report on the 2016 healthy michigan voices enrollee survey
TRANSCRIPT
Report on the 2016 Healthy Michigan Voices Enrollee Survey: Supplemental Analyses
January 17, 2018
University of Michigan Institute for Healthcare Policy & Innovation
Report Authors: Susan Dorr Goold, Jeffrey Kullgren Healthy Michigan Voices Evaluation Team: John Ayanian, Erin Beathard, Corey Bryant, Tammy Chang, Sarah Clark, Susan Dorr Goold, Adrianne Haggins, Edith Kieffer, Matthias Kirch, Jeffrey Kullgren, Sunghee Lee, Minal Patel, Ann-Marie Rosland, Zachary Rowe, Erin Sears, Jennifer Skillicorn, Erica Solway, Lisa Szymecko, Renuka Tipirneni
2
Table of Contents Introduction .......................................................................................................................................... 3 Supplemental Analyses Results ........................................................................................................... 3
Section 1: Impact of pre-HMP insurance status on improvements in forgone care, access, and health ................................................................................................................................................. 3 Section 2: Primary care and use of preventive services ................................................................. 4 Section 3: Health risk assessment completion ................................................................................ 6 Section 4: Health behaviors .............................................................................................................. 7 Section 5: Emergency department utilization (5) ........................................................................... 7 Section 6: Impact of HMP premium contributions on cost-conscious behaviors ........................ 8 Section 7: Diagnosis and care of self-reported chronic health conditions among HMP enrollees ............................................................................................................................................................ 9 Section 8: Diagnosis and care of chronic health conditions among HMP enrollees as measured by HEDIS criteria and claims-based diagnostic codes ................................................................. 11 Section 9: Impact of HMP on enrollees with mental health or substance use disorder conditions ........................................................................................................................................ 14 Section 10: Awareness of HMP dental coverage, perceived access to and use of dental services, oral health status and outcomes ..................................................................................... 17 Section 11: Impact of HMP on reproductive health services ....................................................... 20 Section 12: Impact of HMP on employment, education and ability to work ............................. 22
Appendix A: Supplementary Tables………………………………………………………………….A1 Appendix B: Utilization and Community Factors Variable Definitions…………………….…….B1
3
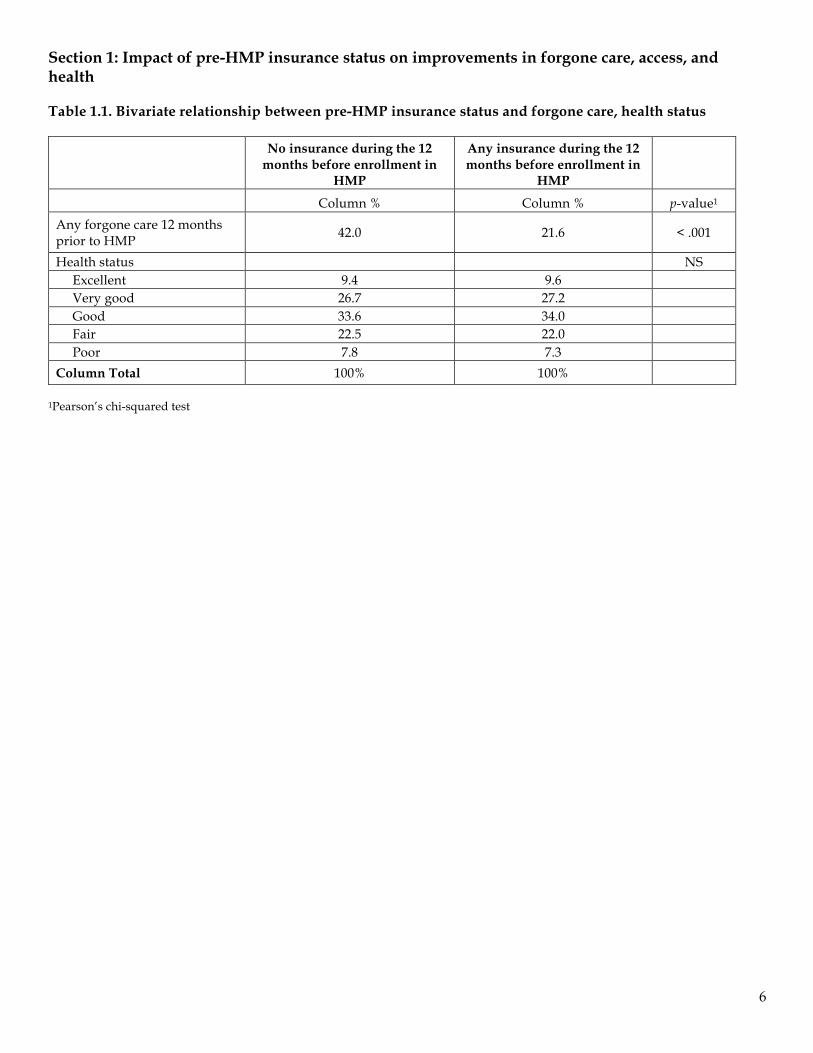
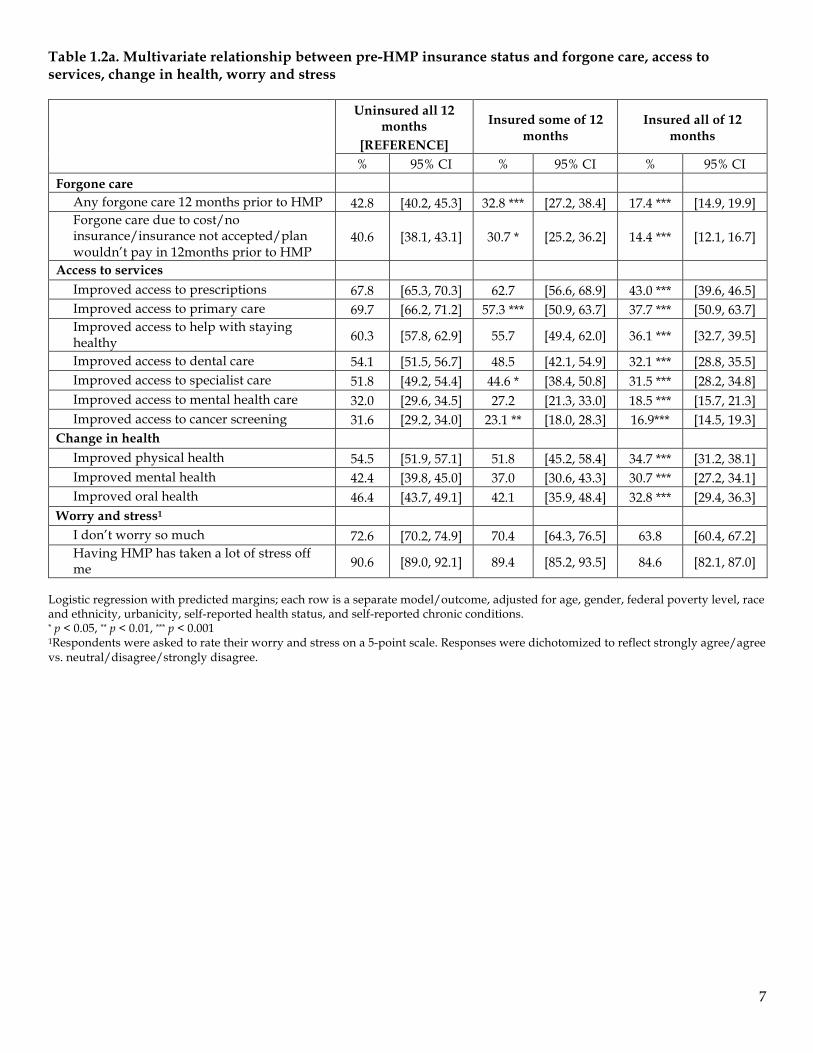
Introduction The University of Michigan Institute for Healthcare Policy & Innovation (IHPI) is conducting the evaluation of the Healthy Michigan Plan (HMP) as required by the Centers for Medicare & Medicaid Services (CMS) through a contract with the Michigan Department of Health and Human Services (MDHHS). Domain IV of the evaluation includes a series of surveys called Healthy Michigan Voices. This report presents supplementary findings from the 2016 Healthy Michigan Voices survey of individuals who were currently enrolled in HMP and who had at least 12 months total HMP enrollment, conducted during January-November 2016. Supplemental analyses were conducted to further explore relationships between select variables of interest, including those using claims data, in order to describe relationships between enrollees’ utilization of healthcare services and their survey responses. For all analyses of bivariate and multivariate relationships, the types of analyses, models, variables included and how they are defined or measured are described in detail in Appendices A and B of this report. The specific tests are described in the table footnotes. Supplemental Analyses Results Section 1: Impact of pre-HMP insurance status on improvements in forgone care, access, and health Relationship between pre-HMP insurance status and forgone care, health status Enrollees without health insurance for any of the 12 months prior to HMP enrollment were about twice as likely to have forgone care during those 12 months (42.0% vs. 21.6%) as those who had insurance at some time during those 12 months (see Appendix A Table 1.1). Relationship between pre-HMP insurance status and forgone care, access to services, change in health, worry and stress Those who were insured all 12 months prior to enrollment in HMP were significantly less likely to report forgone care or forgone care due to cost during the 12 months prior to enrollment in HMP (see Appendix A Table 1.2a and 1.2b). Respondents who lacked insurance for all 12 months before enrollment in HMP were significantly more likely than those who were insured all 12 months to report improvement in access to prescription medications, primary care, help with staying healthy, dental care, specialist care, mental health care, and cancer screening since enrollment in HMP. Compared to those with no insurance during the 12 months prior to HMP, individuals with some insurance were less likely to report improvements in access to primary care, specialty care, and cancer screening (see Appendix A Table 1.2a and 1.2b).
4
Respondents who had health insurance for all 12 months prior to enrollment in HMP were less likely to report improvement in mental, physical and dental health (see Appendix A Table 1.2a and 1.2b). Those who lacked health insurance for the 12 months prior to enrollment in HMP were more likely to agree that they had less stress or worry about their health since enrollment in HMP (see Appendix A Table 1.2a and 1.2b). Section 2: Primary care and use of preventive services Receipt of preventive care Of enrollees who met criteria for breast, cervical, or colorectal cancer screening based on age and/or gender, rates of breast cancer screening were highest (71.7%) and colorectal cancer screening lowest (41.6%) based on claims data. More than half (53.9%) of women had cervical cancer screening (see Appendix A Table 2.1). Nearly all (86.8%) enrollees had at least one preventive service based on claims data. More than half (59.5%) of enrollees had at least one dental visit, 43.9% had a vaccination, 32.5% had a flu vaccine, 18.0% of enrollees filled a prescription for a statin, and 11.3% of all enrollees filled a prescription for smoking cessation (see Appendix A Table 2.1). Relationship between enrollee knowledge about copays and incentives and use of preventive services Enrollee knowledge that some services have no copayments was significantly associated with greater utilization of all preventive services examined, with the exception of vaccinations other than flu and pneumonia, Diabetes Prevention Programs, and nutrition services (for which there were few claims in total). Of those who knew some services had no copays, 88.6% received at least one preventive service, compared to 81.6% of those who did not know (see Appendix A Table 2.2). Enrollee knowledge that completing a Health Risk Assessment (HRA) could result in lower fees was not associated with any preventive service use (see Appendix A Table 2.2). Perceived impact of healthy behavior rewards and use of preventive services Enrollees who agreed that healthy behavior rewards affected their behavior seemed to have a greater likelihood of filling a prescription for a statin, but a lesser likelihood of filling a prescription for smoking cessation (see Appendix A Table 2.3). Relationship between primary care visit and use of preventive services Enrollees with a self-reported primary care visit in the past 12 months of HMP enrollment, or a primary care visit in their claims, were significantly more likely than enrollees without a visit to have claims for nearly all preventive services we examined when adjusted for demographic and
5
health variables, with the exception of nutrition services, Diabetes Prevention Programs, and pneumonia vaccines (see Appendix A Table 2.4a and 2.4b). Over 90% of those with a primary care visit (self-reported or based on claims) had a claim for a preventive service (see Appendix A Table 2.4a and 2.4b). Demographic and health predictors of primary care visits in previous 12 months Older enrollees, women, white enrollees, those in worse health or with a chronic condition, and those who live in rural areas were more likely to report a primary care visit and to have a primary care visit claim (see Appendix A Table 2.6). Neither self-reported primary care visits nor claims for primary care visits differed on the basis of employment, ethnicity, partnership status, FPL group, or health literacy (see Appendix A Table 2.6). Relationship between primary care visit and improved access to health care Enrollees who reported having a primary care visit were significantly more likely than those who did not to report improved access to help with staying healthy, dental care, specialty care and cancer screening, but not more likely to report improved access to mental health care (see Appendix A Table 2.7). Relationship between primary care visit and HRA completion, health behavior counseling Enrollees who reported having a primary care visit, or had a primary care visit in claims, were significantly more likely to report completing an HRA (see Appendix A Table 2.8). Enrollees who reported having a primary care visit, or had a primary care visit in claims, were 3-4 times more likely to report being counseled about exercise, nutrition, tobacco cessation, or alcohol use (see Appendix A Table 2.8). Enrollees who reported having a primary care visit, or had a primary care visit in claims, were more likely to report a new diagnosis of a chronic condition after HMP enrollment (see Appendix A Table 2.8). Predictors of claims-based smoking cessation prescriptions About one-third (37.7% of HMV survey respondents reported smoking or using tobacco in the last 30 days. (See STC report Appendix A Tables 4.45-4.47). About one-quarter (24.3%) of those who reported tobacco use in the past month filled a prescription for smoking cessation in the previous 12 months (see Appendix A Table 2.9a).
6
Nearly 100 respondents who had a claim for a prescription for smoking cessation in the year before the survey (18.2%of those with such claims) reported not smoking in the past 30 days (see Appendix A Table 2.9a). Of those who said they chose to reduce or quit tobacco on the HRA, 33.0% had a claim for a prescription for smoking cessation. Those who reported choosing to quit using tobacco were six times more likely than other smokers to have a claim for a smoking cessation prescription (see Appendix A Table 2.9b). Older respondents, those with poorer health or a chronic condition, and those with a self-reported or claims-based primary visit were more likely to have a claim for a smoking cessation prescription (see Appendix A Table 2.5k). Predictors of claims-based participation in Diabetes Prevention Program Those with a chronic condition were more likely to have a claim for a Diabetes Prevention Program, after controlling for demographics and any primary care visit (aOR=8.5) (see Appendix A Table 2.5e). Predictors of claims-based use of nutrition services Very few (2.1%) respondents had a claim for any nutrition service (Appendix A Table 2.1). Those who chose improved nutrition or losing weight on the HRA were not statistically more likely to have a nutrition service claim, although the small number of nutrition claims limited our ability to precisely measure associations between this outcome and other factors (see Appendix A Table 2.5g). Predictors of claims-based receipt of STI testing Those who reported seeing a PCP in the past 12 months were more likely to have a claim for testing for sexually transmitted infection (excluding HPV) (see Appendix A Table 2.5i). Women, Black or African American enrollees, urban residents and those reporting a chronic condition were more likely to have a claim for STI testing (excluding HPV) (see Appendix A Table 2.5i). Section 3: Health risk assessment completion HRA completion for HMV respondents While 57.3% of HMV respondents had some HRA record in the Data Warehouse, only 31.3% had an HRA record with physician attestation, signaling completion of the HRA process. Almost half of those who reported in the survey, that they did NOT complete an HRA had an HRA record in the data warehouse, although only 18.8% had an HRA record with physician attestation. Those who recalled completing an HRA were more likely to have any HRA record
7
(68.3%) and to have an HRA record with physician attestation (44.1%) (see Appendix A Table 3.1). Demographic predictors of Data Warehouse record of completed HRA Older respondents, White enrollees, and those who reported seeing a PCP in the past 12 months were more likely to have an HRA record with physician attestation (see Appendix A Table 3.2). Demographic predictors of self-reported HRA completion Hispanics/Latinos, those of Arab/Chaldean/Middle Eastern descent, those with a preferred language of Arabic and urban residents were less likely to report completing an HRA. Those who reported seeing a PCP in the past 12 months were more likely to report completing an HRA (see Appendix A Table 3.3). Section 4: Health behaviors Relationship between frequency of social connections and health behaviors Of enrollees who connected with friends or relatives outside their home every day, 73.6% exercised at least 3 days in the previous week and 13.8% had not exercised at all. Of those who connected socially once a year or less, 64.7% exercised at least 3 times in the previous week, and 22.7% had not exercised at all (see Appendix A Table 4.1). Of enrollees who connected with friends or relatives outside their home every day, 2.7% reported unsafe alcohol use every day and 79.2% reported no unsafe alcohol use during the previous week (see Appendix A Table 4.1). Of those who connected socially once a month or less, nearly all (85.2% and 82.8%) reported no episodes of unsafe alcohol use in the previous week (see Appendix A Table 4.1). Relationship between change in frequency of social connections and health behaviors Enrollees who reported being less involved with family, friends and community since enrollment in HMP (4.4%) were more likely to report no exercise (33.1%) compared to those who reported being more involved (16.0%) or involved about the same (17.8%) (see Appendix A Table 4.2). Enrollee reports of changes in involvement with family, friends and community had no relationship with the frequency of unsafe alcohol use (see Appendix A Table 4.2). Section 5: Emergency department utilization Characteristics of emergency department utilization
8
Enrollees who were younger, female, and resided in regions with a higher proportion of uninsured were more likely to self-report any ER visits in the past 12 months. Other factors that were significantly associated with any self-reported ER use were a greater number of outpatient visits, 2 or more chronic conditions, a mental health or substance use disorder condition, fair or poor health, or perceived discrimination related to their insurance or ability to pay. The strongest predictors of self-reported ER use were a mental health/substance use diagnosis (aOR=1.71), 2 or more chronic conditions (aOR=1.71), experience of discrimination due to insurance/ability to pay (aOR=1.55) and fair/poor health status (aOR=1.46) (see Appendix A Table 5.1a). Enrollees with at least one ER visit in the past 12 months, as defined by claims, were younger, female, had lower incomes, and lived in regions with a lower proportion of college-educated individuals. Enrollees with at least one ER visit were more likely to have 2 or more chronic conditions (aOR=1.79), mental health or substance use disorders (aOR=1.93) and more outpatient visits (aOR=1.07). They also were more likely to report perceived discrimination related to their insurance or ability to pay (aOR=1.39). Enrollees were less likely to have an ER visit in claims if their regular source of care was a clinic or doctor's office (aOR=0.73) (see Appendix A Table 5.1a). Enrollees who were younger, female, had lower incomes, 2 or more chronic conditions, a mental health or substance use disorder condition and had more outpatient visits (based on claims) had a greater number of ER visits (by claims assessment). Enrollees who reported fair/poor health or perceived discrimination related to their insurance or ability to pay also had more ER visits. However, enrollees with a clinic or doctor's office as their regular source of care had fewer ER visits (see Appendix A Table 5.1b). Enrollees who were younger, female, had lower incomes, 2 or more chronic conditions, a mental health or substance use disorder condition, and more outpatient visits were likely to have a greater number of high-complexity ER visits (by claims assessment). Enrollees who reported perceived discrimination related to their insurance or ability to pay, fair/poor health, and improved access to prescription medications were also likely to have a greater number of high-complexity ER visits (see Appendix A Table 5.1b). Enrollees had a greater number of medium to low-complexity ER visits (by claims assessment) if they were younger, female, had 2 or more chronic conditions, or a mental health or substance use disorder condition, or if they reported perceived discrimination related to their health insurance or ability to pay. Enrollees with a clinic or doctor's office as their regular source of care had fewer medium/low-complexity ER visits (see Appendix A Table 5.1b). Section 6: Impact of HMP premium contributions on cost-conscious behaviors Engagement in cost-conscious behaviors among subgroups of HMP enrollees Enrollees with incomes 100 to 133% of the FPL, and therefore subject to monthly contributions, were no more likely then enrollees with incomes 36 to 99% of the FPL who are not subject to monthly premium contributions to agree they carefully review their MI Health Account
9
statements (86.0% vs. 88.7%), inquire about costs of services before getting them (70.4% vs. 72.9%), talk to providers about costs of health services (67.8 vs. 68.6%), or ask for less costly medications (77.0% vs. 78.2%). Enrollees age 51-64 were more likely than those age 19-34 to report carefully reviewing MI Health Account statements, enrollees with forgone care due to cost in the 12 months before HMP enrollment were more likely to inquire about costs of services before getting them, and enrollees from the UP/NW/NE region were less likely than enrollees from other regions in Michigan to check reviews or ratings of quality before seeking care. Women were more likely than men to find out the costs of services before getting them, ask doctors about less costly drugs, and check reviews or ratings of quality. Hispanic enrollees were less likely than non-Hispanic white enrollees to find out about costs of services before getting them, talk with doctors about costs, ask doctors about less costly drugs, or check reviews or ratings of quality (see Appendix A Table 6.2). Health care affordability among subgroups of HMP enrollees Enrollees with incomes 100 to 133% of the FPL were less likely than enrollees with incomes 36 to 99% of the FPL without monthly premium contributions to agree their health care payments were affordable (84.9% vs. 90.8%), but were no more likely to report forgoing needed care due to cost in the past 12 months of HMP enrollment (10.4% vs. 12.0%). Those with fair or poor health status were less likely than those with better health status to agree their payments were affordable, and were also more likely to report forgone care due to cost. Those with chronic conditions were also more likely than others to report forgone care due to cost (see Appendix A Table 6.3). Section 7: Diagnosis and care of self-reported chronic health conditions among HMP enrollees Enrollee characteristics, by chronic health condition status Enrollees with chronic health conditions were more often older than 35 years old, White, and more often had an income of 0-35% FPL (see Appendix A Table 7.1). Enrollees with chronic health conditions reported significant functional limitations in day to day life (24.4% reported they were physically limited in daily activities more than 14 of the last 30 days) more often than those without chronic health conditions (5.8%) (see Appendix A Table 7.1). Over half (58.4%) of those with chronic health conditions had two or more chronic health conditions, 11.5% had four or more (see Appendix A Table 7.1). Enrollees with chronic health conditions reported more days of poor health per month than those without chronic conditions, but also reported improved physical and mental health since
10
enrolling in HMP more often than enrollees without chronic health conditions (see Appendix A Table 7.1). Pre-HMP insurance status and access to care before and after HMP enrollment, by chronic health condition status Those with chronic conditions were more likely than those without chronic conditions to have a usual source of care in the 12 months prior to HMP enrollment, although they were equally likely to have gone more than 5 years without a PCP visit before HMP enrollment (see Appendix A Table 7.2). More than half (51.9%) of enrollees with chronic conditions reported having problems paying medical bills in the 12 months prior to HMP enrollment, more often than those without chronic conditions, 29.7% of whom had trouble paying medical bills (see Appendix A Table 7.2). After HMP enrollment, enrollees with chronic conditions reported seeing a PCP in the past 12 months more often than those without chronic conditions (89.8% vs. 75.5%), and more often reported a usual source of care in the past 12 months of HMP enrollment (95.2% vs. 85.8%) (see Appendix A Table 7.2). New chronic condition diagnosis since HMP enrollment, by pre-HMP insurance status and time since last PCP visit prior to HMP enrollment, among enrollees with chronic conditions Among enrollees with chronic disease, those reporting a new chronic disease diagnosis since enrolling in HMP were more likely to have lacked health insurance for all 12 months before enrollment (65.5% vs. 55.7%). However, 34.5% of those with a new diagnosis had health insurance some or all of the 12 months prior to HMP (see Appendix A Table 7.3a). Among enrollees with chronic disease, those reporting a new chronic disease diagnosis since enrolling in HMP were less likely to have had a PCP visit in the 12 months prior to HMP enrollment (35.5% vs. 47.9%) than those reporting no new diagnoses since enrollment (see Appendix A Table 7. 3b). Association between having a chronic health condition and improved physical and mental health after HMP enrollment, among all respondents Enrollees with chronic health conditions were significantly more likely to report improved physical and mental health status since HMP enrollment than enrollees without chronic health conditions, even when adjusted for other factors that can affect health status (see Appendix A Table 7.4). Associations between access to specific types of care and improved physical and mental health after HMP enrollment, among enrollees with chronic health conditions
11
Among enrollees with chronic health conditions, when adjusted for other factors that can affect health status, seeing a PCP in the past 12 months of HMP enrollment and having improved access to prescription medications, were the strongest predictors of improved physical health since HMP enrollment (see Appendix A Table 7.5). Other significant predictors of improved physical health were improved access to specialty care and improved access to mental health care (see Appendix A Table 7.5). Among enrollees with chronic health conditions, the strongest predictor of improved mental health in adjusted analyses was improved access to mental health care (aOR=3.40). Other significant predictors were improved access to prescription medications and improved access to specialty care, but not whether the enrollee saw a PCP in the past 12 months of HMP enrollment (see Appendix A Table 7.5). Section 8: Diagnosis and care of chronic health conditions among HMP enrollees as measured by HEDIS criteria and claims-based diagnostic codes Chronic disease defined by HEDIS criteria In this section, the measure of chronic disease is defined by HEDIS criteria for asthma, cardiovascular disease, COPD or diabetes using claims data. See Appendix B for full definitions. Demographic and health characteristics for HMP enrollees with and without chronic disease defined by HEDIS criteria Compared to those with no chronic disease, individuals with one or more chronic conditions were more likely to be older, have an income of 0-35% FPL, report fair/poor health status, report functional impairment, and less likely to be of ‘other’ race or more than one race (see Appendix A Table 8.1). Compared to those with no chronic disease, individuals with one or more chronic conditions were more likely to report that both their physical (56.7% vs. 45.2%), and mental health (41.5% vs. 37.3%) have gotten better since HMP enrollment (see Appendix A Table 8.1). Differences in access to care among HMP enrollees with and without chronic disease defined by HEDIS criteria before and after HMP Compared to individuals with no chronic disease, individuals with one or more chronic diseases were more likely to have seen a PCP in the 12 months preceding their response to the survey (46.6% vs. 38.8%) (see Appendix A Table 8.2). Compared to individuals with no chronic disease, individuals with one or more chronic diseases were more likely to report a usual source of care (80.2% vs. 71.8%) in the 12 months prior to HMP enrollment (see Appendix A Table 8.2).
12
Compared to individuals with no chronic disease, individuals with one or more chronic diseases were more likely to report that their usual source of care was a clinic (20.4% vs. 16.0%) in the 12 months prior to HMP enrollment (see Appendix A Table 8.2). Compared to individuals with no chronic disease, individuals with one or more chronic diseases were more likely to report problems paying bills (56.8% vs. 40.9%) in the 12 months prior to HMP enrollment (see Appendix A Table 8.2). Compared to individuals with no chronic disease, individuals with one or more chronic diseases were more likely to have seen a PCP (94.8% vs. 82.1%) and to report a usual source of care (98.1% vs. 90.2%), and less likely to report urgent care as a usual source of care (3.5% vs. 6.6%) in the past 12 months of HMP enrollment (see Appendix A Table 8.2). No significant differences were evident between individuals with no chronic disease and individuals with one or more chronic diseases in their report of whether their ability to pay medical bills since HMP enrollment had changed (see Appendix A Table 8.2). Association between chronic disease defined by HEDIS criteria and improvements in physical and mental health outcomes among HMP enrollees Compared to individuals with no chronic disease, enrollees with one or more chronic diseases were more likely to report significant improvements in their physical health in the past 12 months preceding the survey, but no more likely to report significant improvements in their mental health after adjusting for coverage status prior to HMP, smoking, age, gender, income, and race (see Appendix A Table 8.3). Association between improvements in access to specific types of care and physical and mental health outcomes among HMP enrollees with chronic disease defined by HEDIS criteria Among enrollees with one or more chronic diseases, individuals who reported improved access to mental health services, improved access to prescriptions, and improved access to specialty services were more likely to report improvements in their physical health when adjusting for health insurance status in the 12 months prior to HMP, smoking, age, gender, income, and race (see Appendix A Table 8.4). Among enrollees with one or more chronic diseases, individuals who reported improved access to mental health services were more likely, and individuals who reported improved access to specialty services were more likely, to report improvements in their mental health when adjusting for health insurance status in the 12 months prior to HMP, smoking, age, gender, income, and race (see Appendix A Table 8.4). Differences in HRA behavior choice between HMP enrollees with and without chronic disease defined by HEDIS criteria
13
Among enrollees who self-reported completing the HRA, no significant differences were evident among individuals with and without chronic disease in the behaviors selected on the HRA, including reducing/quitting smoking, getting the flu shot, exercising, or improving nutrition (see Appendix A Table 8.5). Chronic disease defined by claims-based diagnostic codes In this section, the measure of chronic disease is defined by claims-based diagnosis codes including Alzheimer’s disease and related dementia, anemia, asthma, atrial fibrillation, cancer, chronic kidney disease, COPD, cystic fibrosis, deep venous thrombosis, diabetes mellitus, glaucoma, heart failure, hemophilia, HIV, hyperlipidemia, hypertension, ischemic heart disease, liver disease and other liver disorders, osteoporosis, arthritis, and stroke/transient ischemic attack. Demographic and health characteristics for HMP enrollees with and without chronic disease defined by claims-based diagnosis codes Compared to those with no chronic disease, individuals with one or more chronic conditions were more likely to be older, female, report fair/poor health status, and report functional impairment (see Appendix A Table 8.6). Compared to those with no chronic disease, individuals with one or more chronic conditions were more likely to report that both their physical (53.3% vs. 37.5%), and mental health (40.5% vs. 34.1%) have gotten better since HMP enrollment (see Appendix A Table 8.6). Differences in access to care among HMP enrollees with and without chronic disease defined by claims-based diagnosis codes before and after HMP Compared to individuals with no chronic disease, individuals with one or more chronic diseases were more likely to report a usual source of care (75.9% vs. 69.7%) in the 12 months prior to HMP enrollment (see Appendix A Table 8.7). They were also more likely to report that their usual source of care was a clinic (18.4% vs. 14.4%) in the 12 months prior to HMP enrollment (see Appendix A Table 8.7). Compared to individuals with no chronic disease, individuals with one or more chronic diseases were more likely to report having seen a PCP (93.1% vs. 68.3%) and to report a usual source of care (97.1% vs. 82.4%) in the 12 months preceding the survey and less likely to report urgent care as their usual source of care (4.2% vs. 9.6%) (see Appendix A Table 8.7). Compared to individuals with no chronic disease, individuals with one or more chronic diseases were more likely to report problems paying medical bills (50.8% vs. 33.0%) in the 12 months prior to HMP enrollment (see Appendix A Table 8.7). No significant differences were evident between individuals with no chronic disease and individuals with one or more chronic diseases in their report about whether their ability to pay medical bills had changed since HMP enrollment (see Appendix A Table 8.7).
14
Association between chronic disease defined by claims-based diagnosis codes and improvements in physical and mental health outcomes among HMP enrollees Compared to individuals with no chronic disease, enrollees with one or more chronic diseases were twice as likely to report significant improvements in their physical health since HMP enrollment, and more likely to report significant improvements in their mental health after adjusting for coverage status prior to HMP, smoking, age, gender, income, and race (see Appendix A Table 8.8). Association between improvements in access to specific types of care and physical and mental health outcomes among HMP enrollees with chronic disease defined by claims-based diagnosis codes Among enrollees with one or more chronic diseases, individuals who reported improved access to mental health services were more likely, individuals who reported improved access to prescriptions were twice more likely, and individuals who reported improved access to specialty services were more likely to report improvements in their physical health when adjusting for coverage status prior to HMP, smoking, age, gender, income, and race (see Appendix A Table 8.9). Among enrollees with one or more chronic diseases, individuals who reported improved access to mental health services were four times more likely, individuals who reported improved access to prescriptions were more likely, and individuals who reported improved access to specialty services were more likely, to report improvements in their mental health when adjusting for coverage status prior to HMP, smoking, age, gender, income, and race (see Appendix A Table 8.9). Differences in HRA behavior selection among HMP enrollees with and without chronic disease defined by claims-based diagnosis codes Among enrollees who self-reported completing the HRA, no significant differences were evident among individuals with and without chronic disease in in the behavior selected on the HRA of reduce/quit smoking, getting the flu shot, exercising or nutrition (see Appendix A Table 8.10). Among all enrollees, individuals with one or more chronic disease were more likely to choose getting a flu shot (0.5% vs. 0.1%), exercise (22.9% vs. 17.0%), and nutrition (24.3% vs. 19.7%) compared to individuals with no chronic disease (see Appendix A Table 8.10). Section 9: Impact of HMP on enrollees with mental health or substance use disorder conditions Changes in access to care and health, among enrollees with mental health or substance use disorder conditions
15
In almost all measures of access to care, enrollees with mental health/substance use disorder conditions (MH/SUD) were significantly more likely than enrollees without MH/SUD conditions to report improved access. This included reported improvements in access to: primary care (1.5 times as likely), specialty care (1.6 times as likely), dental care (1.2 times as likely), mental health care (3.4 times as likely), substance use disorder treatment (2.9 times as likely), prescription medications (1.6 times as likely), cancer screening (1.2 times as likely), and preventive health care (1.3 times as likely). For all of these outcomes, enrollees with MH/SUD conditions who were uninsured in the 12 months prior to HMP enrollment were even more likely to report improved access than those who had health insurance prior to HMP (see Appendix A Table 9.1). There was no significant difference between enrollees with MH/SUD conditions and enrollees without MH/SUD conditions with regard to reported changes in access to family planning services (see Appendix A Table 9.1). Enrollees with MH/SUD conditions were significantly more likely to report improvements in health since HMP enrollment compared with enrollees without MH/SUD conditions: 1.7 times as likely to report improved mental health and 1.3 times as likely to report improved physical health (see Appendix A Table 9.1). Forgone care before and after HMP, among enrollees with mental health or substance use disorder conditions In the 12 months prior to HMP enrollment, enrollees with co-morbid mental and physical health conditions were significantly more likely to forgo needed health care services (41.1%) than enrollees with only MH/SUD (36.8%), only physical health conditions (32.9%), or no health conditions (27.1%). There were no significant differences in reasons for forgone care across these groups (see Appendix A Table 9.2). In the past 12 months of HMP enrollment, rates of forgone care were much lower in all groups, though remained highest for enrollees with co-morbid mental and physical health conditions (18.1%) or only MH/SUD (17.8%), compared with enrollees who had only physical health conditions (13.7%) or no health conditions (13.5%). Again, there were no significant differences in reasons for forgone care across these groups (see Appendix A Table 9.2). Use of preventive services, among enrollees with mental health or substance use disorder conditions Enrollees with any physical or mental health condition, or both, were more likely to have a primary care visit than those without such conditions: co-morbid mental and physical health conditions (98.9%), MH/SUD only (93.4%), physical health only (99.0%), no health conditions (82.5%) (see Appendix A Table 9.3b). Cancer screening was more common among enrollees with co-morbid mental and physical health conditions (49.6%), compared with other groups: MH/SUD only (46.5%), physical health only (40.9%), no health conditions (39.0%) (see Appendix A Table 9.3b).
16
Dental visits were more common among enrollees with mental health conditions: co-morbid mental and physical health conditions (64.0%), MH/SUD only (63.6%), physical health only (53.0%), no health conditions (56.0%) (see Appendix A Table 9.3b). Nutrition services were an infrequent service overall, but there was significant variation among the sub-groups without a predominant pattern: co-morbid mental and physical health conditions (5.9%), MH/SUD only (1.1%), physical health only (5.5%), no health conditions (0.7%) (see Appendix A Table 9.3b). STI screening was more common among enrollees with mental health conditions: co-morbid mental and physical health conditions (18.2%), MH/SUD only (18.1%), physical health only (10.0%), no health conditions (10.0%) (see Appendix A Table 9.3b). Smoking cessation prescriptions were more commonly used among enrollees with co-morbid mental and physical health conditions (21.6%), compared with other groups: MH/SUD only (13.3%), physical health only (10.9%), no health conditions (5.1%) (see Appendix A Table 9.3b). Vaccines were more commonly received by enrollees with physical health conditions: co-morbid mental and physical health conditions (59.0%), MH/SUD only (45.4%), physical health only (53.5%), no health conditions (35.1%) (see Appendix A Table 9.3b). Use of any of the above preventive services was highly prevalent across all sub-groups, though more common among enrollees with either physical or mental health conditions vs. no health conditions: co-morbid mental and physical health conditions (94.9%), MH/SUD only (89.8%), physical health only (92.4%), no health conditions (81.1%) (see Appendix A Table 9.3b). Impact on work/employment for enrollees with mental health or substance use disorder conditions Enrollees with MH/SUD conditions were significantly less likely to be employed (43%) than enrollees without MH/SUD conditions (54%) (see Appendix A Table 9.4A). There was no statistically significant association between reported physical or mental health improvements and employment for either enrollees with MH/SUD conditions or enrollees without MH/SUD conditions (see Appendix A Table 9.4b). Enrollees with MH/SUD conditions were significantly more likely to report that HMP helped them to do a better job at work (80%) than enrollees without MH/SUD conditions (67%) (see Appendix A Table 9.4a). Both groups were significantly more likely to report that HMP helped them do a better job at work if they reported physical or mental health improvements, though the association was more pronounced among enrollees with MH/SUD conditions (5.6 times as likely) (see Appendix A Table 9.4b) than for enrollees without MH/SUD conditions (3.3 times as likely) (see Appendix A Table 9.4c). Among enrollees who were out of work, those with improved physical or mental health reported HMP made them better able to look for a job at similar rates across sub-groups: 59% of
17
enrollees with MH/SUD conditions and 56% of enrollees without MH/SUD conditions (see Appendix A Table 9.4a). Both groups were similarly more likely to report that HMP made them better able to look for a job if they reported physical or mental health improvements: 2.7 times as likely for enrollees with MH/SUD conditions (see Appendix A Table 9.4b) and 3.2 times as likely for enrollees without MH/SUD conditions (see Appendix A Table 9.4c). Among enrollees who had a recent job change, those with improved physical or mental health reported HMP helped them get a better job at similar rates across sub-groups: 41% of enrollees with MH/SUD conditions and 35% of enrollees without MH/SUD conditions (see Appendix A Table 9.4a). Both groups were significantly more likely to report that HMP helped them get a better job if they reported physical or mental health improvements, though the association was more pronounced among enrollees with MH/SUD conditions (5.4 times as likely) (see Appendix A Table 9.4b) than for enrollees without MH/SUD conditions (2.7 times as likely) (see Appendix A Table 9.4c). Section 10: Awareness of HMP dental coverage, perceived access to and use of dental services, oral health status and outcomes Awareness of HMP dental coverage Women were more likely to be aware of their HMP dental coverage than men (80.8% vs. 73.2%). No other differences in demographic characteristics were evident in awareness of HMP dental coverage (see Appendix A Table 10.1). Perceived access to dental care The percentage of respondents who reported improved access to dental care since HMP enrollment was associated with duration of health insurance coverage in the 12 months prior to HMP enrollment, ranging from 32.6% of enrollees who had health insurance for all 12 months to 53.5% of those who were uninsured for all 12 months (see Appendix A Table 10.1). Employed enrollees (48.2%) were more likely than unemployed people (44.0%) to report improved access to dental care since HMP enrollment (see Appendix A Table 10.1). Respondents who were aware of their HMP dental coverage were more likely to report better access to dental care than those who were unaware (55.3% vs. 15.0%) (see Appendix A Table 10.2). Dental care use Women were more likely than men to use dental care (62.9% vs. 55.9%). Enrollees who had health insurance for some of the 12 months prior to HMP enrollment were more likely to use dental care (68.7%) compared to those who had health insurance for all 12 months prior to HMP enrollment (59.0%) or who were uninsured all 12 months prior to HMP enrollment (58.2%) (see Appendix A Table 10.1).
18
Respondents who were aware of their HMP dental coverage were more likely to use dental care compared to those who were unaware (68.9% vs. 27.8%) (see Appendix A Table 10.2). Respondents who reported better access to dental care since HMP enrollment were more likely to use dental care than those who did not report better access (77.4% vs. 44.3%) (see Appendix A Table 10.3). Respondents who reported improved oral health since HMP enrollment were more likely to use dental care compared to those who did not report improved oral health (85.2% vs. 42.8%) (see Appendix A Table 10.3). Enrollees who reported improved access to dental care were 4.7 times more likely to use dental care compared to those who reported no change or worse access to dental care after adjusting for age, gender, race, income, employment status, and insurance duration in the 12 months before HMP enrollment (see Appendix A Table 10.5). Adjusting for improved access and other covariates in the multivariate model, women were 1.3 times more likely to use dental care. Enrollees who were uninsured for all 12 months prior to HMP enrollment were 70% as likely to use dental care than those who had health insurance for all of the 12 months prior to HMP (see Appendix A Table 10.5). Enrollees who were aware of their HMP dental coverage were 5.9 times more likely to use dental services. Adjusting for awareness of HMP dental coverage and other respondent characteristics, women were 1.2 times more likely to use dental care. Respondents ages 35-50 years were 1.3 times more likely, and those with insurance coverage some of the year prior to enrolling in HMP were 1.5 times more likely to use dental care (see Appendix A Table 10.5). Improved oral health Black or African American enrollees were the most likely (45.4%) and Hispanic enrollees the least likely (30.6%) to report improved oral health since HMP enrollment (see Appendix A Table 10.1). The percentage of respondents who reported improved oral health since HMP enrollment was associated with the duration of health insurance coverage in the 12 months prior to HMP enrollment, ranging from 31.7% of enrollees who had health insurance for all 12 months to 44.1% of those who were uninsured for all 12 months (see Appendix A Table 10.1). Respondents who were aware of their HMP dental coverage were more likely to report improved oral health since HMP enrollment than those who were unaware (47.3% vs. 13.3%) (see Appendix A Table 10.2). Respondents who reported better access to dental care were more likely to report improved oral health since HMP enrollment than those who did not report better access (67.9% vs. 15.4%) (see Appendix A Table 10.4).
19
Respondents who used dental care were more likely to report improved oral health since HMP enrollment than those who did not use dental care services (56.5% vs. 14.4%) (see Appendix A Table 10.4). Enrollees who used dental care were 8.3 times more likely to report improved oral health since HMP enrollment than those who had not used dental care after adjusting for age, gender, race, income, employment status, insurance duration in the 12 months before HMP enrollment (see Appendix A Table 10.6).
Adjusting for dental care use and other enrollee characteristics, Black or African American enrollees were 1.6 times more likely, and those who were uninsured all 12 months prior to HMP enrollment were 2.0 times more likely to report improved oral health since HMP enrollment (see Appendix A Table 10.6). Job-related outcomes Among unemployed/out of work respondents, those who reported improved access to dental care since HMP enrollment were more likely than those who reported no change or worse access, to report that HMP had made them better able to look for a job (61.5% vs. 48.8%) (see Appendix A Table 10.7). Among unemployed respondents, those who reported improved oral health since HMP enrollment were more likely than those who reported no change or worse oral health, to report that HMP had made them better able to look for a job (59.9% vs. 51.1%) (see Appendix A Table 10.7). In multivariate analyses adjusting for characteristics of unemployed respondents:
Adjusting for dental care service use, those with improved oral health were 1.5 times more likely to report that HMP had made them better able to look for a job (see Appendix A Table 10.6; Model 2b). Adjusting for improved oral health, unemployed enrollees ages 51-64 were 1.7 times more likely to report that HMP made them better able to look for a job (see Appendix A Table 10.6; Model 2b).
Among employed respondents, those who reported improved access to dental care since HMP enrollment were more likely than those who reported no change or worse access, to report that HMP had helped them do a better job at work (76.8% vs. 62.6%) (see Appendix A Table 10.7). Among employed respondents, those who reported improved oral health since HMP enrollment were more likely than those who reported no change or worse oral health, to report that HMP had helped them do a better job at work (76.1% vs. 65.0%) (see Appendix A Table 10.7).
20
In multivariate analyses adjusting for characteristics of employed respondents:
Those who reported improved oral health were 1.6 times more likely to report that HMP helped them to do a better job at work (see Appendix A Table 10.6; Model 2a). Adjusting for improved oral health and other covariates in the model, women were 1.4 times more likely, Black or African American enrollees were 1.5 times more likely, and enrollees with health insurance for some of the 12 months prior to HMP enrollment were 1.6 times more likely to report that HMP helped them to do a better job at work (see Appendix A Table 10.6; Model 2a). Employed enrollees with incomes of 100-133% FPL were 65.0% as likely to report HMP helped them do a better job at work than those with lower income levels (see Appendix A Table 10.6; Model 2a).
Among employed respondents with a recent job change, respondents who reported better access to dental care since HMP enrollment, were more likely than those who reported no change or worse access, to report that HMP had helped them to get a better job (51.2% vs. 24.5%). Those with a dental care visit since HMP enrollment were more likely than those who had no visit to report that HMP had helped them to get a better job (30.0% vs. 34.1%) (see Appendix A Table 10.7). In multivariate analyses adjusting for characteristics of employed respondents who had a recent job change:
Improved oral health was not associated with helping them to get a better job, although there was a trend in that direction. The low sample size in this population may have affected this model (see Appendix A Table 10.6; Model 2c).
Those who were uninsured all 12 months prior to HMP enrollment were 2.4 times more likely to report that HMP helped them get a better job (see Appendix A Table 10.6; Model 2c).
Section 11: Impact of HMP on reproductive health services Demographic and health characteristics of female respondents ages 19-44 Women enrollees age 19-44 broadly reflected the racial-ethnic demographics of Michigan. Most (74.7%) were lower-income (<100% FPL) and nearly one in five (17.7%) lived in rural settings (see Appendix A Table 11.1). Sixty-four percent reported at least one chronic medical condition and 23.5% reported fair or poor health (see Appendix A Table 11.1).
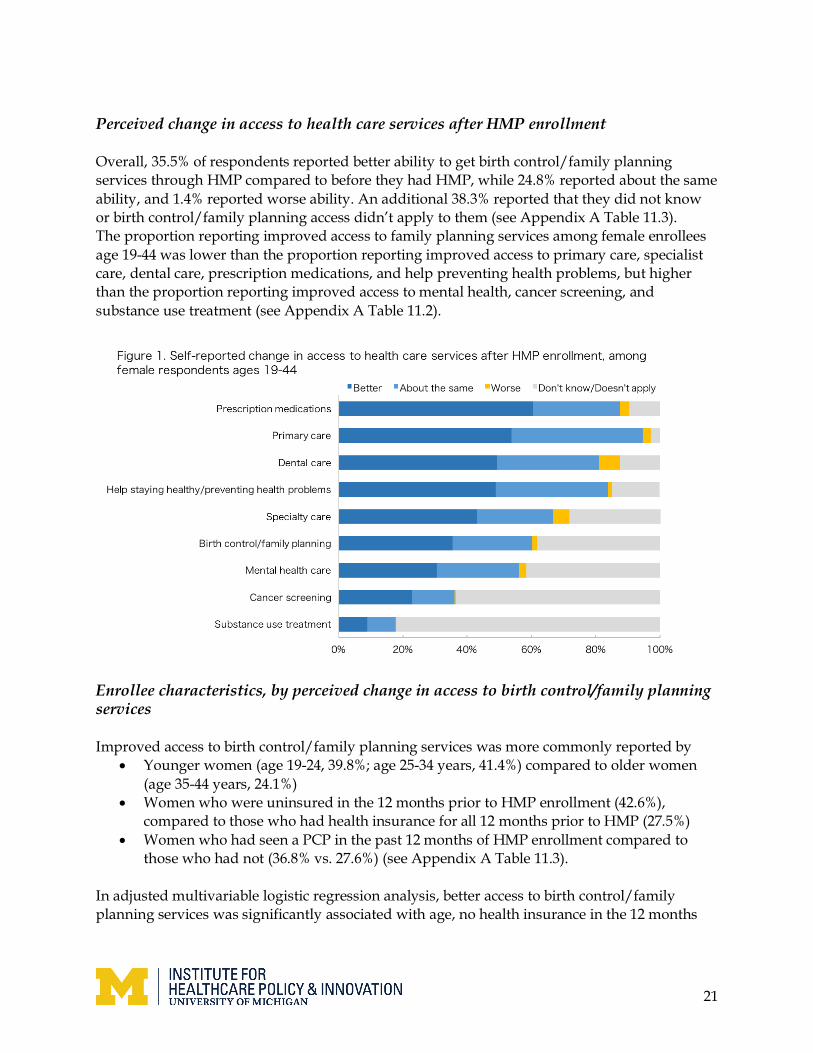
21
Perceived change in access to health care services after HMP enrollment Overall, 35.5% of respondents reported better ability to get birth control/family planning services through HMP compared to before they had HMP, while 24.8% reported about the same ability, and 1.4% reported worse ability. An additional 38.3% reported that they did not know or birth control/family planning access didn’t apply to them (see Appendix A Table 11.3). The proportion reporting improved access to family planning services among female enrollees age 19-44 was lower than the proportion reporting improved access to primary care, specialist care, dental care, prescription medications, and help preventing health problems, but higher than the proportion reporting improved access to mental health, cancer screening, and substance use treatment (see Appendix A Table 11.2).
Enrollee characteristics, by perceived change in access to birth control/family planning services Improved access to birth control/family planning services was more commonly reported by
• Younger women (age 19-24, 39.8%; age 25-34 years, 41.4%) compared to older women (age 35-44 years, 24.1%)
• Women who were uninsured in the 12 months prior to HMP enrollment (42.6%), compared to those who had health insurance for all 12 months prior to HMP (27.5%)
• Women who had seen a PCP in the past 12 months of HMP enrollment compared to those who had not (36.8% vs. 27.6%) (see Appendix A Table 11.3).
In adjusted multivariable logistic regression analysis, better access to birth control/family planning services was significantly associated with age, no health insurance in the 12 months
22
prior to HMP enrollment, and a visit with a PCP in the past 12 months of HMP enrollment (see Appendix A Table 11.4).
• Compared to enrollees age 35-44 years, women age 19-24 years were 2.8 times more likely to report better access to birth control/family planning services and women age 25-34 years were 2.4 times more likely to report better access to birth control/family planning services (see Appendix A Table 11.4).
• Compared to those with health insurance for all 12 months prior to HMP enrollment, women without health insurance in the 12 months prior to HMP were more than twice as likely to report that HMP improved their access to birth control/family planning services (see Appendix A Table 11.4).
• Enrollees who had seen a PCP in the past 12 months of HMP enrollment were 1.7 times more likely to report better access to birth control/family planning since HMP enrollment compared to those who had not (see Appendix A Table 11.4).
We did not observe differences in self-reported access across racial-ethnic groups, income categories, partnership status, urban/rural setting, self-reported health status, or presence of medical comorbidity (see Appendix A Table 11.4). Section 12: Impact of HMP on employment, education and ability to work Demographic and health characteristics for HMP enrollees who are out of work or unable to work Compared to employed enrollees, enrollees who were out of work or unable to work were more likely to be older, male, have an income of 0-35% FPL, veterans, in fair/poor health, and with chronic physical or mental health conditions or limitations (see Appendix A Table 12.1). Black or African American enrollees were more likely to be out of work and White enrollees were more likely to be unable to work (see Appendix A Table 12.1). Association between HMP enrollee demographic and health characteristics and being out of work or unable to work Enrollees were 1.5 times more likely to report being out of work if they reported fair/poor health, 1.5 times as likely if they reported mental health conditions, and more likely if they reported functional limitations (1.4 times as likely if they reported a physical functional limitation; 2.0 times as likely if they reported a mental functional limitation) (see Appendix A Table 12.2) Enrollees were 1.7 times more likely to report being out of work if older (aged 51-64), 1.8 times more likely if male, and 1.9 times more likely if Black or African American (see Appendix A Table 12.2).
23
Enrollees were 3.5 times more likely to report being unable to work if in fair/poor health, 1.7 times as likely if with chronic physical health condition(s), 2.6 times as likely if with chronic mental health condition(s), and more likely if they reported functional limitations (5.1 times as likely if they reported a physical limitation; 2.3 times as likely if they reported a mental limitation) (see Appendix A Table 12.2). Enrollees were more likely to report being unable to work if older (2.3 times more likely for 35-50-year-olds; 4.2 times more likely for 51-64-year-olds) and 1.9 times as likely if male (see Appendix A Table 12.2). Employment status among HMP enrollees, by health status and presence of chronic health condition HMP enrollees were more likely to be employed if their health status was excellent, very good, or good vs. fair or poor (56.1% vs. 32.3%), or if they had no chronic conditions (59.8% vs. 44.1%) (see Appendix A Table 12.3). However, a substantial number of enrollees with fair or poor health status (32.3%) or with chronic conditions (44.1%) were working (see Appendix A Table 12.3). Association of health changes with employment and ability to work among employed enrollees, and job seeking ability among enrollees who were out of work or had a recent job change There was no statistically significant association between improved physical or mental health since HMP enrollment and current employment status (see Appendix A Table 12.4). Enrollees with improved physical or mental health since HMP enrollment were 4.1 times more likely to report that HMP helped them to do a better job at work (see Appendix A Table 12.4). Among enrollees who were out of work, those with improved physical or mental health since HMP enrollment were 2.8 times more likely to report that HMP made them better able to look for a job (see Appendix A Table 12.4). Among enrollees who had a recent job change, those with improved physical or mental health since HMP enrollment were 3.2 times more likely to report that HMP helped them get a better job (see Appendix A Table 12.4).
1
2016 Healthy Michigan Voices Enrollee Survey: Supplemental Analyses
Appendix A: Supplementary Tables
2
Table of Contents Section 1: Impact of pre-HMP insurance status on improvements in forgone care, access, and health ............. 6
Table 1.1. Bivariate relationship between pre-HMP insurance status and forgone care, health status ............... 6Table 1.2a. Multivariate relationship between pre-HMP insurance status and forgone care, access to services, change in health, worry and stress ................................................................................................................................ 7Table 1.2b. Multivariate relationship between pre-HMP insurance status and forgone care, access to services, change in health, worry and stress ................................................................................................................................ 8
Section 2: Primary care and use of preventive services ................................................................................................ 9Table 2.1. Descriptive statistics: receipt of preventive care ........................................................................................ 9Table 2.2. Bivariate relationship between enrollee knowledge about copays and incentives and use of preventive services ......................................................................................................................................................... 10Table 2.3. Bivariate relationship between perceived impact of healthy behavior rewards and use of preventive services ......................................................................................................................................................... 11Table 2.4a. Multivariate relationship between primary care visit and use of preventive services .................... 12Table 2.4b. Bivariate relationship between primary care visit and use of preventive services .......................... 13Table 2.5a. Multivariate relationship between primary care visit and cancer screening1 ................................... 14Table 2.5b. Multivariate relationship between primary care visit and breast cancer screening1 ....................... 15Table 2.5c. Multivariate relationship between primary care visit and cervical cancer screening1 ..................... 16Table 2.5d. Multivariate relationship between primary care visit and colorectal cancer screening1 ................. 17Table 2.5e. Multivariate relationship between primary care visit and Diabetes Prevention Program1 ............. 18Table 2.5f. Multivariate relationship between primary care visit and dental care1 .............................................. 19Table 2.5g. Multivariate relationship between primary care visit and any nutrition services1 .......................... 20Table 2.5h. Multivariate relationship between primary care visit and HPV testing1 ........................................... 21Table 2.5i. Multivariate relationship between primary care visit and STI testing1 ............................................... 22Table 2.5j. Multivariate relationship between primary care visit and prescribed HMG CoA Reductase inhibitor1 .......................................................................................................................................................................... 23Table 2.5k. Multivariate relationship between primary care visit and nicotine replacement and/or Varenicline prescription1 ............................................................................................................................................... 24Table 2.5l. Multivariate relationship between primary care visit and vaccines (any)1 ........................................ 25Table 2.5m. Multivariate relationship between primary care visit and Influenza vaccine1 ................................ 26Table 2.5n. Multivariate relationship between primary care visit and Pneumonia vaccine1 .............................. 27Table 2.5o. Multivariate relationship between primary care visit and other vaccines1 ....................................... 28Table 2.6. Bivariate relationship between enrollee characteristics and primary care visit .................................. 29Table 2.7. Multivariate relationship between primary care visit and improved access to health care services ........................................................................................................................................................................................... 30Table 2.8. Multivariate relationship between primary care visit and HRA completion, health behavior counseling ........................................................................................................................................................................ 31Table 2.9a. Multivariate relationship between primary care visit and cancer screening1 ................................... 32Table 2.9b. Multivariate relationship between primary care visit and breast cancer screening1 ....................... 33Table 2.9c. Multivariate relationship between primary care visit and cervical cancer screening1 ..................... 34Table 2.9d. Multivariate relationship between primary care visit and colorectal cancer screening1 ................. 35Table 2.9e. Multivariate relationship between primary care visit and Diabetes Prevention Program1 ............. 36Table 2.9f. Multivariate relationship between primary care visit and dental care1 .............................................. 37Table 2.9g. Multivariate relationship between primary care visit and any nutrition services1 .......................... 38Table 2.9h. Multivariate relationship between primary care visit and HPV testing1 ........................................... 39Table 2.9i. Multivariate relationship between primary care visit and STI testing1 ............................................... 40
3
Table 2.9j. Multivariate relationship between primary care visit and prescribed HMG CoA Reductase inhibitor1 .......................................................................................................................................................................... 41Table 2.9k. Multivariate relationship between primary care visit and nicotine replacement and/or Varenicline prescription1 ............................................................................................................................................... 42Table 2.9l. Multivariate relationship between primary care visit and vaccines (any)1 ........................................ 43Table 2.9m. Multivariate relationship between primary care visit and Influenza vaccine1 ................................ 44Table 2.9n. Multivariate relationship between primary care visit and Pneumonia vaccine1 .............................. 45Table 2.9o. Multivariate relationship between primary care visit and other vaccines1 ....................................... 46
Section 3: Health risk assessment completion ............................................................................................................. 47Table 3.1. Bivariate association between self-reported HRA completion and Data Warehouse records for HMV respondents .......................................................................................................................................................... 47Table 3.2. Bivariate and multivariate demographic predictors of Data Warehouse record of completed HRA ........................................................................................................................................................................................... 48Table 3.3 Bivariate and multivariate demographic predictors of self-reported HRA completion ..................... 49
Section 4: Health behaviors .............................................................................................................................................. 50Table 4.1. Bivariate relationship between frequency of social connections and health behaviors ..................... 50Table 4.2. Bivariate relationship between change in frequency of social connections and health behaviors ... 51
Section 5: Emergency department utilization ............................................................................................................... 52Table 5.1a. Multivariate analysis of individual and community factors’ relationship to any emergency department utilization ................................................................................................................................................... 52Table 5.1b. Multivariate analysis of individual and community factors’ relationship to number and complexity of emergency department visits .............................................................................................................. 53Table 5.1c. Multivariate analysis of individual and community factors’ relationship to any emergency department utilization ................................................................................................................................................... 55Table 5.1d. Multivariate analysis of individual and community factors’ relationship to number and complexity of emergency department visits .............................................................................................................. 57
Section 6: Impact of HMP premium contributions on cost-conscious behaviors ................................................. 60Table 6.1. Enrollee characteristics, by Federal Poverty Level .................................................................................. 60Table 6.2. Multivariate associations: Engagement in cost-conscious behaviors among subgroups of HMP enrollees ........................................................................................................................................................................... 62Table 6.3. Multivariate associations: Health care affordability among subgroups of HMP enrollees ............... 64
Section 7: Diagnosis and care of self-reported chronic health conditions among HMP enrollees .................... 66Table 7.1. Enrollee characteristics, by self-reported chronic health condition status ........................................... 66Table 7.2. Bivariate associations between self-reported chronic health condition status and pre-HMP insurance status and access to care before and after HMP enrollment .................................................................. 68Table 7.3a. Bivariate relationship between new chronic condition diagnosis since HMP enrollment, by pre-HMP insurance status, among enrollees with self-reported chronic conditions1 ................................................. 69Table 7.3b. Bivariate relationship between new chronic condition diagnosis since HMP enrollment, by time since last PCP visit prior to HMP enrollment, among enrollees with chronic conditions1 ................................. 70Table 7.4. Multivariate association between self-reported chronic health conditions and improved physical and mental health after HMP enrollment, among all respondents ......................................................................... 71Table 7.5. Multivariate associations between access to specific types of care and improved physical and mental health after HMP enrollment, among enrollees with self-reported chronic conditions1 ........................ 72Figure 7.1. Prevalence of chronic conditions – previously vs. newly diagnosed since HMP enrollment vs. comparable Michigan population ................................................................................................................................ 73
Section 8: Diagnosis and care of chronic health conditions among HMP enrollees as measured by HEDIS criteria and claims-based diagnostic codes ................................................................................................................... 74
Table 8.1. Demographic and health characteristics for HMP enrollees with and without chronic disease (HEDIS 20161) .................................................................................................................................................................. 74
4
Table 8.2. Bivariate association between chronic disease (HEDIS 20161) and access to care among HMP enrollees before and after HMP .................................................................................................................................... 75Table 8.3. Multivariate association between chronic disease (HEDIS 20161) and improvements in physical and mental health outcomes among HMP enrollees ................................................................................................ 76Table 8.4. Multivariate association between improvements in access to specific types of care and physical and mental health outcomes among HMP enrollees with chronic disease (HEDIS 20161) ................................. 77Table 8.5. Bivariate relationship between chronic disease (HEDIS 20161) and self-reported HRA behavior choices among HMP enrollees ...................................................................................................................................... 78Table 8.6. Demographic and health characteristics for HMP enrollees with and without chronic disease (DX codes1) .............................................................................................................................................................................. 79Table 8.7. Bivariate association between chronic disease (DX codes1) and access to care among HMP enrollees before and after HMP .................................................................................................................................... 80Table 8.8. Multivariate association between chronic disease (DX codes1) and improvements in physical and mental health outcomes among HMP enrollees ........................................................................................................ 81Table 8.9. Multivariate association between improvements in access to specific types of care and physical and mental health outcomes among HMP enrollees with chronic disease (DX codes1) ...................................... 82Table 8.10. Bivariate relationship between chronic disease (DX codes1) and self-reported HRA behavior choices among HMP enrollees ...................................................................................................................................... 83
Section 9: Impact of HMP on enrollees with mental health or substance use disorder conditions .................. 84Table 9.1 Multivariate association between mental health/substance use disorder, insurance pre-HMP and changes in access to care and health ............................................................................................................................ 84Table 9.2. Bivariate relationship between various combinations of mental and physical health conditions and forgone care before and after HMP ............................................................................................................................. 85Table 9.3a. Bivariate relationship between various combinations of mental and physical health conditions and use of preventive services ...................................................................................................................................... 86Table 9.3b. Multivariate associations between various combinations of mental and physical health conditions and use of preventive services .................................................................................................................. 87Table 9.4a. Bivariate relationship between mental health and substance use disorder and impact on work/employment among HMP enrollees ................................................................................................................ 88Table 9.4b Multivariate association between health improvements and impact of HMP on work/employment among HMP enrollees with mental health or substance use disorder conditions1 ........... 89Table 9.4c. Multivariate association between health improvements and impact of HMP on work/employment among HMP enrollees WITHOUT mental health or substance use disorder conditions1
........................................................................................................................................................................................... 90Section 10: Awareness of HMP dental coverage, perceived access to and use of dental services, oral health status and outcomes ........................................................................................................................................................... 91
Table 10.1. Bivariate associations between respondent characteristics and awareness of HMP dental coverage, perceived access to dental care, dental care use and perceived oral health after HMP enrollment 91Table 10.2. Bivariate associations between awareness of HMP dental coverage and improved access to dental care, dental care use with HMP and improved oral health after HMP enrollment ................................. 92Table 10.3. Bivariate associations between improved access to dental care with HMP, improved oral health and dental care use ......................................................................................................................................................... 93Table 10.4. Bivariate associations between improved access to dental care with HMP, dental care use and improved oral health ...................................................................................................................................................... 94Table 10.5. Multivariate logistic regression analysis of the association between HMP enrollee characteristics and dental care use after HMP enrollment ................................................................................................................. 95Table 10.6. Multivariate logistic regression analysis of the associations between HMP enrollee characteristics, dental care use, improved oral health and employment-related outcomes ............................... 96Table 10.7. Bivariate association between improved access to dental care, dental care use after HMP enrollment, improved oral health and job-related outcomes .................................................................................. 97
5
Section 11: Impact of HMP on reproductive health services ..................................................................................... 98Table 11.1. Demographic and health characteristics of female respondents ages 19-44 ...................................... 98Table 11.2. Perceived change in access to health care services after HMP enrollment among female respondents ages 19-44 .................................................................................................................................................. 99Table 11.3. Bivariate relationship between enrollee characteristics and perceived access to birth control/family planning services, among female respondents ages 19-44 .......................................................... 100Table 11.4. Bivariate and multivariate association between enrollee characteristics and perceived change in access to birth control/family planning services, among female respondents ages 19-44 ................................ 101
Section 12: Impact of HMP on employment, education and ability to work ....................................................... 103Table 12.1. Demographic and health characteristics for HMP enrollees who are out of work or unable to work ................................................................................................................................................................................ 103Table 12.2. Multivariate association between HMP enrollee demographic and health characteristics and being out of work or unable to work ......................................................................................................................... 105Table 12.3. Bivariate predictors of employment status among HMP enrollees, by health status and presence of chronic health condition ......................................................................................................................................... 106Table 12.4. Multivariate association of health changes with employment and ability to work among employed enrollees, and job seeking ability among enrollees who were out of work or had a recent job change ............................................................................................................................................................................ 107
6
Section 1: Impact of pre-HMP insurance status on improvements in forgone care, access, and health Table 1.1. Bivariate relationship between pre-HMP insurance status and forgone care, health status
No insurance during the 12 months before enrollment in
HMP
Any insurance during the 12 months before enrollment in
HMP Column % Column % p-value1
Any forgone care 12 months prior to HMP 42.0 21.6 < .001
Health status NS Excellent 9.4 9.6 Very good 26.7 27.2 Good 33.6 34.0 Fair 22.5 22.0 Poor 7.8 7.3
Column Total 100% 100%
1Pearson’s chi-squared test
7
Table 1.2a. Multivariate relationship between pre-HMP insurance status and forgone care, access to services, change in health, worry and stress
Uninsured all 12 months
[REFERENCE]
Insured some of 12 months
Insured all of 12 months
% 95% CI % 95% CI % 95% CI Forgone care
Any forgone care 12 months prior to HMP 42.8 [40.2, 45.3] 32.8 *** [27.2, 38.4] 17.4 *** [14.9, 19.9] Forgone care due to cost/no insurance/insurance not accepted/plan wouldn’t pay in 12months prior to HMP
40.6 [38.1, 43.1] 30.7 * [25.2, 36.2] 14.4 *** [12.1, 16.7]
Access to services Improved access to prescriptions 67.8 [65.3, 70.3] 62.7 [56.6, 68.9] 43.0 *** [39.6, 46.5] Improved access to primary care 69.7 [66.2, 71.2] 57.3 *** [50.9, 63.7] 37.7 *** [50.9, 63.7] Improved access to help with staying healthy 60.3 [57.8, 62.9] 55.7 [49.4, 62.0] 36.1 *** [32.7, 39.5]
Improved access to dental care 54.1 [51.5, 56.7] 48.5 [42.1, 54.9] 32.1 *** [28.8, 35.5] Improved access to specialist care 51.8 [49.2, 54.4] 44.6 * [38.4, 50.8] 31.5 *** [28.2, 34.8] Improved access to mental health care 32.0 [29.6, 34.5] 27.2 [21.3, 33.0] 18.5 *** [15.7, 21.3] Improved access to cancer screening 31.6 [29.2, 34.0] 23.1 ** [18.0, 28.3] 16.9*** [14.5, 19.3]
Change in health Improved physical health 54.5 [51.9, 57.1] 51.8 [45.2, 58.4] 34.7 *** [31.2, 38.1] Improved mental health 42.4 [39.8, 45.0] 37.0 [30.6, 43.3] 30.7 *** [27.2, 34.1] Improved oral health 46.4 [43.7, 49.1] 42.1 [35.9, 48.4] 32.8 *** [29.4, 36.3]
Worry and stress1 I don’t worry so much 72.6 [70.2, 74.9] 70.4 [64.3, 76.5] 63.8 [60.4, 67.2] Having HMP has taken a lot of stress off me 90.6 [89.0, 92.1] 89.4 [85.2, 93.5] 84.6 [82.1, 87.0]
Logistic regression with predicted margins; each row is a separate model/outcome, adjusted for age, gender, federal poverty level, race and ethnicity, urbanicity, self-reported health status, and self-reported chronic conditions. * p < 0.05, ** p < 0.01, *** p < 0.001 1Respondents were asked to rate their worry and stress on a 5-point scale. Responses were dichotomized to reflect strongly agree/agree vs. neutral/disagree/strongly disagree.
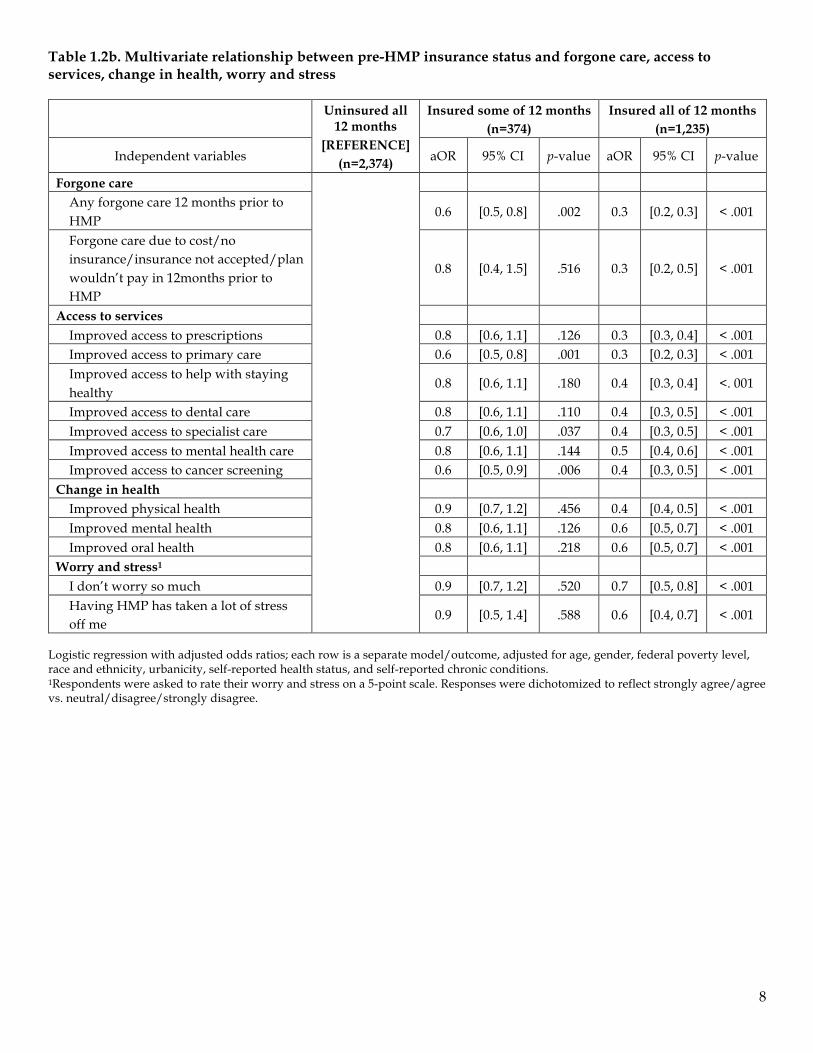
8
Table 1.2b. Multivariate relationship between pre-HMP insurance status and forgone care, access to services, change in health, worry and stress
Uninsured all
12 months [REFERENCE]
(n=2,374)
Insured some of 12 months (n=374)
Insured all of 12 months (n=1,235)
Independent variables aOR 95% CI p-value aOR 95% CI p-value
Forgone care
Any forgone care 12 months prior to HMP
0.6 [0.5, 0.8] .002 0.3 [0.2, 0.3] < .001
Forgone care due to cost/no insurance/insurance not accepted/plan wouldn’t pay in 12months prior to HMP
0.8 [0.4, 1.5] .516 0.3 [0.2, 0.5] < .001
Access to services Improved access to prescriptions 0.8 [0.6, 1.1] .126 0.3 [0.3, 0.4] < .001 Improved access to primary care 0.6 [0.5, 0.8] .001 0.3 [0.2, 0.3] < .001 Improved access to help with staying healthy
0.8 [0.6, 1.1] .180 0.4 [0.3, 0.4] <. 001
Improved access to dental care 0.8 [0.6, 1.1] .110 0.4 [0.3, 0.5] < .001 Improved access to specialist care 0.7 [0.6, 1.0] .037 0.4 [0.3, 0.5] < .001 Improved access to mental health care 0.8 [0.6, 1.1] .144 0.5 [0.4, 0.6] < .001 Improved access to cancer screening 0.6 [0.5, 0.9] .006 0.4 [0.3, 0.5] < .001 Change in health Improved physical health 0.9 [0.7, 1.2] .456 0.4 [0.4, 0.5] < .001 Improved mental health 0.8 [0.6, 1.1] .126 0.6 [0.5, 0.7] < .001 Improved oral health 0.8 [0.6, 1.1] .218 0.6 [0.5, 0.7] < .001 Worry and stress1 I don’t worry so much 0.9 [0.7, 1.2] .520 0.7 [0.5, 0.8] < .001 Having HMP has taken a lot of stress off me
0.9 [0.5, 1.4] .588 0.6 [0.4, 0.7] < .001
Logistic regression with adjusted odds ratios; each row is a separate model/outcome, adjusted for age, gender, federal poverty level, race and ethnicity, urbanicity, self-reported health status, and self-reported chronic conditions. 1Respondents were asked to rate their worry and stress on a 5-point scale. Responses were dichotomized to reflect strongly agree/agree vs. neutral/disagree/strongly disagree.
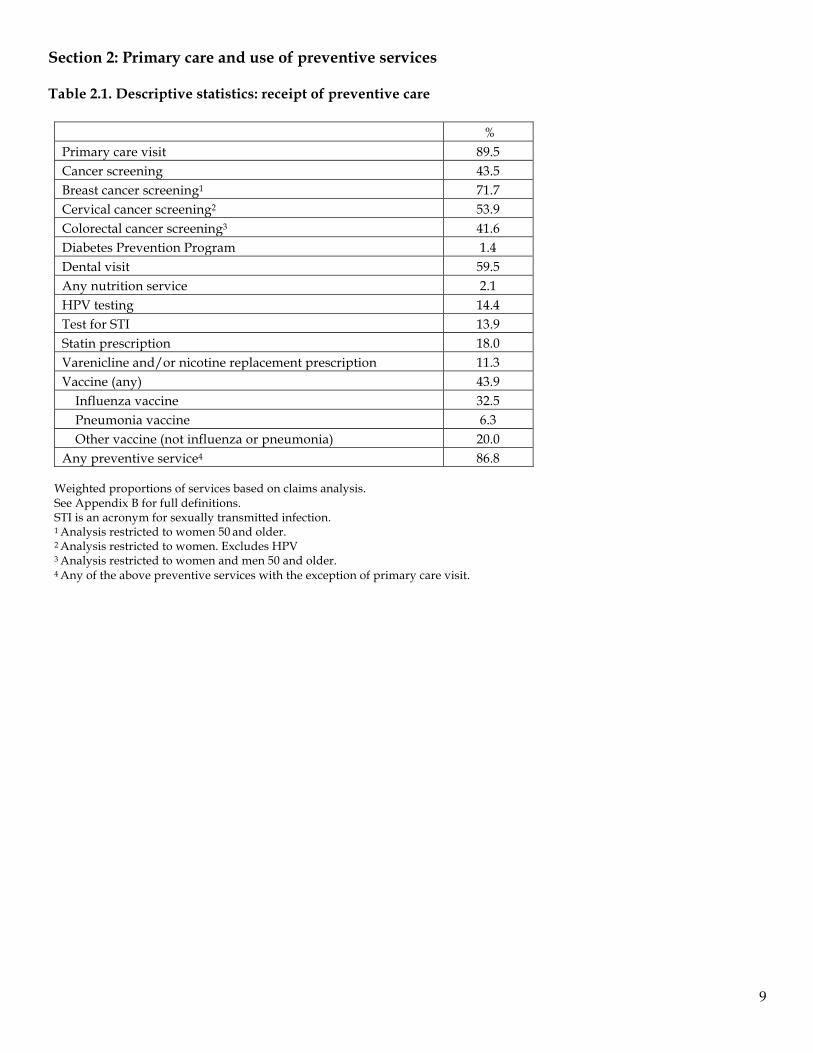
9
Section 2: Primary care and use of preventive services Table 2.1. Descriptive statistics: receipt of preventive care
% Primary care visit 89.5 Cancer screening 43.5 Breast cancer screening1 71.7 Cervical cancer screening2 53.9 Colorectal cancer screening3 41.6 Diabetes Prevention Program 1.4 Dental visit 59.5 Any nutrition service 2.1 HPV testing 14.4 Test for STI 13.9 Statin prescription 18.0 Varenicline and/or nicotine replacement prescription 11.3 Vaccine (any) 43.9 Influenza vaccine 32.5 Pneumonia vaccine 6.3 Other vaccine (not influenza or pneumonia) 20.0 Any preventive service4 86.8
Weighted proportions of services based on claims analysis. See Appendix B for full definitions. STI is an acronym for sexually transmitted infection. 1 Analysis restricted to women 50 and older. 2 Analysis restricted to women. Excludes HPV 3 Analysis restricted to women and men 50 and older. 4 Any of the above preventive services with the exception of primary care visit.
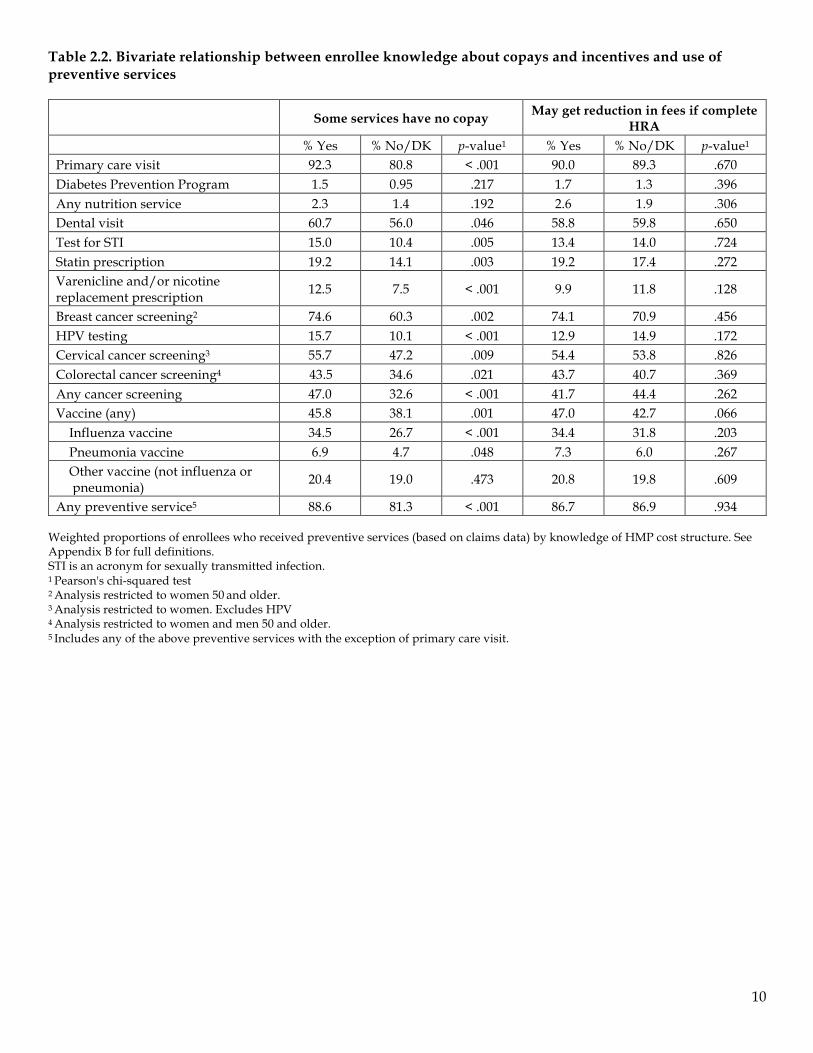
10
Table 2.2. Bivariate relationship between enrollee knowledge about copays and incentives and use of preventive services
Some services have no copay May get reduction in fees if complete HRA
% Yes % No/DK p-value1 % Yes % No/DK p-value1
Primary care visit 92.3 80.8 < .001 90.0 89.3 .670 Diabetes Prevention Program 1.5 0.95 .217 1.7 1.3 .396 Any nutrition service 2.3 1.4 .192 2.6 1.9 .306 Dental visit 60.7 56.0 .046 58.8 59.8 .650 Test for STI 15.0 10.4 .005 13.4 14.0 .724 Statin prescription 19.2 14.1 .003 19.2 17.4 .272 Varenicline and/or nicotine replacement prescription 12.5 7.5 < .001 9.9 11.8 .128
Breast cancer screening2 74.6 60.3 .002 74.1 70.9 .456 HPV testing 15.7 10.1 < .001 12.9 14.9 .172 Cervical cancer screening3 55.7 47.2 .009 54.4 53.8 .826 Colorectal cancer screening4 43.5 34.6 .021 43.7 40.7 .369 Any cancer screening 47.0 32.6 < .001 41.7 44.4 .262 Vaccine (any) 45.8 38.1 .001 47.0 42.7 .066 Influenza vaccine 34.5 26.7 < .001 34.4 31.8 .203 Pneumonia vaccine 6.9 4.7 .048 7.3 6.0 .267 Other vaccine (not influenza or
pneumonia) 20.4 19.0 .473 20.8 19.8 .609
Any preventive service5 88.6 81.3 < .001 86.7 86.9 .934 Weighted proportions of enrollees who received preventive services (based on claims data) by knowledge of HMP cost structure. See Appendix B for full definitions. STI is an acronym for sexually transmitted infection. 1 Pearson's chi-squared test 2 Analysis restricted to women 50 and older. 3 Analysis restricted to women. Excludes HPV 4 Analysis restricted to women and men 50 and older. 5 Includes any of the above preventive services with the exception of primary care visit.
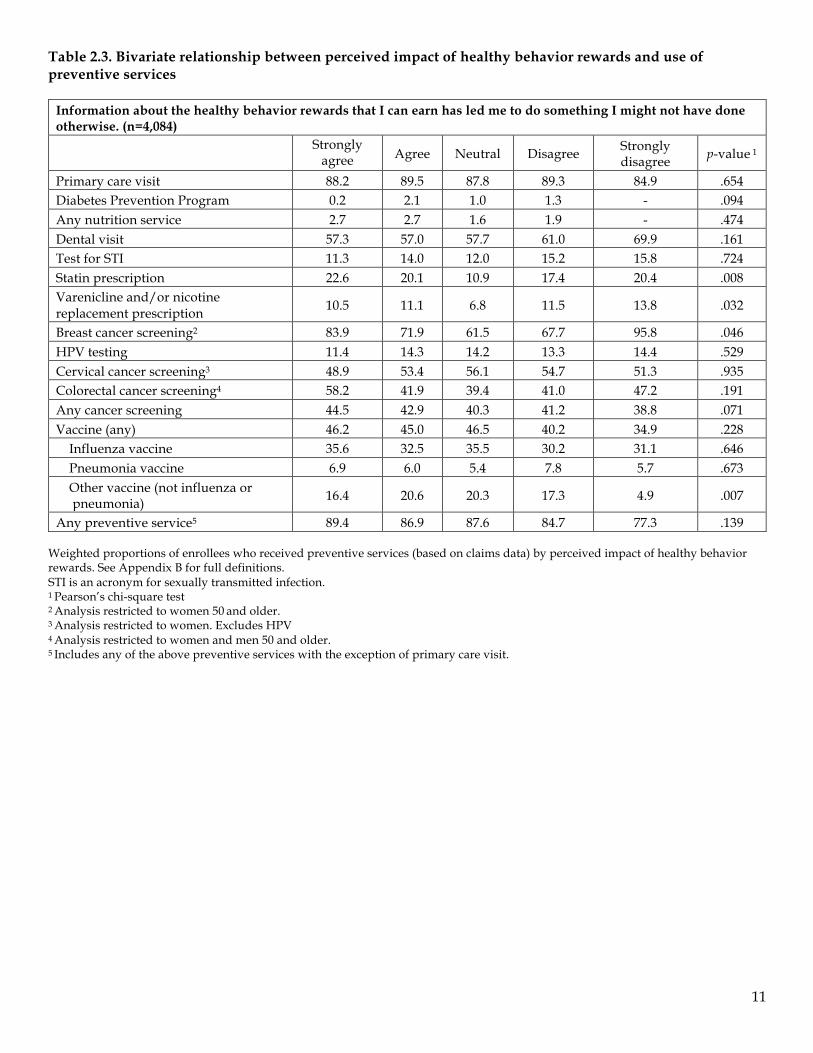
11
Table 2.3. Bivariate relationship between perceived impact of healthy behavior rewards and use of preventive services
Information about the healthy behavior rewards that I can earn has led me to do something I might not have done otherwise. (n=4,084)
Strongly
agree Agree Neutral Disagree Strongly disagree p-value 1
Primary care visit 88.2 89.5 87.8 89.3 84.9 .654 Diabetes Prevention Program 0.2 2.1 1.0 1.3 - .094 Any nutrition service 2.7 2.7 1.6 1.9 - .474 Dental visit 57.3 57.0 57.7 61.0 69.9 .161 Test for STI 11.3 14.0 12.0 15.2 15.8 .724 Statin prescription 22.6 20.1 10.9 17.4 20.4 .008 Varenicline and/or nicotine replacement prescription 10.5 11.1 6.8 11.5 13.8 .032
Breast cancer screening2 83.9 71.9 61.5 67.7 95.8 .046 HPV testing 11.4 14.3 14.2 13.3 14.4 .529 Cervical cancer screening3 48.9 53.4 56.1 54.7 51.3 .935 Colorectal cancer screening4 58.2 41.9 39.4 41.0 47.2 .191 Any cancer screening 44.5 42.9 40.3 41.2 38.8 .071 Vaccine (any) 46.2 45.0 46.5 40.2 34.9 .228 Influenza vaccine 35.6 32.5 35.5 30.2 31.1 .646 Pneumonia vaccine 6.9 6.0 5.4 7.8 5.7 .673 Other vaccine (not influenza or
pneumonia) 16.4 20.6 20.3 17.3 4.9 .007
Any preventive service5 89.4 86.9 87.6 84.7 77.3 .139 Weighted proportions of enrollees who received preventive services (based on claims data) by perceived impact of healthy behavior rewards. See Appendix B for full definitions. STI is an acronym for sexually transmitted infection. 1 Pearson’s chi-square test 2 Analysis restricted to women 50 and older. 3 Analysis restricted to women. Excludes HPV 4 Analysis restricted to women and men 50 and older. 5 Includes any of the above preventive services with the exception of primary care visit.
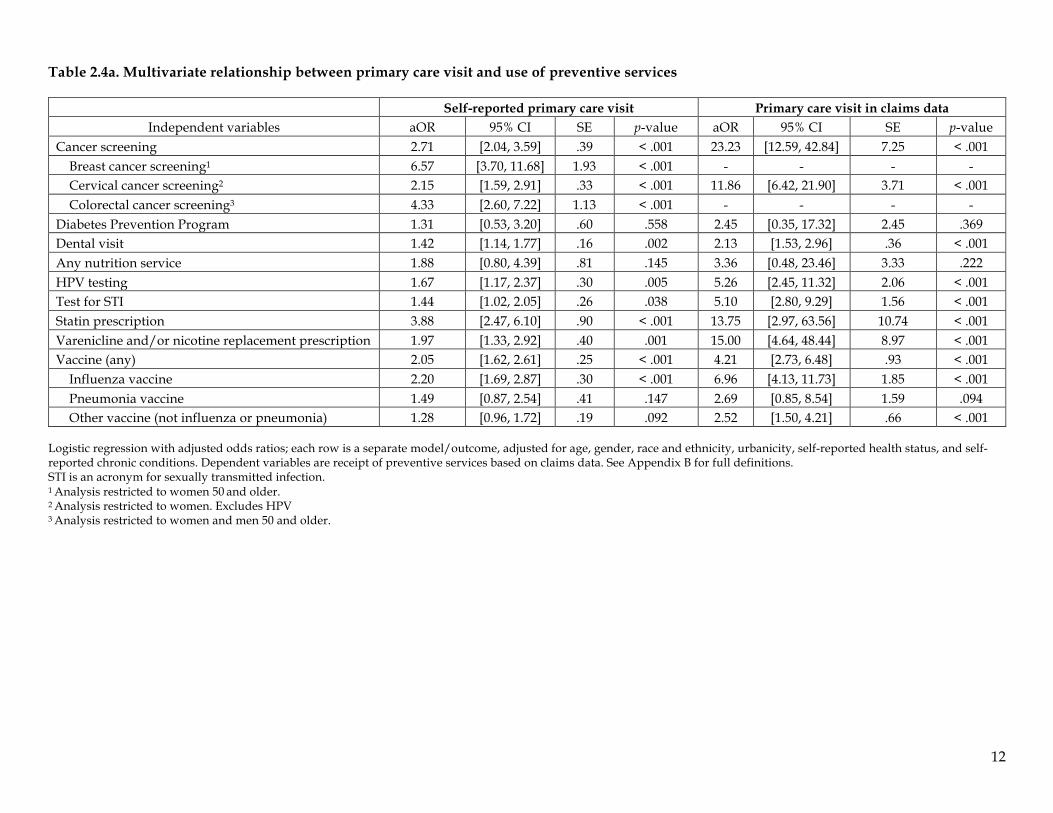
12
Table 2.4a. Multivariate relationship between primary care visit and use of preventive services
Self-reported primary care visit Primary care visit in claims data Independent variables aOR 95% CI SE p-value aOR 95% CI SE p-value
Cancer screening 2.71 [2.04, 3.59] .39 < .001 23.23 [12.59, 42.84] 7.25 < .001 Breast cancer screening1 6.57 [3.70, 11.68] 1.93 < .001 - - - - Cervical cancer screening2 2.15 [1.59, 2.91] .33 < .001 11.86 [6.42, 21.90] 3.71 < .001 Colorectal cancer screening3 4.33 [2.60, 7.22] 1.13 < .001 - - - - Diabetes Prevention Program 1.31 [0.53, 3.20] .60 .558 2.45 [0.35, 17.32] 2.45 .369 Dental visit 1.42 [1.14, 1.77] .16 .002 2.13 [1.53, 2.96] .36 < .001 Any nutrition service 1.88 [0.80, 4.39] .81 .145 3.36 [0.48, 23.46] 3.33 .222 HPV testing 1.67 [1.17, 2.37] .30 .005 5.26 [2.45, 11.32] 2.06 < .001 Test for STI 1.44 [1.02, 2.05] .26 .038 5.10 [2.80, 9.29] 1.56 < .001 Statin prescription 3.88 [2.47, 6.10] .90 < .001 13.75 [2.97, 63.56] 10.74 < .001 Varenicline and/or nicotine replacement prescription 1.97 [1.33, 2.92] .40 .001 15.00 [4.64, 48.44] 8.97 < .001 Vaccine (any) 2.05 [1.62, 2.61] .25 < .001 4.21 [2.73, 6.48] .93 < .001 Influenza vaccine 2.20 [1.69, 2.87] .30 < .001 6.96 [4.13, 11.73] 1.85 < .001 Pneumonia vaccine 1.49 [0.87, 2.54] .41 .147 2.69 [0.85, 8.54] 1.59 .094 Other vaccine (not influenza or pneumonia) 1.28 [0.96, 1.72] .19 .092 2.52 [1.50, 4.21] .66 < .001
Logistic regression with adjusted odds ratios; each row is a separate model/outcome, adjusted for age, gender, race and ethnicity, urbanicity, self-reported health status, and self-reported chronic conditions. Dependent variables are receipt of preventive services based on claims data. See Appendix B for full definitions. STI is an acronym for sexually transmitted infection. 1 Analysis restricted to women 50 and older. 2 Analysis restricted to women. Excludes HPV 3 Analysis restricted to women and men 50 and older.
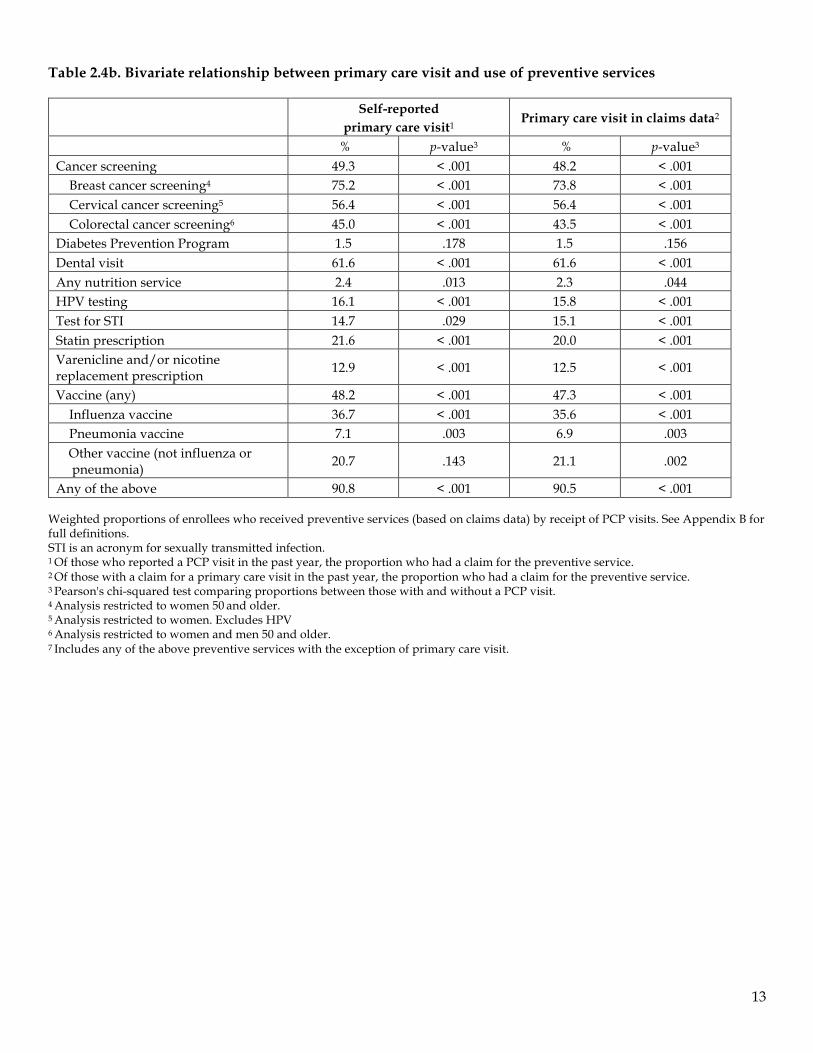
13
Table 2.4b. Bivariate relationship between primary care visit and use of preventive services
Self-reported
primary care visit1 Primary care visit in claims data2
% p-value3 % p-value3
Cancer screening 49.3 < .001 48.2 < .001 Breast cancer screening4 75.2 < .001 73.8 < .001 Cervical cancer screening5 56.4 < .001 56.4 < .001 Colorectal cancer screening6 45.0 < .001 43.5 < .001 Diabetes Prevention Program 1.5 .178 1.5 .156 Dental visit 61.6 < .001 61.6 < .001 Any nutrition service 2.4 .013 2.3 .044 HPV testing 16.1 < .001 15.8 < .001 Test for STI 14.7 .029 15.1 < .001 Statin prescription 21.6 < .001 20.0 < .001 Varenicline and/or nicotine replacement prescription 12.9 < .001 12.5 < .001
Vaccine (any) 48.2 < .001 47.3 < .001 Influenza vaccine 36.7 < .001 35.6 < .001 Pneumonia vaccine 7.1 .003 6.9 .003 Other vaccine (not influenza or
pneumonia) 20.7 .143 21.1 .002
Any of the above 90.8 < .001 90.5 < .001 Weighted proportions of enrollees who received preventive services (based on claims data) by receipt of PCP visits. See Appendix B for full definitions. STI is an acronym for sexually transmitted infection. 1 Of those who reported a PCP visit in the past year, the proportion who had a claim for the preventive service. 2 Of those with a claim for a primary care visit in the past year, the proportion who had a claim for the preventive service. 3 Pearson's chi-squared test comparing proportions between those with and without a PCP visit. 4 Analysis restricted to women 50 and older. 5 Analysis restricted to women. Excludes HPV 6 Analysis restricted to women and men 50 and older. 7 Includes any of the above preventive services with the exception of primary care visit.
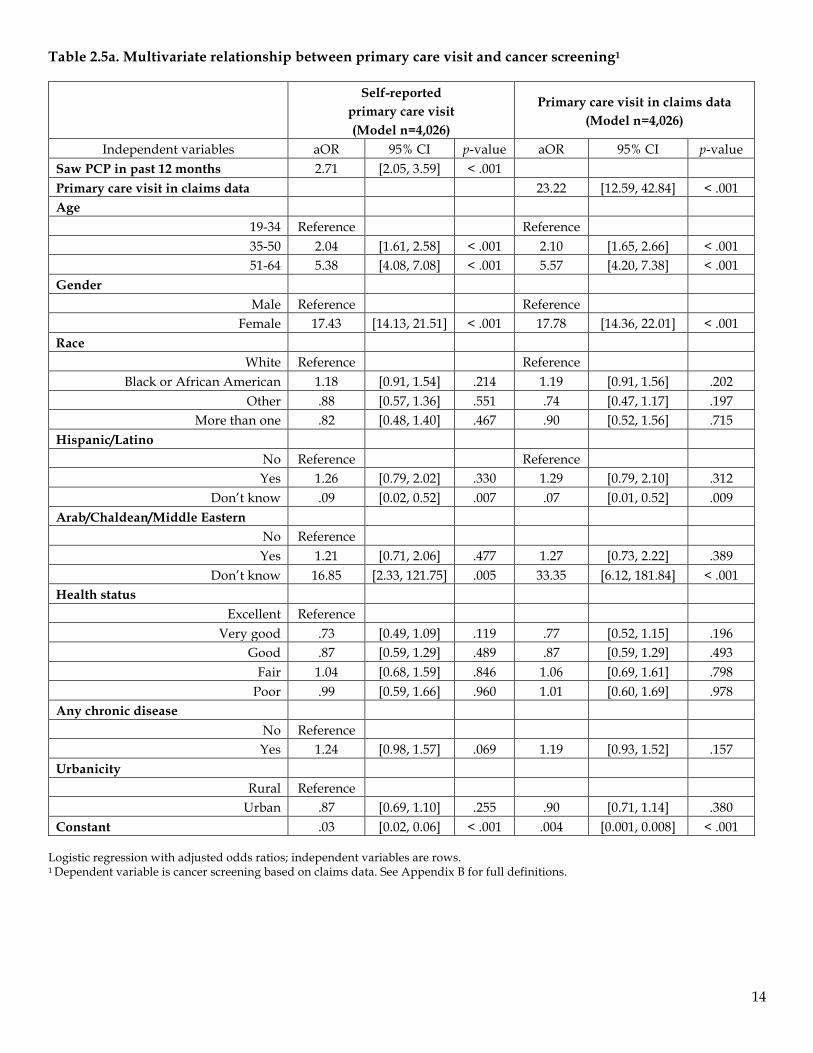
14
Table 2.5a. Multivariate relationship between primary care visit and cancer screening1
Self-reported
primary care visit (Model n=4,026)
Primary care visit in claims data (Model n=4,026)
Independent variables aOR 95% CI p-value aOR 95% CI p-value Saw PCP in past 12 months 2.71 [2.05, 3.59] < .001 Primary care visit in claims data 23.22 [12.59, 42.84] < .001 Age
19-34 Reference Reference 35-50 2.04 [1.61, 2.58] < .001 2.10 [1.65, 2.66] < .001 51-64 5.38 [4.08, 7.08] < .001 5.57 [4.20, 7.38] < .001
Gender Male Reference Reference
Female 17.43 [14.13, 21.51] < .001 17.78 [14.36, 22.01] < .001 Race
White Reference Reference Black or African American 1.18 [0.91, 1.54] .214 1.19 [0.91, 1.56] .202
Other .88 [0.57, 1.36] .551 .74 [0.47, 1.17] .197 More than one .82 [0.48, 1.40] .467 .90 [0.52, 1.56] .715
Hispanic/Latino No Reference Reference Yes 1.26 [0.79, 2.02] .330 1.29 [0.79, 2.10] .312
Don’t know .09 [0.02, 0.52] .007 .07 [0.01, 0.52] .009 Arab/Chaldean/Middle Eastern
No Reference Yes 1.21 [0.71, 2.06] .477 1.27 [0.73, 2.22] .389
Don’t know 16.85 [2.33, 121.75] .005 33.35 [6.12, 181.84] < .001 Health status
Excellent Reference Very good .73 [0.49, 1.09] .119 .77 [0.52, 1.15] .196
Good .87 [0.59, 1.29] .489 .87 [0.59, 1.29] .493 Fair 1.04 [0.68, 1.59] .846 1.06 [0.69, 1.61] .798
Poor .99 [0.59, 1.66] .960 1.01 [0.60, 1.69] .978 Any chronic disease
No Reference Yes 1.24 [0.98, 1.57] .069 1.19 [0.93, 1.52] .157
Urbanicity Rural Reference
Urban .87 [0.69, 1.10] .255 .90 [0.71, 1.14] .380 Constant .03 [0.02, 0.06] < .001 .004 [0.001, 0.008] < .001
Logistic regression with adjusted odds ratios; independent variables are rows. 1 Dependent variable is cancer screening based on claims data. See Appendix B for full definitions.
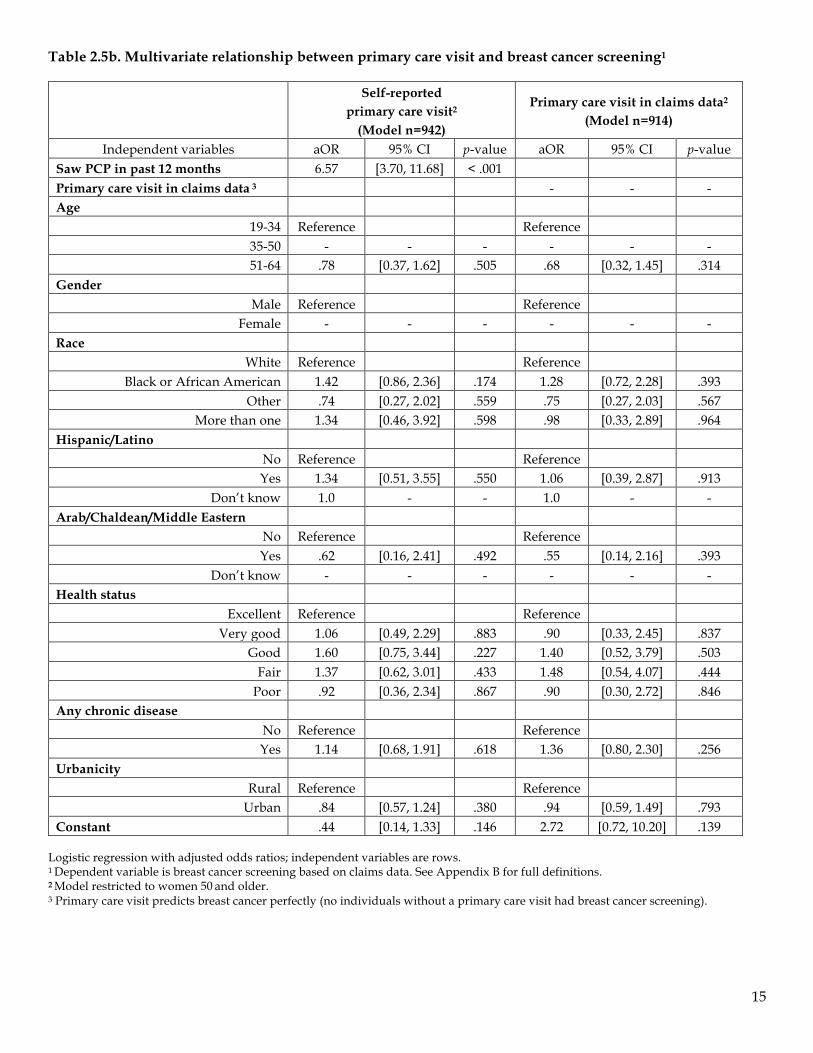
15
Table 2.5b. Multivariate relationship between primary care visit and breast cancer screening1
Self-reported
primary care visit2
(Model n=942)
Primary care visit in claims data2
(Model n=914)
Independent variables aOR 95% CI p-value aOR 95% CI p-value Saw PCP in past 12 months 6.57 [3.70, 11.68] < .001 Primary care visit in claims data 3 - - - Age
19-34 Reference Reference 35-50 - - - - - - 51-64 .78 [0.37, 1.62] .505 .68 [0.32, 1.45] .314
Gender Male Reference Reference
Female - - - - - - Race
White Reference Reference Black or African American 1.42 [0.86, 2.36] .174 1.28 [0.72, 2.28] .393
Other .74 [0.27, 2.02] .559 .75 [0.27, 2.03] .567 More than one 1.34 [0.46, 3.92] .598 .98 [0.33, 2.89] .964
Hispanic/Latino No Reference Reference Yes 1.34 [0.51, 3.55] .550 1.06 [0.39, 2.87] .913
Don’t know 1.0 - - 1.0 - - Arab/Chaldean/Middle Eastern
No Reference Reference Yes .62 [0.16, 2.41] .492 .55 [0.14, 2.16] .393
Don’t know - - - - - - Health status
Excellent Reference Reference Very good 1.06 [0.49, 2.29] .883 .90 [0.33, 2.45] .837
Good 1.60 [0.75, 3.44] .227 1.40 [0.52, 3.79] .503 Fair 1.37 [0.62, 3.01] .433 1.48 [0.54, 4.07] .444
Poor .92 [0.36, 2.34] .867 .90 [0.30, 2.72] .846 Any chronic disease
No Reference Reference Yes 1.14 [0.68, 1.91] .618 1.36 [0.80, 2.30] .256
Urbanicity Rural Reference Reference
Urban .84 [0.57, 1.24] .380 .94 [0.59, 1.49] .793 Constant .44 [0.14, 1.33] .146 2.72 [0.72, 10.20] .139
Logistic regression with adjusted odds ratios; independent variables are rows. 1 Dependent variable is breast cancer screening based on claims data. See Appendix B for full definitions. 2 Model restricted to women 50 and older. 3 Primary care visit predicts breast cancer perfectly (no individuals without a primary care visit had breast cancer screening).
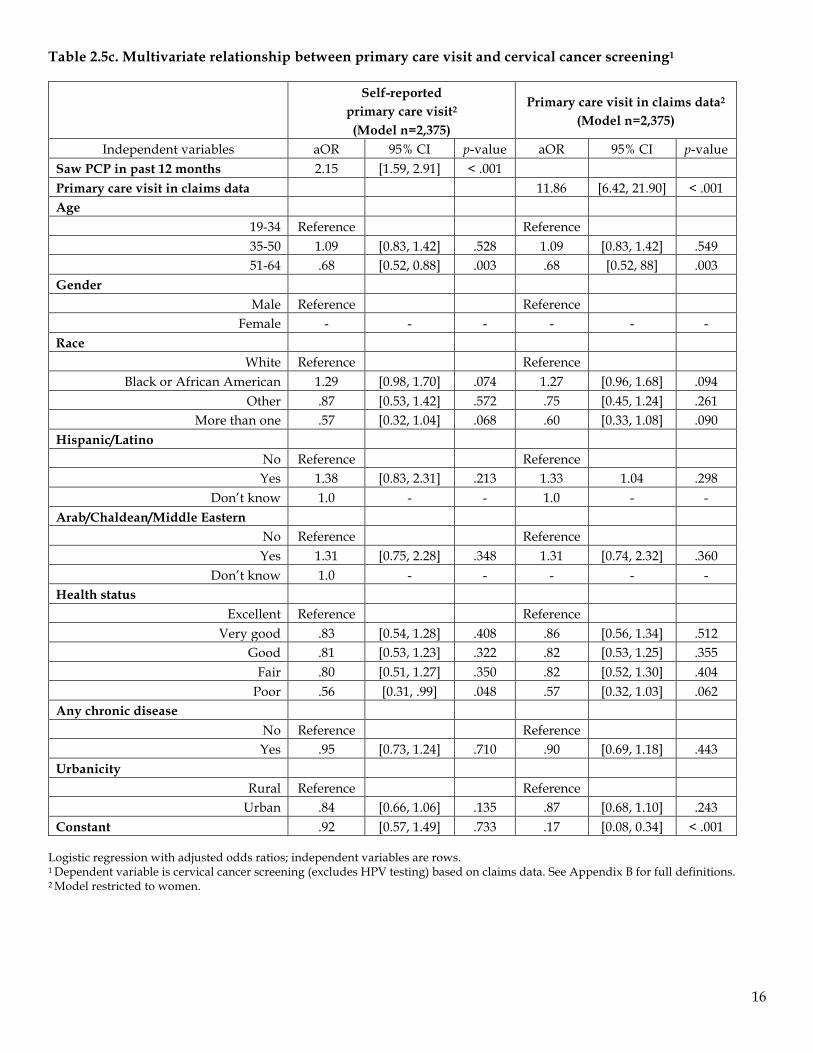
16
Table 2.5c. Multivariate relationship between primary care visit and cervical cancer screening1
Self-reported
primary care visit2
(Model n=2,375)
Primary care visit in claims data2
(Model n=2,375)
Independent variables aOR 95% CI p-value aOR 95% CI p-value Saw PCP in past 12 months 2.15 [1.59, 2.91] < .001 Primary care visit in claims data 11.86 [6.42, 21.90] < .001 Age
19-34 Reference Reference 35-50 1.09 [0.83, 1.42] .528 1.09 [0.83, 1.42] .549 51-64 .68 [0.52, 0.88] .003 .68 [0.52, 88] .003
Gender Male Reference Reference
Female - - - - - - Race
White Reference Reference Black or African American 1.29 [0.98, 1.70] .074 1.27 [0.96, 1.68] .094
Other .87 [0.53, 1.42] .572 .75 [0.45, 1.24] .261 More than one .57 [0.32, 1.04] .068 .60 [0.33, 1.08] .090
Hispanic/Latino No Reference Reference Yes 1.38 [0.83, 2.31] .213 1.33 1.04 .298
Don’t know 1.0 - - 1.0 - - Arab/Chaldean/Middle Eastern
No Reference Reference Yes 1.31 [0.75, 2.28] .348 1.31 [0.74, 2.32] .360
Don’t know 1.0 - - - - - Health status
Excellent Reference Reference Very good .83 [0.54, 1.28] .408 .86 [0.56, 1.34] .512
Good .81 [0.53, 1.23] .322 .82 [0.53, 1.25] .355 Fair .80 [0.51, 1.27] .350 .82 [0.52, 1.30] .404
Poor .56 [0.31, .99] .048 .57 [0.32, 1.03] .062 Any chronic disease
No Reference Reference Yes .95 [0.73, 1.24] .710 .90 [0.69, 1.18] .443
Urbanicity Rural Reference Reference
Urban .84 [0.66, 1.06] .135 .87 [0.68, 1.10] .243 Constant .92 [0.57, 1.49] .733 .17 [0.08, 0.34] < .001
Logistic regression with adjusted odds ratios; independent variables are rows. 1 Dependent variable is cervical cancer screening (excludes HPV testing) based on claims data. See Appendix B for full definitions. 2 Model restricted to women.
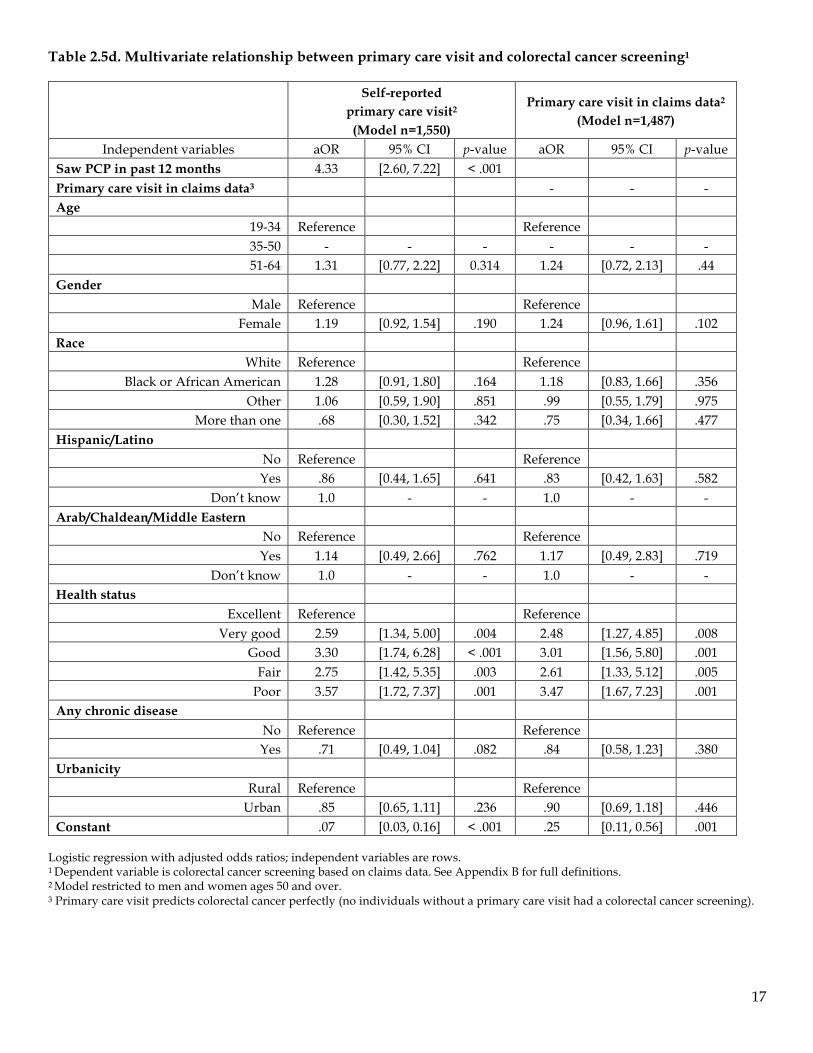
17
Table 2.5d. Multivariate relationship between primary care visit and colorectal cancer screening1
Self-reported
primary care visit2
(Model n=1,550)
Primary care visit in claims data2
(Model n=1,487)
Independent variables aOR 95% CI p-value aOR 95% CI p-value Saw PCP in past 12 months 4.33 [2.60, 7.22] < .001 Primary care visit in claims data3 - - - Age
19-34 Reference Reference 35-50 - - - - - - 51-64 1.31 [0.77, 2.22] 0.314 1.24 [0.72, 2.13] .44
Gender Male Reference Reference
Female 1.19 [0.92, 1.54] .190 1.24 [0.96, 1.61] .102 Race
White Reference Reference Black or African American 1.28 [0.91, 1.80] .164 1.18 [0.83, 1.66] .356
Other 1.06 [0.59, 1.90] .851 .99 [0.55, 1.79] .975 More than one .68 [0.30, 1.52] .342 .75 [0.34, 1.66] .477
Hispanic/Latino No Reference Reference Yes .86 [0.44, 1.65] .641 .83 [0.42, 1.63] .582
Don’t know 1.0 - - 1.0 - - Arab/Chaldean/Middle Eastern
No Reference Reference Yes 1.14 [0.49, 2.66] .762 1.17 [0.49, 2.83] .719
Don’t know 1.0 - - 1.0 - - Health status
Excellent Reference Reference Very good 2.59 [1.34, 5.00] .004 2.48 [1.27, 4.85] .008
Good 3.30 [1.74, 6.28] < .001 3.01 [1.56, 5.80] .001 Fair 2.75 [1.42, 5.35] .003 2.61 [1.33, 5.12] .005
Poor 3.57 [1.72, 7.37] .001 3.47 [1.67, 7.23] .001 Any chronic disease
No Reference Reference Yes .71 [0.49, 1.04] .082 .84 [0.58, 1.23] .380
Urbanicity Rural Reference Reference
Urban .85 [0.65, 1.11] .236 .90 [0.69, 1.18] .446 Constant .07 [0.03, 0.16] < .001 .25 [0.11, 0.56] .001
Logistic regression with adjusted odds ratios; independent variables are rows. 1 Dependent variable is colorectal cancer screening based on claims data. See Appendix B for full definitions. 2 Model restricted to men and women ages 50 and over. 3 Primary care visit predicts colorectal cancer perfectly (no individuals without a primary care visit had a colorectal cancer screening).
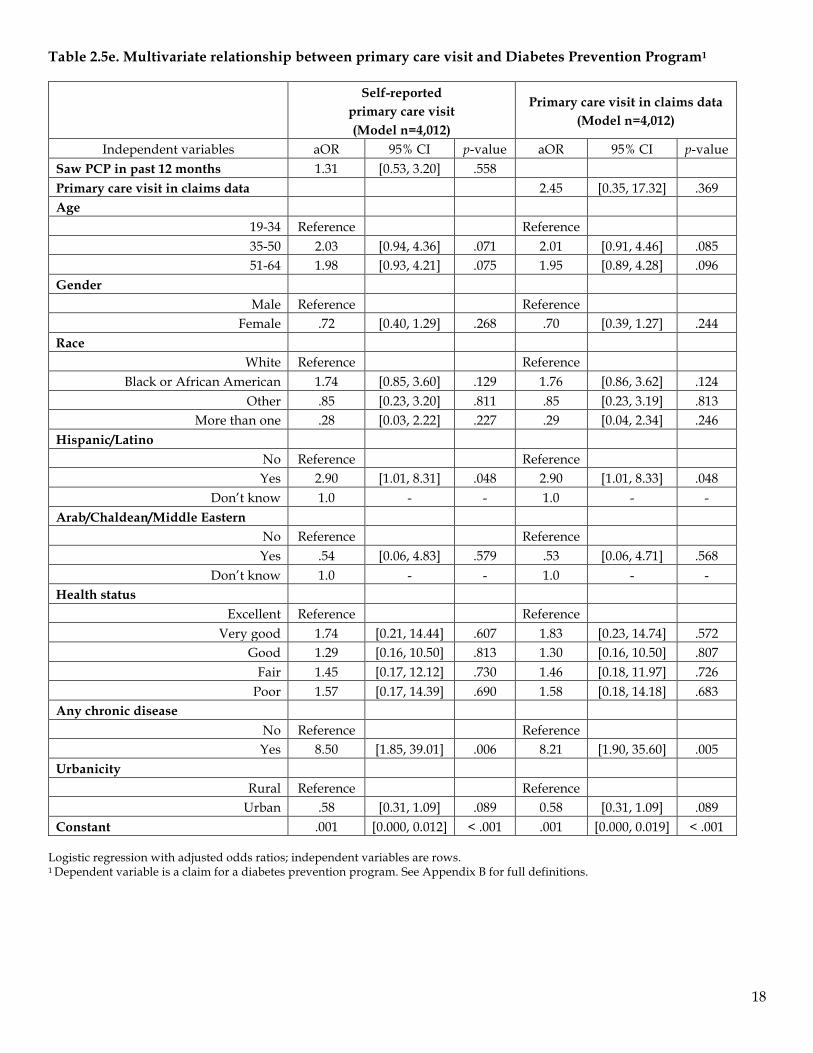
18
Table 2.5e. Multivariate relationship between primary care visit and Diabetes Prevention Program1
Self-reported
primary care visit (Model n=4,012)
Primary care visit in claims data (Model n=4,012)
Independent variables aOR 95% CI p-value aOR 95% CI p-value Saw PCP in past 12 months 1.31 [0.53, 3.20] .558 Primary care visit in claims data 2.45 [0.35, 17.32] .369 Age
19-34 Reference Reference 35-50 2.03 [0.94, 4.36] .071 2.01 [0.91, 4.46] .085 51-64 1.98 [0.93, 4.21] .075 1.95 [0.89, 4.28] .096
Gender Male Reference Reference
Female .72 [0.40, 1.29] .268 .70 [0.39, 1.27] .244 Race
White Reference Reference Black or African American 1.74 [0.85, 3.60] .129 1.76 [0.86, 3.62] .124
Other .85 [0.23, 3.20] .811 .85 [0.23, 3.19] .813 More than one .28 [0.03, 2.22] .227 .29 [0.04, 2.34] .246
Hispanic/Latino No Reference Reference Yes 2.90 [1.01, 8.31] .048 2.90 [1.01, 8.33] .048
Don’t know 1.0 - - 1.0 - - Arab/Chaldean/Middle Eastern
No Reference Reference Yes .54 [0.06, 4.83] .579 .53 [0.06, 4.71] .568
Don’t know 1.0 - - 1.0 - - Health status
Excellent Reference Reference Very good 1.74 [0.21, 14.44] .607 1.83 [0.23, 14.74] .572
Good 1.29 [0.16, 10.50] .813 1.30 [0.16, 10.50] .807 Fair 1.45 [0.17, 12.12] .730 1.46 [0.18, 11.97] .726
Poor 1.57 [0.17, 14.39] .690 1.58 [0.18, 14.18] .683 Any chronic disease
No Reference Reference Yes 8.50 [1.85, 39.01] .006 8.21 [1.90, 35.60] .005
Urbanicity Rural Reference Reference
Urban .58 [0.31, 1.09] .089 0.58 [0.31, 1.09] .089 Constant .001 [0.000, 0.012] < .001 .001 [0.000, 0.019] < .001
Logistic regression with adjusted odds ratios; independent variables are rows. 1 Dependent variable is a claim for a diabetes prevention program. See Appendix B for full definitions.
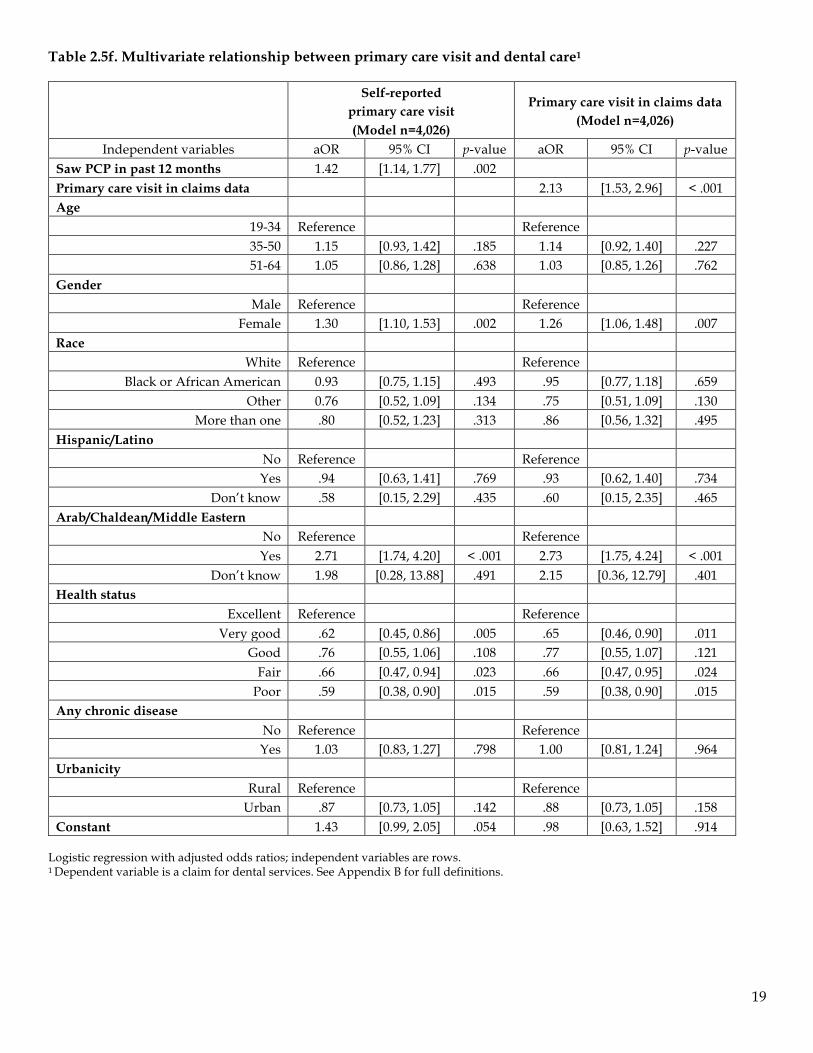
19
Table 2.5f. Multivariate relationship between primary care visit and dental care1
Self-reported
primary care visit (Model n=4,026)
Primary care visit in claims data (Model n=4,026)
Independent variables aOR 95% CI p-value aOR 95% CI p-value Saw PCP in past 12 months 1.42 [1.14, 1.77] .002 Primary care visit in claims data 2.13 [1.53, 2.96] < .001 Age
19-34 Reference Reference 35-50 1.15 [0.93, 1.42] .185 1.14 [0.92, 1.40] .227 51-64 1.05 [0.86, 1.28] .638 1.03 [0.85, 1.26] .762
Gender Male Reference Reference
Female 1.30 [1.10, 1.53] .002 1.26 [1.06, 1.48] .007 Race
White Reference Reference Black or African American 0.93 [0.75, 1.15] .493 .95 [0.77, 1.18] .659
Other 0.76 [0.52, 1.09] .134 .75 [0.51, 1.09] .130 More than one .80 [0.52, 1.23] .313 .86 [0.56, 1.32] .495
Hispanic/Latino No Reference Reference Yes .94 [0.63, 1.41] .769 .93 [0.62, 1.40] .734
Don’t know .58 [0.15, 2.29] .435 .60 [0.15, 2.35] .465 Arab/Chaldean/Middle Eastern
No Reference Reference Yes 2.71 [1.74, 4.20] < .001 2.73 [1.75, 4.24] < .001
Don’t know 1.98 [0.28, 13.88] .491 2.15 [0.36, 12.79] .401 Health status
Excellent Reference Reference Very good .62 [0.45, 0.86] .005 .65 [0.46, 0.90] .011
Good .76 [0.55, 1.06] .108 .77 [0.55, 1.07] .121 Fair .66 [0.47, 0.94] .023 .66 [0.47, 0.95] .024
Poor .59 [0.38, 0.90] .015 .59 [0.38, 0.90] .015 Any chronic disease
No Reference Reference Yes 1.03 [0.83, 1.27] .798 1.00 [0.81, 1.24] .964
Urbanicity Rural Reference Reference
Urban .87 [0.73, 1.05] .142 .88 [0.73, 1.05] .158 Constant 1.43 [0.99, 2.05] .054 .98 [0.63, 1.52] .914
Logistic regression with adjusted odds ratios; independent variables are rows. 1 Dependent variable is a claim for dental services. See Appendix B for full definitions.
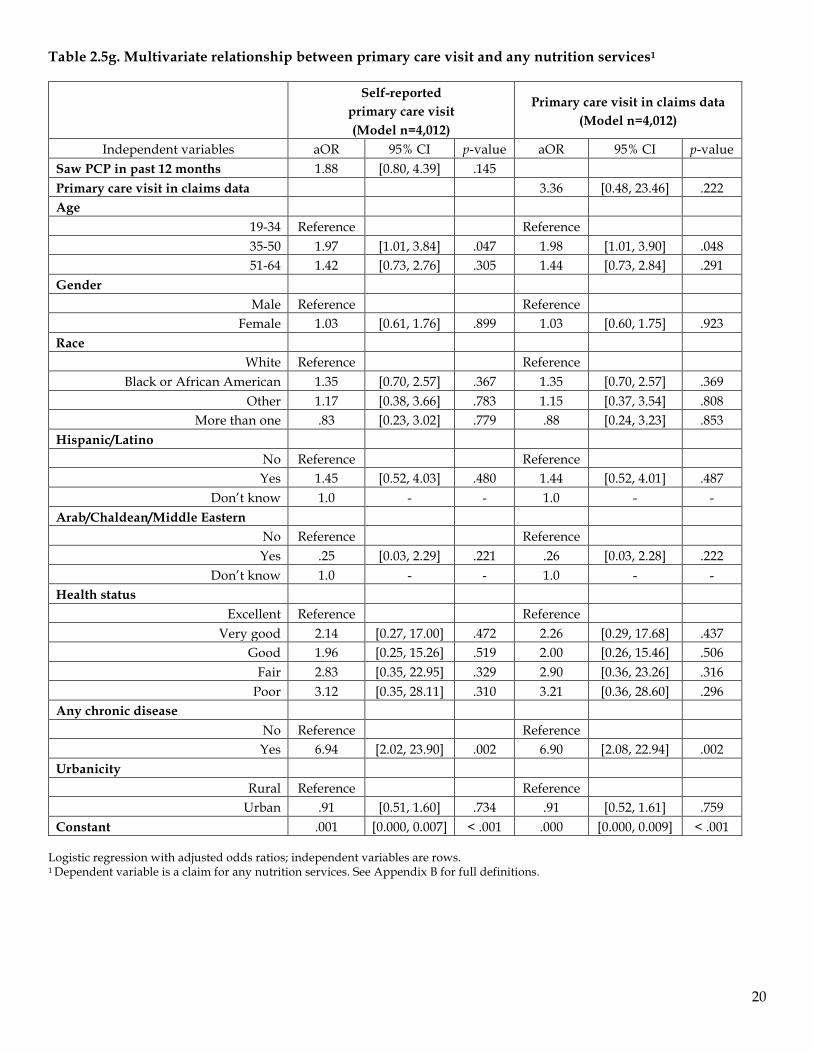
20
Table 2.5g. Multivariate relationship between primary care visit and any nutrition services1
Self-reported
primary care visit (Model n=4,012)
Primary care visit in claims data (Model n=4,012)
Independent variables aOR 95% CI p-value aOR 95% CI p-value Saw PCP in past 12 months 1.88 [0.80, 4.39] .145 Primary care visit in claims data 3.36 [0.48, 23.46] .222 Age
19-34 Reference Reference 35-50 1.97 [1.01, 3.84] .047 1.98 [1.01, 3.90] .048 51-64 1.42 [0.73, 2.76] .305 1.44 [0.73, 2.84] .291
Gender Male Reference Reference
Female 1.03 [0.61, 1.76] .899 1.03 [0.60, 1.75] .923 Race
White Reference Reference Black or African American 1.35 [0.70, 2.57] .367 1.35 [0.70, 2.57] .369
Other 1.17 [0.38, 3.66] .783 1.15 [0.37, 3.54] .808 More than one .83 [0.23, 3.02] .779 .88 [0.24, 3.23] .853
Hispanic/Latino No Reference Reference Yes 1.45 [0.52, 4.03] .480 1.44 [0.52, 4.01] .487
Don’t know 1.0 - - 1.0 - - Arab/Chaldean/Middle Eastern
No Reference Reference Yes .25 [0.03, 2.29] .221 .26 [0.03, 2.28] .222
Don’t know 1.0 - - 1.0 - - Health status
Excellent Reference Reference Very good 2.14 [0.27, 17.00] .472 2.26 [0.29, 17.68] .437
Good 1.96 [0.25, 15.26] .519 2.00 [0.26, 15.46] .506 Fair 2.83 [0.35, 22.95] .329 2.90 [0.36, 23.26] .316
Poor 3.12 [0.35, 28.11] .310 3.21 [0.36, 28.60] .296 Any chronic disease
No Reference Reference Yes 6.94 [2.02, 23.90] .002 6.90 [2.08, 22.94] .002
Urbanicity Rural Reference Reference
Urban .91 [0.51, 1.60] .734 .91 [0.52, 1.61] .759 Constant .001 [0.000, 0.007] < .001 .000 [0.000, 0.009] < .001
Logistic regression with adjusted odds ratios; independent variables are rows. 1 Dependent variable is a claim for any nutrition services. See Appendix B for full definitions.
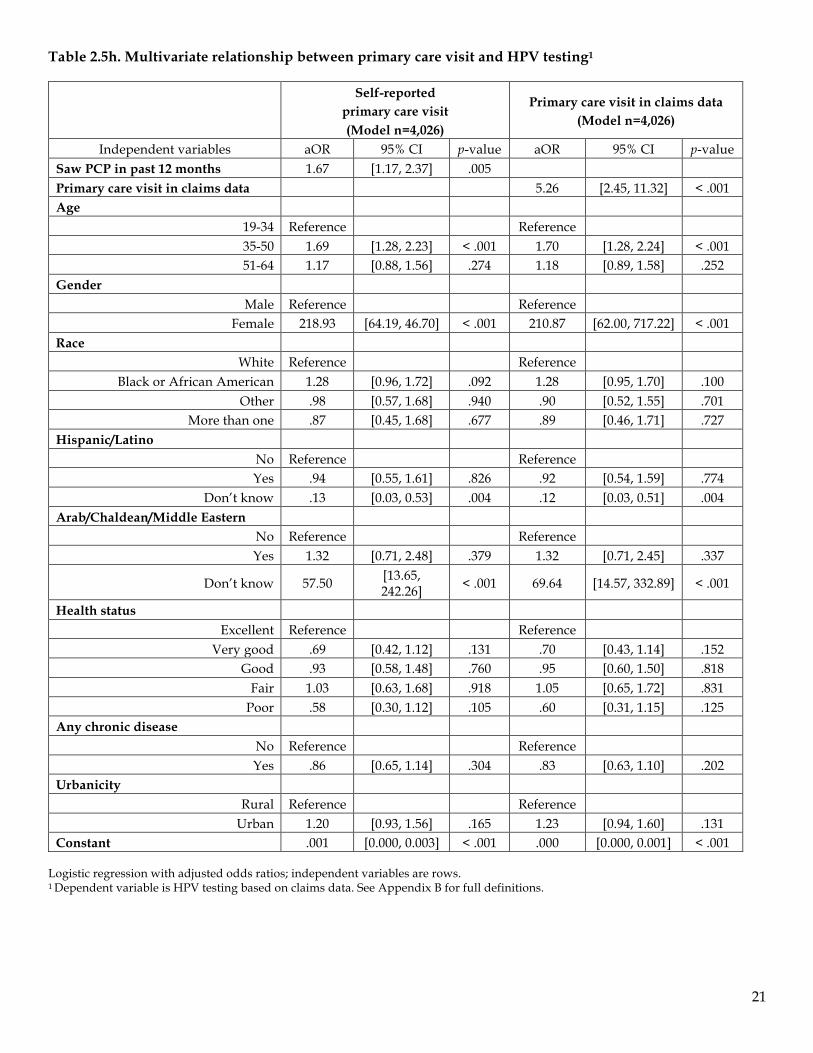
21
Table 2.5h. Multivariate relationship between primary care visit and HPV testing1
Self-reported
primary care visit (Model n=4,026)
Primary care visit in claims data (Model n=4,026)
Independent variables aOR 95% CI p-value aOR 95% CI p-value Saw PCP in past 12 months 1.67 [1.17, 2.37] .005 Primary care visit in claims data 5.26 [2.45, 11.32] < .001 Age
19-34 Reference Reference 35-50 1.69 [1.28, 2.23] < .001 1.70 [1.28, 2.24] < .001 51-64 1.17 [0.88, 1.56] .274 1.18 [0.89, 1.58] .252
Gender Male Reference Reference
Female 218.93 [64.19, 46.70] < .001 210.87 [62.00, 717.22] < .001 Race
White Reference Reference Black or African American 1.28 [0.96, 1.72] .092 1.28 [0.95, 1.70] .100
Other .98 [0.57, 1.68] .940 .90 [0.52, 1.55] .701 More than one .87 [0.45, 1.68] .677 .89 [0.46, 1.71] .727
Hispanic/Latino No Reference Reference Yes .94 [0.55, 1.61] .826 .92 [0.54, 1.59] .774
Don’t know .13 [0.03, 0.53] .004 .12 [0.03, 0.51] .004 Arab/Chaldean/Middle Eastern
No Reference Reference Yes 1.32 [0.71, 2.48] .379 1.32 [0.71, 2.45] .337
Don’t know 57.50 [13.65, 242.26] < .001 69.64 [14.57, 332.89] < .001
Health status Excellent Reference Reference
Very good .69 [0.42, 1.12] .131 .70 [0.43, 1.14] .152 Good .93 [0.58, 1.48] .760 .95 [0.60, 1.50] .818
Fair 1.03 [0.63, 1.68] .918 1.05 [0.65, 1.72] .831 Poor .58 [0.30, 1.12] .105 .60 [0.31, 1.15] .125
Any chronic disease No Reference Reference Yes .86 [0.65, 1.14] .304 .83 [0.63, 1.10] .202
Urbanicity Rural Reference Reference
Urban 1.20 [0.93, 1.56] .165 1.23 [0.94, 1.60] .131 Constant .001 [0.000, 0.003] < .001 .000 [0.000, 0.001] < .001
Logistic regression with adjusted odds ratios; independent variables are rows. 1 Dependent variable is HPV testing based on claims data. See Appendix B for full definitions.
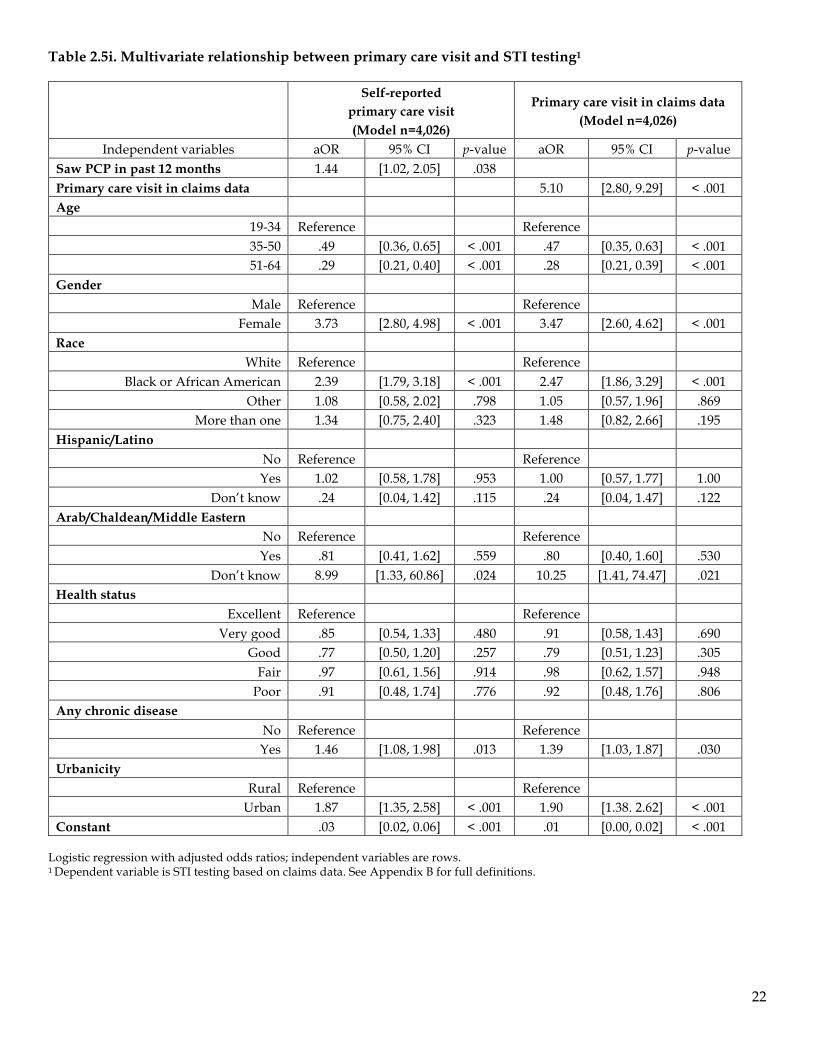
22
Table 2.5i. Multivariate relationship between primary care visit and STI testing1
Self-reported
primary care visit (Model n=4,026)
Primary care visit in claims data (Model n=4,026)
Independent variables aOR 95% CI p-value aOR 95% CI p-value Saw PCP in past 12 months 1.44 [1.02, 2.05] .038 Primary care visit in claims data 5.10 [2.80, 9.29] < .001 Age
19-34 Reference Reference 35-50 .49 [0.36, 0.65] < .001 .47 [0.35, 0.63] < .001 51-64 .29 [0.21, 0.40] < .001 .28 [0.21, 0.39] < .001
Gender Male Reference Reference
Female 3.73 [2.80, 4.98] < .001 3.47 [2.60, 4.62] < .001 Race
White Reference Reference Black or African American 2.39 [1.79, 3.18] < .001 2.47 [1.86, 3.29] < .001
Other 1.08 [0.58, 2.02] .798 1.05 [0.57, 1.96] .869 More than one 1.34 [0.75, 2.40] .323 1.48 [0.82, 2.66] .195
Hispanic/Latino No Reference Reference Yes 1.02 [0.58, 1.78] .953 1.00 [0.57, 1.77] 1.00
Don’t know .24 [0.04, 1.42] .115 .24 [0.04, 1.47] .122 Arab/Chaldean/Middle Eastern
No Reference Reference Yes .81 [0.41, 1.62] .559 .80 [0.40, 1.60] .530
Don’t know 8.99 [1.33, 60.86] .024 10.25 [1.41, 74.47] .021 Health status
Excellent Reference Reference Very good .85 [0.54, 1.33] .480 .91 [0.58, 1.43] .690
Good .77 [0.50, 1.20] .257 .79 [0.51, 1.23] .305 Fair .97 [0.61, 1.56] .914 .98 [0.62, 1.57] .948
Poor .91 [0.48, 1.74] .776 .92 [0.48, 1.76] .806 Any chronic disease
No Reference Reference Yes 1.46 [1.08, 1.98] .013 1.39 [1.03, 1.87] .030
Urbanicity Rural Reference Reference
Urban 1.87 [1.35, 2.58] < .001 1.90 [1.38. 2.62] < .001 Constant .03 [0.02, 0.06] < .001 .01 [0.00, 0.02] < .001
Logistic regression with adjusted odds ratios; independent variables are rows. 1 Dependent variable is STI testing based on claims data. See Appendix B for full definitions.
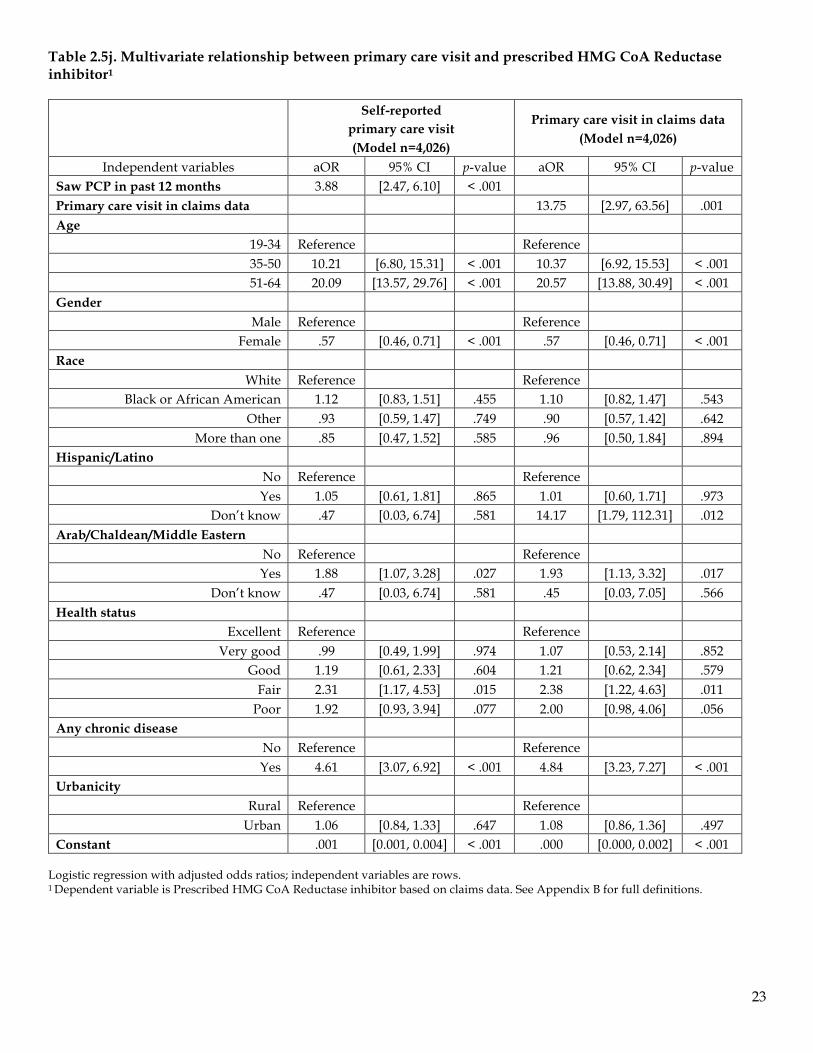
23
Table 2.5j. Multivariate relationship between primary care visit and prescribed HMG CoA Reductase inhibitor1
Self-reported
primary care visit (Model n=4,026)
Primary care visit in claims data (Model n=4,026)
Independent variables aOR 95% CI p-value aOR 95% CI p-value Saw PCP in past 12 months 3.88 [2.47, 6.10] < .001 Primary care visit in claims data 13.75 [2.97, 63.56] .001 Age
19-34 Reference Reference 35-50 10.21 [6.80, 15.31] < .001 10.37 [6.92, 15.53] < .001 51-64 20.09 [13.57, 29.76] < .001 20.57 [13.88, 30.49] < .001
Gender Male Reference Reference
Female .57 [0.46, 0.71] < .001 .57 [0.46, 0.71] < .001 Race
White Reference Reference Black or African American 1.12 [0.83, 1.51] .455 1.10 [0.82, 1.47] .543
Other .93 [0.59, 1.47] .749 .90 [0.57, 1.42] .642 More than one .85 [0.47, 1.52] .585 .96 [0.50, 1.84] .894
Hispanic/Latino No Reference Reference Yes 1.05 [0.61, 1.81] .865 1.01 [0.60, 1.71] .973
Don’t know .47 [0.03, 6.74] .581 14.17 [1.79, 112.31] .012 Arab/Chaldean/Middle Eastern
No Reference Reference Yes 1.88 [1.07, 3.28] .027 1.93 [1.13, 3.32] .017
Don’t know .47 [0.03, 6.74] .581 .45 [0.03, 7.05] .566 Health status
Excellent Reference Reference Very good .99 [0.49, 1.99] .974 1.07 [0.53, 2.14] .852
Good 1.19 [0.61, 2.33] .604 1.21 [0.62, 2.34] .579 Fair 2.31 [1.17, 4.53] .015 2.38 [1.22, 4.63] .011
Poor 1.92 [0.93, 3.94] .077 2.00 [0.98, 4.06] .056 Any chronic disease
No Reference Reference Yes 4.61 [3.07, 6.92] < .001 4.84 [3.23, 7.27] < .001
Urbanicity Rural Reference Reference
Urban 1.06 [0.84, 1.33] .647 1.08 [0.86, 1.36] .497 Constant .001 [0.001, 0.004] < .001 .000 [0.000, 0.002] < .001
Logistic regression with adjusted odds ratios; independent variables are rows. 1 Dependent variable is Prescribed HMG CoA Reductase inhibitor based on claims data. See Appendix B for full definitions.
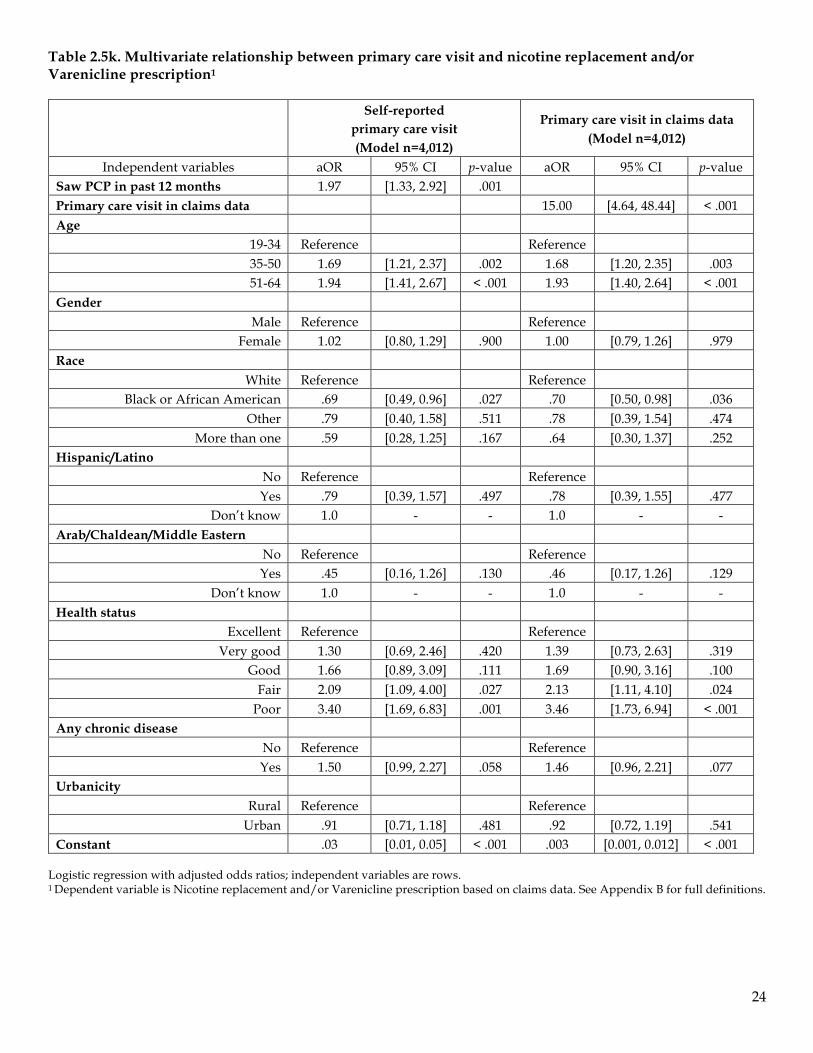
24
Table 2.5k. Multivariate relationship between primary care visit and nicotine replacement and/or Varenicline prescription1
Self-reported
primary care visit (Model n=4,012)
Primary care visit in claims data (Model n=4,012)
Independent variables aOR 95% CI p-value aOR 95% CI p-value Saw PCP in past 12 months 1.97 [1.33, 2.92] .001 Primary care visit in claims data 15.00 [4.64, 48.44] < .001 Age
19-34 Reference Reference 35-50 1.69 [1.21, 2.37] .002 1.68 [1.20, 2.35] .003 51-64 1.94 [1.41, 2.67] < .001 1.93 [1.40, 2.64] < .001
Gender Male Reference Reference
Female 1.02 [0.80, 1.29] .900 1.00 [0.79, 1.26] .979 Race
White Reference Reference Black or African American .69 [0.49, 0.96] .027 .70 [0.50, 0.98] .036
Other .79 [0.40, 1.58] .511 .78 [0.39, 1.54] .474 More than one .59 [0.28, 1.25] .167 .64 [0.30, 1.37] .252
Hispanic/Latino No Reference Reference Yes .79 [0.39, 1.57] .497 .78 [0.39, 1.55] .477
Don’t know 1.0 - - 1.0 - - Arab/Chaldean/Middle Eastern
No Reference Reference Yes .45 [0.16, 1.26] .130 .46 [0.17, 1.26] .129
Don’t know 1.0 - - 1.0 - - Health status
Excellent Reference Reference Very good 1.30 [0.69, 2.46] .420 1.39 [0.73, 2.63] .319
Good 1.66 [0.89, 3.09] .111 1.69 [0.90, 3.16] .100 Fair 2.09 [1.09, 4.00] .027 2.13 [1.11, 4.10] .024
Poor 3.40 [1.69, 6.83] .001 3.46 [1.73, 6.94] < .001 Any chronic disease
No Reference Reference Yes 1.50 [0.99, 2.27] .058 1.46 [0.96, 2.21] .077
Urbanicity Rural Reference Reference
Urban .91 [0.71, 1.18] .481 .92 [0.72, 1.19] .541 Constant .03 [0.01, 0.05] < .001 .003 [0.001, 0.012] < .001
Logistic regression with adjusted odds ratios; independent variables are rows. 1 Dependent variable is Nicotine replacement and/or Varenicline prescription based on claims data. See Appendix B for full definitions.
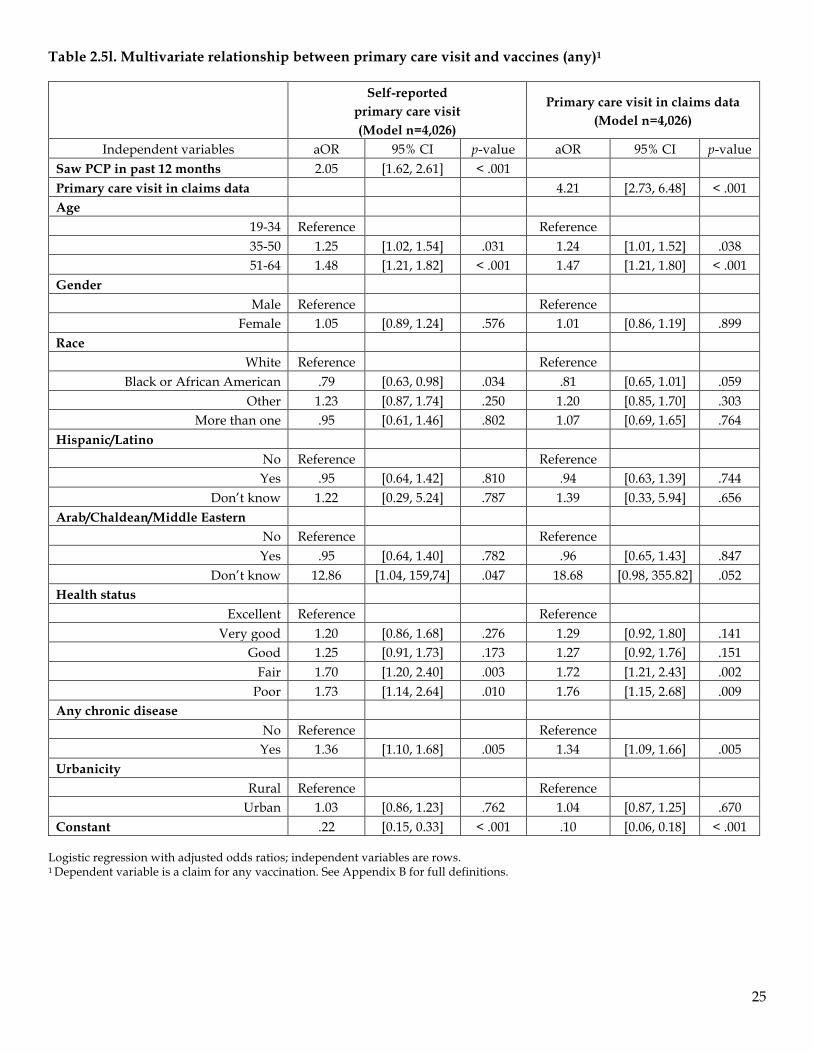
25
Table 2.5l. Multivariate relationship between primary care visit and vaccines (any)1
Self-reported
primary care visit (Model n=4,026)
Primary care visit in claims data (Model n=4,026)
Independent variables aOR 95% CI p-value aOR 95% CI p-value Saw PCP in past 12 months 2.05 [1.62, 2.61] < .001 Primary care visit in claims data 4.21 [2.73, 6.48] < .001 Age
19-34 Reference Reference 35-50 1.25 [1.02, 1.54] .031 1.24 [1.01, 1.52] .038 51-64 1.48 [1.21, 1.82] < .001 1.47 [1.21, 1.80] < .001
Gender Male Reference Reference
Female 1.05 [0.89, 1.24] .576 1.01 [0.86, 1.19] .899 Race
White Reference Reference Black or African American .79 [0.63, 0.98] .034 .81 [0.65, 1.01] .059
Other 1.23 [0.87, 1.74] .250 1.20 [0.85, 1.70] .303 More than one .95 [0.61, 1.46] .802 1.07 [0.69, 1.65] .764
Hispanic/Latino No Reference Reference Yes .95 [0.64, 1.42] .810 .94 [0.63, 1.39] .744
Don’t know 1.22 [0.29, 5.24] .787 1.39 [0.33, 5.94] .656 Arab/Chaldean/Middle Eastern
No Reference Reference Yes .95 [0.64, 1.40] .782 .96 [0.65, 1.43] .847
Don’t know 12.86 [1.04, 159,74] .047 18.68 [0.98, 355.82] .052 Health status
Excellent Reference Reference Very good 1.20 [0.86, 1.68] .276 1.29 [0.92, 1.80] .141
Good 1.25 [0.91, 1.73] .173 1.27 [0.92, 1.76] .151 Fair 1.70 [1.20, 2.40] .003 1.72 [1.21, 2.43] .002
Poor 1.73 [1.14, 2.64] .010 1.76 [1.15, 2.68] .009 Any chronic disease
No Reference Reference Yes 1.36 [1.10, 1.68] .005 1.34 [1.09, 1.66] .005
Urbanicity Rural Reference Reference
Urban 1.03 [0.86, 1.23] .762 1.04 [0.87, 1.25] .670 Constant .22 [0.15, 0.33] < .001 .10 [0.06, 0.18] < .001
Logistic regression with adjusted odds ratios; independent variables are rows. 1 Dependent variable is a claim for any vaccination. See Appendix B for full definitions.
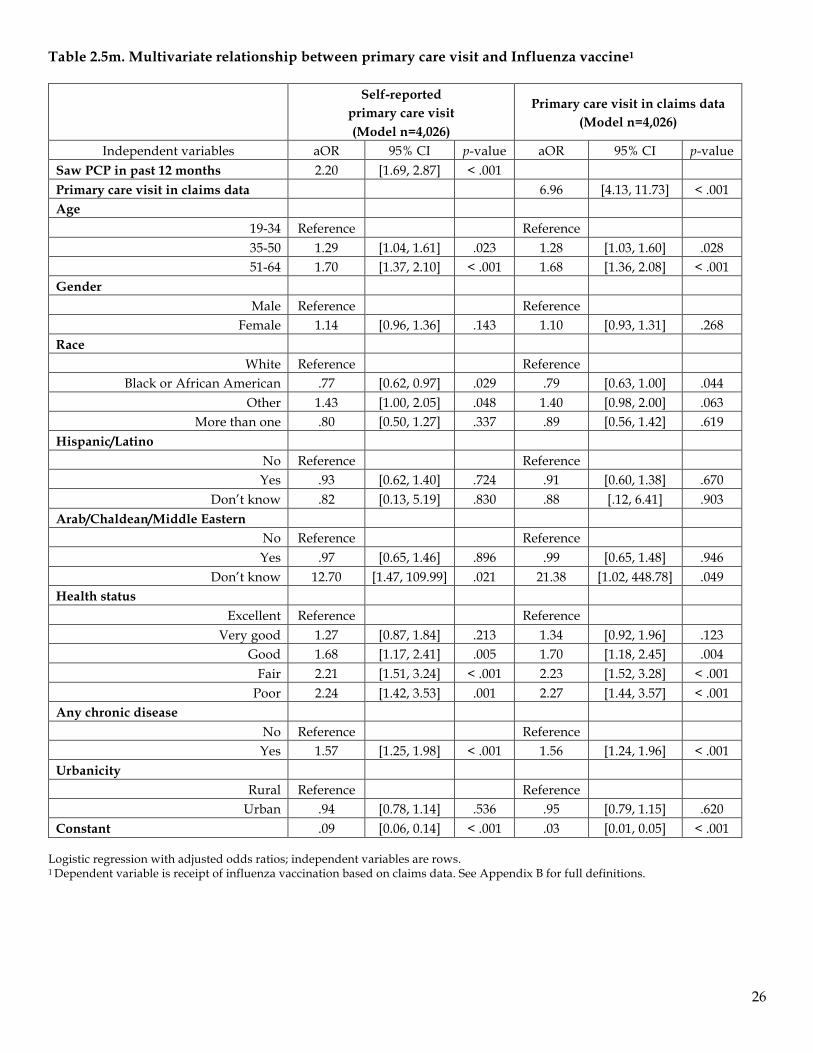
26
Table 2.5m. Multivariate relationship between primary care visit and Influenza vaccine1
Self-reported
primary care visit (Model n=4,026)
Primary care visit in claims data (Model n=4,026)
Independent variables aOR 95% CI p-value aOR 95% CI p-value Saw PCP in past 12 months 2.20 [1.69, 2.87] < .001 Primary care visit in claims data 6.96 [4.13, 11.73] < .001 Age
19-34 Reference Reference 35-50 1.29 [1.04, 1.61] .023 1.28 [1.03, 1.60] .028 51-64 1.70 [1.37, 2.10] < .001 1.68 [1.36, 2.08] < .001
Gender Male Reference Reference
Female 1.14 [0.96, 1.36] .143 1.10 [0.93, 1.31] .268 Race
White Reference Reference Black or African American .77 [0.62, 0.97] .029 .79 [0.63, 1.00] .044
Other 1.43 [1.00, 2.05] .048 1.40 [0.98, 2.00] .063 More than one .80 [0.50, 1.27] .337 .89 [0.56, 1.42] .619
Hispanic/Latino No Reference Reference Yes .93 [0.62, 1.40] .724 .91 [0.60, 1.38] .670
Don’t know .82 [0.13, 5.19] .830 .88 [.12, 6.41] .903 Arab/Chaldean/Middle Eastern
No Reference Reference Yes .97 [0.65, 1.46] .896 .99 [0.65, 1.48] .946
Don’t know 12.70 [1.47, 109.99] .021 21.38 [1.02, 448.78] .049 Health status
Excellent Reference Reference Very good 1.27 [0.87, 1.84] .213 1.34 [0.92, 1.96] .123
Good 1.68 [1.17, 2.41] .005 1.70 [1.18, 2.45] .004 Fair 2.21 [1.51, 3.24] < .001 2.23 [1.52, 3.28] < .001
Poor 2.24 [1.42, 3.53] .001 2.27 [1.44, 3.57] < .001 Any chronic disease
No Reference Reference Yes 1.57 [1.25, 1.98] < .001 1.56 [1.24, 1.96] < .001
Urbanicity Rural Reference Reference
Urban .94 [0.78, 1.14] .536 .95 [0.79, 1.15] .620 Constant .09 [0.06, 0.14] < .001 .03 [0.01, 0.05] < .001
Logistic regression with adjusted odds ratios; independent variables are rows. 1 Dependent variable is receipt of influenza vaccination based on claims data. See Appendix B for full definitions.
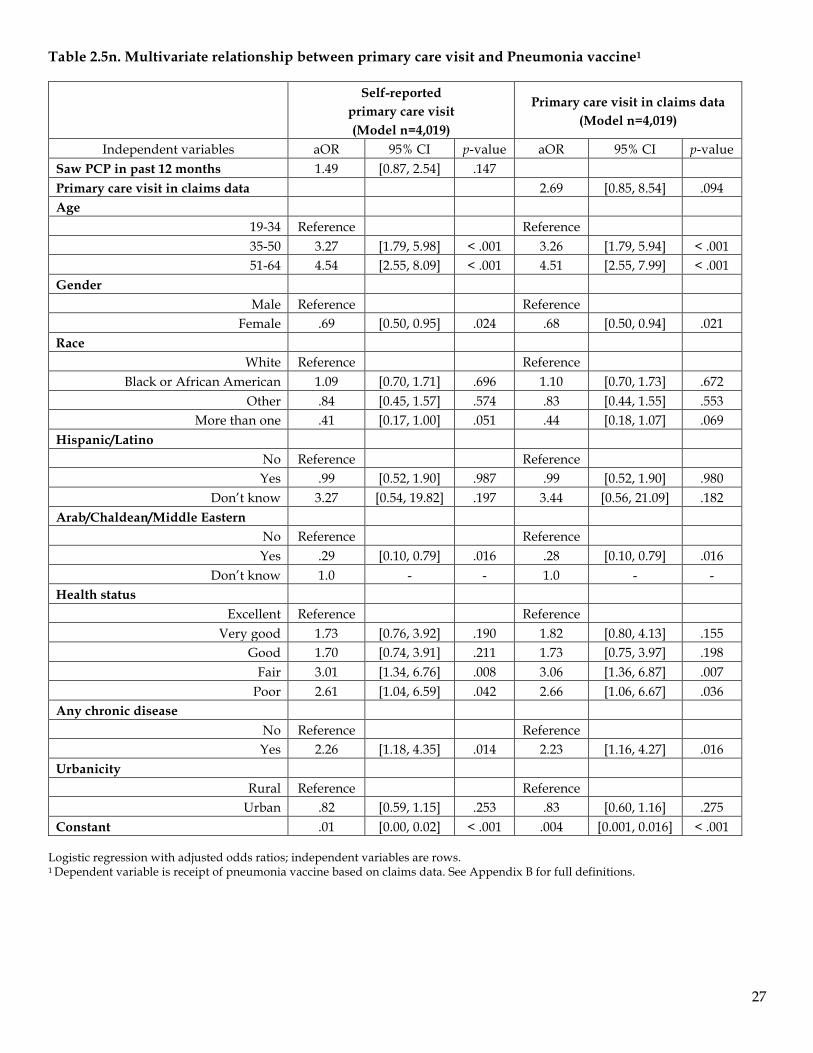
27
Table 2.5n. Multivariate relationship between primary care visit and Pneumonia vaccine1
Self-reported
primary care visit (Model n=4,019)
Primary care visit in claims data (Model n=4,019)
Independent variables aOR 95% CI p-value aOR 95% CI p-value Saw PCP in past 12 months 1.49 [0.87, 2.54] .147 Primary care visit in claims data 2.69 [0.85, 8.54] .094 Age
19-34 Reference Reference 35-50 3.27 [1.79, 5.98] < .001 3.26 [1.79, 5.94] < .001 51-64 4.54 [2.55, 8.09] < .001 4.51 [2.55, 7.99] < .001
Gender Male Reference Reference
Female .69 [0.50, 0.95] .024 .68 [0.50, 0.94] .021 Race
White Reference Reference Black or African American 1.09 [0.70, 1.71] .696 1.10 [0.70, 1.73] .672
Other .84 [0.45, 1.57] .574 .83 [0.44, 1.55] .553 More than one .41 [0.17, 1.00] .051 .44 [0.18, 1.07] .069
Hispanic/Latino No Reference Reference Yes .99 [0.52, 1.90] .987 .99 [0.52, 1.90] .980
Don’t know 3.27 [0.54, 19.82] .197 3.44 [0.56, 21.09] .182 Arab/Chaldean/Middle Eastern
No Reference Reference Yes .29 [0.10, 0.79] .016 .28 [0.10, 0.79] .016
Don’t know 1.0 - - 1.0 - - Health status
Excellent Reference Reference Very good 1.73 [0.76, 3.92] .190 1.82 [0.80, 4.13] .155
Good 1.70 [0.74, 3.91] .211 1.73 [0.75, 3.97] .198 Fair 3.01 [1.34, 6.76] .008 3.06 [1.36, 6.87] .007
Poor 2.61 [1.04, 6.59] .042 2.66 [1.06, 6.67] .036 Any chronic disease
No Reference Reference Yes 2.26 [1.18, 4.35] .014 2.23 [1.16, 4.27] .016
Urbanicity Rural Reference Reference
Urban .82 [0.59, 1.15] .253 .83 [0.60, 1.16] .275 Constant .01 [0.00, 0.02] < .001 .004 [0.001, 0.016] < .001
Logistic regression with adjusted odds ratios; independent variables are rows. 1 Dependent variable is receipt of pneumonia vaccine based on claims data. See Appendix B for full definitions.

28
Table 2.5o. Multivariate relationship between primary care visit and other vaccines1
Self-reported
primary care visit (Model n=4,026)
Primary care visit in claims data (Model n=4,026)
Independent variables aOR 95% CI p-value aOR 95% CI p-value Saw PCP in past 12 months 1.28 [0.96, 1.72] .092 Primary care visit in claims data 2.52 [1.50, 4.21] < .001 Age
19-34 Reference Reference 35-50 .92 [0.72, 1.18] .511 .90 [0.70, 1.16] .418 51-64 .92 [0.72, 1.18] .510 .90 [0.70, 1.14] .379
Gender Male Reference Reference
Female .99 [0.81, 1.21] .940 .95 [0.77, 1.16] .612 Race
White Reference Reference Black or African American .85 [0.65, 1.11] .224 .87 [0.67, 1.14] .328
Other 1.11 [0.73, 1.69] .630 1.11 [0.73, 1.69] .634 More than one .98 [0.58, 1.64] .924 1.06 [0.63, 1.79] .816
Hispanic/Latino No Reference Reference Yes 1.08 [0.66, 1.78] .759 1.08 [0.65, 1.77] .776
Don’t know .74 [0.15, 3.59] .712 .78 [0.16, 3.86] .760 Arab/Chaldean/Middle Eastern
No Reference Reference Yes .76 [0.47, 1.28] .318 .77 [0.46, 1.26] .297
Don’t know 1.90 [0.25, 14.19] .533 2.07 [0.20, 20.99] .538 Health status
Excellent Reference Reference Very good 1.01 [0.69, 1.49] .948 1.06 [0.72, 1.56] .780
Good .90 [0.62, 1.31] .586 .90 [0.62, 1.31] .587 Fair .94 [0.63, 1.41] .769 .93 [0.62, 1.40] .737
Poor .98 [0.59, 1.63] .943 .97 [0.59, 1.62] .919 Any chronic disease
No Reference Reference Yes 1.02 [0.78, 1.33] .883 .99 [0.76, 1.28] .916
Urbanicity Rural Reference Reference
Urban 1.01 [0.81, 1.25] .960 1.01 [0.81, 1.26] .929 Constant .23 [0.15, 0.36] < .001 .13 [0.07, 0.23] < .001
Logistic regression with adjusted odds ratios; independent variables are rows. 1 Dependent variable is receipt of other vaccines based on claims data. See Appendix B for full definitions.
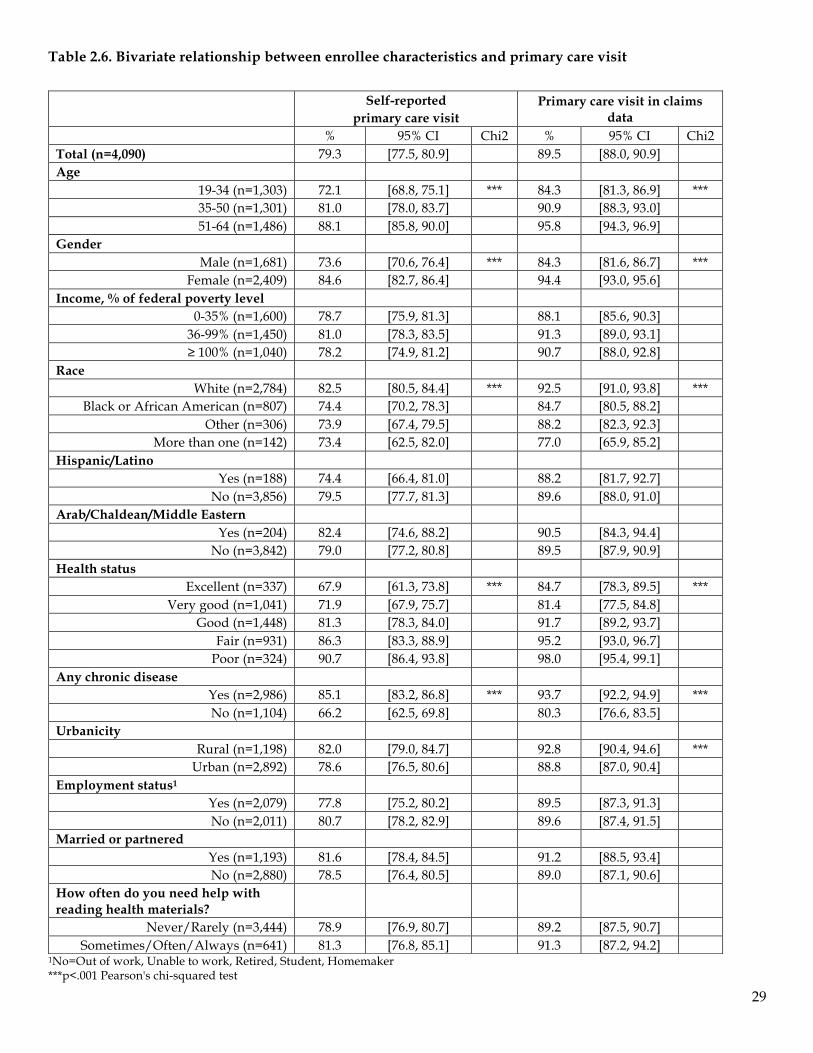
29
Table 2.6. Bivariate relationship between enrollee characteristics and primary care visit
1No=Out of work, Unable to work, Retired, Student, Homemaker ***p<.001 Pearson's chi-squared test
Self-reported
primary care visit Primary care visit in claims
data % 95% CI Chi2 % 95% CI Chi2
Total (n=4,090) 79.3 [77.5, 80.9] 89.5 [88.0, 90.9] Age
19-34 (n=1,303) 72.1 [68.8, 75.1] *** 84.3 [81.3, 86.9] *** 35-50 (n=1,301) 81.0 [78.0, 83.7] 90.9 [88.3, 93.0] 51-64 (n=1,486) 88.1 [85.8, 90.0] 95.8 [94.3, 96.9]
Gender Male (n=1,681) 73.6 [70.6, 76.4] *** 84.3 [81.6, 86.7] ***
Female (n=2,409) 84.6 [82.7, 86.4] 94.4 [93.0, 95.6] Income, % of federal poverty level
0-35% (n=1,600) 78.7 [75.9, 81.3] 88.1 [85.6, 90.3] 36-99% (n=1,450) 81.0 [78.3, 83.5] 91.3 [89.0, 93.1] ≥ 100% (n=1,040) 78.2 [74.9, 81.2] 90.7 [88.0, 92.8]
Race White (n=2,784) 82.5 [80.5, 84.4] *** 92.5 [91.0, 93.8] ***
Black or African American (n=807) 74.4 [70.2, 78.3] 84.7 [80.5, 88.2] Other (n=306) 73.9 [67.4, 79.5] 88.2 [82.3, 92.3]
More than one (n=142) 73.4 [62.5, 82.0] 77.0 [65.9, 85.2] Hispanic/Latino
Yes (n=188) 74.4 [66.4, 81.0] 88.2 [81.7, 92.7] No (n=3,856) 79.5 [77.7, 81.3] 89.6 [88.0, 91.0]
Arab/Chaldean/Middle Eastern Yes (n=204) 82.4 [74.6, 88.2] 90.5 [84.3, 94.4]
No (n=3,842) 79.0 [77.2, 80.8] 89.5 [87.9, 90.9] Health status
Excellent (n=337) 67.9 [61.3, 73.8] *** 84.7 [78.3, 89.5] *** Very good (n=1,041) 71.9 [67.9, 75.7] 81.4 [77.5, 84.8]
Good (n=1,448) 81.3 [78.3, 84.0] 91.7 [89.2, 93.7] Fair (n=931) 86.3 [83.3, 88.9] 95.2 [93.0, 96.7]
Poor (n=324) 90.7 [86.4, 93.8] 98.0 [95.4, 99.1] Any chronic disease
Yes (n=2,986) 85.1 [83.2, 86.8] *** 93.7 [92.2, 94.9] *** No (n=1,104) 66.2 [62.5, 69.8] 80.3 [76.6, 83.5]
Urbanicity Rural (n=1,198) 82.0 [79.0, 84.7] 92.8 [90.4, 94.6] ***
Urban (n=2,892) 78.6 [76.5, 80.6] 88.8 [87.0, 90.4] Employment status1
Yes (n=2,079) 77.8 [75.2, 80.2] 89.5 [87.3, 91.3] No (n=2,011) 80.7 [78.2, 82.9] 89.6 [87.4, 91.5]
Married or partnered Yes (n=1,193) 81.6 [78.4, 84.5] 91.2 [88.5, 93.4] No (n=2,880) 78.5 [76.4, 80.5] 89.0 [87.1, 90.6]
How often do you need help with reading health materials?
Never/Rarely (n=3,444) 78.9 [76.9, 80.7] 89.2 [87.5, 90.7] Sometimes/Often/Always (n=641) 81.3 [76.8, 85.1] 91.3 [87.2, 94.2]
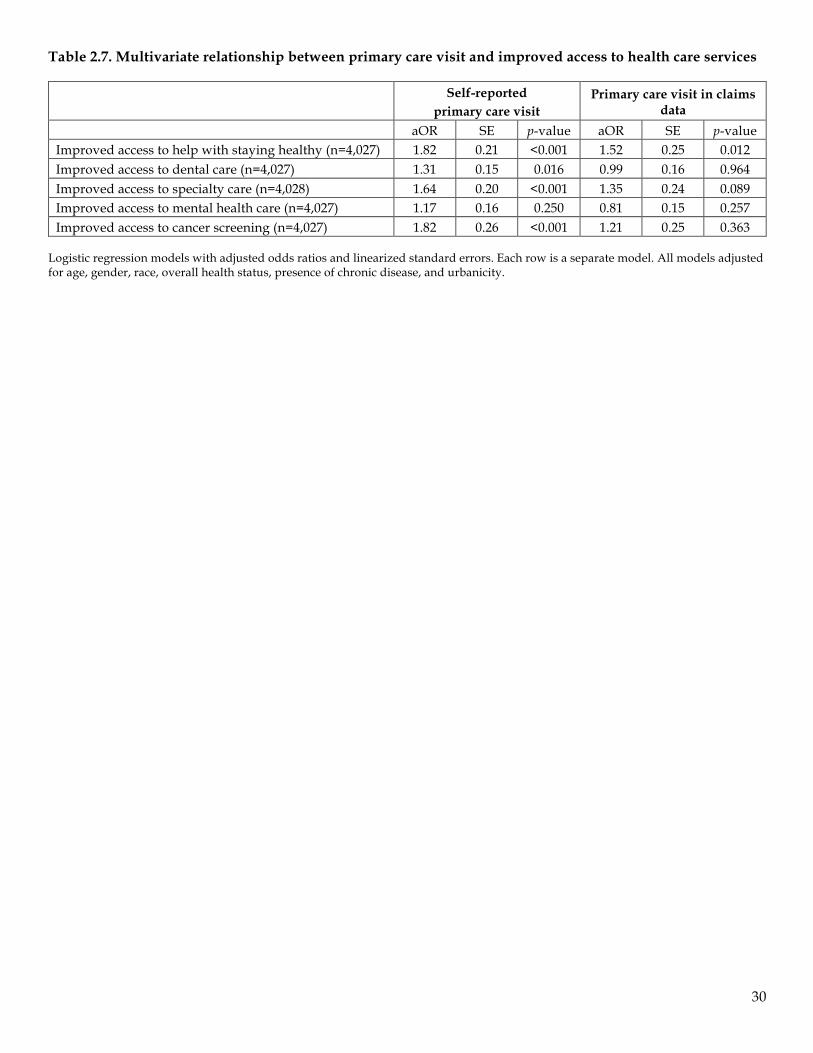
30
Table 2.7. Multivariate relationship between primary care visit and improved access to health care services
Self-reported
primary care visit Primary care visit in claims
data aOR SE p-value aOR SE p-value
Improved access to help with staying healthy (n=4,027) 1.82 0.21 <0.001 1.52 0.25 0.012 Improved access to dental care (n=4,027) 1.31 0.15 0.016 0.99 0.16 0.964 Improved access to specialty care (n=4,028) 1.64 0.20 <0.001 1.35 0.24 0.089 Improved access to mental health care (n=4,027) 1.17 0.16 0.250 0.81 0.15 0.257 Improved access to cancer screening (n=4,027) 1.82 0.26 <0.001 1.21 0.25 0.363
Logistic regression models with adjusted odds ratios and linearized standard errors. Each row is a separate model. All models adjusted for age, gender, race, overall health status, presence of chronic disease, and urbanicity.
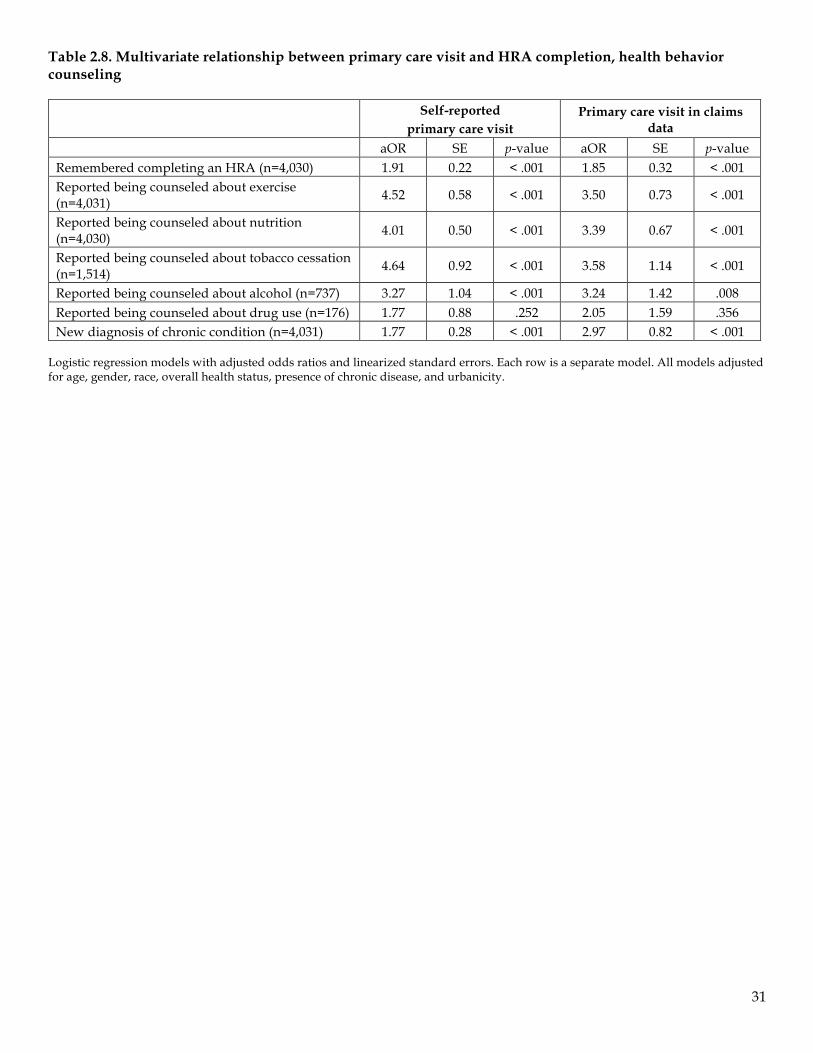
31
Table 2.8. Multivariate relationship between primary care visit and HRA completion, health behavior counseling
Self-reported
primary care visit Primary care visit in claims
data aOR SE p-value aOR SE p-value Remembered completing an HRA (n=4,030) 1.91 0.22 < .001 1.85 0.32 < .001 Reported being counseled about exercise (n=4,031) 4.52 0.58 < .001 3.50 0.73 < .001
Reported being counseled about nutrition (n=4,030) 4.01 0.50 < .001 3.39 0.67 < .001
Reported being counseled about tobacco cessation (n=1,514) 4.64 0.92 < .001 3.58 1.14 < .001
Reported being counseled about alcohol (n=737) 3.27 1.04 < .001 3.24 1.42 .008 Reported being counseled about drug use (n=176) 1.77 0.88 .252 2.05 1.59 .356 New diagnosis of chronic condition (n=4,031) 1.77 0.28 < .001 2.97 0.82 < .001
Logistic regression models with adjusted odds ratios and linearized standard errors. Each row is a separate model. All models adjusted for age, gender, race, overall health status, presence of chronic disease, and urbanicity.
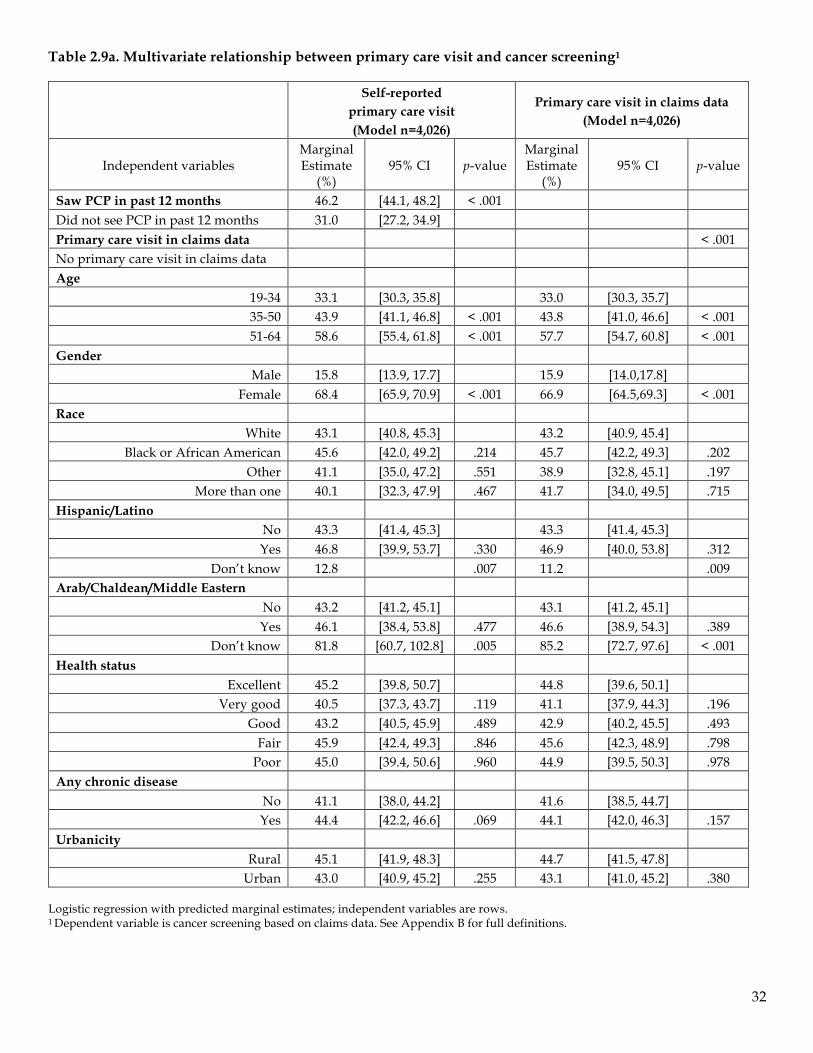
32
Table 2.9a. Multivariate relationship between primary care visit and cancer screening1
Self-reported
primary care visit (Model n=4,026)
Primary care visit in claims data (Model n=4,026)
Independent variables Marginal Estimate
(%) 95% CI p-value
Marginal Estimate
(%) 95% CI p-value
Saw PCP in past 12 months 46.2 [44.1, 48.2] < .001 Did not see PCP in past 12 months 31.0 [27.2, 34.9] Primary care visit in claims data < .001 No primary care visit in claims data Age
19-34 33.1 [30.3, 35.8] 33.0 [30.3, 35.7] 35-50 43.9 [41.1, 46.8] < .001 43.8 [41.0, 46.6] < .001 51-64 58.6 [55.4, 61.8] < .001 57.7 [54.7, 60.8] < .001
Gender Male 15.8 [13.9, 17.7] 15.9 [14.0,17.8]
Female 68.4 [65.9, 70.9] < .001 66.9 [64.5,69.3] < .001 Race
White 43.1 [40.8, 45.3] 43.2 [40.9, 45.4] Black or African American 45.6 [42.0, 49.2] .214 45.7 [42.2, 49.3] .202
Other 41.1 [35.0, 47.2] .551 38.9 [32.8, 45.1] .197 More than one 40.1 [32.3, 47.9] .467 41.7 [34.0, 49.5] .715
Hispanic/Latino No 43.3 [41.4, 45.3] 43.3 [41.4, 45.3] Yes 46.8 [39.9, 53.7] .330 46.9 [40.0, 53.8] .312
Don’t know 12.8 .007 11.2 .009 Arab/Chaldean/Middle Eastern
No 43.2 [41.2, 45.1] 43.1 [41.2, 45.1] Yes 46.1 [38.4, 53.8] .477 46.6 [38.9, 54.3] .389
Don’t know 81.8 [60.7, 102.8] .005 85.2 [72.7, 97.6] < .001 Health status
Excellent 45.2 [39.8, 50.7] 44.8 [39.6, 50.1] Very good 40.5 [37.3, 43.7] .119 41.1 [37.9, 44.3] .196
Good 43.2 [40.5, 45.9] .489 42.9 [40.2, 45.5] .493 Fair 45.9 [42.4, 49.3] .846 45.6 [42.3, 48.9] .798
Poor 45.0 [39.4, 50.6] .960 44.9 [39.5, 50.3] .978 Any chronic disease
No 41.1 [38.0, 44.2] 41.6 [38.5, 44.7] Yes 44.4 [42.2, 46.6] .069 44.1 [42.0, 46.3] .157
Urbanicity Rural 45.1 [41.9, 48.3] 44.7 [41.5, 47.8]
Urban 43.0 [40.9, 45.2] .255 43.1 [41.0, 45.2] .380 Logistic regression with predicted marginal estimates; independent variables are rows. 1 Dependent variable is cancer screening based on claims data. See Appendix B for full definitions.
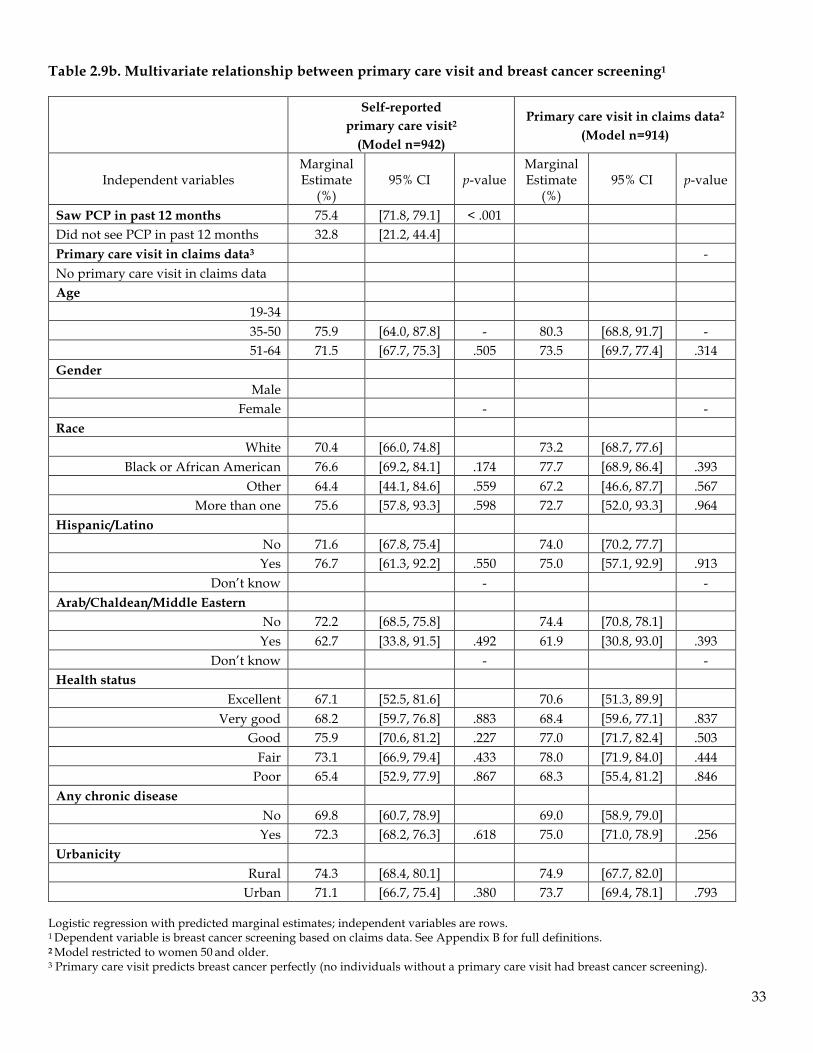
33
Table 2.9b. Multivariate relationship between primary care visit and breast cancer screening1
Self-reported
primary care visit2 (Model n=942)
Primary care visit in claims data2
(Model n=914)
Independent variables Marginal Estimate
(%) 95% CI p-value
Marginal Estimate
(%) 95% CI p-value
Saw PCP in past 12 months 75.4 [71.8, 79.1] < .001 Did not see PCP in past 12 months 32.8 [21.2, 44.4] Primary care visit in claims data3 - No primary care visit in claims data Age
19-34 35-50 75.9 [64.0, 87.8] - 80.3 [68.8, 91.7] - 51-64 71.5 [67.7, 75.3] .505 73.5 [69.7, 77.4] .314
Gender Male
Female - - Race
White 70.4 [66.0, 74.8] 73.2 [68.7, 77.6] Black or African American 76.6 [69.2, 84.1] .174 77.7 [68.9, 86.4] .393
Other 64.4 [44.1, 84.6] .559 67.2 [46.6, 87.7] .567 More than one 75.6 [57.8, 93.3] .598 72.7 [52.0, 93.3] .964
Hispanic/Latino No 71.6 [67.8, 75.4] 74.0 [70.2, 77.7] Yes 76.7 [61.3, 92.2] .550 75.0 [57.1, 92.9] .913
Don’t know - - Arab/Chaldean/Middle Eastern
No 72.2 [68.5, 75.8] 74.4 [70.8, 78.1] Yes 62.7 [33.8, 91.5] .492 61.9 [30.8, 93.0] .393
Don’t know - - Health status
Excellent 67.1 [52.5, 81.6] 70.6 [51.3, 89.9] Very good 68.2 [59.7, 76.8] .883 68.4 [59.6, 77.1] .837
Good 75.9 [70.6, 81.2] .227 77.0 [71.7, 82.4] .503 Fair 73.1 [66.9, 79.4] .433 78.0 [71.9, 84.0] .444
Poor 65.4 [52.9, 77.9] .867 68.3 [55.4, 81.2] .846 Any chronic disease
No 69.8 [60.7, 78.9] 69.0 [58.9, 79.0] Yes 72.3 [68.2, 76.3] .618 75.0 [71.0, 78.9] .256
Urbanicity Rural 74.3 [68.4, 80.1] 74.9 [67.7, 82.0]
Urban 71.1 [66.7, 75.4] .380 73.7 [69.4, 78.1] .793 Logistic regression with predicted marginal estimates; independent variables are rows. 1 Dependent variable is breast cancer screening based on claims data. See Appendix B for full definitions. 2 Model restricted to women 50 and older. 3 Primary care visit predicts breast cancer perfectly (no individuals without a primary care visit had breast cancer screening).

34
Table 2.9c. Multivariate relationship between primary care visit and cervical cancer screening1
Self-reported
primary care visit2 (Model n=2,375)
Primary care visit in claims data2
(Model n=2,375)
Independent variables Marginal Estimate
(%) 95% CI p-value
Marginal Estimate
(%) 95% CI p-value
Saw PCP in past 12 months 56.8 [54.0, 59.6] < .001
Did not see PCP in past 12 months 38.3 [31.9, 44.7] Primary care visit in claims data
56.6 [54.0, 59.2] < .001
No primary care visit in claims data 10.3 [4.8, 15.7] Age
19-34 55.8 [51.3, 60.4] 55.9 [51.4, 60.4] 35-50 57.9 [53.5, 62.3] .528 57.8 [53.5, 62.1] .549 51-64 46.4 [42.3, 50.6] .003 46.6 [42.5, 50.8] .003
Gender Male
Female - - Race
White 53.1 [49.9, 56.4] 53.4 [50.2, 56.6] Black or African American 59.1 [53.6, 64.7] .074 58.9 [53.5, 64.4] .094
Other 49.7 [38.4, 61.0] .572 46.5 [35.1, 57.9] .261 More than one 39.8 [26.3, 53.3] .068 41.4 [28.1, 54.7] .090
Hispanic/Latino No 53.5 [50.8, 56.1] 53.5 [50.9, 56.2] Yes 61.1 [49.7, 72.6] .213 60.0 [48.5, 71.5] .298
Don’t know - - Arab/Chaldean/Middle Eastern
No 53.6 [50.9, 56.2] 53.6 [50.9, 56.2] Yes 59.9 [47.4, 72.4] .348 59.7 [47.3, 72.1] .360
Don’t know - - Health status
Excellent 59.1 [50.0, 68.1] 58.5 [49.5, 67.4] Very good 54.7 [49.6, 59.9] .408 55.1 [50.1, 60.1] .512
Good 53.9 [49.8, 58.1] .322 53.8 [49.8, 57.8] .355 Fair 53.9 [48.5, 59.2] .350 53.9 [48.7, 59.2] .404
Poor 45.0 [35.1,54.9] .048 45.4 [35.6, 55.3] .062 Any chronic disease
No 54.8 [49.6,59.9] 55.7 [50.6, 60.8] Yes 53.6 [50.4,56.7] .710.84 53.2 [50.1, 56.4] .443
Urbanicity Rural 57.3 [52.7, 61.8] 56.5 [51.9, 61.1]
Urban 53.0 [50.0, 56.0] .135 53.2 [50.2, 56.2] .243 Logistic regression with predicted marginal estimates; independent variables are rows. 1 Dependent variable is cervical cancer screening (excludes HPV testing) based on claims data. See Appendix B for full definitions. 2 Model restricted to women.

35
Table 2.9d. Multivariate relationship between primary care visit and colorectal cancer screening1
Self-reported
primary care visit2 (Model n=1,550)
Primary care visit in claims data2
(Model n=1,487)
Independent variables Marginal Estimate
(%) 95% CI p-value
Marginal Estimate
(%) 95% CI p-value
Saw PCP in past 12 months 44.8 [41.5, 48.1] < .001
Did not see PCP in past 12 months 16.1 [9.6, 22.6] Primary care visit in claims data3
-
No primary care visit in claims data Age
19-34 35-50 35.7 [24.4, 46.9] - 38.5 [26.2, 50.8] - 51-64 41.7 [38.6, 44.8] 0.314 43.6 [40.4, 46.8] .44
Gender Male 39.1 [34.4, 43.7] 40.3 [35.4, 45.1]
Female 43.0 [39.2, 46.8] .190 45.5 [41.5, 49.5] .102 Race
White 40.1 [36.5, 43.6] 42.4 [38.7, 46.1] Black or African American 45.7 [38.6, 52.8] .164 46.4 [38.9, 53.8] .356
Other 41.3 [28.6, 54.1] .851 42.2 [28.9, 55.5] .975 More than one 31.5 [15.1, 47.9] .342 35.7 [18.0, 53.3] .477
Hispanic/Latino No 41.4 [38.4, 44.5] 43.4 [40.2, 46.6] Yes 37.9 [23.5, 52.3] .641 38.9 [23.3, 54.4] .582
Don’t know - - Arab/Chaldean/Middle Eastern
No 41.2 [38.2, 44.2] 43.1 [40.0, 46.2] Yes 44.2 [24.8, 63.6] .762 47.0 [25.9, 68.1] .719
Don’t know - - Health status
Excellent 20.4 [10.8, 29.9] 22.2 [11.6, 32.8] Very good 39.1 [32.7, 45.6] .004 41.3 [34.4, 48.3] .008
Good 44.8 [39.9, 49.7] < .001 46.0 [40.9, 51.1] .001 Fair 40.5 [34.8, 46.3] .003 42.5 [36.5, 48.6] .005
Poor 46.6 [37.6, 55.6] .001 49.6 [40.2, 58.9] .001 Any chronic disease
No 47.9 [39.8, 55.9] 46.7 [38.2, 55.1] Yes 40.1 [36.9, 43.4] .082 42.6 [39.2, 45.9] .380
Urbanicity Rural 44.2 [38.9, 49.5] 45.2 [39.7, 50.7]
Urban 40.4 [36.9, 43.9] .236 42.6 [39.0, 46.3] .446 Logistic regression with predicted marginal estimates; independent variables are rows. 1 Dependent variable is colorectal cancer screening based on claims data. See Appendix B for full definitions. 2 Model restricted to men and women ages 50 and over. 3 Primary care visit predicts colorectal cancer perfectly (no individuals without a primary care visit had a colorectal cancer screening).
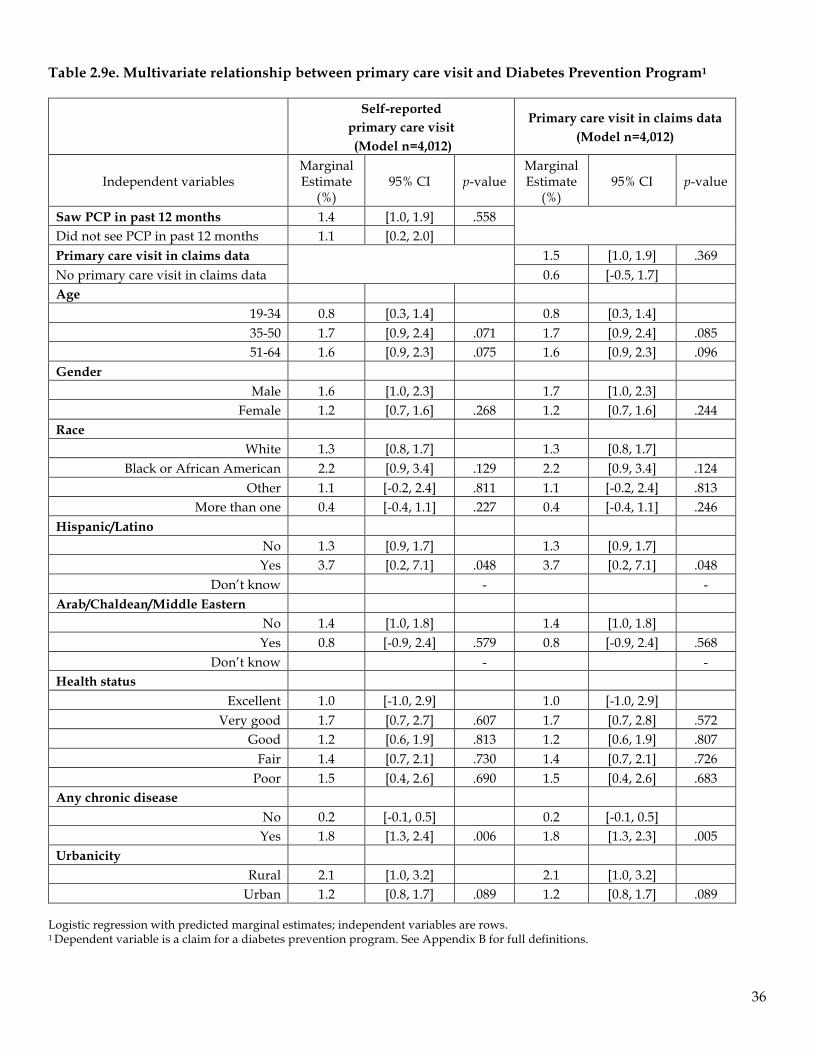
36
Table 2.9e. Multivariate relationship between primary care visit and Diabetes Prevention Program1
Self-reported
primary care visit (Model n=4,012)
Primary care visit in claims data (Model n=4,012)
Independent variables Marginal Estimate
(%) 95% CI p-value
Marginal Estimate
(%) 95% CI p-value
Saw PCP in past 12 months 1.4 [1.0, 1.9] .558
Did not see PCP in past 12 months 1.1 [0.2, 2.0] Primary care visit in claims data
1.5 [1.0, 1.9] .369
No primary care visit in claims data 0.6 [-0.5, 1.7] Age
19-34 0.8 [0.3, 1.4] 0.8 [0.3, 1.4] 35-50 1.7 [0.9, 2.4] .071 1.7 [0.9, 2.4] .085 51-64 1.6 [0.9, 2.3] .075 1.6 [0.9, 2.3] .096
Gender Male 1.6 [1.0, 2.3] 1.7 [1.0, 2.3]
Female 1.2 [0.7, 1.6] .268 1.2 [0.7, 1.6] .244 Race
White 1.3 [0.8, 1.7] 1.3 [0.8, 1.7] Black or African American 2.2 [0.9, 3.4] .129 2.2 [0.9, 3.4] .124
Other 1.1 [-0.2, 2.4] .811 1.1 [-0.2, 2.4] .813 More than one 0.4 [-0.4, 1.1] .227 0.4 [-0.4, 1.1] .246
Hispanic/Latino No 1.3 [0.9, 1.7] 1.3 [0.9, 1.7] Yes 3.7 [0.2, 7.1] .048 3.7 [0.2, 7.1] .048
Don’t know - - Arab/Chaldean/Middle Eastern
No 1.4 [1.0, 1.8] 1.4 [1.0, 1.8] Yes 0.8 [-0.9, 2.4] .579 0.8 [-0.9, 2.4] .568
Don’t know - - Health status
Excellent 1.0 [-1.0, 2.9] 1.0 [-1.0, 2.9] Very good 1.7 [0.7, 2.7] .607 1.7 [0.7, 2.8] .572
Good 1.2 [0.6, 1.9] .813 1.2 [0.6, 1.9] .807 Fair 1.4 [0.7, 2.1] .730 1.4 [0.7, 2.1] .726
Poor 1.5 [0.4, 2.6] .690 1.5 [0.4, 2.6] .683 Any chronic disease
No 0.2 [-0.1, 0.5] 0.2 [-0.1, 0.5] Yes 1.8 [1.3, 2.4] .006 1.8 [1.3, 2.3] .005
Urbanicity Rural 2.1 [1.0, 3.2] 2.1 [1.0, 3.2]
Urban 1.2 [0.8, 1.7] .089 1.2 [0.8, 1.7] .089 Logistic regression with predicted marginal estimates; independent variables are rows. 1 Dependent variable is a claim for a diabetes prevention program. See Appendix B for full definitions.
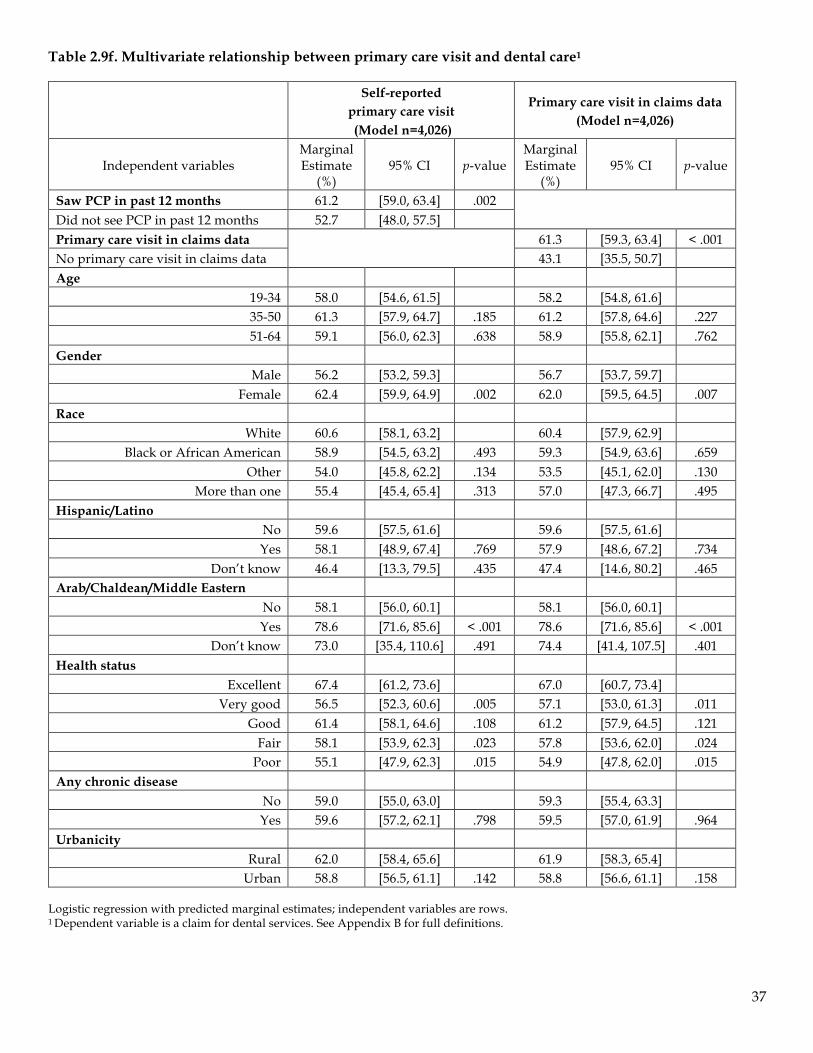
37
Table 2.9f. Multivariate relationship between primary care visit and dental care1
Self-reported
primary care visit (Model n=4,026)
Primary care visit in claims data (Model n=4,026)
Independent variables Marginal Estimate
(%) 95% CI p-value
Marginal Estimate
(%) 95% CI p-value
Saw PCP in past 12 months 61.2 [59.0, 63.4] .002
Did not see PCP in past 12 months 52.7 [48.0, 57.5] Primary care visit in claims data
61.3 [59.3, 63.4] < .001
No primary care visit in claims data 43.1 [35.5, 50.7] Age
19-34 58.0 [54.6, 61.5] 58.2 [54.8, 61.6] 35-50 61.3 [57.9, 64.7] .185 61.2 [57.8, 64.6] .227 51-64 59.1 [56.0, 62.3] .638 58.9 [55.8, 62.1] .762
Gender Male 56.2 [53.2, 59.3] 56.7 [53.7, 59.7]
Female 62.4 [59.9, 64.9] .002 62.0 [59.5, 64.5] .007 Race
White 60.6 [58.1, 63.2] 60.4 [57.9, 62.9] Black or African American 58.9 [54.5, 63.2] .493 59.3 [54.9, 63.6] .659
Other 54.0 [45.8, 62.2] .134 53.5 [45.1, 62.0] .130 More than one 55.4 [45.4, 65.4] .313 57.0 [47.3, 66.7] .495
Hispanic/Latino No 59.6 [57.5, 61.6] 59.6 [57.5, 61.6] Yes 58.1 [48.9, 67.4] .769 57.9 [48.6, 67.2] .734
Don’t know 46.4 [13.3, 79.5] .435 47.4 [14.6, 80.2] .465 Arab/Chaldean/Middle Eastern
No 58.1 [56.0, 60.1] 58.1 [56.0, 60.1] Yes 78.6 [71.6, 85.6] < .001 78.6 [71.6, 85.6] < .001
Don’t know 73.0 [35.4, 110.6] .491 74.4 [41.4, 107.5] .401 Health status
Excellent 67.4 [61.2, 73.6] 67.0 [60.7, 73.4] Very good 56.5 [52.3, 60.6] .005 57.1 [53.0, 61.3] .011
Good 61.4 [58.1, 64.6] .108 61.2 [57.9, 64.5] .121 Fair 58.1 [53.9, 62.3] .023 57.8 [53.6, 62.0] .024
Poor 55.1 [47.9, 62.3] .015 54.9 [47.8, 62.0] .015 Any chronic disease
No 59.0 [55.0, 63.0] 59.3 [55.4, 63.3] Yes 59.6 [57.2, 62.1] .798 59.5 [57.0, 61.9] .964
Urbanicity Rural 62.0 [58.4, 65.6] 61.9 [58.3, 65.4]
Urban 58.8 [56.5, 61.1] .142 58.8 [56.6, 61.1] .158 Logistic regression with predicted marginal estimates; independent variables are rows. 1 Dependent variable is a claim for dental services. See Appendix B for full definitions.
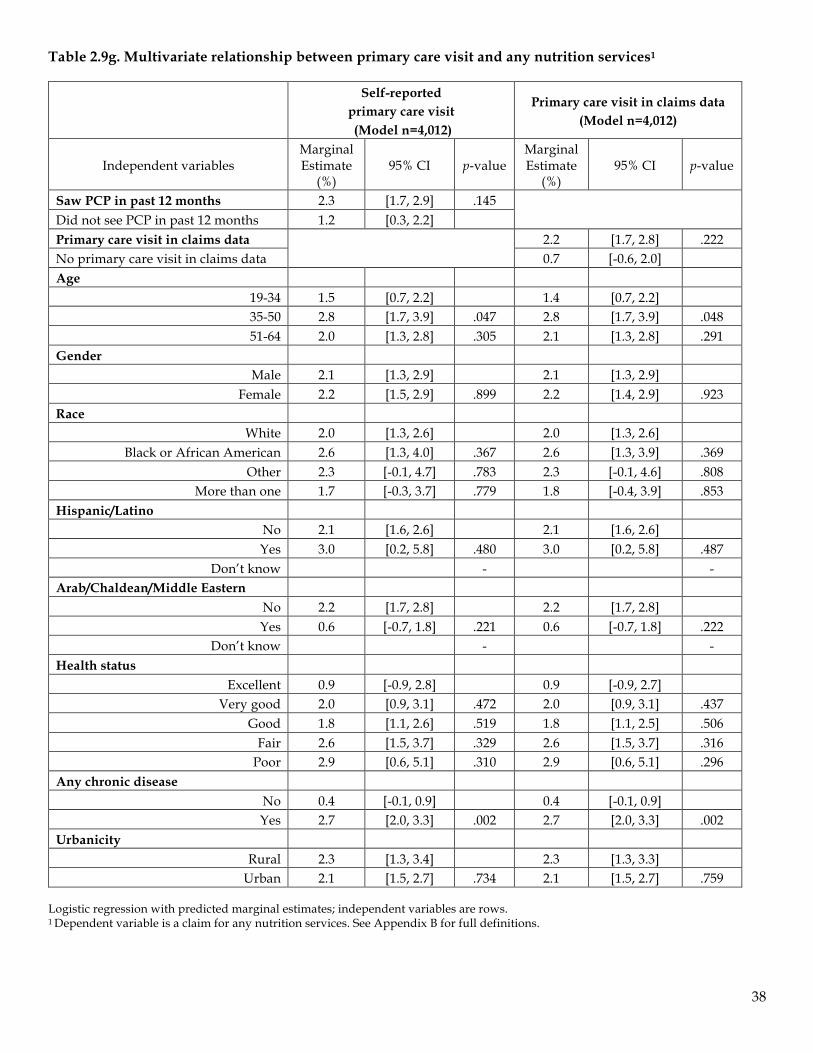
38
Table 2.9g. Multivariate relationship between primary care visit and any nutrition services1
Self-reported
primary care visit (Model n=4,012)
Primary care visit in claims data (Model n=4,012)
Independent variables Marginal Estimate
(%) 95% CI p-value
Marginal Estimate
(%) 95% CI p-value
Saw PCP in past 12 months 2.3 [1.7, 2.9] .145 Did not see PCP in past 12 months 1.2 [0.3, 2.2]
Primary care visit in claims data
2.2 [1.7, 2.8] .222 No primary care visit in claims data 0.7 [-0.6, 2.0] Age
19-34 1.5 [0.7, 2.2] 1.4 [0.7, 2.2] 35-50 2.8 [1.7, 3.9] .047 2.8 [1.7, 3.9] .048 51-64 2.0 [1.3, 2.8] .305 2.1 [1.3, 2.8] .291
Gender Male 2.1 [1.3, 2.9] 2.1 [1.3, 2.9]
Female 2.2 [1.5, 2.9] .899 2.2 [1.4, 2.9] .923 Race
White 2.0 [1.3, 2.6] 2.0 [1.3, 2.6] Black or African American 2.6 [1.3, 4.0] .367 2.6 [1.3, 3.9] .369
Other 2.3 [-0.1, 4.7] .783 2.3 [-0.1, 4.6] .808 More than one 1.7 [-0.3, 3.7] .779 1.8 [-0.4, 3.9] .853
Hispanic/Latino No 2.1 [1.6, 2.6] 2.1 [1.6, 2.6] Yes 3.0 [0.2, 5.8] .480 3.0 [0.2, 5.8] .487
Don’t know - - Arab/Chaldean/Middle Eastern
No 2.2 [1.7, 2.8] 2.2 [1.7, 2.8] Yes 0.6 [-0.7, 1.8] .221 0.6 [-0.7, 1.8] .222
Don’t know - - Health status
Excellent 0.9 [-0.9, 2.8] 0.9 [-0.9, 2.7] Very good 2.0 [0.9, 3.1] .472 2.0 [0.9, 3.1] .437
Good 1.8 [1.1, 2.6] .519 1.8 [1.1, 2.5] .506 Fair 2.6 [1.5, 3.7] .329 2.6 [1.5, 3.7] .316
Poor 2.9 [0.6, 5.1] .310 2.9 [0.6, 5.1] .296 Any chronic disease
No 0.4 [-0.1, 0.9] 0.4 [-0.1, 0.9] Yes 2.7 [2.0, 3.3] .002 2.7 [2.0, 3.3] .002
Urbanicity Rural 2.3 [1.3, 3.4] 2.3 [1.3, 3.3]
Urban 2.1 [1.5, 2.7] .734 2.1 [1.5, 2.7] .759 Logistic regression with predicted marginal estimates; independent variables are rows. 1 Dependent variable is a claim for any nutrition services. See Appendix B for full definitions.

39
Table 2.9h. Multivariate relationship between primary care visit and HPV testing1
Self-reported
primary care visit (Model n=4,026)
Primary care visit in claims data (Model n=4,026)
Independent variables Marginal Estimate
(%) 95% CI p-value
Marginal Estimate
(%) 95% CI p-value
Saw PCP in past 12 months 15.0 [13.6, 16.5] .005
Did not see PCP in past 12 months 10.3 [7.6, 12.9] Primary care visit in claims data
14.9 [13.6, 16.3] < .001
No primary care visit in claims data 3.8 [1.2, 6.4] Age
19-34 12.1 [10.1, 14.1] 12.1 [10.1, 14.0] 35-50 17.5 [15.3, 19.7] < .001 17.5 [15.3, 19.7] < .001 51-64 13.6 [11.7, 15.6] .274 13.7 [11.7, 15.6] .252
Gender Male 0.2 [0.0, 0.4] 0.2 [0.0, 0.4]
Female 27.3 [25.0, 29.5] < .001 26.7 [24.5, 28.9] < .001 Race
White 13.7 [12.2, 15.2] 13.8 [12.3, 15.3] Black or African American 16.3 [13.5, 19.1] .092 16.3 [13.5, 19.0] .100
Other 13.5 [8.5, 18.4] .940 12.7 [8.0, 17.5] .701 More than one 12.3 [6.4, 18.3] .677 12.6 [6.7, 18.6] .727
Hispanic/Latino No 14.4 [13.0, 15.7] 14.4 [13.1, 15.7] Yes 13.8 [8.6, 18.9] .826 13.6 [8.4, 18.7] .774
Don’t know 2.6 [-0.8, 6.0] .004 2.5 [-0.8, 5.8] .004 Arab/Chaldean/Middle Eastern
No 14.1 [12.8, 15.4] 14.1 [12.8, 15.4] Yes 17.1 [10.3, 23.9] .379 17.0 [10.4, 23.6] .337
Don’t know 53.4 [45.6, 61.2] < .001 54.4 [45.2, 63.5] < .001 Health status
Excellent 15.9 [11.2, 20.5] 15.6 [11.1, 20.2] Very good 12.1 [9.9, 14.3] .131 12.1 [10.0, 14.3] .152
Good 15.1 [13.1, 17.1] .760 15.1 [13.1, 17.0] .818 Fair 16.1 [13.6, 18.7] .918 16.2 [13.7, 18.7] .831
Poor 10.7 [6.6, 14.8] .105 10.8 [6.6, 14.9] .125 Any chronic disease
No 15.4 [12.9, 17.9] 15.7 [13.1, 18.2] Yes 13.9 [12.4, 15.3] .304 13.8 [12.3, 15.2] .202
Urbanicity Rural 12.8 [10.7, 15.0] 12.7 [10.5, 14.9]
Urban 14.7 [13.2, 16.1] .165 14.7 [13.2, 16.1] .131 Logistic regression with predicted marginal estimates; independent variables are rows. 1 Dependent variable is HPV testing based on claims data. See Appendix B for full definitions.
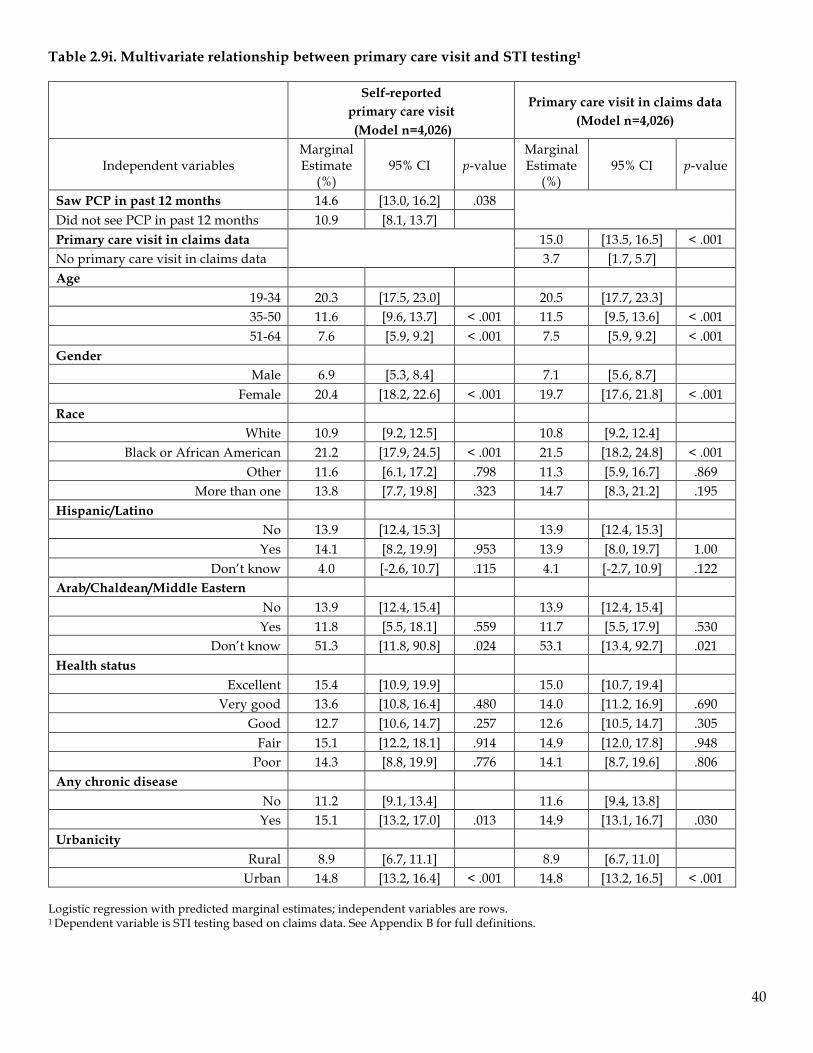
40
Table 2.9i. Multivariate relationship between primary care visit and STI testing1
Self-reported
primary care visit (Model n=4,026)
Primary care visit in claims data (Model n=4,026)
Independent variables Marginal Estimate
(%) 95% CI p-value
Marginal Estimate
(%) 95% CI p-value
Saw PCP in past 12 months 14.6 [13.0, 16.2] .038
Did not see PCP in past 12 months 10.9 [8.1, 13.7] Primary care visit in claims data
15.0 [13.5, 16.5] < .001
No primary care visit in claims data 3.7 [1.7, 5.7] Age
19-34 20.3 [17.5, 23.0] 20.5 [17.7, 23.3] 35-50 11.6 [9.6, 13.7] < .001 11.5 [9.5, 13.6] < .001 51-64 7.6 [5.9, 9.2] < .001 7.5 [5.9, 9.2] < .001
Gender Male 6.9 [5.3, 8.4] 7.1 [5.6, 8.7]
Female 20.4 [18.2, 22.6] < .001 19.7 [17.6, 21.8] < .001 Race
White 10.9 [9.2, 12.5] 10.8 [9.2, 12.4] Black or African American 21.2 [17.9, 24.5] < .001 21.5 [18.2, 24.8] < .001
Other 11.6 [6.1, 17.2] .798 11.3 [5.9, 16.7] .869 More than one 13.8 [7.7, 19.8] .323 14.7 [8.3, 21.2] .195
Hispanic/Latino No 13.9 [12.4, 15.3] 13.9 [12.4, 15.3] Yes 14.1 [8.2, 19.9] .953 13.9 [8.0, 19.7] 1.00
Don’t know 4.0 [-2.6, 10.7] .115 4.1 [-2.7, 10.9] .122 Arab/Chaldean/Middle Eastern
No 13.9 [12.4, 15.4] 13.9 [12.4, 15.4] Yes 11.8 [5.5, 18.1] .559 11.7 [5.5, 17.9] .530
Don’t know 51.3 [11.8, 90.8] .024 53.1 [13.4, 92.7] .021 Health status
Excellent 15.4 [10.9, 19.9] 15.0 [10.7, 19.4] Very good 13.6 [10.8, 16.4] .480 14.0 [11.2, 16.9] .690
Good 12.7 [10.6, 14.7] .257 12.6 [10.5, 14.7] .305 Fair 15.1 [12.2, 18.1] .914 14.9 [12.0, 17.8] .948
Poor 14.3 [8.8, 19.9] .776 14.1 [8.7, 19.6] .806 Any chronic disease
No 11.2 [9.1, 13.4] 11.6 [9.4, 13.8] Yes 15.1 [13.2, 17.0] .013 14.9 [13.1, 16.7] .030
Urbanicity Rural 8.9 [6.7, 11.1] 8.9 [6.7, 11.0]
Urban 14.8 [13.2, 16.4] < .001 14.8 [13.2, 16.5] < .001 Logistic regression with predicted marginal estimates; independent variables are rows. 1 Dependent variable is STI testing based on claims data. See Appendix B for full definitions.
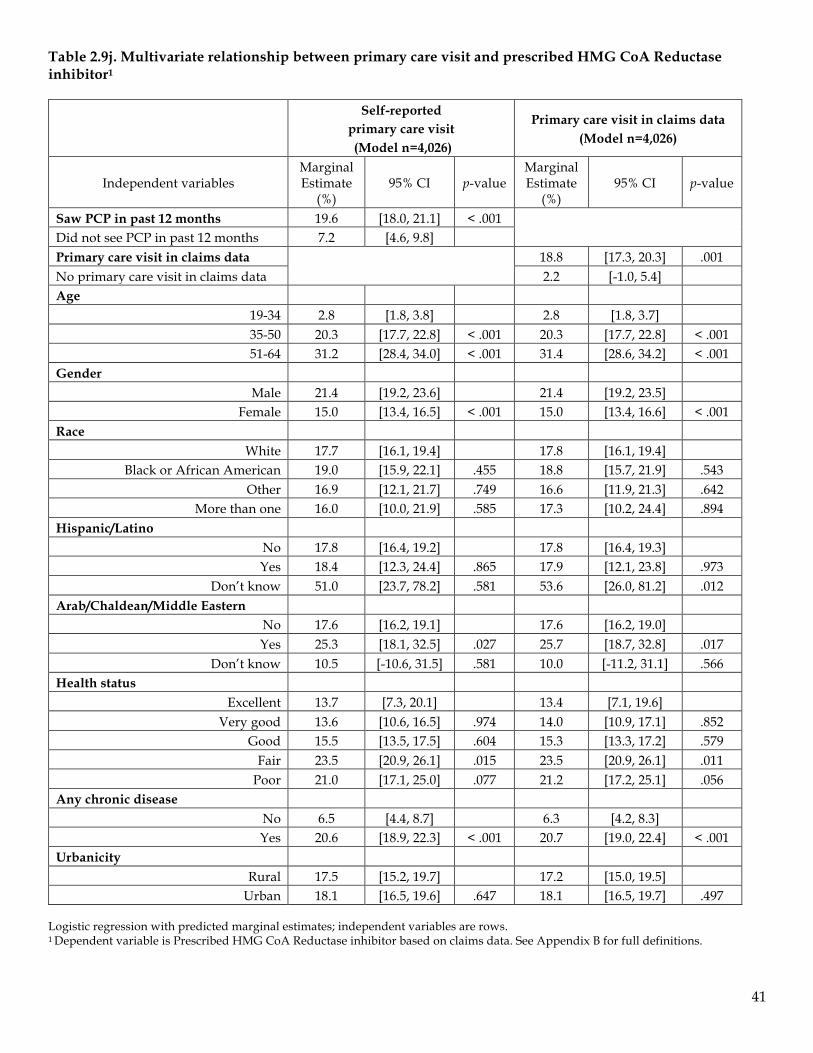
41
Table 2.9j. Multivariate relationship between primary care visit and prescribed HMG CoA Reductase inhibitor1
Self-reported
primary care visit (Model n=4,026)
Primary care visit in claims data (Model n=4,026)
Independent variables Marginal Estimate
(%) 95% CI p-value
Marginal Estimate
(%) 95% CI p-value
Saw PCP in past 12 months 19.6 [18.0, 21.1] < .001
Did not see PCP in past 12 months 7.2 [4.6, 9.8] Primary care visit in claims data
18.8 [17.3, 20.3] .001
No primary care visit in claims data 2.2 [-1.0, 5.4] Age
19-34 2.8 [1.8, 3.8] 2.8 [1.8, 3.7] 35-50 20.3 [17.7, 22.8] < .001 20.3 [17.7, 22.8] < .001 51-64 31.2 [28.4, 34.0] < .001 31.4 [28.6, 34.2] < .001
Gender Male 21.4 [19.2, 23.6] 21.4 [19.2, 23.5]
Female 15.0 [13.4, 16.5] < .001 15.0 [13.4, 16.6] < .001 Race
White 17.7 [16.1, 19.4] 17.8 [16.1, 19.4] Black or African American 19.0 [15.9, 22.1] .455 18.8 [15.7, 21.9] .543
Other 16.9 [12.1, 21.7] .749 16.6 [11.9, 21.3] .642 More than one 16.0 [10.0, 21.9] .585 17.3 [10.2, 24.4] .894
Hispanic/Latino No 17.8 [16.4, 19.2] 17.8 [16.4, 19.3] Yes 18.4 [12.3, 24.4] .865 17.9 [12.1, 23.8] .973
Don’t know 51.0 [23.7, 78.2] .581 53.6 [26.0, 81.2] .012 Arab/Chaldean/Middle Eastern
No 17.6 [16.2, 19.1] 17.6 [16.2, 19.0] Yes 25.3 [18.1, 32.5] .027 25.7 [18.7, 32.8] .017
Don’t know 10.5 [-10.6, 31.5] .581 10.0 [-11.2, 31.1] .566 Health status
Excellent 13.7 [7.3, 20.1] 13.4 [7.1, 19.6] Very good 13.6 [10.6, 16.5] .974 14.0 [10.9, 17.1] .852
Good 15.5 [13.5, 17.5] .604 15.3 [13.3, 17.2] .579 Fair 23.5 [20.9, 26.1] .015 23.5 [20.9, 26.1] .011
Poor 21.0 [17.1, 25.0] .077 21.2 [17.2, 25.1] .056 Any chronic disease
No 6.5 [4.4, 8.7] 6.3 [4.2, 8.3] Yes 20.6 [18.9, 22.3] < .001 20.7 [19.0, 22.4] < .001
Urbanicity Rural 17.5 [15.2, 19.7] 17.2 [15.0, 19.5]
Urban 18.1 [16.5, 19.6] .647 18.1 [16.5, 19.7] .497 Logistic regression with predicted marginal estimates; independent variables are rows. 1 Dependent variable is Prescribed HMG CoA Reductase inhibitor based on claims data. See Appendix B for full definitions.
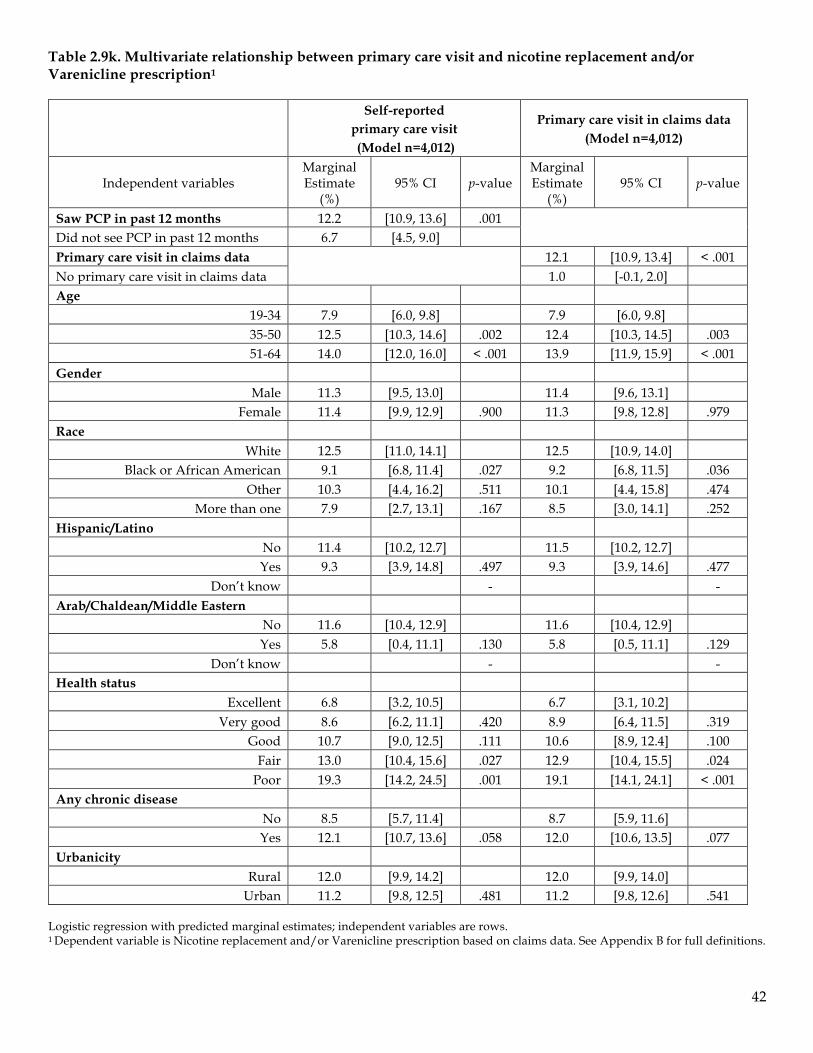
42
Table 2.9k. Multivariate relationship between primary care visit and nicotine replacement and/or Varenicline prescription1
Self-reported
primary care visit (Model n=4,012)
Primary care visit in claims data (Model n=4,012)
Independent variables Marginal Estimate
(%) 95% CI p-value
Marginal Estimate
(%) 95% CI p-value
Saw PCP in past 12 months 12.2 [10.9, 13.6] .001
Did not see PCP in past 12 months 6.7 [4.5, 9.0] Primary care visit in claims data
12.1 [10.9, 13.4] < .001
No primary care visit in claims data 1.0 [-0.1, 2.0] Age
19-34 7.9 [6.0, 9.8] 7.9 [6.0, 9.8] 35-50 12.5 [10.3, 14.6] .002 12.4 [10.3, 14.5] .003 51-64 14.0 [12.0, 16.0] < .001 13.9 [11.9, 15.9] < .001
Gender Male 11.3 [9.5, 13.0] 11.4 [9.6, 13.1]
Female 11.4 [9.9, 12.9] .900 11.3 [9.8, 12.8] .979 Race
White 12.5 [11.0, 14.1] 12.5 [10.9, 14.0] Black or African American 9.1 [6.8, 11.4] .027 9.2 [6.8, 11.5] .036
Other 10.3 [4.4, 16.2] .511 10.1 [4.4, 15.8] .474 More than one 7.9 [2.7, 13.1] .167 8.5 [3.0, 14.1] .252
Hispanic/Latino No 11.4 [10.2, 12.7] 11.5 [10.2, 12.7] Yes 9.3 [3.9, 14.8] .497 9.3 [3.9, 14.6] .477
Don’t know - - Arab/Chaldean/Middle Eastern
No 11.6 [10.4, 12.9] 11.6 [10.4, 12.9] Yes 5.8 [0.4, 11.1] .130 5.8 [0.5, 11.1] .129
Don’t know - - Health status
Excellent 6.8 [3.2, 10.5] 6.7 [3.1, 10.2] Very good 8.6 [6.2, 11.1] .420 8.9 [6.4, 11.5] .319
Good 10.7 [9.0, 12.5] .111 10.6 [8.9, 12.4] .100 Fair 13.0 [10.4, 15.6] .027 12.9 [10.4, 15.5] .024
Poor 19.3 [14.2, 24.5] .001 19.1 [14.1, 24.1] < .001 Any chronic disease
No 8.5 [5.7, 11.4] 8.7 [5.9, 11.6] Yes 12.1 [10.7, 13.6] .058 12.0 [10.6, 13.5] .077
Urbanicity Rural 12.0 [9.9, 14.2] 12.0 [9.9, 14.0]
Urban 11.2 [9.8, 12.5] .481 11.2 [9.8, 12.6] .541 Logistic regression with predicted marginal estimates; independent variables are rows. 1 Dependent variable is Nicotine replacement and/or Varenicline prescription based on claims data. See Appendix B for full definitions.
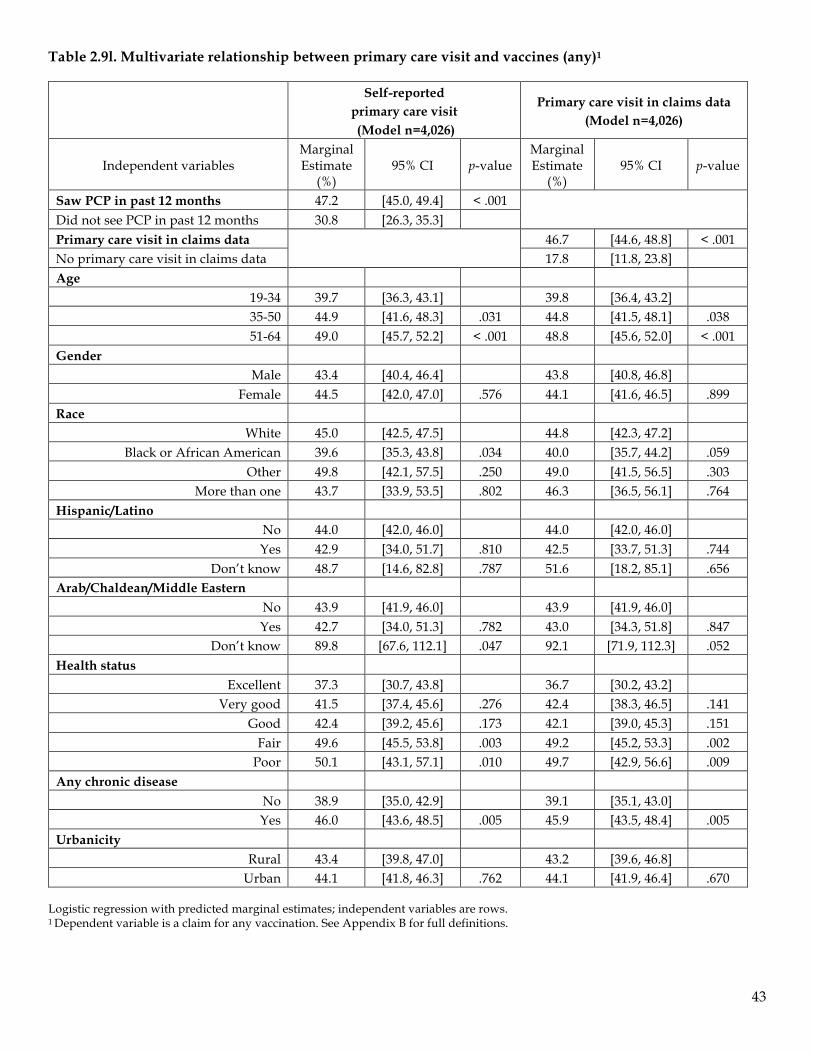
43
Table 2.9l. Multivariate relationship between primary care visit and vaccines (any)1
Self-reported
primary care visit (Model n=4,026)
Primary care visit in claims data (Model n=4,026)
Independent variables Marginal Estimate
(%) 95% CI p-value
Marginal Estimate
(%) 95% CI p-value
Saw PCP in past 12 months 47.2 [45.0, 49.4] < .001
Did not see PCP in past 12 months 30.8 [26.3, 35.3] Primary care visit in claims data
46.7 [44.6, 48.8] < .001
No primary care visit in claims data 17.8 [11.8, 23.8] Age
19-34 39.7 [36.3, 43.1] 39.8 [36.4, 43.2] 35-50 44.9 [41.6, 48.3] .031 44.8 [41.5, 48.1] .038 51-64 49.0 [45.7, 52.2] < .001 48.8 [45.6, 52.0] < .001
Gender Male 43.4 [40.4, 46.4] 43.8 [40.8, 46.8]
Female 44.5 [42.0, 47.0] .576 44.1 [41.6, 46.5] .899 Race
White 45.0 [42.5, 47.5] 44.8 [42.3, 47.2] Black or African American 39.6 [35.3, 43.8] .034 40.0 [35.7, 44.2] .059
Other 49.8 [42.1, 57.5] .250 49.0 [41.5, 56.5] .303 More than one 43.7 [33.9, 53.5] .802 46.3 [36.5, 56.1] .764
Hispanic/Latino No 44.0 [42.0, 46.0] 44.0 [42.0, 46.0] Yes 42.9 [34.0, 51.7] .810 42.5 [33.7, 51.3] .744
Don’t know 48.7 [14.6, 82.8] .787 51.6 [18.2, 85.1] .656 Arab/Chaldean/Middle Eastern
No 43.9 [41.9, 46.0] 43.9 [41.9, 46.0] Yes 42.7 [34.0, 51.3] .782 43.0 [34.3, 51.8] .847
Don’t know 89.8 [67.6, 112.1] .047 92.1 [71.9, 112.3] .052 Health status
Excellent 37.3 [30.7, 43.8] 36.7 [30.2, 43.2] Very good 41.5 [37.4, 45.6] .276 42.4 [38.3, 46.5] .141
Good 42.4 [39.2, 45.6] .173 42.1 [39.0, 45.3] .151 Fair 49.6 [45.5, 53.8] .003 49.2 [45.2, 53.3] .002
Poor 50.1 [43.1, 57.1] .010 49.7 [42.9, 56.6] .009 Any chronic disease
No 38.9 [35.0, 42.9] 39.1 [35.1, 43.0] Yes 46.0 [43.6, 48.5] .005 45.9 [43.5, 48.4] .005
Urbanicity Rural 43.4 [39.8, 47.0] 43.2 [39.6, 46.8]
Urban 44.1 [41.8, 46.3] .762 44.1 [41.9, 46.4] .670 Logistic regression with predicted marginal estimates; independent variables are rows. 1 Dependent variable is a claim for any vaccination. See Appendix B for full definitions.

44
Table 2.9m. Multivariate relationship between primary care visit and Influenza vaccine1
Self-reported
primary care visit (Model n=4,026)
Primary care visit in claims data (Model n=4,026)
Independent variables Marginal Estimate
(%) 95% CI p-value
Marginal Estimate
(%) 95% CI p-value
Saw PCP in past 12 months 35.2 [33.1, 37.3] < .001
Did not see PCP in past 12 months 20.4 [16.6, 24.3] Primary care visit in claims data
34.8 [32.8, 36.7] < .001
No primary care visit in claims data 7.6 [4.1, 11.1] Age
19-34 27.7 [24.6, 30.9] 27.8 [24.7, 31.0] 35-50 32.8 [29.7, 35.9] .023 32.7 [29.7, 35.7] .028 51-64 38.6 [35.7, 41.6] < .001 38.5 [35.5, 41.4] < .001
Gender Male 31.1 [28.4, 33.8] 31.4 [28.7, 34.2]
Female 33.7 [31.4, 36.1] .143 33.4 [31.1, 35.7] .268 Race
White 33.3 [31.1, 35.6] 33.2 [30.9, 35.4] Black or African American 28.3 [24.5, 32.1] .029 28.5 [24.8, 32.3] .044
Other 41.0 [33.6, 48.5] .048 40.3 [33.0, 47.5] .063 More than one 28.8 [20.2, 37.5] .337 30.8 [21.9, 39.7] .619
Hispanic/Latino No 32.6 [30.7, 34.5] 32.6 [30.7, 34.5] Yes 31.1 [23.3, 39.0] .724 30.8 [23.0, 38.6] .670
Don’t know 28.6 [-6.3, 63.5] .830 30.2 [-8.1, 68.4] .903 Arab/Chaldean/Middle Eastern
No 32.4 [30.6, 34.3] 32.4 [30.5, 34.3] Yes 31.9 [24.1, 39.7] .896 32.1 [24.3, 40.0] .946
Don’t know 82.8 [54.5, 111.2] .021 87.0 [58.0, 115.9] .049 Health status
Excellent 23.0 [17.4, 28.6] 22.6 [17.1, 28.2] Very good 27.2 [23.6, 30.8] .213 27.9 [24.2, 31.6] .123
Good 32.8 [29.9, 35.8] .005 32.5 [29.6, 35.5] .004 Fair 38.7 [34.9, 42.6] < .001 38.3 [34.5, 42.1] < .001
Poor 39.0 [32.4, 45.7] .001 38.7 [32.2, 45.2] < .001 Any chronic disease
No 25.9 [22.4, 29.5] 26.0 [22.5, 29.6] Yes 34.9 [32.6, 37.2] < .001 34.8 [32.6, 37.1] < .001
Urbanicity Rural 33.5 [30.2, 36.8] 33.3 [30.0, 36.5]
Urban 32.3 [30.2, 34.4] .536 32.3 [30.2, 34.4] .620 Logistic regression with predicted marginal estimates; independent variables are rows. 1 Dependent variable is receipt of influenza vaccination based on claims data. See Appendix B for full definitions.
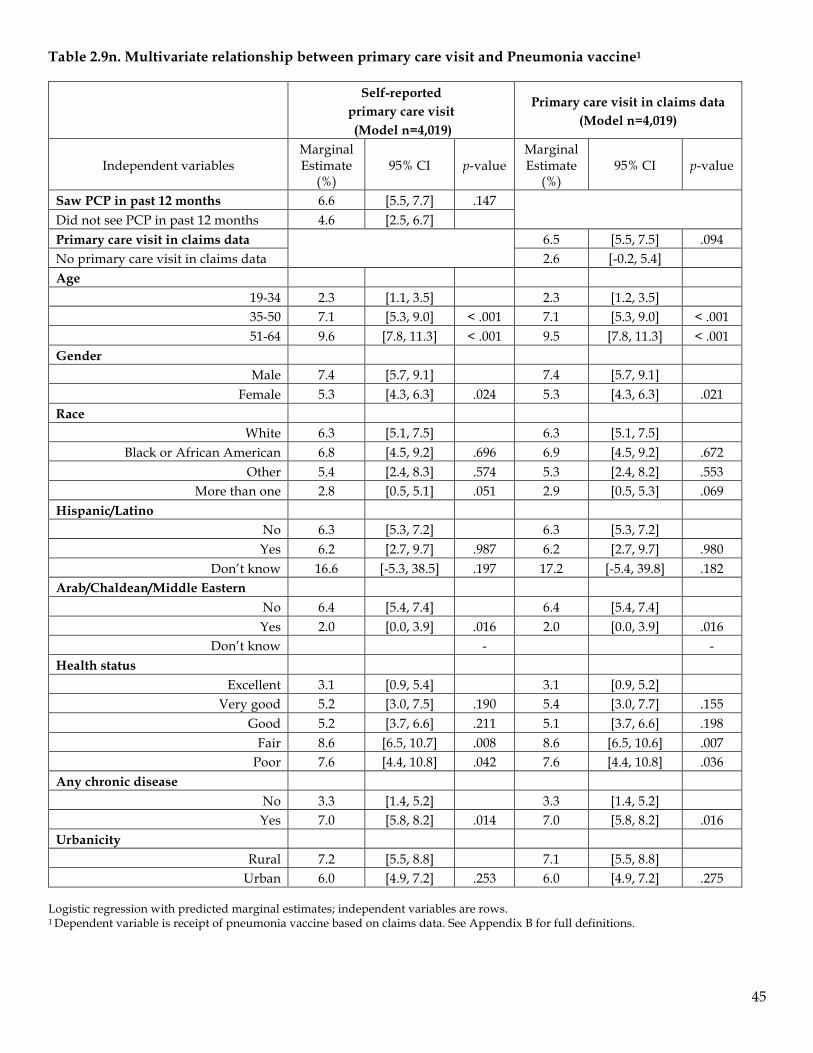
45
Table 2.9n. Multivariate relationship between primary care visit and Pneumonia vaccine1
Self-reported
primary care visit (Model n=4,019)
Primary care visit in claims data (Model n=4,019)
Independent variables Marginal Estimate
(%) 95% CI p-value
Marginal Estimate
(%) 95% CI p-value
Saw PCP in past 12 months 6.6 [5.5, 7.7] .147
Did not see PCP in past 12 months 4.6 [2.5, 6.7] Primary care visit in claims data
6.5 [5.5, 7.5] .094
No primary care visit in claims data 2.6 [-0.2, 5.4] Age
19-34 2.3 [1.1, 3.5] 2.3 [1.2, 3.5] 35-50 7.1 [5.3, 9.0] < .001 7.1 [5.3, 9.0] < .001 51-64 9.6 [7.8, 11.3] < .001 9.5 [7.8, 11.3] < .001
Gender Male 7.4 [5.7, 9.1] 7.4 [5.7, 9.1]
Female 5.3 [4.3, 6.3] .024 5.3 [4.3, 6.3] .021 Race
White 6.3 [5.1, 7.5] 6.3 [5.1, 7.5] Black or African American 6.8 [4.5, 9.2] .696 6.9 [4.5, 9.2] .672
Other 5.4 [2.4, 8.3] .574 5.3 [2.4, 8.2] .553 More than one 2.8 [0.5, 5.1] .051 2.9 [0.5, 5.3] .069
Hispanic/Latino No 6.3 [5.3, 7.2] 6.3 [5.3, 7.2] Yes 6.2 [2.7, 9.7] .987 6.2 [2.7, 9.7] .980
Don’t know 16.6 [-5.3, 38.5] .197 17.2 [-5.4, 39.8] .182 Arab/Chaldean/Middle Eastern
No 6.4 [5.4, 7.4] 6.4 [5.4, 7.4] Yes 2.0 [0.0, 3.9] .016 2.0 [0.0, 3.9] .016
Don’t know - - Health status
Excellent 3.1 [0.9, 5.4] 3.1 [0.9, 5.2] Very good 5.2 [3.0, 7.5] .190 5.4 [3.0, 7.7] .155
Good 5.2 [3.7, 6.6] .211 5.1 [3.7, 6.6] .198 Fair 8.6 [6.5, 10.7] .008 8.6 [6.5, 10.6] .007
Poor 7.6 [4.4, 10.8] .042 7.6 [4.4, 10.8] .036 Any chronic disease
No 3.3 [1.4, 5.2] 3.3 [1.4, 5.2] Yes 7.0 [5.8, 8.2] .014 7.0 [5.8, 8.2] .016
Urbanicity Rural 7.2 [5.5, 8.8] 7.1 [5.5, 8.8]
Urban 6.0 [4.9, 7.2] .253 6.0 [4.9, 7.2] .275 Logistic regression with predicted marginal estimates; independent variables are rows. 1 Dependent variable is receipt of pneumonia vaccine based on claims data. See Appendix B for full definitions.

46
Table 2.9o. Multivariate relationship between primary care visit and other vaccines1
Self-reported
primary care visit (Model n=4,026)
Primary care visit in claims data (Model n=4,026)
Independent variables Marginal Estimate
(%) 95% CI p-value
Marginal Estimate
(%) 95% CI p-value
Saw PCP in past 12 months 20.8 [19.0, 22.6] .092
Did not see PCP in past 12 months 17.0 [13.3, 20.7] Primary care visit in claims data
21.3 [19.5, 23.0] < .001
No primary care visit in claims data 9.7 [5.3, 14.1] Age
19-34 20.8 [17.9, 23.7] 21.0 [18.1, 23.9] 35-50 19.5 [16.7, 22.2] .511 19.4 [16.7, 22.1] .418 51-64 19.5 [16.9, 22.0] .510 19.3 [16.8, 21.8] .379
Gender Male 20.1 [17.5, 22.6] 20.4 [17.9, 23.0]
Female 19.9 [17.9, 21.9] .940 19.6 [17.6, 21.6] .612 Race
White 20.5 [18.4, 22.6] 20.3 [18.3, 22.4] Black or African American 18.0 [14.6, 21.4] .224 18.3 [14.8, 21.7] .328
Other 22.3 [15.6, 29.0] .630 22.0 [15.4, 28.6] .634 More than one 20.1 [12.1, 28.2] .924 21.4 [12.9, 29.8] .816
Hispanic/Latino No 19.9 [18.3, 21.6] 19.9 [18.3, 21.6] Yes 21.2 [13.2, 29.2] .759 21.1 [13.1, 29.1] .776
Don’t know 15.6 [-5.0, 36.3] .712 16.3 [-5.3, 37.9] .760 Arab/Chaldean/Middle Eastern
No 20.2 [18.5, 21.9] 20.2 [18.5, 21.9] Yes 16.4 [9.8, 23.1] .318 16.3 [9.7, 22.9] .297
Don’t know 32.4 [-11.4, 76.2] .533 34.2 [-17.1, 85.5] .538 Health status
Excellent 20.7 [15.3, 26.1] 20.6 [15.2, 26.0] Very good 20.9 [17.4, 24.5] .948 21.5 [17.9, 25.1] .780
Good 19.1 [16.6, 21.6] .586 19.0 [16.5, 21.5] .587 Fair 19.8 [16.4, 23.1] .769 19.5 [16.2, 22.8] .737
Poor 20.4 [14.5, 26.4] .943 20.2 [14.3, 26.0] .919 Any chronic disease
No 19.8 [16.5, 23.1] 20.1 [16.9, 23.4] Yes 20.1 [18.0, 22.2] .883 19.9 [17.9, 22.0] .916
Urbanicity Rural 19.9 [17.0, 22.8] 19.9 [17.0, 22.8]
Urban 20.0 [18.1, 21.9] .960 20.0 [18.2, 21.9] .929 Logistic regression with predicted marginal estimates; independent variables are rows. 1 Dependent variable is receipt of other vaccines based on claims data. See Appendix B for full definitions.

47
Section 3: Health risk assessment completion Table 3.1. Bivariate association between self-reported HRA completion and Data Warehouse records for HMV respondents
Of those who self-reported…. Any HRA record1 Completed HRA2
That they did not complete the HRA 46.7 18.8 That they did complete the HRA 68.3 44.1 All 57.3 31.3
Weighted proportions 1 Data warehouse record of HRA being started. See Appendix B for full definition. 2 Data warehouse record for a completed HRA.
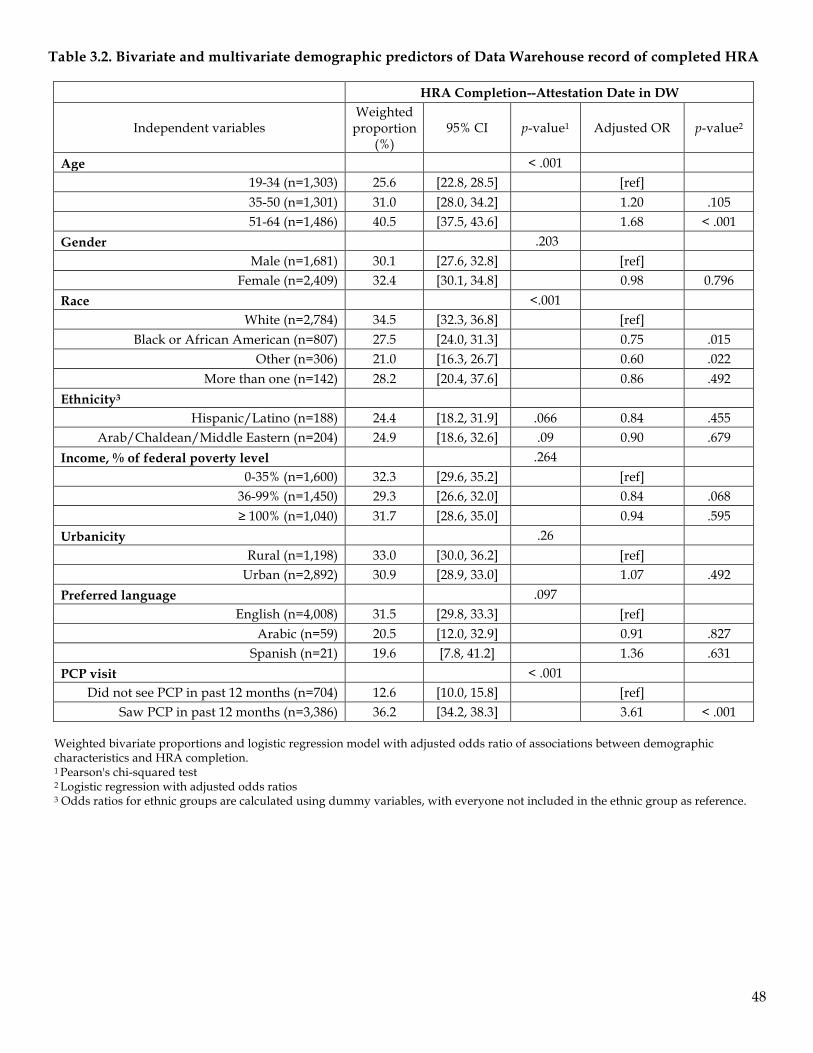
48
Table 3.2. Bivariate and multivariate demographic predictors of Data Warehouse record of completed HRA
HRA Completion--Attestation Date in DW
Independent variables Weighted
proportion (%)
95% CI p-value1 Adjusted OR p-value2
Age < .001 19-34 (n=1,303) 25.6 [22.8, 28.5] [ref] 35-50 (n=1,301) 31.0 [28.0, 34.2] 1.20 .105 51-64 (n=1,486) 40.5 [37.5, 43.6] 1.68 < .001
Gender .203 Male (n=1,681) 30.1 [27.6, 32.8] [ref]
Female (n=2,409) 32.4 [30.1, 34.8] 0.98 0.796 Race <.001
White (n=2,784) 34.5 [32.3, 36.8] [ref] Black or African American (n=807) 27.5 [24.0, 31.3] 0.75 .015
Other (n=306) 21.0 [16.3, 26.7] 0.60 .022 More than one (n=142) 28.2 [20.4, 37.6] 0.86 .492
Ethnicity3 Hispanic/Latino (n=188) 24.4 [18.2, 31.9] .066 0.84 .455
Arab/Chaldean/Middle Eastern (n=204) 24.9 [18.6, 32.6] .09 0.90 .679 Income, % of federal poverty level .264
0-35% (n=1,600) 32.3 [29.6, 35.2] [ref] 36-99% (n=1,450) 29.3 [26.6, 32.0] 0.84 .068 ≥ 100% (n=1,040) 31.7 [28.6, 35.0] 0.94 .595
Urbanicity .26 Rural (n=1,198) 33.0 [30.0, 36.2] [ref]
Urban (n=2,892) 30.9 [28.9, 33.0] 1.07 .492 Preferred language .097
English (n=4,008) 31.5 [29.8, 33.3] [ref] Arabic (n=59) 20.5 [12.0, 32.9] 0.91 .827
Spanish (n=21) 19.6 [7.8, 41.2] 1.36 .631 PCP visit < .001
Did not see PCP in past 12 months (n=704) 12.6 [10.0, 15.8] [ref] Saw PCP in past 12 months (n=3,386) 36.2 [34.2, 38.3] 3.61 < .001
Weighted bivariate proportions and logistic regression model with adjusted odds ratio of associations between demographic characteristics and HRA completion. 1 Pearson's chi-squared test 2 Logistic regression with adjusted odds ratios 3 Odds ratios for ethnic groups are calculated using dummy variables, with everyone not included in the ethnic group as reference.
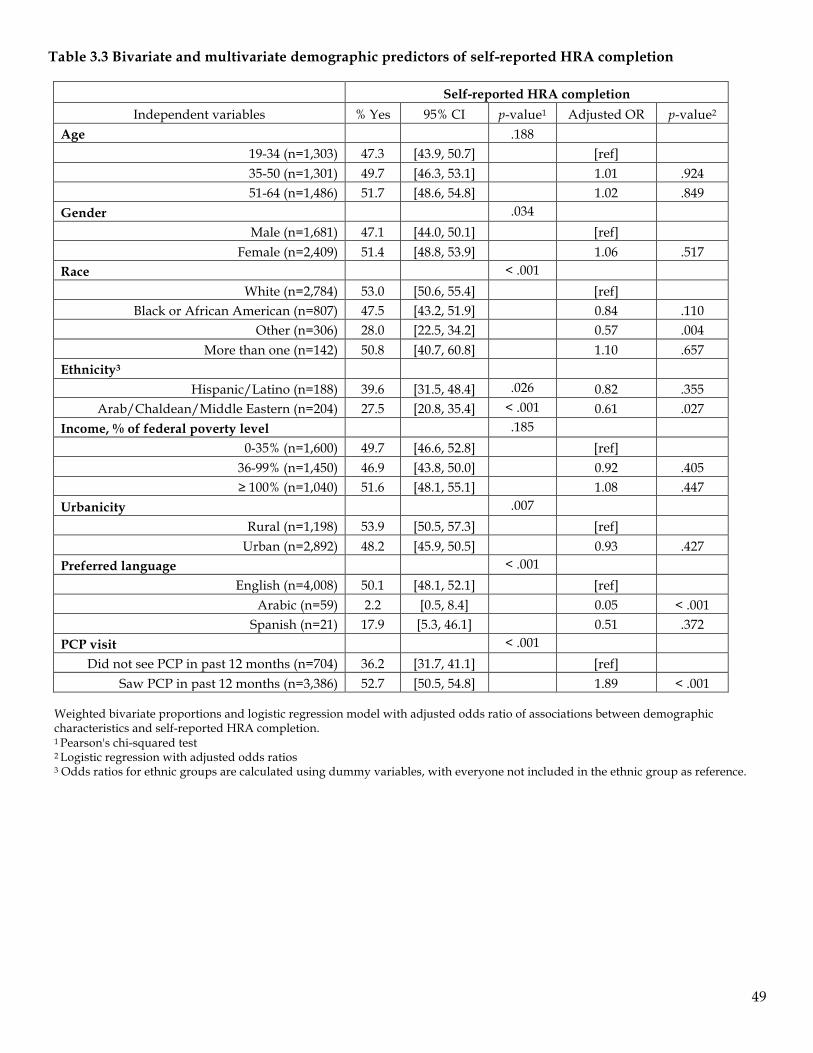
49
Table 3.3 Bivariate and multivariate demographic predictors of self-reported HRA completion
Self-reported HRA completion Independent variables % Yes 95% CI p-value1 Adjusted OR p-value2
Age .188 19-34 (n=1,303) 47.3 [43.9, 50.7] [ref] 35-50 (n=1,301) 49.7 [46.3, 53.1] 1.01 .924 51-64 (n=1,486) 51.7 [48.6, 54.8] 1.02 .849
Gender .034 Male (n=1,681) 47.1 [44.0, 50.1] [ref]
Female (n=2,409) 51.4 [48.8, 53.9] 1.06 .517 Race < .001
White (n=2,784) 53.0 [50.6, 55.4] [ref] Black or African American (n=807) 47.5 [43.2, 51.9] 0.84 .110
Other (n=306) 28.0 [22.5, 34.2] 0.57 .004 More than one (n=142) 50.8 [40.7, 60.8] 1.10 .657
Ethnicity3 Hispanic/Latino (n=188) 39.6 [31.5, 48.4] .026 0.82 .355
Arab/Chaldean/Middle Eastern (n=204) 27.5 [20.8, 35.4] < .001 0.61 .027 Income, % of federal poverty level .185
0-35% (n=1,600) 49.7 [46.6, 52.8] [ref] 36-99% (n=1,450) 46.9 [43.8, 50.0] 0.92 .405 ≥ 100% (n=1,040) 51.6 [48.1, 55.1] 1.08 .447
Urbanicity .007 Rural (n=1,198) 53.9 [50.5, 57.3] [ref]
Urban (n=2,892) 48.2 [45.9, 50.5] 0.93 .427 Preferred language < .001
English (n=4,008) 50.1 [48.1, 52.1] [ref] Arabic (n=59) 2.2 [0.5, 8.4] 0.05 < .001
Spanish (n=21) 17.9 [5.3, 46.1] 0.51 .372 PCP visit < .001
Did not see PCP in past 12 months (n=704) 36.2 [31.7, 41.1] [ref] Saw PCP in past 12 months (n=3,386) 52.7 [50.5, 54.8] 1.89 < .001
Weighted bivariate proportions and logistic regression model with adjusted odds ratio of associations between demographic characteristics and self-reported HRA completion. 1 Pearson's chi-squared test 2 Logistic regression with adjusted odds ratios 3 Odds ratios for ethnic groups are calculated using dummy variables, with everyone not included in the ethnic group as reference.
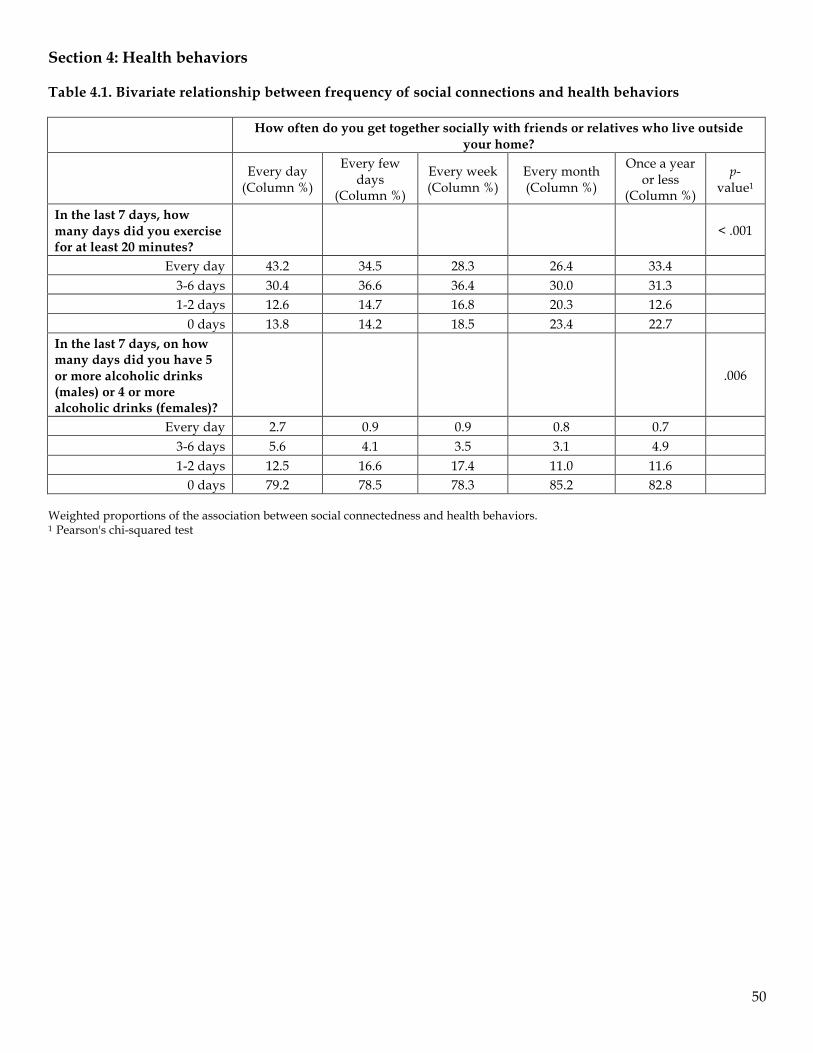
50
Section 4: Health behaviors Table 4.1. Bivariate relationship between frequency of social connections and health behaviors
How often do you get together socially with friends or relatives who live outside your home?
Every day (Column %)
Every few days
(Column %)
Every week (Column %)
Every month (Column %)
Once a year or less
(Column %)
p-value1
In the last 7 days, how many days did you exercise for at least 20 minutes?
< .001
Every day 43.2 34.5 28.3 26.4 33.4 3-6 days 30.4 36.6 36.4 30.0 31.3 1-2 days 12.6 14.7 16.8 20.3 12.6
0 days 13.8 14.2 18.5 23.4 22.7 In the last 7 days, on how many days did you have 5 or more alcoholic drinks (males) or 4 or more alcoholic drinks (females)?
.006
Every day 2.7 0.9 0.9 0.8 0.7 3-6 days 5.6 4.1 3.5 3.1 4.9 1-2 days 12.5 16.6 17.4 11.0 11.6
0 days 79.2 78.5 78.3 85.2 82.8 Weighted proportions of the association between social connectedness and health behaviors. 1 Pearson's chi-squared test
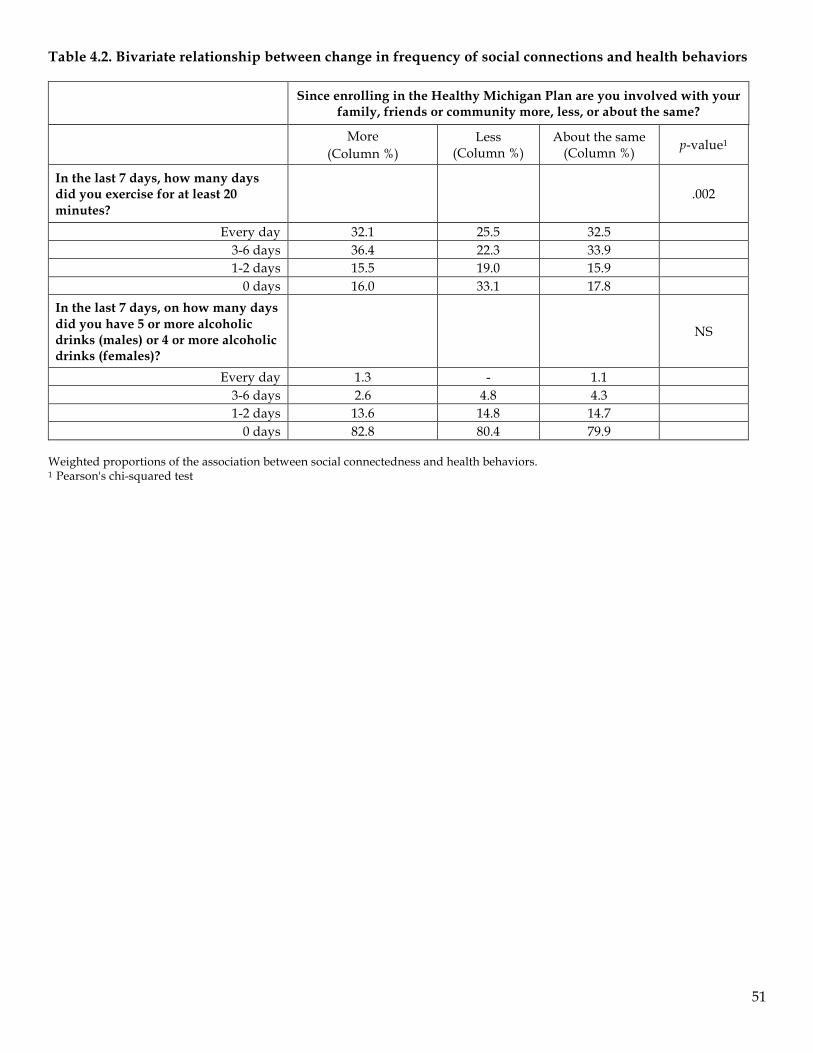
51
Table 4.2. Bivariate relationship between change in frequency of social connections and health behaviors
Since enrolling in the Healthy Michigan Plan are you involved with your family, friends or community more, less, or about the same?
More (Column %)
Less (Column %)
About the same (Column %) p-value1
In the last 7 days, how many days did you exercise for at least 20 minutes?
.002
Every day 32.1 25.5 32.5 3-6 days 36.4 22.3 33.9 1-2 days 15.5 19.0 15.9
0 days 16.0 33.1 17.8 In the last 7 days, on how many days did you have 5 or more alcoholic drinks (males) or 4 or more alcoholic drinks (females)?
NS
Every day 1.3 - 1.1 3-6 days 2.6 4.8 4.3 1-2 days 13.6 14.8 14.7
0 days 82.8 80.4 79.9 Weighted proportions of the association between social connectedness and health behaviors. 1 Pearson's chi-squared test
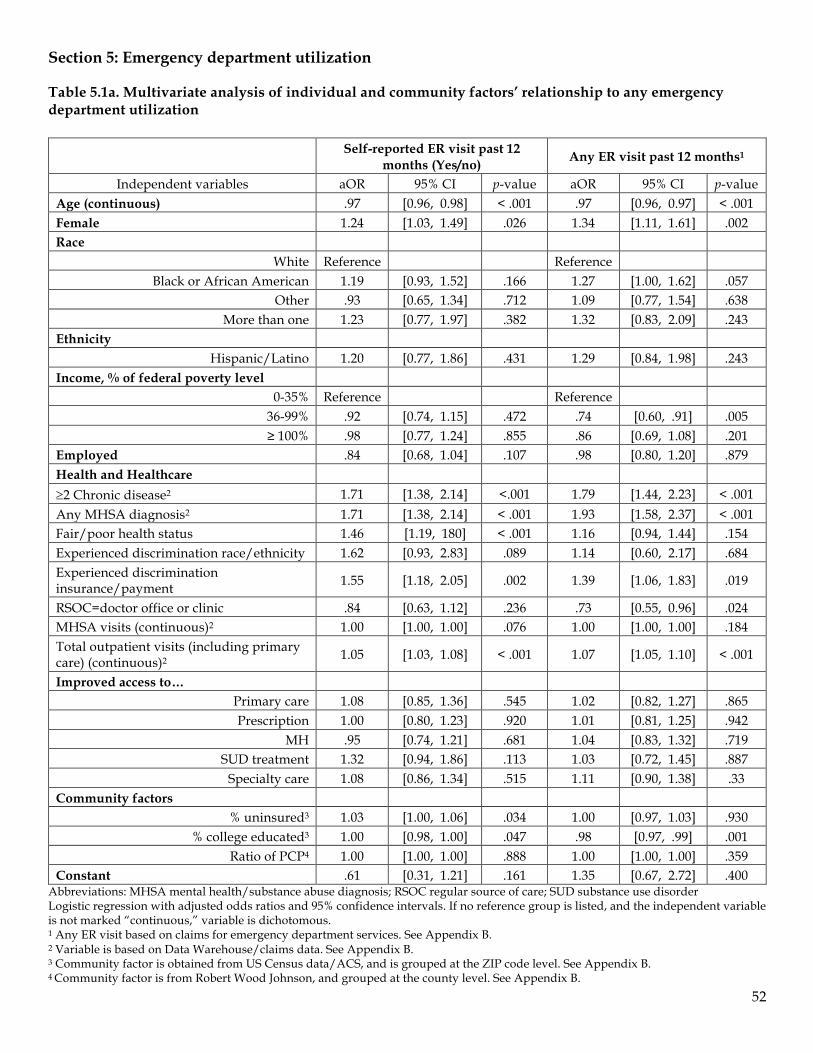
52
Section 5: Emergency department utilization Table 5.1a. Multivariate analysis of individual and community factors’ relationship to any emergency department utilization
Self-reported ER visit past 12 months (Yes/no) Any ER visit past 12 months1
Independent variables aOR 95% CI p-value aOR 95% CI p-value Age (continuous) .97 [0.96, 0.98] < .001 .97 [0.96, 0.97] < .001 Female 1.24 [1.03, 1.49] .026 1.34 [1.11, 1.61] .002 Race
White Reference Reference Black or African American 1.19 [0.93, 1.52] .166 1.27 [1.00, 1.62] .057
Other .93 [0.65, 1.34] .712 1.09 [0.77, 1.54] .638 More than one 1.23 [0.77, 1.97] .382 1.32 [0.83, 2.09] .243
Ethnicity Hispanic/Latino 1.20 [0.77, 1.86] .431 1.29 [0.84, 1.98] .243
Income, % of federal poverty level 0-35% Reference Reference
36-99% .92 [0.74, 1.15] .472 .74 [0.60, .91] .005 ≥ 100% .98 [0.77, 1.24] .855 .86 [0.69, 1.08] .201
Employed .84 [0.68, 1.04] .107 .98 [0.80, 1.20] .879 Health and Healthcare ³2 Chronic disease2 1.71 [1.38, 2.14] <.001 1.79 [1.44, 2.23] < .001 Any MHSA diagnosis2 1.71 [1.38, 2.14] < .001 1.93 [1.58, 2.37] < .001 Fair/poor health status 1.46 [1.19, 180] < .001 1.16 [0.94, 1.44] .154 Experienced discrimination race/ethnicity 1.62 [0.93, 2.83] .089 1.14 [0.60, 2.17] .684 Experienced discrimination insurance/payment 1.55 [1.18, 2.05] .002 1.39 [1.06, 1.83] .019
RSOC=doctor office or clinic .84 [0.63, 1.12] .236 .73 [0.55, 0.96] .024 MHSA visits (continuous)2 1.00 [1.00, 1.00] .076 1.00 [1.00, 1.00] .184 Total outpatient visits (including primary care) (continuous)2 1.05 [1.03, 1.08] < .001 1.07 [1.05, 1.10] < .001
Improved access to… Primary care 1.08 [0.85, 1.36] .545 1.02 [0.82, 1.27] .865 Prescription 1.00 [0.80, 1.23] .920 1.01 [0.81, 1.25] .942
MH .95 [0.74, 1.21] .681 1.04 [0.83, 1.32] .719 SUD treatment 1.32 [0.94, 1.86] .113 1.03 [0.72, 1.45] .887
Specialty care 1.08 [0.86, 1.34] .515 1.11 [0.90, 1.38] .33 Community factors
% uninsured3 1.03 [1.00, 1.06] .034 1.00 [0.97, 1.03] .930 % college educated3 1.00 [0.98, 1.00] .047 .98 [0.97, .99] .001
Ratio of PCP4 1.00 [1.00, 1.00] .888 1.00 [1.00, 1.00] .359 Constant .61 [0.31, 1.21] .161 1.35 [0.67, 2.72] .400
Abbreviations: MHSA mental health/substance abuse diagnosis; RSOC regular source of care; SUD substance use disorder Logistic regression with adjusted odds ratios and 95% confidence intervals. If no reference group is listed, and the independent variable is not marked “continuous,” variable is dichotomous. 1 Any ER visit based on claims for emergency department services. See Appendix B. 2 Variable is based on Data Warehouse/claims data. See Appendix B. 3 Community factor is obtained from US Census data/ACS, and is grouped at the ZIP code level. See Appendix B. 4 Community factor is from Robert Wood Johnson, and grouped at the county level. See Appendix B.
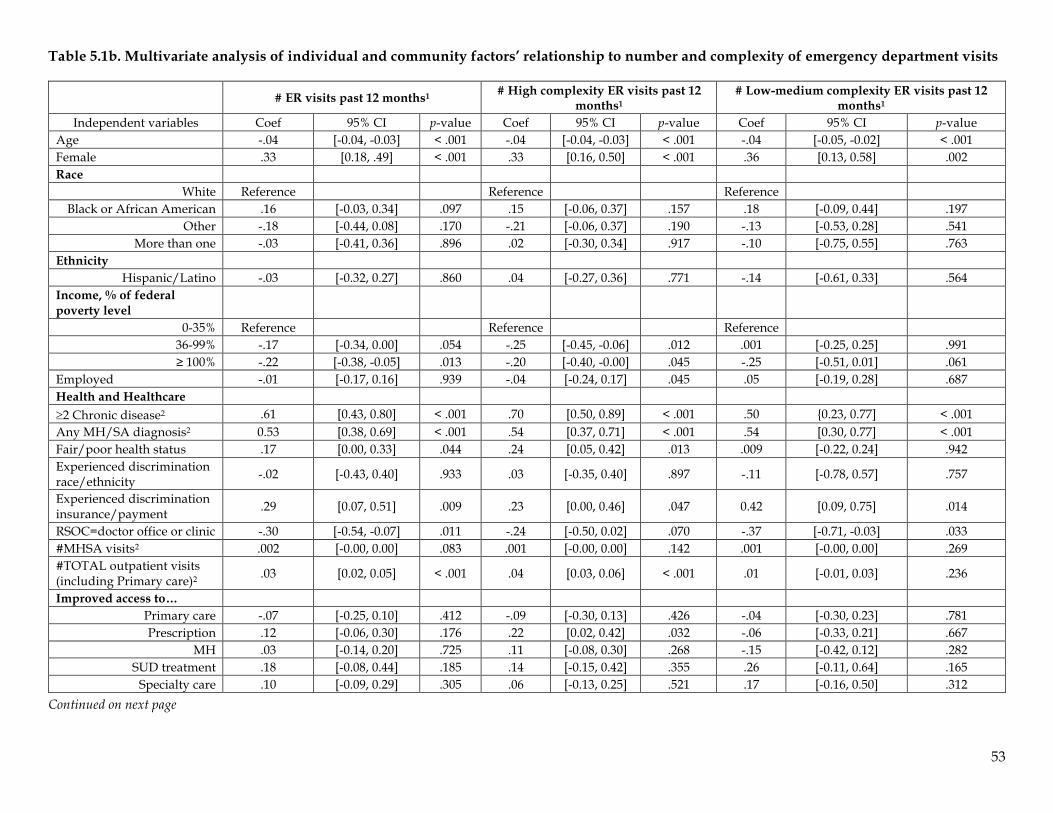
53
Table 5.1b. Multivariate analysis of individual and community factors’ relationship to number and complexity of emergency department visits
# ER visits past 12 months1 # High complexity ER visits past 12 months1
# Low-medium complexity ER visits past 12 months1
Independent variables Coef 95% CI p-value Coef 95% CI p-value Coef 95% CI p-value Age -.04 [-0.04, -0.03] < .001 -.04 [-0.04, -0.03] < .001 -.04 [-0.05, -0.02] < .001 Female .33 [0.18, .49] < .001 .33 [0.16, 0.50] < .001 .36 [0.13, 0.58] .002 Race
White Reference Reference Reference Black or African American .16 [-0.03, 0.34] .097 .15 [-0.06, 0.37] .157 .18 [-0.09, 0.44] .197
Other -.18 [-0.44, 0.08] .170 -.21 [-0.06, 0.37] .190 -.13 [-0.53, 0.28] .541 More than one -.03 [-0.41, 0.36] .896 .02 [-0.30, 0.34] .917 -.10 [-0.75, 0.55] .763
Ethnicity Hispanic/Latino -.03 [-0.32, 0.27] .860 .04 [-0.27, 0.36] .771 -.14 [-0.61, 0.33] .564
Income, % of federal poverty level
0-35% Reference Reference Reference 36-99% -.17 [-0.34, 0.00] .054 -.25 [-0.45, -0.06] .012 .001 [-0.25, 0.25] .991 ≥ 100% -.22 [-0.38, -0.05] .013 -.20 [-0.40, -0.00] .045 -.25 [-0.51, 0.01] .061
Employed -.01 [-0.17, 0.16] .939 -.04 [-0.24, 0.17] .045 .05 [-0.19, 0.28] .687 Health and Healthcare ³2 Chronic disease2 .61 [0.43, 0.80] < .001 .70 [0.50, 0.89] < .001 .50 {0.23, 0.77] < .001 Any MH/SA diagnosis2 0.53 [0.38, 0.69] < .001 .54 [0.37, 0.71] < .001 .54 [0.30, 0.77] < .001 Fair/poor health status .17 [0.00, 0.33] .044 .24 [0.05, 0.42] .013 .009 [-0.22, 0.24] .942 Experienced discrimination race/ethnicity -.02 [-0.43, 0.40] .933 .03 [-0.35, 0.40] .897 -.11 [-0.78, 0.57] .757
Experienced discrimination insurance/payment .29 [0.07, 0.51] .009 .23 [0.00, 0.46] .047 0.42 [0.09, 0.75] .014
RSOC=doctor office or clinic -.30 [-0.54, -0.07] .011 -.24 [-0.50, 0.02] .070 -.37 [-0.71, -0.03] .033 #MHSA visits2 .002 [-0.00, 0.00] .083 .001 [-0.00, 0.00] .142 .001 [-0.00, 0.00] .269 #TOTAL outpatient visits (including Primary care)2 .03 [0.02, 0.05] < .001 .04 [0.03, 0.06] < .001 .01 [-0.01, 0.03] .236
Improved access to… Primary care -.07 [-0.25, 0.10] .412 -.09 [-0.30, 0.13] .426 -.04 [-0.30, 0.23] .781 Prescription .12 [-0.06, 0.30] .176 .22 [0.02, 0.42] .032 -.06 [-0.33, 0.21] .667
MH .03 [-0.14, 0.20] .725 .11 [-0.08, 0.30] .268 -.15 [-0.42, 0.12] .282 SUD treatment .18 [-0.08, 0.44] .185 .14 [-0.15, 0.42] .355 .26 [-0.11, 0.64] .165
Specialty care .10 [-0.09, 0.29] .305 .06 [-0.13, 0.25] .521 .17 [-0.16, 0.50] .312 Continued on next page
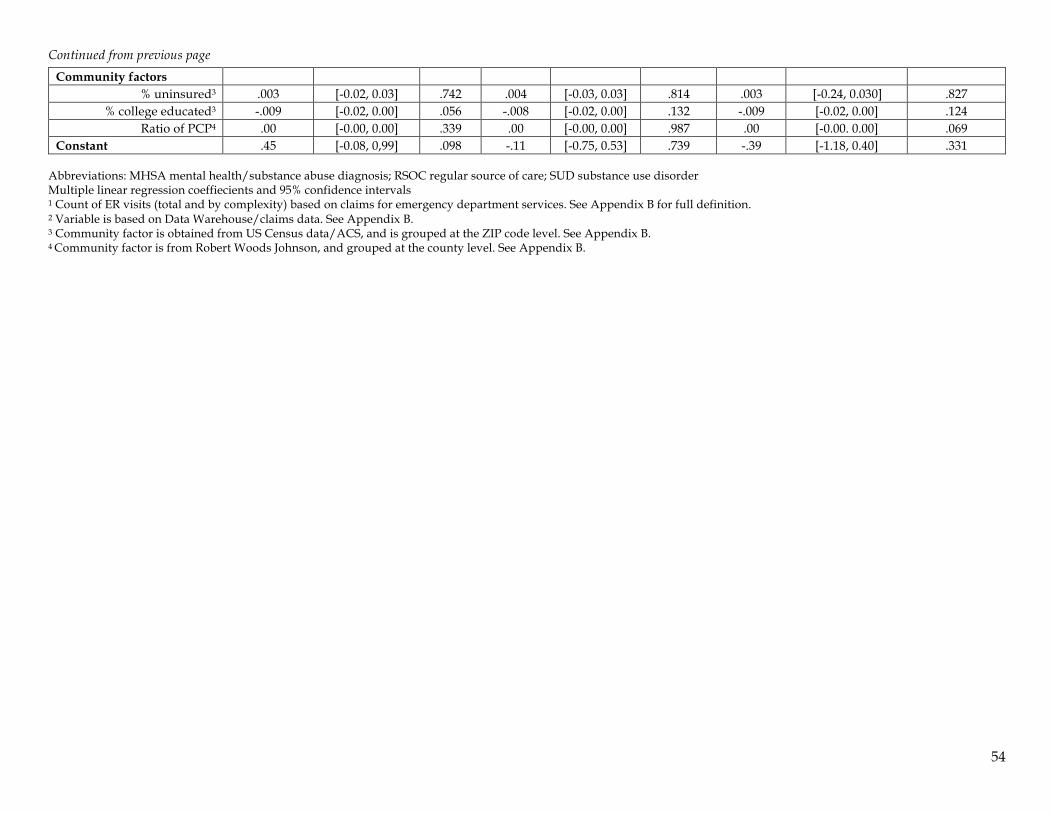
54
Continued from previous page
Community factors % uninsured3 .003 [-0.02, 0.03] .742 .004 [-0.03, 0.03] .814 .003 [-0.24, 0.030] .827
% college educated3 -.009 [-0.02, 0.00] .056 -.008 [-0.02, 0.00] .132 -.009 [-0.02, 0.00] .124 Ratio of PCP4 .00 [-0.00, 0.00] .339 .00 [-0.00, 0.00] .987 .00 [-0.00. 0.00] .069
Constant .45 [-0.08, 0,99] .098 -.11 [-0.75, 0.53] .739 -.39 [-1.18, 0.40] .331 Abbreviations: MHSA mental health/substance abuse diagnosis; RSOC regular source of care; SUD substance use disorder Multiple linear regression coeffiecients and 95% confidence intervals 1 Count of ER visits (total and by complexity) based on claims for emergency department services. See Appendix B for full definition. 2 Variable is based on Data Warehouse/claims data. See Appendix B. 3 Community factor is obtained from US Census data/ACS, and is grouped at the ZIP code level. See Appendix B. 4 Community factor is from Robert Woods Johnson, and grouped at the county level. See Appendix B.
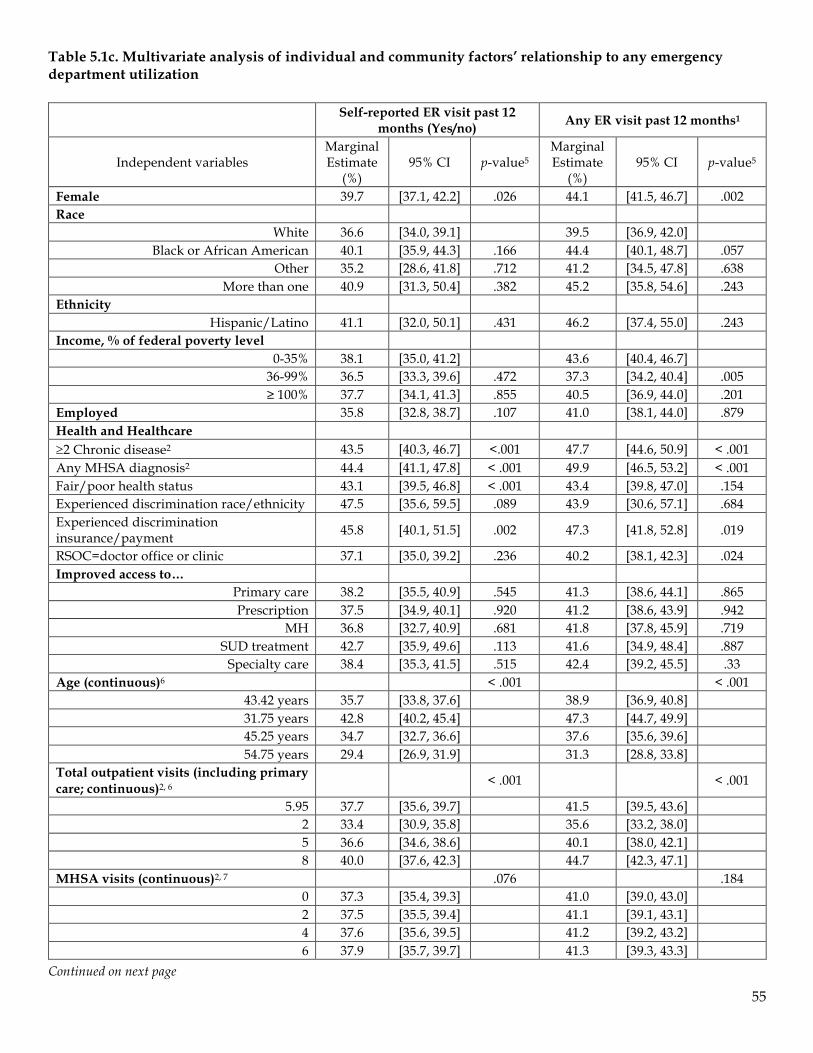
55
Table 5.1c. Multivariate analysis of individual and community factors’ relationship to any emergency department utilization
Self-reported ER visit past 12 months (Yes/no) Any ER visit past 12 months1
Independent variables Marginal Estimate
(%) 95% CI p-value5
Marginal Estimate
(%) 95% CI p-value5
Female 39.7 [37.1, 42.2] .026 44.1 [41.5, 46.7] .002 Race
White 36.6 [34.0, 39.1] 39.5 [36.9, 42.0] Black or African American 40.1 [35.9, 44.3] .166 44.4 [40.1, 48.7] .057
Other 35.2 [28.6, 41.8] .712 41.2 [34.5, 47.8] .638 More than one 40.9 [31.3, 50.4] .382 45.2 [35.8, 54.6] .243
Ethnicity Hispanic/Latino 41.1 [32.0, 50.1] .431 46.2 [37.4, 55.0] .243
Income, % of federal poverty level 0-35% 38.1 [35.0, 41.2] 43.6 [40.4, 46.7]
36-99% 36.5 [33.3, 39.6] .472 37.3 [34.2, 40.4] .005 ≥ 100% 37.7 [34.1, 41.3] .855 40.5 [36.9, 44.0] .201
Employed 35.8 [32.8, 38.7] .107 41.0 [38.1, 44.0] .879 Health and Healthcare ³2 Chronic disease2 43.5 [40.3, 46.7] <.001 47.7 [44.6, 50.9] < .001 Any MHSA diagnosis2 44.4 [41.1, 47.8] < .001 49.9 [46.5, 53.2] < .001 Fair/poor health status 43.1 [39.5, 46.8] < .001 43.4 [39.8, 47.0] .154 Experienced discrimination race/ethnicity 47.5 [35.6, 59.5] .089 43.9 [30.6, 57.1] .684 Experienced discrimination insurance/payment 45.8 [40.1, 51.5] .002 47.3 [41.8, 52.8] .019
RSOC=doctor office or clinic 37.1 [35.0, 39.2] .236 40.2 [38.1, 42.3] .024 Improved access to…
Primary care 38.2 [35.5, 40.9] .545 41.3 [38.6, 44.1] .865 Prescription 37.5 [34.9, 40.1] .920 41.2 [38.6, 43.9] .942
MH 36.8 [32.7, 40.9] .681 41.8 [37.8, 45.9] .719 SUD treatment 42.7 [35.9, 49.6] .113 41.6 [34.9, 48.4] .887
Specialty care 38.4 [35.3, 41.5] .515 42.4 [39.2, 45.5] .33 Age (continuous)6 < .001 < .001
43.42 years 35.7 [33.8, 37.6] 38.9 [36.9, 40.8] 31.75 years 42.8 [40.2, 45.4] 47.3 [44.7, 49.9] 45.25 years 34.7 [32.7, 36.6] 37.6 [35.6, 39.6] 54.75 years 29.4 [26.9, 31.9] 31.3 [28.8, 33.8]
Total outpatient visits (including primary care; continuous)2, 6 < .001 < .001
5.95 37.7 [35.6, 39.7] 41.5 [39.5, 43.6] 2 33.4 [30.9, 35.8] 35.6 [33.2, 38.0] 5 36.6 [34.6, 38.6] 40.1 [38.0, 42.1] 8 40.0 [37.6, 42.3] 44.7 [42.3, 47.1]
MHSA visits (continuous)2, 7 .076 .184 0 37.3 [35.4, 39.3] 41.0 [39.0, 43.0] 2 37.5 [35.5, 39.4] 41.1 [39.1, 43.1] 4 37.6 [35.6, 39.5] 41.2 [39.2, 43.2] 6 37.9 [35.7, 39.7] 41.3 [39.3, 43.3]
Continued on next page
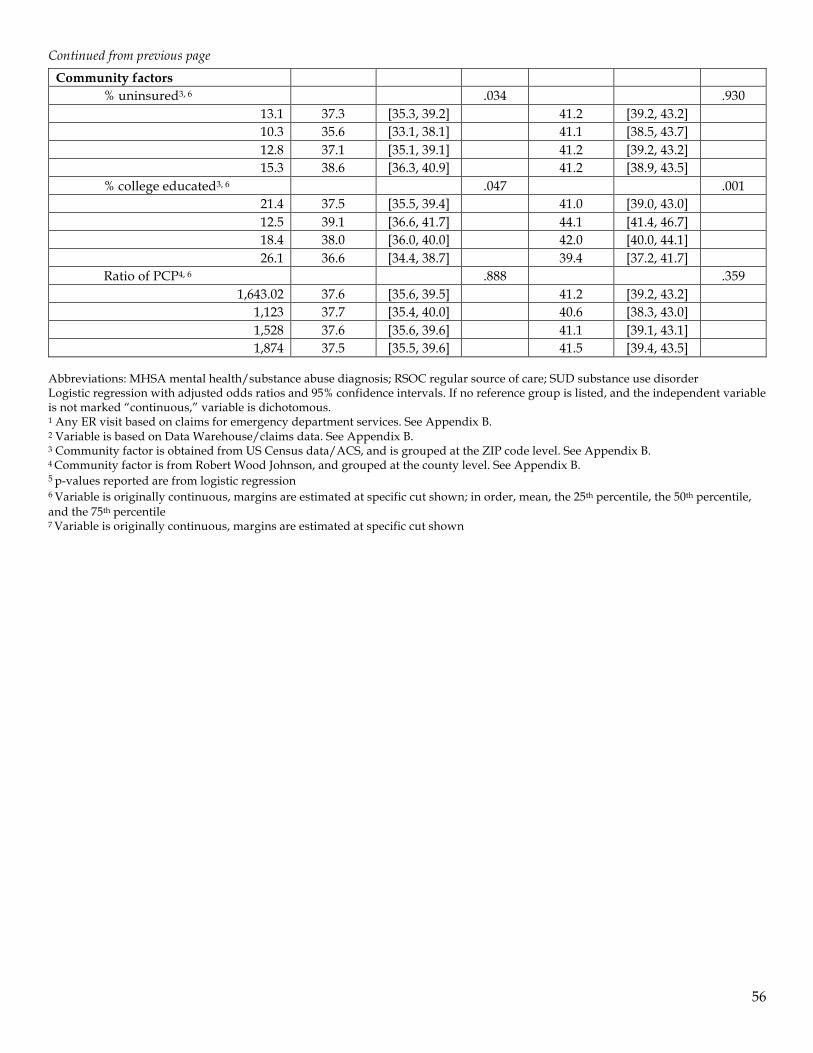
56
Continued from previous page
Community factors % uninsured3, 6 .034 .930
13.1 37.3 [35.3, 39.2] 41.2 [39.2, 43.2] 10.3 35.6 [33.1, 38.1] 41.1 [38.5, 43.7] 12.8 37.1 [35.1, 39.1] 41.2 [39.2, 43.2] 15.3 38.6 [36.3, 40.9] 41.2 [38.9, 43.5]
% college educated3, 6 .047 .001 21.4 37.5 [35.5, 39.4] 41.0 [39.0, 43.0] 12.5 39.1 [36.6, 41.7] 44.1 [41.4, 46.7] 18.4 38.0 [36.0, 40.0] 42.0 [40.0, 44.1] 26.1 36.6 [34.4, 38.7] 39.4 [37.2, 41.7]
Ratio of PCP4, 6 .888 .359 1,643.02 37.6 [35.6, 39.5] 41.2 [39.2, 43.2]
1,123 37.7 [35.4, 40.0] 40.6 [38.3, 43.0] 1,528 37.6 [35.6, 39.6] 41.1 [39.1, 43.1] 1,874 37.5 [35.5, 39.6] 41.5 [39.4, 43.5]
Abbreviations: MHSA mental health/substance abuse diagnosis; RSOC regular source of care; SUD substance use disorder Logistic regression with adjusted odds ratios and 95% confidence intervals. If no reference group is listed, and the independent variable is not marked “continuous,” variable is dichotomous. 1 Any ER visit based on claims for emergency department services. See Appendix B. 2 Variable is based on Data Warehouse/claims data. See Appendix B. 3 Community factor is obtained from US Census data/ACS, and is grouped at the ZIP code level. See Appendix B. 4 Community factor is from Robert Wood Johnson, and grouped at the county level. See Appendix B. 5 p-values reported are from logistic regression 6 Variable is originally continuous, margins are estimated at specific cut shown; in order, mean, the 25th percentile, the 50th percentile, and the 75th percentile 7 Variable is originally continuous, margins are estimated at specific cut shown
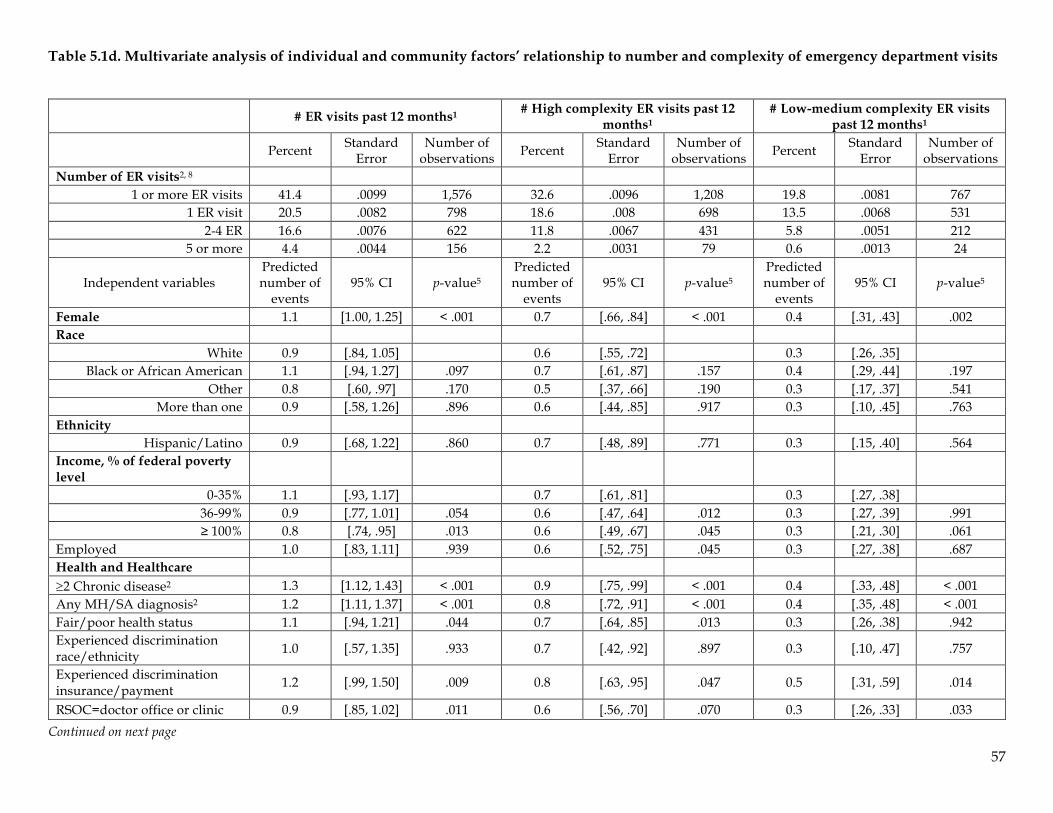
57
Table 5.1d. Multivariate analysis of individual and community factors’ relationship to number and complexity of emergency department visits
# ER visits past 12 months1 # High complexity ER visits past 12 months1
# Low-medium complexity ER visits past 12 months1
Percent Standard Error
Number of observations Percent Standard
Error Number of
observations Percent Standard Error
Number of observations
Number of ER visits2, 8 1 or more ER visits 41.4 .0099 1,576 32.6 .0096 1,208 19.8 .0081 767
1 ER visit 20.5 .0082 798 18.6 .008 698 13.5 .0068 531 2-4 ER 16.6 .0076 622 11.8 .0067 431 5.8 .0051 212
5 or more 4.4 .0044 156 2.2 .0031 79 0.6 .0013 24
Independent variables Predicted number of
events 95% CI p-value5
Predicted number of
events 95% CI p-value5
Predicted number of
events 95% CI p-value5
Female 1.1 [1.00, 1.25] < .001 0.7 [.66, .84] < .001 0.4 [.31, .43] .002 Race
White 0.9 [.84, 1.05] 0.6 [.55, .72] 0.3 [.26, .35] Black or African American 1.1 [.94, 1.27] .097 0.7 [.61, .87] .157 0.4 [.29, .44] .197
Other 0.8 [.60, .97] .170 0.5 [.37, .66] .190 0.3 [.17, .37] .541 More than one 0.9 [.58, 1.26] .896 0.6 [.44, .85] .917 0.3 [.10, .45] .763
Ethnicity Hispanic/Latino 0.9 [.68, 1.22] .860 0.7 [.48, .89] .771 0.3 [.15, .40] .564
Income, % of federal poverty level
0-35% 1.1 [.93, 1.17] 0.7 [.61, .81] 0.3 [.27, .38] 36-99% 0.9 [.77, 1.01] .054 0.6 [.47, .64] .012 0.3 [.27, .39] .991 ≥ 100% 0.8 [.74, .95] .013 0.6 [.49, .67] .045 0.3 [.21, .30] .061
Employed 1.0 [.83, 1.11] .939 0.6 [.52, .75] .045 0.3 [.27, .38] .687 Health and Healthcare ³2 Chronic disease2 1.3 [1.12, 1.43] < .001 0.9 [.75, .99] < .001 0.4 [.33, .48] < .001 Any MH/SA diagnosis2 1.2 [1.11, 1.37] < .001 0.8 [.72, .91] < .001 0.4 [.35, .48] < .001 Fair/poor health status 1.1 [.94, 1.21] .044 0.7 [.64, .85] .013 0.3 [.26, .38] .942 Experienced discrimination race/ethnicity 1.0 [.57, 1.35] .933 0.7 [.42, .92] .897 0.3 [.10, .47] .757
Experienced discrimination insurance/payment 1.2 [.99, 1.50] .009 0.8 [.63, .95] .047 0.5 [.31, .59] .014
RSOC=doctor office or clinic 0.9 [.85, 1.02] .011 0.6 [.56, .70] .070 0.3 [.26, .33] .033 Continued on next page
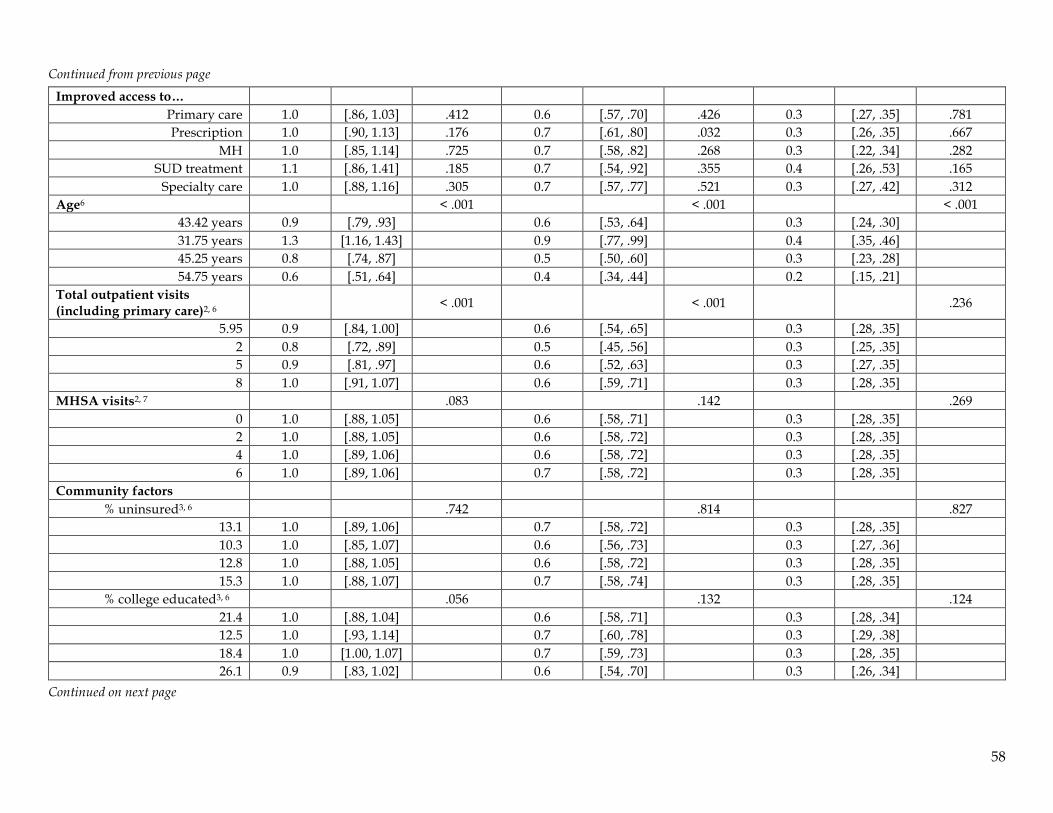
58
Continued from previous page
Improved access to… Primary care 1.0 [.86, 1.03] .412 0.6 [.57, .70] .426 0.3 [.27, .35] .781 Prescription 1.0 [.90, 1.13] .176 0.7 [.61, .80] .032 0.3 [.26, .35] .667
MH 1.0 [.85, 1.14] .725 0.7 [.58, .82] .268 0.3 [.22, .34] .282 SUD treatment 1.1 [.86, 1.41] .185 0.7 [.54, .92] .355 0.4 [.26, .53] .165
Specialty care 1.0 [.88, 1.16] .305 0.7 [.57, .77] .521 0.3 [.27, .42] .312 Age6 < .001 < .001 < .001
43.42 years 0.9 [.79, .93] 0.6 [.53, .64] 0.3 [.24, .30] 31.75 years 1.3 [1.16, 1.43] 0.9 [.77, .99] 0.4 [.35, .46] 45.25 years 0.8 [.74, .87] 0.5 [.50, .60] 0.3 [.23, .28] 54.75 years 0.6 [.51, .64] 0.4 [.34, .44] 0.2 [.15, .21]
Total outpatient visits (including primary care)2, 6 < .001 < .001 .236
5.95 0.9 [.84, 1.00] 0.6 [.54, .65] 0.3 [.28, .35] 2 0.8 [.72, .89] 0.5 [.45, .56] 0.3 [.25, .35] 5 0.9 [.81, .97] 0.6 [.52, .63] 0.3 [.27, .35] 8 1.0 [.91, 1.07] 0.6 [.59, .71] 0.3 [.28, .35]
MHSA visits2, 7 .083 .142 .269 0 1.0 [.88, 1.05] 0.6 [.58, .71] 0.3 [.28, .35] 2 1.0 [.88, 1.05] 0.6 [.58, .72] 0.3 [.28, .35] 4 1.0 [.89, 1.06] 0.6 [.58, .72] 0.3 [.28, .35] 6 1.0 [.89, 1.06] 0.7 [.58, .72] 0.3 [.28, .35]
Community factors % uninsured3, 6 .742 .814 .827
13.1 1.0 [.89, 1.06] 0.7 [.58, .72] 0.3 [.28, .35] 10.3 1.0 [.85, 1.07] 0.6 [.56, .73] 0.3 [.27, .36] 12.8 1.0 [.88, 1.05] 0.6 [.58, .72] 0.3 [.28, .35] 15.3 1.0 [.88, 1.07] 0.7 [.58, .74] 0.3 [.28, .35]
% college educated3, 6 .056 .132 .124 21.4 1.0 [.88, 1.04] 0.6 [.58, .71] 0.3 [.28, .34] 12.5 1.0 [.93, 1.14] 0.7 [.60, .78] 0.3 [.29, .38] 18.4 1.0 [1.00, 1.07] 0.7 [.59, .73] 0.3 [.28, .35] 26.1 0.9 [.83, 1.02] 0.6 [.54, .70] 0.3 [.26, .34]
Continued on next page

59
Continued from previous page
Ratio of PCP4, 6 .339 .987 .069 1,643.02 1.0 [.89, 1.06] 0.7 [.58, .72] 0.3 [.28, .35]
1,123 1.0 [.86, 1.05] 0.7 [.57, .73] 0.3 [.26, .33] 1,528 1.0 [.88, 1.06] 0.7 [.58, .72] 0.3 [.28, .35] 1,874 1.0 [.90, 1.07] 0.7 [.58, .72] 0.3 [.29, .36]
Abbreviations: MHSA mental health/substance abuse diagnosis; RSOC regular source of care; SUD substance use disorder Multiple linear regression coeffiecients and 95% confidence intervals 1 Count of ER visits (total and by complexity) based on claims for emergency department services. See Appendix B for full definition. 2 Variable is based on Data Warehouse/claims data. See Appendix B. 3 Community factor is obtained from US Census data/ACS, and is grouped at the ZIP code level. See Appendix B. 4 Community factor is from Robert Woods Johnson, and grouped at the county level. See Appendix B. 5 p-values reported are from poisson regression 6 Variable is originally continuous, margins are estimated at specific cut shown; in order, mean, the 25th percentile, the 50th percentile, and the 75th percentile 7 Variable is originally continuous, margins are estimated at specific cut shown 8 The total percent may not add up to 100% do to rounding
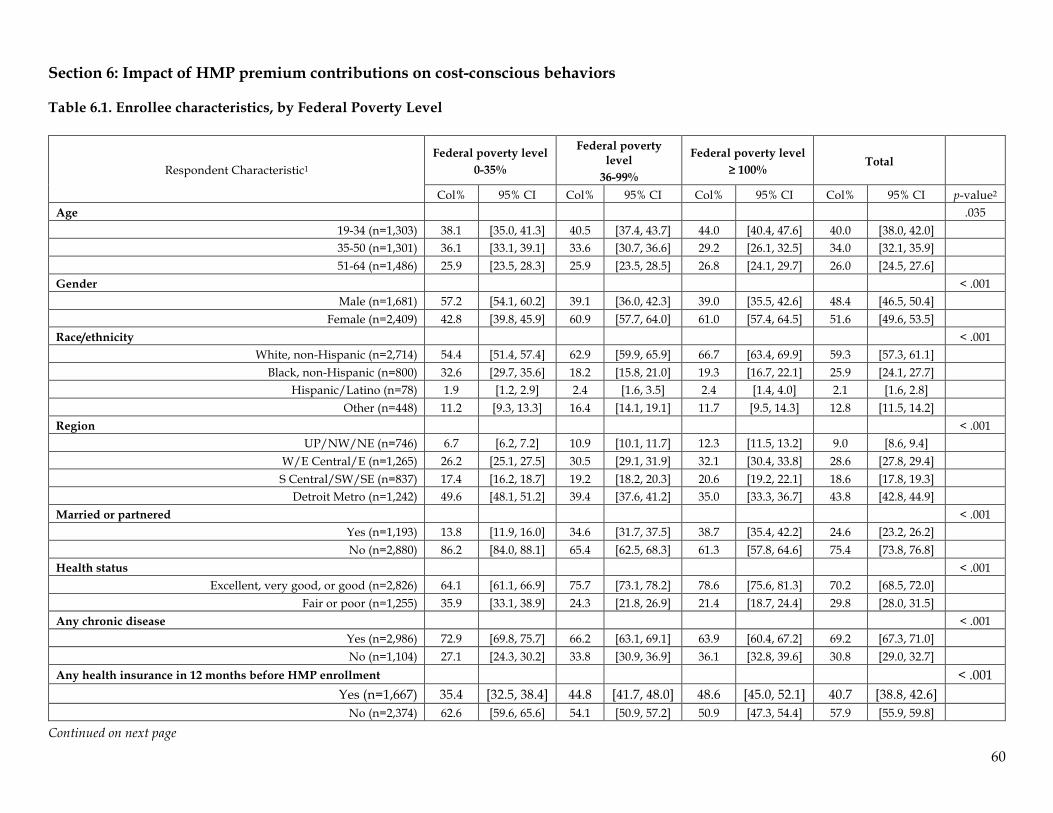
60
Section 6: Impact of HMP premium contributions on cost-conscious behaviors Table 6.1. Enrollee characteristics, by Federal Poverty Level
Respondent Characteristic1
Federal poverty level 0-35%
Federal poverty level
36-99%
Federal poverty level ≥ 100%
Total
Col% 95% CI Col% 95% CI Col% 95% CI Col% 95% CI p-value2 Age .035
19-34 (n=1,303) 38.1 [35.0, 41.3] 40.5 [37.4, 43.7] 44.0 [40.4, 47.6] 40.0 [38.0, 42.0] 35-50 (n=1,301) 36.1 [33.1, 39.1] 33.6 [30.7, 36.6] 29.2 [26.1, 32.5] 34.0 [32.1, 35.9] 51-64 (n=1,486) 25.9 [23.5, 28.3] 25.9 [23.5, 28.5] 26.8 [24.1, 29.7] 26.0 [24.5, 27.6]
Gender < .001 Male (n=1,681) 57.2 [54.1, 60.2] 39.1 [36.0, 42.3] 39.0 [35.5, 42.6] 48.4 [46.5, 50.4]
Female (n=2,409) 42.8 [39.8, 45.9] 60.9 [57.7, 64.0] 61.0 [57.4, 64.5] 51.6 [49.6, 53.5] Race/ethnicity < .001
White, non-Hispanic (n=2,714) 54.4 [51.4, 57.4] 62.9 [59.9, 65.9] 66.7 [63.4, 69.9] 59.3 [57.3, 61.1] Black, non-Hispanic (n=800) 32.6 [29.7, 35.6] 18.2 [15.8, 21.0] 19.3 [16.7, 22.1] 25.9 [24.1, 27.7]
Hispanic/Latino (n=78) 1.9 [1.2, 2.9] 2.4 [1.6, 3.5] 2.4 [1.4, 4.0] 2.1 [1.6, 2.8] Other (n=448) 11.2 [9.3, 13.3] 16.4 [14.1, 19.1] 11.7 [9.5, 14.3] 12.8 [11.5, 14.2]
Region < .001 UP/NW/NE (n=746) 6.7 [6.2, 7.2] 10.9 [10.1, 11.7] 12.3 [11.5, 13.2] 9.0 [8.6, 9.4]
W/E Central/E (n=1,265) 26.2 [25.1, 27.5] 30.5 [29.1, 31.9] 32.1 [30.4, 33.8] 28.6 [27.8, 29.4] S Central/SW/SE (n=837) 17.4 [16.2, 18.7] 19.2 [18.2, 20.3] 20.6 [19.2, 22.1] 18.6 [17.8, 19.3]
Detroit Metro (n=1,242) 49.6 [48.1, 51.2] 39.4 [37.6, 41.2] 35.0 [33.3, 36.7] 43.8 [42.8, 44.9] Married or partnered < .001
Yes (n=1,193) 13.8 [11.9, 16.0] 34.6 [31.7, 37.5] 38.7 [35.4, 42.2] 24.6 [23.2, 26.2] No (n=2,880) 86.2 [84.0, 88.1] 65.4 [62.5, 68.3] 61.3 [57.8, 64.6] 75.4 [73.8, 76.8]
Health status < .001 Excellent, very good, or good (n=2,826) 64.1 [61.1, 66.9] 75.7 [73.1, 78.2] 78.6 [75.6, 81.3] 70.2 [68.5, 72.0]
Fair or poor (n=1,255) 35.9 [33.1, 38.9] 24.3 [21.8, 26.9] 21.4 [18.7, 24.4] 29.8 [28.0, 31.5] Any chronic disease < .001
Yes (n=2,986) 72.9 [69.8, 75.7] 66.2 [63.1, 69.1] 63.9 [60.4, 67.2] 69.2 [67.3, 71.0] No (n=1,104) 27.1 [24.3, 30.2] 33.8 [30.9, 36.9] 36.1 [32.8, 39.6] 30.8 [29.0, 32.7]
Any health insurance in 12 months before HMP enrollment < .001 Yes (n=1,667) 35.4 [32.5, 38.4] 44.8 [41.7, 48.0] 48.6 [45.0, 52.1] 40.7 [38.8, 42.6]
No (n=2,374) 62.6 [59.6, 65.6] 54.1 [50.9, 57.2] 50.9 [47.3, 54.4] 57.9 [55.9, 59.8]
Continued on next page
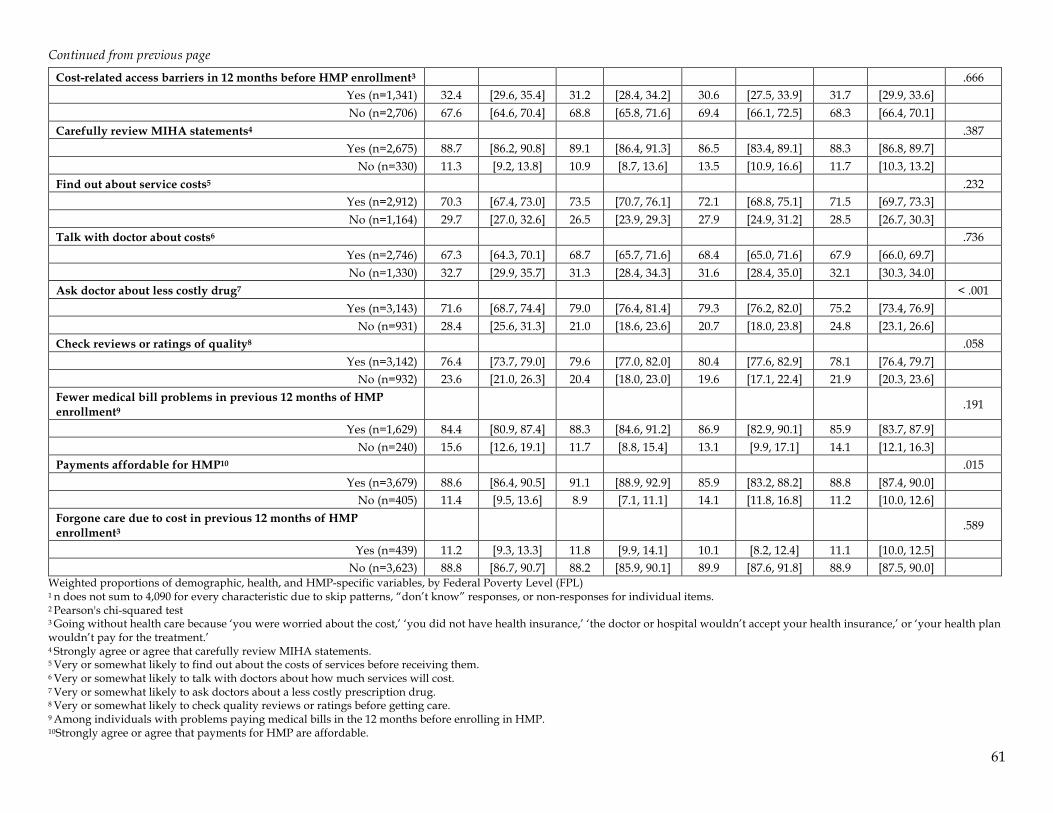
61
Continued from previous page Cost-related access barriers in 12 months before HMP enrollment3 .666
Yes (n=1,341) 32.4 [29.6, 35.4] 31.2 [28.4, 34.2] 30.6 [27.5, 33.9] 31.7 [29.9, 33.6] No (n=2,706) 67.6 [64.6, 70.4] 68.8 [65.8, 71.6] 69.4 [66.1, 72.5] 68.3 [66.4, 70.1]
Carefully review MIHA statements4 .387 Yes (n=2,675) 88.7 [86.2, 90.8] 89.1 [86.4, 91.3] 86.5 [83.4, 89.1] 88.3 [86.8, 89.7]
No (n=330) 11.3 [9.2, 13.8] 10.9 [8.7, 13.6] 13.5 [10.9, 16.6] 11.7 [10.3, 13.2] Find out about service costs5 .232
Yes (n=2,912) 70.3 [67.4, 73.0] 73.5 [70.7, 76.1] 72.1 [68.8, 75.1] 71.5 [69.7, 73.3] No (n=1,164) 29.7 [27.0, 32.6] 26.5 [23.9, 29.3] 27.9 [24.9, 31.2] 28.5 [26.7, 30.3]
Talk with doctor about costs6 .736 Yes (n=2,746) 67.3 [64.3, 70.1] 68.7 [65.7, 71.6] 68.4 [65.0, 71.6] 67.9 [66.0, 69.7] No (n=1,330) 32.7 [29.9, 35.7] 31.3 [28.4, 34.3] 31.6 [28.4, 35.0] 32.1 [30.3, 34.0]
Ask doctor about less costly drug7 < .001 Yes (n=3,143) 71.6 [68.7, 74.4] 79.0 [76.4, 81.4] 79.3 [76.2, 82.0] 75.2 [73.4, 76.9]
No (n=931) 28.4 [25.6, 31.3] 21.0 [18.6, 23.6] 20.7 [18.0, 23.8] 24.8 [23.1, 26.6] Check reviews or ratings of quality8 .058
Yes (n=3,142) 76.4 [73.7, 79.0] 79.6 [77.0, 82.0] 80.4 [77.6, 82.9] 78.1 [76.4, 79.7] No (n=932) 23.6 [21.0, 26.3] 20.4 [18.0, 23.0] 19.6 [17.1, 22.4] 21.9 [20.3, 23.6]
Fewer medical bill problems in previous 12 months of HMP enrollment9 .191
Yes (n=1,629) 84.4 [80.9, 87.4] 88.3 [84.6, 91.2] 86.9 [82.9, 90.1] 85.9 [83.7, 87.9] No (n=240) 15.6 [12.6, 19.1] 11.7 [8.8, 15.4] 13.1 [9.9, 17.1] 14.1 [12.1, 16.3]
Payments affordable for HMP10 .015 Yes (n=3,679) 88.6 [86.4, 90.5] 91.1 [88.9, 92.9] 85.9 [83.2, 88.2] 88.8 [87.4, 90.0]
No (n=405) 11.4 [9.5, 13.6] 8.9 [7.1, 11.1] 14.1 [11.8, 16.8] 11.2 [10.0, 12.6] Forgone care due to cost in previous 12 months of HMP enrollment3 .589
Yes (n=439) 11.2 [9.3, 13.3] 11.8 [9.9, 14.1] 10.1 [8.2, 12.4] 11.1 [10.0, 12.5] No (n=3,623) 88.8 [86.7, 90.7] 88.2 [85.9, 90.1] 89.9 [87.6, 91.8] 88.9 [87.5, 90.0]
Weighted proportions of demographic, health, and HMP-specific variables, by Federal Poverty Level (FPL) 1 n does not sum to 4,090 for every characteristic due to skip patterns, “don’t know” responses, or non-responses for individual items. 2 Pearson's chi-squared test 3 Going without health care because ‘you were worried about the cost,’ ‘you did not have health insurance,’ ‘the doctor or hospital wouldn’t accept your health insurance,’ or ‘your health plan wouldn’t pay for the treatment.’ 4 Strongly agree or agree that carefully review MIHA statements. 5 Very or somewhat likely to find out about the costs of services before receiving them. 6 Very or somewhat likely to talk with doctors about how much services will cost. 7 Very or somewhat likely to ask doctors about a less costly prescription drug. 8 Very or somewhat likely to check quality reviews or ratings before getting care. 9 Among individuals with problems paying medical bills in the 12 months before enrolling in HMP. 10Strongly agree or agree that payments for HMP are affordable.
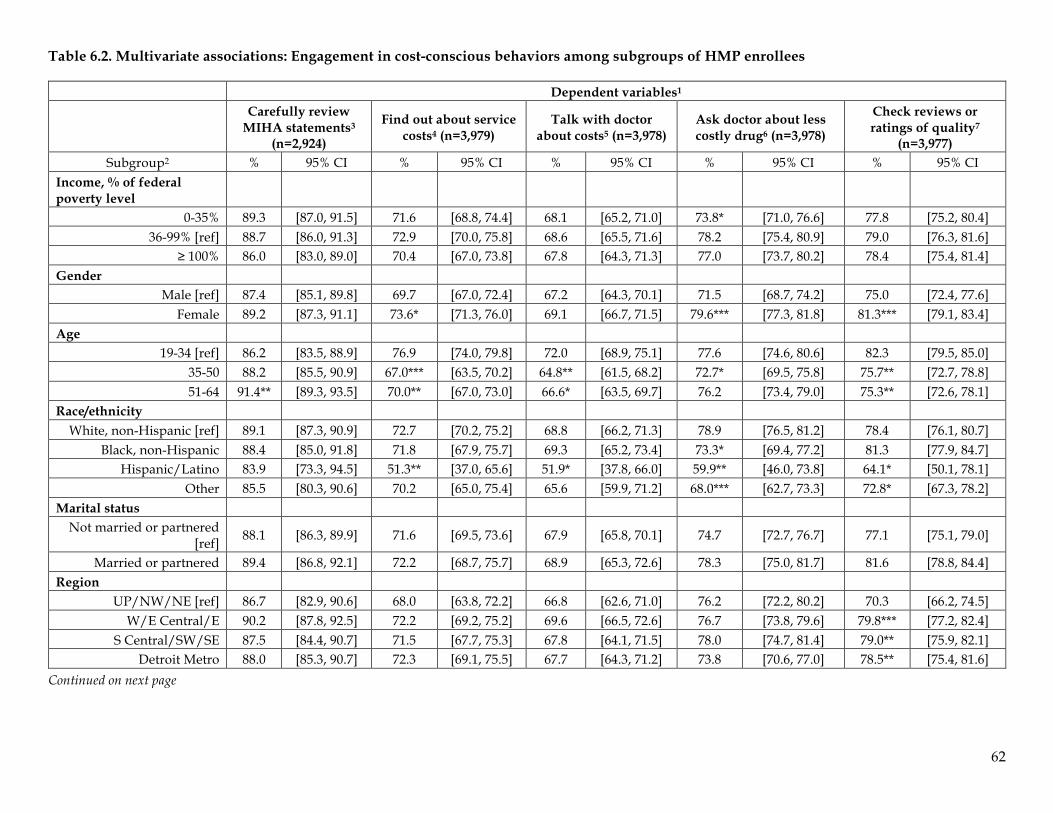
62
Table 6.2. Multivariate associations: Engagement in cost-conscious behaviors among subgroups of HMP enrollees
Dependent variables1
Carefully review
MIHA statements3 (n=2,924)
Find out about service costs4 (n=3,979)
Talk with doctor about costs5 (n=3,978)
Ask doctor about less costly drug6 (n=3,978)
Check reviews or ratings of quality7
(n=3,977) Subgroup2 % 95% CI % 95% CI % 95% CI % 95% CI % 95% CI
Income, % of federal poverty level
0-35% 89.3 [87.0, 91.5] 71.6 [68.8, 74.4] 68.1 [65.2, 71.0] 73.8* [71.0, 76.6] 77.8 [75.2, 80.4] 36-99% [ref] 88.7 [86.0, 91.3] 72.9 [70.0, 75.8] 68.6 [65.5, 71.6] 78.2 [75.4, 80.9] 79.0 [76.3, 81.6]
≥ 100% 86.0 [83.0, 89.0] 70.4 [67.0, 73.8] 67.8 [64.3, 71.3] 77.0 [73.7, 80.2] 78.4 [75.4, 81.4] Gender
Male [ref] 87.4 [85.1, 89.8] 69.7 [67.0, 72.4] 67.2 [64.3, 70.1] 71.5 [68.7, 74.2] 75.0 [72.4, 77.6] Female 89.2 [87.3, 91.1] 73.6* [71.3, 76.0] 69.1 [66.7, 71.5] 79.6*** [77.3, 81.8] 81.3*** [79.1, 83.4]
Age 19-34 [ref] 86.2 [83.5, 88.9] 76.9 [74.0, 79.8] 72.0 [68.9, 75.1] 77.6 [74.6, 80.6] 82.3 [79.5, 85.0]
35-50 88.2 [85.5, 90.9] 67.0*** [63.5, 70.2] 64.8** [61.5, 68.2] 72.7* [69.5, 75.8] 75.7** [72.7, 78.8] 51-64 91.4** [89.3, 93.5] 70.0** [67.0, 73.0] 66.6* [63.5, 69.7] 76.2 [73.4, 79.0] 75.3** [72.6, 78.1]
Race/ethnicity White, non-Hispanic [ref] 89.1 [87.3, 90.9] 72.7 [70.2, 75.2] 68.8 [66.2, 71.3] 78.9 [76.5, 81.2] 78.4 [76.1, 80.7]
Black, non-Hispanic 88.4 [85.0, 91.8] 71.8 [67.9, 75.7] 69.3 [65.2, 73.4] 73.3* [69.4, 77.2] 81.3 [77.9, 84.7] Hispanic/Latino 83.9 [73.3, 94.5] 51.3** [37.0, 65.6] 51.9* [37.8, 66.0] 59.9** [46.0, 73.8] 64.1* [50.1, 78.1]
Other 85.5 [80.3, 90.6] 70.2 [65.0, 75.4] 65.6 [59.9, 71.2] 68.0*** [62.7, 73.3] 72.8* [67.3, 78.2] Marital status
Not married or partnered [ref] 88.1 [86.3, 89.9] 71.6 [69.5, 73.6] 67.9 [65.8, 70.1] 74.7 [72.7, 76.7] 77.1 [75.1, 79.0]
Married or partnered 89.4 [86.8, 92.1] 72.2 [68.7, 75.7] 68.9 [65.3, 72.6] 78.3 [75.0, 81.7] 81.6 [78.8, 84.4] Region
UP/NW/NE [ref] 86.7 [82.9, 90.6] 68.0 [63.8, 72.2] 66.8 [62.6, 71.0] 76.2 [72.2, 80.2] 70.3 [66.2, 74.5] W/E Central/E 90.2 [87.8, 92.5] 72.2 [69.2, 75.2] 69.6 [66.5, 72.6] 76.7 [73.8, 79.6] 79.8*** [77.2, 82.4]
S Central/SW/SE 87.5 [84.4, 90.7] 71.5 [67.7, 75.3] 67.8 [64.1, 71.5] 78.0 [74.7, 81.4] 79.0** [75.9, 82.1] Detroit Metro 88.0 [85.3, 90.7] 72.3 [69.1, 75.5] 67.7 [64.3, 71.2] 73.8 [70.6, 77.0] 78.5** [75.4, 81.6]
Continued on next page
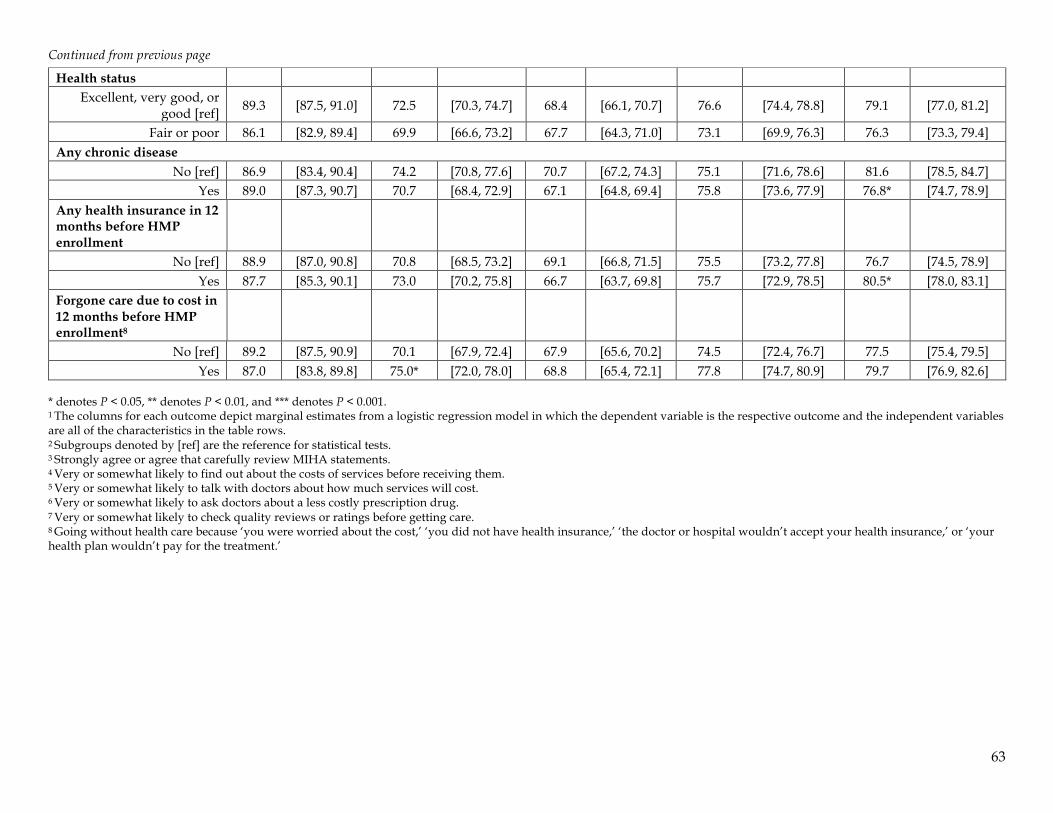
63
Continued from previous page Health status
Excellent, very good, or good [ref] 89.3 [87.5, 91.0] 72.5 [70.3, 74.7] 68.4 [66.1, 70.7] 76.6 [74.4, 78.8] 79.1 [77.0, 81.2]
Fair or poor 86.1 [82.9, 89.4] 69.9 [66.6, 73.2] 67.7 [64.3, 71.0] 73.1 [69.9, 76.3] 76.3 [73.3, 79.4] Any chronic disease
No [ref] 86.9 [83.4, 90.4] 74.2 [70.8, 77.6] 70.7 [67.2, 74.3] 75.1 [71.6, 78.6] 81.6 [78.5, 84.7] Yes 89.0 [87.3, 90.7] 70.7 [68.4, 72.9] 67.1 [64.8, 69.4] 75.8 [73.6, 77.9] 76.8* [74.7, 78.9]
Any health insurance in 12 months before HMP enrollment
No [ref] 88.9 [87.0, 90.8] 70.8 [68.5, 73.2] 69.1 [66.8, 71.5] 75.5 [73.2, 77.8] 76.7 [74.5, 78.9] Yes 87.7 [85.3, 90.1] 73.0 [70.2, 75.8] 66.7 [63.7, 69.8] 75.7 [72.9, 78.5] 80.5* [78.0, 83.1]
Forgone care due to cost in 12 months before HMP enrollment8
No [ref] 89.2 [87.5, 90.9] 70.1 [67.9, 72.4] 67.9 [65.6, 70.2] 74.5 [72.4, 76.7] 77.5 [75.4, 79.5] Yes 87.0 [83.8, 89.8] 75.0* [72.0, 78.0] 68.8 [65.4, 72.1] 77.8 [74.7, 80.9] 79.7 [76.9, 82.6]
* denotes P < 0.05, ** denotes P < 0.01, and *** denotes P < 0.001. 1 The columns for each outcome depict marginal estimates from a logistic regression model in which the dependent variable is the respective outcome and the independent variables are all of the characteristics in the table rows. 2 Subgroups denoted by [ref] are the reference for statistical tests. 3 Strongly agree or agree that carefully review MIHA statements. 4 Very or somewhat likely to find out about the costs of services before receiving them. 5 Very or somewhat likely to talk with doctors about how much services will cost. 6 Very or somewhat likely to ask doctors about a less costly prescription drug. 7 Very or somewhat likely to check quality reviews or ratings before getting care. 8 Going without health care because ‘you were worried about the cost,’ ‘you did not have health insurance,’ ‘the doctor or hospital wouldn’t accept your health insurance,’ or ‘your health plan wouldn’t pay for the treatment.’
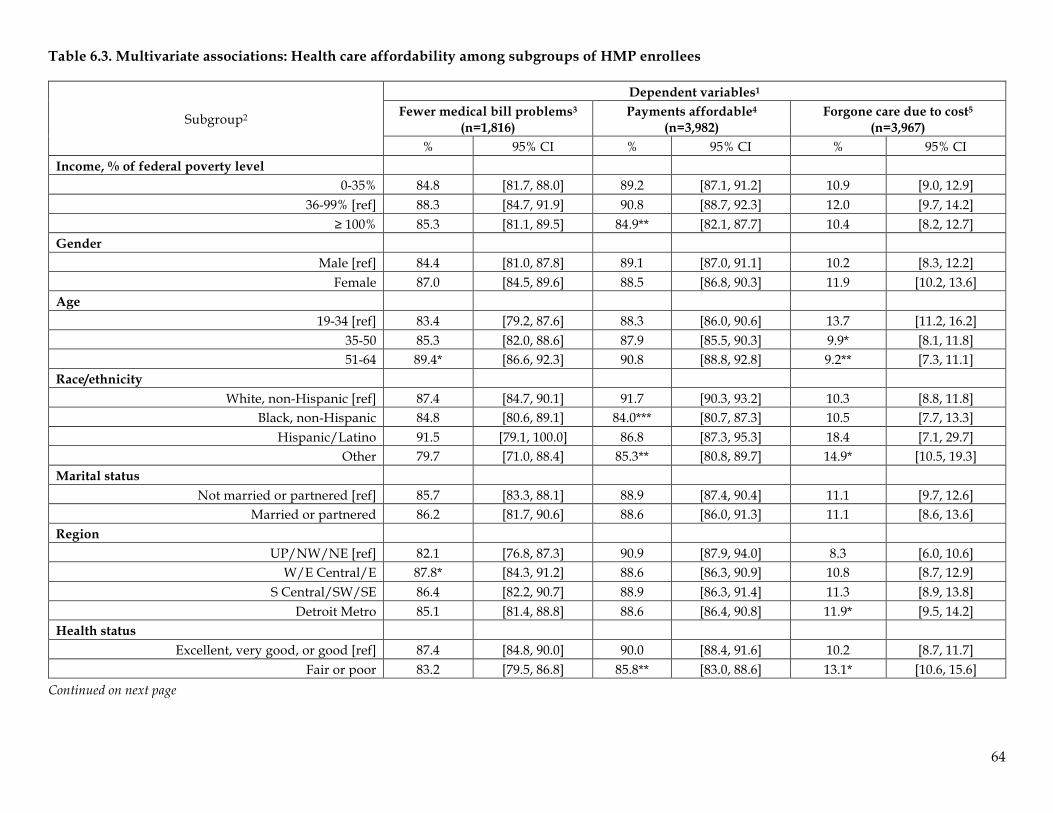
64
Table 6.3. Multivariate associations: Health care affordability among subgroups of HMP enrollees
Subgroup2
Dependent variables1
Fewer medical bill problems3 (n=1,816)
Payments affordable4 (n=3,982)
Forgone care due to cost5 (n=3,967)
% 95% CI % 95% CI % 95% CI Income, % of federal poverty level
0-35% 84.8 [81.7, 88.0] 89.2 [87.1, 91.2] 10.9 [9.0, 12.9] 36-99% [ref] 88.3 [84.7, 91.9] 90.8 [88.7, 92.3] 12.0 [9.7, 14.2]
≥ 100% 85.3 [81.1, 89.5] 84.9** [82.1, 87.7] 10.4 [8.2, 12.7] Gender
Male [ref] 84.4 [81.0, 87.8] 89.1 [87.0, 91.1] 10.2 [8.3, 12.2] Female 87.0 [84.5, 89.6] 88.5 [86.8, 90.3] 11.9 [10.2, 13.6]
Age 19-34 [ref] 83.4 [79.2, 87.6] 88.3 [86.0, 90.6] 13.7 [11.2, 16.2]
35-50 85.3 [82.0, 88.6] 87.9 [85.5, 90.3] 9.9* [8.1, 11.8] 51-64 89.4* [86.6, 92.3] 90.8 [88.8, 92.8] 9.2** [7.3, 11.1]
Race/ethnicity White, non-Hispanic [ref] 87.4 [84.7, 90.1] 91.7 [90.3, 93.2] 10.3 [8.8, 11.8]
Black, non-Hispanic 84.8 [80.6, 89.1] 84.0*** [80.7, 87.3] 10.5 [7.7, 13.3] Hispanic/Latino 91.5 [79.1, 100.0] 86.8 [87.3, 95.3] 18.4 [7.1, 29.7]
Other 79.7 [71.0, 88.4] 85.3** [80.8, 89.7] 14.9* [10.5, 19.3] Marital status
Not married or partnered [ref] 85.7 [83.3, 88.1] 88.9 [87.4, 90.4] 11.1 [9.7, 12.6] Married or partnered 86.2 [81.7, 90.6] 88.6 [86.0, 91.3] 11.1 [8.6, 13.6]
Region UP/NW/NE [ref] 82.1 [76.8, 87.3] 90.9 [87.9, 94.0] 8.3 [6.0, 10.6]
W/E Central/E 87.8* [84.3, 91.2] 88.6 [86.3, 90.9] 10.8 [8.7, 12.9] S Central/SW/SE 86.4 [82.2, 90.7] 88.9 [86.3, 91.4] 11.3 [8.9, 13.8]
Detroit Metro 85.1 [81.4, 88.8] 88.6 [86.4, 90.8] 11.9* [9.5, 14.2] Health status
Excellent, very good, or good [ref] 87.4 [84.8, 90.0] 90.0 [88.4, 91.6] 10.2 [8.7, 11.7] Fair or poor 83.2 [79.5, 86.8] 85.8** [83.0, 88.6] 13.1* [10.6, 15.6]
Continued on next page
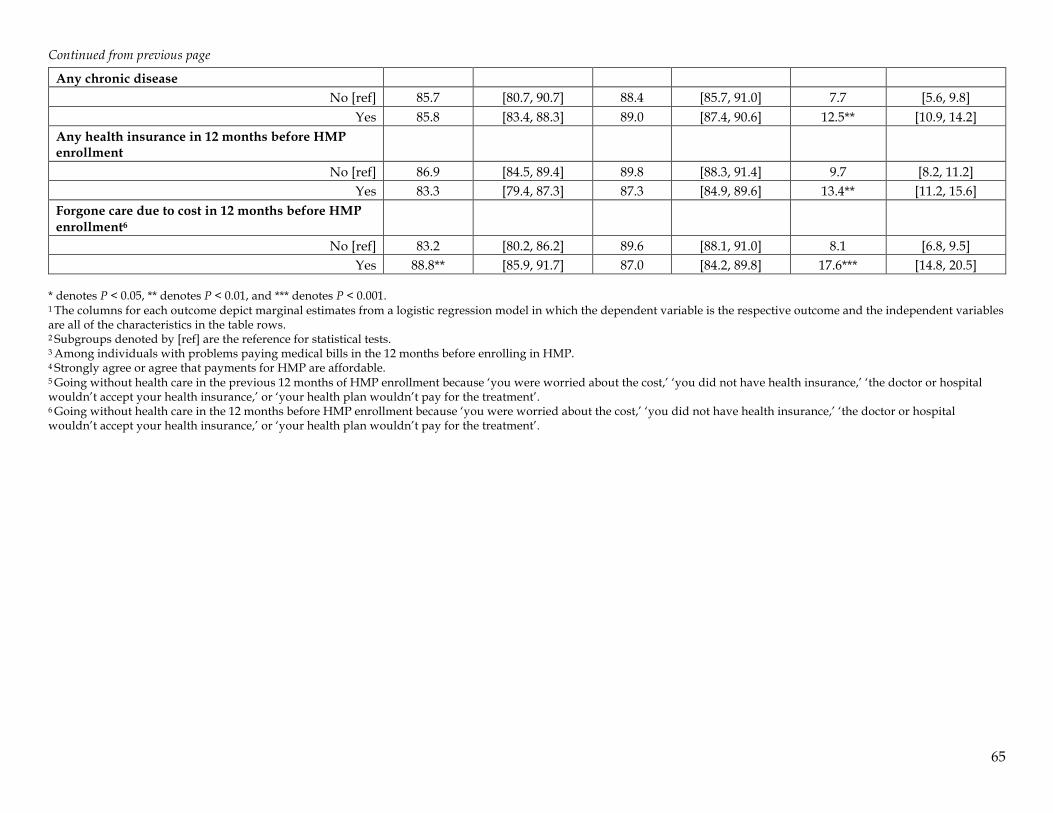
65
Continued from previous page Any chronic disease
No [ref] 85.7 [80.7, 90.7] 88.4 [85.7, 91.0] 7.7 [5.6, 9.8] Yes 85.8 [83.4, 88.3] 89.0 [87.4, 90.6] 12.5** [10.9, 14.2]
Any health insurance in 12 months before HMP enrollment
No [ref] 86.9 [84.5, 89.4] 89.8 [88.3, 91.4] 9.7 [8.2, 11.2] Yes 83.3 [79.4, 87.3] 87.3 [84.9, 89.6] 13.4** [11.2, 15.6]
Forgone care due to cost in 12 months before HMP enrollment6
No [ref] 83.2 [80.2, 86.2] 89.6 [88.1, 91.0] 8.1 [6.8, 9.5] Yes 88.8** [85.9, 91.7] 87.0 [84.2, 89.8] 17.6*** [14.8, 20.5]
* denotes P < 0.05, ** denotes P < 0.01, and *** denotes P < 0.001. 1 The columns for each outcome depict marginal estimates from a logistic regression model in which the dependent variable is the respective outcome and the independent variables are all of the characteristics in the table rows. 2 Subgroups denoted by [ref] are the reference for statistical tests. 3 Among individuals with problems paying medical bills in the 12 months before enrolling in HMP. 4 Strongly agree or agree that payments for HMP are affordable. 5 Going without health care in the previous 12 months of HMP enrollment because ‘you were worried about the cost,’ ‘you did not have health insurance,’ ‘the doctor or hospital wouldn’t accept your health insurance,’ or ‘your health plan wouldn’t pay for the treatment’. 6 Going without health care in the 12 months before HMP enrollment because ‘you were worried about the cost,’ ‘you did not have health insurance,’ ‘the doctor or hospital wouldn’t accept your health insurance,’ or ‘your health plan wouldn’t pay for the treatment’.
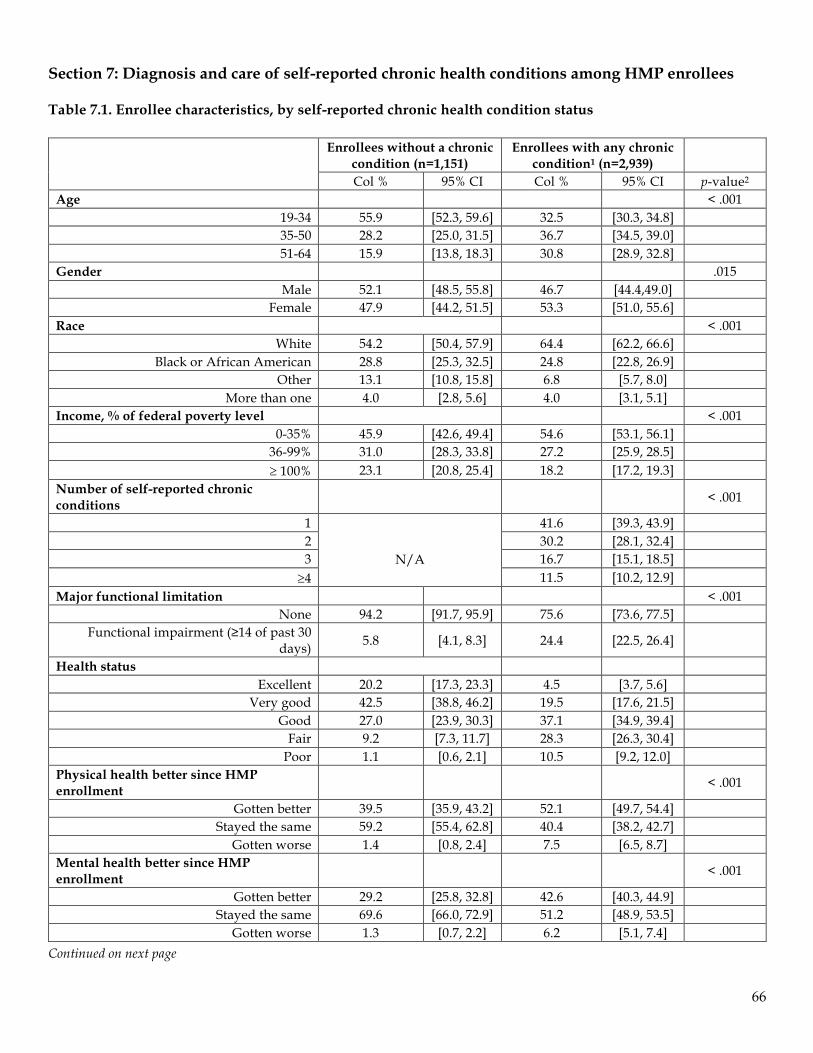
66
Section 7: Diagnosis and care of self-reported chronic health conditions among HMP enrollees Table 7.1. Enrollee characteristics, by self-reported chronic health condition status
Enrollees without a chronic
condition (n=1,151) Enrollees with any chronic
condition1 (n=2,939)
Col % 95% CI Col % 95% CI p-value2 Age < .001
19-34 55.9 [52.3, 59.6] 32.5 [30.3, 34.8] 35-50 28.2 [25.0, 31.5] 36.7 [34.5, 39.0] 51-64 15.9 [13.8, 18.3] 30.8 [28.9, 32.8]
Gender .015 Male 52.1 [48.5, 55.8] 46.7 [44.4,49.0]
Female 47.9 [44.2, 51.5] 53.3 [51.0, 55.6] Race < .001
White 54.2 [50.4, 57.9] 64.4 [62.2, 66.6] Black or African American 28.8 [25.3, 32.5] 24.8 [22.8, 26.9]
Other 13.1 [10.8, 15.8] 6.8 [5.7, 8.0] More than one 4.0 [2.8, 5.6] 4.0 [3.1, 5.1]
Income, % of federal poverty level < .001 0-35% 45.9 [42.6, 49.4] 54.6 [53.1, 56.1]
36-99% 31.0 [28.3, 33.8] 27.2 [25.9, 28.5] ³ 100% 23.1 [20.8, 25.4] 18.2 [17.2, 19.3]
Number of self-reported chronic conditions < .001
1
N/A
41.6 [39.3, 43.9] 2 30.2 [28.1, 32.4] 3 16.7 [15.1, 18.5]
³4 11.5 [10.2, 12.9] Major functional limitation < .001
None 94.2 [91.7, 95.9] 75.6 [73.6, 77.5] Functional impairment (≥14 of past 30
days) 5.8 [4.1, 8.3] 24.4 [22.5, 26.4]
Health status Excellent 20.2 [17.3, 23.3] 4.5 [3.7, 5.6]
Very good 42.5 [38.8, 46.2] 19.5 [17.6, 21.5] Good 27.0 [23.9, 30.3] 37.1 [34.9, 39.4]
Fair 9.2 [7.3, 11.7] 28.3 [26.3, 30.4] Poor 1.1 [0.6, 2.1] 10.5 [9.2, 12.0]
Physical health better since HMP enrollment < .001
Gotten better 39.5 [35.9, 43.2] 52.1 [49.7, 54.4] Stayed the same 59.2 [55.4, 62.8] 40.4 [38.2, 42.7]
Gotten worse 1.4 [0.8, 2.4] 7.5 [6.5, 8.7] Mental health better since HMP enrollment < .001
Gotten better 29.2 [25.8, 32.8] 42.6 [40.3, 44.9] Stayed the same 69.6 [66.0, 72.9] 51.2 [48.9, 53.5]
Gotten worse 1.3 [0.7, 2.2] 6.2 [5.1, 7.4] Continued on next page
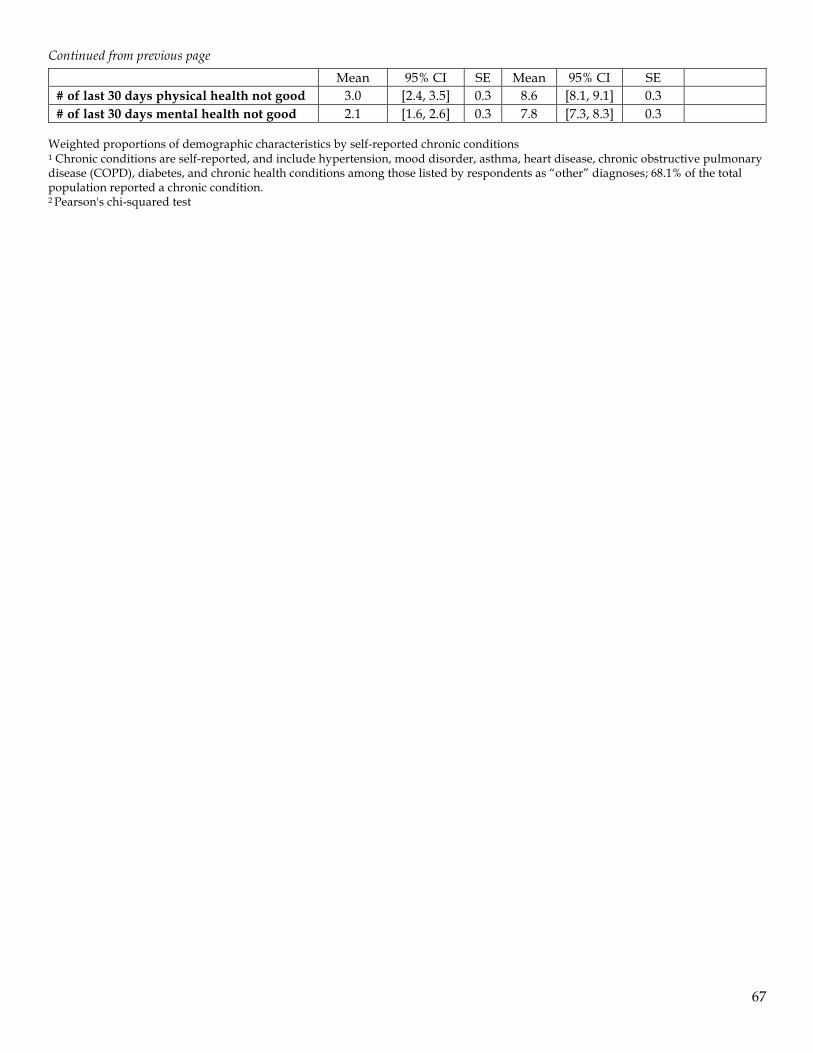
67
Continued from previous page Mean 95% CI SE Mean 95% CI SE # of last 30 days physical health not good 3.0 [2.4, 3.5] 0.3 8.6 [8.1, 9.1] 0.3 # of last 30 days mental health not good 2.1 [1.6, 2.6] 0.3 7.8 [7.3, 8.3] 0.3
Weighted proportions of demographic characteristics by self-reported chronic conditions 1 Chronic conditions are self-reported, and include hypertension, mood disorder, asthma, heart disease, chronic obstructive pulmonary disease (COPD), diabetes, and chronic health conditions among those listed by respondents as “other” diagnoses; 68.1% of the total population reported a chronic condition. 2 Pearson's chi-squared test
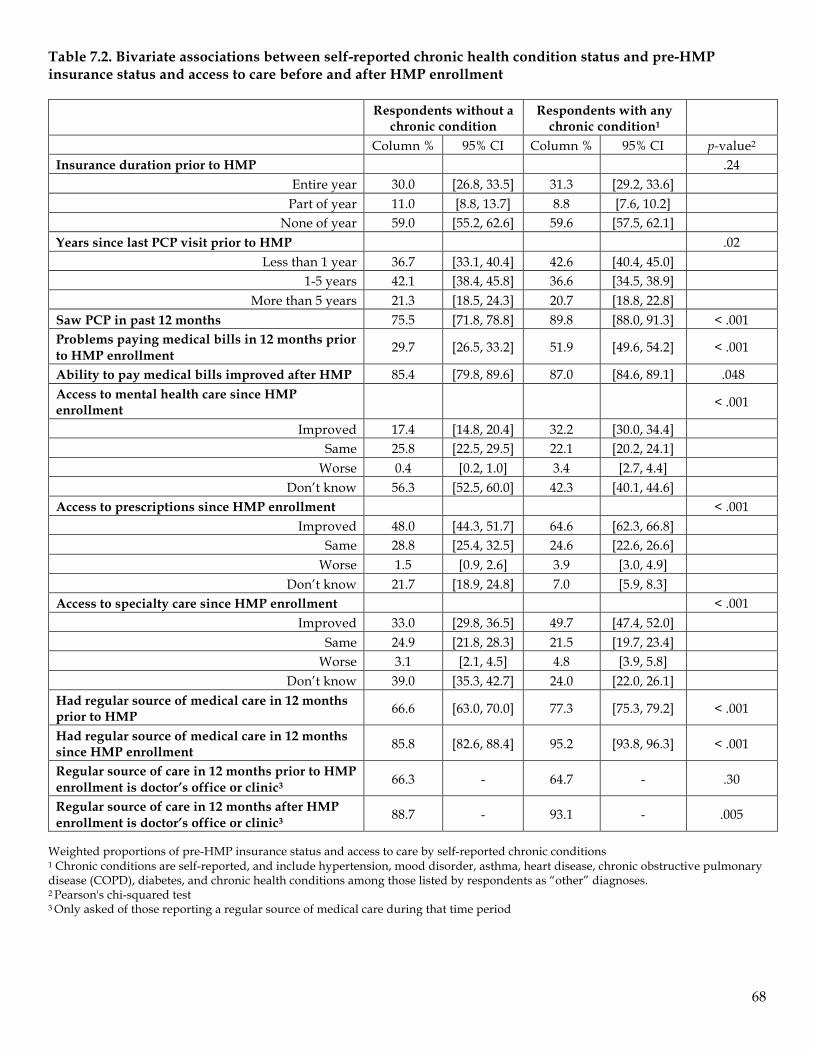
68
Table 7.2. Bivariate associations between self-reported chronic health condition status and pre-HMP insurance status and access to care before and after HMP enrollment
Respondents without a chronic condition
Respondents with any chronic condition1
Column % 95% CI Column % 95% CI p-value2 Insurance duration prior to HMP .24
Entire year 30.0 [26.8, 33.5] 31.3 [29.2, 33.6] Part of year 11.0 [8.8, 13.7] 8.8 [7.6, 10.2]
None of year 59.0 [55.2, 62.6] 59.6 [57.5, 62.1] Years since last PCP visit prior to HMP .02
Less than 1 year 36.7 [33.1, 40.4] 42.6 [40.4, 45.0] 1-5 years 42.1 [38.4, 45.8] 36.6 [34.5, 38.9]
More than 5 years 21.3 [18.5, 24.3] 20.7 [18.8, 22.8] Saw PCP in past 12 months 75.5 [71.8, 78.8] 89.8 [88.0, 91.3] < .001 Problems paying medical bills in 12 months prior to HMP enrollment 29.7 [26.5, 33.2] 51.9 [49.6, 54.2] < .001
Ability to pay medical bills improved after HMP 85.4 [79.8, 89.6] 87.0 [84.6, 89.1] .048 Access to mental health care since HMP enrollment < .001
Improved 17.4 [14.8, 20.4] 32.2 [30.0, 34.4] Same 25.8 [22.5, 29.5] 22.1 [20.2, 24.1] Worse 0.4 [0.2, 1.0] 3.4 [2.7, 4.4]
Don’t know 56.3 [52.5, 60.0] 42.3 [40.1, 44.6] Access to prescriptions since HMP enrollment < .001
Improved 48.0 [44.3, 51.7] 64.6 [62.3, 66.8] Same 28.8 [25.4, 32.5] 24.6 [22.6, 26.6]
Worse 1.5 [0.9, 2.6] 3.9 [3.0, 4.9] Don’t know 21.7 [18.9, 24.8] 7.0 [5.9, 8.3]
Access to specialty care since HMP enrollment < .001 Improved 33.0 [29.8, 36.5] 49.7 [47.4, 52.0]
Same 24.9 [21.8, 28.3] 21.5 [19.7, 23.4] Worse 3.1 [2.1, 4.5] 4.8 [3.9, 5.8]
Don’t know 39.0 [35.3, 42.7] 24.0 [22.0, 26.1] Had regular source of medical care in 12 months prior to HMP 66.6 [63.0, 70.0] 77.3 [75.3, 79.2] < .001
Had regular source of medical care in 12 months since HMP enrollment 85.8 [82.6, 88.4] 95.2 [93.8, 96.3] < .001
Regular source of care in 12 months prior to HMP enrollment is doctor’s office or clinic3 66.3 - 64.7 - .30
Regular source of care in 12 months after HMP enrollment is doctor’s office or clinic3 88.7 - 93.1 - .005
Weighted proportions of pre-HMP insurance status and access to care by self-reported chronic conditions 1 Chronic conditions are self-reported, and include hypertension, mood disorder, asthma, heart disease, chronic obstructive pulmonary disease (COPD), diabetes, and chronic health conditions among those listed by respondents as “other” diagnoses. 2 Pearson's chi-squared test 3 Only asked of those reporting a regular source of medical care during that time period
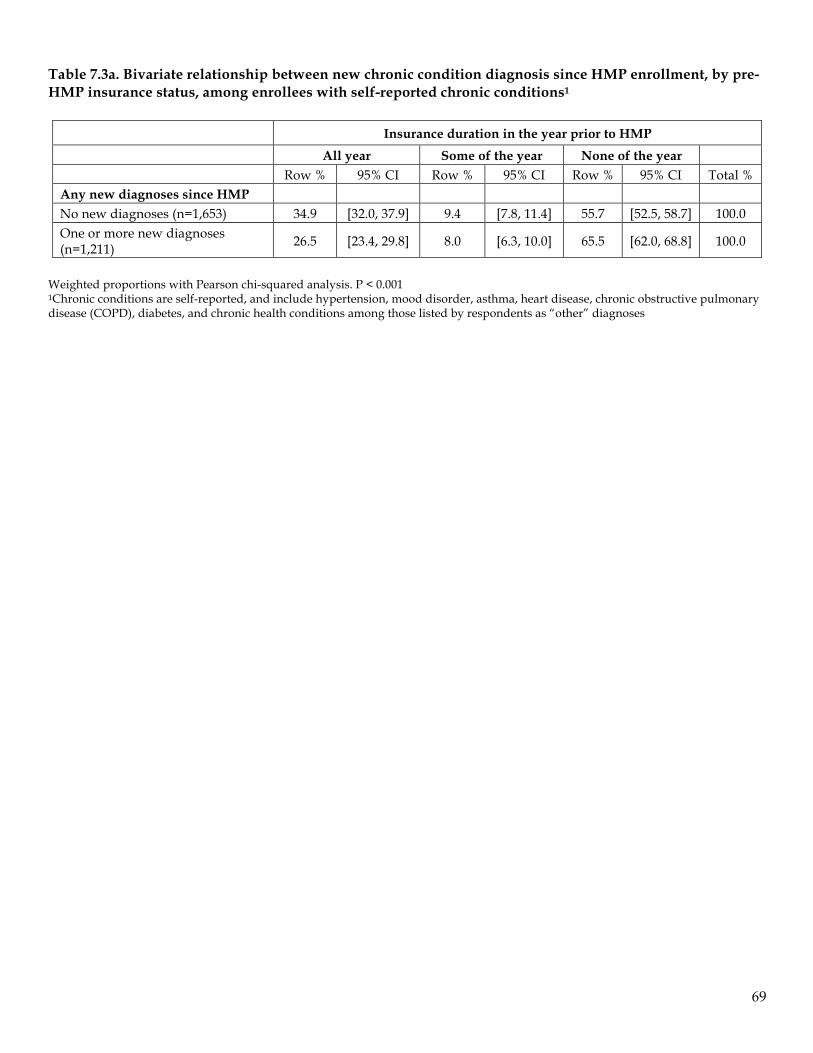
69
Table 7.3a. Bivariate relationship between new chronic condition diagnosis since HMP enrollment, by pre-HMP insurance status, among enrollees with self-reported chronic conditions1
Insurance duration in the year prior to HMP
All year Some of the year None of the year Row % 95% CI Row % 95% CI Row % 95% CI Total % Any new diagnoses since HMP No new diagnoses (n=1,653) 34.9 [32.0, 37.9] 9.4 [7.8, 11.4] 55.7 [52.5, 58.7] 100.0 One or more new diagnoses (n=1,211) 26.5 [23.4, 29.8] 8.0 [6.3, 10.0] 65.5 [62.0, 68.8] 100.0
Weighted proportions with Pearson chi-squared analysis. P < 0.001 1Chronic conditions are self-reported, and include hypertension, mood disorder, asthma, heart disease, chronic obstructive pulmonary disease (COPD), diabetes, and chronic health conditions among those listed by respondents as “other” diagnoses
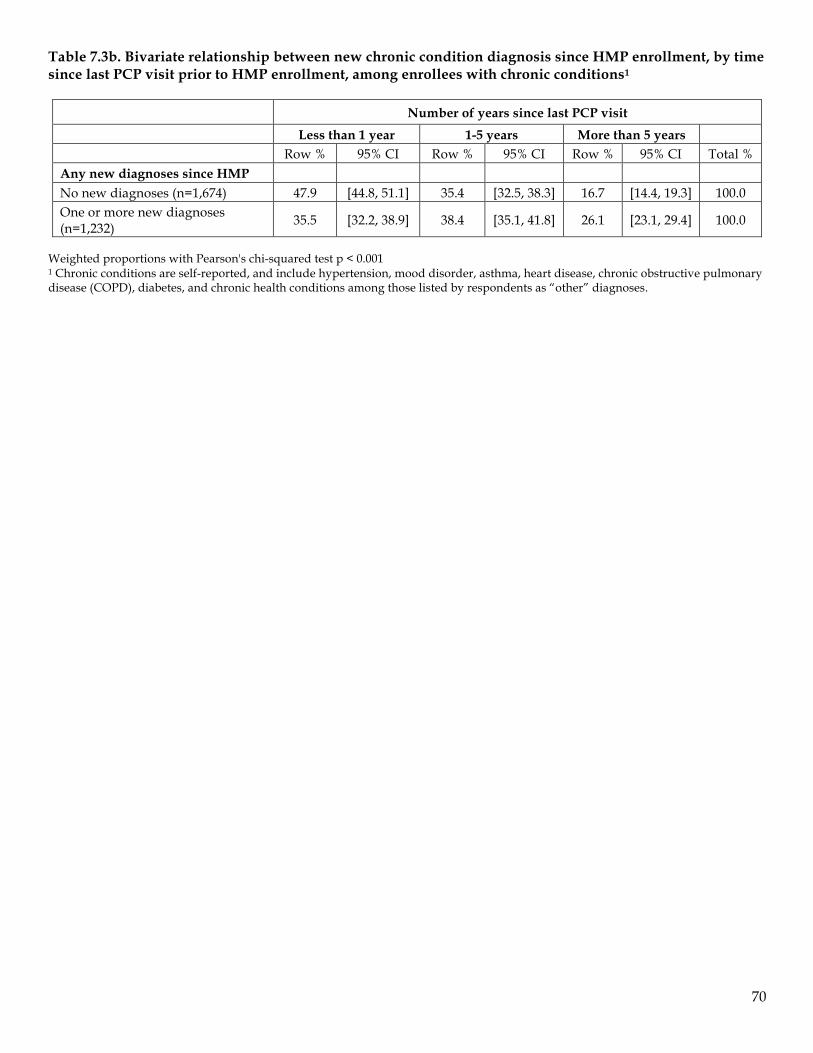
70
Table 7.3b. Bivariate relationship between new chronic condition diagnosis since HMP enrollment, by time since last PCP visit prior to HMP enrollment, among enrollees with chronic conditions1
Number of years since last PCP visit
Less than 1 year 1-5 years More than 5 years Row % 95% CI Row % 95% CI Row % 95% CI Total % Any new diagnoses since HMP No new diagnoses (n=1,674) 47.9 [44.8, 51.1] 35.4 [32.5, 38.3] 16.7 [14.4, 19.3] 100.0 One or more new diagnoses (n=1,232) 35.5 [32.2, 38.9] 38.4 [35.1, 41.8] 26.1 [23.1, 29.4] 100.0
Weighted proportions with Pearson's chi-squared test p < 0.001 1 Chronic conditions are self-reported, and include hypertension, mood disorder, asthma, heart disease, chronic obstructive pulmonary disease (COPD), diabetes, and chronic health conditions among those listed by respondents as “other” diagnoses.
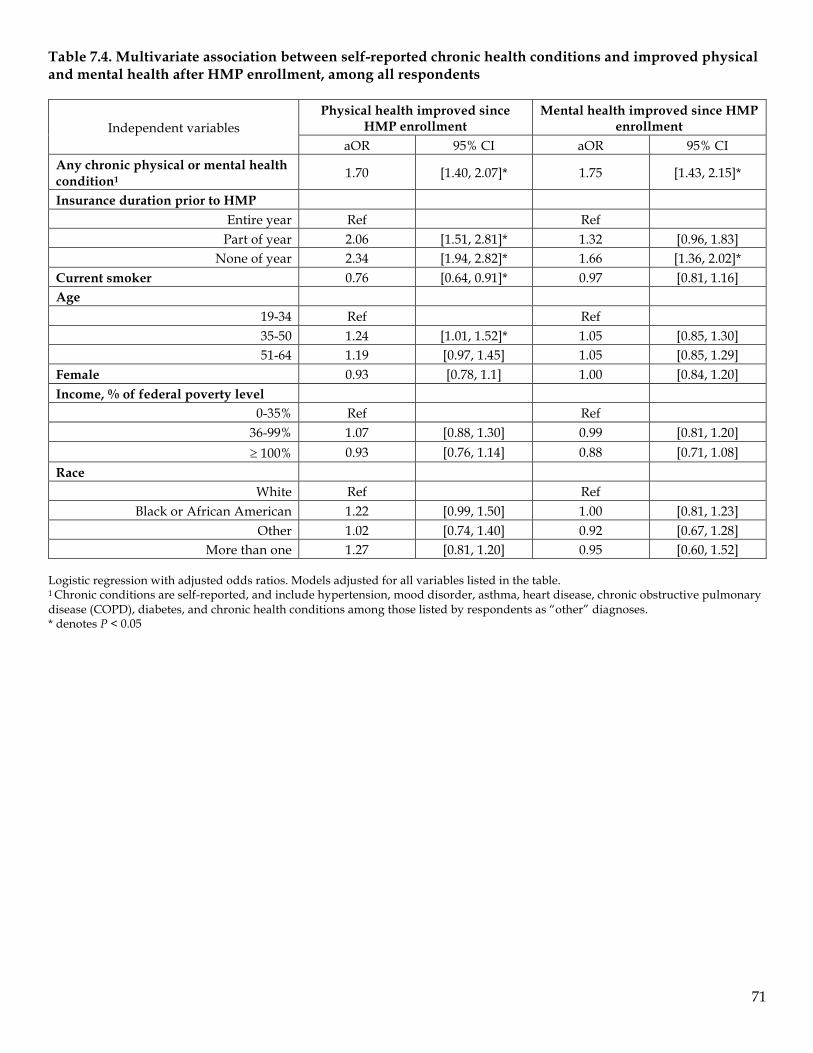
71
Table 7.4. Multivariate association between self-reported chronic health conditions and improved physical and mental health after HMP enrollment, among all respondents
Independent variables Physical health improved since
HMP enrollment Mental health improved since HMP
enrollment aOR 95% CI aOR 95% CI
Any chronic physical or mental health condition1 1.70 [1.40, 2.07]* 1.75 [1.43, 2.15]*
Insurance duration prior to HMP Entire year Ref Ref
Part of year 2.06 [1.51, 2.81]* 1.32 [0.96, 1.83] None of year 2.34 [1.94, 2.82]* 1.66 [1.36, 2.02]*
Current smoker 0.76 [0.64, 0.91]* 0.97 [0.81, 1.16] Age
19-34 Ref Ref 35-50 1.24 [1.01, 1.52]* 1.05 [0.85, 1.30] 51-64 1.19 [0.97, 1.45] 1.05 [0.85, 1.29]
Female 0.93 [0.78, 1.1] 1.00 [0.84, 1.20] Income, % of federal poverty level
0-35% Ref Ref 36-99% 1.07 [0.88, 1.30] 0.99 [0.81, 1.20] ³ 100% 0.93 [0.76, 1.14] 0.88 [0.71, 1.08]
Race White Ref Ref
Black or African American 1.22 [0.99, 1.50] 1.00 [0.81, 1.23] Other 1.02 [0.74, 1.40] 0.92 [0.67, 1.28]
More than one 1.27 [0.81, 1.20] 0.95 [0.60, 1.52] Logistic regression with adjusted odds ratios. Models adjusted for all variables listed in the table. 1 Chronic conditions are self-reported, and include hypertension, mood disorder, asthma, heart disease, chronic obstructive pulmonary disease (COPD), diabetes, and chronic health conditions among those listed by respondents as “other” diagnoses. * denotes P < 0.05
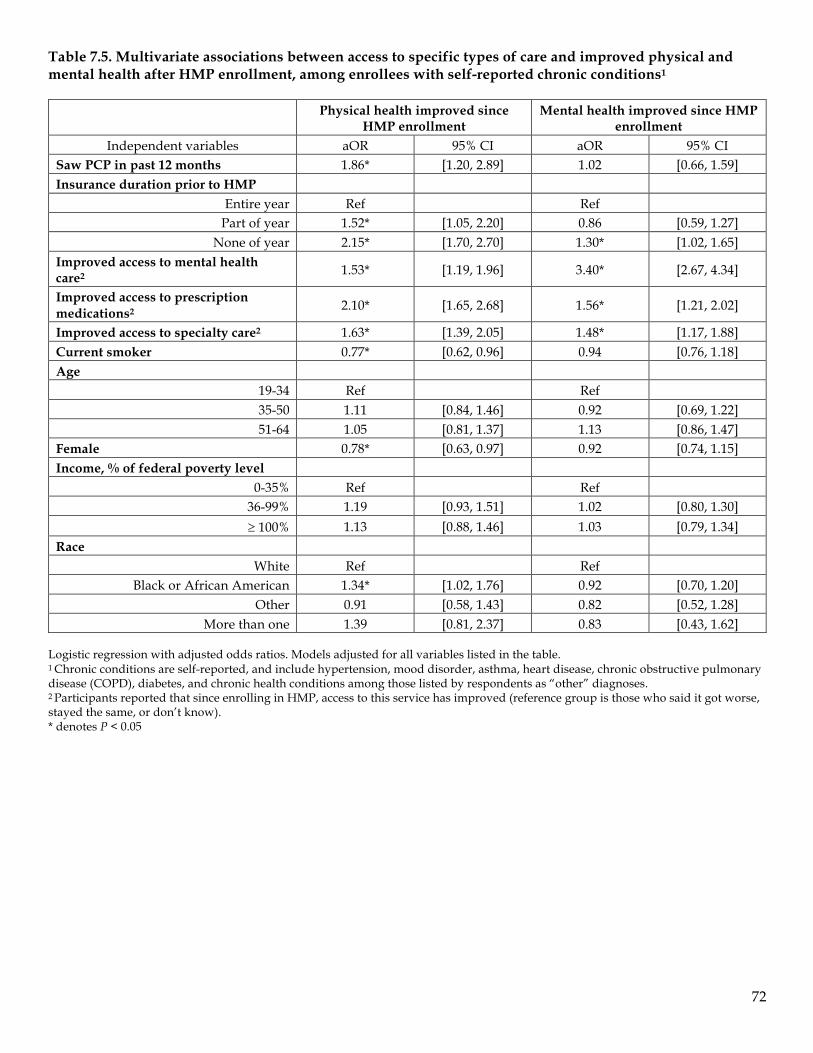
72
Table 7.5. Multivariate associations between access to specific types of care and improved physical and mental health after HMP enrollment, among enrollees with self-reported chronic conditions1
Physical health improved since HMP enrollment
Mental health improved since HMP enrollment
Independent variables aOR 95% CI aOR 95% CI Saw PCP in past 12 months 1.86* [1.20, 2.89] 1.02 [0.66, 1.59] Insurance duration prior to HMP
Entire year Ref Ref Part of year 1.52* [1.05, 2.20] 0.86 [0.59, 1.27]
None of year 2.15* [1.70, 2.70] 1.30* [1.02, 1.65] Improved access to mental health care2 1.53* [1.19, 1.96] 3.40* [2.67, 4.34]
Improved access to prescription medications2 2.10* [1.65, 2.68] 1.56* [1.21, 2.02]
Improved access to specialty care2 1.63* [1.39, 2.05] 1.48* [1.17, 1.88] Current smoker 0.77* [0.62, 0.96] 0.94 [0.76, 1.18] Age
19-34 Ref Ref 35-50 1.11 [0.84, 1.46] 0.92 [0.69, 1.22] 51-64 1.05 [0.81, 1.37] 1.13 [0.86, 1.47]
Female 0.78* [0.63, 0.97] 0.92 [0.74, 1.15] Income, % of federal poverty level
0-35% Ref Ref 36-99% 1.19 [0.93, 1.51] 1.02 [0.80, 1.30] ³ 100% 1.13 [0.88, 1.46] 1.03 [0.79, 1.34]
Race White Ref Ref
Black or African American 1.34* [1.02, 1.76] 0.92 [0.70, 1.20] Other 0.91 [0.58, 1.43] 0.82 [0.52, 1.28]
More than one 1.39 [0.81, 2.37] 0.83 [0.43, 1.62] Logistic regression with adjusted odds ratios. Models adjusted for all variables listed in the table. 1 Chronic conditions are self-reported, and include hypertension, mood disorder, asthma, heart disease, chronic obstructive pulmonary disease (COPD), diabetes, and chronic health conditions among those listed by respondents as “other” diagnoses. 2 Participants reported that since enrolling in HMP, access to this service has improved (reference group is those who said it got worse, stayed the same, or don’t know). * denotes P < 0.05
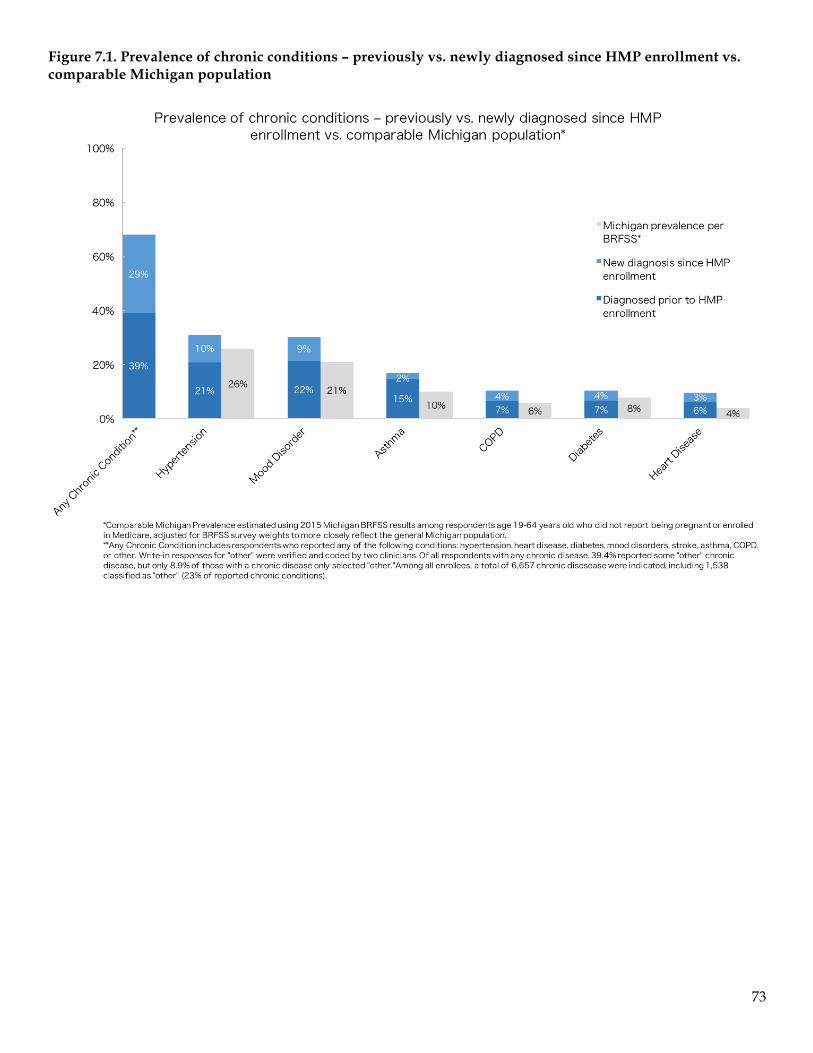
73
Figure 7.1. Prevalence of chronic conditions – previously vs. newly diagnosed since HMP enrollment vs. comparable Michigan population
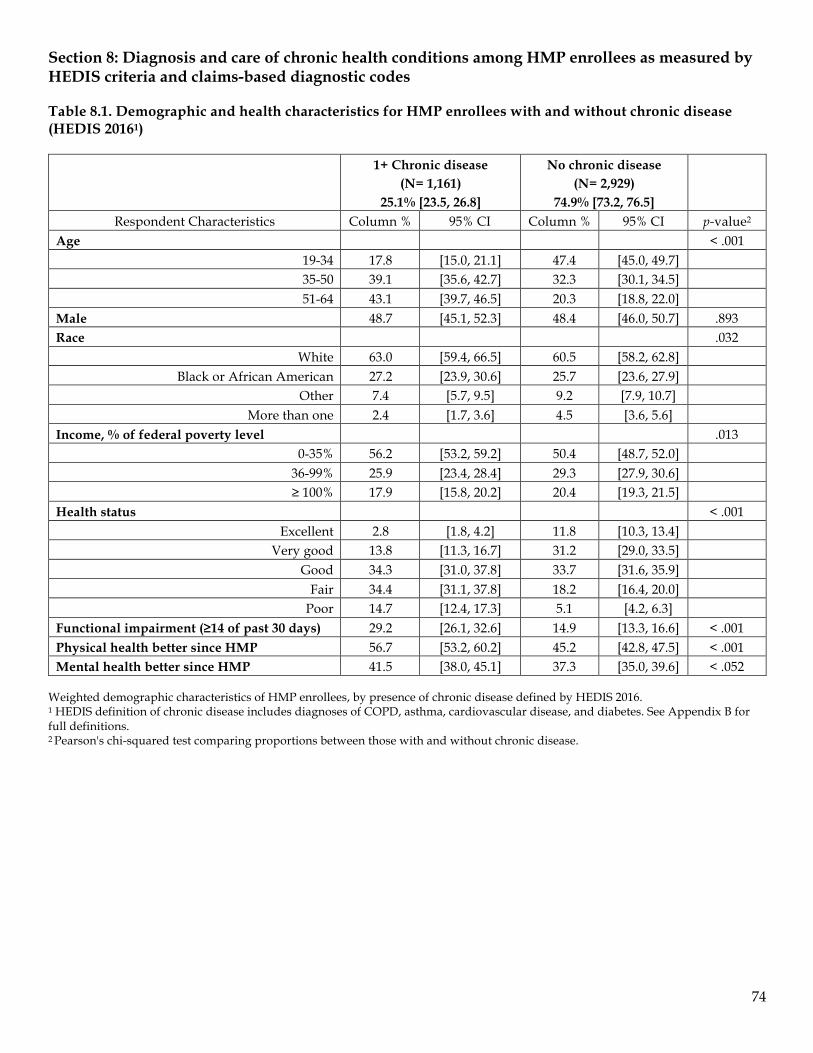
74
Section 8: Diagnosis and care of chronic health conditions among HMP enrollees as measured by HEDIS criteria and claims-based diagnostic codes Table 8.1. Demographic and health characteristics for HMP enrollees with and without chronic disease (HEDIS 20161)
1+ Chronic disease
(N= 1,161) 25.1% [23.5, 26.8]
No chronic disease (N= 2,929)
74.9% [73.2, 76.5]
Respondent Characteristics Column % 95% CI Column % 95% CI p-value2 Age < .001
19-34 17.8 [15.0, 21.1] 47.4 [45.0, 49.7] 35-50 39.1 [35.6, 42.7] 32.3 [30.1, 34.5] 51-64 43.1 [39.7, 46.5] 20.3 [18.8, 22.0]
Male 48.7 [45.1, 52.3] 48.4 [46.0, 50.7] .893 Race .032
White 63.0 [59.4, 66.5] 60.5 [58.2, 62.8] Black or African American 27.2 [23.9, 30.6] 25.7 [23.6, 27.9]
Other 7.4 [5.7, 9.5] 9.2 [7.9, 10.7] More than one 2.4 [1.7, 3.6] 4.5 [3.6, 5.6]
Income, % of federal poverty level .013 0-35% 56.2 [53.2, 59.2] 50.4 [48.7, 52.0]
36-99% 25.9 [23.4, 28.4] 29.3 [27.9, 30.6] ≥ 100% 17.9 [15.8, 20.2] 20.4 [19.3, 21.5]
Health status < .001 Excellent 2.8 [1.8, 4.2] 11.8 [10.3, 13.4]
Very good 13.8 [11.3, 16.7] 31.2 [29.0, 33.5] Good 34.3 [31.0, 37.8] 33.7 [31.6, 35.9]
Fair 34.4 [31.1, 37.8] 18.2 [16.4, 20.0] Poor 14.7 [12.4, 17.3] 5.1 [4.2, 6.3]
Functional impairment (≥14 of past 30 days) 29.2 [26.1, 32.6] 14.9 [13.3, 16.6] < .001 Physical health better since HMP 56.7 [53.2, 60.2] 45.2 [42.8, 47.5] < .001 Mental health better since HMP 41.5 [38.0, 45.1] 37.3 [35.0, 39.6] < .052
Weighted demographic characteristics of HMP enrollees, by presence of chronic disease defined by HEDIS 2016. 1 HEDIS definition of chronic disease includes diagnoses of COPD, asthma, cardiovascular disease, and diabetes. See Appendix B for full definitions. 2 Pearson's chi-squared test comparing proportions between those with and without chronic disease.
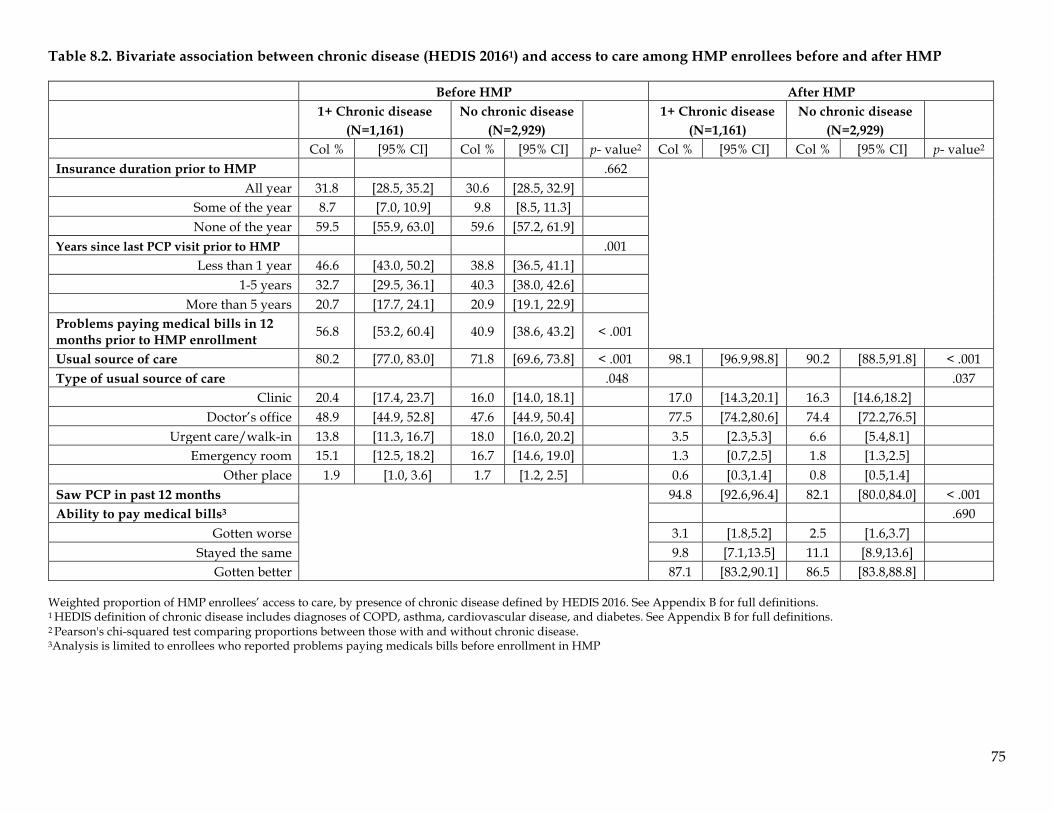
75
Table 8.2. Bivariate association between chronic disease (HEDIS 20161) and access to care among HMP enrollees before and after HMP
Before HMP After HMP
1+ Chronic disease
(N=1,161) No chronic disease
(N=2,929)
1+ Chronic disease (N=1,161)
No chronic disease (N=2,929)
Col % [95% CI] Col % [95% CI] p- value2 Col % [95% CI] Col % [95% CI] p- value2 Insurance duration prior to HMP .662
All year 31.8 [28.5, 35.2] 30.6 [28.5, 32.9] Some of the year 8.7 [7.0, 10.9] 9.8 [8.5, 11.3] None of the year 59.5 [55.9, 63.0] 59.6 [57.2, 61.9]
Years since last PCP visit prior to HMP .001 Less than 1 year 46.6 [43.0, 50.2] 38.8 [36.5, 41.1]
1-5 years 32.7 [29.5, 36.1] 40.3 [38.0, 42.6] More than 5 years 20.7 [17.7, 24.1] 20.9 [19.1, 22.9]
Problems paying medical bills in 12 months prior to HMP enrollment 56.8 [53.2, 60.4] 40.9 [38.6, 43.2] < .001
Usual source of care 80.2 [77.0, 83.0] 71.8 [69.6, 73.8] < .001 98.1 [96.9,98.8] 90.2 [88.5,91.8] < .001 Type of usual source of care .048 .037
Clinic 20.4 [17.4, 23.7] 16.0 [14.0, 18.1] 17.0 [14.3,20.1] 16.3 [14.6,18.2] Doctor’s office 48.9 [44.9, 52.8] 47.6 [44.9, 50.4] 77.5 [74.2,80.6] 74.4 [72.2,76.5]
Urgent care/walk-in 13.8 [11.3, 16.7] 18.0 [16.0, 20.2] 3.5 [2.3,5.3] 6.6 [5.4,8.1] Emergency room 15.1 [12.5, 18.2] 16.7 [14.6, 19.0] 1.3 [0.7,2.5] 1.8 [1.3,2.5]
Other place 1.9 [1.0, 3.6] 1.7 [1.2, 2.5] 0.6 [0.3,1.4] 0.8 [0.5,1.4] Saw PCP in past 12 months
94.8 [92.6,96.4] 82.1 [80.0,84.0] < .001 Ability to pay medical bills3 .690
Gotten worse 3.1 [1.8,5.2] 2.5 [1.6,3.7] Stayed the same 9.8 [7.1,13.5] 11.1 [8.9,13.6]
Gotten better 87.1 [83.2,90.1] 86.5 [83.8,88.8] Weighted proportion of HMP enrollees’ access to care, by presence of chronic disease defined by HEDIS 2016. See Appendix B for full definitions. 1 HEDIS definition of chronic disease includes diagnoses of COPD, asthma, cardiovascular disease, and diabetes. See Appendix B for full definitions. 2 Pearson's chi-squared test comparing proportions between those with and without chronic disease. 3Analysis is limited to enrollees who reported problems paying medicals bills before enrollment in HMP
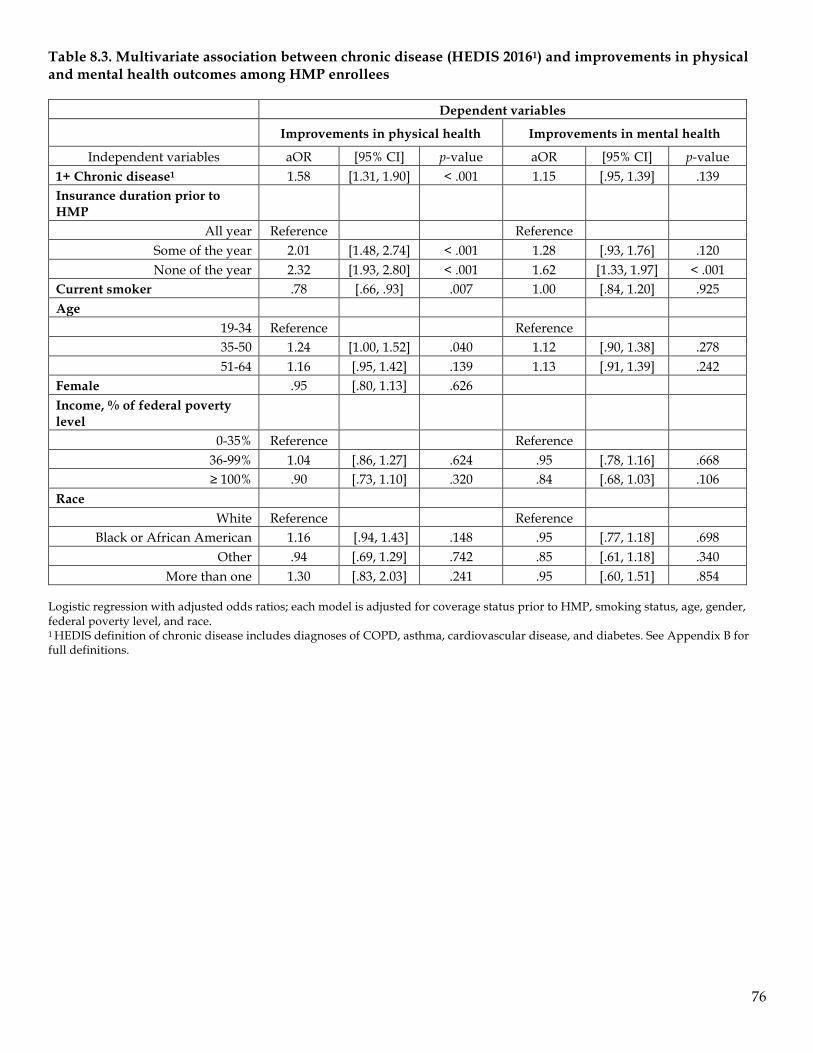
76
Table 8.3. Multivariate association between chronic disease (HEDIS 20161) and improvements in physical and mental health outcomes among HMP enrollees
Dependent variables Improvements in physical health Improvements in mental health
Independent variables aOR [95% CI] p-value aOR [95% CI] p-value 1+ Chronic disease1 1.58 [1.31, 1.90] < .001 1.15 [.95, 1.39] .139 Insurance duration prior to HMP
All year Reference Reference Some of the year 2.01 [1.48, 2.74] < .001 1.28 [.93, 1.76] .120 None of the year 2.32 [1.93, 2.80] < .001 1.62 [1.33, 1.97] < .001
Current smoker .78 [.66, .93] .007 1.00 [.84, 1.20] .925 Age
19-34 Reference Reference 35-50 1.24 [1.00, 1.52] .040 1.12 [.90, 1.38] .278 51-64 1.16 [.95, 1.42] .139 1.13 [.91, 1.39] .242
Female .95 [.80, 1.13] .626 Income, % of federal poverty level
0-35% Reference Reference 36-99% 1.04 [.86, 1.27] .624 .95 [.78, 1.16] .668 ≥ 100% .90 [.73, 1.10] .320 .84 [.68, 1.03] .106
Race White Reference Reference
Black or African American 1.16 [.94, 1.43] .148 .95 [.77, 1.18] .698 Other .94 [.69, 1.29] .742 .85 [.61, 1.18] .340
More than one 1.30 [.83, 2.03] .241 .95 [.60, 1.51] .854 Logistic regression with adjusted odds ratios; each model is adjusted for coverage status prior to HMP, smoking status, age, gender, federal poverty level, and race. 1 HEDIS definition of chronic disease includes diagnoses of COPD, asthma, cardiovascular disease, and diabetes. See Appendix B for full definitions.
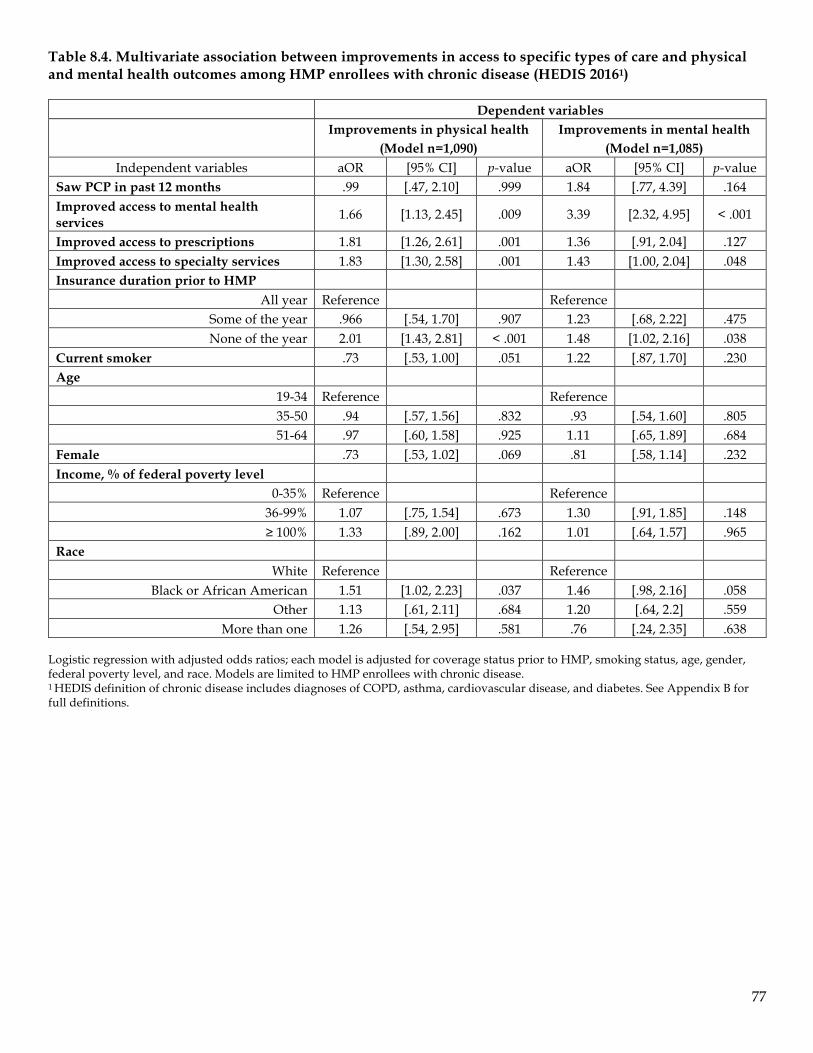
77
Table 8.4. Multivariate association between improvements in access to specific types of care and physical and mental health outcomes among HMP enrollees with chronic disease (HEDIS 20161)
Dependent variables
Improvements in physical health (Model n=1,090)
Improvements in mental health (Model n=1,085)
Independent variables aOR [95% CI] p-value aOR [95% CI] p-value Saw PCP in past 12 months .99 [.47, 2.10] .999 1.84 [.77, 4.39] .164 Improved access to mental health services 1.66 [1.13, 2.45] .009 3.39 [2.32, 4.95] < .001
Improved access to prescriptions 1.81 [1.26, 2.61] .001 1.36 [.91, 2.04] .127 Improved access to specialty services 1.83 [1.30, 2.58] .001 1.43 [1.00, 2.04] .048 Insurance duration prior to HMP
All year Reference Reference Some of the year .966 [.54, 1.70] .907 1.23 [.68, 2.22] .475 None of the year 2.01 [1.43, 2.81] < .001 1.48 [1.02, 2.16] .038
Current smoker .73 [.53, 1.00] .051 1.22 [.87, 1.70] .230 Age
19-34 Reference Reference 35-50 .94 [.57, 1.56] .832 .93 [.54, 1.60] .805 51-64 .97 [.60, 1.58] .925 1.11 [.65, 1.89] .684
Female .73 [.53, 1.02] .069 .81 [.58, 1.14] .232 Income, % of federal poverty level
0-35% Reference Reference 36-99% 1.07 [.75, 1.54] .673 1.30 [.91, 1.85] .148 ≥ 100% 1.33 [.89, 2.00] .162 1.01 [.64, 1.57] .965
Race White Reference Reference
Black or African American 1.51 [1.02, 2.23] .037 1.46 [.98, 2.16] .058 Other 1.13 [.61, 2.11] .684 1.20 [.64, 2.2] .559
More than one 1.26 [.54, 2.95] .581 .76 [.24, 2.35] .638 Logistic regression with adjusted odds ratios; each model is adjusted for coverage status prior to HMP, smoking status, age, gender, federal poverty level, and race. Models are limited to HMP enrollees with chronic disease. 1 HEDIS definition of chronic disease includes diagnoses of COPD, asthma, cardiovascular disease, and diabetes. See Appendix B for full definitions.
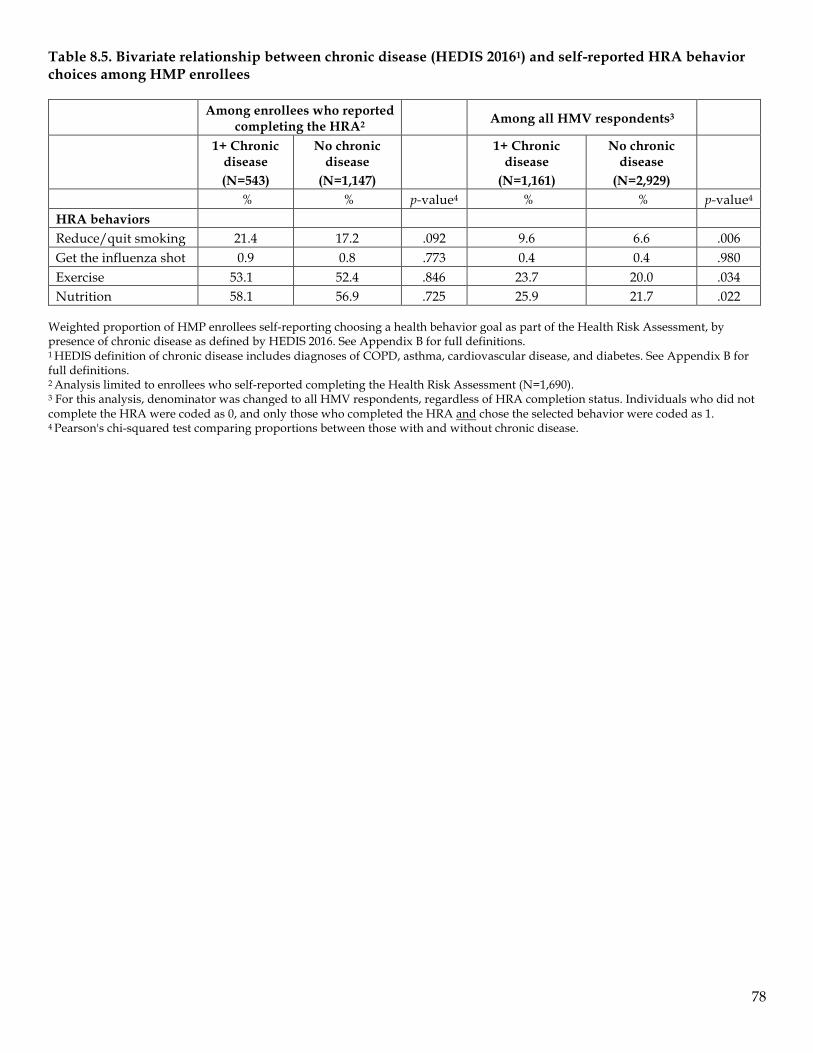
78
Table 8.5. Bivariate relationship between chronic disease (HEDIS 20161) and self-reported HRA behavior choices among HMP enrollees
Among enrollees who reported completing the HRA2 Among all HMV respondents3
1+ Chronic
disease (N=543)
No chronic disease
(N=1,147)
1+ Chronic disease
(N=1,161)
No chronic disease
(N=2,929)
% % p-value4 % % p-value4 HRA behaviors Reduce/quit smoking 21.4 17.2 .092 9.6 6.6 .006 Get the influenza shot 0.9 0.8 .773 0.4 0.4 .980 Exercise 53.1 52.4 .846 23.7 20.0 .034 Nutrition 58.1 56.9 .725 25.9 21.7 .022
Weighted proportion of HMP enrollees self-reporting choosing a health behavior goal as part of the Health Risk Assessment, by presence of chronic disease as defined by HEDIS 2016. See Appendix B for full definitions. 1 HEDIS definition of chronic disease includes diagnoses of COPD, asthma, cardiovascular disease, and diabetes. See Appendix B for full definitions. 2 Analysis limited to enrollees who self-reported completing the Health Risk Assessment (N=1,690). 3 For this analysis, denominator was changed to all HMV respondents, regardless of HRA completion status. Individuals who did not complete the HRA were coded as 0, and only those who completed the HRA and chose the selected behavior were coded as 1. 4 Pearson's chi-squared test comparing proportions between those with and without chronic disease.
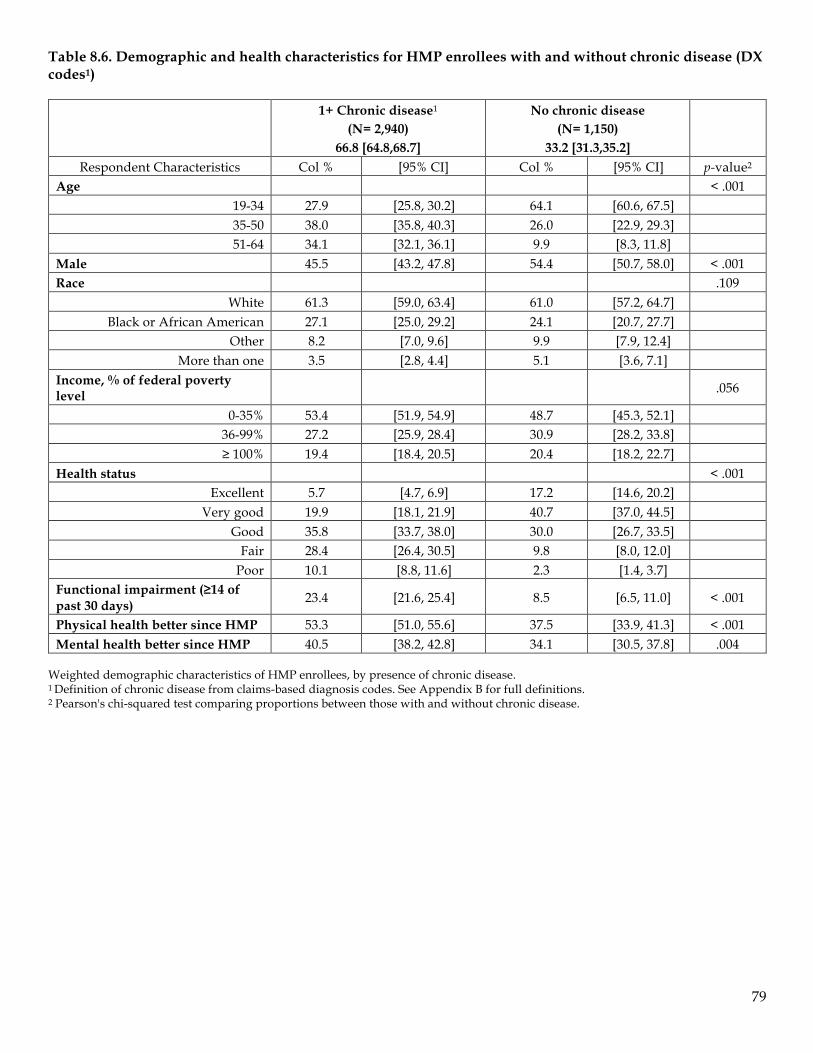
79
Table 8.6. Demographic and health characteristics for HMP enrollees with and without chronic disease (DX codes1)
1+ Chronic disease1
(N= 2,940) 66.8 [64.8,68.7]
No chronic disease (N= 1,150)
33.2 [31.3,35.2]
Respondent Characteristics Col % [95% CI] Col % [95% CI] p-value2 Age < .001
19-34 27.9 [25.8, 30.2] 64.1 [60.6, 67.5] 35-50 38.0 [35.8, 40.3] 26.0 [22.9, 29.3] 51-64 34.1 [32.1, 36.1] 9.9 [8.3, 11.8]
Male 45.5 [43.2, 47.8] 54.4 [50.7, 58.0] < .001 Race .109
White 61.3 [59.0, 63.4] 61.0 [57.2, 64.7] Black or African American 27.1 [25.0, 29.2] 24.1 [20.7, 27.7]
Other 8.2 [7.0, 9.6] 9.9 [7.9, 12.4] More than one 3.5 [2.8, 4.4] 5.1 [3.6, 7.1]
Income, % of federal poverty level .056
0-35% 53.4 [51.9, 54.9] 48.7 [45.3, 52.1] 36-99% 27.2 [25.9, 28.4] 30.9 [28.2, 33.8] ≥ 100% 19.4 [18.4, 20.5] 20.4 [18.2, 22.7]
Health status < .001 Excellent 5.7 [4.7, 6.9] 17.2 [14.6, 20.2]
Very good 19.9 [18.1, 21.9] 40.7 [37.0, 44.5] Good 35.8 [33.7, 38.0] 30.0 [26.7, 33.5]
Fair 28.4 [26.4, 30.5] 9.8 [8.0, 12.0] Poor 10.1 [8.8, 11.6] 2.3 [1.4, 3.7]
Functional impairment (≥14 of past 30 days) 23.4 [21.6, 25.4] 8.5 [6.5, 11.0] < .001
Physical health better since HMP 53.3 [51.0, 55.6] 37.5 [33.9, 41.3] < .001 Mental health better since HMP 40.5 [38.2, 42.8] 34.1 [30.5, 37.8] .004
Weighted demographic characteristics of HMP enrollees, by presence of chronic disease. 1 Definition of chronic disease from claims-based diagnosis codes. See Appendix B for full definitions. 2 Pearson's chi-squared test comparing proportions between those with and without chronic disease.
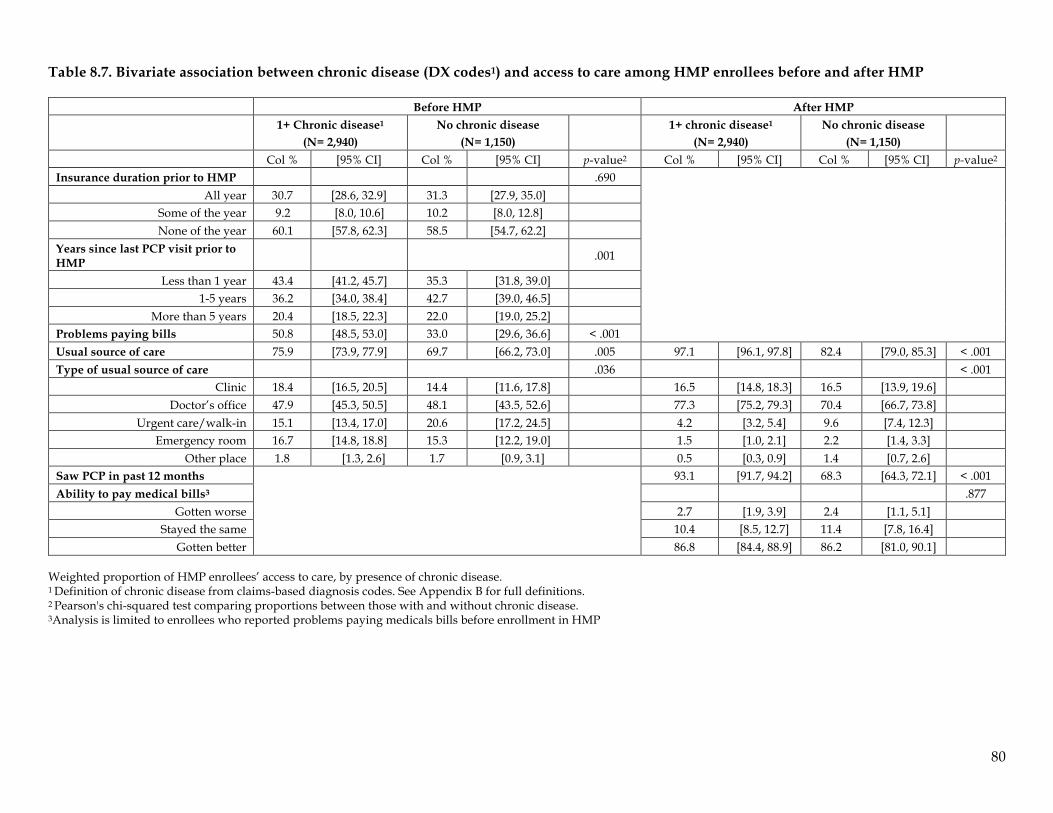
80
Table 8.7. Bivariate association between chronic disease (DX codes1) and access to care among HMP enrollees before and after HMP
Before HMP After HMP
1+ Chronic disease1
(N= 2,940) No chronic disease
(N= 1,150)
1+ chronic disease1
(N= 2,940) No chronic disease
(N= 1,150)
Col % [95% CI] Col % [95% CI] p-value2 Col % [95% CI] Col % [95% CI] p-value2 Insurance duration prior to HMP .690
All year 30.7 [28.6, 32.9] 31.3 [27.9, 35.0] Some of the year 9.2 [8.0, 10.6] 10.2 [8.0, 12.8] None of the year 60.1 [57.8, 62.3] 58.5 [54.7, 62.2]
Years since last PCP visit prior to HMP .001
Less than 1 year 43.4 [41.2, 45.7] 35.3 [31.8, 39.0] 1-5 years 36.2 [34.0, 38.4] 42.7 [39.0, 46.5]
More than 5 years 20.4 [18.5, 22.3] 22.0 [19.0, 25.2] Problems paying bills 50.8 [48.5, 53.0] 33.0 [29.6, 36.6] < .001 Usual source of care 75.9 [73.9, 77.9] 69.7 [66.2, 73.0] .005 97.1 [96.1, 97.8] 82.4 [79.0, 85.3] < .001 Type of usual source of care .036 < .001
Clinic 18.4 [16.5, 20.5] 14.4 [11.6, 17.8] 16.5 [14.8, 18.3] 16.5 [13.9, 19.6] Doctor’s office 47.9 [45.3, 50.5] 48.1 [43.5, 52.6] 77.3 [75.2, 79.3] 70.4 [66.7, 73.8]
Urgent care/walk-in 15.1 [13.4, 17.0] 20.6 [17.2, 24.5] 4.2 [3.2, 5.4] 9.6 [7.4, 12.3] Emergency room 16.7 [14.8, 18.8] 15.3 [12.2, 19.0] 1.5 [1.0, 2.1] 2.2 [1.4, 3.3]
Other place 1.8 [1.3, 2.6] 1.7 [0.9, 3.1] 0.5 [0.3, 0.9] 1.4 [0.7, 2.6] Saw PCP in past 12 months
93.1 [91.7, 94.2] 68.3 [64.3, 72.1] < .001 Ability to pay medical bills3 .877
Gotten worse 2.7 [1.9, 3.9] 2.4 [1.1, 5.1] Stayed the same 10.4 [8.5, 12.7] 11.4 [7.8, 16.4]
Gotten better 86.8 [84.4, 88.9] 86.2 [81.0, 90.1] Weighted proportion of HMP enrollees’ access to care, by presence of chronic disease. 1 Definition of chronic disease from claims-based diagnosis codes. See Appendix B for full definitions. 2 Pearson's chi-squared test comparing proportions between those with and without chronic disease. 3Analysis is limited to enrollees who reported problems paying medicals bills before enrollment in HMP
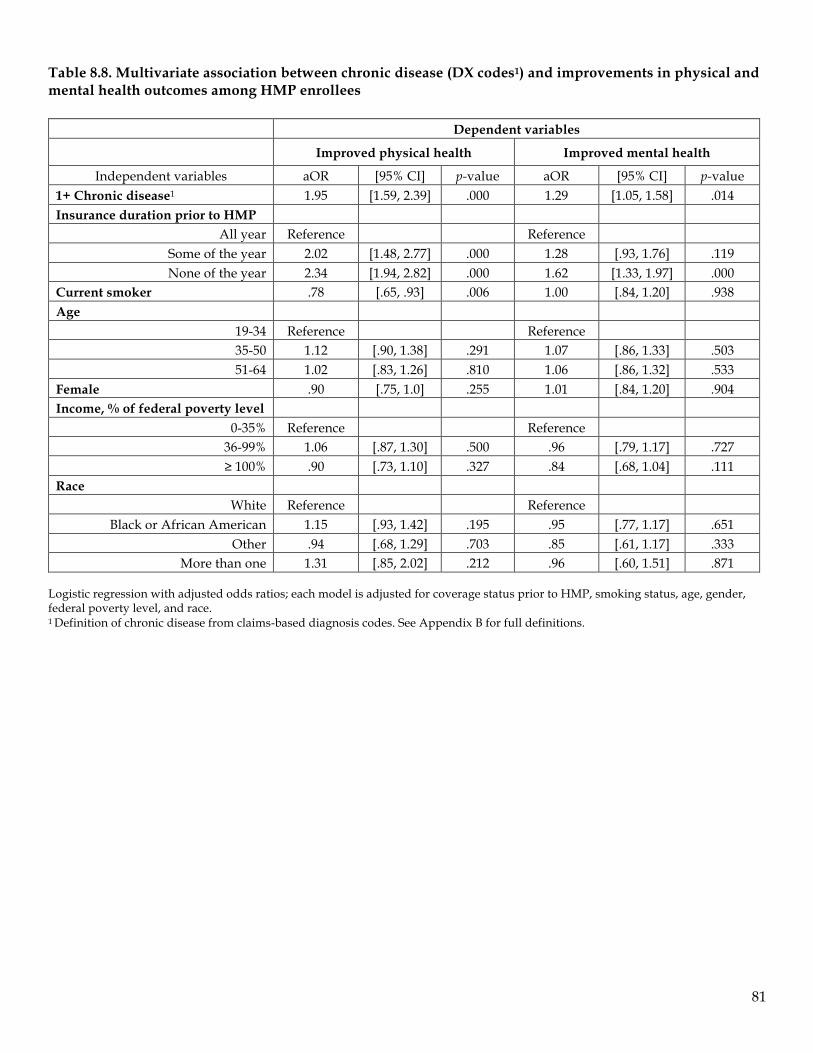
81
Table 8.8. Multivariate association between chronic disease (DX codes1) and improvements in physical and mental health outcomes among HMP enrollees
Dependent variables Improved physical health Improved mental health
Independent variables aOR [95% CI] p-value aOR [95% CI] p-value 1+ Chronic disease1 1.95 [1.59, 2.39] .000 1.29 [1.05, 1.58] .014 Insurance duration prior to HMP
All year Reference Reference Some of the year 2.02 [1.48, 2.77] .000 1.28 [.93, 1.76] .119 None of the year 2.34 [1.94, 2.82] .000 1.62 [1.33, 1.97] .000
Current smoker .78 [.65, .93] .006 1.00 [.84, 1.20] .938 Age
19-34 Reference Reference 35-50 1.12 [.90, 1.38] .291 1.07 [.86, 1.33] .503 51-64 1.02 [.83, 1.26] .810 1.06 [.86, 1.32] .533
Female .90 [.75, 1.0] .255 1.01 [.84, 1.20] .904 Income, % of federal poverty level
0-35% Reference Reference 36-99% 1.06 [.87, 1.30] .500 .96 [.79, 1.17] .727 ≥ 100% .90 [.73, 1.10] .327 .84 [.68, 1.04] .111
Race White Reference Reference
Black or African American 1.15 [.93, 1.42] .195 .95 [.77, 1.17] .651 Other .94 [.68, 1.29] .703 .85 [.61, 1.17] .333
More than one 1.31 [.85, 2.02] .212 .96 [.60, 1.51] .871 Logistic regression with adjusted odds ratios; each model is adjusted for coverage status prior to HMP, smoking status, age, gender, federal poverty level, and race. 1 Definition of chronic disease from claims-based diagnosis codes. See Appendix B for full definitions.
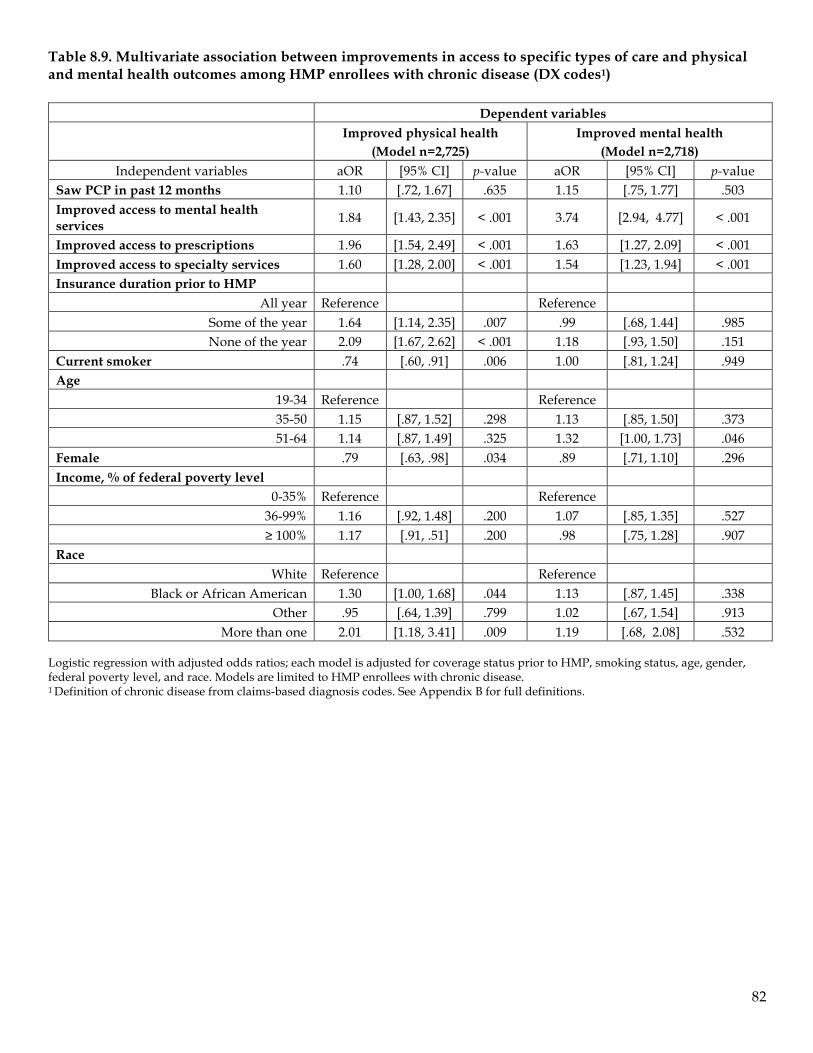
82
Table 8.9. Multivariate association between improvements in access to specific types of care and physical and mental health outcomes among HMP enrollees with chronic disease (DX codes1)
Dependent variables
Improved physical health
(Model n=2,725) Improved mental health
(Model n=2,718) Independent variables aOR [95% CI] p-value aOR [95% CI] p-value
Saw PCP in past 12 months 1.10 [.72, 1.67] .635 1.15 [.75, 1.77] .503 Improved access to mental health services 1.84 [1.43, 2.35] < .001 3.74 [2.94, 4.77] < .001
Improved access to prescriptions 1.96 [1.54, 2.49] < .001 1.63 [1.27, 2.09] < .001 Improved access to specialty services 1.60 [1.28, 2.00] < .001 1.54 [1.23, 1.94] < .001 Insurance duration prior to HMP
All year Reference Reference Some of the year 1.64 [1.14, 2.35] .007 .99 [.68, 1.44] .985 None of the year 2.09 [1.67, 2.62] < .001 1.18 [.93, 1.50] .151
Current smoker .74 [.60, .91] .006 1.00 [.81, 1.24] .949 Age
19-34 Reference Reference 35-50 1.15 [.87, 1.52] .298 1.13 [.85, 1.50] .373 51-64 1.14 [.87, 1.49] .325 1.32 [1.00, 1.73] .046
Female .79 [.63, .98] .034 .89 [.71, 1.10] .296 Income, % of federal poverty level
0-35% Reference Reference 36-99% 1.16 [.92, 1.48] .200 1.07 [.85, 1.35] .527 ≥ 100% 1.17 [.91, .51] .200 .98 [.75, 1.28] .907
Race White Reference Reference
Black or African American 1.30 [1.00, 1.68] .044 1.13 [.87, 1.45] .338 Other .95 [.64, 1.39] .799 1.02 [.67, 1.54] .913
More than one 2.01 [1.18, 3.41] .009 1.19 [.68, 2.08] .532 Logistic regression with adjusted odds ratios; each model is adjusted for coverage status prior to HMP, smoking status, age, gender, federal poverty level, and race. Models are limited to HMP enrollees with chronic disease. 1 Definition of chronic disease from claims-based diagnosis codes. See Appendix B for full definitions.
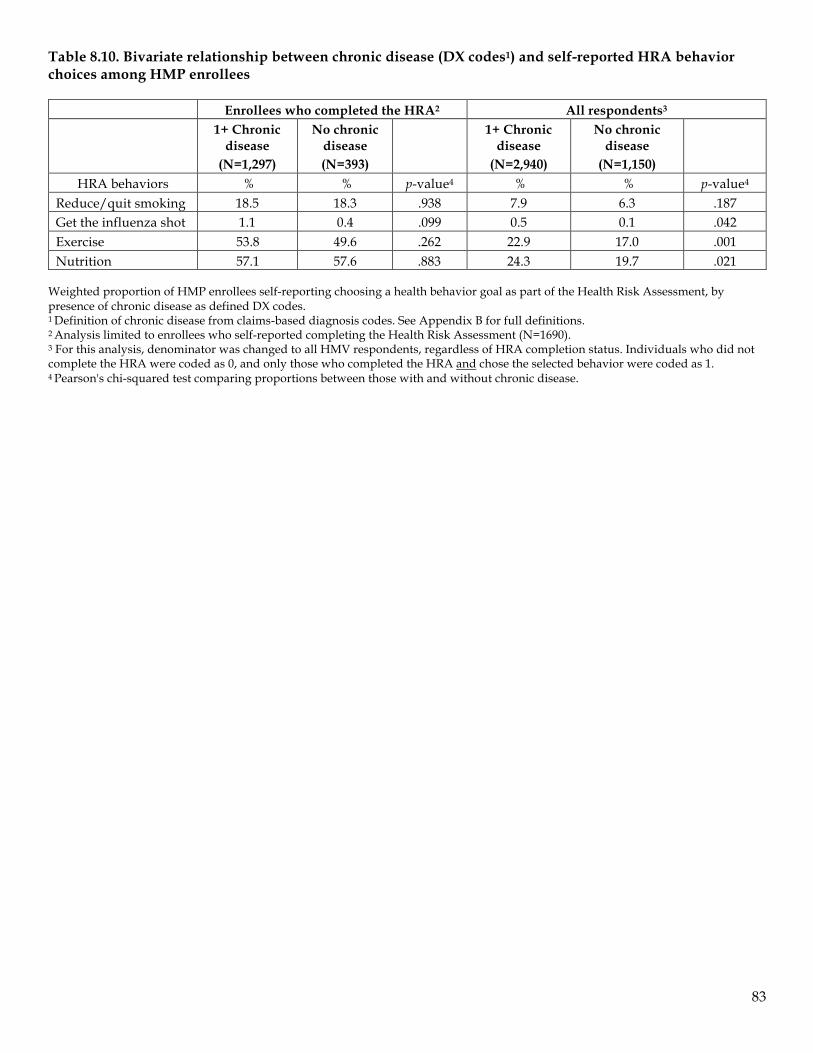
83
Table 8.10. Bivariate relationship between chronic disease (DX codes1) and self-reported HRA behavior choices among HMP enrollees
Enrollees who completed the HRA2 All respondents3
1+ Chronic
disease (N=1,297)
No chronic disease (N=393)
1+ Chronic
disease (N=2,940)
No chronic disease
(N=1,150)
HRA behaviors % % p-value4 % % p-value4 Reduce/quit smoking 18.5 18.3 .938 7.9 6.3 .187 Get the influenza shot 1.1 0.4 .099 0.5 0.1 .042 Exercise 53.8 49.6 .262 22.9 17.0 .001 Nutrition 57.1 57.6 .883 24.3 19.7 .021
Weighted proportion of HMP enrollees self-reporting choosing a health behavior goal as part of the Health Risk Assessment, by presence of chronic disease as defined DX codes. 1 Definition of chronic disease from claims-based diagnosis codes. See Appendix B for full definitions. 2 Analysis limited to enrollees who self-reported completing the Health Risk Assessment (N=1690). 3 For this analysis, denominator was changed to all HMV respondents, regardless of HRA completion status. Individuals who did not complete the HRA were coded as 0, and only those who completed the HRA and chose the selected behavior were coded as 1. 4 Pearson's chi-squared test comparing proportions between those with and without chronic disease.
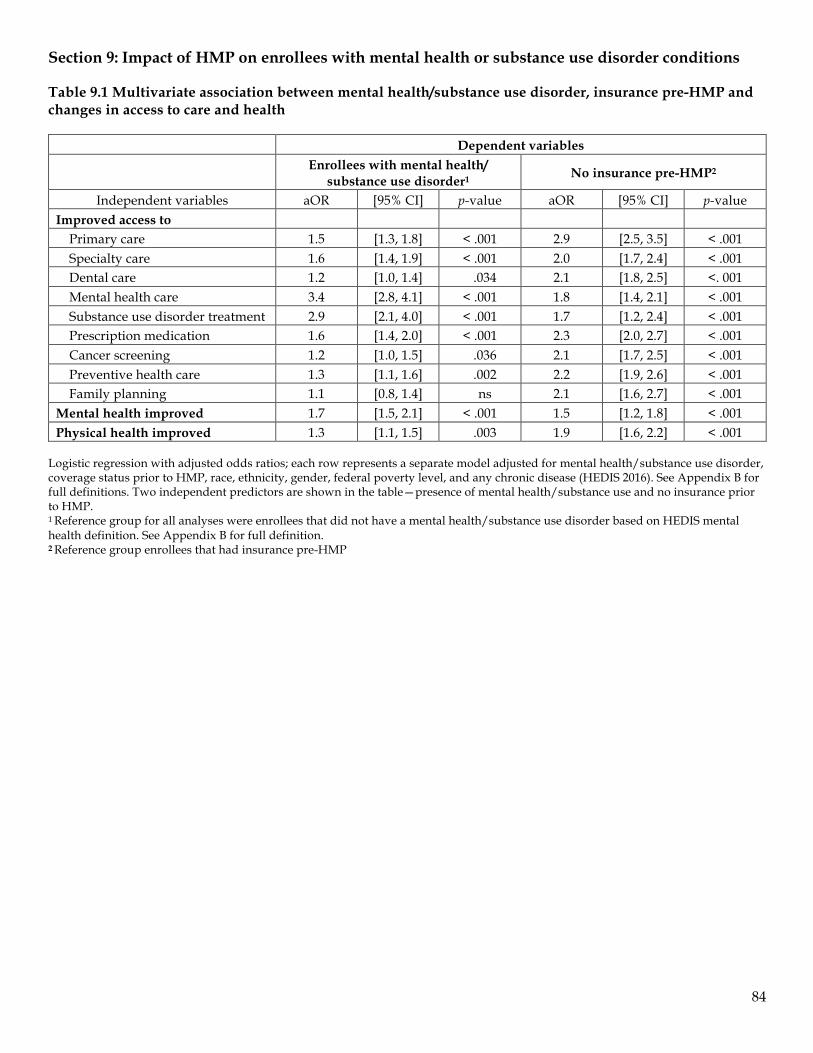
84
Section 9: Impact of HMP on enrollees with mental health or substance use disorder conditions Table 9.1 Multivariate association between mental health/substance use disorder, insurance pre-HMP and changes in access to care and health
Dependent variables
Enrollees with mental health/ substance use disorder1 No insurance pre-HMP2
Independent variables aOR [95% CI] p-value aOR [95% CI] p-value Improved access to Primary care 1.5 [1.3, 1.8] < .001 2.9 [2.5, 3.5] < .001 Specialty care 1.6 [1.4, 1.9] < .001 2.0 [1.7, 2.4] < .001 Dental care 1.2 [1.0, 1.4] .034 2.1 [1.8, 2.5] <. 001 Mental health care 3.4 [2.8, 4.1] < .001 1.8 [1.4, 2.1] < .001 Substance use disorder treatment 2.9 [2.1, 4.0] < .001 1.7 [1.2, 2.4] < .001 Prescription medication 1.6 [1.4, 2.0] < .001 2.3 [2.0, 2.7] < .001 Cancer screening 1.2 [1.0, 1.5] .036 2.1 [1.7, 2.5] < .001 Preventive health care 1.3 [1.1, 1.6] .002 2.2 [1.9, 2.6] < .001 Family planning 1.1 [0.8, 1.4] ns 2.1 [1.6, 2.7] < .001 Mental health improved 1.7 [1.5, 2.1] < .001 1.5 [1.2, 1.8] < .001 Physical health improved 1.3 [1.1, 1.5] .003 1.9 [1.6, 2.2] < .001
Logistic regression with adjusted odds ratios; each row represents a separate model adjusted for mental health/substance use disorder, coverage status prior to HMP, race, ethnicity, gender, federal poverty level, and any chronic disease (HEDIS 2016). See Appendix B for full definitions. Two independent predictors are shown in the table—presence of mental health/substance use and no insurance prior to HMP. 1 Reference group for all analyses were enrollees that did not have a mental health/substance use disorder based on HEDIS mental health definition. See Appendix B for full definition. 2 Reference group enrollees that had insurance pre-HMP
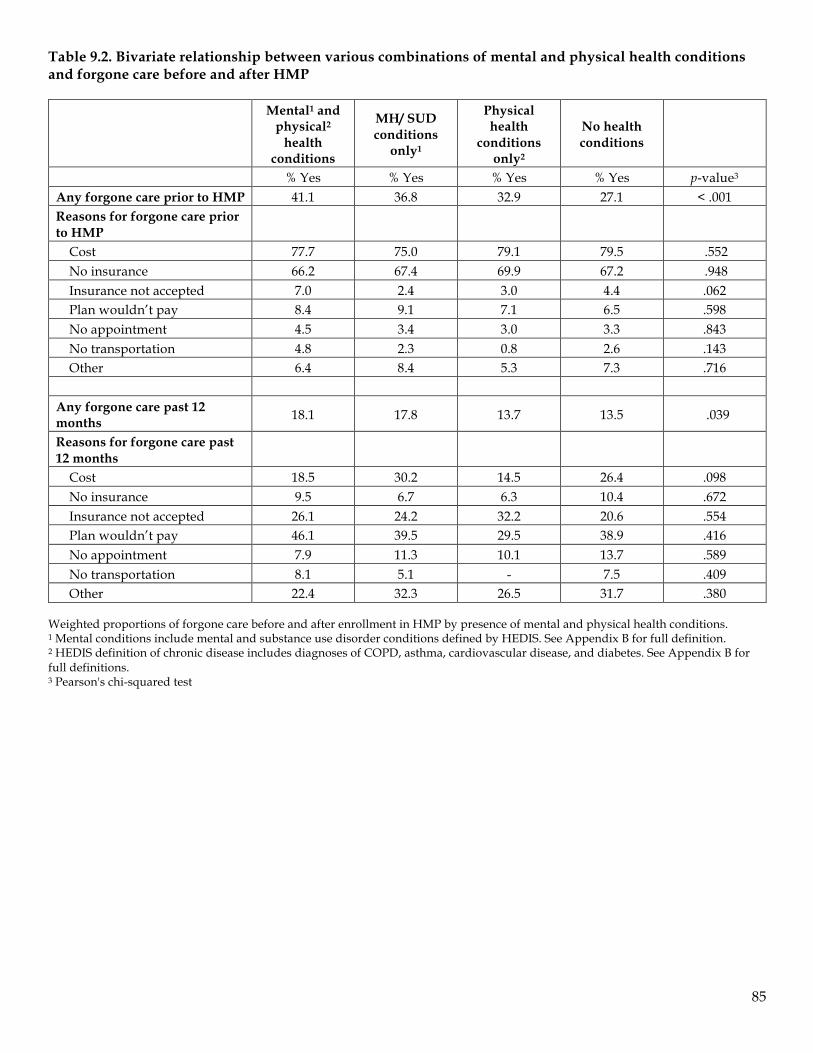
85
Table 9.2. Bivariate relationship between various combinations of mental and physical health conditions and forgone care before and after HMP
Mental1 and physical2
health conditions
MH/ SUD conditions
only1
Physical health
conditions only2
No health conditions
% Yes % Yes % Yes % Yes p-value3
Any forgone care prior to HMP 41.1 36.8 32.9 27.1 < .001 Reasons for forgone care prior to HMP
Cost 77.7 75.0 79.1 79.5 .552 No insurance 66.2 67.4 69.9 67.2 .948 Insurance not accepted 7.0 2.4 3.0 4.4 .062 Plan wouldn’t pay 8.4 9.1 7.1 6.5 .598 No appointment 4.5 3.4 3.0 3.3 .843 No transportation 4.8 2.3 0.8 2.6 .143 Other 6.4 8.4 5.3 7.3 .716
Any forgone care past 12 months 18.1 17.8 13.7 13.5 .039
Reasons for forgone care past 12 months
Cost 18.5 30.2 14.5 26.4 .098 No insurance 9.5 6.7 6.3 10.4 .672 Insurance not accepted 26.1 24.2 32.2 20.6 .554 Plan wouldn’t pay 46.1 39.5 29.5 38.9 .416 No appointment 7.9 11.3 10.1 13.7 .589 No transportation 8.1 5.1 - 7.5 .409 Other 22.4 32.3 26.5 31.7 .380
Weighted proportions of forgone care before and after enrollment in HMP by presence of mental and physical health conditions. 1 Mental conditions include mental and substance use disorder conditions defined by HEDIS. See Appendix B for full definition. 2 HEDIS definition of chronic disease includes diagnoses of COPD, asthma, cardiovascular disease, and diabetes. See Appendix B for full definitions. 3 Pearson's chi-squared test
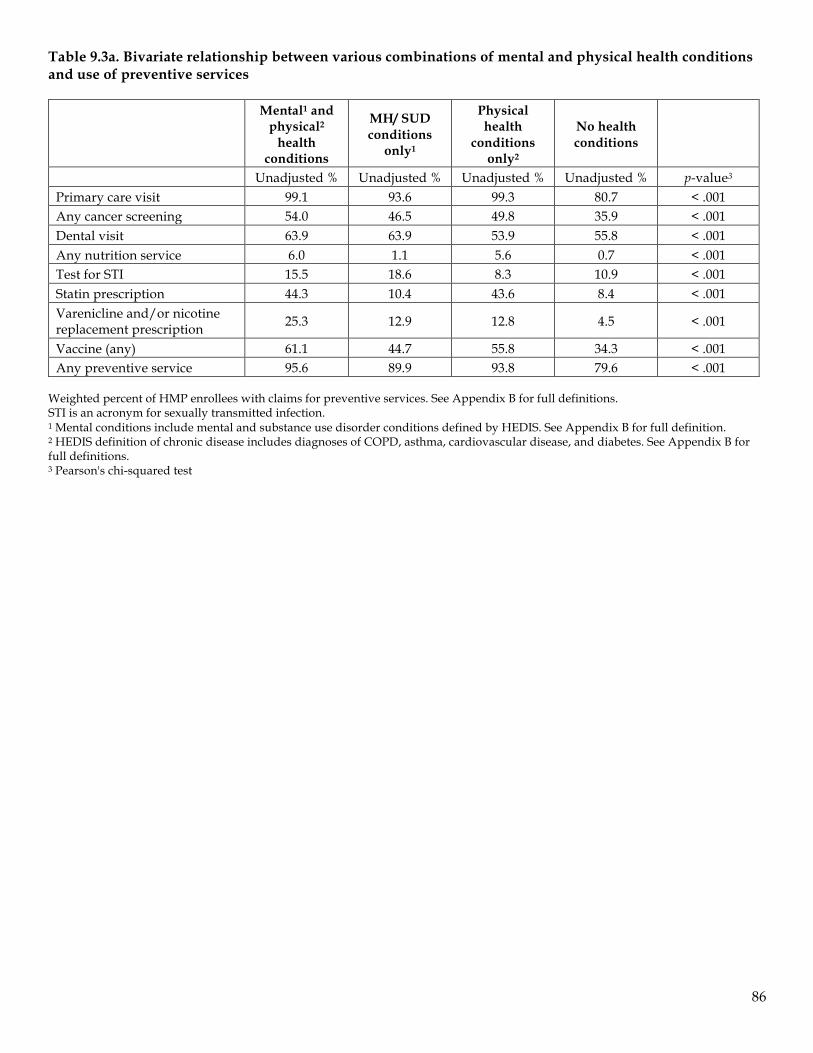
86
Table 9.3a. Bivariate relationship between various combinations of mental and physical health conditions and use of preventive services
Mental1 and physical2
health conditions
MH/ SUD conditions
only1
Physical health
conditions only2
No health conditions
Unadjusted % Unadjusted % Unadjusted % Unadjusted % p-value3
Primary care visit 99.1 93.6 99.3 80.7 < .001 Any cancer screening 54.0 46.5 49.8 35.9 < .001 Dental visit 63.9 63.9 53.9 55.8 < .001 Any nutrition service 6.0 1.1 5.6 0.7 < .001 Test for STI 15.5 18.6 8.3 10.9 < .001 Statin prescription 44.3 10.4 43.6 8.4 < .001 Varenicline and/or nicotine replacement prescription 25.3 12.9 12.8 4.5 < .001
Vaccine (any) 61.1 44.7 55.8 34.3 < .001 Any preventive service 95.6 89.9 93.8 79.6 < .001
Weighted percent of HMP enrollees with claims for preventive services. See Appendix B for full definitions. STI is an acronym for sexually transmitted infection. 1 Mental conditions include mental and substance use disorder conditions defined by HEDIS. See Appendix B for full definition. 2 HEDIS definition of chronic disease includes diagnoses of COPD, asthma, cardiovascular disease, and diabetes. See Appendix B for full definitions. 3 Pearson's chi-squared test
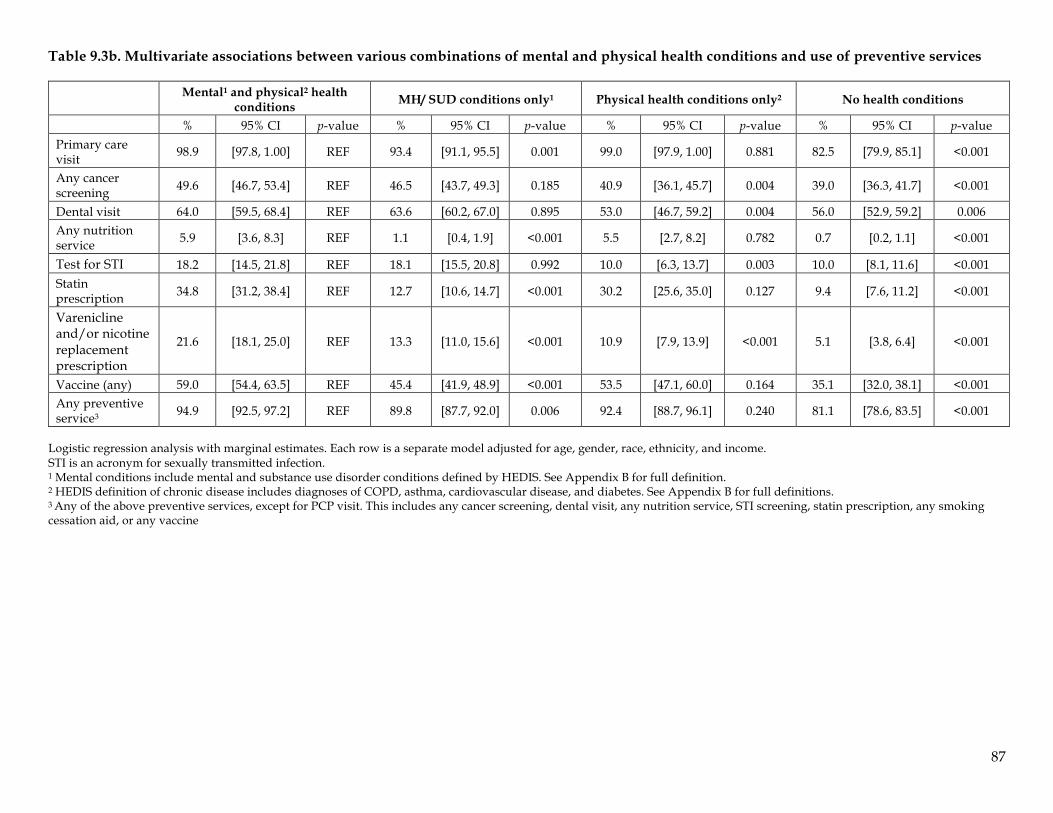
87
Table 9.3b. Multivariate associations between various combinations of mental and physical health conditions and use of preventive services
Mental1 and physical2 health conditions MH/ SUD conditions only1 Physical health conditions only2 No health conditions
% 95% CI p-value % 95% CI p-value % 95% CI p-value % 95% CI p-value Primary care visit 98.9 [97.8, 1.00] REF 93.4 [91.1, 95.5] 0.001 99.0 [97.9, 1.00] 0.881 82.5 [79.9, 85.1] <0.001
Any cancer screening 49.6 [46.7, 53.4] REF 46.5 [43.7, 49.3] 0.185 40.9 [36.1, 45.7] 0.004 39.0 [36.3, 41.7] <0.001
Dental visit 64.0 [59.5, 68.4] REF 63.6 [60.2, 67.0] 0.895 53.0 [46.7, 59.2] 0.004 56.0 [52.9, 59.2] 0.006 Any nutrition service 5.9 [3.6, 8.3] REF 1.1 [0.4, 1.9] <0.001 5.5 [2.7, 8.2] 0.782 0.7 [0.2, 1.1] <0.001
Test for STI 18.2 [14.5, 21.8] REF 18.1 [15.5, 20.8] 0.992 10.0 [6.3, 13.7] 0.003 10.0 [8.1, 11.6] <0.001 Statin prescription 34.8 [31.2, 38.4] REF 12.7 [10.6, 14.7] <0.001 30.2 [25.6, 35.0] 0.127 9.4 [7.6, 11.2] <0.001
Varenicline and/or nicotine replacement prescription
21.6 [18.1, 25.0] REF 13.3 [11.0, 15.6] <0.001 10.9 [7.9, 13.9] <0.001 5.1 [3.8, 6.4] <0.001
Vaccine (any) 59.0 [54.4, 63.5] REF 45.4 [41.9, 48.9] <0.001 53.5 [47.1, 60.0] 0.164 35.1 [32.0, 38.1] <0.001 Any preventive service3 94.9 [92.5, 97.2] REF 89.8 [87.7, 92.0] 0.006 92.4 [88.7, 96.1] 0.240 81.1 [78.6, 83.5] <0.001
Logistic regression analysis with marginal estimates. Each row is a separate model adjusted for age, gender, race, ethnicity, and income. STI is an acronym for sexually transmitted infection. 1 Mental conditions include mental and substance use disorder conditions defined by HEDIS. See Appendix B for full definition. 2 HEDIS definition of chronic disease includes diagnoses of COPD, asthma, cardiovascular disease, and diabetes. See Appendix B for full definitions. 3 Any of the above preventive services, except for PCP visit. This includes any cancer screening, dental visit, any nutrition service, STI screening, statin prescription, any smoking cessation aid, or any vaccine
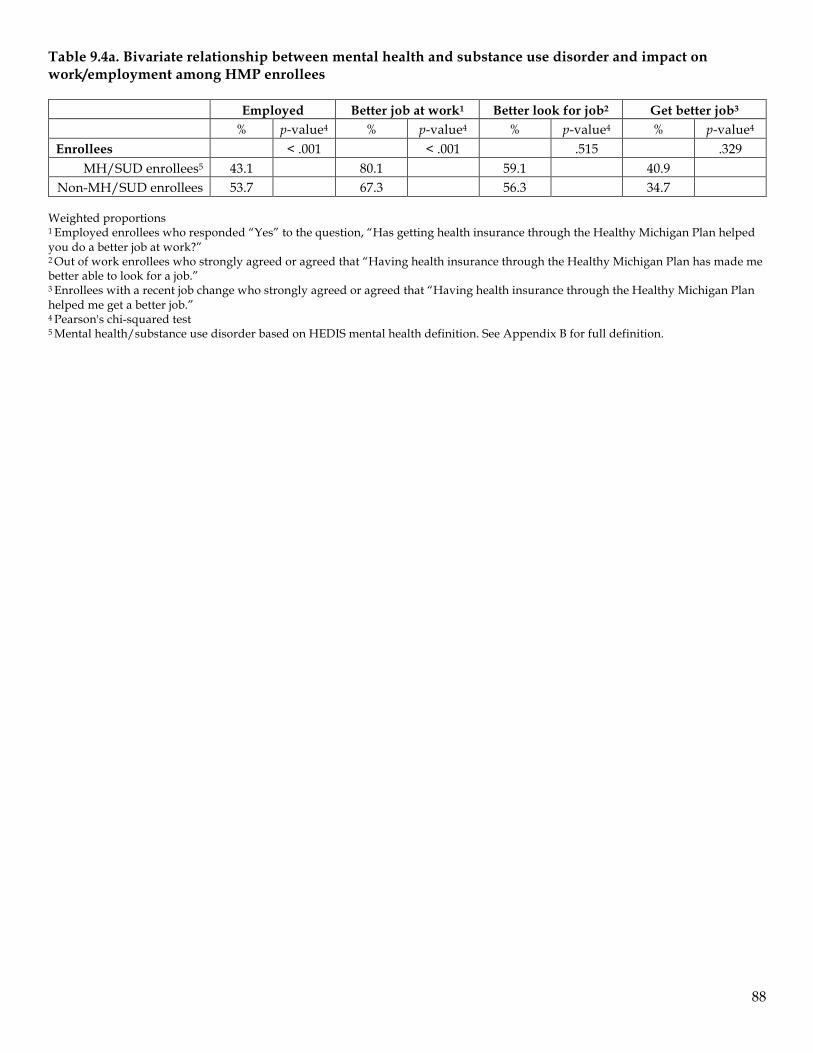
88
Table 9.4a. Bivariate relationship between mental health and substance use disorder and impact on work/employment among HMP enrollees
Employed Better job at work1 Better look for job2 Get better job3
% p-value4 % p-value4 % p-value4 % p-value4
Enrollees < .001 < .001 .515 .329 MH/SUD enrollees5 43.1 80.1 59.1 40.9
Non-MH/SUD enrollees 53.7 67.3 56.3 34.7 Weighted proportions 1 Employed enrollees who responded “Yes” to the question, “Has getting health insurance through the Healthy Michigan Plan helped you do a better job at work?” 2 Out of work enrollees who strongly agreed or agreed that “Having health insurance through the Healthy Michigan Plan has made me better able to look for a job.” 3 Enrollees with a recent job change who strongly agreed or agreed that “Having health insurance through the Healthy Michigan Plan helped me get a better job.” 4 Pearson's chi-squared test 5 Mental health/substance use disorder based on HEDIS mental health definition. See Appendix B for full definition.
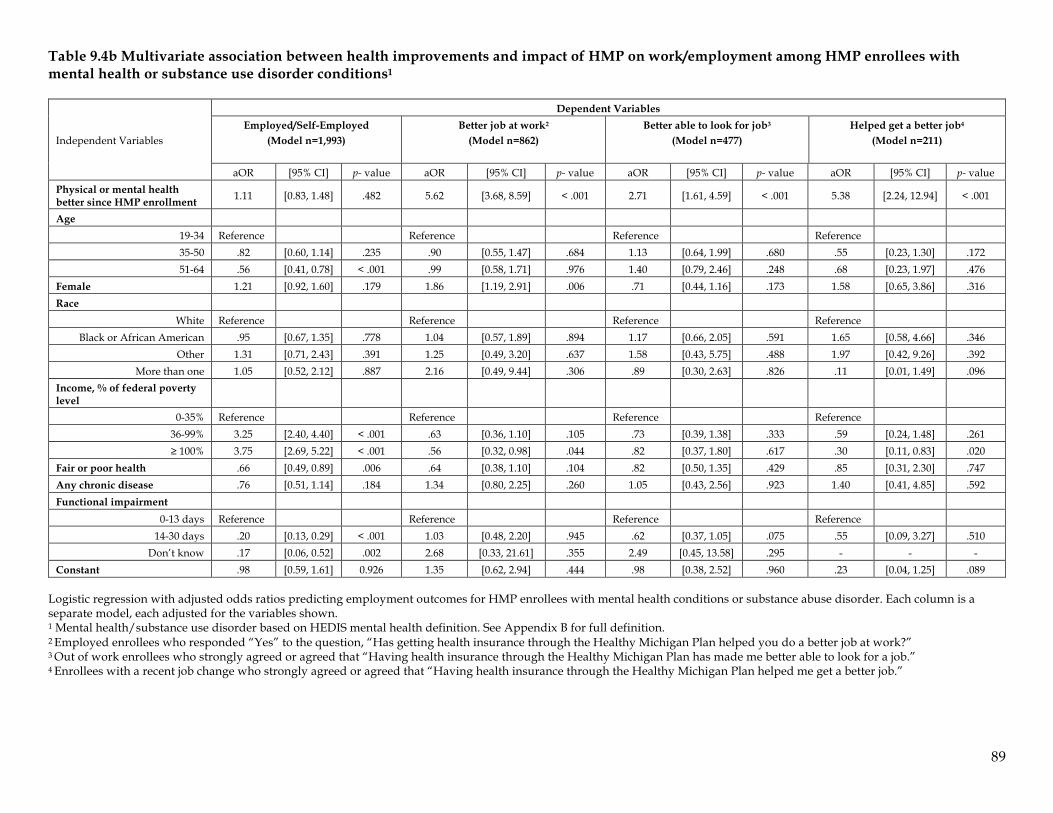
89
Table 9.4b Multivariate association between health improvements and impact of HMP on work/employment among HMP enrollees with mental health or substance use disorder conditions1
Independent Variables
Dependent Variables Employed/Self-Employed
(Model n=1,993)
Better job at work2
(Model n=862)
Better able to look for job3
(Model n=477)
Helped get a better job4
(Model n=211)
aOR [95% CI] p- value aOR [95% CI] p- value aOR [95% CI] p- value aOR [95% CI] p- value
Physical or mental health better since HMP enrollment 1.11 [0.83, 1.48] .482 5.62 [3.68, 8.59] < .001 2.71 [1.61, 4.59] < .001 5.38 [2.24, 12.94] < .001
Age 19-34 Reference Reference Reference Reference 35-50 .82 [0.60, 1.14] .235 .90 [0.55, 1.47] .684 1.13 [0.64, 1.99] .680 .55 [0.23, 1.30] .172 51-64 .56 [0.41, 0.78] < .001 .99 [0.58, 1.71] .976 1.40 [0.79, 2.46] .248 .68 [0.23, 1.97] .476
Female 1.21 [0.92, 1.60] .179 1.86 [1.19, 2.91] .006 .71 [0.44, 1.16] .173 1.58 [0.65, 3.86] .316 Race
White Reference Reference Reference Reference Black or African American .95 [0.67, 1.35] .778 1.04 [0.57, 1.89] .894 1.17 [0.66, 2.05] .591 1.65 [0.58, 4.66] .346
Other 1.31 [0.71, 2.43] .391 1.25 [0.49, 3.20] .637 1.58 [0.43, 5.75] .488 1.97 [0.42, 9.26] .392 More than one 1.05 [0.52, 2.12] .887 2.16 [0.49, 9.44] .306 .89 [0.30, 2.63] .826 .11 [0.01, 1.49] .096
Income, % of federal poverty level
0-35% Reference Reference Reference Reference 36-99% 3.25 [2.40, 4.40] < .001 .63 [0.36, 1.10] .105 .73 [0.39, 1.38] .333 .59 [0.24, 1.48] .261 ≥ 100% 3.75 [2.69, 5.22] < .001 .56 [0.32, 0.98] .044 .82 [0.37, 1.80] .617 .30 [0.11, 0.83] .020
Fair or poor health .66 [0.49, 0.89] .006 .64 [0.38, 1.10] .104 .82 [0.50, 1.35] .429 .85 [0.31, 2.30] .747 Any chronic disease .76 [0.51, 1.14] .184 1.34 [0.80, 2.25] .260 1.05 [0.43, 2.56] .923 1.40 [0.41, 4.85] .592 Functional impairment
0-13 days Reference Reference Reference Reference 14-30 days .20 [0.13, 0.29] < .001 1.03 [0.48, 2.20] .945 .62 [0.37, 1.05] .075 .55 [0.09, 3.27] .510
Don’t know .17 [0.06, 0.52] .002 2.68 [0.33, 21.61] .355 2.49 [0.45, 13.58] .295 - - - Constant .98 [0.59, 1.61] 0.926 1.35 [0.62, 2.94] .444 .98 [0.38, 2.52] .960 .23 [0.04, 1.25] .089
Logistic regression with adjusted odds ratios predicting employment outcomes for HMP enrollees with mental health conditions or substance abuse disorder. Each column is a separate model, each adjusted for the variables shown. 1 Mental health/substance use disorder based on HEDIS mental health definition. See Appendix B for full definition. 2 Employed enrollees who responded “Yes” to the question, “Has getting health insurance through the Healthy Michigan Plan helped you do a better job at work?” 3 Out of work enrollees who strongly agreed or agreed that “Having health insurance through the Healthy Michigan Plan has made me better able to look for a job.” 4 Enrollees with a recent job change who strongly agreed or agreed that “Having health insurance through the Healthy Michigan Plan helped me get a better job.”
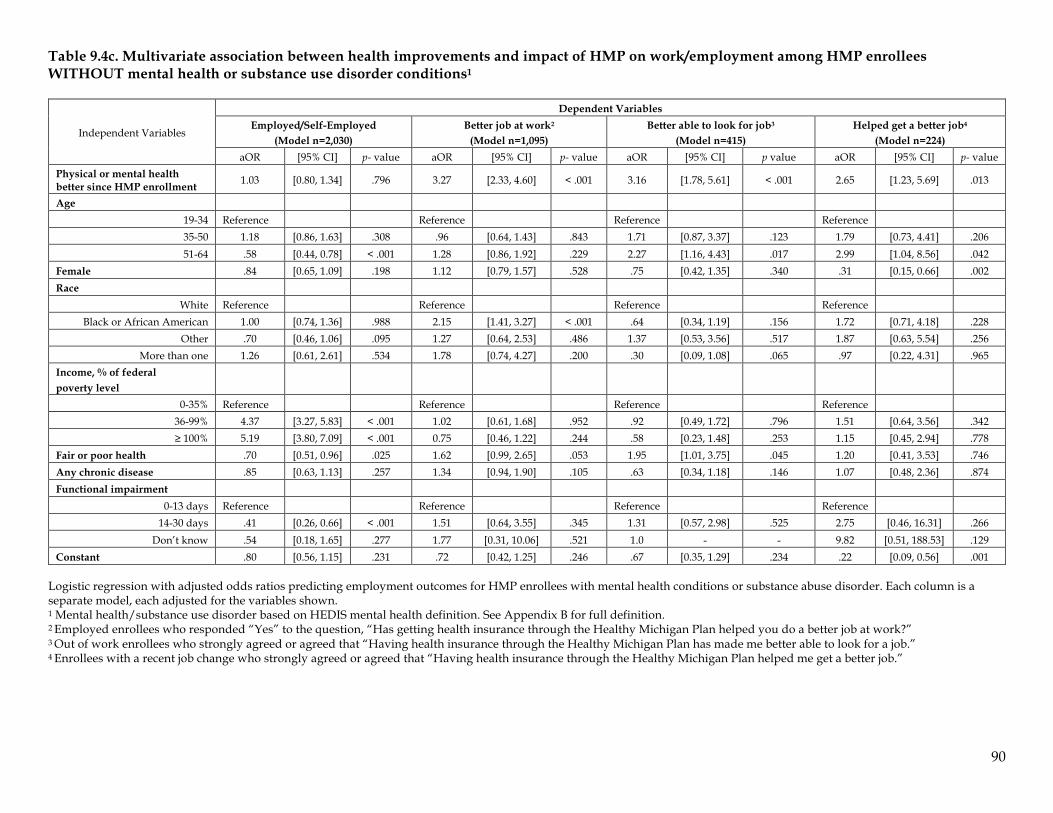
90
Table 9.4c. Multivariate association between health improvements and impact of HMP on work/employment among HMP enrollees WITHOUT mental health or substance use disorder conditions1
Independent Variables
Dependent Variables Employed/Self-Employed
(Model n=2,030)
Better job at work2
(Model n=1,095)
Better able to look for job3
(Model n=415)
Helped get a better job4
(Model n=224)
aOR [95% CI] p- value aOR [95% CI] p- value aOR [95% CI] p value aOR [95% CI] p- value Physical or mental health better since HMP enrollment 1.03 [0.80, 1.34] .796 3.27 [2.33, 4.60] < .001 3.16 [1.78, 5.61] < .001 2.65 [1.23, 5.69] .013
Age 19-34 Reference Reference Reference Reference 35-50 1.18 [0.86, 1.63] .308 .96 [0.64, 1.43] .843 1.71 [0.87, 3.37] .123 1.79 [0.73, 4.41] .206 51-64 .58 [0.44, 0.78] < .001 1.28 [0.86, 1.92] .229 2.27 [1.16, 4.43] .017 2.99 [1.04, 8.56] .042
Female .84 [0.65, 1.09] .198 1.12 [0.79, 1.57] .528 .75 [0.42, 1.35] .340 .31 [0.15, 0.66] .002 Race
White Reference Reference Reference Reference Black or African American 1.00 [0.74, 1.36] .988 2.15 [1.41, 3.27] < .001 .64 [0.34, 1.19] .156 1.72 [0.71, 4.18] .228
Other .70 [0.46, 1.06] .095 1.27 [0.64, 2.53] .486 1.37 [0.53, 3.56] .517 1.87 [0.63, 5.54] .256 More than one 1.26 [0.61, 2.61] .534 1.78 [0.74, 4.27] .200 .30 [0.09, 1.08] .065 .97 [0.22, 4.31] .965
Income, % of federal poverty level
0-35% Reference Reference Reference Reference 36-99% 4.37 [3.27, 5.83] < .001 1.02 [0.61, 1.68] .952 .92 [0.49, 1.72] .796 1.51 [0.64, 3.56] .342 ≥ 100% 5.19 [3.80, 7.09] < .001 0.75 [0.46, 1.22] .244 .58 [0.23, 1.48] .253 1.15 [0.45, 2.94] .778
Fair or poor health .70 [0.51, 0.96] .025 1.62 [0.99, 2.65] .053 1.95 [1.01, 3.75] .045 1.20 [0.41, 3.53] .746 Any chronic disease .85 [0.63, 1.13] .257 1.34 [0.94, 1.90] .105 .63 [0.34, 1.18] .146 1.07 [0.48, 2.36] .874 Functional impairment
0-13 days Reference Reference Reference Reference 14-30 days .41 [0.26, 0.66] < .001 1.51 [0.64, 3.55] .345 1.31 [0.57, 2.98] .525 2.75 [0.46, 16.31] .266
Don’t know .54 [0.18, 1.65] .277 1.77 [0.31, 10.06] .521 1.0 - - 9.82 [0.51, 188.53] .129 Constant .80 [0.56, 1.15] .231 .72 [0.42, 1.25] .246 .67 [0.35, 1.29] .234 .22 [0.09, 0.56] .001
Logistic regression with adjusted odds ratios predicting employment outcomes for HMP enrollees with mental health conditions or substance abuse disorder. Each column is a separate model, each adjusted for the variables shown. 1 Mental health/substance use disorder based on HEDIS mental health definition. See Appendix B for full definition. 2 Employed enrollees who responded “Yes” to the question, “Has getting health insurance through the Healthy Michigan Plan helped you do a better job at work?” 3 Out of work enrollees who strongly agreed or agreed that “Having health insurance through the Healthy Michigan Plan has made me better able to look for a job.” 4 Enrollees with a recent job change who strongly agreed or agreed that “Having health insurance through the Healthy Michigan Plan helped me get a better job.”
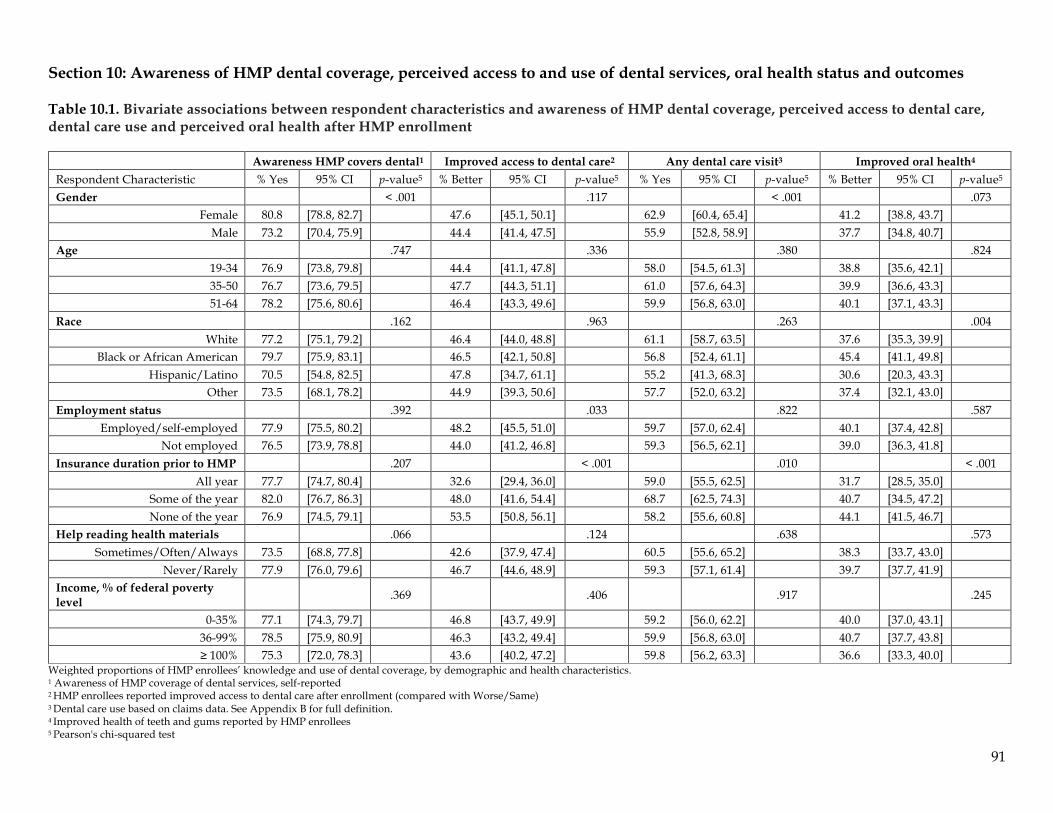
91
Section 10: Awareness of HMP dental coverage, perceived access to and use of dental services, oral health status and outcomes Table 10.1. Bivariate associations between respondent characteristics and awareness of HMP dental coverage, perceived access to dental care, dental care use and perceived oral health after HMP enrollment
Awareness HMP covers dental1 Improved access to dental care2 Any dental care visit3 Improved oral health4
Respondent Characteristic % Yes 95% CI p-value5 % Better 95% CI p-value5 % Yes 95% CI p-value5 % Better 95% CI p-value5
Gender < .001 .117 < .001 .073 Female 80.8 [78.8, 82.7] 47.6 [45.1, 50.1] 62.9 [60.4, 65.4] 41.2 [38.8, 43.7]
Male 73.2 [70.4, 75.9] 44.4 [41.4, 47.5] 55.9 [52.8, 58.9] 37.7 [34.8, 40.7] Age .747 .336 .380 .824
19-34 76.9 [73.8, 79.8] 44.4 [41.1, 47.8] 58.0 [54.5, 61.3] 38.8 [35.6, 42.1] 35-50 76.7 [73.6, 79.5] 47.7 [44.3, 51.1] 61.0 [57.6, 64.3] 39.9 [36.6, 43.3] 51-64 78.2 [75.6, 80.6] 46.4 [43.3, 49.6] 59.9 [56.8, 63.0] 40.1 [37.1, 43.3]
Race .162 .963 .263 .004 White 77.2 [75.1, 79.2] 46.4 [44.0, 48.8] 61.1 [58.7, 63.5] 37.6 [35.3, 39.9]
Black or African American 79.7 [75.9, 83.1] 46.5 [42.1, 50.8] 56.8 [52.4, 61.1] 45.4 [41.1, 49.8] Hispanic/Latino 70.5 [54.8, 82.5] 47.8 [34.7, 61.1] 55.2 [41.3, 68.3] 30.6 [20.3, 43.3]
Other 73.5 [68.1, 78.2] 44.9 [39.3, 50.6] 57.7 [52.0, 63.2] 37.4 [32.1, 43.0] Employment status .392 .033 .822 .587
Employed/self-employed 77.9 [75.5, 80.2] 48.2 [45.5, 51.0] 59.7 [57.0, 62.4] 40.1 [37.4, 42.8] Not employed 76.5 [73.9, 78.8] 44.0 [41.2, 46.8] 59.3 [56.5, 62.1] 39.0 [36.3, 41.8]
Insurance duration prior to HMP .207 < .001 .010 < .001 All year 77.7 [74.7, 80.4] 32.6 [29.4, 36.0] 59.0 [55.5, 62.5] 31.7 [28.5, 35.0]
Some of the year 82.0 [76.7, 86.3] 48.0 [41.6, 54.4] 68.7 [62.5, 74.3] 40.7 [34.5, 47.2] None of the year 76.9 [74.5, 79.1] 53.5 [50.8, 56.1] 58.2 [55.6, 60.8] 44.1 [41.5, 46.7]
Help reading health materials .066 .124 .638 .573 Sometimes/Often/Always 73.5 [68.8, 77.8] 42.6 [37.9, 47.4] 60.5 [55.6, 65.2] 38.3 [33.7, 43.0]
Never/Rarely 77.9 [76.0, 79.6] 46.7 [44.6, 48.9] 59.3 [57.1, 61.4] 39.7 [37.7, 41.9] Income, % of federal poverty level .369 .406 .917 .245
0-35% 77.1 [74.3, 79.7] 46.8 [43.7, 49.9] 59.2 [56.0, 62.2] 40.0 [37.0, 43.1] 36-99% 78.5 [75.9, 80.9] 46.3 [43.2, 49.4] 59.9 [56.8, 63.0] 40.7 [37.7, 43.8] ≥ 100% 75.3 [72.0, 78.3] 43.6 [40.2, 47.2] 59.8 [56.2, 63.3] 36.6 [33.3, 40.0]
Weighted proportions of HMP enrollees’ knowledge and use of dental coverage, by demographic and health characteristics. 1 Awareness of HMP coverage of dental services, self-reported 2 HMP enrollees reported improved access to dental care after enrollment (compared with Worse/Same) 3 Dental care use based on claims data. See Appendix B for full definition. 4 Improved health of teeth and gums reported by HMP enrollees 5 Pearson's chi-squared test
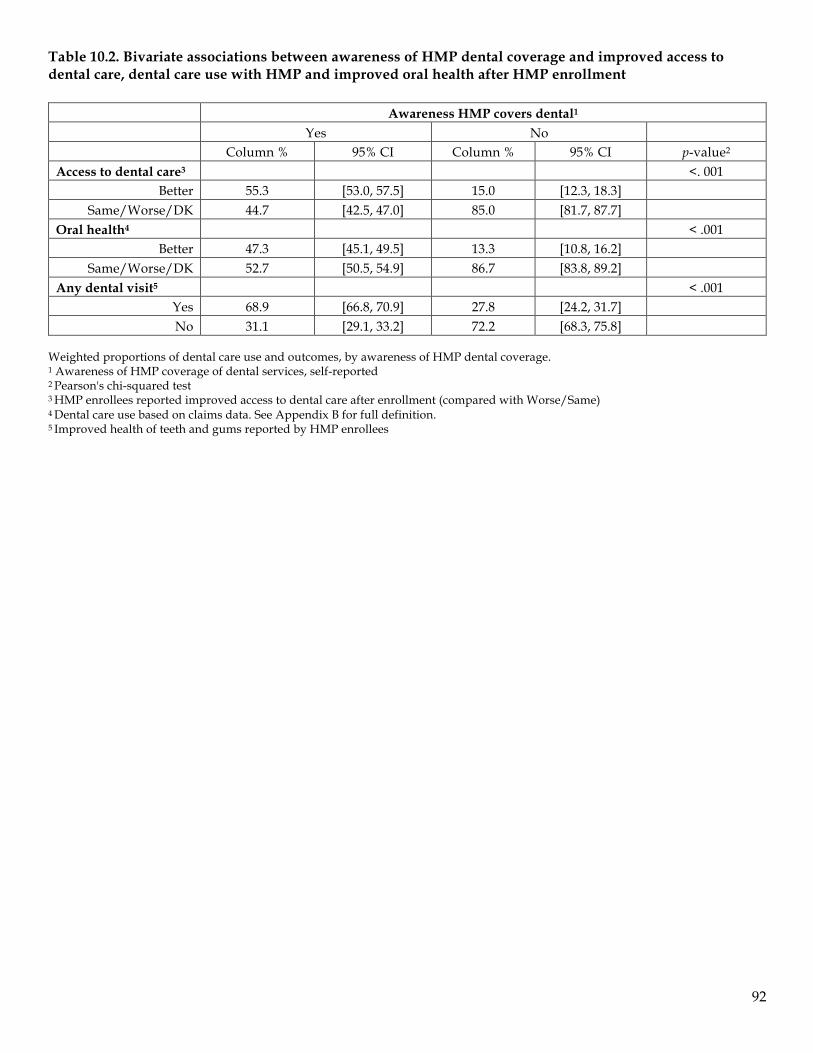
92
Table 10.2. Bivariate associations between awareness of HMP dental coverage and improved access to dental care, dental care use with HMP and improved oral health after HMP enrollment
Awareness HMP covers dental1
Yes No Column % 95% CI Column % 95% CI p-value2
Access to dental care3 <. 001 Better 55.3 [53.0, 57.5] 15.0 [12.3, 18.3]
Same/Worse/DK 44.7 [42.5, 47.0] 85.0 [81.7, 87.7] Oral health4 < .001
Better 47.3 [45.1, 49.5] 13.3 [10.8, 16.2] Same/Worse/DK 52.7 [50.5, 54.9] 86.7 [83.8, 89.2]
Any dental visit5 < .001 Yes 68.9 [66.8, 70.9] 27.8 [24.2, 31.7] No 31.1 [29.1, 33.2] 72.2 [68.3, 75.8]
Weighted proportions of dental care use and outcomes, by awareness of HMP dental coverage. 1 Awareness of HMP coverage of dental services, self-reported 2 Pearson's chi-squared test
3 HMP enrollees reported improved access to dental care after enrollment (compared with Worse/Same) 4 Dental care use based on claims data. See Appendix B for full definition. 5 Improved health of teeth and gums reported by HMP enrollees
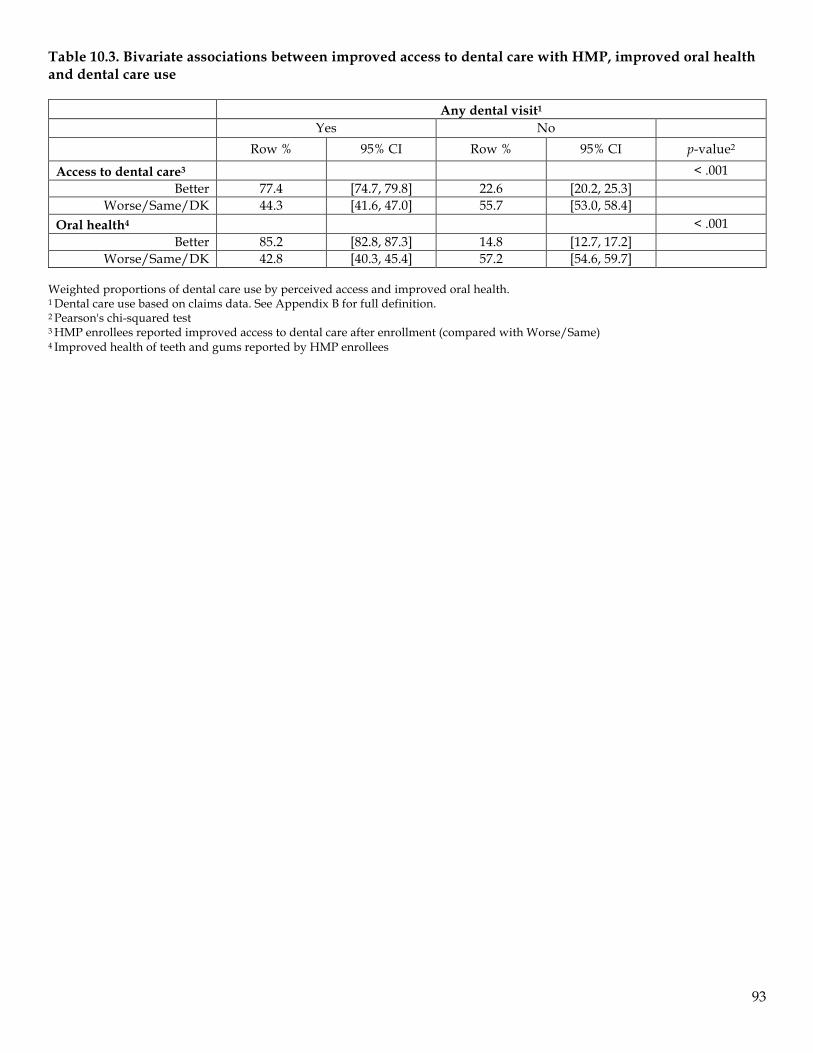
93
Table 10.3. Bivariate associations between improved access to dental care with HMP, improved oral health and dental care use
Any dental visit1
Yes No Row % 95% CI Row % 95% CI p-value2
Access to dental care3 < .001 Better 77.4 [74.7, 79.8] 22.6 [20.2, 25.3]
Worse/Same/DK 44.3 [41.6, 47.0] 55.7 [53.0, 58.4] Oral health4 < .001
Better 85.2 [82.8, 87.3] 14.8 [12.7, 17.2] Worse/Same/DK 42.8 [40.3, 45.4] 57.2 [54.6, 59.7]
Weighted proportions of dental care use by perceived access and improved oral health. 1 Dental care use based on claims data. See Appendix B for full definition. 2 Pearson's chi-squared test 3 HMP enrollees reported improved access to dental care after enrollment (compared with Worse/Same) 4 Improved health of teeth and gums reported by HMP enrollees
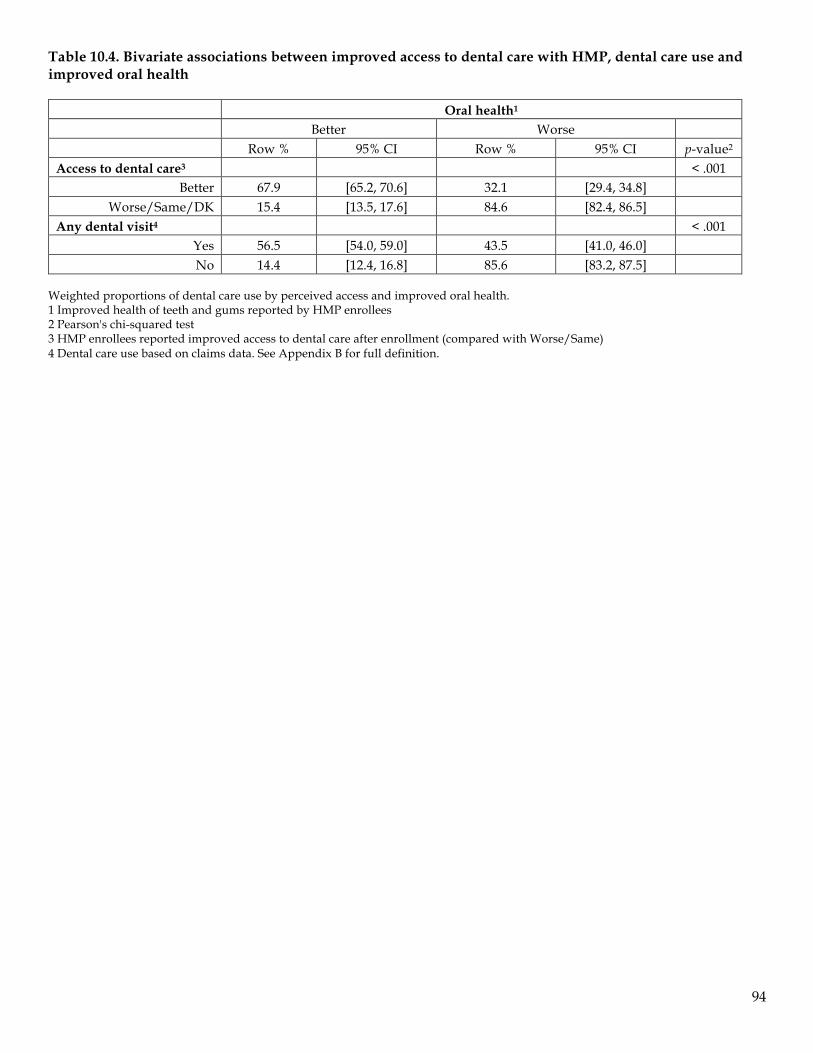
94
Table 10.4. Bivariate associations between improved access to dental care with HMP, dental care use and improved oral health
Oral health1
Better Worse Row % 95% CI Row % 95% CI p-value2
Access to dental care3 < .001 Better 67.9 [65.2, 70.6] 32.1 [29.4, 34.8]
Worse/Same/DK 15.4 [13.5, 17.6] 84.6 [82.4, 86.5] Any dental visit4 < .001
Yes 56.5 [54.0, 59.0] 43.5 [41.0, 46.0] No 14.4 [12.4, 16.8] 85.6 [83.2, 87.5]
Weighted proportions of dental care use by perceived access and improved oral health. 1 Improved health of teeth and gums reported by HMP enrollees 2 Pearson's chi-squared test 3 HMP enrollees reported improved access to dental care after enrollment (compared with Worse/Same) 4 Dental care use based on claims data. See Appendix B for full definition.
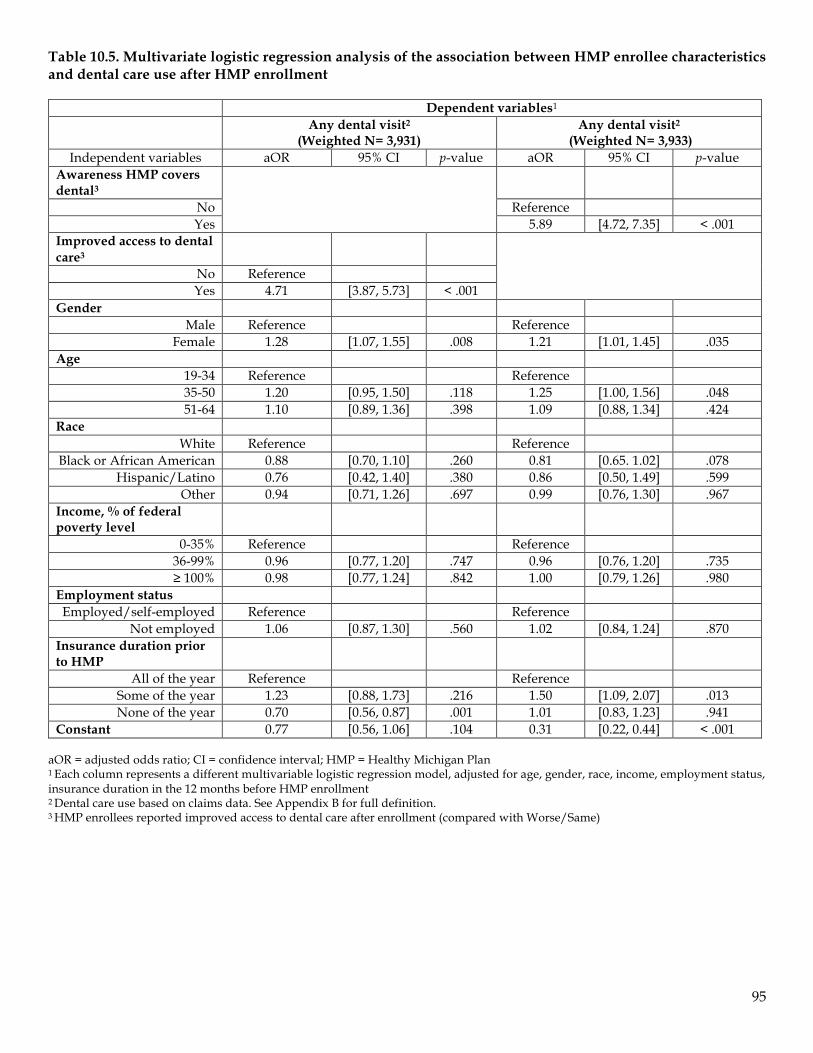
95
Table 10.5. Multivariate logistic regression analysis of the association between HMP enrollee characteristics and dental care use after HMP enrollment
Dependent variables1
Any dental visit2
(Weighted N= 3,931) Any dental visit2
(Weighted N= 3,933) Independent variables aOR 95% CI p-value aOR 95% CI p-value
Awareness HMP covers dental3
No Reference Yes 5.89 [4.72, 7.35] < .001
Improved access to dental care3
No Reference Yes 4.71 [3.87, 5.73] < .001
Gender Male Reference Reference
Female 1.28 [1.07, 1.55] .008 1.21 [1.01, 1.45] .035 Age
19-34 Reference Reference 35-50 1.20 [0.95, 1.50] .118 1.25 [1.00, 1.56] .048 51-64 1.10 [0.89, 1.36] .398 1.09 [0.88, 1.34] .424
Race White Reference Reference
Black or African American 0.88 [0.70, 1.10] .260 0.81 [0.65. 1.02] .078 Hispanic/Latino 0.76 [0.42, 1.40] .380 0.86 [0.50, 1.49] .599
Other 0.94 [0.71, 1.26] .697 0.99 [0.76, 1.30] .967 Income, % of federal poverty level
0-35% Reference Reference 36-99% 0.96 [0.77, 1.20] .747 0.96 [0.76, 1.20] .735 ≥ 100% 0.98 [0.77, 1.24] .842 1.00 [0.79, 1.26] .980
Employment status Employed/self-employed Reference Reference
Not employed 1.06 [0.87, 1.30] .560 1.02 [0.84, 1.24] .870 Insurance duration prior to HMP
All of the year Reference Reference Some of the year 1.23 [0.88, 1.73] .216 1.50 [1.09, 2.07] .013 None of the year 0.70 [0.56, 0.87] .001 1.01 [0.83, 1.23] .941
Constant 0.77 [0.56, 1.06] .104 0.31 [0.22, 0.44] < .001 aOR = adjusted odds ratio; CI = confidence interval; HMP = Healthy Michigan Plan 1 Each column represents a different multivariable logistic regression model, adjusted for age, gender, race, income, employment status, insurance duration in the 12 months before HMP enrollment 2 Dental care use based on claims data. See Appendix B for full definition. 3 HMP enrollees reported improved access to dental care after enrollment (compared with Worse/Same)
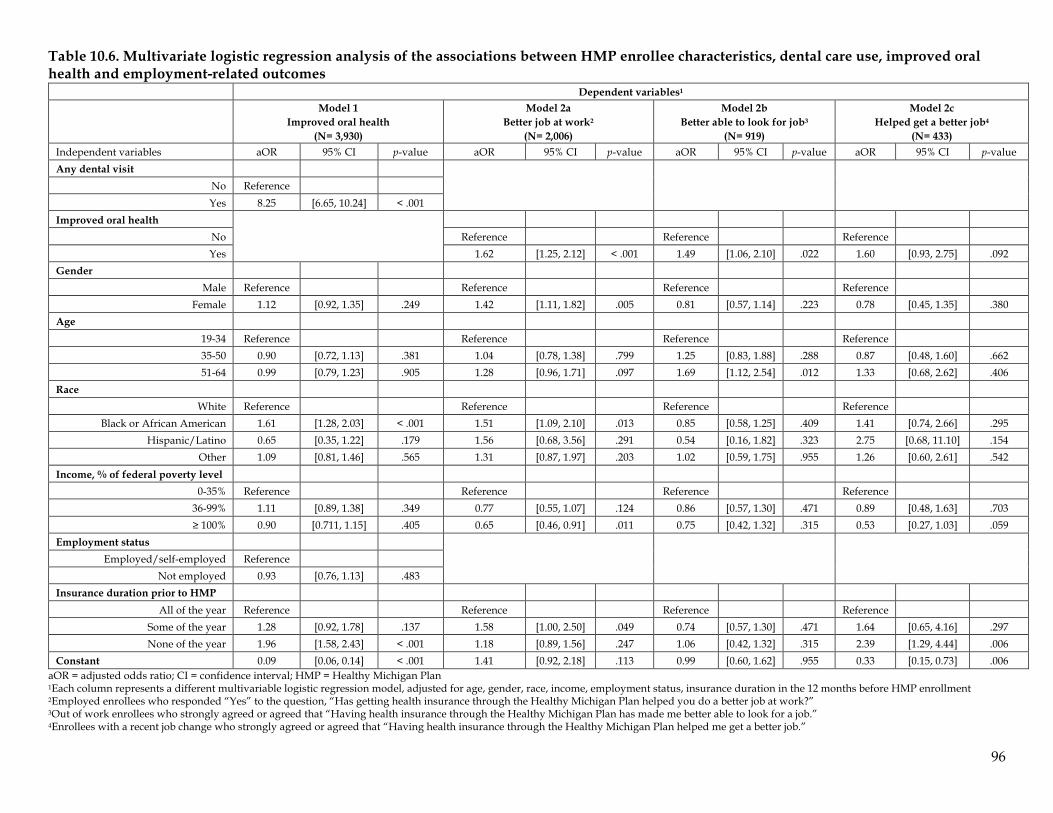
96
Table 10.6. Multivariate logistic regression analysis of the associations between HMP enrollee characteristics, dental care use, improved oral health and employment-related outcomes
Dependent variables1
Model 1
Improved oral health (N= 3,930)
Model 2a Better job at work2
(N= 2,006)
Model 2b Better able to look for job3
(N= 919)
Model 2c Helped get a better job4
(N= 433) Independent variables aOR 95% CI p-value aOR 95% CI p-value aOR 95% CI p-value aOR 95% CI p-value Any dental visit
No Reference Yes 8.25 [6.65, 10.24] < .001
Improved oral health
No Reference Reference Reference Yes 1.62 [1.25, 2.12] < .001 1.49 [1.06, 2.10] .022 1.60 [0.93, 2.75] .092
Gender Male Reference Reference Reference Reference
Female 1.12 [0.92, 1.35] .249 1.42 [1.11, 1.82] .005 0.81 [0.57, 1.14] .223 0.78 [0.45, 1.35] .380 Age
19-34 Reference Reference Reference Reference 35-50 0.90 [0.72, 1.13] .381 1.04 [0.78, 1.38] .799 1.25 [0.83, 1.88] .288 0.87 [0.48, 1.60] .662 51-64 0.99 [0.79, 1.23] .905 1.28 [0.96, 1.71] .097 1.69 [1.12, 2.54] .012 1.33 [0.68, 2.62] .406
Race White Reference Reference Reference Reference
Black or African American 1.61 [1.28, 2.03] < .001 1.51 [1.09, 2.10] .013 0.85 [0.58, 1.25] .409 1.41 [0.74, 2.66] .295 Hispanic/Latino 0.65 [0.35, 1.22] .179 1.56 [0.68, 3.56] .291 0.54 [0.16, 1.82] .323 2.75 [0.68, 11.10] .154
Other 1.09 [0.81, 1.46] .565 1.31 [0.87, 1.97] .203 1.02 [0.59, 1.75] .955 1.26 [0.60, 2.61] .542 Income, % of federal poverty level
0-35% Reference Reference Reference Reference 36-99% 1.11 [0.89, 1.38] .349 0.77 [0.55, 1.07] .124 0.86 [0.57, 1.30] .471 0.89 [0.48, 1.63] .703 ≥ 100% 0.90 [0.711, 1.15] .405 0.65 [0.46, 0.91] .011 0.75 [0.42, 1.32] .315 0.53 [0.27, 1.03] .059
Employment status Employed/self-employed Reference
Not employed 0.93 [0.76, 1.13] .483 Insurance duration prior to HMP
All of the year Reference Reference Reference Reference Some of the year 1.28 [0.92, 1.78] .137 1.58 [1.00, 2.50] .049 0.74 [0.57, 1.30] .471 1.64 [0.65, 4.16] .297 None of the year 1.96 [1.58, 2.43] < .001 1.18 [0.89, 1.56] .247 1.06 [0.42, 1.32] .315 2.39 [1.29, 4.44] .006
Constant 0.09 [0.06, 0.14] < .001 1.41 [0.92, 2.18] .113 0.99 [0.60, 1.62] .955 0.33 [0.15, 0.73] .006 aOR = adjusted odds ratio; CI = confidence interval; HMP = Healthy Michigan Plan 1Each column represents a different multivariable logistic regression model, adjusted for age, gender, race, income, employment status, insurance duration in the 12 months before HMP enrollment
2Employed enrollees who responded “Yes” to the question, “Has getting health insurance through the Healthy Michigan Plan helped you do a better job at work?” 3Out of work enrollees who strongly agreed or agreed that “Having health insurance through the Healthy Michigan Plan has made me better able to look for a job.” 4Enrollees with a recent job change who strongly agreed or agreed that “Having health insurance through the Healthy Michigan Plan helped me get a better job.”
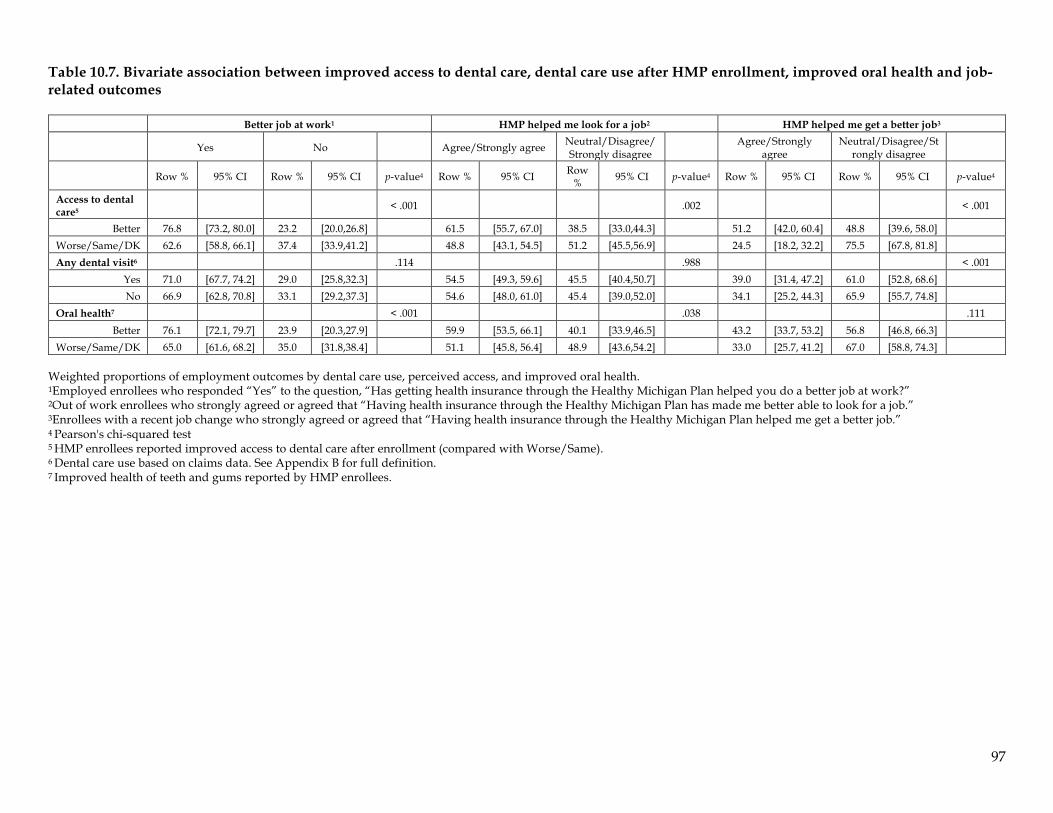
97
Table 10.7. Bivariate association between improved access to dental care, dental care use after HMP enrollment, improved oral health and job-related outcomes
Better job at work1 HMP helped me look for a job2 HMP helped me get a better job3
Yes No Agree/Strongly agree Neutral/Disagree/Strongly disagree Agree/Strongly
agree Neutral/Disagree/St
rongly disagree
Row % 95% CI Row % 95% CI p-value4 Row % 95% CI Row % 95% CI p-value4 Row % 95% CI Row % 95% CI p-value4
Access to dental care5 < .001 .002 < .001
Better 76.8 [73.2, 80.0] 23.2 [20.0,26.8] 61.5 [55.7, 67.0] 38.5 [33.0,44.3] 51.2 [42.0, 60.4] 48.8 [39.6, 58.0] Worse/Same/DK 62.6 [58.8, 66.1] 37.4 [33.9,41.2] 48.8 [43.1, 54.5] 51.2 [45.5,56.9] 24.5 [18.2, 32.2] 75.5 [67.8, 81.8] Any dental visit6 .114 .988 < .001
Yes 71.0 [67.7, 74.2] 29.0 [25.8,32.3] 54.5 [49.3, 59.6] 45.5 [40.4,50.7] 39.0 [31.4, 47.2] 61.0 [52.8, 68.6] No 66.9 [62.8, 70.8] 33.1 [29.2,37.3] 54.6 [48.0, 61.0] 45.4 [39.0,52.0] 34.1 [25.2, 44.3] 65.9 [55.7, 74.8]
Oral health7 < .001 .038 .111 Better 76.1 [72.1, 79.7] 23.9 [20.3,27.9] 59.9 [53.5, 66.1] 40.1 [33.9,46.5] 43.2 [33.7, 53.2] 56.8 [46.8, 66.3]
Worse/Same/DK 65.0 [61.6, 68.2] 35.0 [31.8,38.4] 51.1 [45.8, 56.4] 48.9 [43.6,54.2] 33.0 [25.7, 41.2] 67.0 [58.8, 74.3] Weighted proportions of employment outcomes by dental care use, perceived access, and improved oral health. 1Employed enrollees who responded “Yes” to the question, “Has getting health insurance through the Healthy Michigan Plan helped you do a better job at work?” 2Out of work enrollees who strongly agreed or agreed that “Having health insurance through the Healthy Michigan Plan has made me better able to look for a job.” 3Enrollees with a recent job change who strongly agreed or agreed that “Having health insurance through the Healthy Michigan Plan helped me get a better job.” 4 Pearson's chi-squared test
5 HMP enrollees reported improved access to dental care after enrollment (compared with Worse/Same). 6 Dental care use based on claims data. See Appendix B for full definition. 7 Improved health of teeth and gums reported by HMP enrollees.
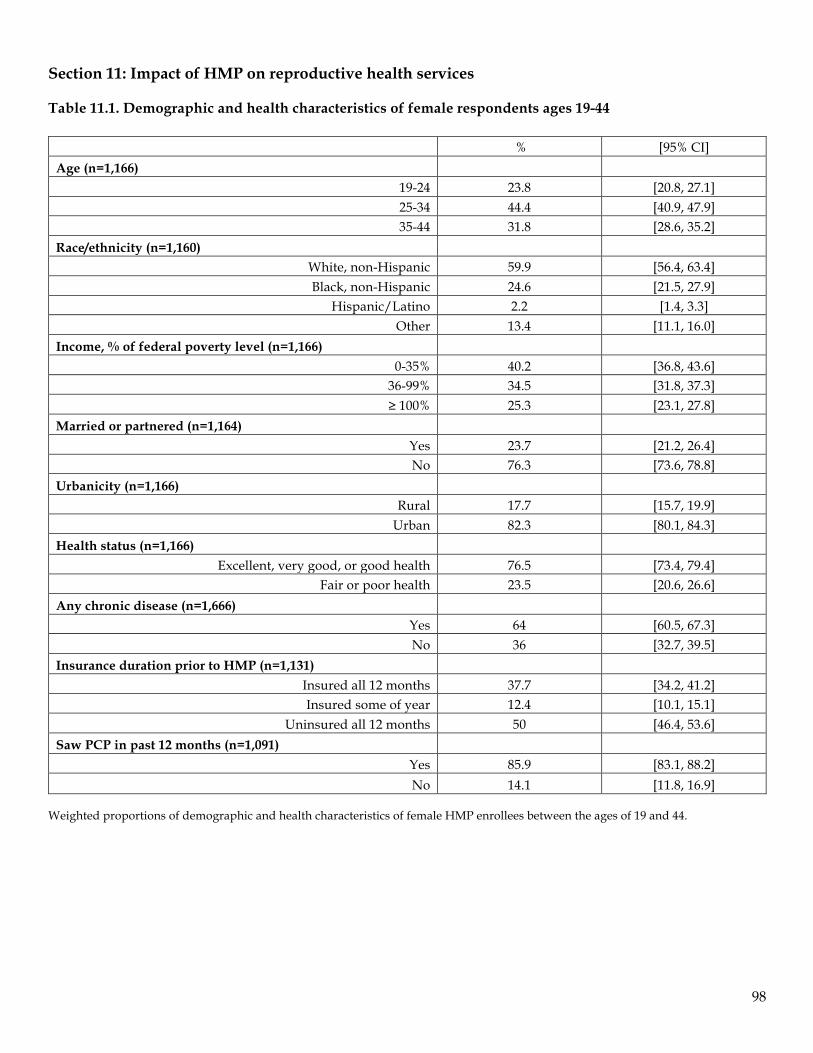
98
Section 11: Impact of HMP on reproductive health services Table 11.1. Demographic and health characteristics of female respondents ages 19-44
% [95% CI] Age (n=1,166)
19-24 23.8 [20.8, 27.1] 25-34 44.4 [40.9, 47.9] 35-44 31.8 [28.6, 35.2]
Race/ethnicity (n=1,160) White, non-Hispanic 59.9 [56.4, 63.4] Black, non-Hispanic 24.6 [21.5, 27.9]
Hispanic/Latino 2.2 [1.4, 3.3] Other 13.4 [11.1, 16.0]
Income, % of federal poverty level (n=1,166) 0-35% 40.2 [36.8, 43.6]
36-99% 34.5 [31.8, 37.3] ≥ 100% 25.3 [23.1, 27.8]
Married or partnered (n=1,164) Yes 23.7 [21.2, 26.4] No 76.3 [73.6, 78.8]
Urbanicity (n=1,166) Rural 17.7 [15.7, 19.9]
Urban 82.3 [80.1, 84.3] Health status (n=1,166)
Excellent, very good, or good health 76.5 [73.4, 79.4] Fair or poor health 23.5 [20.6, 26.6]
Any chronic disease (n=1,666) Yes 64 [60.5, 67.3] No 36 [32.7, 39.5]
Insurance duration prior to HMP (n=1,131) Insured all 12 months 37.7 [34.2, 41.2] Insured some of year 12.4 [10.1, 15.1]
Uninsured all 12 months 50 [46.4, 53.6] Saw PCP in past 12 months (n=1,091)
Yes 85.9 [83.1, 88.2] No 14.1 [11.8, 16.9]
Weighted proportions of demographic and health characteristics of female HMP enrollees between the ages of 19 and 44.
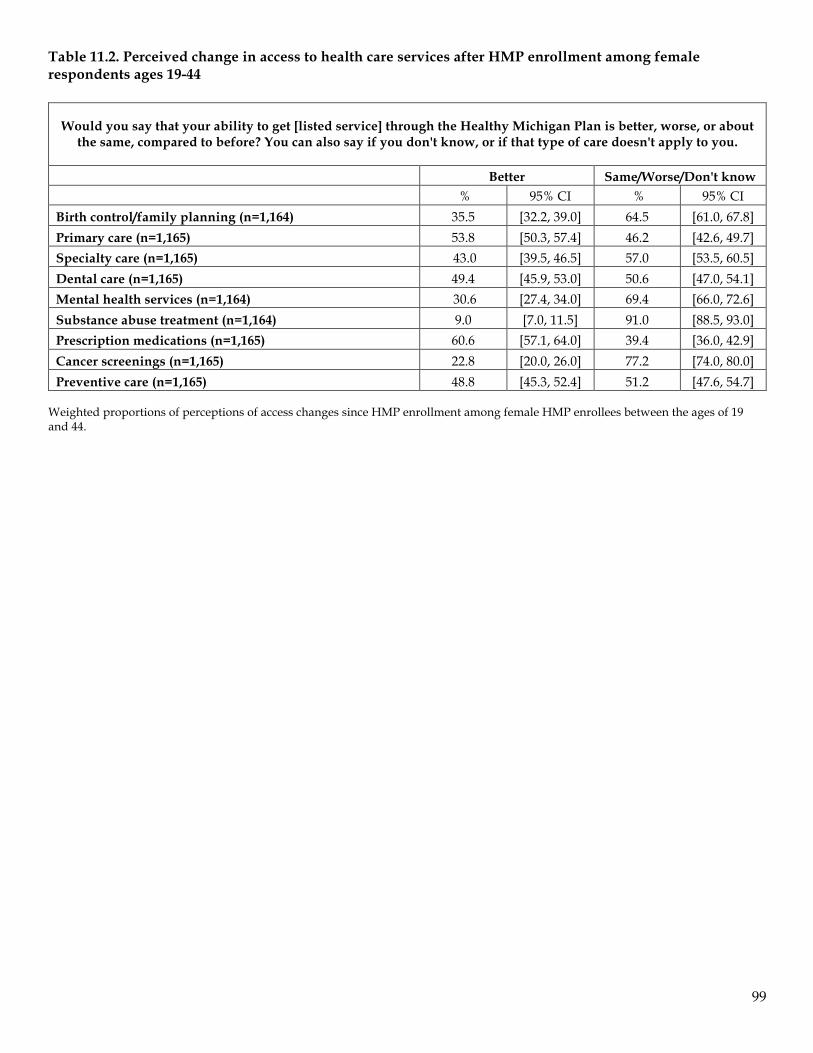
99
Table 11.2. Perceived change in access to health care services after HMP enrollment among female respondents ages 19-44
Would you say that your ability to get [listed service] through the Healthy Michigan Plan is better, worse, or about the same, compared to before? You can also say if you don't know, or if that type of care doesn't apply to you.
Better Same/Worse/Don't know % 95% CI % 95% CI
Birth control/family planning (n=1,164) 35.5 [32.2, 39.0] 64.5 [61.0, 67.8] Primary care (n=1,165) 53.8 [50.3, 57.4] 46.2 [42.6, 49.7] Specialty care (n=1,165) 43.0 [39.5, 46.5] 57.0 [53.5, 60.5] Dental care (n=1,165) 49.4 [45.9, 53.0] 50.6 [47.0, 54.1] Mental health services (n=1,164) 30.6 [27.4, 34.0] 69.4 [66.0, 72.6] Substance abuse treatment (n=1,164) 9.0 [7.0, 11.5] 91.0 [88.5, 93.0] Prescription medications (n=1,165) 60.6 [57.1, 64.0] 39.4 [36.0, 42.9] Cancer screenings (n=1,165) 22.8 [20.0, 26.0] 77.2 [74.0, 80.0] Preventive care (n=1,165) 48.8 [45.3, 52.4] 51.2 [47.6, 54.7]
Weighted proportions of perceptions of access changes since HMP enrollment among female HMP enrollees between the ages of 19 and 44.
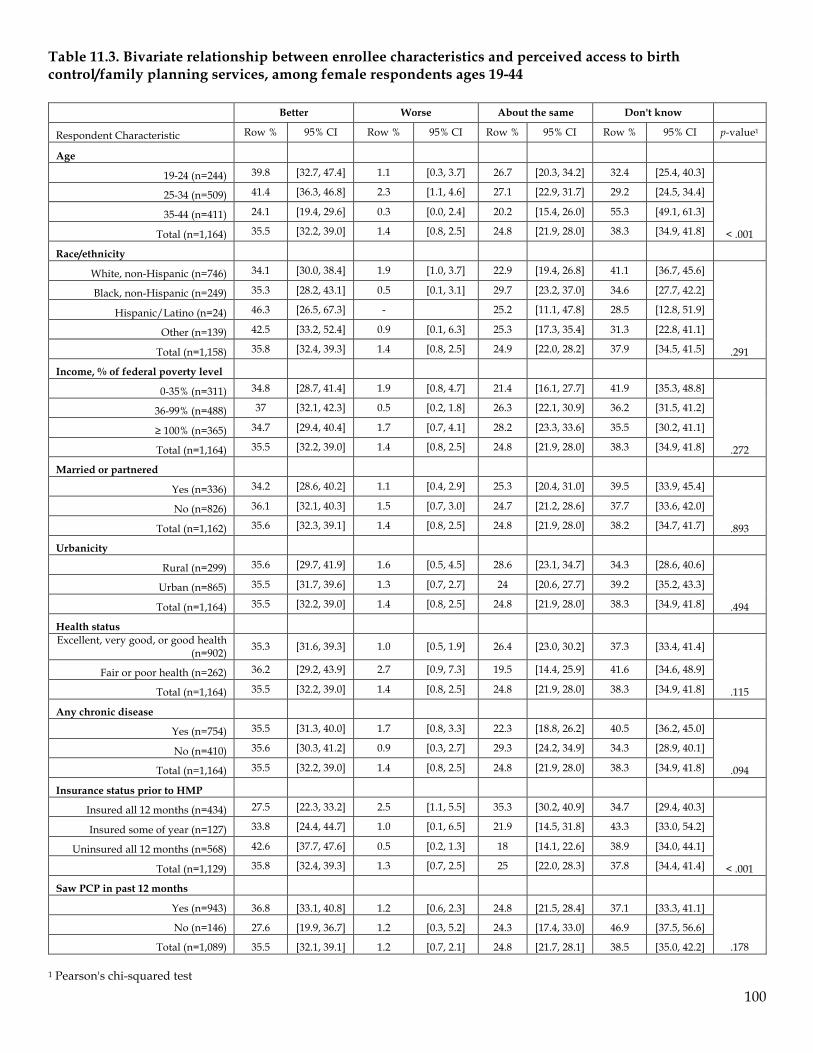
100
Table 11.3. Bivariate relationship between enrollee characteristics and perceived access to birth control/family planning services, among female respondents ages 19-44
Better Worse About the same Don't know
Respondent Characteristic Row % 95% CI Row % 95% CI Row % 95% CI Row % 95% CI p-value1
Age
19-24 (n=244) 39.8 [32.7, 47.4] 1.1 [0.3, 3.7] 26.7 [20.3, 34.2] 32.4 [25.4, 40.3]
< .001
25-34 (n=509) 41.4 [36.3, 46.8] 2.3 [1.1, 4.6] 27.1 [22.9, 31.7] 29.2 [24.5, 34.4]
35-44 (n=411) 24.1 [19.4, 29.6] 0.3 [0.0, 2.4] 20.2 [15.4, 26.0] 55.3 [49.1, 61.3]
Total (n=1,164) 35.5 [32.2, 39.0] 1.4 [0.8, 2.5] 24.8 [21.9, 28.0] 38.3 [34.9, 41.8]
Race/ethnicity
White, non-Hispanic (n=746) 34.1 [30.0, 38.4] 1.9 [1.0, 3.7] 22.9 [19.4, 26.8] 41.1 [36.7, 45.6]
.291
Black, non-Hispanic (n=249) 35.3 [28.2, 43.1] 0.5 [0.1, 3.1] 29.7 [23.2, 37.0] 34.6 [27.7, 42.2]
Hispanic/Latino (n=24) 46.3 [26.5, 67.3] - 25.2 [11.1, 47.8] 28.5 [12.8, 51.9]
Other (n=139) 42.5 [33.2, 52.4] 0.9 [0.1, 6.3] 25.3 [17.3, 35.4] 31.3 [22.8, 41.1]
Total (n=1,158) 35.8 [32.4, 39.3] 1.4 [0.8, 2.5] 24.9 [22.0, 28.2] 37.9 [34.5, 41.5]
Income, % of federal poverty level
0-35% (n=311) 34.8 [28.7, 41.4] 1.9 [0.8, 4.7] 21.4 [16.1, 27.7] 41.9 [35.3, 48.8]
.272
36-99% (n=488) 37 [32.1, 42.3] 0.5 [0.2, 1.8] 26.3 [22.1, 30.9] 36.2 [31.5, 41.2]
≥ 100% (n=365) 34.7 [29.4, 40.4] 1.7 [0.7, 4.1] 28.2 [23.3, 33.6] 35.5 [30.2, 41.1]
Total (n=1,164) 35.5 [32.2, 39.0] 1.4 [0.8, 2.5] 24.8 [21.9, 28.0] 38.3 [34.9, 41.8]
Married or partnered
Yes (n=336) 34.2 [28.6, 40.2] 1.1 [0.4, 2.9] 25.3 [20.4, 31.0] 39.5 [33.9, 45.4]
.893
No (n=826) 36.1 [32.1, 40.3] 1.5 [0.7, 3.0] 24.7 [21.2, 28.6] 37.7 [33.6, 42.0]
Total (n=1,162) 35.6 [32.3, 39.1] 1.4 [0.8, 2.5] 24.8 [21.9, 28.0] 38.2 [34.7, 41.7]
Urbanicity
Rural (n=299) 35.6 [29.7, 41.9] 1.6 [0.5, 4.5] 28.6 [23.1, 34.7] 34.3 [28.6, 40.6]
.494
Urban (n=865) 35.5 [31.7, 39.6] 1.3 [0.7, 2.7] 24 [20.6, 27.7] 39.2 [35.2, 43.3]
Total (n=1,164) 35.5 [32.2, 39.0] 1.4 [0.8, 2.5] 24.8 [21.9, 28.0] 38.3 [34.9, 41.8]
Health status Excellent, very good, or good health
(n=902) 35.3 [31.6, 39.3] 1.0 [0.5, 1.9] 26.4 [23.0, 30.2] 37.3 [33.4, 41.4]
.115
Fair or poor health (n=262) 36.2 [29.2, 43.9] 2.7 [0.9, 7.3] 19.5 [14.4, 25.9] 41.6 [34.6, 48.9]
Total (n=1,164) 35.5 [32.2, 39.0] 1.4 [0.8, 2.5] 24.8 [21.9, 28.0] 38.3 [34.9, 41.8]
Any chronic disease
Yes (n=754) 35.5 [31.3, 40.0] 1.7 [0.8, 3.3] 22.3 [18.8, 26.2] 40.5 [36.2, 45.0]
.094
No (n=410) 35.6 [30.3, 41.2] 0.9 [0.3, 2.7] 29.3 [24.2, 34.9] 34.3 [28.9, 40.1]
Total (n=1,164) 35.5 [32.2, 39.0] 1.4 [0.8, 2.5] 24.8 [21.9, 28.0] 38.3 [34.9, 41.8]
Insurance status prior to HMP
Insured all 12 months (n=434) 27.5 [22.3, 33.2] 2.5 [1.1, 5.5] 35.3 [30.2, 40.9] 34.7 [29.4, 40.3]
< .001
Insured some of year (n=127) 33.8 [24.4, 44.7] 1.0 [0.1, 6.5] 21.9 [14.5, 31.8] 43.3 [33.0, 54.2]
Uninsured all 12 months (n=568) 42.6 [37.7, 47.6] 0.5 [0.2, 1.3] 18 [14.1, 22.6] 38.9 [34.0, 44.1]
Total (n=1,129) 35.8 [32.4, 39.3] 1.3 [0.7, 2.5] 25 [22.0, 28.3] 37.8 [34.4, 41.4]
Saw PCP in past 12 months
Yes (n=943) 36.8 [33.1, 40.8] 1.2 [0.6, 2.3] 24.8 [21.5, 28.4] 37.1 [33.3, 41.1]
.178
No (n=146) 27.6 [19.9, 36.7] 1.2 [0.3, 5.2] 24.3 [17.4, 33.0] 46.9 [37.5, 56.6]
Total (n=1,089) 35.5 [32.1, 39.1] 1.2 [0.7, 2.1] 24.8 [21.7, 28.1] 38.5 [35.0, 42.2]
1 Pearson's chi-squared test
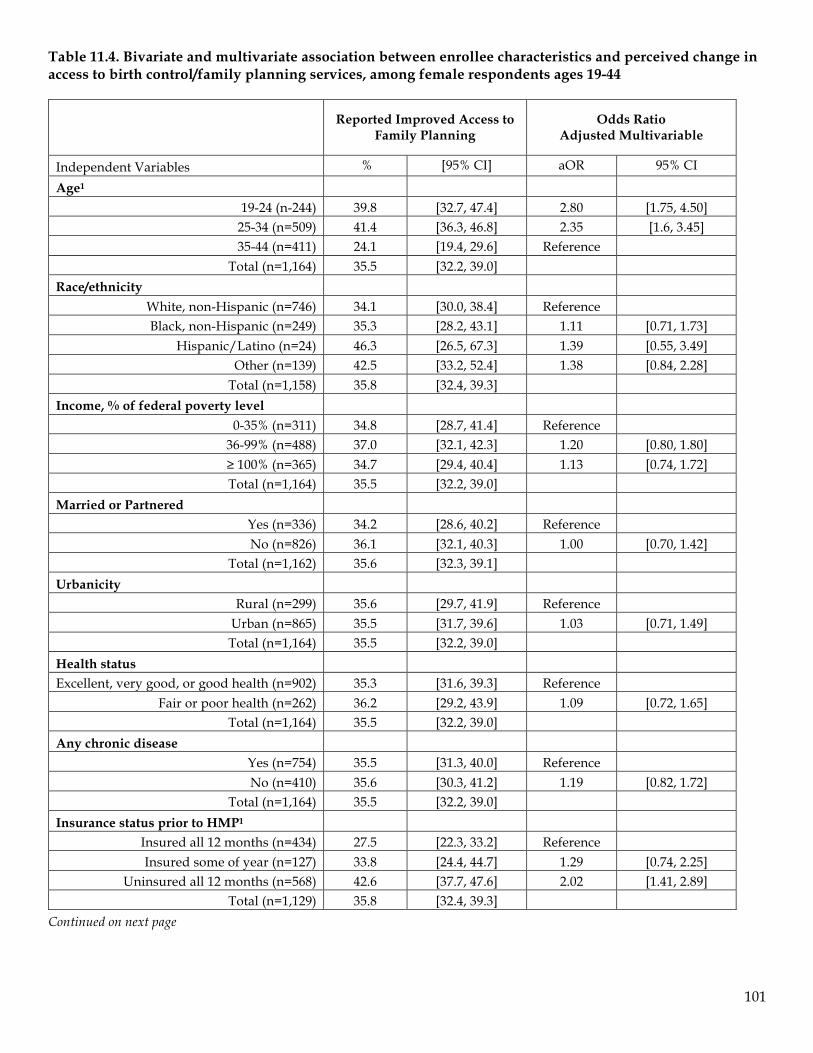
101
Table 11.4. Bivariate and multivariate association between enrollee characteristics and perceived change in access to birth control/family planning services, among female respondents ages 19-44
Reported Improved Access to Family Planning
Odds Ratio Adjusted Multivariable
Independent Variables % [95% CI] aOR 95% CI
Age1 19-24 (n-244) 39.8 [32.7, 47.4] 2.80 [1.75, 4.50]
25-34 (n=509) 41.4 [36.3, 46.8] 2.35 [1.6, 3.45] 35-44 (n=411) 24.1 [19.4, 29.6] Reference
Total (n=1,164) 35.5 [32.2, 39.0] Race/ethnicity
White, non-Hispanic (n=746) 34.1 [30.0, 38.4] Reference Black, non-Hispanic (n=249) 35.3 [28.2, 43.1] 1.11 [0.71, 1.73]
Hispanic/Latino (n=24) 46.3 [26.5, 67.3] 1.39 [0.55, 3.49] Other (n=139) 42.5 [33.2, 52.4] 1.38 [0.84, 2.28]
Total (n=1,158) 35.8 [32.4, 39.3] Income, % of federal poverty level
0-35% (n=311) 34.8 [28.7, 41.4] Reference 36-99% (n=488) 37.0 [32.1, 42.3] 1.20 [0.80, 1.80] ≥ 100% (n=365) 34.7 [29.4, 40.4] 1.13 [0.74, 1.72] Total (n=1,164) 35.5 [32.2, 39.0]
Married or Partnered Yes (n=336) 34.2 [28.6, 40.2] Reference No (n=826) 36.1 [32.1, 40.3] 1.00 [0.70, 1.42]
Total (n=1,162) 35.6 [32.3, 39.1] Urbanicity
Rural (n=299) 35.6 [29.7, 41.9] Reference Urban (n=865) 35.5 [31.7, 39.6] 1.03 [0.71, 1.49] Total (n=1,164) 35.5 [32.2, 39.0]
Health status Excellent, very good, or good health (n=902) 35.3 [31.6, 39.3] Reference
Fair or poor health (n=262) 36.2 [29.2, 43.9] 1.09 [0.72, 1.65] Total (n=1,164) 35.5 [32.2, 39.0]
Any chronic disease Yes (n=754) 35.5 [31.3, 40.0] Reference No (n=410) 35.6 [30.3, 41.2] 1.19 [0.82, 1.72]
Total (n=1,164) 35.5 [32.2, 39.0] Insurance status prior to HMP1
Insured all 12 months (n=434) 27.5 [22.3, 33.2] Reference Insured some of year (n=127) 33.8 [24.4, 44.7] 1.29 [0.74, 2.25]
Uninsured all 12 months (n=568) 42.6 [37.7, 47.6] 2.02 [1.41, 2.89] Total (n=1,129) 35.8 [32.4, 39.3]
Continued on next page
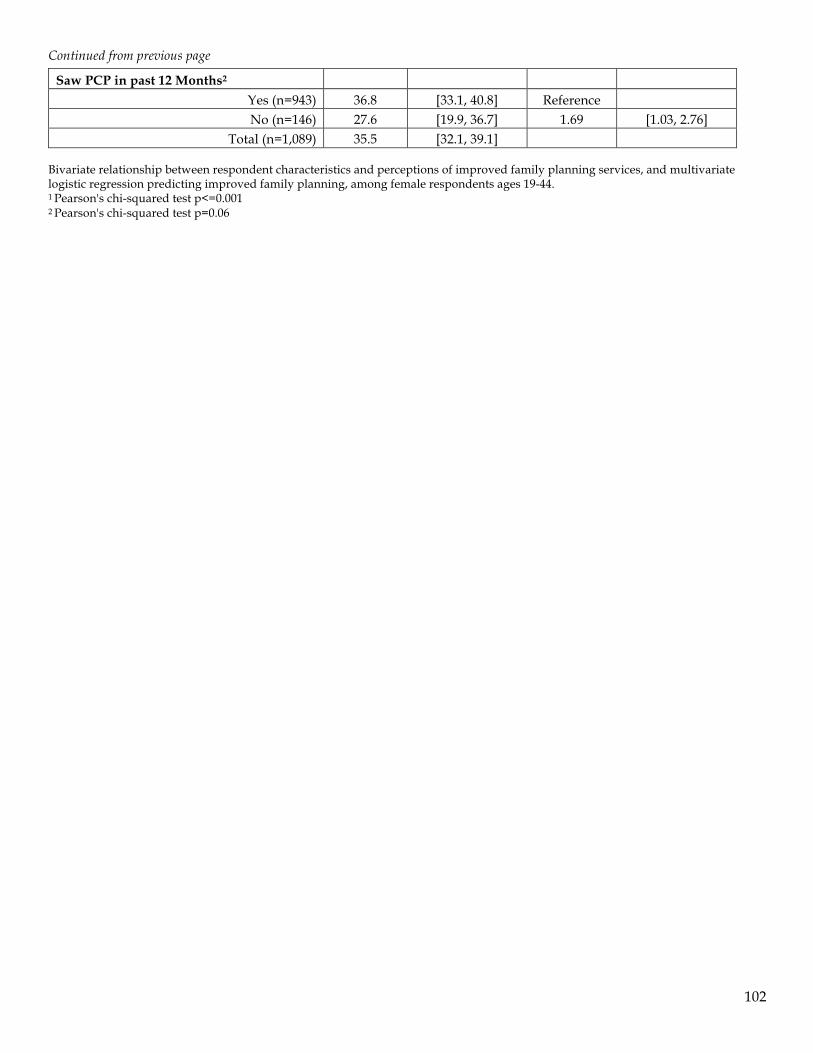
102
Continued from previous page
Saw PCP in past 12 Months2 Yes (n=943) 36.8 [33.1, 40.8] Reference No (n=146) 27.6 [19.9, 36.7] 1.69 [1.03, 2.76]
Total (n=1,089) 35.5 [32.1, 39.1] Bivariate relationship between respondent characteristics and perceptions of improved family planning services, and multivariate logistic regression predicting improved family planning, among female respondents ages 19-44. 1 Pearson's chi-squared test p<=0.001 2 Pearson's chi-squared test p=0.06
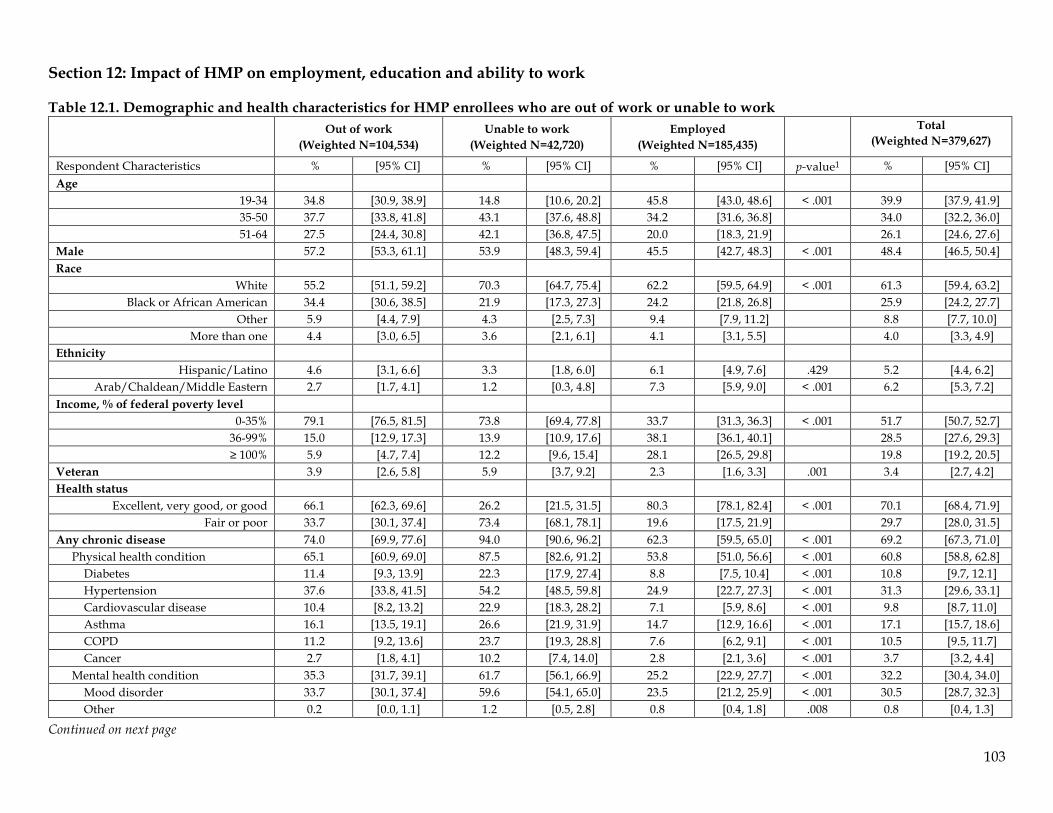
103
Section 12: Impact of HMP on employment, education and ability to work Table 12.1. Demographic and health characteristics for HMP enrollees who are out of work or unable to work
Out of work
(Weighted N=104,534) Unable to work
(Weighted N=42,720) Employed
(Weighted N=185,435) Total
(Weighted N=379,627)
Respondent Characteristics % [95% CI] % [95% CI] % [95% CI] p-value1 % [95% CI] Age
19-34 34.8 [30.9, 38.9] 14.8 [10.6, 20.2] 45.8 [43.0, 48.6] < .001 39.9 [37.9, 41.9] 35-50 37.7 [33.8, 41.8] 43.1 [37.6, 48.8] 34.2 [31.6, 36.8] 34.0 [32.2, 36.0] 51-64 27.5 [24.4, 30.8] 42.1 [36.8, 47.5] 20.0 [18.3, 21.9] 26.1 [24.6, 27.6]
Male 57.2 [53.3, 61.1] 53.9 [48.3, 59.4] 45.5 [42.7, 48.3] < .001 48.4 [46.5, 50.4] Race
White 55.2 [51.1, 59.2] 70.3 [64.7, 75.4] 62.2 [59.5, 64.9] < .001 61.3 [59.4, 63.2] Black or African American 34.4 [30.6, 38.5] 21.9 [17.3, 27.3] 24.2 [21.8, 26.8] 25.9 [24.2, 27.7]
Other 5.9 [4.4, 7.9] 4.3 [2.5, 7.3] 9.4 [7.9, 11.2] 8.8 [7.7, 10.0] More than one 4.4 [3.0, 6.5] 3.6 [2.1, 6.1] 4.1 [3.1, 5.5] 4.0 [3.3, 4.9]
Ethnicity Hispanic/Latino 4.6 [3.1, 6.6] 3.3 [1.8, 6.0] 6.1 [4.9, 7.6] .429 5.2 [4.4, 6.2]
Arab/Chaldean/Middle Eastern 2.7 [1.7, 4.1] 1.2 [0.3, 4.8] 7.3 [5.9, 9.0] < .001 6.2 [5.3, 7.2] Income, % of federal poverty level
0-35% 79.1 [76.5, 81.5] 73.8 [69.4, 77.8] 33.7 [31.3, 36.3] < .001 51.7 [50.7, 52.7] 36-99% 15.0 [12.9, 17.3] 13.9 [10.9, 17.6] 38.1 [36.1, 40.1] 28.5 [27.6, 29.3] ≥ 100% 5.9 [4.7, 7.4] 12.2 [9.6, 15.4] 28.1 [26.5, 29.8] 19.8 [19.2, 20.5]
Veteran 3.9 [2.6, 5.8] 5.9 [3.7, 9.2] 2.3 [1.6, 3.3] .001 3.4 [2.7, 4.2] Health status
Excellent, very good, or good 66.1 [62.3, 69.6] 26.2 [21.5, 31.5] 80.3 [78.1, 82.4] < .001 70.1 [68.4, 71.9] Fair or poor 33.7 [30.1, 37.4] 73.4 [68.1, 78.1] 19.6 [17.5, 21.9] 29.7 [28.0, 31.5]
Any chronic disease 74.0 [69.9, 77.6] 94.0 [90.6, 96.2] 62.3 [59.5, 65.0] < .001 69.2 [67.3, 71.0] Physical health condition 65.1 [60.9, 69.0] 87.5 [82.6, 91.2] 53.8 [51.0, 56.6] < .001 60.8 [58.8, 62.8]
Diabetes 11.4 [9.3, 13.9] 22.3 [17.9, 27.4] 8.8 [7.5, 10.4] < .001 10.8 [9.7, 12.1] Hypertension 37.6 [33.8, 41.5] 54.2 [48.5, 59.8] 24.9 [22.7, 27.3] < .001 31.3 [29.6, 33.1] Cardiovascular disease 10.4 [8.2, 13.2] 22.9 [18.3, 28.2] 7.1 [5.9, 8.6] < .001 9.8 [8.7, 11.0] Asthma 16.1 [13.5, 19.1] 26.6 [21.9, 31.9] 14.7 [12.9, 16.6] < .001 17.1 [15.7, 18.6] COPD 11.2 [9.2, 13.6] 23.7 [19.3, 28.8] 7.6 [6.2, 9.1] < .001 10.5 [9.5, 11.7] Cancer 2.7 [1.8, 4.1] 10.2 [7.4, 14.0] 2.8 [2.1, 3.6] < .001 3.7 [3.2, 4.4]
Mental health condition 35.3 [31.7, 39.1] 61.7 [56.1, 66.9] 25.2 [22.9, 27.7] < .001 32.2 [30.4, 34.0] Mood disorder 33.7 [30.1, 37.4] 59.6 [54.1, 65.0] 23.5 [21.2, 25.9] < .001 30.5 [28.7, 32.3] Other 0.2 [0.0, 1.1] 1.2 [0.5, 2.8] 0.8 [0.4, 1.8] .008 0.8 [0.4, 1.3]
Continued on next page
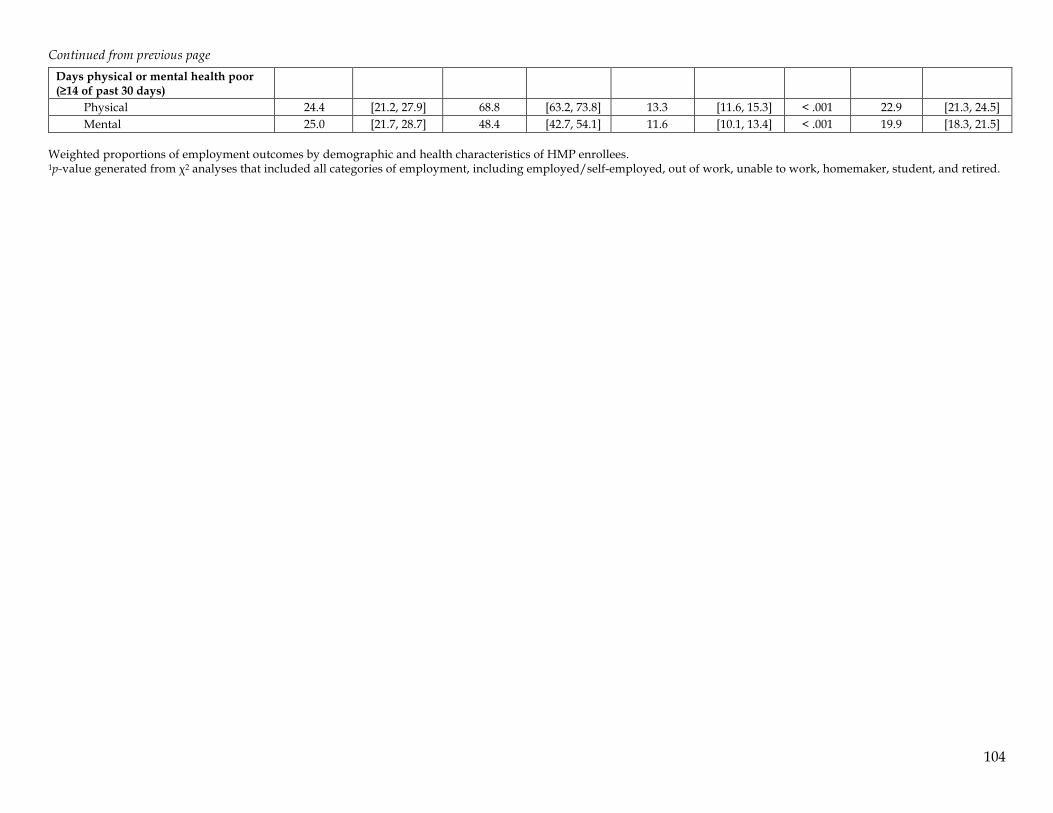
104
Continued from previous page
Days physical or mental health poor (≥14 of past 30 days)
Physical 24.4 [21.2, 27.9] 68.8 [63.2, 73.8] 13.3 [11.6, 15.3] < .001 22.9 [21.3, 24.5] Mental 25.0 [21.7, 28.7] 48.4 [42.7, 54.1] 11.6 [10.1, 13.4] < .001 19.9 [18.3, 21.5]
Weighted proportions of employment outcomes by demographic and health characteristics of HMP enrollees. 1p-value generated from χ2 analyses that included all categories of employment, including employed/self-employed, out of work, unable to work, homemaker, student, and retired.
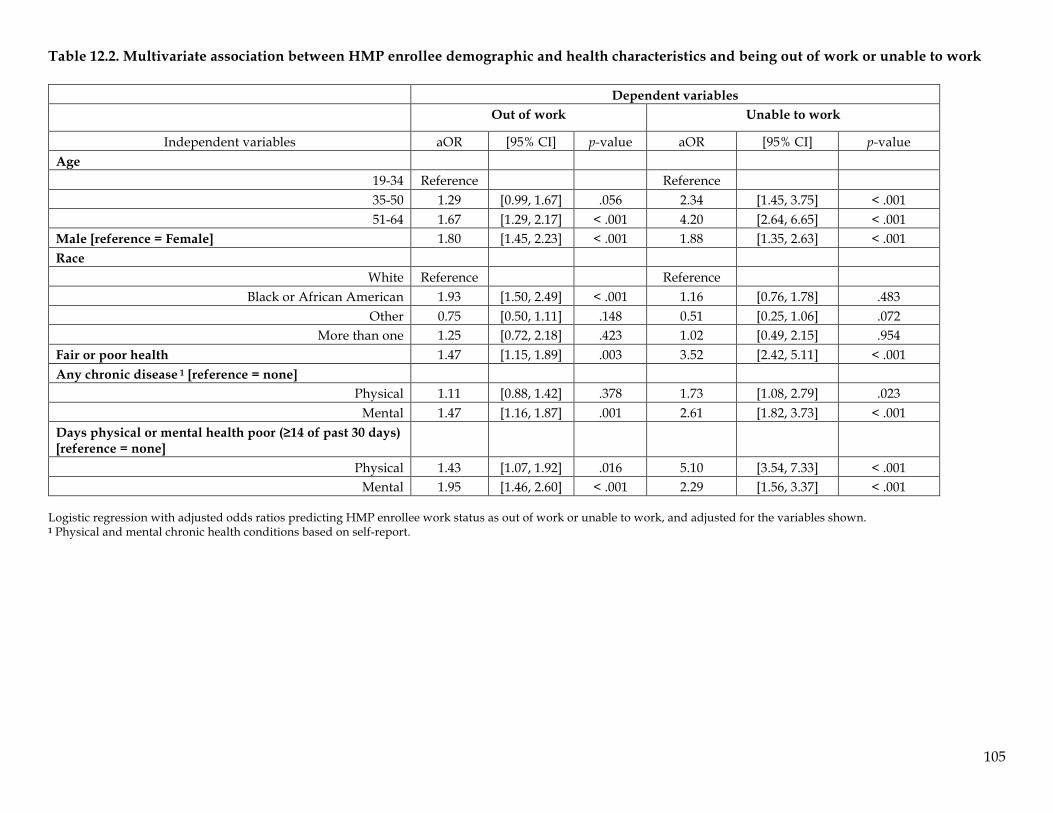
105
Table 12.2. Multivariate association between HMP enrollee demographic and health characteristics and being out of work or unable to work
Dependent variables Out of work Unable to work
Independent variables aOR [95% CI] p-value aOR [95% CI] p-value Age
19-34 Reference Reference 35-50 1.29 [0.99, 1.67] .056 2.34 [1.45, 3.75] < .001 51-64 1.67 [1.29, 2.17] < .001 4.20 [2.64, 6.65] < .001
Male [reference = Female] 1.80 [1.45, 2.23] < .001 1.88 [1.35, 2.63] < .001 Race
White Reference Reference Black or African American 1.93 [1.50, 2.49] < .001 1.16 [0.76, 1.78] .483
Other 0.75 [0.50, 1.11] .148 0.51 [0.25, 1.06] .072 More than one 1.25 [0.72, 2.18] .423 1.02 [0.49, 2.15] .954
Fair or poor health 1.47 [1.15, 1.89] .003 3.52 [2.42, 5.11] < .001 Any chronic disease 1 [reference = none]
Physical 1.11 [0.88, 1.42] .378 1.73 [1.08, 2.79] .023 Mental 1.47 [1.16, 1.87] .001 2.61 [1.82, 3.73] < .001
Days physical or mental health poor (≥14 of past 30 days) [reference = none]
Physical 1.43 [1.07, 1.92] .016 5.10 [3.54, 7.33] < .001 Mental 1.95 [1.46, 2.60] < .001 2.29 [1.56, 3.37] < .001
Logistic regression with adjusted odds ratios predicting HMP enrollee work status as out of work or unable to work, and adjusted for the variables shown. 1 Physical and mental chronic health conditions based on self-report.
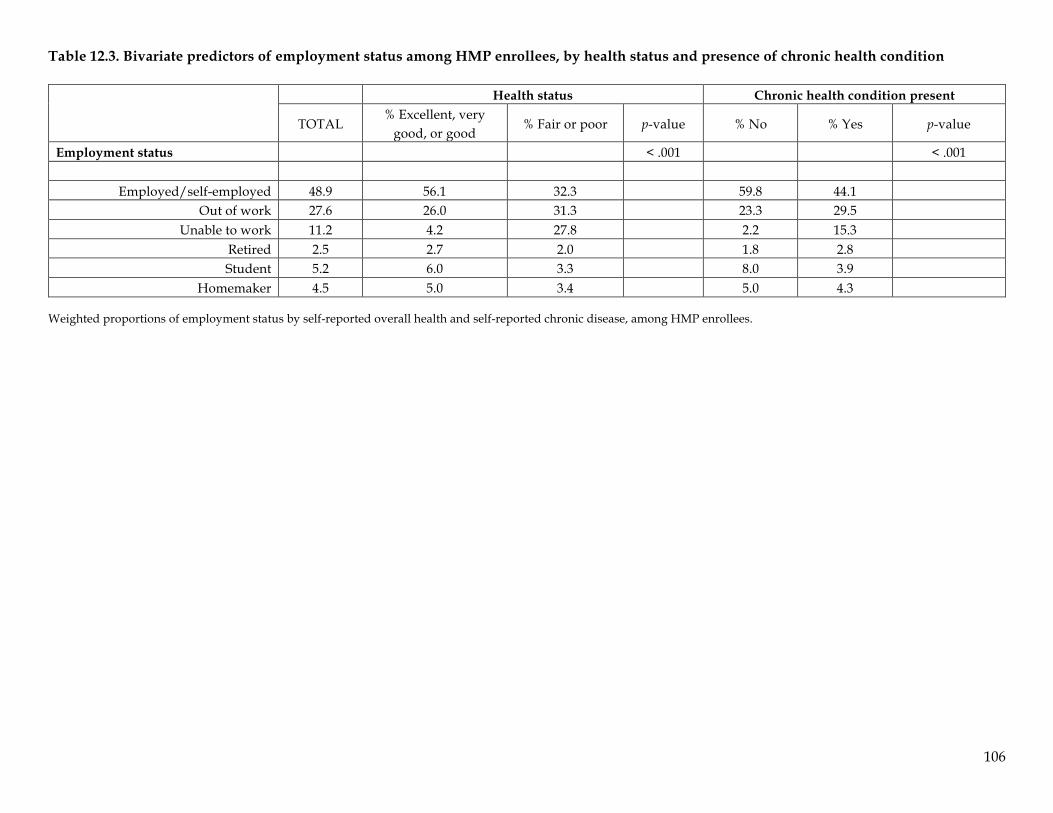
106
Table 12.3. Bivariate predictors of employment status among HMP enrollees, by health status and presence of chronic health condition
Health status Chronic health condition present
TOTAL % Excellent, very
good, or good % Fair or poor p-value % No % Yes p-value
Employment status < .001 < .001
Employed/self-employed 48.9 56.1 32.3 59.8 44.1 Out of work 27.6 26.0 31.3 23.3 29.5
Unable to work 11.2 4.2 27.8 2.2 15.3 Retired 2.5 2.7 2.0 1.8 2.8 Student 5.2 6.0 3.3 8.0 3.9
Homemaker 4.5 5.0 3.4 5.0 4.3 Weighted proportions of employment status by self-reported overall health and self-reported chronic disease, among HMP enrollees.
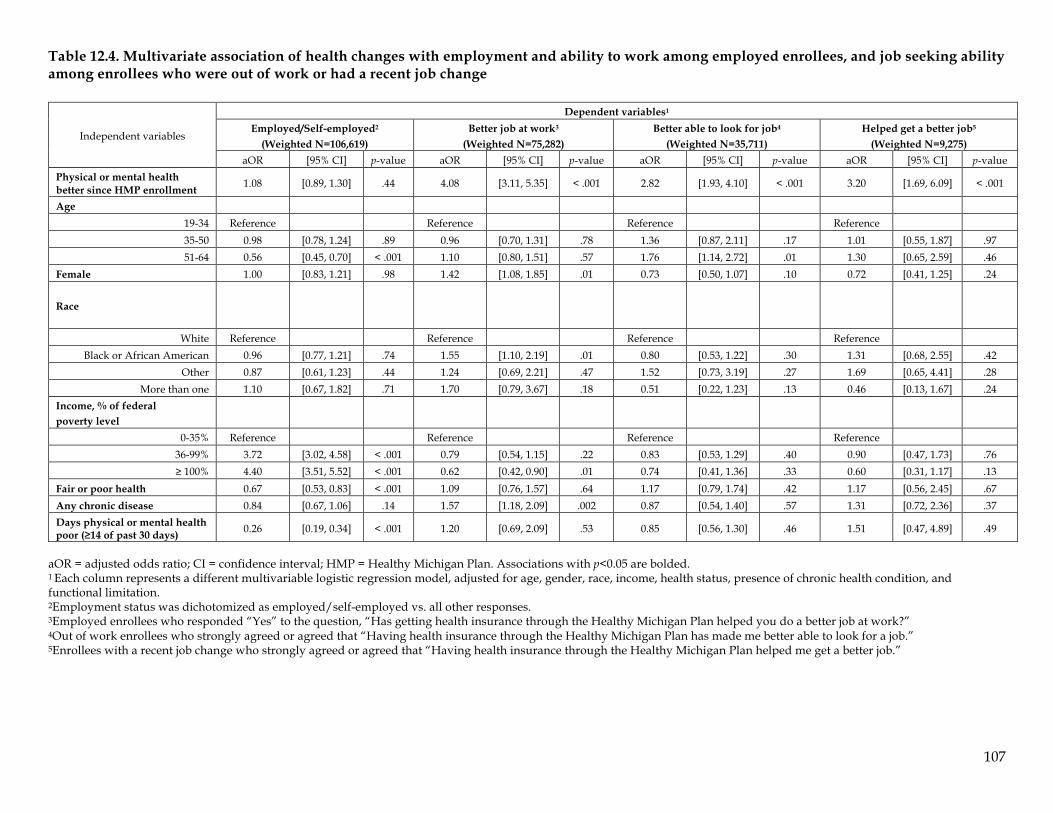
107
Table 12.4. Multivariate association of health changes with employment and ability to work among employed enrollees, and job seeking ability among enrollees who were out of work or had a recent job change
Independent variables
Dependent variables1 Employed/Self-employed2
(Weighted N=106,619) Better job at work3
(Weighted N=75,282) Better able to look for job4
(Weighted N=35,711) Helped get a better job5
(Weighted N=9,275) aOR [95% CI] p-value aOR [95% CI] p-value aOR [95% CI] p-value aOR [95% CI] p-value
Physical or mental health better since HMP enrollment 1.08 [0.89, 1.30] .44 4.08 [3.11, 5.35] < .001 2.82 [1.93, 4.10] < .001 3.20 [1.69, 6.09] < .001
Age 19-34 Reference Reference Reference Reference 35-50 0.98 [0.78, 1.24] .89 0.96 [0.70, 1.31] .78 1.36 [0.87, 2.11] .17 1.01 [0.55, 1.87] .97 51-64 0.56 [0.45, 0.70] < .001 1.10 [0.80, 1.51] .57 1.76 [1.14, 2.72] .01 1.30 [0.65, 2.59] .46
Female 1.00 [0.83, 1.21] .98 1.42 [1.08, 1.85] .01 0.73 [0.50, 1.07] .10 0.72 [0.41, 1.25] .24
Race
White Reference Reference Reference Reference Black or African American 0.96 [0.77, 1.21] .74 1.55 [1.10, 2.19] .01 0.80 [0.53, 1.22] .30 1.31 [0.68, 2.55] .42
Other 0.87 [0.61, 1.23] .44 1.24 [0.69, 2.21] .47 1.52 [0.73, 3.19] .27 1.69 [0.65, 4.41] .28 More than one 1.10 [0.67, 1.82] .71 1.70 [0.79, 3.67] .18 0.51 [0.22, 1.23] .13 0.46 [0.13, 1.67] .24
Income, % of federal poverty level
0-35% Reference Reference Reference Reference 36-99% 3.72 [3.02, 4.58] < .001 0.79 [0.54, 1.15] .22 0.83 [0.53, 1.29] .40 0.90 [0.47, 1.73] .76 ≥ 100% 4.40 [3.51, 5.52] < .001 0.62 [0.42, 0.90] .01 0.74 [0.41, 1.36] .33 0.60 [0.31, 1.17] .13
Fair or poor health 0.67 [0.53, 0.83] < .001 1.09 [0.76, 1.57] .64 1.17 [0.79, 1.74] .42 1.17 [0.56, 2.45] .67 Any chronic disease 0.84 [0.67, 1.06] .14 1.57 [1.18, 2.09] .002 0.87 [0.54, 1.40] .57 1.31 [0.72, 2.36] .37 Days physical or mental health poor (≥14 of past 30 days) 0.26 [0.19, 0.34] < .001 1.20 [0.69, 2.09] .53 0.85 [0.56, 1.30] .46 1.51 [0.47, 4.89] .49
aOR = adjusted odds ratio; CI = confidence interval; HMP = Healthy Michigan Plan. Associations with p<0.05 are bolded. 1 Each column represents a different multivariable logistic regression model, adjusted for age, gender, race, income, health status, presence of chronic health condition, and functional limitation. 2Employment status was dichotomized as employed/self-employed vs. all other responses. 3Employed enrollees who responded “Yes” to the question, “Has getting health insurance through the Healthy Michigan Plan helped you do a better job at work?” 4Out of work enrollees who strongly agreed or agreed that “Having health insurance through the Healthy Michigan Plan has made me better able to look for a job.” 5Enrollees with a recent job change who strongly agreed or agreed that “Having health insurance through the Healthy Michigan Plan helped me get a better job.”
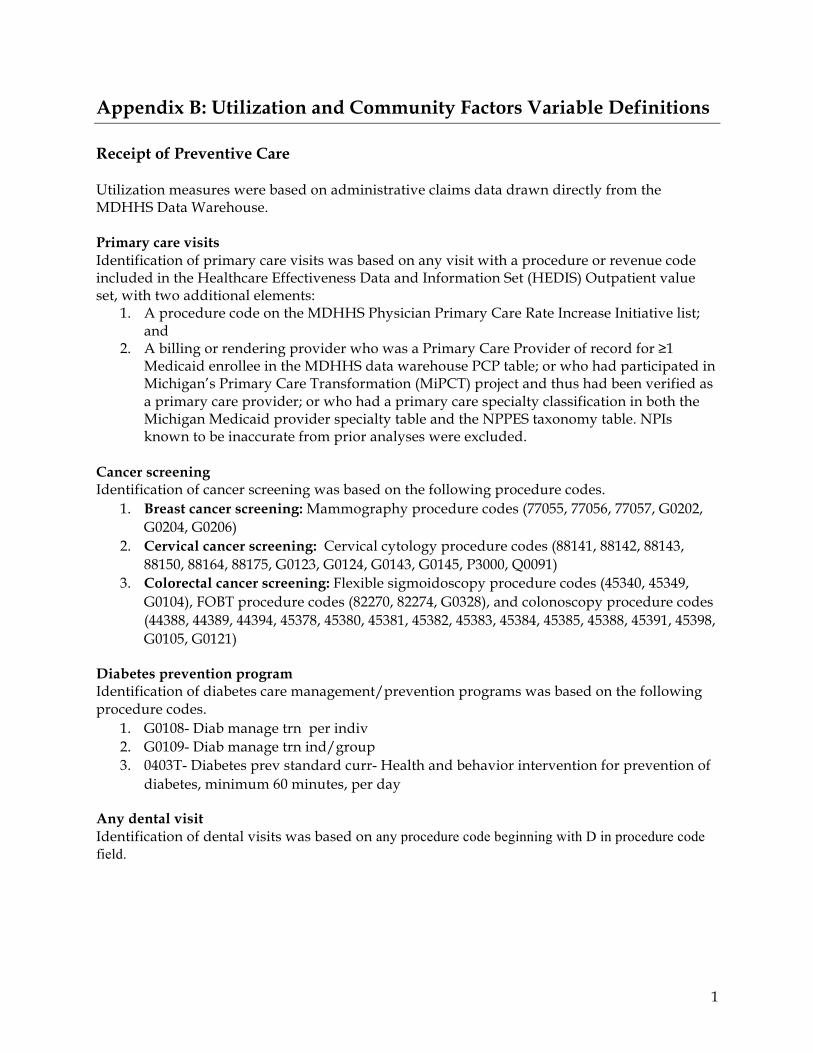
1
Appendix B: Utilization and Community Factors Variable Definitions Receipt of Preventive Care Utilization measures were based on administrative claims data drawn directly from the MDHHS Data Warehouse. Primary care visits Identification of primary care visits was based on any visit with a procedure or revenue code included in the Healthcare Effectiveness Data and Information Set (HEDIS) Outpatient value set, with two additional elements:
1. A procedure code on the MDHHS Physician Primary Care Rate Increase Initiative list; and
2. A billing or rendering provider who was a Primary Care Provider of record for ≥1 Medicaid enrollee in the MDHHS data warehouse PCP table; or who had participated in Michigan’s Primary Care Transformation (MiPCT) project and thus had been verified as a primary care provider; or who had a primary care specialty classification in both the Michigan Medicaid provider specialty table and the NPPES taxonomy table. NPIs known to be inaccurate from prior analyses were excluded.
Cancer screening Identification of cancer screening was based on the following procedure codes.
1. Breast cancer screening: Mammography procedure codes (77055, 77056, 77057, G0202, G0204, G0206)
2. Cervical cancer screening: Cervical cytology procedure codes (88141, 88142, 88143, 88150, 88164, 88175, G0123, G0124, G0143, G0145, P3000, Q0091)
3. Colorectal cancer screening: Flexible sigmoidoscopy procedure codes (45340, 45349, G0104), FOBT procedure codes (82270, 82274, G0328), and colonoscopy procedure codes (44388, 44389, 44394, 45378, 45380, 45381, 45382, 45383, 45384, 45385, 45388, 45391, 45398, G0105, G0121)
Diabetes prevention program Identification of diabetes care management/prevention programs was based on the following procedure codes.
1. G0108- Diab manage trn per indiv 2. G0109- Diab manage trn ind/group 3. 0403T- Diabetes prev standard curr- Health and behavior intervention for prevention of
diabetes, minimum 60 minutes, per day
Any dental visit Identification of dental visits was based on any procedure code beginning with D in procedure code field.
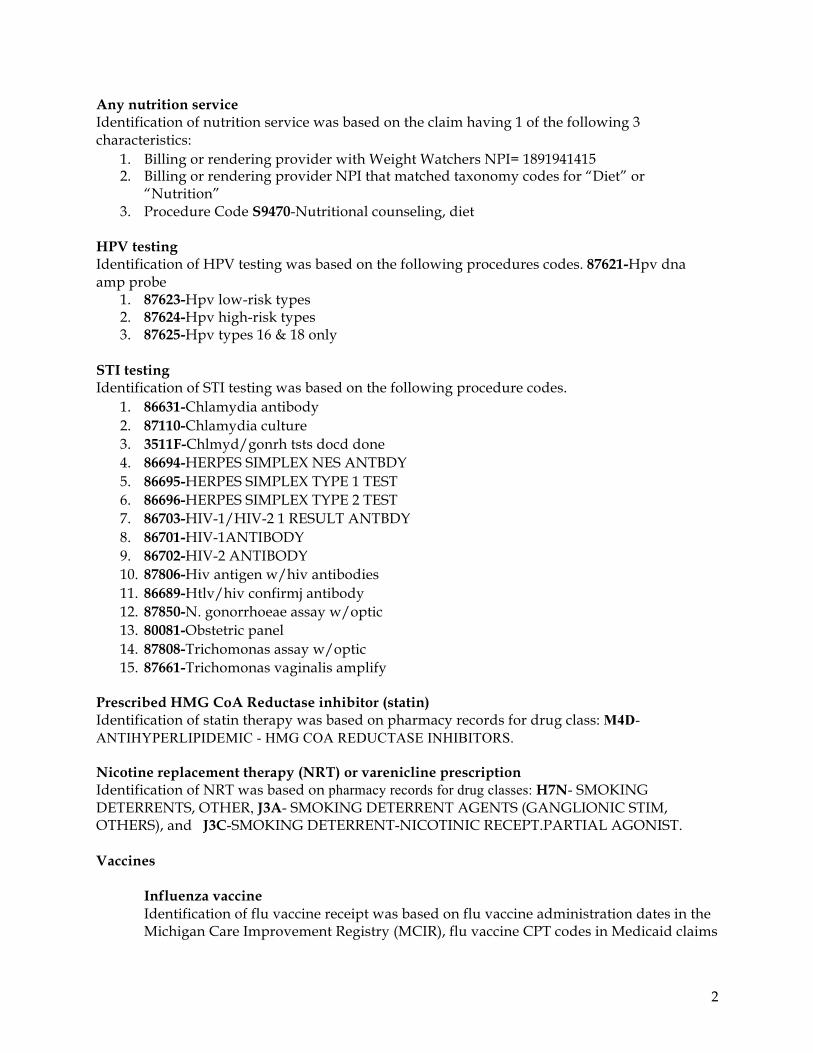
2
Any nutrition service Identification of nutrition service was based on the claim having 1 of the following 3 characteristics:
1. Billing or rendering provider with Weight Watchers NPI= 1891941415 2. Billing or rendering provider NPI that matched taxonomy codes for “Diet” or
“Nutrition” 3. Procedure Code S9470-Nutritional counseling, diet
HPV testing Identification of HPV testing was based on the following procedures codes. 87621-Hpv dna amp probe
1. 87623-Hpv low-risk types 2. 87624-Hpv high-risk types 3. 87625-Hpv types 16 & 18 only
STI testing Identification of STI testing was based on the following procedure codes.
1. 86631-Chlamydia antibody 2. 87110-Chlamydia culture 3. 3511F-Chlmyd/gonrh tsts docd done 4. 86694-HERPES SIMPLEX NES ANTBDY 5. 86695-HERPES SIMPLEX TYPE 1 TEST 6. 86696-HERPES SIMPLEX TYPE 2 TEST 7. 86703-HIV-1/HIV-2 1 RESULT ANTBDY 8. 86701-HIV-1ANTIBODY 9. 86702-HIV-2 ANTIBODY 10. 87806-Hiv antigen w/hiv antibodies 11. 86689-Htlv/hiv confirmj antibody 12. 87850-N. gonorrhoeae assay w/optic 13. 80081-Obstetric panel 14. 87808-Trichomonas assay w/optic 15. 87661-Trichomonas vaginalis amplify
Prescribed HMG CoA Reductase inhibitor (statin) Identification of statin therapy was based on pharmacy records for drug class: M4D- ANTIHYPERLIPIDEMIC - HMG COA REDUCTASE INHIBITORS. Nicotine replacement therapy (NRT) or varenicline prescription Identification of NRT was based on pharmacy records for drug classes: H7N- SMOKING DETERRENTS, OTHER, J3A- SMOKING DETERRENT AGENTS (GANGLIONIC STIM, OTHERS), and J3C-SMOKING DETERRENT-NICOTINIC RECEPT.PARTIAL AGONIST. Vaccines
Influenza vaccine Identification of flu vaccine receipt was based on flu vaccine administration dates in the Michigan Care Improvement Registry (MCIR), flu vaccine CPT codes in Medicaid claims
3
data, and flu vaccine NDC codes in the Medicaid pharmacy data; receipt of any flu vaccine during 2015 or 2016 calendar years is included in this analysis.
Pneumonia vaccine
Identification of pneumonia vaccine receipt was based on having at least one CPT code in Medicaid claims data, NDC code in the Medicaid pharmacy data, or MCIR record for a PCV13 or PPSV23 vaccine during CY2015 or 2016.
Other vaccines
Identification of any other vaccine receipt was based on having at least one CPT code in Medicaid claims data, NDC code in the Medicaid pharmacy data, or MCIR record for any listed vaccine during CY2015 or 2016. This includes Td/Tdap, Zoster, Hepatitis A and B, HIB, HPV, Meningitis or Meningitis B, Varicella, and MMR.
Any preventive service Any of the above services with the exception of primary care visits are included in this definition. Health Risk Assessment (HRA) Completion Data were extracted from the Health Risk Assessment (HRA) table in the data warehouse for the first 24 months from initial enrollment (i.e., the combined Year 1 and Year 2 period), along with any information obtained during the pre-HMP enrollment period of February-March 2014. This information was used to categorize each enrollee’s HRA status:
• HRA attestation – record includes physician attestation date, signaling completion of the HRA process
• HRA questions only – record includes enrollee responses to some/all questions on the patient portion of the HRA, but no physician attestation date
• No HRA record – lack of data for any HRA-related activity For enrollees with a physician attestation date, the record identified a healthy behavior status:
• Selected a healthy behavior • No healthy behaviors to address • Not ready for change • Serious condition / healthy behavior not required
Emergency Department Utilization Claims Identification of ED visits was based on specifications in the HEDIS Emergency Department Utilization (EDU) measure. Consistent with HEDIS, ED visits that resulted in an inpatient admission were not counted, and non-institutional/non-surgical ED visits that occurred a day prior to or after an institutional ED/Observation/Inpatient visit were removed. Two modifications of the HEDIS criteria were made, to allow results to represent the full range of ED utilization for the HMP population: (1) mental health/substance abuse ED visits were included, where HEDIS excludes them; and (2) three observation visit codes (G0378, G0379, revenue code 0762) were added to the HEDIS observation value set, along with codes G0380-G0384 for Hospital Type B emergency visits.
4
Chronic Conditions HEDIS definition: Identification of chronic disease (asthma, cardiovascular disease, COPD, and diabetes) was based on identification criteria outlined in the HEDIS 2016 Relative Resource Use (RRU) specifications, applied to each beneficiary’s first 24 months of HMP enrollment. Chronic Disease defined by claims-based diagnostic codes A second method of identifying chronic disease uses diagnosis codes including Alzheimer’s disease and related dementia, anemia, asthma, atrial fibrillation, cancer, chronic kidney disease, COPD, cystic fibrosis, deep venous thrombosis, diabetes mellitus, glaucoma, heart failure, hemophilia, HIV, hyperlipidemia, hypertension, ischemic heart disease, liver disease and other liver disorders, osteoporosis, arthritis, and stroke/transient ischemic attack.
Mental and behavioral health conditions or substance use disorders: Defined by Mental and Behavioral Disorders value set from HEDIS 2016. Tobacco use disorder was excluded from the list of mental and behavioral health conditions for this analysis. Individual and Community Factors Analysis Census/American Community Survey (ACS): American FactFinder, United States Census Bureau https://factfinder.census.gov All data is downloadable at the ZIP code level. Data is from the 2011-2015 ACS 5-year estimates unless otherwise noted. The following fields were included in the individual and community factor analysis.
Educational attainment • College Grads (% of population ages 25 and over) Insurance coverage (2009-2013 ACS data as pre-HMP comparator) • Percent uninsured of the civilian non-institutionalized population • Percent uninsured ages 18-64
County Health Rankings & Roadmaps: Robert Wood Johnson Foundation, http://www.countyhealthrankings.org/ Data is available on the county level, both as rankings within the state and some summary measures used to calculate those rankings. The following variables are used in the analysis.
Ratio of PCPs to population Source: Area Health Resource File/National Provider Identification File 2014 Definition: Ratio of population to primary care providers