report on the determination of the extent and role of...
TRANSCRIPT

1
Report on the determination of the extent and role of waste
picking in South Africa
2
Project team
Khabokhedi Waste Management (Pty) Ltd, the waste management and project management
team:
Sipho Makhasana
Nompilo Sidondi
Stephen Rule
Robin Richards
Godfrey Dlulane
Linda Sibeko
3
1 CONTENTS
List of Tables ........................................................................................................................ 5
2 Definitions ...................................................................................................................... 6
3 Executive Summary ....................................................................................................... 7
4 Introduction and background .......................................................................................... 8
4.1 Problem Statement ..................................................................................................... 9
4.2 Objectives of the study ............................................................................................... 9
4.3 Who are Waste Pickers ............................................................................................ 10
5 Research Methodology ................................................................................................ 11
5.1 Primary data ............................................................................................................. 11
5.2 Secondary data ........................................................................................................ 12
5.2.1 Preparations to conduct the study .................................................................. 12
5.2.2 Data collection and sampling methods ........................................................... 13
6 WASTE PICKERS ........................................................................................................ 13
6.1 Waste pickers from landfills ...................................................................................... 13
6.2 Trolley pushers ......................................................................................................... 14
7 Municipalities ............................................................................................................... 15
8 Recyclers ..................................................................................................................... 15
9 Reseachers and NON-GOVERNMENT ORGANISATIONS ......................................... 15
10 Limitations to the study................................................................................................. 16
11 Analysis and discussion of results ................................................................................ 17
11.1 Extent of waste pickers ............................................................................................. 17
11.2 Modes of operation of waste pickers ........................................................................ 18
11.2.1 Waste picker demographics ........................................................................... 18
11.2.2 Waste types collected and their economic value ............................................ 21
11.2.3 Landfill site operations ................................................................................... 24
11.2.4 Attitudinal profiles .......................................................................................... 29
4
12 Contribution of waste pickers to the recycling sector .................................................... 29
13 Challenges ................................................................................................................... 39
14 Recommendations ....................................................................................................... 39
14.1 Legal Framework ...................................................................................................... 39
14.2 Institutional Arrangements ........................................................................................ 40
14.3 Operational Matters .................................................................................................. 40
15 Conclusion ................................................................................................................... 41
15.1 Extent of waste picking in South Africa ..................................................................... 41
15.2 Contribution of Waste Pickers to the recycling sector ............................................... 41
15.3 Modes of operation of waste pickers ........................................................................ 42
15.4 Integration of Waste Pickers into the formal waste management system .................. 42
16 References ................................................................................................................... 42
17 Appendices .................................................................................................................. 43
17.1 List of landfill sites and number of waste pickers at sites visited ............................... 43
17.2 Appendix 2 ............................................................................................................... 65
List of Figures
Figure 1: Trolley Pusher ...................................................................................................... 11
Figure 2: A waste picker retrieving food at a landfill site in Mthatha ..................................... 11
Figure 3: Waste pickers collecting recyclables at Rooikraal Landfill Site, Tshwane Metro ... 11
Figure 4: Fieldworker training session in Johannesburg, April 2014 .................................... 12
Figure 5: Age and sex distribution of waste pickers ............................................................. 19
Figure 6: Average monthly earnngs of waste pickers by type of recyclable collected .......... 23
Figure 7: Comparison of quantities collected for recycling from formal companies versus waste
pickers ................................................................................................................................ 24
Figure 8: Transportation of recyclables to by back centre ................................................... 25
5
Figure 9: Illustration of price change per kilogram when material is collected versus delivered
........................................................................................................................................... 26
Figure 10: Waste Picker Attitudes towards the waste picking industry ................................ 28
Figure 11: Views of recycling companies on contribution of waste pickers to recycling ....... 29
Figure 12: View of municipalities on contribution of waste pickers to recycling .................... 30
Figure 13: View of recycling reseachers and NGOs on contribution of waste pickers to
recycling.............................................................................................................................. 30
List of Tables
Table 1:Selected sample of lanfill sites ............................................................................... 14
Table 2: Selected sample of trolley pushers ........................................................................ 14
Table 3: Recycling companies ............................................................................................ 15
Table 4: Research and NGOs bodies .................................................................................. 15
Table 5: Estimation of number of waste pickers operating at landfill sites across South Africa
........................................................................................................................................... 17
Table 6: Trolley pushers ...................................................................................................... 18
Table 7: Mean age of waste pickers by gender ................................................................... 18
Table 8: Provincial origins of waste pickers by current province of operation ...................... 20
Table 9: Province by language spokenby waste pickers ..................................................... 20
Table 10: Province by level of education of waste pickers ................................................... 21
Table 11: Types of waste collected, gender ratios and monthly earnings ............................ 21
Table 12: Prices paid by Recycling Companies................................................................... 23
Table 13: Operational dynamics of waste picking at landfills ............................................... 24
Table 14: Level of organisation of waste pickers ................................................................. 27
Table 15: International synopsis of Waste Picker organising and inclusion ........... 31-38Error!
Bookmark not defined.
6
2 DEFINITIONS
Buy-Back Centre Business that purchases recycled materials
Materials Recycling Facility (MRF) A specialised plant that receives and separates waste
streams according to their characteristics.
Proccessing facility A facility where recyclables are processed to produce
new material.
Recycler A person involved in the process where waste is
reclaimed for further use, which process involves the
separation of waste from a waste stream for further use
and the processing of that separated material as a
product or raw material;
Recyling A process where waste is reclaimed for further use,
which process involves the separation of waste from a
waste stream for further use and the processing of that
separated material as product or raw material;

7
3 EXECUTIVE SUMMARY
The South African population has, over the last few years, experienced unprecedented growth
which has had an impact on the country’s natural resources, urbanisation, waste production
and management. The pressure on the economy placed by the demographic and economic
phenomenon resulted in the economy shedding much needed jobs. This has led to many
communities exposed to joblessness and poverty. The generation of high volumes of waste
material by the economically active consumer population, especially in the urban areas fuelled
by urbanisation, has led to the emergence of the so called waste pickers generation.
As the custodian of the environment the national Department of Environmental Affairs (DEA)
was faced with the environmental challenges emerging from this social and economic
phenomenon presented by the waste picking activity. This led to the DEA commisioning a high
level study to investigate the extent, the mode of operation and the contribution, if any, of
waste picking in the recycling and overall economy. Following due process Khabokedi Waste
Mangement was appointed by the Department to conduct and execute the research of waste
pickers in South Africa.
The study was conducted using scientific research tools methodology at sampled landfills
sites and trolley pushing operations in South Africa. municipalities, waste pickers, recyclers,
researchers and non-government organisations(NGOs), were interviewed during the study.
The findings of the study are that :
i. There are plus / minus 62147 waste pickers in the country (36680 operating from
landfills and 25467 operating as trolley pushers);
ii. The gender split of the pickers is 50:50;
8
iii. Waste picking primarily takes place in urban areas;
iv. Majority of waste picking is in land fill sites;
v. Waste pickers are unorganised and informal;
vi. Waste pickers face health and safety challenges
vii. Waste pickers wish to be formalised and integrated into the waste economy.
4 INTRODUCTION AND BACKGROUND
South Africa has experienced the emergence of a a social class generally referred to as waste
pickers. So much has been said and written about this unclassified “class”. Waste pickers play
an important role in the recycling sector in South Africa. It is difficult to quantify the contribution
made by the waste pickers to the economy and the environment, it is however, generally
accepted that this activity makes a significant contribution to the recycling industry.
This contribution comes with its own challenges in terms of health and safety in this industry,
lack of regulation, relationship with municipalities (as owners of the facilities at which this
activity largely takes place), and the lack of understanding of the extent of waste picking in
South Africa. It is assumed that the existence of this activity is informed by socio-economic
factors.
Over the years South Africa has seen a drop in employment levels from well above the 30%
mark between 2001 and 2003, to slightly below 25% from 2008 (Index Mundi, 2011). The
unemployment rate has had a major influence on the increase in the waste picking activity.
It is on the basis of the above trend that the DEA took a decision to embark on a national
study to establish the nature, the extent and the contribution of waste picking in the country.
The study had to be conducted within the context of the legislative framework of waste
management in South Africa. Prior to the promulgation of the legislation, Waste Act 59 of 2008
(Waste Act), dealing with waste management activities was fragmented and in many instances
outdated. The advent of the Waste Act has ushered in the much needed focus on governing
and regulating waste management.

9
4.1 Problem Statement
Historically waste pickers have played an important role in the recycling sector in South Africa.
Although it is difficult to quantify the contribution made by the waste pickers, it is estimated to
be a significant contribution. It is thus important to ensure that the waste pickers are included
in future plans relating to waste management in the country.
The majority of waste pickers in SA operate on landfill sites and this has its advantages and
disadvantages. The advantages include the reduction in the amount of waste that has to be
landfilled as well as the monitoring role waste pickers play in spotting illegal behaviour. The
waste pickers are normally very well versed with the waste stream they deal with and the
landfill they operate on, as such know what is legal and what is not. However, the dangers to
the health of the waste pickers outweighs these advantages. Waste pickers operate without
any personal protective equipment (PPE) and hence handle waste directly, thereby getting
exposed to health risks. In addition, waste pickers are often in danger of being run down by
the trucks and/or the heavy machinery operating on the site. While the contribution of waste
pickers to the recycling sector is widely acknowledged, waste picking on landfill sites is not
encouraged (Reputation Matters, 2011).
On July 2 and 3, 2009, 100 waste pickers from 26 landfills in seven of South Africa’s nine
provinces gathered for South Africa’s First National Waste Picker Meeting.
Waste picking has introduced an unforeseen and unanticipated social problem in South Africa
affecting municipalities, industry and waste pickers themselves. This problem primarily
revolves around the health and safety of waste pickers and the perceived negative impact of
their operations in municipal facilities. In view of the fact that the extent of this industry, the
validity of the allegations and concerns and whether assistance is required or not are
unknown, the DEA resolved to conduct a scientific investigation to inform any action in this
field.
4.2 Objectives of the study
This study aims at determining the extent of waste picking as well as its contributions into the
recycling sector with the following specific objectives:
The extent of waste picking in South Africa;
The different modes of operation of waste pickers in South Africa;
The impact or contribution of waste pickers on waste management in South Africa; and

10
Ways in which waste pickers can be integrated in waste management in South Africa in
view of the current and future waste management systems based on the current policy
direction;
Develop training material for waste pickers covering the following:
Health and Safety issues relating to operating on landfill sites
The recycling value chain
Recycling business models that will assist waste pickers to understand the
business in order to avoid exploitation
4.3 Who are Waste Pickers
Waste pickers have been defined as people who “collect, sort and sell reusable and recyclable
materials”1. The recyclables predominantly include metal, paper, cardboard, plastic and glass.
Estimates of the number of waste pickers in South Africa prior to this research varied widely
between 18,000 and 100,0002 . Waste pickers in South Africa form part of an international
total of about 15 million in developing countries across the world. Waste pickers have other
appellations, depending on the social and geographical context. The term ‘reclaimer’ is
generally used to refer to persons reclaiming materials from landfills Samson3 2010: 2). Waste
pickers also describe themselves as “bagariesi”, a Setswana term which is thought to mean
someone who is looking for valuable or good things that are useful (ibid). Other names reflect
perceptions about waste pickers’ social status and their economically precarious position in
society. For example, they are also referred to as “skarrelaars” (scuttlers); “grab-grab; and
“minza” (meaning struggling to survive). In Johannesburg the term - “bayahlupeka” (struggling
to make ends meet) - is also used (Sentime, 20114; Shenck, Blaauw and Viljoen, 20125). For
purposes of this study, waste pickers include ‘trolley pushers’ collecting recyclable materials
from residential, commercial and industrial areas, mainly in large urban centres. Figures 1 to
3 below show examples of waste pickers in different situations.
1Carras, Mark (2012). http://urbanearth.co.za/articles/waste-pickers-south-africa Waste Pickers in South Africa.
2 Estimates by SAWPA and groundWork
3 Samson, M. 2010. Organising Reclaimers in Tshwane, South Africa – Lessons from Top Down and Bottom Up Experiences.
Women in Informal Employment: Globalizing and Organizing (WIEGO)
4 Sentime, K. (2011) “Profiling solid waste pickers: A case study of Braamfontein – Greater Johannesburg”, in
Africanus, Vol. 41, No. 2, pp. 96-111. Cited in International Labour Organisation (2012) “Unrecognized Waste Management
Experts: challenges and Opportunities for Small Business Development and Decent Job Creation in the Waste Sector” Schenck,
S., Blaauw, D., Viljoen, K.
5 Schenck, S., Blaauw, D., Viljoen, K. International Labour Organisation (2012) “Unrecognized Waste Management Experts:
challenges and Opportunities for Small Business Development and Decent Job Creation in the Waste Sector”.

11
Figure 1: Trolley Pusher
Figure 2: A waste picker retrieving food at a landfill site in
Mthatha
Figure 3: Waste pickers collecting recyclables at Rooikraal Landfill Site, Tshwane Metro
5 RESEARCH METHODOLOGY
The study used both primary and secondary data sources.
5.1 Primary data
Primary data was collected through the following:
Interviews and questionnaires with identified candidates representative of key
stakeholder groups. The key stakeholder groups identified were the following:

12
o Waste Pickers, as the key group involved in waste picking ;
o Municipalities, as owners of most of the facilities from which waste pickers
operate;
o Recyclers, as key role-players in the recycling value chain; and
o Reseachers and NGOs, owing to the work they do in the recycling space.
Workshops: A national workshop targeting all stakeholder groups was held to allow for
discussions on the key aspects that emerged from the individual interviews.
5.2 Secondary data
Secondary data sources were used to establish how other countries dealt with or are dealing
with waste picking. Literature review was undertaken on waste picking in Brazil, Colombia and
India.
5.2.1 Preparations to conduct the study
A team of experienced fieldworkers was thoroughly trained in Johannesburg (Figure 4) on the
content of the tools used to conduct the study (Appendix 2) and the sorts of responses to
expect. The waste picker questionnaire was piloted with waste pickers operating at the
Robinson Deep landfill site, in order to hone the fieldworkers’ competence in the administration
of the questionnaire as well as to test its relevance and appropriateness for collection of the
required data.
Figure 4: Fieldworker training session in Johannesburg, April 2014
13
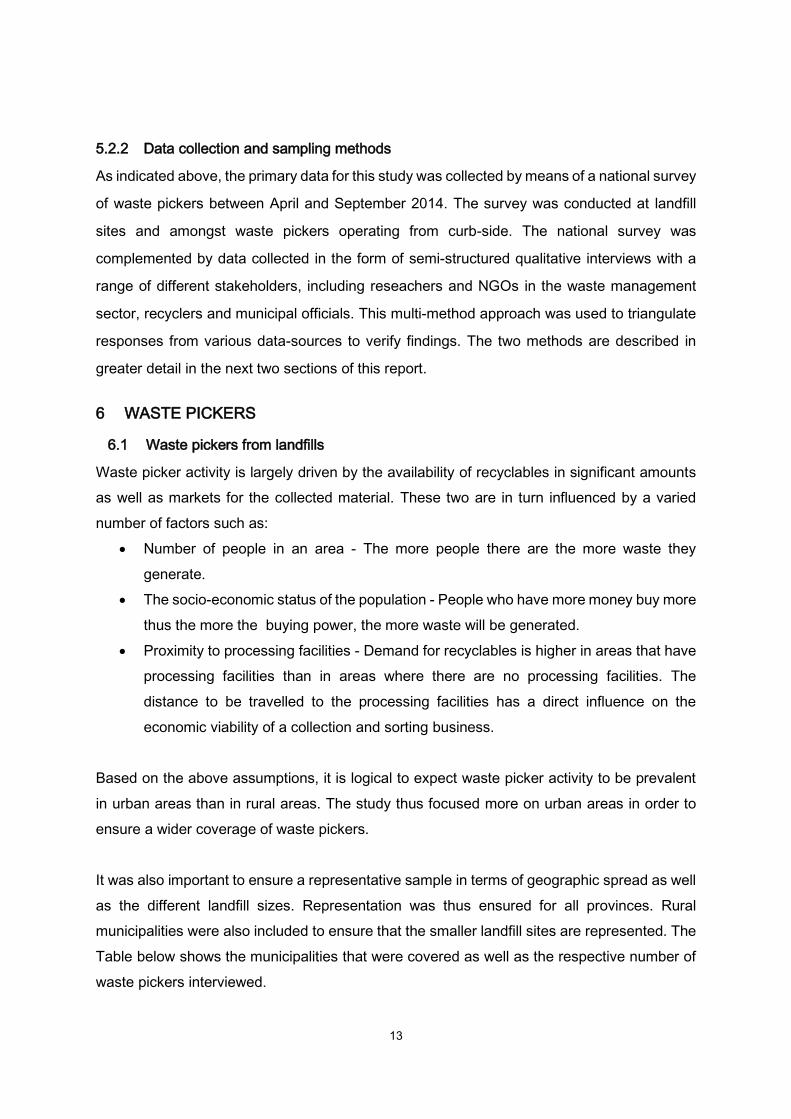
5.2.2 Data collection and sampling methods
As indicated above, the primary data for this study was collected by means of a national survey
of waste pickers between April and September 2014. The survey was conducted at landfill
sites and amongst waste pickers operating from curb-side. The national survey was
complemented by data collected in the form of semi-structured qualitative interviews with a
range of different stakeholders, including reseachers and NGOs in the waste management
sector, recyclers and municipal officials. This multi-method approach was used to triangulate
responses from various data-sources to verify findings. The two methods are described in
greater detail in the next two sections of this report.
6 WASTE PICKERS
6.1 Waste pickers from landfills
Waste picker activity is largely driven by the availability of recyclables in significant amounts
as well as markets for the collected material. These two are in turn influenced by a varied
number of factors such as:
Number of people in an area - The more people there are the more waste they
generate.
The socio-economic status of the population - People who have more money buy more
thus the more the buying power, the more waste will be generated.
Proximity to processing facilities - Demand for recyclables is higher in areas that have
processing facilities than in areas where there are no processing facilities. The
distance to be travelled to the processing facilities has a direct influence on the
economic viability of a collection and sorting business.
Based on the above assumptions, it is logical to expect waste picker activity to be prevalent
in urban areas than in rural areas. The study thus focused more on urban areas in order to
ensure a wider coverage of waste pickers.
It was also important to ensure a representative sample in terms of geographic spread as well
as the different landfill sizes. Representation was thus ensured for all provinces. Rural
municipalities were also included to ensure that the smaller landfill sites are represented. The
Table below shows the municipalities that were covered as well as the respective number of
waste pickers interviewed.
14
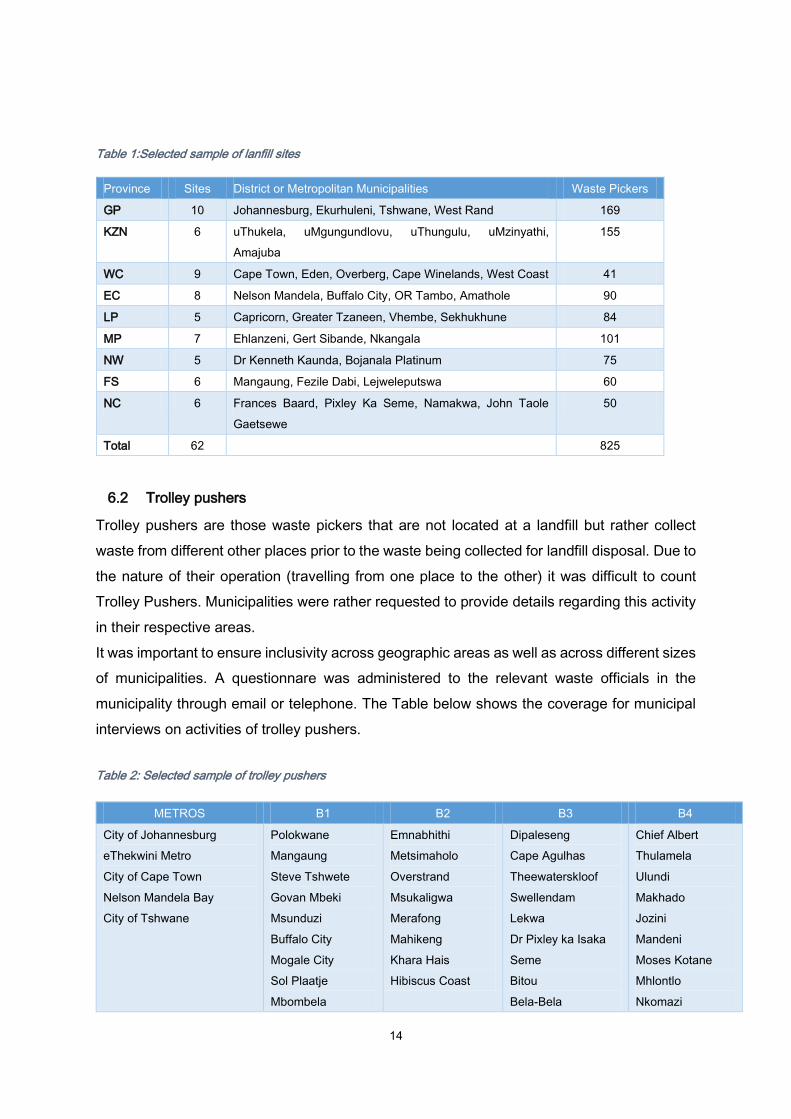
Table 1:Selected sample of lanfill sites
Province Sites District or Metropolitan Municipalities Waste Pickers
GP 10 Johannesburg, Ekurhuleni, Tshwane, West Rand 169
KZN 6 uThukela, uMgungundlovu, uThungulu, uMzinyathi,
Amajuba
155
WC 9 Cape Town, Eden, Overberg, Cape Winelands, West Coast 41
EC 8 Nelson Mandela, Buffalo City, OR Tambo, Amathole 90
LP 5 Capricorn, Greater Tzaneen, Vhembe, Sekhukhune 84
MP 7 Ehlanzeni, Gert Sibande, Nkangala 101
NW 5 Dr Kenneth Kaunda, Bojanala Platinum 75
FS 6 Mangaung, Fezile Dabi, Lejweleputswa 60
NC 6 Frances Baard, Pixley Ka Seme, Namakwa, John Taole
Gaetsewe
50
Total 62 825
6.2 Trolley pushers
Trolley pushers are those waste pickers that are not located at a landfill but rather collect
waste from different other places prior to the waste being collected for landfill disposal. Due to
the nature of their operation (travelling from one place to the other) it was difficult to count
Trolley Pushers. Municipalities were rather requested to provide details regarding this activity
in their respective areas.
It was important to ensure inclusivity across geographic areas as well as across different sizes
of municipalities. A questionnare was administered to the relevant waste officials in the
municipality through email or telephone. The Table below shows the coverage for municipal
interviews on activities of trolley pushers.
Table 2: Selected sample of trolley pushers
METROS B1 B2 B3 B4
City of Johannesburg
eThekwini Metro
City of Cape Town
Nelson Mandela Bay
City of Tshwane
Polokwane
Mangaung
Steve Tshwete
Govan Mbeki
Msunduzi
Buffalo City
Mogale City
Sol Plaatje
Mbombela
Emnabhithi
Metsimaholo
Overstrand
Msukaligwa
Merafong
Mahikeng
Khara Hais
Hibiscus Coast
Dipaleseng
Cape Agulhas
Theewaterskloof
Swellendam
Lekwa
Dr Pixley ka Isaka
Seme
Bitou
Bela-Bela
Chief Albert
Thulamela
Ulundi
Makhado
Jozini
Mandeni
Moses Kotane
Mhlontlo
Nkomazi

15
7 MUNICIPALITIES
The choice of sampled waste pickers largely determined the municipalities who were
interviewed. This was necessary in order to cross-reference responses and triangulate the
data as intended by the research methodolgy. Refer to Table 1 above.
8 RECYCLERS
Recyclers who work with the waste pickers in the same municipalities were also interviewed,
where they could be contacted. The Table below lists the recycling companies interviewed.
Table 3: Recycling companies
Consul (glass) NAMPAK (paper and plastics)
Mpact (Paper) Descorecyclers (eWaste)
Fine Metals (Metal) Metalco (Metal)
Mama She’s (plastic) Senlida Chemical fibre (PET)
Mpilenhle (PET) Lecas metals
Reclam (cardboard and metal) Frane Newcastle (metal)
Siyathenga Scrap metal Refuse waste recycler (cardboard)
9 RESEACHERS AND NON-GOVERNMENT ORGANISATIONS
Researchers and NGOs involved with wastepickers were also interviewed. They were
predominantly Gauteng-based. The Table below lists the interviewed reseachers and NGOs.
Table 4: Research and NGOs bodies
Glass Recycling Association South African Association of Waste Pickers
(SAWPA)
Metal Recyclers Association of South Africa (MRA) Paper Recycling Association (PRASA)
groundWork Recycling and Economic Development Initiative of
South Africa (REDISA)
Women in Informal Employment Globalising and
Organising (Weigo)
Institute for Waste Management of South Africa
Kobus Otto (independent waste management
consultant)
Newcastle Mamusa
Phumelela
Elundi
Total = 5 Total = 10 Total = 8 Total = 10 Total = 10
16
10 LIMITATIONS TO THE STUDY
While the methodology has outlined the ideal data collection and sampling approach adopted
in the study to ensure a comprehensive and representative sample for the study, there has
been some limitations in certain areas that resulted in the methodology not being implemented
entirely in the manner in which it was designed.
The following were the limitations to the study:
o Availability of people for the interviews. While every effort was made to ensure that
when the team visited a specific municipality all relevant people identified were
available, this was not always the case. In some instances relevant municipal officials
would not be available or access to the waste pickers in ceratin intances was not
possible.
o The choice of a date for visits were made on the basis of availability and practicality
rather than targeting potential “busy”6 days where waste pickers are likely to be present
at the landfill site in high numbers. This could have resulted in an understatement of
the number of pickers per site as only pickers who were on the site on the day of the
visit were counted.
o Trolley pushers were particularly difficult to count as they are largely foud in specific
localities. Information provided by respective local municipalities was therefore utilised.
o It is possible that the waste pickers could have been a bit cautious in their responses
to the survey owing to their often precarious status of relation to the landfill site
authorities and the municipalities in which they operate;
o International synopsis of Waste Picker organising and inclusion was undertaken but
could not be used to recommend the approach for South Africa. This is because the
study was not able to glean enough information on the initiatives being implemented
in the country. The department is collaborating with CitiNetworks in its study that will
address this shortfall. The CitiNetworks study will come with proposals that will bridge
the gap.
6 Waste pickers are generally familiar with the collection schedule and are likely to operate on days and
times that they know have the highest recyclables.
17
11 ANALYSIS AND DISCUSSION OF RESULTS
11.1 Extent of waste pickers
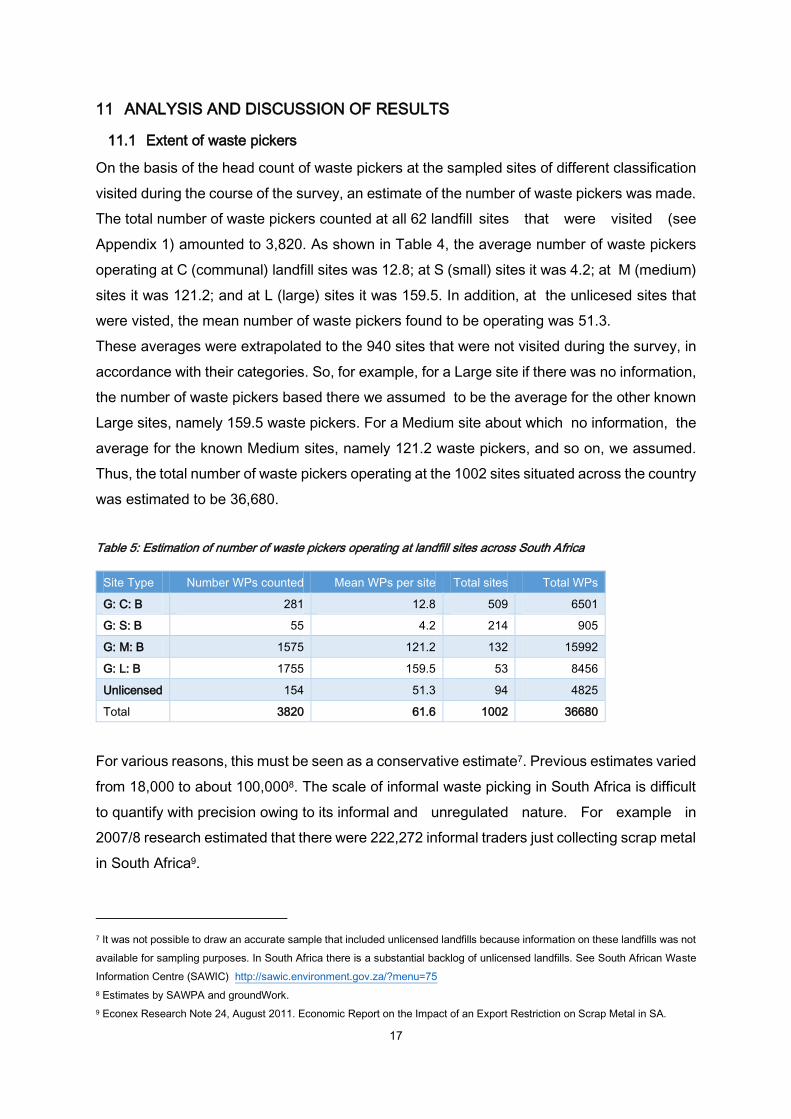
On the basis of the head count of waste pickers at the sampled sites of different classification
visited during the course of the survey, an estimate of the number of waste pickers was made.
The total number of waste pickers counted at all 62 landfill sites that were visited (see
Appendix 1) amounted to 3,820. As shown in Table 4, the average number of waste pickers
operating at C (communal) landfill sites was 12.8; at S (small) sites it was 4.2; at M (medium)
sites it was 121.2; and at L (large) sites it was 159.5. In addition, at the unlicesed sites that
were visted, the mean number of waste pickers found to be operating was 51.3.
These averages were extrapolated to the 940 sites that were not visited during the survey, in
accordance with their categories. So, for example, for a Large site if there was no information,
the number of waste pickers based there we assumed to be the average for the other known
Large sites, namely 159.5 waste pickers. For a Medium site about which no information, the
average for the known Medium sites, namely 121.2 waste pickers, and so on, we assumed.
Thus, the total number of waste pickers operating at the 1002 sites situated across the country
was estimated to be 36,680.
Table 5: Estimation of number of waste pickers operating at landfill sites across South Africa
Site Type Number WPs counted Mean WPs per site Total sites Total WPs
G: C: B 281 12.8 509 6501
G: S: B 55 4.2 214 905
G: M: B 1575 121.2 132 15992
G: L: B 1755 159.5 53 8456
Unlicensed 154 51.3 94 4825
Total 3820 61.6 1002 36680
For various reasons, this must be seen as a conservative estimate7. Previous estimates varied
from 18,000 to about 100,0008. The scale of informal waste picking in South Africa is difficult
to quantify with precision owing to its informal and unregulated nature. For example in
2007/8 research estimated that there were 222,272 informal traders just collecting scrap metal
in South Africa9.
7 It was not possible to draw an accurate sample that included unlicensed landfills because information on these landfills was not
available for sampling purposes. In South Africa there is a substantial backlog of unlicensed landfills. See South African Waste
Information Centre (SAWIC) http://sawic.environment.gov.za/?menu=75
8 Estimates by SAWPA and groundWork.
9 Econex Research Note 24, August 2011. Economic Report on the Impact of an Export Restriction on Scrap Metal in SA.
18
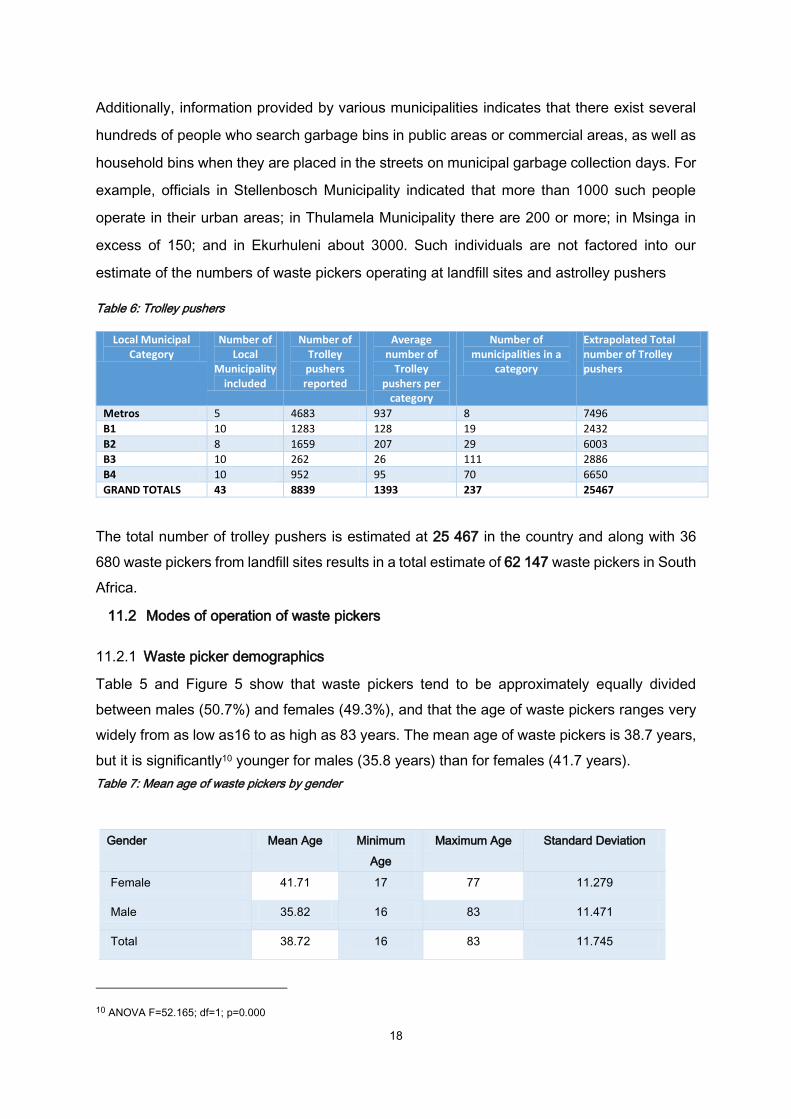
Additionally, information provided by various municipalities indicates that there exist several
hundreds of people who search garbage bins in public areas or commercial areas, as well as
household bins when they are placed in the streets on municipal garbage collection days. For
example, officials in Stellenbosch Municipality indicated that more than 1000 such people
operate in their urban areas; in Thulamela Municipality there are 200 or more; in Msinga in
excess of 150; and in Ekurhuleni about 3000. Such individuals are not factored into our
estimate of the numbers of waste pickers operating at landfill sites and astrolley pushers
Table 6: Trolley pushers
Local Municipal Category
Number of Local
Municipality included
Number of Trolley pushers reported
Average number of
Trolley pushers per
category
Number of municipalities in a
category
Extrapolated Total number of Trolley pushers
Metros 5 4683 937 8 7496
B1 10 1283 128 19 2432
B2 8 1659 207 29 6003
B3 10 262 26 111 2886
B4 10 952 95 70 6650
GRAND TOTALS 43 8839 1393 237 25467
The total number of trolley pushers is estimated at 25 467 in the country and along with 36
680 waste pickers from landfill sites results in a total estimate of 62 147 waste pickers in South
Africa.
11.2 Modes of operation of waste pickers
11.2.1 Waste picker demographics
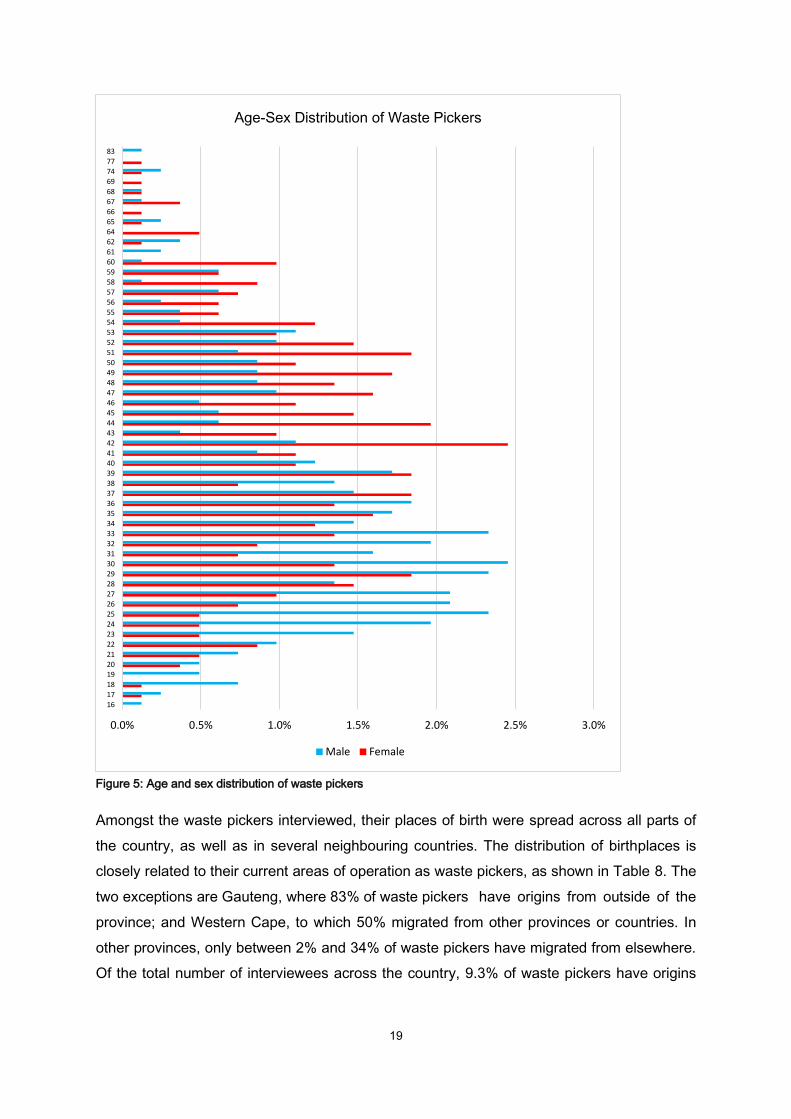
Table 5 and Figure 5 show that waste pickers tend to be approximately equally divided
between males (50.7%) and females (49.3%), and that the age of waste pickers ranges very
widely from as low as16 to as high as 83 years. The mean age of waste pickers is 38.7 years,
but it is significantly10 younger for males (35.8 years) than for females (41.7 years).
Table 7: Mean age of waste pickers by gender
10 ANOVA F=52.165; df=1; p=0.000
Gender Mean Age Minimum
Age
Maximum Age Standard Deviation
Female 41.71 17 77 11.279
Male 35.82 16 83 11.471
Total 38.72 16 83 11.745
19
Figure 5: Age and sex distribution of waste pickers
Amongst the waste pickers interviewed, their places of birth were spread across all parts of
the country, as well as in several neighbouring countries. The distribution of birthplaces is
closely related to their current areas of operation as waste pickers, as shown in Table 8. The
two exceptions are Gauteng, where 83% of waste pickers have origins from outside of the
province; and Western Cape, to which 50% migrated from other provinces or countries. In
other provinces, only between 2% and 34% of waste pickers have migrated from elsewhere.
Of the total number of interviewees across the country, 9.3% of waste pickers have origins
0.0% 0.5% 1.0% 1.5% 2.0% 2.5% 3.0%
16
17
18
19
20
21
22
23
24
25
26
27
28
29
30
31
32
33
34
35
36
37
38
39
40
41
42
43
44
45
46
47
48
49
50
51
52
53
54
55
56
57
58
59
60
61
62
64
65
66
67
68
69
74
77
83
Age-Sex Distribution of Waste Pickers
Male Female
20
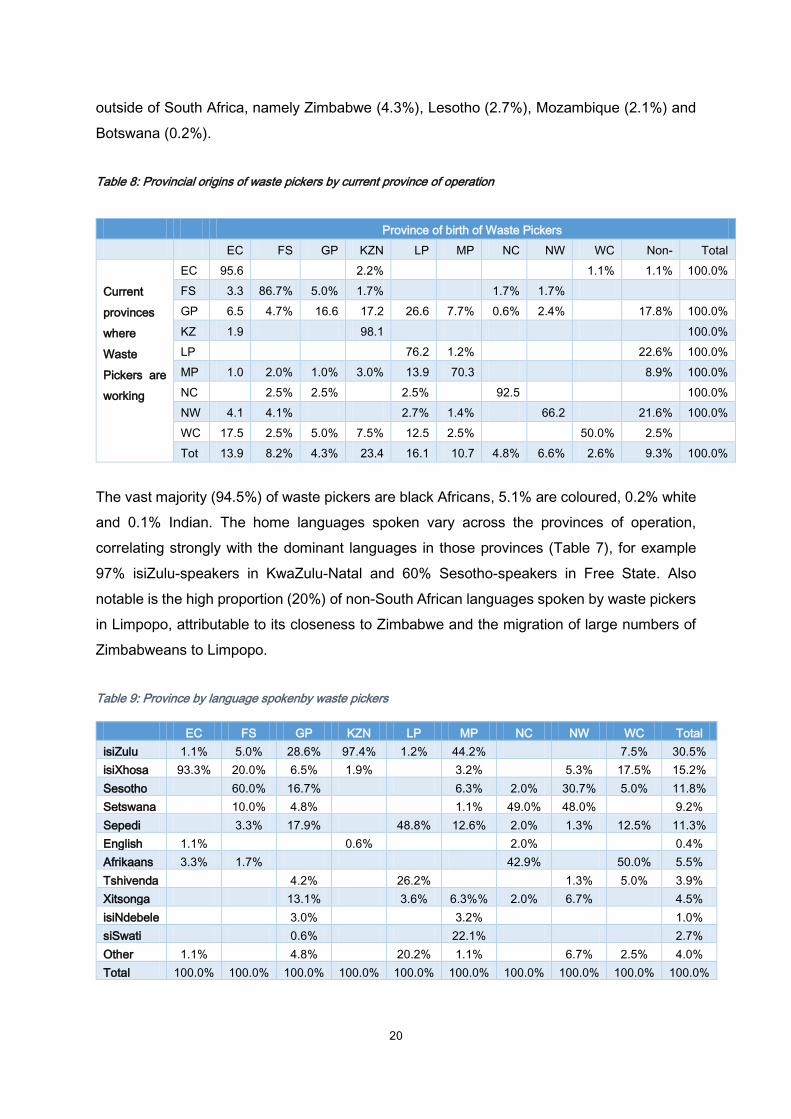
outside of South Africa, namely Zimbabwe (4.3%), Lesotho (2.7%), Mozambique (2.1%) and
Botswana (0.2%).
Table 8: Provincial origins of waste pickers by current province of operation
The vast majority (94.5%) of waste pickers are black Africans, 5.1% are coloured, 0.2% white
and 0.1% Indian. The home languages spoken vary across the provinces of operation,
correlating strongly with the dominant languages in those provinces (Table 7), for example
97% isiZulu-speakers in KwaZulu-Natal and 60% Sesotho-speakers in Free State. Also
notable is the high proportion (20%) of non-South African languages spoken by waste pickers
in Limpopo, attributable to its closeness to Zimbabwe and the migration of large numbers of
Zimbabweans to Limpopo.
Table 9: Province by language spokenby waste pickers
EC FS GP KZN LP MP NC NW WC Total
isiZulu 1.1% 5.0% 28.6% 97.4% 1.2% 44.2% 7.5% 30.5%
isiXhosa 93.3% 20.0% 6.5% 1.9% 3.2% 5.3% 17.5% 15.2%
Sesotho 60.0% 16.7% 6.3% 2.0% 30.7% 5.0% 11.8%
Setswana 10.0% 4.8% 1.1% 49.0% 48.0% 9.2%
Sepedi 3.3% 17.9% 48.8% 12.6% 2.0% 1.3% 12.5% 11.3%
English 1.1% 0.6% 2.0% 0.4%
Afrikaans 3.3% 1.7% 42.9% 50.0% 5.5%
Tshivenda 4.2% 26.2% 1.3% 5.0% 3.9%
Xitsonga 13.1% 3.6% 6.3%% 2.0% 6.7% 4.5%
isiNdebele 3.0% 3.2% 1.0%
siSwati 0.6% 22.1% 2.7%
Other 1.1% 4.8% 20.2% 1.1% 6.7% 2.5% 4.0%
Total 100.0% 100.0% 100.0% 100.0% 100.0% 100.0% 100.0% 100.0% 100.0% 100.0%
Province of birth of Waste Pickers
EC FS GP KZN LP MP NC NW WC Non-
RSA
Total
Current
provinces
where
Waste
Pickers are
working
EC 95.6
%
2.2% 1.1% 1.1% 100.0%
FS 3.3
%
86.7% 5.0% 1.7% 1.7% 1.7%
GP 6.5
%
4.7% 16.6
%
17.2
%
26.6
%
7.7% 0.6% 2.4% 17.8% 100.0%
KZ
N
1.9
%
98.1
%
100.0%
LP 76.2
%
1.2% 22.6% 100.0%
MP 1.0
%
2.0% 1.0% 3.0% 13.9
%
70.3
%
8.9% 100.0%
NC 2.5% 2.5% 2.5% 92.5
%
100.0%
NW 4.1
%
4.1% 2.7% 1.4% 66.2
%
21.6% 100.0%
WC 17.5
%
2.5% 5.0% 7.5% 12.5
%
2.5% 50.0% 2.5%
Tot
al
13.9
%
8.2% 4.3% 23.4
%
16.1
%
10.7
%
4.8% 6.6% 2.6% 9.3% 100.0%

21
Almost two-fifths (39%) of waste pickers have attended but not completed secondary school;
a similar proportion (40%) have only attended primary school; and 15% have no formal
education. As shown in Table 10, a small proportion (7%) has achieved Grade 12 or more.
The waste pickers of Gauteng generally have a higher level of education than those in other
provinces. Conversely, a high proportion (about a quarter) of those in Mpumalanga and
Northern Cape has not had any formal education.
Table 10: Province by level of education of waste pickers
None Primary Some Secondary Grade 12 Tertiary Total
EC 12.2% 46.7% 37.8% 3.3% 0.0% 100.0%
FS 16.7% 55.0% 26.7% 1.7% 0.0% 100.0%
GP 13.7% 25.0% 46.4% 13.1% 1.8% 100.0%
KZN 11.1% 37.9% 43.8% 7.2% 0.0% 100.0%
LP 8.5% 48.8% 36.6% 6.1% 0.0% 100.0%
MP 24.2% 30.6% 38.8% 5.1% 1.0% 100.0%
NC 27.1% 72.9% 0.0% 0.0% 0.0% 100.0%
NW 16.0% 29.3% 45.3% 9.3% 0.0% 100.0%
WC 2.4% 51.2% 46.3% 0.0% 0.0% 100.0%
Total 14.5% 39.6% 38.8% 6.6% 0.5% 100.0%
11.2.2 Waste types collected and their economic value
The most popular item collected is plastic (77% of waste pickers), followed by paper (69%),
cans (65%), metal (58%), glass and bottles (48%) and E-waste (23%). One in ten (10%)
indicated that they collect ‘other’ items, boxes and cardboard (1.2%), copper (0.8%), food
(0.7%), clothing and fabric (0.7%), and bricks (0.2%). The following are factors that affect
the monthly earnings of a waste picker:
Ability or pace of work of individual (Health, age, sex)
Number of hours worked in a week and days worked in a month.
Availability of each waste stream and quality.
Table 11 shows the types of waste collected and monthly earnings
Table 11: Types of waste collected and monthly earnings
Material collected % who collect this item Mean Monthly Earnings
Plastic 77.3% R1480
Paper 68.6% R1421
Cans 64.6% R1402
Metal 58.1% R1489
Glass 47.9% R1378
E-waste 23.0% R1408

22
Boxes/ Cardboard 1.2% R627
Copper 0.8% R2257
Food 0.7% R1353
Clothing/ Fabric 0.7% R1340
Bricks 0.2% R4100
Steel 0.1% R6000
Other/ Unspecified 1.5% R775
54% of those collecting cans and glass or bottles are female; as are 53% of paper collectors;
52% of plastic collectors; and 51% of e-waste collectors. Conversely, 55% of metal collectors
are male; as are 71% of those who collect copper; 83% for food; and 67% for clothing or fabric.
The mean monthly earning of waste pickers is R1430. This ranges widely between waste
pickers of different items. The highest mean earnings are for steel (R6000); bricks (R4100);
and copper (R2257). The lowest mean monthly yield is R627 for boxes and cardboard. The
national mean is somewhat lower than that estimated to be the case in a study of waste pickers
in Durban11 where the monthly average ranged from R2400 to R3360. This is informed by the
fact that in Durban there is an established co-operative supported by the Durban Solid Waste
(DSW). Comparatively, sectoral determinations of minimum monthly wages by the
Department of Labour are R1878 for domestic workers in the main urban areas and R1318
elsewhere; R2420 for the forestry sector; and R2601 in the hospitality sector.12
Using the average earnings per month of waste pickers and the average amounts paid per
tonne for each type of recyclable material it can be extrapolated that those collecting plastic,
collect an average of 0.8 tons per month and those collecting paper, an average of 1.24 tons
per month. The mean tonnages for other materials are 1.25 tons of cardboard; 4.35 tons of
glass; and 0.06 tons of e-waste. Generally, the material buyers determine the price on the
basis of the quality of the material and the demand. Figure 6 shows the avarege monthly
earnings of waste pickers by type of recyclable collected,
11 The Institute of Waste Management of South Africa indicated that earnings can be as high as R120 per day. Asiye eTafuleni,
a Durban NGO that works with waste pickers made this estimate (Carras, 2012).
12 www.labour.gov.za (accessed 5th November 2014).

23
Figure 6: Average monthly earnngs of waste pickers by type of recyclable collected
Table 12 shows the price ranges for the different waste streams bought by buy-back centres
and other recyclers. Average prices show that e-waste and non-ferrous metals13 received the
highest prices from recyclers, whereas glass followed by paper received the lowest prices.
Table 12: Prices paid by Recycling Companies
1 2 3 4 5 6 7 8 9 10 11 12 Total
Paper 1500 850 1260 1000 1100 5710
Cardboard 500 500
Plastic 1800 2365 4000 700 400 9265
Glass 475 212 460 120 1267
E Waste 20200 30000 50200
Metals
Ferrous 2550 2075 2000 2000 2850 1200 12675
Non Ferrous 32375 23000 23000 40000 118375
The figure 7 below shows that recycling companies collect a much larger volume of waste for
recycling from formal businesses than from waste pickers. For example the figure shows that
a national paper recycling company collected 37500 tons per month from formal businesses
in comparison to collecting an estimated 300 tons per month from waste pickers.
13 Non-ferrous metals include aluminium, copper, lead, nickel, tin, titanium and zinc, and alloys such as brass.
R6,000
R4,100
R2,257
R1,489 R1,480 R1,421 R1,408 R1,402 R1,378 R1,353 R1,340
R775 R627
R0
R1,000
R2,000
R3,000
R4,000
R5,000
R6,000
R7,000
Average Monthly Earnings per Material Type

24
Figure 7: Comparison of quantities collected for recycling from formal companies versus waste pickers14
11.2.3 Landfill site operations
The most common types of recyclable materials collected from landfill sites are listed in Table
13. The average time spent at landfill sites per week is 5.4 days for the top four recyclables
(plastic, paper, cans, metal) and ranges between 2 and 5.7 days per week for the other items.
In most cases, waste pickers spend 8 or more hours per day at the site.
Table 13: Operational dynamics of waste picking at landfills
Material
collected
Average time
spent at Landfills
What is done with the recyclable material? [% of waste
pickers who use each of these methods]
Monthly Quantitiies and
Earnings
Days
per
week
Hours
per day
Taken to
buy-back
centre
Collected from
WP by buy-
back centre
Collected
from WP by
recyclers
Taken
elsewhere
Tons
collected
Earnings
Plastic 5.3 8.0 37.6% 39.3% 17.1% 6.1% 0.80 R1480
Paper
5.4 8.1 38.9% 38.3% 16.8% 4.6% 1.24 R1421
Cans 5.4 8.1 41.7% 36.0% 16.3% 2.1% R1402
Metal 5.4 8.1 40.7% 35.1% 18.0% 3.3% R1489
Glass/
Bottles
5.4 8.1 43.8% 31.1% 17.7% 1.3% 4.35 R1378
E-waste 5.6 8.2 40.5% 46.3% 17.9% 2.1% 0.06 R1408
Boxes/
Cardboard
5.0 7.8 10.0% 20.0% 60.0% 10.0% 1.25 R627
Copper 5.7 8.3 71.4% 57.1% 100.0% 100.0% R2257
Food
3.7 7.2 66.7% 16.7% 100.0% 16.7% R1353
Clothing/
Fabric
2.0 3.8 33.3% 100.0% 100.0% 66.7% R1340
Bricks 5.5 8.5 100.0% 100.0% 100.0% 100.0% R4100
Steel 5.0 9.0 100.0% 100.0% 100.0% 100.0% R6000
14 Data are averages based on rough estimates, collected from 14 recycling companies.
0
10000
20000
30000
40000
30
37
50
0
11
00
65
60
00
30
0
20
10
24 72
96
48
19
0.71
.5
30
0
95 7.5 14
00
10
0
85
50
5 24
22
24
19
0.9
T
o
n
n
e
s
/
m
o
n
t
h
Businesses Waste pickers
25
Other/Unsp
ecific
4.8 6.3 100.0% 33.3% 8.3% 66.7% R775
Note that the total of the %s exceed 100% because several methods are used by waste pickers to dispose of their recyclables.
Waste pickers primarily utilise three of the modes for selling recyclable products. For the six
major recyclables, more than one-third of waste pickers take the materials to a buy-back
centre (glass and bottles 44%; cans 42%; metal 41%; e-waste 41%; paper 39%; plastic 38%).
Similar proportions have the materials collected from them by the owners of buy-back centres
(e-waste 46%; plastic 39%; paper 38%; cans 36%; metal 35%; glass and bottles 31%). About
one-sixth of waste pickers of these major materials have the items collected by recyclers. A
different pattern emerges for copper; food; clothing and fabric; bricks; and steel. In these
cases, all waste pickers have their materials collected from them by recyclers, owing to
security, weight and high value considerations.
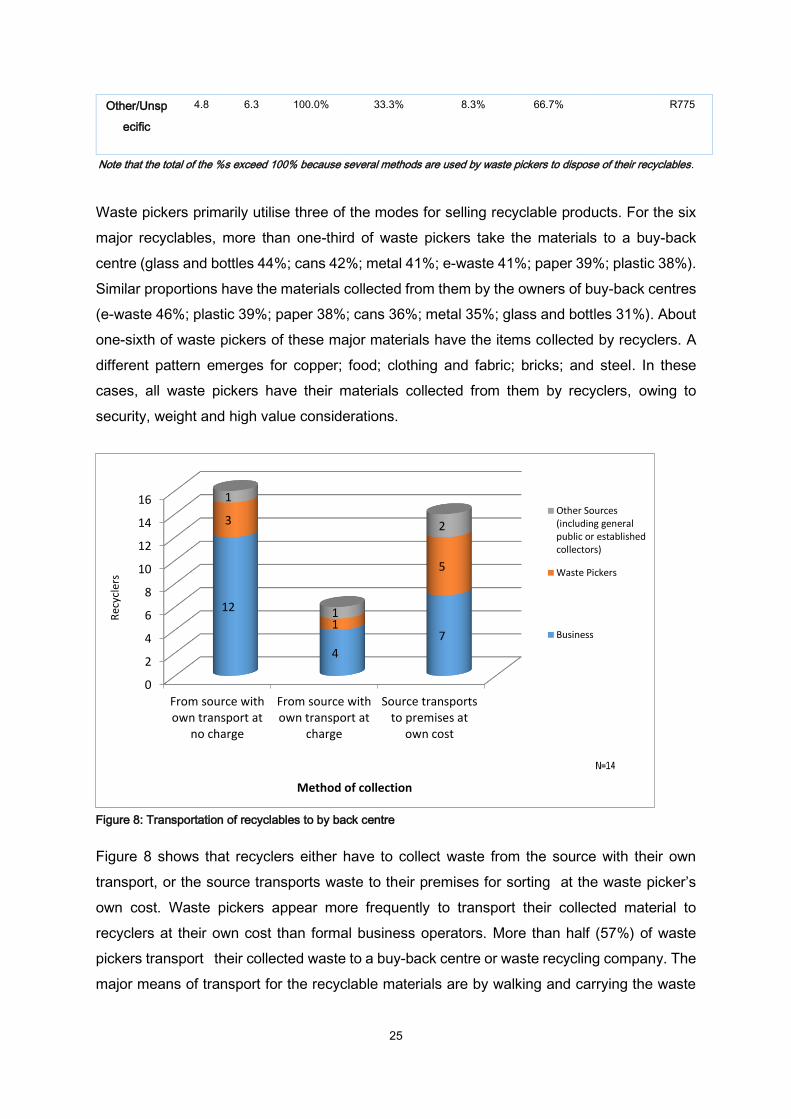
Figure 8: Transportation of recyclables to by back centre
Figure 8 shows that recyclers either have to collect waste from the source with their own
transport, or the source transports waste to their premises for sorting at the waste picker’s
own cost. Waste pickers appear more frequently to transport their collected material to
recyclers at their own cost than formal business operators. More than half (57%) of waste
pickers transport their collected waste to a buy-back centre or waste recycling company. The
major means of transport for the recyclable materials are by walking and carrying the waste
0
2
4
6
8
10
12
14
16
From source withown transport at
no charge
From source withown transport at
charge
Source transportsto premises at
own cost
12
4
7
3
1
5
1
1
2
Rec
ycle
rs
Method of collection
Other Sources(including generalpublic or establishedcollectors)
Waste Pickers
Business

26
(33%); vehicle hire (26.6%); pushing a cart (19%); public transport (15.8%); pulling a cart with
a bicycle (5%); or pulling a cart with a donkey or horse (0.6%).
Recyclers collecting waste from the source with their own transport was typical from formal
business sector. Figure 9 shows that waste pickers receive a higher price for their collected
goods if they deliver the goods to recyclers. However, the costs of transport would have to be
factored into their decisions to transport recyclable material themselves. This may explain why
in some cities there is a high incidence of ‘trolley pushers’ who rely on their own muscle power
to transport goods, thus saving costs and maximising their incomes from selling waste. Figure
9 refers to the percentage of price change per kilogram when material is collected versus
delivered.
Figure 9: Illustration of price change per kilogram when material is collected versus delivered15
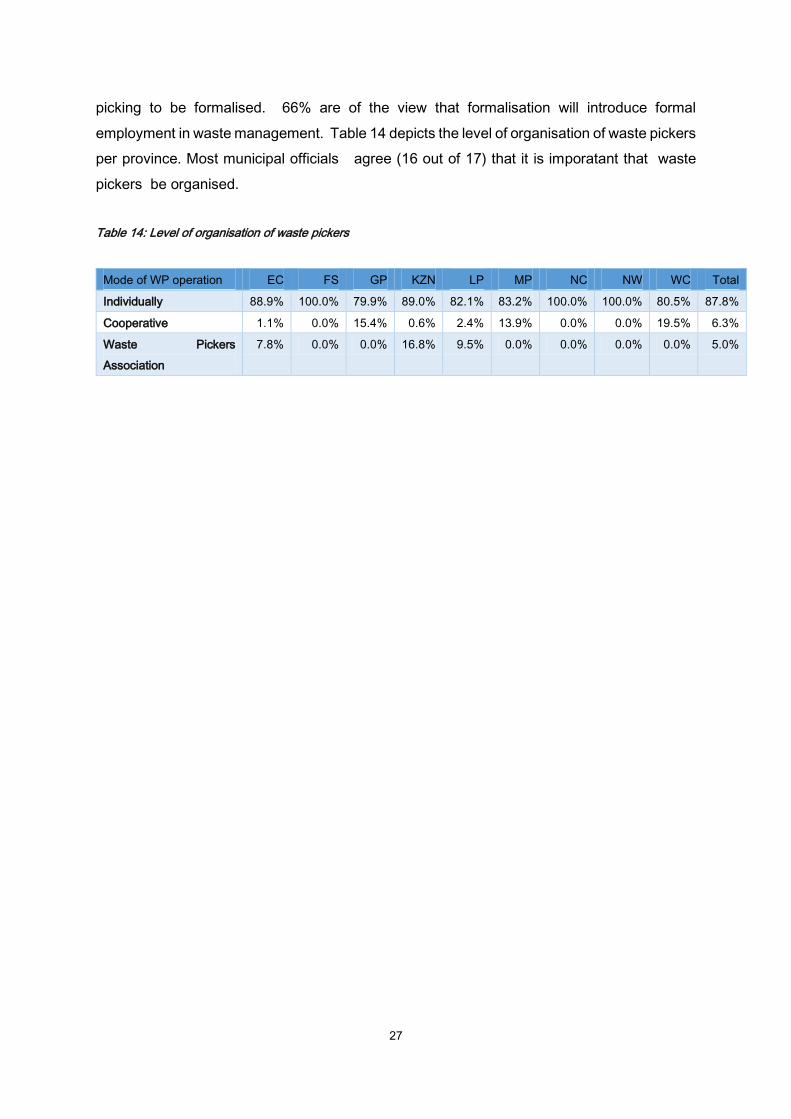
The majority (88%) of waste pickers operate individually. This implies that waste pickers are
primarily informal and largely unorganised. This trend varies by province (100% in Free State,
Northern Cape, North West, to between 80% and 83% in Gauteng, Limpopo, Mpumalanga
and Western Cape). 12% of waste pickers belong to a cooperative and (9%) belong to the
Waste Pickers Association (WPA).
Cooperatives emerge as most common amongst waste pickers in Western Cape,
Mpumalanga , Gauteng, KwaZulu-Natal, Limpopo and Eastern Cape. 68% of waste pickers
agree that it is important and beneficial to belong to an organised structure. 64% want waste
0.50.8
10.7
0.3 0.2
0.80.8
1.6
2
1.31
0.4
1.2
0
0.5
1
1.5
2
2.5
Card
bo
ard
Wh
ite office
pap
er
Co
ca cola b
ottle
s
Mixe
d p
lastic
Co
old
rink/b
eer can
s
Bo
ttle glass
Po
lypro
pyle
ne
Z
A
R Collected
Delivered
27
picking to be formalised. 66% are of the view that formalisation will introduce formal
employment in waste management. Table 14 depicts the level of organisation of waste pickers
per province. Most municipal officials agree (16 out of 17) that it is imporatant that waste
pickers be organised.
Table 14: Level of organisation of waste pickers
Mode of WP operation EC FS GP KZN LP MP NC NW WC Total
Individually 88.9% 100.0% 79.9% 89.0% 82.1% 83.2% 100.0% 100.0% 80.5% 87.8%
Cooperative 1.1% 0.0% 15.4% 0.6% 2.4% 13.9% 0.0% 0.0% 19.5% 6.3%
Waste Pickers
Association
7.8% 0.0% 0.0% 16.8% 9.5% 0.0% 0.0% 0.0% 0.0% 5.0%
28
Wastepicking is my
preferredway of
making aliving
If I couldmake a
living notcollectingwaste, Iwould
Wastepicking
provides mewith a
source ofincome tomeet myneeds
Wastepicking is
another formof
employment
Wastepicking
contributestowards the
recyclingeconomy
Wastepicking
contributestowards theeconomy
Wastepickers areorganised inSouth Africa
Organisationof wastepickers isimportant
Wastepickers
should beorganised inSouth Africa
WPs shouldbe includedin the formal
WPmanagemen
t process
Wastepicking
should berecognisedas formal
employment
Wastepickers have
a goodrelationship
with themunicipality
WPs have agood
relationshipwith
recyclers/buy-back
centreowners
Wastepickers get a
fair/goodprice for
their waste
Strongly Agree 28.8 57.5 27.1 31 46.4 37.9 23.4 38.3 48.4 35.7 40.8 23.9 24.9 10.7
Agree 39.2 18.7 42.2 41.2 26.5 32.5 17.8 29.2 23.8 28.3 25.2 33.1 37.5 17.5
Neutral 6.1 14.2 10.1 7.7 13.3 16.1 21.6 16.7 19 21.5 22.4 24.8 17.3 11.8
Disagree 13 5.6 10.5 10.1 6.9 6.4 28.1 12.4 5.4 8.8 8.2 11.5 12.5 37.4
Strongly Disagree 13 4 10.1 10 6.9 7 9.1 3.4 3.2 5.7 3.4 6.6 7.7 22.6
0
10
20
30
40
50
60
70
Res
po
nse
s %
Statements
Figure 10: Waste Picker Attitudes towards the waste picking industry
29
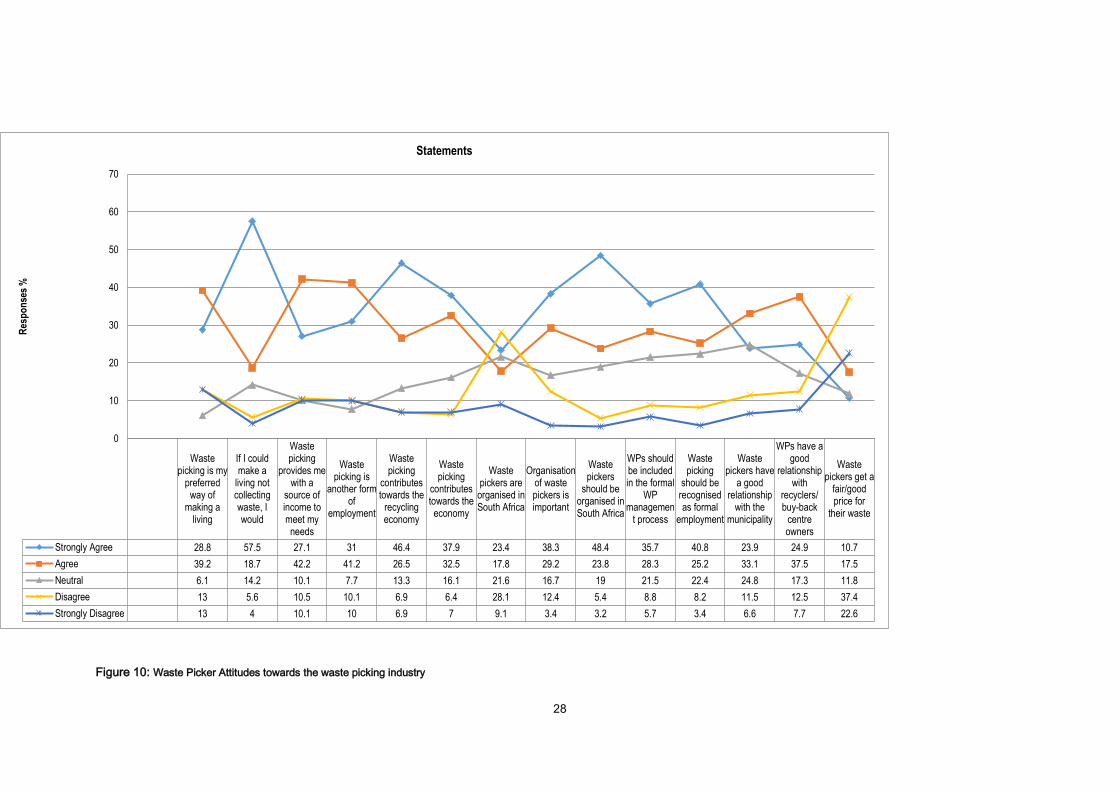
11.2.4 Attitudinal profiles
The responses of waste pickers, and other stakeholders to a set of 14 statements about waste
picking and recycling are shown in Figure 10 above:
68% of waste pickers, are using this method of living as their prefererred manner of making a
living due to economic circumstances. For 26 % of them this is not their preferred manner of
earning a living. 76% of waste pickers could make a living by not collecting waste if they had
a choice. For 70% waste picking provides a source of income that meets their needs, and for
72% waste picking is another form of employment. 60% of waste pickers are of the opnion
that they are not getting a fair/good price for their waste.
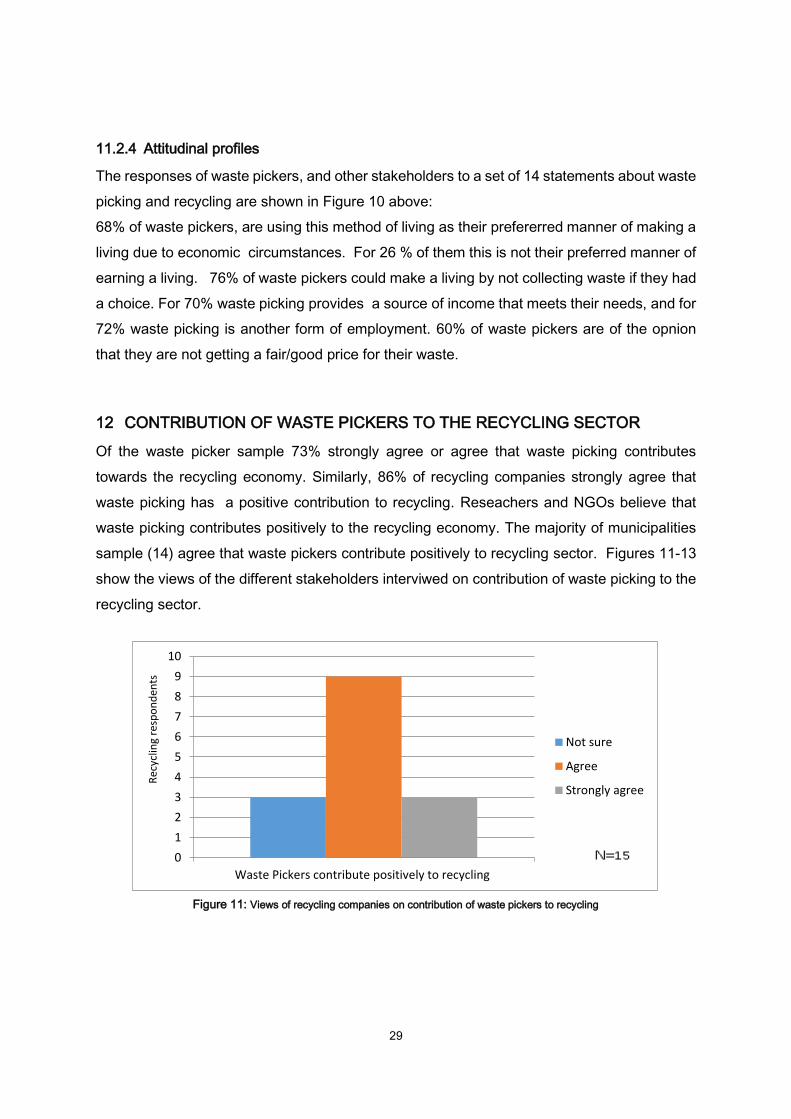
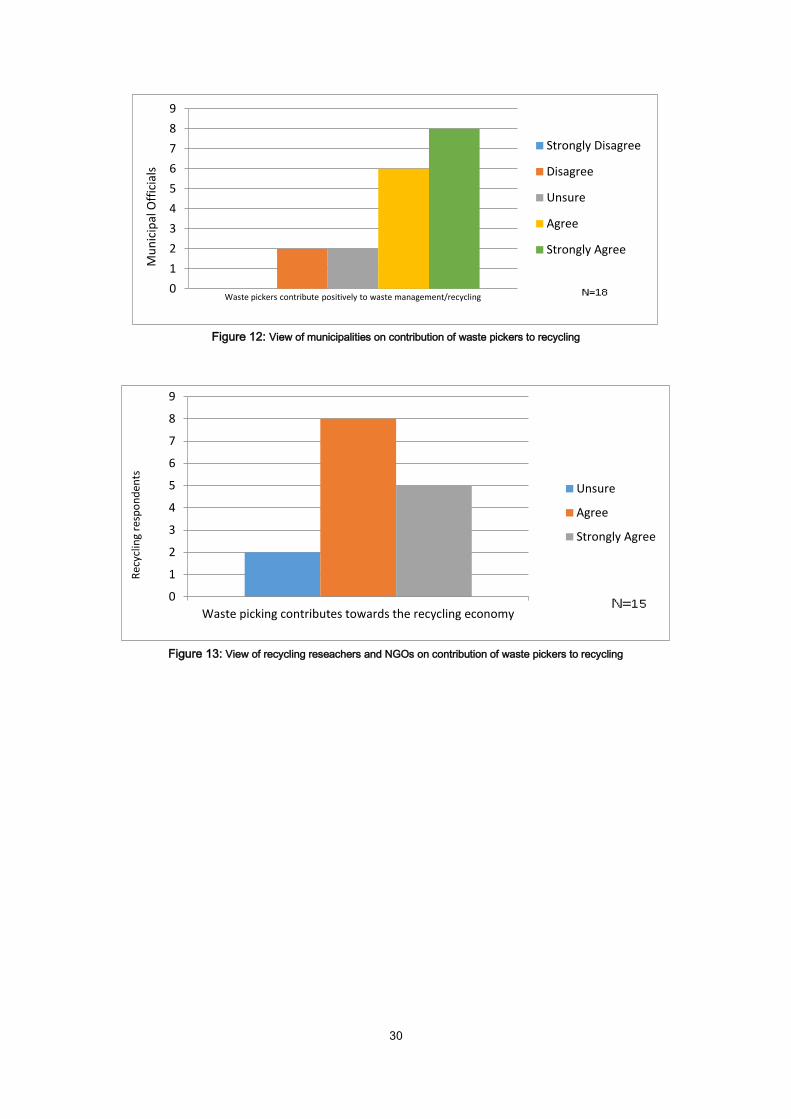
12 CONTRIBUTION OF WASTE PICKERS TO THE RECYCLING SECTOR
Of the waste picker sample 73% strongly agree or agree that waste picking contributes
towards the recycling economy. Similarly, 86% of recycling companies strongly agree that
waste picking has a positive contribution to recycling. Reseachers and NGOs believe that
waste picking contributes positively to the recycling economy. The majority of municipalities
sample (14) agree that waste pickers contribute positively to recycling sector. Figures 11-13
show the views of the different stakeholders interviwed on contribution of waste picking to the
recycling sector.
Figure 11: Views of recycling companies on contribution of waste pickers to recycling
0
1
2
3
4
5
6
7
8
9
10
Waste Pickers contribute positively to recycling
Rec
yclin
g re
spo
nd
ents
Not sure
Agree
Strongly agree
30
Figure 12: View of municipalities on contribution of waste pickers to recycling
Figure 13: View of recycling reseachers and NGOs on contribution of waste pickers to recycling
0
1
2
3
4
5
6
7
8
9
Mu
nic
ipal
Off
icia
ls
Waste pickers contribute positively to waste management/recycling
Strongly Disagree
Disagree
Unsure
Agree
Strongly Agree
0
1
2
3
4
5
6
7
8
9
Waste picking contributes towards the recycling economy
Rec
yclin
g re
spo
nd
ents
Unsure
Agree
Strongly Agree

31
Table 15: International synopsis of Waste Picker organising and inclusion16
Why inclusion of waste pickers
BELOHORIZONTE (BRAZIL)
PUNE (INDIA)
BOGOTA (BELGIUM)
Who instituted? Who instituted? Who instituted?
The Catholic Church, Pastoral de Rua, is the one that took the initiative to organise Waste Pickers in 1987. It brought them together in assemblies and street parties where they identified the need to form an organisation. In 1990 they formed Asmare association of waste pickers which continued to be the pillar of mobilisation for the Waste Pickers rights alongside Pastoral de Rua.
The building of a strong movement of Waste Pickers was greatly assisted by the support of both the state and nongovernmental organisations
Kagad Kach Patra Kashtakari Panchayat (KKPKP) waste pickers union formed in 1993 was central to the inclusion of waste pickers in Pune municipal waste management system.
In 1994 the Bogota local government initiated formal inclusion of waste pickers in the municipal waste management system
The second initiative was driven by waste pickers themselves assisted by nongovernmental organisations as in both Belo Horizonte and Pune
Why instituted? Why instituted? Why instituted?
Pastoral de Rua took the initiative since many of the Waste Pickers were homeless
The inclusion was part of a broader effort by Workers Party at the local and then national level to democratise and transform the state.
The founding of KKPKP was born out of the feminists working for the National Adult Education Programme of Shreemati Nathibai Damodar Thackersey Women’s University (SNDT), whose interest was on increasing girls’ access to education, arguing that if waste could be segregated girls working as waste pickers would have more time to attend school, with their mothers
The municipality initiated formal inclusion initially as a short-term measure to help break a strike by municipal waste workers and then as part of the process of privatisation.
Waste pickers were spurred to organise themselves to fight repression and violence against them. They were also called ‘disposable people’, which culminated in 40 waste pickers killed in
32
soon realising that if they could access the segregated waste, they could earn enough money to allow their daughters to go to school full time.
Campaign for recognition that waste pickers were already providing a valuable service that generated economic and environmental benefits to the city and its residents
Campaign against the daily harassment of waste pickers in the hands of the police
Transform how waste pickers saw themselves as most waste pickers did not view what they did as work.
Mobilise for the recognition that waste picking is a hazardous occupation and that most waste pickers could not afford health care.
Mobilise for the removal of procedural requirements that prevented the children of waste pickers from attending school and sensitise people in the school system to reduce the harassment they experienced.
Mobilise for the inclusion of children of waste pickers in a scholarship for students whose parents work in “unclean occupations”
Evade the possibility of Pune Municipality contracting a private company to collect waste from households in compliance to the
Bogota, their organs sold for transplants and their bodies sold to
University for dissection by medical students. They began organising in 1980 to defend their lives and livelihood.
Waste pickers displaced from dumps as they were replaced by sanitary landfills started forming cooperatives with support from Fundacion Social which assisted them to form local, regional and national associations but Fundacion Social has since stopped working with waste pickers but their cooperatives remain sustainable.
33
national Municipal Solid Waste Rules adopted in 2000.
Legislative Framework
What changed and at what level?
What changed and at what level?
What changed and at what level?
In 1993 Belo Horizonte moved away from a collection and burial model of waste management and implemented an integrated waste management system which included formal integration of waste pickers.
The city signed a covenant with Asmare and the Pastoral de Rua that made Asmare the city’s preferred partner for selective collection.
In 2000, the national government adopted the Municipal Solid Waste Rules, requiring municipalities to ensure segregation of waste, door –to-door collection of waste and recyclables, and the processing of recyclable materials. KKPKP fearing that the municipality would contract a private company to collect waste from the households thus reducing waste pickers’ livelihoods and used the passage of the legislation as an opportunity to reach a formal agreement with the municipality for waste pickers to provide the service.
In 2006, the Municipal Commissioner appointed a Steering Committee to oversee the restructuring of the city’s waste management system from whose recommendations the formations of a waste pickers’ cooperative to conduct door-to-door collection of waste was approved.
In mid-1980s there was a national shift in the Columbian waste management policy leading to the replacement of open dumps, where waste pickers worked, with sanitary landfills where waste picking was forbidden. This led to waste pickers facing large-scale dispossession and loss of their livelihoods.
In 1994 the Columbian national government passed the law which promotes privatisation and outsourcing of public services
In 1996 Bogota municipality gave seven-year contract for the waste collection services to large private companies shutting out waste pickers from the system after ARB was precluded by Law of 1994 and the Terms of Reference of the tender from participating.
ARB managed to get a Constitutional Court ruling against its preclusion to tender for waste services but had to wait till 2011 as the tender was already given to private companies.
Through court challenges ARB also achieved the overturning of the aspect of the National Decree 1713 of 2002 -which made waste placed outside of buildings the property of private consortiums collecting waste in the area -meaning that waste pickers could be charged with

34
theft for taking recyclables out of waste bins.
When the tender was opened again the court ruled that it was not in compliance with the Constitutional Ruling of 2003 and required that bidders partner with waste pickers organisations. The contract was awarded to a company that partnered with a newly formed cooperative, triggering another Constitutional Court engagement which ruled that there must be a process to verify the legitimacy and legality of waste pickers’ organisations, that a census of waste pickers be conducted, and municipalities must develop affirmative actions to include waste pickers.
In 2011 another Constitutional Court ruling was attained barring the municipality from proceeding with the tender, ordering it to develop a plan to give waste pickers the exclusive right to recyclables in the city, to create an integrated waste management system that built on the existing informal system and to pay waste pickers for extracting recyclables from the waste stream.
In 2012 a new mayor (Gustav Petro) poised to reverse the privatisation of the waste services in Bogota adopted a new development plan. In order to address the court ruling he created a system to register waste pickers and then pay them a fixed rate per kilogram of recyclables diverted from the stream, which significantly increased their income when

35
added to their sales of recyclables. Waste pickers were paid from March 2013.
Which legislations changed? Environment/labour etc.
Which legislations changed? Environment/labour etc.
Which legislations changed? Environment/labour etc.
Brazil adopted a National law in 2007 that allows municipalities to contract and pay waste picker organisations to conduct selective collection without putting the service out for competitive tender
The municipality has got two systems of Selective Collection of Recyclable materials (paper, glass, metal, and plastic) which is drop-off and kerbside collection, the other system is operated by the cooperatives.
There were no legislative changes in Pune but the waste pickers cooperative was recognised and contracted to provide the service.
There were no significant changes in the legislation in Bogota but there were many Constitutional Court rulings in favour of waste picker organisations that positively affected waste pickers in their strife to make a living and being recognised as worthy human beings.
Institutional Arrangement
Government Government Government
In 1993 a Social Mobilisation Unit was created and staffed with sociologists, psychologists, education specialists, geographers, artists, architects, and engineers. The Social Mobilisation Unit worked in collaboration with Asmare to design and implement education and mobilisation campaigns. In 2000 the municipality adopted Law 8052, which institutionalised the work of the Social Mobilisation Unit by creating the Department
There is no particular structure at the municipal level to facilitate working relations between government and the waste pickers.
There is no particular structure at the municipal level to facilitate working relations between government and the waste pickers.

36
for Social Mobilisation charged with building the capacity of waste pickers and transforming social attitudes towards them. Belo Horizonte Waste and Citizenship Forum was created in 2003 following on the creation of similar national body in 1998. These forums were subsequently created at state and local levels. The main objective of the Forum is to promote the right of waste pickers to work and to improve their working conditions.
Waste Pickers Waste Pickers Waste Pickers
Waste pickers are organised into an association called Asmare. In June 2001 a National Movement of Waste Pickers viz.Movimento Nacional dos Catadores (MNCR) was formed. MNCR promotes collective – as opposed to individual - advancement Asmare became the founding member of MNCR
In 2007 Waste Pickers formed the Solid Waste Collection and Handling(SWaCH) to take opportunity of the approval of the formation of a cooperative of waste pickers that would perform door-to-door collection with support from the municipality.
Asociacion de Recladores de Bogota (ARB) was formed by 3 cooperatives in 1990. Though ARB, though representing a small percentage of waste pickers it plays a critical role in shaping and leading the struggles to formally integrate waste pickers into the municipal waste management system.
Inclusive arrangement Inclusive arrangement Inclusive arrangement
In 1997, a collaborative governance structure called Collegial Board comprising all stakeholders was established to assume responsibility for planning and evaluation.
There is no inclusive structure between government and the waste pickers
There is no inclusive structure between government and the waste pickers
37
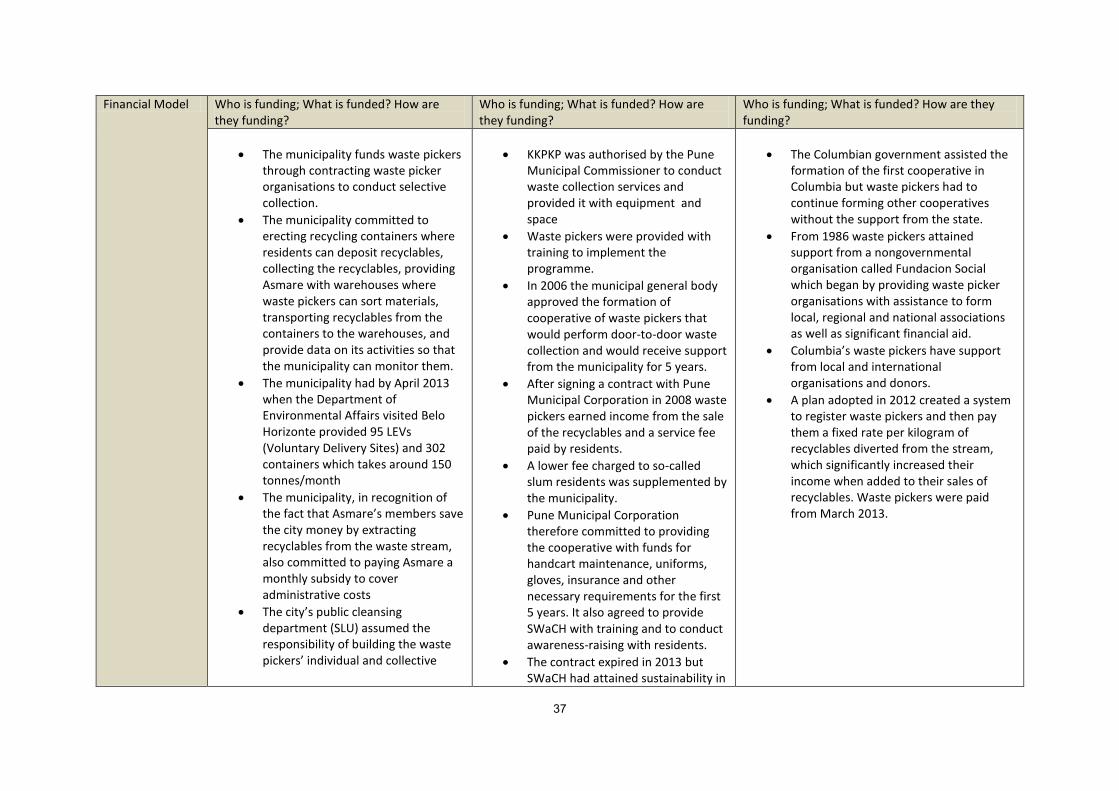
Financial Model Who is funding; What is funded? How are they funding?
Who is funding; What is funded? How are they funding?
Who is funding; What is funded? How are they funding?
The municipality funds waste pickers through contracting waste picker organisations to conduct selective collection.
The municipality committed to erecting recycling containers where residents can deposit recyclables, collecting the recyclables, providing Asmare with warehouses where waste pickers can sort materials, transporting recyclables from the containers to the warehouses, and provide data on its activities so that the municipality can monitor them.
The municipality had by April 2013 when the Department of Environmental Affairs visited Belo Horizonte provided 95 LEVs (Voluntary Delivery Sites) and 302 containers which takes around 150 tonnes/month
The municipality, in recognition of the fact that Asmare’s members save the city money by extracting recyclables from the waste stream, also committed to paying Asmare a monthly subsidy to cover administrative costs
The city’s public cleansing department (SLU) assumed the responsibility of building the waste pickers’ individual and collective
KKPKP was authorised by the Pune Municipal Commissioner to conduct waste collection services and provided it with equipment and space
Waste pickers were provided with training to implement the programme.
In 2006 the municipal general body approved the formation of cooperative of waste pickers that would perform door-to-door waste collection and would receive support from the municipality for 5 years.
After signing a contract with Pune Municipal Corporation in 2008 waste pickers earned income from the sale of the recyclables and a service fee paid by residents.
A lower fee charged to so-called slum residents was supplemented by the municipality.
Pune Municipal Corporation therefore committed to providing the cooperative with funds for handcart maintenance, uniforms, gloves, insurance and other necessary requirements for the first 5 years. It also agreed to provide SWaCH with training and to conduct awareness-raising with residents.
The contract expired in 2013 but SWaCH had attained sustainability in
The Columbian government assisted the formation of the first cooperative in Columbia but waste pickers had to continue forming other cooperatives without the support from the state.
From 1986 waste pickers attained support from a nongovernmental organisation called Fundacion Social which began by providing waste picker organisations with assistance to form local, regional and national associations as well as significant financial aid.
Columbia’s waste pickers have support from local and international organisations and donors.
A plan adopted in 2012 created a system to register waste pickers and then pay them a fixed rate per kilogram of recyclables diverted from the stream, which significantly increased their income when added to their sales of recyclables. Waste pickers were paid from March 2013.
38
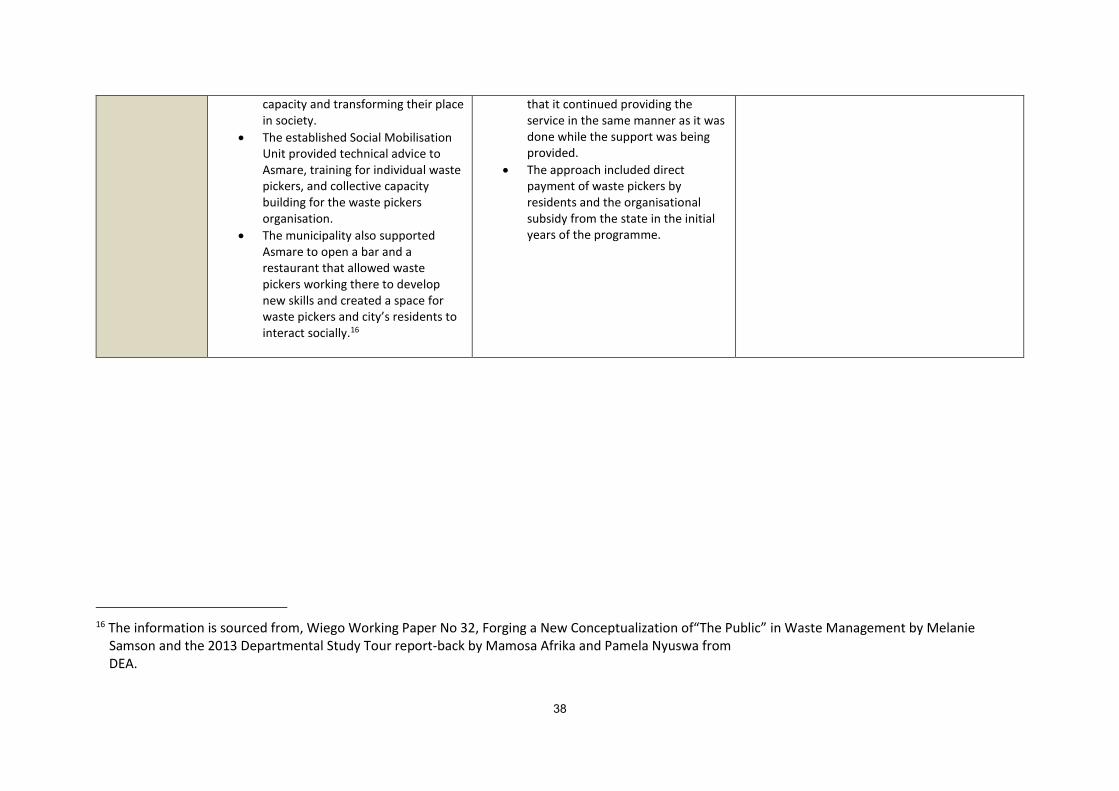
16 The information is sourced from, Wiego Working Paper No 32, Forging a New Conceptualization of“The Public” in Waste Management by Melanie Samson and the 2013 Departmental Study Tour report-back by Mamosa Afrika and Pamela Nyuswa from DEA.
capacity and transforming their place in society.
The established Social Mobilisation Unit provided technical advice to Asmare, training for individual waste pickers, and collective capacity building for the waste pickers organisation.
The municipality also supported Asmare to open a bar and a restaurant that allowed waste pickers working there to develop new skills and created a space for waste pickers and city’s residents to interact socially.16
that it continued providing the service in the same manner as it was done while the support was being provided.
The approach included direct payment of waste pickers by residents and the organisational subsidy from the state in the initial years of the programme.
39
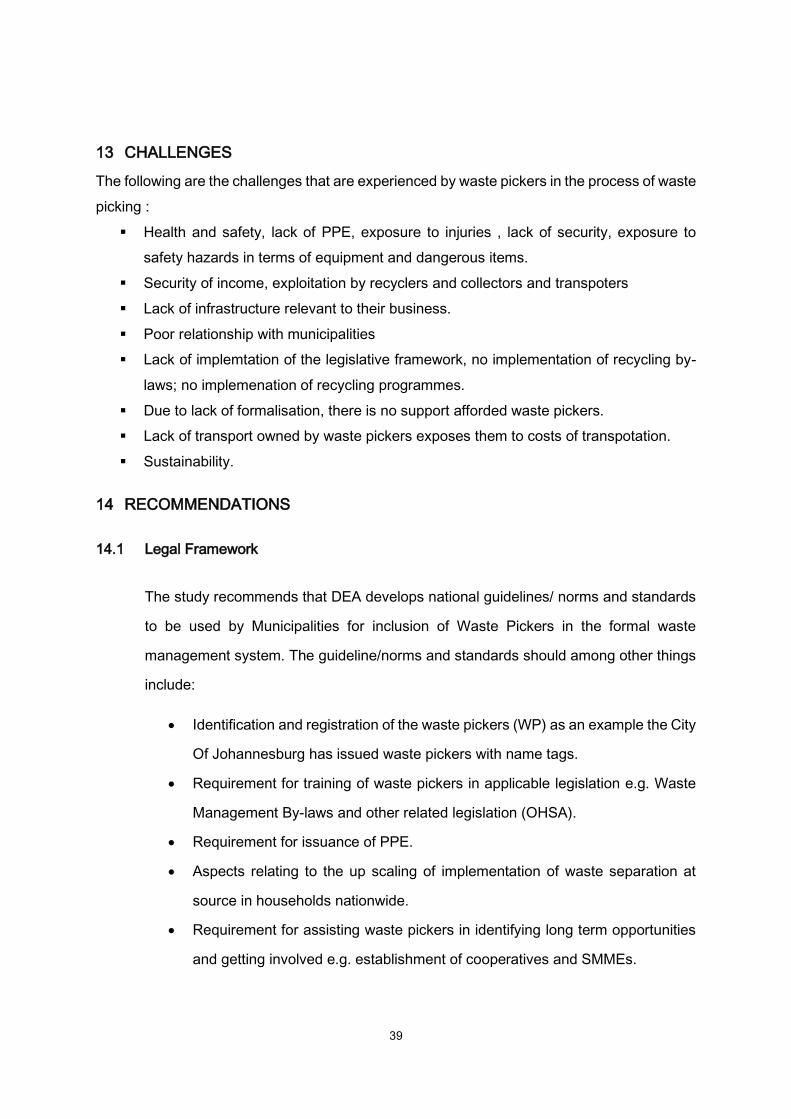
13 CHALLENGES
The following are the challenges that are experienced by waste pickers in the process of waste
picking :
Health and safety, lack of PPE, exposure to injuries , lack of security, exposure to
safety hazards in terms of equipment and dangerous items.
Security of income, exploitation by recyclers and collectors and transpoters
Lack of infrastructure relevant to their business.
Poor relationship with municipalities
Lack of implemtation of the legislative framework, no implementation of recycling by-
laws; no implemenation of recycling programmes.
Due to lack of formalisation, there is no support afforded waste pickers.
Lack of transport owned by waste pickers exposes them to costs of transpotation.
Sustainability.
14 RECOMMENDATIONS
14.1 Legal Framework
The study recommends that DEA develops national guidelines/ norms and standards
to be used by Municipalities for inclusion of Waste Pickers in the formal waste
management system. The guideline/norms and standards should among other things
include:
Identification and registration of the waste pickers (WP) as an example the City
Of Johannesburg has issued waste pickers with name tags.
Requirement for training of waste pickers in applicable legislation e.g. Waste
Management By-laws and other related legislation (OHSA).
Requirement for issuance of PPE.
Aspects relating to the up scaling of implementation of waste separation at
source in households nationwide.
Requirement for assisting waste pickers in identifying long term opportunities
and getting involved e.g. establishment of cooperatives and SMMEs.
40
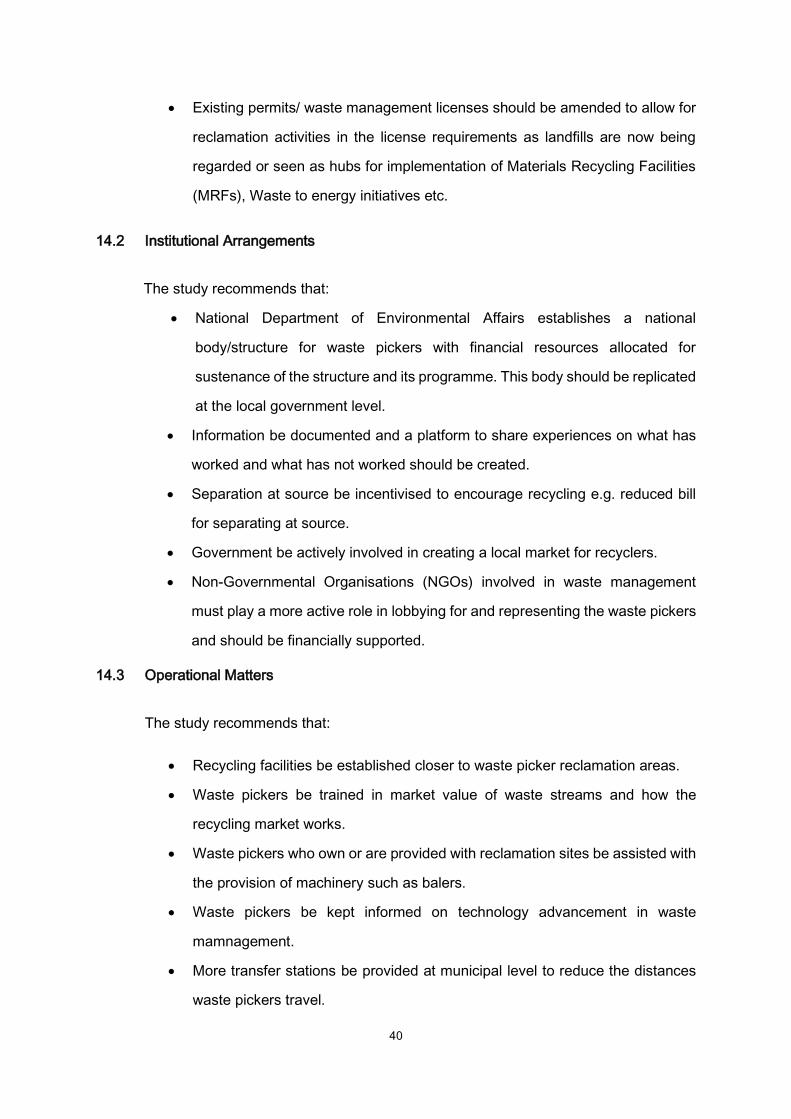
Existing permits/ waste management licenses should be amended to allow for
reclamation activities in the license requirements as landfills are now being
regarded or seen as hubs for implementation of Materials Recycling Facilities
(MRFs), Waste to energy initiatives etc.
14.2 Institutional Arrangements
The study recommends that:
National Department of Environmental Affairs establishes a national
body/structure for waste pickers with financial resources allocated for
sustenance of the structure and its programme. This body should be replicated
at the local government level.
Information be documented and a platform to share experiences on what has
worked and what has not worked should be created.
Separation at source be incentivised to encourage recycling e.g. reduced bill
for separating at source.
Government be actively involved in creating a local market for recyclers.
Non-Governmental Organisations (NGOs) involved in waste management
must play a more active role in lobbying for and representing the waste pickers
and should be financially supported.
14.3 Operational Matters
The study recommends that:
Recycling facilities be established closer to waste picker reclamation areas.
Waste pickers be trained in market value of waste streams and how the
recycling market works.
Waste pickers who own or are provided with reclamation sites be assisted with
the provision of machinery such as balers.
Waste pickers be kept informed on technology advancement in waste
mamnagement.
More transfer stations be provided at municipal level to reduce the distances
waste pickers travel.
41
Industry waste management plans provide insight into how waste recyclers
would be included in the main recycling economy.
The trolleys used by waste pickers should have no sides and be sturdy, durable
and easy to use but designed to carry heavy weight of waste material.
Municipalities enter into relationships with waste pickers, which relationships
can be aided by funding mechanisms.
Minimum standard be developed for the relationship between landfill
management and waste pickers.
A common approach to the nurturing of the relationship between the waste
pickers and landfill management be found.
Forums between middlemen and waste pickers be established as a drive for
mindset change.
A dual operation system in which waste pickers are allowed to pick as much
as they can before the machinery is allowed to compact, in landfills, should be
encouraged.
The approach of running a parallel system of cell activities, trucks on one cell
and waste pickers on the other should be encouraged.
MRFs be built at the municipality level.
Waste pickers be provided with a once of supply of PPE.
Bylaw or law should be developed for the regulation of PPE requirement for
waste pickers.
15 CONCLUSION
15.1 Extent of waste picking in South Africa
On the basis of the data analysed we conclude that: there are about plus /minus 62147
waste pickers in South Africa spread according to the South African population demographics,
with highly populated and urban provinces having the most number waste pickers. i.e Gauteng
, Western Cape and KwaZulu Natal have the highest incidents of waste picking based on their
urbanisation and population.
15.2 Contribution of Waste Pickers to the recycling sector
Waste picking contributes positively to the recycling industry. Waste picking contributes to
income generation and environmental protection and conservation.

42
15.3 Modes of operation of waste pickers
waste picking is predominantly an individual/silo business, and lacks organisation.
Majority of waste pickers :
o operate from landfill sites due to poor or low levels of source separation in
the country;
o would want to be formalised and operate within organised entities;
o lack infrastructure to sustain their businesses, i.e transport, storage
facilities etc.
o lack funds to support their infrastructural, health and safety needs.
15.4 Integration of Waste Pickers into the formal waste management system
Waste pickers should be integrated into the waste management system because that will give
them the benefit of recognition of their activity, industry regulation, government support and
protection.
Further study should be commissioned to determine how the waste pickers should be included
taking into account the South African situation.
16 REFERENCES
Carras, Mark (2012). Waste Pickers in South Africa. http://urbanearth.co.za/articles/waste-pickers-south-africa. Submitted
05.09.2012- 12:15.
eThekwini Municipality (2014). Letter to stakeholders from Economic Development and Investment Promotions Unit, 2nd July.
groundWork report (undated). Waste materials collection and recycling systems integrating the informal sector for uMkhanyakude
District Municipality: ILO collection model and business plan (Part B).
Independent Waste Management Consultant (2014). Interview, May 2014.
NETSAFRICA (2012) Learning from practice: the experience of the NETSAFRICA programme to enhance local Development in
South Africa. http://www.netsafrica.org/attachments/article/90/Guidebook.pdf NETSAFRICA. www.netsafrica.org.za
Paper Recycling Association of South (2014). Operations Director Africa (PRASA). Interview: June 2014.
Samson, M. (2010). Organising Reclaimers in Tshwane, South Africa – Lessons from Top Down and Bottom Up Experiences.
Women in Informal Employment: Globalizing and Organizing (WIEGO).
Sentime, K. (2011). “Profiling solid waste pickers: A case study of Braamfontein – Greater Johannesburg”, in Africanus, Vol. 41,
No. 2, pp. 96-111.

43
Schenck, S., Blaauw, D., Viljoen, K. (2012). “Unrecognized Waste Management Experts: challenges and Opportunities for Small
Business Development and Decent Job Creation in the Waste Sector”. International Labour Organisation (ILO).
South African Waste Information Centre (SAWIC). http://sawic.environment.gov.za/?menu=75
Econex Research Note 24, August 2011. Economic Report on the Impact of an Export Restriction on Scrap Metal in SA.
17 APPENDICES
17.1 List of landfill sites and number of waste pickers at sites visited
VISITED DURING SURVEY
PROVINCE NAME OF SITE TYPE MUNICIPALITY WASTE PICKERS
EC Stutterheim G: S: B+ Amathole DM 3
KZN Ezakheni G: S: B- uThukela DM 26
MP Standerton WDS G: S: B- Gert Sibande DM 26
LP Groblersdal G: S: B- Sekhukhune DM 0
WC Moorreesburg G: S: B- West Coast DM 0
WC Bredasdorp G: S: B- Overberg DM 0
NW Pelindaba G: S: B- Bojanala Platinum DM 0
FS Orkney Kanana G: S: B- Fezile Dabi DM 0
NW Mooinooi G: S: B- Bojanala Platinum DM 0
NC Calvinia G: S: B- Namakwa DM 0
MP Greylingstad G: S: B- Gert Sibande DM 0
GP Magaliesburg G: S: B- West Rand DM 0
FS Bothaville G: S: B- Lejweleputswa DM 0
MP Hazyview G: M: B+ Ehlanzeni DM 20
WC Wellington G: M: B+ Cape Winelands DM 0
WC Brackenfell G: M: B+ Cape Town Metro 0
GP Soshanguve G: M: B- Tshwane Metro 90
KZN New England G: M: B- Umgungundlovu DM 450
NC Kimberley G: M: B- Frances Baard DM 200
EC Mthatha G: M: B- OR Tambo DM 200
KZN Newcastle G: M: B- Amajuba DM 100
NC Kuruman G: M: B-
John Taolo Gaetsewe
DM 80
LP Weltevreden G: M: B Capricorn DM 250
EC East London G: M: B Buffalo City Metro 100
LP Thohoyandou G: M: B Vhembe DM 50
LP Tzaneen G: M: B Greater Tzaneen DM 35
EC Arlington G: L: B+ Nelson Mandela Metro 100
MP Tekwane West Central G: L: B+ Ehlanzeni DM 50
WC Bellville WDS G: L: B+ Cape Town Metro 0
WC Bellville Park G: L: B+ Cape Town Metro 0
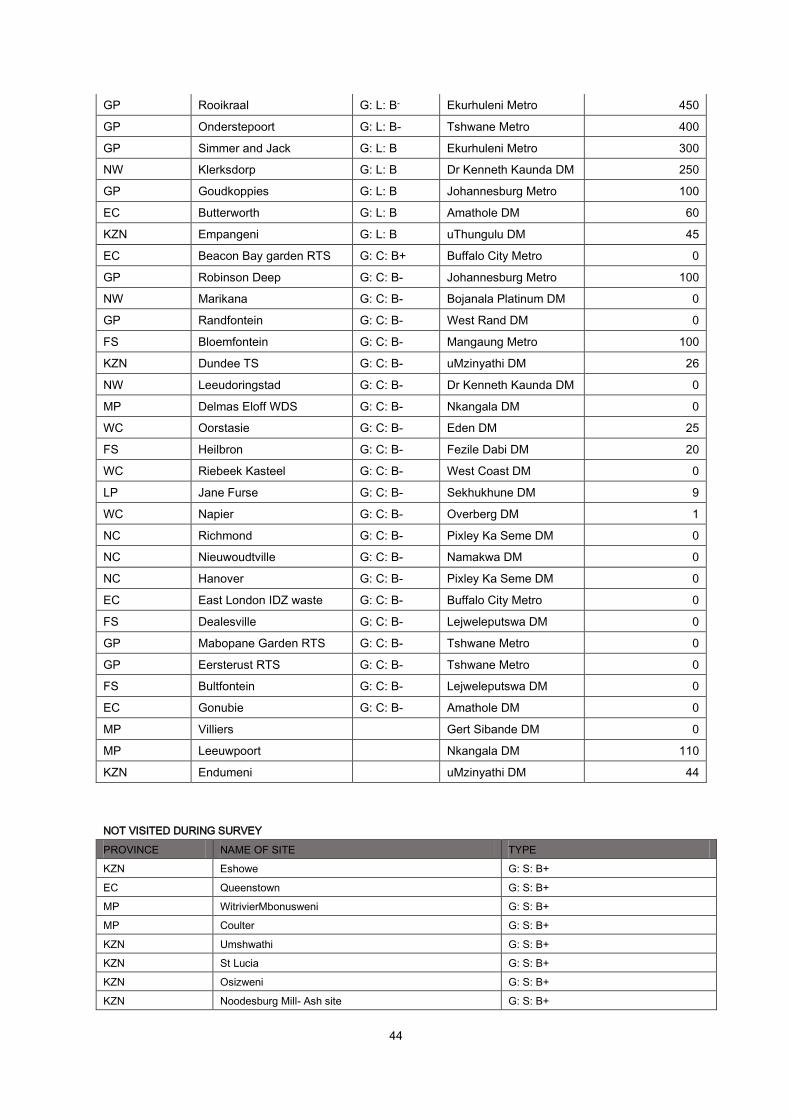
44
GP Rooikraal G: L: B- Ekurhuleni Metro 450
GP Onderstepoort G: L: B- Tshwane Metro 400
GP Simmer and Jack G: L: B Ekurhuleni Metro 300
NW Klerksdorp G: L: B Dr Kenneth Kaunda DM 250
GP Goudkoppies G: L: B Johannesburg Metro 100
EC Butterworth G: L: B Amathole DM 60
KZN Empangeni G: L: B uThungulu DM 45
EC Beacon Bay garden RTS G: C: B+ Buffalo City Metro 0
GP Robinson Deep G: C: B- Johannesburg Metro 100
NW Marikana G: C: B- Bojanala Platinum DM 0
GP Randfontein G: C: B- West Rand DM 0
FS Bloemfontein G: C: B- Mangaung Metro 100
KZN Dundee TS G: C: B- uMzinyathi DM 26
NW Leeudoringstad G: C: B- Dr Kenneth Kaunda DM 0
MP Delmas Eloff WDS G: C: B- Nkangala DM 0
WC Oorstasie G: C: B- Eden DM 25
FS Heilbron G: C: B- Fezile Dabi DM 20
WC Riebeek Kasteel G: C: B- West Coast DM 0
LP Jane Furse G: C: B- Sekhukhune DM 9
WC Napier G: C: B- Overberg DM 1
NC Richmond G: C: B- Pixley Ka Seme DM 0
NC Nieuwoudtville G: C: B- Namakwa DM 0
NC Hanover G: C: B- Pixley Ka Seme DM 0
EC East London IDZ waste G: C: B- Buffalo City Metro 0
FS Dealesville G: C: B- Lejweleputswa DM 0
GP Mabopane Garden RTS G: C: B- Tshwane Metro 0
GP Eersterust RTS G: C: B- Tshwane Metro 0
FS Bultfontein G: C: B- Lejweleputswa DM 0
EC Gonubie G: C: B- Amathole DM 0
MP Villiers Gert Sibande DM 0
MP Leeuwpoort Nkangala DM 110
KZN Endumeni uMzinyathi DM 44
NOT VISITED DURING SURVEY
PROVINCE NAME OF SITE TYPE
KZN Eshowe G: S: B+
EC Queenstown G: S: B+
MP WitrivierMbonusweni G: S: B+
MP Coulter G: S: B+
KZN Umshwathi G: S: B+
KZN St Lucia G: S: B+
KZN Osizweni G: S: B+
KZN Noodesburg Mill- Ash site G: S: B+
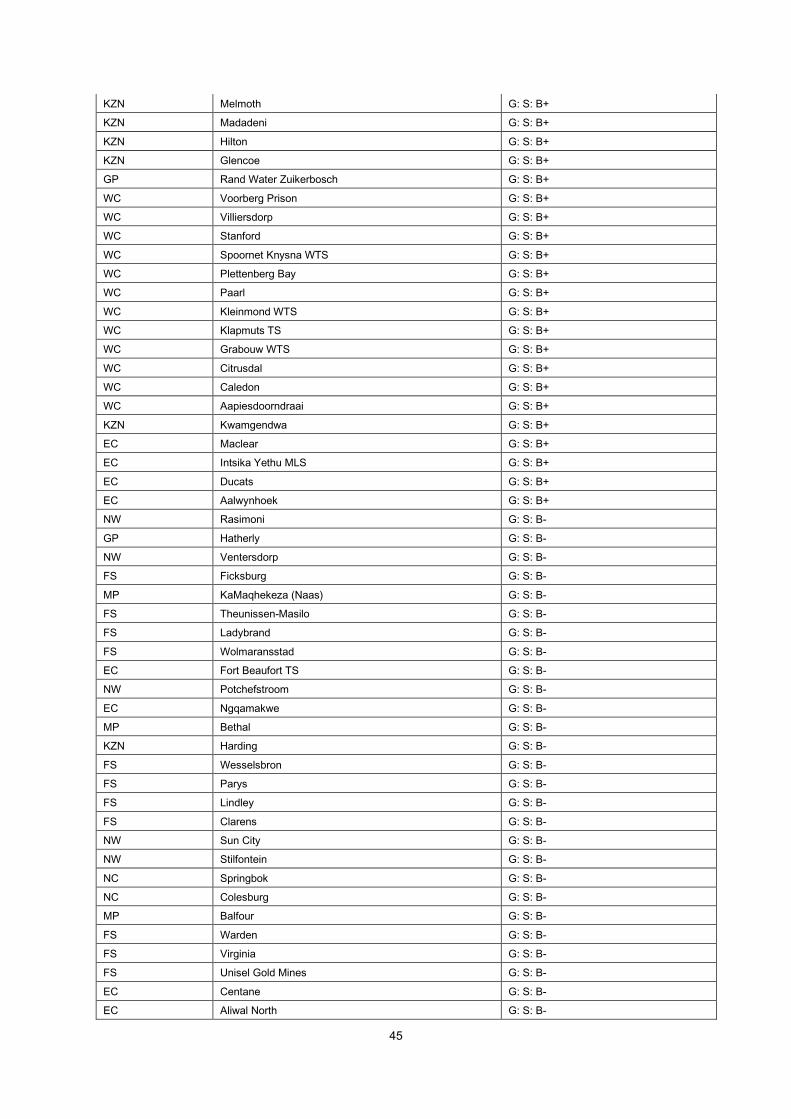
45
KZN Melmoth G: S: B+
KZN Madadeni G: S: B+
KZN Hilton G: S: B+
KZN Glencoe G: S: B+
GP Rand Water Zuikerbosch G: S: B+
WC Voorberg Prison G: S: B+
WC Villiersdorp G: S: B+
WC Stanford G: S: B+
WC Spoornet Knysna WTS G: S: B+
WC Plettenberg Bay G: S: B+
WC Paarl G: S: B+
WC Kleinmond WTS G: S: B+
WC Klapmuts TS G: S: B+
WC Grabouw WTS G: S: B+
WC Citrusdal G: S: B+
WC Caledon G: S: B+
WC Aapiesdoorndraai G: S: B+
KZN Kwamgendwa G: S: B+
EC Maclear G: S: B+
EC Intsika Yethu MLS G: S: B+
EC Ducats G: S: B+
EC Aalwynhoek G: S: B+
NW Rasimoni G: S: B-
GP Hatherly G: S: B-
NW Ventersdorp G: S: B-
FS Ficksburg G: S: B-
MP KaMaqhekeza (Naas) G: S: B-
FS Theunissen-Masilo G: S: B-
FS Ladybrand G: S: B-
FS Wolmaransstad G: S: B-
EC Fort Beaufort TS G: S: B-
NW Potchefstroom G: S: B-
EC Ngqamakwe G: S: B-
MP Bethal G: S: B-
KZN Harding G: S: B-
FS Wesselsbron G: S: B-
FS Parys G: S: B-
FS Lindley G: S: B-
FS Clarens G: S: B-
NW Sun City G: S: B-
NW Stilfontein G: S: B-
NC Springbok G: S: B-
NC Colesburg G: S: B-
MP Balfour G: S: B-
FS Warden G: S: B-
FS Virginia G: S: B-
FS Unisel Gold Mines G: S: B-
EC Centane G: S: B-
EC Aliwal North G: S: B-

46
LP Naboomspruit G: S: B-
NW Zeerust G: S: B-
NW Western Platinum G: S: B-
NW Schweizer Reneke G: S: B-
NW Schoemansville G: S: B-
NW Roosespruit G: S: B-
NW Phokeng G: S: B-
NW Northam Platinum G: S: B-
NW Madikwe G: S: B-
NW Lonmin-Karee G: S: B-
NW Jouberton G: S: B-
NW Impala Platinum Quarry G: S: B-
NW Delareyville G: S: B-
NW Bafokeng Rasimone Platinum Mine G: S: B-
NC Wegdraai G: S: B-
NC Victoria West G: S: B-
NC Verwoerddamdorp G: S: B-
NC Swartmodderweg Upington G: S: B-
NC Steinkopf G: S: B-
NC Raaswater G: S: B-
NC Port Nolloth G: S: B-
NC Noupoort G: S: B-
NC Leerkrans G: S: B-
NC Koningnaas Town Hard Scrap Dump G: S: B-
NC Komaggas G: S: B-
NC Kalksloot G: S: B-
NC Kakamas (Britstown) G: S: B-
NC Kakamas G: S: B-
NC Grootdrink G: S: B-
NC De Aar G: S: B-
NC Buffelsrivier G: S: B-
NC Black Mountain Zuurwater G: S: B-
NC Black Mountain Aggeneys G: S: B-
NC Alexkor G: S: B-
MP Piet Retief G: S: B-
MP Palaborwa Mining Co G: S: B-
MP Libangeni G: S: B-
MP Leslie Mine G: S: B-
MP Kwagga Plaza G: S: B-
MP Groot Vlei Power Station G: S: B-
MP Evander G: S: B-
MP Eskom Tutuka Power Station G: S: B-
MP Belfast G: S: B-
LP Tshikondeni G: S: B-
LP Thabazimbi Donkerpoort G: S: B-
LP Skukuza G: S: B-
LP Shingwedzi G: S: B-
LP Rebone G: S: B-
LP Nylstroom G: S: B-
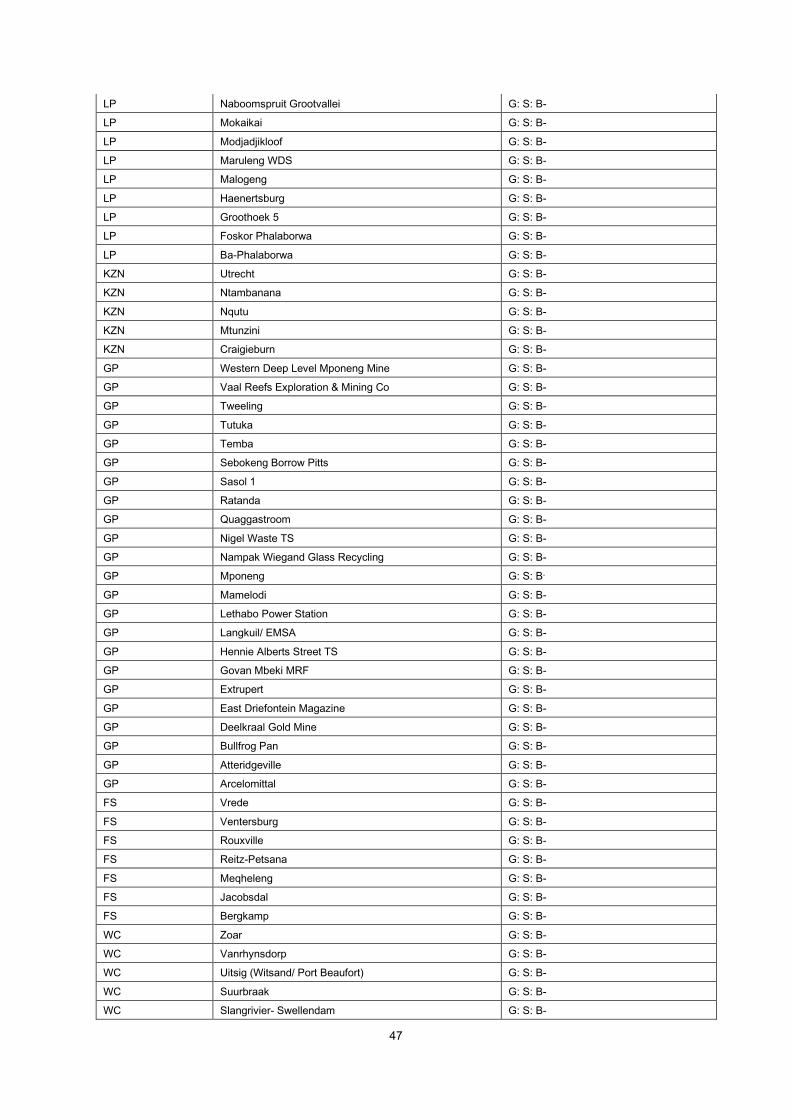
47
LP Naboomspruit Grootvallei G: S: B-
LP Mokaikai G: S: B-
LP Modjadjikloof G: S: B-
LP Maruleng WDS G: S: B-
LP Malogeng G: S: B-
LP Haenertsburg G: S: B-
LP Groothoek 5 G: S: B-
LP Foskor Phalaborwa G: S: B-
LP Ba-Phalaborwa G: S: B-
KZN Utrecht G: S: B-
KZN Ntambanana G: S: B-
KZN Nqutu G: S: B-
KZN Mtunzini G: S: B-
KZN Craigieburn G: S: B-
GP Western Deep Level Mponeng Mine G: S: B-
GP Vaal Reefs Exploration & Mining Co G: S: B-
GP Tweeling G: S: B-
GP Tutuka G: S: B-
GP Temba G: S: B-
GP Sebokeng Borrow Pitts G: S: B-
GP Sasol 1 G: S: B-
GP Ratanda G: S: B-
GP Quaggastroom G: S: B-
GP Nigel Waste TS G: S: B-
GP Nampak Wiegand Glass Recycling G: S: B-
GP Mponeng G: S: B-
GP Mamelodi G: S: B-
GP Lethabo Power Station G: S: B-
GP Langkuil/ EMSA G: S: B-
GP Hennie Alberts Street TS G: S: B-
GP Govan Mbeki MRF G: S: B-
GP Extrupert G: S: B-
GP East Driefontein Magazine G: S: B-
GP Deelkraal Gold Mine G: S: B-
GP Bullfrog Pan G: S: B-
GP Atteridgeville G: S: B-
GP Arcelomittal G: S: B-
FS Vrede G: S: B-
FS Ventersburg G: S: B-
FS Rouxville G: S: B-
FS Reitz-Petsana G: S: B-
FS Meqheleng G: S: B-
FS Jacobsdal G: S: B-
FS Bergkamp G: S: B-
WC Zoar G: S: B-
WC Vanrhynsdorp G: S: B-
WC Uitsig (Witsand/ Port Beaufort) G: S: B-
WC Suurbraak G: S: B-
WC Slangrivier- Swellendam G: S: B-

48
WC Riviersonderend G: S: B-
WC Langebaan G: S: B-
WC Laingsburg G: S: B-
WC Ladismith G: S: B-
WC Hopefield- Leengroef G: S: B-
WC Droekloof- Heidelberg G: S: B-
WC Bonnievale G: S: B-
WC Bessikop- Montagu G: S: B-
LP Vondeling Louis Trichardt G: S: B-
LP Vaalwater G: S: B-
KZN Wartburg G: S: B-
KZN Pomeroy G: S: B-
KZN Mount Edgecombe RTS G: S: B-
KZN Mondi Felixton G: S: B-
KZN Emkhankasweni G: S: B-
FS Winburg G: S: B-
FS Wessels Mine G: S: B-
FS Steynsrus G: S: B-
FS St Helena Gold Mine G: S: B-
FS Smithfield G: S: B-
FS Petrus Steyn Transfer Station LS G: S: B-
FS Paul Roux G: S: B-
FS Mashaeng G: S: B-
FS Kestell G: S: B-
FS Jagersfontein G: S: B-
FS Hoopstad G: S: B-
FS HJ Joel Gold Mine G: S: B-
FS Harrismith-Phomolong G: S: B-
FS Free Gold Mine (FSG7) G: S: B-
FS Fauresmith G: S: B-
FS Edenburg G: S: B-
FS Beatrix Mine G: S: B-
FS Allanridge G: S: B-
EC Storms River G: S: B-
EC Rossouw G: S: B-
EC Riebeeck East G: S: B-
EC Paterson G: S: B-
EC Mistkraal G: S: B-
EC Longmore WDS G: S: B-
EC Kilian Brickfields G: S: B-
EC JC Steyn Prison G: S: B-
EC Hankey G: S: B-
EC Cookhouse G: S: B-
EC Bontrug G: S: B-
EC Boesmansriviermond G: S: B-
EC Addo Langbos G: S: B-
EC Second Creek Landfill G: +C267:C386M: B+
WC Stellenbosch Municipality G: M: B+
KZN Mhlatuze G: M: B+
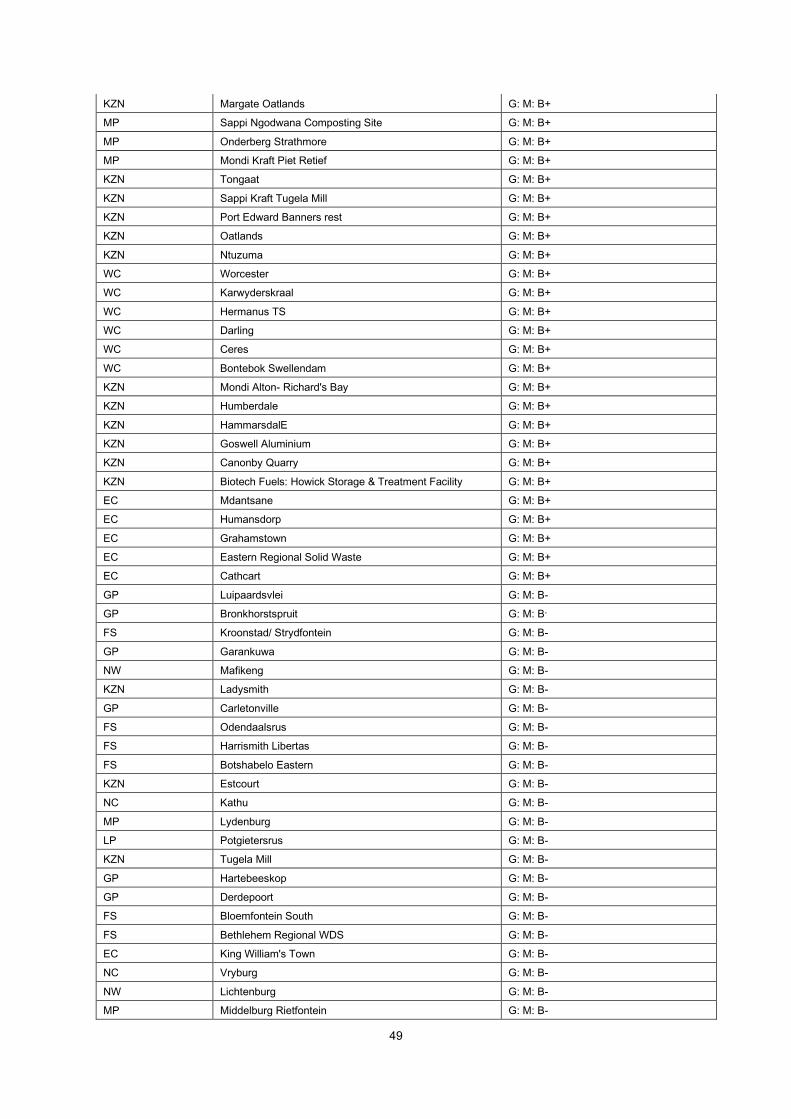
49
KZN Margate Oatlands G: M: B+
MP Sappi Ngodwana Composting Site G: M: B+
MP Onderberg Strathmore G: M: B+
MP Mondi Kraft Piet Retief G: M: B+
KZN Tongaat G: M: B+
KZN Sappi Kraft Tugela Mill G: M: B+
KZN Port Edward Banners rest G: M: B+
KZN Oatlands G: M: B+
KZN Ntuzuma G: M: B+
WC Worcester G: M: B+
WC Karwyderskraal G: M: B+
WC Hermanus TS G: M: B+
WC Darling G: M: B+
WC Ceres G: M: B+
WC Bontebok Swellendam G: M: B+
KZN Mondi Alton- Richard's Bay G: M: B+
KZN Humberdale G: M: B+
KZN HammarsdalE G: M: B+
KZN Goswell Aluminium G: M: B+
KZN Canonby Quarry G: M: B+
KZN Biotech Fuels: Howick Storage & Treatment Facility G: M: B+
EC Mdantsane G: M: B+
EC Humansdorp G: M: B+
EC Grahamstown G: M: B+
EC Eastern Regional Solid Waste G: M: B+
EC Cathcart G: M: B+
GP Luipaardsvlei G: M: B-
GP Bronkhorstspruit G: M: B-
FS Kroonstad/ Strydfontein G: M: B-
GP Garankuwa G: M: B-
NW Mafikeng G: M: B-
KZN Ladysmith G: M: B-
GP Carletonville G: M: B-
FS Odendaalsrus G: M: B-
FS Harrismith Libertas G: M: B-
FS Botshabelo Eastern G: M: B-
KZN Estcourt G: M: B-
NC Kathu G: M: B-
MP Lydenburg G: M: B-
LP Potgietersrus G: M: B-
KZN Tugela Mill G: M: B-
GP Hartebeeskop G: M: B-
GP Derdepoort G: M: B-
FS Bloemfontein South G: M: B-
FS Bethlehem Regional WDS G: M: B-
EC King William's Town G: M: B-
NC Vryburg G: M: B-
NW Lichtenburg G: M: B-
MP Middelburg Rietfontein G: M: B-

50
MP Ermelo G: M: B-
MP C&G Energy & GF Green Energy SA G: M: B-
KZN Nondweni Landfill Site G: M: B-
KZN Mooi River G: M: B-
KZN Howick G: M: B-
NW Rustenburg Platinum Mines G: M: B-
NW Anglo Platinum Rustenburg Platinum Mine G: M: B-
MP Mbombela TS & Recycling G: M: B-
LP Pietersburg G: M: B-
LP Marble Hall G: M: B-
LP Lebowa Platinum Zeekoegat G: M: B-
KZN Mpumalanga G: M: B-
KZN Inanda G: M: B-
GP Zuurfontein G: M: B-
GP Tembisa G: M: B-
GP Soshangive/ Rietgat G: M: B-
GP Skip Waste Recycling Centre G: M: B-
GP Sebokeng Zone 16 G: M: B-
GP Saulsville G: M: B-
GP Randburg G: M: B-
GP Palm Springs G: M: B-
GP Lottering G: M: B-
GP Lebohang G: M: B-
GP Lebanon G: M: B-
GP Kwaggasrand G: M: B-
GP Heidelberg Road TS G: M: B-
GP FG G: M: B-
GP Envirowaste recycling centre G: M: B-
GP Ennerdale G: M: B-
GP Dobsonville G: M: B-
GP Brakpan Mines G: M: B-
WC Vredenburg/ Saldanha G: M: B-
WC Robertson G: M: B-
WC Oudtshoorn (Grootkop) G: M: B-
WC Highlands- Malmesbury G: M: B-
WC Gwaing G: M: B-
WC Gansbaai G: M: B-
NW Hartbeesfontein G: M: B-
NC Die Duine- Upington G: M: B-
KZN Umtentweni G: M: B-
KZN Umbumbulu Road G: M: B-
KZN Shongweni G: M: B-
KZN Magabheni G: M: B-
KZN Broomcliffe G: M: B-
GP Bon Accord G: M: B-
FS Virginia TS G: M: B-
FS Phomolong G: M: B-
FS Bloemfontein Noordstort G: M: B-
EC Somerset East G: M: B-
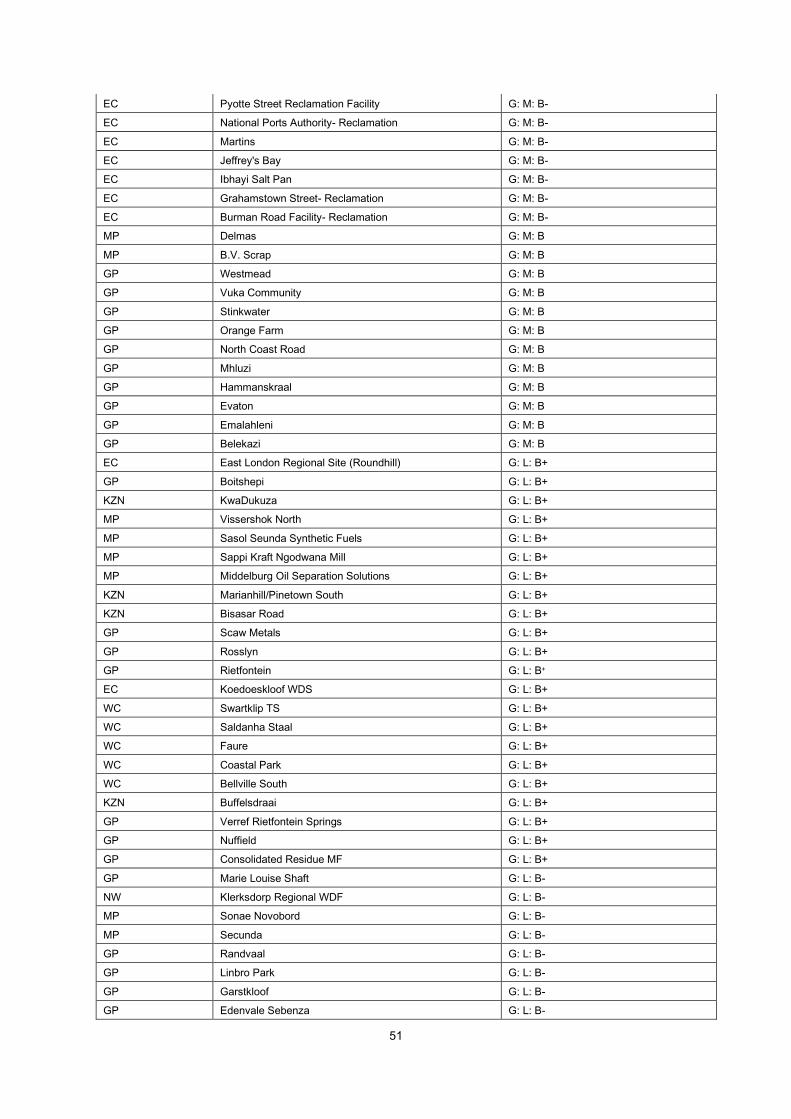
51
EC Pyotte Street Reclamation Facility G: M: B-
EC National Ports Authority- Reclamation G: M: B-
EC Martins G: M: B-
EC Jeffrey's Bay G: M: B-
EC Ibhayi Salt Pan G: M: B-
EC Grahamstown Street- Reclamation G: M: B-
EC Burman Road Facility- Reclamation G: M: B-
MP Delmas G: M: B
MP B.V. Scrap G: M: B
GP Westmead G: M: B
GP Vuka Community G: M: B
GP Stinkwater G: M: B
GP Orange Farm G: M: B
GP North Coast Road G: M: B
GP Mhluzi G: M: B
GP Hammanskraal G: M: B
GP Evaton G: M: B
GP Emalahleni G: M: B
GP Belekazi G: M: B
EC East London Regional Site (Roundhill) G: L: B+
GP Boitshepi G: L: B+
KZN KwaDukuza G: L: B+
MP Vissershok North G: L: B+
MP Sasol Seunda Synthetic Fuels G: L: B+
MP Sappi Kraft Ngodwana Mill G: L: B+
MP Middelburg Oil Separation Solutions G: L: B+
KZN Marianhill/Pinetown South G: L: B+
KZN Bisasar Road G: L: B+
GP Scaw Metals G: L: B+
GP Rosslyn G: L: B+
GP Rietfontein G: L: B+
EC Koedoeskloof WDS G: L: B+
WC Swartklip TS G: L: B+
WC Saldanha Staal G: L: B+
WC Faure G: L: B+
WC Coastal Park G: L: B+
WC Bellville South G: L: B+
KZN Buffelsdraai G: L: B+
GP Verref Rietfontein Springs G: L: B+
GP Nuffield G: L: B+
GP Consolidated Residue MF G: L: B+
GP Marie Louise Shaft G: L: B-
NW Klerksdorp Regional WDF G: L: B-
MP Sonae Novobord G: L: B-
MP Secunda G: L: B-
GP Randvaal G: L: B-
GP Linbro Park G: L: B-
GP Garstkloof G: L: B-
GP Edenvale Sebenza G: L: B-
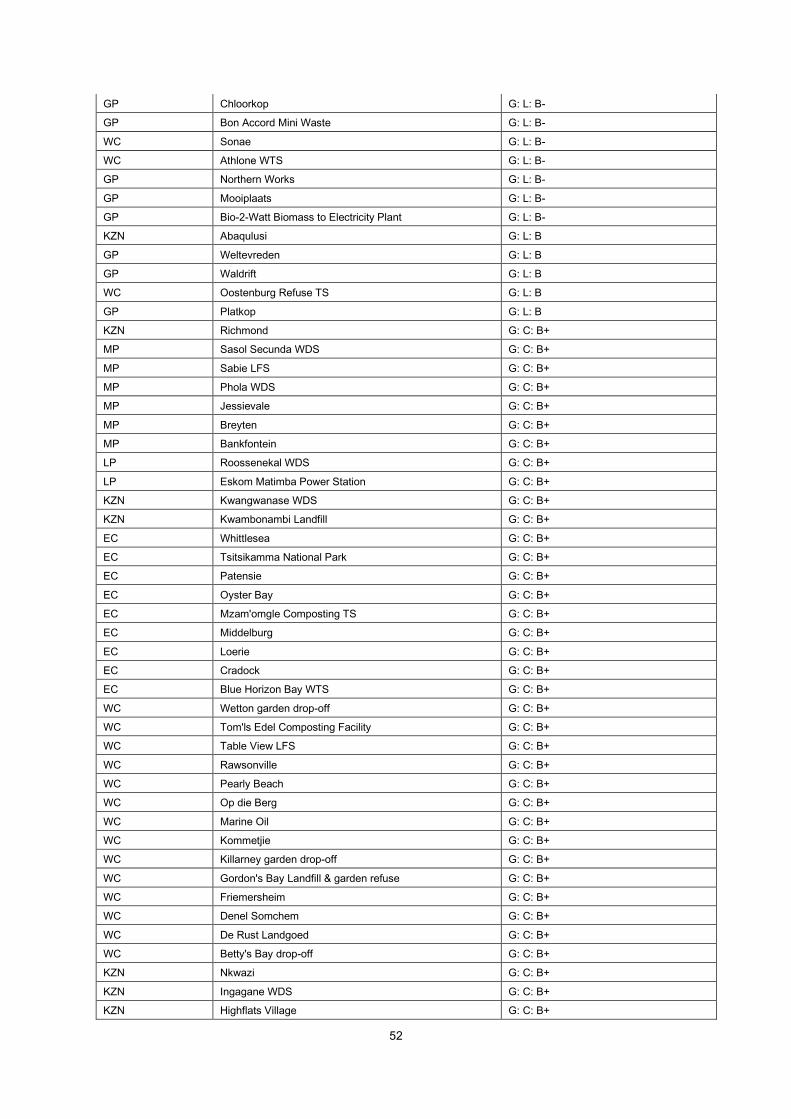
52
GP Chloorkop G: L: B-
GP Bon Accord Mini Waste G: L: B-
WC Sonae G: L: B-
WC Athlone WTS G: L: B-
GP Northern Works G: L: B-
GP Mooiplaats G: L: B-
GP Bio-2-Watt Biomass to Electricity Plant G: L: B-
KZN Abaqulusi G: L: B
GP Weltevreden G: L: B
GP Waldrift G: L: B
WC Oostenburg Refuse TS G: L: B
GP Platkop G: L: B
KZN Richmond G: C: B+
MP Sasol Secunda WDS G: C: B+
MP Sabie LFS G: C: B+
MP Phola WDS G: C: B+
MP Jessievale G: C: B+
MP Breyten G: C: B+
MP Bankfontein G: C: B+
LP Roossenekal WDS G: C: B+
LP Eskom Matimba Power Station G: C: B+
KZN Kwangwanase WDS G: C: B+
KZN Kwambonambi Landfill G: C: B+
EC Whittlesea G: C: B+
EC Tsitsikamma National Park G: C: B+
EC Patensie G: C: B+
EC Oyster Bay G: C: B+
EC Mzam'omgle Composting TS G: C: B+
EC Middelburg G: C: B+
EC Loerie G: C: B+
EC Cradock G: C: B+
EC Blue Horizon Bay WTS G: C: B+
WC Wetton garden drop-off G: C: B+
WC Tom'ls Edel Composting Facility G: C: B+
WC Table View LFS G: C: B+
WC Rawsonville G: C: B+
WC Pearly Beach G: C: B+
WC Op die Berg G: C: B+
WC Marine Oil G: C: B+
WC Kommetjie G: C: B+
WC Killarney garden drop-off G: C: B+
WC Gordon's Bay Landfill & garden refuse G: C: B+
WC Friemersheim G: C: B+
WC Denel Somchem G: C: B+
WC De Rust Landgoed G: C: B+
WC Betty's Bay drop-off G: C: B+
KZN Nkwazi G: C: B+
KZN Ingagane WDS G: C: B+
KZN Highflats Village G: C: B+

53
KZN Frischgewaagd G: C: B+
KZN Babanango G: C: B+
GP Anglogold: West Industrial Site G: C: B+
EC West Bank GRTS G: C: B+
EC Alexandria Nature Reserve G: C: B+
NW Rustenburg G: C: B-
MP Burgersfort G: C: B-
MP Acornhoek G: C: B-
NW Taung G: C: B-
NW Monnakato G: C: B-
NW Mogwase G: C: B-
NW Ganyisa G: C: B-
NC Concordia G: C: B-
MP Kanyamazane (3 sites) G: C: B-
MP Ekundustria G: C: B-
LP Ohrigstad G: C: B-
LP Giyani G: C: B-
FS TweeSpruit G: C: B-
FS Marquard G: C: B-
FS Frankfort G: C: B-
FS Borwa G: C: B-
EC Ntabankulu G: C: B-
EC Bizana G: C: B-
FS Fouriesburg G: C: B-
NC Groblershoop G: C: B-
NC Garies G: C: B-
LP Namakgale G: C: B-
LP Mahlwereng G: C: B-
FS QwaQwa G: C: B-
EC Idutywa G: C: B-
FS Vredefort G: C: B-
FS Brandfort G: C: B-
WC Kliprand G: C: B-
WC De Doorns G: C: B-
WC Barrydale G: C: B-
NW Swartruggens G: C: B-
NW Rooiberg G: C: B-
NW Lehurutshe G: C: B-
NW Koster Dumping site G: C: B-
NW Bloemhof G: C: B-
NC Koopmansfontein (OLD) G: C: B-
NC Campbell G: C: B-
KZN Ulundi RTS G: C: B-
GP Zonderwater (Cullinan Prison) G: C: B-
FS Senekal G: C: B-
FS Clocolan G: C: B-
EC Kei Mouth G: C: B-
EC Barkly East (old site) G: C: B-
LP Lebowakgomo G: C: B-

54
KZN Big Five G: C: B-
FS Oranjeville G: C: B-
FS Deneysville / Refengkgotso G: C: B-
EC Ngqeleni G: C: B-
NW Eastern Platinum G: C: B-
NW Derby G: C: B-
NW Christiana G: C: B-
NW Bethanie G: C: B-
NC Kheis G: C: B-
NC Keimoes G: C: B-
NC Hondeklipbaai G: C: B-
NC Ganspan G: C: B-
NC Douglas G: C: B-
MP Siyabuswa G: C: B-
MP Silobela / Carolina G: C: B-
MP Matsulu G: C: B-
FS Zastron G: C: B-
EC Sterkspruit G: C: B-
EC Lusikisiki G: C: B-
EC Lady Frere G: C: B-
KZN KwaSani RTS G: C: B-
FS Cornelia G: C: B-
GP Devon G: C: B-
WC Namakwa Sands MSP G: C: B-
WC Murraysburg G: C: B-
WC Morningstar drop-off facility G: C: B-
WC Merweville G: C: B-
WC Melkhoutfontein G: C: B-
WC Malgas G: C: B-
WC Lutzville G: C: B-
WC Leipoldville G: C: B-
WC Lambertsbaai garden refuse G: C: B-
WC Lamberts Bay G: C: B-
WC Kwanonqaba RTS G: C: B-
WC Koringberg G: C: B-
WC Koekenaap G: C: B-
WC Klipkop Malmesbury G: C: B-
WC Hopefield garden refuse G: C: B-
WC Greyton G: C: B-
WC Gouritsmond G: C: B-
WC General Aviation Area (GAA) G: C: B-
WC Genadendal G: C: B-
WC Eselsbank G: C: B-
WC Elim G: C: B-
WC Elandsbaai G: C: B-
WC Ebenhaeser G: C: B-
WC Dysselsdorp G: C: B-
WC Doringbaai G: C: B-
WC De Rust G: C: B-

55
WC De Punt G: C: B-
WC Clanwilliam G: C: B-
WC Cape Infanta G: C: B-
WC Calitzdorp G: C: B-
WC Bitterfontein G: C: B-
WC Beaufort West Vaalkoppies G: C: B-
WC Ashton Municipality G: C: B-
WC Albertina G: C: B-
NW Makwassie G: C: B-
NW Impelegeng G: C: B-
NW Fochville G: C: B-
NW Bray G: C: B-
NW Afrisam Dudfield G: C: B-
NC Middelpos G: C: B-
NC Mata-Mata G: C: B-
NC Marchand G: C: B-
NC Loxton G: C: B-
NC Loubos G: C: B-
NC Loeriesfontein G: C: B-
NC Leliefontein G: C: B-
NC Lekkersing G: C: B-
NC Koingnaas Town Hostel Kitchen refuse dump G: C: B-
NC Koingnaas Town garden refuse dump G: C: B-
NC Koingnaas Town domestic refuse dump G: C: B-
NC Koingnaas Town Building rubble dump G: C: B-
NC Koingnaas Mine SSD G: C: B-
NC Koingnaas Mine Soft Scrap Dump G: C: B-
NC Koingnaas Mine Hard Scrap Dump G: C: B-
NC Klipfontein G: C: B-
NC Kleinzee Town Salvage Dump G: C: B-
NC Kleinzee Town Koingnaas Road Hard Scrap G: C: B-
NC Kleinzee Town Garden RS G: C: B-
NC Kleinzee Town Dreyers Pan G: C: B-
NC Kleinzee Town building rubble dump G: C: B-
NC Klein-Nourivier G: C: B-
NC Khubus G: C: B-
NC Kenhardt G: C: B-
NC Karkams G: C: B-
NC Kamieskroon G: C: B-
NC Hotazel G: C: B-
NC Groot Mier G: C: B-
NC Griekwastad G: C: B-
NC Giftkop Alexkor G: C: B-
NC Geelpan Vaalputs G: C: B-
NC Gamsberg G: C: B-
NC Fraserburg Landfill Site G: C: B-
NC Eksteenfontein G: C: B-
NC De Beers Koingnaas HSD G: C: B-
NC De Beers Inland Langhoogte HS G: C: B-

56
NC Carnarvon G: C: B-
NC Bulletrap G: C: B-
NC Buffels Marine Complex Tweepad Soft Scrap G: C: B-
NC Buffels Marine Complex Tweepad Hard Scrap G: C: B-
NC Buffels Inland Complex Nuttabooi SSD G: C: B-
NC Buffels Inland Complex Langhoogte SSD G: C: B-
NC Brandvlei G: C: B-
NC Brandkaros Alexkor G: C: B-
NC Beeshoek G: C: B-
NC Beauvallon Alexkor G: C: B-
NC Baken G: C: B-
NC Askham G: C: B-
MP York Lumber G: C: B-
MP Waterval Boven G: C: B-
MP Wakkerstroom G: C: B-
MP Villiers G: C: B-
MP Sonheuwel G: C: B-
MP Shatale G: C: B-
MP Sappi Forest Ndubazi G: C: B-
MP Sappi Forest Doyershoek G: C: B-
MP Sappi Forest G: C: B-
MP SAFCOL G: C: B-
MP Rietkuil G: C: B-
MP Perdekop G: C: B-
MP Mkhuhlu G: C: B-
MP Maviljan G: C: B-
MP Marloth Park G: C: B-
MP Machadodorp G: C: B-
MP Lothair G: C: B-
MP Lillydale G: C: B-
MP Leandra G: C: B-
MP Kinross G: C: B-
MP Hectorspruit G: C: B-
MP Greens Waste G: C: B-
MP Empuluzi G: C: B-
MP Elukwatini G: C: B-
MP Ekulindeni G: C: B-
MP Dullstroom G: C: B-
MP Doornkop WDS G: C: B-
MP Davel G: C: B-
MP Chrissismeer G: C: B-
MP Casteel G: C: B-
MP Barvale G: C: B-
MP Badplaas G: C: B-
MP Amsterdam G: C: B-
LP Webster RTS G: C: B-
LP Vuwani RTS G: C: B-
LP Venetia Mine G: C: B-
LP Steelpoort G: C: B-
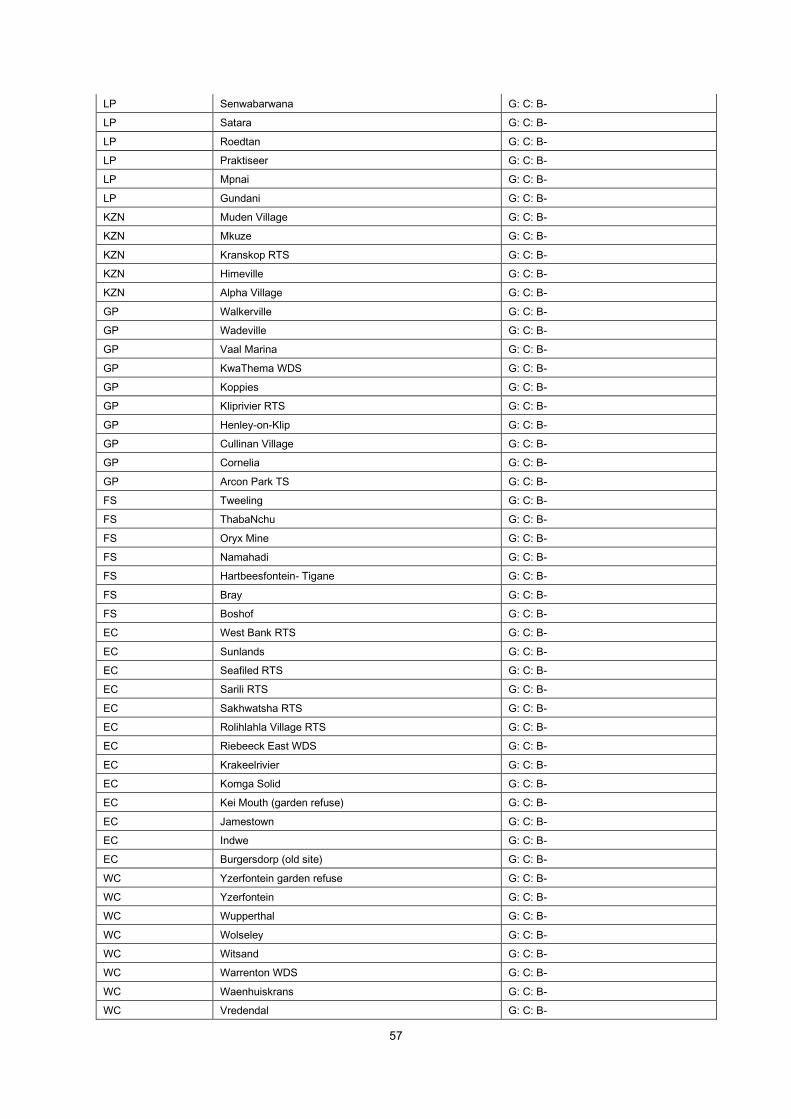
57
LP Senwabarwana G: C: B-
LP Satara G: C: B-
LP Roedtan G: C: B-
LP Praktiseer G: C: B-
LP Mpnai G: C: B-
LP Gundani G: C: B-
KZN Muden Village G: C: B-
KZN Mkuze G: C: B-
KZN Kranskop RTS G: C: B-
KZN Himeville G: C: B-
KZN Alpha Village G: C: B-
GP Walkerville G: C: B-
GP Wadeville G: C: B-
GP Vaal Marina G: C: B-
GP KwaThema WDS G: C: B-
GP Koppies G: C: B-
GP Kliprivier RTS G: C: B-
GP Henley-on-Klip G: C: B-
GP Cullinan Village G: C: B-
GP Cornelia G: C: B-
GP Arcon Park TS G: C: B-
FS Tweeling G: C: B-
FS ThabaNchu G: C: B-
FS Oryx Mine G: C: B-
FS Namahadi G: C: B-
FS Hartbeesfontein- Tigane G: C: B-
FS Bray G: C: B-
FS Boshof G: C: B-
EC West Bank RTS G: C: B-
EC Sunlands G: C: B-
EC Seafiled RTS G: C: B-
EC Sarili RTS G: C: B-
EC Sakhwatsha RTS G: C: B-
EC Rolihlahla Village RTS G: C: B-
EC Riebeeck East WDS G: C: B-
EC Krakeelrivier G: C: B-
EC Komga Solid G: C: B-
EC Kei Mouth (garden refuse) G: C: B-
EC Jamestown G: C: B-
EC Indwe G: C: B-
EC Burgersdorp (old site) G: C: B-
WC Yzerfontein garden refuse G: C: B-
WC Yzerfontein G: C: B-
WC Wupperthal G: C: B-
WC Wolseley G: C: B-
WC Witsand G: C: B-
WC Warrenton WDS G: C: B-
WC Waenhuiskrans G: C: B-
WC Vredendal G: C: B-

58
WC Velddrift Solid WTS G: C: B-
WC Van Wyksdorp G: C: B-
WC Tygerberg Integrated Waste Management G: C: B-
WC Tulbagh Garden & Builders Rubble G: C: B-
WC Touwsrivier G: C: B-
WC Struisbaai G: C: B-
WC Strandfontein G: C: B-
WC Stilbaai Jongensfontein G: C: B-
WC Stilbaai G: C: B-
WC Sonskynvallei RTS G: C: B-
WC Schaap Vley Hills G: C: B-
WC Rietpoort G: C: B-
WC Riebeek West G: C: B-
WC Riebeeck West PPC G: C: B-
WC Riebeeck West garden refuse G: C: B-
WC Redelinghuys G: C: B-
WC Prince Albert composting facility G: C: B-
WC Prince Albert G: C: B-
WC Porterville G: C: B-
WC Piketberg G: C: B-
WC Oriental Plaza G: C: B-
WC Nuwerus G: C: B-
WC Nelspoort G: C: B-
NW Tosca G: C: B-
NW Sannieshof G: C: B-
NW Reivilo G: C: B-
NW Pomphret G: C: B-
NW Piet Plessis G: C: B-
NW Oil Separation Solutions Sales & Services G: C: B-
NW Northam G: C: B-
NW Morokweng G: C: B-
NW Migdol G: C: B-
NW Leeupoort G: C: B-
NC Williston G: C: B-
NC Welkom G: C: B-
NC Vanwyksvlei G: C: B-
NC Vanderkloof G: C: B-
NC Tweerivier G: C: B-
NC Twee Rivieren (Kalahari Gemsbok) G: C: B-
NC Transhex Reuning G: C: B-
NC Transhex Baken G: C: B-
NC Sutherland G: C: B-
NC Strydenburg G: C: B-
NC Spoegrivier G: C: B-
NC Soebatsfontein G: C: B-
NC Sanddrift G: C: B-
NC Samsons Bak Contractor G: C: B-
NC Rooifontein G: C: B-
NC Rietfontein G: C: B-
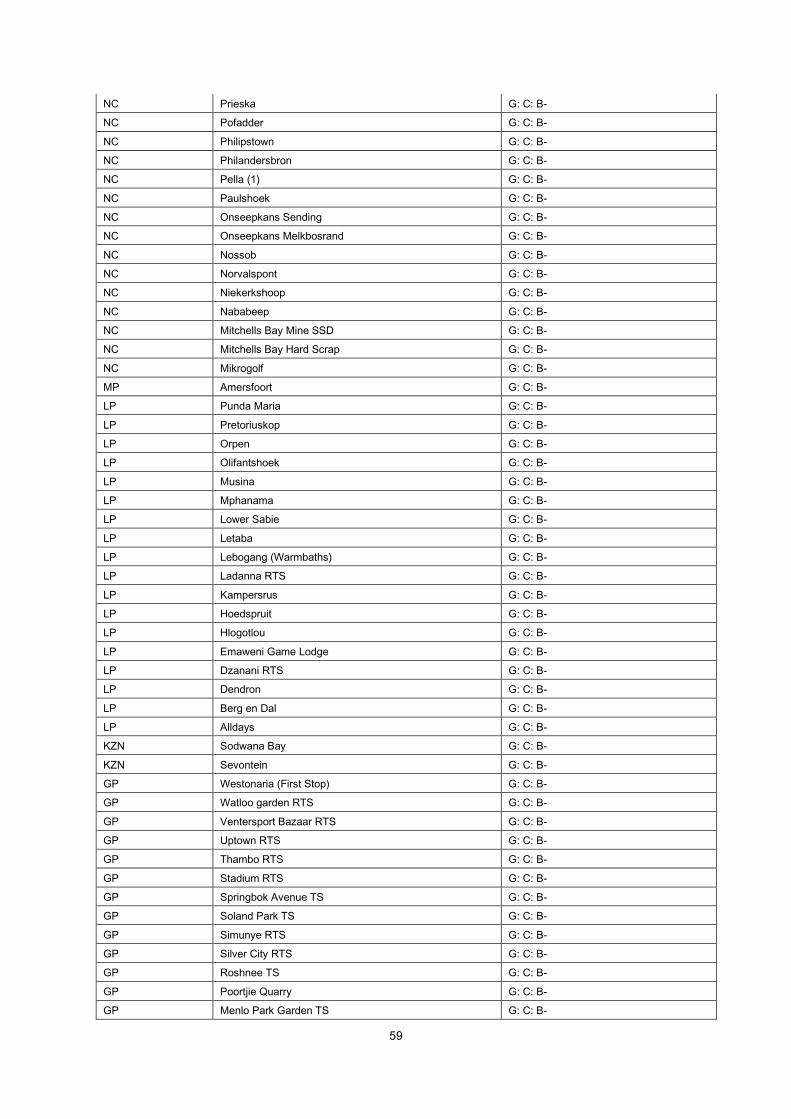
59
NC Prieska G: C: B-
NC Pofadder G: C: B-
NC Philipstown G: C: B-
NC Philandersbron G: C: B-
NC Pella (1) G: C: B-
NC Paulshoek G: C: B-
NC Onseepkans Sending G: C: B-
NC Onseepkans Melkbosrand G: C: B-
NC Nossob G: C: B-
NC Norvalspont G: C: B-
NC Niekerkshoop G: C: B-
NC Nababeep G: C: B-
NC Mitchells Bay Mine SSD G: C: B-
NC Mitchells Bay Hard Scrap G: C: B-
NC Mikrogolf G: C: B-
MP Amersfoort G: C: B-
LP Punda Maria G: C: B-
LP Pretoriuskop G: C: B-
LP Orpen G: C: B-
LP Olifantshoek G: C: B-
LP Musina G: C: B-
LP Mphanama G: C: B-
LP Lower Sabie G: C: B-
LP Letaba G: C: B-
LP Lebogang (Warmbaths) G: C: B-
LP Ladanna RTS G: C: B-
LP Kampersrus G: C: B-
LP Hoedspruit G: C: B-
LP Hlogotlou G: C: B-
LP Emaweni Game Lodge G: C: B-
LP Dzanani RTS G: C: B-
LP Dendron G: C: B-
LP Berg en Dal G: C: B-
LP Alldays G: C: B-
KZN Sodwana Bay G: C: B-
KZN Sevontein G: C: B-
GP Westonaria (First Stop) G: C: B-
GP Watloo garden RTS G: C: B-
GP Ventersport Bazaar RTS G: C: B-
GP Uptown RTS G: C: B-
GP Thambo RTS G: C: B-
GP Stadium RTS G: C: B-
GP Springbok Avenue TS G: C: B-
GP Soland Park TS G: C: B-
GP Simunye RTS G: C: B-
GP Silver City RTS G: C: B-
GP Roshnee TS G: C: B-
GP Poortjie Quarry G: C: B-
GP Menlo Park Garden TS G: C: B-
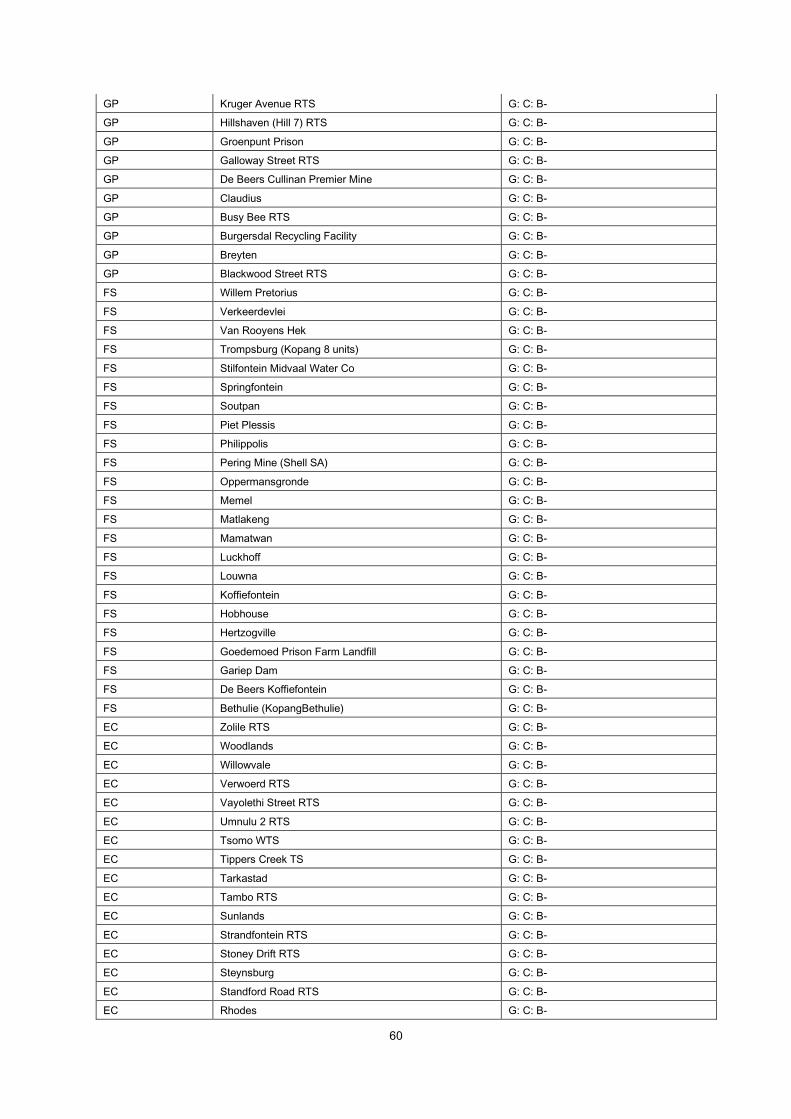
60
GP Kruger Avenue RTS G: C: B-
GP Hillshaven (Hill 7) RTS G: C: B-
GP Groenpunt Prison G: C: B-
GP Galloway Street RTS G: C: B-
GP De Beers Cullinan Premier Mine G: C: B-
GP Claudius G: C: B-
GP Busy Bee RTS G: C: B-
GP Burgersdal Recycling Facility G: C: B-
GP Breyten G: C: B-
GP Blackwood Street RTS G: C: B-
FS Willem Pretorius G: C: B-
FS Verkeerdevlei G: C: B-
FS Van Rooyens Hek G: C: B-
FS Trompsburg (Kopang 8 units) G: C: B-
FS Stilfontein Midvaal Water Co G: C: B-
FS Springfontein G: C: B-
FS Soutpan G: C: B-
FS Piet Plessis G: C: B-
FS Philippolis G: C: B-
FS Pering Mine (Shell SA) G: C: B-
FS Oppermansgronde G: C: B-
FS Memel G: C: B-
FS Matlakeng G: C: B-
FS Mamatwan G: C: B-
FS Luckhoff G: C: B-
FS Louwna G: C: B-
FS Koffiefontein G: C: B-
FS Hobhouse G: C: B-
FS Hertzogville G: C: B-
FS Goedemoed Prison Farm Landfill G: C: B-
FS Gariep Dam G: C: B-
FS De Beers Koffiefontein G: C: B-
FS Bethulie (KopangBethulie) G: C: B-
EC Zolile RTS G: C: B-
EC Woodlands G: C: B-
EC Willowvale G: C: B-
EC Verwoerd RTS G: C: B-
EC Vayolethi Street RTS G: C: B-
EC Umnulu 2 RTS G: C: B-
EC Tsomo WTS G: C: B-
EC Tippers Creek TS G: C: B-
EC Tarkastad G: C: B-
EC Tambo RTS G: C: B-
EC Sunlands G: C: B-
EC Strandfontein RTS G: C: B-
EC Stoney Drift RTS G: C: B-
EC Steynsburg G: C: B-
EC Standford Road RTS G: C: B-
EC Rhodes G: C: B-

61
EC Port Alfred G: C: B-
EC Pearston G: C: B-
EC Oviston G: C: B-
EC Old Uitenhage Road Refuse G: C: B-
EC Ntambanani RTS G: C: B-
EC Nieu-Bethesda WDS G: C: B-
EC Ngqokweni RTS G: C: B-
EC Ngeyakhe RTS G: C: B-
EC Mpong RTS G: C: B-
EC Molteno G: C: B-
EC Middeldrift G: C: B-
EC Mgwalana RTS G: C: B-
EC Mbokwane RTS G: C: B-
EC Malinga Street RTS G: C: B-
EC Langbos G: C: B-
EC Laksman Avenue RTS G: C: B-
EC Lady Grey G: C: B-
EC Kragga Kamma Road RTS G: C: B-
EC Khama Street RTS G: C: B-
EC Kenton-on-Sea G: C: B-
EC Keiskammahoek G: C: B-
EC Katoo & Harrington Road RTS G: C: B-
EC Kareedouw G: C: B-
EC Jolobe Avenue RTS G: C: B-
EC Impofudam Oord G: C: B-
EC Hunters Retreat RTS G: C: B-
EC Hofmeyer G: C: B-
EC Hendrickskraal G: C: B-
EC Haga Haga G: C: B-
EC Gogo Street RTS G: C: B-
EC Gillespie Street RTS G: C: B-
EC Flagstaff G: C: B-
EC Fifth Avenue RTS G: C: B-
EC Emplotheni RTS G: C: B-
EC Empilweni RTS G: C: B-
EC Ditchling Street RTS G: C: B-
EC Daku Square RTS G: C: B-
EC Dabadaba RTS G: C: B-
EC Coldstream G: C: B-
EC Colchester- Cannoville G: C: B-
EC Clarkson G: C: B-
EC Cintsa East G: C: B-
EC Carden Street RTS G: C: B-
EC Cannon Rocks RTS G: C: B-
EC Cala G: C: B-
EC Bushmans River Mouth G: C: B-
EC Boknes RTS G: C: B-
EC Bhobhoyi RTS G: C: B-
EC Alicedale WDS G: C: B-

62
EC Adelaide G: C: B-
EC Aberdeen WDS G: C: B-
NW Klipgat G: C: B
NC Olifantshoek G: C: B
NC Koopmansfontein G: C: B
NC Debeng G: C: B
EC Matatiele WDS G: C: B
EC Maletswai WDS G: C: B
EC Bramlin Street RTS G: C: B
KZN Msunduzi
KZN Nkandla
KZN Dannhauser Landfill Site
KZN Bulwer
FS Viljoenskroon
KZN Umngeni
GP Ekandustria Landfill Site
NC Barkly West Landfill Site
KZN Greater Kokstad
MP Kriel
NC Danieskull Landfill Site
NC Currie Camp Landfill Site
NC Britstown
MP Graskop
KZN Umuziwabantu
KZN Umtshezi
KZN Hlabisa Landfill Site
NC Ritchie Landfill Site
NC Lennersville Landfill Site
NC Boegoeberg Landfill Site
KZN Impendle
KZN Edumbe
KZN Emadlangeni
KZN Umvoti
KZN Msinga
KZN Umzimkulu
KZN Okahlamba
KZN Ingwe
NC Windsorton Landfill Site
NC Vredesvallei Landfill Site
NC Vioolsdrift Landfill Site
NC Van Wyksvlei Landfill Site
NC Topline Landfill Site
NC Smidtsdrift Landfill Site
NC Rooiwal X2 Landfill Site
NC Riverton Landfill Site
NC Riemvasmaak Landfill Site
NC Orania Landfill Site
NC Nonieput Landfill Site
NC Lepelsfontein Landfill Site
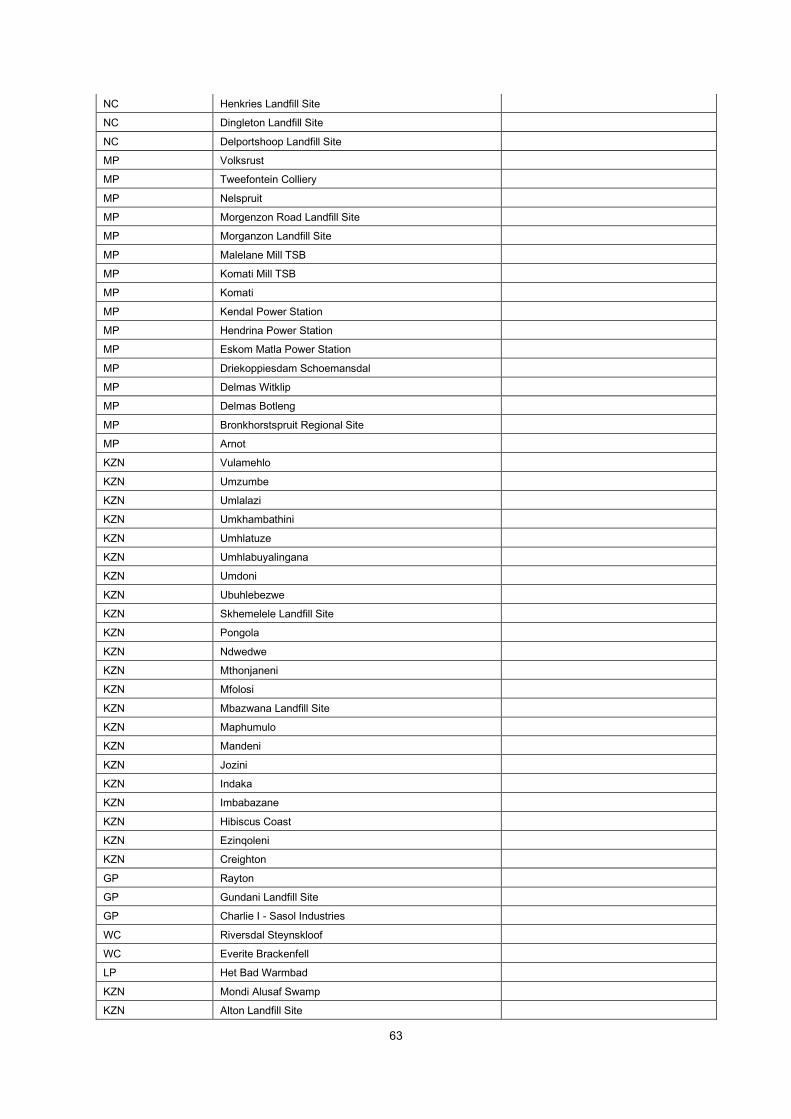
63
NC Henkries Landfill Site
NC Dingleton Landfill Site
NC Delportshoop Landfill Site
MP Volksrust
MP Tweefontein Colliery
MP Nelspruit
MP Morgenzon Road Landfill Site
MP Morganzon Landfill Site
MP Malelane Mill TSB
MP Komati Mill TSB
MP Komati
MP Kendal Power Station
MP Hendrina Power Station
MP Eskom Matla Power Station
MP Driekoppiesdam Schoemansdal
MP Delmas Witklip
MP Delmas Botleng
MP Bronkhorstspruit Regional Site
MP Arnot
KZN Vulamehlo
KZN Umzumbe
KZN Umlalazi
KZN Umkhambathini
KZN Umhlatuze
KZN Umhlabuyalingana
KZN Umdoni
KZN Ubuhlebezwe
KZN Skhemelele Landfill Site
KZN Pongola
KZN Ndwedwe
KZN Mthonjaneni
KZN Mfolosi
KZN Mbazwana Landfill Site
KZN Maphumulo
KZN Mandeni
KZN Jozini
KZN Indaka
KZN Imbabazane
KZN Hibiscus Coast
KZN Ezinqoleni
KZN Creighton
GP Rayton
GP Gundani Landfill Site
GP Charlie I - Sasol Industries
WC Riversdal Steynskloof
WC Everite Brackenfell
LP Het Bad Warmbad
KZN Mondi Alusaf Swamp
KZN Alton Landfill Site

64
FS Reddersburg
FS Dewetsdorp

65
17.2 Appendix 2
Extent and Role of Waste Picking in South Africa 2014
Interviewer name Date
1. Place of interview
2. Municipali
ty
3. Type of site
4. Respondent name 5. Age 6.
Gender M F
7. How did you get involved in waste picking?
What kind of waste 8a.
Glass 8b.
Plastic 8c. Metal 8d. Paper 8e. Cans 8f. E-waste 8g. Other (specify)
do you collect? 1 2 3 4 5 6 7
9. Where do you collect waste?
10. Why do you collect there?
11. How often do you collect?
Method of Operation YES NO (if yes) Number of Number of

66
[INTERVIEWER: READ EACH ONE] days per
week hours per
day
9a. Waste salvaged from landfill site 1 2
9b. Waste salvaged from public bins 1 2
9c. Waste salvaged from household 1 2
bins on roadside kerb
9d. Waste salvaged from commercial 1 2
establishments
9e. Waste salvaged from illegal dumps 1 2
9f. Recyclables salvaged from other 1 2
areas (specify)
12. For how long have you been collecting waste for recycling? 13. For how long in this particular site?
< 1 year 1 - 2 years
2 - 4 years
> 4 years
< 1 year 1 - 2 years
2 - 4 years > 4 years
1 2 3 4 1 2 3 4
14. What do you do with the waste? 15. Why do you do it in this way? 16. How often?
Method of Operation YES NO (if yes) Frequency of collections
[INTERVIEWER: READ EACH ONE] Days per week
Hours per day
The salvaged recyclables are taken 1 2
to a buy-back centre
The salvaged waste is collected 1 2
from me by buy-back centre owners
The salvaged waste is collected 1 2
from me by recyclers
The salvaged waste is taken 1 2
elsewhere (specify)
17. Approximately how much do you usually earn monthly through waste picking? R
18. If you take waste to a buy-back centre or waste recycling company, how long does it take you to get there?
5 mins 10
mins 15
mins 20 mins 25 mins 30
mins > 30 mins
1 2 3 4 5 6 7
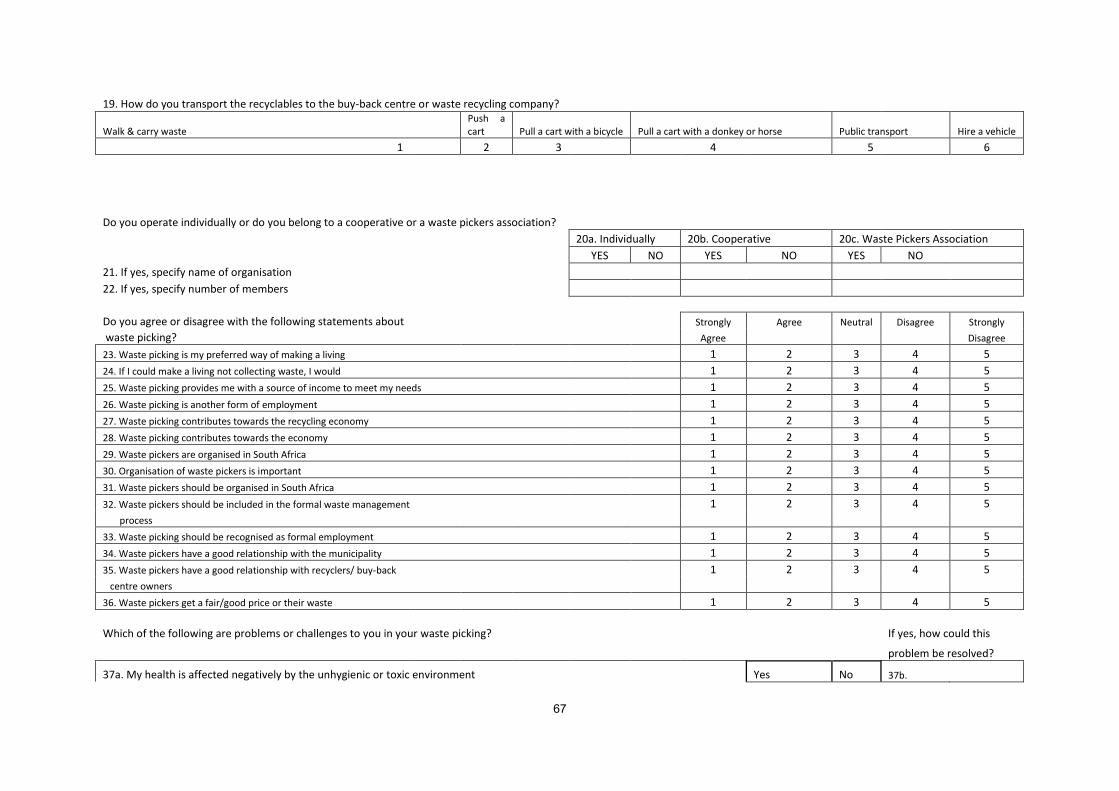
67
19. How do you transport the recyclables to the buy-back centre or waste recycling company?
Walk & carry waste Push a cart Pull a cart with a bicycle Pull a cart with a donkey or horse Public transport Hire a vehicle
1 2 3 4 5 6
Do you operate individually or do you belong to a cooperative or a waste pickers association?
20a. Individually 20b. Cooperative 20c. Waste Pickers Association
YES NO YES NO YES NO
21. If yes, specify name of organisation
22. If yes, specify number of members
Do you agree or disagree with the following statements about Strongly Agree Neutral Disagree Strongly
waste picking? Agree Disagree
23. Waste picking is my preferred way of making a living 1 2 3 4 5
24. If I could make a living not collecting waste, I would 1 2 3 4 5
25. Waste picking provides me with a source of income to meet my needs 1 2 3 4 5
26. Waste picking is another form of employment 1 2 3 4 5
27. Waste picking contributes towards the recycling economy 1 2 3 4 5
28. Waste picking contributes towards the economy 1 2 3 4 5
29. Waste pickers are organised in South Africa 1 2 3 4 5
30. Organisation of waste pickers is important 1 2 3 4 5
31. Waste pickers should be organised in South Africa 1 2 3 4 5
32. Waste pickers should be included in the formal waste management 1 2 3 4 5
process
33. Waste picking should be recognised as formal employment 1 2 3 4 5
34. Waste pickers have a good relationship with the municipality 1 2 3 4 5
35. Waste pickers have a good relationship with recyclers/ buy-back 1 2 3 4 5
centre owners
36. Waste pickers get a fair/good price or their waste 1 2 3 4 5
Which of the following are problems or challenges to you in your waste picking? If yes, how could this
problem be resolved?
37a. My health is affected negatively by the unhygienic or toxic environment Yes No 37b.
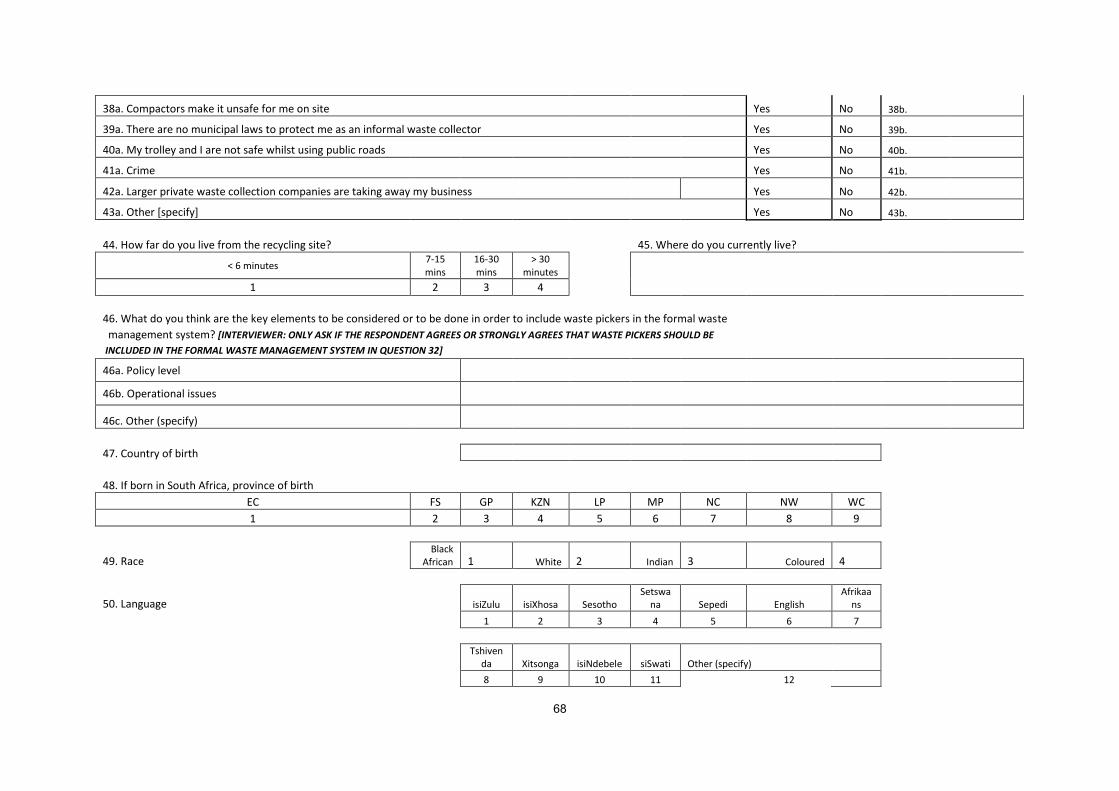
68
38a. Compactors make it unsafe for me on site Yes No 38b.
39a. There are no municipal laws to protect me as an informal waste collector Yes No 39b.
40a. My trolley and I are not safe whilst using public roads Yes No 40b.
41a. Crime Yes No 41b.
42a. Larger private waste collection companies are taking away my business Yes No 42b.
43a. Other [specify] Yes No 43b.
44. How far do you live from the recycling site? 45. Where do you currently live?
< 6 minutes 7-15 mins
16-30 mins
> 30 minutes
1 2 3 4
46. What do you think are the key elements to be considered or to be done in order to include waste pickers in the formal waste
management system? [INTERVIEWER: ONLY ASK IF THE RESPONDENT AGREES OR STRONGLY AGREES THAT WASTE PICKERS SHOULD BE INCLUDED IN THE FORMAL WASTE MANAGEMENT SYSTEM IN QUESTION 32]
46a. Policy level
46b. Operational issues
46c. Other (specify)
47. Country of birth
48. If born in South Africa, province of birth
EC FS GP KZN LP MP NC NW WC
1 2 3 4 5 6 7 8 9
49. Race Black
African 1 White 2 Indian 3 Coloured 4
50. Language isiZulu isiXhosa Sesotho Setswa
na Sepedi English Afrikaa
ns
1 2 3 4 5 6 7
Tshiven
da Xitsonga isiNdebele siSwati Other (specify)
8 9 10 11 12
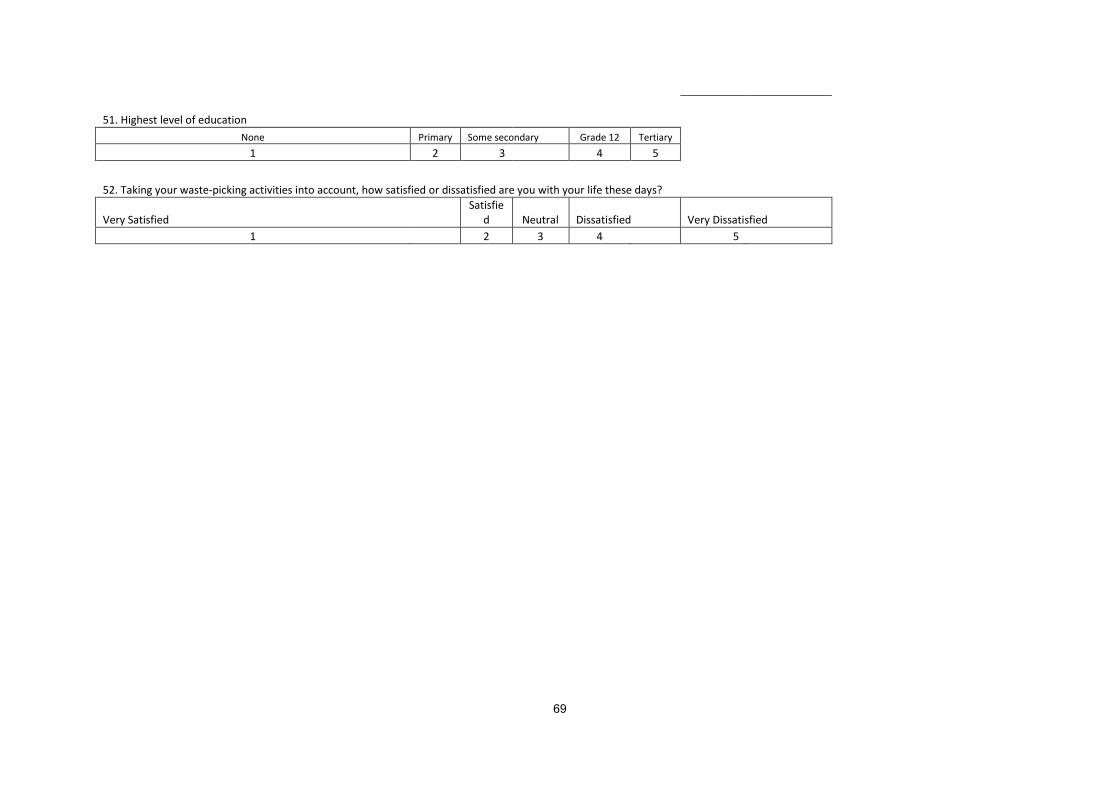
69
51. Highest level of education
None Primary Some secondary Grade 12 Tertiary
1 2 3 4 5
52. Taking your waste-picking activities into account, how satisfied or dissatisfied are you with your life these days?
Very Satisfied Satisfie
d Neutral Dissatisfied Very Dissatisfied
1 2 3 4 5