report on the evolution of the ribble estuary, with...
TRANSCRIPT

Coastal Defence
Report on the evolution of the
Ribble Estuary, with particular
reference to the north Sefton
coast. Version 1.1
March 2008
Prepared by: Vanessa Holden Natural, Geographical & Applied Sciences Edge Hill University St Helens Road Ormskirk Lancashire L39 4QP Email:[email protected]
Sefton Council Technical Services
Balliol House Balliol Road
Bootle L20 3NJ
Tel: +44 (0)151 934 4238 Fax: +44 (0)151 934 4559
www.sefton.gov.uk

Title Report on the evolution of the Ribble Estuary, with particular reference to the north Sefton coast.
Creator/Author/ Originator/ Vanessa Holden Publisher Sefton Council Date of publication March 2008 Contact name or title of Location Coastal Defence, Sefton Council
Subject - Keyword Estuary Keyword – Free text Southport, estuaries, Ribble Description/Abstract Within the last 200 years the Ribble Estuary has
experienced considerable human intervention, particularly associated with engineering works and reclamation schemes, undertaken primarily to develop and maintain access to the former Port of Preston, to provide new land for agricultural and commercial uses, and to allow development of the town of Southport.
Identifier Coverage - Spatial Ribble Estuary Coverage - Temporal 1800’s to 2008 Format/ Presentation type Document Digital Type Report Subject - Category Coast Subject - Project Language English Rights - Copyright O/S maps reproduced under licence number LA
076317 by Sefton Metropolitan Council from the Ordnance Survey’s 1:50,000 map with the permission of the controller of Her Majesty’s Stationary Office Crown Copyright reserved
Rights - EIR disclosability indicator
Rights - EIR exemption Rights - FOIA disclosability indicator
Rights - FOIA exemption Postal address of location Ainsdale Discovery Centre, The Promenade, Shore
Road, Ainsdale-on-Sea, Southport Postcode of location PR8 2QB Telephone number of location
+44 (0)151 934 2960 Fax number of location +44(0)1704 575628 Email address of location [email protected] Online resource www.sefton.gov.uk Date of metadata update
This report should be referenced as: Holden, V.J.C. (2008) Report on the evolution of the Ribble Estuary. Sefton Council, Bootle.

Document History Date Release Notes
March 2008 1.0 Final Report
Prepared ____V. Holden________________ Approved ____________________________ Authorised ____________________________ Copyright Sefton Council Sefton Council accepts no liability for the use by third parties of results or methods presented in this report. Sefton Council also stresses that various sections of this report rely on data supplied by or drawn from third party sources. Sefton Council accepts no liability for loss or damage suffered by the client or third parties as a result of errors or inaccuracies in such third party data.

Contents Section Page 1.0 Introduction 1 2.0 Background to the Sefton Coast 1 3.0 Secondary Data Available 1 3.1 Secondary Data Confidence 3 4.0 The Ribble Estuary 4 4.1 Human Impacts on the Estuary 6 4.1.1 Developments Relating to the Port of Preston 6 4.1.2. Land Reclamation in the Ribble Estuary 12 4.1.3 Other Developments 15 5.0 The Environmental Response of the Ribble Estuary 34 5.1 Pre-Industrialisation 34 5.2 Training of the Navigable Channel and its Implications 42 5.3 Sediment Accretion Along the Southern Estuary Foreshore 50 5.4 Changes in the Bog Hole Channel 57 6.0 Summary 67 7.0 References 68
Report on the Evolution of the Ribble Estuary
1
1. 0 Introduction
This report is part of a series designed to give a detailed account of a particular
feature on the Sefton Coast as part of the process of updating the Sefton Coast
Database. Updating of the database includes analysis and interpretation of
existing materials held by the Council which will identify gaps in knowledge and
future works that could be undertaken to improve our understanding of the
geomorphology of the Sefton Coast. This particular report discusses the evolution
of the Ribble Estuary in North West England through time from the early 1800’s to
the present day. By using various forms of secondary data, a picture of the
development of the location can be built up, providing a basis for understanding
the present day situation.
2.0 Background to the Sefton Coast
The coast is a long wide arc of sand with a hindshore dune system, which at one
time would have stretched from the Mersey Estuary to the Ribble Estuary. Human
use of the dune system over several centuries has created a dune landscape of
great variety. To the north of the Sefton Coast is an extensive area of Saltmarsh
extending into the Ribble estuary; other smaller areas of Saltmarsh also occur at
the River Alt and Smiths Slack (located on the foreshore between Birkdale and
Ainsdale). Several towns have developed along the coast; at Crosby, to the south,
and Southport, to the north, artificial defences have been put in place. In-
between these areas towns such as Formby rely upon the sand dunes to provide
protection from the sea.
The sand dunes, beaches and marshes of the Sefton Coast are one of the most
important areas for nature conservation in Europe. The entire Coast is designated
as either Special Protection Area (SPA) to the north of the pier at Southport or
Special Area of Conservation (SAC) to the south of the pier, notable species
include Sand Lizards and Natterjack Toads with the estuarine area being very
important for birds. The Sefton Coast is also an important visitor destination with
popular bathing beaches, open countryside, and the seaside resort of Southport.
3.0 Secondary Data Available
Much of the information regarding the estuary originates from the archives of the
Borough Engineers, with a great deal of the literature around the time of the
major engineering works being written by:
• The Engineer and General Superintendent of the Ribble Navigation
1901-1933 (James Barron);
Report on the Evolution of the Ribble Estuary
2
• Southport Borough Engineer, early 1900s (Mr A.E. Jackson);
• Engineer for Preston Corporation, 1890 until 1900, and later consulting
engineer to Mersey Estuary (Mr Alexander F. Fowler);
• Ribble Engineer 1933 to mid 1900s (Mr A.H. Howarth, successor to
James Barron);
• Consulting engineers (Mr L.F. Vernon-Harcourt, early 1900s, and
Commander F.W. Jarrad, 1907).
It is for this reason that the evidence surrounding the development of the location
is centred on the three main issues of navigation, reclamation, and the urban
development of Southport. Similarly, there is significant emphasis on the
development of the Bog Hole Channel, as this was an area of increasing concern
during the first half of the twentieth century; hence issues around it were
recorded in relative prevalence. Table 1.1 shows the main types of secondary
data that are available and which were utilised to construct the picture of the
evolution of the estuary.
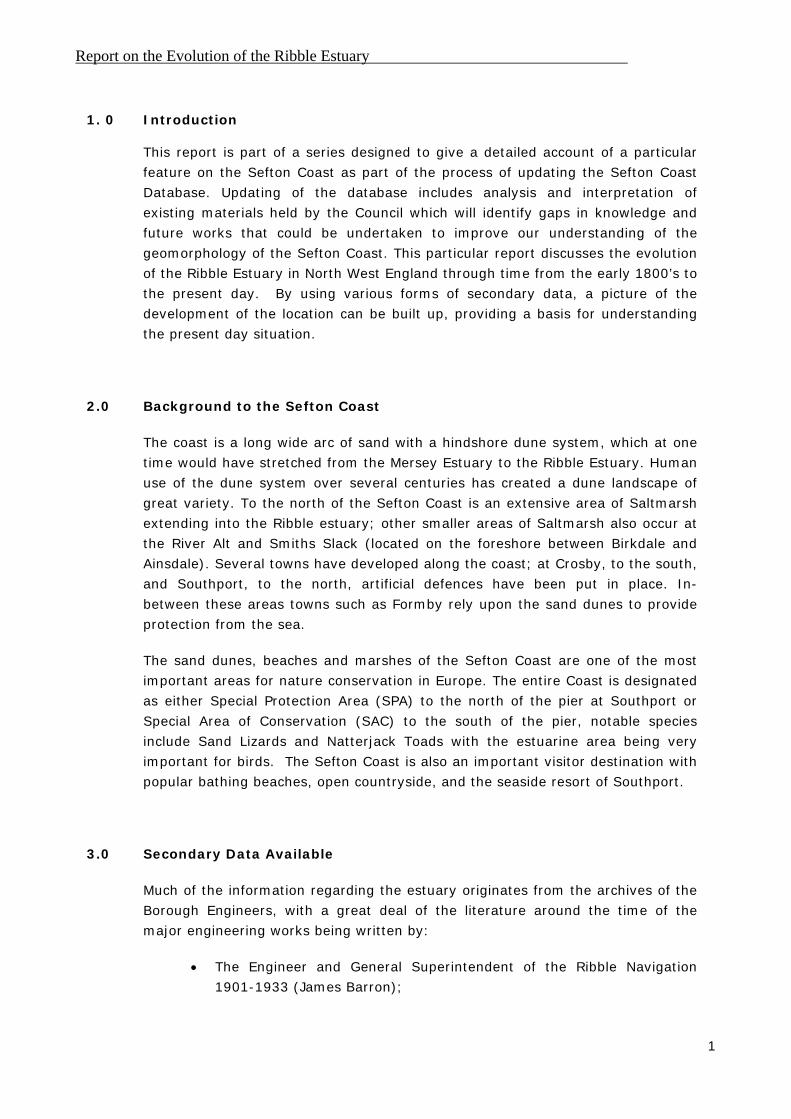
Data Type Format Date Range
Aerial Photographs Digital and printed original 1945 to present
Ordnance Survey Maps Digital and printed original 1843 to present
Navigation & Bathymetric
Charts
Digital and printed original 1736 to 1937
Historic Photographs Digital and printed original c.1900 onwards
Unpublished Reports /
‘Grey’ Literature
Original c.1880 onwards
Published Books Original 1888 onwards
Vegetation Survey Data Original 1998 to present
Profile Survey Data Digital 1913 to present
Table 3.1: Type and format of secondary data sources available within the Sefton
Coast Database.

Report on the Evolution of the Ribble Estuary
3
3.1 Secondary Data Confidence
Historic accounts and data provide an invaluable record of the developments that
have taken place along the coastline, without which, the significance and
reasoning of many events would be lost, facts obscured, or simply forgotten.
However, it is important to remember that most records are subject to the
opinions and observations of the individuals making them, which can in some
circumstances, give little indication of the accuracy of the data. The accuracy of
early charts may be questionable, particularly as they would potentially have been
drawn up for specific purposes, hence certain channels or features that were not
considered by the surveyor to be important may have been recorded in much less
detail, or even omitted. However, that said, as a certain level of accuracy would
have been required for navigation purposes, the charts can be assumed to be
representative of general episodes within the estuary. As the charts of
Mackenzie, Belcher, Williams and Webb, and Calver (Section 5.1) were made and
published by the Admiralty (Barron, 1938), so some degree of data confidence
can be attributed to their provenance.
Discrepancies between certain channel depths and low water marks may have
potentially arisen between texts due to the variance between datums used for
soundings. During the Nineteenth Century, the datums referred to are generally
those of the ‘Old Dock Sill’ at Liverpool (from the first enclosed Liverpool Dock
built in 1715 (Cashin, 1949)). From around 1844, Ordnance Datum referred to
the mean sea level at Liverpool, which was 4.67 feet (1.42 m) above the Old Dock
Sill. From around 1933, Ordnance Datum was based upon mean sea level at
Newlyn, which was 14.54 feet (4.43 m) above the Old Dock Sill (Barron, 1938;
Cashin, 1949; Gresswell, 1953). The level of the Old Dock Sill was believed to be
7ft. 9in. (2.36 m) above the level of Low Water at Southport (Jarrad, 1907), with
the Ribble being calculated as 12.37 feet (3.77 m) below Ordnance Datum
(Liverpool) in 1890 (Barron, 1938). Similarly, early Ordnance maps based the
High and Low Water Marks around surveys taken at times when the Admiralty
informed them that there were expected to be ‘ordinary’ tides, which when
combined with weather conditions, may produce misleading levels on flat
stretches of coastline such as in the Ribble Estuary (Barron, 1938). Ordnance
Survey maps, similarly, showed a low water mark of a ‘Mean Spring Tide’ in 1845,
whereas later revisions show a low water mark of an ‘Ordinary Tide’, which is the
actual low water level on a day between a spring and a neap tide (Gresswell,
1953).
No specific records exist as to the reasons behind the siting of the original
locations of the profile lines. However, it is known that the contemporary profiles
are based upon shore profiles that have always been surveyed by the Borough of
Southport (Smith, 1982), with grid references identifying the locations. Data is
therefore considered sufficiently accurate to allow direct comparison of the
contemporary data with the historic data. The topographic data used to construct
the profile lines were not adjusted for changes in datums. However, any
Report on the Evolution of the Ribble Estuary
4
variations due to this reason would be barely discernible in the graphical
representations used in this report. The accuracy of secondary data from the late
1990s is assured, following the use of GPS systems to ensure accurate
consistency in data collection. As with all amalgamated data sets, differences can
also arise from operator error, different methods of data collection, and different
interpretations.
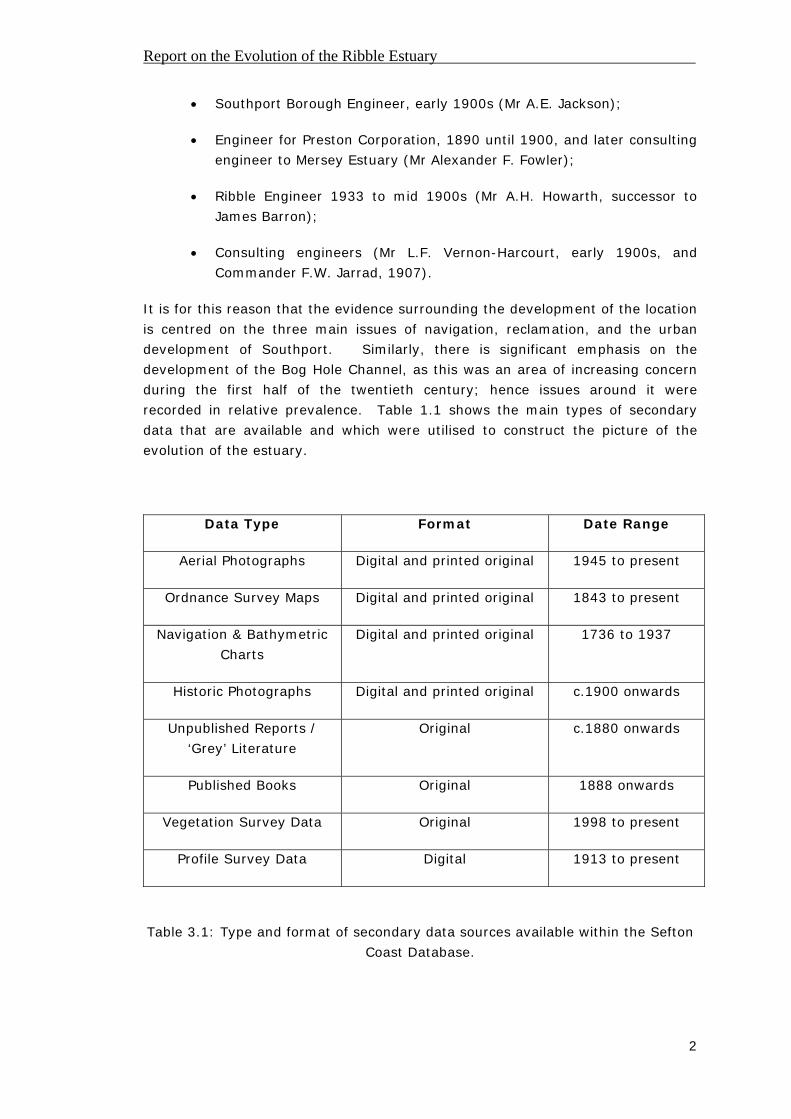
4.0 The Ribble Estuary
Characteristic Reference
Area 70-100 km2 at low water. 10.75 km across mouth (between Southport & St. Anne’s Pier). 20 km length (inner point of Preston Dock and Ribble Bar).
Smith, 1982
Lyons, 1997
Tidal Range Macrotidal. Mean Spring Tidal Range 8.0 m at Formby, 3.6 m at Preston. Mean Neap Tidal Range 4.4 m at Formby, 1.6 m at Preston. Maximum wave fetch c.200 miles.
Tooley, 1985
Van der Wal
et al., 2002
Source and
River
Tributaries
Source of River Ribble at Ingleborough, West
Yorkshire.
River Douglas (Asland in older texts), and River
Yarrow flow into estuary west of Preston.
Freshwater
Input
33 – 44 m3/s.
Maximum 200 m3/s between October and March.
Lyons, 1997
Van der Wal
et al., 2002
Prevailing
Wind Direction
West and Southwest Tooley,1985
Bathymetry Shallow, maximum depth in Liverpool Bay of 50
m.
British
Geological
Survey, 1984
Geology Incised within a late-Pleistocene glacial till cover
over Permo-triassic rocks.
Marine sediments of Liverpool Bay are fine to
medium sand-sized sediment, localised mud and
gravel.
British
Geological
Survey, 1984
Johnson,
1985
Channels Ribble ‘Navigation’ Channel, runs west to east,
flanks north shore of estuary.

Report on the Evolution of the Ribble Estuary
5
Pinfold (sometimes referred to as ‘Penfold’)
Channel, northeast to southwest through outer
estuary.
Bog Hole Channel, northeast to southwest,
parallel with Southport foreshore, now blocked at
northern limit.
Table 4.1: Key characteristics of the Ribble Estuary.
Plate 4.1: Annotated aerial photograph of present day conditions in the Ribble
Estuary, 2002, with features discussed in detail in the text shown. Aerial
photograph courtesy of SMBC © Cities Revealed.
Salter’s Spit
Previously trained Ribble Navigation
Penfold Channel
Sand-winning Plant
Reclamation at Marshside and
Crossens
Marine Drive
Marine Lake
Bog Hole Channel
Southport Pier
South Channel
Crossens Pool (or Channel)

Report on the Evolution of the Ribble Estuary
6
4.1 Human Impacts on the Estuary
The Estuary first began to experience significant human activities at the beginning
of the 19th century. Many of these activities were recorded due to being large
engineering works. Reclamations by landowners were recorded to a lesser
degree. Changes in the estuary during the 1800’s, through into the 1900’s, led to
an increasing awareness of the relatively temporary nature of many of the
Estuary’s features, and subsequently the impact of human activities upon the
natural processes. The increasing manipulation of the estuary coincided with the
development of the town of Southport as a bathing resort on the southern shore
of the estuary.
4.1.1. Developments Relating to the Port of Preston
One of the first major recorded activities within the Ribble Estuary was the
Parliamentary Act of 1806, obtained by a Company of Proprietors, which allowed
works to be undertaken to improve the Ribble Channel for navigation between
The Naze on the north shore of the estuary and Preston. Although the works
were started, and jetties installed, the Company failed, with debts of £4,000
(Wheeler, 1893). In 1837, a new company formed, which was granted
permission in 1853 to undertake a number of works, including dredging the
navigable Ribble channel in order to deepen it; the construction of 4.5 miles of
training walls from Preston to The Naze (further extension was opposed by
landowners on both shores of the estuary); quay walls to be built at Preston; and
a lighthouse constructed at St. Anne’s. The cost of the dredging and training walls
alone was recorded by Wheeler (1893) to be the considerable sum of £47,000.
The undertaking of these first Companies up to 1883 is recorded in great detail by
Barron (1938).
In 1883, the Corporation of Preston obtained Parliamentary powers to purchase
the rights of the Ribble Navigation for the sum of £72,500. They were allowed to
build the docks at Preston (initially 36 acres, later extended to 40 acres), to
dredge the channel between Preston and Lytham, and to extend the training walls
by another 3.5 miles (Wheeler, 1893). The docks subsequently opened on 25th
June 1892.
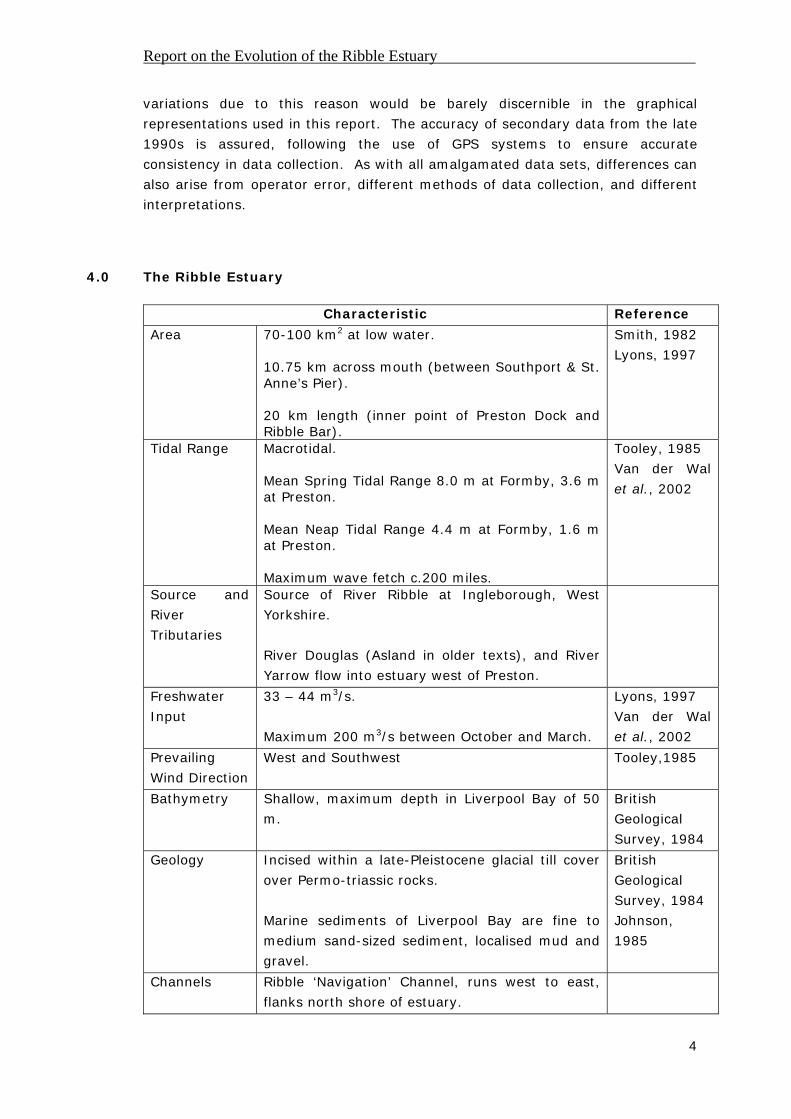
In 1889, a commission was established to investigate the various options of which
channel in the outer estuary to adopt as the main navigable channel. A
consulting engineer advising the Corporation of Southport at the time, Mr Vernon-
Harcourt, advised that the Bog Hole (or South Channel) should be adopted as the
main navigable approach to Preston (Figure 4.2). However, the Corporation of
Preston were successful in their aim to adopt the central channel in the estuary as
the navigable channel. Wheeler (1893) outlined the reasons for this choice being:
i) the central channel was 3 miles shorter than the South Channel; ii) a hard
material on which to build training walls was nearer the surface in the central
channel; iii) the presence of a sharp curve in the South Channel near the Bog
Hole; iv) the direction of the South Channel would require training walls to be
Report on the Evolution of the Ribble Estuary
7
built across the direction of the tide; and v) higher walls would be required on the
inland side of the South Channel to prevent sand being deposited.
Figure 4.1: Map of the Ribble Estuary, 1889, drawn by Archdeacon, Taylor and
Crabtree. (Document held in SMBC archive).
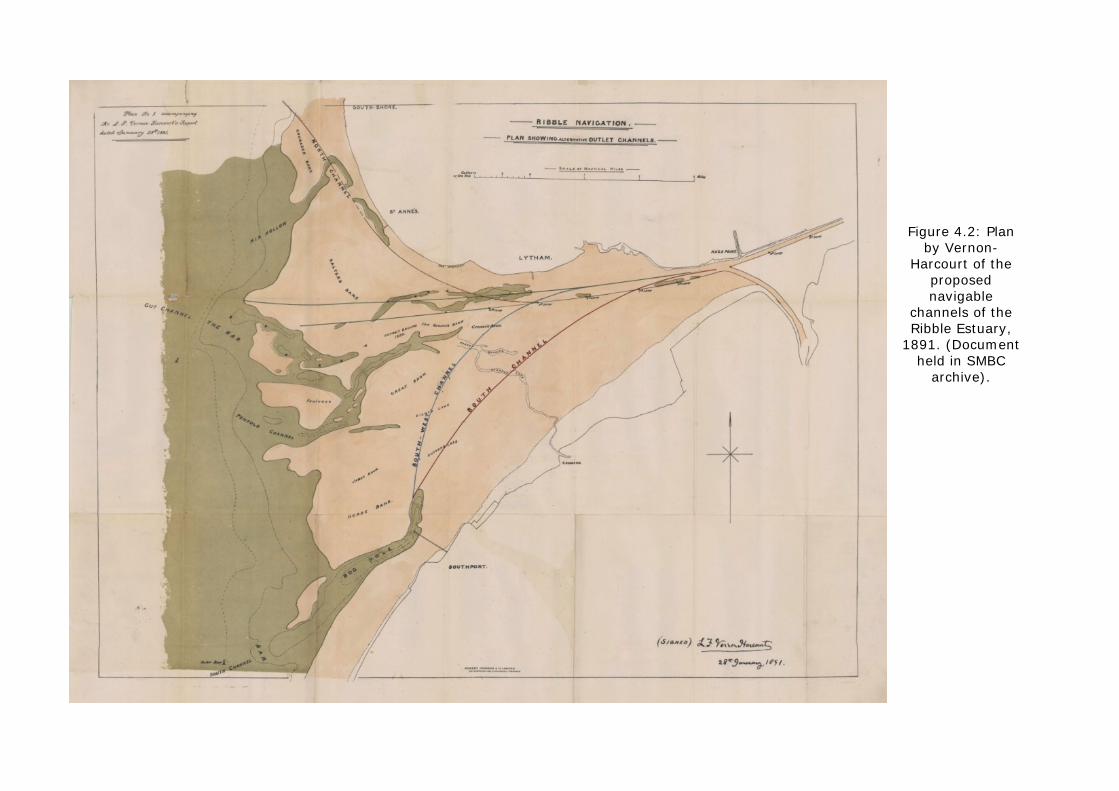
Figure 4.2: Plan by Vernon-
Harcourt of the proposed navigable
channels of the Ribble Estuary,
1891. (Document held in SMBC
archive).
Report on the Evolution of the Ribble Estuary
9
Subsequently, when the Corporation of Preston proposed extension of the central
channel training walls in 1904 (the 1905 Act), the Corporation of Southport
became increasingly concerned about the potential siltation and shallowing of the
Crossens Channel, which at the time was the main drainage channel from the
land that fed into the Bog Hole Channel, which was already beginning to show
signs of siltation. In his report of 1905 on the proposed training wall extension,
Vernon-Harcourt anticipated the following impacts:
“…inevitably extend[ing] the zone of accretion on the southern side of the
estuary considerably seawards… the gradual obliteration of the Bog Hole
Channel… the open sea to recede further from the town [of Southport] by
the growth of the Horse sands seawards… the raising of the foreshore by
accretion on the southern side of the estuary.. impeding the discharge
from the Crossens outfall, and will probably divert the Crossens channel to
a northerly course.” [Vernon-Harcourt, 1905, Report on the extension of
the Ribble training walls proposed in the Ribble Navigation Bill of 1905
p.3]
The proposal was passed, with a further proposal to extend the walls being made
by the Corporation of Preston in the 1931 Act. Figure 4.3 illustrates the
development of the training walls from 1840 through to 1937 as drawn by Barron
(1938).

Figure 4.3: Development of the Ribble training walls from 1840 to 1937. (Source: Barron, 1938).

Report on the Evolution of the Ribble Estuary
11
The earliest recorded dredging of channels in the Ribble were made in the late
1800s and deposited on the southern side of (what was at the time) the end of
the main navigable channel training walls (Messent, 1888; Anon, 1896). In a
report, commissioned by Southport Corporation and the Lords of the Manor of
North Meols, into the effects of the Ribble navigation works, Messent (1888)
details the dredging and depositing of material that is capable of being suspended
may “… affect or alter (not favourably) the character of the sand [foreshore], and
perhaps induce vegetation or growth undesirable, unless the land is to be
reclaimed.” (Messent, 1888, p.12).
It is recorded by Wheeler (1893) that the training walls were constructed from
stone quarried from within the Ribble catchment, red sandstone from the
excavation of the docks, and ‘hard clay’ dredged from the Ribble, faced with
stone. Although Wheelers’ account would appear to indicate that the majority of
the training walls were constructed of material that would not be taken into
suspension, it is highly possible that the ‘dredgings from the Ribble’ would have a
proportion of finer material, which may have led to Messent’s prediction of
induced vegetation growth. However at this time, reclamation was prevalent, so
enhanced salt marsh expansion would not necessarily have been considered
unfavourable.
The Ribble Navigation Act of 1905 specified that all dredgings (except those used
for construction of the training walls), should be deposited at sea “westward of a
meridian drawn 3 degrees 9 minutes west of Greenwich”, or deposited above the
Spring High Water Mark (Fowler, 1909b), to ensure that dredgings would not be
just deposited in another part of the Estuary. In the mid 1960s a number of
investigations were undertaken by the Hydraulics Research Station (HRS) for the
Corporation of Preston in order to propose improvements to the navigable Ribble
Channel. In their report of 1965, they concluded that over the period 1949 to
1962, 1.6 million cubic yards of material had been dredged per annum (HRS,
1965). At the same time, consulting engineers Rendel, Palmer and Tritton (1967)
were in general agreement regarding the transport of material within the estuary,
being that sediment was carried up the South (or New) Gut on a flood tide, and
moved down the Navigation Channel on the ebb tide. However, the proposal of
Rendel, Palmer and Tritton that this material was subsequently deposited on
Salter’s Spit (an area of sedimentation at the seaward end of the training walls),
but with the Spit being largely formed by littoral drift from north to south was
questioned by the Hydraulics Research Station in their later report of 1968 (HRS,
1968).
Around 1974, Fairhurst quoted an annual total of 875,000 cubic metres of
sediment was being dredged to maintain a navigable depth of 21 feet at high tide.
By 1982, the Port of Preston had closed to commercial traffic (Mamas et al.,
1995), with a subsequent cessation of the dredging activities of the main channel.
The maintenance of the training walls was also discontinued. Therefore, the
sediment dynamics of the estuary can be anticipated to be undergoing further

Report on the Evolution of the Ribble Estuary
12
changes that may have implications for the future evolution of the area. The
beginning of these anticipated changes are demonstrated by changes in the
channels and sand banks in the outer estuary (Hansom et al., 1993), notably
Salter’s Spit now extending southwards beyond the end of the previous navigation
channel (see aerial photograph, Plate 4.1) since the cessation of the dredging
(Rainfords, 2005). In addition, the Penfold Channel has gradually shallowed over
recent years (Rainfords, 2005).
4.1.2. Land Reclamation in the Ribble Estuary
Until the beginning of the Nineteenth century, the salt marshes on the southern
side of the Ribble Estuary experienced relatively little human activity. However,
from the middle of the century onwards, reclaimed salt marsh became deemed as
valued agricultural land. In 1838 the Ribble Navigation Reclamation Plan was
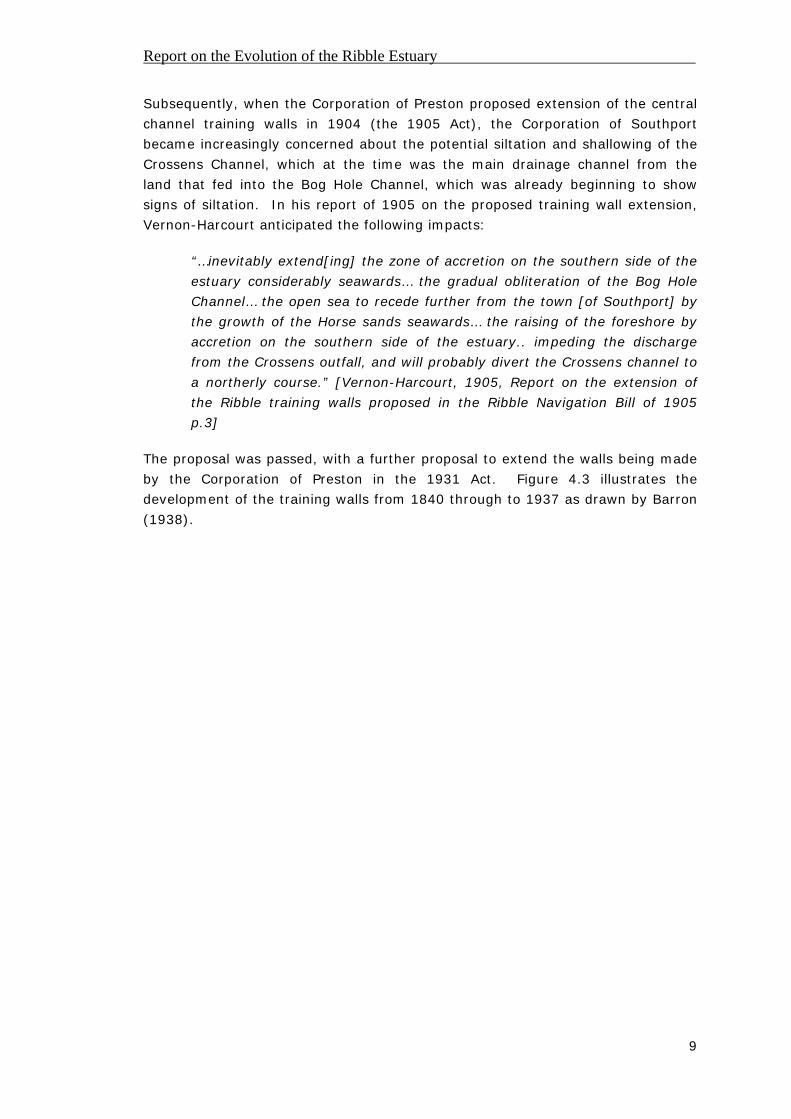
made (Figure 4.4) (Barron, 1938). It was during the second half of the
nineteenth century that a significant number of embankments were constructed
on the southern shore of the estuary, being recorded by Gresswell (1953) as
1860; 1863; 1880; 1891; 1892; and 1895 (Figure 4.5). The scale of the
reclamation was recorded by Gresswell (1953) when he calculated that between
1830 and 1880 over a mile in width of salt marsh had been reclaimed.
In 1932, to further enable reclamation, ‘saltings’ or evenly spaced clumps of
Spartina townsendii were planted to promote sedimentation and encourage new
salt marsh formation at Marshside (Gresswell, 1953; Berry, 1967), (Plate 4.2).
However, not all sedimentation seemed desirable, as only five years later an
article from the Southport Visitor newspaper of February 1937 recording that the
Borough Engineer, Mr Jackson, stated that the build up of sand on the foreshore
at Southport was due to the presence of “…the Ribble training walls, the diversion
of the Crossens Channel from the South Channel into the Pinfold [Penfold]
Channel, land reclamation and the growth of salt marshes, and the Mersey sand
dredgings”.

Figure 4.4: The Ribble Navigation Reclamation Plan. (Source: Barron,
1938, p.341).
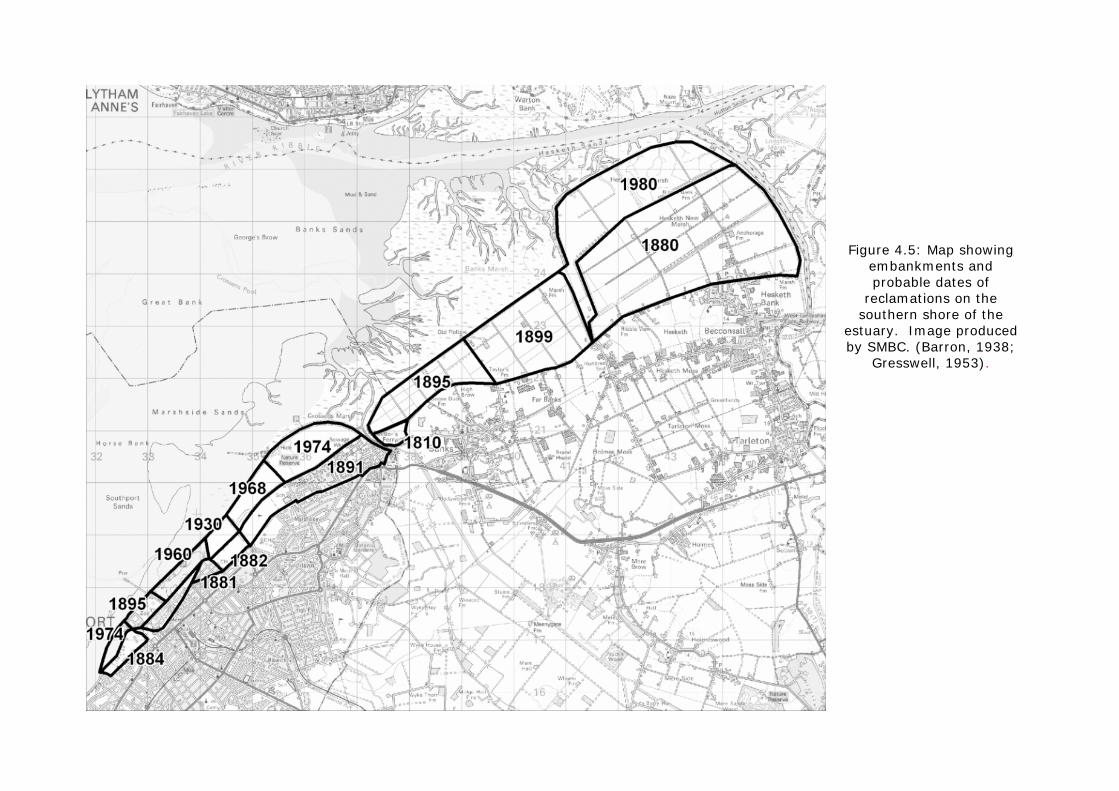
Figure 4.5: Map showing embankments and probable dates of
reclamations on the southern shore of the
estuary. Image produced by SMBC. (Barron, 1938;
Gresswell, 1953).

Report on the Evolution of the Ribble Estuary
15
Plate 4.2: Plate of the ‘saltings’ at Marshside, early twentieth century. (Source:
Gresswell, 1953, facing p.72).
4.1.3. Other Developments
SOUTHPORT
The town of Southport, did not come into being until the start of the Nineteenth
century, when in 1798 a hotel was built by William Sutton. It is recorded that at
the opening of the hotel, a Dr Barton declared the area be called Southport
(Cameron, 1996). Prior to the town developing, there was believed to be very
little habitation in the area that was then known as ‘North Meols’, with only
isolated fishermen’s cottages, which are now a considerable distance from what is
now the foreshore (Tovey, 1965). By the time of the publication of the first
edition of the Ordnance Survey map of 1849, developments were apparent at the
town of Southport, notably the building of the main street of Lord Street, to a
significant average width of 240 feet (73 m) between building lines (Tovey,
1965). Although the width of the street suited the propensity of the Victorians to
‘promenade’, it was, however, built to such dimensions as at that time the ground
in the middle of Lord Street was still liable to flooding, hence the buildings on
either side of the main street being built on the slightly higher ground to either
side, (the issue of flooding in fact continued to some degree until the construction
of the Esplanade Pumping Station in 1951) (Tovey, 1965). The first Promenade
(running parallel with Lord Street) was constructed in 1834 effectively on the

Report on the Evolution of the Ribble Estuary
16
beach at the point of the Ordinary High Water Mark, reclaiming an area of land on
which was constructed the Victoria Baths (SD 333631, 417713), which had a
reservoir out on the beach. Southport still only comprised a few streets at this
point, and remained completely separate from the neighbouring village of
Churchtown. Previous visitors to the town had predominantly travelled via canal,
but following the opening of a railway line from Liverpool to Southport in 1848,
and a line from Wigan to the town in 1855 (Freeman et al., 1966), so the town
further increased in popularity, receiving 10,000 visitors a year by 1850
(Gresswell and Lawton, 1964). In 1860, the Pier was constructed leading out
from the promenade to a distance of 1,100 metres (Smith, 1982), built by private
enterprise, with the support of the Improvement Commissioners that then
governed the town (Tovey, 1965). It was further extended in 1868 to a length of
1,335 metres (Smith, 1982).
A northern extension to the promenade was made between 1879 and 1881
(Borough Surveyor’s Office, 1906; Gresswell, 1953), reclaiming 45 acres of land.
The south Marine Lake (13 acres) and Marine Park (6.5 acres) that fronts the
original promenade was constructed following reclamation in 1887. Notes of the
Borough Surveyor’s Office of 1906 states that the area was above the High Water
Mark of ordinary tides, was already grassed over and was “little better than a
swamp” prior to the works. Following “enormous quantities” (Borough Surveyor’s
Office, 1906) of sand having built up near the Promenade, the North Marine Lake
(26 acres) and Park were constructed in 1892. The two lakes were joined in
1895, along with the construction of Marine Drive (SD 333561, 418436),
enclosing 59 acres, which were above the High Water Mark of ordinary tides, but
which were subject to High Spring tides (Borough Surveyor’s Office, 1906). The
notes of 1906 go on to say that large quantities of sand were removed from inside
and outside the lake due to the build up of wind blown sand, which were
deposited to the north east of the promenade (indicating land that has now been
reclaimed at Marshside), which was already above the limit of ordinary high tides.
Some of the accumulation of sand around the original promenade was attributed
by the Borough Surveyor’s Office (1906) to be due to the construction of the 1883
Southport and Cheshire Lines Railway that enclosed an area of foreshore to the
south of the town. This enclosure was necessary for the railway line to allow the
trains to manoeuvre, allowing the correct approach to the town’s station. The
railway extension subsequently closed in 1952 (Jones et al., 1991).
In 1907, the Bank End Sewage Treatment Works (SD 336948, 420736) were built
to serve the expanding population of Southport (Tovey, 1965), with a population
of 52,000 recorded in 1906 (Borough Surveyor’s Office, 1906). This works,
situated on the coastline to the north of the town, discharged purified effluent into
the estuary just north of Marshside at Crossens. The treatment works were
extended in 1912, to meet the demands of the growing population.

Report on the Evolution of the Ribble Estuary
17
The Ordnance Survey map of 1931 (Figure 4.6), shows an ‘aerodrome’ (SD
334773, 419000) located on Southport sands in the vicinity of Marshside. Aerial
photographs from 1945 show this to be the case (Plates 4.2 and 4.3), with the
land it is situated on being reclaimed initially around 1892, and being extended
seaward around 1930 (Gresswell, 1953). The site is now part of the Southport
Municipal and Hesketh Links golf courses, with the site of the former aerodrome
buildings now occupied by private houses (Plate 4.4).

Figure 4.6: Ordnance
Survey map of 1931. See also Plates 4.2,4.3
and 4.4.
Plate 4.2: Aerial photograph of 1945 showing
aerodrome. See also Plates 4.3
and 4.4. (Image held in SMBC archive).

Plate 4.3: Photograph of 1963, showing site of aerodrome; low building in middle ground, with slipway on left down to beach. (Image held in SMBC archive).

Plate 4.4: Aerial photograph of the previous aerodrome site in 1992. Houses now occupy the site of the former buildings, with the slipway
now being a road. (Image courtesy of SMBC).
Report on the Evolution of the Ribble Estuary
22
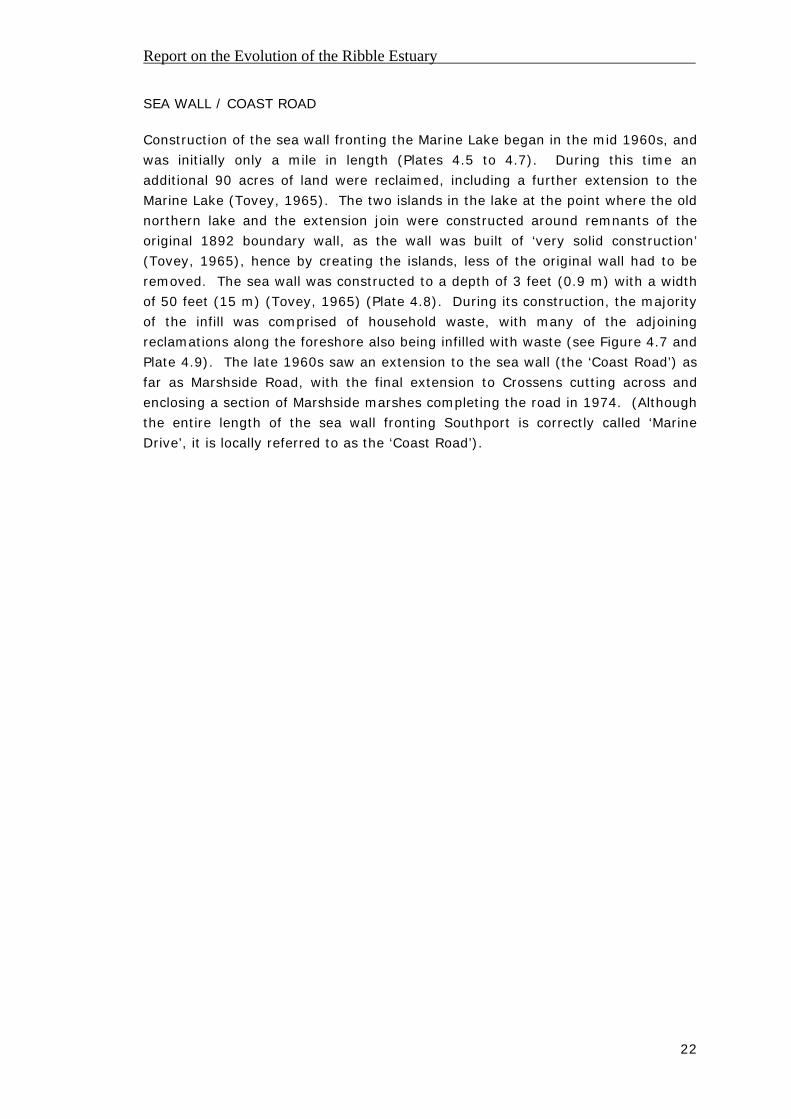
SEA WALL / COAST ROAD
Construction of the sea wall fronting the Marine Lake began in the mid 1960s, and
was initially only a mile in length (Plates 4.5 to 4.7). During this time an
additional 90 acres of land were reclaimed, including a further extension to the
Marine Lake (Tovey, 1965). The two islands in the lake at the point where the old
northern lake and the extension join were constructed around remnants of the
original 1892 boundary wall, as the wall was built of ‘very solid construction’
(Tovey, 1965), hence by creating the islands, less of the original wall had to be
removed. The sea wall was constructed to a depth of 3 feet (0.9 m) with a width
of 50 feet (15 m) (Tovey, 1965) (Plate 4.8). During its construction, the majority
of the infill was comprised of household waste, with many of the adjoining
reclamations along the foreshore also being infilled with waste (see Figure 4.7 and
Plate 4.9). The late 1960s saw an extension to the sea wall (the ‘Coast Road’) as
far as Marshside Road, with the final extension to Crossens cutting across and
enclosing a section of Marshside marshes completing the road in 1974. (Although
the entire length of the sea wall fronting Southport is correctly called ‘Marine
Drive’, it is locally referred to as the ‘Coast Road’).

Plate 4.5: Aerial photograph of
Southport foreshore looking north west, pre construction of the Coast Road and
reclamation to create the Marine Lake extension, estimated mid
1950s. (Image held in SMBC archive).
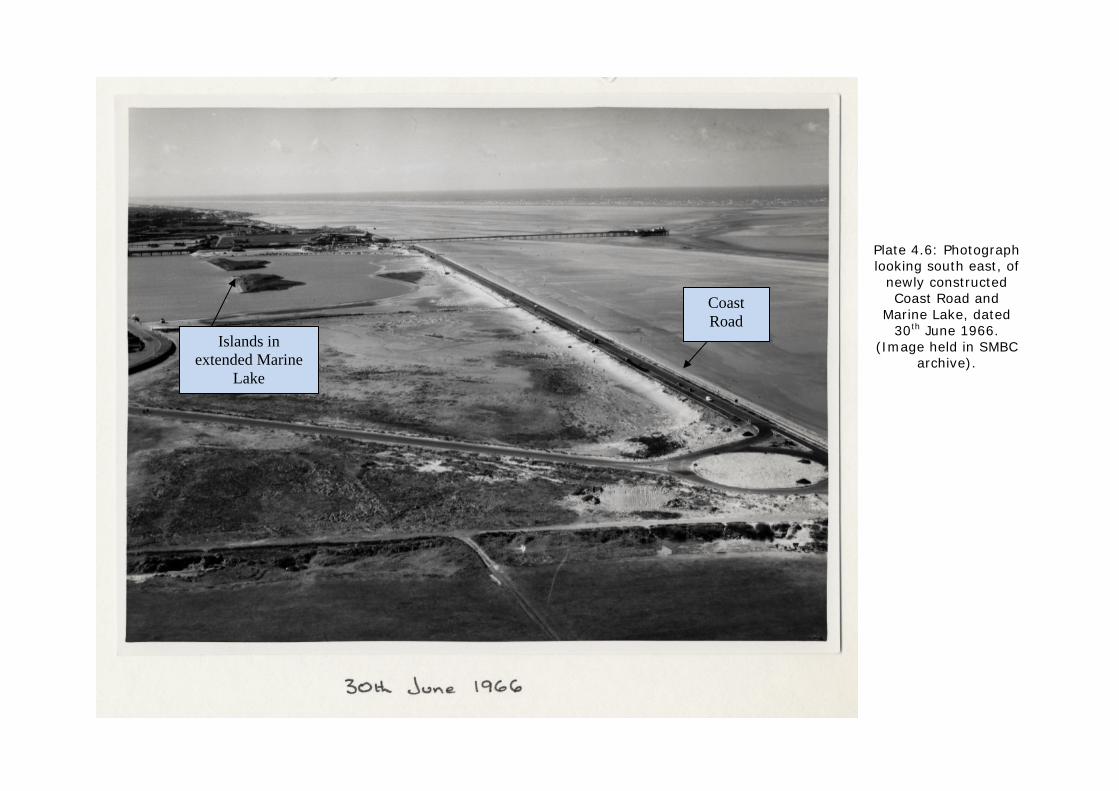
Plate 4.6: Photograph looking south east, of
newly constructed Coast Road and
Marine Lake, dated 30th June 1966.
(Image held in SMBC archive).
Coast Road
Islands in extended Marine
Lake

Plate 4.7: Annotated photograph of Marine Lake, looking west, showing dates of construction, c.1966. (Image held in SMBC archive).
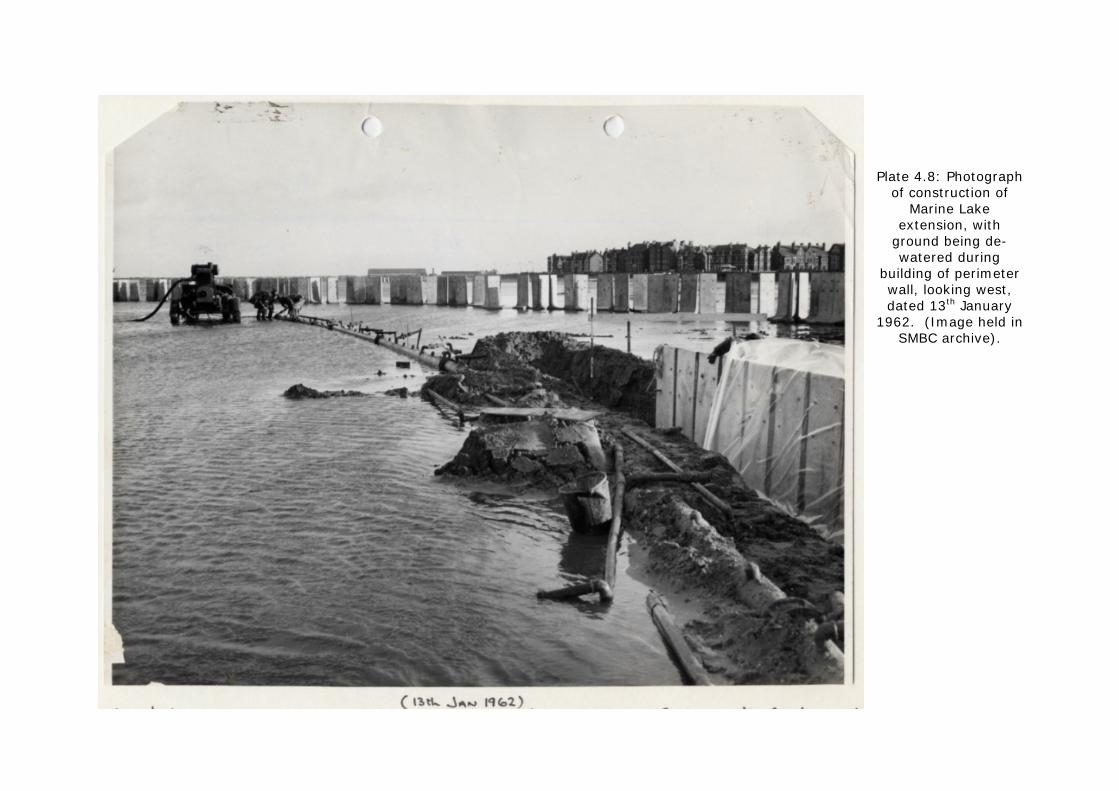
Plate 4.8: Photograph of construction of
Marine Lake extension, with
ground being de-watered during
building of perimeter wall, looking west, dated 13th January
1962. (Image held in SMBC archive).

Figure 4.7: Cross section plan of the Coast Road construction fronting the Marine Lake extension. (Source: Tovey, 1965; p.77).

Plate 4.9: Photograph of the construction of Coast Road, looking south east, estimated mid 1960s. The black dots above the construction site are large numbers of seagulls in the picture due to the road being backfilled with household waste. (Image held in SMBC archive).

Report on the Evolution of the Ribble Estuary
29
SAND WINNING
After a public Town Planning Enquiry in 1968, sand-winning began on Horse Bank
in February 1972, operated by William Rainfords Ltd (Smith, 1982). The site (SD
335308, 420610) was at the end of the 1960s Coast Road, and adjoined the 1974
extension to the road. The sand was considered of an appropriate grade to be
used in the glass industry. The licence for extraction covered an area of 200
hectares, with an annual amount of 0.16 x 10⁶ m3 per year. Over the subsequent
few years, further permissions were granted to extend the areas available on
Horse Bank for sand-winning, to increase tonnage and allow for the highest
possible grade sand to be extracted. Between 1966 and 1994 this amounted to a
total extraction of 4.5 x 10⁶ m3 (van der Wal et al., 2002). In their report of
2002, van der Wal et al. recorded that this volume of sand extracted was small
compared to the changes in sediment movement seen across the estuary as a
whole.
WASTE DISPOSAL
On a regional scale, from 1896, dumping of sewage sludge and industrial waste
into Liverpool Bay has taken place (Allison, 1949; Murray and Norton, 1979;
Norton et al., 1984; Jones et al., 1991; Jones, 2006), with some wastes and
sludge being dumped at a site about 30 km offshore (Norton et al., 1984).
Between 1973 and 1980, between 15 x 10-5 and 20 x 10-5 tonnes of sewage
sludge and industrial wastes were dumped at this site per year (Norton et al.,
1984). Between 1880 and 1953, Liverpool Corporation also dumped large
quantities of domestic refuse into Liverpool Bay (Department of the Environment,
1972; Jones et al., 1991). In a study by Norton et al., (1984), the sludge and
wastes contained organic matter, with the metallic contaminants of Mercury,
Cadmium, Lead, Zinc, Copper, Chromium and Nickel.
During the peak of dumping of sludge and industrial wastes in the 1970s,
concerns were raised for the Ribble Estuary that wastes dumped at the site in
Liverpool Bay, due to the predominant currents, would return not only to the
Mersey Estuary, but also to the Ribble. Ramster and Hill (1969) identified that
‘fine suspended material in mid to surface waters tended to be more widely
dispersed [away from the dumping site] with generally northwards residual
movement’ (Norton et al., 1984). The Department of the Environment, in 1972,
reported that of the sludge dumped in Liverpool Bay, much of the solids reach the
bed of the sea after 12 hours. They also reported that the upper layers of the sea
have a general drift northwards, whilst near bed waters drift south and eastwards.
It may therefore be reasonable to assume that during the initial few hours
following the dumping of sludge, the finer material in suspension would have been
carried predominantly to the north, potentially moving closer to the Ribble
indraught than the Mersey indraught.

Report on the Evolution of the Ribble Estuary
30
The dumping of sewage and waste at sea was, at the time, felt to be a feasible
disposal option due to the ‘tremendous diluting and treatment capacity of the sea’
(Department of the Environment, 1972). Even with such tonnages being
dumped, there was no formal routine monitoring in place regarding the effects of
the dumping on the marine system. Ultimately, the concerns over pollution from
dumping of sewage sludge and waste at sea led to the Food and Environment
Protection Act of 1985, which since 1992 has prohibited the dumping of industrial
waste at sea, and since 1998 has prohibited the dumping of sewage sludge
(DEFRA, 2002).
DREDGING OF THE MERSEY ESTUARY
Deposition of dredgings from the River Mersey began in 1890 (Jarrad, 1907;
Fowler, 1909a), with total amount dredged during the year 1905 being 9,119,100
tons (Jarrad, 1907). Accretion of sediment on the Southport foreshore, along
with the growth of parts of Horse Bank, and the infilling of the Bog Hole, all
permitted Jarrad (1907) to surmise that the large quantities of sediment involved
were being brought into the estuary from a seaward direction. Jarrad investigated
the location of the deposition of the Mersey dredgings, as he recorded that the
area in which dredgings were deposited (at that time) were on the ‘dividing line’
between indraughts for the Mersey and Ribble estuaries (Figures 4.8 and 4.9).
His investigations showed that the material was rarely deposited within the
agreed area, and was generally dumped ‘anywhere within a mile westward’ of the
boundaries, as in practice the larger dredgers could not approach the area for a
considerable time before and after Low Water, nor in stormy weather. Jarrad
(1907) further concluded that, based upon the depths of 1904, there had been
‘no appreciable diminution’ of the depth of the water over the area between
surveys of 1889 and 1904, indicating that the 80 million tons of dredgings that
had been dumped at the site during that period, had been removed elsewhere.
(Thomas et al., (2002) recorded a maximum annual dredging of 17Mt between
1910 and 1917, with Ashton (1920) recording 12,769,409 tons annually).
Following further investigations, Jarrad concluded that if dredgings were deposited
slightly westward and northward of the prescribed area, then there would be an
equal chance of the material returning on a flood tide to either the Mersey or
Ribble indraught, however, during prevailing wind conditions of south-westerly,
the likelihood is that material would have been carried into the Ribble indraught.
With regard to the condition of the Bog Hole Channel, Jarrad (1907)
recommended deposition of the dredgings should be relocated to the area
allocated for the ‘City Engineers refuse Liverpool and Manchester’. It is evidence
along these lines, along with the generally held view that the accumulation of
sediment on the foreshore and the infilling of the Bog Hole Channel became
marked in 1890, when the Mersey dredging began, that led people at the time to
believe that it was, in part at least, the Mersey dredgings that were leading to the
accretion at Southport.

Report on the Evolution of the Ribble Estuary
31
In contrast to this, Fowler (1909a) recorded that the Mersey dredgings had been
deposited in the “…tideway about six miles south-west of Jumbo Buoy” and did
not believe that the deposition of the Mersey dredgings had a significant effect on
the deterioration of the Bog Hole Channel, as the depth of the outer bar (at the
southern end of the Channel) had remained constant. Ashton (1920) however
stated that “The … highering up of the Ribble estuary banks… has its main source
in the Mersey”.
Jones et al., (1991) reported that the peak in dredging of the Mersey was in
1924-25, when 25 million hopper tons per year were dredged. Dredged spoil was
(and still is) dumped at ‘Site Z’, a site much further inland of the sludge dumping
site, about 10 km due west of Formby Point, which in 1972 was receiving 15
million tonnes of dredged spoil per annum (Department of the Environment,
1972), and in 1992 was receiving 3 million wet tonnes of sediment (Rees et al.,
1992). According to Rees et al. (1992) much of the considerable decrease in the
quantities of dredgings dumped is due to changes in dredging practices. Disposal
at the ‘new’ Site Z commenced in 1982 due to shoaling at the ‘old’ Site Z (Rees et
al., 1992).

Report on the Evolution of the Ribble Estuary
32
Figure 4.8: Position of the dumping ground for Mersey dredgings (1904), which at
the time were close to the ‘dividing line’ between the Mersey and Ribble indraughts, from Jarrad, (1907). Document held in SMBC archive.
Report on the Evolution of the Ribble Estuary
Figure 4.9: Current observations around the Mersey dredging dumping site, drawn
by Jarrad, 1906. Document held in
SMBC archive.
Report on the Evolution of the Ribble Estuary
34
5.0 The Environmental Response of the Ribble Estuary
5.1 Environmental setting of the Estuary pre-industrialisation
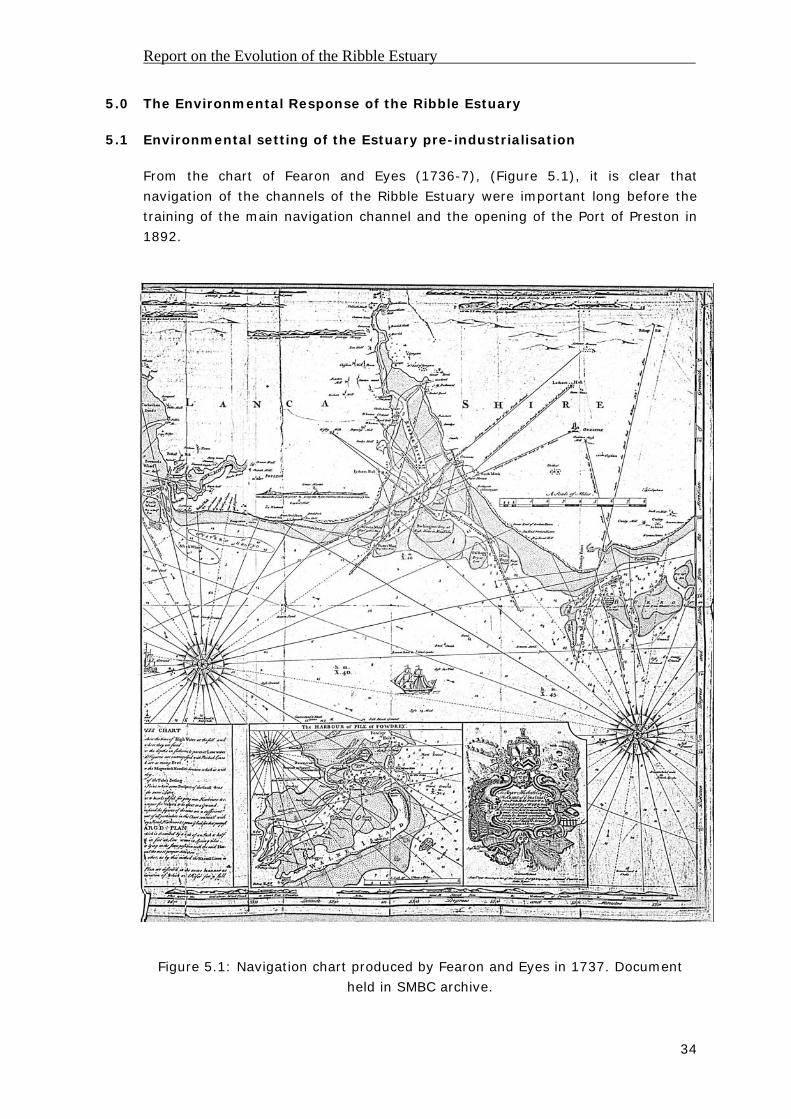
From the chart of Fearon and Eyes (1736-7), (Figure 5.1), it is clear that
navigation of the channels of the Ribble Estuary were important long before the
training of the main navigation channel and the opening of the Port of Preston in
1892.
Figure 5.1: Navigation chart produced by Fearon and Eyes in 1737. Document
held in SMBC archive.

Report on the Evolution of the Ribble Estuary
35
The following Figures (5.2 – 5.7) are copies of original plans, re-drawn by an
unknown source. However, when the first illustration of Fearon and Eyes 1737-7
chart (Figure 5.2) is compared to the ‘original’ chart (Figure 5.1), and those of
others held within the Lancashire Records Office, then assuming the same
accuracy has been applied to all the illustrations, then they appear to be more
than sufficient for the general observations required here. The pertinent points of
each chart are discussed within the box in each figure.

Figure 5.2: Chart of the Ribble Estuary, 1736-7, original by Fearon and Eyes. (Document held in SMBC archive).
Chart of 1736-1737, Fearon and Eyes:
The main channel runs through the centre of
the estuary, which diverts north and south
at the mouth. Northerly, the channel ran
between two banks, Butter Wharf and
Stevens Wharf. To the south, it runs past
sand banks called Packington, Old Bugg and
New Bugg. At this time, Crossens was
linked to the main central channel via a
waterway called Robin Hood, (Dickson,
1893). The town of Southport did not exist
at this point, with there only being mention
of ‘Crossons’ and ‘North Meals’ (later being
referred to as Meales (1761), then North
Meols in 1850).

Figure 5.3: Chart of the Ribble Estuary, 1761, original by Mackenzie. (Document held in SMBC archive).
Chart of 1761, Mackenzie:
The only channel through the mid section of the estuary lies close to the north shore at Lytham, with the
previous main channel through the centre of the estuary no longer being shown. At the mouth of the estuary,
the northern channels are greatly reduced in width, with the south channel being less sinuous. Interestingly,
the only soundings shown on the chart are in the (now) Bog Hole or South Channel, indicating that this was at
the time an important channel for navigation. The soundings are at a similar level to those in the previous
chart. A waterway linking ‘Crossons’ to the main channel is not recorded. The sand banks of Stevens Wharf
and Dawsons Bank have apparently been replaced by South Bank.
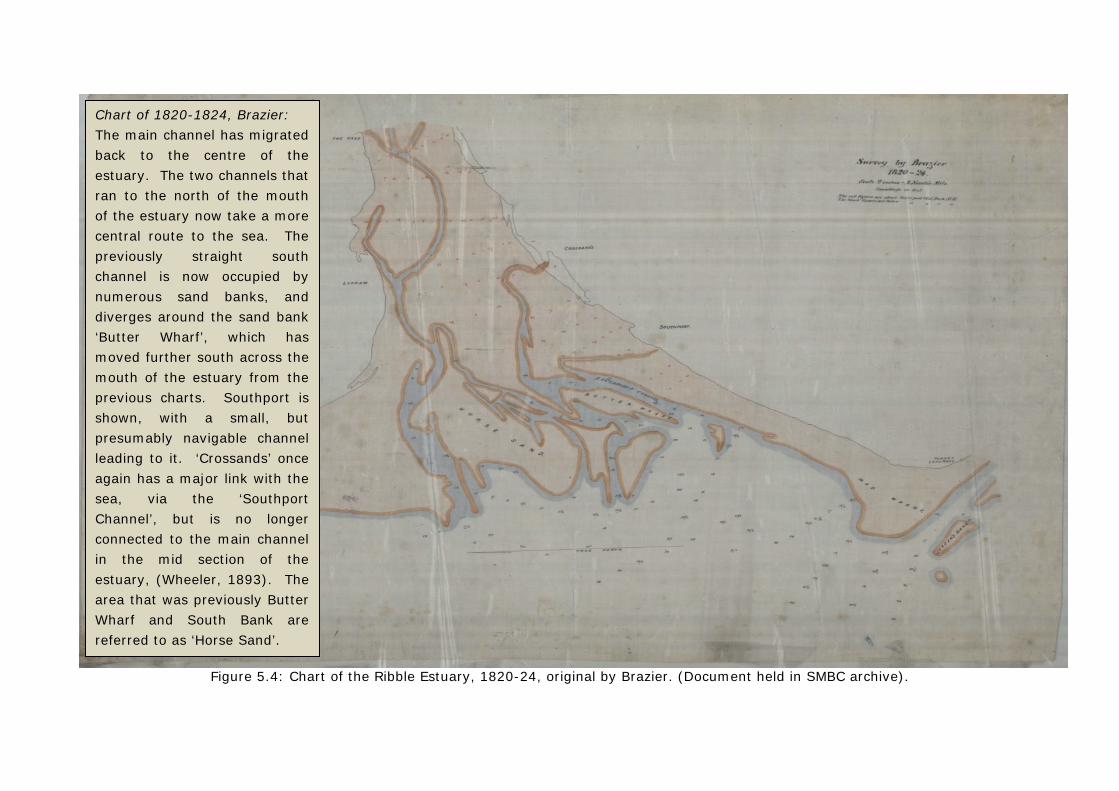
Figure 5.4: Chart of the Ribble Estuary, 1820-24, original by Brazier. (Document held in SMBC archive).
Chart of 1820-1824, Brazier:
The main channel has migrated
back to the centre of the
estuary. The two channels that
ran to the north of the mouth
of the estuary now take a more
central route to the sea. The
previously straight south
channel is now occupied by
numerous sand banks, and
diverges around the sand bank
‘Butter Wharf’, which has
moved further south across the
mouth of the estuary from the
previous charts. Southport is
shown, with a small, but
presumably navigable channel
leading to it. ‘Crossands’ once
again has a major link with the
sea, via the ‘Southport
Channel’, but is no longer
connected to the main channel
in the mid section of the
estuary, (Wheeler, 1893). The
area that was previously Butter
Wharf and South Bank are
referred to as ‘Horse Sand’.

Figure 5.5: Chart of the Ribble Estuary, 1836, original by Belcher. (Document held in SMBC archive).
Chart of 1836, Belcher:
The main channel through the mid part of the estuary has split into two, skirting each of the shorelines; a mid
channel also appears in this section. Where these three channels converge at Lytham, they once again split into two
major channels that run across the mouth of the estuary, to the north and south. The Crossens link to the main
channels is again not recorded, with only a minor waterway being shown in the general vicinity of the previous
waterway. It is possible that a channel was still present at Crossens, but was not of navigable interest, so was not
drawn on the chart. A small looped feature is shown linking Southport to the main south channel.

Figure 5.6: Chart of the Ribble Estuary, 1850, original by Williams and Webb. (Document held in SMBC archive).
Chart of 1850, Williams and Webb:
One main channel drains the mid section of the estuary to the north shore, with the channel that followed the southern shore now
becoming disconnected from the other channels toward the landward end. The South Channel that runs past Southport is still sizeable
to this point, but narrows considerably further into the estuary past the town. Crossens is linked to the sea by minor channels that join
the North and South Channels. ‘The Horse Bank’ is now a major sand bank across the mouth of the estuary, with ‘Salthouse Bank’
separating the ‘North Channel’ that runs very close to Blackpool, and the ‘New Gut’ that takes a more central route to the sea. ‘The
Penfold’ channel makes an appearance, cutting midway across Horse Bank. Fronting Southport is now called the ‘Bug Sands’.

Figure 5.7: Chart of the Ribble Estuary, 1860, original by Calver. (Document held in SMBC archive).
Chart of 1860, Calver:
No channels are shown in the central
and southern areas of the mid section
of the estuary, with the main channel
continuing to flank the northern
shore. The Penfold now cuts
completely through Horse Bank and
joins the Bog Hole / South Channel.
It becomes indicative from this chart
that the Bog Hole was an area of deep
water, having a depth of about 30
feet (9 m) at low water (Dickson,
1893) located in the South Channel.
Crossens is linked by a waterway to
the Penfold and South Channel.

Report on the Evolution of the Ribble Estuary
42
5.2 Training of the navigable channel and its implications
Between 1904 and 1929, James Barron produced four surveys of the Ribble
estuary, (with an additional surveys in 1935 and 1937 by A. Howarth), (Figures
5.8 – 5.14). Between the charts of 1904 and 1912 the extent of the additional
training of the main navigation channel becomes very apparent, extending to the
seaward edge of Salter’s bank and the Old Gut Channel. By 1925 the infilling and
disappearance of the Bog Hole at the end of the South Channel is particularly
marked, as is the virtual disappearance of the New Gut Channel that previously
dissected Salter’s Bank to the north of the trained channel. The chart of 1929
shows sediment deposition had occurred around the end of the trained channel,
with the southerly point of Salter’s Bank now extending beyond the training walls
westwards towards the open sea. The chart of 1935 shows the changes around
the trained channel, with small sand banks developing at the entrance to the
main channel, (this chart used the same survey information as the chart of 1929
for all except the navigation channel between Lytham and the open sea, shown as
a box on the chart). The final chart of 1937 shows further changes around the
end of the trained channel, and also the virtual disappearance of the Bog Hole
Channel.
The movement of sand banks and diverting of channels within the estuary can in
part be explained by the rapidity of the flood (incoming) tide compared to that of
the ebb (outgoing) tide (recorded as four hours and eight hours respectively by
Dickson in 1893). As the faster flowing flood tide is capable of transporting a
greater sediment load than the lower energy ebb tide, so material is moved into
the estuary, with the resulting intertidal areas gradually infilling. The flood tide
was still dominant over 60 years later, with Berry (1967) recording a flood tide of
7.9 feet (2.4 m) per hour (4.5 hours), with an ebb tide of 5.3 feet (1.6 m) per
hour (7.5 hours). This trend of higher flood velocities than ebb velocities still
remains (Lyons, 1997; van der Wal et al., 2002).
As the Navigation Channel was designed to concentrate the ebb flow to within the
trained walls (HRS, 1968; van der Wal et al., 2002), the ebb flow was resultantly
reduced outside the trained channels. The training of the channels to carry the
ebb flow also explains the formation of sand banks at the seaward end of the
main channel, as on reaching the un-trained end of the channel, so the ebb flow
could disperse over a less confined area, losing energy, and hence depositing
sediment. Ashton (1920) noted the area of the Estuary covered by water at low
tide reduced from 30% in 1820 to only 5% in 1910. This reduction could be
attributed potentially to the modification of the estuarine channels, with the main
navigation channel being artificially deepened by dredging, so carrying a greater
volume of water over a smaller surface area to the previously ‘natural’ channels.
Thereby, leaving a larger proportion of the intertidal area drained of water during
low tides. However, it is more probably due to the estuary gradually infilling with
sediment, and so effectively raising more of the intertidal area of the estuary
above the low water mark.

Figure 5.8: Survey of the
Ribble estuary by Barron, 1904.
Document held in SMBC archive.

Figure 5.9: Survey of the Ribble estuary by Barron, 1912. Document held in
SMBC archive.
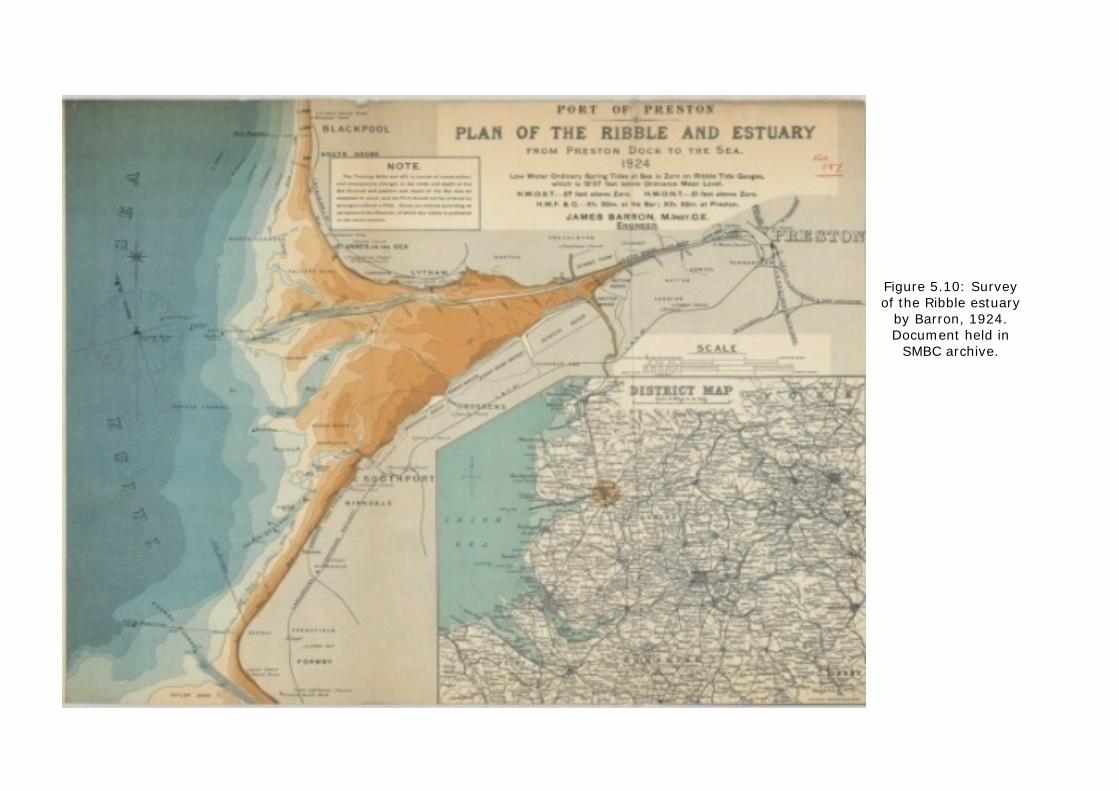
Figure 5.10: Survey of the Ribble estuary
by Barron, 1924. Document held in
SMBC archive.

Figure 5.11: Survey of the Ribble
estuary by Barron, 1925. (Source: Barron, 1938).
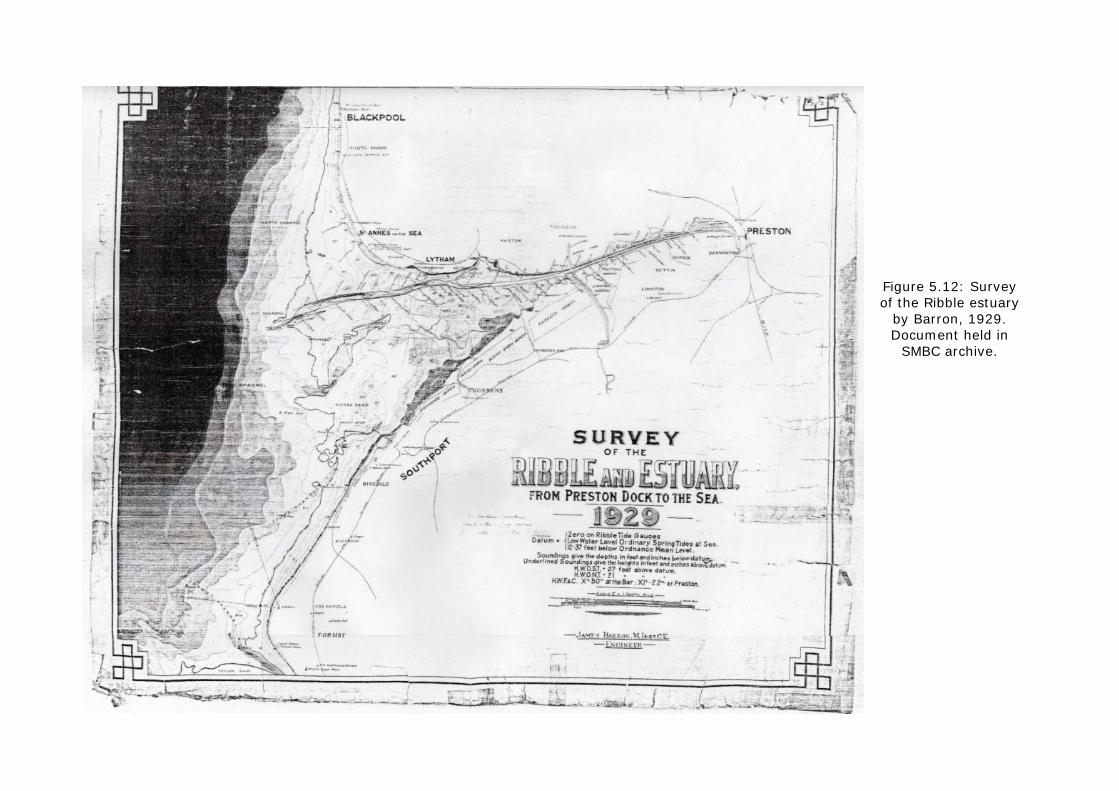
Figure 5.12: Survey of the Ribble estuary
by Barron, 1929. Document held in
SMBC archive.

Figure 5.13: Survey of the
Ribble estuary by Barron, 1935.
Document held in SMBC archive

Figure 5.14: Survey of the
Ribble estuary by Barron, 1937.
(Source: Barron, 1938).

Report on the Evolution of the Ribble Estuary
50
5.3 Sediment accretion along the southern estuary foreshore
Accretion of sandy sediment along the Southport coast was considered by Dickson
(1893), who suggested that the presence of (the relatively recent at that time)
buildings along the coastline were impeding the movement of wind blown sand
onshore, hence causing it to accumulate along the foreshore. Similarly, he
proposed that the draining of the land under Southport town diverted water that
would previously have flowed onto the beach, causing the sand to remain damp,
however, once the sand dried out following drainage and culverting, so the sand
could accumulate by the action of the wind.
In 1906, notes made by the Borough of Southport’s Surveyor’s Office records
that:
“… although there had been erosion in many places the accretions facing
the Borough exceed the erosion by many millions of cubic yards during the
last 20 or 25 years. To the north-east of the Borough and higher up the
Estuary enormous accretions have taken place… since the year 1839 above
5,000 acres have been grassed over.” [Borough Surveyor’s Office,
Southport, 1906].
A study by the University of Liverpool in 1986 identified residual circulations were
transporting material from the spoil ground at Jordan’s Spit onto Taylor’s Bank,
then on to Formby, and subsequently into the drift feeding Horse Bank; hence the
stability of Horse Bank may be linked to the dredging of the Mersey. Similarly,
Pye and Neal (1994) determined that due to the dredging and subsequent spoil
dumping of the Mersey, alterations were made to the wave regime around
Formby Point, contributing to coastal erosion in this area, with much of the
eroded material being moved towards the Ribble Estuary.
The presence of muddy fine sediment along the foreshore to the north of the Pier
is evidently not a recent occurrence. Fowler (1910) reported it was almost
impossible to walk to the Bog Hole Channel eastward of the Pier due to muddy
patches with intermittent sand patches, with the whole of that area below the 9
feet (2.7 m) contour being in a “stagnant condition of wet sand and mud”. Fowler
summarises the condition of the foreshore by saying:
“The contrast between the muddy beach above the Pier and the hard clean
Beach extending from the Pier to Formby and down to spring low water
contour is very marked.” [Fowler, Report to the Chairman and Members of
the Improvement and Parks Committee, Southport, 1910].
Ashton (1920) also described the ‘clay beds’ near Crossens, and at low water on
the landward side of the Bog Hole north of the Pier.
It is highly probable that the extensive reclamations within the estuary were a
significant factor in the accretion of sediment along the foreshore. The
Report on the Evolution of the Ribble Estuary
51
reclamation of land would reduce the tidal prism within an estuary (Long et al.,
2006), and lower mean current velocities, resulting in sediment deposition (van
der Wal et al., 2002). This deposition would have a consequential effect of
establishing a positive feedback by further reducing the tidal prism, thereby
promoting even more deposition, increasingly of finer sediment as the energy
reduces (van der Wal et al., 2002).
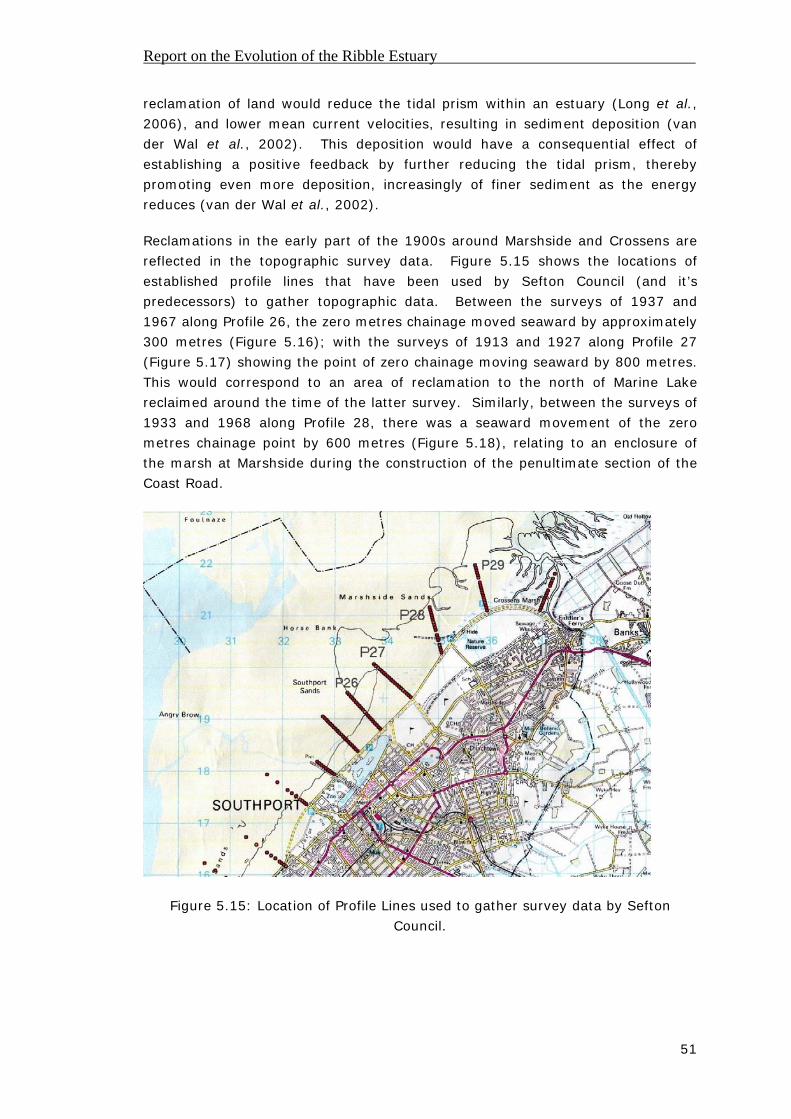
Reclamations in the early part of the 1900s around Marshside and Crossens are
reflected in the topographic survey data. Figure 5.15 shows the locations of
established profile lines that have been used by Sefton Council (and it’s
predecessors) to gather topographic data. Between the surveys of 1937 and
1967 along Profile 26, the zero metres chainage moved seaward by approximately
300 metres (Figure 5.16); with the surveys of 1913 and 1927 along Profile 27
(Figure 5.17) showing the point of zero chainage moving seaward by 800 metres.
This would correspond to an area of reclamation to the north of Marine Lake
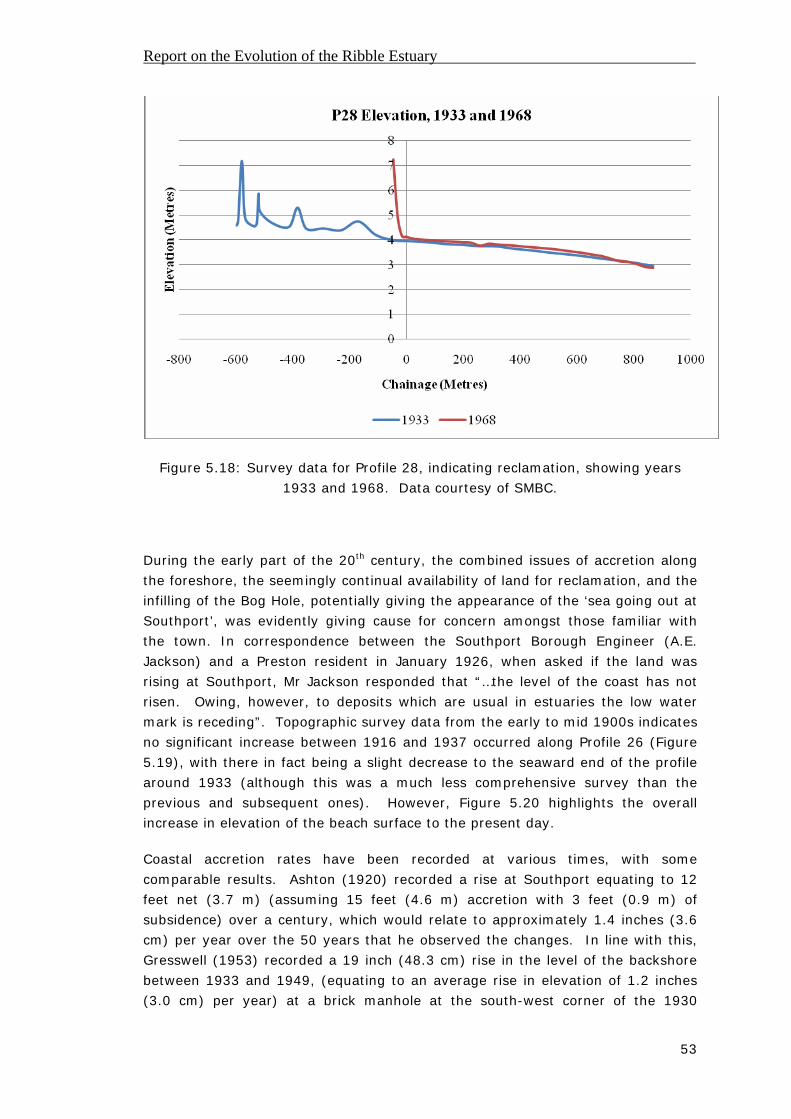
reclaimed around the time of the latter survey. Similarly, between the surveys of
1933 and 1968 along Profile 28, there was a seaward movement of the zero
metres chainage point by 600 metres (Figure 5.18), relating to an enclosure of
the marsh at Marshside during the construction of the penultimate section of the
Coast Road.
Figure 5.15: Location of Profile Lines used to gather survey data by Sefton
Council.

Report on the Evolution of the Ribble Estuary
52
Figure 5.16: Survey data for Profile 26, indicating reclamation, showing years
1937 and 1967. Data courtesy of SMBC.
Figure 5.17: Survey data for Profile 27, indicating reclamation, showing years
1913 and 1927. Data courtesy of SMBC.
Report on the Evolution of the Ribble Estuary
53
Figure 5.18: Survey data for Profile 28, indicating reclamation, showing years
1933 and 1968. Data courtesy of SMBC.
During the early part of the 20th century, the combined issues of accretion along
the foreshore, the seemingly continual availability of land for reclamation, and the
infilling of the Bog Hole, potentially giving the appearance of the ‘sea going out at
Southport’, was evidently giving cause for concern amongst those familiar with
the town. In correspondence between the Southport Borough Engineer (A.E.
Jackson) and a Preston resident in January 1926, when asked if the land was
rising at Southport, Mr Jackson responded that “…the level of the coast has not
risen. Owing, however, to deposits which are usual in estuaries the low water
mark is receding”. Topographic survey data from the early to mid 1900s indicates
no significant increase between 1916 and 1937 occurred along Profile 26 (Figure
5.19), with there in fact being a slight decrease to the seaward end of the profile
around 1933 (although this was a much less comprehensive survey than the
previous and subsequent ones). However, Figure 5.20 highlights the overall
increase in elevation of the beach surface to the present day.
Coastal accretion rates have been recorded at various times, with some
comparable results. Ashton (1920) recorded a rise at Southport equating to 12
feet net (3.7 m) (assuming 15 feet (4.6 m) accretion with 3 feet (0.9 m) of
subsidence) over a century, which would relate to approximately 1.4 inches (3.6
cm) per year over the 50 years that he observed the changes. In line with this,
Gresswell (1953) recorded a 19 inch (48.3 cm) rise in the level of the backshore
between 1933 and 1949, (equating to an average rise in elevation of 1.2 inches
(3.0 cm) per year) at a brick manhole at the south-west corner of the 1930

Report on the Evolution of the Ribble Estuary
54
embankment. Further north-west into the estuary, Berry (1967) recorded 1.4
inches (3.6 cm) of accretion occurring over two years on the salt marshes.
Unfortunately, no specific details are recorded as to the exact locations where
measurements were taken. This accumulation of sediment led to the belief that
the sea was receding at Southport. The Southport Visitor newspaper in 1937
(reporting on a discussion by A.E. Jackson, the Borough Engineer) recorded the
rate of recession of the High Water Mark close to the Pier was 96 feet (29.3 m)
per annum between 1927 and 1937.
Figure 5.19: Topographic survey data of the Southport foreshore, Profile 26,
1916, 1927, 1933 and 1937. Data courtesy of SMBC.

Report on the Evolution of the Ribble Estuary
55
Figure 5.20: Topographic survey data of the Southport foreshore, Profiles 26 and
27, showing overall increase in elevation between 1913 (P26) / 1916 (P27) and
2003. Data courtesy of SMBC.

Report on the Evolution of the Ribble Estuary
56
Industrial growth further inland of the estuary was additionally potentially adding
to the infilling of the estuary and sediment accumulation (Berry, 1967), with
industrial growth in the catchments of the Ribble and other tributary rivers
increasingly involving industry controlling the flow of the rivers. Peak flows from
the Ribble into the estuary had previously been shown to occur in ‘freshets’ of
water lasting a few days (Fairhurst, c.1974). These freshets effectively added
water to the ebb flow, so producing a greater scouring effect than the ebb tide
alone. The scour could result in fine material being resuspended, to be deposited
during a lower energy flow, potentially, either in a seaward direction, or to remain
in suspension until it is deposited at a point further inland than it was originally
eroded. Controlled flow of the Ribble, however, removed the ‘freshets’ that
produced the scour effect (Berry, 1967), potentially, facilitating further
sedimentation in the drainage channels of the estuary.
The gradual increase in the elevation of the foreshore continued to be
demonstrated by topographic survey data during the latter half of the 20th
century. Figure 5.21 demonstrates how the elevation fluctuates over timescales
of a few decades, but shows an overall increase in elevation when compared to
the earliest profile data.
Figure 5.21: Topographic profile data of Profile 26, showing changes in elevation
of foreshore. Data courtesy of SMBC.

Report on the Evolution of the Ribble Estuary
57
5.4 Changes in the Bog Hole Channel
Changes in the morphology of the Bog Hole Channel have been recorded in
relative detail, probably due to its proximity to the foreshore at Southport and its
presence as a notable attribute providing the town with a constant marine feature
even at low tide. As recorded by Gresswell in 1953:
“… the Pier stood in deep water at all states of the tide, and providing one
looked westwards along the length of the [Bog Hole] channel one could
feel that one had reached the sea. But in doing so, one ignored the
several miles of sand in all other directions.” [Gresswell, R.K., (1953),
p.59]
As Southport had developed as a tourist destination during the nineteenth
century, so too the depth of the Bog Hole increased (Table 5.1 and Figure 5.22).
The first Pier was erected at Southport in 1860 and, although there is no recorded
evidence, it is likely that the location of the Pier advantageously coincided with
the location of the ever present (at that time) Bog Hole.
Table 5.1: Changing depths of the Bog Hole channel, increasing through the 19th
Century, decreasing through the 20th Century.
Nineteenth Century (Data from Wheeler, 1893)
Year 1824 1850 1860 1882
Depth (feet) 21.5 43 max/19
min
48 57
Depth (metres) 6.6 13.1 / 5.8 14.6 17.4
Twentieth Century (Data from Gresswell, 1953)
Year 1909 1924 1928 1933
Depth (feet) 60 37 Dry at low
water
Dry by several feet
at low water
Depth (metres) 18.3 11.3 - -
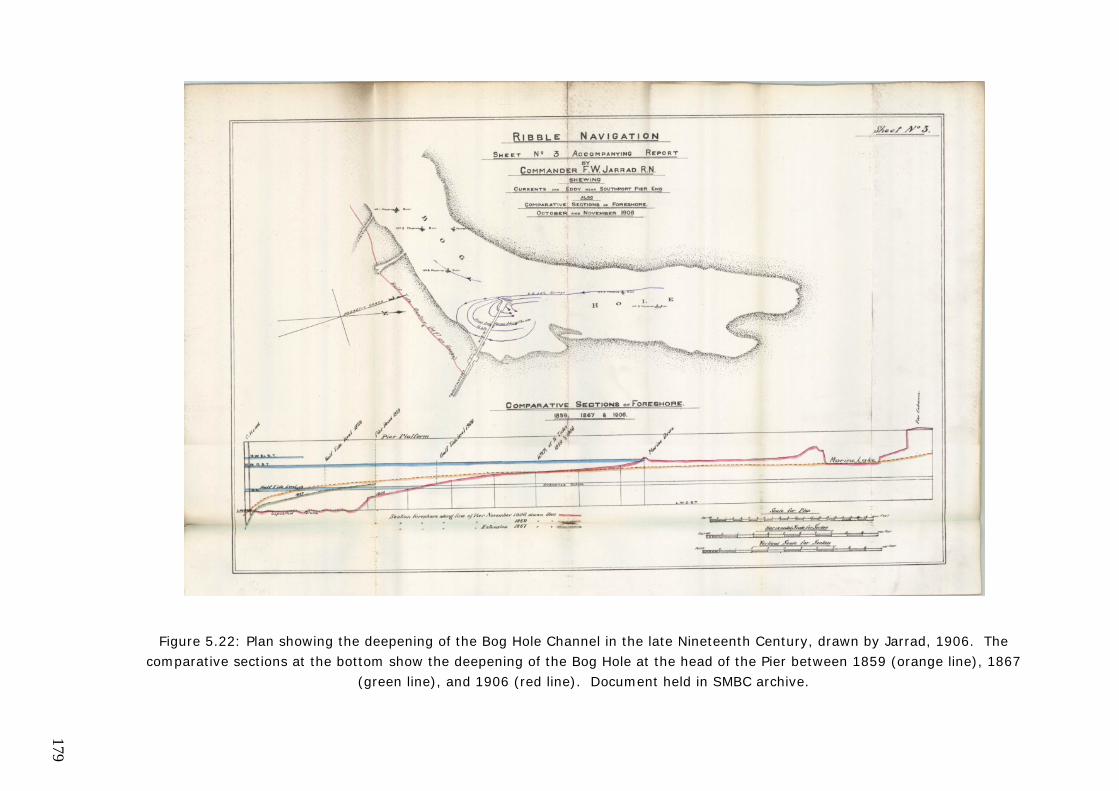
179
Figure 5.22: Plan showing the deepening of the Bog Hole Channel in the late Nineteenth Century, drawn by Jarrad, 1906. The
comparative sections at the bottom show the deepening of the Bog Hole at the head of the Pier between 1859 (orange line), 1867
(green line), and 1906 (red line). Document held in SMBC archive.

Report on the Evolution of the Ribble Estuary
59
In reports of 1888 and 1893, Messent and Dickson, respectively, surmised that
the existence of the Bog Hole was due to it no longer being connected to the
other channels, so the flood tide caused an eddying motion that kept the
depression scoured and hence relatively deep. They suggested if the South
Channel (containing the Bog Hole) were again to be connected to the main
channels, that the Bog Hole would silt up and potentially disappear, however, the
Bog Hole has never again has been connected at its inner point to any of the main
channels, but has still continued to infill.
The Bog Hole was recorded as continuing to deepen and narrow up to 1893, at
which point it started to deteriorate, with infilling being accelerated from 1904
(Fowler, 1909a; Fowler, 1910). Between 1896 and 1905 the Southport
Corporation recorded a decrease of nearly 50% in the tidal volume of the channel,
from 8,427,569 to 4,264,349 cubic yards (Fairhurst, c.1974). Where there had
previously been frequent steamer excursions from Southport Pier to Lytham
across the estuary, by 1913, there were very few steamers able to reach the Pier
due to difficulties negotiating the accreting sand banks, with limited crossings
until 1920 (Tovey, 1965). From the late 1920’s, steamers were unable to sail
from the Pier due to accretion of sand raising the level of the foreshore several
feet higher than at the end of the nineteenth century (Tovey, 1965), and to the
infilling of the Bog Hole channel. In addition, Figure 5.23 shows the topographic
evidence of changes in the Bog Hole Channel, with data pre-1937 indicating the
presence of the channel relating to the decrease in the profile from 500 metres
chainage seawards. By 1996, the channel (its northern end by this time) is
shown to have shallowed and narrowed considerably, with continued infilling by
2003.
Figure 5.23: Changes in the Bog Hole Channel over time as shown by changes in
the topography of Profile 26. Data courtesy of SMBC.
Relates to present day Bog Hole

Report on the Evolution of the Ribble Estuary
60
It was not only the steamers that would have suffered because of the Bog Hole
shallowing. Evidence of correspondence still exists from the ‘Southport and
District Fishermen’s Association’, which was established in 1911 (e.g. Jackson,
1914; Marshall, 1914; Jackson, 1919), suggesting the number of local fishermen
was significant, not only by the presence of an association, but because the
correspondence regards the provision of leading lights to light the Southport (Bog
Hole) Channel. In addition, Stammers (1999) recorded the building of boats at
Shellfield Road in Marshside, which were moved by the local fishermen to be
launched at Marine Drive, and records the presence of a shipyard being
documented at Crossens, possibly from the 18th or 19th century. Plate 5.1 taken
from Barron (1938) illustrates the use of the Bog Hole effectively as a ‘lay-by’ for
boats.
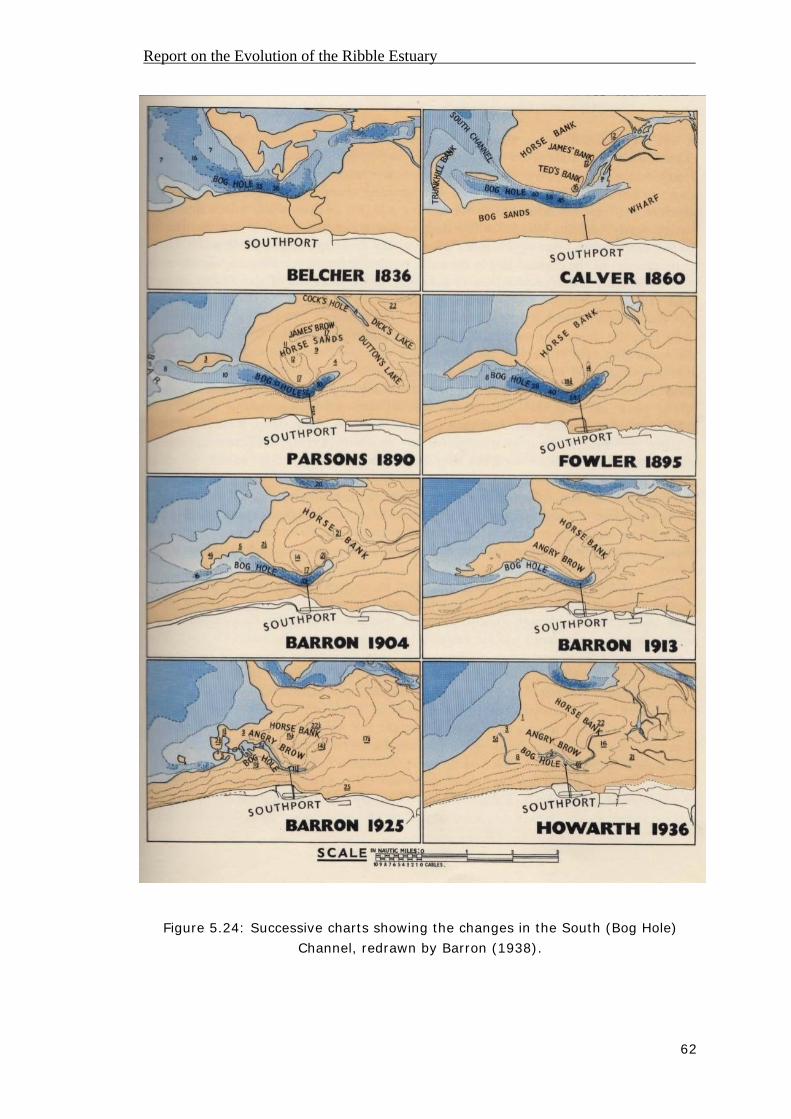
Table 5.2 shows the changing characteristics of the Bog Hole at this time, as
given by Ashton (1920), with Figure 5.24 visually showing the changes as re-
drawn by Barron (1938).
Plate 5.1: Photograph of the “view from the end of Southport Pier, showing
vessels lightering in the Bog Hole”, c.1901. (Source: Barron, 1938).

Report on the Evolution of the Ribble Estuary
61
Table 5.2: Changing characteristics of the Bog Hole Channel, 1871 – 1919; (data taken
from Ashton, 1919 and 1920, formerly quoting data believed to have been collected by
Fowler; and Fowler, 1910).
Characteristic Year Measurement
Measurement
(metric
conversion)
1871 9 feet of water 3 m Height of water/sand 1 mile
above Pier 1905 9 feet of sand 3 m
1887 2700 yards 2469 m
1903 1200 yards 1097 m
1909 1000 yards 914 m
Distance of head of channel from
Pierhead (at Low Water)
1919 900 yards 823 m
1904 2 miles 3.2 km Length of channel at 15 feet
depth 1910 1 mile 70 yards 1.67 km
1904 960 yards 878 m Length of channel at 21 feet
depth 1910 730 yards 668 m
1890 127 acres 51.4 ha Area of channel above Pierhead
1913 47 acres 19.0 ha
1904 720 feet 220 m
1910 660 feet 201 m Channel width, line from Pier to
Horse Bank
1919 450 feet 137 m
Report on the Evolution of the Ribble Estuary
62
Figure 5.24: Successive charts showing the changes in the South (Bog Hole)
Channel, redrawn by Barron (1938).
Report on the Evolution of the Ribble Estuary
63
In a report by Vernon-Harcourt (1905) regarding the proposed extension of the
training walls in the Ribble Navigation Bill of 1905, he quotes the Commissioners
Final Report of 1891, stating that the Bog Hole depends upon “… the set of the
tides, and upon the drainage from the Crossens watershed”. Although previously
in 1885, Southport Corporation had proposed a Parliamentary Bill to divert the
flow of the Crossens Channel back into the Bog Hole, they were opposed by the
riparian landowners whom claimed rights of accretion, with the Bill being dropped
(Fairhurst, c.1974). Without the flow of drainage from Crossens, the surveys of
Barron (1938), and the data from Gresswell (1953) demonstrate the continued
shallowing of the Bog Hole, even though no connection was ever again made
between it and the main channels, (which Dickson (1893) had suggested would
be the main cause of shallowing). This would indicate some other factor being
responsible, which Gresswell (1953) believed to be the presence of the training
walls resulting in a lack of flow into both the Bog Hole and Penfold Channels.
Evidence therefore suggests a major contributing factor to the infilling of the Bog
Hole was, potentially, the diversion of Crossens Pool, as the channel that drained
the adjacent land, away from the Bog Hole which it had previously flowed into,
away towards the centre of the estuary and the Penfold Channel. This alteration
of the course of the drainage water from Crossens may have reduced the flow in
the Bog Hole sufficiently to allow sediment deposition.
Vernon-Harcourt (1905) proposed that should the extension to the training walls
go ahead, that Preston Corporation should be responsible for the dredging of the
inner sand bar to maintain the Bog Hole, or if this was considered too “onerous
[an] obligation”, then to consider training the Crossens Channel into the Bog Hole
to “preserve the latter channel from obliteration” (Figure 5.25). This approach
was supported by Fowler in his report of 1910, who felt that should the Crossens
Channel be diverted into the Bog Hole, then it would prevent any periods of still
water, thereby preventing sediment deposition. Ashton, however, in his book
‘The Battle of Land and Sea’, quoted in Fowler (1910), disagrees with the
proposal, believing the quantity of water flowing through the Crossens Channel to
be insufficient to make a difference to the infilling of the Bog Hole. Potentially, in
addition to the landowners opposition to training the Crossens Channel, some
reluctance to its training across the foreshore at Southport may have been due to
the fact that prior to the Banks Sewage Treatment Works, untreated sewage was
discharged via the Crossens Channel, hence, the presence of this material would
not have been agreeable either across the foreshore or within the Bog Hole
Channel at Pierhead.
At around the same time, in his report of 1909(a), Fowler believed that trying to
maintain the Bog Hole in its current position, in a state suitable for pleasure
steamers, would be unsuitable in the long term. Instead, he proposed a one-off
dredging operation to create a channel in line with the fetch of the flood tide to
the south-west of the Bog Hole out into the open sea (Figure 5.26). Evidently,
this plan was not considered feasible and was never carried out.

Figure 5.25: Plan of proposed diversion of Crossens Pool into the Bog Hole Channel, 1910, probably drawn by Fowler (Borough
Surveyor). Text in red reads: “Line of revetted dredged channel 30ft bottom width”. Document held in SMBC archive.

Report on the Evolution of the Ribble Estuary
65
Figure 5.26: Part of plan showing proposed dredging to maintain a navigable link
between Southport and the sea, drawn by Fowler, 1909(a). (Document held in SMBC
archive).
Report on the Evolution of the Ribble Estuary
66
The general consensus during the early twentieth century was that the
deterioration of the Bog Hole Channel was of great detriment to the town of
Southport, as it resulted in the cessation of pleasure steamers operating from the
pier, and resulted in very little standing water at Pierhead, so giving the impression
that the ‘sea was retreating’ from the town. There was an overall agreement
between the engineers of the time that the main causing factors for the infilling of
the Bog Hole were predominantly; (i) the presence of the 1883 Ribble training walls
(although this was always stated by engineers associated with Southport
Corporation, and not Preston Corporation); (ii) to a lesser degree the reclamation of
the foreshore on the southern side of the estuary, reducing the tidal capacity; and
(iii) the effect of the deposition of Mersey dredgings since 1890, this factor however
being contentious between different parties, some believing that the dredgings
were deposited too far south to produce any significant effect, whilst others argued
that it was in part the dredgings that were leading to an accretion of sediment on
the Southport foreshore.
6.0 Summary
Throughout the last 200 years the Ribble Estuary has undergone continual change
since the first available plans of 1737 illustrate. The estuary has experienced a net
infilling, with evidence indicating that the natural processes of change have been
exacerbated during the last 200 years by human activities (O’Connor, 1987) related
to the development of the Port of Preston, and the evolution of the town of
Southport; notably the construction of the Ribble training walls, land reclamation,
and dredging of both the Ribble and Mersey Channels.
The Ribble Estuary is naturally subject to accretion from offshore sediments moved
inland by tidal currents and the predominant west to west-south-west direction of
onshore winds, with the area to the south of the estuary showing a strong littoral
drift to the north (towards the estuary) (Smith 1982). The amount of sediment
brought into the estuary by the River Ribble is very variable, with a very early
tenuous estimation by Dickson (1893) of an annual contribution of 400,000 tons of
‘soluble solids’ to the sea from the River Ribble. Subsequent studies (e.g.
Hydraulics Research Station, 1965; Smith, 1982; van der Wal et al., 2002) have
shown the input of sediment from the River Ribble to the estuary to be negligible.
7.0 References
ALLISON, J. E. (1949) The Mersey Estuary., Liverpool, Liverpool University Press.
ANON (1896) Minutes of Proceedings, Southport Corporation. Unpublished archive
document, SMBC.
ASHTON, W. (1920) The Evolution of a Coastline.
BARRON, J. (1938) A History of the Ribble Navigation., Preston, Guardian Press.

Report on the Evolution of the Ribble Estuary
67
BERRY, W. G. (1967) Salt marsh development in the Ribble Estuary. IN STEEL, R.
W. & LAWTON, R. (Eds.) Liverpool Essays in Geography. A Jubilee Collection.
Liverpool, Liverpool University Press.
BOROUGH SURVEYOR'S OFFICE (1906) Royal Commission on Coast Erosion. Borough Surveyor's notes on questions framed by the Commission. Unpublished archive document, SMBC. BRITISH GEOLOGICAL SURVEY (1984).
CAMERON, K. (1996) English Place Names, London, B.T. Batsford, Ltd.
CASHIN, J. A. (1949) Engineering works for the improvement of the estuary of the
Mersey. Journal of the Institution of Civil Engineers, 32, 296-367.
DEFRA (2002) Safeguarding Our Seas. A strategy for the conservation and sustainable development of our marine environment. London, Department for Environment, Food and Rural Affairs. DEPARTMENT OF THE ENVIRONMENT (1972) Out of Sight. Out of Mind. Report of a Working Party on the Disposal of Sludge in Liverpool Bay. Vol.1: Main Report. London, HMSO. DICKSON, E. (1893) The history of the Ribble Valley and Estuary. The Southport Society of Natural Science, Fourth Session, 3-13. FAIRHURST, G. J. (c.1974) A study into changes in the estuary of the River Ribble, Lancashire. Unpublished BSc Project Report., Liverpool Polytechnic. FOWLER, A. F. (1909 (a)) Report to the Chairman and Members of the Improvement and Parks Committee, Southport Corporation on the Bog Hole Channel. Unpublished archive document, SMBC. FOWLER, A. F. (1909(b)) Letter to J.E. Jarrat (Town Clerk, Southport) regarding the Bog Hole Channel. Unpublished archive document, SMBC. FOWLER, A. F. (1910) Report to the Improvement and Parks Committee, Southport. Unpublished archive document, SMBC., 31. FREEMAN, T. W., RODGERS, H. B. & KINVIG, R. H. (1966) Lancashire, Cheshire and the Isle of Man., London, Thomas Nelson and Sons Ltd. GRESSWELL, R. K. (1953) Sandy Shores of South Lancashire., Liverpool, Liverpool University Press. GRESSWELL, R. K. & LAWTON, R. (1964) Merseyside., Sheffield, The Geographical Association. HANSOM, J. D., COMBER, D. P. M. & FAHY, F. M. (1993) Estuaries Management Plans, Coastal Processes and Conservation. Ribble Estuary. Report for English Nature. HYDRAULICS RESEARCH STATION (1965) An investigation of sand movements in the Ribble Estuary using radioactive tracers. Report No. Ex.280.
Report on the Evolution of the Ribble Estuary
68
HYDRAULICS RESEARCH STATION (1968) Note on Engineering Works to Reduce Dredging in the Ribble Estuary. Report No. Ex.391. JACKSON, A. E. (1914) Letter to Mr Marshall, Southport and District Fishermen's Association, re: Leading Lights, Southport Channel. Unpublished archive document, SMBC. JACKSON, A. E. (1919) Letter to Mr Black, Borough Electrical Engineer, re: "Leading" Lights, Southport Channel. Unpublished archive document, SMBC. JACKSON, A. E. (1926) Letter to Mr T.C. Chandler, re: sea-level at Southport. Unpublished archive document, SMBC. JACKSON, A. E. (1937) Southport Foreshore. The Southport Visitor. JARRAD, R. N. (1907) Report on the South (Bog Hole) Channel. Unpublished archive document, SMBC. JOHNSON, R. H. (Ed.) (1985) The Geomorphology of North-West England., Manchester, Manchester University Press. JONES, C. R., HOUSTON, J. A. & BATEMAN, D. (1991) A history of human influence on the coastal landscape. IN ATKINSON, D. & HOUSTON, J. (Eds.) The Sand Dunes of the Sefton Coast. Proceedings of the Sefton Coast Research Seminar, Liverpool. Liverpool, National Museums & Galleries on Merseyside. JONES, P. D. (2006) Water quality and fisheries in the Mersey Estuary, England: A historical perspective. Marine Pollution Bulletin, 53, 144-154. LONG, A. J., WALLER, M. P. & STUPPLES, P. (2006) Driving mechanisms of coastal change: Peat compaction and the destruction of late Holocene coastal wetlands. Marine Geology, 225, 63-84. LYONS, M. G. (1997) The dynamics of suspended sediment transport in the Ribble Estuary. Water, Air & Soil Pollution, 99, 141-148. MAMAS, C. J. V., EARWAKER, L. G., SOKHI, R. S., RANDLE, K., BERESFORD-HARTWELL, P. R. & WEST, J. R. (1995) An estimation of sedimentation rates along the Ribble Estuary, Lancashire, UK, based on radiocaesium profiles preserved in intertidal sediments. Environment International, 21, 151-165. MARSHALL, J. (1914) Various letters to Mr Jackson, Southport Borough Engineer, from Southport and District Fishermen's Association, re: Lighting of Southport Channel. Unpublished archive document, SMBC. MESSENT, P. J. (1888) Effect of the works now being executed in the Ribble by the Preston Corporation, a report to the Southport Corporation and the Lords of the Manor of North Meols. Unpublished archive document, SMBC. MURRAY, L. A. & NORTON, M. G. (1979) The composition of dredged spoils dumped
at sea from England and Wales. Ministry of Agriculture, Fisheries & Food,
Directorate of Fisheries Research, Technical report No52. Lowestoft, MAFF.
NORTON, M. G., ROWLATT, S. M. & NUNNY, R. S. (1984) Sewage sludge dumping
and contamination of Liverpool Bay sediments. Estuarine, Coastal and Shelf Science,
19, 69-87.

Report on the Evolution of the Ribble Estuary
69
O'CONNOR, B. A. (1987) Short and long term changes in estuary capacity. Journal of the Geological Society, London, 144, 187-195. PYE, K. & NEAL, A. (1994) Coastal dune erosion at Formby Point, north Merseyside, England: Causes and mechanisms. Marine Geology, 119, 39-56. RAINFORDS, Wm. LTD (2005) Ribble Estuary Sandwinning - Horse Bank, Southport. Aerial inspection monitoring summary report 1993 to 2001. RAMSTER, J. W. & HILL, H. W. (1969) Current system in the northern Irish sea. Nature, 224, 59-61. REES, H. L., ROWLATT, S. M., LIMPENNY, D. S., REES, E. I. S. & ROLFE, M. S. (1992) Benthic studies at dredged material sites in Liverpool Bay. Aquatic Monitoring Report No. 28., MAFF Directorate of Fisheries Research. RENDEL, PALMER AND TRITTON (1967) Ribble Estuary Navigation Channel. Report to Port of Preston Authority. Unpublished archive document, SMBC. SMITH (1982) Guide to the Sefton Coast Database. Southport, Sefton MBC.
STAMMERS, M. (1999) Shipways and steamchests: the archaeology of 18th- and
19th- Century wooden merchant shipyards in the United Kingdom. The International
Journal of Nautical Archaeology, 28, 253-264.
THOMAS, C. G., SPEARMAN, J. R. & TURNBULL, M. J. (2002) Historical
morphological change in the Mersey Estuary. Continental Shelf Research, 22, 1775-
1794.
TOOLEY, M. (1985) Sea level changes and coastal morphology in North-west England. IN JOHNSON, R.H. (Ed.) The Geomorphology of North West England. Manchester, Manchester University Press. TOVEY, N. E. (1965) Municipal Works in Southport. 17th Annual Conference of the Institute of Works and Highways Superintendents. Southport. VAN DER WAL, D., PYE, K. & NEAL, A. (2002) Long-term morphological change in the Ribble Estuary, northwest England. Marine Geology, 189, 249-266. VERNON-HARCOURT, L. F. (1905) Report on the extension of the Ribble training walls proposed in the Ribble Navigation Bill of 1905. Unpublished archive document, SMBC. WHEELER, W. H. (1893) Tidal Rivers, London, Green & Co.