report on torque measurements and process …tempacida.com/index_htm_files/musterbericht -...
TRANSCRIPT
Musterbericht - ACIDA Torque Measurement Services by ACIDA GmbH
Report on Torque Measurements and Process Analyses
at the Heavy Plate Mill of Rolled Products Inc., USA
ACIDA GmbH
in October 2004
ACIDA GmbH Tel.: +49 (0)2407 5638.0 www.acida.net Kaiserstraße 100, D-52134 Herzogenrath Fax.: +49 (0)2407 5638.28 [email protected]
14 October 2004 Musterbericht - ACIDA Torque Measurement Services by ACIDA GmbH Page 2
Content
ACIDA GmbH Tel.: +49 (0)2407 5638.0 www.acida.net Kaiserstraße 100, D-52134 Herzogenrath Fax.: +49 (0)2407 5638.28 [email protected]
14 October 2004 Musterbericht - ACIDA Torque Measurement Services by ACIDA GmbH Page 3
1 Introduction
The Rolled Products Inc., USA, operates a reversing hot mill that consists out of a 4-high-stand with a twin-drive. In autumn 2002, the drive system was modernized by replacing DC motors by ENDRI AC motors (6200 kW / 65 rpm). Based on production statistics delivered by Rolled Products Inc. the total annual throughput of this mill was 483200 tons.
After commissioning of the new AC drives, the roll side knuckles of the existing universal joint shafts failed due excessive wear and fa-tigue. One hypothetical source of the problem was the overload on spindles, which could occur due to extreme overload capacity (2.5 x nominal torque) of the new AC motors.
The VOITH Turbo GmbH & Co. KG, being one of the most renowned manufacturer of heavy duty universal joint spindles, was inquired to provide a drive solution appropriate to the new transmission power of the rolling mill at Rolled Products Inc.
To determine the actual load on the drive train, the ACIDA GmbH, a subsidiary company of VOITH, carried out torque measurements in June 2004. Torque measurements are imperative on dynamically loaded drives, because the electrical motor data do not allow to compute the dynamic torque load cycles, which are causing wear and fatigue.
- A general description of the load situation of the twin drive by the standard rolling process
- Classify torque in order to obtain representative load collectives
- Identify and analyse special events, i.e. overload situations and torsional vibrations
- Determine the natural frequency of the drive train
- Identification of representative rolling processes for further evaluation of the universal joint bearing and fatigue life -time
- Work out recommendations for optimising the rolling process for a consistent torque input, to min imise bite impact and to reduce the risk of overload disasters
In the following the measurements and the analyses results are presented.
ACIDA GmbH Tel.: +49 (0)2407 5638.0 www.acida.net Kaiserstraße 100, D-52134 Herzogenrath Fax.: +49 (0)2407 5638.28 [email protected]
14 October 2004 Musterbericht - ACIDA Torque Measurement Services by ACIDA GmbH Page 4
1 Measuring devices and data acquisition
1.1 Strain gauge based torque measurement
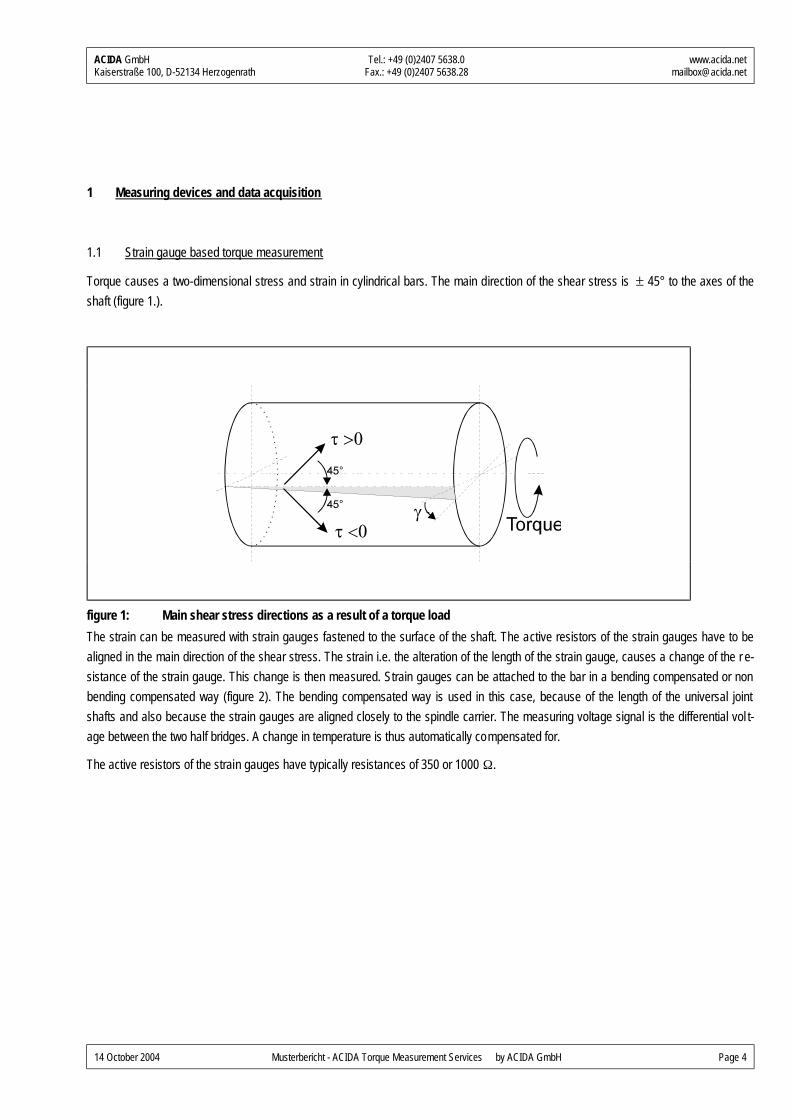
Torque causes a two-dimensional stress and strain in cylindrical bars. The main direction of the shear stress is ± 45° to the axes of the shaft (figure 1.).
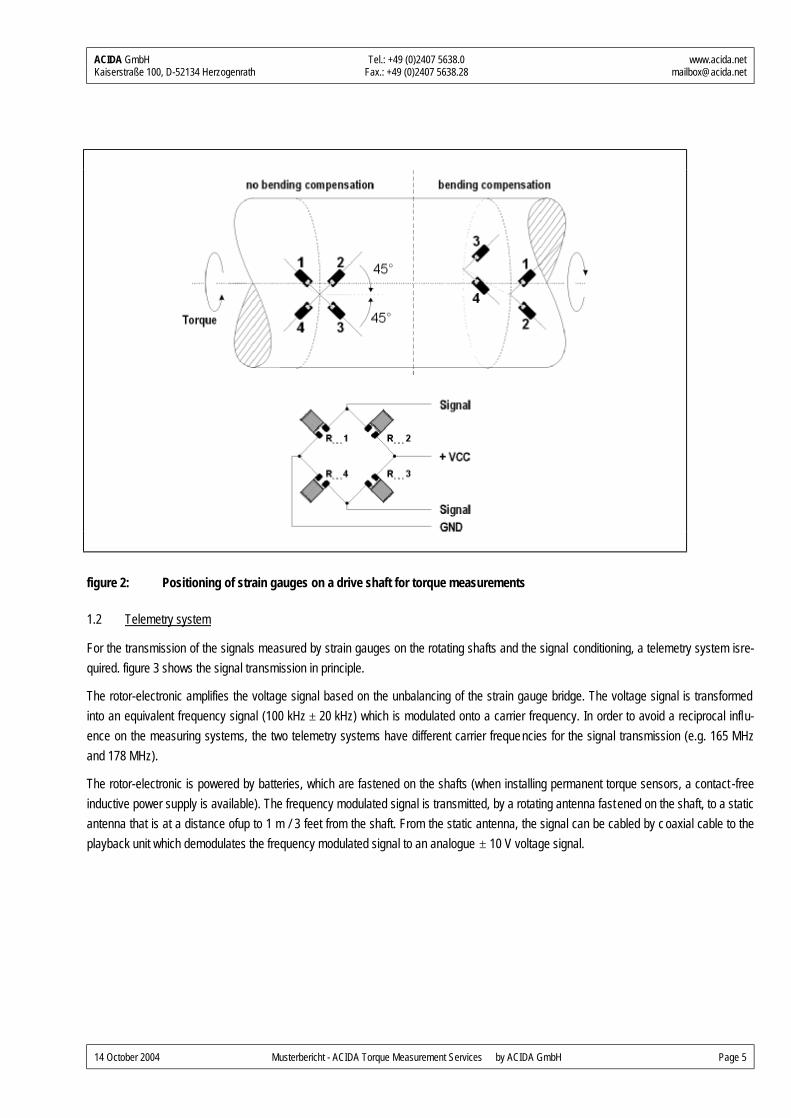
figure 1: Main shear stress directions as a result of a torque load The strain can be measured with strain gauges fastened to the surface of the shaft. The active resistors of the strain gauges have to be aligned in the main direction of the shear stress. The strain i.e. the alteration of the length of the strain gauge, causes a change of the r e-sistance of the strain gauge. This change is then measured. Strain gauges can be attached to the bar in a bending compensated or non bending compensated way (figure 2). The bending compensated way is used in this case, because of the length of the universal joint shafts and also because the strain gauges are aligned closely to the spindle carrier. The measuring voltage signal is the differential vol t-age between the two half bridges. A change in temperature is thus automatically compensated for.
The active resistors of the strain gauges have typically resistances of 350 or 1000 Ω.
ACIDA GmbH Tel.: +49 (0)2407 5638.0 www.acida.net Kaiserstraße 100, D-52134 Herzogenrath Fax.: +49 (0)2407 5638.28 [email protected]
14 October 2004 Musterbericht - ACIDA Torque Measurement Services by ACIDA GmbH Page 5
figure 2: Positioning of strain gauges on a drive shaft for torque measurements
1.2 Telemetry system
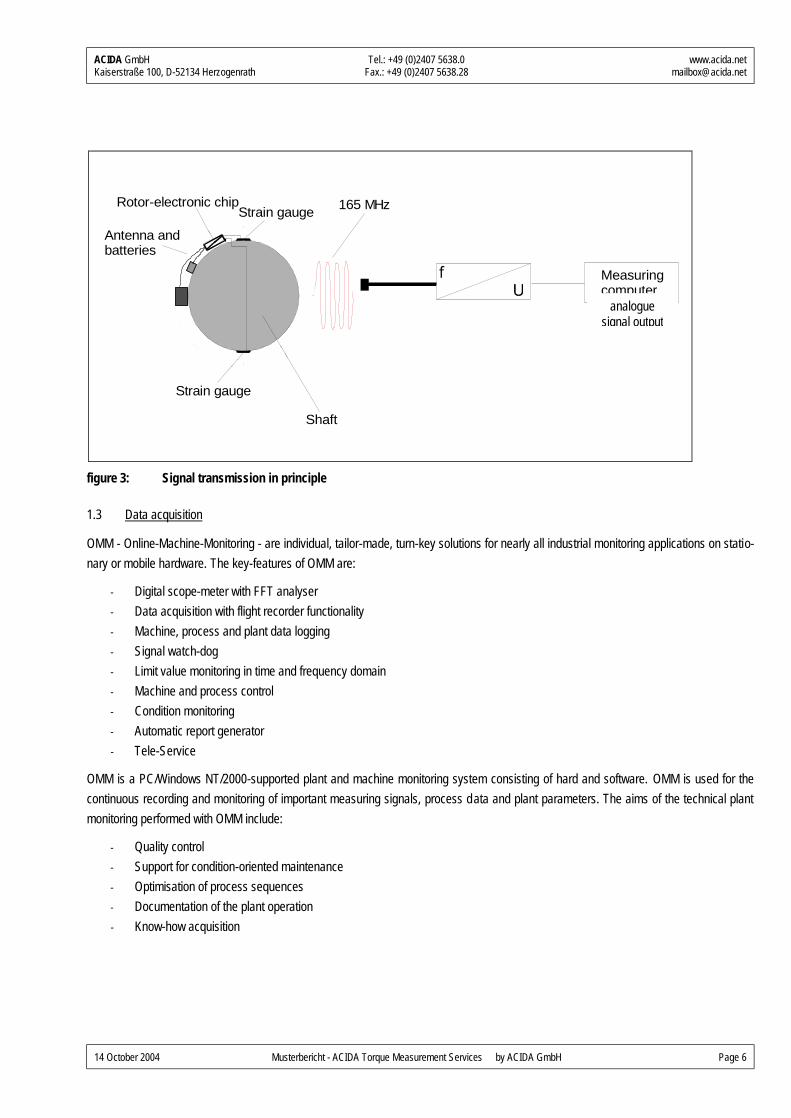
For the transmission of the signals measured by strain gauges on the rotating shafts and the signal conditioning, a telemetry system isre-quired. figure 3 shows the signal transmission in principle.
The rotor-electronic amplifies the voltage signal based on the unbalancing of the strain gauge bridge. The voltage signal is transformed into an equivalent frequency signal (100 kHz ± 20 kHz) which is modulated onto a carrier frequency. In order to avoid a reciprocal influ-ence on the measuring systems, the two telemetry systems have different carrier frequencies for the signal transmission (e.g. 165 MHz and 178 MHz).
The rotor-electronic is powered by batteries, which are fastened on the shafts (when installing permanent torque sensors, a contact -free inductive power supply is available). The frequency modulated signal is transmitted, by a rotating antenna fastened on the shaft, to a static antenna that is at a distance ofup to 1 m / 3 feet from the shaft. From the static antenna, the signal can be cabled by c oaxial cable to the playback unit which demodulates the frequency modulated signal to an analogue ± 10 V voltage signal.
ACIDA GmbH Tel.: +49 (0)2407 5638.0 www.acida.net Kaiserstraße 100, D-52134 Herzogenrath Fax.: +49 (0)2407 5638.28 [email protected]
14 October 2004 Musterbericht - ACIDA Torque Measurement Services by ACIDA GmbH Page 6
figure 3: Signal transmission in principle
1.3 Data acquisition
OMM - Online-Machine-Monitoring - are individual, tailor-made, turn-key solutions for nearly all industrial monitoring applications on statio-nary or mobile hardware. The key-features of OMM are:
- Digital scope-meter with FFT analyser - Data acquisition with flight recorder functionality - Machine, process and plant data logging - Signal watch-dog - Limit value monitoring in time and frequency domain - Machine and process control - Condition monitoring - Automatic report generator - Tele-Service
OMM is a PC/Windows NT/2000-supported plant and machine monitoring system consisting of hard and software. OMM is used for the continuous recording and monitoring of important measuring signals, process data and plant parameters. The aims of the technical plant monitoring performed with OMM include:
- Quality control - Support for condition-oriented maintenance - Optimisation of process sequences - Documentation of the plant operation - Know-how acquisition
165 MhzHH
Strain gauge
Strain gaugeRotor-electronic chip
Measuringcomputer
Antenna andbatteries
Shaft
analogue signal output
ACIDA GmbH Tel.: +49 (0)2407 5638.0 www.acida.net Kaiserstraße 100, D-52134 Herzogenrath Fax.: +49 (0)2407 5638.28 [email protected]
14 October 2004 Musterbericht - ACIDA Torque Measurement Services by ACIDA GmbH Page 7
OMM hereby records measured data and plant signals, for example torques, forces, vibrations, temperatures or speeds, online and cont i-nuously, i.e. completely and in real time. The data can either be connected as analogue signals to the OMM data recording boards or al-ternatively transmitted digitally. The number of the measuring channels is almost unlimited. The data is evaluated with automatic monit o-ring functions and ingenious algorithms.
All information is stored in an SQL database with the advantages of high data security and flexibility. The software uses the network func-tions of the operating system Windows NT/2000. Computer networking, telediagnosis and teleservice are standard modules of the monit o-ring system, whether within a works or world-wide by means of modem, GSM, ISDN or Internet.
The system can be integrated directly in clients' networks with the aid of standardised interfaces (e.g. TCP/IP); this has the advantage that the system and data can be accessed throughout the works. If the OMM is in network with the plant or process control computer, the rea-dings can be archived in the OMM database relative to processes or products, e.g. according to the product -ID or material numbers, for correlation and trend analyses. Readings or characteristics can also be sent to the process control computer from OMM by means of such an interface. An interface programming in OMM and the process control computer should be carried out to realise a corresponding data exchange, e.g. by TCP/IP telegram. The core functionalities of OMM are:
- On and offline visualisation of all signals and data - Online frequency analysis (FFT) with cascade representation - Limit monitoring in the time domain and tolerance characteristics/frequency band monitoring and frequency d omain - Online classification of load collectives (class boundary transgression method and Rainflow/HCM) - Online remaining life estimation - Complete storage of all signal-time curves, subdivided into periods of time of a defined duration - Alternative or additional: process cycle-related signal storage; plant idling is hereby ignored - Cascaded parameter generation (e.g. peak/mean values, TAF, signal variance) - Indexing of signal characteristics to for fast date search (data mining) - Storage of all characteristics with signal file reference in an SQL database with browser function - Product-related characteristics and signal storage if networked with the plant/process control computer - Generation of product or process-related trend curves - 100% networkability with works-internal and world-wide data access: Teleservice
The above describes the features of a full-scale OMM-system.
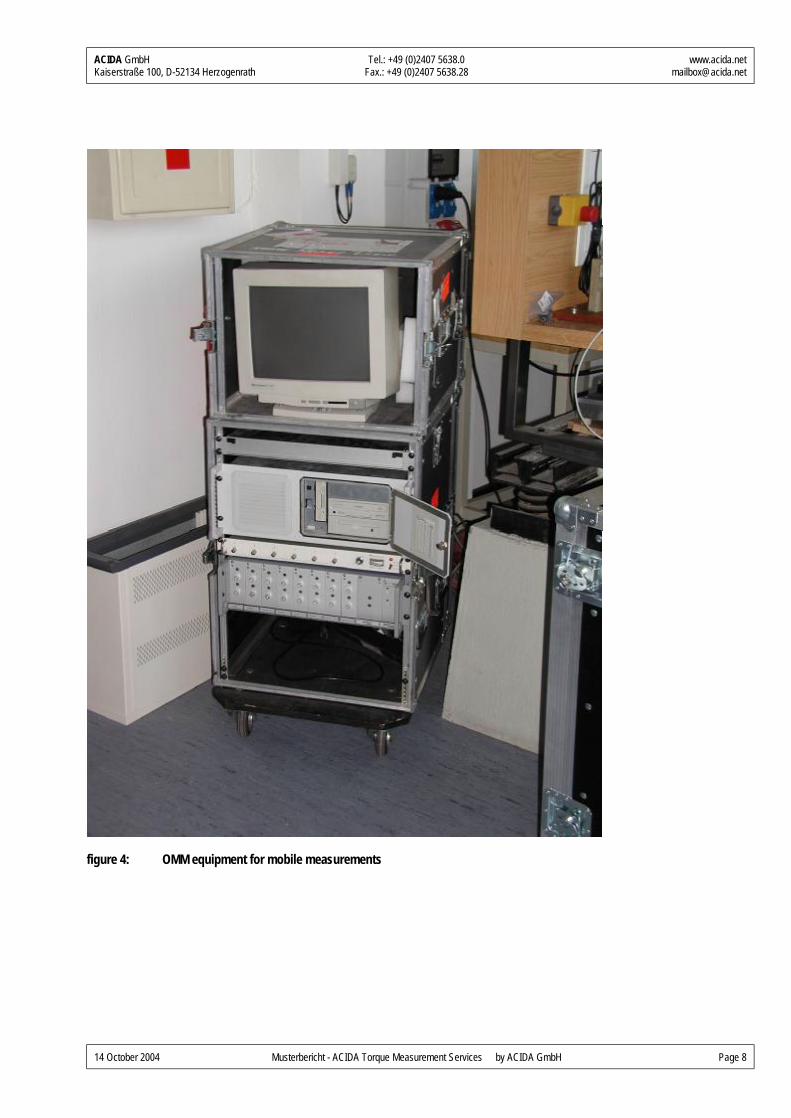
For temporary measurements ACIDA uses mobile versions of the OMM system (s. figure 4) for online, continuous data acquisition and offline signal analysis.
ACIDA GmbH Tel.: +49 (0)2407 5638.0 www.acida.net Kaiserstraße 100, D-52134 Herzogenrath Fax.: +49 (0)2407 5638.28 [email protected]
14 October 2004 Musterbericht - ACIDA Torque Measurement Services by ACIDA GmbH Page 8
figure 4: OMM equipment for mobile measurements
ACIDA GmbH Tel.: +49 (0)2407 5638.0 www.acida.net Kaiserstraße 100, D-52134 Herzogenrath Fax.: +49 (0)2407 5638.28 [email protected]
14 October 2004 Musterbericht - ACIDA Torque Measurement Services by ACIDA GmbH Page 9
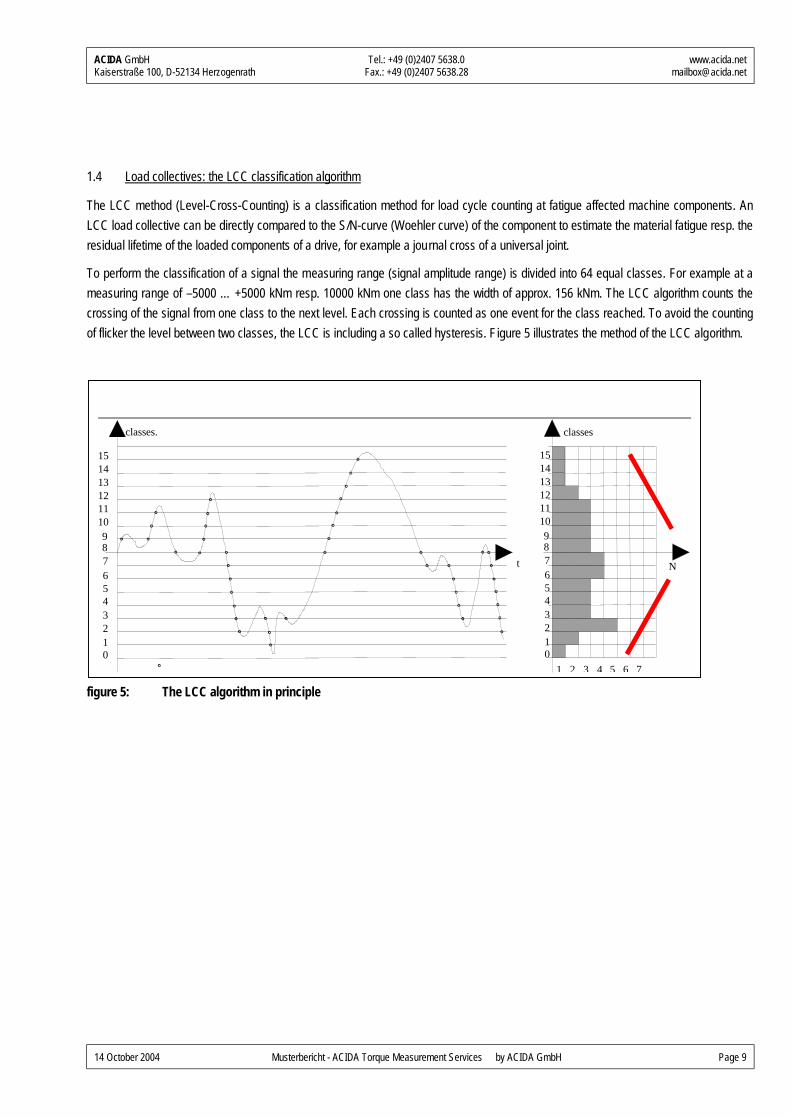
1.4 Load collectives: the LCC classification algorithm
The LCC method (Level-Cross-Counting) is a classification method for load cycle counting at fatigue affected machine components. An LCC load collective can be directly compared to the S/N-curve (Woehler curve) of the component to estimate the material fatigue resp. the residual lifetime of the loaded components of a drive, for example a journal cross of a universal joint.
To perform the classification of a signal the measuring range (signal amplitude range) is divided into 64 equal classes. For example at a measuring range of –5000 … +5000 kNm resp. 10000 kNm one class has the width of approx. 156 kNm. The LCC algorithm counts the crossing of the signal from one class to the next level. Each crossing is counted as one event for the class reached. To avoid the counting of flicker the level between two classes, the LCC is including a so called hysteresis. Figure 5 illustrates the method of the LCC algorithm.
figure 5: The LCC algorithm in principle
t
classes.
123456789
101112131415
0
classes
123456789
101112131415
0
N
1 2 3 4 5 6 7
ACIDA GmbH Tel.: +49 (0)2407 5638.0 www.acida.net Kaiserstraße 100, D-52134 Herzogenrath Fax.: +49 (0)2407 5638.28 [email protected]
14 October 2004 Musterbericht - ACIDA Torque Measurement Services by ACIDA GmbH Page 10
2 Configuration of the measurements
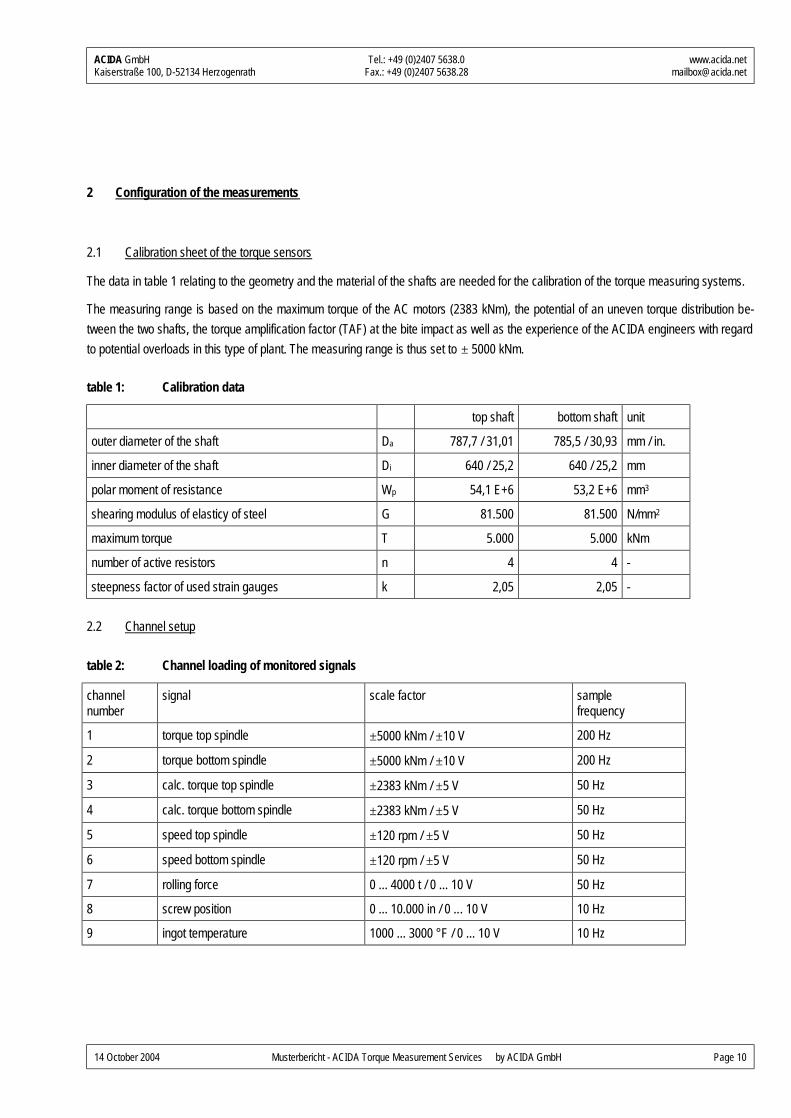
2.1 Calibration sheet of the torque sensors
The data in table 1 relating to the geometry and the material of the shafts are needed for the calibration of the torque measuring systems.
The measuring range is based on the maximum torque of the AC motors (2383 kNm), the potential of an uneven torque distribution be-tween the two shafts, the torque amplification factor (TAF) at the bite impact as well as the experience of the ACIDA engineers with regard to potential overloads in this type of plant. The measuring range is thus set to ± 5000 kNm.
table 1: Calibration data
top shaft bottom shaft unit
outer diameter of the shaft Da 787,7 / 31,01 785,5 / 30,93 mm / in.
inner diameter of the shaft Di 640 / 25,2 640 / 25,2 mm
polar moment of resistance Wp 54,1 E+6 53,2 E+6 mm3
shearing modulus of elasticy of steel G 81.500 81.500 N/mm2
maximum torque T 5.000 5.000 kNm
number of active resistors n 4 4 -
steepness factor of used strain gauges k 2,05 2,05 -
2.2 Channel setup
table 2: Channel loading of monitored signals
channel number
signal scale factor sample frequency
1 torque top spindle ±5000 kNm / ±10 V 200 Hz
2 torque bottom spindle ±5000 kNm / ±10 V 200 Hz
3 calc. torque top spindle ±2383 kNm / ±5 V 50 Hz
4 calc. torque bottom spindle ±2383 kNm / ±5 V 50 Hz
5 speed top spindle ±120 rpm / ±5 V 50 Hz
6 speed bottom spindle ±120 rpm / ±5 V 50 Hz
7 rolling force 0 ... 4000 t / 0 ... 10 V 50 Hz
8 screw position 0 ... 10.000 in / 0 ... 10 V 10 Hz
9 ingot temperature 1000 ... 3000 °F / 0 ... 10 V 10 Hz
ACIDA GmbH Tel.: +49 (0)2407 5638.0 www.acida.net Kaiserstraße 100, D-52134 Herzogenrath Fax.: +49 (0)2407 5638.28 [email protected]
14 October 2004 Musterbericht - ACIDA Torque Measurement Services by ACIDA GmbH Page 11
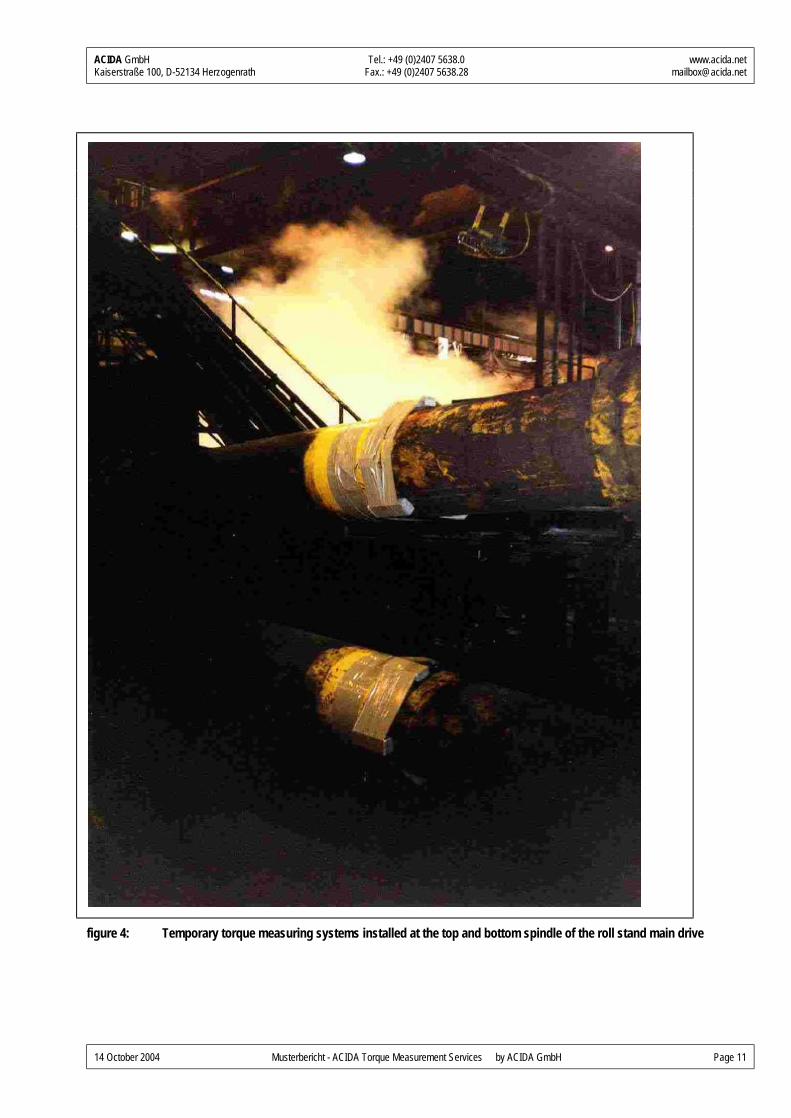
figure 4: Temporary torque measuring systems installed at the top and bottom spindle of the roll stand main drive
ACIDA GmbH Tel.: +49 (0)2407 5638.0 www.acida.net Kaiserstraße 100, D-52134 Herzogenrath Fax.: +49 (0)2407 5638.28 [email protected]
14 October 2004 Musterbericht - ACIDA Torque Measurement Services by ACIDA GmbH Page 12
3 Results
This chapter gives a general overview of the measured signals by showing the signals corresponding to the regular rolling process. The basic values for the bearing lifetime evaluation as well as regular / standard drive load situations are discussed. The load collectives of the measuring period which are calculated based on the time signals are shown. Finally, some overload or special events during rolling opera-tion are analysed.
3.1 Regular rolling processes and characteristiv values for bearing lifetime evaluation
The rolled alloys are divided in so-called XYZ ranges. The whole production range constitutes fourteen XYZ ranges. For the evaluation the alloy with the highest production tonnage of the year 2000 represents the corresponding XYZ range. The XYZ ranges making up a high proportion of the annual production (like XYZ range 0.40-0.49: 41.4%, 0.3-0.39: 17.1% and so on) are not just represented by one alloy but rather two or three, in order to achieve improved statistic reliability.
Unfortunately the alloys of the XYZ ranges >=1.0 and DuraTEC are not rolled in the measuring period. Therefore these two ranges cannot be taken into account. The XYZ range 0.1-0.19 is not represented by alloy A01 which is the dominant product but by alloy A03 because alloy A01 is not rolled during the measuring period.
For the bearing lifetime calculation, the mean torque load and mean speed for each pass of each alloy, have to be calculated. The time signals of torque and speed for each chosen alloy are shown in the appendix. Furthermore the mean value of torque and speed are listed in tables in the appendix. Based on this data, a representative mean value of torque and speed for the annual production mix can be ca l-culated and compared with the specific data regarding the used bearings in the knuckles. This evaluation is not part of this report.
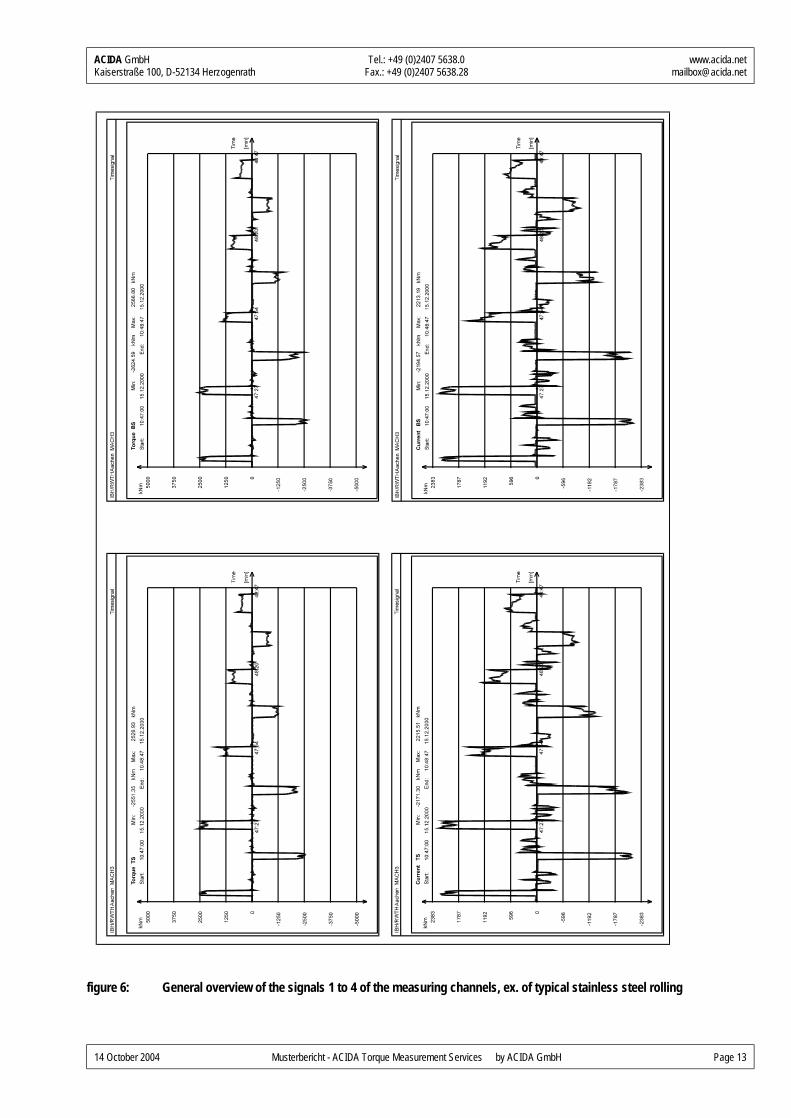
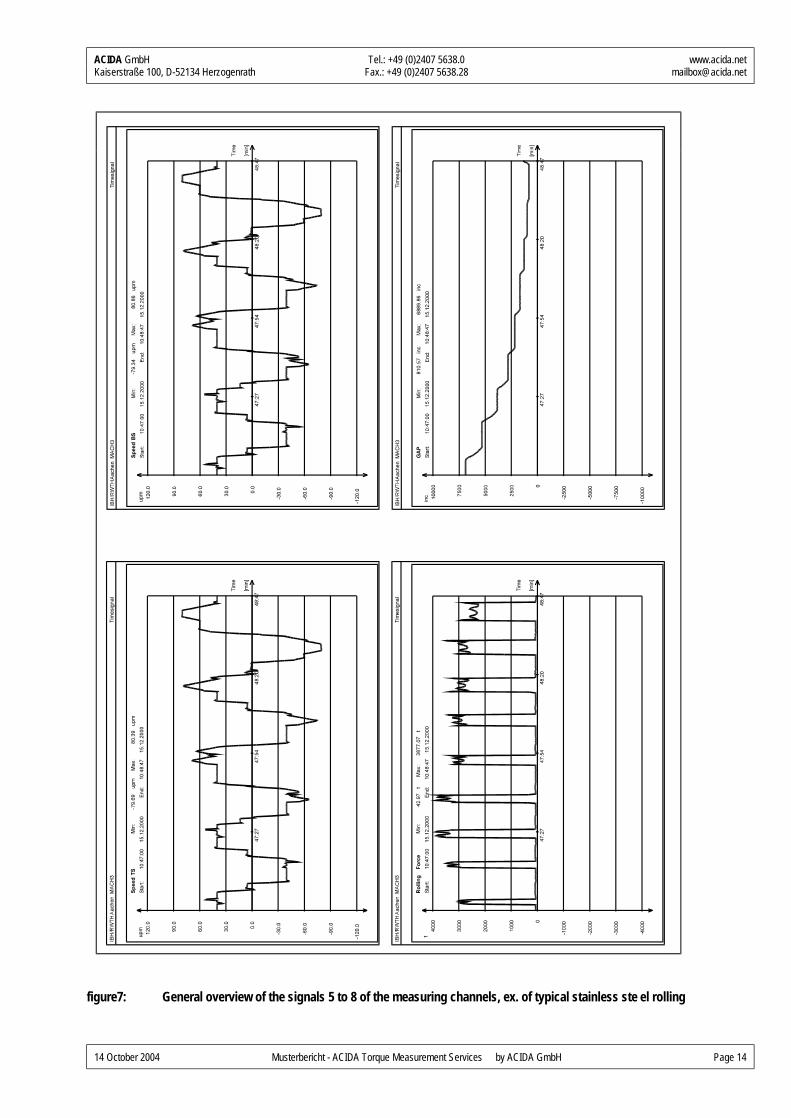
In figure 6 and 7 an example of a regular rolling process of stainless steel is illustrated by the measured and the monitored signals, except the temperature of the ingot (channel 9). It shows that torque signals based on motor currents and taken from the control system of the mill are lower than measured spindle torques. The difference is approximately 10 %.
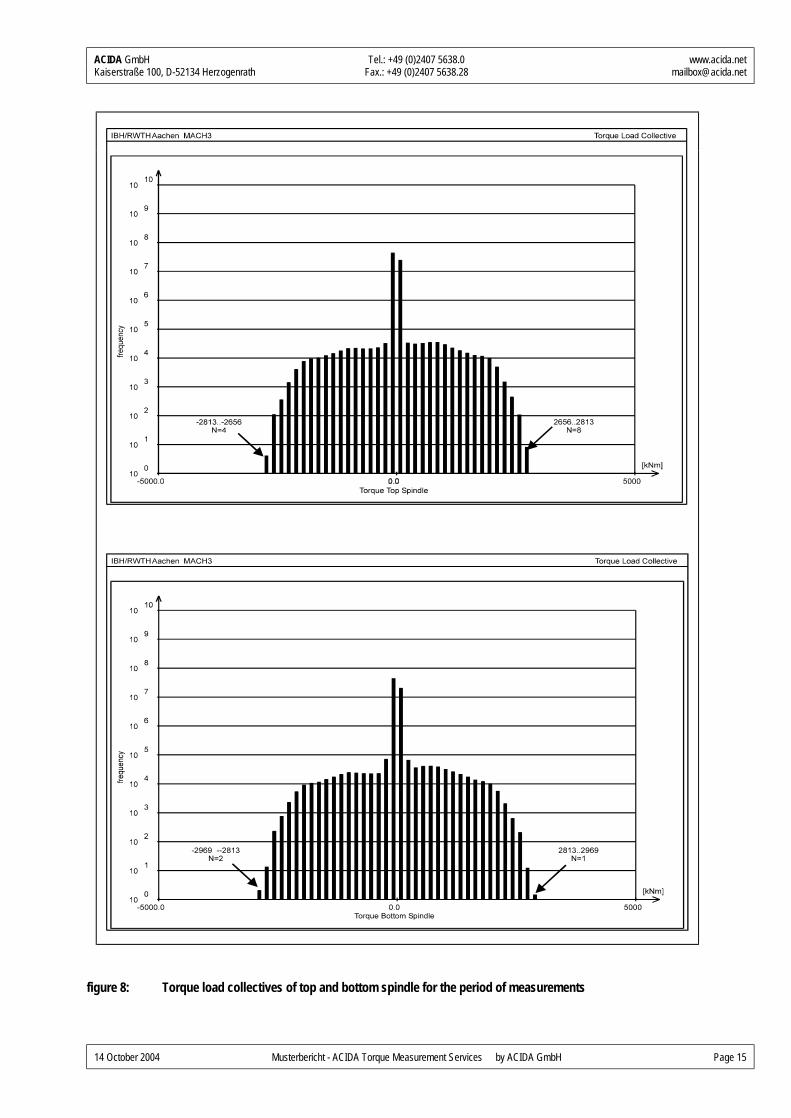
Figure 8 shows the torque load collective of top and bottom spindle during the measuring period indicating a good load split between top and bottom drive. The torque of the top spindle hits twelve times the class from 2656 kNm to 2813 kNm (both directions together). The torque load on the bottom spindle is slightly higher. The torque hits three times the class from 2813 kNm to 2969 kNm (also both directions together).
ACIDA GmbH Tel.: +49 (0)2407 5638.0 www.acida.net Kaiserstraße 100, D-52134 Herzogenrath Fax.: +49 (0)2407 5638.28 [email protected]
14 October 2004 Musterbericht - ACIDA Torque Measurement Services by ACIDA GmbH Page 13
figure 6: General overview of the signals 1 to 4 of the measuring channels, ex. of typical stainless steel rolling
ACIDA GmbH Tel.: +49 (0)2407 5638.0 www.acida.net Kaiserstraße 100, D-52134 Herzogenrath Fax.: +49 (0)2407 5638.28 [email protected]
14 October 2004 Musterbericht - ACIDA Torque Measurement Services by ACIDA GmbH Page 14
figure7: General overview of the signals 5 to 8 of the measuring channels, ex. of typical stainless ste el rolling
ACIDA GmbH Tel.: +49 (0)2407 5638.0 www.acida.net Kaiserstraße 100, D-52134 Herzogenrath Fax.: +49 (0)2407 5638.28 [email protected]
14 October 2004 Musterbericht - ACIDA Torque Measurement Services by ACIDA GmbH Page 15
figure 8: Torque load collectives of top and bottom spindle for the period of measurements
ACIDA GmbH Tel.: +49 (0)2407 5638.0 www.acida.net Kaiserstraße 100, D-52134 Herzogenrath Fax.: +49 (0)2407 5638.28 [email protected]
14 October 2004 Musterbericht - ACIDA Torque Measurement Services by ACIDA GmbH Page 16
3.2 Overlaod situations and special events
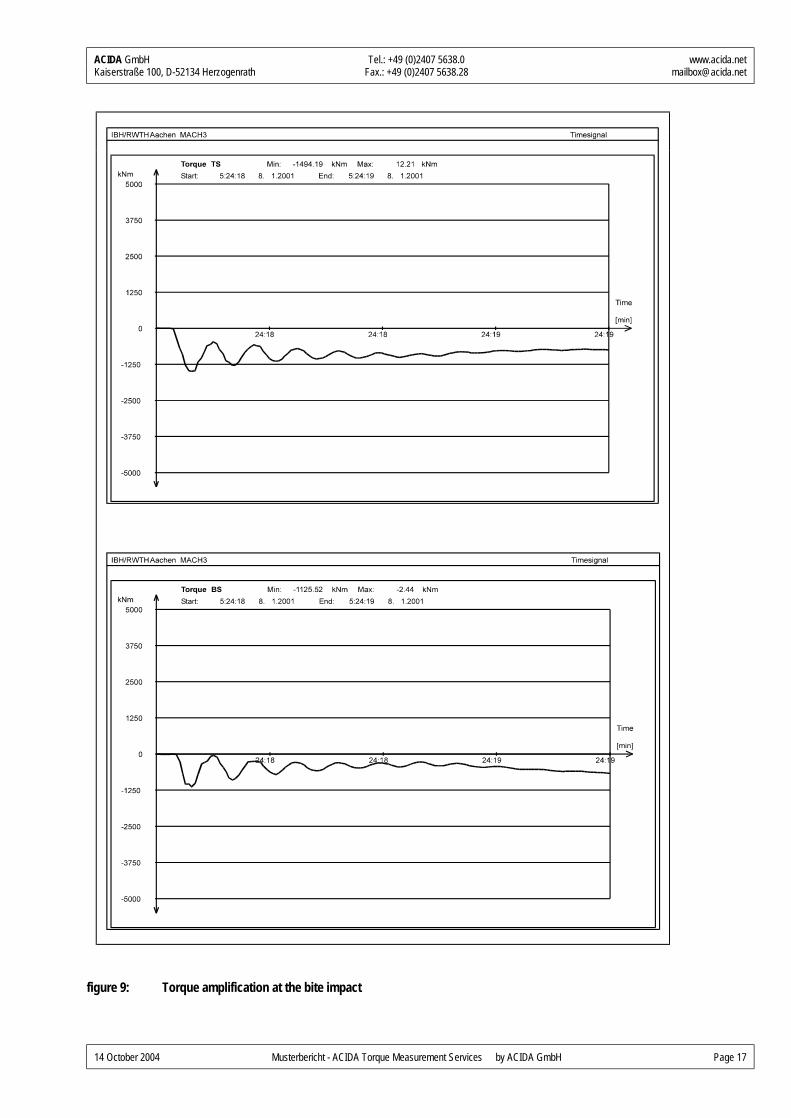
In this chapter some special events, e.g. toque overload situations are illustrated. Figure 9 shows a torsional vibration which occurs at the begining of a pass.
The relation between the peak torque value at the bite impact and the mean torque value during steady rolling is d escribed by the torque amplification factor (TAF). The TAF is only noteworthy at the last passes of a plate, because then the entry speed is higher than during the three passes. At the mill of Rolled Products Inc. the TAF does not exceed 2.3 and because of the low torque load during the later passes this values are classified as uncritical.
The first natural frequency of the drive train (i.e. the torsional vibration frequency) is approx. 14.5 Hz.
The signal records of the events which are shown in the following figures are more remarkable:
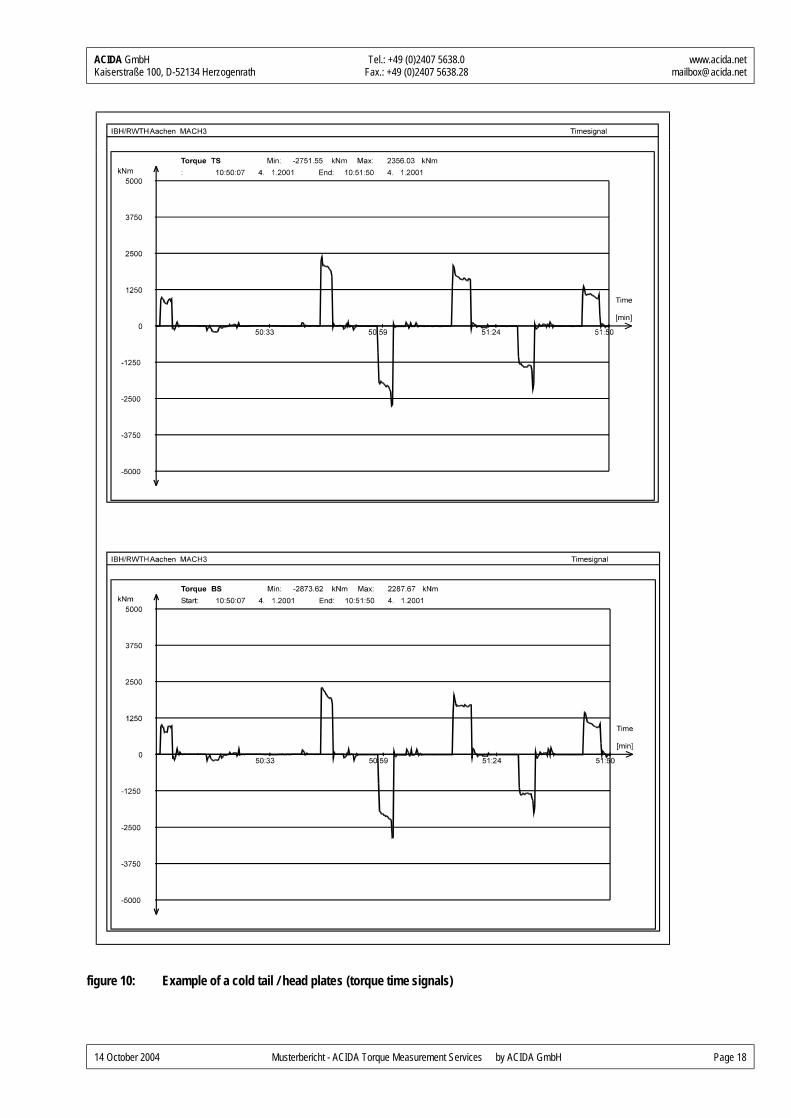
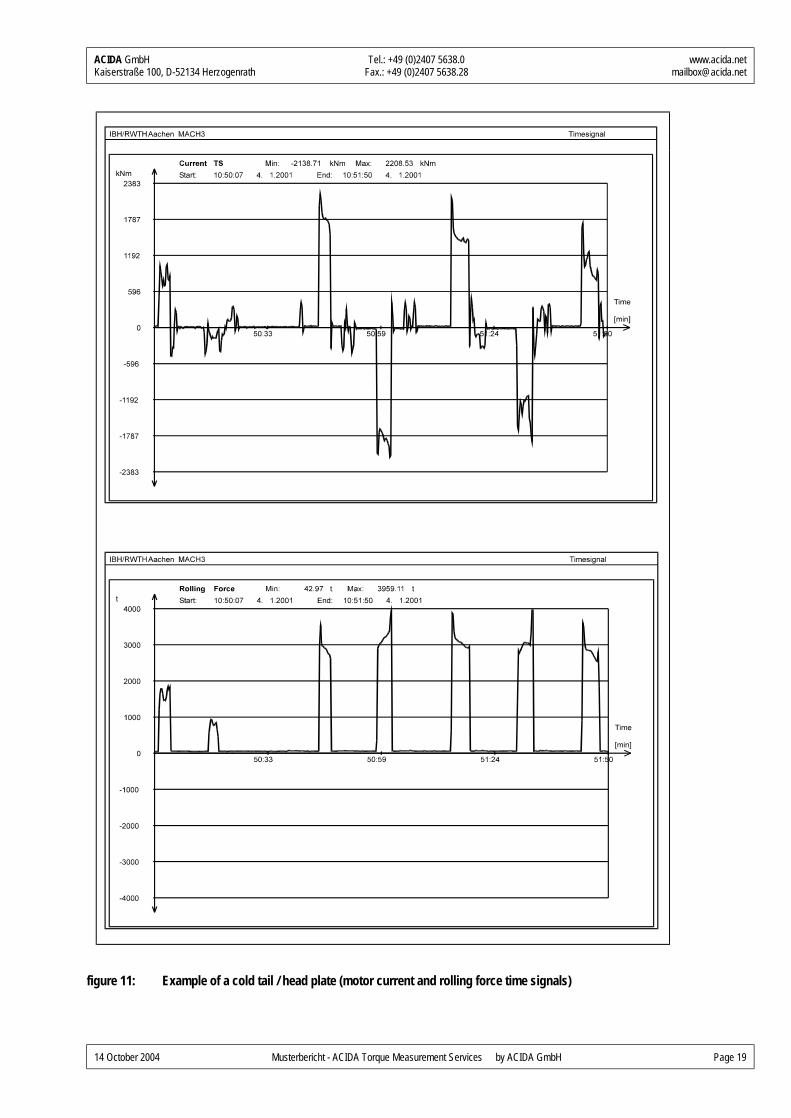
- Figure 10 shows a changing increase of the torque load from head to tail and back. This characteristic can also be seen in the rolling force signal (figure 11). The reason is probably the cold head of the ingot (uneven temperature distribution).
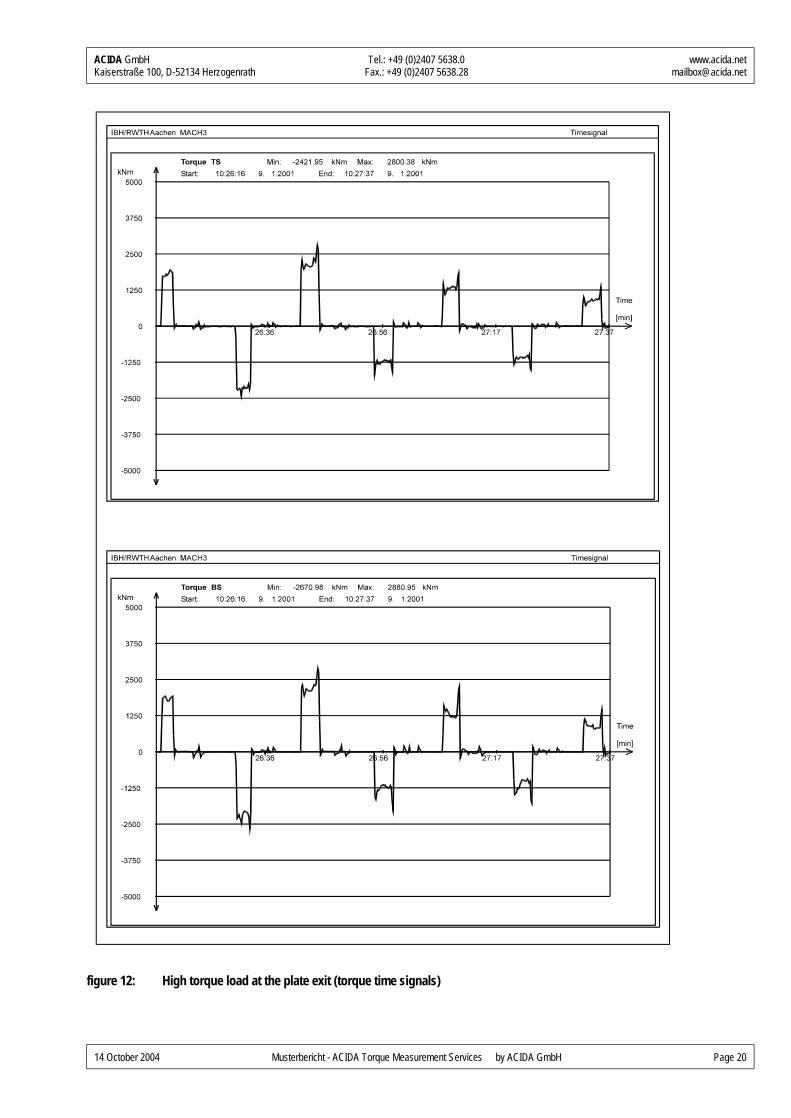
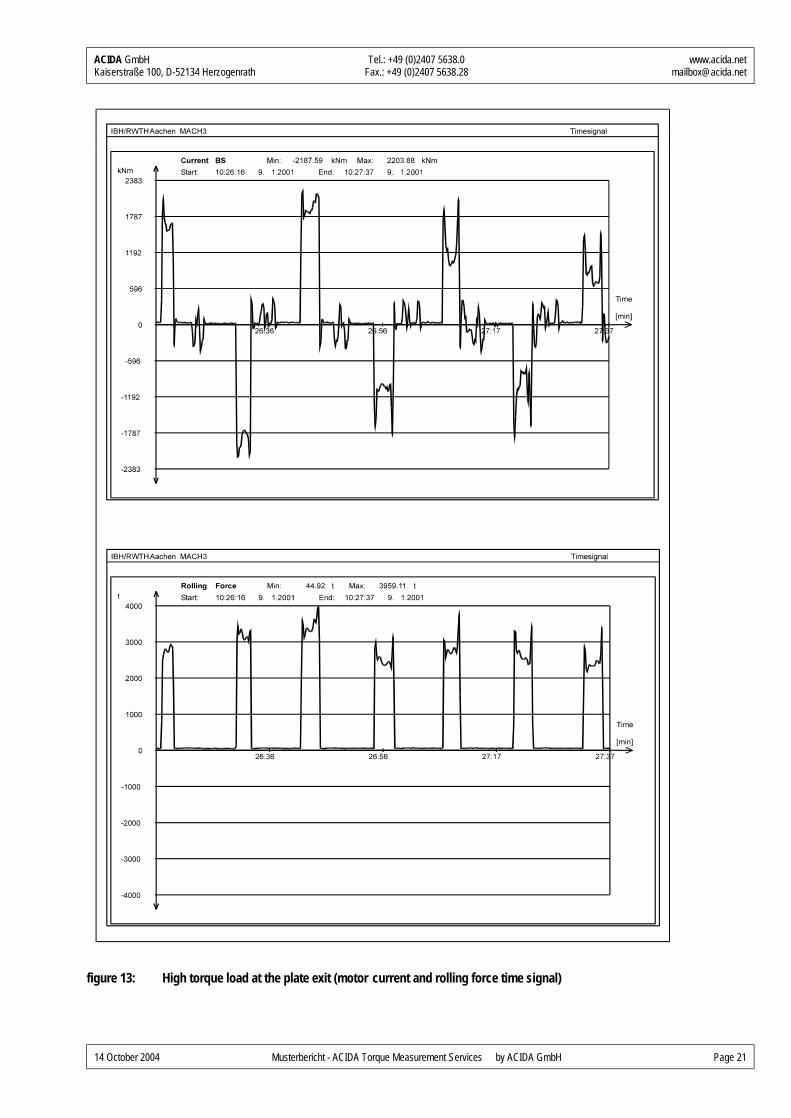
- Also the next example (figure 12 and 13) shows a significant increase of the torque load at the end of the passes. During some passes the torque load at the end of the pass is two times higher than during steady state rolling. At the end of the pass the i n-got is washed down with water for de-scaling. This cools down the ingot and increases the resistance to forming. This could be an explanation of the increase of the torque at the end of the pass.
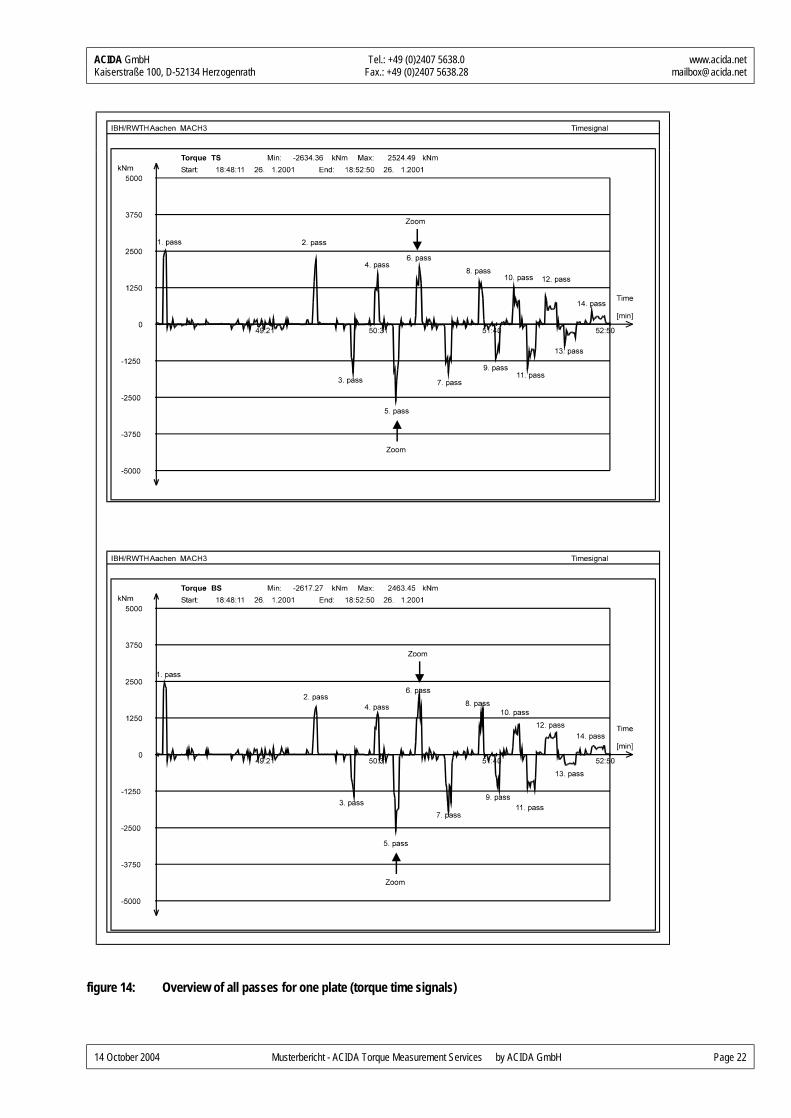
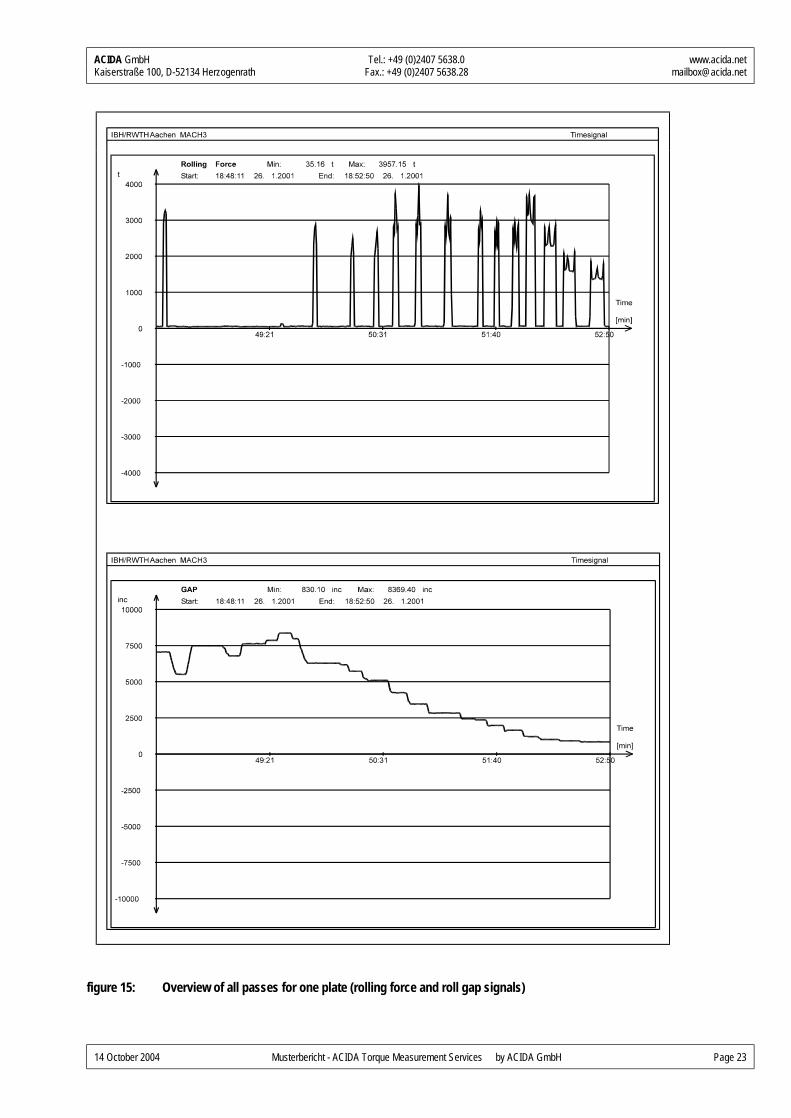
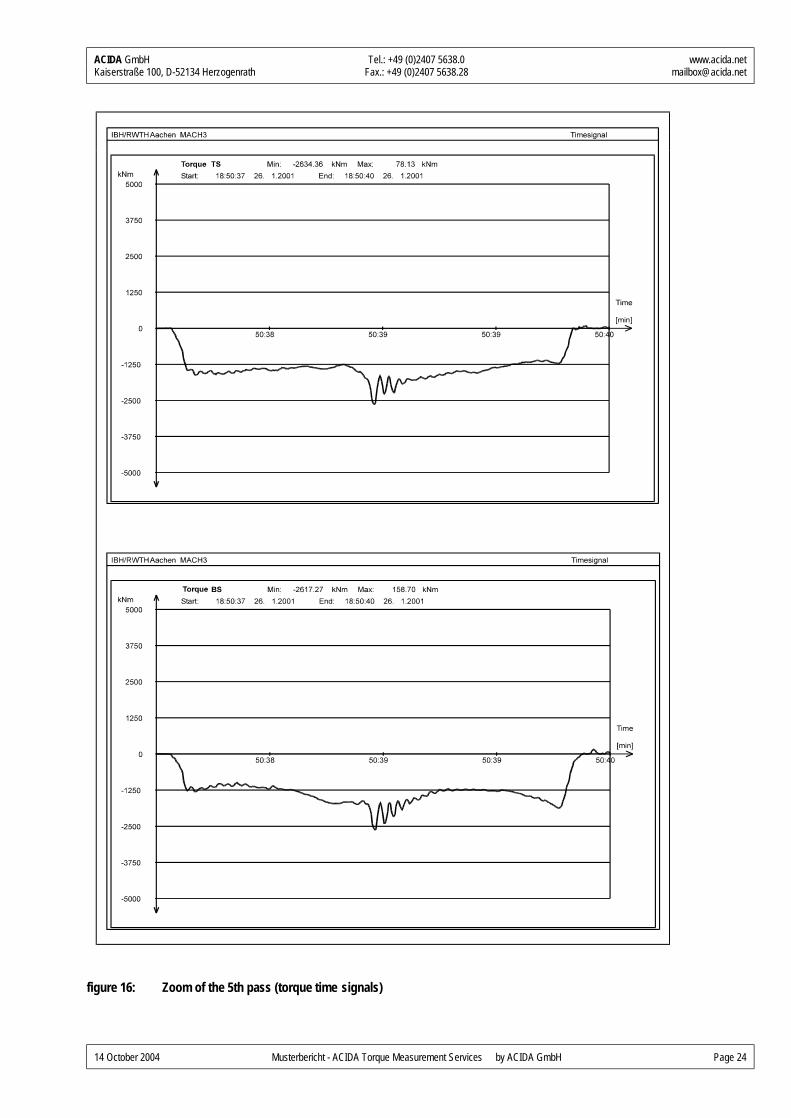
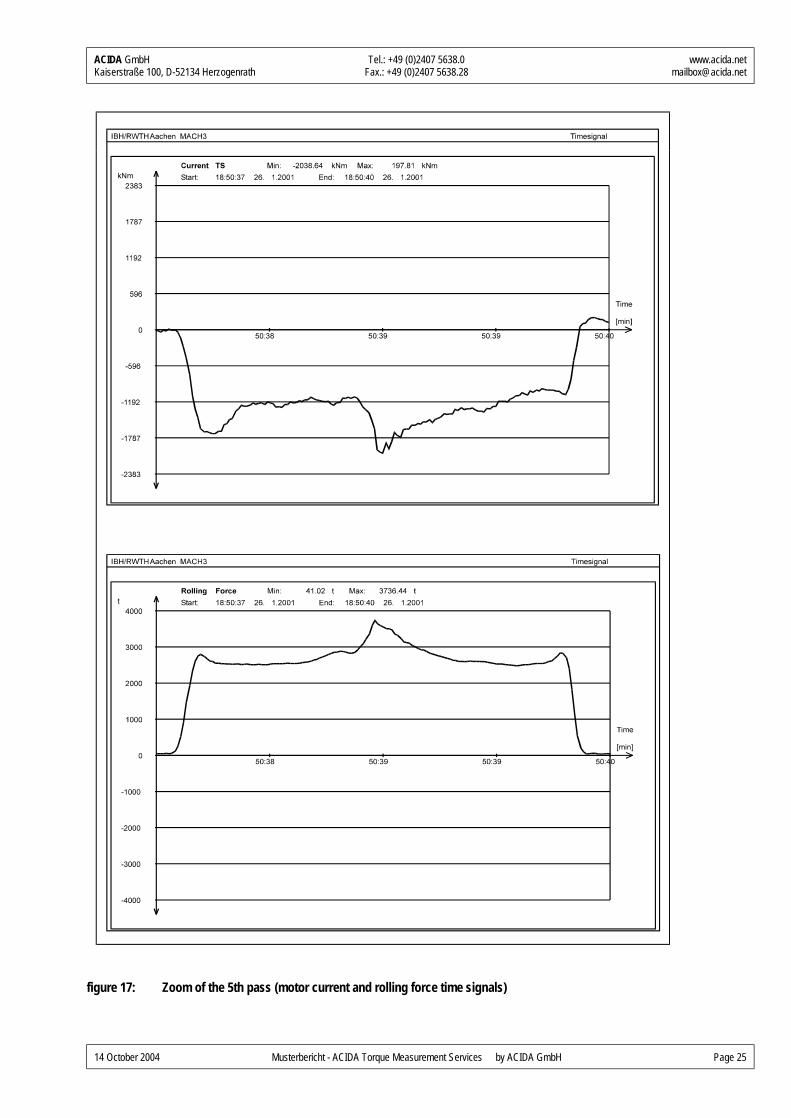
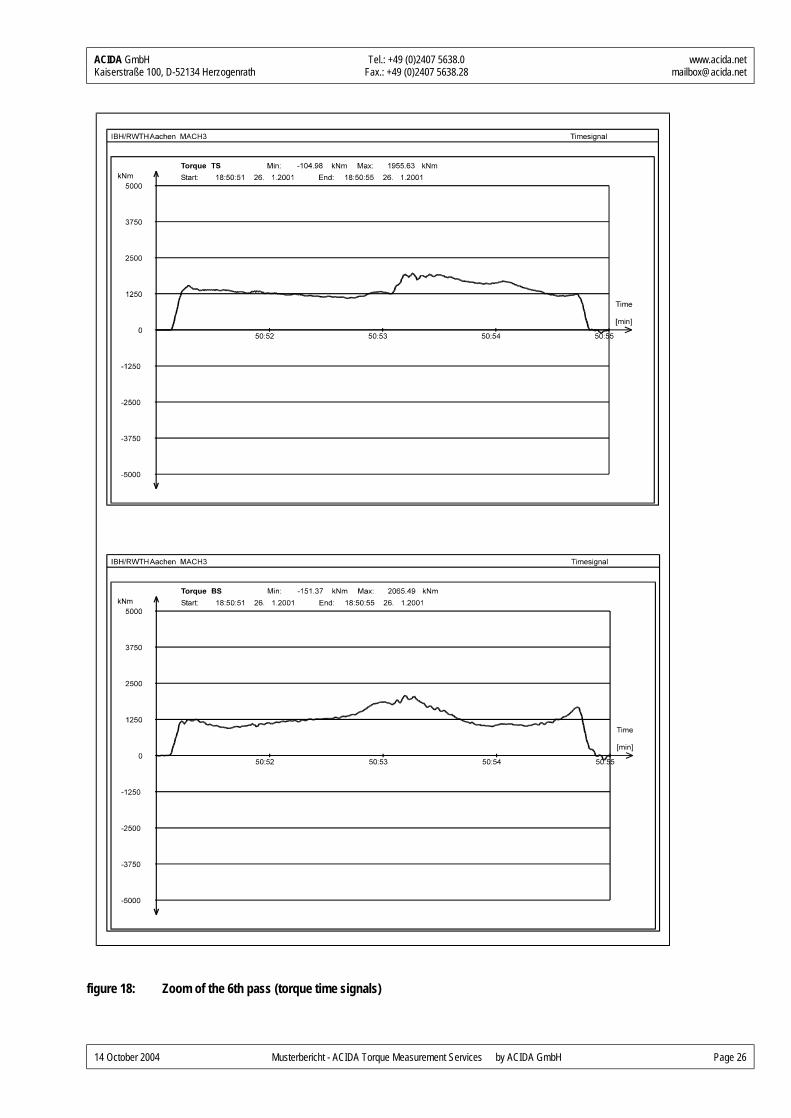
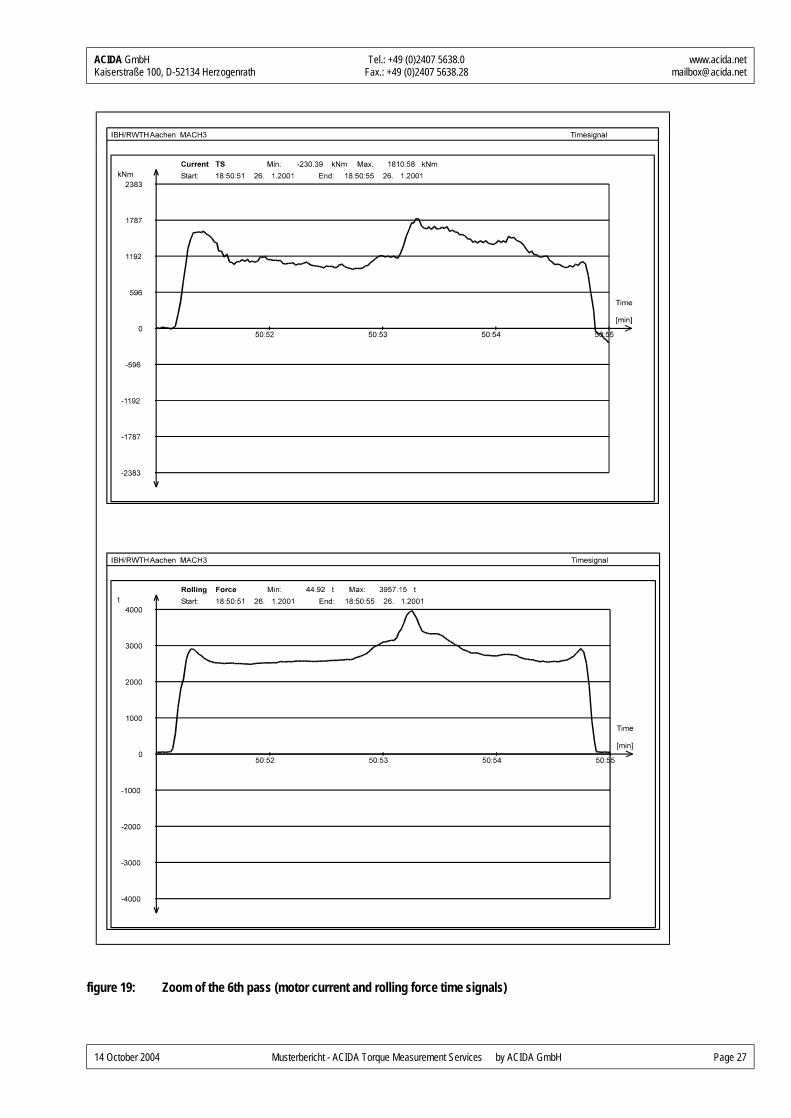
- In the examples shown in figures 14 to 19 the torque load increases in the middle of the pass very strongly. Especially in the zoom view of pass 5 this behavior is very obviously. It seems that the work rolls also slips on the surface of the ingot and cause as a result a torsional vibration. Reasons could be an uneven heating in the furnace or a thickness deviation of the plate.
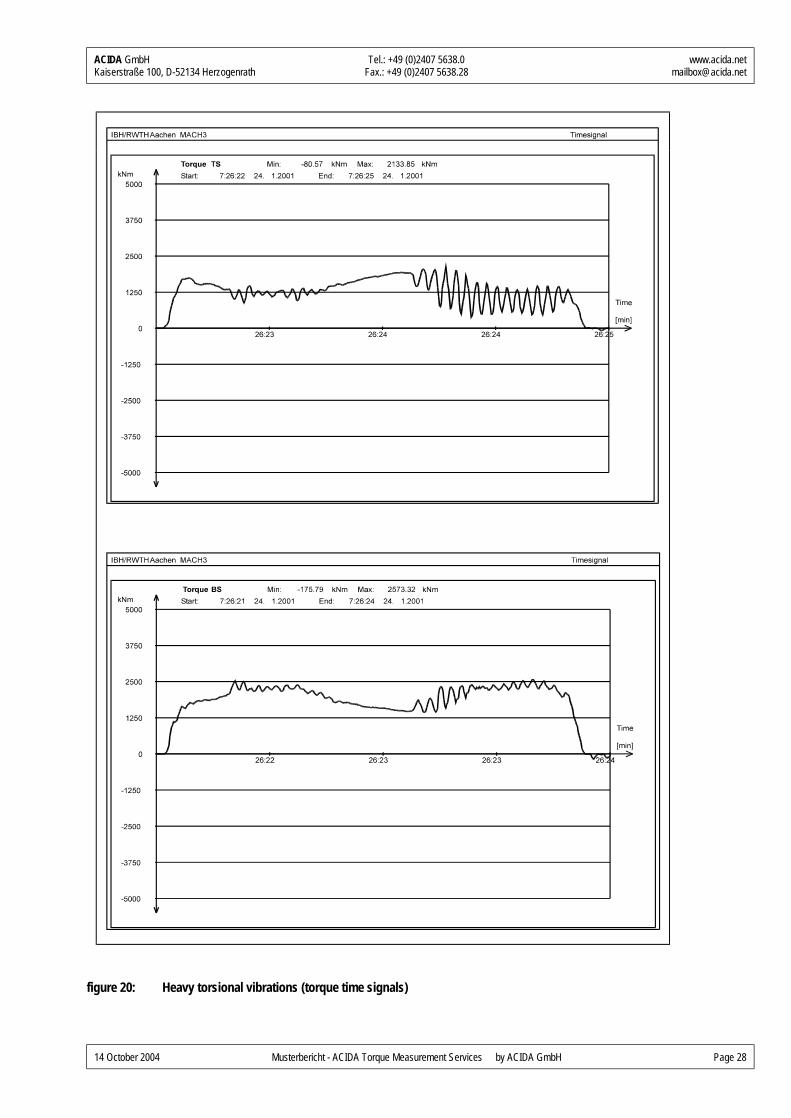
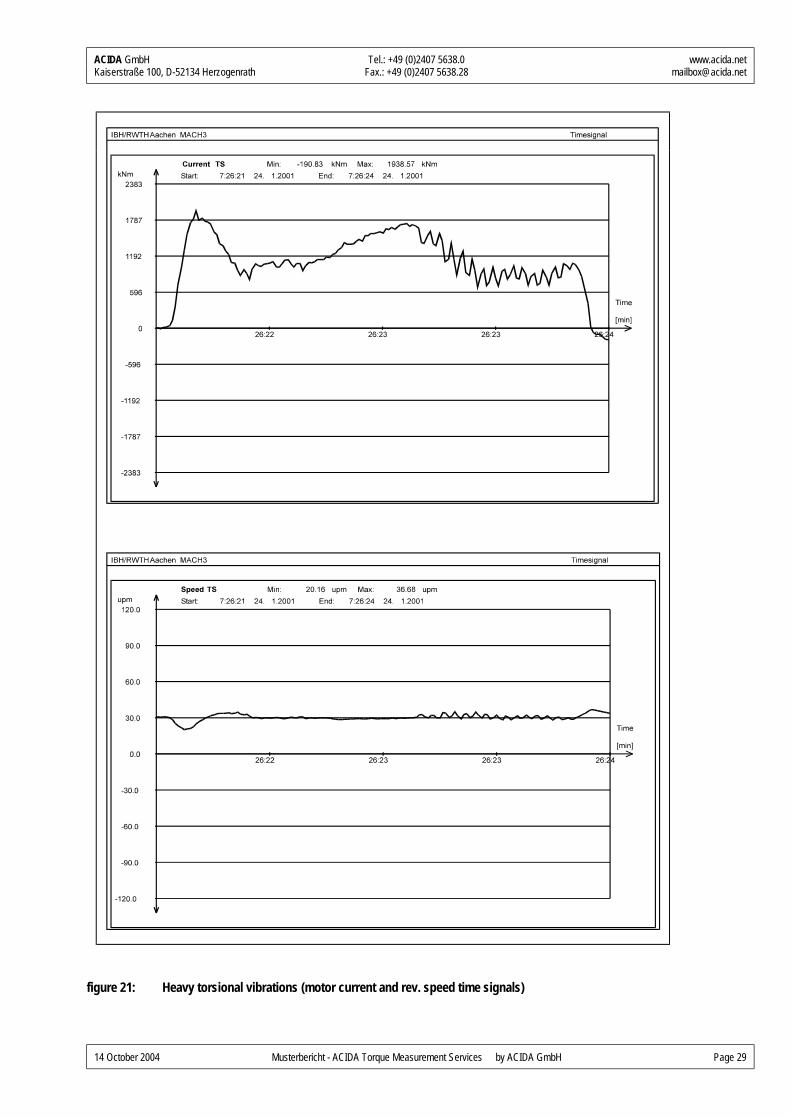
- Figure 20 and 21 show an additional example of a torsional vibration during the rolling process. The frequency corresponds to the first natural frequency of the drive train.
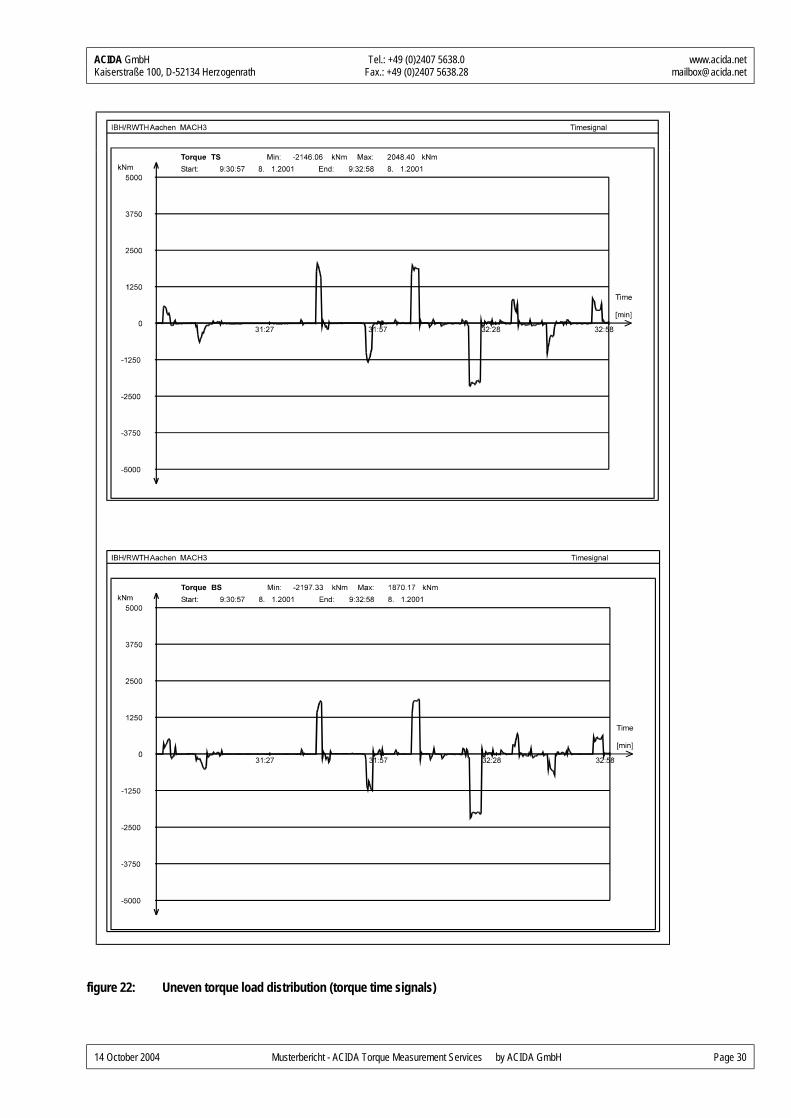
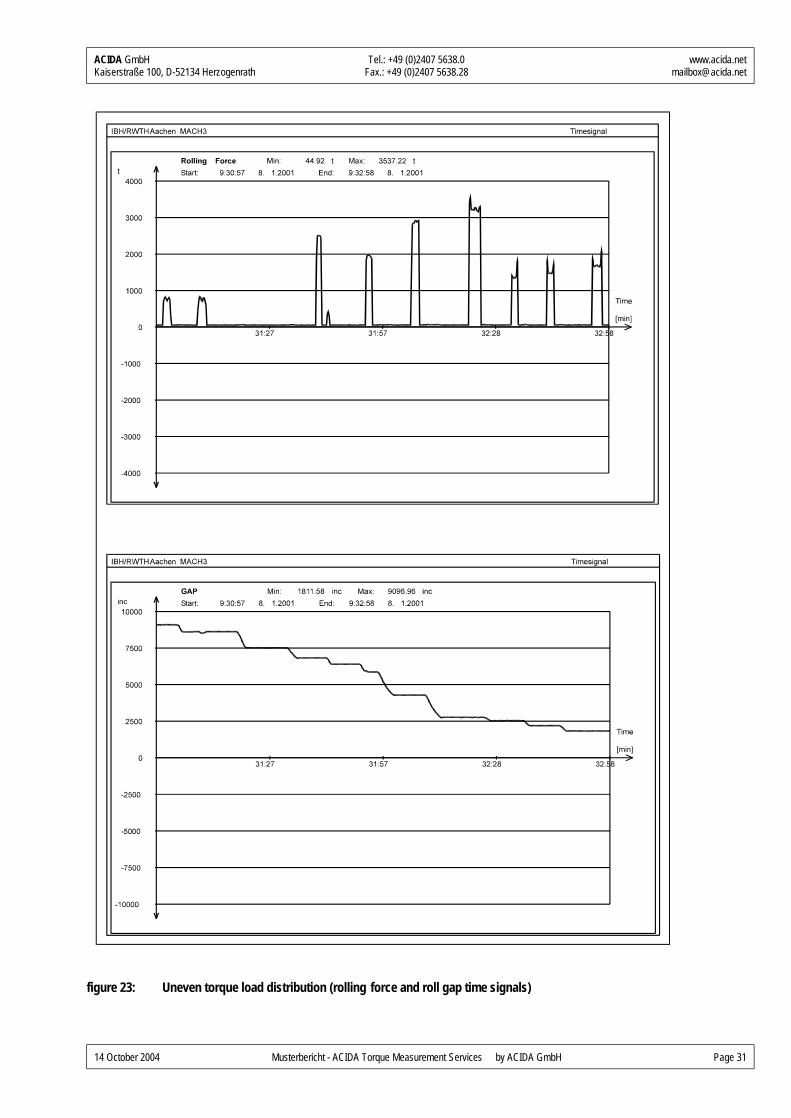
- The example shown in figure 22 illustrates an uneven torque load distribution between the to and the bottom roll. To prolong the lifetime of power transmission components a more even torque load for each pass has to be adjusted.
ACIDA GmbH Tel.: +49 (0)2407 5638.0 www.acida.net Kaiserstraße 100, D-52134 Herzogenrath Fax.: +49 (0)2407 5638.28 [email protected]
14 October 2004 Musterbericht - ACIDA Torque Measurement Services by ACIDA GmbH Page 17
figure 9: Torque amplification at the bite impact
ACIDA GmbH Tel.: +49 (0)2407 5638.0 www.acida.net Kaiserstraße 100, D-52134 Herzogenrath Fax.: +49 (0)2407 5638.28 [email protected]
14 October 2004 Musterbericht - ACIDA Torque Measurement Services by ACIDA GmbH Page 18
figure 10: Example of a cold tail / head plates (torque time signals)
ACIDA GmbH Tel.: +49 (0)2407 5638.0 www.acida.net Kaiserstraße 100, D-52134 Herzogenrath Fax.: +49 (0)2407 5638.28 [email protected]
14 October 2004 Musterbericht - ACIDA Torque Measurement Services by ACIDA GmbH Page 19
figure 11: Example of a cold tail / head plate (motor current and rolling force time signals)
ACIDA GmbH Tel.: +49 (0)2407 5638.0 www.acida.net Kaiserstraße 100, D-52134 Herzogenrath Fax.: +49 (0)2407 5638.28 [email protected]
14 October 2004 Musterbericht - ACIDA Torque Measurement Services by ACIDA GmbH Page 20
figure 12: High torque load at the plate exit (torque time signals)
ACIDA GmbH Tel.: +49 (0)2407 5638.0 www.acida.net Kaiserstraße 100, D-52134 Herzogenrath Fax.: +49 (0)2407 5638.28 [email protected]
14 October 2004 Musterbericht - ACIDA Torque Measurement Services by ACIDA GmbH Page 21
figure 13: High torque load at the plate exit (motor current and rolling force time signal)
ACIDA GmbH Tel.: +49 (0)2407 5638.0 www.acida.net Kaiserstraße 100, D-52134 Herzogenrath Fax.: +49 (0)2407 5638.28 [email protected]
14 October 2004 Musterbericht - ACIDA Torque Measurement Services by ACIDA GmbH Page 22
figure 14: Overview of all passes for one plate (torque time signals)
ACIDA GmbH Tel.: +49 (0)2407 5638.0 www.acida.net Kaiserstraße 100, D-52134 Herzogenrath Fax.: +49 (0)2407 5638.28 [email protected]
14 October 2004 Musterbericht - ACIDA Torque Measurement Services by ACIDA GmbH Page 23
figure 15: Overview of all passes for one plate (rolling force and roll gap signals)
ACIDA GmbH Tel.: +49 (0)2407 5638.0 www.acida.net Kaiserstraße 100, D-52134 Herzogenrath Fax.: +49 (0)2407 5638.28 [email protected]
14 October 2004 Musterbericht - ACIDA Torque Measurement Services by ACIDA GmbH Page 24
figure 16: Zoom of the 5th pass (torque time signals)
ACIDA GmbH Tel.: +49 (0)2407 5638.0 www.acida.net Kaiserstraße 100, D-52134 Herzogenrath Fax.: +49 (0)2407 5638.28 [email protected]
14 October 2004 Musterbericht - ACIDA Torque Measurement Services by ACIDA GmbH Page 25
figure 17: Zoom of the 5th pass (motor current and rolling force time signals)
ACIDA GmbH Tel.: +49 (0)2407 5638.0 www.acida.net Kaiserstraße 100, D-52134 Herzogenrath Fax.: +49 (0)2407 5638.28 [email protected]
14 October 2004 Musterbericht - ACIDA Torque Measurement Services by ACIDA GmbH Page 26
figure 18: Zoom of the 6th pass (torque time signals)
ACIDA GmbH Tel.: +49 (0)2407 5638.0 www.acida.net Kaiserstraße 100, D-52134 Herzogenrath Fax.: +49 (0)2407 5638.28 [email protected]
14 October 2004 Musterbericht - ACIDA Torque Measurement Services by ACIDA GmbH Page 27
figure 19: Zoom of the 6th pass (motor current and rolling force time signals)
ACIDA GmbH Tel.: +49 (0)2407 5638.0 www.acida.net Kaiserstraße 100, D-52134 Herzogenrath Fax.: +49 (0)2407 5638.28 [email protected]
14 October 2004 Musterbericht - ACIDA Torque Measurement Services by ACIDA GmbH Page 28
figure 20: Heavy torsional vibrations (torque time signals)
ACIDA GmbH Tel.: +49 (0)2407 5638.0 www.acida.net Kaiserstraße 100, D-52134 Herzogenrath Fax.: +49 (0)2407 5638.28 [email protected]
14 October 2004 Musterbericht - ACIDA Torque Measurement Services by ACIDA GmbH Page 29
figure 21: Heavy torsional vibrations (motor current and rev. speed time signals)
ACIDA GmbH Tel.: +49 (0)2407 5638.0 www.acida.net Kaiserstraße 100, D-52134 Herzogenrath Fax.: +49 (0)2407 5638.28 [email protected]
14 October 2004 Musterbericht - ACIDA Torque Measurement Services by ACIDA GmbH Page 30
figure 22: Uneven torque load distribution (torque time signals)
ACIDA GmbH Tel.: +49 (0)2407 5638.0 www.acida.net Kaiserstraße 100, D-52134 Herzogenrath Fax.: +49 (0)2407 5638.28 [email protected]
14 October 2004 Musterbericht - ACIDA Torque Measurement Services by ACIDA GmbH Page 31
figure 23: Uneven torque load distribution (rolling force and roll gap time signals)
ACIDA GmbH Tel.: +49 (0)2407 5638.0 www.acida.net Kaiserstraße 100, D-52134 Herzogenrath Fax.: +49 (0)2407 5638.28 [email protected]
14 October 2004 Musterbericht - ACIDA Torque Measurement Services by ACIDA GmbH Page 32
4 Summary and conclusion
Torque measurements had beein carried out at the ROLLED PRODUCTS INC. hot plate reversing mill main drives. Besides the ACIDA proprietary torque sensor signals additional plant signals, i.e. motor speed, rolling force, motor current or roll gap were also monitored for enhanced process analysis. The measurements started on 2004/06/13 and ended on 2004/06/27.
The aim was to obtain an overview of the main drive torque load distribution in order to be able to design a new spindle solution for the main drive, based on real and representative rolling processes.
The torque of the top spindle reaches twelve times the torque level of 2813 kNm during the measurements. The torque load on the bottom spindle is, as it was expected, slightly higher. The torque reaches three times the level of 2969 kNm (in the same period). Because the maximum torque is achieved at highly dynamic load progression (bite impact or torsional resonances), the electical motor values (i.e. the motor current) cannot deliver the appropriate torque load information.
The first natural frequency (frequency of the torsional vibration) of the drive is about 14.5 Hz.
Torque amplification occurs mostly during the last passes of a plate because of the increased rolling speed at this production stage.
The TAF values do not exceed 2.3 and are classified as uncrit ical.
The increase of the torque load during the middle and the end of the pass are illustrated in some examples of specials events recorded during the measurements. Furthermore there is a significant difference of the torque mean load at the first four passes compared to the following passes.
Further investigations and optimizations of these phenomena will help to prolong lifetime of the power tr ansmission components of the roll-ing mill main drive and to reduce maintenance costs.
The pass schedule in formation and measured load values (max. torque, TAF and natural frequency) will be the basis for the design of new VOITH Turbo universal joint shafts with improved load capacity and life-time performance.