report resumes - files.eric.ed.gov · the proliferation of increasingly more complex and...
TRANSCRIPT
...41""'"""P"'"or.V407"0149,NIPVIOVIII,T,A.VVITliegmorrs700,1,404M,PermmVINTItm,
REPORT RESUMESED 016 815 08 VT 004 16$DEVELOPMENT AND EVALUATION OF EDUCATIONAL PROGRAMS IN810 - MEDICAL EQUIPMENT TECHNOLOGY, PHASE I. FINAL REPORT.TECHNICAL EDUCATION RESEARCH CTR., CAMBRIDGE,MASS.REPORT NUMBER BR -5-0175 PUB DATE JUL 67GRANT 0E016000366065EDRS PRICE MF60.75 HC -$6.48 160P.
DESCRIPTORS *HEALTH OCCUPATIONS EDUCATION, TECHNICALEDUCATION, PROGRAM DEVELOPMENT, *BIOMEDICAL EQUIPMENTTECHNICIANS, *OCCUPATIONAL SURVEYS, EMPLOYMENT PROJECTIONS,EMPLOYMENT OPPORTUNITIES, *CURRICULUM DEVELOPMENT,OCCUPATIONAL INFORMATION, EDUCATIONAL NEEDS, QUESTIONNAIRES,
OFFICIALS OF A REPRESENTATIVE SAMPLE OF HOSPITALS,BIOMEDICAL EQUIPMENT MANUFACTURERS, AND MEDICAL RESEARCHINSTITUTES IN NEW ENGLAND AND THREE MIDDLE ATLANTIC STATESWERE INTERVIEWED TO DETERMINE THE NEED FOR TECHNICIANS TOSERVICE AND MAINTAIN EQUIPMENT FOUND IN HOSPITALS ANDBIOMEDICAL RESEARCH INSTITUTIONS. RESPONSES INDICATED A NEEDFOR BETWEEN 1,350 AND 1,450 TECHNICIANS ON CURRENT STAFFS ANDBETWEEN 5,200 AND 3,700 BY 1970. FOUR TYPES OF TECHNICIANSWERE IDENTIFIED ACCORDING TO FUNCTIONS AND CAPABILITIES....-(1)SERVICE AND MAINTENANCE ONLY, (2) OPERATION, INSTRUCTION INUSE, AND INSTALLATION, (3) DESIGN, MODIFICATION, ANDADAPTATION, AND (4) SALES-ORIENTED FUNCTIONS. ON THE BASIS OFTHE INTERVIEW DATA AND DISCUSSIONS AT A CURRICULUMCONFERENCE, THE GENERAL STRUCTURE AND PRELIMINARY OUTLINE OFA 2 -YEAR CURRICULUM WERE DEVELOPED TO FORM A TENTATIVEFOUNDATION FOR DETAILED DEVELOPMENT, PILOT TESTING, ANDEVALUATION. THE CURRICULUM WAS ESSENTIALLY AN ELECTRONICSTECHNICIAN CURRICULUM WITH A STRONG EMPHASIS ON MEDICALINSTRUMENTATION. IT CONTAINED A UNIQUE COMPONENT ONBIOMEDICAL EQUIPMENT TECHNIQUES, AS WELL AS ENGLISH, PHYSICS,AND MATHEMATICS. RECOMMENDATIONS WERE- -C1) TO ESTABLISH AMINIMUM OF 50 PROGRAMS IN GEOGRAPHICALLY DISPERSEDEDUCATIONAL INSTITUTIONS TO MEET THE DEMAND FOR 2,000TECHNICIANS PER YEAR, (2) TO UNDERTAKE MAJOR CURRICULUMDEVELOPMENT RATHER THAN TO COMBINE EXISTING COURSES, AND (3)TO CONTINUE INTENSIVE RESEARCH TO DEVELOP AN ASSOCIATE DEGREETYPE OF CURRICULUM ADAPTABLE TO NUMEROUS POST- SECONDARYINSTITUTIONS. (JK)

0 R Sw-- 0 1 95-.1-
%Coileceivea bi Wig e A 6 SCO
Iftcports Unit /1-4
OC3 FINAL REPORTImo Project No. E0-366-65
Grant No. OEG-1-6-000366-0658
DEVELOPMENT AND EVALUATION OF EDUCATIONALPROGRAMS IN.BIO-MEDICAL EQUIPMENT TECHNOLOGY
PHASE I
July 1967
U.S. DEPARTMENT OFHEALTH, EDUCATION, AND WELFARE
Office of EducationBureau of Research
Development and Evaluation of EducatinnalPrograms in Bio-Medical Equipment Technology
Phase I
Project No. EO-366-65Grant No. 0EG-1-6-000366-0658
July 1967
The research reported herein was performedpursuant to a grant with the Office of Ed-ucation, U.S. Department of Health, Educa-tion, and Welfare. Contractors undertakingsuch projects under Government sponsorshipare encouraged to express freely their pro-fessional judgment in the conduct of theproject. Points of view or opinions stateddo not, therefore, necessarily represent'official Office of Education position orpolicy.
Technical Education Research Center, Inc.142 Mt. Auburn Street
Cambridge, Massachusetts
U.S. DEPARTMENT OF HEALTH, EDUCATION & WELFARE
OFFICE OF EDUCATION
THIS DOCUMENT HAS BEEN REPRODUCED EXACTLY AS RECEIVED FROM THE
PERSON OR OISANSIATION ORIGINATING IT. POINTS Of VIEW OR OPINIONS
STATED DO NOT NECESSARILY REPRESENT OFFICIAL OFFICE OF EDUCATION
POSITION OR POLICY.

.
CONTENTS
ACKNOWLEDGEMENTS-INTRODUCTION
Page
1
METHOD 7
I. Identifying the Populations and Sub-Populations 7and Selecting Samples
II. Interview Procedures 12
III. Data Coding and Analysis 13
RESULTS--PART I--THE NEED FOR AND CHARACTERISTICS OF BMET's14I. Hospital Sub-Population 14
A. The Need for Bio-Medical Equipment Technicians 141. Current Staff Needs .152. Projected 1970 Needs 183. Growth Estimate in the Need 18
B. Variables Related to the Need for BMET's 211. Definition of Variables 242. The Relationship Among the Variables and the25
Need for BMET'sC. Characteristics of the BMET 32
1. Salary 322. Type of Supervisor 343. Functions of the BMET 34
II. Manufacturer Sub-Population 42A. The Need for BMET's .42
1. Need on Current Staffs 422. Projected 1970 Need 473. Growth in the Need for BMET's 50
B. Variables Related to the Need for BMET's 521. DefinLtion of Variables 52
C. Characteristics of the BMET . 56
III, Research Institute Sub-Population 63A. The Need for BMET's 63
1. Current Needs 632. Projected 1970 Need 653. Growth in the Need for BMET's 67
B. Variables Related to the Need for BMET's 671. Definition of Variables .672. Relationships Among the Variables and Need
for BMET's69
C. Characteristics of the BMET 69.IV, Discussion of Combined Data from Hospitals, Man-
ufacturers, and Research Institutes74
RESULTS--PART II--PRELIMINARY CURRICULUM OUTLINE FOR BMET's 81
I. Guidelines Deriyed from Interview DataII. Curriculum ConferenceIII. Special Requirements of the BMET CurriculumIV. Preliminary Curriculum OutlineV. Curriculum Development Planning Conference
CONCLUSIONS AND
RECOMMENDATIONS
SUMMARY
REFERENCES
APPENDIXES
Appendix A:
Appendix B:
Appendix C:
Appendix D:
Appendix E:
Appendix F:
Appendix G:
IMPLICATIONS
Preliminary Curriculum Outline Used inthe Field Study and Interview GuidesUsed in the Field Study.Supplementary Tables Relating to Pro-portions of Hospitals; Manufacturersand Research Institutes IndicatingNeeds for BMET's.Supplementary Tables Extrapolating theNumbers of BMET's Needed by Employersin the Different Sub-Populations.Procedures Used to Explain Distributionof Money Variables.List of Individuals Who Assisted inPlanning and Carrying Out Project.List of Hospitals, Manufacturers, andResearch Institutes Interviewed inthe Field Study.List of Institutions Interviewed.inPreliminary Survey.
82
858888
99
102
103'
105
A-1
B-1
F-1
G-1. .

LIST OF TABLES
Table Page
1. Distributioh of Hospital Sub-PopulationAccording to Three Stratifying Variables. 8
II. Distribution of ManAfacturer Sub-PopulationAccording to Two Stratifying Variables. 10
III. Mean Number of BMET's NeedeA Now per Hospital. 16
IV. Mean Number of BMET's Needed Now per Hospital.(Excluding V.A. Hospitals). 17
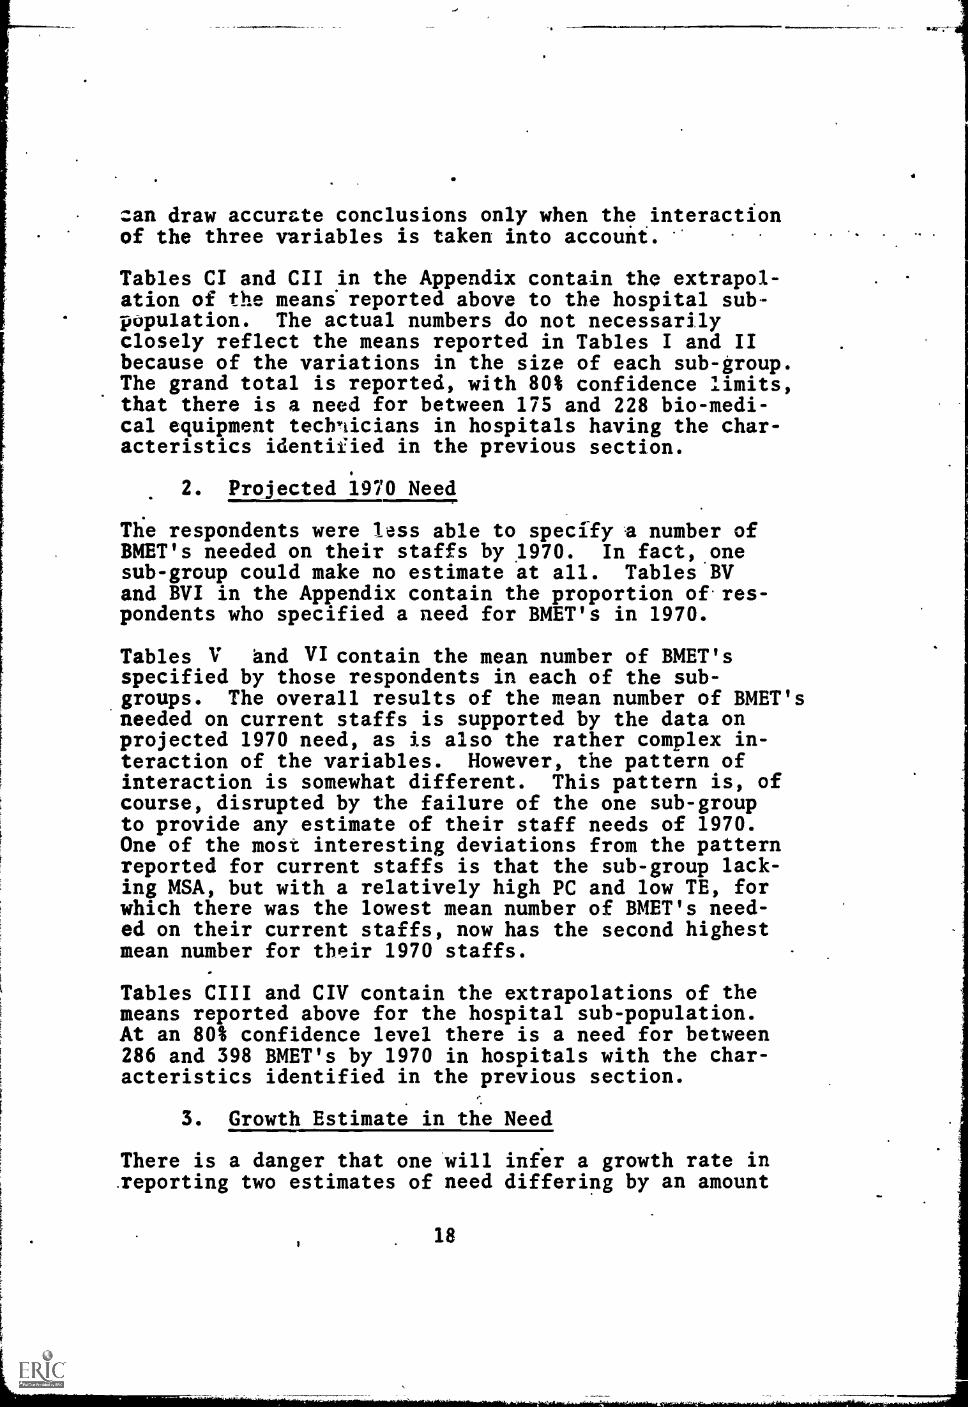
V. Mean Number of BMET's Needed in 1970 per Hospital. 19
VI. Mean Number of BMET's Needed in 1970 per Hospital(Excluding V.A. Hospitals). 20
VII. Mean Proportion Increase in Need for BMET's perHospital (1966-1970). 22
VIII. Mean Proportion Increase in Need for BMET's perHospital (1966-1970).
IX. Comparative Data on the Need for BMET's in Hospitals. 26
X. Comparative Data by Level of Annual HospitalExpenditure in Equipment. 28
XI. Comparative Data by Level of Annual HospitalExpenditure in Personnel and Services. 31
XII. ;lean "Average" Salary of BMET in Hospitals. 33
XIII. Proportion of Hospitals Identifying Types ofBMET Supervisors. 35
XIV. Proportion of Hospitals Identifying Only One Typeof BMET Needed. 36
XV. Proportion of Hospitals Indicating Current Needsfor BMET's by Job Types.
XVI. Proportion of Hospitals Indicating 1970 Need forBMET's by Job Types.
XVII. Proportion of Hospitals Indicating Combination ofBMET Job Types, Supervisors and Mean Salaries.
38
40
41
XVIII. Mean Number of BMET's Needed Now Per Manufacturer. 43

Table -Page
XIX. Proportion of Manufacturers Categorized inHigh Curient Need Grolp. 46
XX. Mean Number of BMET's Needed in 1970 perManufacturer. 48
XXI. Proportion of Manufacturers Categorized in High1970 Need Group.
XXII. Mean Proportion Increase in Need for BMET's perManufacturer (1966-1970)
49
51
XXIII. Comparative Data Between Manufacturers Having Highand Low Current Need for BMET's. 53
XXIV. Comparative Data Between Manufacturers Having.Highand Low Projected 1970 Needs for BMET's 55
XXV. Mean "Average" Salary of BMET's Among Manu-
facturers.57
XXVI. Proportion of Manufacturers Identifying Types
of BMET Supervisors.
XXVII. Proportion of Manufacturers Indicating Needsfor BMET's by Job Types.
58
61
XXVIII. Proportions of Manufacturers Indicating Combinationsof BMET Job Types, Supervisors and Mean Salaries. 62
XXIX. Mean Number of BMET's Needed Now per Research.Institute. 64
XXX. Mean Number of BMET's Needed in 1970 perResearch Institute. 66
XXXI. Mean Proportion Increase in Need for BMET's perResearch Institute (1966-1970). 68
XXXII. Comparative Data Between Types of Research In- .
stitutes. 70
XXXIII. Data Relative to Characteristics of the BMET in.Research Institutes. 72
XXXIV. Proportions of Research Institutes IndicatingCombinations of BMET Job Types, Supervisors
and Salaries. 73

Table
XXXV. Summary of Mean Number of BMET's Needed perEmployer.
XXXVI. Summary of Number of BMET's Needed by Employersin Population Studied.
XXXVII. Proportion of BMET's Needed Designated byGeneral Job Types.
XXXVIII. Number of BMET's Needed by Employers inPopulation Studied Designated by GeneralJob Types.
Page
75,
79
80
1
ACKNOWLEDGEMENTS
This research project has been carried on as a co-ordinated team effort and represents the contributionsof many people in many ways. It represents not onlythe efforts of the staff members and consultants ofTechnical Education Research Center, Inc. (TERC), butof many individuals in hospitals, medical schools,research institutes, and equipmc14s manufacturing con-cerns who have attended planning conferences and havein various ways assited the staff in planning andcarrying out of this project. A list of both TERCstaff members and other individuals who have assistedin this project is contain ;:d in Appendix E. Many otherindividuals including.U.S. Government personnel inthe U.S. Office of Education and other agencies whoare not listed have also contributed to this project.Grateful acknowledgement is made of the contributionsof all of these individuals.
Grateful acknowledgement is also made of the contri-butions of representatives nom those hospitals, manu-facturers, and research in=atutes who were interviewedduring the Preliminary Survey and the Field Study. Thenames of these institutions (although not the individualsinterviewed) are listed in Appendixes F and G.

i.
INTRODUCTION.
Recent advances In the fields of electronics and in-strumentation have resulted both in the accelerationof medical technology in terms of equipment and pro-cedures, and the creation of a need for people able tounderstand and effectively utilize these.new gains.The proliferation of increasingly more complex and soph-isticated instruments and methods in this area hascreated, among other things, a need for technicianscapable of servicing and maintaining the bio-medicalequipment used in hospitals and medical research in-stitutes. The development of this technology has open-ed up a new area of employment--one which requires itspersonnel to be trained specifically to meat its needs.
The rapid growth of bio-medical equipment technologywithin the past few years has coincided with and hasresulted largely from a rapid increase of expendituresin bio-medical research. As expenditures in bio-med-ical research have continued to grow,' there have beelarge increases in the numbers of research scientists'in the fields of biological and medical research. Atthe same time, manufacturers of bio-medical equipmenthave kept abreast of these trends. The volume of salescontinues to expand as it reflects the rapid growthin the use of new bio-medical systems and instruments°.
At present there are few educational programs in exist-ence to prepare men specifically as Bio-Medical Equip-ment Technicians (BMET's). This lack of training op-portunities has created an occupational vacuum; thereis a lack of individuals able to fill the roles fos-tered by technological advances. There is evidencethat the lack of educational programs for BMET'sis adversely affecting many national health programsnow underway and, unless corrected, may impair thequality and efficiency of our nation's health services.
The purpose of this project was three-fold. First, onthe assumption that there is a need for bio-medicalequipment technicians, the extent of that need had tobe determined. Secondly, once the need had been veri-fied, it was necessary to determine the specificationsof the need for bio-medical equipment technicians (lo-cation and extent of employment opportunities, specificjob functions and characteristics). Finally once the
.specifications of the need had been determined it wasnecessary to design the preliminary framework or struc-ture of a curriculum which ill adequately prepare BMET's
1
to fill these needs and to develop useful new careersin this rapidly emerging technology.
This research project as originally conceived had the .
final objective of developing a suggested two year posthigh school curriculum guide for bio-medical equipmenttechnology. These objectives were reflected in theoriginal title of the project--"Development of aCurriculum Guide for Bio-Medical Equipment Technology."
Research work was begun April 1, 1966 and was completedJune 30, 1967. The first four months were devoted toa Preliminary Survey of the Field. This PreliminarySurvey included a review of. the literature and a seriesof unstructured interviews both with leading Profession-als in the field of bio- medical equipment_, technology andwith officials of a number of prospective-employers ofBMET's. The categories of prospective employers inter-viewed included hospitals, medical schools, medicalresearch institutes and bio-medical equipment manu-facturers throughout the country.
The objectives of the Preliminary Survey were(1) to review any previous research programs or existingeducational programs which might be relevant to this pro-gram; (2) to develop preliminary information about theprospective employers of BMET's and about the employmentopportunities, functions, and characteristics of BMET's;and (3) to develop a preliminary proposed curriculum out-line. This information was needed as a basis for dev-eloping the detailed research design for the project.
The Preliminary Survey strengthened previous impressionsthat little if any relevant occupational research hasbeen done in the field of bio-medical equipment tech-nology and that few if any formal educational programsexist for technicians in this field in the United States.Those technicians at work in the field typically have .
either electronic, electrical, or instrumentation back-grounds. They laU training to varying degrees in thebasic educational subjects underlying this multi-disciplinary technology. Their on-the-job training isusually restricted to providing them with proficiency inspecific equipments of interest to their employers. Be-cause of this lack of educational background their abilityto develop and grow within this rapidly changing tech-nology is limited. Furthermore many of the tasks andfunctions which might be performed by trained BMET's are
2
now necessarily being performed by professionals withconsequent-expenditure of professional time. It was the.general opinion of those interviewed in, the Prelim-inary Survey that if a supply of systemmatically trainedBMET's existed there loould be substantial and growingemployment opportunities for them particularly amongthree major categories of employers--hospitals, bio-medical equipment manufacturers, and medical researchinstitutes.
The Preliminary Survey also considerably strengthenedprevious impressions that a BMET capable of Meeting thepresent and developing needs of these employers wouldbe a new type of technician. The need for such tech-nicians has only recently been created by the develop-ment of this rapidly. emerging technologr!:. Understandab-ly there exists virtually no educational experience torely upon as a sound basis for the development of a cur7riculum for such a technician.
In view of the lack of existing occupational informationin this field and the lack of tested instructionalmaterials, it was concluded that it would be prematureto publish a "curriculum guide" for bio-medical equip-ment technology until an actual curriculum for BMET'shad been developed, pilot tested, and evaluated. Itwas felt that dissemination of an untested or "paper"curriculum guide could be a disservice both to schools,to prospective BMET's, and to their employers. It wasalso concluded that in a rapidly emerging technologysuch as this,where there is not yet a generally recog-nized occupational structure, any sound curriculum dev-elopment effort must be preceded by a rather carefuland intensive program of occupational research.
It was therefore decided, with the approval of theProject Officer, that in view of the budgetary limita-tions of the project, primary effort in this projectshould be focused on obtaining valid factual occupation-al information as to the developing employment opportuni-ties, functions, and other characteristics of Bio-MedicalEquipment Technicians. On the basis of this information,at least the general structure and a preliminary outlineof a curriculum for BMET's would be developed. It wasrecognized that if the.occupational research confirmedthe preliminary indications of substantial employmentOpportunities for BMET's,'it would be necessary, beforeactual educational programs for BMET's could be established
3

in schools, to later carry out a carefully designedcurriculum development and evaluation project in orderto "flesh out" the curriculum and to develop and testthe necessaryinstructional materials.
The objectives of the present project were therefore .
modified in August 1966 to comprise the following twospecific objectives:
1. To determine by means of occupational researchthe employment opportunities for Bio-MedicalEquipment Technicians and to identify thefunctions and other characteristics of suchtechnicians; and
TO develop a preliminary curriculum outlineor structure for post high school educationalprograms in Bio-Medical Equipment Technology.
In order to achieve these two objectives a field studywas designed based upon structured interviews with officialsof a representative regional sample of the three majorcategories of prospective employers, of BMET's--hospitals,bio-medical equipment manufacturers, and medical researchinstitutes. The region studied included the six New Eng-land states (comprising Region I as defined by the Am-erican Hospital Association) and the three Mid-Atlanticstates of New York, New Jersey and Pennsylvania (comprisingRegion 2 as defined by the AHA). It was believed, on thebasis of the Preliminary Survey, that few if any regionaldifferences exist in the pattern of employment oppor-tunities and characteristics of BMET's within the UnitedStates so that the regional study would have nationalsignificance.
The Field Study was begun in October 1966 with theinterviews being carried out during the period October1966 through February 1967. The interview data were codedand analysed during the period March through June 1967.The preliminary curriculum outline for BMET's was dev-eloped in the months of May and June 1967 based upon theresults of the occupational research as reviewed by aCurriculum Conference held in May 1967.
The results of the field study are reported in two parts:Part I entitled "Need for and Characteristics of BMET's"describes the statistical results of the occupationalresearch. This part documents employment opportunitieswithin the region and employer population studied. It
4

identifies and describes the characteristics of fourgeneral types of jobs whif.h BMET's will fill. The. results ofPart I imply a national need for the immediate develop-ment of educational programs for BMET's.for a minimum of2000 BMET's per year in fifty or more technical institutesand community/junior colleges.
Part II of the Results entitled "Preliminary CurriculumOutline for BMET's", outlines the general structure ofa two year associate degree type curriculum in Bio-Medical Equipment Technology designed on the basis ofthe field study. It should be strongly emphasized thatthis curriculum outline is very preliminary and has notbeen tested. It is presented only to indicate thegeneral requirements of, such a curriculum and to form thebasis for the detailed development, pilot.testing, andevaluation of such a curriculum in a Phase II researchproject.
The requirements of such a curriculum for BMET's arequite different from existing curricula in technicalinstitutes and community/junior colleges. Many of thenecessary instructional materials do not exist. In orderto assist schools in establishing needed educationalprograms for BMET's it has been recommended that abroadly generalizeable curriculum development, testingand evaluation project be undertaken as a Phase II con-tinuation of this program. TERC expects to begin such aPhase II curriculum development project with the cooper-ation of two pilot schools in September 1967. As soonas the tested instructional materials developed in PhaseII are available, it will be possible for technical in-stitutes, community/junior colleges and other post second-ary schools to establish educational programs for BMET'swith a minimum of local effort, cost, and time. Suchprograms can provide the basis for new careers in Bio-Medical Equipment Technology for thousands of youngpeople. It is hoped that this intensive and coordinatedresearch effort to develop and test educational programsfor BMET's can provide a model for the systemmaticdevelopment of generalizeable educational programs inother-emerging technologies.
The title of this Report has been changed from itsoriginal form both to reflect the modified objectives of

this study and to identify it as the first phase of abroader coordinated research program to develop andevaluate educational programs in bio-medical equip-ment technology.
METHOD
I. Identifying the Populations and Sub-populationsand Selecting Samples
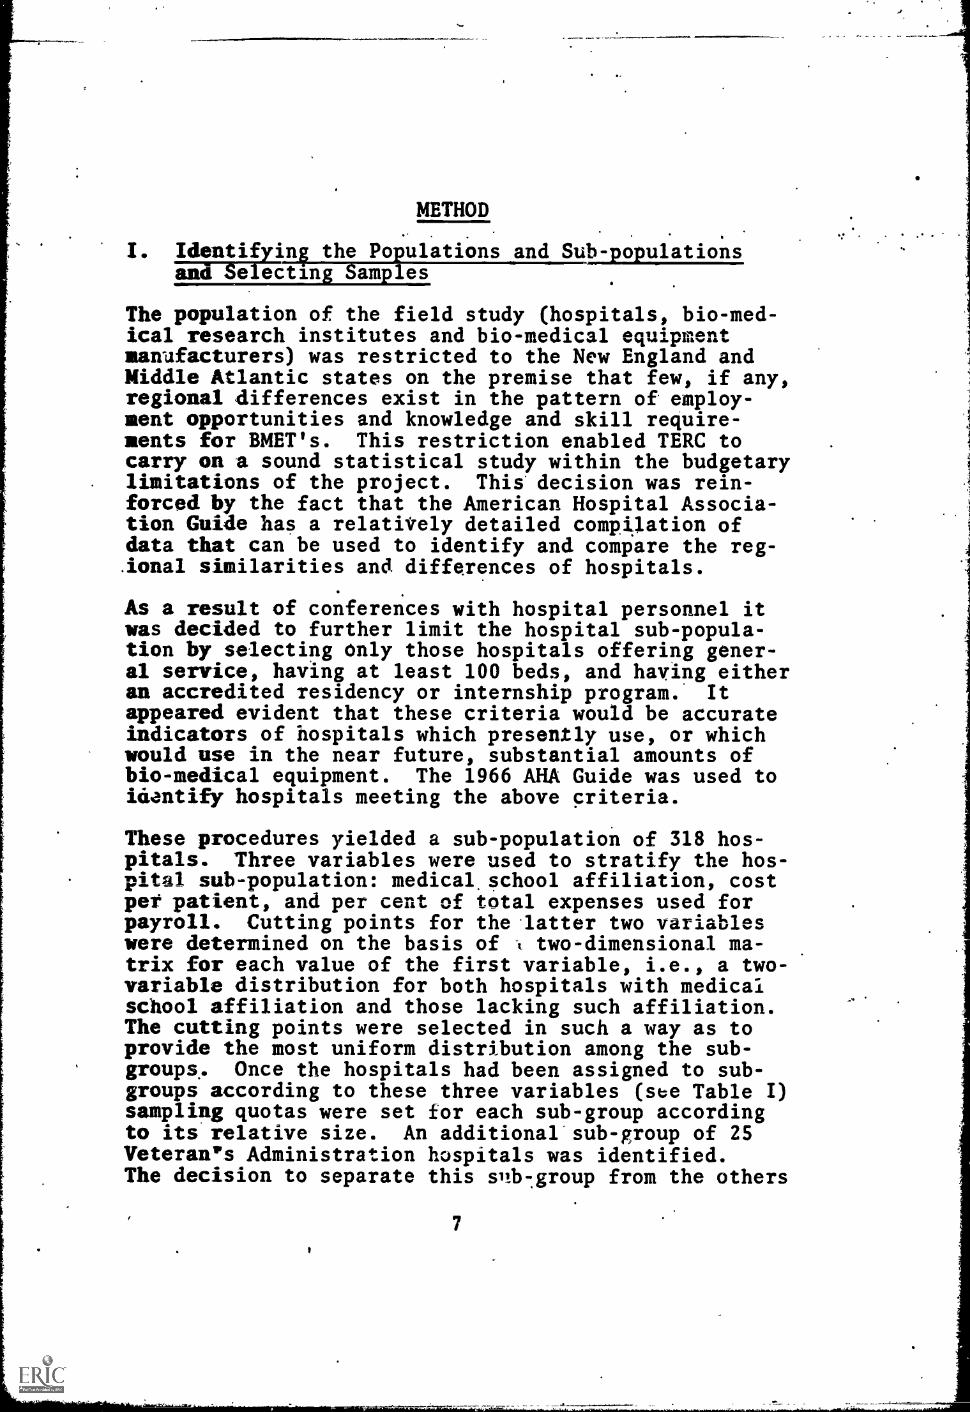
The population of the field study (hospitals, biomed-ical research institutes and bio-medical equipmentmanufacturers) was restricted to the New England andMiddle Atlantic states on the premise that few, if any,regional differences exist in the pattern of employ-ment opportunities and knowledge and skill require-ments for BMET's. This restriction enabled TERC tocarry on a sound statistical study within the budgetarylimitations of the project. This decision was rein-forced by the fact that the American Hospital Associa-tion Guide has a relatiVely detailed compilation ofdata that can be used to identify and compare the reg-ional similarities and differences of hospitals.
As a result of conferences with hospital personnel itwas decided to further limit the hospital sub-popula-tion by selecting only those hospitals offering gener-al service, having at least 100 beds, and having eitheran accredited residency or internship program. Itappeared evident that these criteria would be accurateindicators of hospitals which presently use, or whichwould use in the near future, substantial amounts ofbio-medical equipment. The 1966 AHA Guide was used toidentify hospitals meeting the above criteria.
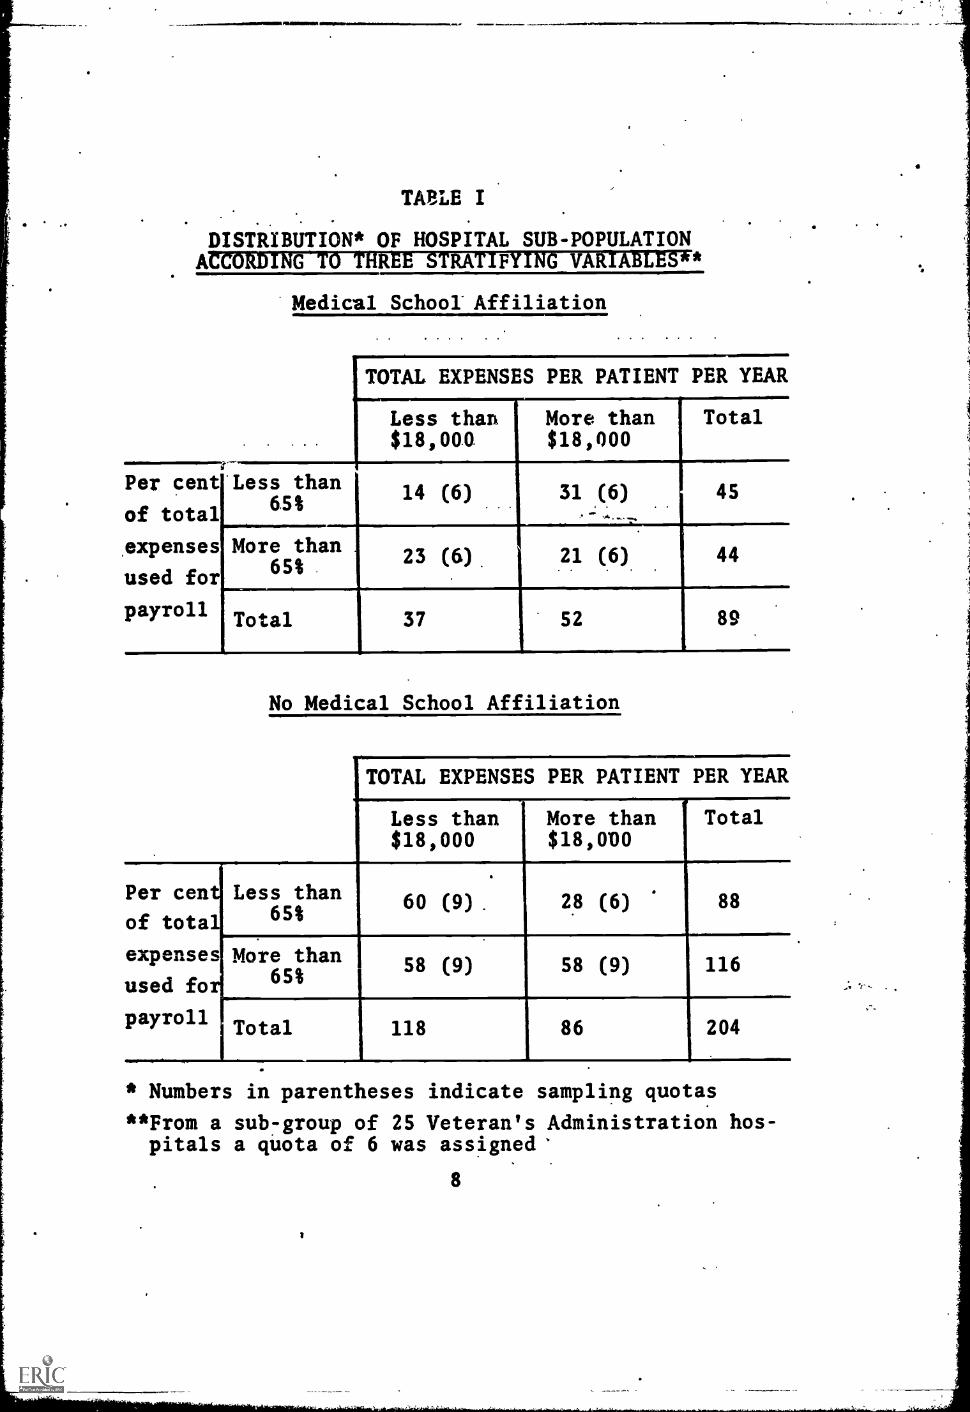
These procedures yielded a sub-population of 318 hos-pitals. Three variables were used to stratify the hos-pital sub-population: medical, school affiliation, costper patient, and per cent of total expenses used forpayroll. Cutting points for the latter two variableswere determined on the basis of t two-dimensional ma-trix for each value of the first variable, i.e., a two-variable distribution for both hospitals with medicalschool affiliation and those lacking such affiliation.The cutting points were selected in such a way as toprovide the most uniform distribution among the sub-groups.. Once the hospitals had been assigned to sub-groups according to these three variables (see Table I)sampling quotas were set for each sub-group accordingto its relative size. An additional sub-group of 25Veteran's Administration hospitals was identified.The decision to separate this snb7group from the others
7
TAIrLE I
DISTRIBUTION* OF HOSPITAL SUB-POPULATIONACCORDING TO THREE STRATIFYING VARIABLES**
Per cent
of total
expenses
used for
payroll
Medical School Affiliation
TOTAL. EXPENSES PER PATIENT PER YEAR
Less than$18,000
More than Total$18,000
Less than65%
More than65%
14 (6) 31 (6) 45 .
.-:.;...._
Total
23 (6)
37
21 (6) 44
52 89
No Medical School Affiliation
TOTAL EXPENSES PER PATIENT PER YEAR
Less than$18,000
More than$18,000
Total
Per centiLess than
of total' 65%60 (9) 28 (6) 88
expenses More than
used fo 65%
payrollI Total
1
58 (9) 58 (9) 116
118 86 204
* Numbers in parentheses indicate sampling quotas
**From a sub -group of 25 Veteran's Administration hos-pitals a quota of 6 was assigned'
8
was based on the fact that they did not exhibit thecharacteristics of the other hospitals in the same pro-portions. Itas felt that they would exert dispropor-tionate influence on the results of one or two of theother sub-groups. Each sub-group was then randomlysampled to meet those quotas, yielding a sample of 63hospitals. Additional hospitals were selected randon-ly to serve as alternates.
Four hundred thirty-five manufacturers of bio-medicalequipment were identified in the New England and Mid-Atlantic regions from listings in the Medtcal Instru-ment Dictionary and Buyer's Guide, and Science maga-iii57TWU variables were used to refiniTHilopula-tion: type of equipment produced, and relative size asmeasured by asset data. Equipment was classified aseither, physiological (monitors, recordersi EKG's, etc.)or bio-chemical (laboratory equipment). Equipment ofthe first category generally has contact with the pa-tient whereas equipment of the second category general-ly does not have ccntact with the patieiit. A thirdcategory designated "other" was required for thosemanufacturers who produced both types of equipment orwho manufactured equipment not clearly of one type ofthe other.
On the basis of asset data obtained from the Dun andBradstreet Million Dollar Market, the Dun and Brad-street Middle Range Market, an Thomas Register,
rothree gups were identified: those companies worth$1,000,000 or more; those worth less than $1,000,000;and those manufacturers for which no asset data couldbe found. After discarding the "Other" category (leav-ing a total population of 380), quotas were set foreach of the remaining six sub-groups. Random selec-tions from each cell yielded a sample of 48 equipmentmanufacturers in the bio-medical equipment field (seeTable II).
In the process of arranging interviews and randomlyselecting alternates, it was found that 45 had beef in-appropriately identified for inclusion in the sample,i.e., they were not actually in the bio-medical equip-ment field, or were in the field only to a very smalldegree. There were five who either did not exist orwho declined to participate in the,study. Thirty-sixwere appropriate for the sample.
Thus, if one makes estimates on the basis of the total,
9
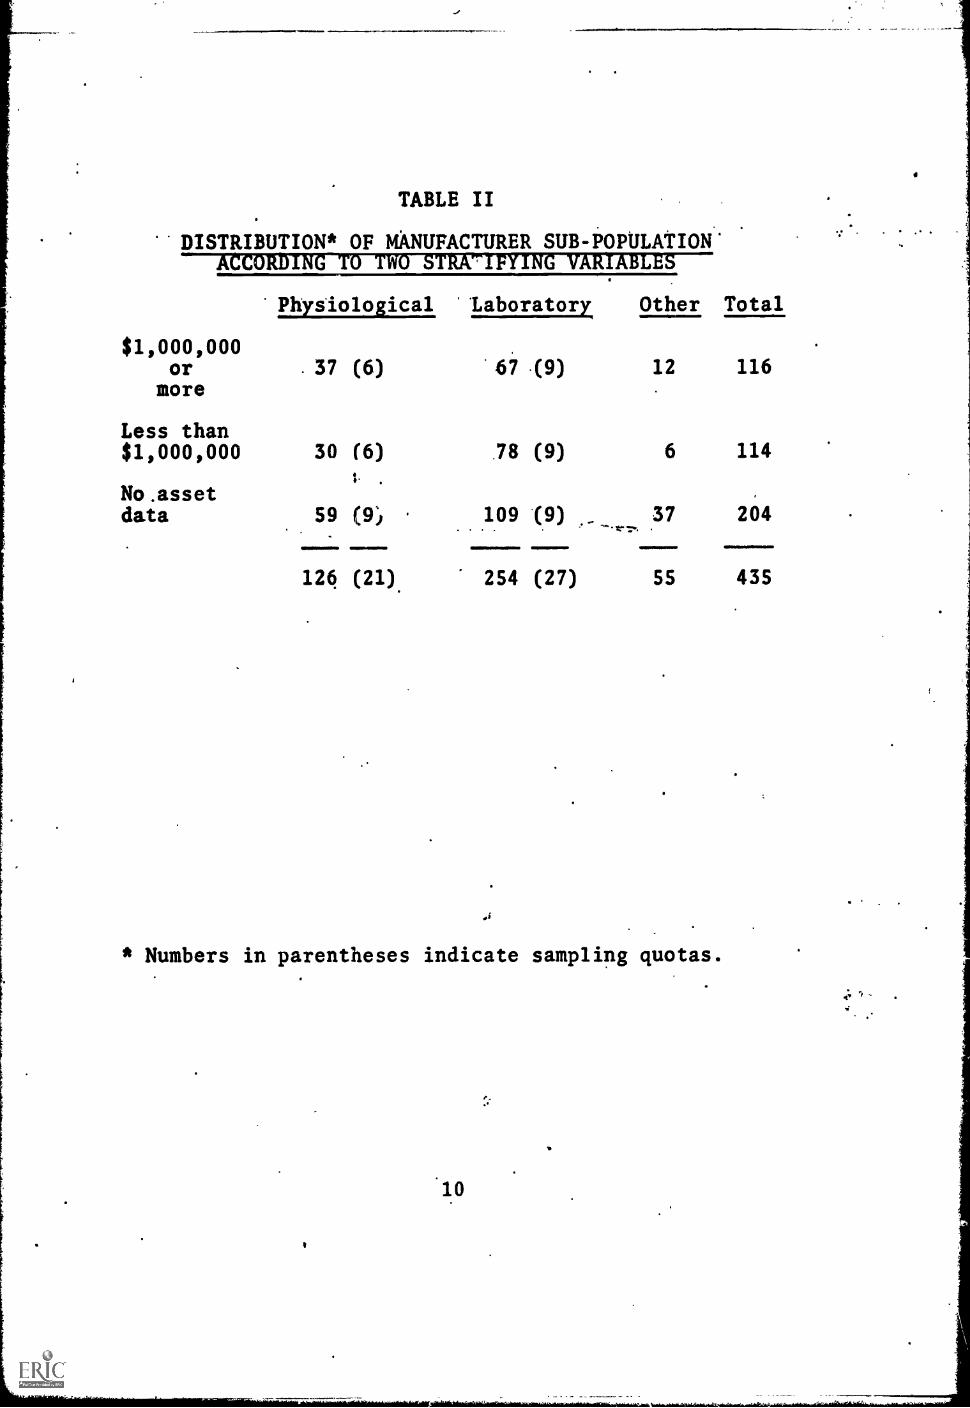
TABLE II
DISTRIBUTION* OF MANUFACTURER SUB-POPULATION.ACCORDING TO TWO STRATIFYING VARIABLES
Physiological 'Laboratory Other Total
$1,000,000ormore
.37 (6)
Less than$1,000,000 30 (6)
No .assetdata 59 (9,,
124 (21)
67
.78
109
254
(9) 12 116
(9) 6 114
(9).. .,.. ......
37 204
(27) 55 435
* Numbers in parentheses indicate sampling quotas.
10

but overinclusive, list of 380 manufacturers of bio-medical equipment, one could expect to find 182 in-.
appropriately identified, 34 manufacturers either non-existent or not willing to participate, and 164 manu-facturers both in the field and willing to participate.
Bowker Associates of New York provided TERC with twolists of research institutes in the two geographicalareas being studied. Only one of the lists containedany supplementary data. Ninety-nine institutions fromthis list of 214 were selected as being in the fieldof bio-medical research. Forty-four of this smallergroup were chosen as the sub-group to be studied, onthe basis of the fact that more than SO% of their re-sources were devoted to research rather than to othertypes of activities. This group was designated "Re-search Laboratories" (RL).
As no data were available concerning the second listof 122 "Bio-Medical Institutes" (BMI) sub-group byBowker Associates, it was decided to sample this sub-group without further qualification. Quotas of 6 and9 were assigned to the two sub-groups; institutionsand their alternates were drawn randomly within eachgroup.
From the total sample to be studied it was found that5 had been inappropriately identified. Eight institu-tions did not exist or declined to participa-,e. Fifteenreseala in5tituticils were appI,,,:,i..riate io the study.On the N::;;Is of these figures it can be estimated thatfrom the total population of research institutes, 28.would not belong in the sample, 52 might decline or befound not to exist, and 88 would be suitable for study.
In the course of conducting the interviews, suggestionswere made by the respondents regarding the breadth ofthe field study. On the basis of these recommendationsseveral supplementary interviews have been conducted,notably with hospital supply houses and local dealersof scientific instruments. However, since these typesof organizations were not included in the original re-search design of this project, information from thesesources were not included in the results of the fieldstudy.

II. Interview Procedures
Four interviewers were'involved in conducting the inter-views of the total field study population. In caseswhere there was more than one person interviewing aparticular sub-population, interviews were assigned ona random basis within that sub-population.
Prior to the beginning of the interviews specialistsin the areas of both technical and medical educationdevised a tentative two-year curriculum plan (Appen-dixes Al and AII). These charts were used not in adefinitive manner, but rather as a basis for commentsand reactions by the people being interviewed.
LOosely structured interview guides were used to recordinformation gathered during the field study (AppendixAin). The guide for each sub-population variedslightly in order to make it more applicable to thatsub-population. Mese interview guides provided thebasis for the data presently being analysed. The in-formation was used to document the need for BMET's andhis knowledge and skill requirements.
After selection of the hospitals, equipment manufac-turers, and research institutes to be interviewed,arrangements were made to conduct the interviews.These arrangements were greatly facilitated in the caseof the hospital sample by the generous cooperation ofthe New England Hospital Assembly and the Mid-AtlanticHospital Assembly which wrote letters of introductionto the administrators of the hospitals to be interview-ed within their respective regions. Similar letters ofintroduction were written by the Association for theAdvancement of Medical Instrumentation to the manufac-turers to be interviewed. Similar letters were writtenby the Bio-Medical Instrumentation Advisory Councilof the American Institute of Biological Sciences to theresearch institutes to be interviewed. The cooperationof these professional organizations was very helpful inassuring the cooperation of the key officials of theinstitutions to be interviewed.
Following the letters of introduction the recipientswere contacted by telephone, the field study was morefully described, and the date and time for the interviews
12

were arranged. Among the hospitals the hospital admin-istrator was usually interviewed first. in some casesadditional interviews were conducted with other know-ledgeable officials within the hospital. A similar pat-tern was followed in interviewing the manufacturersand research institutes. All interviews were conductedby experienced interviewers. Two interviewers were ran-domly assigned to conduct the hospital interviews. Twointerviewers were randomly assigned to conduct the man-ufacturer interviews. One interviewer conducted allresearch institute interviews.
III. Data Coding and Analysis
After completion of interviews, the interview data re-lating to the need for and characteristics of BMET'swas coded and the coded data was punched 'into IBMcards. Data analysis was carried out in the form offrequency distributions.
Data gathered during the field study relating to thecurriculum for BMET's was distributed to members of aCurriculum Conference consisting of representativesof hospitals, research institutes, manufacturers andtechnical educators. This data was used as the basisfor the development by this Curriculum Conference ofa preliminary outline for a two year associate degreetype curriculum for BMET's.
,5
13

RESULTS - PART I
THE NEED FOR AND CHARACTERISTICS OF BMET'S
I. -Hospital Sub-Population
In many cases the coding of the data from the interviewguides was designed to compensate for the roughness ofthe data. A second factor which affects the data isthat in many instances the interviews were the firstdiscussion which a respondent had on the topic of theneed for bio-medical equipment technicians. This prob-able influence on the data could not be controlled inthe analysis. On factor, however, could be readily con-trolled, i.e., the proportion of people who made noresponse to questions put to them during the interview.The data analysis is designed to carefully tabulatethe proportion of respondents to each of the majorquestions and to report the findings only on the basisof those who responded.
The hospital sub-population was stratified on the basisof three variables: medical school affiliation (MSA),total expenses per patient per year (TE), and per centof total expenses used for payroll (PR). Each variablewas used to identify two groups of hospitals, producinga total of 8 sub-groups. Because of their specificcharacteristics, a ninth sub-group consisting onlyof VA hospitals was created. The cutting points used!a this study were chosen to make the distribution tfhospitals in the 8 sub-groups as even as possible.These cutting points arc similar to the means estab-lished in the AHA Guide.
A. The Need for Bio- Meaical Equipment Technicians
As a first approximation of the reaction to the res-pondents to this discussion, each interview report wascoded to indicate whether the respondent at one timeor another agreed that there was a need for 'no-medicalequipment technicians. This agreement could take sever-al forms, ranging from a willingness to hire such aperson immediately to simply stating that the serviceand maintenance of equipment was a pressing problemwhich could probably be resolved through the hiring ofadditional personnel. Eighty-four per cent of therespondents were in general agreement as to the need forBMET's. This indication was relatively uniform acrossthe nine sub-groups. There is one notable exception.As may be seen in Tables BI and BII of the Appendix,
14
in hospitals lacking MSA and having a below average TEand above average PC, 44% of the respondents indicatedsuch a need. The finding is surprising in its deviationfrom other sub-groups, particularly among hospitals withrelatively high payroll costs, for it was assumed thathospitals of this type would recognize the need for per-sonnel and have budgets reflecting that concern.
1. Current Staff Needs
Each respondent was asked to specify a number of BMET'sthat he could use as members of his staff both now andby 1970. Tables BIII and BIV in the Appendix containthe proportion of respondents who specified a need foranumber of BMET's on their present staff. There wererespondents who clearly stated that there were no posi-tions open on their current staffs for BMET's. Therewere others who did not respond to this question. Sincean acceptable response in this regard was the number"o", the former group is included in these proportionsand the latter group is excluded.
Tables III and IV contain the mean number of BMET's cur-rently needed on hc.12pital staffs. The standard devia-tions of these means are also included. The means andvariances reported in this section were computed ac-cording to formulas presented in Chapter 5 of SamplinTechniques. These data indicate that hospitals witMSA express a greater need than those without MSA.Hospitals with relatively low PC express a greater needfor BMET's than those with a relatively higher PC, andhospitals with relatively high TE express a greater needfor BMET's than those with relatively low TE. Only thefinding with respect to payroll cost is surprising. Aspreviously stated, it was assumed prior to the inter-views that hospitals currently spending more in payrollwould tend to recognize a greater need for BMET's.The data support just the opposite finding, i.e., thosehospitals currently spending less in payroll recognize agreater need for BMET's.
The overall picture supported in Tables III and IV is farsimpler than the complex interaction of these three var-iables. For example, in spite of the fact that hospitalswith MSA have a higher mean need, two sub-groups withMSA have a lower mean need than that of hospitals lack-ing MSA. One of the non-MSA groups expresses a higherneed than the mean of hospitals with MSA. One
15
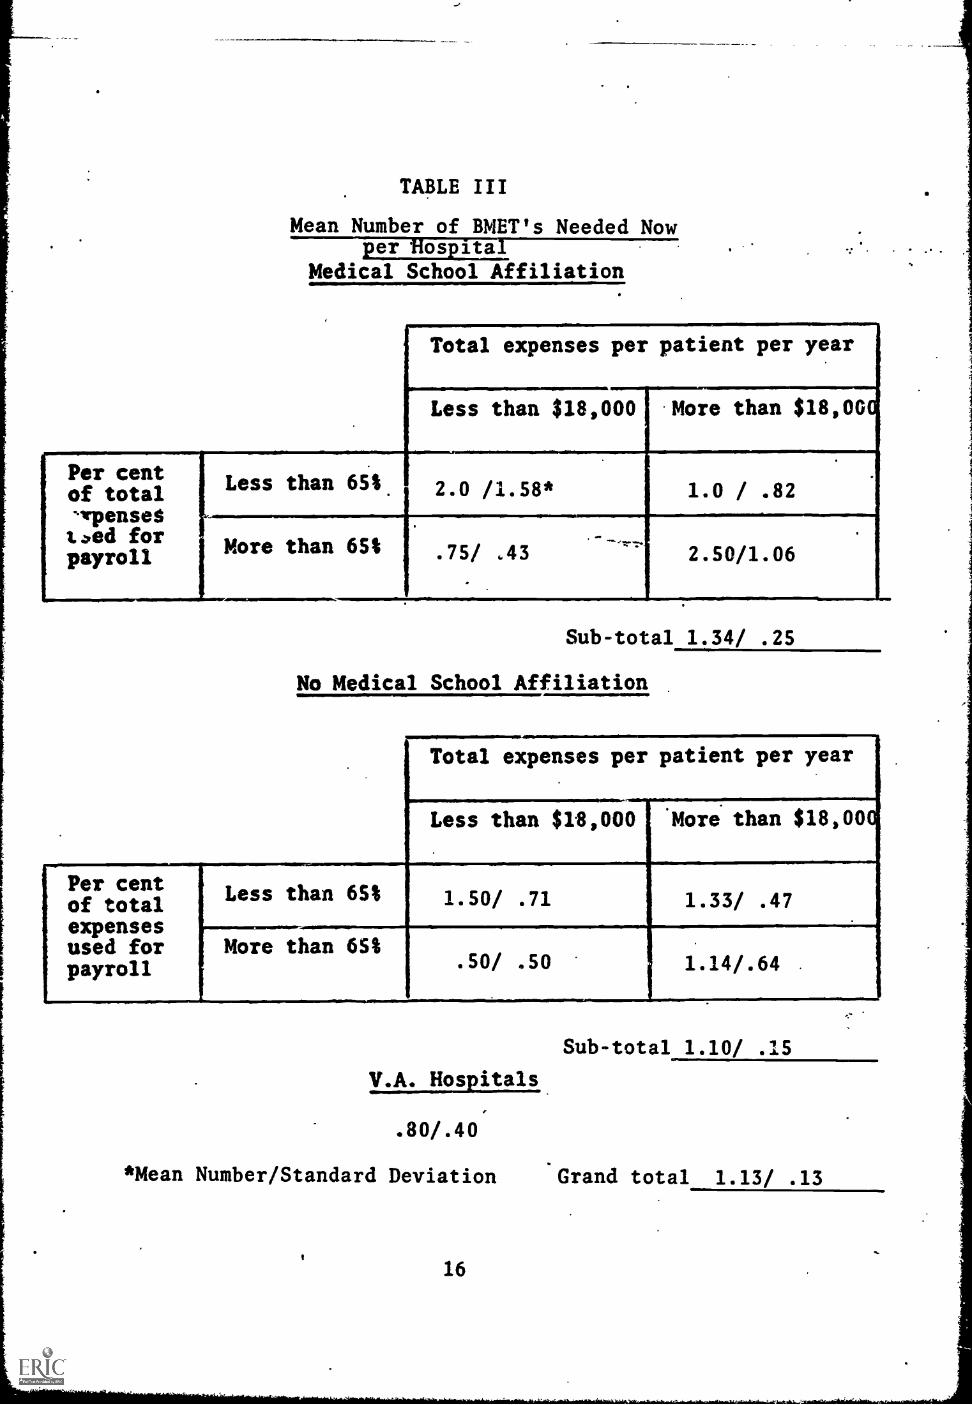
TABLE III
Mean Number of BMET's Needed Nowper Hospital
Medical School Affiliation
Total expenses per patient per year
Less than $18,000 More than $18,0
Per cent Less than 65Sof total 2.0 /1.58* 1.0 / .82irpcmseSt.)ed for More than 6S%payroll .75/ .43 2.50/1.06
[Per centof totalexpensesused forpayroll
Sub-total 1.34/ .25
No Medical School Affiliation
Total expenses per patient per year
Less than $18,000 More than $18,000,
Less than 6St
More than 65%
1.33/ .47
.50/ .50
Sub-total 1.10/
V.A. Hospitals
.80/.40
*Mean Number/Standard Deviation Grand total 1.13/ .13
16
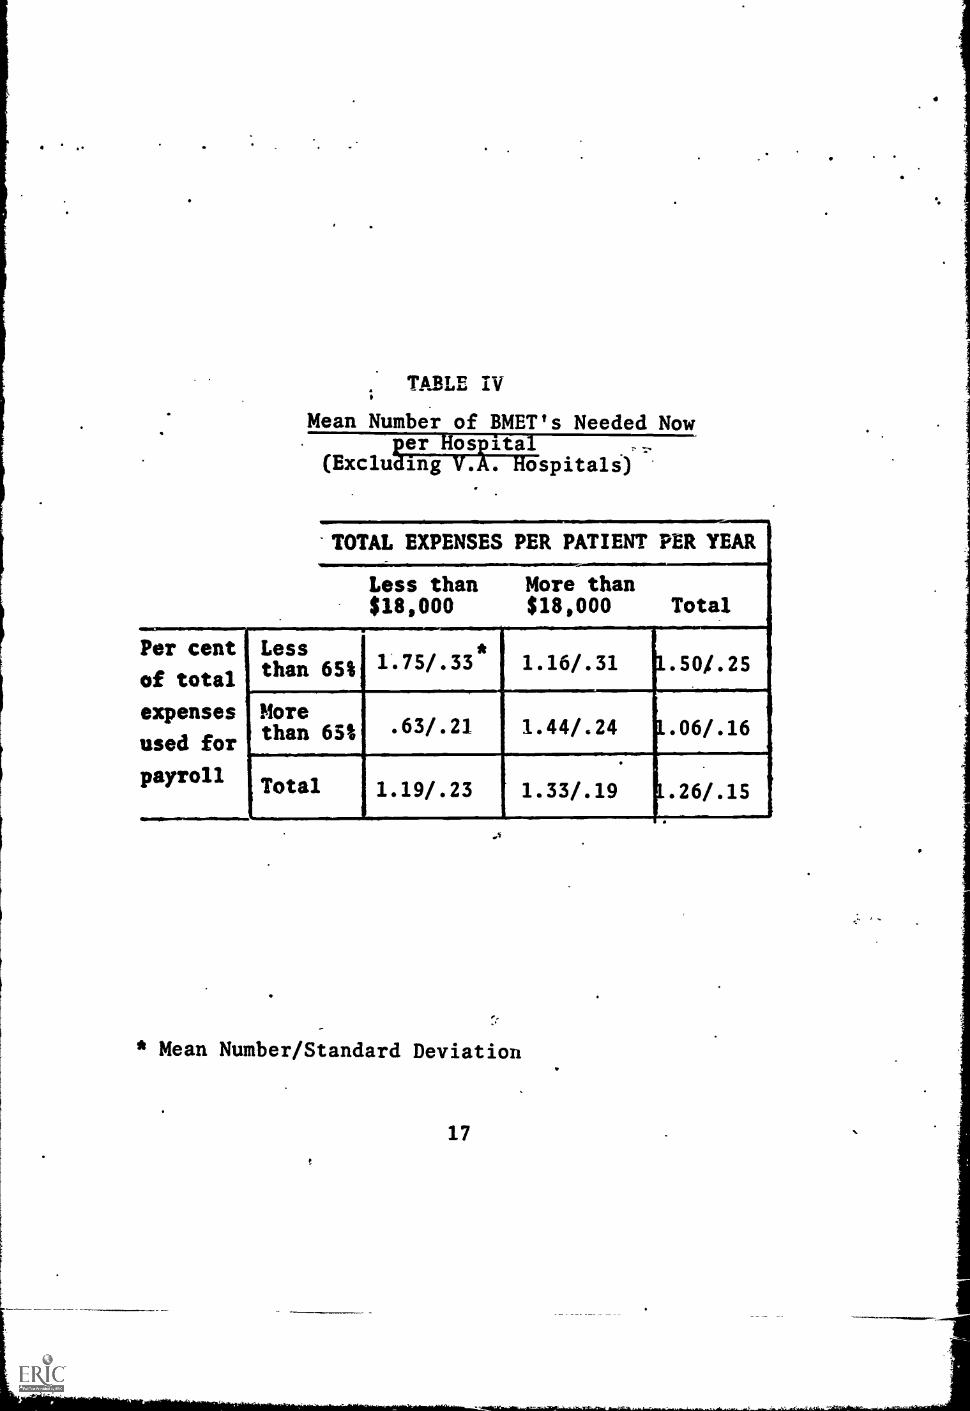
TABLE IV;
Mean Number of BMET's Needed NowRD:49AP#4
(ExcludIETV:AWispitals)
'TOTAL EXPENSES PER PATIENT PER YEAR
Less than$18,000
More than$18,000 Total
Per cent
of total
Lessthan 65%
4
1.75/.33*
1.16/.31 1.50/.25
expenses
used for
payroll
Morethan 651 .63/.21 1.44/.24 1.06/ .16
Total 1.19/.23 1.33/.19 1.26/.15
* Mean Number/Standard Deviation
17
:an draw accurate conclusions only when the interactionof the three variables is taken into account.
Tables CI and CII in the Appendix contain the extrapol-ation of the means reported above to the hospital sub-population. The actual numbers do not necessarilyclosely reflect the means reported in Tables I and IIbecause of the variations in the size of each sub-group.The grand total is reported, with 80% confidence limits,that there is a need for between 175 and 228 biomedi-cal equipment technicians in hospitals having the char-acteristics identified in the previous section.
2. Projected 1970 Need
The respondents were less able to specify =a number ofBMET's needed on their staffs by 1970. In fact, onesub-group could make no estimate at all. Tables BVand BVI in the Appendix contain the proportion of res-pondents who specified a need for BMET's in 1970.
Tables V and VI contain the mean number of BMET'sspecified by those respondents in each of the sub-groups. The overall results of the mean number of BMET'sneeded on current staffs is supported by the data onprojected 1970 need, as is also the rather complex in-teraction of the variables. However, the pattern ofinteraction is somewhat different. This pattern is, ofcourse, disrupted by the failure of the one sub-groupto provide any estimate of their staff needs of 1970.One of the most interesting deviations from the patternreported for current staffs is that the sub-group lack-ing MSA, but with a relatively high PC and low TE, forwhich there was the lowest mean number of BMET's need-ed on their current staffs, now has the second highestmean number for their 1970 staffs.
Tables CIII and CIV contain the extrapolations of themeans reported above for the hospital sub-population.At an 80% confidence level there is a need for between286 and 398 BMET's by 1970 in hospitals with the char-acteristics identified in the previous section.
3. Growth Estimate in the Need
There is a danger that one will infer a growth rate inreporting two estimates of need differing by an amount
18
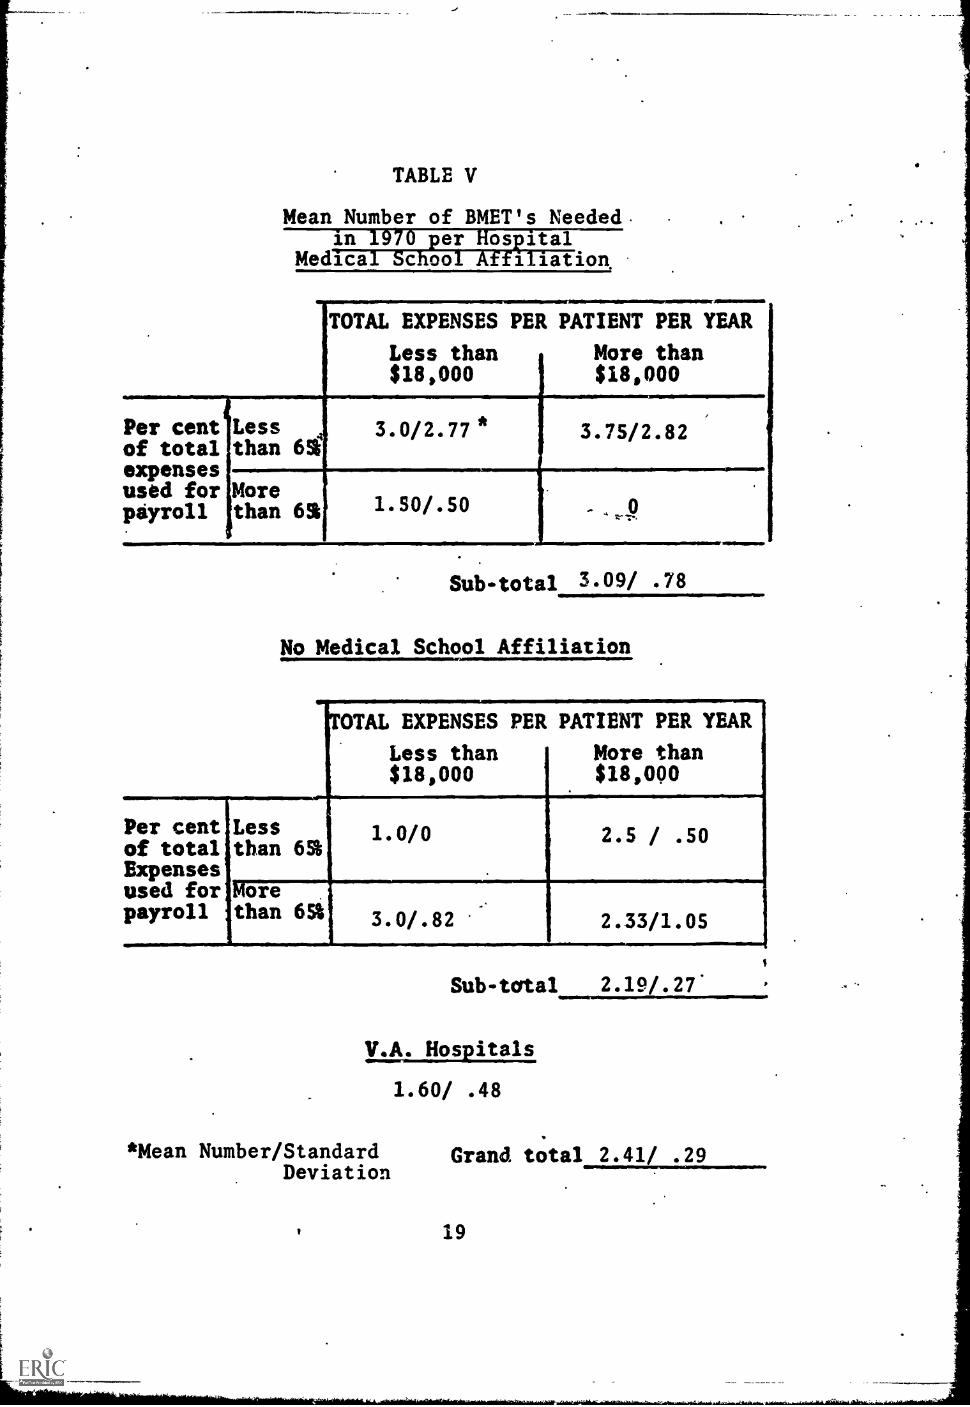
TABLE V
Mean Number of BMET's Neededin per osaital
Medical School Affiliation,
TOTAL EXPENSES PER PATIENT PER YEAR
Less than More than$18,000 $18,000
Per centof totalexpensesused forptyroll
Lessthan 62
3.0/2.77 * 3.75/2.82
Morethan 62 1.50/.50
Sub-total 3.09/ .78
No Medical School Affiliation
NOTAL EXPENSES PER PATIENT PER YEAR
Less than More than$18,000 $18,000
Per centof totalExpensesused forpayroll
Lessthan 65%
Morethan 65%
1.0/0 2.5 / .50
3.0/.82 2.33/1.05
Sub-total 2.19/.27'
V.A. Hospitals
1.60/ .48
*Mean Number/StandardDeviation
Grand total 2.41/ .29
19
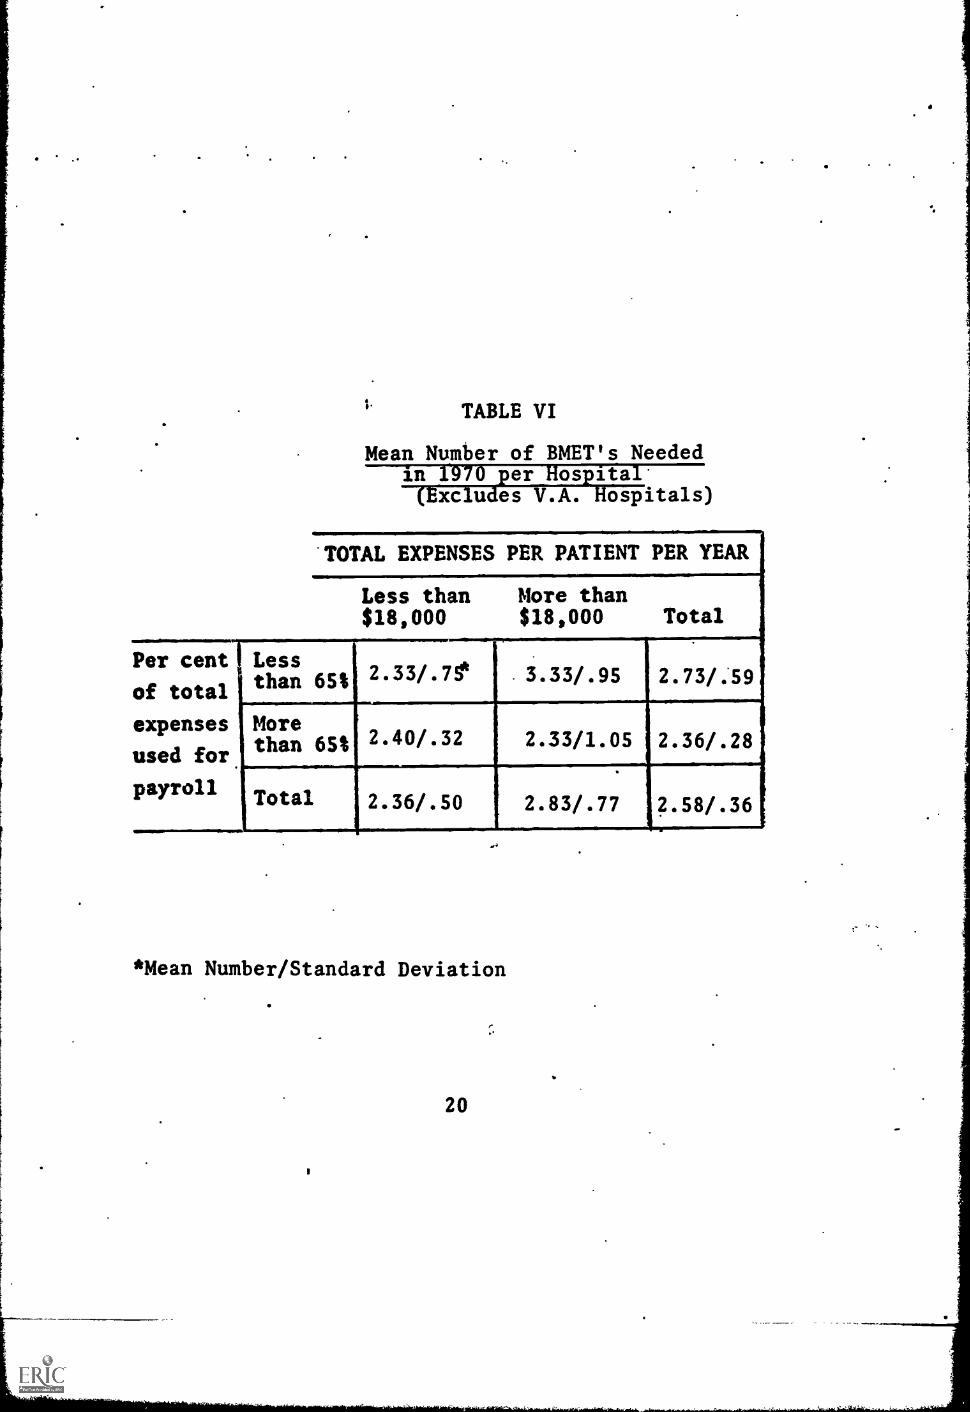
TABLE VI
Mean Number of BMET's Needed
xc u es V.A. ospitals)
TOTAL EXPENSES PER PATIENT PER YEAR
Less than More than$18,000 $18,000 Total
Per cent
of total
expenses
used for
payroll
Lessthan 651
Morethan 65%
Total
2.33/.75*
2.40/.32
2.36/.50
*Mean Number/Standard Deviation
20
3.33/.95
2.33/1.05
2.83/.77
2.73/.59
2.36/.28
2.58/.36f

of time. The report of each time period was indepen-dent of the other and many respondents were not ableto provide an estimate for both points in time. Inorder to estimate the growth rate of the need forBMET's, it would be necessary to analyze the responsesof those who provided data for both points in time.Tables VII and VIII contain the results of such an an-alysis. The numbers in parentheses indicate the propor-tion of respondents who provided estimates of both cur-rent and 1970 need. The statistics reported in TablesVII and VIII are the mean proportion increase in the num-ber of BMET's between now and 1970. The most startlingresult contained in the tables is that those hospitalswhich reported the lowest need for BMET's report thegreatest growth rate. The degree of interaction amongthe three variables is not as pronounced with respect tothe growth rate as it is with respect to the need. InTable VII the comparison among sub-groups is about whatwould be expected on the basis of the overall findings.In Table VIII the interaction is opposite to the di-rection of the interaction reported in Table IV.
B. Variables Related to the Need for BMET's
The variables stratifying the hospital sub-populationwere chosen after consultations with persons familiarwith hospital organization. The considerable inter-action of these variables with regard to the currentand projected needs for the BMET and to the growthrate of this need indicates their unsuitability; thatis, the pattern established by the 9 sub-groups is in-dependent of the three stratifying variables.
Using the need and growth rate data, the 9 sub-groupscan be placed into the following five categories ofneed: above average, average, below average, decreas-ing, and increasing. This categorization contains oneor two inconsistencies, but in general, it avoids thecomplexity of the interaction among the stratifyingvariables and the variation with respect to expressedneeds on current staffs and projected 1970 staffs. Onesub-group (having MSA and relatively low PC and TE) ex-pressed an above average need for BMET's for both currentand projected 1970 staffs. Two sub-groups (both lack-ing MSA and having relatively high TE but having oppos-ite PC values) expressed a need for BMET's approxima-ting the overall mean need. Two sub-groups (the VA
21

TABLE VII
Mean Proportion Increase in Need for BMET'smuUsuulltiOLILLP115EULT1
Medical School Affiliation
Total expenses per patient per yeareLess than $18,000 More than $l8,00
Per centof total%Timm'sted forpayroll
Less than 65%. 1.87 (.69)* 2.33 (.5)
More than 651 2.0 (.33) no estimate
Sub-total 2.06 (.37)
No Medical School Affiliation.
Total expenses per patient per year
Less than $18,000 More than $18,00
Per centof totalexpensesused forpayroll
Less than 65% 1.0 (.11) 2.5 (.33)
More than 65%3.0 (.22) 2.16 (.56)
V.A. HosEitals
1.5 (.33i
Sub-total 2.27 (.33)
Grand total 2.11 (.35)
* Mean Proportion Increase (Proportion of sample respondingto this question.)
22

TABLE VIII
Mean Pro ortion Increase in Need for BMET's221122spital (1966-1970
TOTAL EXPENSES PER PATIENT PER YEAR
Less than$18,000
More than$18,000 Total
Per cent Lesst
of totalthan 651
expenses More
used forthan 65%
payroll iTotal
1.73
2.4
2.03
(.33) 2.39 (.42) 2.06 (.37
(.27) 2.16 (.40) 2.27 (.33
(.30) ,2.28 (.41) 3.16 ..35
* Mean Proportion Increase (Proportion of sample respondingto this question.)
23

sub-group, and one having MSA, relatively low TE andrelatively high PC) expressed a below average needfor BMET's for both the current and 1970 staffs. Twosub-groups (one having MSA and both relatively high TEand PC, the other. lacking MSA and both relatively lowPC and TE) expressed an average or above need for BMET'son the current staffs, but either could not estimatefor the 1970 staffs or indicated a below average needfor BMET's. Two sub-groups (one having MSA, a rela-tively high TE and relatively low PC, the other lack-ing MSA and having a relatively low TE and relativelyhigh PC) expressed a need for BMET's opposite to thatof the previous category; that is, a below averagecurrent need and an above averageineed for 1970.
1. Definition of Variables
Several variables may be used to study the relation-ship among the categories of sub-groups mentioned above.These variables can be placed into one of two generalclassifications. The data from one type of variablewas gathered independent of the field study and is rel-atively objective and subject to little variation. Var-iables of this type are: number of beds, type of con-trol, region in which the hospital is located, and typeof city in which the hospital is located. Data forvariables of the second type were collected as a partof the field study, and although the data are objec-tive, they are not precise. These variables are: theamount of investment in bio-medical equipment, theyearly expenditure in bio-medical equipment, and theyearly expenditure in personnel and services associatedwith the equipment. Analysis of these variables was con-cerned with the distribution of the responses ratherthan the content of the responses; that is, the analysiswas concerned not so much with specific figures, butrather with a respondent's relative position with res-pect torthe other respondents. The distribution of thetwo variables concerning equipment were trichotimized,providing tlree groups: above average, average, and be-low average; the variable concerning personnel and ser-vices was dichotimized, providing an above and below av-erage group. Appendix D contains a further exposi-tion of this type of analysis.
Two variables need a brief explanation. Data on a hos-pital's type of control, taken from the AHA Guide, in-
,24

dicated that there were four types of control in thesub-population studied here. First was the govern-mental non-federal type of control, consisting primar-ily of city hospitals, although one of this group wasa counthospital. Second was the church affiliatedvolunta2y, non-profit type. VA hospitals and one USPublic Health Service hospital comprised the thirdgroup of governmental federal hcspitals. The finalgroup, other voluntary, non -profit, consists primarilyof community as distinguished '.:TOM city hospitals.
There are tvo obvious classifications of the city typevariable: large cities (New York, Philadelphia, Boston)and small cities (Bangor, Maine and Altoona, Pa.). Athird category was used to include cities not clearlyof either of the other two types; for example, Buffalo,New York, and Hartford, Conn. This category also in-cludes suburbs such as Brockton, Mass. and East Orange,N.J., on the assumption that these cities are more akinto large cities in their thinking and outlook than tosmall towns isolated from large urban centers.
2. The Relationshi Amon the Variables and theNeed for T s
Table IX contains the values of each variable for eachcategory of sub-group. There are two sets of compar-isons contained in Table IX: first, among the threecolumns in which the level of need is specified; andsecond, among the last twv columns in which the changein the need for BMnf's is indicated. The data withrespect to the control variable is reported in propor-tions of three of the four control types identified in
the previous section. In order, they are: governmentalnon-federal, church related voluntary non-profit, andother voluntary non-profit (community). The govern-mental federal control is not reported in the table,but one may infer its influence on the need for .BMET's,since this type of control was largely in the VA sub-group which was categorized as below average. Data onthe region variable is reported as the proportion ofeach category located in region 2. The last four var-iables reported in this table are distribution vari-ables indicating the degree of skewness in the distri-bution of respondents on each of the variables.
Considering the data relative to the level of need con-
25

TABLE IX
Com arative Data on the Need for BMET's in Hospitals
Mean Need Relatively Mean Need Chin9ingConstant (1966-70) TotalIFFTEW Above
Decreasing IncreaseN=15 N=15 N=63
Variable Average Average AverageN=12 N=15 N=6
Average. Number beds 665 475 500
Type oflConzrol .1/.2/ .2/.3/ 0/.2/
.3 ;..5 .8
.
Region2 .8 ..7 .8
City Type3 1.5 1.8 "1.5
Investment4in equipment 2.2 2.0 2.4.
Equipment4Expenditure 1.7 1.8 3.0(Annual)
PersonnelSand service 1.2 . 1.4 1.8Expenditure
420 390 450
.1/.1/ 0/.3/ .1/.2/
.8 .7 .6
"-:V. .7 .7
1.9 1.8 1.7
1.9 1.9 2.0
2.0 1.8 2.0
1.3 1.1 1.3
1. Proportion of hospitals controlled as follows:Governmental, non federal (primarily city)/Church related/Other voluntary non-profit (primarily community hospitals)
2. Proportion of hospitals in Middle Atlantic region. Remainderin New England.
3. Index of city 1=Large city; 2=Middle sized or suburbancity; 3=Small city
4. Measure of symmetry of distribution. See Appendix D.Perfect symmetry = 2.0
5. Measure of symmetry of distribution. Perfect symmetry =1.5
26
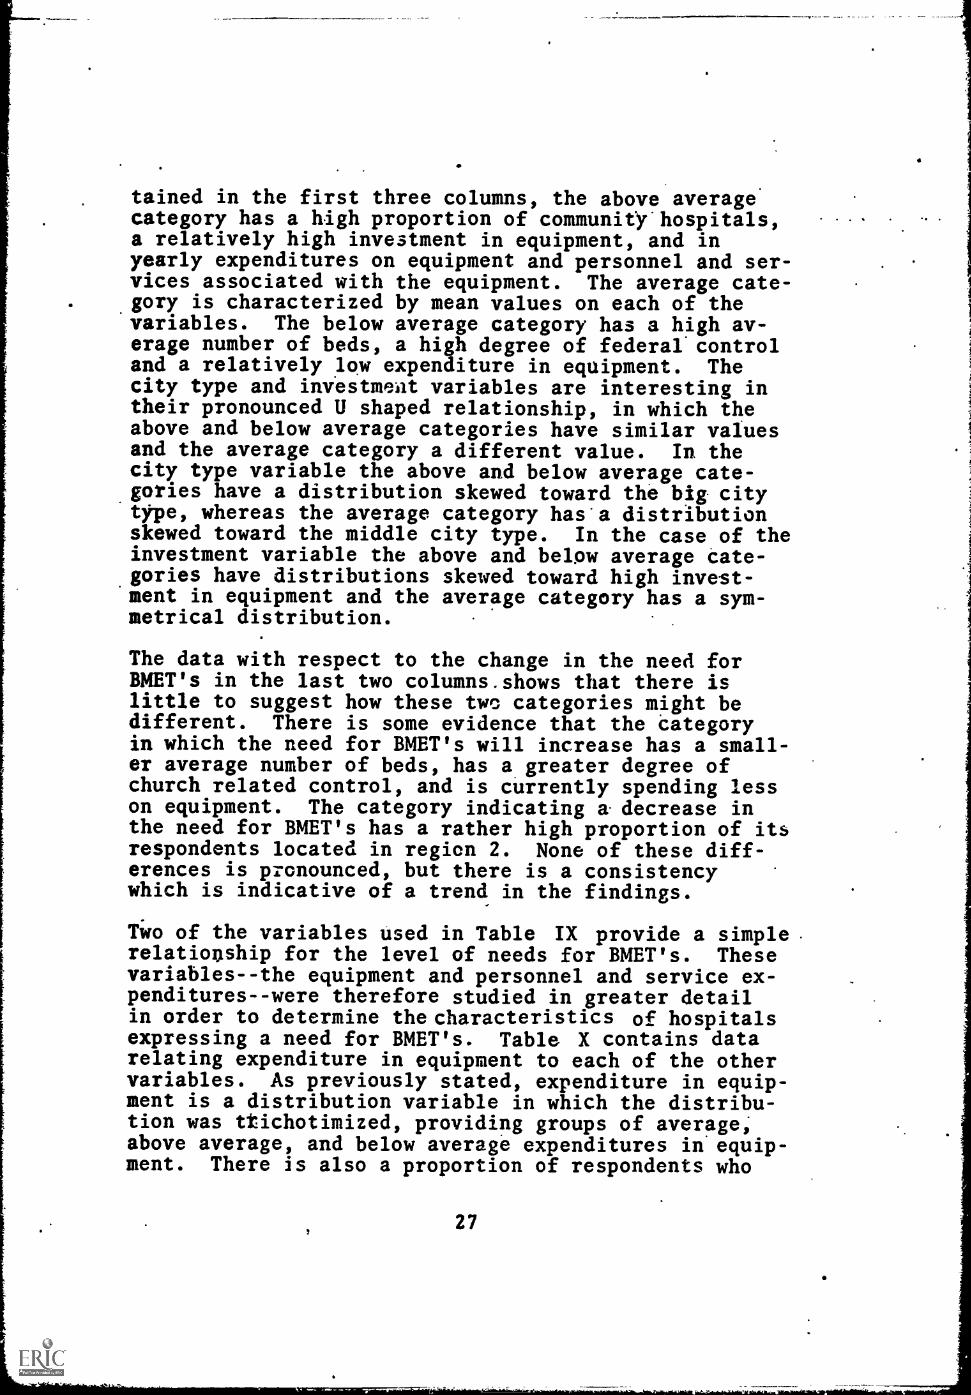
tained in the first three columns, the above averagecategory has a high proportion of community hospitals,a relatively high investment in equipment, and inyearly expenditures on equipment and personnel and ser-vices associated with the equipment. The average cate-gory is characterized by mean values on each of thevariables. The below average category has a high av-erage number of beds, a high degree of federal controland a relatively low expenditure in equipment. Thecity type and investment variables are interesting intheir pronounced U shaped relationship, in which theabove and below average categories have similar valuesand the average category a different value. In thecity type variable the above and below average cate-gories have a distribution skewed toward the big citytype, whereas the average category has a distributionskewed toward the middle city type. In the case of theinvestment variable the above and below average cate-gories have distributions skewed toward high invest-ment in equipment and the average category has a sym-metrical distribution.
The data with respect to the change in the need forBMET's in the last two columns.shows that there islittle to suggest how these two categories might bedifferent. There is some evidence that the categoryin which the need for BMET's will increase has a small-er average number of beds, has a greater degree ofchurch related control, and is currently spending lesson equipment. The category indicating a decrease inthe need for BMET's has a rather high proportion of itsrespondents located in region 2. None of these diff-erences is pronounced, but there is a consistencywhich is indicative of a trend in the findings.
Two of the variables used in Table IX provide a simplerelationship for the level of needs for BMET's. Thesevariables--the equipment and personnel and service ex-penditures--were therefore studied in greater detailin order to determine the characteristics of hospitalsexpressing a need for BMET's. Table X contains datarelating expenditure in equipment to each of the othervariables. As previously stated, expenditure in equip-ment is a distribution variable in which the distribu-tion was ttichotimized, providing groups of average,above average, and below average expenditures in equip-ment. There is also a proportion of respondents who
27

TABLE X
Comparative Data by Level of Annual HospitalExpenditure in Equipment:
Level of Expenditure
VariableBelowAver.N=18
Avera ge
N=11
CurrentMean needfor BMET's
ProjectedMean needfor BMET's
1.00,(.5)1
2.81,(.6)1
aO
1.00(.5)
1..67
(.3)1970
Invest. in1.7
Equip.
Above NoTotal
Aver. ResponseN=13 N=63 N=21
1.75 1.13 1.09(.6) (.6) (.5)
2.33 2.41(.5) .--"r-.=-(.5)
2.1 2.4
Aver. Num.of beds
320 550 370
Type 0/.22 .09/.18 .15/.23Control2 /.56 /.73 /.46
CityType 2
1.9 1.6 1.5
Region2 .5_ .64 .92
Propor.3 .22 .45 .54MSA
Propor.4 .57 .82 .67High TE
Propor.5 .43 .64 .42
Low PC
2.00(.4)
2.0 2.1
450 480
.10/.21 .14/.191.59 /.62
1.7 1.7
.71 .76
.38 .38
.53 .25
.53 .60
1. Proportion responding to this question.2. See footnotes Table IX for explanation.3. Proportion of hospitals having Medical School affiliation.4. Proportion of hospitals having relatively high total
expenses per patient (over $18,000 per year).5. Proportion of hospitals having relatively low per cent of
payroll costs as related to Total Expenses (less than 65%).
28
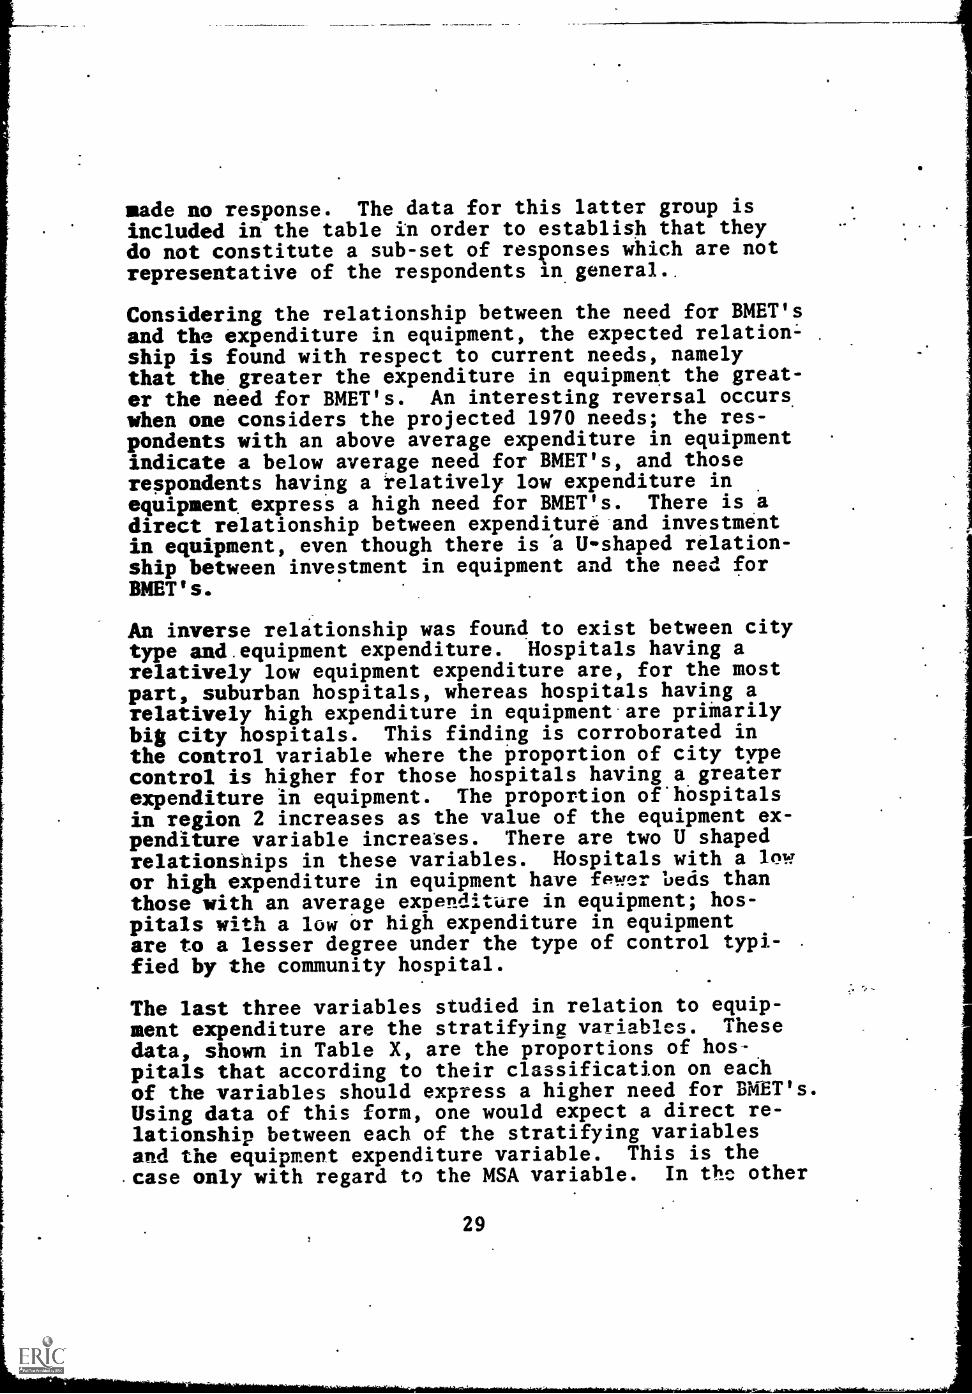
made no response. The data for this latter group isincluded in the table in order to establish that theydo not constitute a sub-set of responses which are notrepresentative of the respondents in general..
Considering the relationship between the need for BMET'sand the expenditure in equipment, the expected relation-ship is found with respect to current needs, namelythat the greater the expenditure in equipment the great-er the need for BMET's. An interesting reversal occurswhen one considers the projected 1970 needs; the res-pondents with an above average expenditure in equipmentindicate a below average need for BMET's, and thoserespondents having a relatively low expenditure inequipment express a high need for BMET's. There is adirect relationship between expenditure and investmentin equipment, even though there is 'a U-shaped relation-ship between investment in equipment and the need forBMET's.
An inverse relationship was found to exist between citytype and equipment expenditure. Hospitals having arelatively low equipment expenditure are, for the mostpart, suburban hospitals, whereas hospitals having arelatively high expenditure in equipment are primarilybig city hospitals. This finding is corroborated inthe control variable where the proportion of city typecontrol is higher for those hospitals having a greaterexpenditure in equipment. The proportion ofhospitalsin region 2 increases as the value of the equipment ex-penditure variable increases. There are two U shapedrelationships in these variables. Hospitals with a lowor high expenditure in equipment have fewer beds thanthose with an average expenditure in equipment; hos-pitals with a low or high expenditure in equipmentare to a lesser degree under the type of control typi-fied by the community hospital.
The last three variables studied in relation to equip-ment expenditure are the stratifying variables. Thesedata, shown in Table X, are the proportions of hos-pitals that according to their classification on eachof the variables should express a higher need for BMET's.Using data of this form, one would expect a direct re-lationship between each of the stratifying variablesand the equipment expenditure variable. This is thecase only with regard to the MSA variable. In the other
29

two cases. there are U shaped relationships with the high-er and lower equipment expenditure categories having .
lower values on the TE and PC proportions.
. The 'type of analysis that was carried on with respectto equipment expenditures was also applied to personnelexpenditures. A direct relationship had been estab-lished between personnel and service expenditures andthe level of need categories for the sub-groups. TableXI shows the relationships between personnel and ser-vice expenditures and the other variables. The expect-ed direct relationships between the need for BMET'sand personnel and service expenditures were obtainedfor both current and projected 1970 needs. There isalto the expected direct relationship between the invest-ment in equipment and personnel and service expenditures.
There is some support for the relationships reportedbetween characteristics of hospitals and their expen-ditures in equipment. The two most pertinent variableswere region and city type of control. With respect tosome of the other variables, however, there are someinteresting deviations from the relationships reportedin Table X. The most pronounced of these deviationsis with regaid to the number of beds. The U shapedrelationship established with regard to equipment in-vestment is not vesent with regard to personnel expen-ditures and instead there is a strong positive rela-tionship established. It is also interesting to notethat the proportion of hospitals under church relatedcontrol, which was rather evenly distributed with re-spect to the equipment expenditure variable, shows anuneven distribution on personnel and service expendi-tures (those hospitals spending the most having a verylow proportion of church related control). The citytype variable does not corroborate the relationship es-tablished with city type control as it did with respectto equipment expenditures. In the case of personneland service expenditures there is some evidence tosuggest that suburban hospitals spend more money inpersonnel and services than hospitals in other settings.
Considering the relationship between personnel and ser-vice expenditures and the stratifying variables, thedirect relationships that would be expected are obtain-ed with respect to the MSA variable and the PC variable.The very opposite relationship is obtained with respect
30

TABLE XI
arative.--Ilketditidiii7Pefsonne an ervices:
Level of ExpenditureMow 'Above
Variable Aver.. Average Total No responseN=24 N=11 NIm63 N=28
Current meanNeed for
791
BMET's(.6)
ProjectedMean need .2.36,fox BMET's (.5)11970
Invest inEquip. 4
Aver. numb.of beds
City type2
TypeControl2
Region2
Propert.3MSA
Proport.4High TE
Proport.5Low PC
1.7
.00/.25/.58 1.64
1.71(.6)
1.13(.6)
1.29(.5)
2.25 2.41 2.07(.4) (.5) (.5)
2.6 . 2.0 2.0
630 450 430
2.0 1.7 1.6
.18/.09 .10/.21 .14/.211.58 /.57
.67 .81 .71 .71
.42 .55 .48 .37
.65 .30 .53 .52
.55 .80 .53 .41
1. Proportion responding to this question.
2. See footnotes Table IX for explanation.
3. Proportion of hospitals having Medical School affiliation.
4. Proportion of hospitals having relatively high TotalExpenses per patient (over $18,000 per year).
5. Proportion of hospitals having relatively low percentof payroll costs as related to Total Expenses (less than 65%).
31

to the TE variable.
There are two factors which might influence the data re-ported here--respondent and interviewer biases. Infor-matibn about the position and background of the respon-dents was gathered and studied with respect to theirexpressed needs for BMET's. There were three types ofrespondents: the largest proportion being hospital ad-ministrators, a smaller proportion being medical staffpersonnel, a very small proportion being personnel fromother departments, and a fourth category composed ofinterviews with more than one respondent. No relation-ship was found between the type of respondent or hisbackground and his expressed needs for BMET's. Thematter of interviewer bias was also examined and someevidence was obtained to suggest that one interviewerrecorded a higher need for BMET's than the other. Asmay be seen in Tables BVII and BVIII of the Appendix,the distribution of the interviewers among the sub-groups was such that the differential influence of theinterviewer was evenly distributed among the sample, sothat the results reported here are not unduly influenc-ed by interviewer bias.
C. Characteristics of the BMET
Three questions were asked in each interview concerningthe characteristics of the BMET: his salary, his super-visor, and his functions.
1. Salary
Table XII contains the salary data. There is consider-able deviation not only within each sub-group, as shownby the standard deviations, but also among the sub-groups.This deviation becomes smaller when the sub-group isconsidered in conjunction with other sub-groups of thesame type. The grand mean salary of $7,700 has an 80%confidence range of only $240. Once again, there isevidence of interaction among the three stratifyingvariables, so that although there are relatively clearrelationships among each of the stratifying variablestaken one at a time, one is unable to comment on thesalary estimate of a particular sub-group without know-ing what value that sub-group has on each of the threevariables. When the salary figures are compared to theexpressed needs of Tables III and IV there is also an
32

TABLE XII . -Mean "Avera e" Salar of BMET in Hos itals
ical c oo A 1 cation
%UMW
TOTAL EXPENSES PER PATIENT PER YEAR
Less than More than$18,000 $18,000
Per cent Less % 6900/1970* 8200/1420of total than 62'expensesused for Morepayroll than 62 6750/1860 935011650
Per cent Lessof total than 62 9900/2130 6750/1680
Expensesused for Morepayroll than 651 7100/615 6600/1300
Sub-total 7900/430
No Medical School Affiliation
TAL EXPENSES PER PATIENT PER YEAR
Less than More than$18,000 $18,000
Sub-tat
V.A. Hospitals
7600/1140
Grand total 7700 4- 24211.
* Mean "Average" annual salary/Standard Deviation
** Indicates 80% confidence rangeA
A
33
interesting contrast where some sub-groups that expressa relatively high need for BMET's also express a rela-tively high average salary, whereas other sub-groups.do just the opposite. A case in point is the sub-groupwith MSA and relatively low PC and TB viTues. This sub-group reported a higher need on both cArrent and rro-jected 1970 staffs and yet cited ^:ao or Ole tower sal-ary ranges.
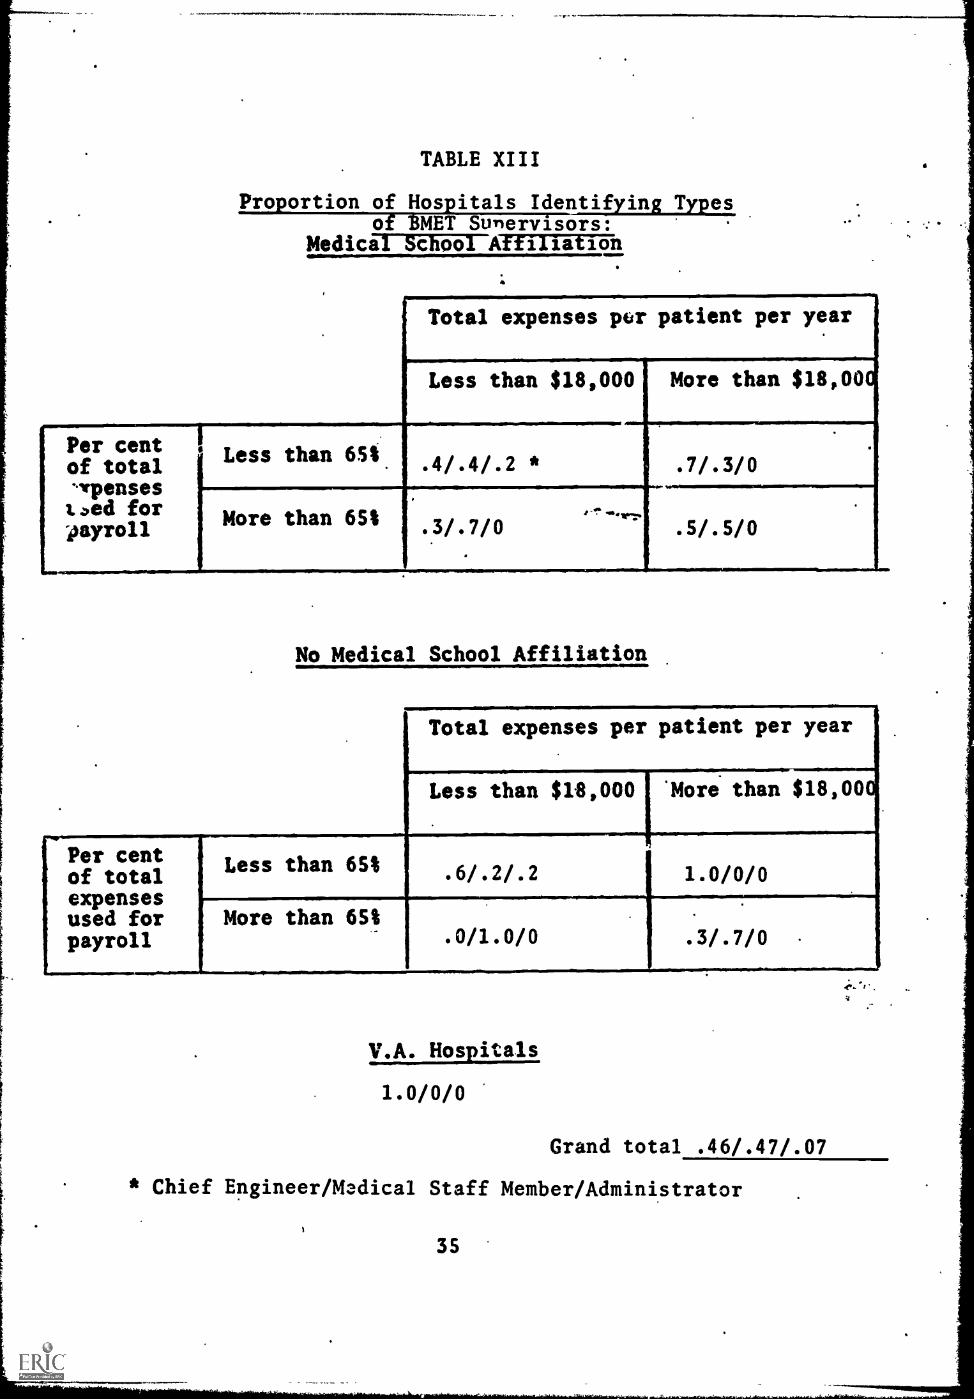
2. Type of Supervisor
There were three general types of BMET sv..orvisor iden-tified by the respondents: the chief engincr, a medi-cal staff member, and the administrator. T%-.; latterwas named by only 7% of the respondents; the ethertwo were evenly distributed among the remaining 93%.The distribution of these types of supervitors amongthe nine sub-groups was rather even, as may be seen inTable XIII. The administrator as a supervisor was iden-tified in the sub7groups having relatively low PC andTE values, although evenly distributed among the MSAand non-MSA sub-groups. Only with the PC variable wasthere an uneven distribution between the remaining twotypes of supervisor. Sixty-seven per cent of thoserespondents with a relatively low PC value identifiedthe chief engineer as the supervisor of the BMET, while691 of those respondents having a relatively high PCvalue identified the medical staff member as the super-visor of the BMET.
3. Functions of the BMET
The respondents were allowed wide latitude with regardboth to the functions and the number of types of BMET.Approximately 54% of the respondents who expressed aneed for BMET's identified only one type, 24% identi-fied two types, one respondent (2%) identified threetypes, and one respondent (2%) identified four typesof BMET's. The distribution of the number of typesof BMET's is relatively even among the nine sub-groups,as may be seen in Table XIV. The remaining 18% of therespondents suggested that they could best utilize theservice of a BMET by engaging in cooperative effortswith other hospitals.
The responses concerning the BMET's functions were codedinto five categories: service, maintenance and calibration;
34
Per centof totalvenses1.)ed forpayroll
TABLE XIII
Proportion of Hospitals Identifying Typesof BMET Sunervisors:
Medical School Affiliation
Total expenses per patient per year
Less than $18,000 More than $18,000
Less than 651. .4/.4/.2 * . 7/.3/0
More than 651 .3/.7/0.. -^' .6...vv.
. 5/.5/0
No Medical School Affiliation
Total expenses per patient per year
Less than $18,000 'More than $18,000
Per centof totalexpensesused forpayroll
F._Less than 65%
More than 65%
. 6/.2/.2 1.0/0/0
. 0/1.0/0 .3/.7/0
V.A. Hospitals
1.0/0/0
Grand total .46/.47/.07
4
* Chief Engineer/Medical Staff Member/Administrator
)
35

TABLE XIV
Proportion of Hospitals Identifying OnlyOne Type of BMET Needed
Medical School Affiliation
Total expenses pc): patient per year
Per centof total%Irpensestoed forpayroll
Less than 65% .5
More than 65%
Per centof totalexpensesused forpayroll
No Medical School Affiliation
.8
.8 (.2)
Total expenses per patient per year
Less than $18,000 More than $18,00
Less than 65t . 6 .(.3) .4 (.4)
More than 65%. 5
V.A. Hosp. tals
.6 (,2)
.8
Grand total..54 (.18)
*Proportion indicating cooperative effort
a
36

operation of equipment; instruction in the use and careof the equipment; design and modification of the equip-sent as a member of a research team; and superviiion ofhospital's equipment, i.e., generally overseeing allaspects of the equipment. Not all the functions sugges-ted by the respondents could be coded under this scheme.The 9% of the functions termed "other" included suchthings as being a lab technician, assisting in purchas-ing, and taking over some of the nurses' duties. Sincesome of the respondents were unable to specify functions,there is a category of unspecified duties.
Half of the respondents identified only the first functionof servicing, maintaining and calibrating_equipment (Hos-pital job type 1). The combination of functions reportedby the remaining respondents were examined and two addition-al types of BMET's were identified: firsf, the BMET cap-able not only of servicing And maintaining the equip-ment but rlso operating or instructing in the use and careof the equipment (Hospital job type 2). The other typeof BMET would have considerable more responsibility andwould be capable of more sophisticated duties, i.e., hewould be the member of a research team who would assistin the design and modification of equipment; or he mightbe in charge of a department whose specific purposewould be all aspects of the bio-medical equipmentwithin the hospital (Hospital job type 3).
The distribution of thre three types of BMET is not uni-form for the two periods in time for which the respon-dents were asked to provide data. In Table XV the dis-tribution of the current need for these job types isprovided. Two sub-groups identified a need for type 3BMET's. One sub-group having MSA and a relatively lowPC and relatively high TE identified a need for type 3BMET's in the same proportion as for types 1 and 2.The other sub-group lacks MSA, has a relatively high PCand relatively low TE. Fifty per cent of the techniciansthat they felt were needed now on their staffs were to beof type 3. In an overall sense the need for BMET's isevenly divided among types 1 and 2. A notable exceptionis in the case of MSA vs. non-MSA hospitals. In theformer, it is clearly desirable to have type 1 BMET's,whereas in the latter it is clearly desirable to havetype 2 BMET's. fl is relationship holds fairly evenlywithin each of the sub-groups.
37
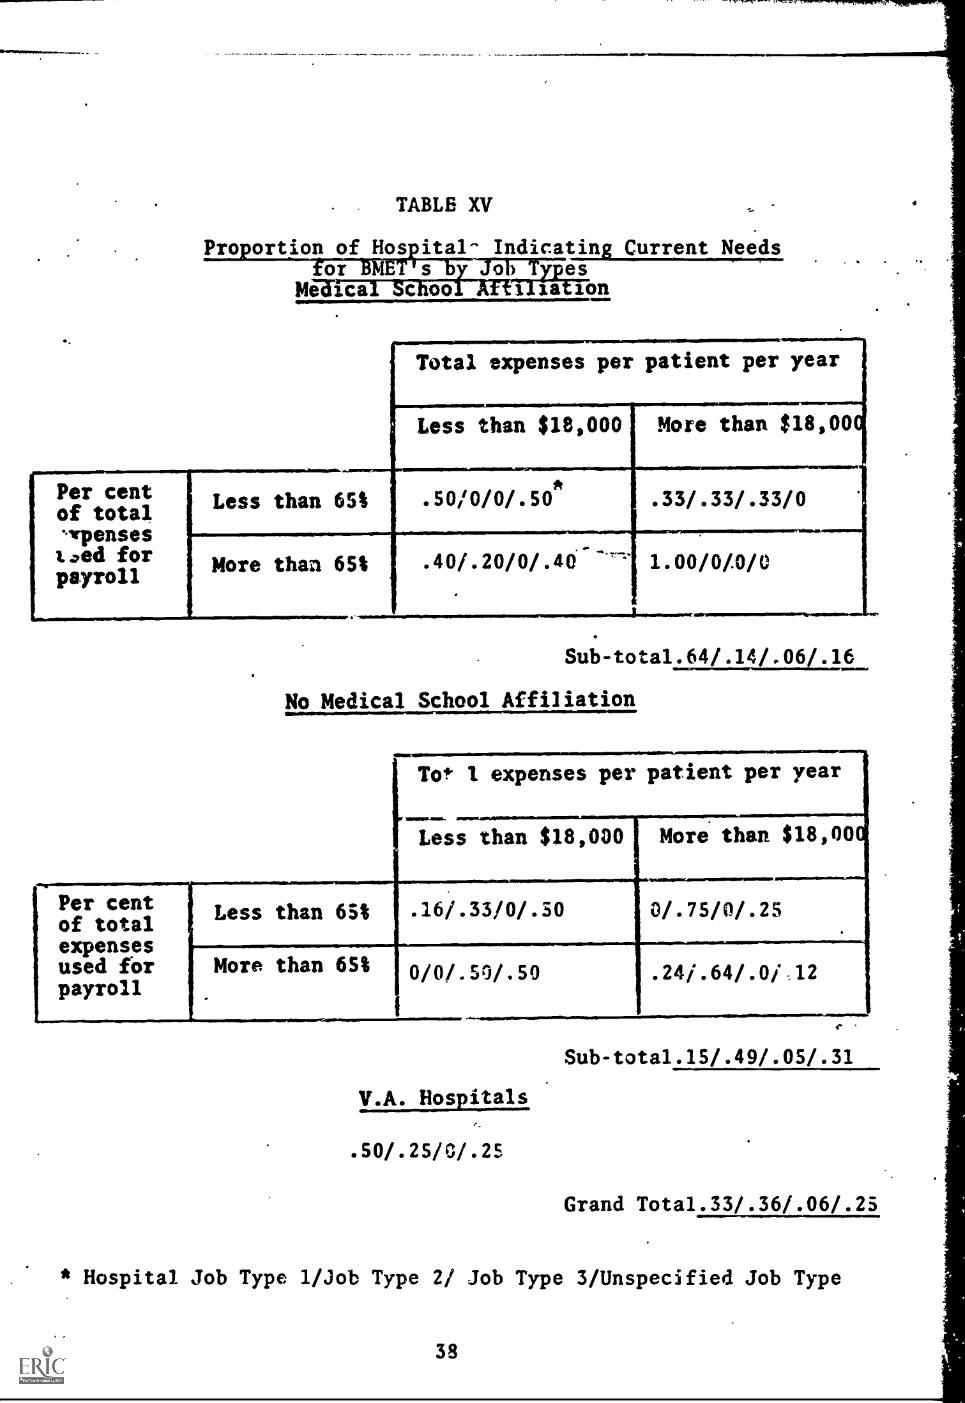
TABLE XV
Proportion of Hos ital- Indicating Current NeedsSoh T es
is ionMe ica c
Total expenses per patient per year
Less than $18,000 More than $18,00
Less than 65% . s0/0/0/.50*
More than 651
.33/.33/.33/0
. 40/.20/0/.46--"' 1.00/0/0/0
Sub-tota1.64/.14/.06/.16
No Medical School Affiliation
[To* 1 expenses per patient per year
Less than $18,000 More than $18,00
-.
Per centof totalexpensesused forpayroll
Less than 65% .16/.33/0/.50 0/.75/0/.25
More than 6S% 0/0/.50/.50 .241.64/.0i 12
r
Sub-tota1.15/.49/.05/.31
V.A. Hospitals
.50/.25/0/.25
Grand Tota1.33/.36/.06/.25
* Hospital Job Type 1/Job Type 2/ Job Type 3/Unspecified Job Type
38
As shown in Table XVI, the same general relations holdtrue for the needs of 1970, but the degree of the, rela-tionship is sharply reduced, and in fact it is not con-sistently held through all of the sub-groups. Two ofthe sub-groups having MSA declare a need fora greaterproportion of Type 2 BMET's, whereas in sub-groups lack-ing MSA there are two instances of a declaration ofgreater need for Type 1 BMET's. The Type 3 BMET's arefavored by the same two sub-groups as in current needs,but to a lesser degree in the sub-group without MSA.An additional sub-group with MSA, relatively low PCand relatively high TE, expresses a need for Type 3BMET's.
There had been the expectation that the delineation ofthe various types of BMET's would help-explain the widedeviation in the reported salaries for each of the sub-groups. There are one or two instances in which thisis true, but as is true in most of the preceding analy-ses, there are interesting exceptions and contradic-tions which prevent a simple general statement relatingsalary to job type. Table XVII contains data relativeto the type of supervisor and the salary for each jobtype.
The two most startling salary/job type comparisons arethe two most contrasting sub-groups. One has MSA, rel-atively high PC and TE values; the other does not haveMSA and has relatively low PC and TE.values. The form-er sub-group expresses a need for Type 1 BMET's andprovides no data for 1970; the latter sub-group indi-cates a need for predominately Type 2 BMET's, althoughwith some Type 1, and indicates a need for only Type 2in 1970. Yet the average salary for these two sub-groups is over $9,000 (in the latter case very closeto $10,000). Neither of these salary figures is con-sistent with any of the other findings. Nor is thereany hint of a particularly high regard for the need forBMET's. An inspection of the individual responses pro-vides no clue as to why these two sub-groups should in-dicate such a high salary.
3.9
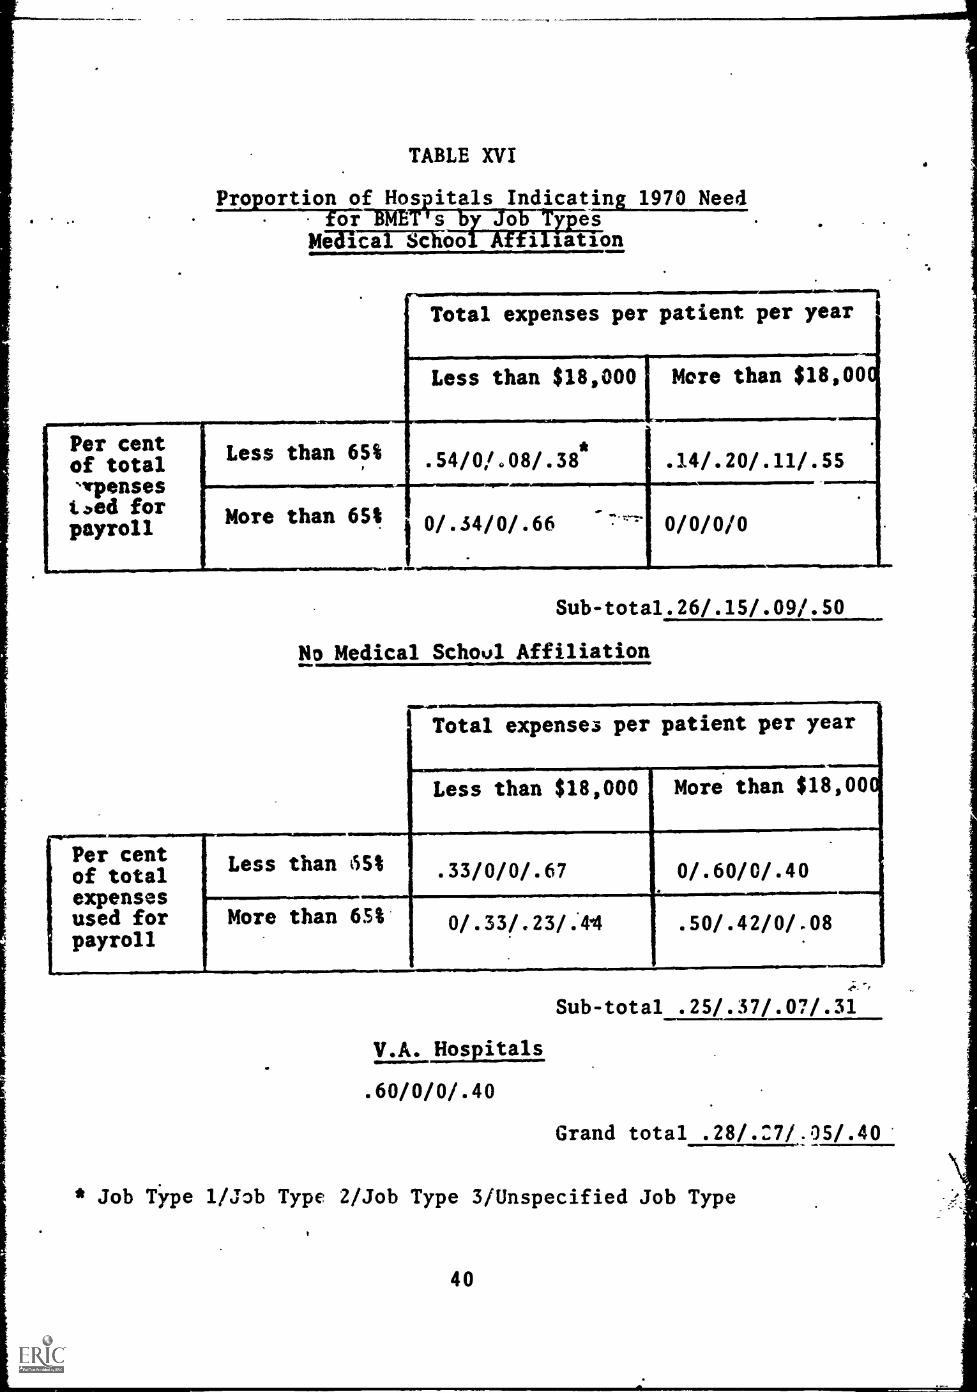
TABLE XVI
.
Proportion of Hos itals Indicating 1970 Needor-BRM s o rpes
Mel 'cal School Affiliation
Per centof total%/Tensested forpayroll
Total expenses per patient per year
Less than $18,000 More than $18,00
Less than 65% .54/0/.08/.38* .14/.20/.11/.55
More than 65% 0/.34/0/.66
gall. PM
0/0/0/0
Sub-tota1.26/.15/.09/.50
No Medical School Affiliation
41111,11R4110.
Total expenses per patient per year
Less than $18,000 More than $18,00
Less than 5S1 .33/0/0/.67 0/.60/0/.40
More than 65% 0/.33/.23/.4.4 .50/.42/0/.08
V.A. Hospitals
.60/0/0/.40
Sub-total .25/.37/.07/.31
Grand total .28/.27/.05/.40
* Job Type 1/Job Type 2/Job Type 3/Unspecified Job Type
40

TABLE XVII
Pro ortion of Hos itals Indicatin' Combinations of BMETo ypes, Supervisors an Mean Salaries
Supervisors
Hospital Chief Medical Hospital MeanJob Type Engineer Staff Member Admini$trator Salary
1
2
: 3
.37
.09;.
.04
.13
.18
.13
.04 $7300
$7400
$8500
* Reflects only hospitals who provided data on both JobTypes and supervisors.
41

Manufacturer Sub-Population
The interview guide used in the hospital sub-populationwas modified slightly for use in the manufacturer sub-population (see Appendix A-IV). The purpose of the modi-fications was to delete the questions specific to hos-pitals, and to add instead questions pretaining to bio-medical equipment manufacturers. The manufacturer sub-population is also different from the hospital sub-pop-ulation in its sample design. As previously reported,two variables were used to stratify the sub-population:type of equipment manufactured, and the assets of thecompany. With regard to the latter variable, a largesegment of the sub-population did not have any assetdata available. This segment was too large to discard,but it was too amorphous to study in detail. For thatreason alternates were not chosen for the,two sub-groups lacking asset data when the sampled manufacturerof those two sub-groups was found to be inappropriatefor interviewing; The sampling of these two sub-groupswas essentially exploratory--to gain some informationabout their characteristics. The other four sub-groupswere focused upon in the study of this sub-population.
A. The Need for BMET's
Procedures for coding responses concerning the need forBMET's were similar to those used in the hospital. sub-population. Eighty-two percent of the respondents in-dicated that the training of BMET's was a worthwhileendeavor. The distribution of this agreement amongthe sub-groups is even (see Table BIX in Appendix),with the single exception of manufacturers of physiol-ogical equipment with assets under $1,000,000. One-third of these respondents saw no need for BMET's.
1. Need on Current Staffs
Each of the respondents was asked to indicate the num-ber of BMET's needed by his company currently and pro-jected to 1970. Seventy-one per cent of the respon-dents were able to indicate a current need, but onlySitt were able to project that need to 1970. In gener-al, these proportions were evenly distributed among thesub-groups, as may be seen in Tables BX and BXI in theAppendix.
Table XVIII contains the mean number of BMET's needednow (standard deviations are included). These datashow that there is considerable difference between the
42

TABLE XVIII
Mean Number of BMET's Needed Now Per Manufacturer
Assets ofManufacturer
Type of Manufacturer
Physiological LaboratoryEquipment Equipment Total
More than0,000,000
16.75/23.17*
10.33/7.11
11.90/.2.9.0
Less than 1.75/ 16.00/ 10.3 /$1,000,000 1.26 30.03 6/58
Sub- 8.97/ 12.27 11.2,6total 2/63 5.07 2.08
No asset 8.0/ 2.67/ 4.24/data 1.15 1.53 .63
TOTAL 8.48/ 7.25/ 7.62/2.10 2.02 1.55 t
t
..s
* Mean Number/Standard Deviation
43
./.
sub-groups with and without asset data. This differ-ence is not only with respect to the number of BMET's,but also with respect to the pattern of the need. Therelationship of manufacturers of laboratory equipmentto manufacturers of physiological equipment is the re-verse of what one finds among sub-groups without assetdata compared to what one finds with sub-groups withasset data.
For those sub-groups with asset data there is a strik-ing difference between the sub-groups producing physiol-ogical equipment and having less than $1,000,000 assetsand the other sub-groups having asset data. The effectof this sub-group is not as pronounced when one comparesthe two categories of asset data, but its impact isenough to lessen the average need for BMET's among man-ufacturers of physiological equipment when compared tomanufacturers of laboratory equipment. This categoriza-tion is unfortunate, however, because the results re-ported in Table XVIII clearly establishthat three sub-groups indicate a relatively high need and the fourtha markedlylower need.
One of the more disconcerting findings reported inTable XVIII is the magnitude of the standard deviations,especially in two of the sub-groups. This finding isparticularly forceful when the means are expanded toactual numbers of BMET's needed on current staffs.These data are contained in Table CV in the Appendix.The effect of the standard deviation is noted in the801 confidence level which is more than 25% of the to-tal number needed.
The magnitude of the dispersion indicated in Table XVIIIprecludes considering each of the sub-groups as homo-geneous.' These dispersions indicate'that each of thesub-groups (with one or two exceptions) contains ele-ments of at least two contrasting groups of equipmentmanufacturers.
The most important variable studied in this report- -
the need for bio-medical equipment technicians--wasused to identify the contrasting groups. Cutting pointsof 1 standard deviation above and below the overallmean of BMET's needed were used to identify two groups.One group expresses a relatively high need for BMET's
44

(more than 9) and the other group expresses a relative-ly low need for BMET's' (less than 6). Twenty-five per-cent of the respondents were in the high group, and theyindicated a mean need of 25.5 BMET's with a range from10 to 70. Forty-two per cent of the respondents werein the lower group and indicated a mean need of 1.5BMET's with a range from 0 to 5. As indicated before291 of the respondents gave no response to this ques-tion, leaving only 41 of the respondents that could beconsidered as having an average need for BMET's. Thisis a striking result which provides evidence for atleast two modes in the distribution of the need forBMET's. The rather wide range in the high group may beindicative of one or more modes, but for the purposesof this study he analysis will be restricted to twomodes.
Data in Table XIX indicate the proportion of each sub-group classified as a high need group. These data i-dentified two sub-groups that are entirely of the lowneed classification and one sub-group which is pre-dominantly of the high need classification. The lattersub-group (manufacturers of laboratory equipment withassets greater than $1,000,000) are relatively homo-geneous and have a relatively high need for BMET's.The two sub-groups with the most interesting data are:one, manufacturers of physiological equipment withassets greater than $1,000,000; and two, manufacturersof laboratory equipment with assets less than $1,000,000Both of these sub-groups expressed a relatively highmean need and yet they are evenly distributed among thehigh and low need classifications. These two sub-groups confirm the general polarity which was observedearlier. It is also of interest to note the differ-ence in the proportion of the high need classificationamong the sub-groups for which asset data is known; yetthis difference is not as wide in the mean need. Forexample, 60% of those sub-groups having assets greaterthan $1,000,000 are classified as a high need group ascompared to 20% in those sub-groups having less than$1,000,000 in assets. However, the mean need for thehigh asset sub-groups is only 11.9 as compared to amean need of 10.3 for sub-groups with low assets. Thisapparently contradictory finding is probably the resultof the large range in the high need group. Even thoughthere is a higher proportion of high need respondents
45
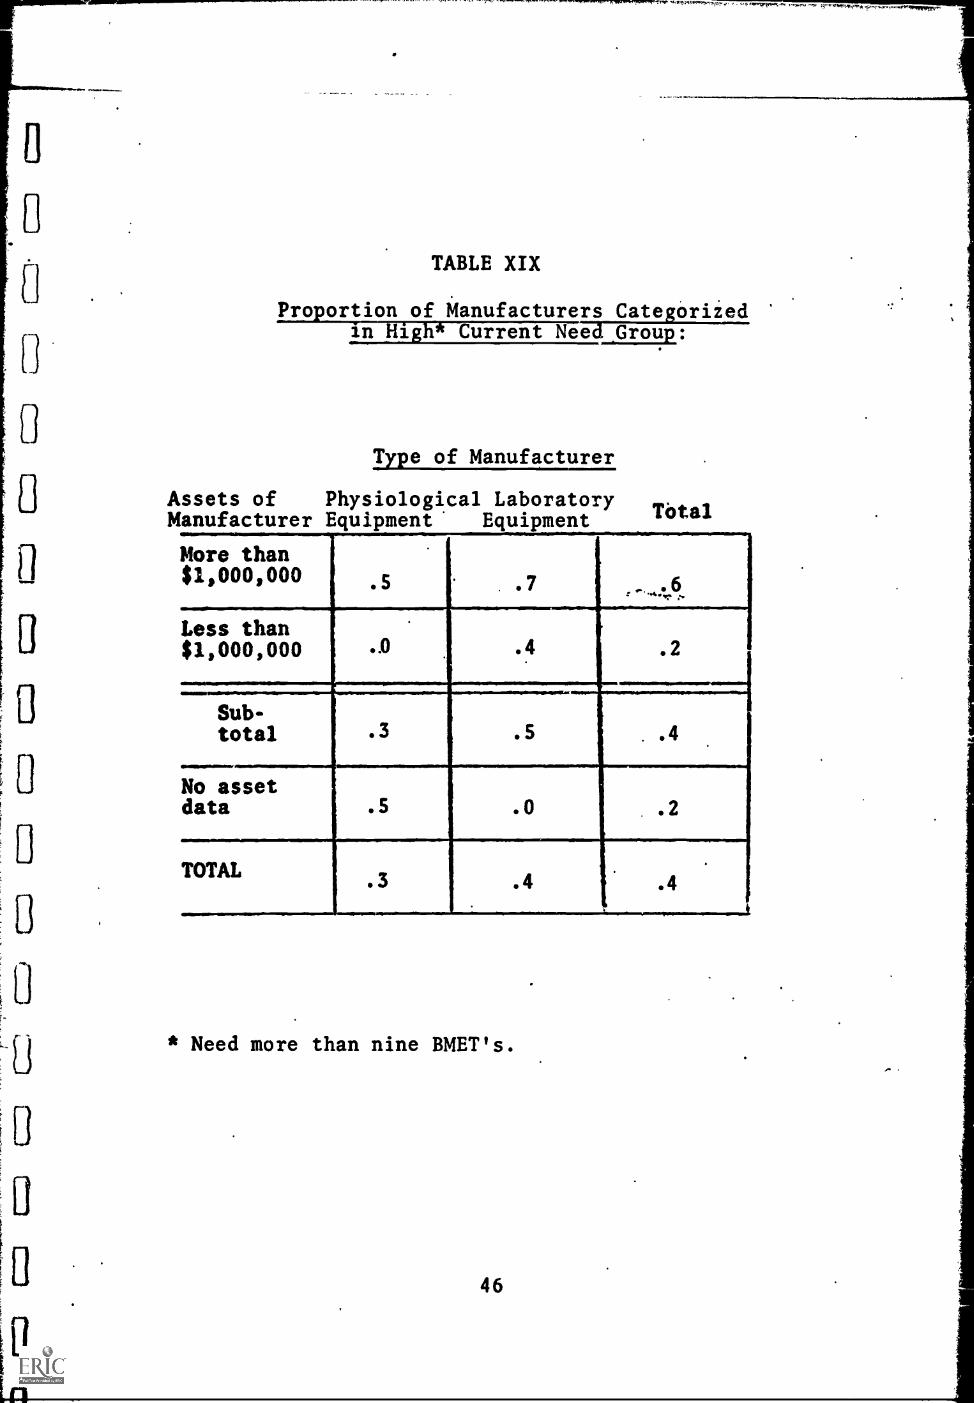
0
FrF
1,1,,,,,1
TABLE XIX
Int
iofMant--ag---ir"sCateariiedProortiolin ig Current Nee _Group:
Type of Manufacturer
Assets of Physiological LaboratoryTotalManufacturer Equipment Equipment
More than$1,000,000
:-..0.
Less than$1,000,000
.
.0 .4 .2
Sub-total 3 .5 . .4
No assetdata .5 .0 .2
TOTAL 3 .4 .4
* Need more than nine BMET's.
46

'VA
in the sub-groups with more than $1,000,000 in assets,they are probably at the lower end of the range, where-as the small proportion of respondents in the low needcategory are at the higher end of the range, therebygiving means that'are similar.
2. Projected 1970 Need
The mean number of BMET's needed in 1970 are indicatedin Table XX. The pattern for the 1970 need is almostidentical to that for current need, including a widedispersion. Once again, the no asset data sub-groupsdiffer from those having asset data both in the mag-nitude (though not to the same extent) and in thepattern. In addition, those manufacturers of physiol-ogical equipment with less than $1,000,000 assets are,once again, distinctly different from the other threein their need for BMET's. The expansion of the meanneeds to actual numbers contained in Table CVI of theAppendix reflects this pattern and also'indicates theimpact of the dispersion in terms of the 80% confidencelimit which; once again, is over 25% of the actual num-ber needed.
A classification scheme based on the data with respectto 1970 was used to identify contrasting groups ofequipment manufacturers. Cutting points of 1 standarddeviaion above and below the overall mean need wereused to create two groups: the first, a high need group,indicating a mean need of 34 or more BMET's; and thesecond, a low need group, indicating a mean need of 22or less. Twenty per cent of the respondents were inthe high need group which had a mean need of 65.9 anda range of 36 to 170. Thirty-one per cent of the res-pondents.were in the low need group which had a meanneed of 8.5 and a range of 0 to 20. As indicated pre-viously/ 46% of the respondents did not provide datafor this question, leaving 3% of the respondents whocould be considered of average need. Once again, therange of the high need group is considerable and is in-dicative of the possibility of more than one high needgroup.
Table XXI contains the proportion of respondents who'were classified as high need. Three pure sub-groupswere identified; however, two of those had no asset
47
..
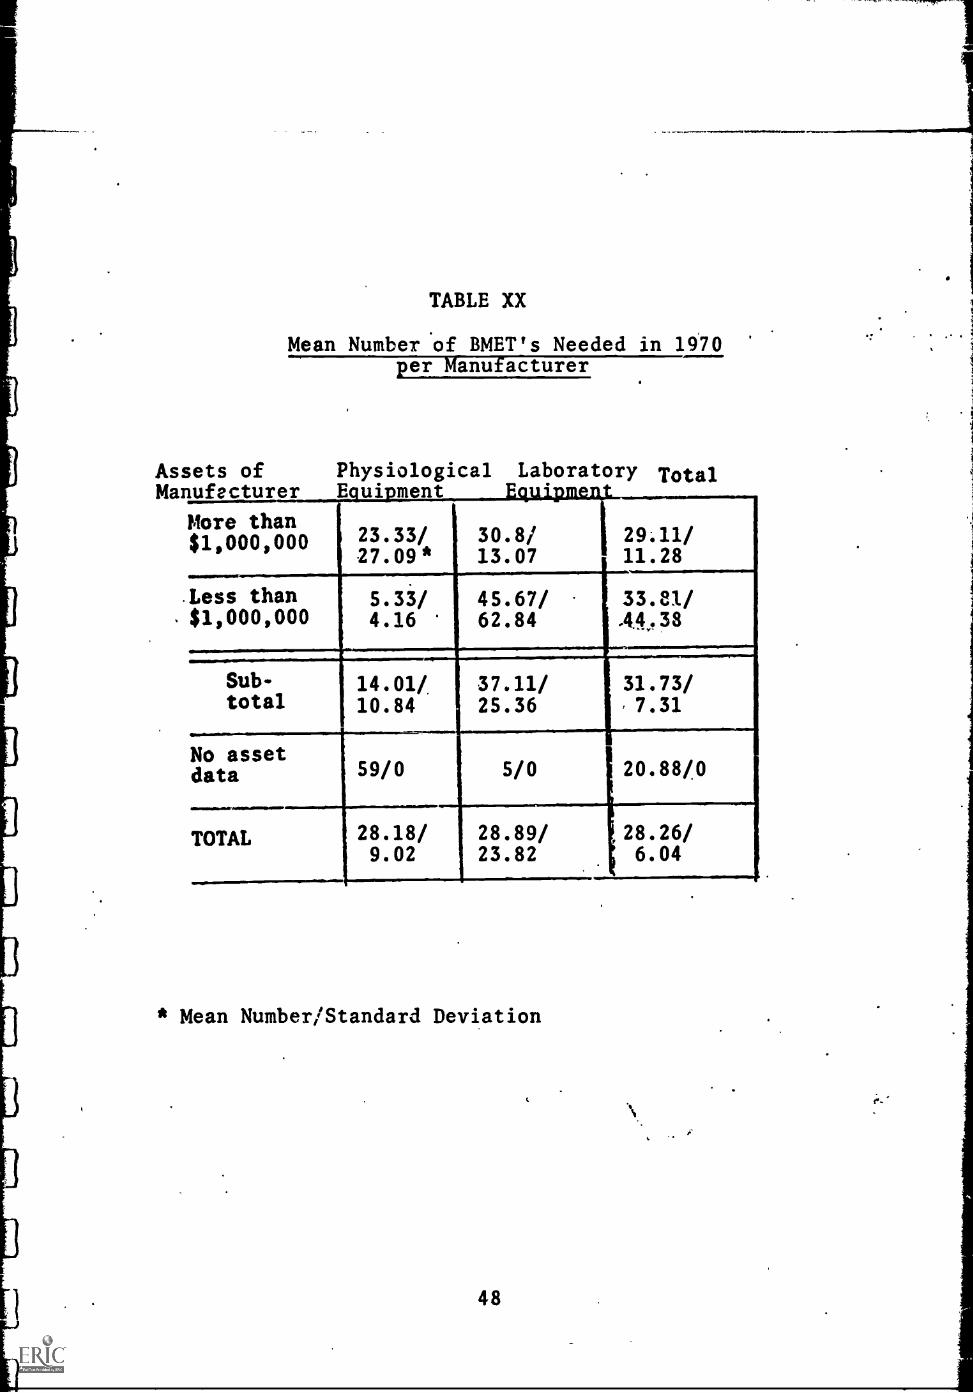
Assets ofMa
TABLE XX
Mean Number of BMET's Needed in 1970per Manufacturer
Physiological Laboratory TotalLufecturergamipment F4U112111221-----
More than$1,000,000 23.33/
.27.09*30.8/ 29;11/13.07 11.28
Less than$1,000,000
5.33/4.16
45.67/62.84
33.81/A4.8
Sub-total
14.01/10.84
37.11/25.36
31.73/,7.31
No asdata
set59/0 5/0 20.88/0
.................
TOTAL 28.18/9.02
28.89/23.82
28.26/6.04
* Mean Number/Standard Deviation
48

TABLE XXI
Proportion of Manufacturers Categorizedin High* 1970 Need Group:
Type of ManufacturerAssets ofManufacturer Physiological Laboratory Total
More than$1,000,000 .3 .5 .4
Less than$1,000,000 .0 .5 .3
Sub-total.2 .5 .4
No assetdata d 1.0 .0 .5
Total.3 .5 .4
Ned more than thirty-four BMET's.
1
I
I
1
49

I
data and contained such a low proportion of respondentsthat they were not considered for analysis. The sub-group of manufacturers producing physiological equipmentwith assets lower than $1,000,000 is, once again, alow need group. The other three sub-groups for whichasset data were available are relatively uniform intheir proportions of nigh need classification.
Since two different criteria were used for identifyinghigh and low need groups of manufacturers it is ofinterest to note the degree of overlap in the two cate-gorizations. Sixty-four per cent of the respondentswere classified the same way under both criteria.Twenty-four per cent of those who were classified dif-ferently gave no response in reply to a 1970 need. Ofthe remaining 12% only 4% were classified high need forcurrent staffs and low need for the 1970 staff. Theremaining 8% went from high to middle or middle to high.The proportion of respondents classified the same wayis not evenly distributed among high and low classifi-cations. Forty per cent of the respondents classifiedthe same way were in the high group; the remaining 60%were in the low group.
3. Growth in the Need for BMET's
As stated in the analysis of the hospital sub-populationdata the comparison between the need for BMET's in cur-rent staffs and 1970 staffs should not be construed toindicate the growth of the need for BMET's, since theseare two independent estimates of need and are not nec-essarily related. The data provided by those respon-dents who gave estimates for both current and 1970needs were analysed with respect to the relationshipimplies'. Table XXII contains the mean proportion be-tisreen BMET's needed in 1970 compared to BMET's needednow. These data indicate that the sub-groups whichmanufacture physiological equipment perceive a greatergrowth rate than those who produce laboratory equipment.The overall growth rate of 2.2, when applied to theactual number indicated as a current need for BMET's,yields an estimate of 2,195 BMET's needed in 1970.This figure compares quite favorably with the estimateof 2,235 BMET's derived previously. The data of thoserespondents categorized into high and low need groupsusing both criteria were analysed to give an indication
50

. TABLE XXII
Mean Pio ortion Increase in Need for BMET'smap acturer 1966-1970
Assets ofMa
4
Totaluffacturer Ph .. . .DO .k.
More than$1,000,000, .5 GS/ 2.5 (.6) 2.7 (.5)
Less than$1,000,000 3.2 (.5) 2.6 (.6) 2.6 (.5)
.
Sub-total 3.4 (.5 ) 2.6 (.6) 2.7 (.5)
No assetdata 3.7 (.3) 1.3 (.3) 2.5 (.3)
TOTAL 3.5 (.5) 1.9 (.6) 2.2 (.5)
..,
* Mean proportion increase (Proportion of sample respondingto question.)
51

of the growth for those two sub-groups. The respondentsindicating a relatively high need provided.a growth rateof 2.8 BMET's, whereas the respondents who indicated arelatively low need provided a growth rate of 4.6BMET's.
B. Variables Related to the Need for BMET's
The considerable variance and its relative independencefrom the stratifying variables suggests that 1.hey arenot useful in studying the relationships concerningthe need for BMET's in this sub-population. Instead,the categorizations formed on the basis of expressedneed data (both current and projected) will be used.In spite of the 64% overlap between the two character-izations, there was some deviation in the comparisonbetween high and low need groups that suggested eachcategorization should be reported separately.
1. Definition of the Variables
Four variables were used to study the need for BMET's:the per cent of "resources" in the bio-medical field,the per cent of a company's resources in the serviceand maintenance of equipment, the number of men usedto service and maintain equipment, and the ratio be-tween the number of men needed for service and $100,000in sales. The latter three are distribution variables.The resources variable was used to identify four groupsof equipment manufacturers, but the identification wason the basis of the percentages and not on the basisof the distribution. This variable was not treated asa distribution variable because it was felt that theresponses were not sufficiently reliable. The variablerepresenting the ratio of BMET's to sales served thedilal purpose of providing data both with respect tothe need for BMET's and for the possible conversion ofindependently gathered sales data to the need for BMET's.
Comparative data between the high and low need groupsdefined on the basis of current need for BMET's is con-tained in Table XXIII. There is a column for thoserespondents who failed to express a need for BMET's toestablish the characteristics of that sub -group. Thereis some evidence to support the expected differencesbetween the high and low need groups: the high need
52

TABLE XXIII
Comparative Data Between Manufacturers H4ying Highand Low Current Need for BMET's ii)
Low needVariable N=15
High needN=9
TotalN=35
No responseN=10
Currentmean need 1.5 (.4)(2)for BMET's
Proport. ofresources in-
.41vested inbio-medicalequip. mfg.
Resources(3)1.7in service
Men used inservice ofbio-medic 41,
1.7
equipmentLJ)
BMET's needed$100MQ 1.3
in sales k"
Proportionproducing .5physiologi-cal equip.
Proportionwith $1,000,000 .3or more assets
25.5
.48
2.3
2.1
1.3
.3
.7
(.3) 7.6
.43
2.0
2.0
1.3
.4
.4
(.7) -- (.3)
.41
2.0
3.0
1.5
.5
.4
(1) One manufacturer having average current need not included.
(2) Mean Need (Proportion responding to this question).
(3) Measure of Symmetry of Distribution.Perfect symmetry = 2.0
(4) Measure of Symmetry of Distribution.Perfect symmetry = 1.5
53
See Appendix D
See Appendix D
group is in the bio-medical field to a larger degree,has a-higher percentage of its resources in service,.and uses a greater number of men with regard to ser-vice.and maintenance. It is of interest tc note that
ratioatio between BMET's and sales does not distinguishthe high from the low need group, nor is there a pro-nounced distinction between the proportion of manu-facturers in physiological equipment. The proportionof manufacturers having $1,000,000 or more in assetsdoes serve as a distinguishing characteristic betweenthe two groups. With regard to the sub-group thatfailed to express a need for BMET's, there is evidenceto suggest that they are representative of the sub-population in general, the most notable exceptionbeing with respect to the variable of the number ofmen used in service. In this instance they exhibit adistribution that is skewed greatly toward the highernumber of men. This finding is remarkedly inconsis-tent with the conception of a sub-group that failed toexpress a need for BMET's.
Comparative data on the high and low need groups ofmanufacturers for projected 1970 needs are contained inTable XXIV. The expected relationships with regardto per cent of resources in the bio-medical field andthe resources in service and maintenance were obtainedin the same manner as for the current need for BMET's.The extent of the relationship is slightly greater thanthat reported for the current need. With regard to theratio of BMET's to sales there is a slight distinctionindicating that the group of manufacturers expressinga low need for BMET's sees a relatively higher ratioof BMET's to sales. This is not a pronounced distinc-tion in view of its inconsistency with the previousfinding, and it should not be regarded seriously. Themost pronounced deviation from the results of the com-parison on the basis of current needs is with regardto the proportion of manufacturers having $1,000,000 ormore in assets. On the basis of their expressed needsfor projected 1970 needs, there is no distinction be-tween high and low need groups.
When the possibility of interviewer bias was investi-gated, there vas evidence to suggest that there was aconsiderable difference in the responses recorded bythe interviewers. The assignment of interviews had
54

TABLE XXIV
Comparative Data Between Manufacturers Havingitlighand Low Projected 1970 Needs for BMETskl)
Low need High need TotalVariable N=11 N=7 N=35
No responseN=16
Projectedmean need 8.5for BMET's
Proport. ofresources in-vested inbio-medicalequip. mfg.
Resources (3)-in service
Men used inservice ofbio-medicalequipment(3)
BMET's neededper $l00,?in.sales
Proportionproducingphysiologi-cal equip.
Proportionhaving
.$1,000,000 or
(.3)
.38
1.8
1.9
1.4
.5
.4
(2) 65.9
.46
2.6
2.5
1.2
.3
.4
(.2) 28.3
.43
2.0
2.0
1.3
.4
.4
(.5) --
.51
1.9
1.6
1.2
.3
.4
viall
(.5)
more in assets
(1) One manufacturer having average current need not included.
(2) Mean geed (Proportion responding to this question).
(3) Measure of Symmetry of Distribution.Perfect symmetry =
(4 Measure of Symmetry of Distribution.Perfect symmetry = 1.5
55
See Appendix D
See Appendix D

been designed to distribute whatever interviewer biasmight have existed among the.sub-groups. As may beseen in Table BXII in the Appendix, the distributionof interviewers is rather uniform among the sub-groups.With regard to the high and low need categorization thedistribution is not uniform, but is such that the re-lationships reported with regard to the need for BMET'sare not disproportionately influenced by interviewerbias.
C. Characteristics of the BMET
The manufacturer respondents were asked to character-ize the BMET in terms of his average salary, his super-visor, and his functions. Table XXV contains the meansalary of each of the sub-groups. In general, thedeviation of the mean salary among the sub-groups isconsiderably less than that found in the hospital sub-population, but the individual sub-groups had about asmuch variance in their responses with respect to salaryas did the hospitals. Only one of the sub- groups forwhich complete data were available deviated noticeablyfrom the overall mean of $7000--those manufacturersproducing physiological equipment with assets morethan $1,000,000 perceive an average salary of $8800.This is a particularly high value when one considersthat this was the sub-group that indicated a higherratio :f BMET's per $100,000 sales of equipment. Thesetwo findings would indicate that manufacturers of thistype are heavily committed to the service and mainten-ance of their equipment.
Four types of supervisor for the BMET were identifiedby the manufacturer respondents: a professional or re-search person, a sales staff person,.the service man-ager, and a production or plant manager. These fourtypes were evenly distributed among the respondents,as may be seen in Table XXVI. There were, however, somenotable exceptions. The sales supervisor was primarilyin the sub-group producing physiological materials andhaving assets less than $1,000,000. (This is the sub-group that has consistently been uncommitted to theservice and maintenance of its equipment and hasexpressed a relatively low need for BMET's.) Con-versely, the service manager type of supervisor was
56
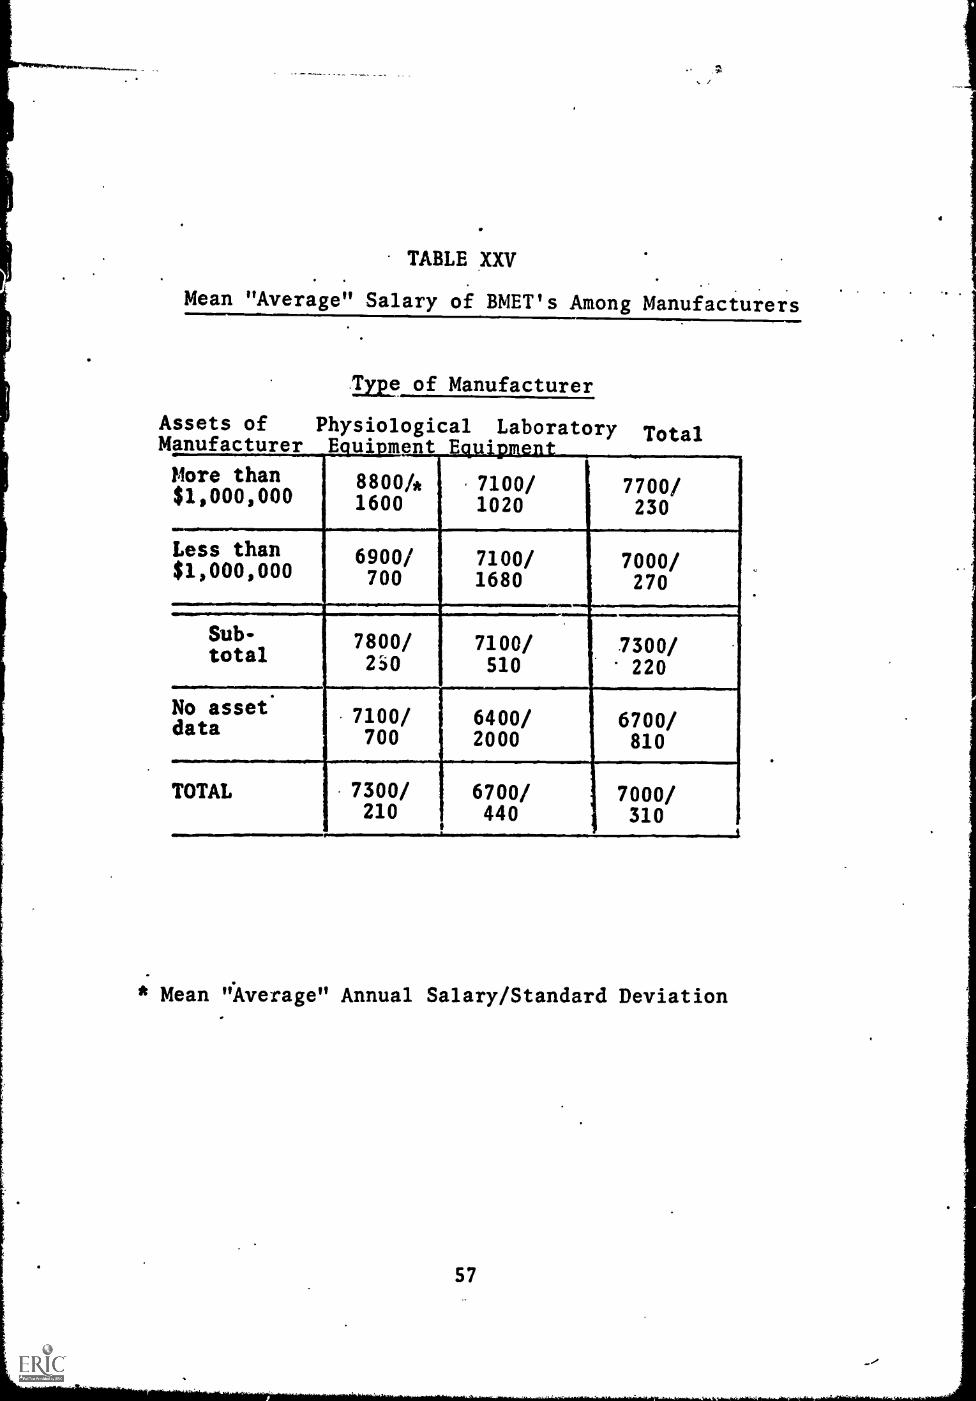
TABLE XXV
Mean "Average" Salary of BMET's Among Manufacturers
Type of Manufacturer
Assets of Physiological Laboratory TotalM
More than$1,000,000
8800/*1600
. 7100/1020
7700/230
Less than 6900/ 7100/ 7000/$1,000,000 700 1680 270
Sub- 7800/ 7100/ 7300/total 230 510 220
No asset 7100/ 6400/ 6700/data 700 2000 810
TOTAL 7300/ 6700/ 7000/210 440 310
i
* Mean "Average" Annual Salary/Standard Deviation
57
..,

TABLE XXVI
Proportion of Manufacturers Identifying Typesof BMET Supervisors
Type of Manufacturer
Assets of PhysiologicalManufacW/AL?ore than$1,000,000
Less than$1,000,000
Sub-total
.1114No assetdata
Laboratory Total
2/.1/.6/. .2/.2/.3/.5 .2/.2/.4/.2
3/.5/.2/.0 .3/.1/.3/.3
3/.3/.4/.1
/0/.5/.5 .2/.3/0/.5
IBM,. NOM 11111111111/11/1
/.3/.2/.2
2/.3/0/.5 3/:. 2/ . 3t. 2
............................................................
TOTAL .2/.2/.4/.2
.....--.............,. ............
1/.2/.2/.5
/.3/.1/.4 /.2/.3/.3
* Professional/ Sales/ Service/ Production Supervisors
58
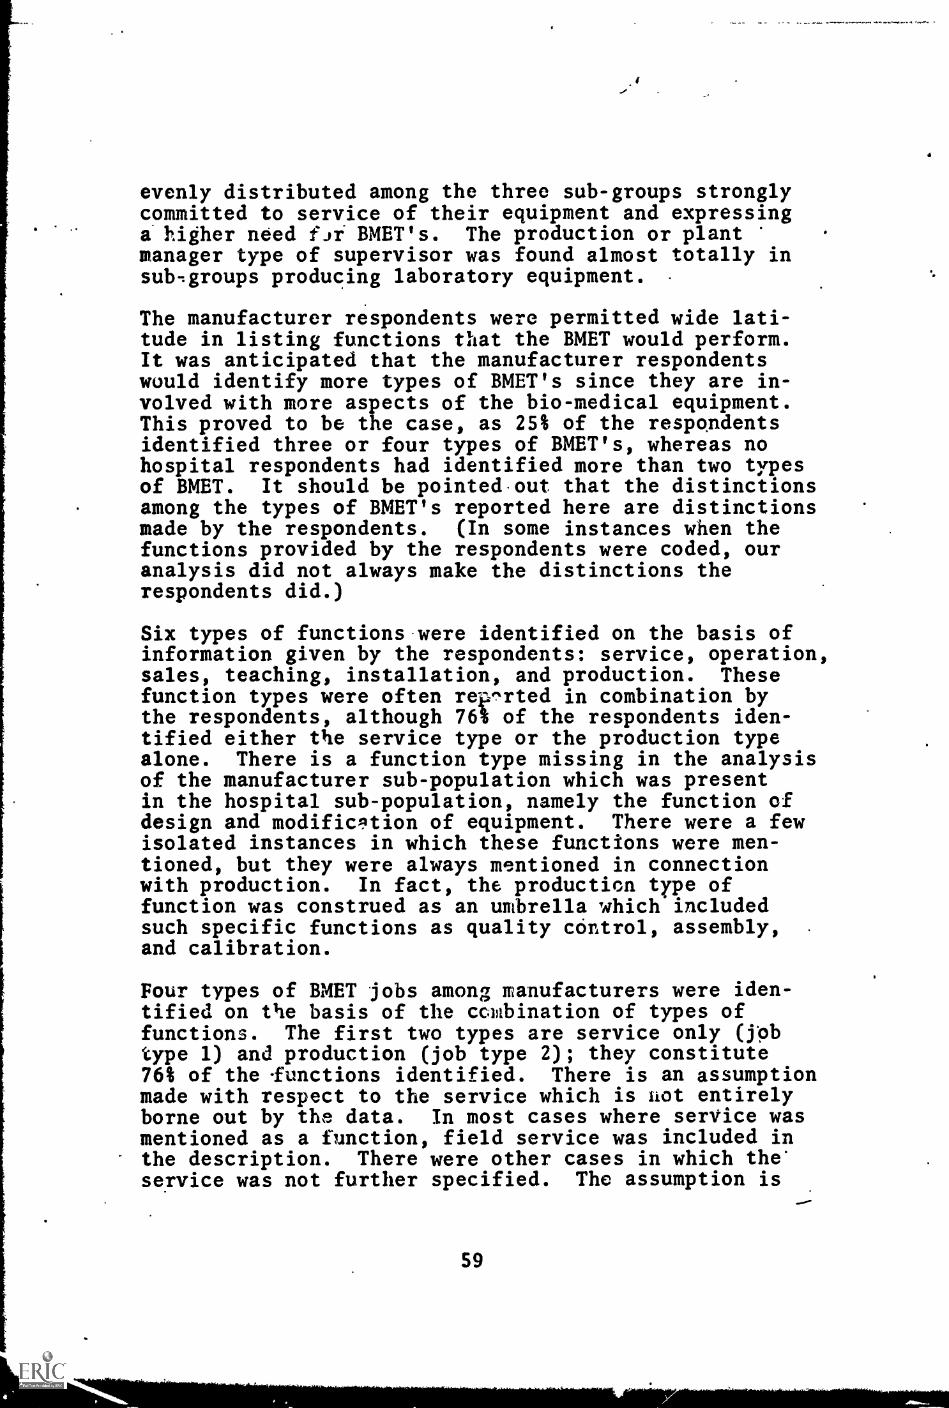
evenly distributed among the three sub-groups stronglycommitted to service of their equipment and expressinga higher need fir BMET's. The production or plant -
manager type of supervisor was found almost totally insub- groups producing laboratory equipment.
The manufacturer respondents were permitted wide lati-tude in listing functions that the BMET would perform.It was anticipated that the manufacturer respondentswould identify more types of BMET's since they are in-volved with more aspects of the bio-medical equipment.This proved to be the case, as 25% of the respondentsidentified three or four types of BMET's, whereas nohospital respondents had identified more than two typesof BMET. It should be pointed out that the distinctionsamong the types of BMET's reported here are distinctionsmade by the respondents. (In some instances when thefunctions provided by the respondents were coded, ouranalysis did not always make the distinctions therespondents did.)
Six types of functions were identified on the basis ofinformation given by the respondents: service, operation,sales, teaching, installation, and production. Thesefunction types were often rep-rted in combination bythe respondents, although 76% of the respondents iden-tified either the service type or the production typealone. There is a function type missing in the analysisof the manufacturer sub-population which was presentin the hospital sub-population, namely the function ofdesign and modification of equipment. There were a fewisolated instances in which these functions were men-tioned, but they were always mentioned in connectionwith production. In fact, the production type offunction was construed as an umbrella which includedsuch specific functions as quality control, assembly,and calibration.
Four types of BMET jobs among manufacturers were iden-tified on the basis of the combination of types offunctions. The first two types are service only (jobtype 1) and production (job type 2); they constitute761 of the functions identified. There is an assumptionmade with respect to the service which is not entirelyborne out by the data. In most cases where service wasmentioned as a function, field service was included inthe description. There were other cases in which theservice was not further specified. The assumption is
59

that unless service is qualified in some other way, theintent of the reply is field service. This is an im-portant assumption because both of the other two types -
of BMET's have service as a component of their over-all. duties. IP one case not only does the BMET pro-vide field service but he is also called upon to assistin operation, teaching, installing and productionmatters.(job type 3). In other words, this third typeof BMET has a wide range of responsibilities and mustbe competent enough to handle a variety of jobs. Thefourth type of BMET fs characterized by a sales ori-entation (job type 4). This combination of functionswas identified in only 4% of the cases, but it is re-ported here because it was anticipated as an optionfor the BMET. Not all of the respondents provided datawith regard to the functions of the BMET, nor were allthe combinations of functions included in the fourtypes given. Thus, a category of unspecified typewhich constitutes about 18% of the number of BMET'sneeded. The distribution of the types of BMET's wasremarkedly even among the sub-groups with only slightdeviations. Table XXVII contains the distributionof the job types among the sub-groups and also in-dicates the proportion of BMET's for whom job typeis unspecified. The rost notable exception from aneven distribution occurs with respect to the produc-tion type of BMET, which consistently was cited morefrequently among respondents from sub-groups producinglaboratory equipment.
The general service type of BMET (Type 3) is identifiedprimarily by sub-groups having more than $1,000,00 inassets, and the ove:-all distribution between the sub-groups producing physiological equipment vs. thoseproducing laboratory equipment is even. The sales typeof BMET is evenly distributed among three of the sub-groups--the two sub-groups producing physiological equip-ment and the one laboratory sub-group having more than$1,000,000. It is interesting to note that althoughthe sub-group with less than $1,000,000 in assets pro-ducing physiological equipment identified the salestype of supervisor to a higher degree, it does notidentify the sales type of BMET to a disproportiona-tely high degree.
1
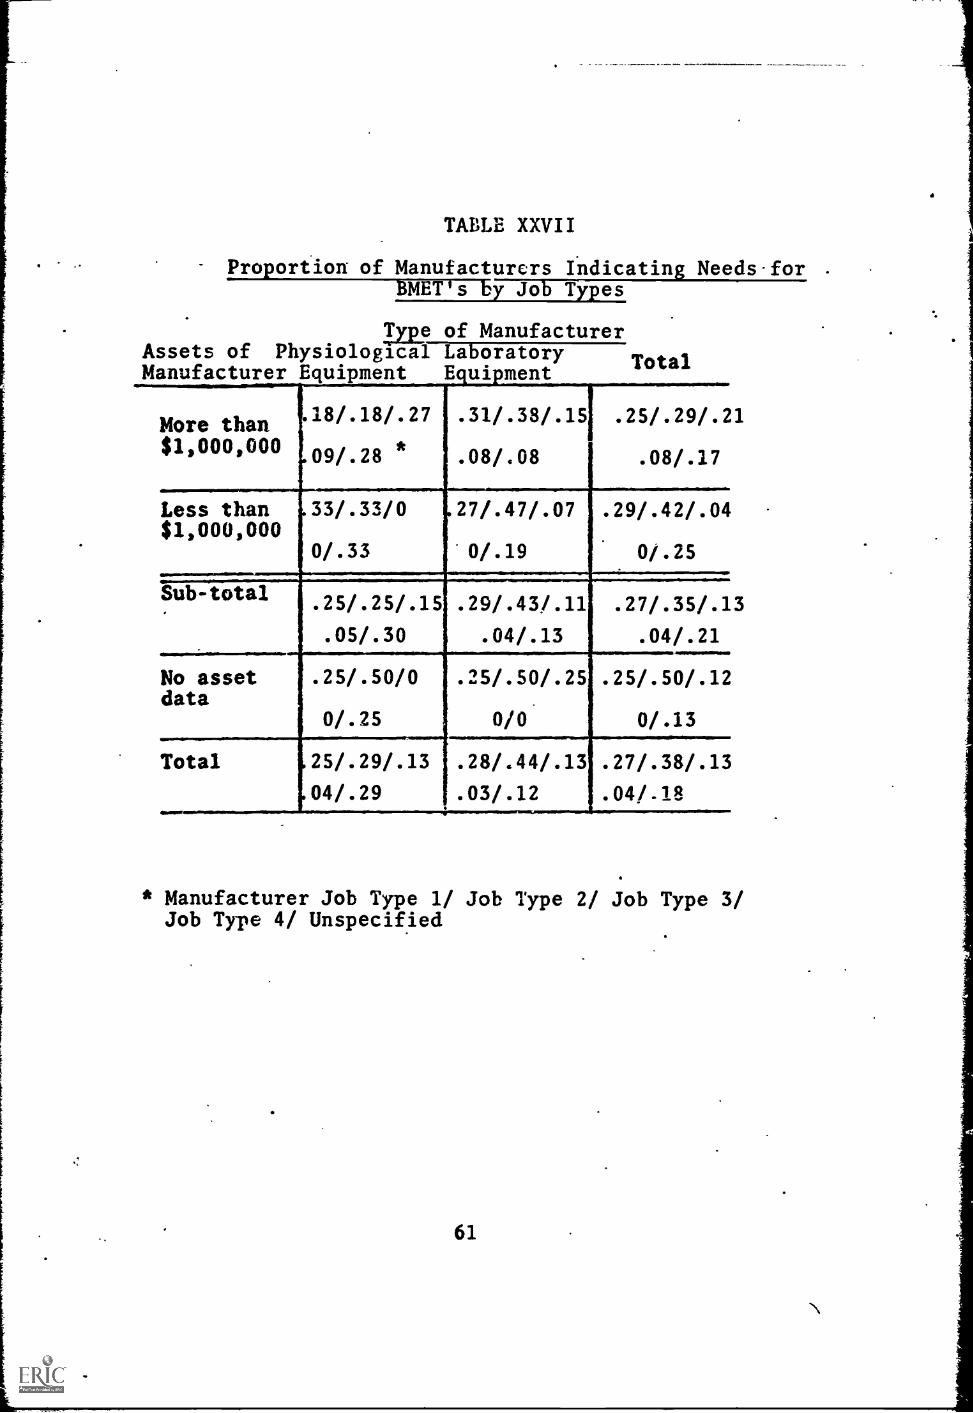
TABLE XXVII
Proportion of Manufacturers Indicatin Needs-for .
BMET's by Jo Types
Type of ManufacturerAssets of Physiological Laboratory
TotalManufacturer Equipment Equipment
More than$1,000,000
18/.18/.27
09/.28 *
Less than$1,000,000
Sub-total
No assetdata
Total
33/.33/0
0/.33
. 31/.38/.151 .25/.29/.21
. 08/.08 .08/.17
27/.47/.07 .29/.42/.04
0/.19 0/.25
. 25/.25/.15 .29/.43/.11
.05/.30 .04/.13
. 25/.50/0 .25/.50/.25
0/.25 0/0
25/.29/.13 .28/.44/.13
04/.29 .03/.12
.27/.35/.13
.04/.21
. 25/.50/.12
0/.13
. 27/.38/.13
. 04/.18
* Manufacturer Job Type 1/ Job Type 2/ Job Type 3/Job Type 4/ Unspecified
61

TABA7 XXVIII-
Pr;portiOns of Manufacturers Indicatin Combinationsof BMET Job Types, Supervisors an Mean Salaries
SUPERVISOR
ManufacturersJob Tjpe
Professional Sales Service Prcduction MeanSalary
1 - ServiceOnly .05 .07 .15 7600
2 - Production .17 .07 .25 6800
3 - General .02 .02 .07 .02 8000Service
4 - Sales .07 9000
*Reflects only manufacturers who provided data on both JobTypes and Supervisors.

Further characterization of the BMEI' is possible bycomparing the distribution Of the supervisor typesamong the function types. Table XXVIII contains datarelative to those comparisons. The data reported withregard to the supervisor type vs. function type arethe proportions of each particular combination to allof the combinations. The more obvious combinationsthat one would expect are supported by the data, i.e.,the field service technician is supervised by the ser-vice manager and the sales oriented technician is supervised totally by the sales manager. The most inter-esting finding is with respect to the supervisor of theproduction technician. There appear to be two distincttypes of supervisors for this technician: the produc-tion manager and the professional person. This dichot-omy probably reflects the fact tha' che definition ofthe production BMET included some of the more sophis-ticated functions, for example, design and modificationin addition to those functions strictly identified withproduction. The salary data indicate that productionis the position into which a newly trained technicianmost likely would enter, although the need for othertypes of BMET's may create a situation where the moresuccessful graduate of a technical institute couldassume other duties.
III. Research Institute Sub-Population
Procedures used with the research institute sub-popula-tion were similar to those used with the other two sub-populations. The only major difference was that justone interviewer was used to report on the small numberin the sample.
A. The Need for BMET's
All of the respondents in the sample agreed that theservice aid maintenance of bio-medical equipment was apressing, problem that could probably be lessenedthrough a training program to supply the needed tech-nicians.
1. Current Needs
Every respondent was also able to indicate a number ofBMET's who would be employed at present if they wereavailable. Table XXIX contains the mean number of
63

TABLE XXIX
Mear; Number of BMET's Needed Nowper Research Institute
Type of Institute Need
Research Laboratory 1.17/.98*
Bio-Medical Institute 2.78/5.56
Total 2.34/1.25
*Mean Number/Standard Deviation
64
/

BMET's needed by each of the two sub-groups. Theextrapolation of these means to the actual numbers ofBMET's needed in the sub-population is contained inTable CVII in the Appendix.
T1 large standard deviation and its concomitant largeconfidence levels indicate heterogeneity in the res-pondents. An inspection of the raw data indicates thatthe variance in the responses is caused by one respon-dent who felt that there was a need for 17 BMET's. Ifthis respondent is removed from that sub-group andthe remaining data are analysed, the mean number ofBMET's is reduced from 2.78 to 1.0 with a standarddeviation of 1.36, which is still relatively large.If these findings are extrapolated to the sub-popula-tion, the 80% confidence levels are reduced from+ 141 to + 44. This reduction depends upon an estima-tion of ta variance of the deviant respondent basedon the other respondents and on the assumption thatthe deviant respondent was randomly selected from athird sub-group. These procedures are, of course, ontenuous ground and prohibit the substitution of thereduced findings for the original findings.
2. Projected 1970 Need
The research institute respondents were not as capableof projecting the need for 1970 as they were for speci-fying needs on their current staffs. Table BXIII ofthe Appendix contains proportions of people who wereable to provide data with respect to the projected 1970need for BMET's. The mean number of BMET's needed iscontained in Table XXX with the respective standarddeviations. ratv.aporation of these means to the sub-population are contained in Table CVIII of fhe Appendix.
Once again, there is evidence of the lack of homogen-eity in the research institute sub-population. In thecase of the 1970 needs the variance is explained by tworespondents: one who needed 20 BMET's, and the otherwho needed 106 BMET's. When these two deviant casesare removed from the research institute sub-group themean number-of BMET's is 2.6 and its standard deviationis 1.38. When these data are extrapolated to the sub-population the 801 confidence levels are reduced from+ 774 to + 40. The same procedures and assumptions
65

n
uTABLE XXX
[] Mean Number of BMET's Needed in 1970per ResearchInstitute
--,
,._
7 Type of Institute NeedL.......F-
L
AIM..
Research Laboratory 2.0/1.41*
Bio-Medical Institute 17.13/33.12
Total 15.26/10.35
0
[1 * Mean Number/Standard Deviation
U..
[11
are associated with this reduction as with the reduction in the current staff needs and are equally tenu-ous. -Both analyses, however, indicate that the insti-tute sub-group is not homogeneous and that future inver.-tigation in this sub-population should take this find-ing into account.
3. growth in the Need for BMET's
Following the procedures outlined in the other two sub-populations the mean proportion of BMET's needed in1970 compared to BMET's needed now were derived. Thesedata are contained in Table XXXI. If the deviant res-pondents are set aside from the analysis the mean pro-portion of growth for the institute sub-group is 2.8,and the mean proportion of growth for the deviant casesis 7.4. The overall proportion of 6.13, when appliedto the current need for BMET's, yields an expectedneed for 1970 of 1263; this is considerably higher thanthe need established on the projected 1970 data, al-though it is within the 80% confidence level reported(deviant cases not considered).
B. Variables Related to the Need for BMET's
The analysis of the data reported in this section isdivided into two cases: one in which the originalsampling design is considered, and the other in whichthe two deviant cases are studied apart from theiroriginal sub-group. Data on four variables are avail-able for studying the need for BMET's: size of theresearch institute, investment and expenditure in bio-medical equipment, and expenditure in the personnel andservices associated with the equipment.
1. Definition of the Variables
The size of the research institute was defined on thebasis of the number of people on the research staff.Two categories of size were identified: one with 50 crfewer people, and the other with more tun 50 people.The remaining three variables are distribution var-iables, each of which was dichotimized.
67

TABLE XXXI
Mean Proportion Increase in Need for BMET'sper Researc Institute
Type of Institute
Research Institute
Bio-Medical Institute
Total
68
6-1970
Proportion Increase
2.0
6.5
6.13

2. Relationships Among the Variables and NeedTOYNMET's
TableXXXII contains comparative data of sub-groups,withand without deviant cases separated, on the four vari-ables mentioned above. Current and projected 1970need data.are also included. There are no clearcutrelationships contained in the data of TableXXXII.The non-deviant bio-medical institutes and the researchlaboratories express approximately the same need, andfor the most part share common characteristics, themost notable exception being with regard to the invest-ment variablein which the bio-medical institutes havea distribution skewed toward higher investment. Thedeviant cases identified on the basis of their expres-sed needs also deviate from the other respondents withrespect to their characteristics, with the exceptionof the investment variable in which they reflect theoverall mean.
C. Characteristics of the BMET
The respondents in this sub-population suggested feweralternatives with regard to the characteristics of theBMET. For example, only two types of supervisor wereidentified: the chief of maintenance, and a profession-al or research staff member. One respondent in theresearch laboratory sub-group suggested that the BMETwould work without a supervisor.
The research institute respondents were similar to thehospital respondents in that they identified eitherone or two types of BMET (one respondent identified 3types), and they suggested the same functions that theBMET would perform, namely, service and maintenance.,operation, design/adaptation, and instruction. .Therewas also the small proportion (.13) of research in-stitutes who agreed with a small proportion of hospitalrespondents that their need for a BMET could be bestutilized through cooperative efforts. The researchinstitute respondents differed from the hospital res-pondents in that they combined the functions more fre-quently and therefore no one function can characterizethe job types identified on the basis of the responses.Two job types were identified: service and maintenancecombined with operation (job type 1), and design/
69

TABLE XXXII
Comparative Data Between Types ofResearch institutes
RESEARCHLABORATORY
N=6
BIO-MEDICAL INSTITUTES
Deviant Deviant Sub-Cases Cases Total:RemovedN=7 N=2 N=9
[TOTAL
i
N=15
MeanCurrent needfor BMET's 1.17
Mean needfor BMET'sin 1970
2.00
Size ofInstitute(1) .3
Invest-ment (2)
Equip-ment12)
1.3
1.3
Pers. andService .
Expend. (2) .1.4
1.14
2.6
1.6
8.5
63.00
1.0
1.5
1.5
2.78
17.13
2.0 1.7
2.34
15.25
.5
1.5
1.3
1.6
(1) Proportion of institutes having more than 50employees.
(2) Measure of symmetry of distribution. See Appendix DPerfect symmetry = 1.5
70

adaptation and instruction (job type 2). The data withrespect to the characteristics of the BMET are containedin Table XXXIII.
.
One.of the most interesting findings that result fromthe data in Table XXXIII is that the research labora-tory sub-group proposes an average salary of $8200,largely for one type of BMET (service and operate) whowould be supervised to a greater degree by a mainten-ance personnel than in any other sub-group. By wayof contrast the deviant cases who expressed the greaterneed for BMET's suggest a much lower salary for agreater number of types of BMET's.
Table XXXIV contains some comparative data with regardto the characteristics of the BMET. The disparate sal-aries between the two types of BMET is the most pro-nounced finding. The expected relationship. betweenthe maintenance supervisor and the lower level BMET isobtained, but it is interesting to note tliat abouttwice the proportion of the lower level BMET will besupervised by the research staff.
71
1
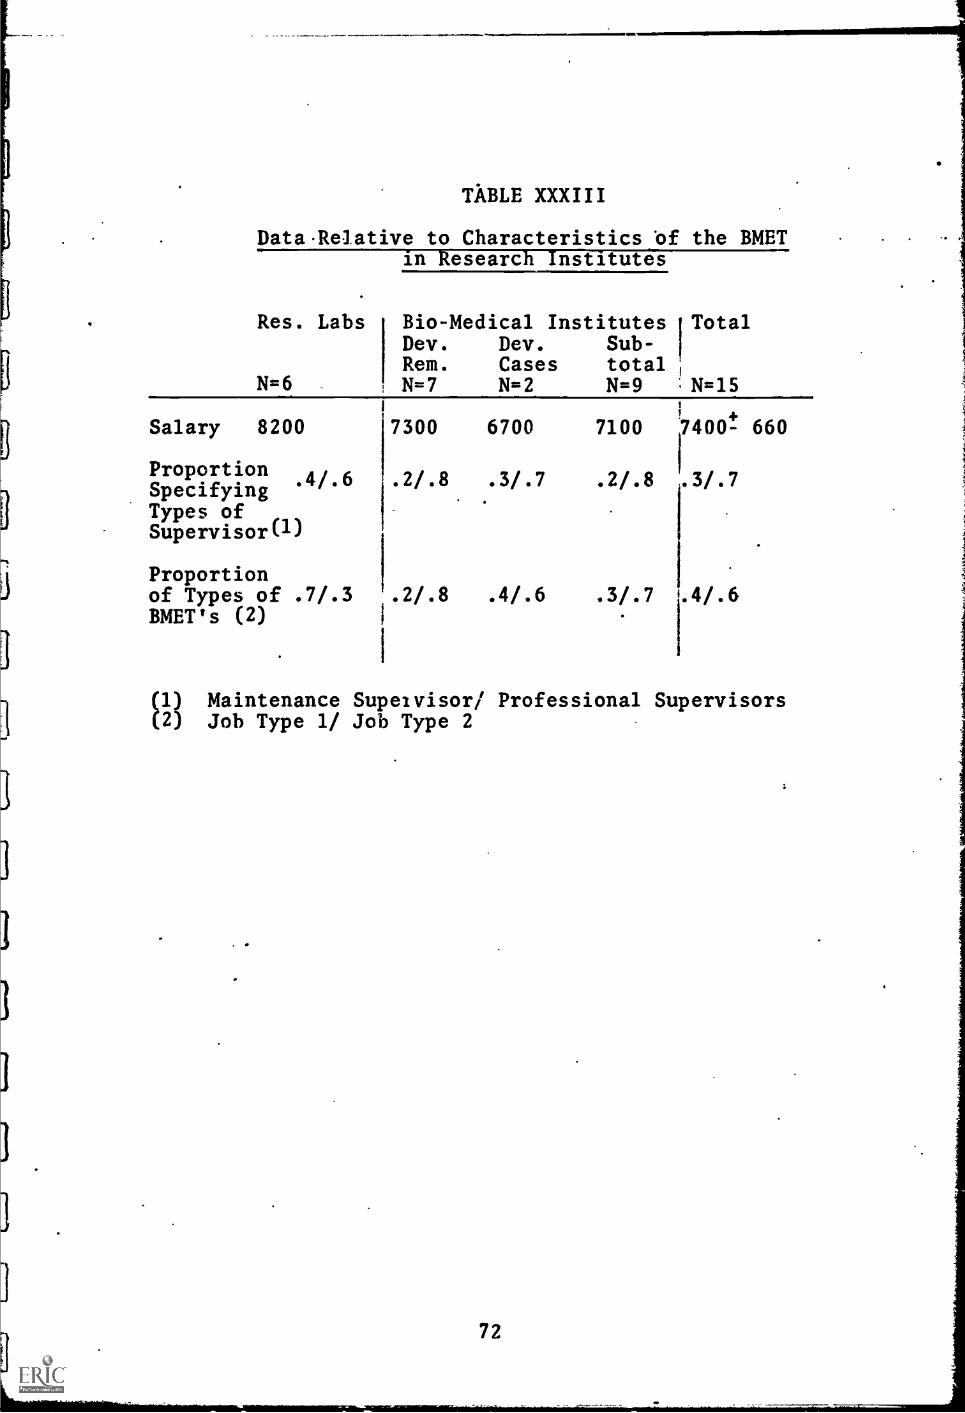
TABLE XXXIII
DataRelative to Characteristics of the BMETin Research Institutes
Res. Labs
N=6
Bio-Medical Institutes TotalDev. Dev. Sub-Rem. Cases totalN=7 N=2 N=9 :N=15
Salary 8200
ProportionSpecifying
.4/.6
Types ofSupervisor(1)
Proportionof Types of .7/.3BMET's (2)
7300 6700 7100 7400! 660
.2/.8
116
3/..2/.8 .3/.7
1
.2/.8 .4/.6 .3/.7 1.4/.6
(1) Maintenance Supeivisor/ Professional Supervisors(2) Job Type 1/ Job Type 2
72

TABLE XXXIV
Proportions of Research Institutes IndicatingC :binations of BMET Job Types, Supervisors
and Salaries
Supervisor
Research MeanJob TypeMaintenanceEtafes_sinnaL_Saiar*
.06 .19 6500
2 .31 .38 9100
CD
73
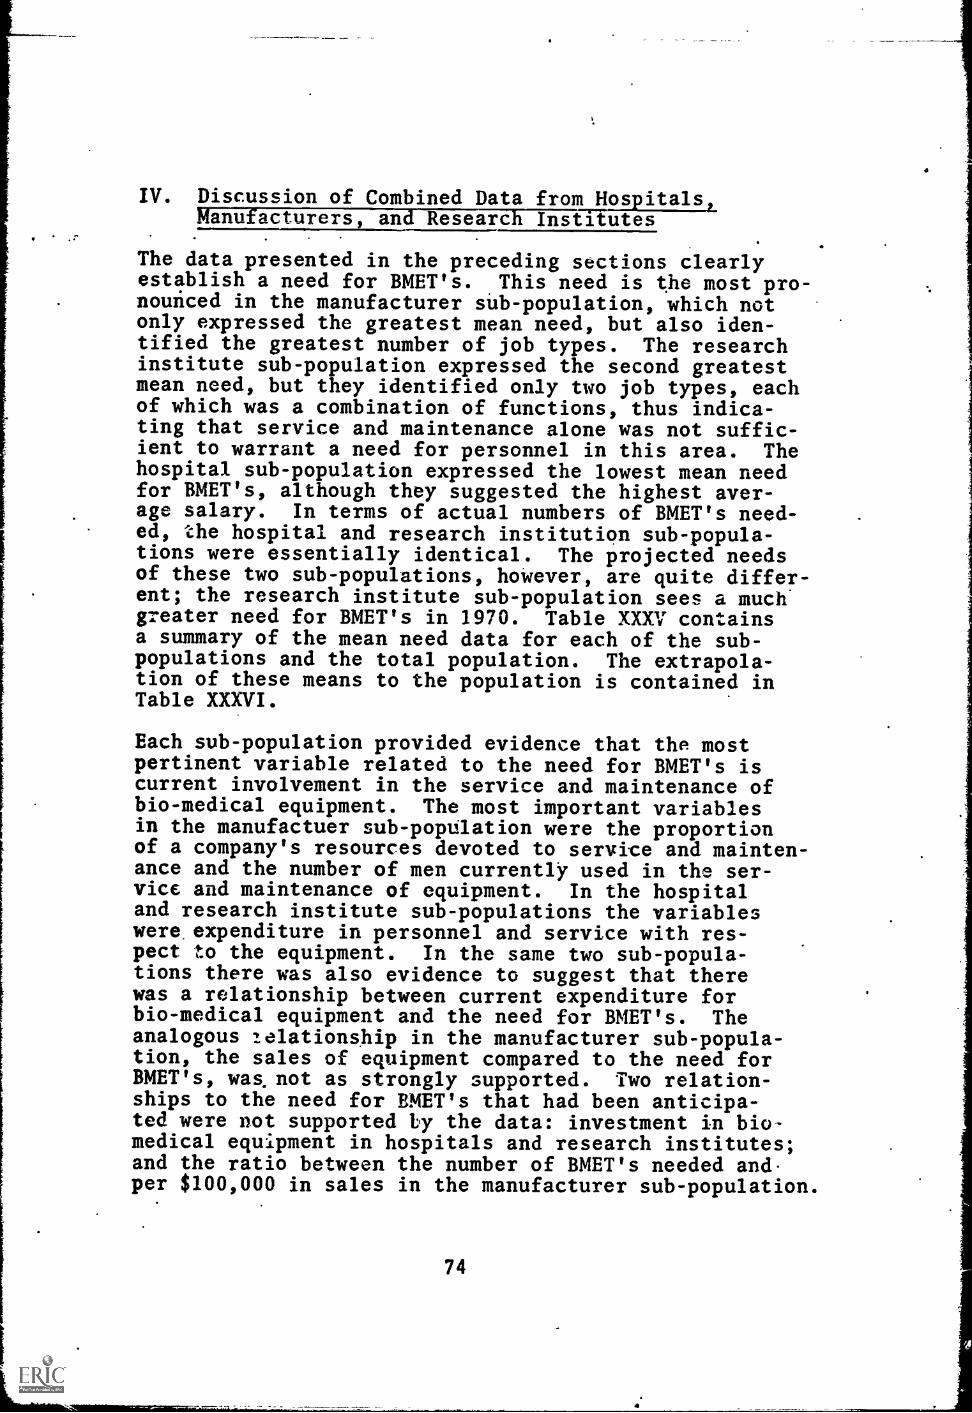
IV. Discussion of Combined Data from Hospitals,Manufacturers, and Research Insfitutes
The data presented in the preceding sections clearlyestablish a need for BMET's. This need is the most pro-nounced in the manufacturer sub-population, which notonly expressed the greatest mean need, but also iden-tified the greatest number of job types. The researchinstitute sub-population expressed the second greatestmean need, but they identified only two job types, eachof which was a combination of functions, thus indica-ting that service and maintenance alone was not suffic-ient to warrant a need for personnel in this area. Thehospital sub-population expressed the lowest mean needfor BMET's, although they suggested the highest aver-age salary. In terms of actual numbers of BMET's need-ed, the hospital and research institution sub-popula-tions were essentially identical. The projected needsof these two sub-populations, however, are quite differ-ent; the research institute sub-population sees a muchgreater need for BMET's in 1970. Table XXXV containsa summary of the mean need data for each of the sub-populations and the total population. The extrapola-tion of these means to the population is contained inTable XXXVI.
Each sub-population provided evidence that the mostpertinent variable related to the need for BMET's iscurrent involvement in the service and maintenance ofbio-medical equipment. The most important variablesin the manufactuer sub-population were the proportionof a company's resources devoted to service and mainten-ance and the number of men currently used in the ser-vice and maintenance of equipment. In the hospitaland research institute sub-populations the variableswere expenditure in personnel and service with res-pect to the equipment. In the same two sub-popula-tions there was also evidence to suggest that therewas a relationship between current expenditure forbio-medical equipment and the need for BMET's. Theanalogous lelationship in the manufacturer sub-popula-tion, the sales of equipment compared to the need forBMET's, was, not as strongly supported. Two relation-ships to the need for EMET's that had been anticipa-ted were not supported by the data: investment in bio-medical equipment in hospitals and research institutes;and the ratio between the number of BMET's needed and-per $100,000 in sales in the manufacturer sub-population.
74

TABLE XXXV
Summary of Mean 'Number of BMET's Needed
Sub-Population Current Staff Projected 1970
Hospital
Manufacturer
1.13/.13*
7.62/1.55
2.41/.29
28.26/6.04
Research Institute 2.34/1.25 15.26/10.35
Total 3.37/.1.1 12.74/.69
* Mean Number/ Standard Deviation
75
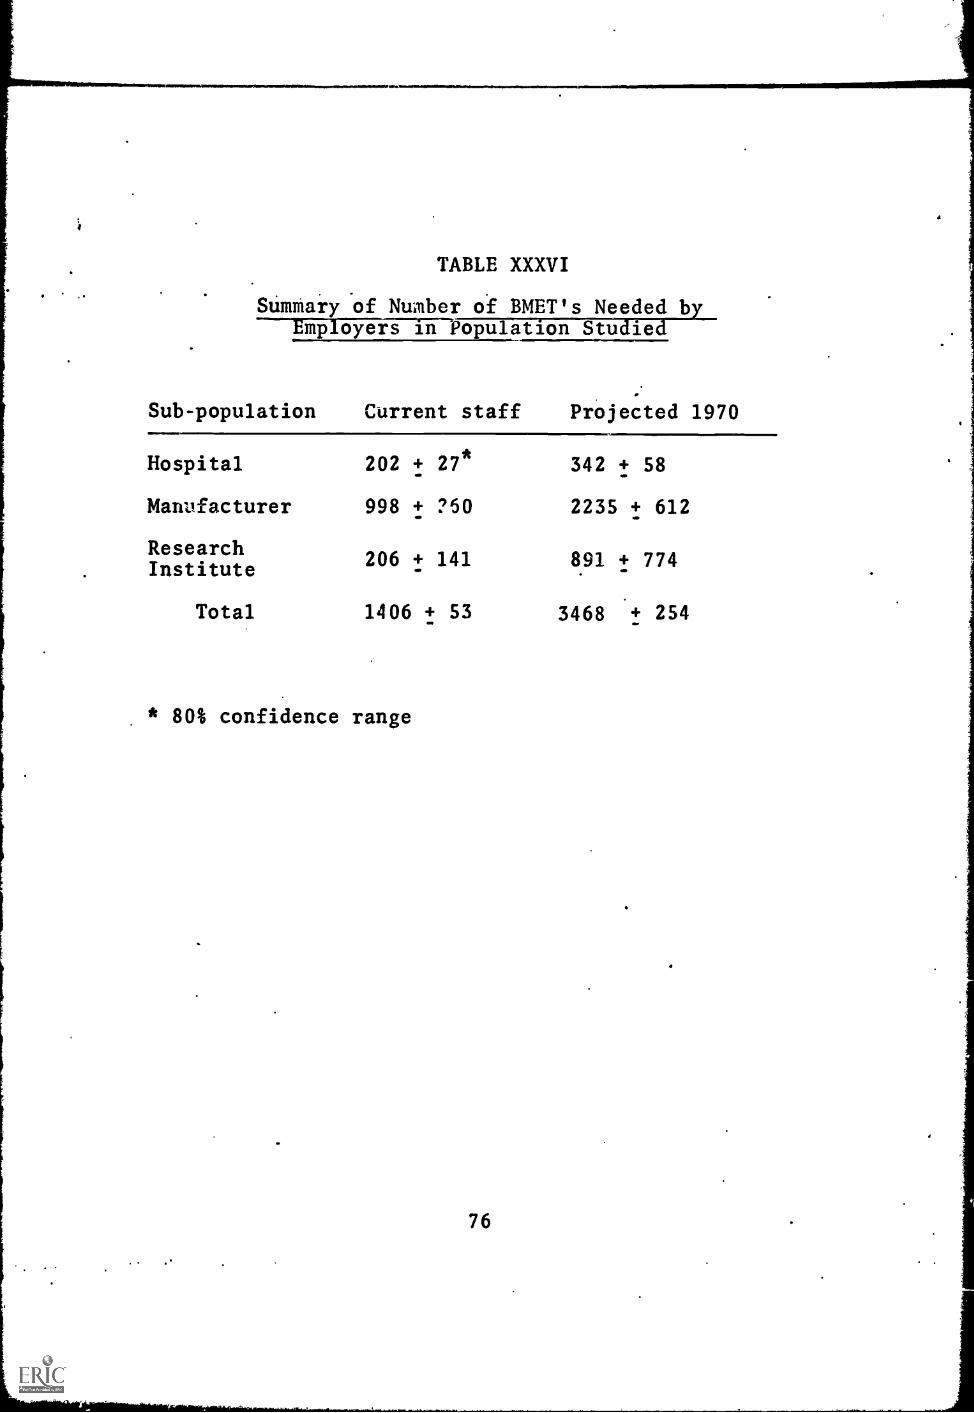
i
1
TABLE XXXVI
Summary of Number of BMET's Needed byEmployers in Population Studied
Sub-population Current staff Projected 1970MIMM
Hospital
Manufacturer
ResearchInstitute
202
998
206
+ 27*
+ ?50
+ 141
342
2235
891
+ 58
+ 612
+ 774
Total 1406 t 53
* 80% confidence range
3468 .+ 254

1
Taken together, these findings add strength to the re-lationships between current expenditures in serviceand maintenance of equipment and the need for BMET1sby suggesting that neither past investment in equip-ment nor number of BMET's needed to service equipmentare related to the need for BMET's.
The sampling procedures employed in this study weredesigned to utilize objective data that were readilyavailable in studying the need for BMET's in each ofthe sub-populations. The results of these procedureswere, to some extent, disappointing. There were re-latively weak relationships observed with respect tomedical school affiliation and payroll costs in thehospital sub-population, and in the type of equipmentproduced and relative assets in the manufacturer sub-population. When these variables are considered incombination, however, the observed relationships aresomewhat disrupted by the interaction of the variables.The stratifying variables, therefore, apparently donot serve the complete purpose of providing objectivedata to characterize those respondents who express agreater need for BMET's. Only the hospital sub-pop-ulation had further objective data available. Thesedata were with regard to the control of the hospital,the type of city and region in which it was located,and the number of beds contained by the hospital. Onthe basis of these data the greater need for BMET'sseems to be among hospitals in the relatively largercities of region 2 which are under city type control.
There was disagreement among the respondents concerningthe immediacy of the need for BMET's. One segment ofthe respondents indicated a pressing need to be resolv-ed as soon as possible. The other segment, however,indicated that the need for BMET's wou--, occur in thefuture. This latter group consisted of the smallermanufacturers of physiological and the smaller hospi-tals with community control located in the suburbanareas of region 1. This particular segment has thelowest current expenditures in bio-medical equipment.
The data with regard to the characteristics of the BMETsuggest that the three sub-populations have jointly de-fined four types of BMET. The first type of BMETwould be found in hospitals or manufacturers and hisduties would be restricted to the service and mainten-ance of equipment (General job type 1). The second
77.
.1

general type is characterized by the ability to assumea wider range of responsibilities with respect to theequipment (General job type 2). This category was iden-tified by the hospital sub-population as their secondtype. The manufacturer sub-population indicated thatthis type would be their field service man. The researchinstitute population identified this type as theirlower level technician. The third general type musthave the ability to design and modify equipment inaddition to being able to service, maintain, and oper-ate the equipment (General job type 3). This was themost sophisticated type, and was identified to a muchgreater degree 11, the research institute sub-population.The fourth general type would be oriented to the salesof bio-medical equipment, and logically was identifiedonly by the manufacturer sub-population (General jobtype 4). Table XXXVII contains the proportions of eachtype of BMET needed now and in 1970. Table XXXVIIIcontains the extrapolation of these proportions to theactual number of each type of BMET needed both on.cur-rent and 1970 staffs among the population of employersstudied.
78

TABLE XXXVII
Proportion of BMET's Needed Designatedby General Job Types
Category of Em'loyer
General HospitalJob Type
Manufacturer Res. Institute Total
1 .33 .32 0 .28* .24**
2 .36 .38 .40 .38 .38
3 .06 .03 .60 .12 .18
4 .00 .07 .00 .04 .04
Unspec. .25 .20 .00 .18 .16
Total 1.0 1.0 1.0 1.0 1.0
* Using current need data
** Using projected 1970 data
79
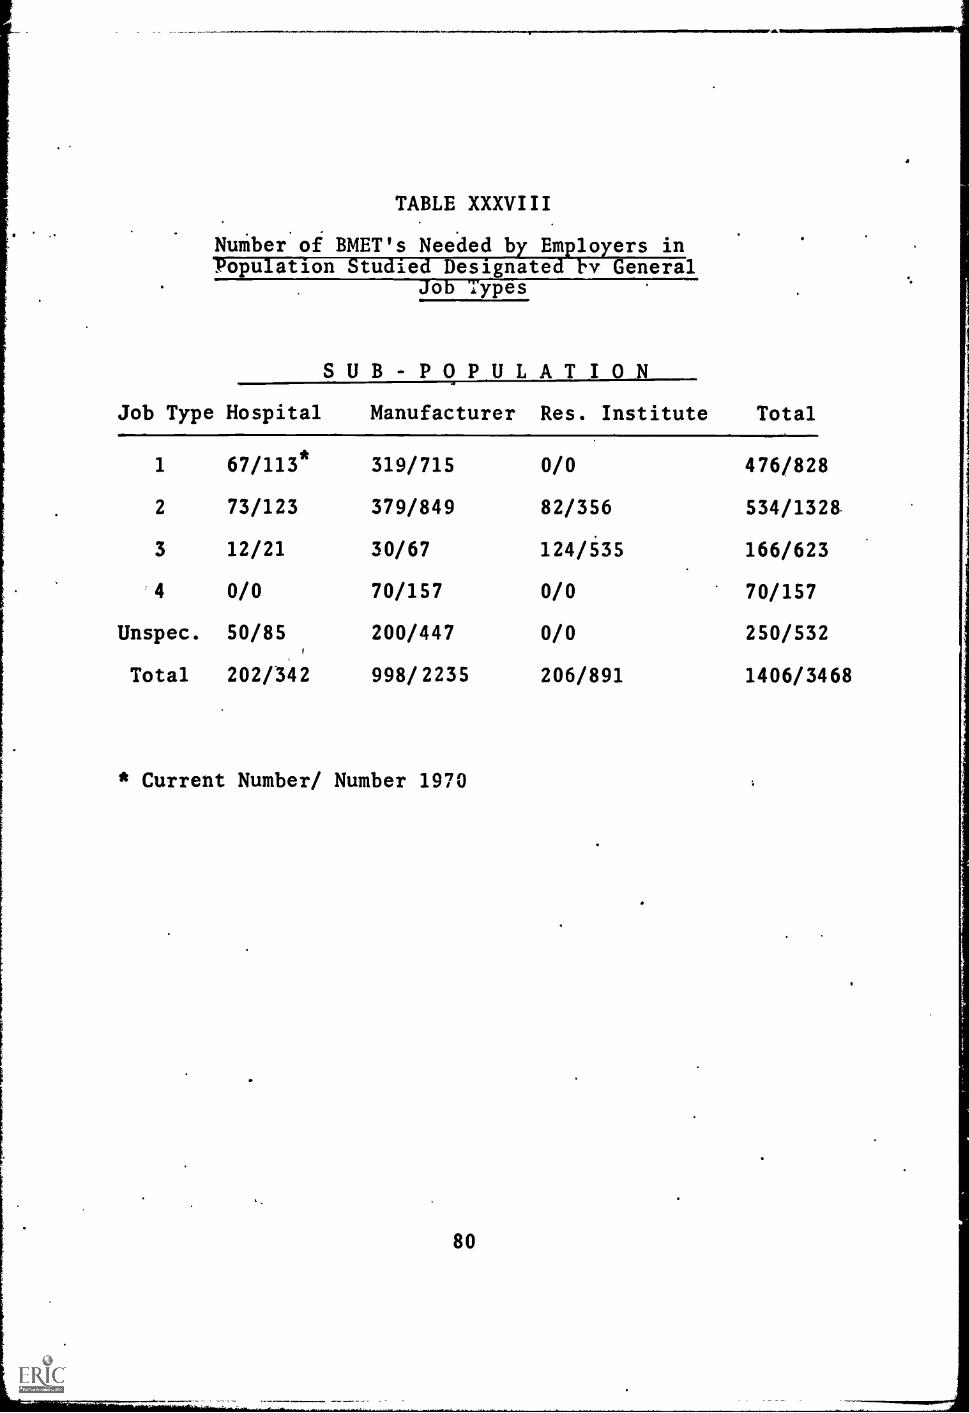
TABLE XXXVIII
NuMber of BMET's Needed by Employers inPopulation Studied Designated by General
Job Types
SUB-POPULATIO NJob Type Hospital Manufacturer Res. Institute Total
1 67/113* 319/715 0/0 476/828
2 73/123 379/849 82/356 534/1328.
3 12/21 30/67 124/535 166/623
4 0/0 70/157 0/0 70/157
Unspec. 50/85 200/447 0/0 250/532
Total 202/342 998/2235 206/891 1406/3468
* Current Number/ Number 1970
80

RESULTS - PART II
PRELIMINARY CURRICULUM OUTLINE FOR BMET'S
The second major objective of this coordinated researchproject was to develop the general structure and a pre-liminary outline of a post high school curriculum. forBMET's based upon the needs of prospective employersof BMET's as determined from the Field Study.
The first approach to developing a curriculum outlinewas made at the beginning of the Project. As a partof the Preliminary Survey a series of unstructuredinterviews were conducted with representatives of a fewhospitals, medical schools, and bio-medical equipmentmanufacturers throughout the country during which theeducational requirements for BMET's were discussed(Appendix G). Based on these preliminary interviews afirst draft of an "ideal" curriculum outline was pre-pered.
Following these preliminay interviews two planningconferences were held in Cambridge, Massachusetts inJuly 1966 to review and refine this curriculum outline.The first conference was atteaded primarily by hos-pital administrators and leading technical educatorsand the second conference wa attended primarily byrepresentatives of bio-medical equipment manufacturersand leading technical educators. It was generally agreedat these conferences that an appraximately two yearassociate deg t' type, of curricu;,m, would be re-quired for adt1u4t:.-a preparrtion of BMET's and a draftof a tentativt% two year curriculum was prepared. Thiscurriculum outlined in Appendil AI and AII was usedduring the Field Study interviews as an initiator ofconversation relative to BMET's and as a point of depar-ture for soliciting sugvsted modifications.
The modified and expanded curriculum outline presentedin this Report was developed on the basis of datagathered during the Field Study. The interview data werecomments and reactions to the preliminary curriculum pro-posal; including such topics as the length of the program,the extent to which particular subjects should be taught,the need for an internship, the necessity of accredi-tation, and the types of equipment with which the tech-nician should be familiar. On the basis of these data,recommendations were prepared for the modification of
the preliminary curriculum proposal and a conferencewas held to act on these recommendations. Conferencepartitipznts included representatives of hospitals,research institutes and manufacturing concerns. Inaddition, there were several members from TERC's staffand faculty members from a technical institute. Thepresent curriculum proposal is the result of effortsto balance the implications of the interview data withthe results of the conference discussions in the con-text of experience in technical education.
J. Guidelines Derived from Interview Data
Data concerning the need for BMET's clearly indicatethat employment opportunities are greatest with manu-facturers of equipment. For that reason the data frommanufacturers' interviews were accorded greater weightin determining the curriculum than the data from hos-pitals and research institutes, although there wasrelatively little variation in the responses of thethree groups.
All respondents identified electronics as the mostimportant aspect of the curriculum, followed closelyby instrumentation. The coupling of instrumentationwith electronics is the strongest indication that theBMET is not considered synonymous with the electronicstechnician; rather, he may at the least be a particularkind of electronics technician.
Many respondents (especially manufacturers) indicatedthat communicative skills should receive' emphasis inthe curriculum. These respondents felt that a BMETwould be hampered if he were unable to express himselfand to understand the problems of others.
Mathematics and physics were generally agreed to beworthwhile ind even necessary, but the consensus wasthat they are of secondary importance. Biology, phys-iology, chemistry and medical sciences received themost uneven attention from the respondents. The over-all impression provided by the data is that the tech-nician must-be conversant in these areas, but that thisknowledge can be attained in an internship program orin a small number of courses with the narrow objectiveof familiarizing the student with broad concepts andterminology.
82

The overwhelming majority of respondents agreed thattwo years was about the proper length for the program.One respondent, however, felt that the job of traininga BMET could only be accomplished in four years; a fewothers felt that on-the-job training was sufficient.
The comments and reactions of respondents with respectto the accreditation of the BMET were fairly evenlydivided between those who felt that it was of littleuse and those who felt that it was necessary. Thereis a possibility of some ambiguity with regard toaccreditation. There is professional accreditationwhich is accorded to people who meet certain standardswithin a given profession, and there is the accredita-tion given to schools that meet certain standards;this ambiguity may have been operating in the res-ponses. It was decided that the curriculum should
iattempt to meet the educational standards that go intothe accreditation of a school.
II. Curriculum Conference
The preceding guidelines were discussed at considerablylength at a curriculum conference held at TERC in May.Each guideline was discussed in detail from severalpoints of view; the implication of the discussion wasleft to the authors of the curriculum. In general,the conference participants approved of the guidelinespresented to them, but there were differences in thedegree to which they emphasized certain aspects of theguidelines.
The curriculum conference added insight into the prob-lem of constructing a curriculum for BMET's by highlight-ing three areas of the guidelines: the breadth of thecurriculum, inclusion of communicative skills, and theneed for accreditation. With regard to the breadthof the .curriculum, the participants were concerned withthe future of an individual who had been trained as aBMET. There was general agreement that as bio-medicalequipment becomes more sophisticated, an increasingdegree of competence in the technician will be requir-ed. Therefore, the technician must receive a broadeducation focusing on fundamental concepts. On theother hand, the educational program should not become
83
too abstract for the type of student likely to enterit. It was felt tkat the success of the program woulddepend on an early introduction to the type of equip-ment that the technician would Le expected to serviceand maintain. This introduction blould have to be rein-forced throughout the educational t.xperience by explicit-ly demonstrating the relevance of an; given phase ofthe curriculum to the projected needs of a bio-medicalequipment technician. Thus, the needed curriculummust meet with the somewhat contrasting objectivesof being broadly based on fundamental concepts andavoiding over-abstraction.
The technician's ability to communicate effectivelywith others concerning the use of bio-medical equip-ment was strongly emphasized by all the participantsin the conference. The general feeling was that thetechnician, in order to achieve a high level ofeffectiveness, must be attuned to the various waysin which other people conceptualize the workings ofbio-medical equipment. The technician must have theability to utilize another's explanation within thecontext of his own understanding and competence. Itwas suggested that whereas certain aspects of thesecommunicative skills could be taught formally, thebest source of experience would be on the job; thus,the internship program could focus on the problems ofcommunication.
The probl m cf accreditation was discussed at.lengthby the conference participants. Two concerns promptedthis discussion: the future growth and development ofthe technician, and the quality of student that wouldmatriculate into the program. It was felt that inorder for the BMET to further his education, an appre-ciable percentage of his course work should be trans-ferable to institutions of higher learning, thereby en-couraging those with the motivation and capability tocomplete a bachelor's degree in bio-medical engineer-ing. In conjunction with the second concern, it wasfelt that unless a program could offer a high propor-tion of college credits, the student who would beattracted to the program would of necessity have lowerstandards and the effect of the training would beimmediately diluted. These concerns, therefore, wereexpressed in terms suggesting that the construction ofthe curriculum be sensitive to providing the type of
84

.,
course that would be acceptable for college credit.Consequently, the emphasis of accreditation was moreon the educatibnal characteristics of the institution'and less on professional accreditation.
III. Special Requirements of the BMET Curriculum
The construction of the BMET curriculum necessitatescoordinating the technologies of electronics and in-strumentation and applying this coordinated technologyto bio-medical equipment. Programs in both electron-ics technology and instrumentation technology requiretwo years for completion. Assuming an overlap of notmore than 50% between these two technologies, it wouldtake three years of a conventional curriculum designedto educate an electronics/instrumentation technician.To apply this technology to bio-medical equipmentwould take from one to two additional semesters. Clear-ly, then, a curriculum that attempts to coordinateelectronics and instrumentation and seeks the applica-tion to bio-medical equipment within a period of twoyears must be designed in such a way that the goal ofbio-medical equipment technology is directly served byeach component of the curriculum. This requires boththe integration of courses and the coordination offaculty effort to a degree generally unknown at presentin higher education. Both the integration of the coursework mnd the coordination of faculty effort must bespecified and the mechanism for effecting them establish-ed.
The integration of the course work is accomplished ina course titled "Bio-Medical Techniques." This courseis taught every semester, beginning with some rudimen-tary biology, physiology and medical science and even-tually considering bio-medical instrumentation. Thiscourse is designed to serve as a focus for all of theother courses taught in the curriculum. The sequenceand emphasis of the topics within this course will de-pend on the level of competence acquired by the studentfrom the other components of the curriculum, but bio-medical equipment will always be the'focal point oftopics covered in this course. For example, as soonas the concepts of electrical resistance and potentialhave been established in the electrical/electronicspart of the curriculum, the EKG machine can be used inthe "Bio-Medical Techniques" course to stimulate dis=
85

di
cussion on heart-beat, heart diseases and the use of theEKG.
The design of the "Bio-Medical Techniques" course isnot restricted to merely reflecting the skills andcompetencies developed in the other aspects of the cur-riculum. Rather, it can play an active role in deter-mining the sequence and emphasis of topics covered bythe other components. For example, the use of a spec-trophotometer may be a logical outcome of discussionin a bio-medical techniques class, but the physics andelectricity of the spectrophotometer may not have beencovered. The design of this course is such that theinstructor can approach the instructors in physics andelectronics and encourage them to alter their plans sothat he might discuss the spectrophotometer. Thus,the bio-medical techniques course serves as the mech-anism by which the electronics and instrumentationtechnologies can be applied to bio-medical equipment,and indeed it is the course which can guarantee thatthe necessary electronics and instrumentation are in-cluded for the particular application of bio-medicalequipment.
The design of the curriculum assumes that faculty mem-bers both can and will be aware of students' progressin other areas of the curriculum, and so adjust theirown specific areas of instruction. This implies thatdiscussion among faculty members will influence thesequence and emphasis of topics within any of the com-ponents of the curriculum. Members of the faculty ofbio-medical equipment technology must have the abilityto adapt and modify their knowledge to meet the needsof the curriculum in bio-medical equipment technology,thus implying that the instructor is capable of prqduc-ing new materials or new variations to old materials.It requires that he be aware of the demands of biomed-ical equipment technology, and above all it requiresthat he be capable of working with others toward acommon goal while maintaining his own general goals.Perhaps no other special requirement of a BMET curric-ulum is more crucial than that of gathering a facultythat meet these requirements. The integration of thecourse work is an ideal which can be realized onlythrough the coordination of the efforts of the faculty.
It should be noted that this special requirement is the
86
point upon which the concern for college credit rests.The coordination of the efforts of the faculty can havetwo extreme possibilities. There can be little or no -
coordination, in which case each faculty member teacheshis.course as he sees fit. In this context zollegecredit is relatively easy to establish, but the successof the program to educate a BMET rests upon the abilityof the student to integrate the various components ofthe curriculum. The other extreme possibility for thecoordination of the faculty is that the content ofeach course is subordinated to the need to train a BMET;unless a particular topic can be shown to have directand explicit relevance to the service and maintenanceof bio-medical equipment, the topic is not taught.Within this context, it would be very difficult toestablish college credit for any of the courses taught,but the student would be well prepared to assume therole of a bio-medical equipment technician. If hewished to further his education, however, he would belimited in the amount of coursework that he couldtransfer to an institution of higher learning. Thefaculty, therefore, must integrate the curriculum insuch a way as to serve the dual obligation of providingthe framework upon which further education is possible,and assisting the student in integrating that frameworkinto the context of bio-medical equipment technology.
There are few instructional materials presently avail-able for use in a curriculum of this design. Of course,materials relating the fundamental concepts of electronics,instrumentation, mathematics, physics and communicativeskills are available from several sources. The importantlink that is missing is the application of these conceptsto bio-medical equipment technology. This link must beestablished by the faculty. The resource upon whichthey will draw is knowledge in their resp)ctive subjectfields and a list of equipment which has been compiledfrom the interview data. This list consists of equip-ment that the bio-medical equipment technician must beprepared to service and maintain and also equipment thathe will use as tools for that purpose. The instruction-al materials, therefore, will be developed from the know-ledge and skill requirements associated with that listof equipment. In general, the task is to identifyclasses of equipment which are related to certain fun-damental concepts in each of the curriculum areas, thento devise instructional materials which will exemplifythese fundamental concepts within the context of theclasses of equipment.
87
One of the more important aspects of the curriculumwhich thus far has received little attention is thatof the emphasis of laboratory work. It is through lab-oratory work that the goal of avoiding abstraction isachieved and the concept of integration of course workcan be effected. In the laboratory the student can seefirst-hand how the topics covered in the various com-ponents of the curriculum bear directly on the role ofa bio-medical equipment technician. Furthermore, thelaboratory can be a situation in which more than oneinstructor can play a part in devising materials so thata particular experience can be connected to more thanone component of the curriculum. In this context thelaboratory need not be a physics laboratory; rather, itcan be a laboratory in which the concepts of mathematics,instrumentation, and bio-medical equipment technologyare extracted' together with the physics. The labora-tory component of the BMET curriculum is, therefore, aspecial requirement which goes beyond the requirementof most laboratory experience's in other curricula:
IV. Preliminary Curriculum Outline
The following pages contain a preliminary curriculumoutline for an associate degree level curriculum in bio-medical equipment technology designed on the basis ofthe Field Study. It includes: Preliminary CurriculumChart, Preliminary BMET Curriculum, and Preliminary Cur-riculum Content.
It should be strongly emphasized that this curriculumoutline is very preliminary and has not been tested. Itis presented only to indicate the general requirementsof such a curriculum and to form a tentative basis forthe detailed development, pilot testing, and evaluationof such a curriculum in a continuing research project.
Curriculum Development Planning Conference
In order to explore some of the problems of system-atically developing and evaluating curricula in a rapid-ly emerging technology such as bio-medical equipmenttechnology, a curriculum development planning confer-ence was held in Waco, Texas on January 20-21, 1967 atthe James Connally Technical Institute of Texas ABMUniversity. Participants in this conference includedseveral nationally leading technical educators. Theguidelines laid down at this conference will be veryuseful in the development, testing, and evaluation ofa new broadly generalizeable curriculum for BMET's.
88

English
Physics
PRELIMINARY CURRICULUM CHART
BIO-MEDICAL EQUIPMENT TECHNICIAN
13th and 14th GRADE LEVEL
Mathematics
Electronics
Electricity
Vocabulary
Word usage
Composition
Effective
Writing
.Units of
measure
Kinematics
Heat
Light
Modern
Physics
College
Algebra
Analytic
Geometry
Principles of
Electronics
Basic Elec-'
tronic Cir-
cuits
Electrical
Fundamentals
AC and DC
circuits
Bio-Medical
Equipment
Techniques
Including:
Concepts of
Medical Sci.
ence
Bio-Medical
Instrumenta
rition
Field Ex-
perience in
Hospitals,
Research
Institutes
and Equip-
of ment Man-
to ufacturers
scr1
-11.
411
-
Report
Writing
Psychology I
Principles
of Human
Behavior
1
Introduction
Basic Pulse
to
'Circuits
Calculus
Speech
Psy.:.;iology II
Principles
of Human
Adjustment
Basics of
Computers
Construction
Design
Individual Pro
jects in build
ing specialize
equipment
Bio-Medical
Electronics
Application
electronics
bio-medical
instrumentatioh
including
trouble-
shooting &
equipment mod-
ification
Horizontal Distance represents distribution of time in
a typical day.
Vertical Distance represents distribution of time within four semester
program.
Prerequisites:
High School Mathematics through Trigonometry, two semesters
of High School Physics.

First Semester
PRELIMINARY BMET CURRICULUM
Class Lab Credit
Bio-Medical Techniques I 2* 3 3Electrical Fundamentals 2 3 3Principles of Electronics 2 3 3Physics I (Mechanics) 3 3 4Mathematics I 3 0 3English I 3 .0 3
rs l'i IT
Second Semester
Bio-Medical Techniques II 2 3 3AC and DC Circuits , 2 3 3Basic Electronic Circuits 2 3 3
Physics II (Heat, Light, Sound) 3 3 4Mathematics II 3 0 3English II
.3 0 3
15 2 19
Third Semester
Bio-Medical Techniques III 3 3 4Bio-Med. Electronic Systems I 2 3 3Basic Pulse Circuits 2 3 3Mathematics III 3 0 3Psychology I 3 .0 3Report Writing 2 0 2
Fourth Semester
Bio - Medical Techniques IV 3 3 .4Bio-Med. Electronic Systems II 3 3 4Bio-Med. Equip. Construction &
1 3 2DesignBasic3 of Computers 2 3 3Psychology II 3 0 3Speech 2 0 2
14. rz lirTotal
Bio-Medical Component .
Electrical/Electronic ComponentPhysics/Mathematics ComponentGeneral Education Component
90
16 21 2310 15 1517 9 20
.16 0 16
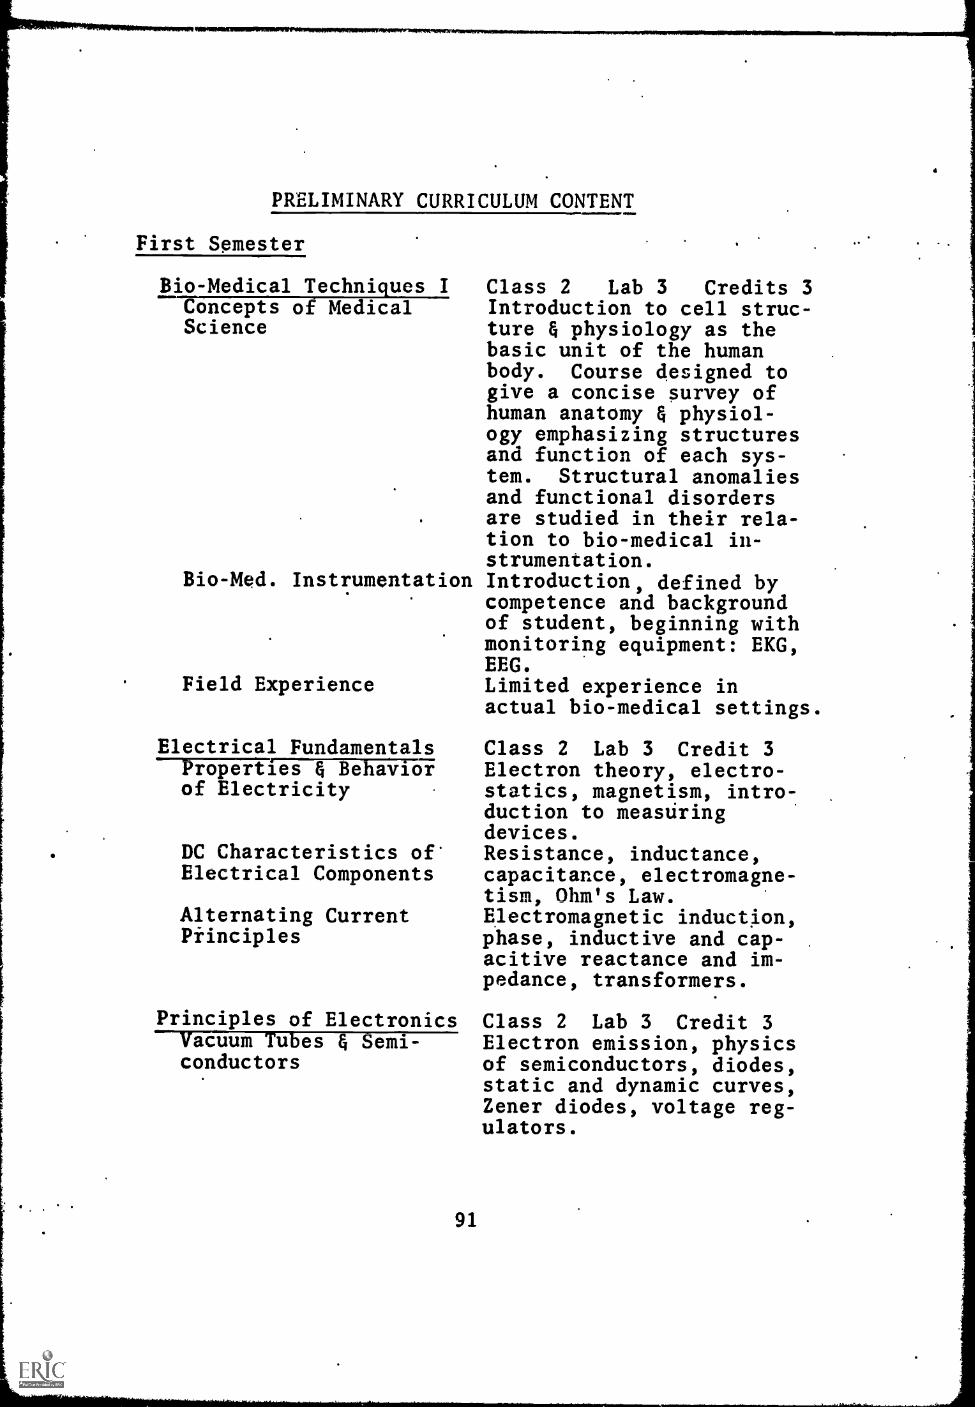
a
PRELIMINARY CURRICULUM CONTENT
First Semester
Bio-Medical Techniques IConcepts of MedicalScience
Class 2 Lab 3 Credits 3Introduction to cell struc-ture & physiology as thebasic unit of the humanbody. Course designed togive a concise survey ofhuman anatomy & physiol-ogy emphasizing structuresand function of each sys-tem. Structural anomaliesand functional disordersare studied in their rela-tion to bio-medical in-strumentation.
Bio-Med. Instrumentation Introduction, defined bycompetence and backgroundof student, beginning withmonitoring equipment: EKG,EEG.
Field Experience Limited experience inactual bio-medical settings.
Electrical FundamentalsProperties & Behaviorof Electricity
DC Characteristics ofElectrical Components
Alternating CurrentPiinciples
Class 2 Lab 3 Credit 3Electron theory, electro-statics, magnetism, intro-duction to measuringdevices.Resistance, inductance,capacitance, electromagne-tism, Ohm's Law.Electromagnetic induction,phase, inductive and cap-acitive reactance and im-pedance, transformers.
Principles of Electronics Class 2 Lab 3 Credit 3Vacuum Tubes & Semi- Electron emission, physicsconductors of semiconductors, diodes,
static and dynamic curves,Zener diodes, voltage reg-ulators.
91

Three-element Devices Triode vacuum tubes, tran-sistors, parameters, uni-junction transistors; sili-con controll rectifiers,characteristic curves.
Multi-element Devices Tetrodes, pentodes, beampower vacuum tubes, special-purpose transistors.
Physics I (Mechanics) Class 3 Lab 3 Credit 4Fundamental Concepts Time and space, precision
measurements, forces andforce systems, rectilinearand angular motion.
Kinematics Velocity and acceleration,projectiles. -
Dynamics Force and motion, momentumand collisions, work, power,and energy.
Objects in Equilibrium Statics
Mathematics I Class 3 Lab 0 Credit 3Slide Rule Scope, description, accur-
acy. Location of decimalpoint. Relation of loga-rithms to slide rule.
Basic Algebra Linear equations, functionsand graphs, simultaneousequations, exponents andradicals.
Introduction to Ad- Solution of quadratic equa-vanced Algebra tions in one unknown by
plotting, factoring, com-pleting the square, and byformula. The discriminant.
English I Class 3 Lab 0 Credit 3Problems in Mechanics Construction of effective
sentences and paragraphs,functional grammar usageand organization. Empha-sis upon proper spelling.
Word Usage & Vocabulary Exercises in expansion ofBuilding vocabulary and proper iden-
tification and use of words.Persistent problems in mechanics.
92

Principles of Composi-tion
Second Semester
Bio-Medical Techniques IIConcepts of MedicalScience
Instruction and practicein the different types ofwriting including informa-tive evaluative and per-suasive. Abstract andshort papers studiedas models of expressionand stimulation for expos-itory writing.
Class 2 Lab 3 Credit 3Review of basic chemistryemphasizing redox, chemical equilibrium and ioni-zation. Introduction tophysiological chemistry,integrating concepts withrelated electronic labora-tory apparatus.
Bio-Med. Instrumentation Experience in the opera-tion and purpose of lab-oratory equipment: pHmeter, spectrophotometer,colorimeter, flame photo-meter, blood analyzers.
Field Experience Regularly scheduled ex-perience in hospital lab-oratories
AC and DC CircuitsDC Circuit Analysis
AC Circuit Analysis
Resonant Circuits
Class 2 Lab 3 Credit 3Kirchhoff's Laws, super-position theoreth, Thevenin'sand Norton's theorems.Simple circuits, seriescircuits, parallel circuits,combination circuits.Series and parallel reson-and circuits and theircharacteristics.
Basic Electronic Circuits Class 2 Lab 3 Credit 3Rectification Principles of rectifica-
tion, types, filtering,
93

Amplification
Oscillation
Physics II (Heat, Light,Sound)
Temperature, Heat,Thermodynamics
Wave Motion
Light
Introduction to ModernPhysics
Mathematics IIAdvaa-edAlgebra
Logarithms
Trigonometry
voltage dividers, for vac-uum tubes and semiconduc-tors.Classification of circuits,audio-frequency amplifiersfor vacuum tubes and semi-conductors.Uniform wave oscillators,phase shifting, resonantcircuit, crystal controlledoscillators for vacuumtubes and semi-conductors.
Class 3 Lab 3 Credit 4
Temperature and ideal gases,thermal expansion andstress, heat and laws ofthermodynamics.Transverse and longitudin-al waves, polarization andphotoelectric effect.Sound waves.Geometrical optics, inter-ference and diffraction.Nuclear structure, atomicmolecular structure, nucleardisintegration.
Class 3 Lab 0 'Credit 3Simultaneous quadraticequations, solution of sys-tems of equations; reduc-tion to simpler systems.Binomial Theorem.Definition, properties,relation to exponents,tables, interpolation,computation.Trigonometric functions,the right triangle, theoblique triangle, trigono-metric identities. Vectors.
English II Class 3 Lab 0 Credit 3Development of Concepts To cultivate analytical
94.
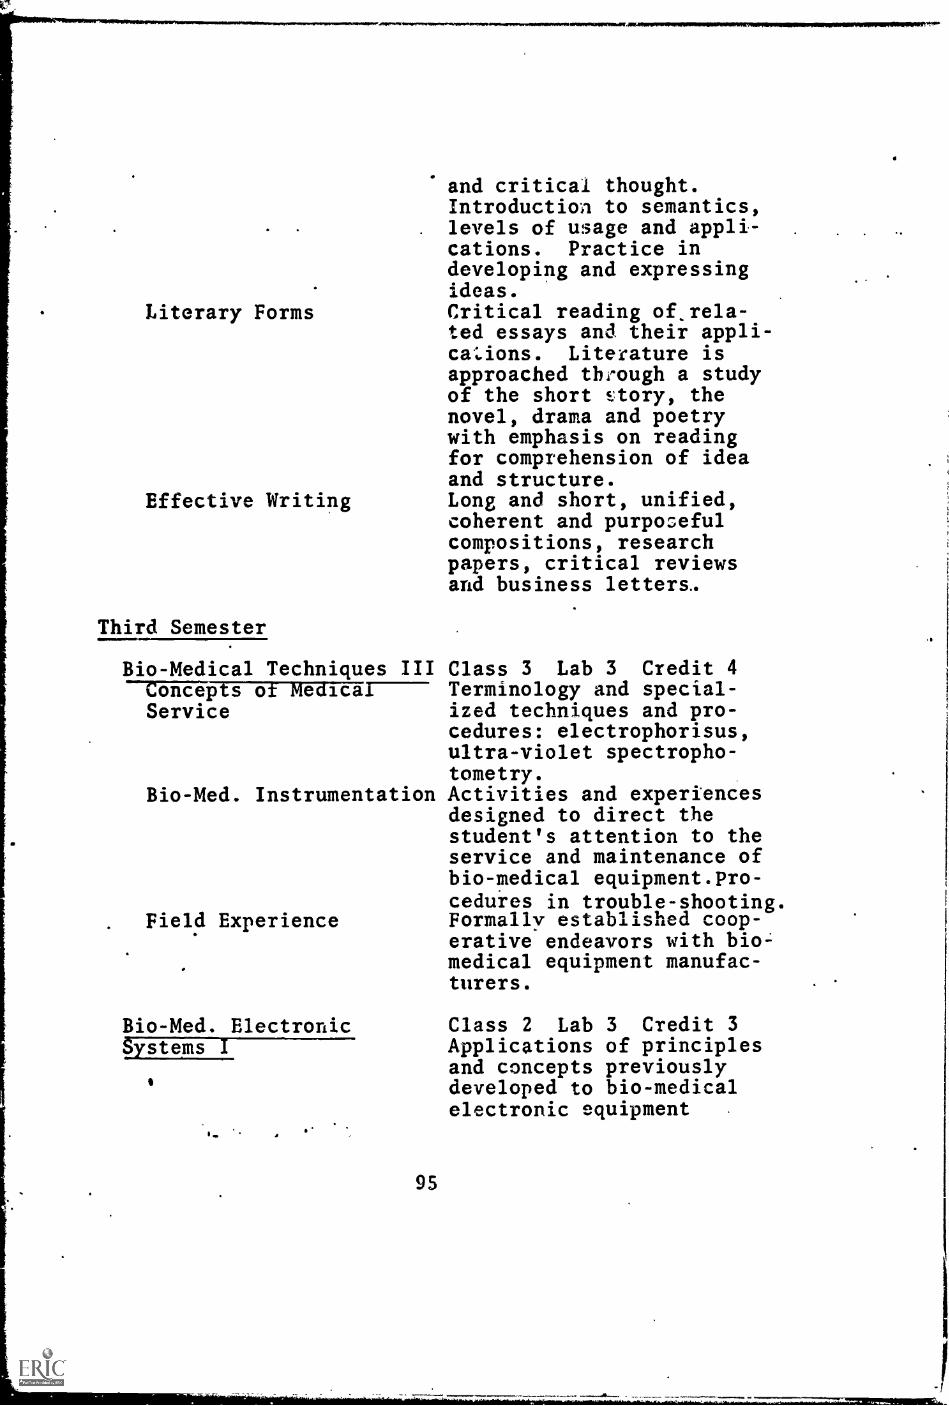
and critical thought.Introduction to semantics,levels of usage and appli-cations. Practice indeveloping and expressingideas.
Literary Forms Critical reading of.rela-ted essays and their appli-ca'..ions. Literature isapproached through a studyof the short story, thenovel, drama and poetrywith emphasis on readingfor comprehension of ideaand structure.
Effective Writing Long and short, unified,coherent and purposefulcompositions, researchpapers, critical reviewsand business letters..
Third Semester
Bio-Medical Techniques III Class 3 Lab 3 Credit 41.7610105.76aNala[17---- Terminology and special-Service ized techniques and pro-
cedures: electrophorisus,ultra-violet spectropho-tometry.
Bio-Med. Instrumentation Activities and experiencesdesigned to direct thestudent's attention to theservice and maintenance ofbio-medical equipment.Pro-cedures in trouble-shooting.
. Field Experience Formally established coop-erative endeavors with bio-
.
Bio-Med. ElectronicSystems I
95
medical equipment manufac-turers.
Class 2 Lab 3 Credit 3Applications of principlesand concepts previouslydeveloped to bio-medicalelectronic equipment
II

Basic Pulse Circuits Class 2 Lab 3 Credit 3Nonsinusoidal.Wave Fourier analysis, square,shapes rectangular, sawtooth, tri-
and peaked waves,transients.
Waveshaping Circuits Operation, R-C differen-tiator, integration, diff-erentiated and integratedvoltage waveshapes.
Multivibrators Types of multivibrators,astable, monostable, andbistable.
Mathematics III Class 3 Lab 0 Credit 3Analytic Geometry Slope, equations of a
straight line, equationsand graphs of the conics.
Differentiation Functions and the limitconcept, derivatives ofalgebraic functions, max-ima and minima, the dif-ferential.
Integration Integration as the inverseof differentiation, theconcept of summation, thedefinite integral, the in-tegral as an area, inte-gration of algebraicfunctions.
Psychology I (Principles Class 3 Lab 0 Credit 361-Human Behavior)
Basic Concepts Definition, description,and growth of psychologyas a science. Explanaticnof methddology and tech-niques.
Structure and Function ofThe nature of the brainHuman NervoLs System and neural system. Sen-
sory reception and per-;eptual development.
Behavioral Processes Motivation, learning,thinking, emotion, andpersonality. Reactionto frustration and 'con-flict.
96
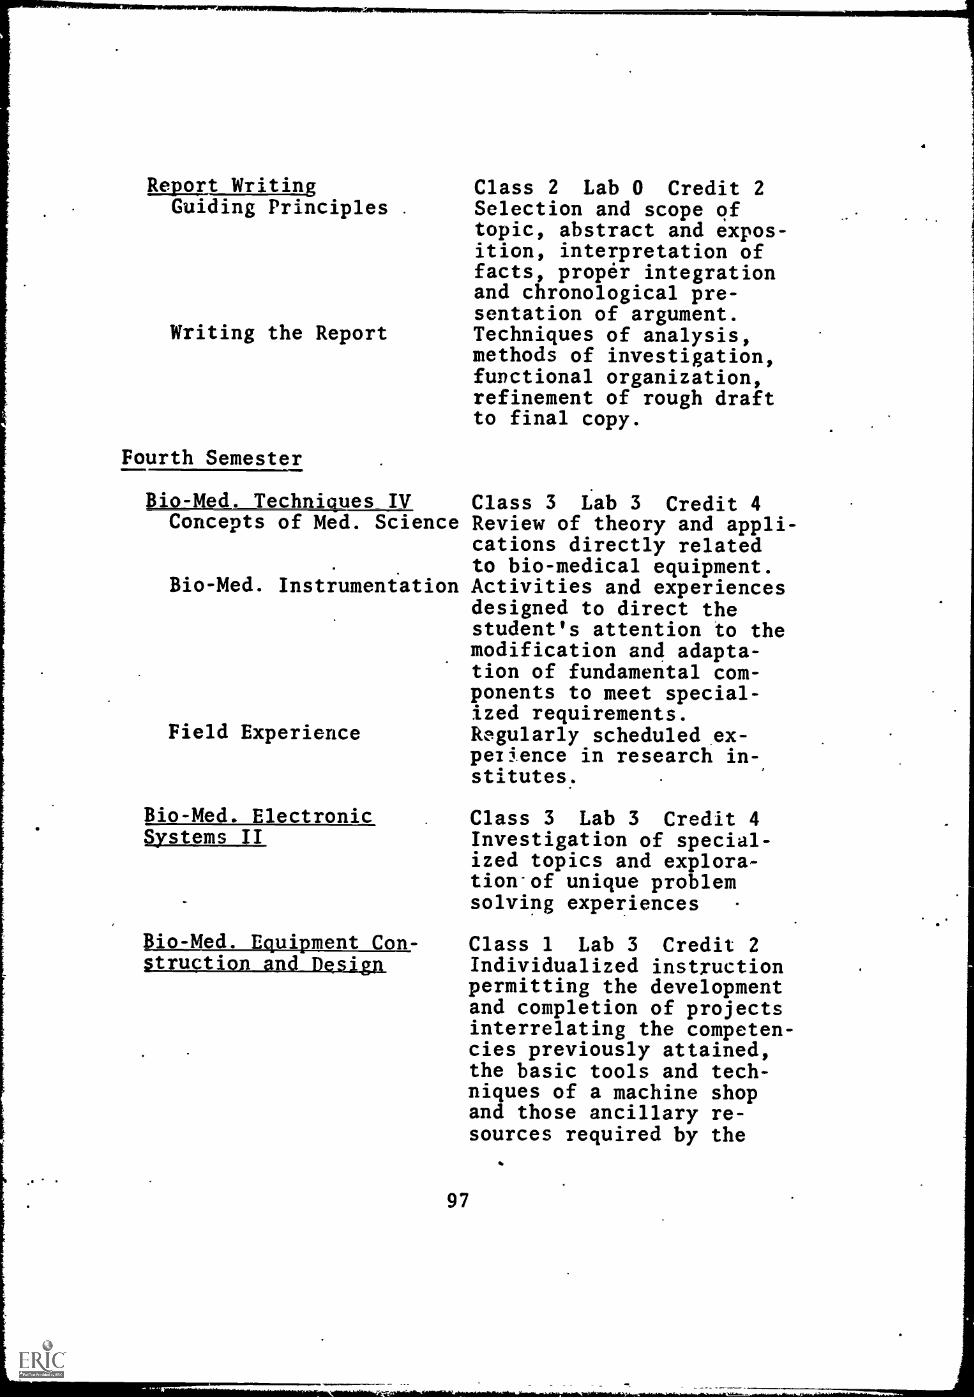
Report Writing Class 2 Lab 0 Credit 2Guiding Principles . Selection and scope of
topic, abstract and expos-ition, interpretation offacts, proper integrationand chronological pre-sentation of argument.
Writing the Report Techniques of analysis,methods of investigation,functional organization,refinement of rough draftto final copy.
Fourth Semester
Bio-Med. Techniques IV Class 3 Lab 3 Credit 4Concepts of Med. Science Review of theory and appli-
cations directly relatedto bio-medical equipment.
Bio-Med. Instrumentation Activities and experiencesdesigned to direct thestudent's attention to themodification and adapta-tion of fundamental com-ponents to meet special-ized requirements.
Field Experience Regularly scheduled ex-pe/3ence in research in-stitutes.
Bio-Med. Electronic Class 3 Lab 3 Credit 4Systems II Investigation of special-
ized topics and explora-tion-of unique problemsolving experiences
Dio-Med. Equipment Con- Class 1 Lab 3 Credit 2$truction and Design Individualized instruction
permitting the developmentand completion of projectsinterrelating the competen-cies previously attained,the basic tools and tech-niques of a machine shopand those ancillary re-sources required by the
97

Basics of Computers--NTOWYS7pMIT--
project.
Class 2 Lab 3 Credit 3Decimal to any base, anybase to decimal conver-sions.
Boolean Algebra Propositions, Venn diagrams,Boolean algebra functions,switching circuit theory,map technique, synthesis.
( Basic Logic Units AND gates, OR gates, NORand NAND, inverters, diodematrix, logical operations.
Psychology II (Principles Class 3 Lab 0 Credit 3of Human Adjustment)Personality Dynamics
Atypical Behaviorand Adjustment
Group Interactionand adjustment
Elements of SpeechBasic Fundamentals
Techniques of Delivery
Defining and differentia-ting between the normaland abnormal personalitypatterns.Recognition and avoidanceof maladjustment. Prin-ciples of mental hygiene.Emphasis on the develop-ment of individuals andgroups in present day cul-tures and principles ofadjustment.
Class 3 Lab 0 'Credit 3Fundamental concepts, con-tent, organization, voiceand diction. Types ofpublic speeches includingformal discussions, speechesof persuasion and informa-tion, speeches using vis-ual aids.Platform behavior includ-ing posture and bodilyaction. Constructivecriticism through inter-view sessions and taperecording analysis. De-velopment of listeningskills.

CONCLUSIONS AND IMPLICATIONS
The first objective of this study was to determine theneed for individuals to service and maintain equipmentfound in hospitals and bio-medical research. institutes.This documentation was to take the form of specifyingthe number of such individuals needed, characterizingthe employment opportunities that would be open tothem, and gathering information that can assist in theformulation of a curriculum to train these technicians.On the basis of these data the following conclusionscan be drawn:
1. There is a current need for between 1350 and1450 technicians to service and maintain bio-medical equipment in the New England and Mid-Atlantic regions;
2. This need, projected to 1970, increases tobetween 3200 and 3700 BMET's;
3. The greatest opportunity for employment iswith manufacturers of bio-medical equipment,although the more sophisticated jobs arefound in hospitals and research institutes;
4. There are four general job types that a BMET- will fill:
a. Rudimentary service and maintenance underclose supervision by the production mana-ger in the manufacturer setting or thechief engineer in the hospital setting,and providing an average salary of $6800;
b. General service and maintenance requiringgreater competencies not only with respectto the quality of his work, but also withrespect to the number of tasks expected ofhim, and supervised to a greater degree byprofessional people and providing an aver-age salary of $7400;
c. Sophisticated service and maintenance thatwould involve design and modification ofequipment almost exclusively under thesupervision of professional people and. pro-viding an average salary of $8400.
99
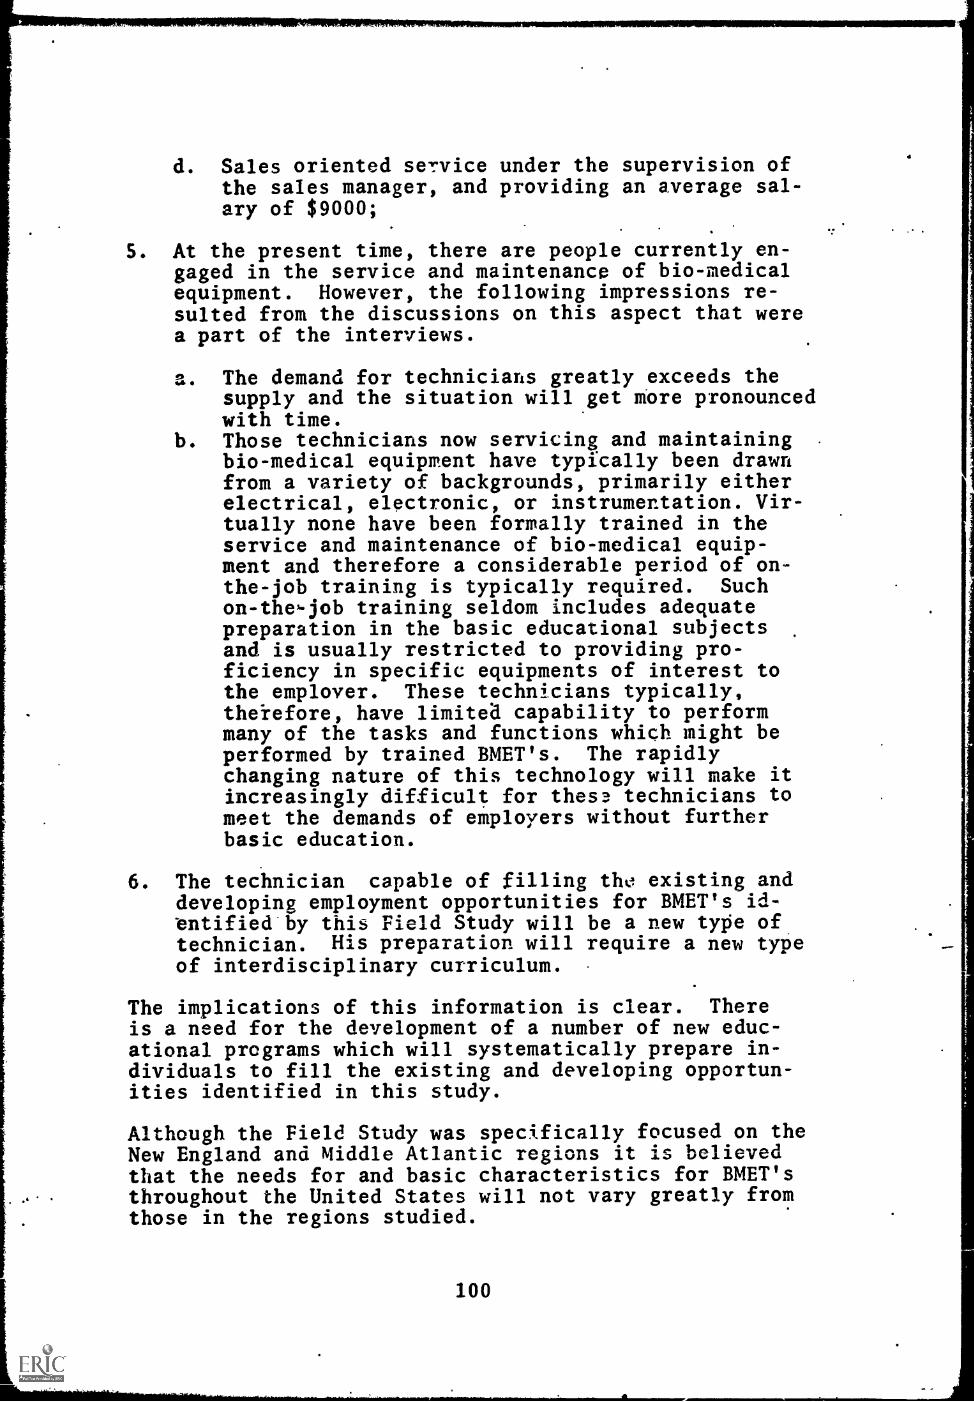
d. Sales oriented service under the supervision ofthe sales manager, and providing an average sal-ary of $9000;
5. At the present time, there are people currently en-gaged in the service and maintenance of bio-medicalequipment. However, the following impressions re-sulted from the discussions on this aspect that werea part of the interviews.
a. The demand for technicians greatly exceeds thesupply and the situation will get more pronouncedwith time.
b. Those technicians now servicing and maintainingbio-medical equipment have typically been drawnfrom a variety of backgrounds, primarily eitherelectrical, electronic, or instrumentation. Vir-tually none have been formally trained in theservice and maintenance of bio-medical equip-ment and therefore a considerable period of on-the-job training is typically required. Suchon-the-job training seldom includes adequatepreparation in the basic educational subjectsand is usually restricted to providing pro-ficiency in specific equipments of interest tothe employer. These technicians typically,theiefore, have limited capability to performmany of the tasks and functions which might beperformed by trained BMET's. The rapidlychanging nature of this technology will make itincreasingly difficult for these technicians tomeet the demands of employers without furtherbasic education.
6. The technician capable of filling the existing anddeveloping employment opportunities for BMET's id-entified by this Field Study will be a new type oftechnician. His preparation will require a new typeof interdisciplinary curriculum.
The implications of this information is clear. Thereis a need for the development of a number of new educ-ational programs which will systematically prepare in-dividuals to fill the existing and developing opportun-ities identified in this study.
Although the Field Study was specifically focused on theNew England and Middle Atlantic regions it is believedthat the needs for and basic characteristics for BMET'sthroughout the United States will not vary greatly fromthose in the regions studied.
100
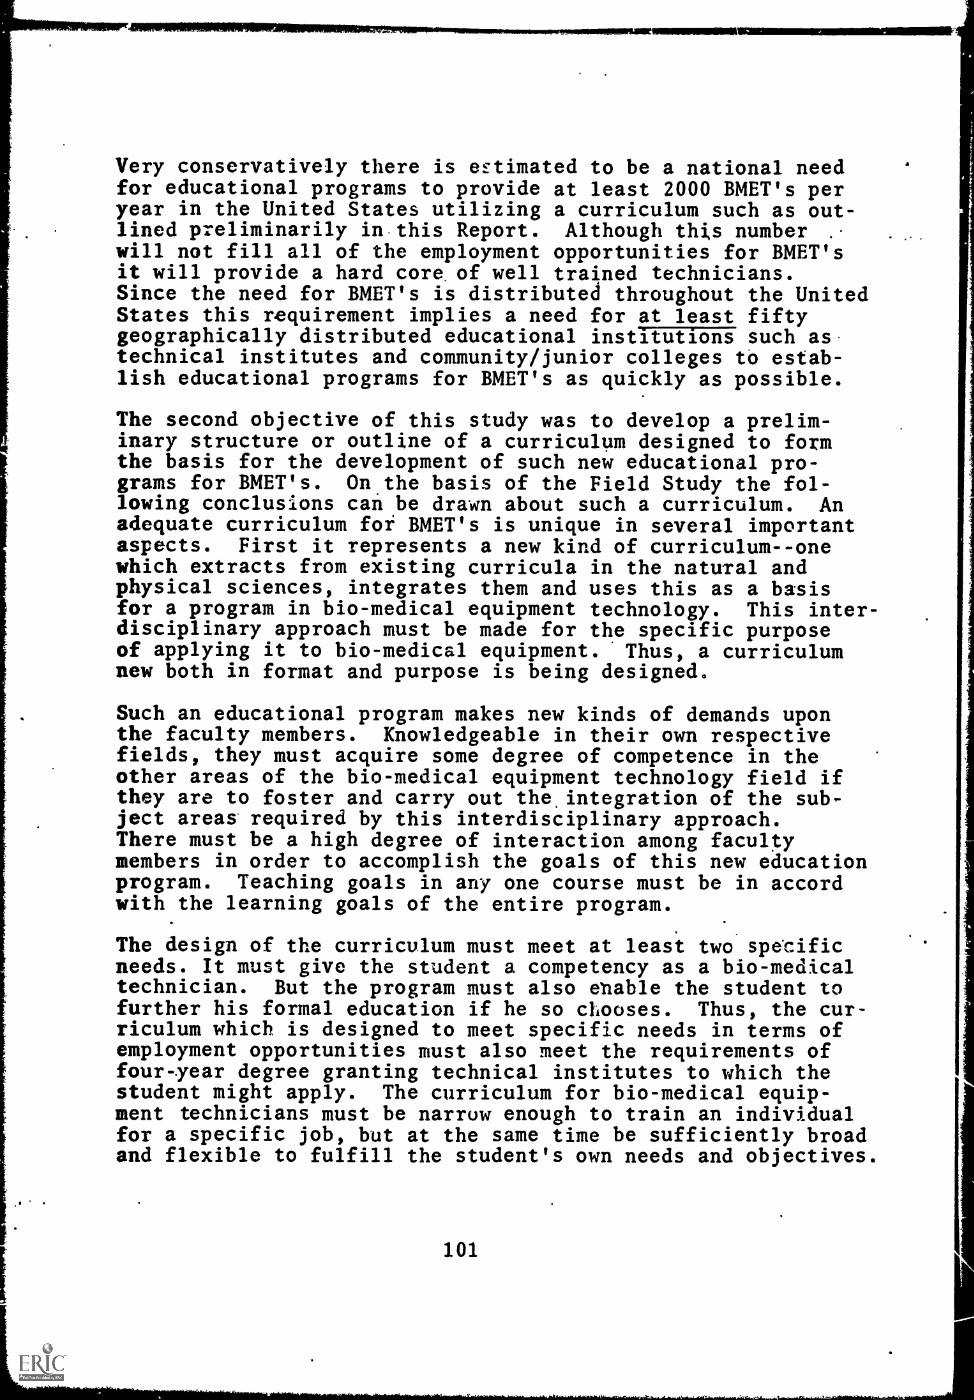
Very conservatively there is estimated to be a national needfor educational programs to provide at least 2000 BMET's peryear in the United States utilizing a curriculum such as out-lined preliminarily in this Report. Although this numberwill not fill all of the employment opportunities for BMET'sit will provide a hard core of well trained technicians.Since the need for BMET's is distributed throughout the UnitedStates this requirement implies a need for at least fiftygeographically distributed educational institutions such astechnical institutes and community/junior colleges to estab-lish educational programs for BMET's as quickly as possible.
The second objective of this study was to develop a prelim-inary structure or outline of a curriculum designed to formthe basis for the development of such new educational pro-grams for BMET's. On the basis of the Field Study the fol-lowing conclusions can be drawn about such a curriculum. Anadequate curriculum foi BMET's is unique in several importantaspects. First it represents a new kind of curriculum--onewhich extracts from existing curricula in the natural andphysical sciences, integrates them and uses this as a basisfor a program in bio-medical equipment technology. This inter-disciplinary approach must be made for the specific purposeof applying it to bio-medical equipment. Thus, a curriculumnew both in format and purpose is being designed.
Such an educational program makes new kinds of demands uponthe faculty members. Knowledgeable in their own respectivefields, they must acquire some degree of competence in theother areas of the bio-medical equipment technology field ifthey are to foster and carry out the, integration of the sub-ject areas required by this interdisciplinary approach.There must be a high degree of interaction among facultymembers in order to accomplish the goals of this new educationprogram. Teaching goals in any one course must be in accordwith the learning goals of the entire program.
The design of the curriculum must meet at least two specificneeds. It must give the student a competency as a bio-medicaltechnician. But the program must also enable the student tofurther his formal education if he so chooses. Thus, the cur-riculum which is designed to meet specific needs in terms ofemployment opportunities must also meet the requirements offour -.year degree granting technical institutes to which thestudent might apply. The curriculum for bio-medical equip-ment technicians must be narrow enough to train an individualfor a specific job, but at the same time be sufficiently broadand flexible to fulfill the student's own needs and objectives.
101 1

I
Recommendation No, 1
RECOMMENDATIONS
Educational programs in Bio-Medical Equipment TechnologyshOuld be planned and implemented to provide a minimum of2000 BMET's per year beginning as soon as possible.
It is recommended that educational programs be estab-lished in a minimum of fifty .geographically dispersededucational institutions such as technical institutes,and community/junior colleges graduating an average offorty BMET's per year.
Recommendation No. 2
Because of the unique curriculum requirements of this emerg-ing technology, schools cannot expect to develop adequateprograms for BMET's by utilizing combinations of existingcourses and instructional materials without major modifi-cations and additions.
Major curriculum development is required in order both tointerrelate the academic courses in this multi-disci-plinary technology and to relate the academic courses tothe required laboratory and clinical experience.
Recommendation No. 3
A continuing intensive research project can and should becarried out, based upon the occupational information devel-oped in this project, to systematically develop, pilot test,and evaluate an associate degree type of curriculum forBMET's which can be broadly generalized tobe applicable tonumerous post secondary institutions.
It is not economical nor feasible for individual schoolsto attempt to develop such a curriculum independentlywith limited resources. The results of an intensiveresearch program in this area can be used by many schoolsas the basis for establishing educational programs forBMET's with minimum local effort, time, and cost.

SUMMARY
The purpose of this study was to document the need forindividuals to service and maintain equipment found inhospitals and bio-medical research institutions. Thisdocumentation took the form of specifying the numberof such technicians needed, establishing the character-istics of the potential employers of this technician,and gathering data that would assist in formulating acurriculum to train such a technician. 'The three ob-vious sub-populations of hospitals, manufacturers, andresearch institutes were independently sampled accord-ing to a stratified random design. A loosely structur-ed interview guide, constructed to organize the inter-view, but to provide the freedom to explore open-endedquestions, was used with the selected participants.
The data gathered from the interviews established a needwithin the population of employers studied in the NewEngland and Middle Atlantic regions for between 1350 and1450 BMET's to be utilized on current staffs, and for bet-ween 3200-3700 BMET's for use on 1970 staffs. The great-est proportions of these needs are expressed by the manu-facturer sub-population, with the lowest proportion beingexpressed by the hospital sub-population. In each of thesub-populations the need was most directly related to thecurrent involvement in bio-medical equipment, in regardto both direct expenditure and to expenditures for per-sonnel and services associated with the equipment. Therewere few substantial relationshipsestablished betweenreadily available objective data and the need for BMET's.There was some evidence to suggest that hospitals withmedical school affiliation and lower payroll costs whowere under a city type control and located in metropolitanareas of region 2 would employ the BMET to a greater degreethan any other type of hospital. In the manufacturer sub-population there was evidence to suggest that manufacturersof physiological equipment having assets less than$1,000,000 would utilize BMET's to a lesser degree than anyother type of manufacturer. In the case of the research in-stitute sub-population, the rather obvious relationship bet-ween the size of the institute and the need for BMET's wassupported.
The need for BMET's was distributed among four types oftechnician. Three of the four types were levels of ser-vice and maintenance, and the fourth was a sales-orientedtechnician identified by the manufacturer
103

sub-population with an estimated average.salary of$9000. The first two levels of the service and main-tenance technician constitute the greatest proportionof BMET's needed. The levels are distinguished by asophistication of functions expected of the BM t71- lhelowest level identified by the hospital and wil:LI.fer-er sub-populations-,would be a service and ...iirc.colo7.1-;
only technician supervised by the prod;:ctionin the manufacturer sub-population and by the caiefengineer in the hospital sub-population. The averagesalary for this type is $6800. The second level oftechnician would be capable of a wider range offunctions, including operation of the equipment, in,struction in its use,, and installation of the equip-ment. The second level technician would be su-,er-vised to a greater degree by research and professionalstaff members, and the average salary would be $7400.The third level of technician performs the most soph-isticated tasks, namely the design, modification andadaptation of the equipment. This type of technicianwas identified to a greater degree by the hospitaland research institute sub-populations, would be super-vised almost exclusively by research and professionalstaff members, and would receive an average salary of$8400.
Using the data with respect to the employment oppor-tunities for the BMET as a basis, the informal infor-mation gathered in the interviews with regard to theskill and knowledge requirements of the BMET was com-bined with the experience of consultants in the fieldsof bio-medical engineering and technical education todevise a curriculum for training the BMET. The essen-tial character. of the curriculum is that it is largelyan electronics technician curriculum with a strongphasis on medical instrumentation. The aspect of thecurriculum that makes it uniquely suited for bio-medicalequipment technology is a component titled "Bio-Medi-cal Equipment Techniques." This component is the focalpoint of the entire curriculum. It serves as themechanism by which the several other components of thecurriculum may be integrated and their application tobio-medical equipment established. It is throughthe student's experience in the bio-medical equipmenttechniques course that he becomes familiar with the con-cepts, terminology and procedures unique to the bio-medical field. The necessary integration requires thefaculty to devise ways by which the goals and objectivesof the curriculum can most effectively be reached.
104

a
REFERENCES
1. -Resources for Medical Research. Report 4,
upport for Me ical Research.1947-1964, U.S. Department of Health, Educationand Welfare, Public Health Service Publication1068. August 1963.
2. Emplo ment Outlook and Changin: Occu ational Struc-ture in ectronic actur111:. 1. . Iepartment61-1,41Vor,Ealletinktober 1963.
3. Trends in Selected Technical Markets. Arthur D.itt e, nc. Cam ri ge, Mass. December 1965.
4. Cochran, William G. Sampling Techni ues. NewYork: John Wildey & Sons. 1963. 10.
105

APPENDIX A.
APPENDIX B.
APPENDIX C.
APPENDIX D.
APPENDIX E.
APPENDIX F.
APPENDIX G.
LIST OF APPENDIXES
Preliminary Curriculum Outline Used in theField Study and Interview Guides Used inthe Field Study.
Supplementary Tables Relating to Proportionsof Hospitals, Manufacturers and Research In-stitutes Indicating Needs for BMET's.
Supplementary Tables Extrapolating the Num-bers of BMET's Needed by Employers in theDifferent Sub-Populations.
Procedures Used to Explain Distribution ofMoney Variables.
List of Individuals Who Assisted in Planningand Carrying Out Project.
List of Hospitals, Manufacturers, and ResearchInstitutes Interviewed in the Field Study.
List of Institutions Interviewed in Prelim-inary Survey.
106

APPENDIXES AI AND All
PRELIMINARY CURRICULUM PROPOSAL FORMS USED IN FIELD STUDY
EXPLANATION OF CURRICULUM FORMS
The attached sheets are representative of our general thoughtsin regard to a curriculum for the bio-medical equipment tech-nician. The circle chart depicts the distribution of credithours among the several, major areas of the curriculum. Thereis also an indication of the time that is devoted to the lab-oratory aspects of some courses.
The block chart has implied time factors in its horizontaland vertical dimensions. Distances in the horizontal directionare representative of the distribution of time in a typical day.Distances in the vertical direction are representative of thedistribution of time within the four semester tenure of the pro-gram. For example, the Electricity & Electronics areas receiveconsiderable time in the first two semesters but in the thirdsemestester the time is halved and it is not taught in thefourth semester.
An aspect of our curriculum proposal that isnot clearly shownin either chart is a high degree of integration among the sev-eral areas. The major component of the integration is the bio-medical area. It is our plan to begin the familiarization ofbio-medical equipment and techniques in the first semester andto expand this area as the students develop competence in theother areas. The expansion takes place not only as'courses areadded (one in the third semester and two more in the fourthsemester) but also by considering bio-medical applications inother areas (telemetry in electricity & electronics, and trans-ducers in physics). Our model for the curriculum is a core ofbio-medical equipment techniques that is gradually expanded andin addition is "served" by the other areas. Mathematics actsas a service to electricity & electronics and physics.
Our feeling is that the accomplishment of the broad backgroundthat is required of the technician necessitates a highly inte-grated program that stresses the relationship of fundamentalsubjects to bio-medical techniques.
A-1

DIV"4-ILLYLl.ML GWUlrmrAii
ICI.-1111.1r
COURSE OUTLINE
13th and 14th GRADE LEVEL
General
2aZ
"....
=N
E.IN
ME
NE
.11.
4
English
Composition
I iTech Report
Writing
Humanities
Electives
Electricity & Electronics
20%
AC & DC Circuits
Amplifiers
Vacuum Tubes
Transistors
Telemetry
Practicum
- Trouble
Shooting
- Preventive
Maintenance
Mathematics
157.
Trigonometry
Vector Analysis
Algebra
Number Systems
Analytic
Geometry
Physics
157.
Bio-Medical
307.
Mechanics
Heat
Heat Transfer
Optics
Fluid Mechanics
Bio-Medical
Transducers
Bio-Medical
Equipment
Techniques
Graphical
'llculus
Clinical
Experience
Sociology of
Bio-Medical
Professions
&Occupations
Computer
Specialization
Applications
Electives
to
Bio-Medical
Systems
Design and
Equipment
Selection
Prerequisites 1
High School Met.r,,ematics through Trigonometr!
Two-semesters
'
Snhool Physic::
miln
eNeY
IEN
.00
"NM
ME
NN
EN
NE
NE
EN
NE
EN
NIE
NI.
VE
NN
E.
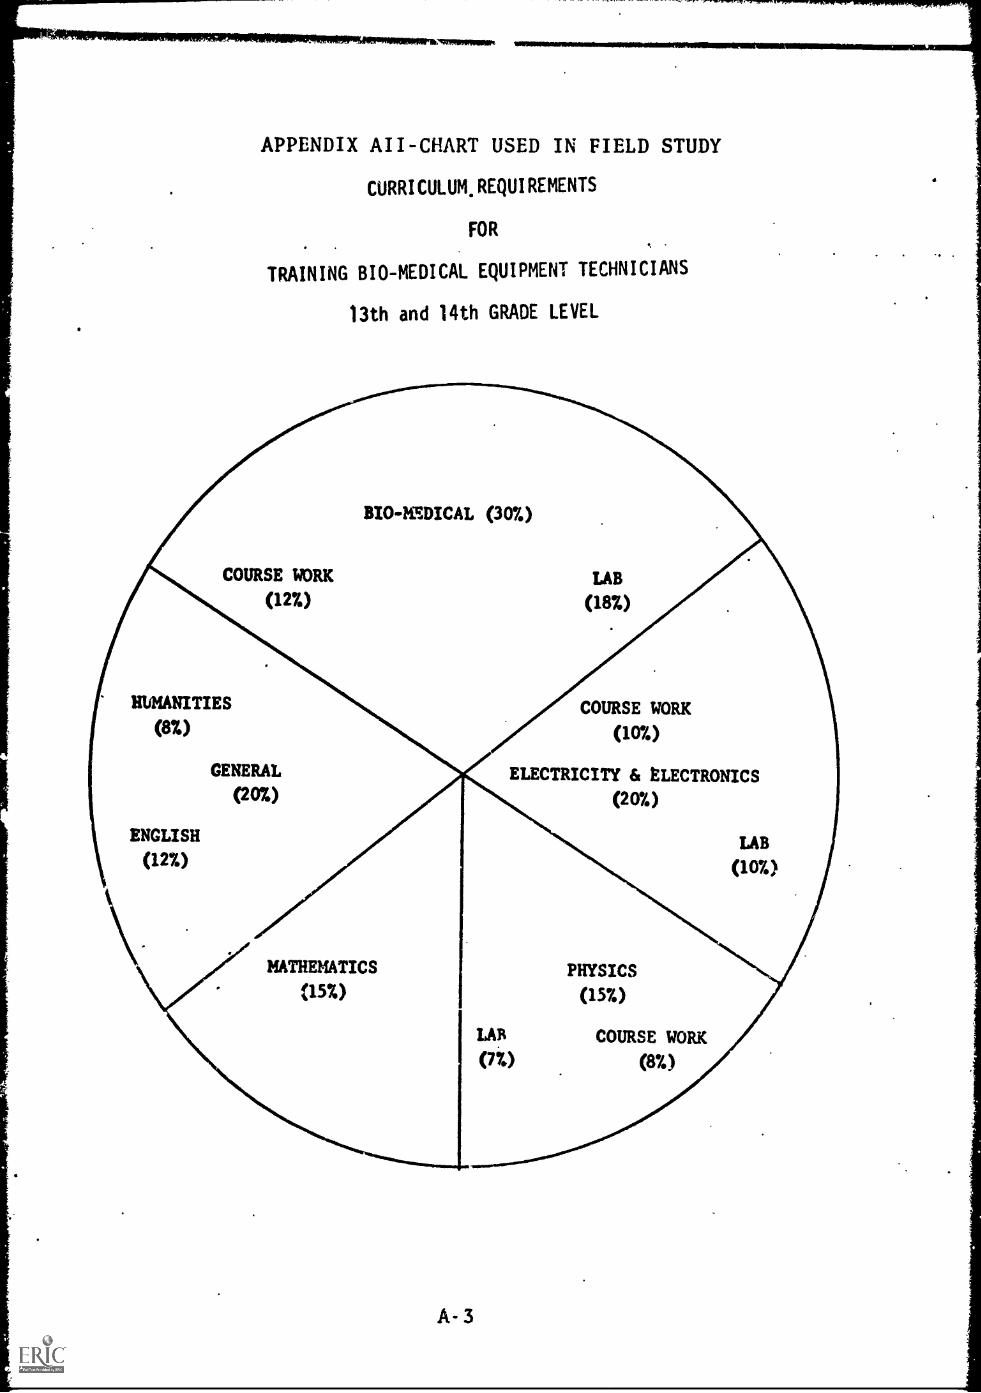
APPENDIX All -CHART USED IN FIELD STUDY
CURRICULUM, REQUIREMENTS
FOR
TRAINING BIO-MEDICAL EQUIPMENT TECHNICIANS
13th and 14th GRADE LEVEL
BIO- 1 DICAL (307.)
COURSE WORK
(12%)
LAB
(18%)
HUMANITIES
(8%)
ENGLISH
(127.)
GENERAL
(20%)
COURSE WORK
(10%)
ELECTRICITY & ELECTRONICS
(207.)
LAB
(107.)
MATHEMATICS
(15%)PHYSICS
(15%)
LAB COURSE WORK
(77.) (87.)
A- 3

. APPENDIX AIII
INTERVIEW GUIDE
for
Hospital Sample
of
Bio-Medical Equipment Technician
Field Study
Name Date
Position
Institution Interviewer
A-4

IA. Do you have any recommendations for employing the curriculumon the attached sheet?
Specifically:
a. What should be the length of such a training program?
b. To what extent would the technician require the followingsubjects?
Biology
Physiology
Chemistry
Instrumentation Communication
c. Could medical specialization be taught in an internshipprogram which follows the training program?
d. Do the courses seem to prepare individuals for thefunctions you feel are needed?
e. Does the scope of training seem appropriate?
f. What equipment should receive high priority for inclusionin the bio-medical techniques course?
g. Is there a need for acLreditation of the BMET?
Physics
Mathematics
Electronics
AS

IB. How many types of jobs that you administer do you foreseea BMET engaged in? What are the functions cf each type?What is the salary range of each type? How many BMET'sof each type do you need? Who will supervise each job type?
,Job Type I Salary RangeI=4
Job Type II Salary Range
Number Now 1970 Number Now 1970
Functions Supervisor I Functions Supervisor
Is there a requirement for skilled maintenance personnel?Superintendent of grounds?
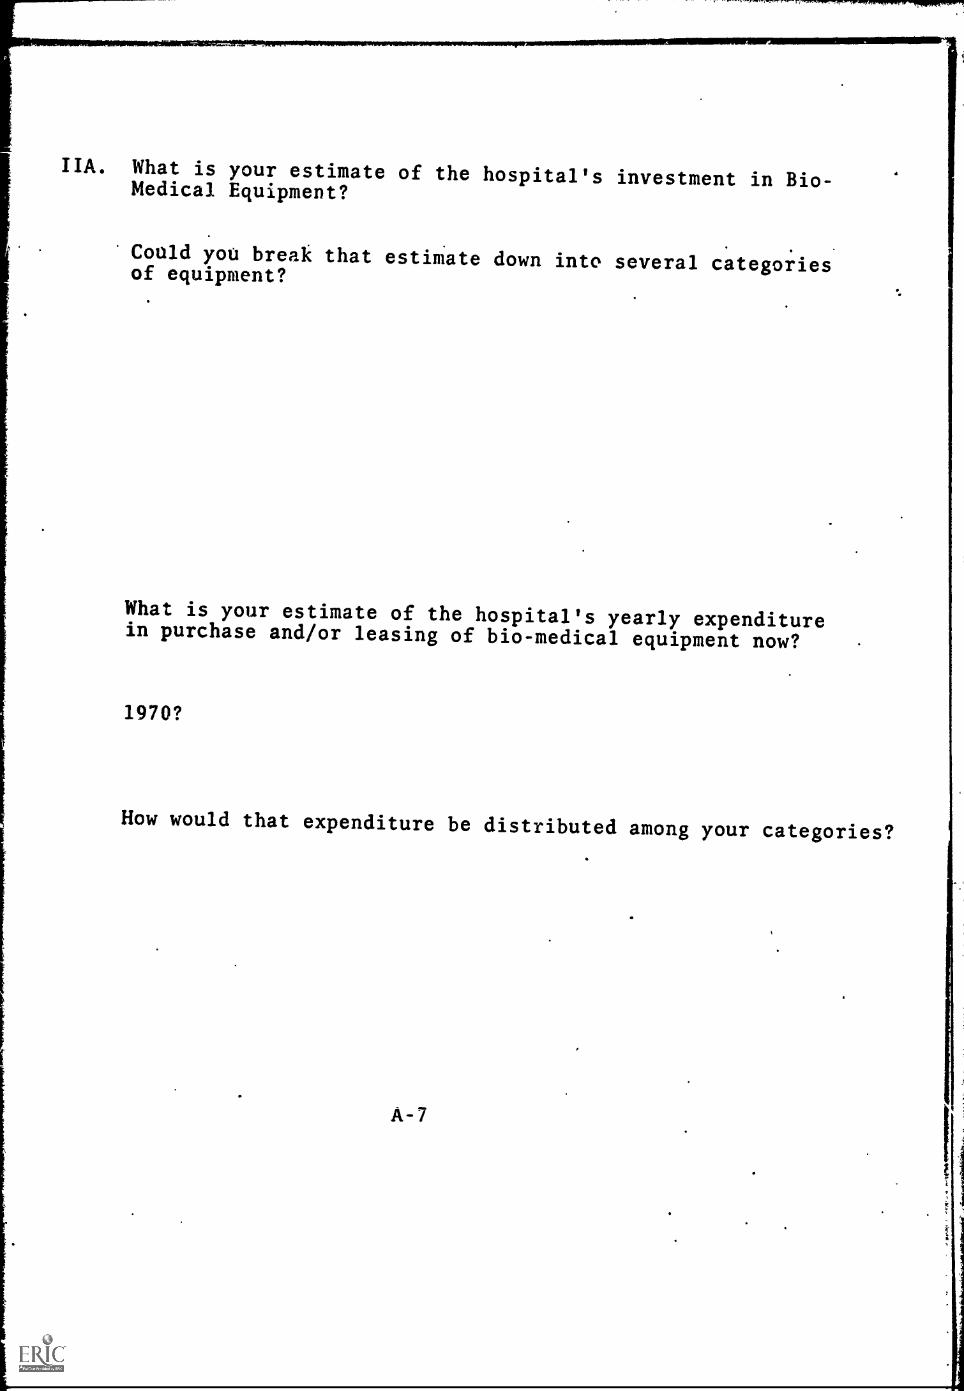
IIA. What is your estimate of the hospital's investment in Bio-Medical Equipment?
Could you break that estimate down into several categoriesof equipment?
What is your estimate of the hospital's yearly expenditurein purchase and/or leasing of bio-medical equipment now?
1970?
.
How would that expenditure be distributed among your categories?
A-7
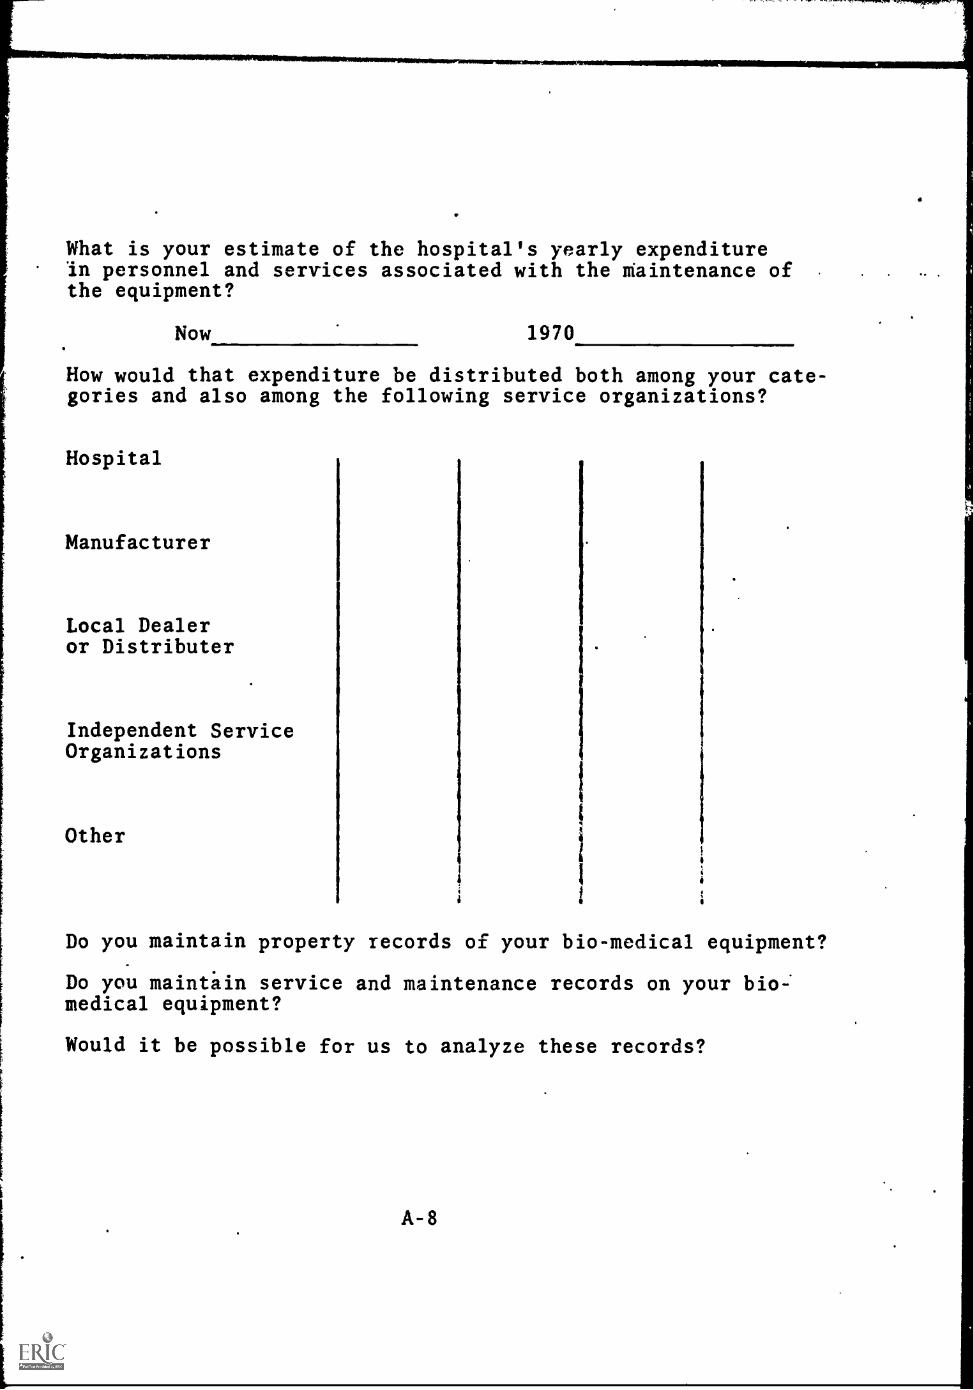
What is your estimate of the hospital's yearly expenditurein personnel and services associated with the maintenance ofthe equipment?
Now 1970
How would that expenditure be distributed both among your cate-gories and also among the following service organizations?
Hospital
Manufacturer
Local Dealeror Distributer
Independent ServiceOrganizations
Other
Do you maintain property records of your bio-medical equipment?
Do you maintain service and maintenance records on your bio:medical equipment?
Would it be possible for us to analyze these records?
A-8
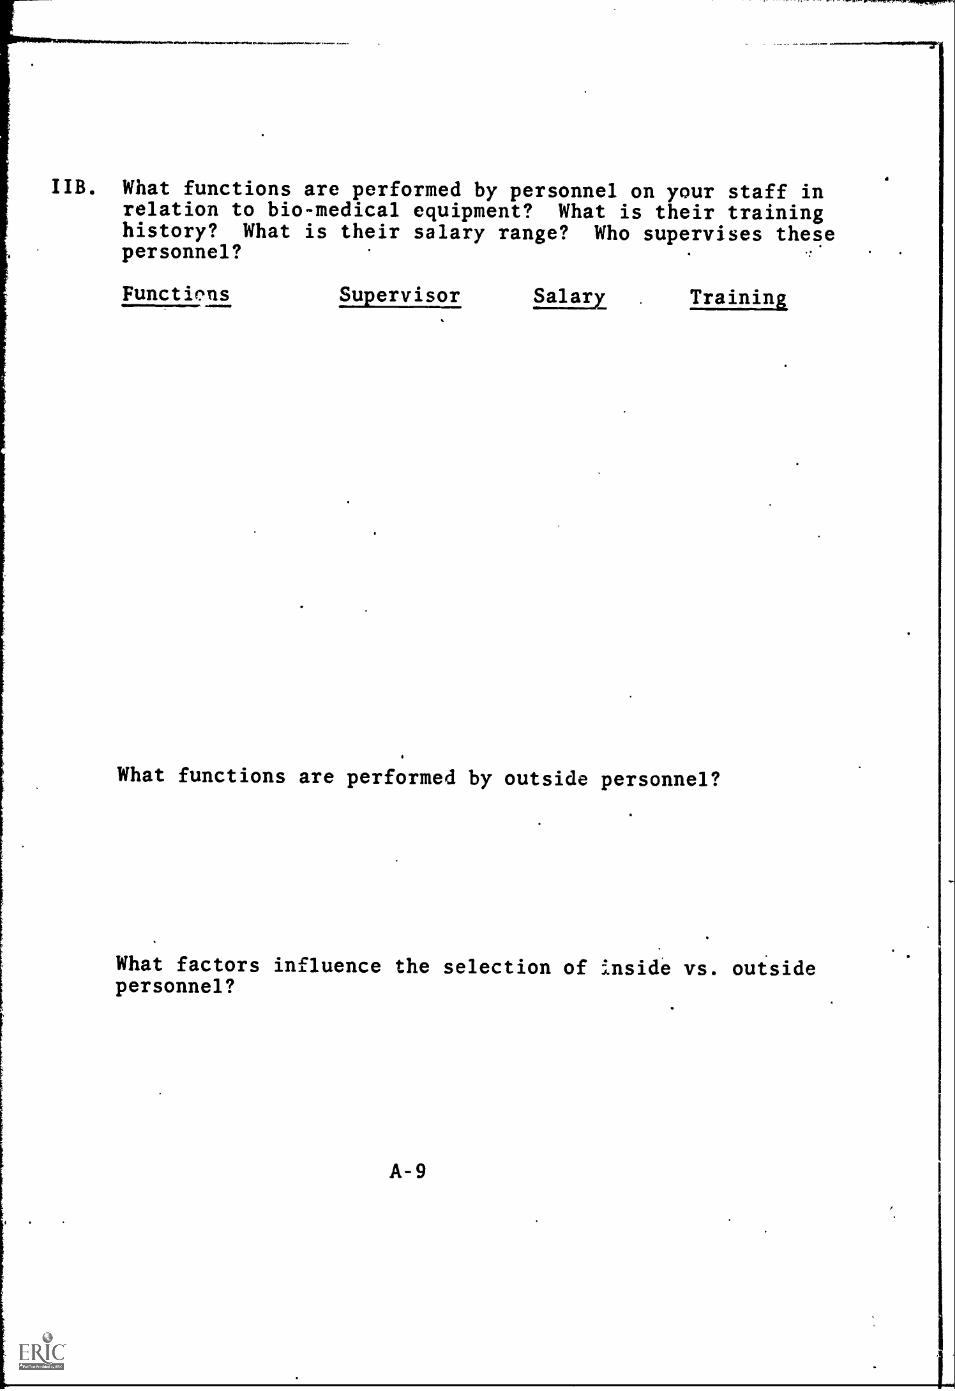
IIB. What functions are performed by personnel on your staff inrelation to bio-medical equipment? What is their traininghistory? What is their salary range? Who supervises thesepersonnel?
Functions Supervisor Salary . Training
What functions are performed by outside personnel?
What factors influence the selection of inside vs. outsidepersonnel?
A-9

APPENDIX AIV
Modifications for Industry Sample
A. 1. Do you maintain and service bio-medical equipment?
a. If you do not, who does service your equipment?
b. If you do maintain and service bio-medical equipment,please answer the following questions.
1. How many employees do you have for servicing bio-medicalequipment?
2. What is the educational background of your personnel inthis area?
3. Is the maintenance and service restricted to your products?
4. What portion of your resources is devoted to maintenanceand service?
3. Do you expect to expand your maintenance and service program?
6. If you do expand, will the expansion inc-ease the portionof your resources devoted to maintenance and service, orwill the expansion be in proportion to the total expansionof the company?
7. If you do expand your maintenance and service program,what will be the rate of expansion through the periodfrom the present to 1970?
8. What proportion of the maintenance and service of bio-medical equipment is shared by each of the following:
a. Manufacturer
b.. Hospital staff
c. Local dealer
d. Independent service agency
e. Other
9. Do you expect the above proportions to change by 1970?If so, please indicate above.
10. How many BMET's do you estimate are needed to servi..and maintain $100,000 of your type of equipment
a. Do you expect this ratio to change by 1970?
A-10

TABLE BI
Proportion of Hospitals Reco nizin Need for BMET'
Medical School Affiliation.
TOTAL EXPENSES PER PATIENT PER YEAR
Less than More than$18,000 $18,000
Per centof totalexpensesused forpayroll
Lessthan 61
Morethan 6M
1.00 .83
.83 (.17)* .67 (.17)
Sub-total .83 (08)
No Medical School Affiliation
OTAL EXPENSES PER PATIENT PER YEAR
Less than More than$18,000 $18,000
Per centof totalExpensesused forpayroll
Lessthan 65%
Morethan 65%
.89 (.11) 1.00
.44 0.2) 1.00
* Non-respondents
Sub-tatal
V.A. Hospitals
1.00
Grand total...JALEEL___
B-1

TABLE B11
Proportion of Hos itals Recognizing a Needor ME s
TOTAL EXPENSES PER PATIENT PER YEAR
Less than$18,000
More than$18,000 Total
Per cent Less
of total
expenses
than 65% .93 .92 .93
More
used for than 65% .60 .87 .73
payrollTotal .77 .89 .82

Pro
TABLE'BIII
ortion of Hospitals Indicatin a Need for a21Ic um er o BMET s for Current Stirri:
Medical School Affiliation
Per centof totalexpensesused forpayroll
1
1Lessthan 61
Morethan 691
TOTAL EXPENSES PER PATIENT PER YEAR
Less than More than$18,000 $18,000
. 67 .50
. 67 .33
Sub - total .54
No Medical School Affiliation
OTAL EXPENSES
Less than$18,000
PER PATIENT PER YEAR'
More than$18,000
Per centof totalExpensesused forpayroll
Lessthan 65% . 44 .50
morethan 65%t .44
J. 78
Sub- total
V.A. Hospitals
. 83
Grand total .57
B-3

TABLE BIV
Pronortion of Hos itals Indicatin a Need foreci is Number o., BMET's or t eir Current
tat s:
TOTAL EXPENSES PER PATIENT PER YEAR
Less than More than$18,000 $18,000 Total
Per cent
of total
expenses
used for
payroll
Lessthan 65% .53 .50 .52
Morethan 65% .53 .60 .57
Total .53 .56 .54
B-4
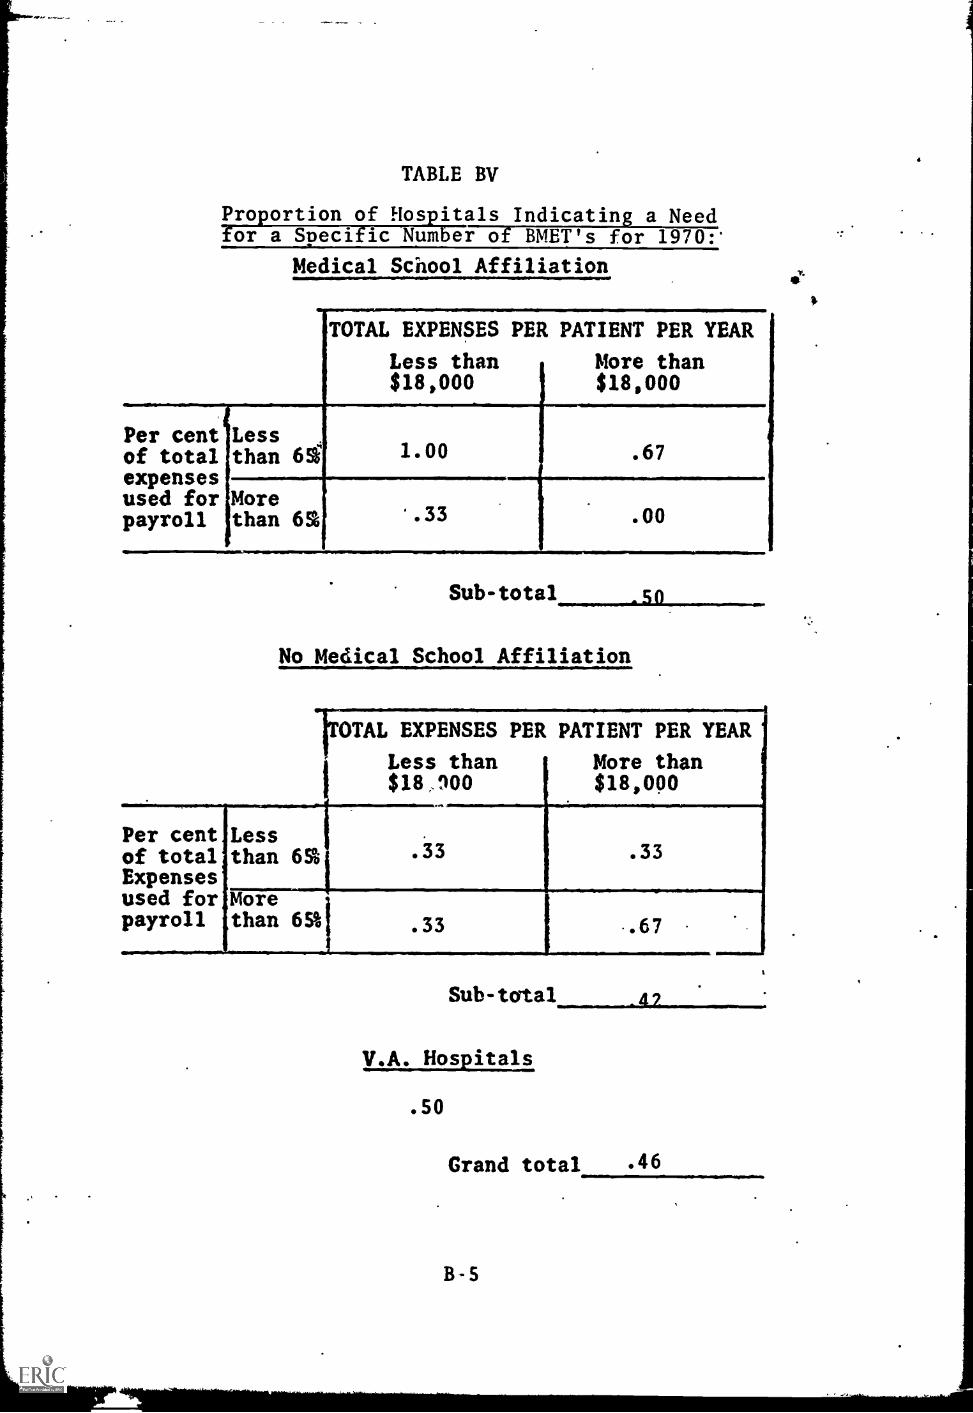
TABLE BV
Proportion of Hospitals Indicating a Needfor a Specific Number of BMET's for 1970:'
Medical School Affiliation
TOTAL EXPENSES PER PATIENT PER YEAR
Less than More than$18,000 $18,000
Per cent Lessof total than 61expensesused for Morepayroll than 65%
1.00 .67
'.33 .00
Sub
No Medical School Affiliation
t0TAL EXPENSES PER PATIENT PER YEAR
Less than$18,900
More than$18,000
Per cent Lessof total than 65%Expensesused for Morepayroll than 65%1
. 33 . 33
. 33 .67
Sub - total
V.A. Hospitals
. 50
Grand total
B-5
4 7
. 46
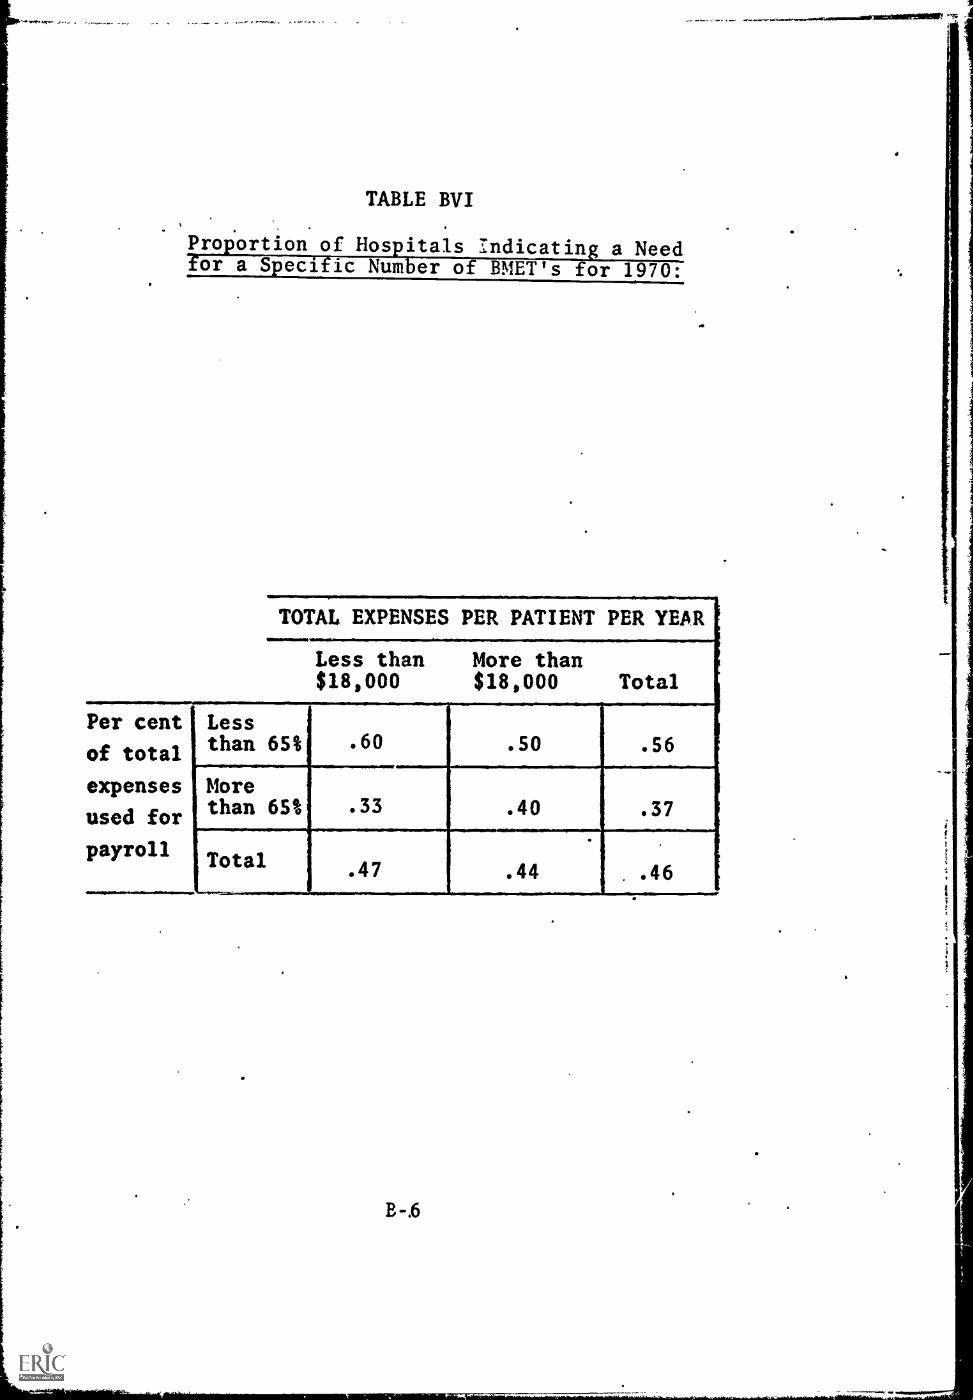
TABLE BVI
maxyarreiturate
Proportion of Hospitals Indicating a Needfor a Specific Number of BMET's for 1970:
TOTAL EXPENSES PER PATIENT PER YEAR
Less than$18,000
More than$18,000 Total
Per cent Less
of total
expenses
than 65% .60 .50 .56
More
used for than 65% .33 .40 .37
.
payrollTotal
......_
.47 .44 .46
B-.6
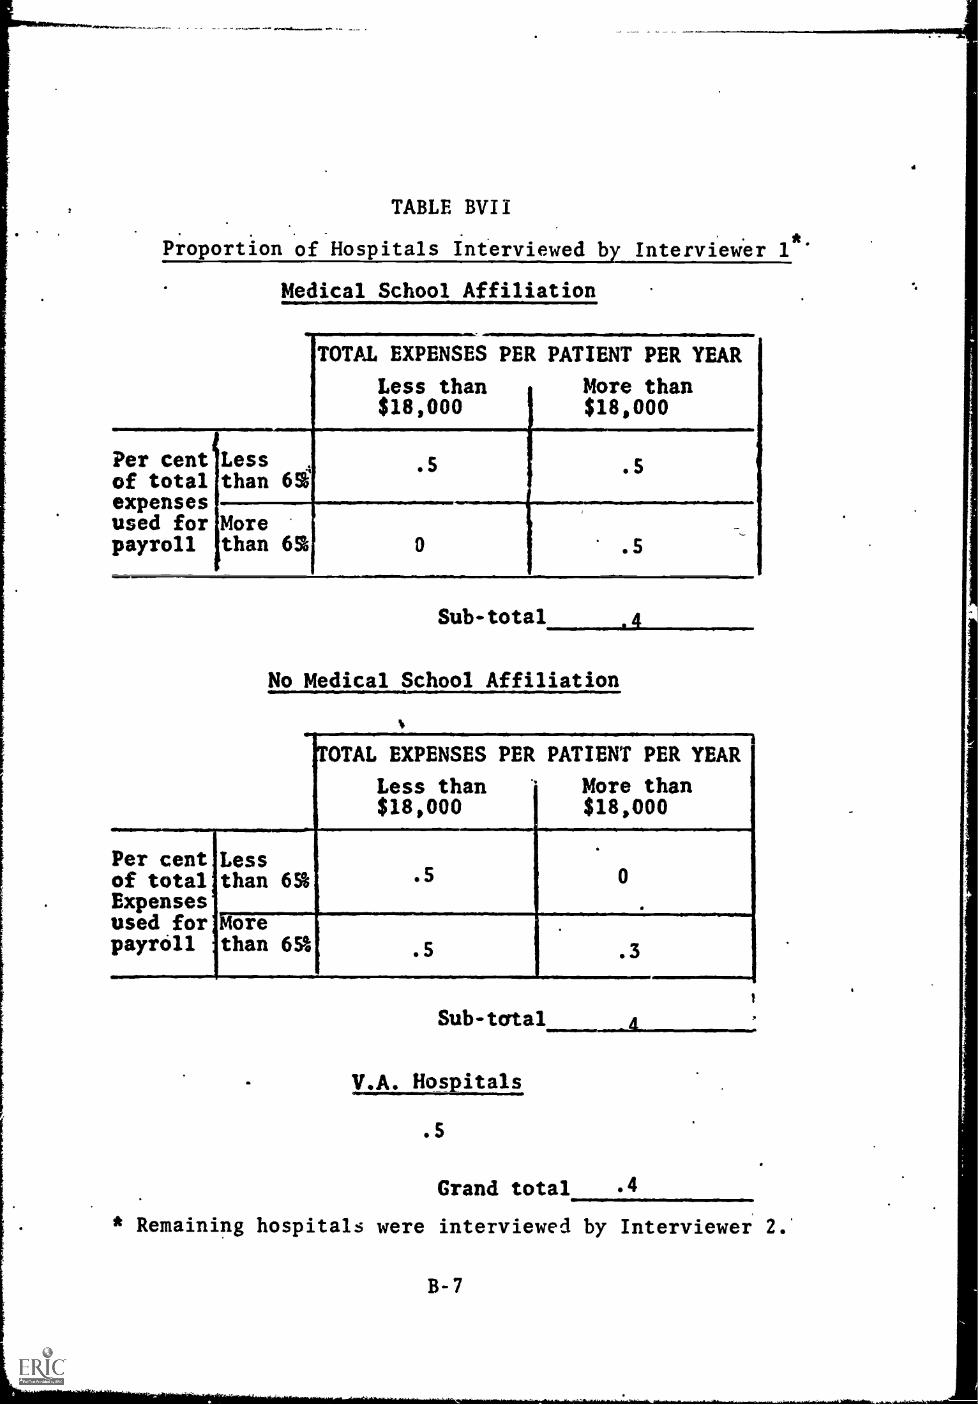
TABLE BVII
Proportion of Hospitals Interviewed by Interviewer 1ft.
Medical School Affiliation
TOTAL EXPENSES PER PATIENT PER YEAR
Less than More than$18,000 $18,000
Per cent Lessof total than 6%expensesused for Morepayroll than 65 0 .5
Sub-total .4
No Medical School Affiliation
.5 .5
OTAL EXPENSES PER PATIENT PER YEAR
Less than '* More than$18,000 $18,000
Per cent,of total'Expensesused for;payroll
Lessthan 6%
Morethan 65%
. 5
. 5 .3
Sub-tcrtal
V.A. Hospitals
.5
Grand total .4
* Remaining hospitals were interviewed by Interviewer 2.
B -7
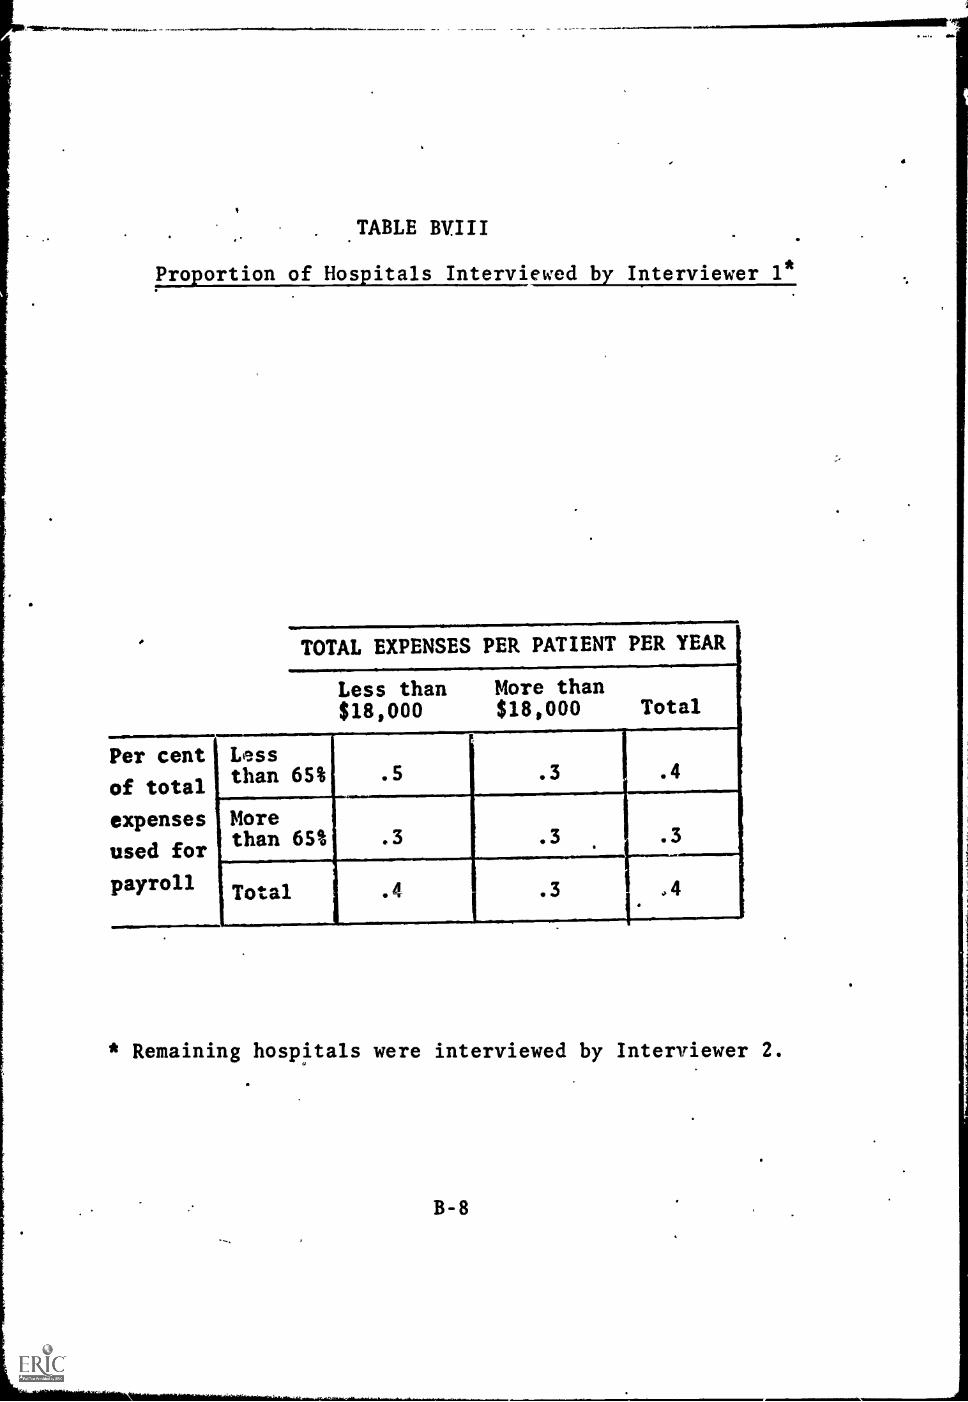
TABLE BVIII
Proportion of Hospitals Interviewed by Interviewer 1*
TOTAL EXPENSES PER PATIENT PER YEAR
Less than$18,000
More than$18,000 Total
Per cent Less
of totalthan 65% .5 .3 .4
expenses More
used forthan 65% .3 .3 .3
payroll Total .4 .3 ,4
* Remaining hospitals were interviewed by Interviewer 2.
B-8
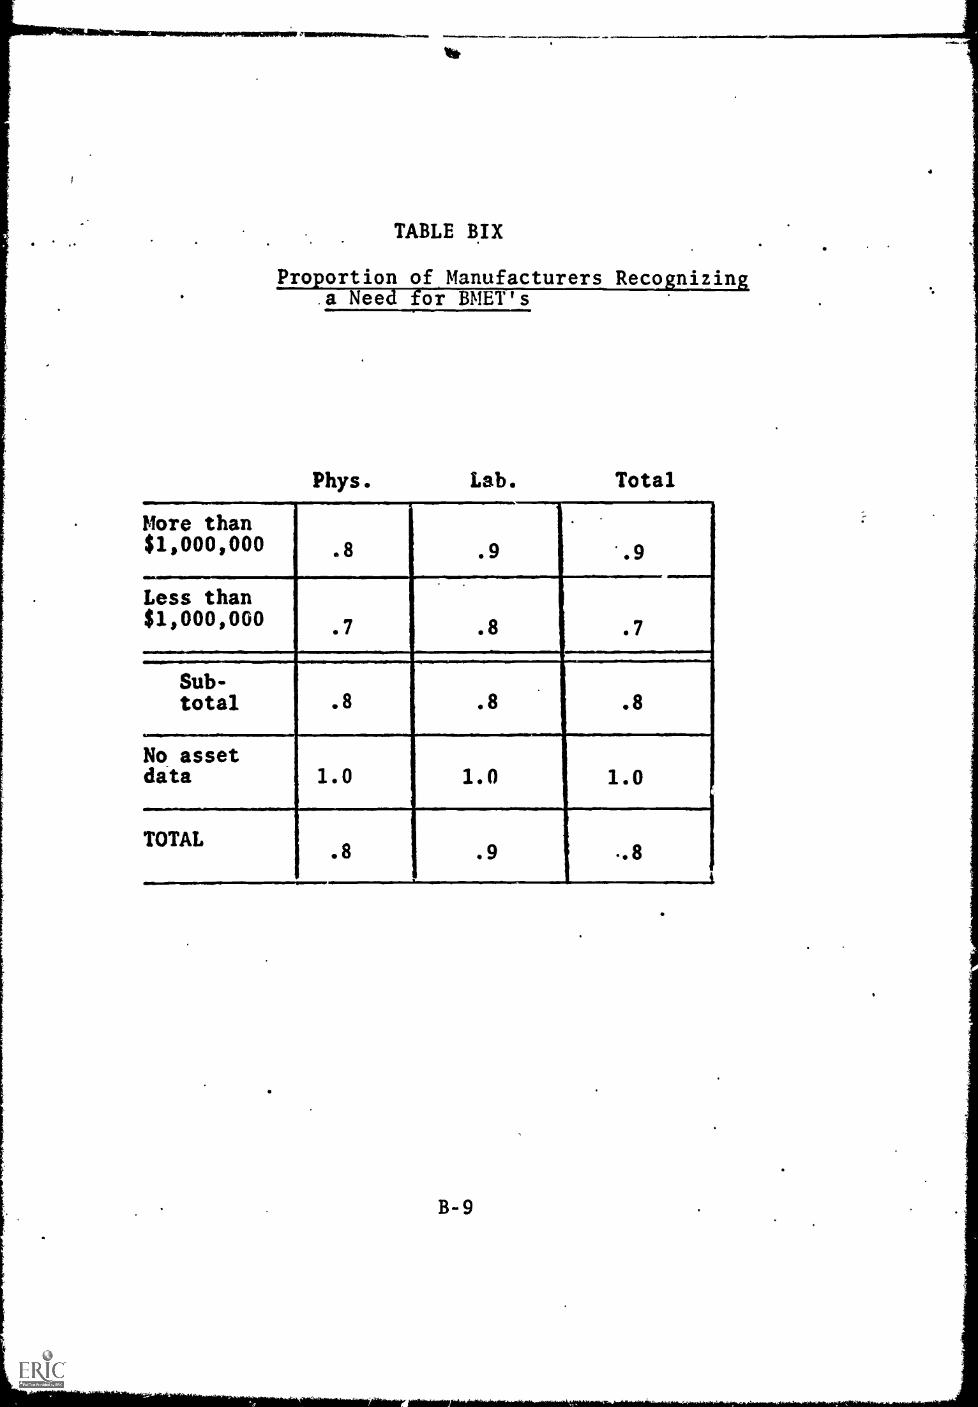
It*
TABLE BIX
Proportion of Manufacturers Reco nizina Need or BMET's
Phys. Lab. Total
More than$1,000,000 .8 .9 '.9
Less than$1,000,000 .7 .8 .7
Sub-total .8 .8 .8
No assetdata 1.0 1.0 1.0
TOTAL.8 .9 "8
t
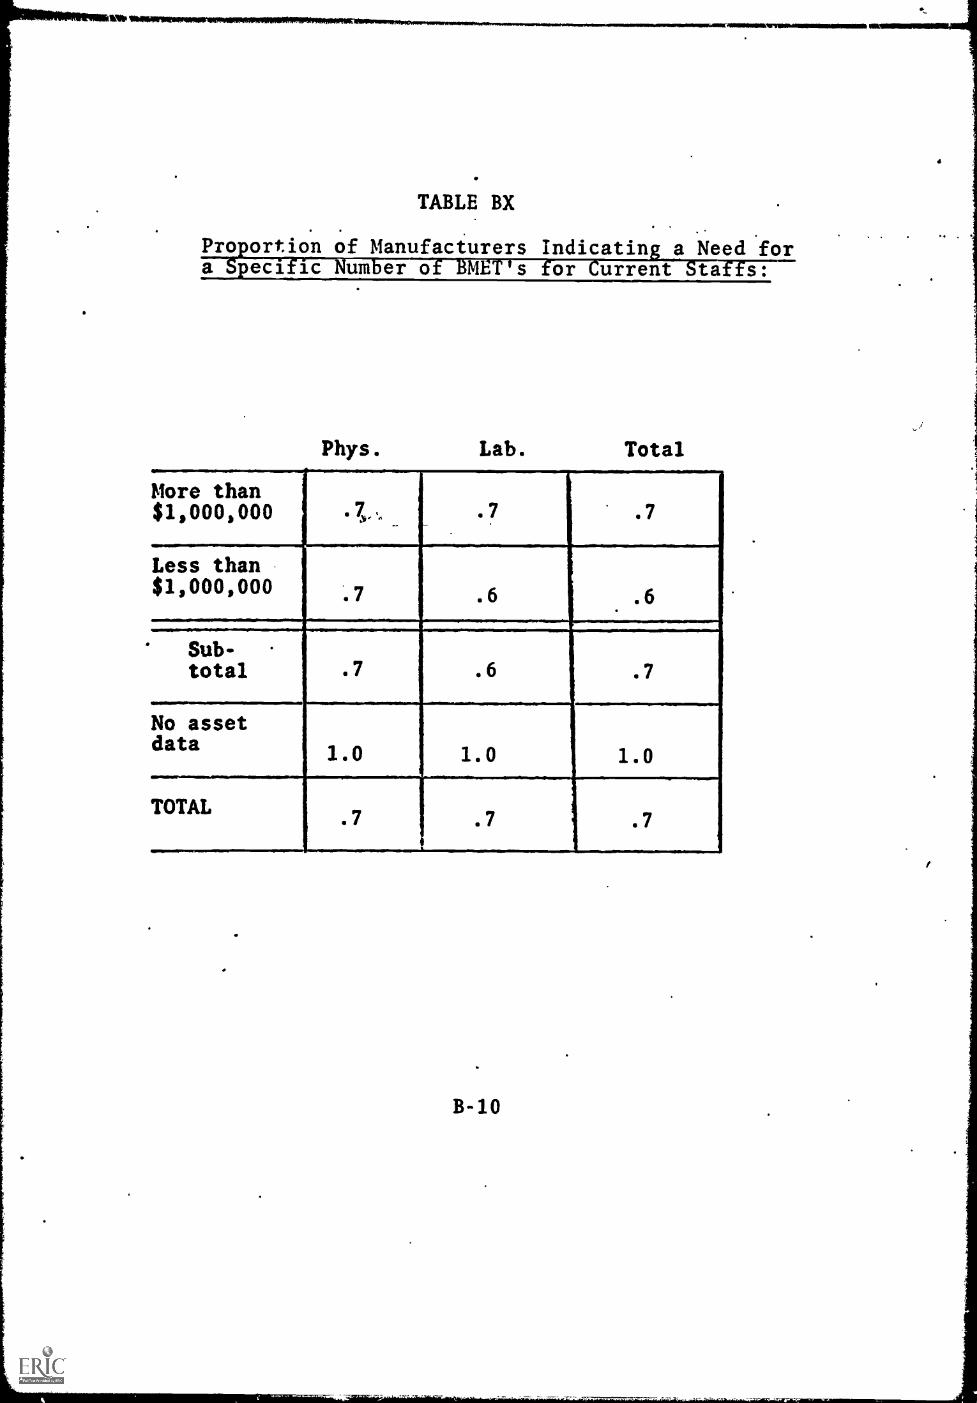
Pro ortion of Manufacturers Indicatin. a Need fora peci is um er o :ME s or urrent to s:
More than$1,000,000 .7., .7 .7
Less than$1,000,000
.6 .6
Sub-total .7 .6 .7
No assetdata 1.0 1.0 1.0
TOTAL.7 .7 .7
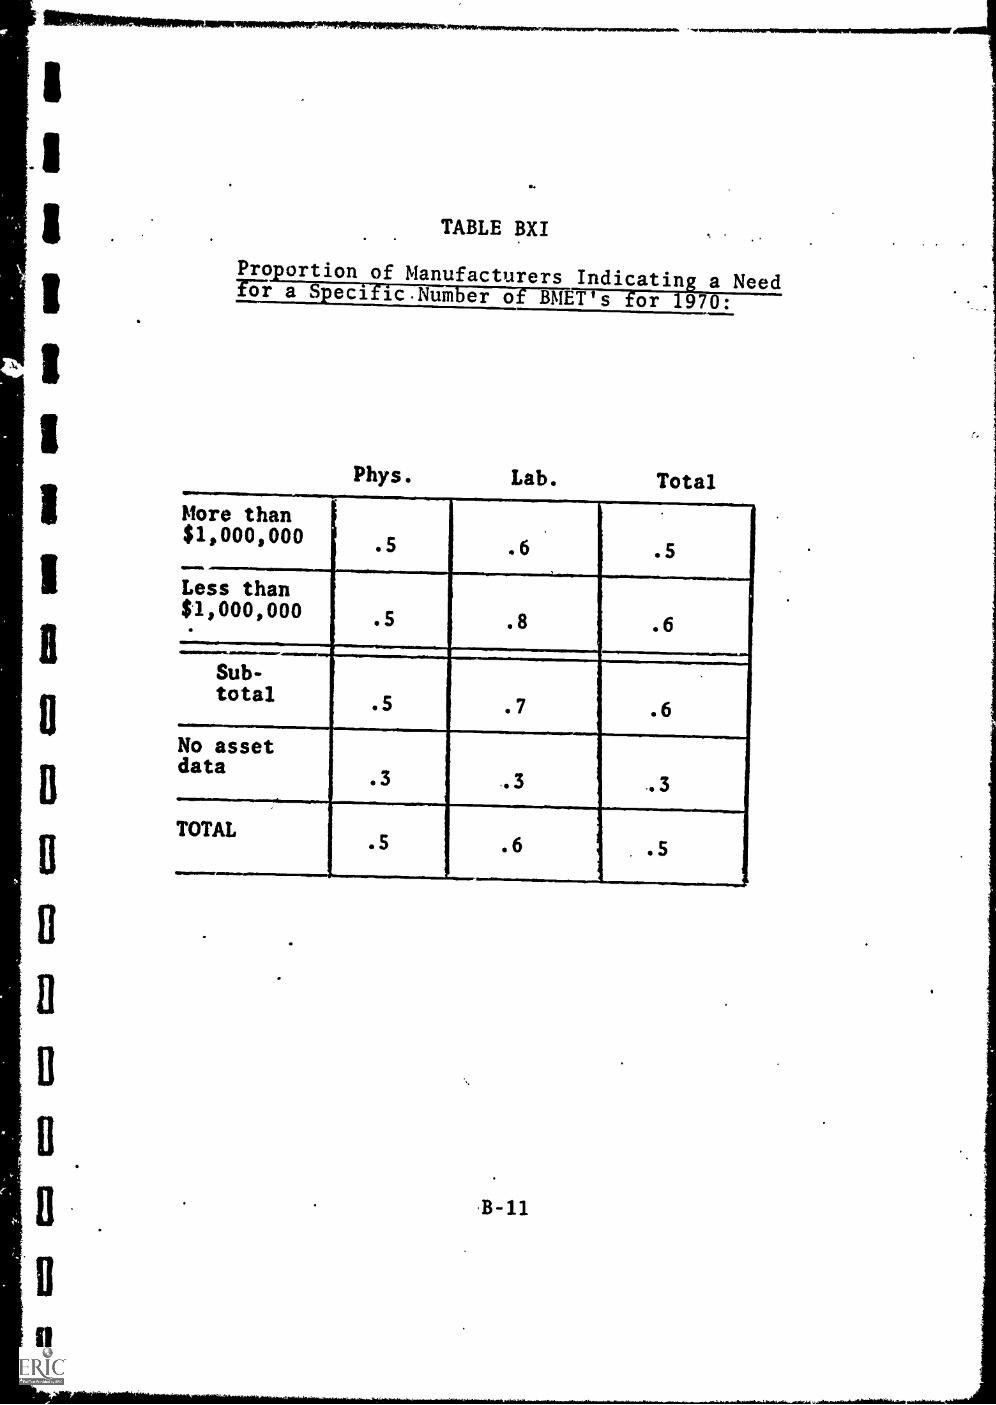
II
IIIB
D
B
11
ii
TABLE BXI
Pro ortion of Manufacturers Indicating a Needfor a Spec]. icNum er of BMET's for 1970:
Phys. Lab. Total
More than.
$1,000,000
....
.5 .6 .5
Less than$1,000,000. .8 .6
ill..Sub-total
.5 .7 .6
No assetdata
.3 .3
TOTAL.5 .6 .5
,B-11
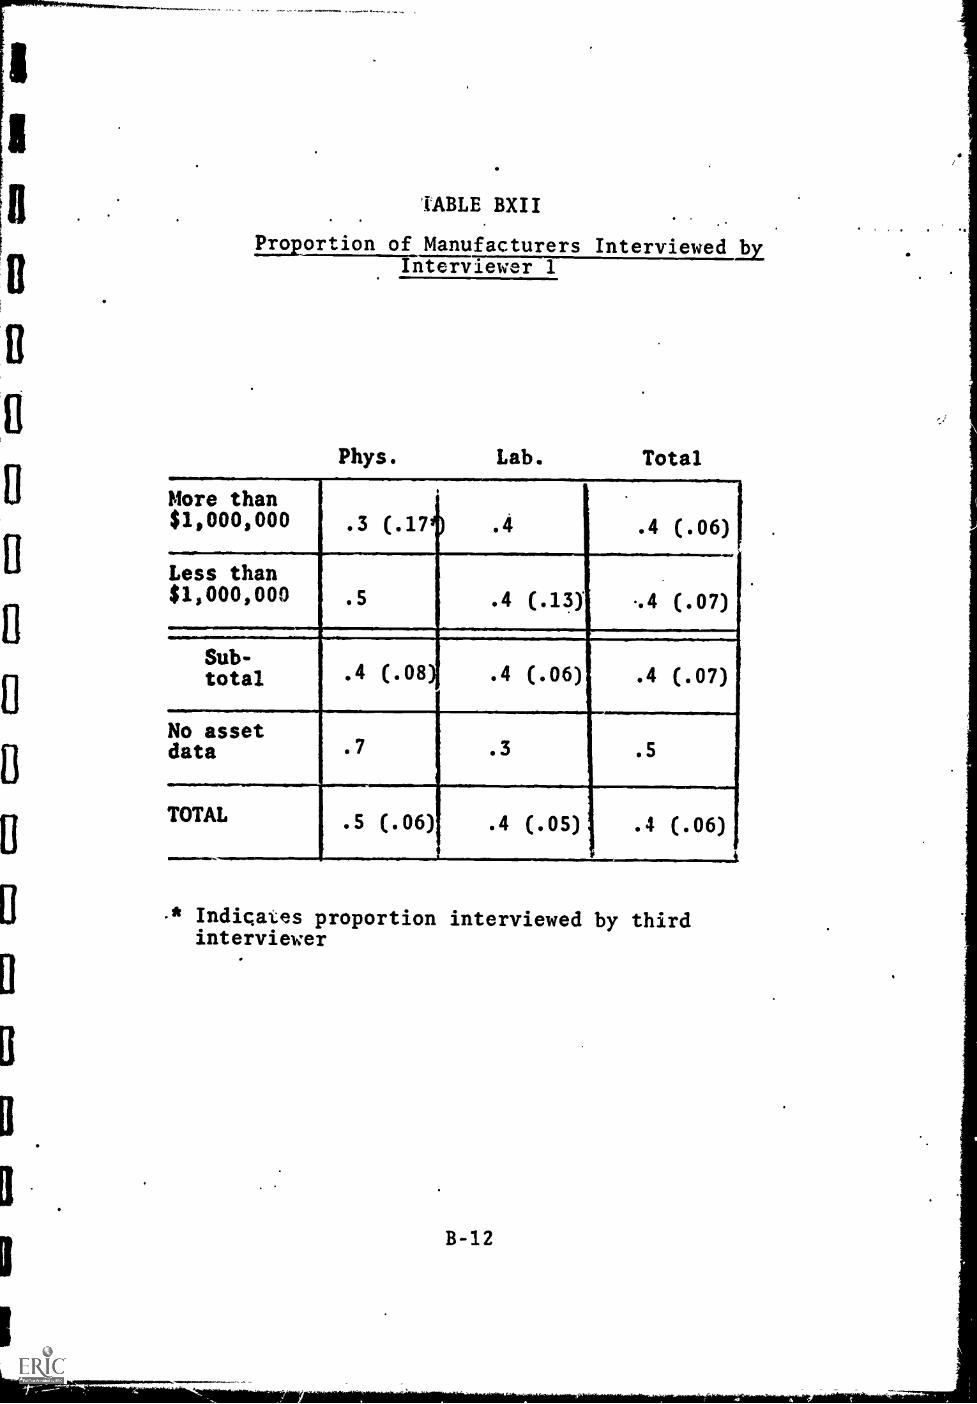
B
O
TABLE BXII
Proportion of Manufacturers InterviewedbEInterviewer
Phys. Lab. Total
More than$1,000,000 .3 (.17 .4 .4 (.06)
Less than$1,000,000 .5 .4 (.13) -.4 (.07)
Sub-total .4 (.08
I
.4 (.06) .4 (.07)
No assetdata .7 .3 .5
TOTAL .5 (.06) .4 (.05) .4 (.06)
-* Indicates proportion interviewed by thirdinterviewer
'4111611111NIAM.
B-12
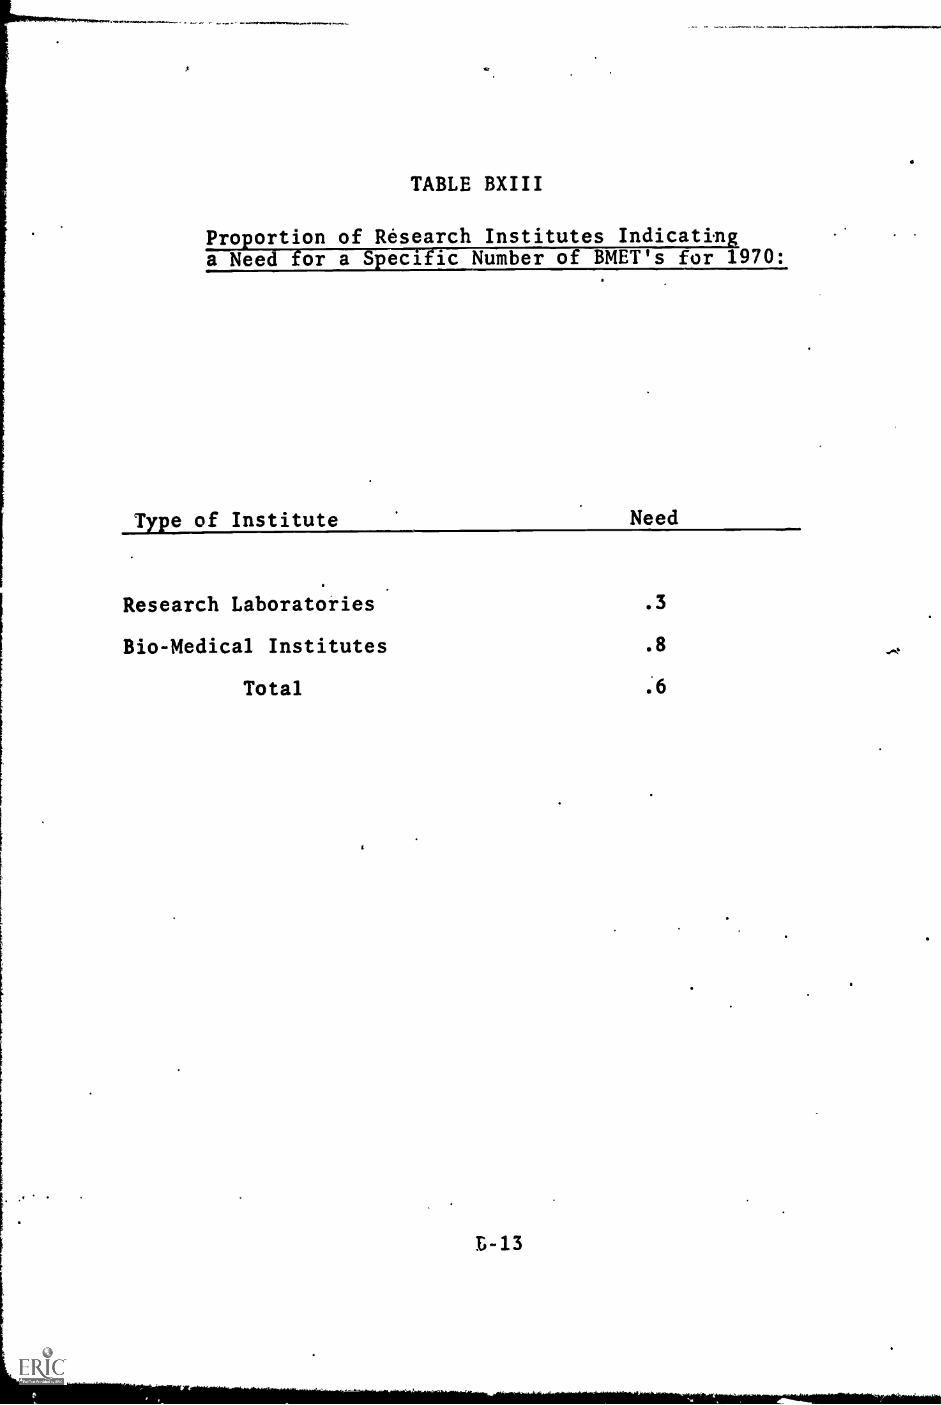
TABLE BXIII
Pro ortion of Research Institutes Indicationa Need or a Specific Number of BMET's for 1970:
Type of Institute Need
Research Laboratories .3
Bio-Medical Institutes .8
Total .6

TABLE CI
Number of BMET's Needed on*Current Staffs: Hospital
TOTAL EXPENSES PER PATIENT PER YEAR
Less than$18,000
More than$18,000
Per cent Lessof total than 69expensesused for Morepayroll than 65
19 (14)* 15 (31)
11 (23) 17 (21)
Sub-total 63 (12)
No Medical School Affiliation
TOTAL EXPENSES PER PATIENT PER YEAR
Less than More than$18,000 $18,000
Per cent.Lessof total than 65%Expensesused for,M5fepayroll Ethan 65t
40 (60) 19 (28)
13 (58) 51 (58)
* "b -group size
Sub-total 122 (204)
V.A. Hospitals
17 (25)
Grand total 202 + 26.8
C-1
(318)

TABLE CII
Number of BMET's Needed on Current Staffs:
.11110.1~11111allemes
POT cent
of total
expenses
used for
payroll
TOTAL EXPENSES PER PATIENT PER YEAR
Less than More than$18,000 $18,000 Total
Lessthan 55t
11111.11.111MO
34 _(59)
Morethan 65t
* Cell size
C-2
ri
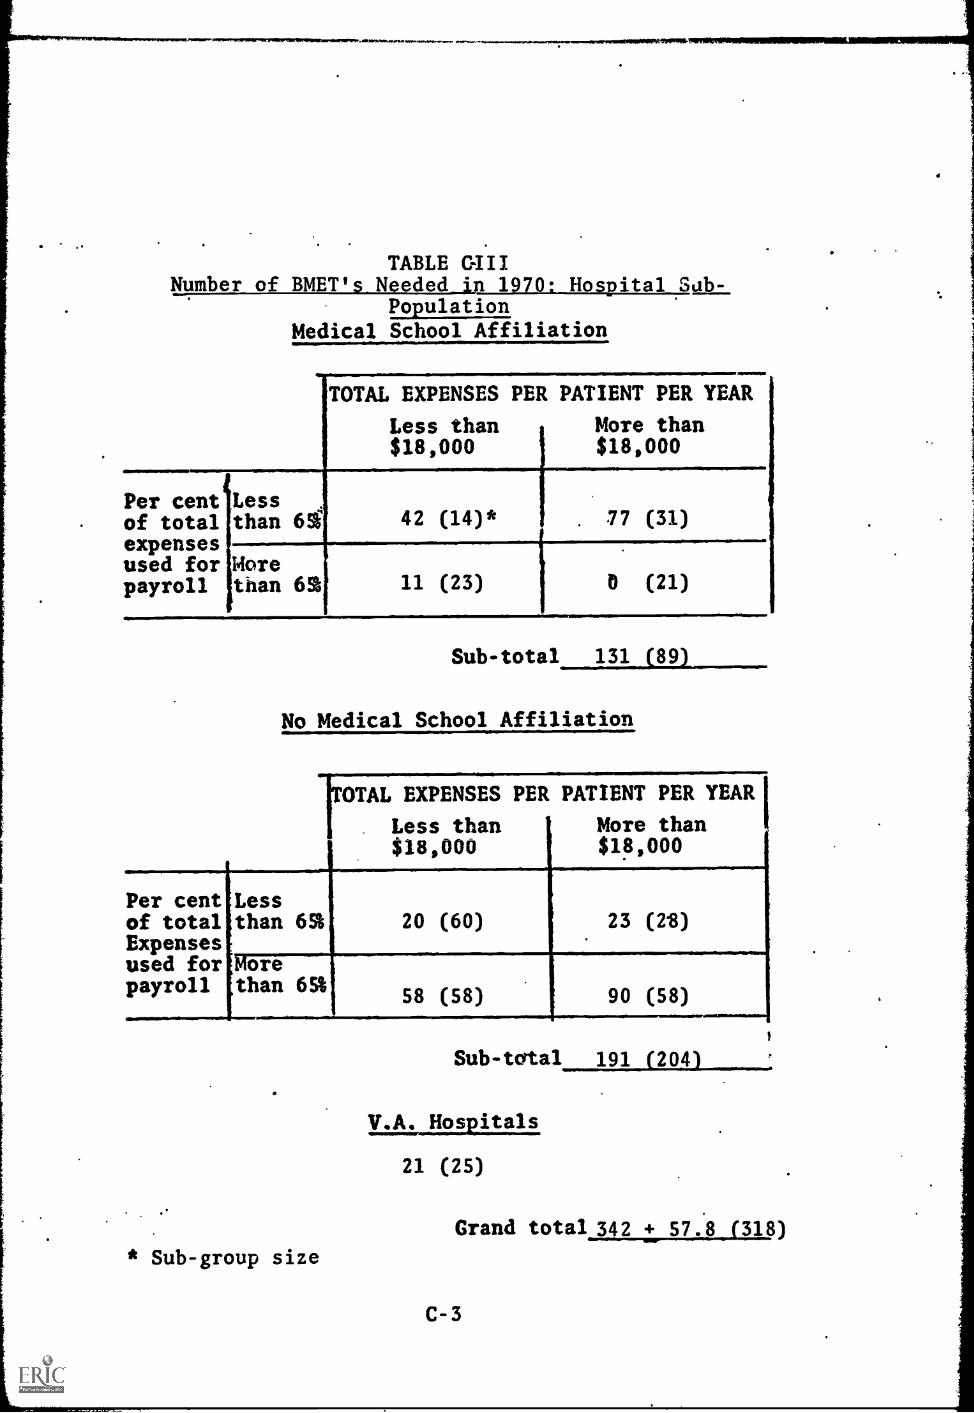
TABLENumber of BMET's Needed in 1970: Hospital Sub-
PopulationMedical School Affiliation
TOTAL EXPENSES PER PATIENT PER YEAR
Less than More than$18,000 $18,000
Per cent Lessof total than 61expensesused for Morepayroll than 62
42 (14)*
11 (23)
1
. 77 (31)
(21)
Sub -total 131 (89)
No Medical School Affiliation
OTAL EXPENSES PER PATIENT PER YEAR
Less than More than$18,000 $18,000
Per centof totalExpensesused forpayroll
Lessthan 65%
Morethan 65%
20 (60) 23 (2'8)
58 (58) 90 (58)
* Sub-group size
Sub-total 191 (204)
V.A. Hospitals
21 (25)
Grand total 342 + 57.8 (318)
C-3

TABLE GIV
Number of BMET's Needed in 1970:
IIIERLaLihgLTSIngLatila
TOTAL EXPENSES PER PATIENT PER YEAR
Less than$18,000
More than$18,000 Total
Per cent
of total
expenses
used for
payroll
I
Less than65% 62 (74)* 100 (59) 162 (133)
More than65% 69 (71) 90 (79) 159 (160)
Total 131 (155) 190 (138) 321 (293)
* Cell size
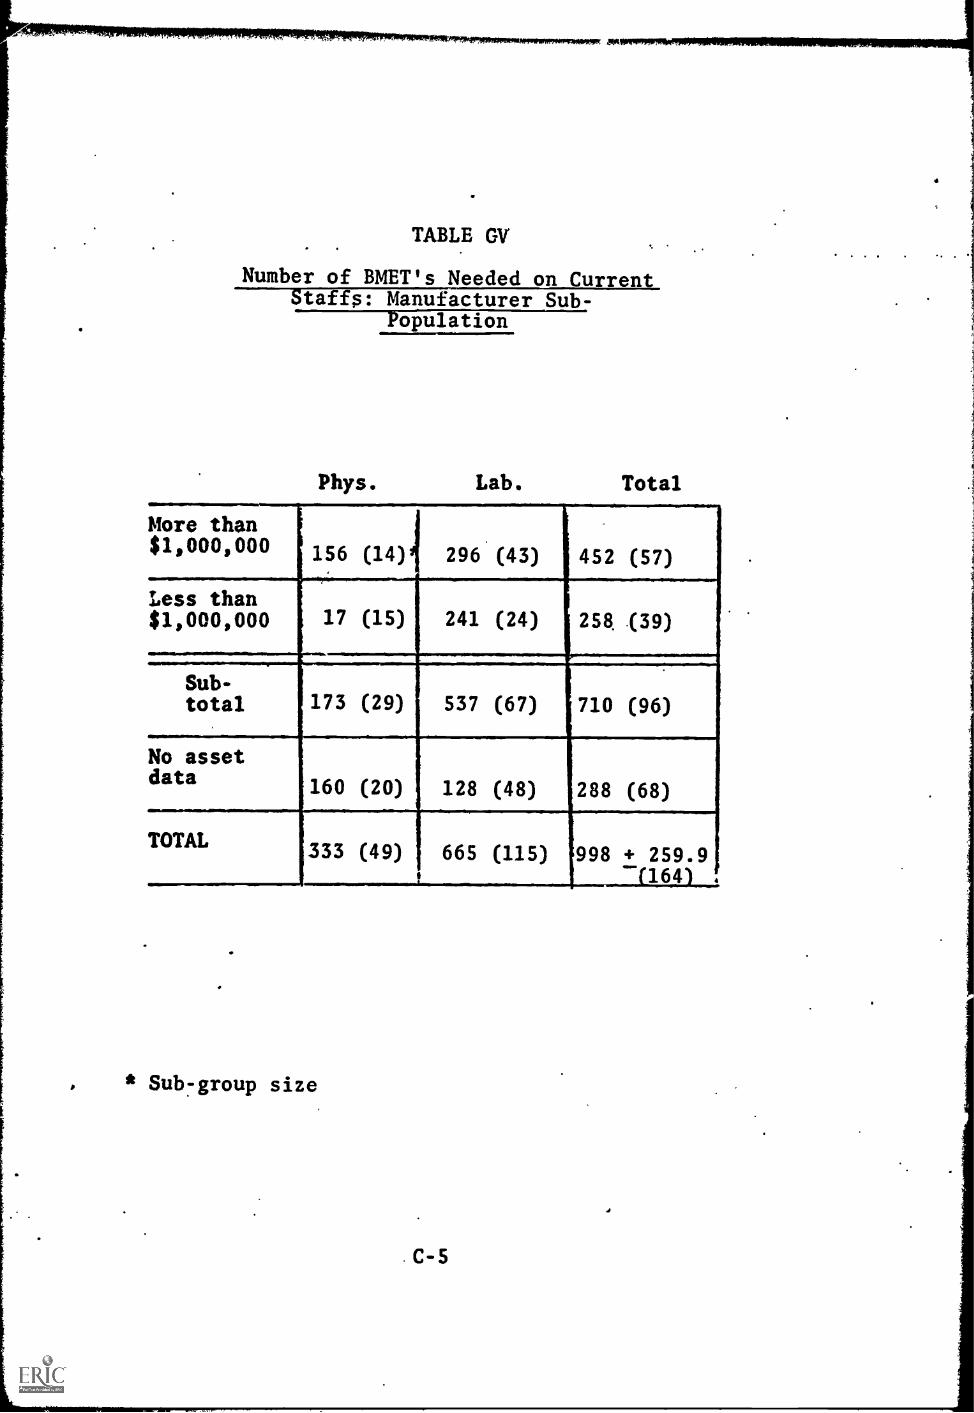
TABLE CV'
Number of BMET's Needed on CurrentStaffs: Manufacturer Sub-
Population
Phys. Lab. Total
More than$1,000,000 156 (14) 296 (43) 452 (57)
Less than$1,000,000 17 (15) 241 (24) 258 (39)
Sub-total 173 (29) 537 (67) 710 (96)
No assetdata 160 (20) 128 (48) 288 (68)
TOTAL 333 (49) 665 (115) 998 + 259.91164 .
. * Sub -group size
C-5
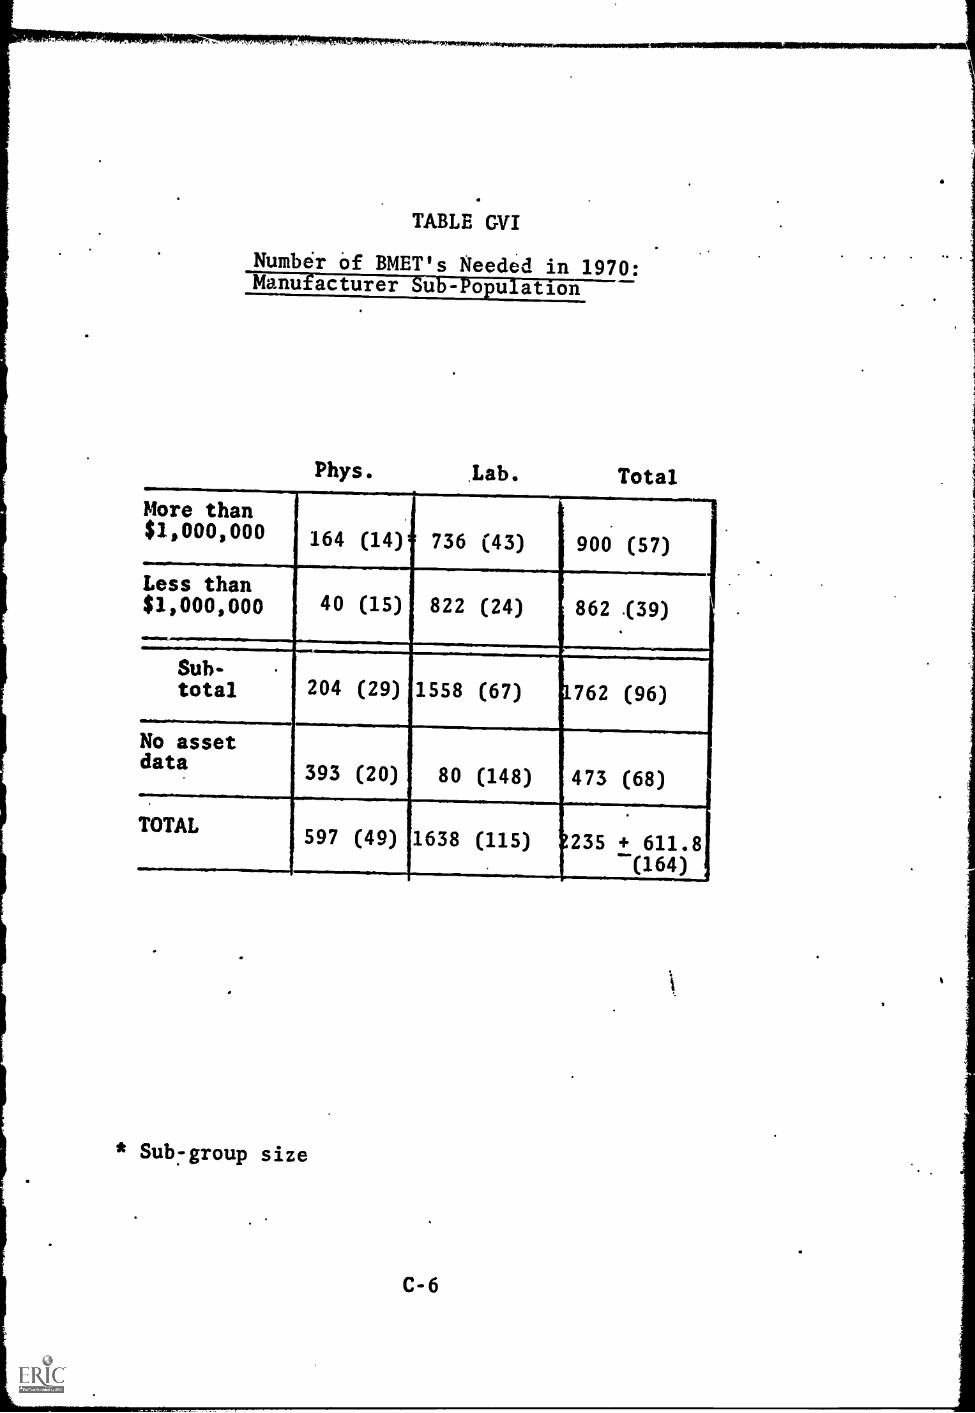
TABLE GVI
Numbir of BMET's Needed in 1970:Mc51tilriaT11 Etl'--T'-1-0F Iii anon
Phys. .Lab. Total
More than$1,000,000 164 (14) 736 (43) 900 (57)
Le1ss than$,000,000 40 (15) 822 (24) 862 f39)
Sub-total 204 (29) 1558 (67) 1762 (96)
No assetdata
393 (20) 80 (148) 473 (68)
TOTAL597 (49) 1638 (115) 235 + 611.8
(164)
* Sub -group size
C-6

TABLE CVII
Number of BMET's Needed on Current Staffs:Research Institute Sub-Poulation
Type of Institute Need
Research Laboratory 28 (24)
Bio-Medical Institute 178 (64)
Total 206 (88). + 141.2
TABLE GVIII
Number of BMET's Needed in 1:`,70:Research InstitutT751.767P751.11ifiUn
Type of Institute Need
Research Laboratory 14 (24)
Bio-Medical Institute 877 (64)
Total 891 + 773.9.
C -7

APPENDIX.D
PROCEDURES USED TO EXPLAIN DISTRIBUTION OF MONEYVARIABLES
The data with regard to the investment and expendituresin bio-medical equipment were coded to indicate thedistribution of the respondents. This procedure wasemployed because the respondents were uncertain aboutthe figures they gave. The coded data were analysedon the basis of the assumption that they representedthe distribution of the respondents on the variablerather than any actual dollar amounts. In order todemonstrate what this analysis means, .the distribu-tion of respondents on the coded investment, variable ispresented in this appendix and the indicators derivedfrom it are included so that the reader may compare them.Tables I and II of this appendix contain the distribu-tion on the three coded categories of the investmentvariable for each of the nine sub-groups and their com-bintions. The number in parentheses is the distribu-tion indicator reported in the text. These figureswere derived by assigning values of 1, 2, and 3 to thethree categories and taking the mean of each of thedistributions. For each of the three sub-groups havingan indicator of 2.0 there is symmetry in their distri-butions even though the actual distributions are some-what different especially in the case of the sub-group having no respondents in the high or low group.(Certain deviations from the symmetry are. permittedwhen the frequency of each of the three categories in-creases.) The most notable exception is in the grandtotal where there is a slight skewness to the highercategory, but the indicator is still 2.0.
The two MSA sub-groups with a relatively low PC valuehave indicators that are reasonably similar even thoughtheir distributions are quite different. The commonaspect of the distributions is their skewness to thehigher category. The sub-group with a relatively highTE value has.a lowei iftdicator even though a greaterproportion of the respondents are in the higher in-vestment category. This is caused by one respondent inthat sub-group being in the lower investment category.If one were to remove that compensating effect, theindicator would be 2.6. In Table II there is aninteresting result that one may follow by looking
D-1

across either row. As the frequency of the distribu-tion increases a greater absolute skewness results inan indicator which is equal to the indicator of dis-tribution having less absolute skewness.' For example,in the row that contains the distributions for hospi-tals having a relatively low PC, in the first entrythe difference between those in the high and lowcategories is only two respondents. The same is truefor those in the second entry. In the total columnfor that row there are four more respondents in thehigher level than in the lower level, but the same in-dication of skewness is obtained. This result pointsout the fact that the indicator is a proportional in-dication of skewness and not an absolute indication.
D-2

TABLE DI
Comparison Between Distribution of Hospital Invest-ment Data and Investment Distribution Indicator
Medical School Affiliation
TOTAL EXPENSES PER PATIENT. PER YEAR
Less than More than$18,000 $18,000
Perof total than 61expensesused for Morepayroll than 63
0/3/2* 1/2/3(2.4)** (2.3)
0/5/1 1/5/0(2.2) (1.8)
Sub-total2/15/6(2.2)
No Medical School Affiliation
TOTAL EXPENSES PER PATTENT.PER YEAR'
i
Less than More$18,000 ! $18,000
than
i
iA
Per cent:Less1
2/3/2 ! 0/5/0of total than 6%; (2.0) 1 (2.0)Expenses':used forliore -
4/3/1 2/4/2 :
payroll :than 65%1
(1.4) ! (2.0)ra8/15/5
Subtotal (1.9)
V.A. Hospitals
2/1/3(2.2)
12/31/14Grand total (2.0)
Number of hospitals: Below average/ Average/ Above average
** Investment distribution indicatorPerfect symmetry = 2.0
D-3

TABLE DII
Comparison Between Distribution of HospitalInvestment Data an Investment
EFITEIEFF
OTAL EXPENSES PER PATIENT PER YEAR
ess t an$18,000
ore t an ota$18,000
Per cent
of total
expenses
used for
payroll
Less than 65% 2/6/4*(2.2)**
1/7/3(2.2)
3/13/7(2.2)
More than 65%
Total
4/8/2(1.9)
6/14/6(2.0)
3/9/2(1.9)
4/16/5(2.0)
7/17/4(1.9)
10/30/11(2.0)
Number of hospitals: Below average/ Average/ Above average
** Investment distribution indicatorPerfect symmetry = 2.0
D-4

APPENDIX E
LIST OF INDIVIDUALS WHO ASSISTED IN PLANNING ANDCARRYING OUT PROJECT
Abele, John Vice President and General Manager,Advanced Instruments, Inc. New-ton; Chairman, Manufacturer's Ad-visory Board, Association for theAdvancement of Medical Instrumen-tation.
Austen, W. Gerald, M.D. Chairman, Sub-Committee on Bio-logical and Medical Engineering,Massachusetts General Hospital,Boston.
Ayers, John, M.D.
Balasz, Endre
Berkley, Carl
Boal, Bruce
Buchanan, William W.
Bugby, John
Busser, John H.
Cooke, Lot H., Jr.
Croll, Millard, M.D.
Director, Springfield MunicipalHospital, Springfield, Massachu-setts.
President, Retina Foundation,Boston, Massachusetts.
Scientific Director, Foundationfor Medical Technology, New York,New York.
President, Hickok Teaching Sys-tems, Inc., Cambridge, Massachusetts
Vice President, Bowker Associates,Washington, D. C.
Faculty, Springfield TechnicalInstitute, Springfield, Massachu-setts.
Executive Secretary, Bioinstru-mentation Advisory Council, Amer-ican Institute of Biological.Sciences, Washington, D. C.
Senior Supervisor for Research,Division of Vocational Education,Massachusetts Department of Educa-tion, Boston, Massachusetts.
Department of Radio Therapy; Hahn-emann Hospital, Hahnemann MedicalCollege, Philadelphia, Pennsylvania.
E-1

Cronkhite, Leonard W., Jr., M.D. Administrator,Children's Hospital Medical Center,Boston, Massachusetts.
Davis, Julie
Dobrovolny, Jerry
Dugger, Roy W.
Fine, Samuel
Cambridge School DepartmentPlanning Staff, Cambridge,Massachusetts.
Head, Department of GeneralEngineering, University of Illinois,Urbana, Illinois
Vice President and Director, JamesConnally Technical Institute ofTexas, A & M University, Waco,Texas.
Chairman, Department of Bio-Physics and Bio-Medical Engi-neering, Northeastern University,Boston, Massachusetts.
Frank, Nathaniel H. Massachusetts Institute of Tech-nology, Cambridge, Massachusetts.
Fribance, Austin E. Technical Education ResearchCenter, Cambridge, Massachusetts.
Garvey, Edmond P. President, Springfield TechnicalInstitute, Springfield, Mass-achusetts.
Giddings, Frank Faculty, Springfield TechnicalInstitute, Springfield, Mass-achusetts.
Herbert, Achille C. Head.of Applied Physics and Tech-nical Mathematics Department,James Connally Technical Institute,Waco, Texas.
Herron, Earl H., Jr. Bioinstrumentation AdvisoryCouncil, American Institute ofBiological Sciences, Washing-ton, D.C.
Hubbard, Donald Technical Education ResearchCenter, Cambridge, Massachusetts
E-2
Husman, Don
Klein, Herbert
Vice President, ManufacturingInstrumentation Laboratory,Watertown, Massachusetts.
Chief Engineer, Boston Univer-sity Medical Center and Univer-sity Hospital, Boston, Mass.
'Knowles, John H., M.D. General Director, MassachusettsGeneral Hospital, Boston, Mass.
Krueger, Cynthia Technical Education Research Center,Cambridge, Massachusetts.
Markham, Walter J. Director, Division of VocationalEducation, Massachusetts Departmentof Educat:;on, Boston, Massachusetts.
Martin, Josephine
McLaughlin, Bette
McNary, William
Miller, A. J.
Nangle, Grace L.
Nelson, Arthur H.
Owen, Jack W.
Post, John
Editor, Medical Electronic News,Pittsburg, Pennsylvania.
Education Development Center,Cambridge, Massachusetts
Director of the Teaching Lab-oratory, Boston University Schoolof Medicine, Boston, Massachusetts.
Center for Vocational and TechnicalEducation, Ohio State University,Columbus, Ohio.
Supervisor, Health OccupationsTraining, Massachusetts Divisionof Vocational Education, Massa-chusetts Department of Education.
Technical Education ResearchCenter, Cambridge, Massachusetts.
Secretary, Middle Atlantic HospitalAssembly.
Executive Secretary, Associationfor the Advancement of MedicalInstrumentation.
Quigley, John Secretary, New England HospitalAssociation.
Ratner, Murield
Roney, Maurice W.
Community College Health Car-eers Project, New York StateEducation Department, New York,New York.
Director of the School of'In-dustrial Education, OklahomaState University; PresidentAmerican Technical EducationAssociation. .
Scofield, Robert Professor of Psychology andManagenent, University ofHouston, Houston, Texas.
Skaggs, Kenneth G. American Association ofJunior Colleges, Washington,D.C.
Slater, Lloyd E. Associated Universities. Inc.Washington, D.C.
Soule, A. Bradley, M.D. Chairman, Department of Rad-iology, College of Medicine,University of Vermont, Bur-lington, Vermont.
Sussman, Patricia Director, Health CareersProgram, American HospitalAssociation, Chicago, Ill.
Sweeney, Robert S. Director, Technical Institute,Cambridge School Department,Cambridge, Massachusetts.
Taylor, A.N. Council on Medical Education,American Medical Association,Chicago, Illinois.
Thompson, John Arthur D. Little, Inc. Cam-bridge, Massachusetts.
Tischler, Morris Baltimore, Maryland
Twyman, J. Paschal Vice President, Tulsa Uni-versity, Tulsa, Oklahma.

i
Van Dusen, Edward B.
Weimer, Edward W.
Wilde, Evelyn
Director of the Evening Di-vision, Lowell TechnologicalInstitute, Lowell, Massachuse* s.
Assistant Secretary, AmericanHospital Association, Chicago,Illinois.
Technical Education ResearchCenter, Cambridge, Massa-chusetts.
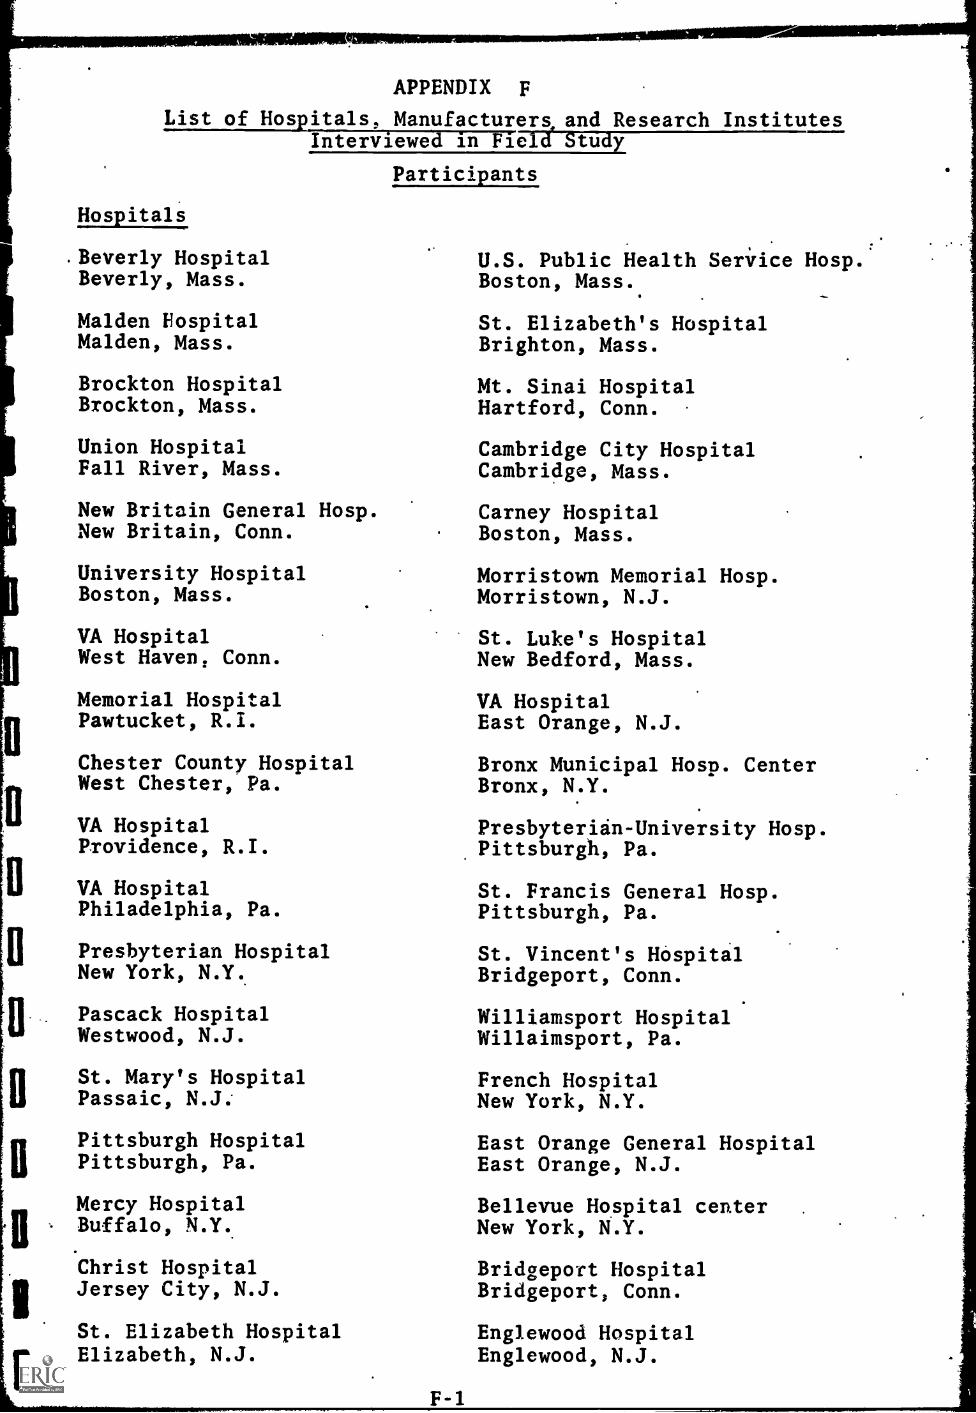
APPENDIX F
List of Hospitals, Manufacturers, and Research InstitutesInterviewed in Field Study
Participants
Hospitals
.Beverly HospitalBeverly, Mass.
Malden HospitalMalden, Mass.
Brockton HospitalBrockton, Mass.
Union HospitalFall River, Mass.
New Britain General Hosp.New Britain, Conn.
University HospitalBoston, Mass.
VA HospitalWest Haven, Conn.
Memorial HospitalPawtucket, R.I.
Chester County HospitalWest Chester, Pa.
VA HospitalProvidence, R.I.
VA HospitalPhiladelphia, Pa.
Presbyterian HospitalNew York, N.Y.
Pascack HospitalWestwood, N.J.
St. Mary's HospitalPassaic, N.J.
Pittsburgh HospitalPittsburgh, Pa.
Mercy HospitalBuffalo, N.Y.
Christ HospitalJersey City, N.J.
St. Elizabeth HospitalElizabeth, N.J.
F-1
U.S. Public Health Service Hosp.Boston, Mass.
St. Elizabeth's HospitalBrighton, Mass.
Mt. Sinai HospitalHartford, Conn.
Cambridge City HospitalCambridge, Mass.
Carney HospitalBoston, Mass.
Morristown Memorial Hosp.Morristown, N.J.
St. Luke's HospitalNew Bedford, Mass.
VA HospitalEast Orange, N.J.
Bronx Municipal Hosp. CenterBronx, N.Y.
Presbyterian-University Hosp.Pittsburgh, Pa.
St. Francis General Hosp.Pittsburgh, Pa.
St. Vincent's HospitalBridgeport, Conn.
Williamsport HospitalWillaimsport, Pa.
French HospitalNew York, N.Y.
East Orange General HospitalEast Orange, N.J.
Bellevue Hospital centerNew York, N.Y.
Bridgeport HospitalBridgeport, Conn.
Englewood HospitalEnglewood, N.J.

Flushing Hosp. & Med. CenterFlushing, N.Y.
Misericordia HospitalBronx, N.Y.
St. Vincent's HospitalStaten Island, N.Y.
Meadowbrook Hosp.East Meadow, N.Y.
Long Island Jewish HospitalNew Hyde Park, N.Y.
Harlem HospitalNew York, N.Y.
Mary Immaculate HospitalJamaica, N.Y.
Atlantic City Hospital.Atlantic City, N.J.
Presbyterian-U. of Pa. Med. CenterPhiladelphia, Pa.
Cumberland HospitalBrooklyn, N.Y.
Hahnlmann Medical College & HospitalPhiladelphia, Pa.
St. Barnabas Medical CenterLivingston, N.J.
Altoona HospitalAltoona, Pa.
Kingston HospitalKingston, N.Y.
St. Mary's HospitalHoboken, N.J.
Brooklyn HospitalBrooklyn, N.Y.
Genesee HospitalRochester, N.Y.
Emergency HospitalBuffalo, N.Y.
Binghamton General HospitalBinghamton, N.Y.
VA HospitalNewington, Conn. F-2
Meriden HospitalMeriden, Conn.
VA HospitalWilkes-Barre, Pa.
Allentown Hosp.Allentown, Pa.
Mercer HospitalTrenton, N.J.
Hackensack HospHackensack, N.J.
Mercy-Douglass HospitalPhiladelphia, Pa.
Harrisburg HospitalHarrisburg, Pa.
Jefferson Med. College Hosp.Philadelphia, Pa.

Manufacturers
Virtis Co.Gardiner , N.Y.
Cambridge InstrumentsNew York, N.Y.
Sperry ProductsDanbury, Conn.
Medcraft ElectronicsSkippack, Pa.
Telemedics-Vector Div.Southampton, Pa.
F&M ScientificAvondale, Pa.
Hydor Therme Corp.Pennsauken, N.J.
Jordan Com Refrig CoPhiladelphia, Pa.
Air Products & Chemical Corp.Natick, Mass.
Carl Zeiss Inc.New York, N.Y.
Teca CorpWhite Plains, N.Y.
U.S. Catheter & Instr. Corp.Glens Falls, N.Y.
Linde DivNew York, N.Y.
Brinkmann Instr. Inc.Westbury, N.Y.
Standard Scientific SupplyNew York, N.Y.
Lehigh Valley Electronics Inc.Fogelsville, Pa.
American Electr. Labs Inc.Lansdale, Pa.
Perkin-Elmer CorpNorwalk, Conn.
Tenney Engineering Inc.Union, N.J.
Modern Lab EquipmentNew York, N.Y.
ManostatNew York, N.Y.
Electro-Medical LabWindsor, Vermont
Baird-AtomicCambridge, Mass.
Noslab Instrs. Inc.Durham, N.H.
Eageet OpitcalRochester, N.Y.
Bausch & LomgRochester, N.Y.
Internation EquipmentHeights, Mass.
Waters AssociatesFramingham, Mass.
Gifford WoodNew York, N.Y.
Lmerican OpitcalBedford, Mass.
ACACamden, N.J.
Warren E. CollinsBraintree, Mass.
Hewlett PackardWaltham, Mass.
Brookline Instrument Co.White Plains, N.Y.
F-3
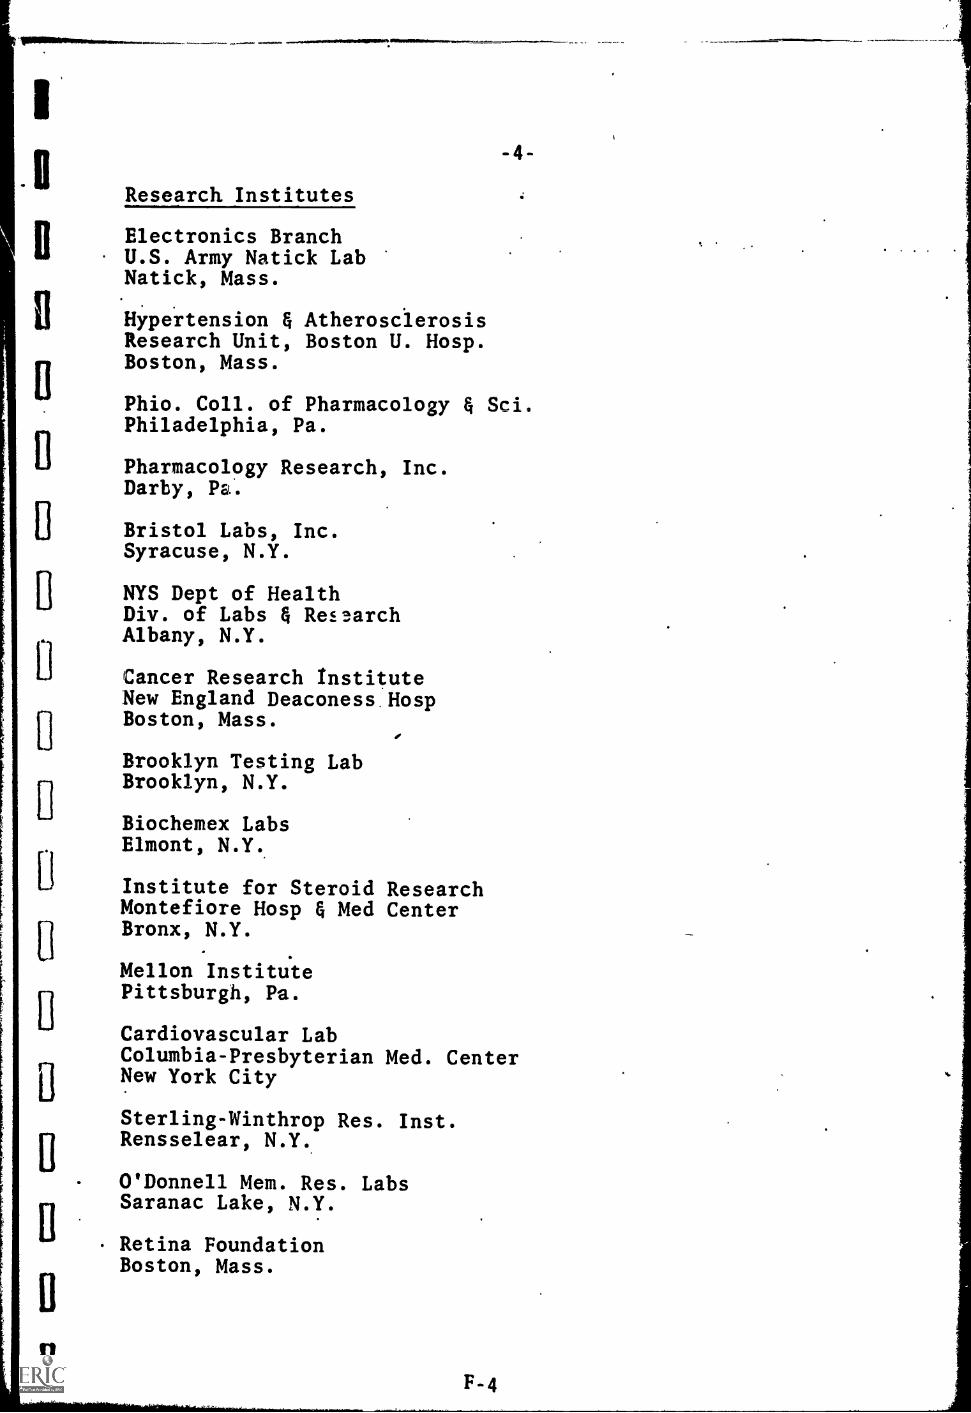
io
I]
D
i]
[
L
Ei
C
0
0
U
U
Research Institutes
Electronics BranchU.S. Army Natick LabNatick, Mass.
Hypertension & AtherosclerosisResearch Unit, Boston U. Hosp.Boston, Mass.
Phio. Coll. of Pharmacology & Sci.Philadelphia, Pa.
Pharmacology Research, Inc.Darby, P.
Bristol Labs, Inc.Syracuse, N.Y.
NYS Dept of HealthDiv. of Labs & Res.,,archAlbany, N.Y.
Cancer Research InstituteNew England Deaconess HospBoston, Mass.
I
Brooklyn Testing LabBrooklyn, N.Y.
Biochemex LabsElmont, N.Y.
Institute for Steroid ResearchMontefiore Hosp & Med CenterBronx, N.Y.
Mellon InstitutePittsburgh, Pa.
Cardiovascular LabColumbia-Presbyterian Med. CenterNew York City
Sterling-Winthrop Res. Inst.Rensselear, N.Y.
O'Donnell Mem. Res. LabsSaranac Lake, N.Y.
Retina FoundationBoston, Mass.
APPENDIX G
LIST OF INSTITUTIONS INTERVIEWED INPRELIMINARY SURVEY
Southwest Medical CenterDallas, Texas
University of California at Los AngelesWhite Memorial HospitalLos Angeles, California
Stanford Medical Scheol,Stanford, California
Cutter LaboratoryBerkeley, California
University of California Medical CenterSan Francisco, California
Monroe County LaboratoriesRochester, New York
Springfield Municipal HospitalSpringfield, Massachusetts
Massachusetts General HospitalBoston, Massachusetts
* A number of other institutions represented by individualslisted in Appendix E were also consulted during the Pre-liminary Survey.
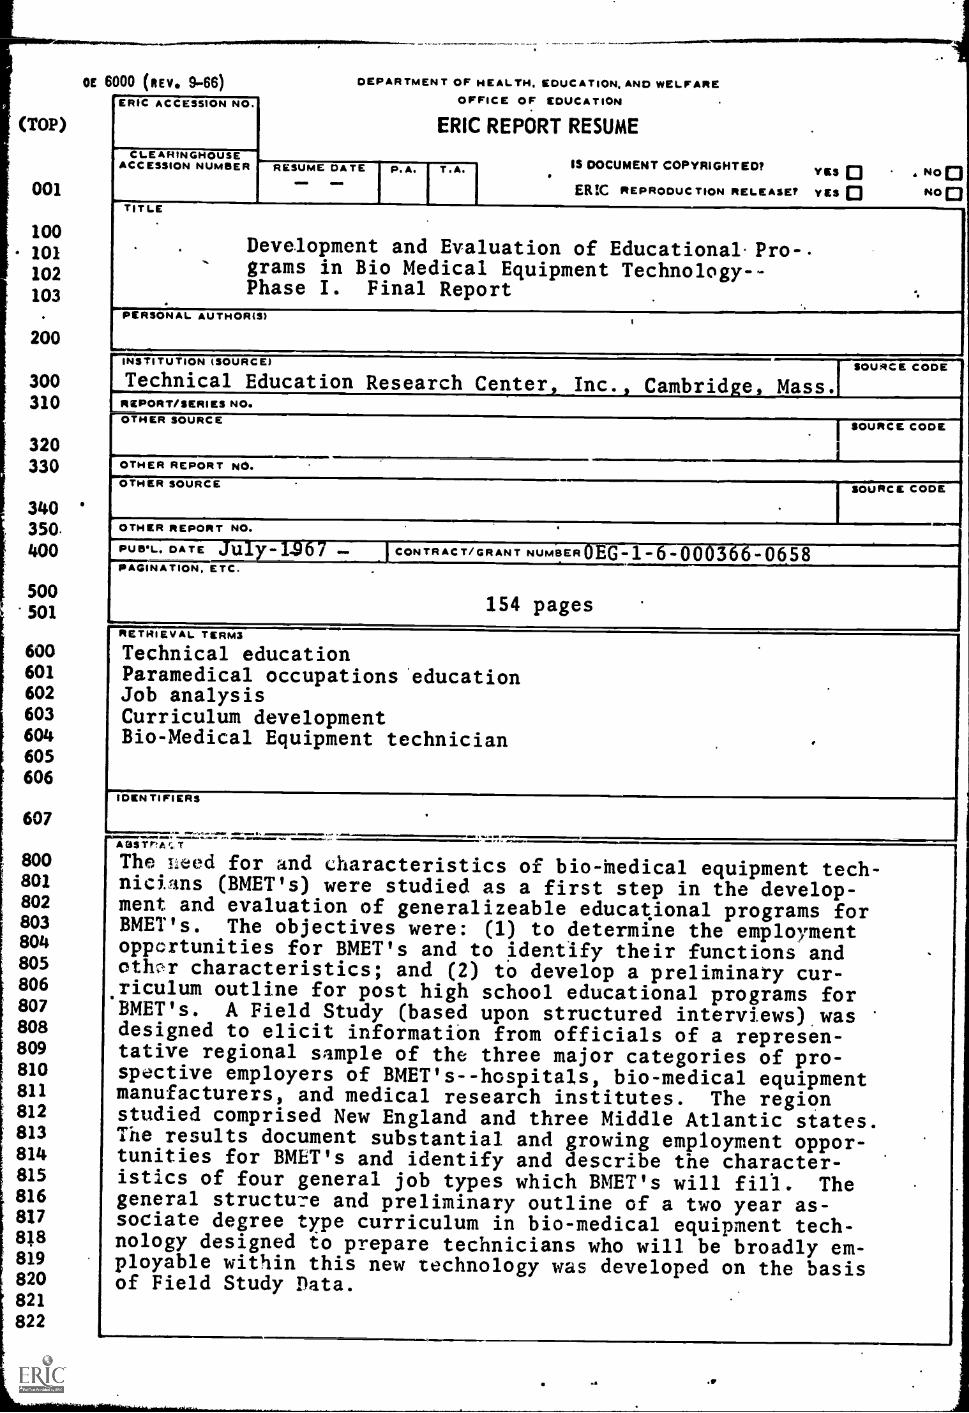
(TOP)
001
100
101
102
103
200
300310
320330
340350.
400
500501
600601602
603604605
606
607
800801802
803804805806807
808809810811812813814815816817818819820821822
OE 6000 (Rev. 9-66) DEPARTMENT OF HEALTH. EDUCATION, AND WELFARE
ERIC ACCESSION NO. o rricE
ERIC
or &ULM^ T WM
REPORT RESUME
IS DOCUMENT COPYRIGHTED? vas 0 No 0ERM REPRODUCTION RELEASE? YES 0 No 0
CLEARINGHOUSEACCESSION NUMBER RESUME DATE P.A. T.A.
TITLE
. Development and Evaluation of Educational-Pro-.grams in Bio Medical Equipment Technology --Phase I. Final Report ..
PERSONAL AUTHORS)1
INSTITUTION (SOURCE) SOURCE CODE
Technical Education Research Center Inc. Cambridge, Mass.REPORT/SERIES NO.OTHER SOURCE
SOURCE CODE
OTHER REPORT NO.OTHER SOURCE SOURCE CODE
OTHER REPORT NO. .
PUB*L. DATE July-1967 CONTRACT /GRANT NUMBER OEG -1-6-000366-0658PAGINATION, ETC. .
154 pages .
RETRIEVAL TERMS
Technical educationParamedical occupations educationJob analysisCurriculum developmentBio-Medical Equipment technician
(DEN TIFIERS
-.::::.-ABSTr'ZI T
The Leed for and characteristics of bio-medical equipment tech-nicians (BMET's) were studied as a first step in the develop-ment and evaluation of generalizeable educational programs forBMET's. The objectives were: (1) to determine the employmentopportunities for BMET's and to identify their functions andothc-r characteristics; and (2) to develop a preliminary cur-riculum outline for post high school educational programs forBMET's. A Field Study (based upon structured interviews) wasdesigned to elicit information from officials of a represen-tative regional sample of the three major categories of pro-spective employers of BMET's--hospitals, bio-medical equipmentmanufacturers, and medical research institutes. The regionstudied comprised New England and three Middle Atlantic states.The results document substantial and growing employment oppor-tunities for BMET's and identify and describe the character-istics of four general job types which BMET's will fill. Thegeneral structure and preliminary outline of a two year as-sociate degree type curriculum in bio-medical equipment tech-nology designed to prepare technicians who will be broadly em-ployable within this new technology was developed on the basisof Field Study Data.
.

E 6000 (Roy. 9-66)
INSTRUCTIONS FOR COMPLETING ERIC REPORT RESUME
The resume is used to identify summary data and information about each ' locument acquired, processed,and stored within the ERIC system. In addition to serving as a permanent record of the document in the col.lection, the resume is also a means of dissemination. All fields of the form must be completed in the allottedspaces, but inapplicable fields, should be left blank. The following instructions arc Keyed to the liae numbersappearing in the left margin of the form:
P LINE. ERIC Accession No 'Leave blank. A permanent ED.umber Will be assigned to each resume and its corresponding
document as they are processed into the ERIC system.
LINE 001. Clearinghouse Accession No. For use only by ERICClearinghouses. Enter the alpha code and 6digit documentnumber.
Resume Date. In numeric form, enter month, day, and yearthat resume is completed. (Example: 07 14 66)
P.A. Leave blank.IA Leave blank.Copyright. Check appropriate block to denote presence of
copyrighted material within the document.ERIC Reproduction Release Check appropriate block to indi-
cate that ERIC has permission to reproduce the document andits resume form.
LINES 100-103. Title. Enter the complete document title, in-cluding subtitles if they add significant information. Whereapplicable, also enter volume number or part number, and thetype of document ( Final Report, Interim Report, Thesis, etc.).
'LINE 200. Personal Author(s). Enter personal author(s), lastt name first. ( Example: Doe, John J.) If two authors are given,
enter both. ( Example: Doe, John J. Smith, Ted). If there arethree or more authors, list only one followed by "and others."
LINE 300. Institution (Source). Enter the name of the organiza-tion which originated the report. Include the address (city andState) and the subordinate unit of the organizatiOn. (Example:Howard Um., Cambridge, Mass., School of Education.)
Source Code. Leave blank.
LINE 310. Report/Series No. Enter any unique number assignedto the document by the institutional source. (Example: SC-1234)
LINE 320. Other Source. Use only when a second source isassociated with the document. Follow instructions for Line 300above.
Source Code Leave blank.
UNE 330. Cther Report No. Enter document number assignedby the second source.
LINE 340. Other'Source. Use only when a third source is asio-c ia ted with the docun.ent. follow instructions for Line 300 above.
Source Code. Leave tbink.
LINE 350. Other Report No. Enter document number assignedby the third source.
LINE 400. Publication Date. Enter the day, month, and year ofthe document. (Example: 12 Jun 66)
Contract/Grant Number. Applicable only for documents gen-erated from research sponsored by the U.S. Office of Education.Enter appropriate contract or grant number and its prefix.Example: OEC-I-6-061234-0033)
LINES 500-501. Pagination, etc. Enter the total number ofpages of the document, including illustrations. and appendixes.( Example: 115p.) USE THIS SPACE FOR ADDITIONAL IN-FORMATION PERTINENT TO THE DOCUMENT, such aspublisher, journal citation, and other contract numbers.
LINES 600-606. Retrieval Terms. Enter the important subjectterms (descriptors) which, taken as a group, adequately describethe contents of the document.
LINE 607. Identifiers. Enter any additional important toms,more specific than descriptors, such as trade names, equipmentmodel names and numbers, organization and project names,discussed in the document.
LINES 800-822. Abstract. Enter an informative abstract of thedocument. Its style and content must be suitable for publicannouncement and dissemination.
U.S. GOVERNMENT PRINTING OFFICE : 19411 0-2314111