report summary sheet - welcome to the …_human_resources_report... · report summary sheet ......
TRANSCRIPT
Page 1 of 21
Quality care – for you, with you
REPORT SUMMARY SHEET
Meeting: Date:
Trust Board Thursday 29th September 2016
Title: Trust Board Report (HROD, including Estates)
Lead Director:
Vivienne Toal Director of Human Resources & Organisational Development
Corporate Objective:
Provide safe, high quality care Be a great place to work
Make the best use of resources
Purpose: For Approval
Summary of Key Issues for Trust Board High level context:
Section 1 this month focuses on the implementation of an £11M project to improve
the electrical infrastructure of Craigavon Area Hospital
Section 2 provides an update regarding the Trust’s Resourcing Service
Sections 3 - 4 outlines key workforce productivity information
Key issues/risks for discussion:
Section 1 – Electrical Supply and Electrical Infrastructure Work Scheme at
Craigavon Area Hospital
£11M capital investment
Addresses a key Corporate Risk
Facilitates future site developments
Improves sustainability
Section 2 – Resourcing Services
The Recovery Plan for Recruitment & Selection Shared Services Centre (RSSSC) is
continuing with several improvements made or in progress. The Trust is working
closely with RSSSC and regional colleagues to ensure processes are streamlined to

Page 2 of 21
ensure the length of time taken to recruit to vacant posts is as efficient as possible.
Regular dialogue continues at a senior level between the Trust and RSSSC.
Section 3 – Workforce Information
The Trust’s absence rate in April was particularly low and while there was an
increase in the rate during May and June, the rate has dropped again to 4.76% in
July.
Regional figures as at July 2016 indicate that SHSCT has the lowest sickness
absence rate of all the Trusts, for the year to date.
The Staff in Post figure as at 31 July shows a slight increase of 7.81 WTE since 31
March 2016, and an increase of 313.70 WTE in comparison with the baseline
figure for 31 March 2015.
The Monthly Average Flexible Workforce Costs for 2016/17 (YTD) as at July 2016
are over £600K higher than the monthly average during 2015/16 and subsequently
the costs as a % of the YTD Total Salary Bill has increased to 8.65%.
Summary of SMT challenge/discussion:
Criticality of the newly recruited Trust Resourcing Liaison role in ensuring that any
blockages / delays in Recruitment Shared Services Centre and their ability to fill
vacancies quickly were identified and addressed, particularly coming into winter
months.
Internal/External engagement:
Section 1 - Due to the scale and complex nature of the project, the Trust engaged with many internal and externals stakeholders. From the design stage through to completion the Trust engaged with many parties to ensure a new dedicated NIE power supply was installed and commissioned. The following is a list of typical parties engaged throughout the project: Typical Internal Parties:
Ward Managers
Heads of Service
Facilities Management
Estates Management
Transport
IT Typical External Parties:
Central Procurement Directorate (CPD)
Design Team
Local Council and planners
Utility providers – Airtricity, NIE Networks, PowerNI, BT & Firmus Gas
DOE Road service, DRDNI
Large equipment and generation providers – Edina, ABB, Schneider, D&J generators
Land Owners and Residents affected by works.
Human Rights/Equality:
N/A

Page 3 of 21
Quality care – for you, with you
Trust Board Report
Human Resources & Organisational Development (HROD) Directorate
Version
1
Presented to Board of Directors
Thursday 29th September 2016
Authors of report HROD Assistant Directors & Heads of Service:
Alan Metcalfe, Assistant Director of Estates
Karen Anderson, Head of Workforce Information
Iain Gough, Acting Head of Resourcing
Presented by Vivienne Toal, Director of HROD

Page 4 of 21
INTRODUCTION & PURPOSE
Section 1 provides a report on a major, £11M project to upgrade the electrical supply to
the Craigavon Hospital site in order to improve resilience, increase on-site capacity to
support future development and improve sustainability through the implementation of
Combined Heat and Power (CHP).
Section 2 provides an update on the service provided to the Trust by the Recruitment & Selection Shared Service Centre (BSO). Section 3-4 of the report provides workforce productivity information (turnover, sick leave etc).

Page 5 of 21
SECTION 1
Electrical Supply and Electrical Infrastructure Work Scheme at Craigavon Area Hospital 1.0 Introduction
A constant and reliable electricity supply is essential for Healthcare delivery –
particularly in an Acute setting. The loss of electricity, even for a short period of time,
can result in loss of critical equipment and a consequential risk to life. A sustained
interruption to the electricity supply may necessitate the temporary closure of that
facility.
This report sets out the approach taken to address the risk associated with insufficient
electrical power supply to the Craigavon Area Hospital Site.
It describes the background to the issue and the key factors influencing the
development of the solution and its implementation.
2.0 CAH Electrical System
The electrical infrastructure supporting the hospital was largely unchanged since the
hospital was constructed 45 years ago and had a capacity of 2.5 MVA. Since that time
the hospital has undergone many changes such as departmental extensions and
greater use of electrical appliances such as computers which gradually increased the
demand for electricity on site. This increase in loading eventually caused a network
collapse resulting in a total site power outage in 2010.
Clearly, it is critically important that the Trust is able to have an electrical supply to
ensure continuity of services without the risk of power failure. Measures were taken
immediately to minimise the risk of any reoccurrence and Northern Ireland Electricity
(NIE) put in place special arrangements to manage peak demands. A strategic review
of the electrical supply was carried out to establish a permanent solution and the
outcome of this review was the design and implementation of the project described in
this report.
3.0 Proposed Solution
The solution comprised of two parts, an initial interim solution and a permanent solution
with an overall cost of approximately £11 million.
The interim solution comprised of additional on-site diesel generation and protection
measures to ensure the Trust would not exceed supply limits set by NIE. Under these

Page 6 of 21
arrangements, diesel generation was set to commence when 95% capacity was
reached. In addition to this, a new energy centre was constructed which includes a
1.4MW Combined Heat and Power Plant (CHP) to provide additional on-site electrical
generation during peak demand and reduce the overall reliance on the NIE network
supply.
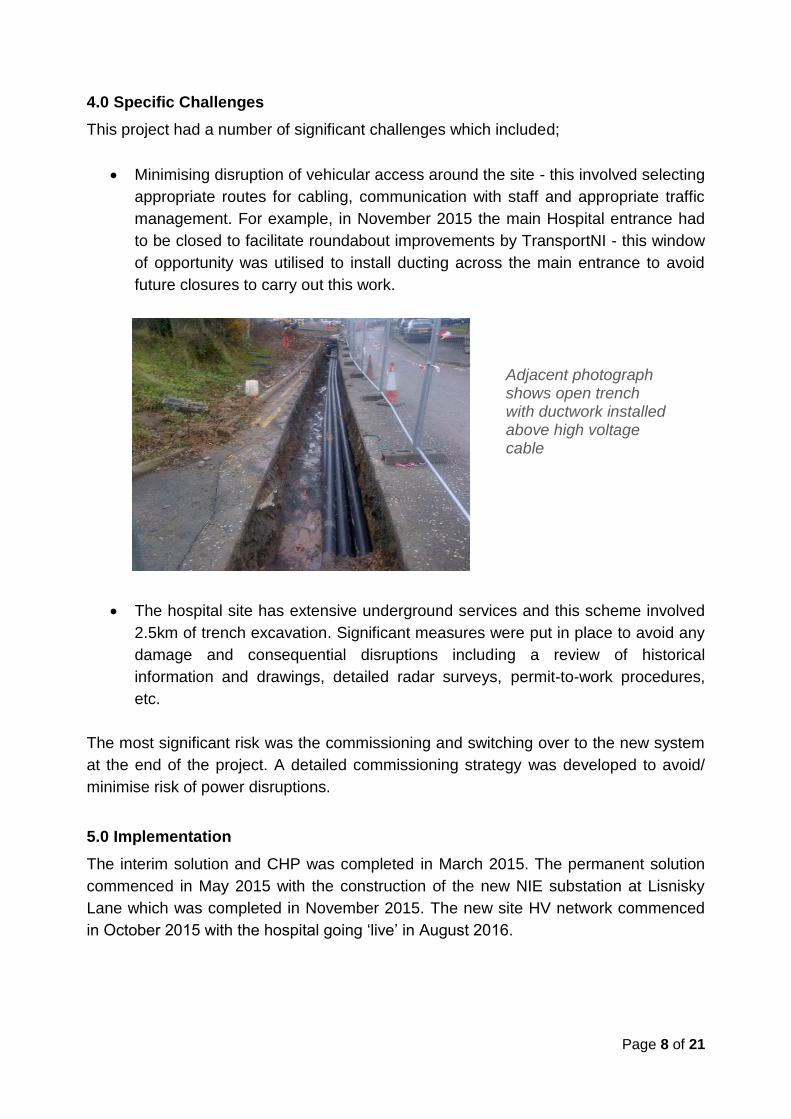
The permanent solution consists of a new 6MVA High Voltage (HV) electrical supply
from NIE with a new substation located to the rear of the site at Lisnisky Lane. This
supply links into a new 2.5km long HV network which encompasses the site and
supplies current facilities as well as providing capacity for future development. Existing
HV Transformers and switchgear being upgraded to facilitate this new supply.
Adjacent photograph shows new energy centre
Illustration above shows proposed layout of new switch room adjacent to Bluestone

Page 7 of 21
Illustration above shows extent of site wide high voltage network as denoted by red line
Page 8 of 21
4.0 Specific Challenges
This project had a number of significant challenges which included;
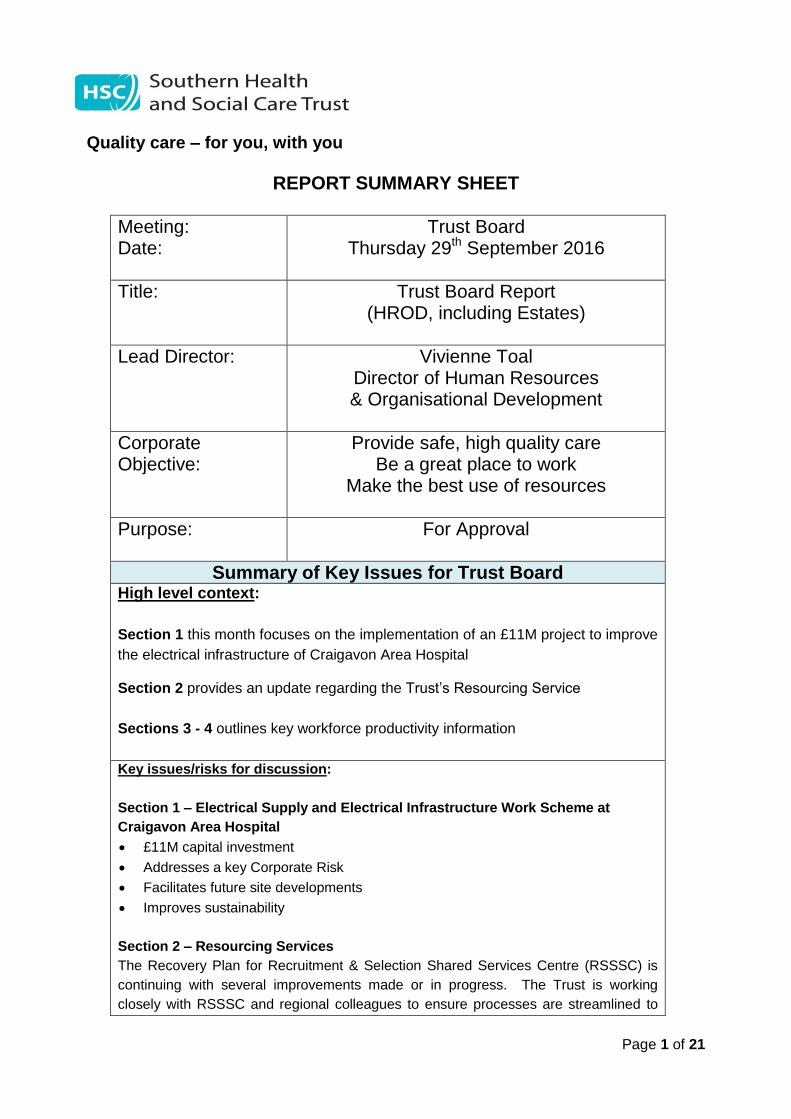
Minimising disruption of vehicular access around the site - this involved selecting
appropriate routes for cabling, communication with staff and appropriate traffic
management. For example, in November 2015 the main Hospital entrance had
to be closed to facilitate roundabout improvements by TransportNI - this window
of opportunity was utilised to install ducting across the main entrance to avoid
future closures to carry out this work.
The hospital site has extensive underground services and this scheme involved
2.5km of trench excavation. Significant measures were put in place to avoid any
damage and consequential disruptions including a review of historical
information and drawings, detailed radar surveys, permit-to-work procedures,
etc.
The most significant risk was the commissioning and switching over to the new system
at the end of the project. A detailed commissioning strategy was developed to avoid/
minimise risk of power disruptions.
5.0 Implementation
The interim solution and CHP was completed in March 2015. The permanent solution
commenced in May 2015 with the construction of the new NIE substation at Lisnisky
Lane which was completed in November 2015. The new site HV network commenced
in October 2015 with the hospital going ‘live’ in August 2016.
Adjacent photograph shows open trench with ductwork installed above high voltage cable
Page 9 of 21
6.0 Benefits
Implementation of the project has enabled us to realise the following benefits:
The provision of a 6MVA supply helps ensure the continuity of services with
minimum risk of power failure and site resilience is greatly improved.
On-site generator capacity is now sufficient to meet the full demands of the
hospital with fuel storage of 10 days before resupply is required (Departmental
requirement).
Provision of additional electrical capacity to enable future site developments to
take place.
Carbon reductions are achieved by the use of onsite CHP generation –
improving the Trust’s “carbon footprint”.
Onsite CHP generation will provide significant cost savings of approximately
£400K annually.
Compliance with Health Department Guidance HTM 06-01 and NIE operating
guidance will be achieved.
This project also provided the opportunity to install ducting for future IT cabling
across the site.
7.0 Project Status – Key Milestones
The project has progressed as follows:
New substations constructed with HV equipment commissioned. (June 16)
IT ducting infrastructure around site complete (June 16)
All NIE works complete with a new 6MVA high voltage electrical supply
commissioned and live (July 16).
New 11 KV ring around CAH site complete. (July 16)
All premises on CAH sites migrated on to new high voltage supply (Aug 16)
Adjacent photograph shows transformer (33 to 11KV) at substation at Lisnisky Lane

Page 10 of 21
Landscaping works progressing (Sept 16)
CHP plant to be recommissioned (Sept 16)
8.0 Key Project Team Members
Trust Project Director: Trevor Burns
Trust Project Manager: John Mitchell
Estates Operational Lead: David Thompson
CPDHP Project Manager: Joe George
CPDHP Quantity Surveyor: Michael Beggs
CPDHP Electrical Engineer: Johnny Baxter
Design Consultants: Todd Architects
ARUP
Sweett Group
Contractor: Felix O’Hare
Page 11 of 21
SECTION 2
Resourcing Services
This section of the report provides an update on the service provided to the Trust by
the Recruitment & Selection Shared Service Centre (BSO).
The Recruitment & Selection Shared Service Centre (RSSSC) continue to be in
‘recovery’ with work ongoing to continue the standardisation and streamlining of
processes regionally, along with a range of other pieces of improvement work. A
regional ‘Task & Finish’ group oversees the ongoing implementation of this recovery
plan, and this group continues to meet on a fortnightly basis with the Trust’s Acting
Head of Resourcing actively and fully engaged in this group.
A local action plan is also in place within the Trust, as part of the overall recovery
process. The Trust’s Acting Head of Resourcing is leading on the implementation and
ongoing management of this local action plan, which seeks to ensure that all
unnecessary delays in the recruitment process which are caused by factors within the
control of Trust managers and/or HR teams, are minimised or eliminated.
Performance Monitoring
Recent developments in reporting functionality in the E-Recruitment system have
facilitated the provision of performance data from the RSSSC, particularly on the
important KPI of ‘time to fill’ posts.
A workshop is planned for 16th September to assist Trusts to fully understand the
information being provided by RSSSC and to allow Trust Resourcing Teams to run
reports locally for monitoring purposes.
A recent report from RSSSC indicates that 87% of SHSCT posts were filled within the
KPI of 70 days, however several data quality concerns remain. Following the above
workshop, local reporting will be carried out to interrogate SHSCT data more
thoroughly.
The Trust has now appointed a Recruitment Shared Services Liaison Officer to monitor
progress with recruitment requisitions and to assist in removing blockages / delays in
the time to fill vacancies.
Standardisation and harmonisation of processes
A key element in addressing issues of service delivery is a move towards
standardisation of practice across the HSC, in areas such as the management of

Page 12 of 21
waiting lists, advertising of posts and processing of ‘pre-employment checks’. Most
recently, a workshop was held with Occupational Health (OH) colleagues in all Trusts,
to ensure that documentation and processes are streamlined to minimise any delays in
the completion of pre-employment health checks.
Customer Service
The RSSSC Recovery Plan includes specific actions to ensure better communication
and engagement with Trust managers, with associated improvements in customer
service standards. This includes the provision of a bespoke customer service training
programme to all RSSSC staff.
In response to ongoing dissatisfaction expressed by Trust managers with the RSSSC
telephone system, a new call management system is being implemented before the
end of September 2016. This new system will not only improve the routing of calls, but
will also facilitate the provision of evidential feedback on key indicators such as call
volumes, call durations, percentage of calls answered/unanswered and average
number of rings before calls are answered.
E-Recruitment system
A number of planned enhancements to the E-Recruitment system have been
implemented during August/September 2016 which should make the system more
usable for Trust staff/managers. Several further enhancements are ongoing and will be
prioritised by the regional ‘Task & Finish Group’ before implementation.
Training and Support for Trust Managers
A set of ‘Operating Principles’ have been established which set out the roles and
responsibilities of Trust managers, Trust HR/Resourcing staff and the RSSSC. A
summarised version of this document has been shared widely with Trust managers, so
they understand and fulfil all their responsibilities with regard to the recruitment of staff
to ensure the process is completed within reasonable timescales.
A key focus for the Trust’s Resourcing Team is to ensure that managers are supported
by appropriate system training at the point of need, for example targeting managers
who are due to complete shortlisting (identified by RSSSC as one of the key delays in
processing recruitment files). The Resourcing Team also maintain a comprehensive
range of locally tailored guidance documents and also provide a Trust ‘helpdesk’
resource to assist in resolving any issues arising.
The Resourcing Team have recently appointed a Recruitment Liaison Officer whose
role will include the provision of advice and assistance to Trust managers, as well as
the co-ordination of activities for ‘high-volume’ Trust-wide recruitment exercises.

Page 13 of 21
Impact of further deployments to RSSSC:
South Eastern and Western Trusts are currently in the process of agreeing a revised
timetable for transferring their services to the RSSSC (dependent on stabilisation of the
current service delivery standards). The impact on SHSCT services will be closely
monitored during this time.

Page 14 of 21
SECTION 3
3. Workforce Productivity Information
3.1 - Workforce Information – Monthly Trend Information
The Trust’s Sickness Absence Target for 2016/17 is 5.07% The above absence figures do not include Domiciliary Care Workers.
Workforce Information
Area 2
01
3/2
01
4
Bas
eli
ne
Info
rma
tio
n
(31 M
ar
2014
)
20
14
/20
15
Bas
eli
ne
Info
rma
tio
n
(31 M
ar
2015
)
20
15
/20
16
Bas
eli
ne
Info
rma
tio
n
(31 M
ar
2016
)
2016/2017 – Monthly Trend Information
HRPTS Figures
Apr 2016
May 2016
Jun 2016
Jul
2016
Aug 2016
Sep 2016
Oct
2016
Nov 2016
Dec 2016
Jan 2017
Feb 2017
Mar 2017
Turnover
(permanent staff only)
5.7%
6.2%
6.9%
7.1%
6.9%
7.1%
7.1%
Administrative
& Clerical Staffing Levels
18.3%
17.8%
17.7%
17.7%
17.8%
17.9%
17.9%
Skills Mix – Nursing & Midwifery
79:21
79:21
80:20
-
-
79:21
-
Skills Mix -
Allied Health Professional
(AHP)
84:16
88:12
88:12
-
-
88:12
-
Sickness Absence
5.14%
5.15%
5.25%
4.60%
5.07%
5.23%
4.76%
Page 15 of 21
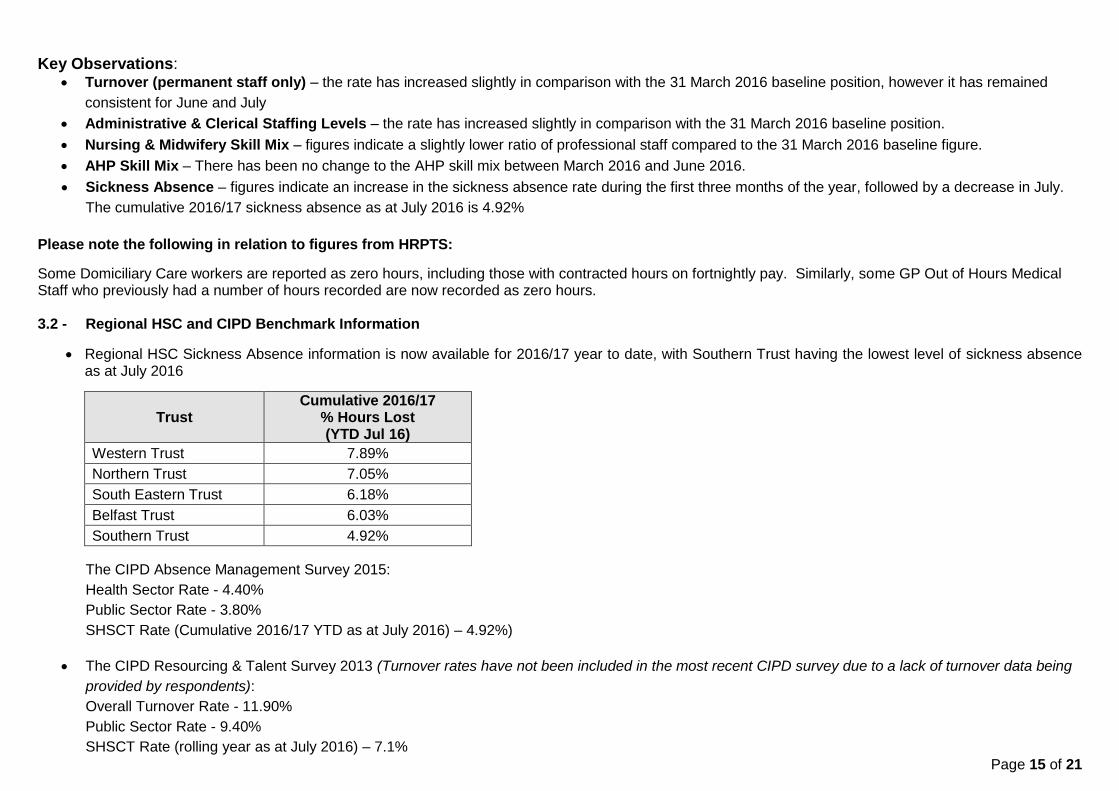
Key Observations: Turnover (permanent staff only) – the rate has increased slightly in comparison with the 31 March 2016 baseline position, however it has remained
consistent for June and July
Administrative & Clerical Staffing Levels – the rate has increased slightly in comparison with the 31 March 2016 baseline position.
Nursing & Midwifery Skill Mix – figures indicate a slightly lower ratio of professional staff compared to the 31 March 2016 baseline figure.
AHP Skill Mix – There has been no change to the AHP skill mix between March 2016 and June 2016.
Sickness Absence – figures indicate an increase in the sickness absence rate during the first three months of the year, followed by a decrease in July.
The cumulative 2016/17 sickness absence as at July 2016 is 4.92%
Please note the following in relation to figures from HRPTS:
Some Domiciliary Care workers are reported as zero hours, including those with contracted hours on fortnightly pay. Similarly, some GP Out of Hours Medical Staff who previously had a number of hours recorded are now recorded as zero hours. 3.2 - Regional HSC and CIPD Benchmark Information
Regional HSC Sickness Absence information is now available for 2016/17 year to date, with Southern Trust having the lowest level of sickness absence as at July 2016
Trust Cumulative 2016/17
% Hours Lost (YTD Jul 16)
Western Trust 7.89%
Northern Trust 7.05%
South Eastern Trust 6.18%
Belfast Trust 6.03%
Southern Trust 4.92%
The CIPD Absence Management Survey 2015:
Health Sector Rate - 4.40%
Public Sector Rate - 3.80%
SHSCT Rate (Cumulative 2016/17 YTD as at July 2016) – 4.92%)
The CIPD Resourcing & Talent Survey 2013 (Turnover rates have not been included in the most recent CIPD survey due to a lack of turnover data being
provided by respondents):
Overall Turnover Rate - 11.90%
Public Sector Rate - 9.40%
SHSCT Rate (rolling year as at July 2016) – 7.1%

Page 16 of 21
3.3 - Long and Short Term Sickness Absence Analysis
Trust Long and Short Term Sickness Absence Summary – August 2015 to July 2016
Long Term, 1,965 26.20%
Short Term, 5,535 73.80%
Number of Episodes of Long Term/Short Term Sickness August 2015 - July 2016
(excluding Domiciliary Care Workers & GP Out of Hours Medical Staff)
Long Term Sick Leave is defined as 29 calendar days or more
2,353
1,471
1,711
1,965
0
1000
2000
3000
1-3 Days 4-7 Days 8-28 Days 29+ Days
Ep
iso
de
s
Number of Episodes by Absence Length Category August 2015 - July 2016
4,625 7,996
26,471
151,537
0
20000
40000
60000
80000
100000
120000
140000
160000
1-3 Days 4-7 Days 8-28 Days 29+ Days
Days
Calendar Days Lost by Absence Length Category August 2015 - July 2016
Page 17 of 21
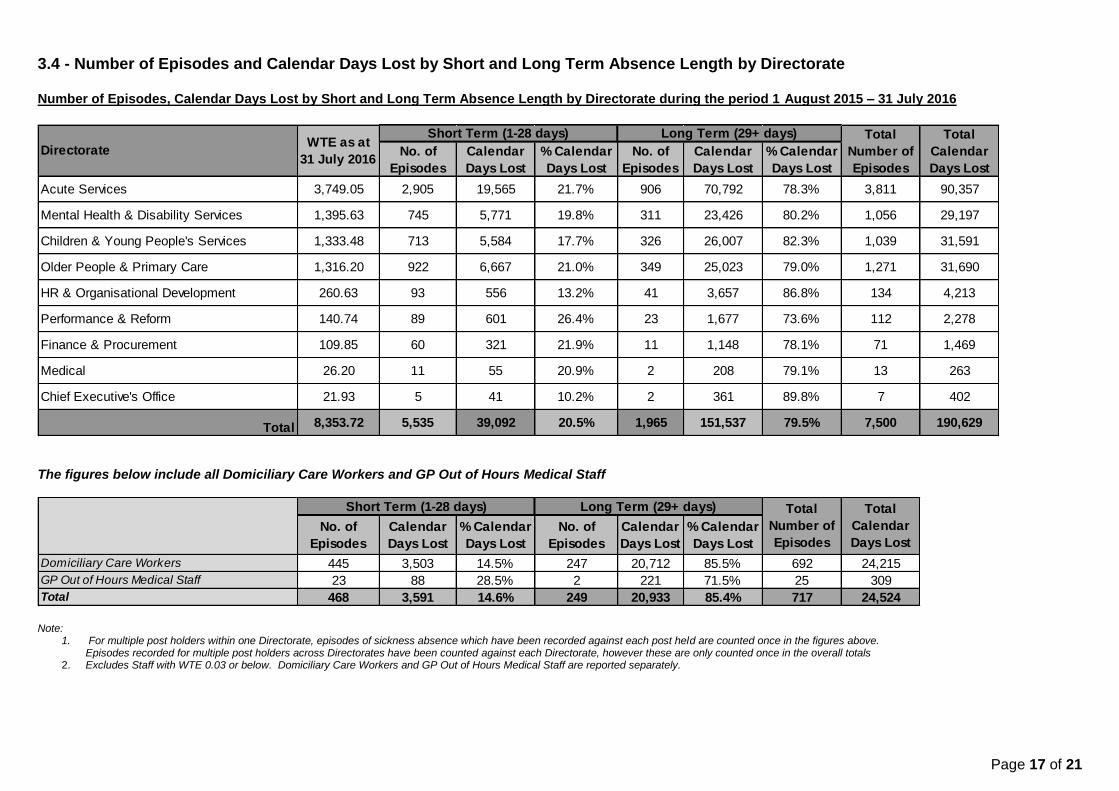
3.4 - Number of Episodes and Calendar Days Lost by Short and Long Term Absence Length by Directorate Number of Episodes, Calendar Days Lost by Short and Long Term Absence Length by Directorate during the period 1 August 2015 – 31 July 2016
The figures below include all Domiciliary Care Workers and GP Out of Hours Medical Staff
Note:
1. For multiple post holders within one Directorate, episodes of sickness absence which have been recorded against each post held are counted once in the figures above. Episodes recorded for multiple post holders across Directorates have been counted against each Directorate, however these are only counted once in the overall totals
2. Excludes Staff with WTE 0.03 or below. Domiciliary Care Workers and GP Out of Hours Medical Staff are reported separately.
No. of
Episodes
Calendar
Days Lost
% Calendar
Days Lost
No. of
Episodes
Calendar
Days Lost
% Calendar
Days Lost
Acute Services 3,749.05 2,905 19,565 21.7% 906 70,792 78.3% 3,811 90,357
Mental Health & Disability Services 1,395.63 745 5,771 19.8% 311 23,426 80.2% 1,056 29,197
Children & Young People's Services 1,333.48 713 5,584 17.7% 326 26,007 82.3% 1,039 31,591
Older People & Primary Care 1,316.20 922 6,667 21.0% 349 25,023 79.0% 1,271 31,690
HR & Organisational Development 260.63 93 556 13.2% 41 3,657 86.8% 134 4,213
Performance & Reform 140.74 89 601 26.4% 23 1,677 73.6% 112 2,278
Finance & Procurement 109.85 60 321 21.9% 11 1,148 78.1% 71 1,469
Medical 26.20 11 55 20.9% 2 208 79.1% 13 263
Chief Executive's Office 21.93 5 41 10.2% 2 361 89.8% 7 402
Total 8,353.72 5,535 39,092 20.5% 1,965 151,537 79.5% 7,500 190,629
Total
Calendar
Days Lost
Short Term (1-28 days)WTE as at
31 July 2016
Long Term (29+ days) Total
Number of
Episodes
Directorate
No. of
Episodes
Calendar
Days Lost
% Calendar
Days Lost
No. of
Episodes
Calendar
Days Lost
% Calendar
Days Lost
Domiciliary Care Workers 445 3,503 14.5% 247 20,712 85.5% 692 24,215
GP Out of Hours Medical Staff 23 88 28.5% 2 221 71.5% 25 309
Total 468 3,591 14.6% 249 20,933 85.4% 717 24,524
Total
Number of
Episodes
Total
Calendar
Days Lost
Short Term (1-28 days) Long Term (29+ days)

Page 18 of 21
SECTION 4
4. Workforce Movement, Flexible Workforce Costs, Posts Approved & Agency/Bank Usage
4.1 – Monthly Staff in Post Comparison & Variance with Baseline Positions Note: These figures exclude staff with WTE 0.03 or below, staff on career breaks and staff on external secondments
Directorate
Baseline Position
Apr 16 May 16 Jun 16 Jul 16 Aug 16 Sep 16 Oct 16 Nov 16 Dec 16 Jan 17 Feb 17 Mar 17
Variance between Mar 15 & Current Month
Mar 15 Mar 16
Acute Services 3,650.00 3,741.02 3,730.84 3,729.75 3,732.33 3,749.05 99.05
Mental Health & Disability Services
1,274.68 1,392.14 1,387.35 1,389.02 1,391.66 1,395.63 120.95
Children & Young People's Services
1,263.54 1,326.37 1,322.86 1,328.80 1,329.38 1,333.48 69.94
Older People & Primary Care 1,293.53 1,322.65 1,308.35 1,320.08 1,318.23 1,316.20 22.68
HR & Organisational Development
121.45 262.81 259.36 257.73 257.93 260.63 139.19
Performance & Reform 265.08 142.16 139.14 138.74 139.74 140.74 -124.33
Finance & Procurement 109.22 109.29 109.76 110.69 110.60 109.85 0.63
Medical 40.66 25.84 27.24 27.24 27.20 26.20 -14.46
Chief Executive's Office 21.88 23.63 23.03 23.03 22.63 21.93 0.05
Total (exc Domiciliary Care Workers & GP OOH Medical Staff):
8,040.02 8,345.91 8,307.93 8,325.08 8,329.70 8,353.72 313.70
*Domiciliary Care Workers 90.35 217.82 221.68 225.07 229.99 232.95
*GP Out of Hours Medical Staff 0.80 0.48 0.48 0.48 0.48 0.48
Total 91.15 218.29 222.15 225.55 230.47 233.43
* There is a piece of work ongoing to offer Domiciliary Care Workers minimum hours contracts and as a result there is a notable increase in the WTE which will continue until this exercise is completed.

Page 19 of 21
4.2 - Comparison of 2014/15, 2015/16 and 2016/17 Staff Levels (WTE), Overtime, Bank, Agency and Locum Costs and 2016/17 Costs to Date as % of YTD Total Salary Bill
Notes:
Staff Levels WTE figures above have been taken from HRPTS and exclude staff with WTE <= 0.03, Career Breaks and External Secondments
Cost information has been extracted from information provided by Finance & Procurement Directorate
Mar-15 Mar-16 2014/15 2015/16 2016/17
2014/15
Baseline
& 2016/17
YTD
Variance
8,040.02 8,345.91 8,353.72 313.70
£2,418,263 £3,036,611 £1,083,900 £201,522 £253,051 £270,975 £69,453 0.85%
£8,880,496 £9,569,879 £3,162,504 £740,041 £797,490 £790,626 £50,585 2.49%
£7,805,354 £11,938,264 £6,388,831 £650,446 £994,855 £1,597,208 £946,762 5.02%
£664,870 £901,568 £359,177 £55,406 £75,131 £89,794 £34,388 0.28%
£19,768,983 £25,446,322 £10,994,412 £1,647,415 £2,120,527 £2,748,603 £1,101,188 8.65%
2016/17 Costs
to date as %
of YTD Total
Salary Bill
WTE
Baseline Position
Staff Levels WTE
and Costs (£)
Overtime Cost (£)
Bank Cost (£)
Agency Cost (£)
(including M&D Agency
Costs)Locum Cost (£)
(M&D Locum Staff
employed by SHSCT)
Variance
Staff WTE
March 2015
and Current
Month
Total Costs
Staff Levels WTE
(HRMS/HRPTS)
2016/17 to
date as at
31 July 2016
Monthly Average Flexible Workforce Costs
Page 20 of 21
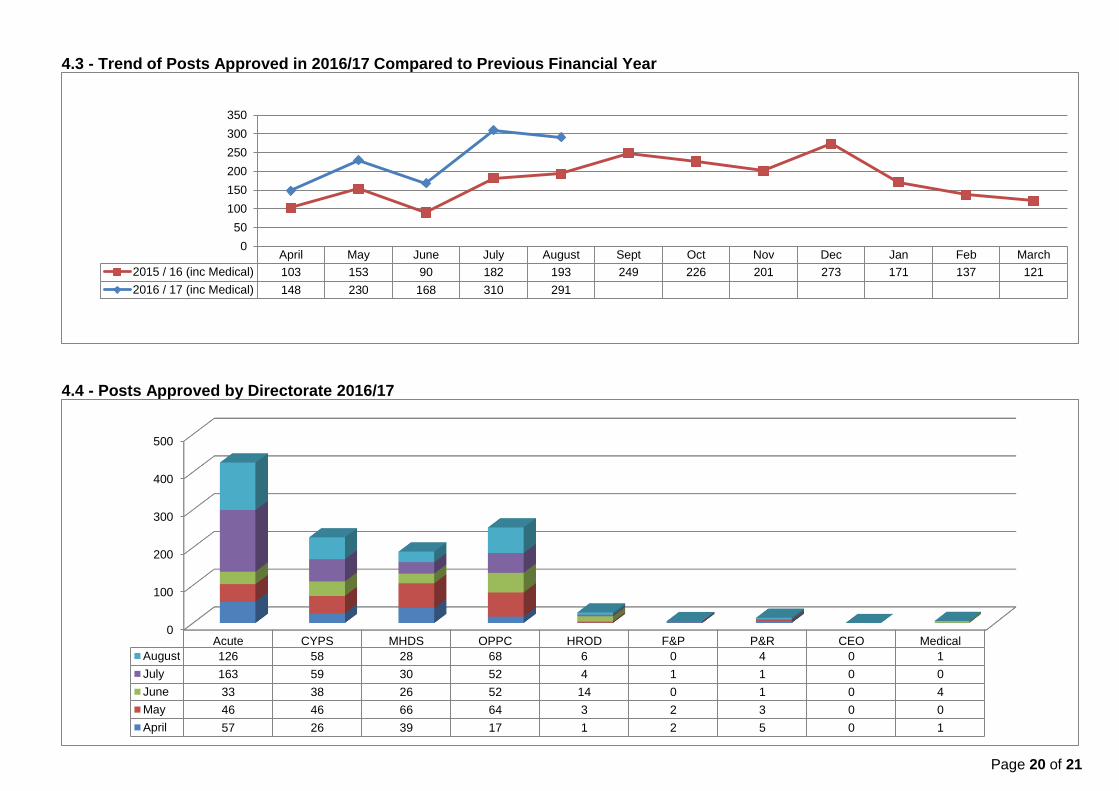
4.3 - Trend of Posts Approved in 2016/17 Compared to Previous Financial Year
4.4 - Posts Approved by Directorate 2016/17
April May June July August Sept Oct Nov Dec Jan Feb March
2015 / 16 (inc Medical) 103 153 90 182 193 249 226 201 273 171 137 121
2016 / 17 (inc Medical) 148 230 168 310 291
0
50
100
150
200
250
300
350
0
100
200
300
400
500
Acute CYPS MHDS OPPC HROD F&P P&R CEO Medical
August 126 58 28 68 6 0 4 0 1
July 163 59 30 52 4 1 1 0 0
June 33 38 26 52 14 0 1 0 4
May 46 46 66 64 3 2 3 0 0
April 57 26 39 17 1 2 5 0 1

Page 21 of 21
4.5 - Trend Charts for 2016/17 Bank Activity
4.6 - Trend Chart for 2016/17 Agency Activity Compared to Previous Financial Year – WTE (Snap Shot at Month End) (NB This chart excludes adhoc Agency usage)
0
50
100
150
200
250
Apr-16 May-16 Jun-16 Jul-16 Aug-16 Sep-16 Oct-16 Nov-16 Dec-16 Jan-17 Feb-17 Mar-17
Apr-16 May-16 Jun-16 Jul-16 Aug-16 Sep-16 Oct-16 Nov-16 Dec-16 Jan-17 Feb-17 Mar-17
Bank Block Bookings 216.02 221.37 217.15 232.21 236.91
HSC E-locum (hours filled in WTE) 5.43 6.54 5.65 7.55 6.36
Nurse Bank Adhoc Activity (hours filled in WTE) 196.86 204.28 219.13 233.41 237.54
Apr May Jun Jul Aug Sep Oct Nov Dec Jan Feb Mar
2015/16 219.99 211.56 211 194.75 214.48 232.05 235.2 293.41 300.75 330.74 357.08 374.91
2016/17 368.34 382.57 364.13 367.39 375.41
0
50
100
150
200
250
300
350
400
450