report to shareholders for the first quarter, 2017 · report to shareholders for the first quarter,...
TRANSCRIPT
Report to Shareholders for the First Quarter, 2017www.cibc.com February 23, 2017
Report of the President and Chief Executive Officer
Overview of resultsCIBC today announced its financial results for the first quarter ended January 31, 2017.
First quarter highlights• Reported net income was $1,407 million, compared with $982 million for the first quarter a year ago, and $931 million for the prior
quarter.• Adjusted net income(1) was $1,166 million, compared with $1,029 million for the first quarter a year ago, and $1,041 million for the prior
quarter.• Reported diluted earnings per share (EPS) was $3.50, compared with $2.43 for the first quarter a year ago, and $2.32 for the prior quarter.• Adjusted diluted EPS(1) was $2.89, compared with $2.55 for the first quarter a year ago, and $2.60 for the prior quarter.• Reported return on common shareholders’ equity (ROE) was 24.4% and adjusted ROE(1) was 20.1%.
Results for the first quarter of 2017 were affected by the following items of note aggregating to a positive impact of $0.61 per share:• $299 million ($245 million after-tax) gain on the sale and lease back of certain retail properties (reported in the Other business line within Retail and
Business Banking); and• $6 million ($4 million after-tax) amortization of intangible assets.
At January 31, 2017, CIBC’s Basel III Common Equity Tier 1, Tier 1 and Total capital ratios were 11.9%, 13.2% and 15.2%, respectively, on an all-in basiscompared with 11.3%, 12.8% and 14.8%, respectively, at the end of the prior quarter. CIBC’s Basel III leverage ratio at January 31, 2017 was 4.0% on anall-in basis.
CIBC today announced a quarterly dividend increase of 3 cents per common share to $1.27 per share. In addition, we announced our intention to seekToronto Stock Exchange approval for a normal course issuer bid that would permit us to purchase for cancellation up to a maximum of 8 million, orapproximately 2% of our outstanding common shares, over the next 12 months.
In the first quarter, CIBC delivered strong performance across Retail and Business Banking, Wealth Management and Capital Markets. We are executing wellon our strategy to build a strong, innovative, relationship-oriented bank to deliver growth and reach our goal of being #1 in client experience.
Core business performanceRetail and Business Banking reported net income of $953 million for the first quarter, up $269 million or 39% from the first quarter a year ago. Excludingitems of note, adjusted net income(1) was $709 million, up $23 million or 3% from the first quarter a year ago. Solid volume growth and higher fees werepartially offset by narrow spreads, a higher provision for credit losses due to increased write-offs in the card and personal lending portfolios, and higherspending on strategic initiatives.
Retail and Business Banking continued to make progress against our objectives of leadership in profitable revenue growth and client experience. Duringthe first quarter of 2017:• We launched Digital Cart, allowing clients to apply for multiple banking products entirely through their mobile devices or online - a first in the mobile
space in Canada;• For the third year in a row, we earned the highest score for online banking functionality among the five largest retail banks in Canada in Forrester
Research Inc.’s 2016 Canadian Online Banking Functionality Benchmark report; and• We transformed eight of our banking centres to deliver a more modern banking experience and meet the changing banking preferences of our clients.

Wealth Management reported net income of $133 million for the first quarter, up $14 million or 12% from the first quarter a year ago. Excluding items ofnote, adjusted net income(1) was $135 million, up $13 million or 11% from the first quarter a year ago, driven by higher revenue, partially offset by higherexpenses. The higher revenue was driven by growth in average assets under management and higher transactional activity, including debt and equityissuance, partially offset by the impact of the sale of American Century Investments.
During the first quarter of 2017, Wealth Management continued its progress in support of our strategic focus to enhance client experience, drive assetgrowth, and simplify our business platform:• We launched multi-currency registered brokerage accounts, enabling clients to hold U.S. dollars and six other major currencies in their registered
accounts; and• We began co-locating Private Banking teams with CIBC Wood Gundy teams in select locations across the country, to deliver a more integrated offer for
high net worth clients and drive growth in this market.
Capital Markets reported net income of $371 million for the first quarter, up $127 million or 52% from the first quarter a year ago. Excluding items of note,adjusted net income(1) was $371 million, up $123 million or 50%, primarily due to higher revenue and lower loan losses, partially offset by higher expenses.Revenue growth was driven by strong equity derivatives, interest rate and commodities trading, higher equity and debt issuance activity, and higher corporatebanking revenue, partially offset by lower advisory revenue.
As a leading capital markets franchise in Canada serving clients around the world, Capital Markets acted during the first quarter of 2017 as:• Financial advisor to Shell Canada on the sale of oil and gas assets to Tourmaline Oil Corp for $1.4 billion;• Joint bookrunner on a $1 billion notes offering for PSP Capital Inc.;• Co-underwriter on $150 million in credit facilities in support of Acasta Enterprises Inc.’s qualifying acquisition of Apollo Health & Beauty Care Partnership
and Apollo Laboratories Inc., and JemPak Corporation; and• Lead manager and joint bookrunner on a $125 million Initial Public Offering for Freshii Inc.
In addition, we announced a partnership with China UnionPay International, expanding CIBC Global Money Transfer™ services to China.
Making a difference in our CommunitiesCIBC is committed to investing in the social and economic development of communities across Canada. During the quarter we:• Raised close to $23 million from CIBC Miracle Day, United Way and Movember for community organizations across Canada, U.S., U.K. and Hong Kong,
through the generosity of CIBC employees;• Committed to hiring 500 individuals with disabilities in 2017 through a partnership with Magnet; and• Installed the world’s first ski-thru ATM at the top of Whistler Mountain as part of a new partnership with Whistler-Blackcomb Ski Resort.
During the quarter, CIBC was:• Ranked second in The Globe and Mail Report on Business 2016 Board Games;• Named Financial Institution Innovator of the Year at the Canadian FinTech Awards;• Included in the 2017 Bloomberg Financial Services Gender-Equality Index;• Named one of Canada’s 10 Most Admired Corporate Cultures by Waterstone; and• Recognized as one of Canada’s Top Employers for Young People by Mediacorp.
In addition, Sandy Sharman, EVP and Chief Human Resources Officer, was named among WXN’s Top 100 Most Powerful Women in Canada.
Victor G. DodigPresident and Chief Executive Officer
(1) For additional information, see the “Non-GAAP measures” section.
ii CIBC FIRST QUARTER 2017
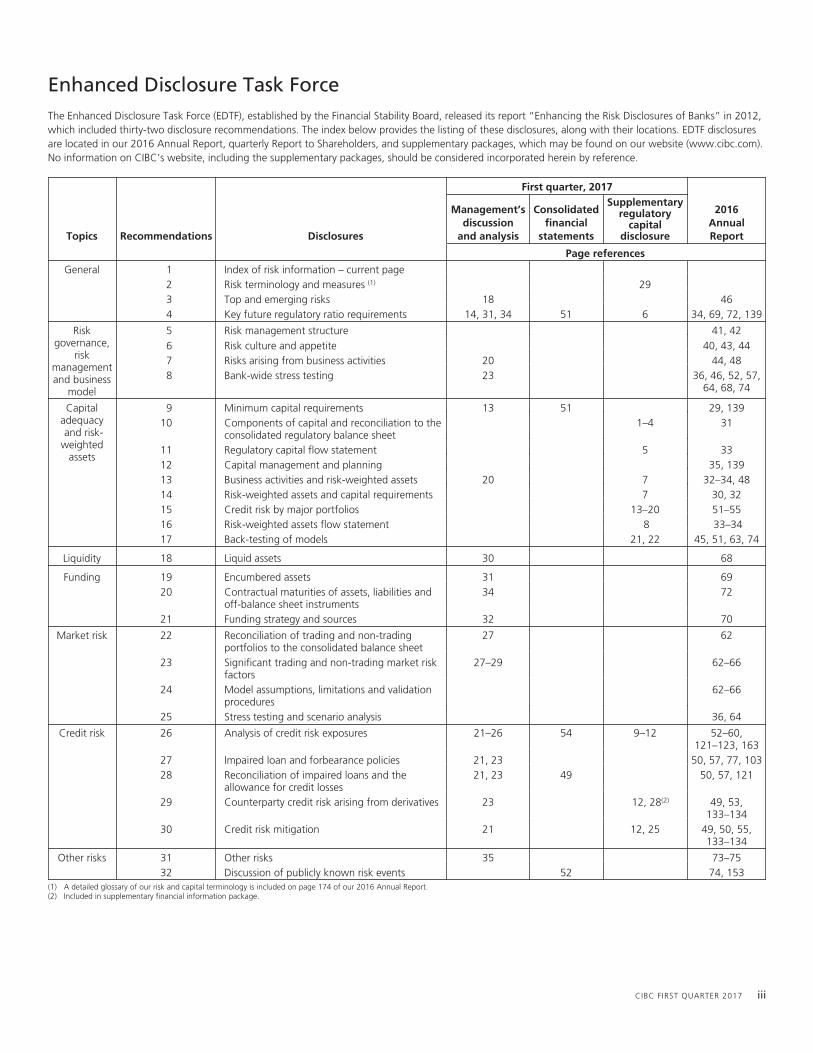
Enhanced Disclosure Task ForceThe Enhanced Disclosure Task Force (EDTF), established by the Financial Stability Board, released its report “Enhancing the Risk Disclosures of Banks” in 2012,which included thirty-two disclosure recommendations. The index below provides the listing of these disclosures, along with their locations. EDTF disclosuresare located in our 2016 Annual Report, quarterly Report to Shareholders, and supplementary packages, which may be found on our website (www.cibc.com).No information on CIBC’s website, including the supplementary packages, should be considered incorporated herein by reference.
First quarter, 2017
2016AnnualReportTopics Recommendations Disclosures
Management’sdiscussion
and analysis
Consolidatedfinancial
statements
Supplementaryregulatory
capitaldisclosure
Page references
General 1 Index of risk information – current page2 Risk terminology and measures (1) 293 Top and emerging risks 18 464 Key future regulatory ratio requirements 14, 31, 34 51 6 34, 69, 72, 139
Riskgovernance,
riskmanagementand business
model
5 Risk management structure 41, 426 Risk culture and appetite 40, 43, 447 Risks arising from business activities 20 44, 488 Bank-wide stress testing 23 36, 46, 52, 57,
64, 68, 74
Capitaladequacyand risk-
weightedassets
9 Minimum capital requirements 13 51 29, 13910 Components of capital and reconciliation to the
consolidated regulatory balance sheet1–4 31
11 Regulatory capital flow statement 5 3312 Capital management and planning 35, 13913 Business activities and risk-weighted assets 20 7 32–34, 4814 Risk-weighted assets and capital requirements 7 30, 3215 Credit risk by major portfolios 13–20 51–5516 Risk-weighted assets flow statement 8 33–3417 Back-testing of models 21, 22 45, 51, 63, 74
Liquidity 18 Liquid assets 30 68
Funding 19 Encumbered assets 31 6920 Contractual maturities of assets, liabilities and
off-balance sheet instruments34 72
21 Funding strategy and sources 32 70
Market risk 22 Reconciliation of trading and non-tradingportfolios to the consolidated balance sheet
27 62
23 Significant trading and non-trading market riskfactors
27–29 62–66
24 Model assumptions, limitations and validationprocedures
62–66
25 Stress testing and scenario analysis 36, 64
Credit risk 26 Analysis of credit risk exposures 21–26 54 9–12 52–60,121–123, 163
27 Impaired loan and forbearance policies 21, 23 50, 57, 77, 10328 Reconciliation of impaired loans and the
allowance for credit losses21, 23 49 50, 57, 121
29 Counterparty credit risk arising from derivatives 23 12, 28(2) 49, 53,133–134
30 Credit risk mitigation 21 12, 25 49, 50, 55,133–134
Other risks 31 Other risks 35 73–7532 Discussion of publicly known risk events 52 74, 153
(1) A detailed glossary of our risk and capital terminology is included on page 174 of our 2016 Annual Report.(2) Included in supplementary financial information package.
CIBC FIRST QUARTER 2017 iii

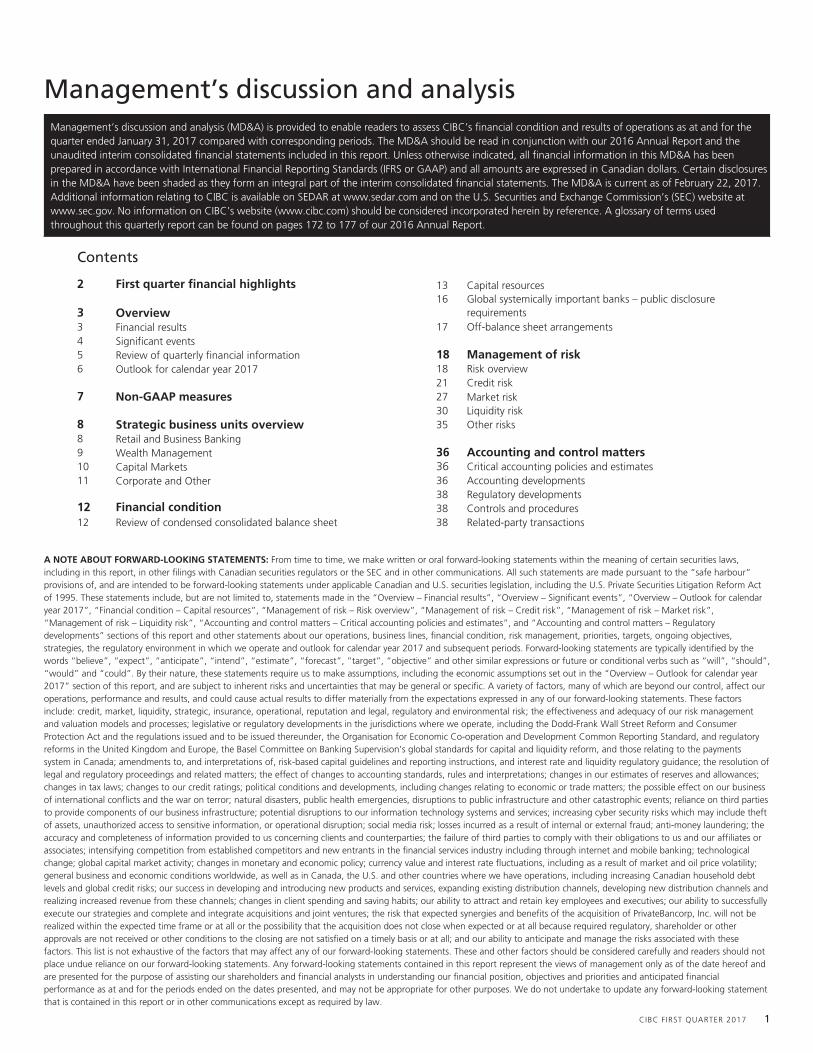
Management’s discussion and analysisManagement’s discussion and analysis (MD&A) is provided to enable readers to assess CIBC’s financial condition and results of operations as at and for thequarter ended January 31, 2017 compared with corresponding periods. The MD&A should be read in conjunction with our 2016 Annual Report and theunaudited interim consolidated financial statements included in this report. Unless otherwise indicated, all financial information in this MD&A has beenprepared in accordance with International Financial Reporting Standards (IFRS or GAAP) and all amounts are expressed in Canadian dollars. Certain disclosuresin the MD&A have been shaded as they form an integral part of the interim consolidated financial statements. The MD&A is current as of February 22, 2017.Additional information relating to CIBC is available on SEDAR at www.sedar.com and on the U.S. Securities and Exchange Commission’s (SEC) website atwww.sec.gov. No information on CIBC’s website (www.cibc.com) should be considered incorporated herein by reference. A glossary of terms usedthroughout this quarterly report can be found on pages 172 to 177 of our 2016 Annual Report.
Contents
2 First quarter financial highlights 13 Capital resources16 Global systemically important banks – public disclosure
requirements3 Overview3 Financial results 17 Off-balance sheet arrangements4 Significant events5 Review of quarterly financial information 18 Management of risk6 Outlook for calendar year 2017 18 Risk overview
21 Credit risk7 Non-GAAP measures 27 Market risk
30 Liquidity risk8 Strategic business units overview 35 Other risks8 Retail and Business Banking9 Wealth Management 36 Accounting and control matters10 Capital Markets 36 Critical accounting policies and estimates11 Corporate and Other 36 Accounting developments
38 Regulatory developments12 Financial condition 38 Controls and procedures12 Review of condensed consolidated balance sheet 38 Related-party transactions
A NOTE ABOUT FORWARD-LOOKING STATEMENTS: From time to time, we make written or oral forward-looking statements within the meaning of certain securities laws,including in this report, in other filings with Canadian securities regulators or the SEC and in other communications. All such statements are made pursuant to the “safe harbour”provisions of, and are intended to be forward-looking statements under applicable Canadian and U.S. securities legislation, including the U.S. Private Securities Litigation Reform Actof 1995. These statements include, but are not limited to, statements made in the “Overview – Financial results”, “Overview – Significant events”, “Overview – Outlook for calendaryear 2017”, “Financial condition – Capital resources”, “Management of risk – Risk overview”, “Management of risk – Credit risk”, “Management of risk – Market risk”,“Management of risk – Liquidity risk”, “Accounting and control matters – Critical accounting policies and estimates”, and “Accounting and control matters – Regulatorydevelopments” sections of this report and other statements about our operations, business lines, financial condition, risk management, priorities, targets, ongoing objectives,strategies, the regulatory environment in which we operate and outlook for calendar year 2017 and subsequent periods. Forward-looking statements are typically identified by thewords “believe”, “expect”, “anticipate”, “intend”, “estimate”, “forecast”, “target”, “objective” and other similar expressions or future or conditional verbs such as “will”, “should”,“would” and “could”. By their nature, these statements require us to make assumptions, including the economic assumptions set out in the “Overview – Outlook for calendar year2017” section of this report, and are subject to inherent risks and uncertainties that may be general or specific. A variety of factors, many of which are beyond our control, affect ouroperations, performance and results, and could cause actual results to differ materially from the expectations expressed in any of our forward-looking statements. These factorsinclude: credit, market, liquidity, strategic, insurance, operational, reputation and legal, regulatory and environmental risk; the effectiveness and adequacy of our risk managementand valuation models and processes; legislative or regulatory developments in the jurisdictions where we operate, including the Dodd-Frank Wall Street Reform and ConsumerProtection Act and the regulations issued and to be issued thereunder, the Organisation for Economic Co-operation and Development Common Reporting Standard, and regulatoryreforms in the United Kingdom and Europe, the Basel Committee on Banking Supervision’s global standards for capital and liquidity reform, and those relating to the paymentssystem in Canada; amendments to, and interpretations of, risk-based capital guidelines and reporting instructions, and interest rate and liquidity regulatory guidance; the resolution oflegal and regulatory proceedings and related matters; the effect of changes to accounting standards, rules and interpretations; changes in our estimates of reserves and allowances;changes in tax laws; changes to our credit ratings; political conditions and developments, including changes relating to economic or trade matters; the possible effect on our businessof international conflicts and the war on terror; natural disasters, public health emergencies, disruptions to public infrastructure and other catastrophic events; reliance on third partiesto provide components of our business infrastructure; potential disruptions to our information technology systems and services; increasing cyber security risks which may include theftof assets, unauthorized access to sensitive information, or operational disruption; social media risk; losses incurred as a result of internal or external fraud; anti-money laundering; theaccuracy and completeness of information provided to us concerning clients and counterparties; the failure of third parties to comply with their obligations to us and our affiliates orassociates; intensifying competition from established competitors and new entrants in the financial services industry including through internet and mobile banking; technologicalchange; global capital market activity; changes in monetary and economic policy; currency value and interest rate fluctuations, including as a result of market and oil price volatility;general business and economic conditions worldwide, as well as in Canada, the U.S. and other countries where we have operations, including increasing Canadian household debtlevels and global credit risks; our success in developing and introducing new products and services, expanding existing distribution channels, developing new distribution channels andrealizing increased revenue from these channels; changes in client spending and saving habits; our ability to attract and retain key employees and executives; our ability to successfullyexecute our strategies and complete and integrate acquisitions and joint ventures; the risk that expected synergies and benefits of the acquisition of PrivateBancorp, Inc. will not berealized within the expected time frame or at all or the possibility that the acquisition does not close when expected or at all because required regulatory, shareholder or otherapprovals are not received or other conditions to the closing are not satisfied on a timely basis or at all; and our ability to anticipate and manage the risks associated with thesefactors. This list is not exhaustive of the factors that may affect any of our forward-looking statements. These and other factors should be considered carefully and readers should notplace undue reliance on our forward-looking statements. Any forward-looking statements contained in this report represent the views of management only as of the date hereof andare presented for the purpose of assisting our shareholders and financial analysts in understanding our financial position, objectives and priorities and anticipated financialperformance as at and for the periods ended on the dates presented, and may not be appropriate for other purposes. We do not undertake to update any forward-looking statementthat is contained in this report or in other communications except as required by law.
CIBC FIRST QUARTER 2017 1
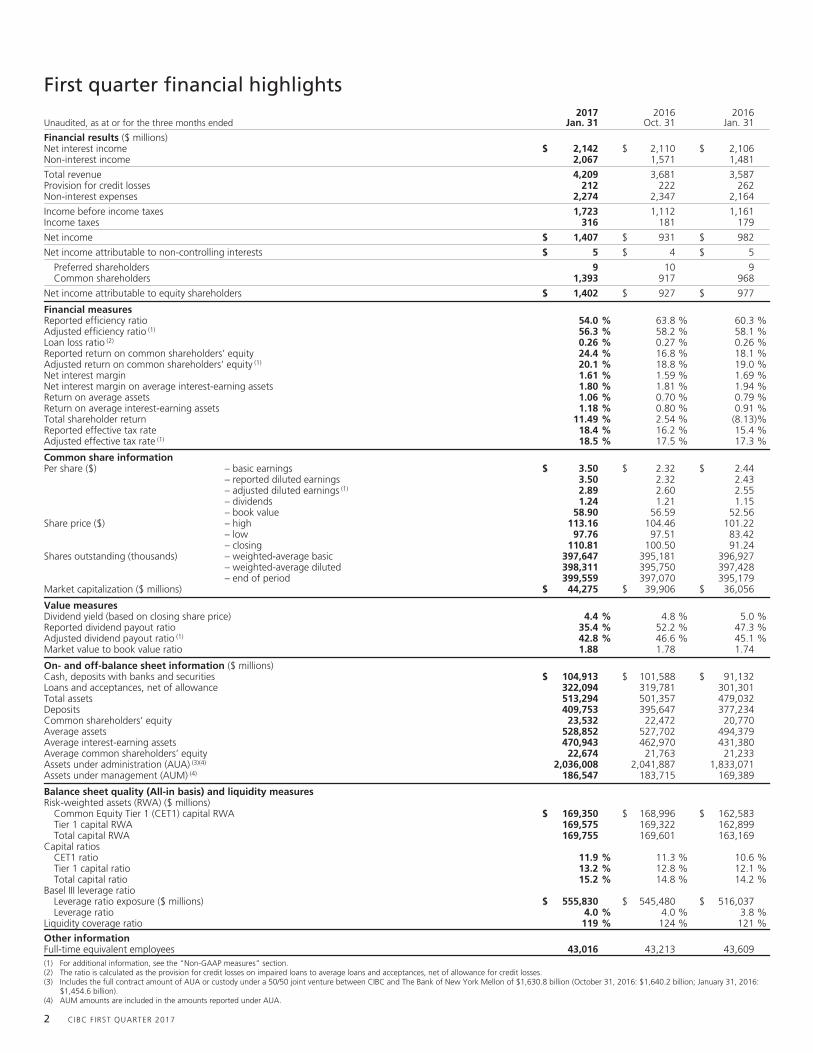
First quarter financial highlights
Unaudited, as at or for the three months ended2017
Jan. 312016
Oct. 312016
Jan. 31
Financial results ($ millions)Net interest income $ 2,142 $ 2,110 $ 2,106Non-interest income 2,067 1,571 1,481
Total revenue 4,209 3,681 3,587Provision for credit losses 212 222 262Non-interest expenses 2,274 2,347 2,164
Income before income taxes 1,723 1,112 1,161Income taxes 316 181 179
Net income $ 1,407 $ 931 $ 982
Net income attributable to non-controlling interests $ 5 $ 4 $ 5
Preferred shareholders 9 10 9Common shareholders 1,393 917 968
Net income attributable to equity shareholders $ 1,402 $ 927 $ 977
Financial measuresReported efficiency ratio 54.0 % 63.8 % 60.3 %Adjusted efficiency ratio (1) 56.3 % 58.2 % 58.1 %Loan loss ratio (2) 0.26 % 0.27 % 0.26 %Reported return on common shareholders’ equity 24.4 % 16.8 % 18.1 %Adjusted return on common shareholders’ equity (1) 20.1 % 18.8 % 19.0 %Net interest margin 1.61 % 1.59 % 1.69 %Net interest margin on average interest-earning assets 1.80 % 1.81 % 1.94 %Return on average assets 1.06 % 0.70 % 0.79 %Return on average interest-earning assets 1.18 % 0.80 % 0.91 %Total shareholder return 11.49 % 2.54 % (8.13)%Reported effective tax rate 18.4 % 16.2 % 15.4 %Adjusted effective tax rate (1) 18.5 % 17.5 % 17.3 %
Common share informationPer share ($) – basic earnings $ 3.50 $ 2.32 $ 2.44
– reported diluted earnings 3.50 2.32 2.43– adjusted diluted earnings (1) 2.89 2.60 2.55– dividends 1.24 1.21 1.15– book value 58.90 56.59 52.56
Share price ($) – high 113.16 104.46 101.22– low 97.76 97.51 83.42– closing 110.81 100.50 91.24
Shares outstanding (thousands) – weighted-average basic 397,647 395,181 396,927– weighted-average diluted 398,311 395,750 397,428– end of period 399,559 397,070 395,179
Market capitalization ($ millions) $ 44,275 $ 39,906 $ 36,056
Value measuresDividend yield (based on closing share price) 4.4 % 4.8 % 5.0 %Reported dividend payout ratio 35.4 % 52.2 % 47.3 %Adjusted dividend payout ratio (1) 42.8 % 46.6 % 45.1 %Market value to book value ratio 1.88 1.78 1.74
On- and off-balance sheet information ($ millions)Cash, deposits with banks and securities $ 104,913 $ 101,588 $ 91,132Loans and acceptances, net of allowance 322,094 319,781 301,301Total assets 513,294 501,357 479,032Deposits 409,753 395,647 377,234Common shareholders’ equity 23,532 22,472 20,770Average assets 528,852 527,702 494,379Average interest-earning assets 470,943 462,970 431,380Average common shareholders’ equity 22,674 21,763 21,233Assets under administration (AUA) (3)(4) 2,036,008 2,041,887 1,833,071Assets under management (AUM) (4) 186,547 183,715 169,389
Balance sheet quality (All-in basis) and liquidity measuresRisk-weighted assets (RWA) ($ millions)
Common Equity Tier 1 (CET1) capital RWA $ 169,350 $ 168,996 $ 162,583Tier 1 capital RWA 169,575 169,322 162,899Total capital RWA 169,755 169,601 163,169
Capital ratiosCET1 ratio 11.9 % 11.3 % 10.6 %Tier 1 capital ratio 13.2 % 12.8 % 12.1 %Total capital ratio 15.2 % 14.8 % 14.2 %
Basel III leverage ratioLeverage ratio exposure ($ millions) $ 555,830 $ 545,480 $ 516,037Leverage ratio 4.0 % 4.0 % 3.8 %
Liquidity coverage ratio 119 % 124 % 121 %
Other informationFull-time equivalent employees 43,016 43,213 43,609(1) For additional information, see the “Non-GAAP measures” section.(2) The ratio is calculated as the provision for credit losses on impaired loans to average loans and acceptances, net of allowance for credit losses.(3) Includes the full contract amount of AUA or custody under a 50/50 joint venture between CIBC and The Bank of New York Mellon of $1,630.8 billion (October 31, 2016: $1,640.2 billion; January 31, 2016:
$1,454.6 billion).(4) AUM amounts are included in the amounts reported under AUA.
2 CIBC FIRST QUARTER 2017
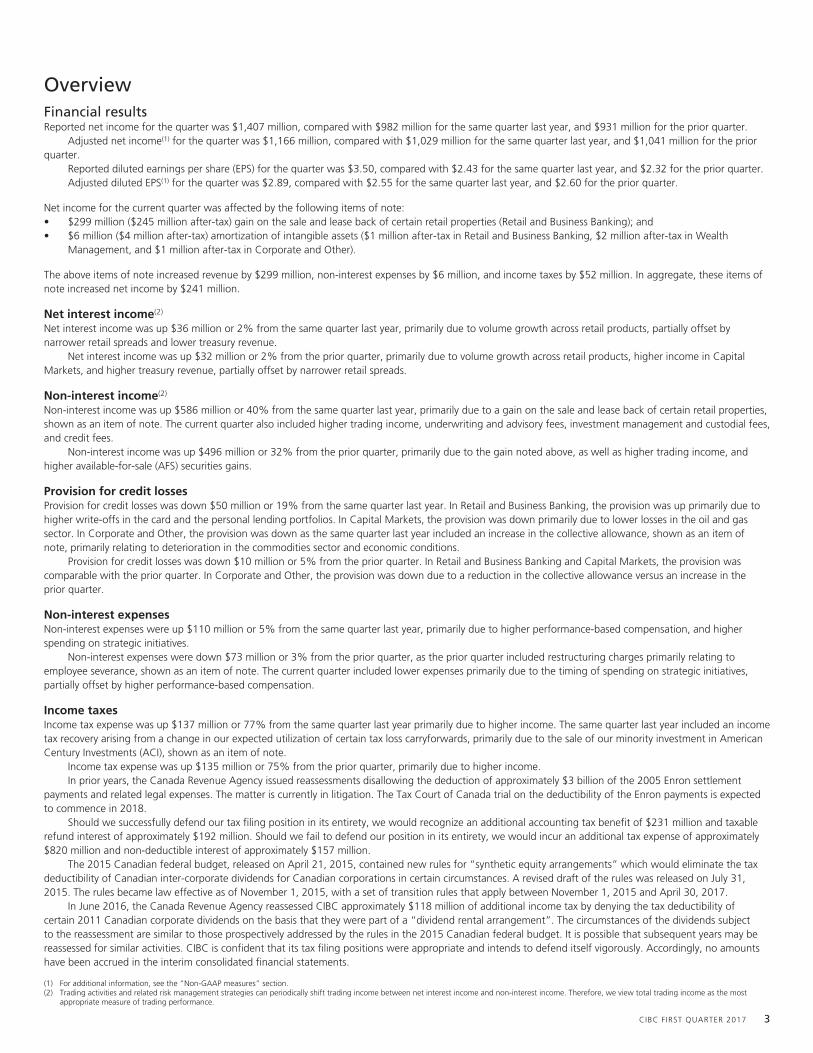
OverviewFinancial resultsReported net income for the quarter was $1,407 million, compared with $982 million for the same quarter last year, and $931 million for the prior quarter.
Adjusted net income(1) for the quarter was $1,166 million, compared with $1,029 million for the same quarter last year, and $1,041 million for the priorquarter.
Reported diluted earnings per share (EPS) for the quarter was $3.50, compared with $2.43 for the same quarter last year, and $2.32 for the prior quarter.Adjusted diluted EPS(1) for the quarter was $2.89, compared with $2.55 for the same quarter last year, and $2.60 for the prior quarter.
Net income for the current quarter was affected by the following items of note:• $299 million ($245 million after-tax) gain on the sale and lease back of certain retail properties (Retail and Business Banking); and• $6 million ($4 million after-tax) amortization of intangible assets ($1 million after-tax in Retail and Business Banking, $2 million after-tax in Wealth
Management, and $1 million after-tax in Corporate and Other).
The above items of note increased revenue by $299 million, non-interest expenses by $6 million, and income taxes by $52 million. In aggregate, these items ofnote increased net income by $241 million.
Net interest income(2)
Net interest income was up $36 million or 2% from the same quarter last year, primarily due to volume growth across retail products, partially offset bynarrower retail spreads and lower treasury revenue.
Net interest income was up $32 million or 2% from the prior quarter, primarily due to volume growth across retail products, higher income in CapitalMarkets, and higher treasury revenue, partially offset by narrower retail spreads.
Non-interest income(2)
Non-interest income was up $586 million or 40% from the same quarter last year, primarily due to a gain on the sale and lease back of certain retail properties,shown as an item of note. The current quarter also included higher trading income, underwriting and advisory fees, investment management and custodial fees,and credit fees.
Non-interest income was up $496 million or 32% from the prior quarter, primarily due to the gain noted above, as well as higher trading income, andhigher available-for-sale (AFS) securities gains.
Provision for credit lossesProvision for credit losses was down $50 million or 19% from the same quarter last year. In Retail and Business Banking, the provision was up primarily due tohigher write-offs in the card and the personal lending portfolios. In Capital Markets, the provision was down primarily due to lower losses in the oil and gassector. In Corporate and Other, the provision was down as the same quarter last year included an increase in the collective allowance, shown as an item ofnote, primarily relating to deterioration in the commodities sector and economic conditions.
Provision for credit losses was down $10 million or 5% from the prior quarter. In Retail and Business Banking and Capital Markets, the provision wascomparable with the prior quarter. In Corporate and Other, the provision was down due to a reduction in the collective allowance versus an increase in theprior quarter.
Non-interest expensesNon-interest expenses were up $110 million or 5% from the same quarter last year, primarily due to higher performance-based compensation, and higherspending on strategic initiatives.
Non-interest expenses were down $73 million or 3% from the prior quarter, as the prior quarter included restructuring charges primarily relating toemployee severance, shown as an item of note. The current quarter included lower expenses primarily due to the timing of spending on strategic initiatives,partially offset by higher performance-based compensation.
Income taxesIncome tax expense was up $137 million or 77% from the same quarter last year primarily due to higher income. The same quarter last year included an incometax recovery arising from a change in our expected utilization of certain tax loss carryforwards, primarily due to the sale of our minority investment in AmericanCentury Investments (ACI), shown as an item of note.
Income tax expense was up $135 million or 75% from the prior quarter, primarily due to higher income.In prior years, the Canada Revenue Agency issued reassessments disallowing the deduction of approximately $3 billion of the 2005 Enron settlement
payments and related legal expenses. The matter is currently in litigation. The Tax Court of Canada trial on the deductibility of the Enron payments is expectedto commence in 2018.
Should we successfully defend our tax filing position in its entirety, we would recognize an additional accounting tax benefit of $231 million and taxablerefund interest of approximately $192 million. Should we fail to defend our position in its entirety, we would incur an additional tax expense of approximately$820 million and non-deductible interest of approximately $157 million.
The 2015 Canadian federal budget, released on April 21, 2015, contained new rules for “synthetic equity arrangements” which would eliminate the taxdeductibility of Canadian inter-corporate dividends for Canadian corporations in certain circumstances. A revised draft of the rules was released on July 31,2015. The rules became law effective as of November 1, 2015, with a set of transition rules that apply between November 1, 2015 and April 30, 2017.
In June 2016, the Canada Revenue Agency reassessed CIBC approximately $118 million of additional income tax by denying the tax deductibility ofcertain 2011 Canadian corporate dividends on the basis that they were part of a “dividend rental arrangement”. The circumstances of the dividends subjectto the reassessment are similar to those prospectively addressed by the rules in the 2015 Canadian federal budget. It is possible that subsequent years may bereassessed for similar activities. CIBC is confident that its tax filing positions were appropriate and intends to defend itself vigorously. Accordingly, no amountshave been accrued in the interim consolidated financial statements.
(1) For additional information, see the “Non-GAAP measures” section.(2) Trading activities and related risk management strategies can periodically shift trading income between net interest income and non-interest income. Therefore, we view total trading income as the most
appropriate measure of trading performance.
CIBC FIRST QUARTER 2017 3

Foreign exchangeThe estimated impact of U.S. dollar translation on key lines of our interim consolidated statement of income, as a result of changes in average exchange rates, isas follows:
$ millions, except per share amounts, for the three months ended
Jan. 31, 2017vs.
Jan. 31, 2016
Jan. 31, 2017vs.
Oct. 31, 2016
Estimated increase (decrease) in:Total revenue $ (19) $ 3Provision for credit losses (1) –Non-interest expenses (10) 2Income taxes – –Net income (8) 1
Impact on EPS:Basic $ (0.02) $ –Diluted (0.02) –
Average USD appreciation (depreciation) relative to CAD (3.2) % 0.6 %
Impact of items of note in prior periodsNet income for the prior quarters was affected by the following items of note:
Q4, 2016• $134 million ($98 million after-tax) in restructuring charges primarily relating to employee severance (Corporate and Other);• $9 million ($7 million after-tax) loss from the structured credit run-off business (Capital Markets); and• $7 million ($5 million after-tax) amortization of intangible assets ($1 million after-tax in Retail and Business Banking, $1 million after-tax in Wealth
Management, and $3 million after-tax in Corporate and Other).
The above items of note decreased revenue by $3 million, increased non-interest expenses by $147 million, and decreased income taxes by $40 million. Inaggregate, these items of note decreased net income by $110 million.
Q1, 2016• $69 million ($51 million after-tax) increase in the portion of the collective allowance recognized in Corporate and Other(1);• $15 million income tax recovery arising from a change in our expected utilization of certain tax loss carryforwards, primarily due to the sale of our minority
investment in ACI (Corporate and Other);• $9 million ($7 million after-tax) amortization of intangible assets ($2 million after-tax in Retail and Business Banking, $3 million after-tax in Wealth
Management, and $2 million after-tax in Corporate and Other); and• $5 million ($4 million after-tax) loss from the structured credit run-off business (Capital Markets).
The above items of note decreased revenue by $4 million, increased provision for credit losses by $69 million and non-interest expenses by $10 million, anddecreased income taxes by $36 million. In aggregate, these items of note decreased net income by $47 million.
(1) Relates to collective allowance, except for: (i) residential mortgages greater than 90 days delinquent; (ii) personal loans and scored small business loans greater than 30 days delinquent, and (iii) net write-offsfor the card portfolio, which are all reported in the respective strategic business units (SBUs).
Significant eventsSale and lease back of certain retail propertiesDuring the quarter, we sold and leased back 89 retail properties located mainly in Ontario and British Columbia, and recognized a gain of $299 million($245 million after-tax) in our Retail and Business Banking SBU.
Acquisition of PrivateBancorp, Inc.On June 29, 2016, we announced that we had entered into a definitive agreement to acquire PrivateBancorp, Inc. (PrivateBancorp) and its subsidiary, ThePrivateBank and Trust Company (PrivateBank). PrivateBank is a Chicago-based middle-market commercial bank with private banking and wealth managementcapabilities.
Under the terms of the agreement, CIBC will pay US$18.80 in cash and 0.3657 of a CIBC common share for each share of PrivateBancorp common stock.Based on the June 28, 2016 closing price of CIBC’s common shares on the New York Stock Exchange (US$77.11), the total transaction value is approximatelyUS$3.8 billion (C$4.9 billion) or US$47.00 of value per share of PrivateBancorp common stock at announcement. The transaction is subject to customary closingconditions, including regulatory approvals and the approval of PrivateBancorp’s common stockholders. The special meeting of PrivateBancorp’s commonstockholders originally scheduled for December 8, 2016 was postponed by the PrivateBancorp Board of Directors on December 7, 2016 and has not yet beenrescheduled. Both parties continue to work to secure all required regulatory approvals as well as to continue development of detailed integration plans.
4 CIBC FIRST QUARTER 2017

Review of quarterly financial information
$ millions, except per share amounts,for the three months ended 2017 2016 2015
Jan. 31 Oct. 31 Jul. 31 Apr. 30 Jan. 31 Oct. 31 Jul. 31 Apr. 30
RevenueRetail and Business Banking $ 2,596 $ 2,290 $ 2,225 $ 2,150 $ 2,190 $ 2,176 $ 2,118 $ 2,029Wealth Management 653 620 1,035 583 601 607 628 614Capital Markets (1) 877 673 809 750 683 571 691 657Corporate and Other (1) 83 98 67 148 113 129 83 94
Total revenue $ 4,209 $ 3,681 $ 4,136 $ 3,631 $ 3,587 $ 3,483 $ 3,520 $ 3,394
Net interest income $ 2,142 $ 2,110 $ 2,113 $ 2,037 $ 2,106 $ 2,043 $ 2,021 $ 1,895Non-interest income 2,067 1,571 2,023 1,594 1,481 1,440 1,499 1,499
Total revenue 4,209 3,681 4,136 3,631 3,587 3,483 3,520 3,394Provision for credit losses 212 222 243 324 262 198 189 197Non-interest expenses 2,274 2,347 2,218 2,242 2,164 2,383 2,179 2,104
Income before income taxes 1,723 1,112 1,675 1,065 1,161 902 1,152 1,093Income taxes 316 181 234 124 179 124 174 182
Net income $ 1,407 $ 931 $ 1,441 $ 941 $ 982 $ 778 $ 978 $ 911
Net income attributable to:Non-controlling interests $ 5 $ 4 $ 6 $ 5 $ 5 $ 2 $ 5 $ 4Equity shareholders 1,402 927 1,435 936 977 776 973 907
EPS – basic $ 3.50 $ 2.32 $ 3.61 $ 2.35 $ 2.44 $ 1.93 $ 2.42 $ 2.25– diluted 3.50 2.32 3.61 2.35 2.43 1.93 2.42 2.25
(1) Capital Markets revenue and income taxes are reported on a taxable equivalent basis (TEB) with an equivalent offset in the revenue and income taxes of Corporate and Other.
Our quarterly results are modestly affected by seasonal factors. The second quarter has fewer days as compared with the other quarters, generally leading tolower earnings. The summer months (July – third quarter and August – fourth quarter) typically experience lower levels of market activity, which affects ourbrokerage, investment management, and Capital Markets activities.
RevenueRetail and Business Banking revenue has benefited from volume growth, partially offset by the continued low interest rate environment, and attrition in ourexited FirstLine mortgage broker business. The first quarter of 2017 included a gain on the sale and lease back of certain retail properties.
In Wealth Management, we recognized a gain, net of related transaction costs, on the sale of our minority investment in ACI in the third quarter of 2016.We ceased recognition of income from equity-accounted associates relating to ACI following the announcement of the sale in the first quarter of 2016.
Capital Markets revenue is influenced, to a large extent, by market conditions and activity in the equity derivatives business, which includes tax-exemptincome. The third quarter of 2016 included a gain from the structured credit run-off business.
Corporate and Other includes the offset related to the TEB component of tax-exempt income reported in Capital Markets revenue. The second quarter of2016 included a gain on sale of a processing centre.
Provision for credit lossesProvision for credit losses is dependent upon the credit cycle in general and on the credit performance of the loan portfolios. In Retail and Business Banking,losses in the card and personal lending portfolios trended higher after the first quarter of 2016. In Capital Markets, losses in the oil and gas sector were elevatedin the fourth quarter of 2015 and the first half of 2016. The third quarter of 2016 had higher losses in our exited European leveraged finance portfolio. InCorporate and Other, the first two quarters of 2016 included increases in the collective allowance, primarily relating to deterioration in the commodities sectorand economic conditions.
Non-interest expensesNon-interest expenses have fluctuated over the period largely due to changes in employee-related compensation and benefits, higher spending on strategicinitiatives, and movement in foreign exchange rates. The fourth quarters of 2016 and 2015 included restructuring charges primarily relating to employeeseverance. The second quarter of 2016 included legal provisions in Corporate and Other.
Income taxesIncome taxes vary with changes in income subject to tax, and the jurisdictions in which the income is earned. Taxes can also be affected by the impact ofsignificant items and the level of tax-exempt income. The second quarter of 2016 included an income tax recovery due to the settlement of transfer pricing-related matters. The first quarter of 2016 included an income tax recovery arising from a change in our expected utilization of certain tax loss carryforwards,primarily due to the sale of our minority investment in ACI.
CIBC FIRST QUARTER 2017 5

Outlook for calendar year 2017Global growth in gross domestic product in 2017 is expected to be marginally better than the moderate pace seen in 2016. Emerging markets should see somesupport from earlier interest rate cuts. The U.S. should improve to a growth rate slightly above 2%, driven by consumer spending and housing, while Europeshould be steady with growth in the 1.5% range, as diminished fiscal tightening should help offset the impact of political uncertainties. The U.S. FederalReserve could raise rates over the course of the year, but the federal funds rate will remain very low by historical standards. Canada’s economic growth rateshould accelerate from 2016 while remaining below 2%. A diminished drag from declines in energy capital spending and additions to governmentinfrastructure spending should counter a reduced growth contribution from housing. Canada’s 2017 growth could be impacted if the U.S. pursues aprotectionist policy that extends to Canadian exports. Canadian interest rates should remain stable while the Canadian dollar sheds some of the gains seenduring the prior year.
In Retail and Business Banking, we could see a more moderate expansion of consumer credit due to steps taken by the government to slow priceappreciation in the housing market. Business credit demand should remain healthy, given very low interest rates and somewhat faster economic growth.
An improving environment for corporate profits and low interest rates should support equity-related business in Capital Markets and Wealth Management,and Capital Markets should see continued strength in the issuance of government debt tied to accelerating infrastructure spending.
Credit quality should remain healthy overall, with somewhat firmer oil prices diminishing risks in the energy sector.
6 CIBC FIRST QUARTER 2017
Non-GAAP measures
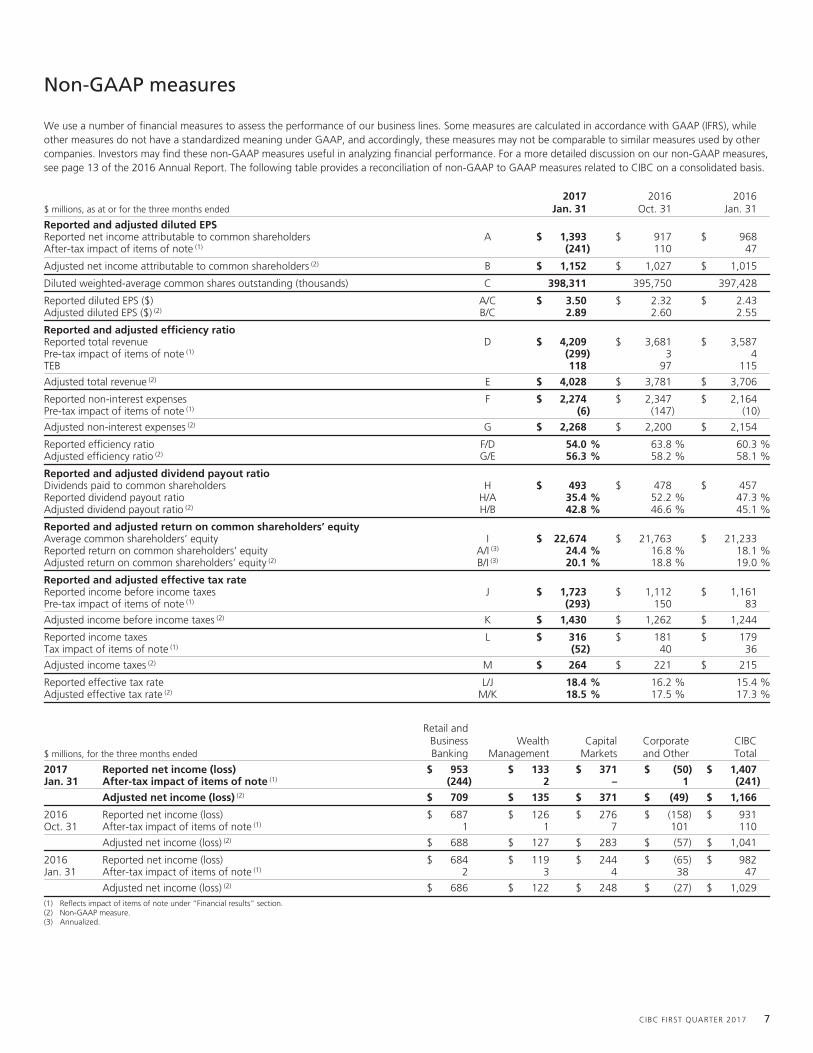
We use a number of financial measures to assess the performance of our business lines. Some measures are calculated in accordance with GAAP (IFRS), whileother measures do not have a standardized meaning under GAAP, and accordingly, these measures may not be comparable to similar measures used by othercompanies. Investors may find these non-GAAP measures useful in analyzing financial performance. For a more detailed discussion on our non-GAAP measures,see page 13 of the 2016 Annual Report. The following table provides a reconciliation of non-GAAP to GAAP measures related to CIBC on a consolidated basis.
$ millions, as at or for the three months ended2017
Jan. 312016
Oct. 312016
Jan. 31
Reported and adjusted diluted EPSReported net income attributable to common shareholders A $ 1,393 $ 917 $ 968After-tax impact of items of note (1) (241) 110 47
Adjusted net income attributable to common shareholders (2) B $ 1,152 $ 1,027 $ 1,015
Diluted weighted-average common shares outstanding (thousands) C 398,311 395,750 397,428
Reported diluted EPS ($) A/C $ 3.50 $ 2.32 $ 2.43Adjusted diluted EPS ($) (2) B/C 2.89 2.60 2.55
Reported and adjusted efficiency ratioReported total revenue D $ 4,209 $ 3,681 $ 3,587Pre-tax impact of items of note (1) (299) 3 4TEB 118 97 115
Adjusted total revenue (2) E $ 4,028 $ 3,781 $ 3,706
Reported non-interest expenses F $ 2,274 $ 2,347 $ 2,164Pre-tax impact of items of note (1) (6) (147) (10)
Adjusted non-interest expenses (2) G $ 2,268 $ 2,200 $ 2,154
Reported efficiency ratio F/D 54.0 % 63.8 % 60.3 %Adjusted efficiency ratio (2) G/E 56.3 % 58.2 % 58.1 %
Reported and adjusted dividend payout ratioDividends paid to common shareholders H $ 493 $ 478 $ 457Reported dividend payout ratio H/A 35.4 % 52.2 % 47.3 %Adjusted dividend payout ratio (2) H/B 42.8 % 46.6 % 45.1 %
Reported and adjusted return on common shareholders’ equityAverage common shareholders’ equity I $ 22,674 $ 21,763 $ 21,233Reported return on common shareholders’ equity A/I (3) 24.4 % 16.8 % 18.1 %Adjusted return on common shareholders’ equity (2) B/I (3) 20.1 % 18.8 % 19.0 %
Reported and adjusted effective tax rateReported income before income taxes J $ 1,723 $ 1,112 $ 1,161Pre-tax impact of items of note (1) (293) 150 83
Adjusted income before income taxes (2) K $ 1,430 $ 1,262 $ 1,244
Reported income taxes L $ 316 $ 181 $ 179Tax impact of items of note (1) (52) 40 36
Adjusted income taxes (2) M $ 264 $ 221 $ 215
Reported effective tax rate L/J 18.4 % 16.2 % 15.4 %Adjusted effective tax rate (2) M/K 18.5 % 17.5 % 17.3 %
$ millions, for the three months ended
Retail andBusinessBanking
WealthManagement
CapitalMarkets
Corporateand Other
CIBCTotal
2017 Reported net income (loss) $ 953 $ 133 $ 371 $ (50) $ 1,407Jan. 31 After-tax impact of items of note (1) (244) 2 – 1 (241)
Adjusted net income (loss) (2) $ 709 $ 135 $ 371 $ (49) $ 1,166
2016 Reported net income (loss) $ 687 $ 126 $ 276 $ (158) $ 931Oct. 31 After-tax impact of items of note (1) 1 1 7 101 110
Adjusted net income (loss) (2) $ 688 $ 127 $ 283 $ (57) $ 1,041
2016 Reported net income (loss) $ 684 $ 119 $ 244 $ (65) $ 982Jan. 31 After-tax impact of items of note (1) 2 3 4 38 47
Adjusted net income (loss) (2) $ 686 $ 122 $ 248 $ (27) $ 1,029(1) Reflects impact of items of note under “Financial results” section.(2) Non-GAAP measure.(3) Annualized.
CIBC FIRST QUARTER 2017 7
Strategic business units overview
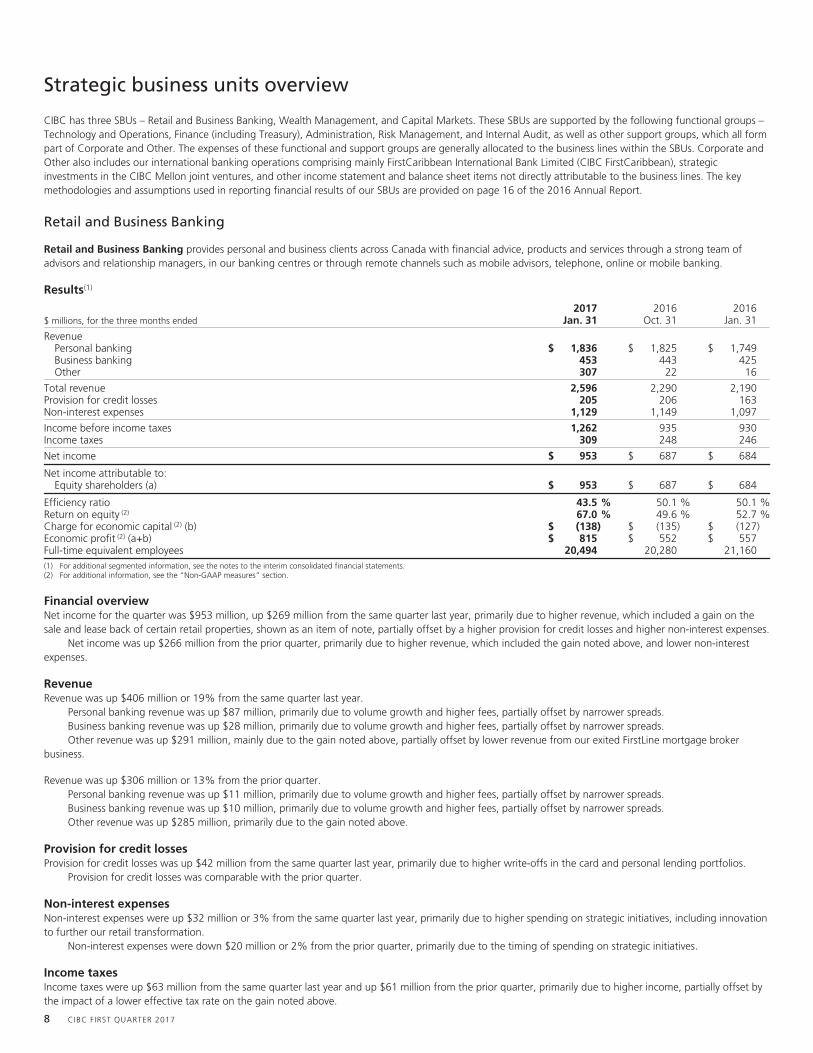
CIBC has three SBUs – Retail and Business Banking, Wealth Management, and Capital Markets. These SBUs are supported by the following functional groups –Technology and Operations, Finance (including Treasury), Administration, Risk Management, and Internal Audit, as well as other support groups, which all formpart of Corporate and Other. The expenses of these functional and support groups are generally allocated to the business lines within the SBUs. Corporate andOther also includes our international banking operations comprising mainly FirstCaribbean International Bank Limited (CIBC FirstCaribbean), strategicinvestments in the CIBC Mellon joint ventures, and other income statement and balance sheet items not directly attributable to the business lines. The keymethodologies and assumptions used in reporting financial results of our SBUs are provided on page 16 of the 2016 Annual Report.
Retail and Business Banking
Retail and Business Banking provides personal and business clients across Canada with financial advice, products and services through a strong team ofadvisors and relationship managers, in our banking centres or through remote channels such as mobile advisors, telephone, online or mobile banking.
Results(1)
$ millions, for the three months ended2017
Jan. 312016
Oct. 312016
Jan. 31
RevenuePersonal banking $ 1,836 $ 1,825 $ 1,749Business banking 453 443 425Other 307 22 16
Total revenue 2,596 2,290 2,190Provision for credit losses 205 206 163Non-interest expenses 1,129 1,149 1,097
Income before income taxes 1,262 935 930Income taxes 309 248 246
Net income $ 953 $ 687 $ 684
Net income attributable to:Equity shareholders (a) $ 953 $ 687 $ 684
Efficiency ratio 43.5 % 50.1 % 50.1 %Return on equity (2) 67.0 % 49.6 % 52.7 %Charge for economic capital (2) (b) $ (138) $ (135) $ (127)Economic profit (2) (a+b) $ 815 $ 552 $ 557Full-time equivalent employees 20,494 20,280 21,160(1) For additional segmented information, see the notes to the interim consolidated financial statements.(2) For additional information, see the “Non-GAAP measures” section.
Financial overviewNet income for the quarter was $953 million, up $269 million from the same quarter last year, primarily due to higher revenue, which included a gain on thesale and lease back of certain retail properties, shown as an item of note, partially offset by a higher provision for credit losses and higher non-interest expenses.
Net income was up $266 million from the prior quarter, primarily due to higher revenue, which included the gain noted above, and lower non-interestexpenses.
RevenueRevenue was up $406 million or 19% from the same quarter last year.
Personal banking revenue was up $87 million, primarily due to volume growth and higher fees, partially offset by narrower spreads.Business banking revenue was up $28 million, primarily due to volume growth and higher fees, partially offset by narrower spreads.Other revenue was up $291 million, mainly due to the gain noted above, partially offset by lower revenue from our exited FirstLine mortgage broker
business.
Revenue was up $306 million or 13% from the prior quarter.Personal banking revenue was up $11 million, primarily due to volume growth and higher fees, partially offset by narrower spreads.Business banking revenue was up $10 million, primarily due to volume growth and higher fees, partially offset by narrower spreads.Other revenue was up $285 million, primarily due to the gain noted above.
Provision for credit lossesProvision for credit losses was up $42 million from the same quarter last year, primarily due to higher write-offs in the card and personal lending portfolios.
Provision for credit losses was comparable with the prior quarter.
Non-interest expensesNon-interest expenses were up $32 million or 3% from the same quarter last year, primarily due to higher spending on strategic initiatives, including innovationto further our retail transformation.
Non-interest expenses were down $20 million or 2% from the prior quarter, primarily due to the timing of spending on strategic initiatives.
Income taxesIncome taxes were up $63 million from the same quarter last year and up $61 million from the prior quarter, primarily due to higher income, partially offset bythe impact of a lower effective tax rate on the gain noted above.
8 CIBC FIRST QUARTER 2017
Wealth Management
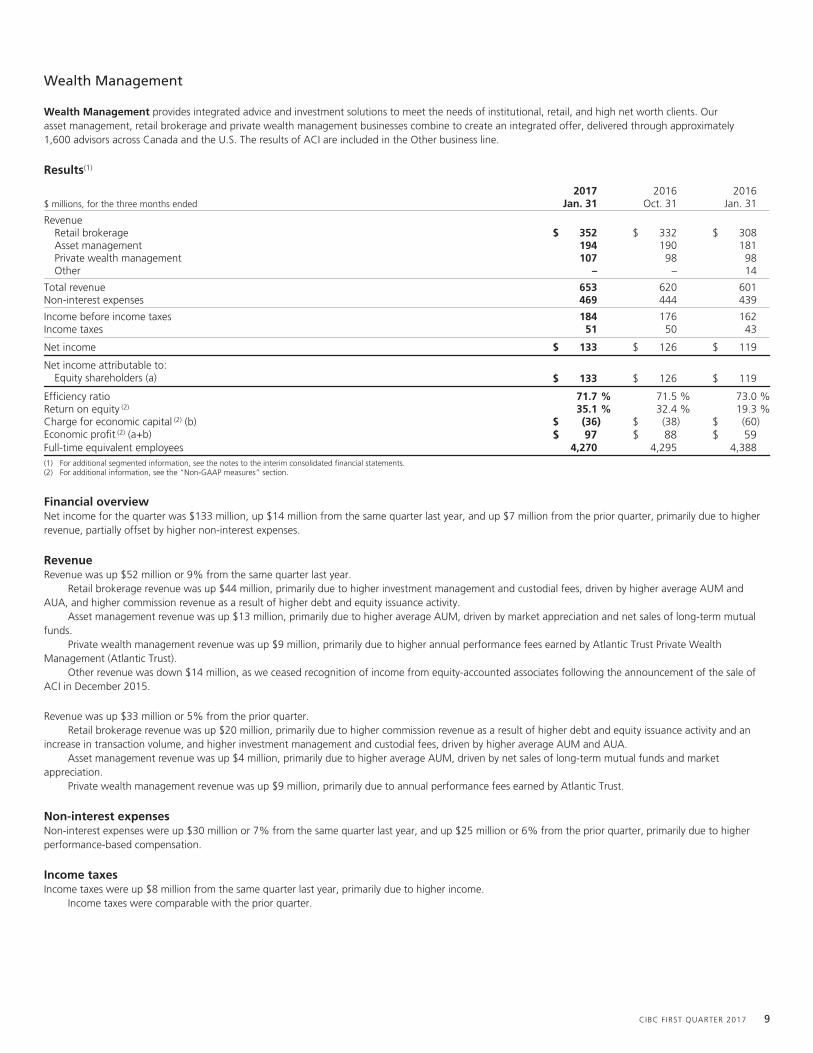
Wealth Management provides integrated advice and investment solutions to meet the needs of institutional, retail, and high net worth clients. Ourasset management, retail brokerage and private wealth management businesses combine to create an integrated offer, delivered through approximately1,600 advisors across Canada and the U.S. The results of ACI are included in the Other business line.
Results(1)
$ millions, for the three months ended2017
Jan. 312016
Oct. 312016
Jan. 31
RevenueRetail brokerage $ 352 $ 332 $ 308Asset management 194 190 181Private wealth management 107 98 98Other – – 14
Total revenue 653 620 601Non-interest expenses 469 444 439
Income before income taxes 184 176 162Income taxes 51 50 43
Net income $ 133 $ 126 $ 119
Net income attributable to:Equity shareholders (a) $ 133 $ 126 $ 119
Efficiency ratio 71.7 % 71.5 % 73.0 %Return on equity (2) 35.1 % 32.4 % 19.3 %Charge for economic capital (2) (b) $ (36) $ (38) $ (60)Economic profit (2) (a+b) $ 97 $ 88 $ 59Full-time equivalent employees 4,270 4,295 4,388(1) For additional segmented information, see the notes to the interim consolidated financial statements.(2) For additional information, see the “Non-GAAP measures” section.
Financial overviewNet income for the quarter was $133 million, up $14 million from the same quarter last year, and up $7 million from the prior quarter, primarily due to higherrevenue, partially offset by higher non-interest expenses.
RevenueRevenue was up $52 million or 9% from the same quarter last year.
Retail brokerage revenue was up $44 million, primarily due to higher investment management and custodial fees, driven by higher average AUM andAUA, and higher commission revenue as a result of higher debt and equity issuance activity.
Asset management revenue was up $13 million, primarily due to higher average AUM, driven by market appreciation and net sales of long-term mutualfunds.
Private wealth management revenue was up $9 million, primarily due to higher annual performance fees earned by Atlantic Trust Private WealthManagement (Atlantic Trust).
Other revenue was down $14 million, as we ceased recognition of income from equity-accounted associates following the announcement of the sale ofACI in December 2015.
Revenue was up $33 million or 5% from the prior quarter.Retail brokerage revenue was up $20 million, primarily due to higher commission revenue as a result of higher debt and equity issuance activity and an
increase in transaction volume, and higher investment management and custodial fees, driven by higher average AUM and AUA.Asset management revenue was up $4 million, primarily due to higher average AUM, driven by net sales of long-term mutual funds and market
appreciation.Private wealth management revenue was up $9 million, primarily due to annual performance fees earned by Atlantic Trust.
Non-interest expensesNon-interest expenses were up $30 million or 7% from the same quarter last year, and up $25 million or 6% from the prior quarter, primarily due to higherperformance-based compensation.
Income taxesIncome taxes were up $8 million from the same quarter last year, primarily due to higher income.
Income taxes were comparable with the prior quarter.
CIBC FIRST QUARTER 2017 9
Capital Markets
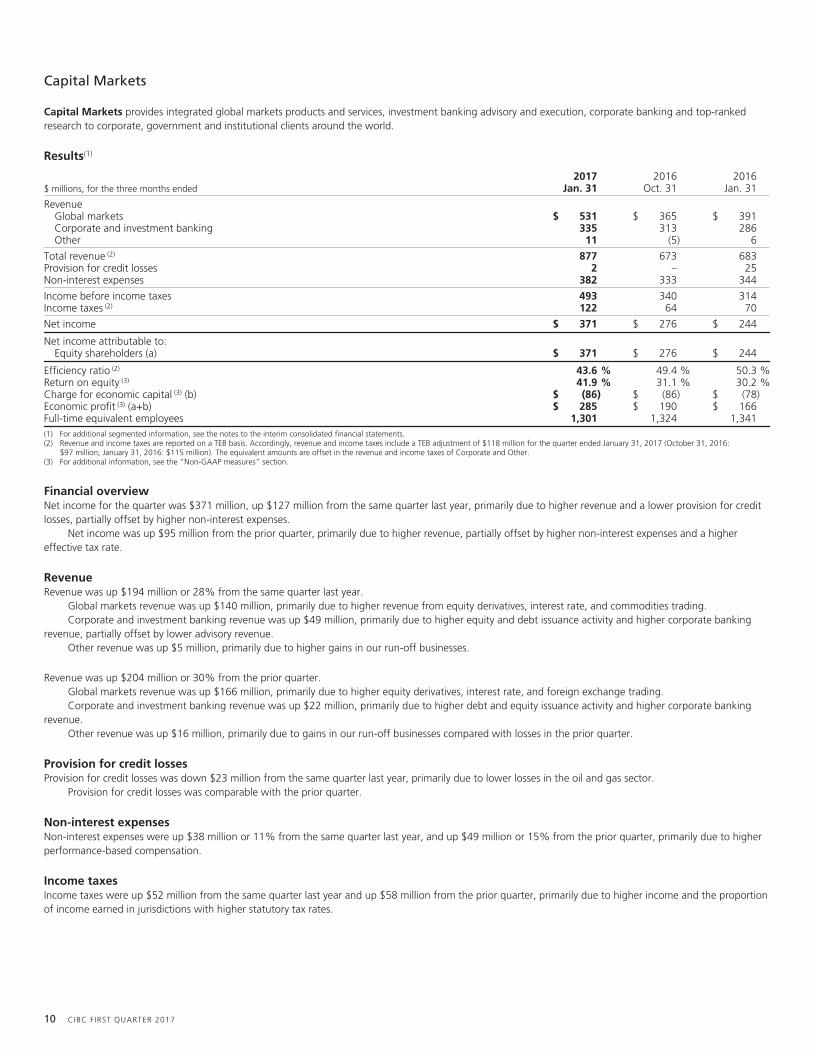
Capital Markets provides integrated global markets products and services, investment banking advisory and execution, corporate banking and top-rankedresearch to corporate, government and institutional clients around the world.
Results(1)
$ millions, for the three months ended2017
Jan. 312016
Oct. 312016
Jan. 31
RevenueGlobal markets $ 531 $ 365 $ 391Corporate and investment banking 335 313 286Other 11 (5) 6
Total revenue (2) 877 673 683Provision for credit losses 2 – 25Non-interest expenses 382 333 344
Income before income taxes 493 340 314Income taxes (2) 122 64 70
Net income $ 371 $ 276 $ 244
Net income attributable to:Equity shareholders (a) $ 371 $ 276 $ 244
Efficiency ratio (2) 43.6 % 49.4 % 50.3 %Return on equity (3) 41.9 % 31.1 % 30.2 %Charge for economic capital (3) (b) $ (86) $ (86) $ (78)Economic profit (3) (a+b) $ 285 $ 190 $ 166Full-time equivalent employees 1,301 1,324 1,341(1) For additional segmented information, see the notes to the interim consolidated financial statements.(2) Revenue and income taxes are reported on a TEB basis. Accordingly, revenue and income taxes include a TEB adjustment of $118 million for the quarter ended January 31, 2017 (October 31, 2016:
$97 million; January 31, 2016: $115 million). The equivalent amounts are offset in the revenue and income taxes of Corporate and Other.(3) For additional information, see the “Non-GAAP measures” section.
Financial overviewNet income for the quarter was $371 million, up $127 million from the same quarter last year, primarily due to higher revenue and a lower provision for creditlosses, partially offset by higher non-interest expenses.
Net income was up $95 million from the prior quarter, primarily due to higher revenue, partially offset by higher non-interest expenses and a highereffective tax rate.
RevenueRevenue was up $194 million or 28% from the same quarter last year.
Global markets revenue was up $140 million, primarily due to higher revenue from equity derivatives, interest rate, and commodities trading.Corporate and investment banking revenue was up $49 million, primarily due to higher equity and debt issuance activity and higher corporate banking
revenue, partially offset by lower advisory revenue.Other revenue was up $5 million, primarily due to higher gains in our run-off businesses.
Revenue was up $204 million or 30% from the prior quarter.Global markets revenue was up $166 million, primarily due to higher equity derivatives, interest rate, and foreign exchange trading.Corporate and investment banking revenue was up $22 million, primarily due to higher debt and equity issuance activity and higher corporate banking
revenue.Other revenue was up $16 million, primarily due to gains in our run-off businesses compared with losses in the prior quarter.
Provision for credit lossesProvision for credit losses was down $23 million from the same quarter last year, primarily due to lower losses in the oil and gas sector.
Provision for credit losses was comparable with the prior quarter.
Non-interest expensesNon-interest expenses were up $38 million or 11% from the same quarter last year, and up $49 million or 15% from the prior quarter, primarily due to higherperformance-based compensation.
Income taxesIncome taxes were up $52 million from the same quarter last year and up $58 million from the prior quarter, primarily due to higher income and the proportionof income earned in jurisdictions with higher statutory tax rates.
10 CIBC FIRST QUARTER 2017

Corporate and Other
Corporate and Other includes the following functional groups – Technology and Operations, Finance (including Treasury), Administration, Risk Management,and Internal Audit, as well as other support groups. The expenses of these functional and support groups are generally allocated to the business lines within theSBUs. Corporate and Other also includes our international banking operations comprising mainly CIBC FirstCaribbean, strategic investments in the CIBC Mellonjoint ventures, and other income statement and balance sheet items not directly attributable to the business lines.
Results(1)
$ millions, for the three months ended2017
Jan. 312016
Oct. 312016
Jan. 31
RevenueInternational banking $ 179 $ 176 $ 195Other (96) (78) (82)
Total revenue (2) 83 98 113Provision for credit losses 5 16 74Non-interest expenses 294 421 284
Loss before income taxes (216) (339) (245)Income taxes (2) (166) (181) (180)
Net loss $ (50) $ (158) $ (65)
Net income (loss) attributable to:Non-controlling interests $ 5 $ 4 $ 5Equity shareholders (55) (162) (70)
Full-time equivalent employees 16,951 17,314 16,720(1) For additional segmented information, see the notes to the interim consolidated financial statements.(2) TEB adjusted. See footnote 2 in the “Capital Markets” section for additional details.
Financial overviewNet loss for the quarter was $50 million, compared with a net loss of $65 million in the same quarter last year, primarily due to a lower provision for creditlosses, partially offset by lower revenue and higher non-interest expenses.
Net loss was down $108 million from the prior quarter, primarily due to lower non-interest expenses and a lower provision for credit losses, partially offsetby lower revenue.
RevenueRevenue was down $30 million or 27% from the same quarter last year.
International banking revenue was down $16 million, primarily due to the unfavourable impact of foreign exchange rates.Other revenue was down $14 million, primarily due to lower treasury revenue.
Revenue was down $15 million or 15% from the prior quarter.International banking revenue was up $3 million, primarily due to the favourable impact of foreign exchange rates.Other revenue was down $18 million, primarily due to a higher TEB adjustment.
Provision for credit lossesProvision for credit losses was down $69 million, as the same quarter last year included an increase in the collective allowance, shown as an item of note,primarily relating to deterioration in the commodities sector and economic conditions.
Provision for credit losses was down $11 million from the prior quarter, primarily due to a reduction in the collective allowance versus an increase in theprior quarter.
Non-interest expensesNon-interest expenses were up $10 million or 4% from the same quarter last year, primarily due to higher spending on strategic initiatives.
Non-interest expenses were down $127 million or 30% from the prior quarter, as the prior quarter included restructuring charges primarily relating toemployee severance, shown as an item of note.
Income taxesIncome tax benefit was down $14 million from the same quarter last year, as the prior year quarter included an income tax recovery arising from a change inour expected utilization of certain tax loss carryforwards, shown as an item of note.
Income tax benefit was down $15 million from the prior quarter primarily due to lower losses.
CIBC FIRST QUARTER 2017 11

Financial condition
Review of condensed consolidated balance sheet
$ millions, as at2017
Jan. 312016
Oct. 31
AssetsCash and deposits with banks $ 15,389 $ 14,165Securities 89,524 87,423Securities borrowed or purchased under resale agreements 44,556 33,810Loans and acceptances, net of allowance 322,094 319,781Derivative instruments 23,897 27,762Other assets 17,834 18,416
$ 513,294 $ 501,357
Liabilities and equityDeposits $ 409,753 $ 395,647Obligations related to securities lent or sold short or under repurchase agreements 28,995 24,550Derivative instruments 25,923 28,807Other liabilities 20,595 25,314Subordinated indebtedness 3,302 3,366Equity 24,726 23,673
$ 513,294 $ 501,357
AssetsAs at January 31, 2017, total assets were up $11.9 billion or 2% from October 31, 2016, net of a decrease of approximately $3 billion due to the depreciationof the U.S. dollar.
Cash and deposits with banks increased by $1.2 billion or 9%, mainly due to higher short-term placements in Treasury.Securities increased by $2.1 billion or 2%, primarily due to higher trading securities in Capital Markets, partially offset by a decrease in AFS securities,
mainly in Canadian government debt securities.Securities borrowed or purchased under resale agreements increased by $10.7 billion or 32%, due to increased funding in Treasury and normal business
activity.Net loans and acceptances increased by $2.3 billion or 1% due to an increase in residential mortgages, partially offset by a decrease in foreign business
and government loans and acceptances.Derivative instruments decreased by $3.9 billion or 14%, largely driven by decreases in foreign exchange and interest rate derivatives valuation, partially
offset by an increase in equity derivative valuation.Other assets decreased by $582 million or 3%, due to decreases in collateral pledged for derivatives and gold and silver certificates.
LiabilitiesAs at January 31, 2017, total liabilities were up $10.9 billion or 2% from October 31, 2016, net of a decrease of approximately $3 billion due to thedepreciation of the U.S. dollar.
Deposits increased by $14.1 billion or 4%, primarily due to increased funding in Treasury and domestic retail volume growth. Further details on thecomposition of deposits are provided in Note 7 to the interim consolidated financial statements.
Obligations related to securities lent or sold short or under repurchase agreements increased by $4.4 billion or 18%, primarily due to client-drivenactivities.
Derivative instruments decreased by $2.9 billion or 10%, largely driven by decreases in interest rate and foreign exchange derivatives valuation.Other liabilities decreased by $4.7 billion or 19%, mainly due to a decrease in acceptances.
EquityAs at January 31, 2017, equity increased $1.1 billion or 4% from October 31, 2016, primarily due to a net increase in retained earnings.
12 CIBC FIRST QUARTER 2017

Capital resourcesWe actively manage our capital to maintain a strong and efficient capital base, to maximize risk-adjusted returns to shareholders, and to meet regulatoryrequirements. For additional details on capital resources, see pages 29 to 38 of the 2016 Annual Report.
Regulatory capital requirements under Basel IIIOur regulatory capital requirements are determined in accordance with guidelines issued by the Office of the Superintendent of Financial Institutions (OSFI),which are based upon the risk-based capital standards developed by the Basel Committee on Banking Supervision (BCBS).
Regulatory capital consists of CET1, Tier 1 and Tier 2 capital. OSFI requires all institutions to achieve target capital ratios that meet or exceed the 2019 all-in minimum ratios plus a conservation buffer. “All-in” is defined by OSFI as capital calculated to include all of the regulatory adjustments that will be requiredby 2019, but retaining the phase-out rules for non-qualifying capital instruments. Certain deductions from CET1 capital are phased in at 20% per year from2014 for the determination of capital under the transitional rules. Amounts not yet deducted from capital under OSFI’s transitional rules are risk weighted,creating a difference between RWAs on a transitional and all-in basis.
CIBC, along with the Bank of Montreal, the Bank of Nova Scotia, the National Bank of Canada, the Royal Bank of Canada, and the Toronto-DominionBank, have been designated by OSFI as domestic systemically important banks (D-SIBs) in Canada, and they are subject to a 1% CET1 surcharge, whichcommenced January 1, 2016. This results in current minimum targets for CET1, Tier 1 and Total capital ratios of 8.0%, 9.5%, and 11.5%, respectively. Thesetargets may be higher for certain institutions at OSFI’s discretion. Additionally, starting in the first quarter of 2017, banks will need to hold an incrementalcountercyclical capital buffer equal to the weighted average of buffers deployed in Canada and across certain other jurisdictions, where private sector creditexposures exist.
Capital adequacy requirements are applied on a consolidated basis, which is consistent with the consolidation basis in our financial statements asdescribed in Note 1 to the 2016 annual consolidated financial statements, except for our insurance subsidiaries (CIBC Reinsurance Company Limited and CIBCLife Insurance Company Limited), which are excluded from the regulatory scope of consolidation. CIBC Life Insurance Company Limited is subject to OSFI’sMinimum Continuing Capital Surplus Requirements for life insurance companies.
A comparison of the BCBS transitional capital ratio requirements and the OSFI all-in target capital ratio requirements is as follows:
CET1 Capital(8.0%)
All-in basis(1) (OSFI)
2.5%
1.0%
1.5%
2.0%
11.5%
2017 - 2019
Tier 1 Capital(9.5%)
Total Capital(11.5%)
4.5%
1.3%
1.5%
2.0%
9.3%
2017
4.5%
1.9%
1.5%
2.0%
9.9%
2018
4.5%
2.5%
1.5%
2.0%
10.5%
2019
CET1 Capital(7.0%)
Tier 1 Capital(8.5%)
Total Capital(10.5%)
CET 1 Capital Conservation Buffer D-SIB Buffer Additional Tier 1 Tier 2
Transitional basis(1)
(BCBS)
4.5%
(1) A countercyclical capital buffer is also applicable, but is insignificant for CIBC as at January 31, 2017.
The tiers of regulatory capital indicate increasing quality/permanence and the ability to absorb losses. The major components of our regulatory capital aresummarized as follows:
CET1 Capital• Common Equity (Common Shares and Retained Earnings)• Accumulated Other Comprehensive Income (AOCI)(1)
• Qualifying instruments issued by a consolidated banking subsidiary to third parties• Less regulatory deductions for items such as: ➢ Goodwill and other intangible assets ➢ Deferred tax assets ➢ Net assets related to defined benefit pension plans ➢ Certain investments
Additional Tier 1 (AT1) Capital• Non-Viability Contingent Capital (NVCC) preferred shares• Qualifying instruments issued by a consolidated subsidiary to third parties• Innovative Tier 1 notes subject to phase-out rules for capital instruments
Tier 2 Capital• NVCC subordinated indebtedness• Non-qualifying subordinated indebtedness subject to phase-out rules for capital instruments• Eligible collective allowance under the standardized approach• Qualifying instruments issued by a consolidated subsidiary to third parties
Total C
apital
Tier 1 Cap
ital
HigherQuality
LowerQuality
(1) Excluding AOCI relating to cash flow hedges and changes to FVO liabilities attributable to changes in own credit risk.
CIBC FIRST QUARTER 2017 13

Regulatory capital
$ millions, as at2017
Jan. 312016
Oct. 31
Transitional basisCET1 capital $ 20,877 $ 20,751Tier 1 capital 22,809 22,596Total capital 26,125 25,949RWA 171,157 173,902CET1 ratio 12.2 % 11.9 %Tier 1 capital ratio 13.3 % 13.0 %Total capital ratio 15.3 % 14.9 %
All-in basisCET1 capital $ 20,093 $ 19,148Tier 1 capital 22,360 21,666Total capital 25,710 25,083CET1 capital RWA 169,350 168,996Tier 1 capital RWA 169,575 169,322Total capital RWA 169,755 169,601CET1 ratio 11.9 % 11.3 %Tier 1 capital ratio 13.2 % 12.8 %Total capital ratio 15.2 % 14.8 %
CET1 ratio (All-in basis)The CET1 ratio at January 31, 2017 increased 0.6% from October 31, 2016. The impact of the increase in CET1 capital was partially offset by the impact of anincrease in RWAs. The increase in CET1 capital was the result of internal capital generation (net income less dividends) and share issuance arising from ourshareholder and employee plans. CET1 capital RWAs increased $0.4 billion from October 31, 2016 to January 31, 2017, primarily due to increased exposuresand capital methodology updates, partially offset by the impact of net foreign exchange movement and portfolio upgrades.
Continuous enhancement to risk-based capital requirementsThe BCBS has published a number of proposals for changes to the existing risk-based capital requirements (see page 34 of the 2016 Annual Report), whichcontinue to evolve.
In December 2016, OSFI issued a final Capital Adequacy Requirements Guideline, effective for the first quarter of 2017, following the draft issued forpublic consultation in September 2016.
CIBC will continue to monitor and prepare for developments impacting risk-based capital requirements.
Basel III leverage ratioThe Basel III capital reforms included a non-risk-based capital metric, the leverage ratio, to supplement risk-based capital requirements.
The leverage ratio is defined as Tier 1 capital divided by the leverage ratio exposure. The leverage ratio exposure is defined under the rules as the sum of:(i) On-balance sheet assets less Tier 1 capital regulatory adjustments;(ii) Derivative exposures;(iii) Securities financing transaction exposures; and(iv) Off-balance sheet exposures (such as commitments, direct credit substitutes, letters of credit, and securitization exposures).
OSFI expects federally regulated deposit-taking institutions to have leverage ratios that meet or exceed 3%. This minimum may be higher for certain institutionsat OSFI’s discretion.
$ millions, as at2017
Jan. 312016
Oct. 31
Transitional basisTier 1 capital A $ 22,809 $ 22,596Leverage ratio exposure B 556,186 546,136Leverage ratio A/B 4.1 % 4.1 %
All-in basisTier 1 capital C $ 22,360 $ 21,666Leverage ratio exposure D 555,830 545,480Leverage ratio C/D 4.0 % 4.0 %
Leverage ratio (All-in basis)The leverage ratio at January 31, 2017 remained unchanged from October 31, 2016 at 4.0%, as the impact of an increase in Tier 1 capital was offset by theimpact of an increase in leverage ratio exposure. The increase in Tier 1 capital was driven by the increase in the CET1 capital noted above, partially offset by anincrease in the phase-out of Innovative Tier 1 notes from Additional Tier 1 capital. The increase in leverage ratio exposure was primarily driven by an increase inon-balance sheet and securities financing transaction exposures.
Proposed revisions to leverage ratio frameworkRevisions proposed by the BCBS are discussed on page 35 of the 2016 Annual Report and are expected to be finalized for implementation on January 1, 2018.
Revised Pillar 3 disclosure requirementsIn January 2015, the BCBS issued “Revised Pillar 3 disclosure requirements”, which set out the first phase of a two-phase project by the BCBS to replace existingPillar 3 disclosure requirements for credit (including counterparty credit), market, operational, interest rate and securitization risks. Pillar 3 aims to
14 CIBC FIRST QUARTER 2017

promote market discipline through regulatory disclosure requirements, in order to improve comparability and consistency of disclosures and increasetransparency and confidence about a bank’s exposure to risk and the overall adequacy of its regulatory capital.
In January 2016, OSFI issued a draft guideline confirming its expectations for domestic implementation of the BCBS Pillar 3 first phase requirements. InAugust 2016, OSFI confirmed that implementation is required beginning in the fourth quarter of 2018.
In March 2016, the BCBS released “Pillar 3 disclosure requirements – consolidated and enhanced framework”, a consultative document establishing thesecond phase of the project. The proposals in this document include enhancements to the January 2015 requirements, the introduction of several new disclosurerequirements, and the incorporation into Pillar 3 of other proposed disclosure requirements arising from ongoing reforms to the regulatory framework.
CIBC will continue to monitor and prepare for developments in this area.
Taxpayer Protection and Bank Recapitalization RegimeThe Canadian Government has passed legislation to enable a Taxpayer Protection and Bank Recapitalization (bail-in) regime. The overarching policy objective isto preserve financial stability while protecting taxpayers in the event of a large bank (D-SIB) failure, and is consistent with the objectives of the Financial StabilityBoard’s rules for Total Loss-Absorbing Capacity applicable to G-SIBs. The bail-in regime is designed to enable the expedient conversion, in whole or in part, ofcertain bank liabilities (bail-in debt) into common equity, thus ensuring that the D-SIB emerges from conversion as adequately capitalized. Specified eligibleshares and liabilities of D-SIBs may be converted into common shares, and the CDIC will set the terms and conditions of conversion, including timing. The ruleswould not be applied retroactively to liabilities outstanding as of the implementation date. In addition, OSFI will establish loss absorbency requirements forD-SIBs, which will consist of regulatory capital and debt subject to conversion under this framework.
Additional details on implementation, scope, and timing are expected to follow through regulations and guidelines.
Significant capital management activityNormal course issuer bidWe intend to seek Toronto Stock Exchange approval for a new normal course issuer bid that would permit us to purchase for cancellation up to a maximum of8 million, or approximately 2% of our outstanding common shares, over a 12 month period.
Shareholder Investment Plan (the plan)Effective with the October 28, 2016 dividend, CIBC has elected to issue shares from Treasury to fulfill the requirements of the plan. Pursuant to the plan, weissued 1,554,414 common shares for consideration of $171 million for the quarter ended January 31, 2017.
DividendsOn February 22, 2017, the Board of Directors (the Board) approved an increase in our quarterly common share dividend from $1.24 per share to $1.27 pershare for the quarter ending April 30, 2017.
Convertible instrumentsThe table below provides a summary of our NVCC capital instruments outstanding:
Shares outstandingMinimum
conversionprice per
common share
Maximum numberof common
shares issuableon conversion$ millions, except number of shares and per share amounts, as at January 31, 2017
Numberof shares
Parvalue
Preferred shares (1)(2)
Series 39 (NVCC) 16,000,000 $ 400 $ 5.00 80,000,000Series 41 (NVCC) 12,000,000 300 5.00 60,000,000Series 43 (NVCC) 12,000,000 300 5.00 60,000,000Subordinated indebtedness (2)(3)
3.00% Debentures due October 28, 2024 (NVCC) n/a 1,000 5.00 300,000,0003.42% Debentures due January 26, 2026 (NVCC) n/a 1,000 5.00 300,000,000
Total $ 3,000 800,000,000(1) Upon the occurrence of a Trigger Event, each share is convertible into a number of common shares, determined by dividing the par value of $25.00 plus declared and unpaid dividends by the average common
share price (as defined in the relevant prospectus supplement) subject to a minimum price per share (subject to adjustment in certain events as defined in the relevant prospectus supplement). Preferredshareholders do not have the right to convert their shares into common shares.
(2) The maximum number of common shares issuable on conversion excludes the impact of declared but unpaid dividends and accrued interest.(3) Upon the occurrence of a Trigger Event, the Debentures are convertible into a number of common shares, determined by dividing 150% of the par value plus accrued and unpaid interest by the average
common share price (as defined in the relevant prospectus supplement) subject to a minimum price per common share (subject to adjustment in certain events as defined in the relevant prospectussupplement).
n/a Not applicable.
The occurrence of a “Trigger Event” would result in conversion of all of the outstanding NVCC instruments described above, which would represent a dilutionimpact of 67% based on the number of CIBC common shares outstanding as at January 31, 2017. As described in the Capital Adequacy Guidelines, a TriggerEvent occurs when OSFI determines the bank is or is about to become non-viable and, if after conversion of all contingent instruments and consideration of anyother relevant factors or circumstances, it is reasonably likely that its viability will be restored or maintained; or if the bank has accepted or agreed to accept acapital injection or equivalent support from a federal or provincial government, without which OSFI would have determined the bank to be non-viable.
CIBC FIRST QUARTER 2017 15
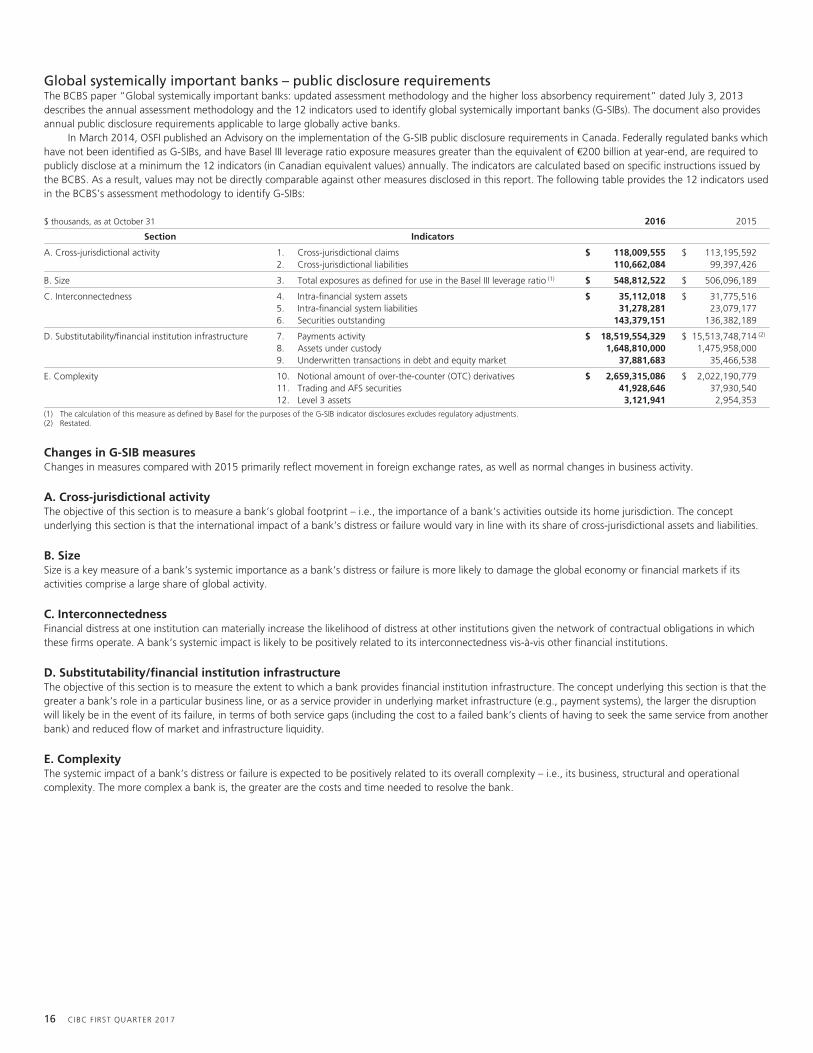
Global systemically important banks – public disclosure requirementsThe BCBS paper “Global systemically important banks: updated assessment methodology and the higher loss absorbency requirement” dated July 3, 2013describes the annual assessment methodology and the 12 indicators used to identify global systemically important banks (G-SIBs). The document also providesannual public disclosure requirements applicable to large globally active banks.
In March 2014, OSFI published an Advisory on the implementation of the G-SIB public disclosure requirements in Canada. Federally regulated banks whichhave not been identified as G-SIBs, and have Basel III leverage ratio exposure measures greater than the equivalent of €200 billion at year-end, are required topublicly disclose at a minimum the 12 indicators (in Canadian equivalent values) annually. The indicators are calculated based on specific instructions issued bythe BCBS. As a result, values may not be directly comparable against other measures disclosed in this report. The following table provides the 12 indicators usedin the BCBS’s assessment methodology to identify G-SIBs:
$ thousands, as at October 31 2016 2015
Section Indicators
A. Cross-jurisdictional activity 1. Cross-jurisdictional claims $ 118,009,555 $ 113,195,5922. Cross-jurisdictional liabilities 110,662,084 99,397,426
B. Size 3. Total exposures as defined for use in the Basel III leverage ratio (1) $ 548,812,522 $ 506,096,189
C. Interconnectedness 4. Intra-financial system assets $ 35,112,018 $ 31,775,5165. Intra-financial system liabilities 31,278,281 23,079,1776. Securities outstanding 143,379,151 136,382,189
D. Substitutability/financial institution infrastructure 7. Payments activity $ 18,519,554,329 $ 15,513,748,714 (2)
8. Assets under custody 1,648,810,000 1,475,958,0009. Underwritten transactions in debt and equity market 37,881,683 35,466,538
E. Complexity 10. Notional amount of over-the-counter (OTC) derivatives $ 2,659,315,086 $ 2,022,190,77911. Trading and AFS securities 41,928,646 37,930,54012. Level 3 assets 3,121,941 2,954,353
(1) The calculation of this measure as defined by Basel for the purposes of the G-SIB indicator disclosures excludes regulatory adjustments.(2) Restated.
Changes in G-SIB measuresChanges in measures compared with 2015 primarily reflect movement in foreign exchange rates, as well as normal changes in business activity.
A. Cross-jurisdictional activityThe objective of this section is to measure a bank’s global footprint – i.e., the importance of a bank’s activities outside its home jurisdiction. The conceptunderlying this section is that the international impact of a bank’s distress or failure would vary in line with its share of cross-jurisdictional assets and liabilities.
B. SizeSize is a key measure of a bank’s systemic importance as a bank’s distress or failure is more likely to damage the global economy or financial markets if itsactivities comprise a large share of global activity.
C. InterconnectednessFinancial distress at one institution can materially increase the likelihood of distress at other institutions given the network of contractual obligations in whichthese firms operate. A bank’s systemic impact is likely to be positively related to its interconnectedness vis-à-vis other financial institutions.
D. Substitutability/financial institution infrastructureThe objective of this section is to measure the extent to which a bank provides financial institution infrastructure. The concept underlying this section is that thegreater a bank’s role in a particular business line, or as a service provider in underlying market infrastructure (e.g., payment systems), the larger the disruptionwill likely be in the event of its failure, in terms of both service gaps (including the cost to a failed bank’s clients of having to seek the same service from anotherbank) and reduced flow of market and infrastructure liquidity.
E. ComplexityThe systemic impact of a bank’s distress or failure is expected to be positively related to its overall complexity – i.e., its business, structural and operationalcomplexity. The more complex a bank is, the greater are the costs and time needed to resolve the bank.
16 CIBC FIRST QUARTER 2017

Off-balance sheet arrangementsWe enter into off-balance sheet arrangements in the normal course of our business. These arrangements typically involve the use of structured entities (SEs),which are entities that have been designed so that voting or similar rights are not the dominant factor in deciding who controls the entity, such as when anyvoting rights relate to administrative tasks only and the relevant activities are directed by means of contractual arrangements. CIBC is involved with various typesof SEs for which the business activities include securitization of financial assets, asset-backed financings, and asset management.
We consolidate all of our sponsored trusts that securitize our own assets with the exception of a commercial mortgage securitization trust. Details of ourother off-balance sheet arrangements are provided on pages 38 and 39 of the 2016 Annual Report and also in Note 6 to the consolidated financial statementsin the 2016 Annual Report.
We manage and administer a single-seller conduit and several CIBC-sponsored multi-seller conduits in Canada. As at January 31, 2017, there were $6.0billion (October 31, 2016: $6.0 billion) of total assets in our non-consolidated single-seller conduit and multi-seller conduits.
We earn fees for providing services related to the non-consolidated single-seller and multi-seller conduits, such as backstop liquidity facilities, distribution,transaction structuring, and conduit administration. These fees totalled $11 million in the first quarter of 2017 ($10 million for the prior quarter and $10 millionfor the same quarter last year). All fees earned in respect of activities with the conduits are on a market basis.
As at January 31, 2017, the amount funded for the various asset types in our multi-seller conduits amounted to $5.4 billion (October 31, 2016:$5.4 billion). The estimated weighted-average life of these assets was 1.5 years (October 31, 2016: 1.5 years). Our holdings of commercial paper issued by ournon-consolidated sponsored multi-seller conduits that offer commercial paper to external investors were $4 million (October 31, 2016: $10 million). Ourcommitted backstop liquidity facilities to these conduits were $7.2 billion (October 31, 2016: $7.2 billion). We also provided credit facilities of $40 million(October 31, 2016: $40 million) to these conduits.
We participate in a syndicated facility for a three-year commitment of $700 million to the single-seller conduit that provides funding to franchisees of amajor Canadian retailer. Our portion of the commitment is $130 million (October 31, 2016: $130 million). As at January 31, 2017, we funded $102 million(October 31, 2016: $103 million) through the issuance of bankers’ acceptances and prime loans.
Our on-balance sheet amounts and maximum exposure to loss related to our off-balance sheet arrangements with SEs that are not consolidated are setout in the table below. The maximum exposure comprises the carrying value of unhedged investments, the notional amounts for liquidity and credit facilities,and the notional amounts less accumulated fair value losses for unhedged written credit derivatives on SE reference assets. The impact of credit valuationadjustment (CVA) is not considered in the table below.
$ millions, as at January 31, 2017
Single-sellerand multi-seller
conduits
Third-partystructuredvehicles –
continuing
Structuredvehiclesrun-off (1) Other (2)
On-balance sheet assets at carrying value (3)
Trading securities $ 4 $ 213 $ 6 $ 396AFS securities – 2,339 – –FVO securities – – 91 –Loans 102 1,335 212 –Investments in equity-accounted associates and joint ventures – – – 3Derivatives (4) – – – 32
$ 106 $ 3,887 $ 309 $ 431
October 31, 2016 $ 113 $ 4,647 $ 910 $ 448
On-balance sheet liabilities at carrying value (3)
Deposits $ – $ – $ – $ 1,650Derivatives (4) – – 159 –
$ – $ – $ 159 $ 1,650
October 31, 2016 $ – $ – $ 174 $ 1,664
Maximum exposure to loss, net of hedgesInvestments and loans $ 106 $ 3,887 $ 309 $ 399Notional of written derivatives, less fair value losses – – 61 –Liquidity, credit facilities and commitments 5,460 (5) 1,473 27 75Less: hedges of investments, loans and written derivatives exposure – – (250) (388)
$ 5,566 $ 5,360 $ 147 $ 86
October 31, 2016 $ 5,613 $ 6,045 $ 409 $ 121
(1) Includes CIBC structured collateralized debt obligation (CDO) vehicles and third-party structured vehicles.(2) Includes pass-through investment structures, a commercial mortgage securitization trust, CIBC Capital Trust, and CIBC-managed investment funds.(3) Excludes SEs established by Canada Mortgage and Housing Corporation (CMHC), Federal National Mortgage Association, Federal Home Loan Mortgage Corporation, Government National Mortgage
Association, Federal Home Loan Banks, Federal Farm Credit Bank, and Student Loan Marketing Association.(4) Comprises written credit default swaps and total return swaps under which we assume exposures. Excludes foreign exchange derivatives, interest rate derivatives and other derivatives provided as part of
normal course client facilitation.(5) Excludes an additional $1.8 billion (October 31, 2016: $1.8 billion) relating to our backstop liquidity facilities provided to the multi-seller conduits as part of their commitment to fund purchases of additional
assets and $4 million (October 31, 2016: $10 million) relating to our direct investments in the multi-seller conduits which we consider investment exposure.
Additional details of our SEs are provided in Note 6 to the interim consolidated financial statements.
CIBC FIRST QUARTER 2017 17
Management of risk
Our approach to management of risk has not changed significantly from that described on pages 40 to 75 of the 2016 Annual Report.
Risk overviewCIBC faces a wide variety of risks across all of its areas of business. Identifying and understanding risks and their impacts allows CIBC to frame its risk appetiteand risk management practices. Defining acceptable levels of risk, and establishing sound principles, policies and practices for managing risks, is fundamental toachieving consistent and sustainable long-term performance, while remaining within our risk appetite.
Our risk appetite defines tolerance levels for various risks. This is the foundation for our risk management culture and our risk management framework.
Our risk management framework includes:• CIBC and SBU-level risk appetite statements;• Risk frameworks, policies, procedures and limits to align activities with our risk appetite;• Regular risk reports to identify and communicate risk levels;• An independent control framework to identify and test compliance with key controls;• Stress testing to consider potential impacts of changes in the business environment on capital, liquidity and earnings;• Proactive consideration of risk mitigation options in order to optimize results; and• Oversight through our risk-focused committees and governance structure.
Managing risk is a shared responsibility at CIBC. Business units and risk management professionals work in collaboration to ensure that business strategies andactivities are consistent with our risk appetite. CIBC’s approach to enterprise-wide risk management aligns with the three lines of defence model:(i) CIBC’s lines of business and functional and support groups are responsible for all risks associated with their activities – this is the first line of defence;(ii) As the second line of defence, CIBC’s Risk Management, including Compliance, and other oversight functions are responsible for independent oversight of
the enterprise-wide risks inherent in CIBC’s business activities; and(iii) As the third line of defence, CIBC’s internal audit function provides an independent assessment of the design and operating effectiveness of risk
management controls, processes and systems.
We continuously monitor our risk profile against our defined risk appetite and related limits, taking actions as needed to maintain an appropriate balance of riskand return. Monitoring our risk profile includes forward-looking analysis of sensitivity to local and global market factors, economic conditions, and political andregulatory environments that influence our overall risk profile.
Regular and transparent risk reporting and discussion at senior management committees facilitate communication of risks and discussion of riskmanagement strategies across the organization.
Top and emerging risksWe monitor and review top and emerging risks that may affect our future results, and take action to mitigate potential risks if required. We perform in-depthanalyses, which can include stress testing our exposures relative to the risks, and provide updates and related developments to the Board on a regular basis. Thissection describes the top and emerging risks that we consider to have potential negative implications, as well as regulatory and accounting developments thatare material for CIBC.
Technology, information and cyber security riskFinancial institutions like CIBC are evolving their business processes to leverage innovative technologies and the internet to improve client experience andstreamline operations. At the same time, cyber threats and the associated financial, reputation and business interruption risks have also increased. CIBC hascyber insurance coverage to help mitigate loss associated with cyber incidents.
These risks continue to be actively managed by us through strategic risk reviews, enterprise-wide technology and information security programs, with thegoal of maintaining overall cyber resilience that prevents, detects and responds to threats such as data breaches, malware, unauthorized access and denial-of-service attacks.
Given the importance of electronic financial systems, including secure online and mobile banking provided by CIBC to its clients, CIBC continues todevelop controls and processes to protect our systems and client information from damage and unauthorized disclosure. CIBC monitors the changingenvironment globally, including cyber threats, evolving regulatory requirements, and mitigation strategies. In addition, we benchmark against best practices andprovide regular updates to the Board.
Despite our commitment to information and cyber security, CIBC and its related third parties may not be able to fully mitigate all risks associated with theincreased complexity and high rate of change in the threat landscape. However, CIBC continuously monitors its risk posture for changes and continues to refinesecurity protection approaches to minimize the impact of any incidents that may occur.
Disintermediation riskCanadian banking clients are increasingly shifting their service transactions from branches to digital platforms. As such, competitive pressure from digitaldisruptors, both global technology leaders and smaller financial technology entrants, is increasing and the risk of disintermediation is growing due to the levelof sophistication of these non-traditional competitors.
CIBC manages disintermediation risk through strategic risk reviews as well as investment in emerging channels, in data and analytics capabilities, and intechnology and innovation in general, to meet our clients’ changing expectations, while working to reduce our cost structure and simplify operations.
Geo-political riskThe level of geo-political risk escalates at certain points in time. While the specific impact on the global economy and on global credit and capital markets woulddepend on the nature of the event, in general, any major event could result in instability and volatility, leading to widening spreads, declining equity valuations,flight to safe-haven currencies and increased purchases of gold. In the short run, market shocks could hurt the net income of our trading and non-tradingmarket risk positions. Although Canada is unlikely to be directly subject to geo-political risk, the indirect impact of reduced economic growth, as wellas potential impacts on commodity prices, could have serious negative implications for general economic and banking activities.
The change in leadership in the White House poses new economic policy uncertainties that could either add or subtract to Canadian economic activity.
18 CIBC FIRST QUARTER 2017
The downside risks would be associated with an increase in protectionism that does not exempt Canadian goods and services, as well as heightenedcompetition for business investment as the U.S. eases up on corporate taxes and regulations. There could also be positive implications for Canada if U.S. growthaccelerates due to fiscal stimulus. We will monitor these policy developments as details emerge.
While the negative economic effects of Brexit are likely to be concentrated in the U.K., they will have ramifications for the rest of Europe, adding toexisting economic challenges in the region. Our direct exposure to the region is limited. However, we continue to actively monitor and assess the globalbusiness and geo-political environment for adverse developments.
While it is impossible to predict where new geo-political disruption will occur, we do pay particular attention to markets and regions with existing or recenthistorical instability to assess the impact of these environments on the markets and businesses in which we operate.
Canadian consumer debt and the housing marketAs a consequence of historically low interest rates, Canadians have increased debt levels at a pace that has exceeded growth in their income. Most of theincrease in household debt levels has been driven by higher levels of mortgage debt, which is tied to the Canadian housing market. While interest rates areexpected to remain relatively low in the foreseeable future, concerns remain that an external shock, such as higher unemployment rates, could affect the abilityof Canadians to repay their loans, potentially triggering a correction in the housing market, which in turn could result in credit losses to banks. In an attempt tomitigate the risks associated with the housing market, the Canadian government has introduced regulatory changes, and announced a public consultation onother measures. See the “Real estate secured personal lending” section for additional details.
Currently, we qualify all variable rate mortgage borrowers using the Bank of Canada 5-year fixed benchmark rate, which is typically higher than thevariable rate by approximately two percentage points. If there were an interest rate increase, our variable rate borrowers should be able to withstand someincrease in the interest rate. We believe the risk of a severe housing crash that generates significant losses for mortgage portfolios is unlikely, but the riskassociated with high levels of consumer debt would be a concern should the economy falter and unemployment rates increase.
Commodity pricesCommodity prices have recovered and stabilized at somewhat higher levels, suggesting that they may have passed their cyclical trough. Oil has rallied followingthe recent OPEC agreement, while prices of several base metals have been buoyed by a tightening supply in global markets. The upside in prices may be limited,however, as global growth remains lacklustre.
So far, our overall commodity exposure continues to perform within our risk appetite, with losses in our oil and gas portfolio down significantly. Clients inour oil and gas portfolio are currently being assessed on the basis of our enhanced risk metrics, and our portfolio is being monitored in a prudent manner. Wehave run our enterprise statistical stress tests at lower oil prices to determine potential direct losses, and have also conducted stress tests to assess the secondaryimpacts of lower oil prices on our retail portfolio for the affected regions, where we could see higher losses if unemployment continues to trend negatively.
China economic policy riskWhile meeting the government-set quarterly targets, China’s economy continues to be on a slower growth trajectory as, in addition to cyclical factors, thecountry tries to rebalance growth from an export-oriented and investment-driven performance to a more sustainable service-oriented and consumption-driveneconomy. The People’s Bank of China deployed a series of new capital controls at the end of 2016 designed to slow capital outflows. In addition to restrictionson outbound corporate acquisitions and investments, the rules limit individual purchases of foreign currencies, which could have implications for Canadian citiessuch as Vancouver and Toronto, where foreign purchasers have contributed to the sharp rise in house prices.
We continue to monitor economic policy both within the country and the region for signs of stress or directional change, and have taken a prudent stancein addressing our tolerance for exposure to the country. We currently have little direct exposure to China, but any negative impact from the Chinese economicslowdown could affect clients that export to China or sell into a market where prices have been pushed down by weakness in Chinese demand, and could raisethe credit risk associated with our exposure to trading counterparties.
Acquisition riskCIBC seeks out acquisition opportunities which align with its financial goals and strategies. The ability to successfully execute these strategies to integrateacquisitions, and the ability to anticipate and manage risks associated with them, are subject to certain factors. These include receiving regulatory andshareholder approval on a timely basis and on favourable terms, changes in general business and economic conditions, and the ability to control integration andacquisition costs, among others.
Although many of the factors are beyond CIBC’s control, their impact is mitigated by conducting thorough due diligence before completing thetransaction, developing and executing appropriate action plans to ensure successful integration, and monitoring performance following the acquisition.
Anti-money launderingRecognizing the threat of money laundering, terrorist financing activities and other related crimes to the stability and integrity of a country’s financial sector andits broader economy, the international community has made the fight against these illegal activities a priority. Several laws and regulations have been enactedby governments and regulatory bodies globally. As a potential conduit for illegal operations, financial institutions bear a significant responsibility in mitigatingthe risks associated with these activities.
CIBC is committed to adhering to all regulatory requirements pertaining to Anti-Money Laundering (AML) and Anti-Terrorist Financing (ATF) andimplementing best practices to minimize the impact of such activities. As such, CIBC has implemented procedures to ensure that relevant regulatory obligationswith respect to the reporting of large cash transactions, electronic funds transfers, and cross-border movements of cash and monetary instruments, are met ineach jurisdiction. In addition, all employees are required to complete CIBC’s AML/ATF training annually.
Environmental risks and pandemic outbreaksA number of environmental events have occurred over the past several years, including hurricanes, tsunamis, earthquakes, wildfires, droughts and floods, oilspills, and industrial accidents. There is also concern that the outbreak of certain illnesses could have the potential to reach pandemic levels. In addition to thehumanitarian impact, these phenomena, along with the potential impact of climate change, introduce uncertainty and pose risks to the global economy, as wellas our clients and our operations.
CIBC monitors these events and has measures in place including disaster recovery, insurance and business continuity programs, to ensure client needscontinue to be met.
CIBC FIRST QUARTER 2017 19
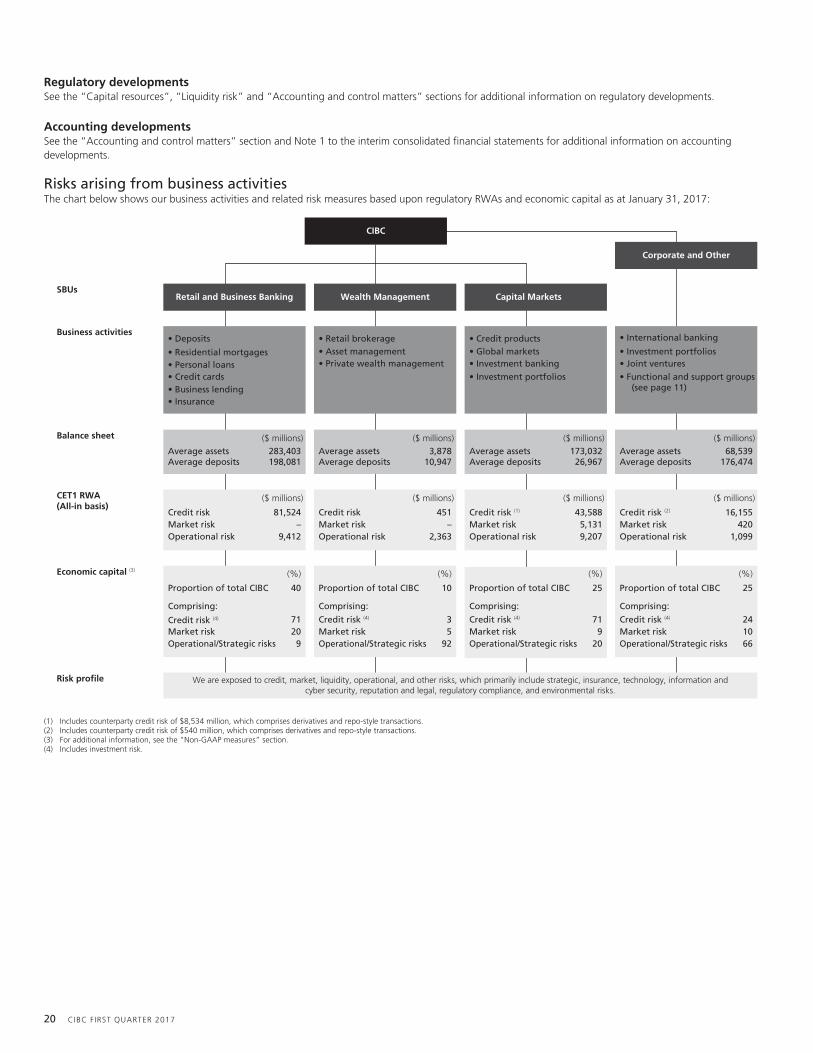
Regulatory developmentsSee the “Capital resources”, “Liquidity risk” and “Accounting and control matters” sections for additional information on regulatory developments.
Accounting developmentsSee the “Accounting and control matters” section and Note 1 to the interim consolidated financial statements for additional information on accountingdevelopments.
Risks arising from business activitiesThe chart below shows our business activities and related risk measures based upon regulatory RWAs and economic capital as at January 31, 2017:
CIBC
Retail and Business Banking
($ millions)Average assetsAverage deposits
283,403198,081
We are exposed to credit, market, liquidity, operational, and other risks, which primarily include strategic, insurance, technology, information andcyber security, reputation and legal, regulatory compliance, and environmental risks.
Wealth Management Capital Markets
Corporate and Other
• International banking
• Investment portfolios• Joint ventures• Functional and support groups
(see page 11)
• Retail brokerage • Asset management• Private wealth management
Business activities
Balance sheet
Economic capital (3)
SBUs
Risk profile
CET1 RWA(All-in basis)
Credit riskMarket risk Operational risk
–9,412
($ millions)
Credit riskMarket risk Operational risk
($ millions)
45181,524–
2,363
Credit risk (1)
Market riskOperational risk
($ millions)
5,1319,207
43,588
($ millions)
Credit risk (2)
Market riskOperational risk
4201,099
16,155
• Deposits
• Residential mortgages• Personal loans
• Business lending• Insurance
• Credit cards
($ millions)3,878
10,947Average assetsAverage deposits
($ millions)173,032
26,967Average assetsAverage deposits
68,539176,474
($ millions)Average assetsAverage deposits
• Investment banking • Investment portfolios
• Credit products • Global markets
Proportion of total CIBC 25
Comprising:
Credit risk (4)
Market riskOperational/Strategic risks
241066
(%)(%)
25Proportion of total CIBC
Comprising:
Credit risk (4)
Market riskOperational/Strategic risks
719
20
(%)
10Proportion of total CIBC
Comprising:
Credit risk (4)
Market riskOperational/Strategic risks
35
92
(%)
40Proportion of total CIBC
Comprising:
Credit risk (4)
Market riskOperational/Strategic risks
7120
9
(1) Includes counterparty credit risk of $8,534 million, which comprises derivatives and repo-style transactions.(2) Includes counterparty credit risk of $540 million, which comprises derivatives and repo-style transactions.(3) For additional information, see the “Non-GAAP measures” section.(4) Includes investment risk.
20 CIBC FIRST QUARTER 2017
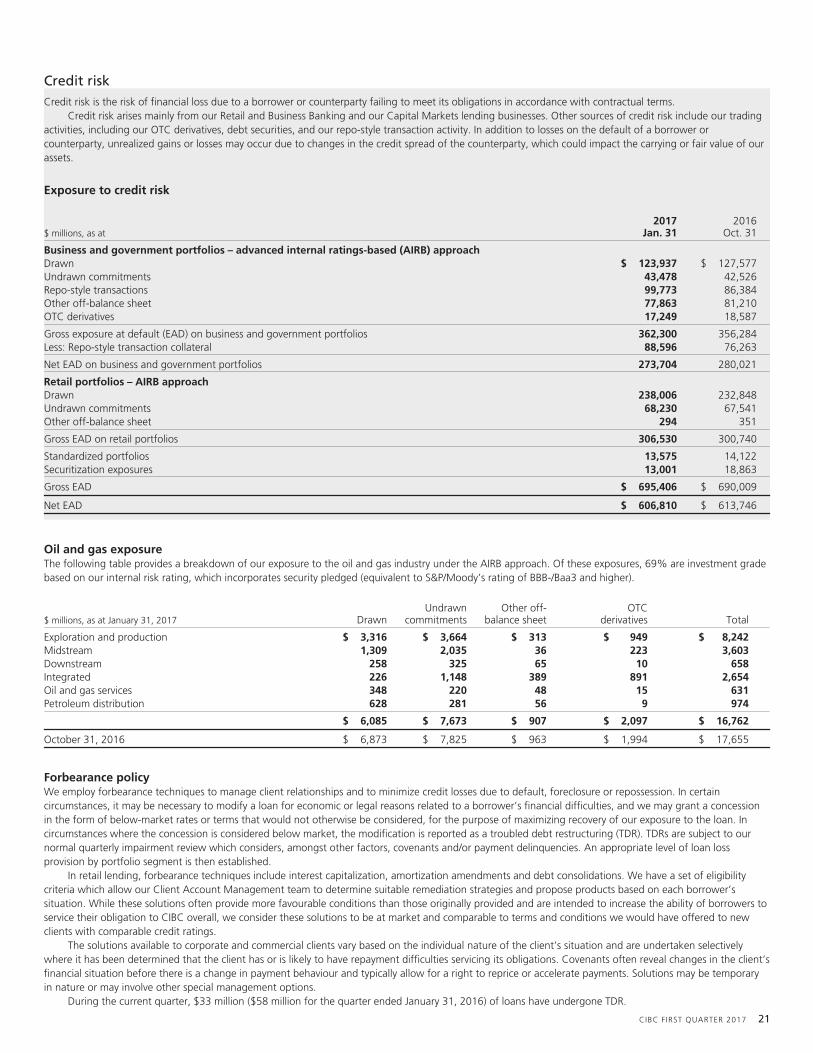
Credit riskCredit risk is the risk of financial loss due to a borrower or counterparty failing to meet its obligations in accordance with contractual terms.
Credit risk arises mainly from our Retail and Business Banking and our Capital Markets lending businesses. Other sources of credit risk include our tradingactivities, including our OTC derivatives, debt securities, and our repo-style transaction activity. In addition to losses on the default of a borrower orcounterparty, unrealized gains or losses may occur due to changes in the credit spread of the counterparty, which could impact the carrying or fair value of ourassets.
Exposure to credit risk
$ millions, as at2017
Jan. 312016
Oct. 31
Business and government portfolios – advanced internal ratings-based (AIRB) approachDrawn $ 123,937 $ 127,577Undrawn commitments 43,478 42,526Repo-style transactions 99,773 86,384Other off-balance sheet 77,863 81,210OTC derivatives 17,249 18,587
Gross exposure at default (EAD) on business and government portfolios 362,300 356,284Less: Repo-style transaction collateral 88,596 76,263
Net EAD on business and government portfolios 273,704 280,021
Retail portfolios – AIRB approachDrawn 238,006 232,848Undrawn commitments 68,230 67,541Other off-balance sheet 294 351
Gross EAD on retail portfolios 306,530 300,740
Standardized portfolios 13,575 14,122Securitization exposures 13,001 18,863
Gross EAD $ 695,406 $ 690,009
Net EAD $ 606,810 $ 613,746
Oil and gas exposureThe following table provides a breakdown of our exposure to the oil and gas industry under the AIRB approach. Of these exposures, 69% are investment gradebased on our internal risk rating, which incorporates security pledged (equivalent to S&P/Moody’s rating of BBB-/Baa3 and higher).
$ millions, as at January 31, 2017 DrawnUndrawn
commitmentsOther off-
balance sheetOTC
derivatives Total
Exploration and production $ 3,316 $ 3,664 $ 313 $ 949 $ 8,242Midstream 1,309 2,035 36 223 3,603Downstream 258 325 65 10 658Integrated 226 1,148 389 891 2,654Oil and gas services 348 220 48 15 631Petroleum distribution 628 281 56 9 974
$ 6,085 $ 7,673 $ 907 $ 2,097 $ 16,762
October 31, 2016 $ 6,873 $ 7,825 $ 963 $ 1,994 $ 17,655
Forbearance policyWe employ forbearance techniques to manage client relationships and to minimize credit losses due to default, foreclosure or repossession. In certaincircumstances, it may be necessary to modify a loan for economic or legal reasons related to a borrower’s financial difficulties, and we may grant a concessionin the form of below-market rates or terms that would not otherwise be considered, for the purpose of maximizing recovery of our exposure to the loan. Incircumstances where the concession is considered below market, the modification is reported as a troubled debt restructuring (TDR). TDRs are subject to ournormal quarterly impairment review which considers, amongst other factors, covenants and/or payment delinquencies. An appropriate level of loan lossprovision by portfolio segment is then established.
In retail lending, forbearance techniques include interest capitalization, amortization amendments and debt consolidations. We have a set of eligibilitycriteria which allow our Client Account Management team to determine suitable remediation strategies and propose products based on each borrower’ssituation. While these solutions often provide more favourable conditions than those originally provided and are intended to increase the ability of borrowers toservice their obligation to CIBC overall, we consider these solutions to be at market and comparable to terms and conditions we would have offered to newclients with comparable credit ratings.
The solutions available to corporate and commercial clients vary based on the individual nature of the client’s situation and are undertaken selectivelywhere it has been determined that the client has or is likely to have repayment difficulties servicing its obligations. Covenants often reveal changes in the client’sfinancial situation before there is a change in payment behaviour and typically allow for a right to reprice or accelerate payments. Solutions may be temporaryin nature or may involve other special management options.
During the current quarter, $33 million ($58 million for the quarter ended January 31, 2016) of loans have undergone TDR.
CIBC FIRST QUARTER 2017 21

Real estate secured personal lendingReal estate secured personal lending comprises residential mortgages and personal loans and lines secured by residential property (HELOC). This portfolio is lowrisk, as we have a first charge on the majority of the properties and a second lien on only a small portion of the portfolio. We use the same lending criteria inthe adjudication of both first lien and second lien loans.
The following table provides details on our residential mortgage and HELOC portfolios:
Residential mortgages HELOC (1) Total
$ billions, as at January 31, 2017 Insured Uninsured Uninsured Insured Uninsured
Ontario $ 44.4 49 % $ 46.6 51 % $ 10.3 100 % $ 44.4 44 % $ 56.9 56 %British Columbia and territories 16.0 40 24.3 60 4.2 100 16.0 36 28.5 64Alberta 16.2 64 9.2 36 2.7 100 16.2 58 11.9 42Quebec 7.4 56 5.9 44 1.5 100 7.4 50 7.4 50Central prairie provinces 4.9 65 2.6 35 0.9 100 4.9 59 3.5 41Atlantic provinces 5.5 65 2.9 35 0.8 100 5.5 59 3.7 41
Canadian portfolio (2)(3) 94.4 51 91.5 49 20.4 100 94.4 46 111.9 54International portfolio (2) – – 2.4 100 – – – – 2.4 100
Total portfolio $ 94.4 50 % $ 93.9 50 % $ 20.4 100 % $ 94.4 45 % $ 114.3 55 %
October 31, 2016 $ 97.4 53 % $ 85.9 47 % $ 20.3 100 % $ 97.4 48 % $ 106.2 52 %
(1) We did not have any insured HELOCs as at January 31, 2017 and October 31, 2016.(2) Geographical location is based on the address of the property managed.(3) 77% (October 31, 2016: 77%) of insurance on Canadian residential mortgages is provided by CMHC and the remaining by two private Canadian insurers, both rated at least AA (low) by DBRS Limited (DBRS).
The average loan-to-value (LTV) ratios(1) for our uninsured Canadian residential mortgages and HELOCs originated during the quarter are provided in thefollowing table. We did not acquire uninsured residential mortgages or HELOCs from a third party for the periods presented in the table below.
2017Jan. 31
2016Oct. 31
2016Jan. 31
For the three months endedResidentialmortgages HELOC
Residentialmortgages HELOC
Residentialmortgages HELOC
Ontario 64 % 68 % 64 % 68 % 64 % 69 %British Columbia and territories 59 63 59 63 60 64Alberta 68 73 68 73 68 72Quebec 68 72 68 72 67 72Central prairie provinces 69 74 69 73 69 74Atlantic provinces 72 74 72 73 72 74
Canadian portfolio (2) 64 % 67 % 64 % 67 % 64 % 68 %International portfolio 72 % n/m 74 % n/m 71 % n/m
(1) LTV ratios for newly originated residential mortgages and HELOCs are calculated based on weighted average.(2) Geographical location is based on the address of the property managed.n/m Not meaningful.
The following table provides the average LTV ratios on our total Canadian residential mortgage portfolio:
Insured Uninsured
January 31, 2017 (1) 57 % 56 %October 31, 2016 (1) 57 % 56 %
(1) LTV ratios for residential mortgages are calculated based on weighted average. The house price estimates for January 31, 2017 and October 31, 2016 are based on the Forward Sortation Area (FSA) levelindices from the Teranet – National Bank National Composite House Price Index (Teranet) as of December 31, 2016 and September 30, 2016, respectively. Teranet is an independent estimate of the rate ofchange in Canadian home prices.
The tables below summarize the remaining amortization profile of our total Canadian and international residential mortgages. The first table provides theremaining amortization periods based on the minimum contractual payment amounts. The second table provides the remaining amortization periods basedupon current customer payment amounts, which incorporate payments larger than the minimum contractual amount and/or higher frequency of payments.
Contractual payment basisLess than
5 years5–10years
10–15years
15–20years
20–25years
25–30years
30–35years
35 yearsand above
Canadian portfolioJanuary 31, 2017 – % – % 3 % 5 % 31 % 58 % 3 % – %October 31, 2016 – % – % 3 % 6 % 30 % 58 % 3 % – %
International portfolioJanuary 31, 2017 8 % 16 % 27 % 24 % 16 % 8 % 1 % – %October 31, 2016 8 % 16 % 27 % 24 % 16 % 8 % 1 % – %
Current customer payment basisLess than
5 years5–10years
10–15years
15–20years
20–25years
25–30years
30–35years
35 yearsand above
Canadian portfolioJanuary 31, 2017 2 % 5 % 8 % 12 % 34 % 38 % 1 % – %October 31, 2016 2 % 5 % 8 % 12 % 34 % 37 % 2 % – %
International portfolioJanuary 31, 2017 8 % 15 % 26 % 24 % 16 % 8 % 2 % 1 %October 31, 2016 8 % 16 % 26 % 23 % 16 % 8 % 2 % 1 %
22 CIBC FIRST QUARTER 2017

In July 2016, as a follow-up to its B-20 guidelines, OSFI released a letter to all federally regulated financial institutions reinforcing its expectation that theseinstitutions engage in prudent underwriting of residential mortgage loans.
In October 2016, the Minister of Finance announced changes to strengthen the housing market that will impose the use of the government-postedmortgage qualifying rates on a wider range of insured mortgages, and close loopholes related to the principal residence exemption for capital gains taxes.There will also be a consultation with market participants on an approach to implement risk sharing for insured mortgages (i.e., sharing losses between banksand insurers).
Reflective of the regulatory changes relating to mortgage insurance introduced over the past few years, including the most recent changes noted above,and a change in consumer behaviour in response to the series of government tightening measures on high ratio mortgages, we expect our insured mortgagemix as a proportion of total mortgages to decrease at an accelerated rate.
We have two types of condominium exposures in Canada: mortgages and developer loans. Both are primarily concentrated in the Toronto and Vancouverareas. As at January 31, 2017, our Canadian condominium mortgages were $21.4 billion (October 31, 2016: $20.6 billion) of which 51% (October 31, 2016:54%) were insured. Our drawn developer loans were $0.6 billion (October 31, 2016: $0.7 billion) or 0.8% (October 31, 2016: 0.8%) of our business andgovernment portfolio, and our related undrawn exposure was $2.7 billion (October 31, 2016: $2.2 billion). The condominium developer exposure is diversifiedacross 91 projects.
We stress test our mortgage and HELOC portfolio to determine the potential impact of different economic events. Our stress tests can use variables such asunemployment rates, debt service ratios and housing price changes, to model potential outcomes for a given set of circumstances. The stress testing involvesvariables that could behave differently in certain situations. Our main tests use economic variables in a similar range to historical events when Canadaexperienced economic downturns. Our results show that in an economic downturn, our strong capital position should be sufficient to absorb mortgage andHELOC losses.
Trading credit exposuresWe have trading credit exposure (also called counterparty credit exposure) that arises from our interest rate, foreign exchange, equity, commodity, and creditderivatives trading, hedging, and portfolio management activities, as described in Note 12 to the 2016 annual consolidated financial statements.
The following table shows the rating profile of OTC derivative mark-to-market (MTM) receivables:
$ billions, as at2017
Jan. 312016
Oct. 31
Exposure (1)
Investment grade $ 5.70 79.5 % $ 7.36 82.8 %Non-investment grade 1.35 18.8 1.43 16.1Watch list 0.05 0.7 0.03 0.3Default 0.05 0.7 0.05 0.6Unrated 0.02 0.3 0.02 0.2
$ 7.17 100.0 % $ 8.89 100.0 %
(1) MTM of the OTC derivative contracts is after the impact of master netting agreements, but before any collateral.
The following table provides details of our impaired loans and allowances for credit losses:
$ millions, as at or for the three months ended2017
Jan. 312016
Oct. 312016
Jan. 31
Business andgovernment
loansConsumer
loans Total
Business andgovernment
loansConsumer
loans Total
Business andgovernment
loansConsumer
loans Total
Gross impaired loansBalance at beginning of period $ 951 $ 707 $ 1,658 $ 1,035 $ 703 $ 1,738 $ 659 $ 760 $ 1,419
Classified as impaired during the period 85 314 399 68 326 394 58 271 329Transferred to not impaired during the period (19) (40) (59) – (28) (28) (4) (22) (26)Net repayments (87) (24) (111) (44) (70) (114) (46) (52) (98)Amounts written off (46) (234) (280) (124) (233) (357) (12) (197) (209)Recoveries of loans and advances previously written off – – – – – – – – –Disposals of loans (165) – (165) – – – – – –Foreign exchange and other (15) (9) (24) 16 9 25 33 29 62
Balance at end of period $ 704 $ 714 $ 1,418 $ 951 $ 707 $ 1,658 $ 688 $ 789 $ 1,477
Allowance for impairment (1)
Balance at beginning of period $ 259 $ 313 $ 572 $ 349 $ 320 $ 669 $ 313 $ 333 $ 646Amounts written off (46) (234) (280) (124) (233) (357) (12) (197) (209)Recoveries of amounts written off in previous periods 4 43 47 2 42 44 7 43 50Charge to income statement 13 198 211 29 184 213 28 163 191Interest accrued on impaired loans (6) (2) (8) (7) (2) (9) (4) (2) (6)Disposals of loans – – – – – – – – –Foreign exchange and other (11) (8) (19) 10 2 12 17 9 26
Balance at end of period $ 213 $ 310 $ 523 $ 259 $ 313 $ 572 $ 349 $ 349 $ 698
Net impaired loansBalance at beginning of period $ 692 $ 394 $ 1,086 $ 686 $ 383 $ 1,069 $ 346 $ 427 $ 773
Net change in gross impaired (247) 7 (240) (84) 4 (80) 29 29 58Net change in allowance 46 3 49 90 7 97 (36) (16) (52)
Balance at end of period $ 491 $ 404 $ 895 $ 692 $ 394 $ 1,086 $ 339 $ 440 $ 779
Net impaired loans as a percentage of net loans and acceptances 0.28 % 0.34 % 0.26 %
(1) Includes collective allowance relating to personal, scored small business and mortgage impaired loans that are greater than 90 days delinquent, and individual allowance.
Gross impaired loansAs at January 31, 2017, gross impaired loans were $1,418 million, down $59 million from the same quarter last year. The decrease was primarily due to theimpact of U.S. dollar depreciation on our existing portfolio. A decrease in CIBC FirstCaribbean, driven by higher write-offs, was partially offset by an increase inthe U.S. oil and gas sector and an increase in the Canadian residential mortgage portfolio.
Gross impaired loans were down $240 million from the prior quarter, primarily due to a reduction in our exited European leveraged finance portfolio andthe impact of U.S. dollar depreciation on our existing portfolio.
Approximately 40% of gross impaired loans related to Canada, of which the residential mortgages, personal lending, and oil and gas sectors accountedfor the majority.
CIBC FIRST QUARTER 2017 23

Approximately 37% of gross impaired loans related to CIBC FirstCaribbean, of which the residential mortgages and real estate and construction sectorsaccounted for the majority.
Approximately 23% of gross impaired loans related to the U.S., of which the oil and gas sector accounted for the majority.
Allowance for impairmentAllowance for impairment was $523 million, down $175 million from the same quarter last year. The decrease was primarily due to higher write-offs in CIBCFirstCaribbean and the Canadian oil and gas sector, and the impact of U.S. dollar depreciation on our existing portfolio.
Allowance for impairment was down $49 million from the prior quarter, mainly due to the reduction in our exited European leveraged finance portfolionoted above.
Exposure to certain countries and regionsOver the past several years, a number of countries in Europe experienced credit concerns. The following tables provide our exposure to European countries,both within and outside the Eurozone.
Our direct exposures presented in the tables below comprise (A) funded – on-balance sheet loans (stated at amortized cost net of individual allowances, if any),deposits with banks (stated at amortized cost net of individual allowances, if any) and securities (stated at fair value); (B) unfunded – unutilized creditcommitments, letters of credit, and guarantees (stated at notional amount net of individual allowances, if any) and sold credit default swap (CDS) contractswhere we do not benefit from subordination (stated at notional amount less fair value); and (C) derivative MTM receivables (stated at fair value) and repo-styletransactions (stated at fair value).
Of our total direct exposures to Europe, approximately 34% (October 31, 2016: 34%) is to entities in countries with Aaa/AAA ratings from at least one ofMoody’s or S&P.
The following tables provide a summary of our positions in this business:
Direct exposures
Funded Unfunded
$ millions, as at January 31, 2017 Corporate Sovereign BankTotal funded
(A) Corporate BankTotal unfunded
(B)
Austria $ – $ 258 $ – $ 258 $ – $ 2 $ 2Belgium – – 9 9 – – –Finland 22 1 – 23 62 – 62France 49 – 580 629 70 7 77Germany 77 506 377 960 3 24 27Ireland 2 – – 2 – 13 13Italy – – – – – – –Luxembourg 2 – – 2 5 37 42Netherlands 311 17 141 469 182 53 235Spain – – 2 2 – – –
Total Eurozone $ 463 $ 782 $ 1,109 $ 2,354 $ 322 $ 136 $ 458
Czech Republic $ – $ – $ – $ – $ – $ – $ –Denmark – – 7 7 – 6 6Norway – – 3 3 310 – 310Poland – – 1 1 – – –Sweden 121 300 3 424 82 – 82Switzerland 233 – 54 287 72 10 82Turkey – – 80 80 – 16 16United Kingdom 711 397 538 1,646 2,579 258 2,837
Total non-Eurozone $ 1,065 $ 697 $ 686 $ 2,448 $ 3,043 $ 290 $ 3,333
Total Europe (1) $ 1,528 $ 1,479 $ 1,795 $ 4,802 $ 3,365 $ 426 $ 3,791
October 31, 2016 $ 1,684 $ 1,401 $ 1,488 $ 4,573 $ 3,347 $ 296 $ 3,643
(1) Includes nil (October 31, 2016: $162 million) of loans, net of allowance, related to the discontinued European leveraged finance business.
24 CIBC FIRST QUARTER 2017
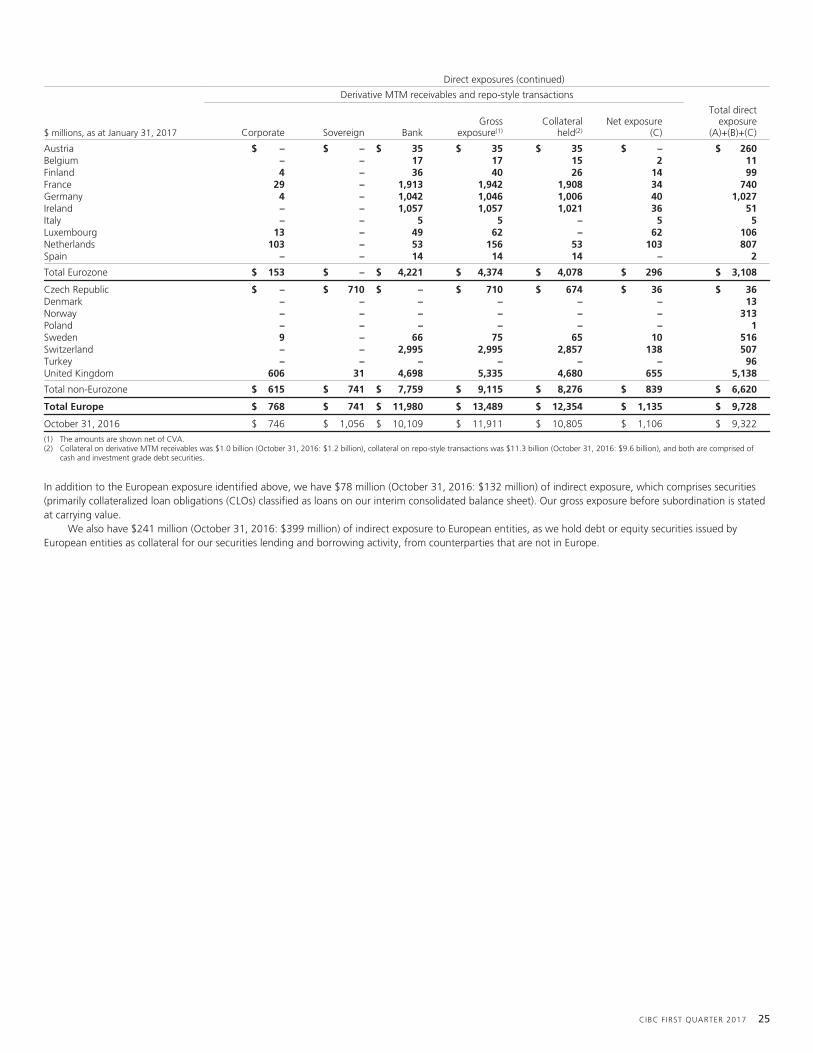
Direct exposures (continued)
Derivative MTM receivables and repo-style transactions
$ millions, as at January 31, 2017 Corporate Sovereign BankGross
exposure(1)Collateral
held(2)Net exposure
(C)
Total directexposure
(A)+(B)+(C)
Austria $ – $ – $ 35 $ 35 $ 35 $ – $ 260Belgium – – 17 17 15 2 11Finland 4 – 36 40 26 14 99France 29 – 1,913 1,942 1,908 34 740Germany 4 – 1,042 1,046 1,006 40 1,027Ireland – – 1,057 1,057 1,021 36 51Italy – – 5 5 – 5 5Luxembourg 13 – 49 62 – 62 106Netherlands 103 – 53 156 53 103 807Spain – – 14 14 14 – 2
Total Eurozone $ 153 $ – $ 4,221 $ 4,374 $ 4,078 $ 296 $ 3,108
Czech Republic $ – $ 710 $ – $ 710 $ 674 $ 36 $ 36Denmark – – – – – – 13Norway – – – – – – 313Poland – – – – – – 1Sweden 9 – 66 75 65 10 516Switzerland – – 2,995 2,995 2,857 138 507Turkey – – – – – – 96United Kingdom 606 31 4,698 5,335 4,680 655 5,138
Total non-Eurozone $ 615 $ 741 $ 7,759 $ 9,115 $ 8,276 $ 839 $ 6,620
Total Europe $ 768 $ 741 $ 11,980 $ 13,489 $ 12,354 $ 1,135 $ 9,728
October 31, 2016 $ 746 $ 1,056 $ 10,109 $ 11,911 $ 10,805 $ 1,106 $ 9,322
(1) The amounts are shown net of CVA.(2) Collateral on derivative MTM receivables was $1.0 billion (October 31, 2016: $1.2 billion), collateral on repo-style transactions was $11.3 billion (October 31, 2016: $9.6 billion), and both are comprised of
cash and investment grade debt securities.
In addition to the European exposure identified above, we have $78 million (October 31, 2016: $132 million) of indirect exposure, which comprises securities(primarily collateralized loan obligations (CLOs) classified as loans on our interim consolidated balance sheet). Our gross exposure before subordination is statedat carrying value.
We also have $241 million (October 31, 2016: $399 million) of indirect exposure to European entities, as we hold debt or equity securities issued byEuropean entities as collateral for our securities lending and borrowing activity, from counterparties that are not in Europe.
CIBC FIRST QUARTER 2017 25

Selected exposures in certain activitiesIn response to the recommendations of the Financial Stability Board, this section provides information on our other selected activities within our continuing andexited businesses that may be of particular interest to investors based on their risk characteristics and the current market environment. For additionalinformation on these selected exposures, refer to page 60 of the 2016 Annual Report.
Structured credit run-off businessIn 2008, management made a decision to wind down our exposure in the structured credit business. The following table provides a summary of our exposures:
Written credit derivatives,liquidity and credit
facilities
Purchased credit protection
US$ millions, as at January 31, 2017 Investment and loans (1)
Financialguarantors
Othercounterparties
Notional
Fair valuetrading, AFS
and FVOsecurities
Fairvalue of
securitiesclassifiedas loans
Carryingvalue of
securitiesclassifiedas loans Notional Fair value Notional
Fair valuenet of
CVA Notional
Fair valuenet of
CVA
$ 331 $ 70 $ 163 $ 163 $ 174 $ 107 $ 160 $ 1 $ 135 $ 107
October 31, 2016 $ 611 $ 252 $ 236 $ 236 $ 3,695 $ 120 $ 282 $ 2 $ 3,821 $ 103
(1) Excluded from the table above is an equity AFS security that we obtained in consideration for commutation of our U.S. residential mortgage market (USRMM) contracts with financial guarantors with a carryingvalue of US$7 million (October 31, 2016: US$5 million).
As at January 31, 2017, our significant positions in investments and loans include:• US$170 million notional value of CLO positions classified at amortized cost, consisting of first priority tranches of CLOs, backed by diversified pools of
primarily U.S. and European-based senior secured leveraged loans. As at January 31, 2017, 100% of the total notional amount of the CLO tranches wererated Aaa by Moody’s Investors Service, Inc. (Moody’s). The CLO positions have a carrying value of US$151 million and a weighted-average life of 1.3years.
• Notes that were originally received in exchange for our non-bank sponsored asset-backed commercial paper (ABCP) in January 2009, upon the ratificationof the Montreal Accord restructuring, which include loans classified at amortized cost with a notional value of US$49 million and fair value and carryingvalue of nil; and
• US$88 million notional value of CDOs consisting of trust preferred securities (TruPs) collateral, which are Tier I Innovative Capital Instruments issued by U.S.regional banks and insurers. These securities are classified as FVO securities and had a fair value of US$70 million.
As at January 31, 2017, our significant positions in written and purchased credit derivatives include:• USRMM CDO positions consisting of a written and purchased credit derivative with the same notional value of US$135 million.• US$160 million notional value of credit protection purchased from financial guarantors that are hedging the CLO positions.
During the quarter, our exposure significantly decreased due to maturities and unwinds, including the maturity of a corporate debt exposure, where CIBC hadpurchased and sold credit protection with a notional value of US$3.3 billion. Net income after tax for the quarter was $10 million, compared with net losses of$4 million and $7 million for the same quarter last year and the prior quarter, respectively.
U.S. real estate financeThe following table provides a summary of our positions in this business:
$ millions, as at January 31, 2017 Drawn Undrawn
Construction program $ 78 $ 381Interim program 8,262 487Permanent program 67 –
Exposure, net of allowance $ 8,407 $ 868
Of the above:Net impaired $ 40 $ –On credit watch list 130 9
Exposure, net of allowance, as at October 31, 2016 $ 8,827 $ 947
As at January 31, 2017, the allowance for credit losses for this portfolio was $25 million (October 31, 2016: $24 million). During the quarter ended January 31,2017, the provision for credit losses was $2 million ($1 million for the quarter ended January 31, 2016).
26 CIBC FIRST QUARTER 2017
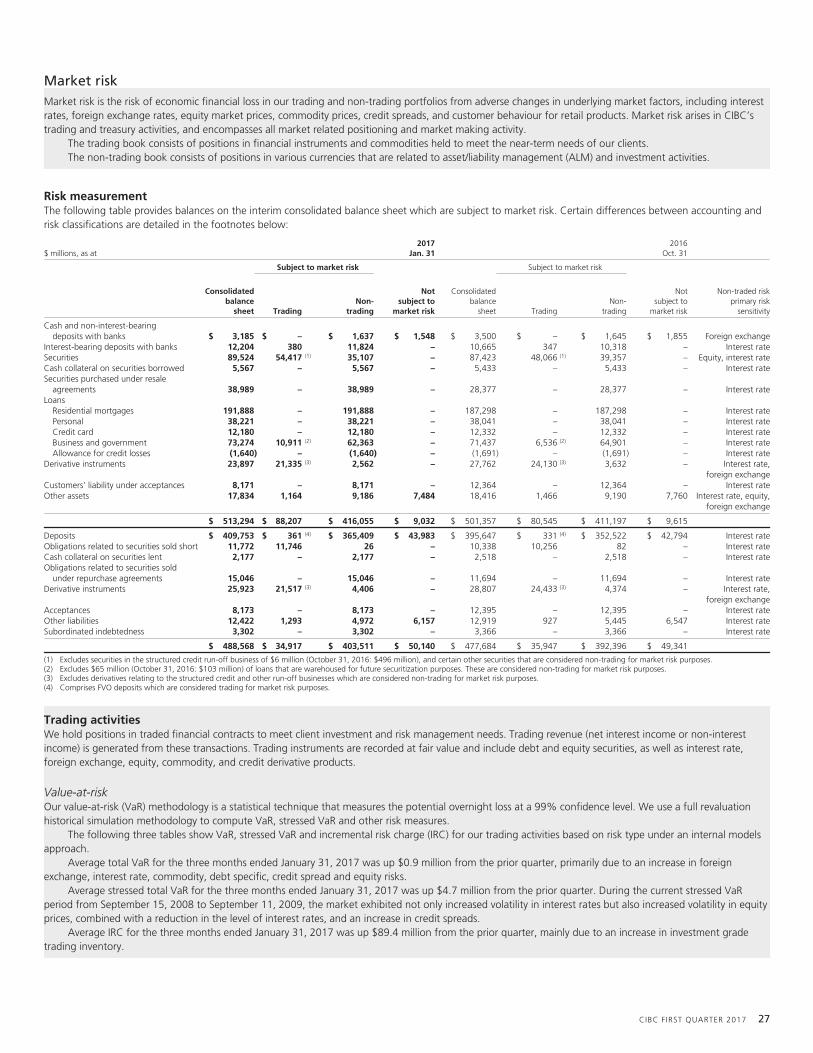
Market riskMarket risk is the risk of economic financial loss in our trading and non-trading portfolios from adverse changes in underlying market factors, including interestrates, foreign exchange rates, equity market prices, commodity prices, credit spreads, and customer behaviour for retail products. Market risk arises in CIBC’strading and treasury activities, and encompasses all market related positioning and market making activity.
The trading book consists of positions in financial instruments and commodities held to meet the near-term needs of our clients.The non-trading book consists of positions in various currencies that are related to asset/liability management (ALM) and investment activities.
Risk measurementThe following table provides balances on the interim consolidated balance sheet which are subject to market risk. Certain differences between accounting andrisk classifications are detailed in the footnotes below:
$ millions, as at2017
Jan. 312016
Oct. 31
Subject to market risk Subject to market risk
Consolidatedbalance
sheet TradingNon-
trading
Notsubject to
market risk
Consolidatedbalance
sheet TradingNon-
trading
Notsubject to
market risk
Non-traded riskprimary risk
sensitivity
Cash and non-interest-bearingdeposits with banks $ 3,185 $ – $ 1,637 $ 1,548 $ 3,500 $ – $ 1,645 $ 1,855 Foreign exchange
Interest-bearing deposits with banks 12,204 380 11,824 – 10,665 347 10,318 – Interest rateSecurities 89,524 54,417 (1) 35,107 – 87,423 48,066 (1) 39,357 – Equity, interest rateCash collateral on securities borrowed 5,567 – 5,567 – 5,433 – 5,433 – Interest rateSecurities purchased under resale
agreements 38,989 – 38,989 – 28,377 – 28,377 – Interest rateLoans
Residential mortgages 191,888 – 191,888 – 187,298 – 187,298 – Interest ratePersonal 38,221 – 38,221 – 38,041 – 38,041 – Interest rateCredit card 12,180 – 12,180 – 12,332 – 12,332 – Interest rateBusiness and government 73,274 10,911 (2) 62,363 – 71,437 6,536 (2) 64,901 – Interest rateAllowance for credit losses (1,640) – (1,640) – (1,691) – (1,691) – Interest rate
Derivative instruments 23,897 21,335 (3) 2,562 – 27,762 24,130 (3) 3,632 – Interest rate,foreign exchange
Customers’ liability under acceptances 8,171 – 8,171 – 12,364 – 12,364 – Interest rateOther assets 17,834 1,164 9,186 7,484 18,416 1,466 9,190 7,760 Interest rate, equity,
foreign exchange
$ 513,294 $ 88,207 $ 416,055 $ 9,032 $ 501,357 $ 80,545 $ 411,197 $ 9,615
Deposits $ 409,753 $ 361 (4) $ 365,409 $ 43,983 $ 395,647 $ 331 (4) $ 352,522 $ 42,794 Interest rateObligations related to securities sold short 11,772 11,746 26 – 10,338 10,256 82 – Interest rateCash collateral on securities lent 2,177 – 2,177 – 2,518 – 2,518 – Interest rateObligations related to securities sold
under repurchase agreements 15,046 – 15,046 – 11,694 – 11,694 – Interest rateDerivative instruments 25,923 21,517 (3) 4,406 – 28,807 24,433 (3) 4,374 – Interest rate,
foreign exchangeAcceptances 8,173 – 8,173 – 12,395 – 12,395 – Interest rateOther liabilities 12,422 1,293 4,972 6,157 12,919 927 5,445 6,547 Interest rateSubordinated indebtedness 3,302 – 3,302 – 3,366 – 3,366 – Interest rate
$ 488,568 $ 34,917 $ 403,511 $ 50,140 $ 477,684 $ 35,947 $ 392,396 $ 49,341
(1) Excludes securities in the structured credit run-off business of $6 million (October 31, 2016: $496 million), and certain other securities that are considered non-trading for market risk purposes.(2) Excludes $65 million (October 31, 2016: $103 million) of loans that are warehoused for future securitization purposes. These are considered non-trading for market risk purposes.(3) Excludes derivatives relating to the structured credit and other run-off businesses which are considered non-trading for market risk purposes.(4) Comprises FVO deposits which are considered trading for market risk purposes.
Trading activitiesWe hold positions in traded financial contracts to meet client investment and risk management needs. Trading revenue (net interest income or non-interestincome) is generated from these transactions. Trading instruments are recorded at fair value and include debt and equity securities, as well as interest rate,foreign exchange, equity, commodity, and credit derivative products.
Value-at-riskOur value-at-risk (VaR) methodology is a statistical technique that measures the potential overnight loss at a 99% confidence level. We use a full revaluationhistorical simulation methodology to compute VaR, stressed VaR and other risk measures.
The following three tables show VaR, stressed VaR and incremental risk charge (IRC) for our trading activities based on risk type under an internal modelsapproach.
Average total VaR for the three months ended January 31, 2017 was up $0.9 million from the prior quarter, primarily due to an increase in foreignexchange, interest rate, commodity, debt specific, credit spread and equity risks.
Average stressed total VaR for the three months ended January 31, 2017 was up $4.7 million from the prior quarter. During the current stressed VaRperiod from September 15, 2008 to September 11, 2009, the market exhibited not only increased volatility in interest rates but also increased volatility in equityprices, combined with a reduction in the level of interest rates, and an increase in credit spreads.
Average IRC for the three months ended January 31, 2017 was up $89.4 million from the prior quarter, mainly due to an increase in investment gradetrading inventory.
CIBC FIRST QUARTER 2017 27
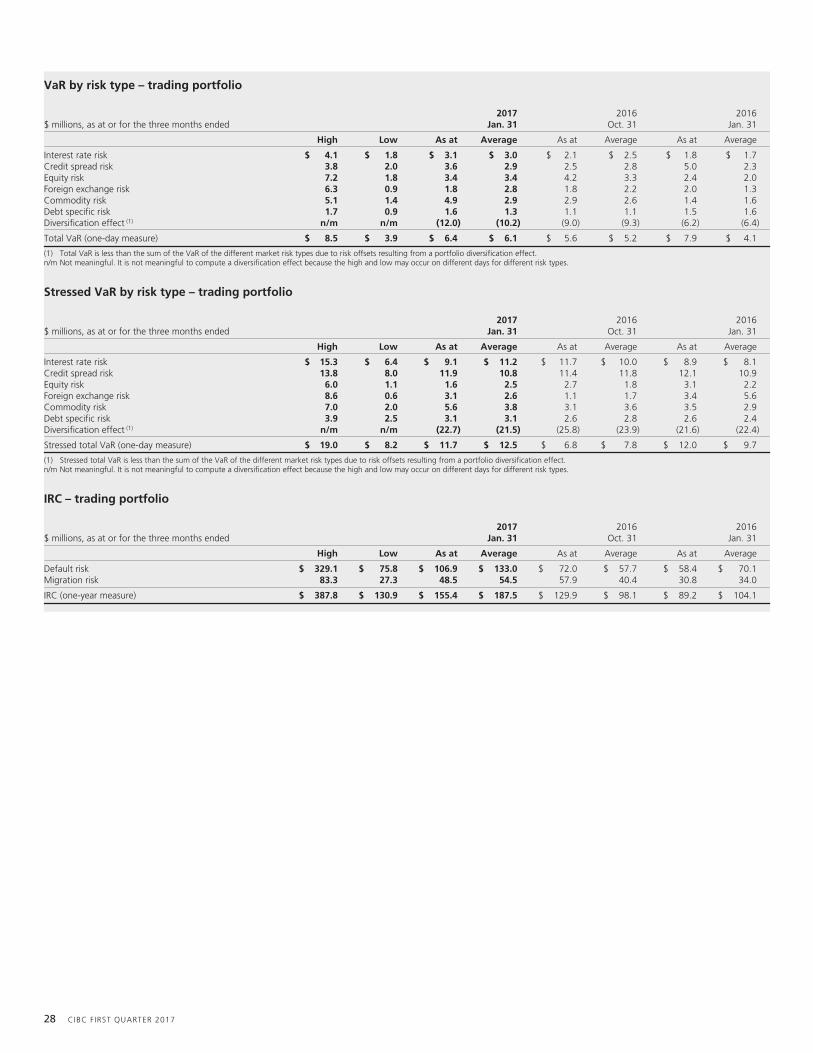
VaR by risk type – trading portfolio
$ millions, as at or for the three months ended2017
Jan. 312016
Oct. 312016
Jan. 31
High Low As at Average As at Average As at Average
Interest rate risk $ 4.1 $ 1.8 $ 3.1 $ 3.0 $ 2.1 $ 2.5 $ 1.8 $ 1.7Credit spread risk 3.8 2.0 3.6 2.9 2.5 2.8 5.0 2.3Equity risk 7.2 1.8 3.4 3.4 4.2 3.3 2.4 2.0Foreign exchange risk 6.3 0.9 1.8 2.8 1.8 2.2 2.0 1.3Commodity risk 5.1 1.4 4.9 2.9 2.9 2.6 1.4 1.6Debt specific risk 1.7 0.9 1.6 1.3 1.1 1.1 1.5 1.6Diversification effect (1) n/m n/m (12.0) (10.2) (9.0) (9.3) (6.2) (6.4)
Total VaR (one-day measure) $ 8.5 $ 3.9 $ 6.4 $ 6.1 $ 5.6 $ 5.2 $ 7.9 $ 4.1
(1) Total VaR is less than the sum of the VaR of the different market risk types due to risk offsets resulting from a portfolio diversification effect.n/m Not meaningful. It is not meaningful to compute a diversification effect because the high and low may occur on different days for different risk types.
Stressed VaR by risk type – trading portfolio
$ millions, as at or for the three months ended2017
Jan. 312016
Oct. 312016
Jan. 31
High Low As at Average As at Average As at Average
Interest rate risk $ 15.3 $ 6.4 $ 9.1 $ 11.2 $ 11.7 $ 10.0 $ 8.9 $ 8.1Credit spread risk 13.8 8.0 11.9 10.8 11.4 11.8 12.1 10.9Equity risk 6.0 1.1 1.6 2.5 2.7 1.8 3.1 2.2Foreign exchange risk 8.6 0.6 3.1 2.6 1.1 1.7 3.4 5.6Commodity risk 7.0 2.0 5.6 3.8 3.1 3.6 3.5 2.9Debt specific risk 3.9 2.5 3.1 3.1 2.6 2.8 2.6 2.4Diversification effect (1) n/m n/m (22.7) (21.5) (25.8) (23.9) (21.6) (22.4)
Stressed total VaR (one-day measure) $ 19.0 $ 8.2 $ 11.7 $ 12.5 $ 6.8 $ 7.8 $ 12.0 $ 9.7
(1) Stressed total VaR is less than the sum of the VaR of the different market risk types due to risk offsets resulting from a portfolio diversification effect.n/m Not meaningful. It is not meaningful to compute a diversification effect because the high and low may occur on different days for different risk types.
IRC – trading portfolio
$ millions, as at or for the three months ended2017
Jan. 312016
Oct. 312016
Jan. 31
High Low As at Average As at Average As at Average
Default risk $ 329.1 $ 75.8 $ 106.9 $ 133.0 $ 72.0 $ 57.7 $ 58.4 $ 70.1Migration risk 83.3 27.3 48.5 54.5 57.9 40.4 30.8 34.0
IRC (one-year measure) $ 387.8 $ 130.9 $ 155.4 $ 187.5 $ 129.9 $ 98.1 $ 89.2 $ 104.1
28 CIBC FIRST QUARTER 2017
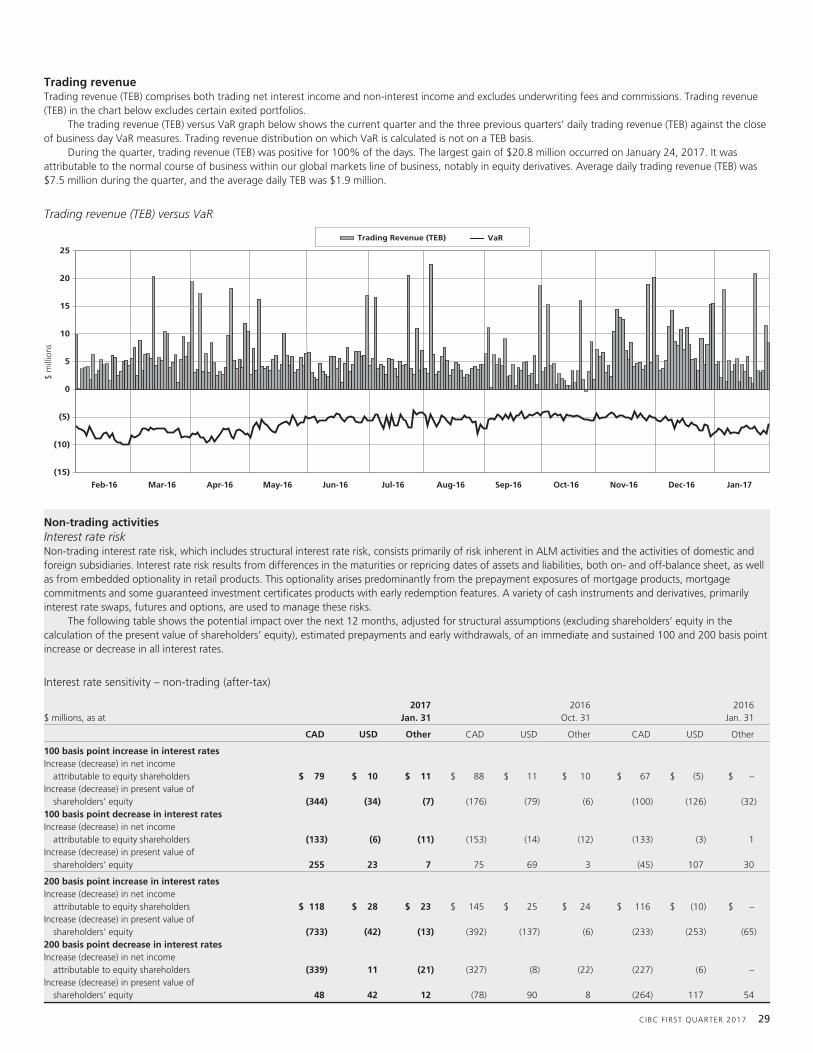
Trading revenueTrading revenue (TEB) comprises both trading net interest income and non-interest income and excludes underwriting fees and commissions. Trading revenue(TEB) in the chart below excludes certain exited portfolios.
The trading revenue (TEB) versus VaR graph below shows the current quarter and the three previous quarters’ daily trading revenue (TEB) against the closeof business day VaR measures. Trading revenue distribution on which VaR is calculated is not on a TEB basis.
During the quarter, trading revenue (TEB) was positive for 100% of the days. The largest gain of $20.8 million occurred on January 24, 2017. It wasattributable to the normal course of business within our global markets line of business, notably in equity derivatives. Average daily trading revenue (TEB) was$7.5 million during the quarter, and the average daily TEB was $1.9 million.
Trading revenue (TEB) versus VaR
$ m
illio
ns
(15)
(10)
0
(5)
5
10
15
20
25
Feb-16 Mar-16 Apr-16 May-16 Jun-16 Jul-16 Aug-16 Dec-16 Jan-17
Trading Revenue (TEB) VaR
Nov-16Oct-16Sep-16
Non-trading activitiesInterest rate riskNon-trading interest rate risk, which includes structural interest rate risk, consists primarily of risk inherent in ALM activities and the activities of domestic andforeign subsidiaries. Interest rate risk results from differences in the maturities or repricing dates of assets and liabilities, both on- and off-balance sheet, as wellas from embedded optionality in retail products. This optionality arises predominantly from the prepayment exposures of mortgage products, mortgagecommitments and some guaranteed investment certificates products with early redemption features. A variety of cash instruments and derivatives, primarilyinterest rate swaps, futures and options, are used to manage these risks.
The following table shows the potential impact over the next 12 months, adjusted for structural assumptions (excluding shareholders’ equity in thecalculation of the present value of shareholders’ equity), estimated prepayments and early withdrawals, of an immediate and sustained 100 and 200 basis pointincrease or decrease in all interest rates.
Interest rate sensitivity – non-trading (after-tax)
$ millions, as at2017
Jan. 312016
Oct. 312016
Jan. 31
CAD USD Other CAD USD Other CAD USD Other
100 basis point increase in interest ratesIncrease (decrease) in net income
attributable to equity shareholders $ 79 $ 10 $ 11 $ 88 $ 11 $ 10 $ 67 $ (5) $ –Increase (decrease) in present value of
shareholders’ equity (344) (34) (7) (176) (79) (6) (100) (126) (32)100 basis point decrease in interest ratesIncrease (decrease) in net income
attributable to equity shareholders (133) (6) (11) (153) (14) (12) (133) (3) 1Increase (decrease) in present value of
shareholders’ equity 255 23 7 75 69 3 (45) 107 30
200 basis point increase in interest ratesIncrease (decrease) in net income
attributable to equity shareholders $ 118 $ 28 $ 23 $ 145 $ 25 $ 24 $ 116 $ (10) $ –Increase (decrease) in present value of
shareholders’ equity (733) (42) (13) (392) (137) (6) (233) (253) (65)200 basis point decrease in interest ratesIncrease (decrease) in net income
attributable to equity shareholders (339) 11 (21) (327) (8) (22) (227) (6) –Increase (decrease) in present value of
shareholders’ equity 48 42 12 (78) 90 8 (264) 117 54
CIBC FIRST QUARTER 2017 29

Liquidity risk
Liquidity risk is the risk of having insufficient cash or its equivalent in a timely and cost-effective manner to meet financial obligations as they come due.Common sources of liquidity risk inherent in banking services include unanticipated withdrawals of deposits, the inability to replace maturing debt, credit andliquidity commitments, and additional pledging or other collateral requirements.
CIBC possesses a comprehensive liquidity management framework that supports our business strategy, aligns with our risk appetite and limits establishedwithin the liquidity risk management policy, and adheres to regulatory expectations. The liquidity risk management policy requires we maintain sufficient liquidassets and diversified funding sources to consistently fund our balance sheet, commitments and contingent obligations, in order to maintain the strength of ourenterprise under both normal and stressed conditions.
Our management strategies, objectives and practices are regularly reviewed to align with changes to the liquidity environment, including regulatory,business and/or market developments. Liquidity risk remains within CIBC’s risk appetite.
Governance and managementWe manage liquidity risk in a manner that enables us to withstand a liquidity stress event without an adverse impact on the viability of our operations. Actualand anticipated cash flows generated from on- and off-balance sheet exposures are routinely measured and monitored to ensure compliance with establishedlimits. CIBC incorporates stress testing into its management and measurement of liquidity risk. Stress test results assist with the development of our liquidityassumptions, identification of potential constraints to funding planning, and contribute to the design of CIBC’s contingency funding plan (CFP).
The Global Asset Liability Committee (GALCO) governs CIBC’s liquidity risk management, ensuring the liquidity risk management methodologies,assumptions, and key metrics such as the Liquidity Horizon, are regularly reviewed and aligned with our operating regulatory requirements. The Liquidity RiskManagement Committee is responsible for supporting GALCO to ensure that CIBC’s liquidity risk profile is comprehensively measured and managed inalignment with CIBC’s strategic direction, risk appetite and regulatory requirements.
The Risk Management Committee (RMC) approves CIBC’s liquidity risk management policy, CFP, and recommends liquidity risk tolerance to the Boardthrough the risk appetite statement.
Liquid and encumbered assetsAvailable liquid assets include cash, high quality marketable securities and other assets that can be used to access funding in a timely fashion. Encumberedassets, composed of assets pledged as collateral and those assets that are deemed restricted due to legal, operational, or other purposes, are not considered assources of available liquidity when measuring liquidity risk.
Unencumbered assets from on- and off-balance sheet sources are summarized as follows:
$ millions, as at2017
Jan. 312016
Oct. 31
Gross liquid assets Encumbered liquid assets (1) Unencumbered liquid assets
CIBC owned assets Third-party assets CIBC owned assets Third-party assets
Cash and due from banks $ 15,389 (2) $ – $ 517 $ – $ 14,872 $ 13,665Securities 89,068 (3) 93,268 (4) 26,818 51,621 103,897 91,378National Housing Act mortgage-backed securities 51,512 (5) – 20,583 – 30,929 26,223Mortgages 13,658 (6) – 13,658 – – –Credit cards 2,356 (7) – 2,356 – – –Other assets 6,049 (8) – 5,684 – 365 586
$ 178,032 $ 93,268 $ 69,616 $ 51,621 $ 150,063 $ 131,852(1) Excludes intraday pledges to the Bank of Canada related to the Large Value Transfer System as these are normally released at the end of the settlement cycle each day.(2) Includes cash, non-interest-bearing deposits and interest-bearing deposits with contractual maturities of less than 30 days.(3) Includes trading, AFS and FVO securities. Excludes securities in our structured credit run-off business, private debt and private equity securities of $456 million (October 31, 2016: $944 million).(4) Includes $5,567 million (October 31, 2016: $5,433 million) of cash collateral received on securities borrowed, $38,989 million (October 31, 2016: $28,377 million) of securities purchased under resale
agreements, $43,830 million (October 31, 2016: $38,657 million) of securities borrowed against securities lent, and $4,882 million (October 31, 2016: $1,257 million) of securities received for derivativecollateral.
(5) Includes securitized and transferred residential mortgages under the Canada Mortgage Bond Programme, and securitized mortgages that were not transferred to external parties. These are reported as Loanson our interim consolidated balance sheet.
(6) Includes mortgages in the Covered Bond Programme.(7) Includes assets held in consolidated trusts supporting funding liabilities.(8) Includes $5,684 million (October 31, 2016: $6,022 million) of cash pledged as collateral for derivatives and $365 million (October 31, 2016: $586 million) of gold and silver certificates.
The following table summarizes unencumbered liquid assets held by CIBC (parent) and significant subsidiaries:
$ millions, as at2017
Jan. 312016
Oct. 31
CIBC (parent) $ 120,803 $ 96,027CIBC World Markets Inc. (1) 13,385 18,387Other subsidiaries 15,875 17,438
$ 150,063 $ 131,852(1) Includes CIBC World Markets Inc. and CIBC World Markets Corp.
Asset haircuts and monetization depth assumptions under a liquidity stress scenario are applied to determine asset liquidity value. Haircuts take intoconsideration those margins applicable at central banks – such as the Bank of Canada and the Federal Reserve Bank – historical observations, and securitiescharacteristics including asset type, issuer, credit ratings, currency and remaining term to maturity, as well as available regulatory guidance.
Our unencumbered liquid assets increased by $18.2 billion or 14% from October 31, 2016, primarily due to an increase in securities purchased underresale agreements.
Furthermore, CIBC maintains access eligibility to the Bank of Canada’s Emergency Lending Assistance (ELA) program and the Federal Reserve Bank’sDiscount Window.
30 CIBC FIRST QUARTER 2017
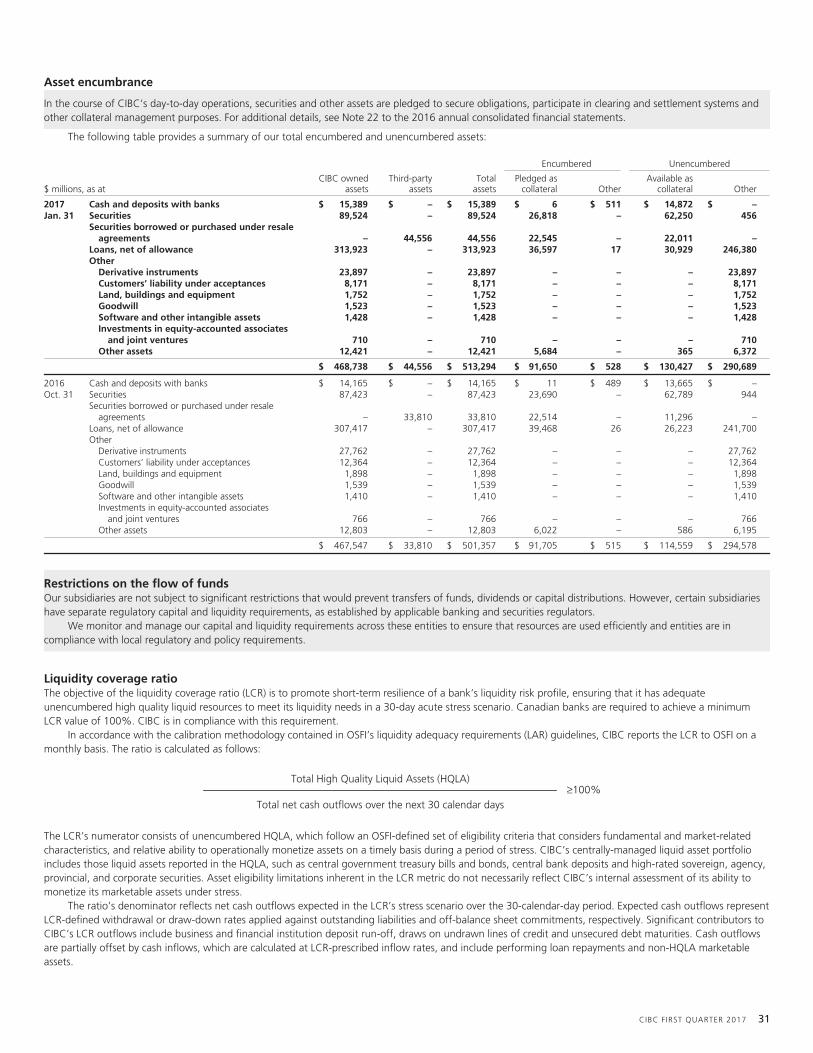
Asset encumbrance
In the course of CIBC’s day-to-day operations, securities and other assets are pledged to secure obligations, participate in clearing and settlement systems andother collateral management purposes. For additional details, see Note 22 to the 2016 annual consolidated financial statements.
The following table provides a summary of our total encumbered and unencumbered assets:
Encumbered Unencumbered
$ millions, as atCIBC owned
assetsThird-party
assetsTotal
assetsPledged as
collateral OtherAvailable as
collateral Other
2017 Cash and deposits with banks $ 15,389 $ – $ 15,389 $ 6 $ 511 $ 14,872 $ –Jan. 31 Securities 89,524 – 89,524 26,818 – 62,250 456
Securities borrowed or purchased under resaleagreements – 44,556 44,556 22,545 – 22,011 –
Loans, net of allowance 313,923 – 313,923 36,597 17 30,929 246,380Other
Derivative instruments 23,897 – 23,897 – – – 23,897Customers’ liability under acceptances 8,171 – 8,171 – – – 8,171Land, buildings and equipment 1,752 – 1,752 – – – 1,752Goodwill 1,523 – 1,523 – – – 1,523Software and other intangible assets 1,428 – 1,428 – – – 1,428Investments in equity-accounted associates
and joint ventures 710 – 710 – – – 710Other assets 12,421 – 12,421 5,684 – 365 6,372
$ 468,738 $ 44,556 $ 513,294 $ 91,650 $ 528 $ 130,427 $ 290,689
2016 Cash and deposits with banks $ 14,165 $ – $ 14,165 $ 11 $ 489 $ 13,665 $ –Oct. 31 Securities 87,423 – 87,423 23,690 – 62,789 944
Securities borrowed or purchased under resaleagreements – 33,810 33,810 22,514 – 11,296 –
Loans, net of allowance 307,417 – 307,417 39,468 26 26,223 241,700Other
Derivative instruments 27,762 – 27,762 – – – 27,762Customers’ liability under acceptances 12,364 – 12,364 – – – 12,364Land, buildings and equipment 1,898 – 1,898 – – – 1,898Goodwill 1,539 – 1,539 – – – 1,539Software and other intangible assets 1,410 – 1,410 – – – 1,410Investments in equity-accounted associates
and joint ventures 766 – 766 – – – 766Other assets 12,803 – 12,803 6,022 – 586 6,195
$ 467,547 $ 33,810 $ 501,357 $ 91,705 $ 515 $ 114,559 $ 294,578
Restrictions on the flow of fundsOur subsidiaries are not subject to significant restrictions that would prevent transfers of funds, dividends or capital distributions. However, certain subsidiarieshave separate regulatory capital and liquidity requirements, as established by applicable banking and securities regulators.
We monitor and manage our capital and liquidity requirements across these entities to ensure that resources are used efficiently and entities are incompliance with local regulatory and policy requirements.
Liquidity coverage ratioThe objective of the liquidity coverage ratio (LCR) is to promote short-term resilience of a bank’s liquidity risk profile, ensuring that it has adequateunencumbered high quality liquid resources to meet its liquidity needs in a 30-day acute stress scenario. Canadian banks are required to achieve a minimumLCR value of 100%. CIBC is in compliance with this requirement.
In accordance with the calibration methodology contained in OSFI’s liquidity adequacy requirements (LAR) guidelines, CIBC reports the LCR to OSFI on amonthly basis. The ratio is calculated as follows:
Total High Quality Liquid Assets (HQLA)≥100%
Total net cash outflows over the next 30 calendar days
The LCR’s numerator consists of unencumbered HQLA, which follow an OSFI-defined set of eligibility criteria that considers fundamental and market-relatedcharacteristics, and relative ability to operationally monetize assets on a timely basis during a period of stress. CIBC’s centrally-managed liquid asset portfolioincludes those liquid assets reported in the HQLA, such as central government treasury bills and bonds, central bank deposits and high-rated sovereign, agency,provincial, and corporate securities. Asset eligibility limitations inherent in the LCR metric do not necessarily reflect CIBC’s internal assessment of its ability tomonetize its marketable assets under stress.
The ratio’s denominator reflects net cash outflows expected in the LCR’s stress scenario over the 30-calendar-day period. Expected cash outflows representLCR-defined withdrawal or draw-down rates applied against outstanding liabilities and off-balance sheet commitments, respectively. Significant contributors toCIBC’s LCR outflows include business and financial institution deposit run-off, draws on undrawn lines of credit and unsecured debt maturities. Cash outflowsare partially offset by cash inflows, which are calculated at LCR-prescribed inflow rates, and include performing loan repayments and non-HQLA marketableassets.
CIBC FIRST QUARTER 2017 31
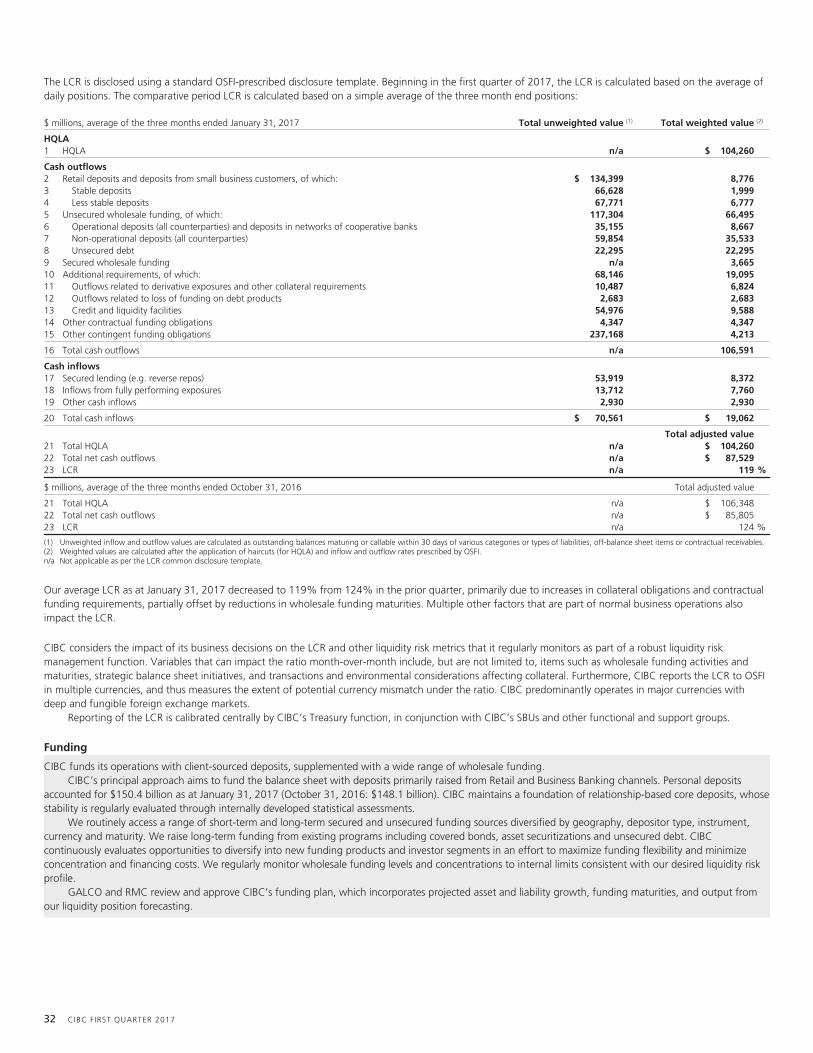
The LCR is disclosed using a standard OSFI-prescribed disclosure template. Beginning in the first quarter of 2017, the LCR is calculated based on the average ofdaily positions. The comparative period LCR is calculated based on a simple average of the three month end positions:
$ millions, average of the three months ended January 31, 2017 Total unweighted value (1) Total weighted value (2)
HQLA1 HQLA n/a $ 104,260
Cash outflows2 Retail deposits and deposits from small business customers, of which: $ 134,399 8,7763 Stable deposits 66,628 1,9994 Less stable deposits 67,771 6,7775 Unsecured wholesale funding, of which: 117,304 66,4956 Operational deposits (all counterparties) and deposits in networks of cooperative banks 35,155 8,6677 Non-operational deposits (all counterparties) 59,854 35,5338 Unsecured debt 22,295 22,2959 Secured wholesale funding n/a 3,66510 Additional requirements, of which: 68,146 19,09511 Outflows related to derivative exposures and other collateral requirements 10,487 6,82412 Outflows related to loss of funding on debt products 2,683 2,68313 Credit and liquidity facilities 54,976 9,58814 Other contractual funding obligations 4,347 4,34715 Other contingent funding obligations 237,168 4,213
16 Total cash outflows n/a 106,591
Cash inflows17 Secured lending (e.g. reverse repos) 53,919 8,37218 Inflows from fully performing exposures 13,712 7,76019 Other cash inflows 2,930 2,930
20 Total cash inflows $ 70,561 $ 19,062
Total adjusted value21 Total HQLA n/a $ 104,26022 Total net cash outflows n/a $ 87,52923 LCR n/a 119 %
$ millions, average of the three months ended October 31, 2016 Total adjusted value
21 Total HQLA n/a $ 106,34822 Total net cash outflows n/a $ 85,80523 LCR n/a 124 %
(1) Unweighted inflow and outflow values are calculated as outstanding balances maturing or callable within 30 days of various categories or types of liabilities, off-balance sheet items or contractual receivables.(2) Weighted values are calculated after the application of haircuts (for HQLA) and inflow and outflow rates prescribed by OSFI.n/a Not applicable as per the LCR common disclosure template.
Our average LCR as at January 31, 2017 decreased to 119% from 124% in the prior quarter, primarily due to increases in collateral obligations and contractualfunding requirements, partially offset by reductions in wholesale funding maturities. Multiple other factors that are part of normal business operations alsoimpact the LCR.
CIBC considers the impact of its business decisions on the LCR and other liquidity risk metrics that it regularly monitors as part of a robust liquidity riskmanagement function. Variables that can impact the ratio month-over-month include, but are not limited to, items such as wholesale funding activities andmaturities, strategic balance sheet initiatives, and transactions and environmental considerations affecting collateral. Furthermore, CIBC reports the LCR to OSFIin multiple currencies, and thus measures the extent of potential currency mismatch under the ratio. CIBC predominantly operates in major currencies withdeep and fungible foreign exchange markets.
Reporting of the LCR is calibrated centrally by CIBC’s Treasury function, in conjunction with CIBC’s SBUs and other functional and support groups.
Funding
CIBC funds its operations with client-sourced deposits, supplemented with a wide range of wholesale funding.CIBC’s principal approach aims to fund the balance sheet with deposits primarily raised from Retail and Business Banking channels. Personal deposits
accounted for $150.4 billion as at January 31, 2017 (October 31, 2016: $148.1 billion). CIBC maintains a foundation of relationship-based core deposits, whosestability is regularly evaluated through internally developed statistical assessments.
We routinely access a range of short-term and long-term secured and unsecured funding sources diversified by geography, depositor type, instrument,currency and maturity. We raise long-term funding from existing programs including covered bonds, asset securitizations and unsecured debt. CIBCcontinuously evaluates opportunities to diversify into new funding products and investor segments in an effort to maximize funding flexibility and minimizeconcentration and financing costs. We regularly monitor wholesale funding levels and concentrations to internal limits consistent with our desired liquidity riskprofile.
GALCO and RMC review and approve CIBC’s funding plan, which incorporates projected asset and liability growth, funding maturities, and output fromour liquidity position forecasting.
32 CIBC FIRST QUARTER 2017
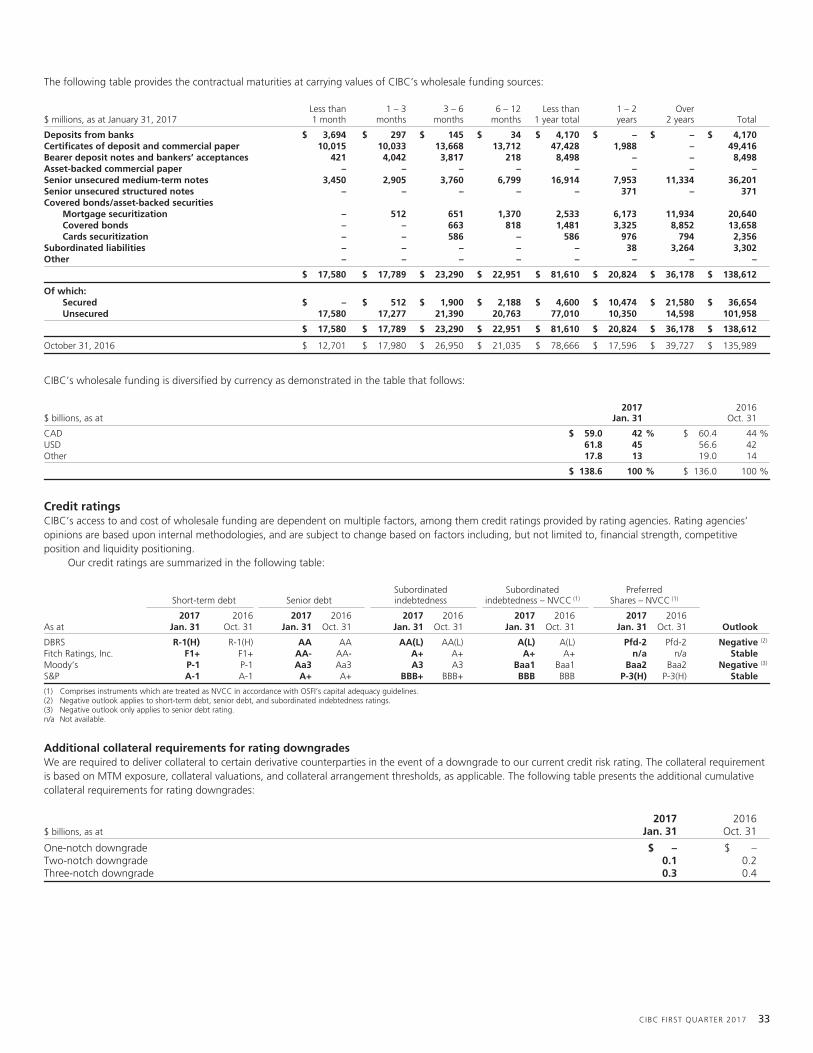
The following table provides the contractual maturities at carrying values of CIBC’s wholesale funding sources:
$ millions, as at January 31, 2017Less than1 month
1 – 3months
3 – 6months
6 – 12months
Less than1 year total
1 – 2years
Over2 years Total
Deposits from banks $ 3,694 $ 297 $ 145 $ 34 $ 4,170 $ – $ – $ 4,170Certificates of deposit and commercial paper 10,015 10,033 13,668 13,712 47,428 1,988 – 49,416Bearer deposit notes and bankers’ acceptances 421 4,042 3,817 218 8,498 – – 8,498Asset-backed commercial paper – – – – – – – –Senior unsecured medium-term notes 3,450 2,905 3,760 6,799 16,914 7,953 11,334 36,201Senior unsecured structured notes – – – – – 371 – 371Covered bonds/asset-backed securities
Mortgage securitization – 512 651 1,370 2,533 6,173 11,934 20,640Covered bonds – – 663 818 1,481 3,325 8,852 13,658Cards securitization – – 586 – 586 976 794 2,356
Subordinated liabilities – – – – – 38 3,264 3,302Other – – – – – – – –
$ 17,580 $ 17,789 $ 23,290 $ 22,951 $ 81,610 $ 20,824 $ 36,178 $ 138,612
Of which:Secured $ – $ 512 $ 1,900 $ 2,188 $ 4,600 $ 10,474 $ 21,580 $ 36,654Unsecured 17,580 17,277 21,390 20,763 77,010 10,350 14,598 101,958
$ 17,580 $ 17,789 $ 23,290 $ 22,951 $ 81,610 $ 20,824 $ 36,178 $ 138,612
October 31, 2016 $ 12,701 $ 17,980 $ 26,950 $ 21,035 $ 78,666 $ 17,596 $ 39,727 $ 135,989
CIBC’s wholesale funding is diversified by currency as demonstrated in the table that follows:
$ billions, as at2017
Jan. 312016
Oct. 31
CAD $ 59.0 42 % $ 60.4 44 %USD 61.8 45 56.6 42Other 17.8 13 19.0 14
$ 138.6 100 % $ 136.0 100 %
Credit ratingsCIBC’s access to and cost of wholesale funding are dependent on multiple factors, among them credit ratings provided by rating agencies. Rating agencies’opinions are based upon internal methodologies, and are subject to change based on factors including, but not limited to, financial strength, competitiveposition and liquidity positioning.
Our credit ratings are summarized in the following table:
Short-term debt Senior debtSubordinatedindebtedness
Subordinatedindebtedness – NVCC (1)
PreferredShares – NVCC (1)
As at2017
Jan. 312016
Oct. 312017
Jan. 312016
Oct. 312017
Jan. 312016
Oct. 312017
Jan. 312016
Oct. 312017
Jan. 312016
Oct. 31 Outlook
DBRS R-1(H) R-1(H) AA AA AA(L) AA(L) A(L) A(L) Pfd-2 Pfd-2 Negative (2)
Fitch Ratings, Inc. F1+ F1+ AA- AA- A+ A+ A+ A+ n/a n/a StableMoody’s P-1 P-1 Aa3 Aa3 A3 A3 Baa1 Baa1 Baa2 Baa2 Negative (3)
S&P A-1 A-1 A+ A+ BBB+ BBB+ BBB BBB P-3(H) P-3(H) Stable
(1) Comprises instruments which are treated as NVCC in accordance with OSFI’s capital adequacy guidelines.(2) Negative outlook applies to short-term debt, senior debt, and subordinated indebtedness ratings.(3) Negative outlook only applies to senior debt rating.n/a Not available.
Additional collateral requirements for rating downgradesWe are required to deliver collateral to certain derivative counterparties in the event of a downgrade to our current credit risk rating. The collateral requirementis based on MTM exposure, collateral valuations, and collateral arrangement thresholds, as applicable. The following table presents the additional cumulativecollateral requirements for rating downgrades:
$ billions, as at2017
Jan. 312016
Oct. 31
One-notch downgrade $ – $ –Two-notch downgrade 0.1 0.2Three-notch downgrade 0.3 0.4
CIBC FIRST QUARTER 2017 33
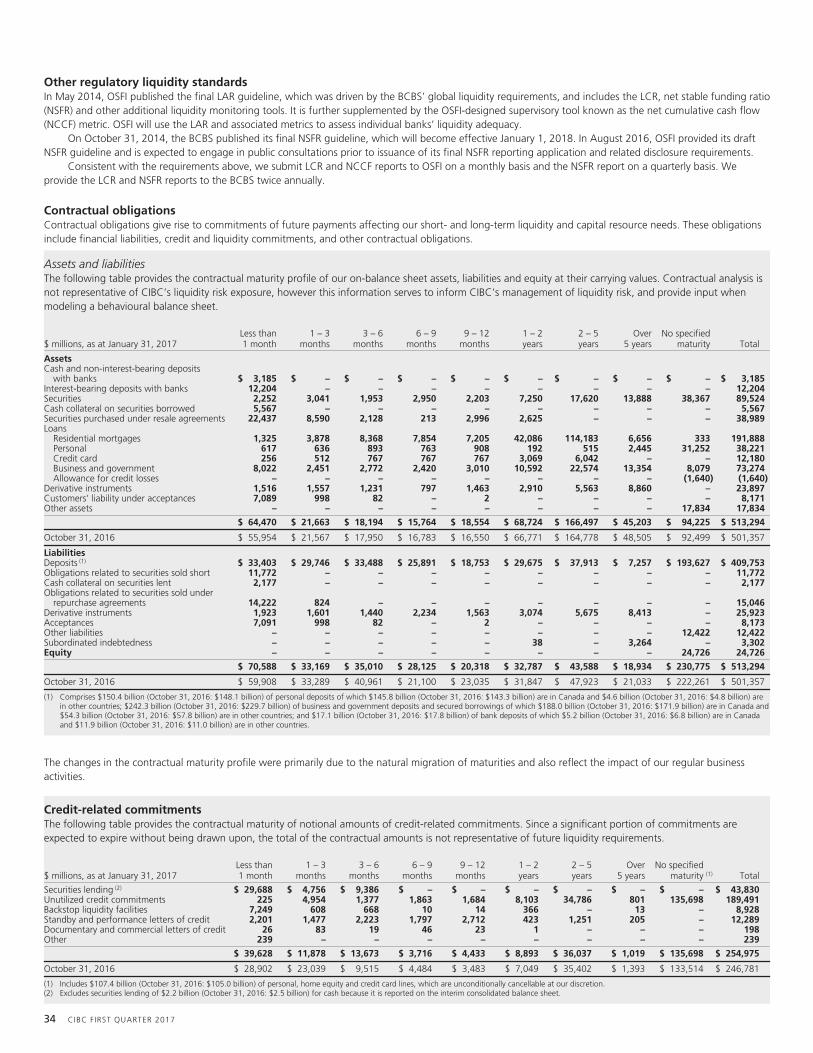
Other regulatory liquidity standardsIn May 2014, OSFI published the final LAR guideline, which was driven by the BCBS’ global liquidity requirements, and includes the LCR, net stable funding ratio(NSFR) and other additional liquidity monitoring tools. It is further supplemented by the OSFI-designed supervisory tool known as the net cumulative cash flow(NCCF) metric. OSFI will use the LAR and associated metrics to assess individual banks’ liquidity adequacy.
On October 31, 2014, the BCBS published its final NSFR guideline, which will become effective January 1, 2018. In August 2016, OSFI provided its draftNSFR guideline and is expected to engage in public consultations prior to issuance of its final NSFR reporting application and related disclosure requirements.
Consistent with the requirements above, we submit LCR and NCCF reports to OSFI on a monthly basis and the NSFR report on a quarterly basis. Weprovide the LCR and NSFR reports to the BCBS twice annually.
Contractual obligationsContractual obligations give rise to commitments of future payments affecting our short- and long-term liquidity and capital resource needs. These obligationsinclude financial liabilities, credit and liquidity commitments, and other contractual obligations.
Assets and liabilitiesThe following table provides the contractual maturity profile of our on-balance sheet assets, liabilities and equity at their carrying values. Contractual analysis isnot representative of CIBC’s liquidity risk exposure, however this information serves to inform CIBC’s management of liquidity risk, and provide input whenmodeling a behavioural balance sheet.
$ millions, as at January 31, 2017Less than1 month
1 – 3months
3 – 6months
6 – 9months
9 – 12months
1 – 2years
2 – 5years
Over5 years
No specifiedmaturity Total
AssetsCash and non-interest-bearing deposits
with banks $ 3,185 $ – $ – $ – $ – $ – $ – $ – $ – $ 3,185Interest-bearing deposits with banks 12,204 – – – – – – – – 12,204Securities 2,252 3,041 1,953 2,950 2,203 7,250 17,620 13,888 38,367 89,524Cash collateral on securities borrowed 5,567 – – – – – – – – 5,567Securities purchased under resale agreements 22,437 8,590 2,128 213 2,996 2,625 – – – 38,989Loans
Residential mortgages 1,325 3,878 8,368 7,854 7,205 42,086 114,183 6,656 333 191,888Personal 617 636 893 763 908 192 515 2,445 31,252 38,221Credit card 256 512 767 767 767 3,069 6,042 – – 12,180Business and government 8,022 2,451 2,772 2,420 3,010 10,592 22,574 13,354 8,079 73,274Allowance for credit losses – – – – – – – – (1,640) (1,640)
Derivative instruments 1,516 1,557 1,231 797 1,463 2,910 5,563 8,860 – 23,897Customers’ liability under acceptances 7,089 998 82 – 2 – – – – 8,171Other assets – – – – – – – – 17,834 17,834
$ 64,470 $ 21,663 $ 18,194 $ 15,764 $ 18,554 $ 68,724 $ 166,497 $ 45,203 $ 94,225 $ 513,294
October 31, 2016 $ 55,954 $ 21,567 $ 17,950 $ 16,783 $ 16,550 $ 66,771 $ 164,778 $ 48,505 $ 92,499 $ 501,357
LiabilitiesDeposits (1) $ 33,403 $ 29,746 $ 33,488 $ 25,891 $ 18,753 $ 29,675 $ 37,913 $ 7,257 $ 193,627 $ 409,753Obligations related to securities sold short 11,772 – – – – – – – – 11,772Cash collateral on securities lent 2,177 – – – – – – – – 2,177Obligations related to securities sold under
repurchase agreements 14,222 824 – – – – – – – 15,046Derivative instruments 1,923 1,601 1,440 2,234 1,563 3,074 5,675 8,413 – 25,923Acceptances 7,091 998 82 – 2 – – – – 8,173Other liabilities – – – – – – – – 12,422 12,422Subordinated indebtedness – – – – – 38 – 3,264 – 3,302Equity – – – – – – – – 24,726 24,726
$ 70,588 $ 33,169 $ 35,010 $ 28,125 $ 20,318 $ 32,787 $ 43,588 $ 18,934 $ 230,775 $ 513,294
October 31, 2016 $ 59,908 $ 33,289 $ 40,961 $ 21,100 $ 23,035 $ 31,847 $ 47,923 $ 21,033 $ 222,261 $ 501,357
(1) Comprises $150.4 billion (October 31, 2016: $148.1 billion) of personal deposits of which $145.8 billion (October 31, 2016: $143.3 billion) are in Canada and $4.6 billion (October 31, 2016: $4.8 billion) arein other countries; $242.3 billion (October 31, 2016: $229.7 billion) of business and government deposits and secured borrowings of which $188.0 billion (October 31, 2016: $171.9 billion) are in Canada and$54.3 billion (October 31, 2016: $57.8 billion) are in other countries; and $17.1 billion (October 31, 2016: $17.8 billion) of bank deposits of which $5.2 billion (October 31, 2016: $6.8 billion) are in Canadaand $11.9 billion (October 31, 2016: $11.0 billion) are in other countries.
The changes in the contractual maturity profile were primarily due to the natural migration of maturities and also reflect the impact of our regular businessactivities.
Credit-related commitmentsThe following table provides the contractual maturity of notional amounts of credit-related commitments. Since a significant portion of commitments areexpected to expire without being drawn upon, the total of the contractual amounts is not representative of future liquidity requirements.
$ millions, as at January 31, 2017Less than1 month
1 – 3months
3 – 6months
6 – 9months
9 – 12months
1 – 2years
2 – 5years
Over5 years
No specifiedmaturity (1) Total
Securities lending (2) $ 29,688 $ 4,756 $ 9,386 $ – $ – $ – $ – $ – $ – $ 43,830Unutilized credit commitments 225 4,954 1,377 1,863 1,684 8,103 34,786 801 135,698 189,491Backstop liquidity facilities 7,249 608 668 10 14 366 – 13 – 8,928Standby and performance letters of credit 2,201 1,477 2,223 1,797 2,712 423 1,251 205 – 12,289Documentary and commercial letters of credit 26 83 19 46 23 1 – – – 198Other 239 – – – – – – – – 239
$ 39,628 $ 11,878 $ 13,673 $ 3,716 $ 4,433 $ 8,893 $ 36,037 $ 1,019 $ 135,698 $ 254,975
October 31, 2016 $ 28,902 $ 23,039 $ 9,515 $ 4,484 $ 3,483 $ 7,049 $ 35,402 $ 1,393 $ 133,514 $ 246,781
(1) Includes $107.4 billion (October 31, 2016: $105.0 billion) of personal, home equity and credit card lines, which are unconditionally cancellable at our discretion.(2) Excludes securities lending of $2.2 billion (October 31, 2016: $2.5 billion) for cash because it is reported on the interim consolidated balance sheet.
34 CIBC FIRST QUARTER 2017
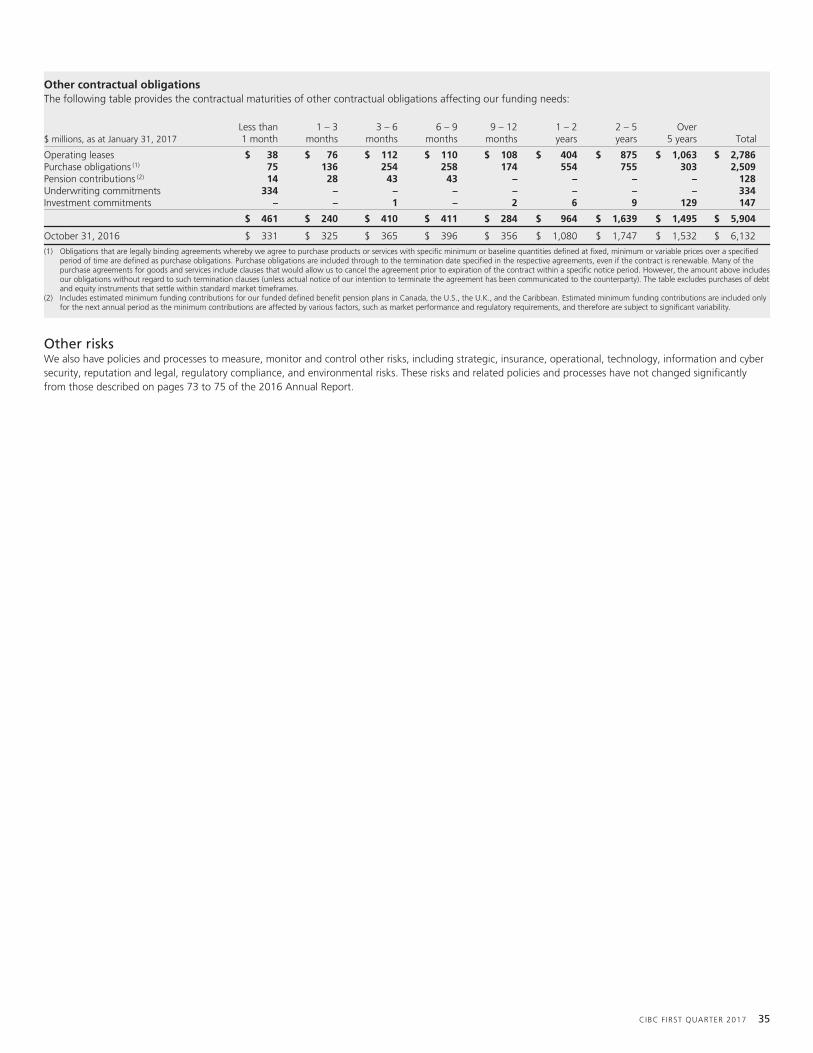
Other contractual obligationsThe following table provides the contractual maturities of other contractual obligations affecting our funding needs:
$ millions, as at January 31, 2017Less than1 month
1 – 3months
3 – 6months
6 – 9months
9 – 12months
1 – 2years
2 – 5years
Over5 years Total
Operating leases $ 38 $ 76 $ 112 $ 110 $ 108 $ 404 $ 875 $ 1,063 $ 2,786Purchase obligations (1) 75 136 254 258 174 554 755 303 2,509Pension contributions (2) 14 28 43 43 – – – – 128Underwriting commitments 334 – – – – – – – 334Investment commitments – – 1 – 2 6 9 129 147
$ 461 $ 240 $ 410 $ 411 $ 284 $ 964 $ 1,639 $ 1,495 $ 5,904
October 31, 2016 $ 331 $ 325 $ 365 $ 396 $ 356 $ 1,080 $ 1,747 $ 1,532 $ 6,132
(1) Obligations that are legally binding agreements whereby we agree to purchase products or services with specific minimum or baseline quantities defined at fixed, minimum or variable prices over a specifiedperiod of time are defined as purchase obligations. Purchase obligations are included through to the termination date specified in the respective agreements, even if the contract is renewable. Many of thepurchase agreements for goods and services include clauses that would allow us to cancel the agreement prior to expiration of the contract within a specific notice period. However, the amount above includesour obligations without regard to such termination clauses (unless actual notice of our intention to terminate the agreement has been communicated to the counterparty). The table excludes purchases of debtand equity instruments that settle within standard market timeframes.
(2) Includes estimated minimum funding contributions for our funded defined benefit pension plans in Canada, the U.S., the U.K., and the Caribbean. Estimated minimum funding contributions are included onlyfor the next annual period as the minimum contributions are affected by various factors, such as market performance and regulatory requirements, and therefore are subject to significant variability.
Other risksWe also have policies and processes to measure, monitor and control other risks, including strategic, insurance, operational, technology, information and cybersecurity, reputation and legal, regulatory compliance, and environmental risks. These risks and related policies and processes have not changed significantlyfrom those described on pages 73 to 75 of the 2016 Annual Report.
CIBC FIRST QUARTER 2017 35
Accounting and control matters
Critical accounting policies and estimatesThe interim consolidated financial statements have been prepared in accordance with International Accounting Standard (IAS) 34 “Interim Financial Reporting”using IFRS as issued by the International Accounting Standards Board (IASB). A summary of significant accounting policies is presented in Note 1 to theconsolidated financial statements of our 2016 Annual Report. The interim consolidated financial statements have been prepared using the same accountingpolicies as CIBC’s consolidated financial statements as at and for the year ended October 31, 2016.
Certain accounting policies require us to make judgments and estimates, some of which may relate to matters that are uncertain. Changes in thejudgments and estimates required in the critical accounting policies discussed on pages 76 to 80 of our 2016 Annual Report could have a material impact onour financial results. No significant changes have occurred with respect to our critical accounting estimates since our 2016 Annual Report.
Accounting developmentsTransition to IFRS 9
IFRS 9 “Financial Instruments” (IFRS 9) replaces IAS 39 “Financial Instruments: Recognition and Measurement” and is effective for annual periods beginning onor after January 1, 2018, which for us would have been on November 1, 2018. Early application is permitted if an entity applies all the requirements of thestandard. During 2015, OSFI issued a final advisory that requires D-SIBs to adopt IFRS 9 for their annual period beginning on November 1, 2017, one year earlierthan required by the IASB. As a D-SIB, we will publish our first interim consolidated financial statements under IFRS 9 for the quarter ended January 31, 2018,except for the “own credit” provisions of IFRS 9, which we voluntarily early adopted as of November 1, 2014. IFRS 9 is required to be applied on a retrospectivebasis, with certain exceptions. As permitted, we will not restate our prior period comparative consolidated financial statements when we adopt therequirements of the new standard. We will recognize an adjustment to our opening November 1, 2017 retained earnings and AOCI, to reflect the application ofthe new requirements at the adoption date.
The transition to IFRS 9 represents a significant initiative for CIBC, for which we have established a transition program that is supported by a formalgovernance structure with an enterprise view and a dedicated project team. The project’s Steering Committee is co-chaired by senior stakeholders from our RiskManagement and Finance groups, and comprises individuals from the impacted SBUs as well as functional groups, such as Technology and Operations andInternal Audit. The Steering Committee is responsible for:• Ensuring the strategic alignment of IFRS 9 with CIBC’s overall strategies;• Ensuring key milestones are met;• Providing direction and guidance on a holistic basis; and• Reviewing and resolving key issues and risks.
To assist the Steering Committee in meeting its responsibilities, our transition program structure has three work streams that correspond to the three sections ofthe new financial instruments standard: (1) Classification and measurement of financial instruments; (2) Impairment; and (3) Hedge accounting. Each workstream comprises stakeholders from the impacted SBUs and functional groups, who are subject matter experts in the relevant policies, processes or technologiesthat are expected to be impacted by the transition.
Classification and measurementThe IFRS 9 classification and measurement model requires that all debt instrument financial assets that do not meet a “solely payment of principal and interest”(SPPI) test, including those that contain embedded derivatives, be classified at initial recognition as fair value through profit or loss (FVTPL). The intent of theSPPI test is to ensure that debt instruments that contain non-basic lending features, such as conversion options and equity linked pay-outs, are measured atFVTPL. Subsequent measurement of instruments classified as FVTPL under IFRS 9 operates in a similar manner to trading under IAS 39.
For debt instrument financial assets that meet the SPPI test, classification at initial recognition will be determined based on the business model underwhich these instruments are managed. Debt instruments that are managed on a “held for trading” or “fair value” basis will be classified as FVTPL. Debtinstruments that are managed on a “hold to collect and for sale” basis will be classified as fair value through OCI (FV-OCI) for debt. Debt instruments that aremanaged on a “hold to collect” basis will be classified as amortized cost. Subsequent measurement of instruments classified at FV-OCI and amortized costclassifications under IFRS 9 operate in a similar manner to AFS for debt securities and loans and receivables, respectively, under existing IAS 39, except for theimpairment provisions which are discussed below.
For those debt instrument financial assets that would otherwise be classified as FV-OCI or amortized cost, an irrevocable designation can be made at initialrecognition to instead measure the debt instrument at FVTPL under the fair value option (FVO) if doing so eliminates or significantly reduces an accountingmismatch and if certain OSFI requirements are met.
All equity instrument financial assets are required to be classified at initial recognition as FVTPL unless an irrevocable designation is made to classify theinstrument as FV-OCI for equities. Unlike AFS for equity securities under IAS 39, the FV-OCI for equities category results in all realized and unrealized gains andlosses being recognized in OCI with no recycling to profit and loss. Only dividends continue to be recognized in profit and loss.
The classification and measurement of financial liabilities remain essentially unchanged from the current IAS 39 requirements, except that changes in fairvalue of FVO liabilities attributable to changes in own credit risk are to be presented in OCI, rather than profit and loss, which we early adopted as ofNovember 1, 2014.
Derivatives will continue to be measured at FVTPL under IFRS 9.
ImpairmentThe new impairment guidance sets out an expected credit loss (ECL) model applicable to all debt instrument financial assets classified as amortized cost orFV-OCI. In addition, the ECL model applies to loan commitments and financial guarantees that are not measured at FVTPL.
Incurred Loss versus Expected Loss MethodologyThe application of ECL will significantly change our credit loss methodology and models. ECL allowances represent credit losses that reflect an unbiased andprobability-weighted amount which is determined by evaluating a range of possible outcomes, the time value of money and reasonable and supportableinformation about past events, current conditions and forecasts of future economic conditions. This compares to the present incurred loss model under IAS 39that incorporates a single best estimate, the time value of money and information about past events and current conditions. The objective of the newimpairment standard is to record lifetime losses on all financial instruments which have experienced a significant increase in credit risk (SICR) since their initialrecognition. As a result, ECL allowances will be measured at amounts equal to either (i) 12-month ECL or (ii) lifetime ECL for those financial instruments which
36 CIBC FIRST QUARTER 2017

have experienced a SICR since initial recognition. This compares to the present incurred loss model which recognizes lifetime credit losses when there isobjective evidence of impairment. Because of the inclusion of relative credit deterioration criteria and consideration of forward looking information, the ECLmodel eliminates the threshold or trigger event required under the incurred loss model and lifetime ECL are recognized earlier under IFRS 9.
Stage Migration and Significant Increase in Credit RiskFor non-impaired financial instruments:• Stage 1 is comprised of all non-impaired financial instruments which have not experienced a SICR since initial recognition. Entities are required to
recognize 12 months of ECL for stage 1 financial instruments. In assessing whether credit risk has increased significantly, entities are required to comparethe risk of a default occurring on the financial instrument as at the reporting date, with the risk of a default occurring on the financial instrument as at thedate of initial recognition.
• Stage 2 is comprised of all non-impaired financial instruments which have experienced a SICR since initial recognition. Entities are required to recognizelifetime ECL for stage 2 financial instruments. In subsequent reporting periods, if the credit risk of the financial instrument improves such that there is nolonger a SICR since initial recognition, then entities shall revert to recognizing 12 months of ECL. In contrast to stage 1 and stage 2, inherent within theincurred loss methodology under IAS 39, allowances are provided for non-impaired financial instruments for credit losses that are incurred but not yetidentified.
For impaired financial instruments:• Financial instruments are classified as stage 3 when there is objective evidence of impairment as a result of one or more loss events that have occurred
after initial recognition with a negative impact on the estimated future cash flows of a loan or a portfolio of loans. The ECL model requires that lifetimeECL be recognized for impaired financial instruments, which is similar to the current requirements under IAS 39 for impaired financial instruments.
For our business and government portfolios, the individually assessed allowances for impaired instruments recognized under IAS 39 will generally be replaced bystage 3 allowances under IFRS 9, while the collective allowances for non-impaired financial instruments will generally be replaced by either stage 1 or stage 2allowances under IFRS 9. For our retail portfolios, the portion of our collective allowances that relate to impaired financial instruments under IAS 39 willgenerally be replaced by stage 3 allowances, while the non-impaired portion of our collective allowances will generally be replaced by either stage 1 or stage 2allowances under IFRS 9.
Our definitions of default, our write-off policy and our interest income recognition policy under IAS 39 are not expected to be materially different underthe ECL model.
Key Drivers of Expected Credit LossWe are currently refining and testing the application of the ECL methodology for our impacted portfolios, which includes building the data, processes andsystems to incorporate the following concepts which are subject to a high level of judgment. These will have a significant impact on the level of ECL allowancesand will be the cause of increased volatility of allowances:• Determining when a SICR of a financial asset has occurred,• Measuring both 12-month and lifetime credit losses, and• Incorporating forward-looking information through the use of multiple probability-weighted scenarios.
For the majority of our retail portfolios, we will determine SICR based on relative changes in the financial instrument’s lifetime probability of default (PD) sinceits initial recognition. For the majority of our business and government portfolios and FV-OCI debt securities, we will determine SICR based on relative changesin internal risk ratings since initial recognition. In respect to the lifetime of a financial instrument, the maximum period to consider when measuring ECL shall bethe maximum contractual period over which an entity is exposed to credit risk. For revolving facilities, such as credit cards, an entity shall measure ECL over theperiod that the entity is exposed to credit risk and the ECL would not be mitigated by credit risk management actions, even if that period extends beyond themaximum contractual period.
We are currently testing the process to determine the forward-looking macroeconomic factors that will be used in our models. Our process leverages ourexisting forecasting processes and determines the forward-looking macroeconomic factors for multiple scenarios so that we can appropriately probabilityweight the expected losses we will recognize on our balance sheet. The process being tested is overseen by a governance committee consisting of key internalstakeholders from Economics, Risk Management, and Finance.
Use of the Regulatory FrameworkOur ECL model leverages the data, systems and processes that are used to calculate Basel expected losses regulatory adjustments for the portion of ourportfolios under the AIRB approach. Appropriate adjustments will be made to the Basel parameters to meet IFRS 9 requirements, including the conversion ofthrough-the-cycle and downturn parameters used in the Basel regulatory calculations to point-in-time parameters used under IFRS 9 that considers forward-looking information. In addition, credit losses under IFRS 9 are for 12 months for stage 1 financial instruments and lifetime for stage 2 and stage 3 financialinstruments, as compared with 12 months for AIRB portfolios under Basel. The main adjustments necessary to Basel risk parameters are explained in the tablebelow:
Regulatory Capital IFRS 9
PD Through-the-cycle PD represents long-run average PD throughout afull economic cycle
Point-in-time 12-month or lifetime PD based on current conditions andrelevant forward-looking assumptions
LGD Downturn loss given default (LGD) based on losses that would beexpected in an economic downturn and subject to certain regulatoryfloorsDiscounted using the cost of capital
Unbiased probability-weighted LGD based on estimated LGD includingimpact of relevant forward-looking assumptions such as changes incollateral valueDiscounted using the original effective interest rate
EAD Based on the drawn balance plus expected utilization of any undrawnportion prior to default, and cannot be lower than the drawn balance
Amortization and repayment of principal and interest from thebalance sheet date to the default is captured
Other ECL is discounted from the default date to the reporting date
CIBC FIRST QUARTER 2017 37
Key ActivitiesThe data, processes and systems that support our ECL allowances will undergo further refinement, validation and testing throughout fiscal 2017. Ourrefinements will consider and address any feedback received from our validation team and other stakeholders. During the year, we will also ensure that allrelevant internal controls and policies are updated and we will continue with education and training of key stakeholders. Our Audit Committee will alsocontinue to receive regular updates.
We also plan to change from our current policy of attributing changes to our collective allowance for non-impaired financial instruments from Corporateand Other to a new IFRS 9 policy to attribute any changes in ECL, including stage 1 and stage 2 ECL changes, to our strategic business units.
We are currently evaluating the potential regulatory capital impact of IFRS 9. The impact from potential changes in our balance sheet allowances underIFRS 9 on CET1 capital could be partially mitigated by changes in negative regulatory capital adjustments related to any shortfall of allowances to regulatoryexpected losses in the CET1 calculation.
Regulatory DevelopmentsOur implementation of IFRS 9 takes into account all regulatory requirements, including guidance issued by OSFI and the BCBS covering sound credit riskpractices associated with the implementation and application of an expected credit loss accounting framework. We also continue to monitor regulatorydevelopments related to the new ECL impairment requirements. In October 2016, the BCBS issued “Discussion Paper, Regulatory treatment of accountingprovisions” for comment as it considers policy options for the longer-term regulatory treatment of accounting provisions given the change from an incurred lossto an expected credit loss accounting framework. The BCBS also issued “Consultative Document, Regulatory treatment of accounting provisions – interimapproach and transitional arrangements”, which proposes to retain, for an interim period, the current regulatory treatment of accounting provisions under boththe standardized and IRB approaches for credit risk. The consultative document also issues for commentary three potential approaches for transitional capitalrelief, if any relief is ultimately to be provided.
Hedge accountingThe IFRS 9 hedge accounting guidance is intended to better align the accounting with risk management activities. However, IFRS 9 allows the existing hedgeaccounting requirements under IAS 39 to continue in place of the hedge accounting requirements under IFRS 9, pending the completion of the IASB’s projecton macro hedge accounting. As permitted, we have elected to not adopt the IFRS 9 hedge accounting requirements and instead will retain the IAS 39 hedgeaccounting requirements. However, we will adopt the new hedge accounting disclosure requirements under amendments to IFRS 7 for our annual periodbeginning November 1, 2017.
Other accounting policy changesFor details on other future accounting policy changes, refer to Note 32 to the consolidated financial statements included in our 2016 Annual Report.
Regulatory developmentsDodd-Frank Wall Street Reform and Consumer Protection ActThe Dodd-Frank Wall Street Reform and Consumer Protection Act (the “Dodd-Frank Act”) was enacted in the U.S. in July 2010. The Dodd-Frank Act containsmany broad reforms impacting the financial services industry. These reforms impact every financial institution in the U.S. and many financial institutions thatoperate outside the U.S. Most aspects of the Dodd-Frank Act have become effective, while some portions are still subject to final rulemakings by U.S.government agencies, or the expiration of transition periods. CIBC is subject to a number of specific requirements, including, among other things: (i) mandatoryclearing, trade reporting and registration of OTC derivative trading activities; (ii) heightened capital, liquidity and prudential standards, such as the enhancedprudential standards and early remediation requirements under Sections 165 and 166 of the Dodd-Frank Act; (iii) mandatory risk retention rules, applicable tosponsors of asset-backed securities and securitizations; and (iv) restrictions on proprietary trading, private equity and hedge fund activities, commonly known asthe Volcker Rule.
Although these reforms have increased our cost of regulatory compliance and have restricted our ability to engage in certain activities in the U.S. andelsewhere, we do not expect costs and restrictions associated with the new regulations to have a material impact on our financial results. CIBC continues todevote the resources necessary to ensure that we implement the requirements in compliance with all applicable regulations under the Dodd-Frank Act. Wecontinue to monitor developments in this area, including upcoming changes in laws or regulations that may be enacted by the new U.S. governmentadministration.
Automatic Exchange of Information – Organisation for Economic Co-operation and Development (OECD)Under the initiative of the OECD, many countries have committed to automatic exchange of information relating to accounts held by tax residents of signatorycountries, using a Common Reporting Standard (CRS). CRS was implemented in “early adopter” countries in January 2016, with other countries, includingCanada agreeing to implementation in subsequent years. Canada passed CRS implementing legislation on December 15, 2016, to take effect in 2017. CIBC willmeet all obligations imposed under the CRS, in accordance with local law, in all applicable jurisdictions in which it operates.
Controls and proceduresDisclosure controls and proceduresCIBC’s management, with the participation of the President and Chief Executive Officer and the Chief Financial Officer, has evaluated the effectiveness ofCIBC’s disclosure controls and procedures as at January 31, 2017 (as defined in the rules of the SEC and the Canadian Securities Administrators). Based on thatevaluation, the President and Chief Executive Officer and the Chief Financial Officer have concluded that such disclosure controls and procedures were effective.
Changes in internal control over financial reportingThere have been no changes in CIBC’s internal control over financial reporting during the quarter ended January 31, 2017, that have materially affected, or arereasonably likely to materially affect, its internal control over financial reporting.
Related-party transactionsThere have been no significant changes to CIBC’s procedures and policies regarding related-party transactions since October 31, 2016. For additionalinformation, refer to pages 82 and 158 of the 2016 Annual Report.
38 CIBC FIRST QUARTER 2017
Interim consolidated financial statements(Unaudited)
Contents
40 Consolidated balance sheet41 Consolidated statement of income42 Consolidated statement of comprehensive income43 Consolidated statement of changes in equity44 Consolidated statement of cash flows45 Notes to the interim consolidated financial statements
45 Note 1 – Changes in accounting policies46 Note 2 – Fair value measurement48 Note 3 – Significant acquisition and disposition48 Note 4 – Securities49 Note 5 – Loans49 Note 6 – Structured entities and derecognition
of financial assets50 Note 7 – Deposits
50 Note 8 – Share capital51 Note 9 – Post-employment benefits52 Note 10 – Income taxes52 Note 11 – Earnings per share52 Note 12 – Contingent liabilities and provision
53 Note 13 – Segmented information
54 Note 14 – Financial instruments – disclosures
CIBC FIRST QUARTER 2017 39
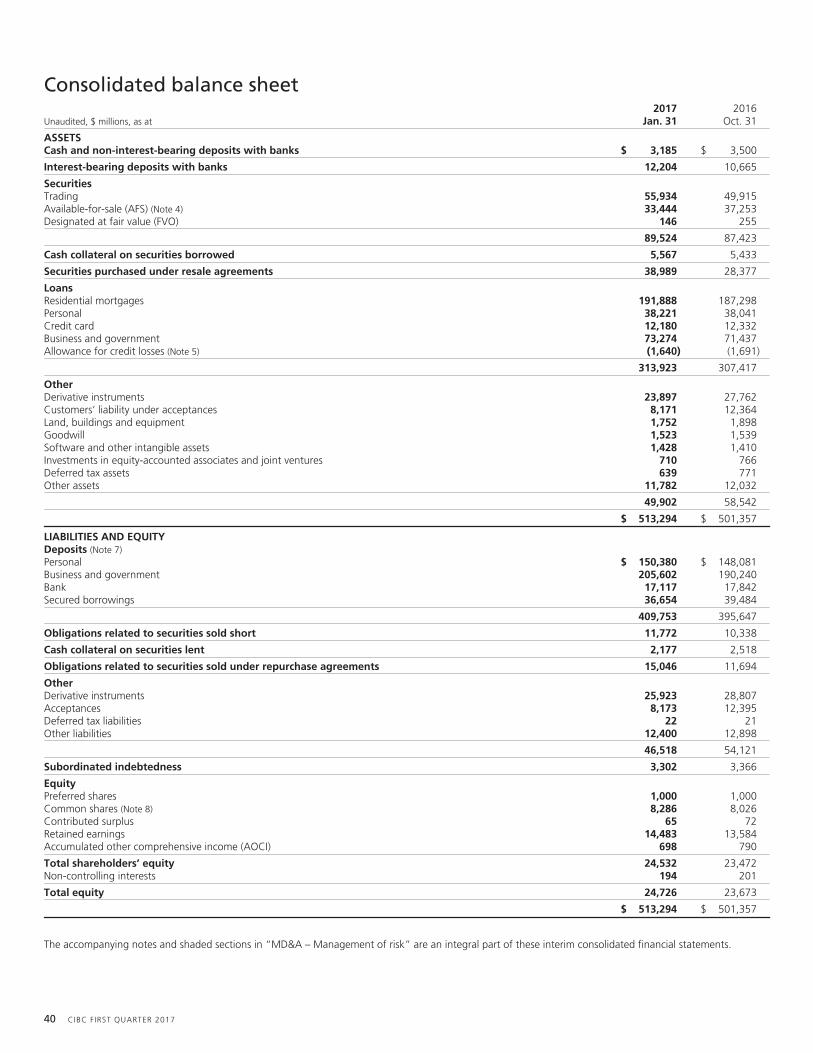
Consolidated balance sheet
Unaudited, $ millions, as at2017
Jan. 312016
Oct. 31
ASSETSCash and non-interest-bearing deposits with banks $ 3,185 $ 3,500
Interest-bearing deposits with banks 12,204 10,665
SecuritiesTrading 55,934 49,915Available-for-sale (AFS) (Note 4) 33,444 37,253Designated at fair value (FVO) 146 255
89,524 87,423
Cash collateral on securities borrowed 5,567 5,433
Securities purchased under resale agreements 38,989 28,377
LoansResidential mortgages 191,888 187,298Personal 38,221 38,041Credit card 12,180 12,332Business and government 73,274 71,437Allowance for credit losses (Note 5) (1,640) (1,691)
313,923 307,417
OtherDerivative instruments 23,897 27,762Customers’ liability under acceptances 8,171 12,364Land, buildings and equipment 1,752 1,898Goodwill 1,523 1,539Software and other intangible assets 1,428 1,410Investments in equity-accounted associates and joint ventures 710 766Deferred tax assets 639 771Other assets 11,782 12,032
49,902 58,542
$ 513,294 $ 501,357
LIABILITIES AND EQUITYDeposits (Note 7)Personal $ 150,380 $ 148,081Business and government 205,602 190,240Bank 17,117 17,842Secured borrowings 36,654 39,484
409,753 395,647
Obligations related to securities sold short 11,772 10,338
Cash collateral on securities lent 2,177 2,518
Obligations related to securities sold under repurchase agreements 15,046 11,694
OtherDerivative instruments 25,923 28,807Acceptances 8,173 12,395Deferred tax liabilities 22 21Other liabilities 12,400 12,898
46,518 54,121
Subordinated indebtedness 3,302 3,366
EquityPreferred shares 1,000 1,000Common shares (Note 8) 8,286 8,026Contributed surplus 65 72Retained earnings 14,483 13,584Accumulated other comprehensive income (AOCI) 698 790
Total shareholders’ equity 24,532 23,472Non-controlling interests 194 201
Total equity 24,726 23,673
$ 513,294 $ 501,357
The accompanying notes and shaded sections in “MD&A – Management of risk” are an integral part of these interim consolidated financial statements.
40 CIBC FIRST QUARTER 2017
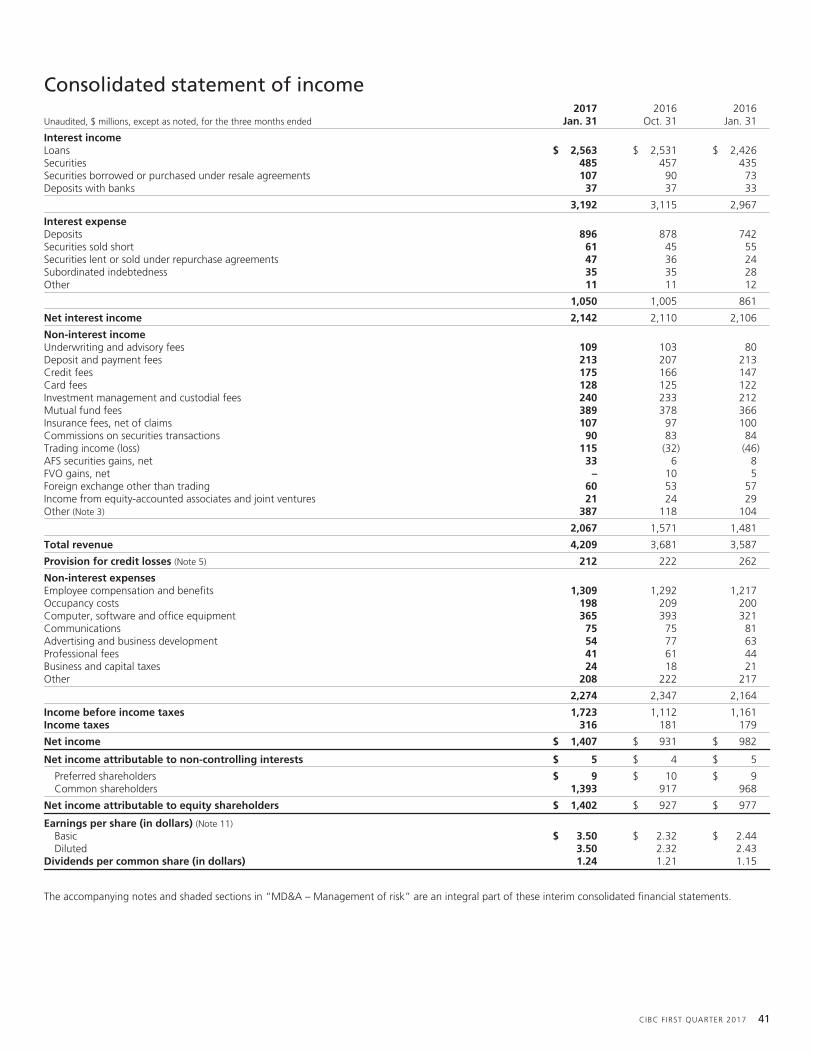
Consolidated statement of income
Unaudited, $ millions, except as noted, for the three months ended2017
Jan. 312016
Oct. 312016
Jan. 31
Interest incomeLoans $ 2,563 $ 2,531 $ 2,426Securities 485 457 435Securities borrowed or purchased under resale agreements 107 90 73Deposits with banks 37 37 33
3,192 3,115 2,967
Interest expenseDeposits 896 878 742Securities sold short 61 45 55Securities lent or sold under repurchase agreements 47 36 24Subordinated indebtedness 35 35 28Other 11 11 12
1,050 1,005 861
Net interest income 2,142 2,110 2,106
Non-interest incomeUnderwriting and advisory fees 109 103 80Deposit and payment fees 213 207 213Credit fees 175 166 147Card fees 128 125 122Investment management and custodial fees 240 233 212Mutual fund fees 389 378 366Insurance fees, net of claims 107 97 100Commissions on securities transactions 90 83 84Trading income (loss) 115 (32) (46)AFS securities gains, net 33 6 8FVO gains, net – 10 5Foreign exchange other than trading 60 53 57Income from equity-accounted associates and joint ventures 21 24 29Other (Note 3) 387 118 104
2,067 1,571 1,481
Total revenue 4,209 3,681 3,587
Provision for credit losses (Note 5) 212 222 262
Non-interest expensesEmployee compensation and benefits 1,309 1,292 1,217Occupancy costs 198 209 200Computer, software and office equipment 365 393 321Communications 75 75 81Advertising and business development 54 77 63Professional fees 41 61 44Business and capital taxes 24 18 21Other 208 222 217
2,274 2,347 2,164
Income before income taxes 1,723 1,112 1,161Income taxes 316 181 179
Net income $ 1,407 $ 931 $ 982
Net income attributable to non-controlling interests $ 5 $ 4 $ 5
Preferred shareholders $ 9 $ 10 $ 9Common shareholders 1,393 917 968
Net income attributable to equity shareholders $ 1,402 $ 927 $ 977
Earnings per share (in dollars) (Note 11)Basic $ 3.50 $ 2.32 $ 2.44Diluted 3.50 2.32 2.43
Dividends per common share (in dollars) 1.24 1.21 1.15
The accompanying notes and shaded sections in “MD&A – Management of risk” are an integral part of these interim consolidated financial statements.
CIBC FIRST QUARTER 2017 41
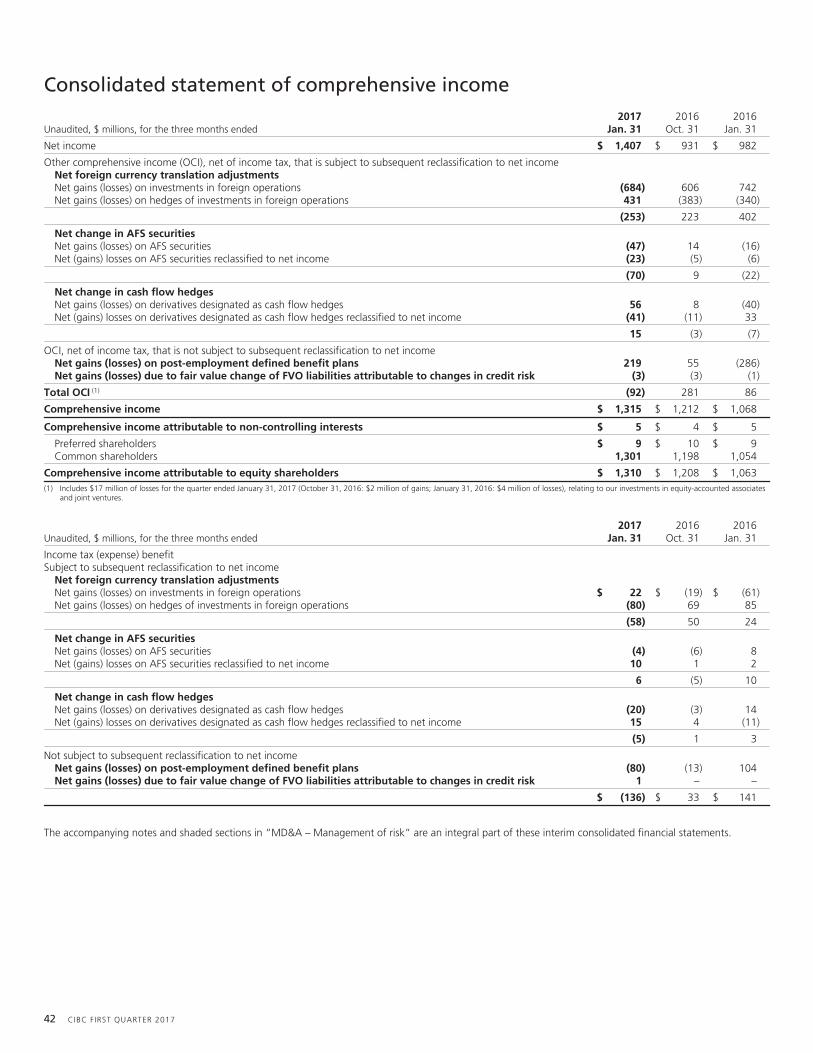
Consolidated statement of comprehensive income
Unaudited, $ millions, for the three months ended2017
Jan. 312016
Oct. 312016
Jan. 31
Net income $ 1,407 $ 931 $ 982
Other comprehensive income (OCI), net of income tax, that is subject to subsequent reclassification to net incomeNet foreign currency translation adjustmentsNet gains (losses) on investments in foreign operations (684) 606 742Net gains (losses) on hedges of investments in foreign operations 431 (383) (340)
(253) 223 402
Net change in AFS securitiesNet gains (losses) on AFS securities (47) 14 (16)Net (gains) losses on AFS securities reclassified to net income (23) (5) (6)
(70) 9 (22)
Net change in cash flow hedgesNet gains (losses) on derivatives designated as cash flow hedges 56 8 (40)Net (gains) losses on derivatives designated as cash flow hedges reclassified to net income (41) (11) 33
15 (3) (7)
OCI, net of income tax, that is not subject to subsequent reclassification to net incomeNet gains (losses) on post-employment defined benefit plans 219 55 (286)Net gains (losses) due to fair value change of FVO liabilities attributable to changes in credit risk (3) (3) (1)
Total OCI (1) (92) 281 86
Comprehensive income $ 1,315 $ 1,212 $ 1,068
Comprehensive income attributable to non-controlling interests $ 5 $ 4 $ 5
Preferred shareholders $ 9 $ 10 $ 9Common shareholders 1,301 1,198 1,054
Comprehensive income attributable to equity shareholders $ 1,310 $ 1,208 $ 1,063(1) Includes $17 million of losses for the quarter ended January 31, 2017 (October 31, 2016: $2 million of gains; January 31, 2016: $4 million of losses), relating to our investments in equity-accounted associates
and joint ventures.
Unaudited, $ millions, for the three months ended2017
Jan. 312016
Oct. 312016
Jan. 31
Income tax (expense) benefitSubject to subsequent reclassification to net income
Net foreign currency translation adjustmentsNet gains (losses) on investments in foreign operations $ 22 $ (19) $ (61)Net gains (losses) on hedges of investments in foreign operations (80) 69 85
(58) 50 24
Net change in AFS securitiesNet gains (losses) on AFS securities (4) (6) 8Net (gains) losses on AFS securities reclassified to net income 10 1 2
6 (5) 10
Net change in cash flow hedgesNet gains (losses) on derivatives designated as cash flow hedges (20) (3) 14Net (gains) losses on derivatives designated as cash flow hedges reclassified to net income 15 4 (11)
(5) 1 3
Not subject to subsequent reclassification to net incomeNet gains (losses) on post-employment defined benefit plans (80) (13) 104Net gains (losses) due to fair value change of FVO liabilities attributable to changes in credit risk 1 – –
$ (136) $ 33 $ 141
The accompanying notes and shaded sections in “MD&A – Management of risk” are an integral part of these interim consolidated financial statements.
42 CIBC FIRST QUARTER 2017

Consolidated statement of changes in equity
Unaudited, $ millions, for the three months ended2017
Jan. 312016
Oct. 312016
Jan. 31
Preferred sharesBalance at beginning of period $ 1,000 $ 1,000 $ 1,000Issue of preferred shares – – –Redemption of preferred shares – – –
Balance at end of period $ 1,000 $ 1,000 $ 1,000
Common shares (Note 8)Balance at beginning of period $ 8,026 $ 7,806 $ 7,813Issue of common shares 261 212 20Purchase of common shares for cancellation – – (46)Treasury shares (1) 8 (1)
Balance at end of period $ 8,286 $ 8,026 $ 7,786
Contributed surplusBalance at beginning of period $ 72 $ 73 $ 76Stock option expense – 2 1Stock options exercised (7) (2) (3)Other – (1) 1
Balance at end of period $ 65 $ 72 $ 75
Retained earningsBalance at beginning of period $ 13,584 $ 13,145 $ 11,433Net income attributable to equity shareholders 1,402 927 977Dividends
Preferred (9) (10) (9)Common (493) (478) (457)
Premium on purchase of common shares for cancellation – – (159)Other (1) – –
Balance at end of period $ 14,483 $ 13,584 $ 11,785
AOCI, net of income taxAOCI, net of income tax, that is subject to subsequent reclassification to net income
Net foreign currency translation adjustmentsBalance at beginning of period $ 1,114 $ 891 $ 1,035Net change in foreign currency translation adjustments (253) 223 402
Balance at end of period $ 861 $ 1,114 $ 1,437
Net gains (losses) on AFS securitiesBalance at beginning of period $ 161 $ 152 $ 94Net change in AFS securities (70) 9 (22)
Balance at end of period $ 91 $ 161 $ 72
Net gains (losses) on cash flow hedgesBalance at beginning of period $ 23 $ 26 $ 22Net change in cash flow hedges 15 (3) (7)
Balance at end of period $ 38 $ 23 $ 15
AOCI, net of income tax, that is not subject to subsequent reclassification to net incomeNet gains (losses) on post-employment defined benefit plansBalance at beginning of period $ (508) $ (563) $ (118)Net change in post-employment defined benefit plans 219 55 (286)
Balance at end of period $ (289) $ (508) $ (404)
Net gains (losses) due to fair value change of FVO liabilities attributable to changes in credit riskBalance at beginning of period $ – $ 3 $ 5Net change attributable to changes in credit risk (3) (3) (1)
Balance at end of period $ (3) $ – $ 4
Total AOCI, net of income tax $ 698 $ 790 $ 1,124
Non-controlling interestsBalance at beginning of period $ 201 $ 188 $ 193Net income attributable to non-controlling interests 5 4 5Dividends (4) – (15)Other (8) 9 12
Balance at end of period $ 194 $ 201 $ 195
Equity at end of period $ 24,726 $ 23,673 $ 21,965
The accompanying notes and shaded sections in “MD&A – Management of risk” are an integral part of these interim consolidated financial statements.
CIBC FIRST QUARTER 2017 43
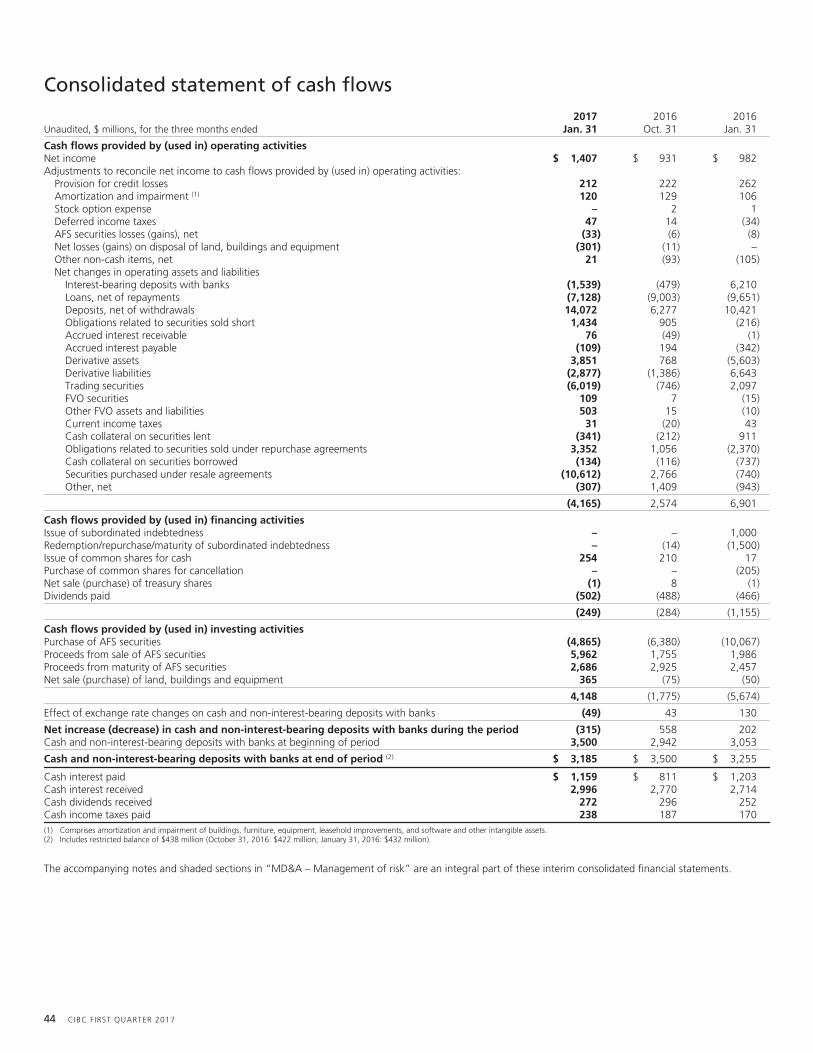
Consolidated statement of cash flows
Unaudited, $ millions, for the three months ended2017
Jan. 312016
Oct. 312016
Jan. 31
Cash flows provided by (used in) operating activitiesNet income $ 1,407 $ 931 $ 982Adjustments to reconcile net income to cash flows provided by (used in) operating activities:
Provision for credit losses 212 222 262Amortization and impairment (1) 120 129 106Stock option expense – 2 1Deferred income taxes 47 14 (34)AFS securities losses (gains), net (33) (6) (8)Net losses (gains) on disposal of land, buildings and equipment (301) (11) –Other non-cash items, net 21 (93) (105)Net changes in operating assets and liabilities
Interest-bearing deposits with banks (1,539) (479) 6,210Loans, net of repayments (7,128) (9,003) (9,651)Deposits, net of withdrawals 14,072 6,277 10,421Obligations related to securities sold short 1,434 905 (216)Accrued interest receivable 76 (49) (1)Accrued interest payable (109) 194 (342)Derivative assets 3,851 768 (5,603)Derivative liabilities (2,877) (1,386) 6,643Trading securities (6,019) (746) 2,097FVO securities 109 7 (15)Other FVO assets and liabilities 503 15 (10)Current income taxes 31 (20) 43Cash collateral on securities lent (341) (212) 911Obligations related to securities sold under repurchase agreements 3,352 1,056 (2,370)Cash collateral on securities borrowed (134) (116) (737)Securities purchased under resale agreements (10,612) 2,766 (740)Other, net (307) 1,409 (943)
(4,165) 2,574 6,901
Cash flows provided by (used in) financing activitiesIssue of subordinated indebtedness – – 1,000Redemption/repurchase/maturity of subordinated indebtedness – (14) (1,500)Issue of common shares for cash 254 210 17Purchase of common shares for cancellation – – (205)Net sale (purchase) of treasury shares (1) 8 (1)Dividends paid (502) (488) (466)
(249) (284) (1,155)
Cash flows provided by (used in) investing activitiesPurchase of AFS securities (4,865) (6,380) (10,067)Proceeds from sale of AFS securities 5,962 1,755 1,986Proceeds from maturity of AFS securities 2,686 2,925 2,457Net sale (purchase) of land, buildings and equipment 365 (75) (50)
4,148 (1,775) (5,674)
Effect of exchange rate changes on cash and non-interest-bearing deposits with banks (49) 43 130
Net increase (decrease) in cash and non-interest-bearing deposits with banks during the period (315) 558 202Cash and non-interest-bearing deposits with banks at beginning of period 3,500 2,942 3,053
Cash and non-interest-bearing deposits with banks at end of period (2) $ 3,185 $ 3,500 $ 3,255
Cash interest paid $ 1,159 $ 811 $ 1,203Cash interest received 2,996 2,770 2,714Cash dividends received 272 296 252Cash income taxes paid 238 187 170(1) Comprises amortization and impairment of buildings, furniture, equipment, leasehold improvements, and software and other intangible assets.(2) Includes restricted balance of $438 million (October 31, 2016: $422 million; January 31, 2016: $432 million).
The accompanying notes and shaded sections in “MD&A – Management of risk” are an integral part of these interim consolidated financial statements.
44 CIBC FIRST QUARTER 2017
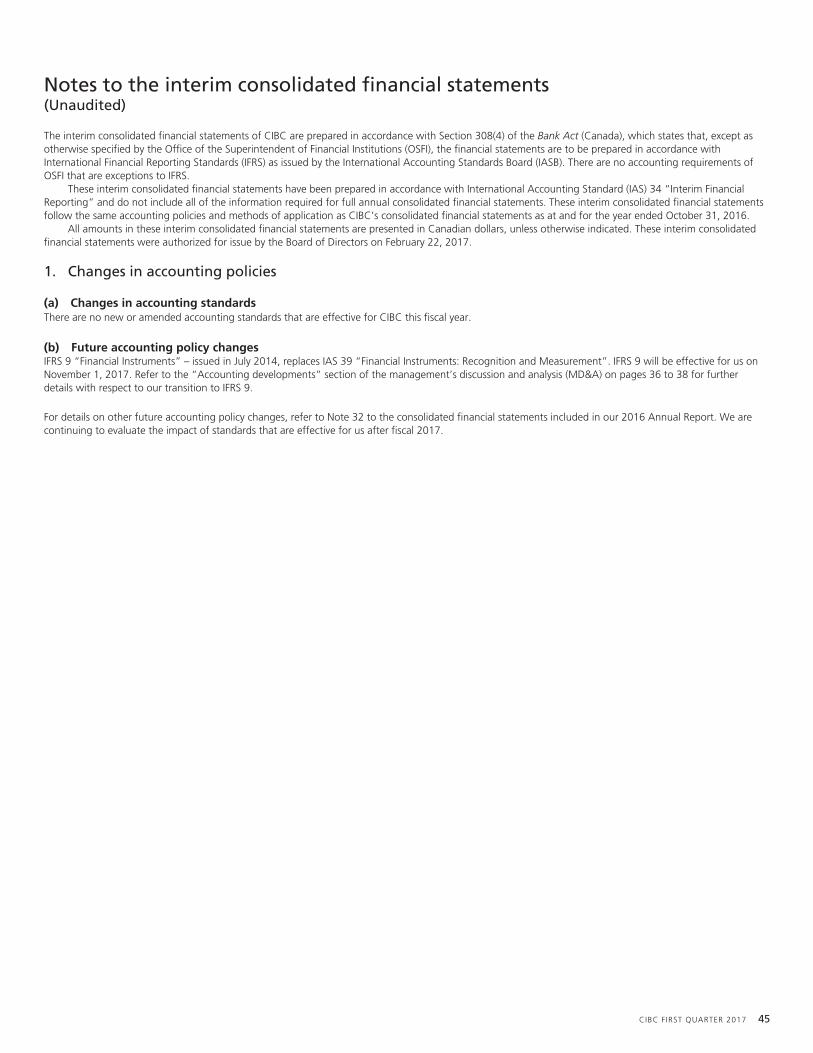
Notes to the interim consolidated financial statements(Unaudited)
The interim consolidated financial statements of CIBC are prepared in accordance with Section 308(4) of the Bank Act (Canada), which states that, except asotherwise specified by the Office of the Superintendent of Financial Institutions (OSFI), the financial statements are to be prepared in accordance withInternational Financial Reporting Standards (IFRS) as issued by the International Accounting Standards Board (IASB). There are no accounting requirements ofOSFI that are exceptions to IFRS.
These interim consolidated financial statements have been prepared in accordance with International Accounting Standard (IAS) 34 “Interim FinancialReporting” and do not include all of the information required for full annual consolidated financial statements. These interim consolidated financial statementsfollow the same accounting policies and methods of application as CIBC’s consolidated financial statements as at and for the year ended October 31, 2016.
All amounts in these interim consolidated financial statements are presented in Canadian dollars, unless otherwise indicated. These interim consolidatedfinancial statements were authorized for issue by the Board of Directors on February 22, 2017.
1. Changes in accounting policies
(a) Changes in accounting standardsThere are no new or amended accounting standards that are effective for CIBC this fiscal year.
(b) Future accounting policy changesIFRS 9 “Financial Instruments” – issued in July 2014, replaces IAS 39 “Financial Instruments: Recognition and Measurement”. IFRS 9 will be effective for us onNovember 1, 2017. Refer to the “Accounting developments” section of the management’s discussion and analysis (MD&A) on pages 36 to 38 for furtherdetails with respect to our transition to IFRS 9.
For details on other future accounting policy changes, refer to Note 32 to the consolidated financial statements included in our 2016 Annual Report. We arecontinuing to evaluate the impact of standards that are effective for us after fiscal 2017.
CIBC FIRST QUARTER 2017 45
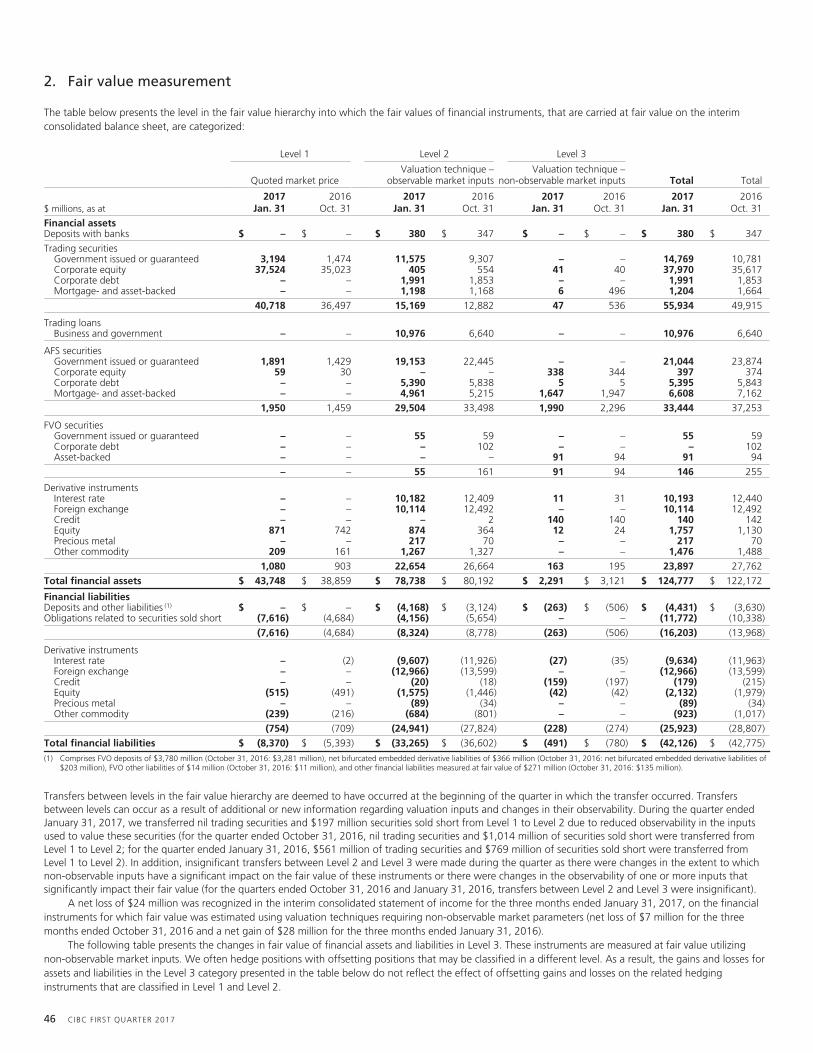
2. Fair value measurement
The table below presents the level in the fair value hierarchy into which the fair values of financial instruments, that are carried at fair value on the interimconsolidated balance sheet, are categorized:
Level 1 Level 2 Level 3
Quoted market priceValuation technique –
observable market inputsValuation technique –
non-observable market inputs Total Total
$ millions, as at2017
Jan. 312016
Oct. 312017
Jan. 312016
Oct. 312017
Jan. 312016
Oct. 312017
Jan. 312016
Oct. 31
Financial assetsDeposits with banks $ – $ – $ 380 $ 347 $ – $ – $ 380 $ 347
Trading securitiesGovernment issued or guaranteed 3,194 1,474 11,575 9,307 – – 14,769 10,781Corporate equity 37,524 35,023 405 554 41 40 37,970 35,617Corporate debt – – 1,991 1,853 – – 1,991 1,853Mortgage- and asset-backed – – 1,198 1,168 6 496 1,204 1,664
40,718 36,497 15,169 12,882 47 536 55,934 49,915
Trading loansBusiness and government – – 10,976 6,640 – – 10,976 6,640
AFS securitiesGovernment issued or guaranteed 1,891 1,429 19,153 22,445 – – 21,044 23,874Corporate equity 59 30 – – 338 344 397 374Corporate debt – – 5,390 5,838 5 5 5,395 5,843Mortgage- and asset-backed – – 4,961 5,215 1,647 1,947 6,608 7,162
1,950 1,459 29,504 33,498 1,990 2,296 33,444 37,253
FVO securitiesGovernment issued or guaranteed – – 55 59 – – 55 59Corporate debt – – – 102 – – – 102Asset-backed – – – – 91 94 91 94
– – 55 161 91 94 146 255
Derivative instrumentsInterest rate – – 10,182 12,409 11 31 10,193 12,440Foreign exchange – – 10,114 12,492 – – 10,114 12,492Credit – – – 2 140 140 140 142Equity 871 742 874 364 12 24 1,757 1,130Precious metal – – 217 70 – – 217 70Other commodity 209 161 1,267 1,327 – – 1,476 1,488
1,080 903 22,654 26,664 163 195 23,897 27,762
Total financial assets $ 43,748 $ 38,859 $ 78,738 $ 80,192 $ 2,291 $ 3,121 $ 124,777 $ 122,172
Financial liabilitiesDeposits and other liabilities (1) $ – $ – $ (4,168) $ (3,124) $ (263) $ (506) $ (4,431) $ (3,630)Obligations related to securities sold short (7,616) (4,684) (4,156) (5,654) – – (11,772) (10,338)
(7,616) (4,684) (8,324) (8,778) (263) (506) (16,203) (13,968)
Derivative instrumentsInterest rate – (2) (9,607) (11,926) (27) (35) (9,634) (11,963)Foreign exchange – – (12,966) (13,599) – – (12,966) (13,599)Credit – – (20) (18) (159) (197) (179) (215)Equity (515) (491) (1,575) (1,446) (42) (42) (2,132) (1,979)Precious metal – – (89) (34) – – (89) (34)Other commodity (239) (216) (684) (801) – – (923) (1,017)
(754) (709) (24,941) (27,824) (228) (274) (25,923) (28,807)
Total financial liabilities $ (8,370) $ (5,393) $ (33,265) $ (36,602) $ (491) $ (780) $ (42,126) $ (42,775)
(1) Comprises FVO deposits of $3,780 million (October 31, 2016: $3,281 million), net bifurcated embedded derivative liabilities of $366 million (October 31, 2016: net bifurcated embedded derivative liabilities of$203 million), FVO other liabilities of $14 million (October 31, 2016: $11 million), and other financial liabilities measured at fair value of $271 million (October 31, 2016: $135 million).
Transfers between levels in the fair value hierarchy are deemed to have occurred at the beginning of the quarter in which the transfer occurred. Transfersbetween levels can occur as a result of additional or new information regarding valuation inputs and changes in their observability. During the quarter endedJanuary 31, 2017, we transferred nil trading securities and $197 million securities sold short from Level 1 to Level 2 due to reduced observability in the inputsused to value these securities (for the quarter ended October 31, 2016, nil trading securities and $1,014 million of securities sold short were transferred fromLevel 1 to Level 2; for the quarter ended January 31, 2016, $561 million of trading securities and $769 million of securities sold short were transferred fromLevel 1 to Level 2). In addition, insignificant transfers between Level 2 and Level 3 were made during the quarter as there were changes in the extent to whichnon-observable inputs have a significant impact on the fair value of these instruments or there were changes in the observability of one or more inputs thatsignificantly impact their fair value (for the quarters ended October 31, 2016 and January 31, 2016, transfers between Level 2 and Level 3 were insignificant).
A net loss of $24 million was recognized in the interim consolidated statement of income for the three months ended January 31, 2017, on the financialinstruments for which fair value was estimated using valuation techniques requiring non-observable market parameters (net loss of $7 million for the threemonths ended October 31, 2016 and a net gain of $28 million for the three months ended January 31, 2016).
The following table presents the changes in fair value of financial assets and liabilities in Level 3. These instruments are measured at fair value utilizingnon-observable market inputs. We often hedge positions with offsetting positions that may be classified in a different level. As a result, the gains and losses forassets and liabilities in the Level 3 category presented in the table below do not reflect the effect of offsetting gains and losses on the related hedginginstruments that are classified in Level 1 and Level 2.
46 CIBC FIRST QUARTER 2017
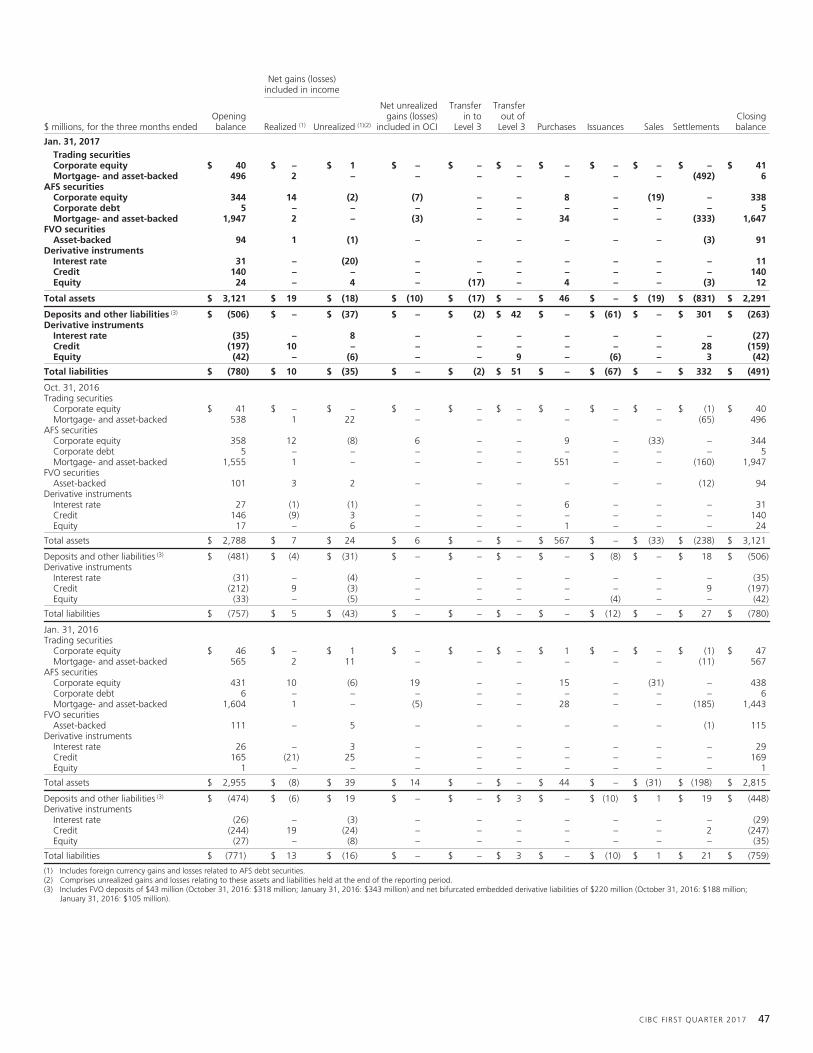
Net gains (losses)included in income
$ millions, for the three months endedOpeningbalance Realized (1) Unrealized (1)(2)
Net unrealizedgains (losses)
included in OCI
Transferin to
Level 3
Transferout of
Level 3 Purchases Issuances Sales SettlementsClosingbalance
Jan. 31, 2017Trading securitiesCorporate equity $ 40 $ – $ 1 $ – $ – $ – $ – $ – $ – $ – $ 41Mortgage- and asset-backed 496 2 – – – – – – – (492) 6
AFS securitiesCorporate equity 344 14 (2) (7) – – 8 – (19) – 338Corporate debt 5 – – – – – – – – – 5Mortgage- and asset-backed 1,947 2 – (3) – – 34 – – (333) 1,647
FVO securitiesAsset-backed 94 1 (1) – – – – – – (3) 91
Derivative instrumentsInterest rate 31 – (20) – – – – – – – 11Credit 140 – – – – – – – – – 140Equity 24 – 4 – (17) – 4 – – (3) 12
Total assets $ 3,121 $ 19 $ (18) $ (10) $ (17) $ – $ 46 $ – $ (19) $ (831) $ 2,291
Deposits and other liabilities (3) $ (506) $ – $ (37) $ – $ (2) $ 42 $ – $ (61) $ – $ 301 $ (263)Derivative instruments
Interest rate (35) – 8 – – – – – – – (27)Credit (197) 10 – – – – – – – 28 (159)Equity (42) – (6) – – 9 – (6) – 3 (42)
Total liabilities $ (780) $ 10 $ (35) $ – $ (2) $ 51 $ – $ (67) $ – $ 332 $ (491)
Oct. 31, 2016Trading securities
Corporate equity $ 41 $ – $ – $ – $ – $ – $ – $ – $ – $ (1) $ 40Mortgage- and asset-backed 538 1 22 – – – – – – (65) 496
AFS securitiesCorporate equity 358 12 (8) 6 – – 9 – (33) – 344Corporate debt 5 – – – – – – – – – 5Mortgage- and asset-backed 1,555 1 – – – – 551 – – (160) 1,947
FVO securitiesAsset-backed 101 3 2 – – – – – – (12) 94
Derivative instrumentsInterest rate 27 (1) (1) – – – 6 – – – 31Credit 146 (9) 3 – – – – – – – 140Equity 17 – 6 – – – 1 – – – 24
Total assets $ 2,788 $ 7 $ 24 $ 6 $ – $ – $ 567 $ – $ (33) $ (238) $ 3,121
Deposits and other liabilities (3) $ (481) $ (4) $ (31) $ – $ – $ – $ – $ (8) $ – $ 18 $ (506)Derivative instruments
Interest rate (31) – (4) – – – – – – – (35)Credit (212) 9 (3) – – – – – – 9 (197)Equity (33) – (5) – – – – (4) – – (42)
Total liabilities $ (757) $ 5 $ (43) $ – $ – $ – $ – $ (12) $ – $ 27 $ (780)
Jan. 31, 2016Trading securities
Corporate equity $ 46 $ – $ 1 $ – $ – $ – $ 1 $ – $ – $ (1) $ 47Mortgage- and asset-backed 565 2 11 – – – – – – (11) 567
AFS securitiesCorporate equity 431 10 (6) 19 – – 15 – (31) – 438Corporate debt 6 – – – – – – – – – 6Mortgage- and asset-backed 1,604 1 – (5) – – 28 – – (185) 1,443
FVO securitiesAsset-backed 111 – 5 – – – – – – (1) 115
Derivative instrumentsInterest rate 26 – 3 – – – – – – – 29Credit 165 (21) 25 – – – – – – – 169Equity 1 – – – – – – – – – 1
Total assets $ 2,955 $ (8) $ 39 $ 14 $ – $ – $ 44 $ – $ (31) $ (198) $ 2,815
Deposits and other liabilities (3) $ (474) $ (6) $ 19 $ – $ – $ 3 $ – $ (10) $ 1 $ 19 $ (448)Derivative instruments
Interest rate (26) – (3) – – – – – – – (29)Credit (244) 19 (24) – – – – – – 2 (247)Equity (27) – (8) – – – – – – – (35)
Total liabilities $ (771) $ 13 $ (16) $ – $ – $ 3 $ – $ (10) $ 1 $ 21 $ (759)
(1) Includes foreign currency gains and losses related to AFS debt securities.(2) Comprises unrealized gains and losses relating to these assets and liabilities held at the end of the reporting period.(3) Includes FVO deposits of $43 million (October 31, 2016: $318 million; January 31, 2016: $343 million) and net bifurcated embedded derivative liabilities of $220 million (October 31, 2016: $188 million;
January 31, 2016: $105 million).
CIBC FIRST QUARTER 2017 47
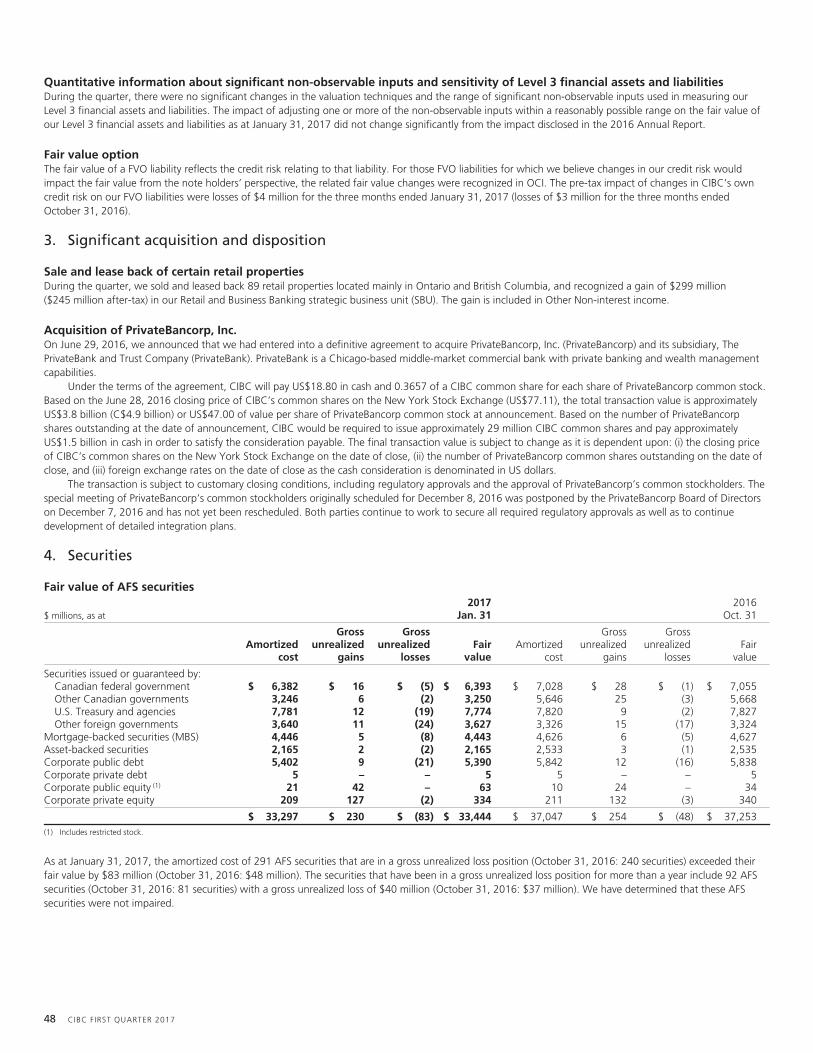
Quantitative information about significant non-observable inputs and sensitivity of Level 3 financial assets and liabilitiesDuring the quarter, there were no significant changes in the valuation techniques and the range of significant non-observable inputs used in measuring ourLevel 3 financial assets and liabilities. The impact of adjusting one or more of the non-observable inputs within a reasonably possible range on the fair value ofour Level 3 financial assets and liabilities as at January 31, 2017 did not change significantly from the impact disclosed in the 2016 Annual Report.
Fair value optionThe fair value of a FVO liability reflects the credit risk relating to that liability. For those FVO liabilities for which we believe changes in our credit risk wouldimpact the fair value from the note holders’ perspective, the related fair value changes were recognized in OCI. The pre-tax impact of changes in CIBC’s owncredit risk on our FVO liabilities were losses of $4 million for the three months ended January 31, 2017 (losses of $3 million for the three months endedOctober 31, 2016).
3. Significant acquisition and disposition
Sale and lease back of certain retail propertiesDuring the quarter, we sold and leased back 89 retail properties located mainly in Ontario and British Columbia, and recognized a gain of $299 million($245 million after-tax) in our Retail and Business Banking strategic business unit (SBU). The gain is included in Other Non-interest income.
Acquisition of PrivateBancorp, Inc.On June 29, 2016, we announced that we had entered into a definitive agreement to acquire PrivateBancorp, Inc. (PrivateBancorp) and its subsidiary, ThePrivateBank and Trust Company (PrivateBank). PrivateBank is a Chicago-based middle-market commercial bank with private banking and wealth managementcapabilities.
Under the terms of the agreement, CIBC will pay US$18.80 in cash and 0.3657 of a CIBC common share for each share of PrivateBancorp common stock.Based on the June 28, 2016 closing price of CIBC’s common shares on the New York Stock Exchange (US$77.11), the total transaction value is approximatelyUS$3.8 billion (C$4.9 billion) or US$47.00 of value per share of PrivateBancorp common stock at announcement. Based on the number of PrivateBancorpshares outstanding at the date of announcement, CIBC would be required to issue approximately 29 million CIBC common shares and pay approximatelyUS$1.5 billion in cash in order to satisfy the consideration payable. The final transaction value is subject to change as it is dependent upon: (i) the closing priceof CIBC’s common shares on the New York Stock Exchange on the date of close, (ii) the number of PrivateBancorp common shares outstanding on the date ofclose, and (iii) foreign exchange rates on the date of close as the cash consideration is denominated in US dollars.
The transaction is subject to customary closing conditions, including regulatory approvals and the approval of PrivateBancorp’s common stockholders. Thespecial meeting of PrivateBancorp’s common stockholders originally scheduled for December 8, 2016 was postponed by the PrivateBancorp Board of Directorson December 7, 2016 and has not yet been rescheduled. Both parties continue to work to secure all required regulatory approvals as well as to continuedevelopment of detailed integration plans.
4. Securities
Fair value of AFS securities
$ millions, as at2017
Jan. 312016
Oct. 31
Amortizedcost
Grossunrealized
gains
Grossunrealized
lossesFair
valueAmortized
cost
Grossunrealized
gains
Grossunrealized
lossesFair
value
Securities issued or guaranteed by:Canadian federal government $ 6,382 $ 16 $ (5) $ 6,393 $ 7,028 $ 28 $ (1) $ 7,055Other Canadian governments 3,246 6 (2) 3,250 5,646 25 (3) 5,668U.S. Treasury and agencies 7,781 12 (19) 7,774 7,820 9 (2) 7,827Other foreign governments 3,640 11 (24) 3,627 3,326 15 (17) 3,324
Mortgage-backed securities (MBS) 4,446 5 (8) 4,443 4,626 6 (5) 4,627Asset-backed securities 2,165 2 (2) 2,165 2,533 3 (1) 2,535Corporate public debt 5,402 9 (21) 5,390 5,842 12 (16) 5,838Corporate private debt 5 – – 5 5 – – 5Corporate public equity (1) 21 42 – 63 10 24 – 34Corporate private equity 209 127 (2) 334 211 132 (3) 340
$ 33,297 $ 230 $ (83) $ 33,444 $ 37,047 $ 254 $ (48) $ 37,253(1) Includes restricted stock.
As at January 31, 2017, the amortized cost of 291 AFS securities that are in a gross unrealized loss position (October 31, 2016: 240 securities) exceeded theirfair value by $83 million (October 31, 2016: $48 million). The securities that have been in a gross unrealized loss position for more than a year include 92 AFSsecurities (October 31, 2016: 81 securities) with a gross unrealized loss of $40 million (October 31, 2016: $37 million). We have determined that these AFSsecurities were not impaired.
48 CIBC FIRST QUARTER 2017
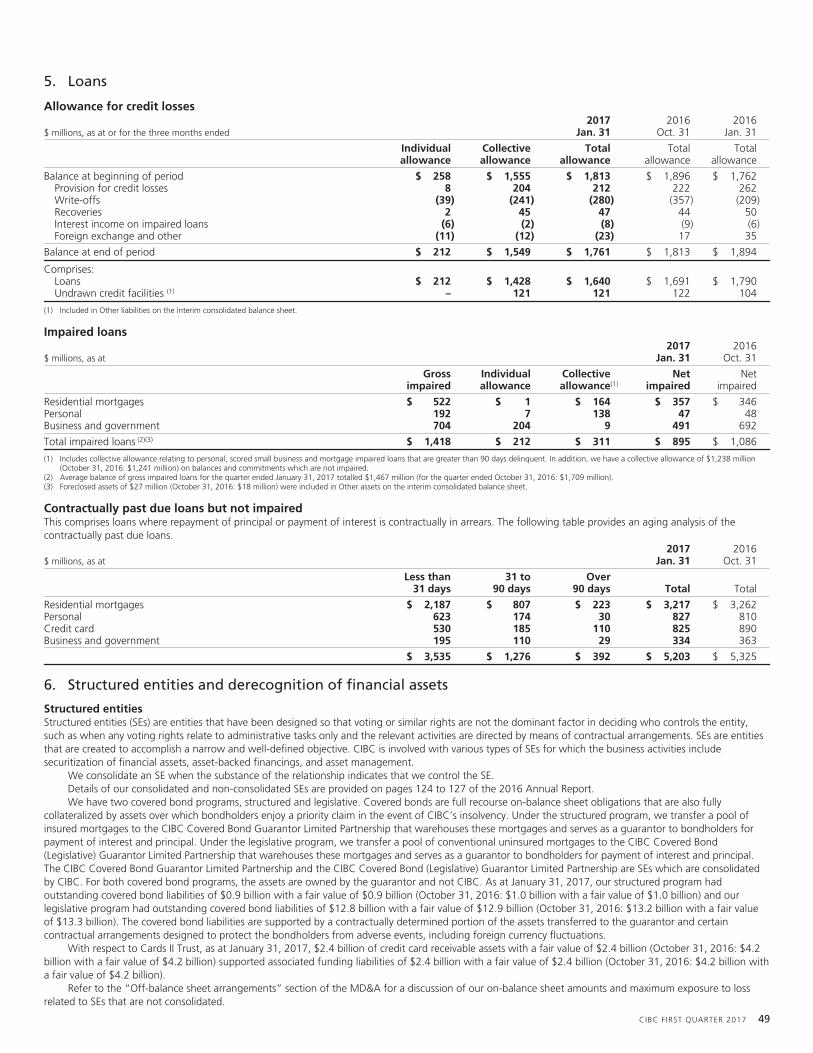
5. Loans
Allowance for credit losses
$ millions, as at or for the three months ended2017
Jan. 312016
Oct. 312016
Jan. 31
Individualallowance
Collectiveallowance
Totalallowance
Totalallowance
Totalallowance
Balance at beginning of period $ 258 $ 1,555 $ 1,813 $ 1,896 $ 1,762Provision for credit losses 8 204 212 222 262Write-offs (39) (241) (280) (357) (209)Recoveries 2 45 47 44 50Interest income on impaired loans (6) (2) (8) (9) (6)Foreign exchange and other (11) (12) (23) 17 35
Balance at end of period $ 212 $ 1,549 $ 1,761 $ 1,813 $ 1,894
Comprises:Loans $ 212 $ 1,428 $ 1,640 $ 1,691 $ 1,790Undrawn credit facilities (1) – 121 121 122 104
(1) Included in Other liabilities on the interim consolidated balance sheet.
Impaired loans
$ millions, as at2017
Jan. 312016
Oct. 31
Grossimpaired
Individualallowance
Collectiveallowance(1)
Netimpaired
Netimpaired
Residential mortgages $ 522 $ 1 $ 164 $ 357 $ 346Personal 192 7 138 47 48Business and government 704 204 9 491 692
Total impaired loans (2)(3) $ 1,418 $ 212 $ 311 $ 895 $ 1,086
(1) Includes collective allowance relating to personal, scored small business and mortgage impaired loans that are greater than 90 days delinquent. In addition, we have a collective allowance of $1,238 million(October 31, 2016: $1,241 million) on balances and commitments which are not impaired.
(2) Average balance of gross impaired loans for the quarter ended January 31, 2017 totalled $1,467 million (for the quarter ended October 31, 2016: $1,709 million).(3) Foreclosed assets of $27 million (October 31, 2016: $18 million) were included in Other assets on the interim consolidated balance sheet.
Contractually past due loans but not impairedThis comprises loans where repayment of principal or payment of interest is contractually in arrears. The following table provides an aging analysis of thecontractually past due loans.
$ millions, as at2017
Jan. 312016
Oct. 31
Less than31 days
31 to90 days
Over90 days Total Total
Residential mortgages $ 2,187 $ 807 $ 223 $ 3,217 $ 3,262Personal 623 174 30 827 810Credit card 530 185 110 825 890Business and government 195 110 29 334 363
$ 3,535 $ 1,276 $ 392 $ 5,203 $ 5,325
6. Structured entities and derecognition of financial assets
Structured entitiesStructured entities (SEs) are entities that have been designed so that voting or similar rights are not the dominant factor in deciding who controls the entity,such as when any voting rights relate to administrative tasks only and the relevant activities are directed by means of contractual arrangements. SEs are entitiesthat are created to accomplish a narrow and well-defined objective. CIBC is involved with various types of SEs for which the business activities includesecuritization of financial assets, asset-backed financings, and asset management.
We consolidate an SE when the substance of the relationship indicates that we control the SE.Details of our consolidated and non-consolidated SEs are provided on pages 124 to 127 of the 2016 Annual Report.We have two covered bond programs, structured and legislative. Covered bonds are full recourse on-balance sheet obligations that are also fully
collateralized by assets over which bondholders enjoy a priority claim in the event of CIBC’s insolvency. Under the structured program, we transfer a pool ofinsured mortgages to the CIBC Covered Bond Guarantor Limited Partnership that warehouses these mortgages and serves as a guarantor to bondholders forpayment of interest and principal. Under the legislative program, we transfer a pool of conventional uninsured mortgages to the CIBC Covered Bond(Legislative) Guarantor Limited Partnership that warehouses these mortgages and serves as a guarantor to bondholders for payment of interest and principal.The CIBC Covered Bond Guarantor Limited Partnership and the CIBC Covered Bond (Legislative) Guarantor Limited Partnership are SEs which are consolidatedby CIBC. For both covered bond programs, the assets are owned by the guarantor and not CIBC. As at January 31, 2017, our structured program hadoutstanding covered bond liabilities of $0.9 billion with a fair value of $0.9 billion (October 31, 2016: $1.0 billion with a fair value of $1.0 billion) and ourlegislative program had outstanding covered bond liabilities of $12.8 billion with a fair value of $12.9 billion (October 31, 2016: $13.2 billion with a fair valueof $13.3 billion). The covered bond liabilities are supported by a contractually determined portion of the assets transferred to the guarantor and certaincontractual arrangements designed to protect the bondholders from adverse events, including foreign currency fluctuations.
With respect to Cards II Trust, as at January 31, 2017, $2.4 billion of credit card receivable assets with a fair value of $2.4 billion (October 31, 2016: $4.2billion with a fair value of $4.2 billion) supported associated funding liabilities of $2.4 billion with a fair value of $2.4 billion (October 31, 2016: $4.2 billion witha fair value of $4.2 billion).
Refer to the “Off-balance sheet arrangements” section of the MD&A for a discussion of our on-balance sheet amounts and maximum exposure to lossrelated to SEs that are not consolidated.
CIBC FIRST QUARTER 2017 49
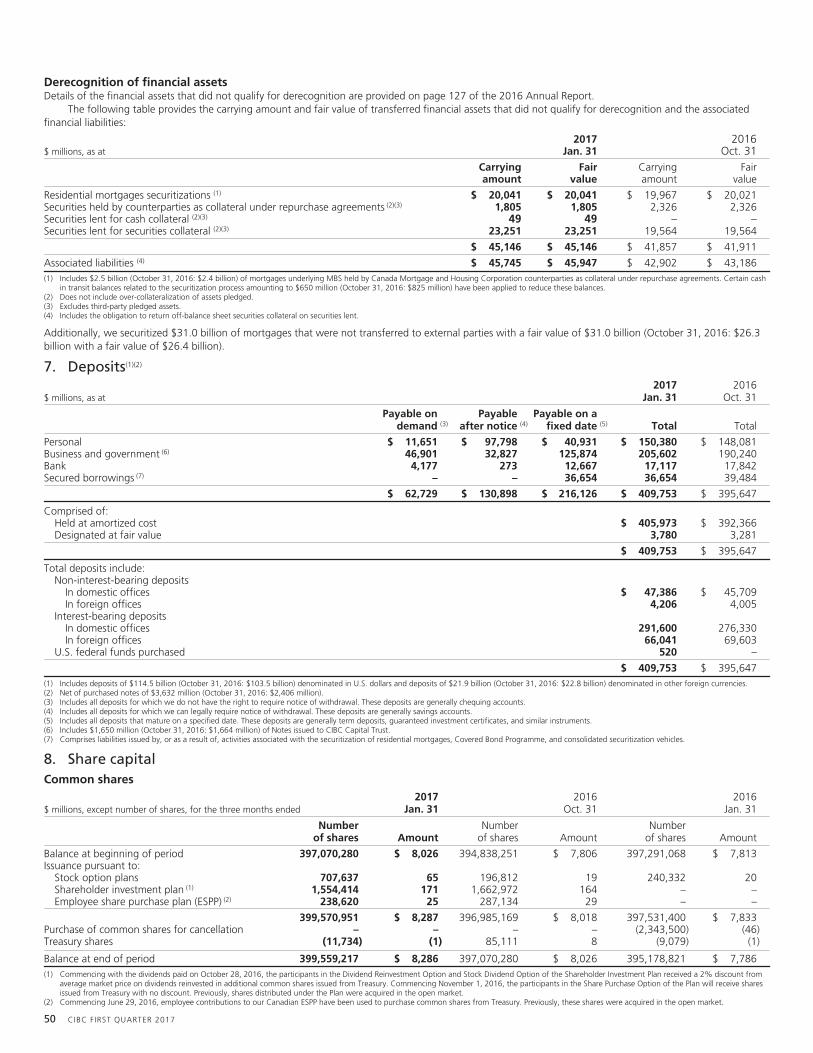
Derecognition of financial assetsDetails of the financial assets that did not qualify for derecognition are provided on page 127 of the 2016 Annual Report.
The following table provides the carrying amount and fair value of transferred financial assets that did not qualify for derecognition and the associatedfinancial liabilities:
$ millions, as at2017
Jan. 312016
Oct. 31Carryingamount
Fairvalue
Carryingamount
Fairvalue
Residential mortgages securitizations (1) $ 20,041 $ 20,041 $ 19,967 $ 20,021Securities held by counterparties as collateral under repurchase agreements (2)(3) 1,805 1,805 2,326 2,326Securities lent for cash collateral (2)(3) 49 49 – –Securities lent for securities collateral (2)(3) 23,251 23,251 19,564 19,564
$ 45,146 $ 45,146 $ 41,857 $ 41,911
Associated liabilities (4) $ 45,745 $ 45,947 $ 42,902 $ 43,186(1) Includes $2.5 billion (October 31, 2016: $2.4 billion) of mortgages underlying MBS held by Canada Mortgage and Housing Corporation counterparties as collateral under repurchase agreements. Certain cash
in transit balances related to the securitization process amounting to $650 million (October 31, 2016: $825 million) have been applied to reduce these balances.(2) Does not include over-collateralization of assets pledged.(3) Excludes third-party pledged assets.(4) Includes the obligation to return off-balance sheet securities collateral on securities lent.
Additionally, we securitized $31.0 billion of mortgages that were not transferred to external parties with a fair value of $31.0 billion (October 31, 2016: $26.3billion with a fair value of $26.4 billion).
7. Deposits(1)(2)
$ millions, as at2017
Jan. 312016
Oct. 31
Payable ondemand (3)
Payableafter notice (4)
Payable on afixed date (5) Total Total
Personal $ 11,651 $ 97,798 $ 40,931 $ 150,380 $ 148,081Business and government (6) 46,901 32,827 125,874 205,602 190,240Bank 4,177 273 12,667 17,117 17,842Secured borrowings (7) – – 36,654 36,654 39,484
$ 62,729 $ 130,898 $ 216,126 $ 409,753 $ 395,647
Comprised of:Held at amortized cost $ 405,973 $ 392,366Designated at fair value 3,780 3,281
$ 409,753 $ 395,647
Total deposits include:Non-interest-bearing deposits
In domestic offices $ 47,386 $ 45,709In foreign offices 4,206 4,005
Interest-bearing depositsIn domestic offices 291,600 276,330In foreign offices 66,041 69,603
U.S. federal funds purchased 520 –
$ 409,753 $ 395,647(1) Includes deposits of $114.5 billion (October 31, 2016: $103.5 billion) denominated in U.S. dollars and deposits of $21.9 billion (October 31, 2016: $22.8 billion) denominated in other foreign currencies.(2) Net of purchased notes of $3,632 million (October 31, 2016: $2,406 million).(3) Includes all deposits for which we do not have the right to require notice of withdrawal. These deposits are generally chequing accounts.(4) Includes all deposits for which we can legally require notice of withdrawal. These deposits are generally savings accounts.(5) Includes all deposits that mature on a specified date. These deposits are generally term deposits, guaranteed investment certificates, and similar instruments.(6) Includes $1,650 million (October 31, 2016: $1,664 million) of Notes issued to CIBC Capital Trust.(7) Comprises liabilities issued by, or as a result of, activities associated with the securitization of residential mortgages, Covered Bond Programme, and consolidated securitization vehicles.
8. Share capitalCommon shares
$ millions, except number of shares, for the three months ended2017
Jan. 312016
Oct. 312016
Jan. 31
Numberof shares Amount
Numberof shares Amount
Numberof shares Amount
Balance at beginning of period 397,070,280 $ 8,026 394,838,251 $ 7,806 397,291,068 $ 7,813Issuance pursuant to:
Stock option plans 707,637 65 196,812 19 240,332 20Shareholder investment plan (1) 1,554,414 171 1,662,972 164 – –Employee share purchase plan (ESPP) (2) 238,620 25 287,134 29 – –
399,570,951 $ 8,287 396,985,169 $ 8,018 397,531,400 $ 7,833Purchase of common shares for cancellation – – – – (2,343,500) (46)Treasury shares (11,734) (1) 85,111 8 (9,079) (1)
Balance at end of period 399,559,217 $ 8,286 397,070,280 $ 8,026 395,178,821 $ 7,786(1) Commencing with the dividends paid on October 28, 2016, the participants in the Dividend Reinvestment Option and Stock Dividend Option of the Shareholder Investment Plan received a 2% discount from
average market price on dividends reinvested in additional common shares issued from Treasury. Commencing November 1, 2016, the participants in the Share Purchase Option of the Plan will receive sharesissued from Treasury with no discount. Previously, shares distributed under the Plan were acquired in the open market.
(2) Commencing June 29, 2016, employee contributions to our Canadian ESPP have been used to purchase common shares from Treasury. Previously, these shares were acquired in the open market.
50 CIBC FIRST QUARTER 2017
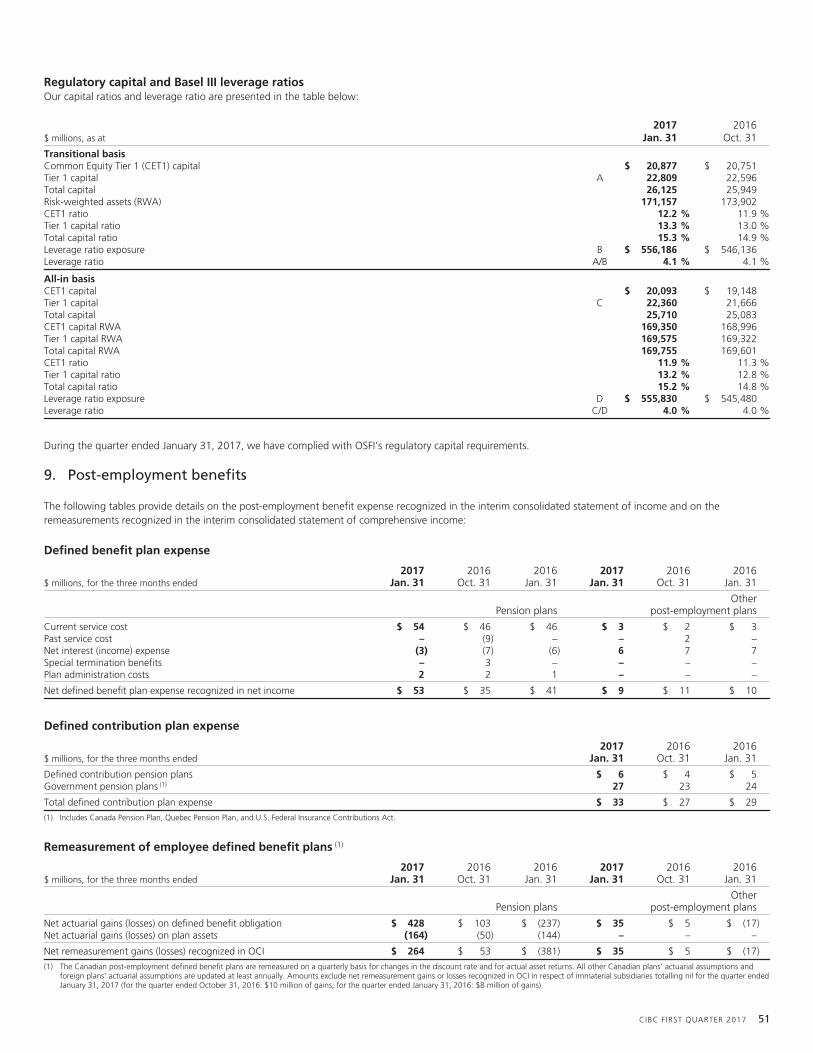
Regulatory capital and Basel III leverage ratiosOur capital ratios and leverage ratio are presented in the table below:
$ millions, as at2017
Jan. 312016
Oct. 31
Transitional basisCommon Equity Tier 1 (CET1) capital $ 20,877 $ 20,751Tier 1 capital A 22,809 22,596Total capital 26,125 25,949Risk-weighted assets (RWA) 171,157 173,902CET1 ratio 12.2 % 11.9 %Tier 1 capital ratio 13.3 % 13.0 %Total capital ratio 15.3 % 14.9 %Leverage ratio exposure B $ 556,186 $ 546,136Leverage ratio A/B 4.1 % 4.1 %
All-in basisCET1 capital $ 20,093 $ 19,148Tier 1 capital C 22,360 21,666Total capital 25,710 25,083CET1 capital RWA 169,350 168,996Tier 1 capital RWA 169,575 169,322Total capital RWA 169,755 169,601CET1 ratio 11.9 % 11.3 %Tier 1 capital ratio 13.2 % 12.8 %Total capital ratio 15.2 % 14.8 %Leverage ratio exposure D $ 555,830 $ 545,480Leverage ratio C/D 4.0 % 4.0 %
During the quarter ended January 31, 2017, we have complied with OSFI’s regulatory capital requirements.
9. Post-employment benefits
The following tables provide details on the post-employment benefit expense recognized in the interim consolidated statement of income and on theremeasurements recognized in the interim consolidated statement of comprehensive income:
Defined benefit plan expense
$ millions, for the three months ended2017
Jan. 312016
Oct. 312016
Jan. 312017
Jan. 312016
Oct. 312016
Jan. 31
Pension plansOther
post-employment plans
Current service cost $ 54 $ 46 $ 46 $ 3 $ 2 $ 3Past service cost – (9) – – 2 –Net interest (income) expense (3) (7) (6) 6 7 7Special termination benefits – 3 – – – –Plan administration costs 2 2 1 – – –
Net defined benefit plan expense recognized in net income $ 53 $ 35 $ 41 $ 9 $ 11 $ 10
Defined contribution plan expense
$ millions, for the three months ended2017
Jan. 312016
Oct. 312016
Jan. 31
Defined contribution pension plans $ 6 $ 4 $ 5Government pension plans (1) 27 23 24
Total defined contribution plan expense $ 33 $ 27 $ 29
(1) Includes Canada Pension Plan, Quebec Pension Plan, and U.S. Federal Insurance Contributions Act.
Remeasurement of employee defined benefit plans (1)
$ millions, for the three months ended2017
Jan. 312016
Oct. 312016
Jan. 312017
Jan. 312016
Oct. 312016
Jan. 31
Pension plansOther
post-employment plans
Net actuarial gains (losses) on defined benefit obligation $ 428 $ 103 $ (237) $ 35 $ 5 $ (17)Net actuarial gains (losses) on plan assets (164) (50) (144) – – –
Net remeasurement gains (losses) recognized in OCI $ 264 $ 53 $ (381) $ 35 $ 5 $ (17)
(1) The Canadian post-employment defined benefit plans are remeasured on a quarterly basis for changes in the discount rate and for actual asset returns. All other Canadian plans’ actuarial assumptions andforeign plans’ actuarial assumptions are updated at least annually. Amounts exclude net remeasurement gains or losses recognized in OCI in respect of immaterial subsidiaries totalling nil for the quarter endedJanuary 31, 2017 (for the quarter ended October 31, 2016: $10 million of gains; for the quarter ended January 31, 2016: $8 million of gains).
CIBC FIRST QUARTER 2017 51

10. Income taxes
EnronIn prior years, the Canada Revenue Agency issued reassessments disallowing the deduction of approximately $3 billion of the 2005 Enron settlement paymentsand related legal expenses. The matter is currently in litigation. The Tax Court of Canada trial on the deductibility of the Enron payments is expected tocommence in 2018.
Should we successfully defend our tax filing position in its entirety, we would recognize an additional accounting tax benefit of $231 million and taxablerefund interest of approximately $192 million. Should we fail to defend our position in its entirety, we would incur an additional tax expense of approximately$820 million and non-deductible interest of approximately $157 million.
Dividend Received DeductionIn June 2016, the Canada Revenue Agency reassessed CIBC approximately $118 million of additional income tax by denying the tax deductibility of certain2011 Canadian corporate dividends on the basis that they were part of a “dividend rental arrangement”. The circumstances of the dividends subject to thereassessment are similar to those prospectively addressed by the rules in the 2015 Canadian federal budget. It is possible that subsequent years may bereassessed for similar activities. CIBC is confident that its tax filing positions were appropriate and intends to defend itself vigorously. Accordingly, no amountshave been accrued in the consolidated financial statements.
11. Earnings per share
$ millions, except number of shares and per share amounts, for the three months ended2017
Jan. 312016
Oct. 312016
Jan. 31
Basic earnings per shareNet income attributable to equity shareholders $ 1,402 $ 927 $ 977Less: Preferred share dividends and premiums 9 10 9
Net income attributable to common shareholders $ 1,393 $ 917 $ 968
Weighted-average common shares outstanding (thousands) 397,647 395,181 396,927
Basic earnings per share $ 3.50 $ 2.32 $ 2.44
Diluted earnings per shareNet income attributable to common shareholders $ 1,393 $ 917 $ 968
Weighted-average common shares outstanding (thousands) 397,647 395,181 396,927Add: Stock options potentially exercisable (1) (thousands) 664 569 501
Weighted-average diluted common shares outstanding (thousands) 398,311 395,750 397,428
Diluted earnings per share $ 3.50 $ 2.32 $ 2.43(1) Excludes average options outstanding of 537,029 (October 31, 2016: 572,449; January 31, 2016: 1,363,352) with a weighted-average exercise price of $111.69 (October 31, 2016: $102.33; January 31,
2016: $99.38) for the quarter ended January 31, 2017, as the options’ exercise prices were greater than the average market price of CIBC’s common shares.
12. Contingent liabilities and provision
Legal proceedings and other contingenciesIn the ordinary course of its business, CIBC is a party to a number of legal proceedings, including regulatory investigations, in which claims for substantialmonetary damages are asserted against CIBC and its subsidiaries. Legal provisions are established if, in the opinion of management, it is both probable that anoutflow of economic benefits will be required to resolve the matter, and a reliable estimate can be made of the amount of the obligation. If the reliableestimate of probable loss involves a range of potential outcomes within which a specific amount within the range appears to be a better estimate, that amountis accrued. If no specific amount within the range of potential outcomes appears to be a better estimate than any other amount, the mid-point in the range isaccrued. In some instances, however, it is not possible either to determine whether an obligation is probable or to reliably estimate the amount of loss, in whichcase no accrual can be made.
While there is inherent difficulty in predicting the outcome of legal proceedings, based on current knowledge and in consultation with legal counsel, wedo not expect the outcome of these matters, individually or in aggregate, to have a material adverse effect on our consolidated financial statements. However,the outcome of these matters, individually or in aggregate, may be material to our operating results for a particular reporting period. We regularly assess theadequacy of CIBC’s litigation accruals and make the necessary adjustments to incorporate new information as it becomes available.
The provisions disclosed in Note 23 to the 2016 annual consolidated financial statements included all of CIBC’s accruals for legal matters as at that date,including amounts related to the significant legal proceedings described in that note and to other legal matters.
CIBC considers losses to be reasonably possible when they are neither probable nor remote. It is reasonably possible that CIBC may incur losses in additionto the amounts recorded when the loss accrued is the mid-point of a range of reasonably possible losses, or the potential loss pertains to a matter in which anunfavourable outcome is reasonably possible but not probable.
CIBC believes the estimate of the aggregate range of reasonably possible losses, in excess of the amounts accrued, for its significant legal proceedings,where it is possible to make such an estimate, is from nil to approximately $1.3 billion as at January 31, 2017. This estimated aggregate range of reasonablypossible losses is based upon currently available information for those significant proceedings in which CIBC is involved, taking into account CIBC’s bestestimate of such losses for those cases for which an estimate can be made. CIBC’s estimate involves significant judgment, given the varying stages of theproceedings and the existence of multiple defendants in many of such proceedings whose share of the liability has yet to be determined. The range does notinclude potential punitive damages and interest. The matters underlying the estimated range as at January 31, 2017, consist of the significant legal mattersdisclosed in Note 23 to the 2016 annual consolidated financial statements as updated below. The matters underlying the estimated range will change from timeto time, and actual losses may vary significantly from the current estimate. For certain matters, CIBC does not believe that an estimate can currently be made asmany of them are in preliminary stages and certain matters have no specific amount claimed. Consequently, these matters are not included in the range.
52 CIBC FIRST QUARTER 2017
The following developments related to our significant legal proceedings occurred since the issuance of our 2016 annual consolidated financial statements:• Credit card class actions - Quebec Consumer Protection Act: The Lamoureux, St. Pierre and Corriveau actions were settled in 2016 subject to court
approval. Pursuant to the proposed settlement CIBC will pay $4.25 million to settle these three actions. The court approval hearing was held in December2016. In January 2017, the court did not approve CIBC’s proposed settlement as it found the fees for plaintiffs’ counsel were excessive and the end datefor one of the actions was later than required. The plaintiffs are appealing the decision.
• Cerberus Capital Management L.P. v. CIBC: The hearing of the summary judgment motion is tentatively set for March 2017.• Fresco v. Canadian Imperial Bank of Commerce: The plaintiffs have filed a motion for summary judgment which is set for August 2017.
Other than the items described above, there are no significant developments in the matters identified in Note 23 to our 2016 annual consolidated financialstatements, and no new significant legal proceedings have arisen since the issuance of our 2016 annual consolidated financial statements.
RestructuringIn previous years we recorded cumulative restructuring charges of $430 million. As at January 31, 2017, the remaining provision relating to restructuringcharges recognized in previous years was $224 million (October 31, 2016: $256 million). The reduction in the provision during the three months endedJanuary 31, 2017 primarily relates to payments made to settle a portion of the obligation. While this amount represents our best estimate as at January 31,2017 of the amount required to settle the obligation, uncertainty exists with respect to when the obligation will be settled and the amounts that will ultimatelybe paid, as this will largely depend upon individual facts and circumstances.
13. Segmented information
CIBC has three SBUs: Retail and Business Banking, Wealth Management, and Capital Markets. These SBUs are supported by Corporate and Other.Retail and Business Banking provides personal and business clients across Canada with financial advice, products and services through a strong team of
advisors and relationship managers, in our banking centres or through remote channels such as mobile advisors, telephone, online or mobile banking.Wealth Management provides integrated advice and investment solutions to meet the needs of institutional, retail, and high net worth clients. Our asset
management, retail brokerage and private wealth management businesses combine to create an integrated offer, delivered through approximately 1,600advisors across Canada and the U.S. The results of American Century Investments are included in the Other business line.
Capital Markets provides integrated global markets products and services, investment banking advisory and execution, corporate banking and top-rankedresearch to corporate, government and institutional clients around the world.
Corporate and Other includes the following functional groups – Technology and Operations, Finance (including Treasury), Administration, RiskManagement, and Internal Audit, as well as other support groups. The expenses of these functional and support groups are generally allocated to the businesslines within the SBUs. Corporate and Other also includes our international banking operations comprising mainly FirstCaribbean International Bank Limited,strategic investments in the CIBC Mellon joint ventures, and other income statement and balance sheet items not directly attributable to the business lines.
CIBC FIRST QUARTER 2017 53

$ millions, for the three months ended
Retail andBusinessBanking
WealthManagement
CapitalMarkets
Corporateand Other
CIBCTotal
2017 Net interest income (1) $ 1,602 $ 54 $ 546 $ (60) $ 2,142Jan. 31 Non-interest income 872 724 328 143 2,067
Intersegment revenue (2) 122 (125) 3 – –
Total revenue (1) 2,596 653 877 83 4,209Provision for credit losses 205 – 2 5 212Amortization and impairment (3) 22 6 1 91 120Other non-interest expenses 1,107 463 381 203 2,154
Income (loss) before income taxes 1,262 184 493 (216) 1,723Income taxes (1) 309 51 122 (166) 316
Net income (loss) $ 953 $ 133 $ 371 $ (50) $ 1,407
Net income (loss) attributable to:Non-controlling interests $ – $ – $ – $ 5 $ 5Equity shareholders 953 133 371 (55) 1,402
Average assets (4) $ 283,403 $ 3,878 $ 173,032 $ 68,539 $ 528,852
2016 Net interest income (1) $ 1,599 $ 51 $ 506 $ (46) $ 2,110Oct. 31 Non-interest income 570 693 164 144 1,571
Intersegment revenue (2) 121 (124) 3 – –
Total revenue (1) 2,290 620 673 98 3,681Provision for credit losses 206 – – 16 222Amortization and impairment (3) 23 7 1 98 129Other non-interest expenses 1,126 437 332 323 2,218
Income (loss) before income taxes 935 176 340 (339) 1,112Income taxes (1) 248 50 64 (181) 181
Net income (loss) $ 687 $ 126 $ 276 $ (158) $ 931
Net income (loss) attributable to:Non-controlling interests $ – $ – $ – $ 4 $ 4Equity shareholders 687 126 276 (162) 927
Average assets (4) $ 276,304 $ 4,086 $ 168,096 $ 79,216 $ 527,702
2016 Net interest income (1) $ 1,534 $ 52 $ 537 $ (17) $ 2,106Jan. 31 Non-interest income 542 666 143 130 1,481
Intersegment revenue (2) 114 (117) 3 – –
Total revenue (1) 2,190 601 683 113 3,587Provision for credit losses 163 – 25 74 262Amortization and impairment (3) 24 6 1 75 106Other non-interest expenses 1,073 433 343 209 2,058
Income (loss) before income taxes 930 162 314 (245) 1,161Income taxes (1) 246 43 70 (180) 179
Net income (loss) $ 684 $ 119 $ 244 $ (65) $ 982
Net income (loss) attributable to:Non-controlling interests $ – $ – $ – $ 5 $ 5Equity shareholders 684 119 244 (70) 977
Average assets (4) $ 257,152 $ 4,995 $ 157,537 $ 74,695 $ 494,379(1) Capital Markets net interest income and income tax expense includes a taxable equivalent basis (TEB) adjustment of $118 million for the three months ended January 31, 2017 ($97 million and $115 million
for the three months ended October 31, 2016 and January 31, 2016, respectively) with an equivalent offset in Corporate and Other.(2) Intersegment revenue represents internal sales commissions and revenue allocations under the Manufacturer / Customer Segment / Distributor Management Model.(3) Comprises amortization and impairment of buildings, furniture, equipment, leasehold improvements, and software and other intangible assets.(4) Assets are disclosed on an average basis as this measure is most relevant to a financial institution and is the measure reviewed by management.
14. Financial instruments – disclosures
We have provided quantitative disclosures related to credit risk consistent with Basel guidelines in the “Credit risk” section of the MD&A in our 2016 AnnualReport and interim report to shareholders, which require entities to disclose their exposures based on how they manage their business and risks. The tablebelow sets out the categories of the on-balance sheet exposure to credit risk under different Basel approaches, displayed in both accounting categories andBasel portfolios.
Accounting categories Basel portfolios
Advanced internal ratings-based and standardized approaches
$ millions, as at Corporate Sovereign Bank
Real estatesecured
personallending
Qualifyingrevolving
retailOtherretail
Assetsecuritization
Totalsubject tocredit risk
Notsubject
to creditrisk
Totalconsolidated
balancesheet
2017 Cash and deposits with banks $ 246 $ 10,464 $ 2,907 $ – $ – $ – $ – $ 13,617 $ 1,772 $ 15,389Jan. 31 Securities 1,395 27,518 3,191 – – – 2,372 34,476 55,048 89,524
Cash collateral on securities borrowed 2,547 8 3,012 – – – – 5,567 – 5,567Securities purchased under resale agreements 22,020 10,505 6,464 – – – – 38,989 – 38,989Loans 67,137 4,319 596 209,147 21,474 10,545 1,636 314,854 709 315,563Allowance for credit losses – – – – – – – – (1,640) (1,640)Derivative instruments 5,397 5,500 13,000 – – – – 23,897 – 23,897Customers’ liability under acceptances 6,140 2,031 – – – – – 8,171 – 8,171Other assets 263 2,237 5,145 149 30 14 4 7,842 9,992 17,834
Total credit exposure $ 105,145 $ 62,582 $ 34,315 $ 209,296 $ 21,504 $ 10,559 $ 4,012 $ 447,413 $ 65,881 $ 513,294
2016Oct. 31 Total credit exposure $ 96,352 $ 64,554 $ 38,326 $ 204,225 $ 21,597 $ 10,465 $ 5,435 $ 440,954 $ 60,403 $ 501,357
54 CIBC FIRST QUARTER 2017
TO REACH US:
Corporate Secretary: Shareholders may call 416-980-3096, or e-mail: [email protected]
Investor Relations: Financial analysts, portfolio managers and other investors requiring financial information may call 416-861-5743, or e-mail:[email protected]
Communications and Public Affairs: Financial, business and trade media may call 416-861-5482, or e-mail: [email protected]
CIBC Telephone Banking: As part of our commitment to our clients, information about CIBC products and services is available by calling 1-800-465-2422toll-free across Canada.
Online Investor Presentations: Supplementary financial information, Supplementary regulatory capital disclosure and a presentation to investors and analystsare available at www.cibc.com; About CIBC.
Earnings Conference Call: CIBC’s first quarter conference call with analysts and investors will take place on Thursday, February 23, 2017 at 8:00 a.m. (ET).The call will be available in English (416-340-2217, or toll-free 1-866-696-5910, passcode 7253671#) and French (514-861-2255, or toll-free 1-877-405-9213,passcode 8742908#). A telephone replay of the conference call will be available in English and French until 11:59 p.m. (ET) March 2, 2017. To access the replayin English, call 905-694-9451 or 1-800-408-3053, passcode 9856140#. To access the replay in French, call 514-861-2272 or 1-800-408-3053,passcode 7466572#.
Audio Webcast: A live audio webcast of CIBC’s first quarter results conference call will take place on Thursday, February 23, 2017 at 8:00 a.m. (ET) inEnglish and French. To access the audio webcast, go to www.cibc.com; About CIBC. An archived version of the audio webcast will also be available inEnglish and French following the call on www.cibc.com; About CIBC.
Annual Meeting: CIBC’s next Annual Meeting of Shareholders will be held on April 6, 2017 in Ottawa, Ontario.
Regulatory Capital: Information on CIBC’s regulatory capital instruments and regulatory capital position may be found at www.cibc.com; About CIBC;Investor Relations; Regulatory Capital Instruments.
Nothing in CIBC’s website www.cibc.com should be considered incorporated herein by reference.
DIRECT DIVIDEND DEPOSIT SERVICECanadian-resident holders of common shares may have their dividendsdeposited directly into their account at any financial institution which is amember of the Canadian Payments Association. To arrange, please write toCST Trust Company, P.O. Box 700 Postal Station B, Montreal, QC H3B 3K3or e-mail: [email protected]
SHAREHOLDER INVESTMENT PLANRegistered holders of CIBC common shares wishing to acquire additionalcommon shares may participate in the Shareholder Investment Plan and payno brokerage commissions or service charges.
For a copy of the offering circular, contact CST Trust Company at416-682-3860, toll-free at 1-800-387-0825, or by email [email protected].
PURCHASE PRICE OF COMMON SHARESUNDER THE
SHAREHOLDER INVESTMENT PLAN
Date
Sharepurchase
option
Dividendreinvestment & stock
dividend options
Nov. 1/16 $100.79Dec. 1/16 $105.72Jan. 3/17 $110.60
Jan. 27/17 $109.77
Canadian Imperial Bank of CommerceHead Office: Commerce Court, Toronto, Ontario, M5L 1A2, Canada, (416) 980-2211
www.cibc.com