report to the nation kentucky - files.eric.ed.gov · 13.3 12.4 11.9 5.5 3.4 16.9 4.6 ... a closer...
TRANSCRIPT

Ken
tuck
y
THE 10TH ANNUAL
AP® Report to the NationSTATE SUPPLEMENT FEBRUARY 11, 2014

2
T H E 1 0 T H A N N U A L A P R E P O R T T O T H E N A T I O N · K E N T U C K Y S U P P L E M E N T
About This Report
This report provides educators and policymakers with information
they can use to celebrate their successes, understand their unique
challenges, and set meaningful goals to increase opportunity for all
students. It’s important to note that while AP® Exams are valid
measures of students’ content mastery of college-level studies in
specific academic disciplines, AP results should never be used as
the sole measure for gauging educational excellence and equity.
Because reliable demographic data for nonpublic schools are not
available for all states, this report represents public school students
only. Additionally, this report looks at students’ entire experience
with AP — tracking exams taken by graduates throughout their high
school careers — as opposed to reporting exam results from a
particular calendar year.
Additional data are available at apreport.collegeboard.org.
Table of Contents
3 State Strategies
6 Fostering AP® Participation and Success
8 A Closer Look at Equity Gaps in AP Participation and Success
Note: Throughout this report, public high school graduates represent projections supplied in Knocking at the College Door (Western Interstate Commission for Higher Education, 2012).
The redesigned courses, Biology, Latin, and Spanish Literature and Culture, began in fall 2012, and the first AP Exam based on those redesigned courses was administered in May 2013. As a result, the data in this report reflect a blend of the old and redesigned exam results.

3
T H E 1 0 T H A N N U A L A P R E P O R T T O T H E N A T I O N · K E N T U C K Y S U P P L E M E N T
STATE STRATEG IESSTATE STRATEG IES
Kentucky has made progress in recent years in improving student access and supporting student performance in AP®. Just as we do in the national report, we wanted to take an opportunity to applaud your efforts and offer additional strategies for your consideration.
Current Picture
Congratulations. You are already using these strategies to build a robust AP Program. You:
Include AP on the state’s school report card.
Celebrate the 13 districts that have earned a spot on the AP Honor Roll through their hard work and dedication to increasing participation and success in AP, particularly for underrepresented students. See details on page 5.
Encourage your educators to participate in the development of the AP Program, such as by becoming AP Exam Readers or participating in course and exam development committees. See page 5 for more details.
Ensure that colleges and universities award credit or placement for AP Exam scores using evidence-based methods.

4
T H E 1 0 T H A N N U A L A P R E P O R T T O T H E N A T I O N · K E N T U C K Y S U P P L E M E N T
STATE STRATEG IESSTATE STRATEG IES
The following strategies have been proven effective. To build an even stronger AP program, you could:
¨ Include AP in the state accountability system. • Establish AP participation and performance indicators. • Set clear, measurable statewide goals toward improvement.
¨ Provide funding for teachers in underserved areas of the state to participate in professional development.
¨ Create opportunities for other schools and districts to learn from your AP Honor Roll winners.
¨ Provide targeted assistance and resources to schools serving traditionally underserved populations. For example, funding for materials, supplies, outreach efforts, and tutoring programs.
¨ Clearly communicate how AP fits into state graduation requirements, and share information about funding opportunities that enable students to participate and succeed in AP.
¨ Develop policies that allow AP course work and exam scores for sophomores and juniors to substitute for statewide graduation requirements and/or end-of-course assessments.
¨ Provide resources to schools and districts to support research-based programs that build content knowledge and skills — particularly in literacy and math — to prepare students for success in AP course work, and in college and careers.
Opportunities

5
T H E 1 0 T H A N N U A L A P R E P O R T T O T H E N A T I O N · K E N T U C K Y S U P P L E M E N T
STATE STRATEG IESSTATE STRATEG IES
The following information dives a little deeper into the details of your efforts.
Participation in the Development of AP
2013 Reading participants —Total: 215 Kentucky represents 1.9% of all Readers • AP High School Teachers: 103 • College and University Faculty: 112
2013 AP Professional Development Leaders —Total: 6
2013 AP Development Committee Members —Total: 5
Microeconomics Centre College AP Capstone™ Seminar McCracken County High School AP Capstone Seminar University of Kentucky Music Theory University of Louisville Italian Language and Culture University of Louisville
The AP Honor RollThe AP Honor Roll recognizes and honors those outstanding school districts that simultaneously increase access to Advanced Placement® course work while increasing the percentage of students earning scores of 3 or higher on AP Exams. Achieving both of these goals is the ideal scenario for a district’s AP program because it indicates that the district is successfully identifying motivated, academically prepared students who are likely to benefit most from rigorous AP course work.
4th Annual Honor Roll Districts in Kentucky: 13
Archdiocese of Louisville*Ashland Independent Schools*Boone County Schools*Bracken County School DistrictFayette County Public Schools*Floyd County School DistrictLogan County SchoolsMadison County School DistrictMarion County Public Schools*Marshall County School DistrictMcLean County Unit District No. 5Murray Independent School DistrictPulaski County Schools*
Highlights
*District has achieved the honor for multiple years.
6
T H E 1 0 T H A N N U A L A P R E P O R T T O T H E N A T I O N · K E N T U C K Y S U P P L E M E N T
FOSTER ING AP PART IC IPAT ION AND SUCCESS
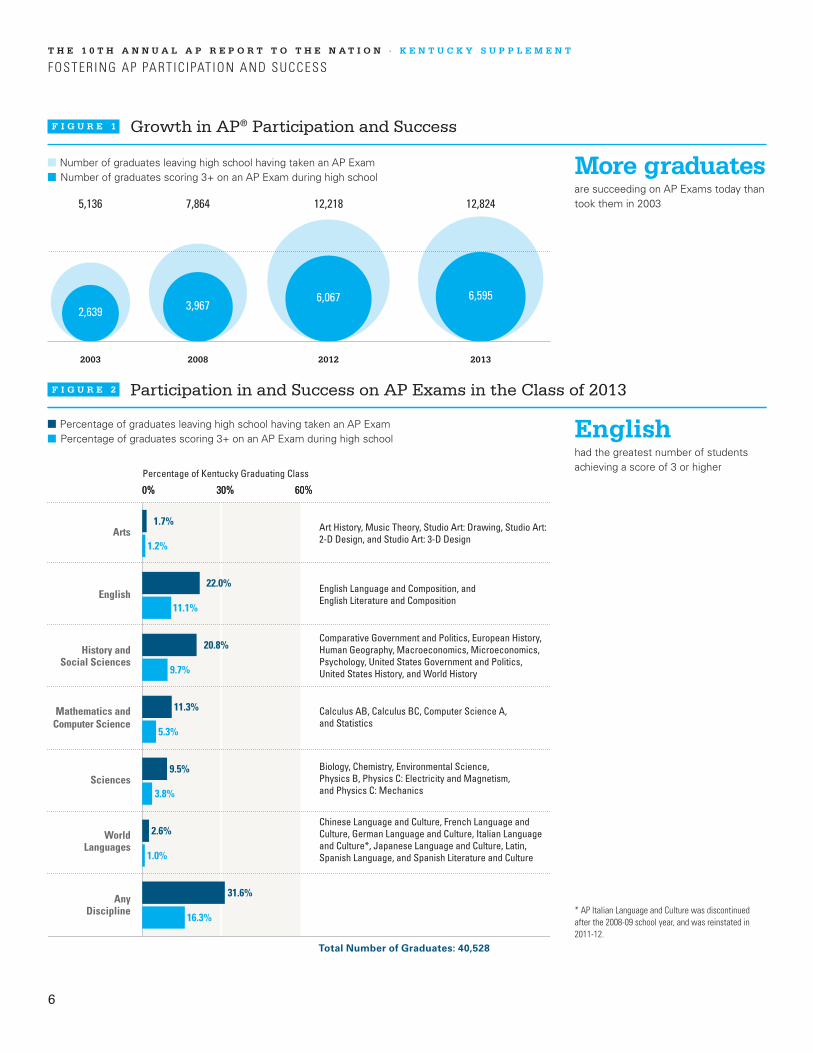
More graduatesare succeeding on AP Exams today than took them in 2003
Englishhad the greatest number of students achieving a score of 3 or higher
F I G U R E 1 Growth in AP® Participation and Success
F I G U R E 2 Participation in and Success on AP Exams in the Class of 2013
Number of graduates leaving high school having taken an AP Exam Number of graduates scoring 3+ on an AP Exam during high school
2003 2008 2012 2013
7,8645,136 12,218 12,824
3,9672,6396,067 6,595
60%30%0%
Percentage of Kentucky Graduating Class
Arts
English
WorldLanguages
Mathematics andComputer Science
Sciences
History andSocial Sciences
AnyDiscipline
Total Number of Graduates: 40,528
1.7%
22.0%
20.8%
11.3%
9.5%
2.6%
31.6%
1.2%
11.1%
9.7%
5.3%
3.8%
1.0%
16.3%
60%30%0%
Percentage of graduates leaving high school having taken an AP Exam Percentage of graduates scoring 3+ on an AP Exam during high school
* AP Italian Language and Culture was discontinued after the 2008-09 school year, and was reinstated in 2011-12.
Art History, Music Theory, Studio Art: Drawing, Studio Art: 2-D Design, and Studio Art: 3-D Design
English Language and Composition, and English Literature and Composition
Comparative Government and Politics, European History, Human Geography, Macroeconomics, Microeconomics, Psychology, United States Government and Politics, United States History, and World History
Calculus AB, Calculus BC, Computer Science A, and Statistics
Biology, Chemistry, Environmental Science, Physics B, Physics C: Electricity and Magnetism, and Physics C: Mechanics
Chinese Language and Culture, French Language and Culture, German Language and Culture, Italian Language and Culture*, Japanese Language and Culture, Latin, Spanish Language, and Spanish Literature and Culture

7
T H E 1 0 T H A N N U A L A P R E P O R T T O T H E N A T I O N · K E N T U C K Y S U P P L E M E N T
FOSTER ING AP PART IC IPAT ION AND SUCCESS
+ Due to rounding, percentages do not always add up to 100.0.* AP Italian Language and Culture was discontinued after the 2008-09 school year, and was reinstated in 2011-12.
Subjects with fewer than five AP Exam takers were omitted from this figure.
F I G U R E 3 Score Distributions of AP Exams Taken by the Class of 2013 During High School
Rank
100% 80% 60% 40% 20% 0% 20% 40% 60% 80% 100%
Subject No. of Exams % of Exam Scores+
4.7
6.5
11.1
7.5
11.8
18.2
14.6
15.3
10.7
17.7
14.9
7.4
23.6
31.9
20.8
28.3
31.1
14.8
10.0
40.5
39.1
53.8
24.7
36.3
20.6
22.0
34.2
30.9
43.0
43.9
26.8
Studio Art: Drawing 129
Macroeconomics 184
Microeconomics 81
Spanish Literature and Culture 40
Comparative Government and Politics 93
Calculus BC 611
Studio Art: 3-D Design 41
Physics C: Electricity and Magnetism 48
Physics C: Mechanics 137
Music Theory 243
German Language and Culture 62
Art History 148
Studio Art: 2-D Design 217
6 Psychology 2,152
Computer Science A 232
9 United States Government and Politics 1,409
Human Geography 1,134
Physics B 682
1 English Language and Composition 7,317
3 English Literature and Composition 5,418
4 Calculus AB 2,956
European History 1,252
Japanese Language and Culture 13
5 World History 2,752
8 Statistics 1,812
French Language and Culture 160
2 United States History 5,474
7 Biology 1,966
Environmental Science 878
Spanish Language 733
10 Chemistry 1,288
Latin 71
Chinese Language and Culture 3
Italian Language and Culture* 0
10.1
12.0
8.6
15.0
10.8
6.9
29.3
16.7
18.2
23.0
17.7
22.3
31.3
15.4
9.1
24.6
18.3
18.3
34.9
41.3
11.6
14.1
29.2
18.9
35.0
34.6
24.7
29.3
18.0
18.2
47.9
46.5
18.5
23.5
37.5
18.3
18.8
46.3
10.4
16.1
28.8
21.0
31.1
30.0
21.2
16.4
25.4
20.8
24.2
29.2
31.2
17.6
30.0
23.1
24.9
22.6
28.1
22.8
23.2
16.7
16.0
18.5
16.9
28.7
41.8
39.5
30.0
29.0
14.9
14.6
22.9
24.1
19.8
27.4
23.6
20.3
25.0
20.7
15.8
20.1
14.5
15.7
14.0
13.5
12.2
14.7
15.2
13.8
14.9
11.9
19.1
12.8
12.4
5.6
10.1
21.2
17.3
10.0
30.1
41.2
9.8
35.4
26.3
17.7
16.1
8.1
11.1
14.9
22.0
13.3
12.4
11.9
5.5
3.4
16.9
4.6
23.1
6.5
7.1
2.5
5.8
6.1
4.0
10.2
6.9
2.8

8
T H E 1 0 T H A N N U A L A P R E P O R T T O T H E N A T I O N · K E N T U C K Y S U P P L E M E N T
A CLOSER LOOK AT EQUITY GAPS IN AP PART IC IPAT ION AND SUCCESS
Low IncomeF I G U R E 4 Trends in AP Exam Participation and Success
8,869AP Exams were taken by low-income graduates in the class of 2013
The percentage or number of ...
• K–12 students eligible for free or reduced-price lunch*
• graduates leaving high school having taken an AP Exam who are from low-income backgrounds
• graduates scoring 3+ on an AP Exam during high school who are from low-income backgrounds
2003 2008 2012 2013
** ** ** **
479 1,200 3,114 3,345
145 363 1,086 1,234
2003 2005 2008 20122011 2013
PE
RC
EN
TA
GE
OF
SP
EC
IF
IC
PO
PU
LA
TI
ON
G R A D U A T I N G C L A S S
10%
20%
0%
30%
40%
50%
60%
70%
80%
90%
100%
51.2%
56.6%
9.3%
12.1%
23.3%
25.5% 26.1%
5.5%
9.2%
16.3%17.9%
18.7%15.3%
7.0%
* Estimates reflect the percentage of K–12 public school students eligible for free or reduced-price lunch. SOURCE: U.S. Department of Education, National Center for Education Statistics, Digest of Education Statistics: 2008 (Table 42), 2009 (Table 42), 2010 (Table 44), 2011 (Table 45), and 2012 (Table 46).
** The numbers of students in the graduating classes who are eligible for free or reduced-price lunch are not available.
9
T H E 1 0 T H A N N U A L A P R E P O R T T O T H E N A T I O N · K E N T U C K Y S U P P L E M E N T
A CLOSER LOOK AT EQUITY GAPS IN AP PART IC IPAT ION AND SUCCESS
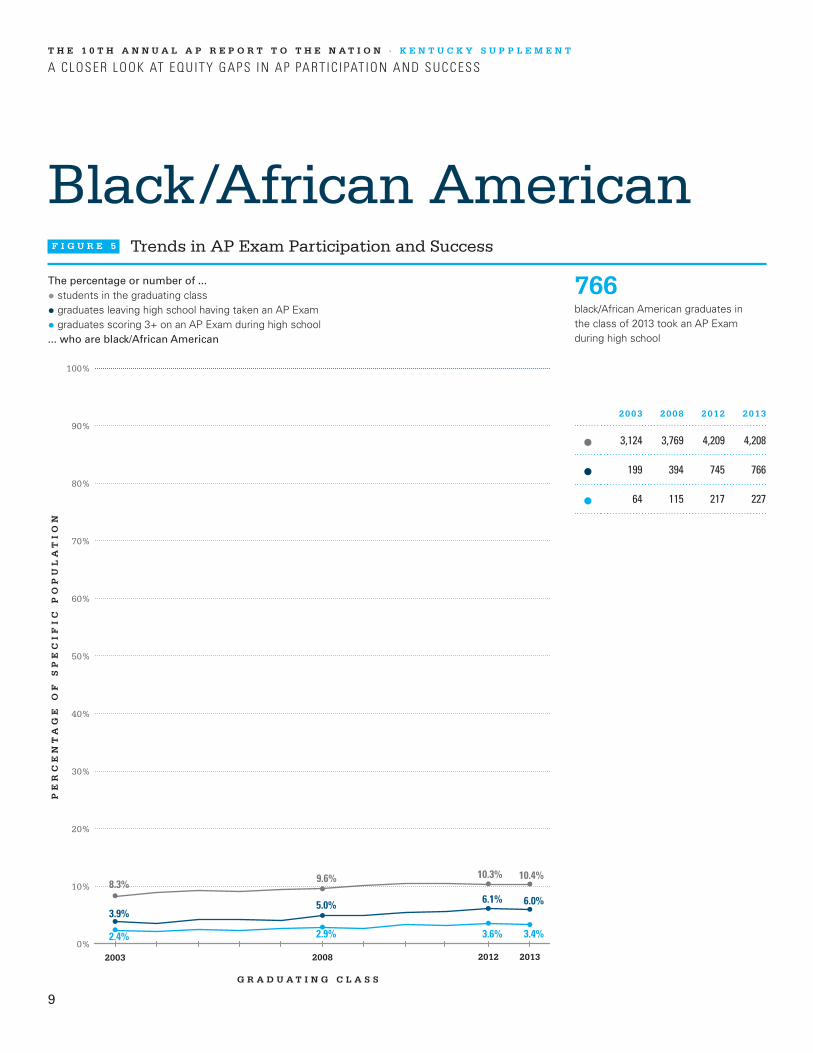
Black/African AmericanF I G U R E 5 Trends in AP Exam Participation and Success
766black/African American graduates in the class of 2013 took an AP Exam during high school
The percentage or number of ...
• students in the graduating class
• graduates leaving high school having taken an AP Exam
• graduates scoring 3+ on an AP Exam during high school... who are black/African American
2003 2008 2012 2013
3,124 3,769 4,209 4,208
199 394 745 766
64 115 217 227
2003 2008 2012 2013
PE
RC
EN
TA
GE
OF
SP
EC
IF
IC
PO
PU
LA
TI
ON
G R A D U A T I N G C L A S S
10%
20%
0%
30%
40%
50%
60%
70%
80%
90%
100%
8.3% 9.6% 10.3% 10.4%
3.9%5.0% 6.1% 6.0%
2.4% 2.9% 3.6% 3.4%

10
T H E 1 0 T H A N N U A L A P R E P O R T T O T H E N A T I O N · K E N T U C K Y S U P P L E M E N T
A CLOSER LOOK AT EQUITY GAPS IN AP PART IC IPAT ION AND SUCCESS
Hispanic/LatinoF I G U R E 6 Trends in AP Exam Participation and Success
411Hispanic/Latino graduates in the class of 2013 took an AP Exam during high school
The percentage or number of ...
• students in the graduating class
• graduates leaving high school having taken an AP Exam
• graduates scoring 3+ on an AP Exam during high school... who are Hispanic/Latino
2003 2008 2012 2013
385 585 951 1,147
54 163 348 411
35 112 197 228
2003 2008 2012 2013
PE
RC
EN
TA
GE
OF
SP
EC
IF
IC
PO
PU
LA
TI
ON
G R A D U A T I N G C L A S S
10%
20%
0%
30%
40%
50%
60%
70%
80%
90%
100%
1.0%1.5% 2.3% 2.8%
1.1% 2.1% 2.8% 3.2%1.3%2.8% 3.2% 3.5%

11
T H E 1 0 T H A N N U A L A P R E P O R T T O T H E N A T I O N · K E N T U C K Y S U P P L E M E N T
A CLOSER LOOK AT EQUITY GAPS IN AP PART IC IPAT ION AND SUCCESS
American Indian/ Alaska NativeF I G U R E 7 Trends in AP Exam Participation and Success
49American Indian/Alaska Native graduates in the class of 2013 took an AP Exam during high school
The percentage or number of ...
• students in the graduating class
• graduates leaving high school having taken an AP Exam
• graduates scoring 3+ on an AP Exam during high school... who are American Indian/Alaska Native
2003 2008 2012 2013
45 53 48 64
14 26 43 49
8 10 22 23
2003 2008 2012 2013
PE
RC
EN
TA
GE
OF
SP
EC
IF
IC
PO
PU
LA
TI
ON
G R A D U A T I N G C L A S S
10%
20%
0%
30%
40%
50%
60%
70%
80%
90%
100%
0.1% 0.1% 0.1% 0.2%
0.3%0.3% 0.4% 0.4%
0.3% 0.3% 0.4% 0.3%

12
T H E 1 0 T H A N N U A L A P R E P O R T T O T H E N A T I O N · K E N T U C K Y S U P P L E M E N T
A CLOSER LOOK AT EQUITY GAPS IN AP PART IC IPAT ION AND SUCCESS
Asian/Asian American/ Pacific IslanderF I G U R E 8 Trends in AP Exam Participation and Success
383Asian/Asian American/Pacific Islander graduates in the class of 2013 took an AP Exam during high school
The percentage or number of ...
• students in the graduating class
• graduates leaving high school having taken an AP Exam
• graduates scoring 3+ on an AP Exam during high school... who are Asian/Asian American/Pacific Islander
2003 2008 2012 2013
328 390 554 614
162 255 360 383
104 156 240 270
2003 2008 2012 2013
PE
RC
EN
TA
GE
OF
SP
EC
IF
IC
PO
PU
LA
TI
ON
G R A D U A T I N G C L A S S
10%
20%
0%
30%
40%
50%
60%
70%
80%
90%
100%
0.9% 1.0% 1.3% 1.5%3.2% 3.2% 2.9% 3.0%3.9% 3.9% 4.0% 4.1%

13
T H E 1 0 T H A N N U A L A P R E P O R T T O T H E N A T I O N · K E N T U C K Y S U P P L E M E N T
A CLOSER LOOK AT EQUITY GAPS IN AP PART IC IPAT ION AND SUCCESS
WhiteF I G U R E 9 Trends in AP Exam Participation and Success
10,761white graduates in the class of 2013 took an AP Exam during high school
The percentage or number of ...
• students in the graduating class
• graduates leaving high school having taken an AP Exam
• graduates scoring 3+ on an AP Exam during high school... who are white
2003 2008 2012 2013
33,772 34,185 34,740 33,904
4,567 6,778 10,321 10,761
2,348 3,450 5,224 5,653
2003 2008 2012 2013
PE
RC
EN
TA
GE
OF
SP
EC
IF
IC
PO
PU
LA
TI
ON
G R A D U A T I N G C L A S S
10%
20%
0%
30%
40%
50%
60%
70%
80%
90%
100%
89.7%
86.9% 84.7%83.7%
88.9%86.2% 84.5%
83.9%
89.0% 87.0% 86.1% 85.7%

14
ABOUT THE COLLEGE BOARD
The College Board is a mission-driven not-for-profit
organization that connects students to college success
and opportunity. Founded in 1900, the College Board
was created to expand access to higher education.
Today, the membership association is made up of over
6,000 of the world’s leading educational institutions
and is dedicated to promoting excellence and equity in
education. Each year, the College Board helps more
than seven million students prepare for a successful
transition to college through programs and services in
college readiness and college success — including
the SAT®, and the Advanced Placement Program®. The
organization also serves the education community through
research and advocacy on behalf of students, educators,
and schools.
For further information, visit www.collegeboard.org.
© 2014 The College Board. College Board, Advanced Placement, Advanced Placement Program, AP, SAT and the acorn logo are registered trademarks of the College Board. AP Capstone is a trademark owned by the College Board. All other products and services may be trademarks of their respective owners. Visit the College Board on the Web: www.collegeboard.org.
apreport.collegeboard.org