report tvgt-5061 johan lindstrÖm - geoteknik · homepage: johan lindstrÖm supervisors: erika...
TRANSCRIPT
Master’s DissertationGeotechnical
Engineering
Report TVG
T-5061JO
HA
N LIN
DSTRÖ
M C
ON
E PENETR
ATIO
N TESTIN
G IN
THE C
LAY
TILLS OF SK
ÅN
E - An
investig
ation
of th
e con
e factor
JOHAN LINDSTRÖM
CONE PENETRATION TESTINGIN THE CLAY TILLS OF SKÅNEAn investigation of the cone factor


DEPARTMENT OF CONSTRUCTION SCIENCES
GEOTECHNICAL ENGINEERING
ISRN LUTVDG/TVGT--17/5061--SE (1-72) | ISSN 0349-4977
MASTER’S DISSERTATION
Copyright © 2017 Geotechnical Engineering,Dept. of Construction Sciences, Faculty of Engineering LTH, Lund University, Sweden.
Printed by Media-Tryck LU, Lund, Sweden, July 2017 (Pl).
For information, address:Geotechnical Engineering, Dept. of Construction Sciences,
Faculty of Engineering LTH, Lund University, Box 118, SE-221 00 Lund, Sweden.
Homepage: www.geoteknik.lth.se
JOHAN LINDSTRÖM
Supervisors: ERIKA TUDISCO, PhD, Geotechnical Engineering, LTH, Lundand HÅKAN LINDGREN, Geotechnical Engineer, Sweco Civil AB.
Examiner: Professor OLA DAHLBLOM, Dept. of Construction Sciences, LTH, Lund
CONE PENETRATION TESTINGIN THE CLAY TILLS OF SKÅNE
An investigation of the cone factor


Abstract
The undrained shear strength is a key parameter in the design process ofgeotechnical structures. One of the most frequently used methods to investi-gate this parameter is the cone penetration test (CPT). The CPT does notmeasure the undrained shear strength directly, but instead the resistance thata conic probe encounters as it is pushed into the ground. A calibration factor,the cone factor (Nkt), relating the two quantities is, therefore, needed. TheSwedish Geotechnical Institute suggests to use a cone factor of 11 when usingCPT in the clay tills of Skane. However, in Denmark, a value of 10 is recom-mended for similar soils. The magnitude of the calibration factor is criticalwhen determining the undrained shear strength and, consequently, for furtherdesign.
To investigate the cone factor, measurements of the undrained shear strengthand the net cone resistance were compared for five types of clay till found inSkane at a total of three different sites. Depending on availability, other soilparameters were considered in the analysis in order to explain variations ofthe calibration factor Nkt.
The comparison between the undrained shear strength measurements, fromfield vane tests, and the net cone resistance gave a mean value of Nkt in therange of 9.3 to 10.2. However, a significant standard deviation, ranging from0.7 to 1.7, is connected to the evaluated cone factors.
Due to the significant degree of scatter in the data, partially caused by theinhomogeneous nature of the soil and partially influenced by primarily usingfield vane tests to evaluate the undrained shear strength, it is hard to drawexhaustive conclusions. However, for the different soils studied in this project,it seems reasonable to use a cone factor lower than 11. It also appears thatthe cone factor is closely linked to the overconsolidation ratio, though moretests at various locations are needed to verify this hypothesis.
I


Preface
This project concludes five years of inspiring and developing studies at thefaculty of engineering, LTH, in Lund.
The project was conducted in association with the Division of GeotechinicalEngineering at LTH and the geotechnical group at Sweco Civil AB in Malmo.First and foremost, I am very grateful to have had the opportunity to gaina broad insight into the field of geotechnics. It would not have been possiblewithout this project, and also my supervisors Erika Tudisco, LTH, and HakanLindgren, Sweco Civil AB, whom I would like to thank for valuable insights,feedback and guidance. Furthermore, I would like to thank the other personnelat the geotechnical group at Sweco in Malmo for providing helpful thoughtsand ideas, as well as a general interest.
Finally, I would like to thank Ann Dueck, Rolf Larsson and Hakan Garinfor conducting previous investigations of the clay tills of Skane, thus makingavailable a considerable amount of data regarding the materials properties.This project would not have been possible without it.
Lund, june 2017
Johan Lindstrom
III


Notations and Symbols
m - bulk massV - bulk volumew - natural water contentmw - water massms - solid massρ - bulk densityρs - solid densityS - degree of saturationn - porositye0 - void ratiolc - clay contentwL - liquid limitwP - plastic limitσv0 - total overburden stressu - pore pressureσ′v0 - effective overburden stressσ′c - preconsolidation stressOCR - overconsolidation ratioσ′h - horizontal stressK0 - coefficient of earth pressure at restK0nc - coefficient of earth pressure at rest for a normally consolidated soilcu - undrained shear strengthqt - total cone resistanceft - total sleeve frictionRf - friction ratioNkt - cone factorNct - cone factor, preconsolidation stressm - mean value, CPT-smoothings - standard deviation, CPT-smoothingfl - constant, CPT-smoothingqs - smoothed cone resistancecv - undrained vane strengthP - applied force, field vane testg - gravity acceleration
V
a - lever, field vane testM, M1, M2, M3 - static moment, field vane testh, d, r, t - vane geometryck - undrained cone strengthK - constant based on the apex angle of the conemcone - cone massi - cone penetrationσa, σr - axial and radial stress, triaxial testεa, εvol alt. ε1, εV - axial strain and change in volume, triaxial testσ1, σ3 - principal stressesp - mean stressq - deviator stressα, Λ - constants, Ladd- and Foott’s formulaφ′ - effective friction angle
VI

Contents
Abstract I
Preface III
Notations and Symbols V
Table of Contents VII
1 Introduction 11.1 Background . . . . . . . . . . . . . . . . . . . . . . . . . . . . . 11.2 Purpose and Delimitations . . . . . . . . . . . . . . . . . . . . . 21.3 Method . . . . . . . . . . . . . . . . . . . . . . . . . . . . . . . 3
2 Geology 52.1 Regional Geology . . . . . . . . . . . . . . . . . . . . . . . . . . 5
2.1.1 Bedrock . . . . . . . . . . . . . . . . . . . . . . . . . . . 52.1.2 Quaternary Deposits . . . . . . . . . . . . . . . . . . . . 6
2.2 Field Site Geology . . . . . . . . . . . . . . . . . . . . . . . . . 92.2.1 Site I - Lund - Tornhill . . . . . . . . . . . . . . . . . . 92.2.2 Site II - Malmo - Lergoken . . . . . . . . . . . . . . . . 112.2.3 Site III - Staffanstorp - Torreberga . . . . . . . . . . . . 12
3 Test Methods 133.1 Field Tests . . . . . . . . . . . . . . . . . . . . . . . . . . . . . 13
3.1.1 Cone Penetration Test . . . . . . . . . . . . . . . . . . . 133.1.2 Field Vane Test . . . . . . . . . . . . . . . . . . . . . . . 183.1.3 Disturbed sampling – Non-continuous Flight Auger . . . 223.1.4 Undisturbed sampling – Piston Sampler . . . . . . . . . 233.1.5 Dilatometer & Pressuremeter . . . . . . . . . . . . . . . 24
3.2 Laboratory Tests . . . . . . . . . . . . . . . . . . . . . . . . . . 253.2.1 Soil Classification . . . . . . . . . . . . . . . . . . . . . . 253.2.2 Fall Cone Test . . . . . . . . . . . . . . . . . . . . . . . 273.2.3 Triaxial Test . . . . . . . . . . . . . . . . . . . . . . . . 293.2.4 Oedometer test . . . . . . . . . . . . . . . . . . . . . . . 35
4 Conducted tests 37
VII

4.1 Site I - Lund - Tornhill . . . . . . . . . . . . . . . . . . . . . . . 374.1.1 Previously conducted tests . . . . . . . . . . . . . . . . 374.1.2 Recently conducted tests . . . . . . . . . . . . . . . . . 39
4.2 Site II - Malmo - Lergoken . . . . . . . . . . . . . . . . . . . . . 404.3 Site III - Staffanstorp - Torreberga . . . . . . . . . . . . . . . . 41
5 Results 435.1 Site I - Lund - Tornhill . . . . . . . . . . . . . . . . . . . . . . . 435.2 Site II - Malmo - Lergoken . . . . . . . . . . . . . . . . . . . . . 485.3 Site III - Staffanstorp - Torreberga . . . . . . . . . . . . . . . . 505.4 Evaluated cone factors . . . . . . . . . . . . . . . . . . . . . . . 52
6 Analysis 57
7 Conclusions 61
8 Proposed Further Research 63
VIII

1 Introduction
1.1 Background
Determining the strength parameters of a soil is not an easy task, and theprocedure is even more difficult if the soil is non homogeneous and highlyoverconsolidated. The main problem is to obtain values that are representativefor large areas based on a series of point investigations. However, in civilengineering it is of great importance to be able to describe the propertiesof the ground in order to enable calculations of load bearing capacity andsettlements.
As a result of this, many different test methods have been developed over theyears to measure important soil parameters. These methods vary a consider-able amount in complexity, cost and utility. However it is possible to dividethe different methods into two categories; in-situ tests and laboratory tests.In modern, commercial, geotechnical investigations there is a strong desire toderive the soil properties from in-situ methods as these tests are conductedon soils in their natural state. Furthermore, studies with advanced laboratorymethods also tend to be costly and very sensitive to the quality on gatheredsoil samples, and also the ability to recreate the in-situ stress condition.
The Cone Penetration Test (CPT) is one of the geotechnical in-situ methodsmost frequently used in investigations of the clay till that is characteristic forboth Skane and Denmark. A lot of the early experience in the field was estab-lished in conjunction with the investigations conducted for the constructionof the Storebæltsbroen in Denmark [18]. In the investigations it was foundthat the CPT-probe normally penetrates clay till fairly well. However, it wasalso noted that CPT occasionally failed to penetrate firm variants of clay tilland clayey till. Problems were also detected in clay tills containing firm layersof friction soil and/or stones and boulders [18]. In Skane this relates to theBaltic clay tills being relatively easy to investigate due to their high contentof fine soil material and relatively small amounts of coarser soil particles. Onthe other hand, the Northeast clay till is less suitable for CPT with a Swedishstandard setup as it is firmer and in general contains more coarse soil particlesrelative to its clay- silt- and fine sand content [16][23].
1

As the undrained shear strength is not directly measured with CPT, a rela-tion is needed to translate the cone resistance in the sounding to the desiredstrength parameter. The relation itself is simple, and is based on dividing thecone resistance by a cone factor, Nkt in order to receive the undrained shearstrength [42]:
cu =(qt − σv0)
Nkt(kPa) (1.1)
The cone factor is to be seen as a calibration parameter that describes how thecone resistance measured with CPT-soundings corresponds to the undrainedshear strength measured with different geotechnical methods. The in-situmethod that is commonly used to acquire a referential value of the strength isthe field vane test. If it is possible to obtain undisturbed samples of the ma-terial, advanced lab tests, like the triaxial compression test can be conducted.
The value of the cone factor is traditionally related to the liquid limit andoverconsolidation ratio of the soil material when the CPT is used in clay soilsin Sweden [21]. However, a cone factor Nkt = 11 is suggested by the SwedishGeotechnical Institue (SGI) [23], though it is possible to use different valuesif better knowledge of the geotechnical properties at an arbitrary site exists.Previous studies in Denmark, that have been conducted on similar clay till,also show that a cone factor, of about 10 is a possibility [3][26][27][28].
Furthermore, different deposits of clay till present varying degree of preconsol-idation. The clay content, void ratio and grain size distribution, among othersoil properties, also differ between sites. This variation might complicate theidea of having just one constant value of the cone factor for all of Skane.
1.2 Purpose and Delimitations
The main purpose of this project has been to investigate values of the conefactor, Nkt, that might be relevant for the clay tills of Skane. The aim hasalso been to study variations between different field sites, and also differentlayers of clay till and analyze what the causes for possible variation could be.Furthermore, by obtaining a deeper understanding of the material behaviourand the parameters affecting it, enable improvements when evaluating thesoils’ bearing capacity. In turn, this will lead to an improved foundation
2

design and a better utilization of economic resources.
The focus in the project is on the cone penetration test, and finding sugges-tions regarding the value of the cone factor. The complimentary geotechnicalmethods, used to obtain a variety of soil parameters that are relevant for thestudy, have not been investigated further than what has been deemed neces-sary.
Furthermore, as the quaternary deposits are varying throughout Skane theresults obtained in this project can only be considered valid in the close sur-roundings of the conducted tests.
Lastly, no effort have gone into the possibility of evaluating drained parametersand/or the stress-strain moduli from CPT.
1.3 Method
The approach chosen was to calibrate the CPT against field vane- and triaxialtests as this matches the traditional investigation methodology well. Further-more, it generates data that can be compared to previous investigations. Apiston sampler was used to obtain undisturbed samples for tests with a triax-ial apparatus, and a non-continuous flight auger was used in conjunction withthe field vane tests to obtain disturbed samples for routine tests.
The possibility to establish another site than Tornhill was investigated basedupon the extents of various glacial advancements described by the quaternarymaps of the southwestern part of Skane. The stratigraphy at potential loca-tions was determined based on previous drillings in the vicinity of the location.
To enable the project, a thorough literature study on the clay till of Skaneand its properties was conducted. The study handled the different geotechnicalinvestigation methods that have been used previously to investigate clay tilland clayey till in Sweden and Denmark. The study serves as a basis for theinvestigations conducted in the project but also as mean of gathering necessarydata for evaluation.
3


2 Geology
2.1 Regional Geology
The geology of the southwestern part of Skane features an abundance of verystiff soils, generally superimposing sedimentary bedrock [8]. The various soiltypes in the area are rich in clay compared to the vast majority of soil inSweden. The generous clay content combined with the overall high stiffnessof the soil makes the quaternary deposits in Skane appear more similar tothe soils frequently encountered in Denmark than in the rest of Sweden. Theexplanation behind this is primarily based on the type of bedrock in Skaneand in its vicinity, and also the influences of the glacial periods in the northernpart of Europe.
2.1.1 Bedrock
The border between the southwestern part och Skane and the rest of Swedenis defined by the Sorgefrei-Tornquist zone. This zone is a crustal boundarybetween the hard crystalline bedrock of the Baltic shield to the northeast andthe Phanerozoic bedrock to the southwest [25].
Cretaceous-Tertiary
Triassic-Jurassic
Cambrian-Silurian
Precambrian
Hollviken
1000
2000
3000
m
Danish Basin
AlnarpBasin
RomeleHorst Vomb
Basin
Figure 2.1: Rock formations in the southwest of Skane. Inspired by [8]
5
The Phanerozoic formations located to the west of the Romele horst are morethan two thousand meters thick, superimposing the crystalline rock formationsotherwise found at the rock surface to the northeast of the Sorgenfrei-Tornquistzone. The Phanerozoic rock formations found in Skane are also encounteredin the entirety of Denmark. The formations dating back to the Phanerozoicperiod essentially consists of multiple layers of claystone, limestone and sand-stone. Further down in the Jurassic and Triassic layers coal is also encountered[8]. A simplified version of the rock formations in the southwest of Skane isshown in Figure 2.1.
2.1.2 Quaternary Deposits
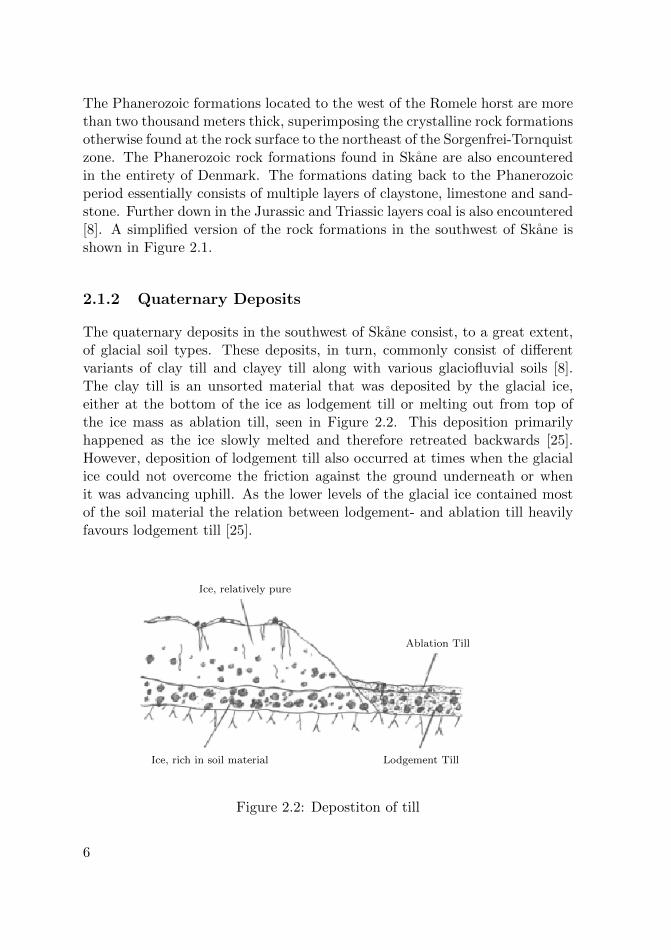
The quaternary deposits in the southwest of Skane consist, to a great extent,of glacial soil types. These deposits, in turn, commonly consist of differentvariants of clay till and clayey till along with various glaciofluvial soils [8].The clay till is an unsorted material that was deposited by the glacial ice,either at the bottom of the ice as lodgement till or melting out from top ofthe ice mass as ablation till, seen in Figure 2.2. This deposition primarilyhappened as the ice slowly melted and therefore retreated backwards [25].However, deposition of lodgement till also occurred at times when the glacialice could not overcome the friction against the ground underneath or whenit was advancing uphill. As the lower levels of the glacial ice contained mostof the soil material the relation between lodgement- and ablation till heavilyfavours lodgement till [25].
Ice, relatively pure
Ice, rich in soil material
Ablation Till
Lodgement Till
Figure 2.2: Depostiton of till
6

The unsorted nature is lent to the material by this formation process. Soilparticles varying greatly in shape and size where deposited simultaneously[18]. The soil material that later came to be deposited as till was gatheredby the glacial ice as its front crept outwards during the expansion phases,eroding older soil deposits and bare rock surfaces [8]. The material was thentransported within the ice by slow moving currents. During this process oftransportation the soil particles were ground against one another resulting infurther erosion [18]. A direct result of this action is a very well graded soil, assome coarser particles managed to pass through the glacial movement intactwhile other got reduced into finer fractions [18]. One way to describe the soil isas matrix-supported, which corresponds to bigger aggregates; gravels, stonesand boulders, that ”float” in a matrix of fine material [25].
Onwards, the deglaciation of Skane that occurred during the final stages of theWeichel glacial period was complex. It was comprised of both relatively warmperiods, when the melting ice crept backwards, and cold periods when the icefront advanced yet again [25]. During the warm periods till was depositedand ice lakes were formed where water from the melting glacier could notdrain away. In these lakes fine soil particles had the possibility to settle down[25]. Then, when the ice advanced again, parts of the previously depositedtill and fine sediments were yet again incorporated in the ice and served asmaterial for the next layer of till to be deposited. This process has resultedin stratigraphies where interglacial soil layers are embedded within the till.The properties of the till also vary greatly over the stratigraphy [18]. Thesevariations within the till layers are influenced a great deal by what glacialmovement deposited them. This in turn reflects in which direction the glacialfront advanced and also from where it gathered the material that later comesto make up the till. Essentially, mapping the material composition of the tillgives a fairly good indication of the bedrock in the area, albeit slightly offsetin the direction the ice front advanced in [18].
Denotation of the different till deposits are based on these phenomena, re-sulting in two distinguished types of clay till and clayey till. The first ofthese being the Northeast clay till, which was deposited by the glacial frontthat advanced from the northeast, as the name suggests. To the Northeast,the glacier encountered hard crystalline bedrock and old soil deposits, richin coarse soil particles. This resulted in a clay till with a relatively low claycontent and thereby higher content of coarser grains [18]. The Northeast claytill does not always meet the required clay content to be classified as clay tilland is then classified as clayey till [48]. In contrary to the Northeast till, the
7
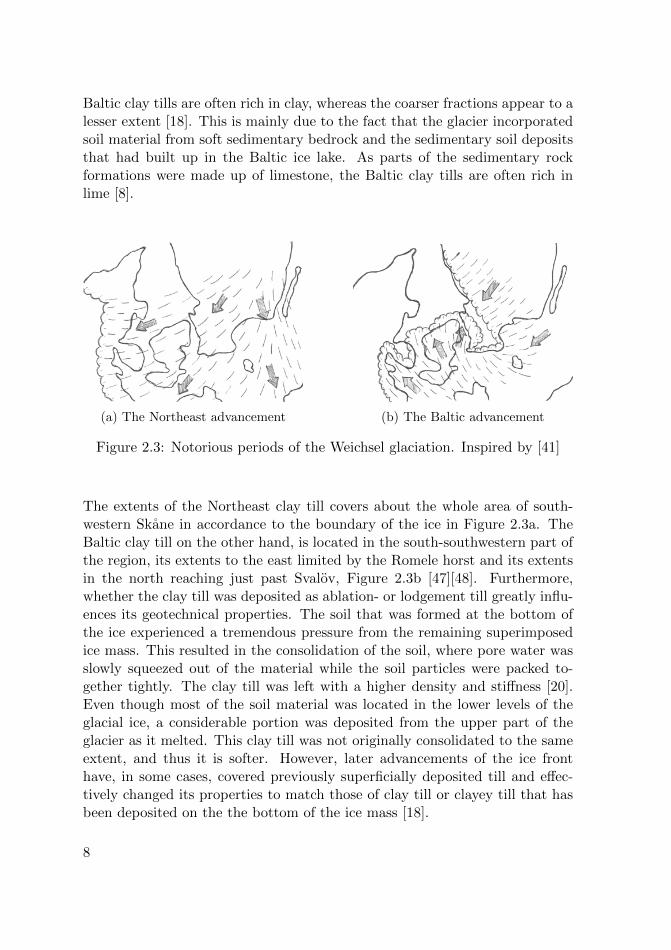
Baltic clay tills are often rich in clay, whereas the coarser fractions appear to alesser extent [18]. This is mainly due to the fact that the glacier incorporatedsoil material from soft sedimentary bedrock and the sedimentary soil depositsthat had built up in the Baltic ice lake. As parts of the sedimentary rockformations were made up of limestone, the Baltic clay tills are often rich inlime [8].
(a) The Northeast advancement (b) The Baltic advancement
Figure 2.3: Notorious periods of the Weichsel glaciation. Inspired by [41]
The extents of the Northeast clay till covers about the whole area of south-western Skane in accordance to the boundary of the ice in Figure 2.3a. TheBaltic clay till on the other hand, is located in the south-southwestern part ofthe region, its extents to the east limited by the Romele horst and its extentsin the north reaching just past Svalov, Figure 2.3b [47][48]. Furthermore,whether the clay till was deposited as ablation- or lodgement till greatly influ-ences its geotechnical properties. The soil that was formed at the bottom ofthe ice experienced a tremendous pressure from the remaining superimposedice mass. This resulted in the consolidation of the soil, where pore water wasslowly squeezed out of the material while the soil particles were packed to-gether tightly. The clay till was left with a higher density and stiffness [20].Even though most of the soil material was located in the lower levels of theglacial ice, a considerable portion was deposited from the upper part of theglacier as it melted. This clay till was not originally consolidated to the sameextent, and thus it is softer. However, later advancements of the ice fronthave, in some cases, covered previously superficially deposited till and effec-tively changed its properties to match those of clay till or clayey till that hasbeen deposited on the the bottom of the ice mass [18].
8

2.2 Field Site Geology
The various field sites presented, and utilized, within this report display thelarge variations of the clay till deposits in Skane. The sites presented includesTornhill, just to the north of Lund, Lergoken, in the southern part of Malmoand Torreberga located in the vicinty of the Alnarp basin.
2.2.1 Site I - Lund - Tornhill
The field site Tornhill is located just to the north of Lund, within the bounds ofthe estate Vallkarratorn 1:18. This is an already established site for geotech-nical testing of clay till, and has been used since 1995 for this purpose. Itis featured in a couple of studies, for instance by Dueck [3][4] and Larsson[19]. Basic soil parameters that previously have been evaluated at the site arepresented in Table 2.1.
Table 2.1: Values of different soil properties for the test site Tornhill [3]
Property Baltic Mixed Northeastclay till clay till clay till0-3 m 3-6 m 6-10 m
Bulk density, t/m3 2.11 2.17 2.27Particle density, t/m3 2.72 2.72 2.72Natural water content , % 17.0 15.8 12.4Liquid limit, % 32.0 26.9 23.4Plastic limit, % 16.3 16.3 13.3Index of plasticity, % 11.4 12.2 9.7Degree of saturation, % 81.0 84.0 82.5Clay content, % 35.0 25.1 21.1Cone resistance, MPa 4 2 7Vane strength, kPa 350 290 450
The estate Vallkarratorn 1:18 is occupied in its entirety by a square grove thatis about 86 × 105 m2. Harneskgranden passes by to the west of the grove,while the remaining three sides are surrounded by farmland. A large glade,where the previous tests have taken place, is located in the eastern part of thegrove. The ground is relatively flat within the area and it is located about 62meters above sea level [3]. A map of the site and the evaluated soil profile isshown in Figure 2.4.
9
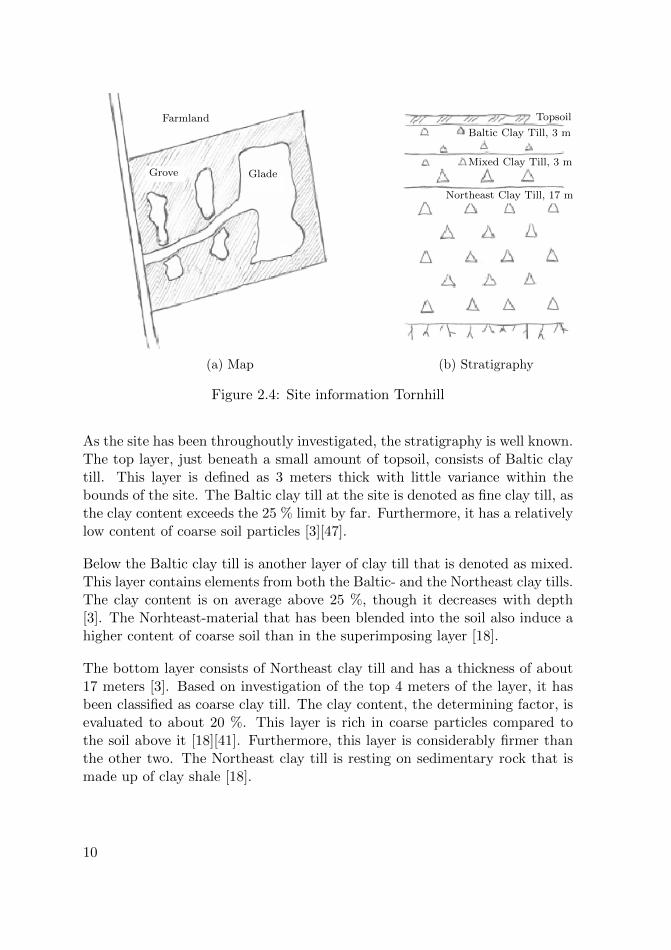
(a) Map (b) Stratigraphy
Topsoil
Baltic Clay Till, 3 m
Mixed Clay Till, 3 m
Northeast Clay Till, 17 m
GladeGrove
Farmland
Figure 2.4: Site information Tornhill
As the site has been throughoutly investigated, the stratigraphy is well known.The top layer, just beneath a small amount of topsoil, consists of Baltic claytill. This layer is defined as 3 meters thick with little variance within thebounds of the site. The Baltic clay till at the site is denoted as fine clay till, asthe clay content exceeds the 25 % limit by far. Furthermore, it has a relativelylow content of coarse soil particles [3][47].
Below the Baltic clay till is another layer of clay till that is denoted as mixed.This layer contains elements from both the Baltic- and the Northeast clay tills.The clay content is on average above 25 %, though it decreases with depth[3]. The Norhteast-material that has been blended into the soil also induce ahigher content of coarse soil than in the superimposing layer [18].
The bottom layer consists of Northeast clay till and has a thickness of about17 meters [3]. Based on investigation of the top 4 meters of the layer, it hasbeen classified as coarse clay till. The clay content, the determining factor, isevaluated to about 20 %. This layer is rich in coarse particles compared tothe soil above it [18][41]. Furthermore, this layer is considerably firmer thanthe other two. The Northeast clay till is resting on sedimentary rock that ismade up of clay shale [18].
10

2.2.2 Site II - Malmo - Lergoken
The field site Lergoken is located within the southern border of Malmo, justto the east of the estates Lergoken 5 and 6 in Almvik. The area at the siteconsists of a grass field that slopes slightly to the south, together with a coupleof small groves. The elevation of the site is about 33 meters above sea level.A map of the site is presented in Figure 2.5a.
(a) Map (b) Stratigraphy
TopsoilPostglacial Sand
Baltic Clay Till
Interglacial Sediments
Northeast Clay Till
Figure 2.5: Site information, Lergoken
The soil deposits in the vicinity of the site consists mainly of clay till, however,a topmost layer of sand, and also interglacial layers, are common [39][40].The thickness of these deposits vary greatly, in a relatively small area thedepth to the underlying rock formation ranges from 5 to 25 meters [46]. Fromthe information available a plausible stratigraphy is presented in figure 2.5b.Essentially a thin layer of topsoil superimposes a layer of postglacial sand,which in turn rests on the upper bed of clay till. Between the upper and lowerbeds of clay till there is a significant chance to encounter interglacial sediments.The lower bed of clay till is assumed to rest directly on the Danian limestoneformation. At the investigation point the limestone should be encountered at adepth of about 20 m below the ground surface [46]. It is reasonable to assumethat the quaternary deposit at the site features layers of both Northeast- andBaltic clay till as both ice advancements have passed over the area. The claytill found in the area to the south of Malmo is to a great extent coarse andthe clay content is in general below 30 % [39].
11

2.2.3 Site III - Staffanstorp - Torreberga
The field site Torreberga is located to the southeast of Staffanstorp, directlyeast of Grevie. This site lies within the bounds of the Alnarp basin, present-ing vast soil deposits [46]. The site has previously been used by Dueck andGarin [6] for testing the usability of a pressuremeter in firm clay and also claytill. The pressuremeter tests were complimented by field vane tests, CPT-soundings, and lab tests conducted on acquired piston samples. No furthertests were conducted at the site during this project.
The mean elevation of the site is about 15 meters, however the elevation inthe vicinity varies between 10 and 20 meters. The tests were conducted tothe south of the gravel road, leading to the west, from the Hamilton Horseproperty. A map of the site is presented in Figure 2.6a.
(a) Map (b) Stratigraphy
TopsoilSand, ≈ 1 m
Sedimentary clay, 4− 6 m
Clay Till, 4 m
Hamilton Horse Property
Test Field
Figure 2.6: Site information, Torreberga
The upper part of the soil deposit, resting on top of the vast Alnarp sedimentsconsists of clay, fine friction soil and different clay tills, in accordance to Figure2.6b [6].
12

3 Test Methods
3.1 Field Tests
3.1.1 Cone Penetration Test
The basic execution of the cone penetration test is that a probe with a conicaltip, attached to a series of drill rods, is pushed into the ground at a constantrate. The exterior of the conical probe is completed by a pore pressure filterand a friction sleeve according to Figure 3.1. While the probe is forced intothe ground continuous measurements of the cone resistance, sleeve friction andpore pressure buildup are made by the transducers connected to the differentparts [42].
Sounding Rod
Extension
Seal
Friction Sleeve
CPT-probe
Seal
Filter
Conical Tip
Figure 3.1: Geometrical design of a CPT-probe. Inspired by [21]
The bottom part of the Swedish standard probe consists of a cone with a60◦apex angle and a base diameter of 35.7 mm , which results in a cross sec-tional area of 1000 mm2 [10]. The filter, connected to the transducer used
13

for pore pressure measurement, is normally placed just behind the cone, al-though there are other possible placements in various locations on the probe[10][42]. Following the cone and the filter is a metal sleeve that is used tomeasure the friction the probe experiences on its surrounding surface area asit is forced through the soil [10]. Moreover, there are a couple of different sizesof probes. The most commonly used are those with a cross sectional area ofeither 1000 mm2 or 1500 mm2. However, there are also finer probes with across sectional area of 200 mm2 that are used to obtain better investigationresolution when probing soft clays. Lastly there are more robust probes witha cross sectional area in the range of 4000 mm2, which are effectively usedfor soundings in coarser frictions soils, and very stiff soils, essentially soils inwhich a standard probe can not penetrate sufficiently [42]. This robust probegives comparatively poor resolution when used in softer soil [42].
Figure 3.2: Drill-rig mounted 5 ton CPT unit. Inspired by [21]
The CPT-probe is driven by a machine consisting of an extendable rod sys-tem, a thrust mechanism and a reaction frame. The capacity of the thrustmechanism used naturally defines the dimensions of the reaction frame. Forexample a CPT unit with a thrust capacity of 25 ton normally requires to bemounted on a large truck whereas the 5 ton setup, frequently used in Sweden,can be mounted on a standard drill-rig as seen in Figure 3.2 [21][42].
The execution of CPT-soundings in Sweden is carried out according to Eu-
14

ropean Standard, SS EN ISO 22476-1:2012. The standardization involvesacceptable equipment deviations and the test procedure itself [21]. Previousto the implementation of the European standard, soundings were done accord-ing a recommended standard developed by the Swedish Geotechnical Society(SGF) [10]. It is worth noting that the two standards differ very little.
The parameter that is mainly calculated based on the CPT-data is the undrainedshear strength, however as previously mentioned in Section 1.1 this is donewith the help of a calibration factor Nkt. The essential relation is, for example,defined by P. K. Robertsson [42] as:
cu =(qt − σv0)
Nkt(kPa) (3.1)
The raw CPT-data consists of the following measured parameters; the coneresistance, qt, the sleeve friction, ft, and registered pore pressure buildup, u.[10]. The raw data mainly provides information about the stratigraphy of asoil profile. For instance, variations in cone resistance suggests the existanceof an interface between layers of stiffer/softer soil, whereas a sudden drop inpore pressure could indicate contact with a more permeable layer [21]. The soilclassification of encountered layers can also be carried out using establishedcharts that describe the soil behaviour type based on the cone resistance, thefriction ratio and the pore pressure buildup [42].
However, in order to enable further evaluation of the CPT, data processingis needed. The cone factor used to evaluate the undrained shear strengthis one example of the processing. It is obvious that the decided value ofNkt has great influence on the evaluated undrained shear strength and, inturn, the estimated bearing capacity. The factor Nkt can be evaluated basedon other in-situ and/or laboratory test methods that measure the undrainedshear strength directly. Various methods have been used in different studies.However, the majority of these studies utilizes field vane tests and/or triaxialtests [19][26][27][28]. Furthermore, it is also possible to use a combination oflegitimate test methods for determining the cone factor. Based on Swedishexperience for investigation in clay, a relation based on the liquid limit hasbeen established. For overconsolidated soils a further correction factor wasadded to the relation, resulting in [21]:
15
cu =qt − σv0
13.4 + 6.65 wL
(OCR
1.3
)−0.2
(kPa) (3.2)
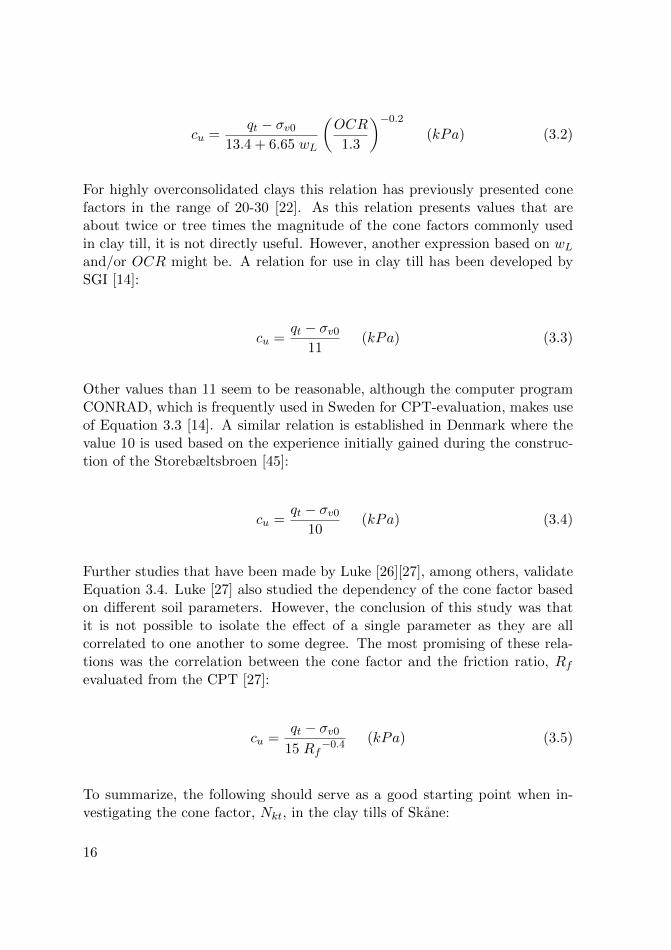
For highly overconsolidated clays this relation has previously presented conefactors in the range of 20-30 [22]. As this relation presents values that areabout twice or tree times the magnitude of the cone factors commonly usedin clay till, it is not directly useful. However, another expression based on wLand/or OCR might be. A relation for use in clay till has been developed bySGI [14]:
cu =qt − σv0
11(kPa) (3.3)
Other values than 11 seem to be reasonable, although the computer programCONRAD, which is frequently used in Sweden for CPT-evaluation, makes useof Equation 3.3 [14]. A similar relation is established in Denmark where thevalue 10 is used based on the experience initially gained during the construc-tion of the Storebæltsbroen [45]:
cu =qt − σv0
10(kPa) (3.4)
Further studies that have been made by Luke [26][27], among others, validateEquation 3.4. Luke [27] also studied the dependency of the cone factor basedon different soil parameters. However, the conclusion of this study was thatit is not possible to isolate the effect of a single parameter as they are allcorrelated to one another to some degree. The most promising of these rela-tions was the correlation between the cone factor and the friction ratio, Rfevaluated from the CPT [27]:
cu =qt − σv0
15 Rf−0.4 (kPa) (3.5)
To summarize, the following should serve as a good starting point when in-vestigating the cone factor, Nkt, in the clay tills of Skane:
16

Nkt =
f (wL, OCR)
10 − 11
15 Rf−0.4
(3.6)
Furthermore, it is also possible to estimate the preconsolidation stress, σ′c, andthe overconsolidation ratio, OCR, from CPT-measurements [21][42]. Differentapproaches are available, but they all do share similar traits [21]. Furthermore,the evaluation is very sensitive to the quality of the CPT-data [21]. Accordingto SGI the preconsolidation pressure can be evaluated as [21]:
σ′c =qt − σ′v0
1.21 + 4.4 wL(kPa) (3.7)
For calculations of the preconsolidation stress in clay till it is advised to usethe following approximation though.
σ′c ≈qt − σ′v0
3(kPa) (3.8)
However, the values calculated with Equations 3.7 and 3.8 can differ signifi-cantly. The overconsolidation ratio is calculated as [21]:
OCR =σ′cσ′v0
(3.9)
The received value of the overconsolidation ratio is not to be seen as a re-placement for the oedometer test but as a reference value [21]. Similar to thecone factor, Nkt, used for determining the relation between undrained shearstrength and cone resistance another cone factor, Nct, can be implementedin the determination of the preconsolidation stress. Its possible values aresummarized as:
Nct ≈{
1.21 + 4.4 wL3
(3.10)
17

Another way to calculate the overconsolidation ratio and preconsolidationstress was presented by Robertson [42]:
OCR = 0.25
(qt − σv0
σ′v0
)1.25
(3.11)
σ′c = σ′v0 OCR (kPa) (3.12)
It is not previously known how well the empirical relations derived by Robert-son fares in the investigation of clay till.
Finally, due to the continuous nature of the CPT-data its possible to reduce thespiky appearance, caused by the presence of coarse particles and lenses of fric-tion soil, by mathematical smoothing [45]. This way of smoothing CPT-curveswas introduced by Mortensen et al [28]. The reasoning behind smoothing thedata is to enhance the general trend by reducing or eliminating peaks andnoise. However, by removing the local peaks information about the presenceof coarse particles and lenses of silt/sand/gravel is lost. The general idea be-hind the mathematical process is to compare the measured value, qt, at onelevel with the mean value and standard deviation over a wider range. Thesmoothing constraint is presented as [28]:
m− fl s < qs < m+ fl s (3.13)
Where m and s represent the mean value and standard deviation over a setdepth and fl is a constant value. When interpreting the undrained shearstrength, cu, in conjunction with field vane tests the value of fl has previouslybeen chosen as 1. The range over which m and s are evaluated has been setto 0.2 meters of investigation depth [28].
3.1.2 Field Vane Test
The field vane test is an in-situ method that has been used in quite a fewscientific studies with the intention to obtain a value of the undrained shearstrength of clay till and/or provide reference material for CPT calibration[2][3][26][28]. The method also sees its fair share of commercial use and testitself is simple to conduct. First the vane instrument is pushed down into the
18
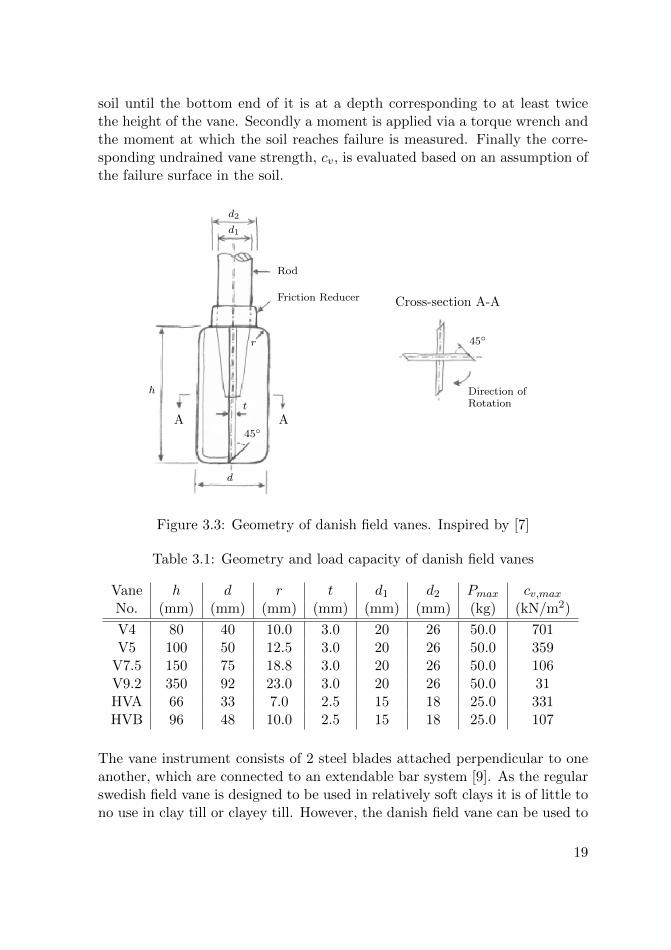
soil until the bottom end of it is at a depth corresponding to at least twicethe height of the vane. Secondly a moment is applied via a torque wrench andthe moment at which the soil reaches failure is measured. Finally the corre-sponding undrained vane strength, cv, is evaluated based on an assumption ofthe failure surface in the soil.
d2
d1
Rod
Friction Reducer
r
h
A A
Cross-section A-A
45◦
45◦
d
t
Direction ofRotation
Figure 3.3: Geometry of danish field vanes. Inspired by [7]
Table 3.1: Geometry and load capacity of danish field vanes
Vane h d r t d1 d2 Pmax cv,maxNo. (mm) (mm) (mm) (mm) (mm) (mm) (kg) (kN/m2)
V4 80 40 10.0 3.0 20 26 50.0 701V5 100 50 12.5 3.0 20 26 50.0 359
V7.5 150 75 18.8 3.0 20 26 50.0 106V9.2 350 92 23.0 3.0 20 26 50.0 31HVA 66 33 7.0 2.5 15 18 25.0 331HVB 96 48 10.0 2.5 15 18 25.0 107
The vane instrument consists of 2 steel blades attached perpendicular to oneanother, which are connected to an extendable bar system [9]. As the regularswedish field vane is designed to be used in relatively soft clays it is of little tono use in clay till or clayey till. However, the danish field vane can be used to
19

greater success due to its more robust design, which has its origin in surveyingin firm clay till [18]. Vane configuration and geometry are presented in Figure3.3 and Table 3.1. The vanes V4 - V9.2 are used for deeper investigations,where as the hand vanes, HVA and HVB, suffice in shallow surveys [7]. Inaccordance with Swedish standards, namely the requirement that the heightof the vane instrument needs to be at least twice the diameter, deep vanes V4- V7.5 can be used for testing the clay till in Skane [9].
Calculations of the undrained vane strength differ between the Swedish andDanish methods. This is mainly due to the differences in vane instrumentgeometry. Essential for both methods is that an applied torque is divided by ageometrical factor [7][9]. For the Danish field vane the calculations are carriedout as [7]:
τv =P g a
M(kPa) (3.14)
M = M1 +M2 +M3 (m3) (3.15)
M1 =1
2π d2 (h− 2r) (m3) (3.16)
M2 =4
3π
(d
2r3
)(m3) (3.17)
M3 = 2 π2 r
(d
2− r)2
+ π2 r3 + 8 π r2
(d
2− r)
(m3) (3.18)
where M is a measurement of the static moment of the total shear surfaceof the vane instrument. For the danish deep vanes, the value of a is almostconstantly 0.3 m [7]. The calculated undrained vane strength, cv, does notnecessarily correspond to the undraind shear strength, cu and there are acouple of different approaches to relating the two parameters. The procedurethat is normally used in Sweden for overconsolidated soils is to correct theundrained vane strength based on the liquid limit and the overconsolidationratio [24]:
20
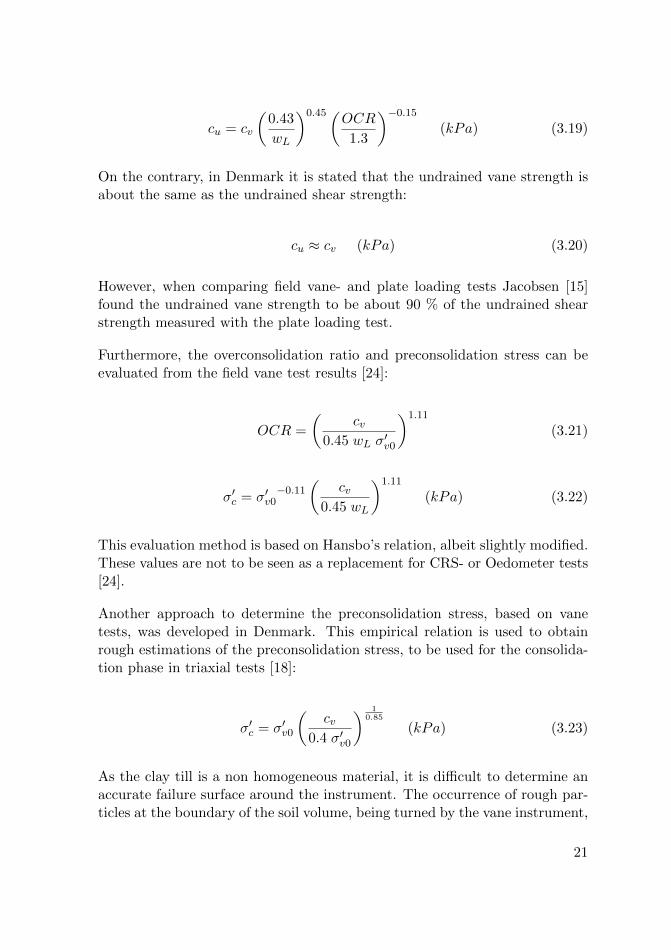
cu = cv
(0.43
wL
)0.45(OCR1.3
)−0.15
(kPa) (3.19)
On the contrary, in Denmark it is stated that the undrained vane strength isabout the same as the undrained shear strength:
cu ≈ cv (kPa) (3.20)
However, when comparing field vane- and plate loading tests Jacobsen [15]found the undrained vane strength to be about 90 % of the undrained shearstrength measured with the plate loading test.
Furthermore, the overconsolidation ratio and preconsolidation stress can beevaluated from the field vane test results [24]:
OCR =
(cv
0.45 wL σ′v0
)1.11
(3.21)
σ′c = σ′v0−0.11
(cv
0.45 wL
)1.11
(kPa) (3.22)
This evaluation method is based on Hansbo’s relation, albeit slightly modified.These values are not to be seen as a replacement for CRS- or Oedometer tests[24].
Another approach to determine the preconsolidation stress, based on vanetests, was developed in Denmark. This empirical relation is used to obtainrough estimations of the preconsolidation stress, to be used for the consolida-tion phase in triaxial tests [18]:
σ′c = σ′v0
(cv
0.4 σ′v0
) 10.85
(kPa) (3.23)
As the clay till is a non homogeneous material, it is difficult to determine anaccurate failure surface around the instrument. The occurrence of rough par-ticles at the boundary of the soil volume, being turned by the vane instrument,
21

will disturb the test and provide values that are not entirely representative.The non homogeneous nature of the material might also create an unevendisturbance as the instrument is pushed into the ground [18]. The suggestedsolution to handle this source of errors is to conduct more tests in the samearea. By doing so it is possible to mitigate the variation and eventually obtaina reasonable value for cv with a greatly decreased uncertainty [2].
CPT-soundings are preferred over the field vane tests as the data output fromthe CPT presents a continuous reading over the the sounded depth, as statedin Section 3.1.1, whereas the vane test presents single values. The ability toreceive a continous reading makes it far easier to follow possible trends inthe soil profile, pick up details like lenses of sand and silt and also filter outexcessive scatter. Moreover, the CPT is far more efficient as the field vanetests are conducted beneath the bottom of predrilled holes, meaning that anew segment of the hole must be drilled in between the individual vane tests[19], whereas the CPT is done in one continuous probing. Finally a smallervariation in the aquired data has been measured for the CPT compared tofield vane tests [19].
3.1.3 Disturbed sampling – Non-continuous Flight Auger
A non-continuous flight auger is a method used to obtain disturbed samples.The equipment features a spiral flight wound round a central stem, which isfitted with a cutter head [32]. The majority of the standard augers have adiameter of 50 – 100 mm. The length of the spiral part of the equipment iscommonly in the 500 – 2000 mm range. Above the spiral there is a shaft,which is attached to the bar system of the drill rig [32]. An example of anon-continous auger is presented in Figure 3.4.
Figure 3.4: Non-continuous flight auger, diameter 100 mm. Inspired by [32]
The non-continuous flight auger is often used in conjunction with the fieldvane tests. First, the flight auger is used to drill down to the desired depthfor the vane test, it is then pulled up, and in the process a disturbed samplecan be acquired from the material that is adhering to the auger flights [32].When the flight auger is pulled up it is important not to rotate the equipmentas that may cause unnecessary loss of sample material and further disturb the
22

soil [32]. After the flight auger has created an open borehole, the field vane ispushed adequately into the bottom of the hole and the vane test is conducted.These three steps are repeated until the wanted total investigation depth isreached.
The sampling method is useful for investigations in cohesive soils with a certainlimitation, based on the amount of big particles, namely stones and boulders[32]. It is important to note that it is hard to evaluate the natural bulk densityand void ratio from these disturbed clay till samples as the sample is likely toswell due to the disturbance caused by the auger and by the sudden loss ofconfining soil pressure [18].
The disturbed samples obtained with the auger drill are, furthermore, usefulin selecting depths for taking undisturbed samples As the equipment used forthis process generally is less robust than the auger.
3.1.4 Undisturbed sampling – Piston Sampler
One of the commonly used methods to acquire undisturbed soil samples forfurther investigations in a geotechnical lab is the piston sampler. The equip-ment is classified as a composite sampler with a set of detachable internalplastic pistons for gathering the samples together with an easily changeablecutting edge [11]. The advantage is that parts that get worn out and/or dam-aged can easily be replaced instead of discarding the equipment as a whole[11]. For use in rough soils like clay till, where excessive wear can be expectedthis has a significant impact.
The equipment provides samples that retain the properties they had in-situ.This includes composition, structure, strength, density and water content [11].However, it is not an easy feat to obtain undisturbed samples in a heteroge-neous soil like the clay till. There is a constant risk of the sampling to beinterrupted prematurely as the piston sampler encounters boulders, stones,gravel, and also firm lenses of friction soil [18]. Even if the attempt is nothalted the sample can still be considered disturbed if rough soil particles havebeen squeezed into the pistons and/or pushed in front of the sampler.
It is at least possible to use the piston sampler in the Baltic clay till, whichis considerably softer than the Northeast clay till and a lot less heterogeneousthan the mixed clay till, and retain good samples [6]. Another method that hasalso been used successfully, for instance at Tornhill, is the Danish type of piston
23
sampling [19]. This method uses a single metal tube, an ”Americanerror” forgathering the sample instead of a set of plastic pistons. In this case the sampleris not pushed into the ground, but instead hammered.
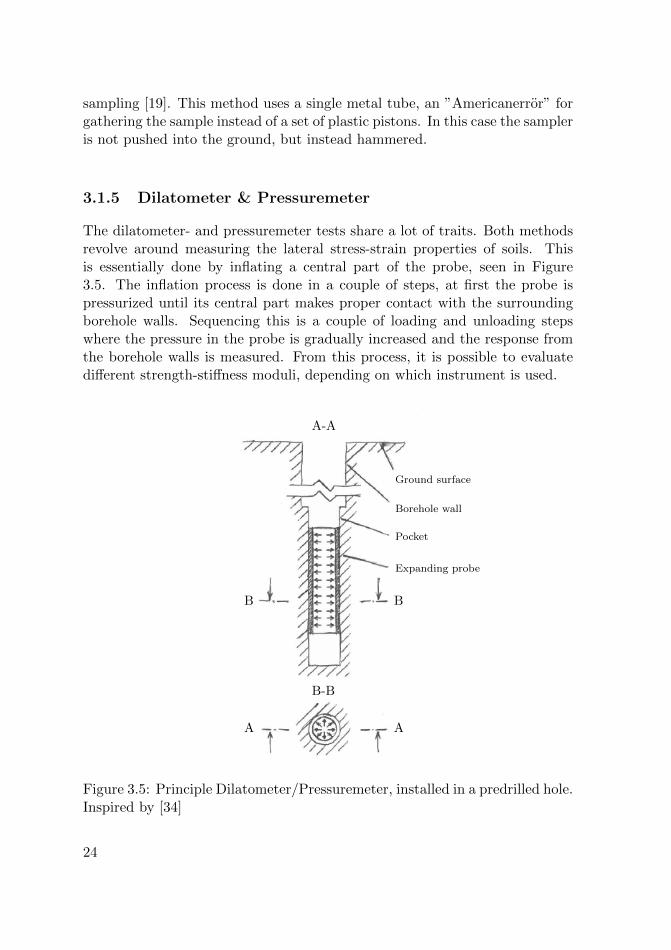
3.1.5 Dilatometer & Pressuremeter
The dilatometer- and pressuremeter tests share a lot of traits. Both methodsrevolve around measuring the lateral stress-strain properties of soils. Thisis essentially done by inflating a central part of the probe, seen in Figure3.5. The inflation process is done in a couple of steps, at first the probe ispressurized until its central part makes proper contact with the surroundingborehole walls. Sequencing this is a couple of loading and unloading stepswhere the pressure in the probe is gradually increased and the response fromthe borehole walls is measured. From this process, it is possible to evaluatedifferent strength-stiffness moduli, depending on which instrument is used.
A-A
A A
B-B
B B
Ground surface
Borehole wall
Expanding probe
Figure 3.5: Principle Dilatometer/Pressuremeter, installed in a predrilled hole.Inspired by [34]
24

Furthermore, the coefficient of soil pressure at rest and the effective horizontalstress is evaluated. Lastly, there is also a couple of different ways to interpretthe undrained shear strength from dilatometer measurements, for instance byMarchetti, Larsson and Roque et al [19]. The same is true for evaluation ofthe pressuremeter measurements, for instance by Gibson and Andersson, Mairand Wood, Menard and Briaud [19].
There are a couple of different ways of conducting dilatometer- and pres-suremeter tests, which essentially revolves around how the instrument is in-stalled into the ground. More robust versions of the probes can be equippedby a conic shoe and then thrust down into the soil profile to the desired depths[34]. There is also equipment that is denoted as self-boring, where the probedrills its way down into the soil profile instead of being pushed down [6]. Apartfrom these approaches, there is the alternative to pre-drill the holes and thenfurther prepare the test cavities using special down-the-hole tools. When uti-lizing this approach it is important to install the equipment and proceed withthe tests as soon as possible from the point in time when the cavity is prepared[19].
3.2 Laboratory Tests
3.2.1 Soil Classification
The routine tests conducted in a geotechnical laboratory serve as a way toclassify the soil, but also measure basic properties such as bulk density, naturalwater content and porosity among others. Many of the measured parametersare connected to the relation between the material’s three phases; solids, fluidand gas.
Initially, the volume and mass of the specimen is measured in order to deter-mine the bulk density of the material as [36]:
ρ =m
V
(kg/m3
)(3.24)
Where m is the mass of the sample and V is its volume. The sample is thendried out in a oven at 105 ◦C for a period of time according to the Europeanstandard [35]. The natural water content in the sample is given by [20][35]:
25

w =mmoist −mdried
mdried −mcontainer⇐⇒ w =
mw
ms(3.25)
Where mw is the mass of the water contained within the material, and ms isthe mass of the solids. To enable progression in the calculation sequence theparticle density, ρs needs to be known. This is easily obtained by pulverizinga small amount of the dried soil and measuring the density of the powder withthe aid of a pycnometer. The degree of saturation is then calculated as [20]:
S =
mwρw
V − msρs
(3.26)
Knowledge of the particle density also enables calculation of the porosity, andthereby of the void ratio [20] as:
n =V − ms
ρs
V(3.27)
e0 =n
1− n(3.28)
Finally, the grain size distribution featuring the clay content can be determinedby the use of a combined analysis of sieving and sedimentation [37]. Fromthis set of material data it is possible to use different empirical relations forcalculating the undrained shear strength. These relations were established byHartlen [13], and Jacobsen [15]:
cu = 18 w0−2.05 e0
−1.88 lc2.66 (kPa) cu ≤ 200 kPa (3.29)
cu = 10 e(0.77 e0−1.2) (kPa) (3.30)
Hartlen’s relation, Equation 3.29, is intended to be used for soft clay tillwhereas Jacobsen’s relation, Equation 3.30, is to be used when evaluatingcoarser clay till and clayey till [13][15]. However, when these empiric relations
26

have been compared to the undrained shear strength, measured with both fieldvane- and triaxial tests, at a later date, the correlation is bad [4].
Another empirical relation that is partly based on the current effective verticalin-situ stress, which in turn depends on the bulk density of the superimposingmaterial was established by Ladd and Foott [17].
cu = a σ′v0 OCRΛ (kPa)
a = 0.4 & Λ = 0.85(3.31)
The validity of this relation for use in clay till has have been subsequentlytested by Steenfelt and Foged [44]. At this point the factors a and Λ wereadjusted to fit the properties of clay till. The relation has been tested, toa limited extent, with somewhat promising results, in Sweden, by Dueck [5].However, the method is sensitive to the accuracy with which the overcon-solidation ratio is determined, which is problematic when working with claytill.
3.2.2 Fall Cone Test
Use of the fall cone apparatus is part of the routine investigations of an ar-bitrary soil sample in Sweden. The device is used to estimate the undrainedshear strength of undisturbed samples and the liquid limit of both undisturbedand disturbed samples. As the fall cone test practically measures the strengthproperties of a very small portion of the sample it is very advantageous if thesoil is homogeneous [43]. The clay till, however, is a non homogenous ma-terial, which results in the undrained shear strength, measured with the fallcone test is to be considered lightly when compared to other methods. Thetests conducted with the fall cone apparatus are done according to Europeanstandard [29][33].
The apparatus shown in Figure 3.6 consists of a height adjustable stand fixedto a stable base plate. The adjustable part of the stand is fitted with a 0.1millimeter scale, from which the cone penetration can be read. Held firmlyby the stand is a fall cone that can posses different specifications according toTable 3.2. By pressing a button on the apparatus the cone will be instantlydisengaged and for a brief period only be affected by gravity [29].
27

The main device is completed by a mixing bowl made out of iron, ceramic orplastic. The bowl’s diameter needs to be at least 55 millimeters, its height 30mm and its rim parallel to its base [29].
Height AdjustableStand
0.1 mm-graded scale
60 g - 60◦ cone
Mixing Bowl
Figure 3.6: Standard fall cone apparatus. Inspired by [20]
Table 3.2: Properties of standard cones - mass and shape [29]
Mass 10 g 60 g 80 g 100 g 400 g
Tip angle 60◦ 60◦ 30◦ 30◦ 30◦
When determining the undrained shear strength with a fall cone apparatus,the test is first conducted with a 60g/60◦or an 80g/30◦cone. For the measuredpenetration to be valid it needs to be in the interval 5 to 20 millimeters [29].If the penetration is insufficient, a different cone needs to be used for the se-quent tests. The undrained cone strength is calculated based on the measuredpenetration and the specifications for the used cone, according to:
ck = K · mcone · gi2
(kPa) (3.32)
where i is the penetration depth of the cone and mcone its mass. The parameterK is a correction factor that is based on the apex angle of the cone. Tocalculate the undrained shear strength, cu, the undrained cone strength, ckis normally corrected according to the same factors as the undrained vanestrength. This is treated in Section 3.1.2.
28

The other usage of the fall cone apparatus is to obtain a value of the liquidlimit, wL. This is done exploiting the linearity of the relation between thewater content and the cone penetration in the vicinity of the liquid limit [20].The test is carried out according the instructions presented in the Europeanstandard [33]. The methodology is to add distilled water to the preparedsample until the desired initial penetration is reached. At this point a sampleis taken and the water content measured according to Equation 3.25. Moredistilled water is then added and the procedure is repeated until the intervalbetween desired initial- and final penetration, according to Table 3.3, is coveredin 4-5 tests. The results are plotted in a cone penetration - water contentgraph, and the water content representing the liquid limit is measured [33].
Table 3.3: Guidelines when determining wL [33]
Requirement 80 g/30◦ 60 g/60◦
Initial penetration ≈ 15 mm ≈ 7 mmFinal penetration ≈ 25 mm ≈ 15 mmwL determined based on penetration 20 mm 10 mm
An alternative is to use the Casagrande device when determining the liquidlimit, though it is not advised according to the European standard [33],
3.2.3 Triaxial Test
The basic principle of the triaxial test is loading of a cylindrically shapedspecimen in its axial and radial direction. The axial load is applied via apiston arranged to align with the specimens central axis, whereas the radialload is applied by pressurizing the surrounding fluid. To prevent the fluidfrom infiltrating, a thin rubber membrane is used to cover the sample [12].As clay till samples normally feature coarse and sharp particles that protrudefrom its surface double membranes are often used to ensure the integrity ofthe specimen [18]. The top and bottom parts of the sample are confined byporous stones connected to drainage tubes. When the valves of the drainageare open, water is allowed to be squeezed out of the sample during the testingprocedure, allowing for consolidation and drained tests. On the other hand,by closing the valves an undrained analysis can be conducted. During theundrained analysis the pore pressure increase is measured [12].
The test procedure involved in standard drained- and undrained analysis witha triaxial apparatus is covered in ISO/TS 17892-8 respectively ISO/TS 17892-
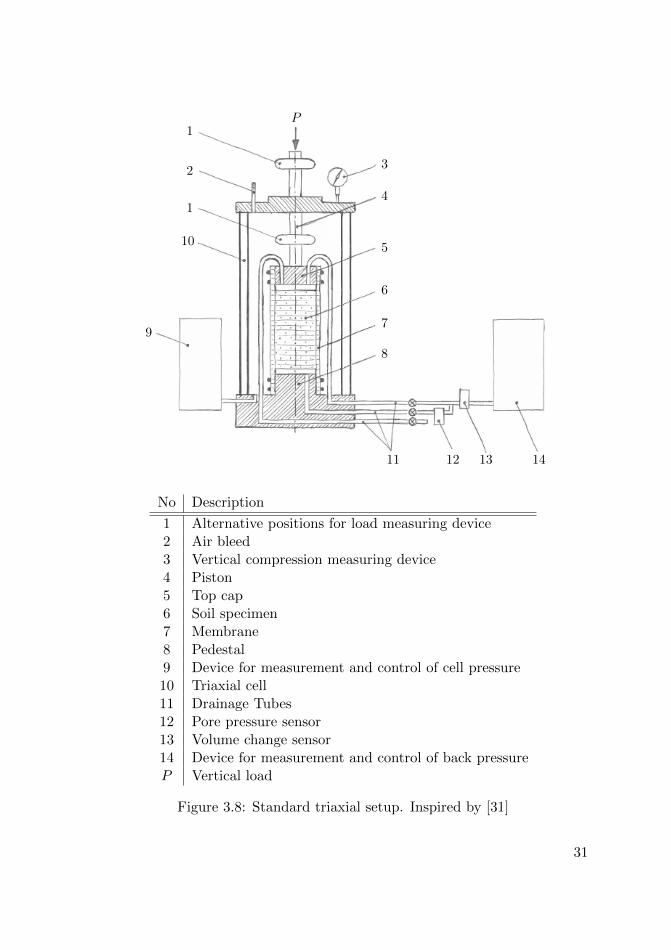
29
9 [30][31]. Figure 3.8 shows the setup, for example, used in a consolidatedundrained triaxial test according to European standard. However, there area lot of variations of both the drained- and undrainded test which differ fromthe European standard. The reason behind these test variants is that theycan evaluate the properties of a specific soil type or soil material better thanthe standard procedure.
σr
σru
σa
σa
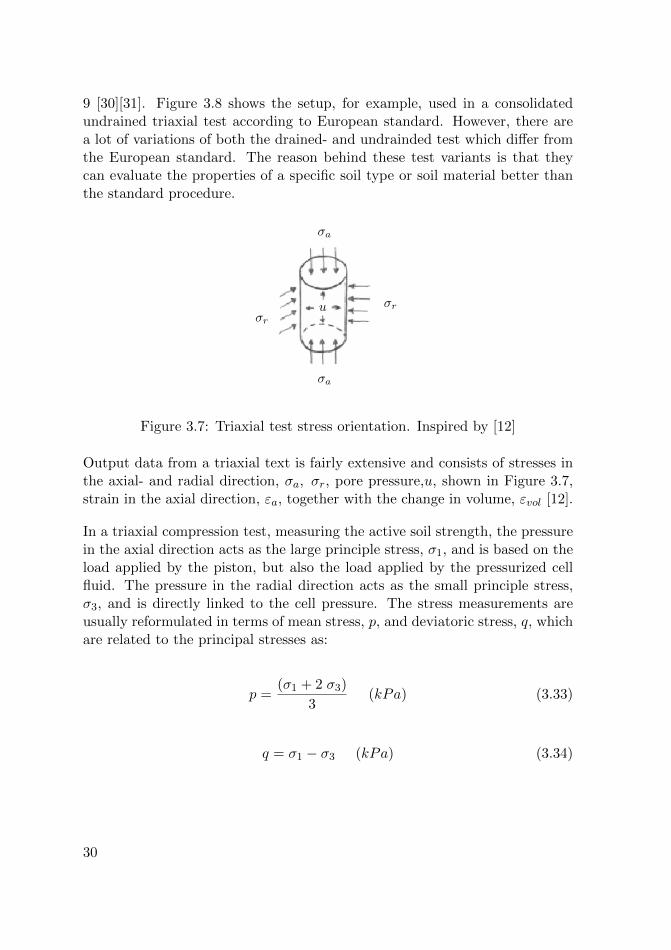
Figure 3.7: Triaxial test stress orientation. Inspired by [12]
Output data from a triaxial text is fairly extensive and consists of stresses inthe axial- and radial direction, σa, σr, pore pressure,u, shown in Figure 3.7,strain in the axial direction, εa, together with the change in volume, εvol [12].
In a triaxial compression test, measuring the active soil strength, the pressurein the axial direction acts as the large principle stress, σ1, and is based on theload applied by the piston, but also the load applied by the pressurized cellfluid. The pressure in the radial direction acts as the small principle stress,σ3, and is directly linked to the cell pressure. The stress measurements areusually reformulated in terms of mean stress, p, and deviatoric stress, q, whichare related to the principal stresses as:
p =(σ1 + 2 σ3)
3(kPa) (3.33)
q = σ1 − σ3 (kPa) (3.34)
30
3
4
5
6
7
8
1
2
1P
10
9
11 12 13 14
No Description
1 Alternative positions for load measuring device2 Air bleed3 Vertical compression measuring device4 Piston5 Top cap6 Soil specimen7 Membrane8 Pedestal9 Device for measurement and control of cell pressure10 Triaxial cell11 Drainage Tubes12 Pore pressure sensor13 Volume change sensor14 Device for measurement and control of back pressureP Vertical load
Figure 3.8: Standard triaxial setup. Inspired by [31]
31
One of the variations of the undrained triaxial procedure is the Area ConstantUndrained with u = 0 (ACUu=0). This type of test is commonly used inDenmark when investigating undrained shear strength in clay till [18]. Whatdistinguishes this method is that the in-situ stress situation- and history isrecreated as far as possible [4]. This makes the test well suited for investigationof clay till as the consolidation procedure counteracts the disturbance that isinevitably caused to the specimen as these are sampled.
The most distinctive feature of the test is the anisotropic consolidation phase,which allows the current in-situ stresses to be recreated. During this stage85-90 % of the preconsolidation pressure is gradually applied to the sample bythe axial piston. Meanwhile, the cell pressure is continuously adjusted to keepthe cross section of the sample constant, by keeping the relation between theaxial strain and change in volume constant [4][18]. The consecutive step is tounload the sample to its measured in-situ vertical pressure while adjusting thecell pressure in the same way as when the sample was first consolidated [18]. Atthis point the sample is in a state that is very similar to in-situ. The knowledgeof both vertical- and horizontal pressures enables evaluation of the coefficient ofearth pressure at rest in the soil’s natural state [4]. Furthermore, the relationbetween the coefficient of earth pressure at rest and the overconsolidationratio can be studied during the anisotropic consolidation phase. This relationis described empirically as:
K0 = K0nc OCRα (3.35)
K0nc = 1− sin(φ′) (3.36)
Where K0nc is the value of the earth pressure at rest for a normally con-solidated soil and α is a material parameter [4]. During the consolidationphase in the triaxial test, K0 for overconsolidated samples approaches K0nc
[4]. The general expression for α, together with the empirical value for claytill presented by Steenfelt and Foged is [44]:
α =
sin(φ′)
0.45± 0.03(3.37)
A load step that is part of the anisotropic consolidation phase begins and
32
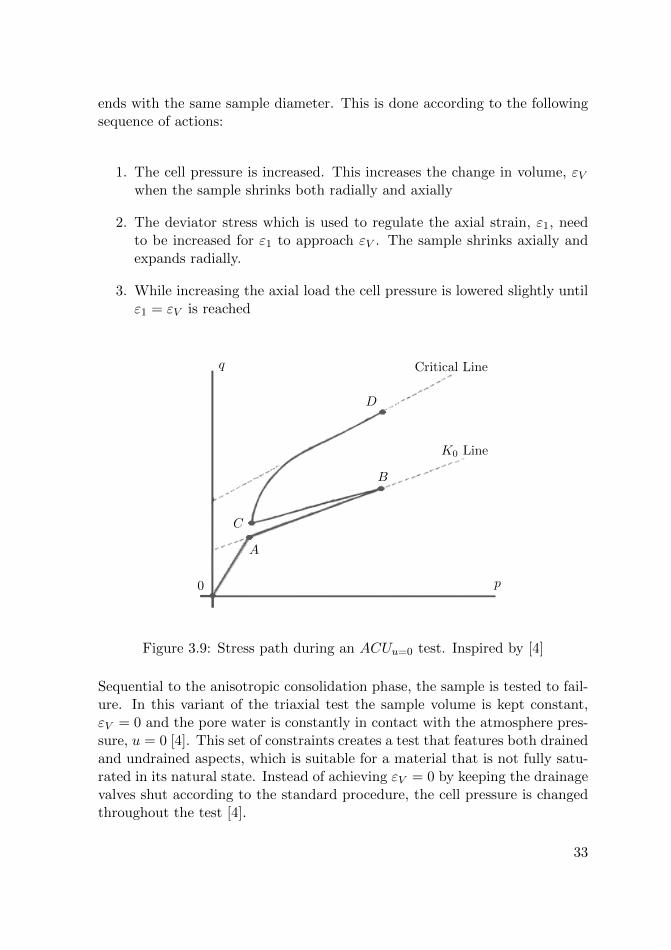
ends with the same sample diameter. This is done according to the followingsequence of actions:
1. The cell pressure is increased. This increases the change in volume, εVwhen the sample shrinks both radially and axially
2. The deviator stress which is used to regulate the axial strain, ε1, needto be increased for ε1 to approach εV . The sample shrinks axially andexpands radially.
3. While increasing the axial load the cell pressure is lowered slightly untilε1 = εV is reached
Critical Line
K0 Line
0
A
B
C
D
q
p
Figure 3.9: Stress path during an ACUu=0 test. Inspired by [4]
Sequential to the anisotropic consolidation phase, the sample is tested to fail-ure. In this variant of the triaxial test the sample volume is kept constant,εV = 0 and the pore water is constantly in contact with the atmosphere pres-sure, u = 0 [4]. This set of constraints creates a test that features both drainedand undrained aspects, which is suitable for a material that is not fully satu-rated in its natural state. Instead of achieving εV = 0 by keeping the drainagevalves shut according to the standard procedure, the cell pressure is changedthroughout the test [4].
33
A description of the stress path during the consolidation and loading to failureis presented in Figure 3.9. The sample, mounted in the triaxial apparatus,starts out at 0. It is then anisotropically consolidated with constant crosssection area from point A to point B, following the K0-line. When unloadingthe sample to its in-site overburden pressure C is reached. From this pointthe sample is loaded to failure. Point D notes where along the critical line thefailure occurs [4].
In contradiction with European standard, Danish tradition suggests that asample with height equal to the diameter should be used [1]. The Europeanstandard, on the other hand, states that the height of the sample shouldbe twice its diameter [31]. The idea behind having a sample with heighttwice the diameter is to reduce the influence by the roughness of the pressureheads. According to Danish practice, this problem is instead managed by usingsmooth pressure heads. This essentially consists of covering the pressure headswith a set of rubber membranes with grease in between, reducing the friction atthe ends of the sample drastically [1]. The reason behind the Danish approachis to provide a homogenenous stress-strain field in the sample and therebycreate a test that mimics a theoretical element test better. The Europeanstandard test is likely to create ”dead zones” where the sample is in contactwith the pressure heads [1]. Moreover, the test setup and the shape of thesample might influence what type of failure is most likely to occur.
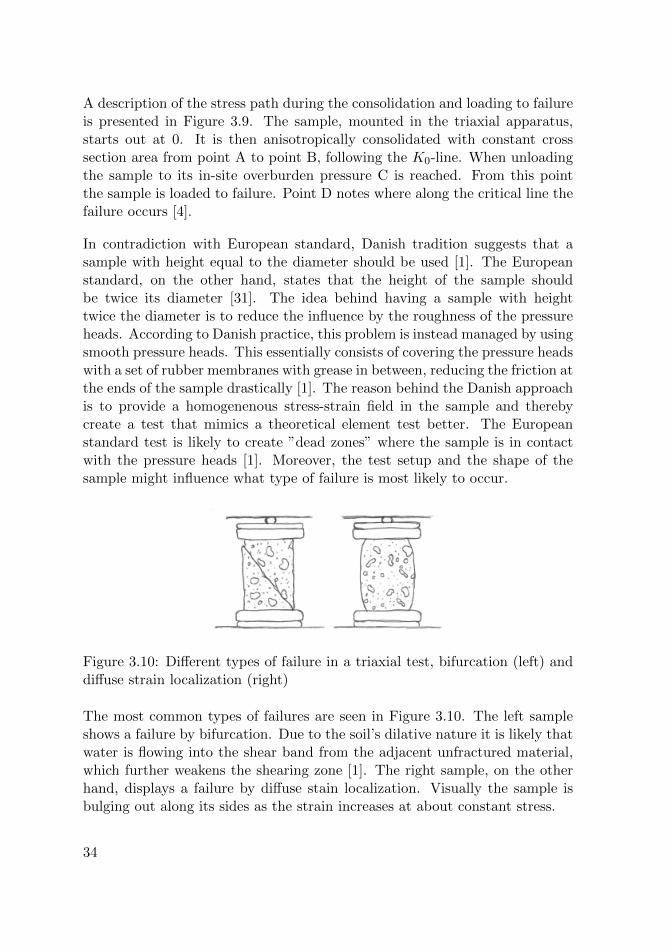
Figure 3.10: Different types of failure in a triaxial test, bifurcation (left) anddiffuse strain localization (right)
The most common types of failures are seen in Figure 3.10. The left sampleshows a failure by bifurcation. Due to the soil’s dilative nature it is likely thatwater is flowing into the shear band from the adjacent unfractured material,which further weakens the shearing zone [1]. The right sample, on the otherhand, displays a failure by diffuse stain localization. Visually the sample isbulging out along its sides as the strain increases at about constant stress.
34

3.2.4 Oedometer test
The oedometer test is a one dimensional consolidation test used for evaluatingof the compressibility characteristics of soils [38]. To ensure that the consol-idation only takes place in the vertical direction the sample is encased in asteel ring with very high relative stiffness. The ends of the sample are fittedwith filter papers and porous disks to ensure that pore water can be squeezedout during the tests, allowing consolidation of the sample.
Furthermore, the load cell is submerged in water. This ensures that the sampledoes not dry out during the test as it is in direct contact with the water bathvia the filter papers and the porous disks. The water container featuring theload cell is installed in a loading rig, which utilizes a lever arm to amplify theapplied weights. A schematic image of the oedometer is seen in Figure 3.12.
Recompression
log(σ′v) (kPa)
Virgin
loadingε v(%
)
Rebound
Figure 3.11: Oedometer test curve
In the oedometer test, the soil sample is incrementally loaded. During eachstep the change in sample height is measured and plotted for the duration ofthe step. When the change in height is evening out, it is time to add anotherload increment, as this indicates that the pore pressure build up caused by theprevious step has dissipated. The sample is also unloaded in steps in orderto obtain a rebound curve, which has a similar inclination to the first part ofthe loading curve, the recompression. The ideal stress - strain path during anoedometer test is presented in Figure 3.11. For evaluation of the oedometertest, the change in void ratio is plotted against the logarithm of the effectivevertical stress in the sample. The stress situation can be considered effeciveas the pore pressure build up is given time to dissipate during load steps
35

and the water pressure caused by the surrounding bath is negligible. In anideal oedometer test, the preconsolidation stress is defined as the intersectionbetween the tangent of the recompression part of the load curve and the virginpart. However, due to sample disturbance this is often impossible. Instead theEuropen standard suggests using the Cassagrande method when estimatingthe preconsolidation stress [38]. Furthermore, depending on the resolutionand processing of the test data it is possible to divide the strain into thefollowing parts; initial, consolidation and creep [4].
1 2
3
4
5
6 7
8
9
10
11
No Description
1 Counterweight2 Lever arm3 Joint4 Vertical compression measuring device5 Water container6 Oedometer ring7 Sample8 Porous disks9 Top cap10 Load measuring device11 Weight
Figure 3.12: Oedometer
36
4 Conducted tests
4.1 Site I - Lund - Tornhill
4.1.1 Previously conducted tests
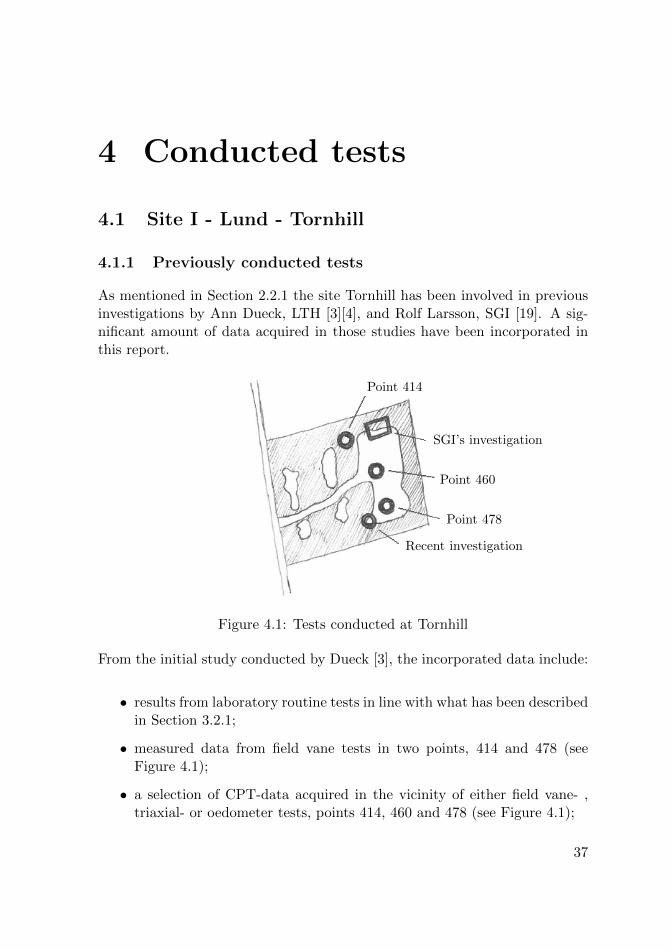
As mentioned in Section 2.2.1 the site Tornhill has been involved in previousinvestigations by Ann Dueck, LTH [3][4], and Rolf Larsson, SGI [19]. A sig-nificant amount of data acquired in those studies have been incorporated inthis report.
Point 414
Point 460
Point 478
SGI’s investigation
Recent investigation
Figure 4.1: Tests conducted at Tornhill
From the initial study conducted by Dueck [3], the incorporated data include:
• results from laboratory routine tests in line with what has been describedin Section 3.2.1;
• measured data from field vane tests in two points, 414 and 478 (seeFigure 4.1);
• a selection of CPT-data acquired in the vicinity of either field vane- ,triaxial- or oedometer tests, points 414, 460 and 478 (see Figure 4.1);
37
• groundwater measurements.
During this study, 25 CPT-soundings were conducted. The majority of themreached a depth of about 7 meters and showed the same trend over the in-vestigated depth [3]. This trend is well represented in the utilized CPT-datapoints.
From a later study by Dueck [4], where undisturbed samples were obtainedand both triaxial- and oedometer tests were conducted in Aalborg accordingto Danish practice, the following is included:
• results from Triaxial tests, ACUu=0, points 460 and 478 (see Figure 4.1);
• results from Oedometer tests, points 460 and 478 (see Figure 4.1).
Undisturbed samples were obtained using both tube sampling, and a tripletube core drilling system.
The most recent documented study from Tornhill was conducted by Larsson[19]. The most significant feature of this project was a full-scale plate loadingtest. However, a wide array of complimentary tests were conducted in the closevicinity of the main test rig. Out of these the following have been included:
• results from Triaxial tests, CU ;
• results from Oedometer tests;
• a CPT-sounding adjacent to the point where tube sampling was con-ducted;
• pressuremeter- and dilatometer measurements of the lateral stress in thesoil profile, σ′h.
Undisturbed specimens were obtained using both tube sampling and tripletube core drilling. The specimens obtained with the tube sampler were con-sidered to be of a higher quality [19]. A 10 ton drill-rig was used in this projectin an attempt to penetrate further into the Northeast clay till using the CPTthan with a standard 5 ton rig. However, this was not successful and a deeperpenetration than 7 meters was not achieved.
38

4.1.2 Recently conducted tests
Two new CPT-soundings were conducted in the southern area of the field,points 1 and 2, presented in Table 4.1). This was done to obtain CPT-datawith better resolution as the original CPT-data from Dueck’s first investigationwere not available and have been, therefore, manually recreated from drawings.The CPT-soundings were carried out according to class 3 and penetrated to6.96 and 7.02 meters respectively.
Table 4.1: Coordinates, Tornhill - SWEREF 99 13 30
Notification N E h
CPT 1 6178990.79 130824.24 62.42CPT 2 6178990.57 130825.40 62.43
Close by the CPT-points a combination of auger sampling and field vane testswere performed. This was mainly done to ensure that no significant deviationsin the strength properties of the clay till existed in this particular spot, whileat the same time contributing to the collection of data available at the location
Auger samples were obtained for the intervals 1-2 m and 2-3 m in the Balticclay till, and 3-4 and 4-5 in the mixed clay till. Vane tests were carried outat the depths 2, 3.3, and 4 m using the danish field vane V4. Vane tests wereevaluated according to Danish standard [7].
Piston sampling was attempted in the same location and a sample was ob-tained from the depth 3.3 m. The sampler itself was complemented with apressure gauge to make sure that the equipment was not forced to a pointwhere the risk of damage was considered to be too high.
To further monitor the groundwater level at the site an open tube was installedand the depth to the ground water table measured. During the spring of2017 the level varied between about 0.5 and 1.2 meter. Determination ofbulk density, water content, liquid limit and grainsize distribution has beendetermined for samples acquired from 1-2 m, 2-3 m, 3-4 m and 4-5 m. Theauger samples have been used for determination of bulk density. Archimedesprinciple was used to measure the volume of 4 relatively undisturbed specimensfrom each sampling level. The specimens were completely submerged in waterand the weight generated was measured. After the volume measurementsthe specimens were carefully dried and weighted again to make sure that nosignificant amounts of water had infiltrated. None of the tested specimens had
39

a change in mass exceeding 0.5 % of their total weight. The use of Archimedesprinciple to determine the volume of clay till auger samples was also usedby Dueck [3]. Determination of the natural water content was carried outaccording to the European standard [35]. One sample per depth interval wasused.
The grain size distribution was determined with a combined analysis. First thewhole sample was washed in a 0.063 mm sieve in order to separate the fine soilparticles. The coarser particles were then sieved while the solution holdingthe fine material was first oven dried until almost all water was eliminatedand then freeze dried. Subsequently, a hydrometer analysis was conductedin a room with constant temperature and humidity at Lund University. Onesample per level was tested.
Finally, the liquid limit was measured following the European standard [33].To separate particles larger than 0.5 mm, the suggested wet method was used.The resulting sample-slurry was then dried to the point where the first conepenetration was about 7 mm, using a 60g/60◦-cone.
Due to issues with the triaxial apparatus at LTH, the planned trixial compres-sion tests were unfortunately canceled.
4.2 Site II - Malmo - Lergoken
Two CPT points were established close to the central brush in the area, points3 and 4. The CPT-soundings were carried out according to class 3 and pen-etrated to 6.70 and 6.72 meters respectively. Their coordinates are presentedin Table 4.2.
Table 4.2: Coordinates, Lergoken - SWEREF 99 13 30
Notification N E h
CPT 3 6158929.37 120150.63 35.10CPT 4 6158929.63 120150.20 35.12
Close by the CPT-points a combination of auger sampling and field vane testswas conducted. This was done to verify the roughly estimated soil profile forthe site and to get an idea of the undrained shear strength in the material.Auger samples were obtained for the intervals 2.3 - 3 m and 3 - 4.8 m inbrownish sandy clay till, 4.8 - 5.5 m in silty sand, and also 5.5 - 7 in grey
40
sandy clay till. Superimposing the glacial deposits, are the following layers;sandy topsoil 0 - 0.8 m and pure sand 0.8 - 2.3 m.
Vane tests were carried out at the depths 3 and 4 m using the danish fieldvane V4. Vane tests were evaluated according to Danish standard [7]. Thevanes almost reached their max capacity in the assumed Baltic clay till and itwas considered ineffective to use the field vane test in the lower clay till layeras this was judged to be much stiffer, based on the auger samples acquired.
Piston sampling was attempted at the depth 3 m but it was impossible to pushthe equipment into the soil without damaging it. To monitor the groundwaterlevel at the site an open tube was installed. The depth to the groundwatertable has been recorded to be between 3.0 - 4.0 meters.
Determination of bulk density, water content, liquid limit and grainsize distri-bution has been determined for samples acquired from 2 - 2.3 m, 2.3 -4.8 m, 4.8- 5.5 m and 5.5 - 7 m. The procedure followed was the same as for the samplesacquired at Tornhill, 4 specimens where chosen for bulk density measurementwhereas a single specimen was used in the following tests. Special care wastaken when handling the sandy silt specimens during the bulk density test asthese specimens were not as firm as the clay till ones. Nevertheless, sandy siltspecimens experienced a small change in volume during the test, less than 1%.
4.3 Site III - Staffanstorp - Torreberga
No further tests have been conducted at Torreberga, and the data presentedwere acquired during a project carried out by Dueck and Garin [6]. Theutilized data consists of:
• results from laboratory routine tests in line with what has been describedin Section 3.2.1;
• measured data from field vane tests in one point, 5, at depths thatcorresponds to clay till;
• CPT-data from one point, 5, at depths that corresponds to clay till;
• estimated lateral pressure from pressuremeter tests.
41

5 Results
5.1 Site I - Lund - Tornhill
The investigations carried out by Dueck [3] and Larsson [19] provide a verycomprehensive description of the soils found at Tornhill. The specimens testedin the current project fall within the bounds set by previous investigations.The parameters can be divided into two groups, one that describes the materialcomposition of the soil, and one that describes the stress state.
In Figure 5.1 the representative soil parameters: natural water content, liquidlimit, void ratio, and clay content, have been presented along with estimatedtrend lines for their variation with the depth. From this distribution the soilwas initially divided into 3 different layers, Baltic-, mixed- and Northeast claytill, by Dueck [3]. The liquid limit and the clay content share a trend of highvalues in the first 3 meters of the soil profile and then steadily decreasing. Ithas been shown by Dueck [3] that the liquid limit is fairly linearly related tothe clay content, according to the approximated relation:
lc = 0.97 + 0.92 wL (5.1)
The relation between the clay content and the liquid limit is strikingly obviouswhen handling specimens of different types of clay till during the liquid limittest. Moreover, there is a shared trend between the void ratio and the naturalwater content, which is logical as the content of water in the material is directlyinfluence by the porosity.
43

10 20 30 40 50
1
2
3
4
5
6
7
8
9
10
11
12
20 40 60 80 100
10 20 30 40 50
wn (%) wL (%) e0 lc (%)d
(m)
Figure 5.1: Soil properties - natural water content, liquid limit, void ratio andclay content. Squares - measurement by Larsson, diamonds - measurementsby Dueck, filled diamonds - measurements from present project
The second set of parameters, presented in Figure 5.2, shows the preconosol-idation stress, the horizontal stress, and also their relations to the effectiveoverburden stress, OCR and K0 respectively. The preconsolidation stress andthe corresponding parameter OCR are almost exclusively evaluated from Oe-dometer tests, excluding the 3 measurements below 9 meters that are evaluatedusing a triaxial apparatus. The horizontal stress and the parameter K0 areevaluated from dilatometer and pressuremeter tests. Two series of measure-ments have been carried out with both dilatometer and pressuremeter. Boththe preconsolidation stress and the lateral stress originate from the consolida-
44
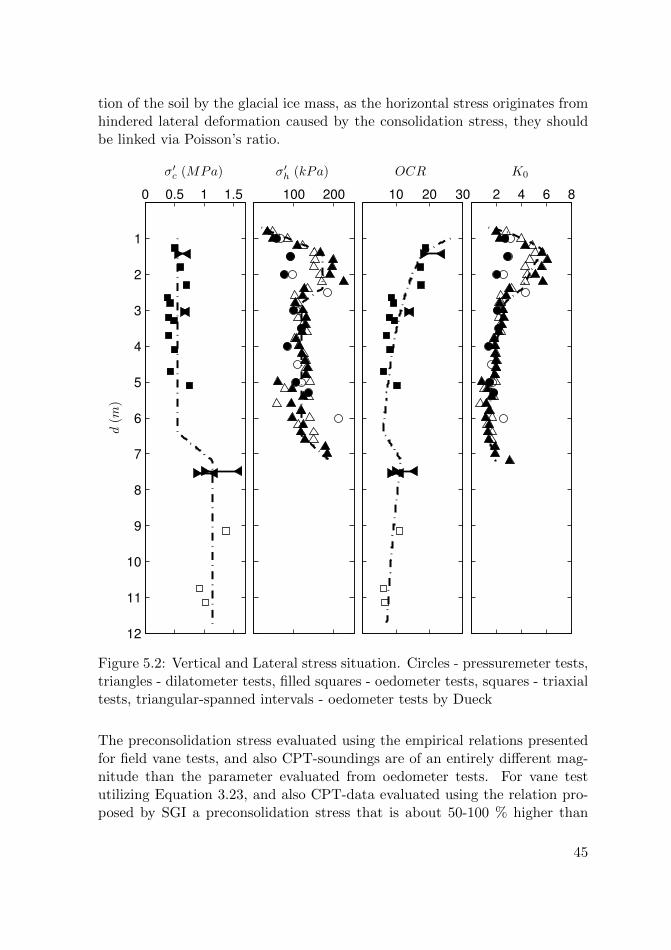
tion of the soil by the glacial ice mass, as the horizontal stress originates fromhindered lateral deformation caused by the consolidation stress, they shouldbe linked via Poisson’s ratio.
0 0.5 1 1.5
1
2
3
4
5
6
7
8
9
10
11
12
100 200
10 20 30
2 4 6 8
σ′c (MPa) σ′h (kPa) OCR K0
d(m
)
Figure 5.2: Vertical and Lateral stress situation. Circles - pressuremeter tests,triangles - dilatometer tests, filled squares - oedometer tests, squares - triaxialtests, triangular-spanned intervals - oedometer tests by Dueck
The preconsolidation stress evaluated using the empirical relations presentedfor field vane tests, and also CPT-soundings are of an entirely different mag-nitude than the parameter evaluated from oedometer tests. For vane testutilizing Equation 3.23, and also CPT-data evaluated using the relation pro-posed by SGI a preconsolidation stress that is about 50-100 % higher than
45

the oedometer results was obtained. When evaluating the preconsolidationstress from CPT-data, exploiting Robertson’s relation the difference was evenlarger. However, due to disturbance caused by sampling, and also handling ofthe specimens used in the oedometer tests the preconsolidation stress evalu-ated in the laboratory may serve as a lower bound.
0 2 4 6 8
1
2
3
4
5
6
7
8
50 100 150
2 4 6 8
200 400 600
qt (MPa) ft (kPa) Rf (%) cv (kPa)
d(m
)
Figure 5.3: Processed CPT-data from Tornhill, CPT 414 - black, 478 - redand 1 - blue, and also a comparison to field vane tests
From the CPT, the key parameters qt and ft have been filtered to obtain a coneresistance- and sleeve friction distribution for further evaluation, this is shownin Figure 5.3 along with the friction ratio, Rf . Processed data is plotted assolid lines, whereas raw data for comparison purpose is plotted as dash-dotted
46

lines. Furthermore, a comparison to the conducted vane test are included.The dash-dotted lines in the vane plot represent measured cone resistance, ofthe adjacent CPT-sounding, divided by 10.
The method proposed by Mortensen described in Section 3.1.1 was initiallyused to filter the CPT-data. This processing was, however, considered notsufficient. A basic floating mean value filter was also tested, filtering over 20data-points. This filter had issues handling thicker lenses of coarse soil, andit excessively decreased the resolution of the data. The filter that was finallyused is based on Mortensens theory with a doubled floating data-interval andparameter fl of 0.2. The filter was supported by manually pre-smoothingthicker lenses of friction soil, when it was obvious that the adjacent vane testshave failed to hit the lens.
Lastly, the results from the triaxial tests, conducted by Dueck [4] and at theSGI [19], are presented in the table below:
Table 5.1: Triaxial test results, Tornhill
Depth cu (Dueck) cu (SGI)(m) (kPa) (kPa)
1.15 1602.20 180 1752.70 1283.00 3503.20 1053.80 2234.25 1304.75 1155.15 1185.60 1407.00 10259.18 825
The majority of triaxial tests from the Baltic and mixed clay till presentssuspiciously low values. However, the undrained shear strength evaluated fromtriaxial tests in clay till are highly dependant on how the tests are conductedand the quality of the samples. This is further discussed in Section 6.
47
5.2 Site II - Malmo - Lergoken
The data sample from Lergoken involves soil classification parameters for theBaltic and Northeast clay till, and also the interglacial sandy silt presented inTable 5.2 as well as strength parameters measured by CPT and field vane tests,Figure 5.2. The data is smoothed using the same filter as for the CPT-datafrom Tornhill.
The clay till layer with an upper bound at about 2.3 meters below the groundsurface is brownish and features a high content of sand. This clay till issignificantly firmer and more brittle compared to the Baltic clay till at Tornhill.Within the layer, both the clay content and liquid limit increase with depth.
The Northeast clay till is located beneath a layer of interglacial sandy silt.The material contains more coarse particles, has a low clay content, and isvery firm.
Table 5.2: Soil parameters, Lergoken
Depth wn wL lc(m) (%) (%) (%)
2.6 12.7 20.7 133.9 12.0 22.9 165.2 20.9 20.0 106.3 11.9 19.0 10
The layer denoted as sandy silt, between 4.8 and 5.5 meters below the groundsurface, based on the disturbed samples obtained using the flight auger, corre-sponds well to the layer with exceptionally high cone resistance seen in Figure5.2.
48

0 5 10 152
3
4
5
6
100 300 500
2 4 6 8
300 500 700
qt (MPa) ft (kPa) Rf (%) cv (kPa)
d(m
)
Figure 5.4: Processed CPT-data from Lergoken, CPT 3 - black, CPT 4 - red,and also a comparison to field vane tests
49

5.3 Site III - Staffanstorp - Torreberga
From the investigation carried out by Dueck and Garin [6] basic soil classifi-cation parameters, strength parameters, measured with both CPT and fieldvane tests, and an estimate of the lateral stress situation have been used forTorreberga. The data represents the layer of clay till located between thedepths 5 and 8 meters, out of which the top 0.1 - 0.2 meters resembles siltyclay. The clay till deposit continues below 8 meters. The soil classificationparameters are presented in Table 5.3.
Table 5.3: Soil parameters, Torreberga
Depth wn wL lc K0 σ′h(m) (%) (%) (%) (kPa)
5.1 21.1 27 305.3 17.55.5 16.0 216.3 13.2 18.9 306.5 1.7 1566.7 13.0 207.0 2.0 2558.0 1.8 275
The clay till is denoted fine with a generous clay content. The available dataindicates that most of the parameters seem fairly constant over the depth,though there is a trend of increasing lateral stress in the clay till. This, how-ever, is not entirely reliable as the lateral stress, at depths 7.0 and 8.0 meters, isevaluated at higher developed strains than usually when using a pressuremeter[6].
Measurements from CPT and field vane tests are presented in Figure 5.5. Thedata is smoothed using the same filter as for the CPT-data from Tornhill.However, the level of filtering needed was relatively low. Based on the not sojagged appearance of the CPT-data, the high clay content and the successfuluse of a standard piston sampler to obtain samples, it seems that the clay tillat Torreberga is relatively homogeneous and contains fewer coarse particlesthan the other investigated clay tills. It also seems to be softer.
The ground water level was measured in an open hole and with piezometers.The groundwater table was determined to be located 1.2 meter below theground surface, with a significant variation throughout the year.
50

0 2 4 6
5
6
7
8
50 100 150
2 4 6
100 200 300
qt (MPa) ft (kPa) Rf (%) cv (kPa)
d(m
)
Figure 5.5: Processed CPT-data from Torreberga, CPT 5, and also a compar-ison to field vane tests
51
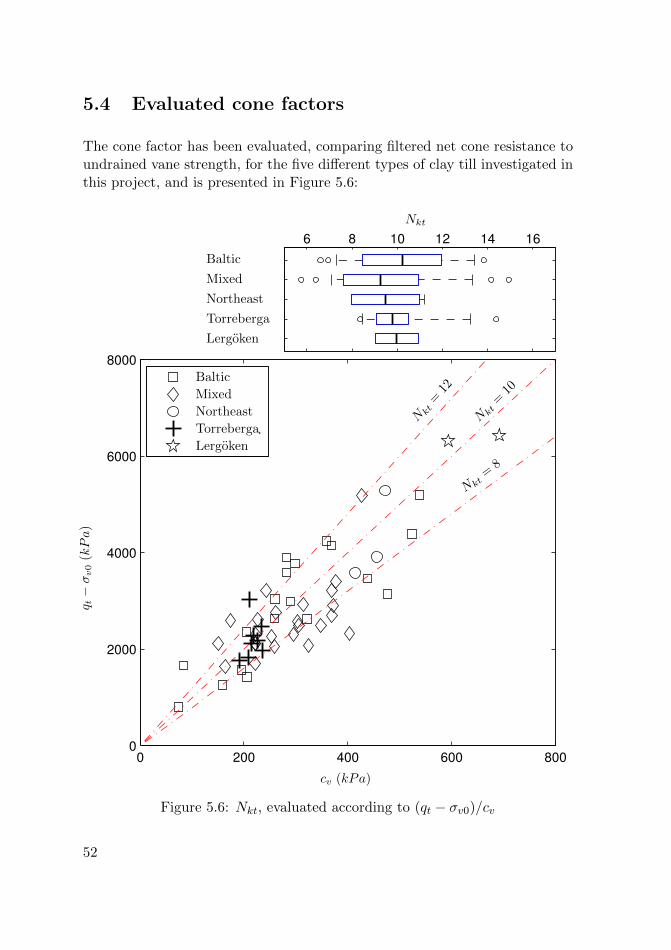
5.4 Evaluated cone factors
The cone factor has been evaluated, comparing filtered net cone resistance toundrained vane strength, for the five different types of clay till investigated inthis project, and is presented in Figure 5.6:
0 200 400 600 8000
2000
4000
6000
8000
.
6 8 10 12 14 16
Baltic
Mixed
Northeast
Torreberga
Lergoken
Baltic
Mixed
Northeast
Torreberga
Lergoken
q t−σv0
(kPa)
cv (kPa)
N kt=
12
N kt=
10
Nkt=
8
Nkt
Figure 5.6: Nkt, evaluated according to (qt − σv0)/cv
52

For this evaluation the different types of clay till are denoted as Baltic, Mixed,Northeast, Torreberga and Lergoken, out of which the first three originatesfrom Tornhill.
The bottom part of the Figure 5.6, shows the comparison as a whole. Thedifferent variants of clay till covers the range of undrained shear strengthsfrom approximately 100 - 700 kPa. The top part of Figure 5.6 presents theplausible cone factors for the different types of clay till in the shape of a boxand whiskers plot. The data presented features the mean value of the conefactor along with its standard deviation, and also the tenth- and ninetiethpercentile. Values that exceed the outer limits are denoted outliers and donot contribute to calculation of the mean value and standard deviation. It isnot possible to either determine, or rule out, that the same cone factor can beused for all of the different soils, based on the available statistical data.
Furthermore, the relation Luke proposed for evaluation of the cone factor,Equation 3.5, was investigated. This was done by comparing the relation tothe cone factors presented in Figure 5.6, and their corresponding friction ratio.
1 2 3 4
7
8
9
10
11
12
13
1 2 3 4
1 2 3 4
Nkt
Rf (%)
Nkt = 15 R−0.4f
Figure 5.7: Evaluated cone factors compared to Luke’s relation
In the Figure 5.7 the obtained cone factors are plotted as a cross, the midpointrepresents the mean cone factor and the corresponding mean friction ratio, thehorizontal bar represents the standard deviation of the friction ratio and thevertical bar translates to the standard deviation of the cone factor. A squareand a circle are used in the left plot to denote Baltic respectively Northeastclay till, whereas a diamond and a star are used in the middle plot to denoteMixed clay till and the clay till encountered at Lergoken. In the right plot thedata from Torreberga is presented.
53

Lastly, in Figure 5.8 four different approaches to determine the cone factorfor the clay tills at Tornhill are presented. The approaches are the following:static values of 10 and 11, a semi dynamic solution exploiting the mean valuesfrom figure 5.6 and a dynamic solution based on Equation 5.2.
6 8 10 12 14
1
2
3
4
5
6
7
6 8 10 12 14
6 8 10 12 14
−60 −40 −20 0 20 40 60 80
d(m
)
Nkt
Deviation from the (qt − σv0)/cv-profile (%)
Nkt,11
Nkt,10
Nkt,mean
Nkt,OCR
Nkt,11
Nkt,10
Nkt,mean Nkt,OCR
Figure 5.8: Comparison between the evaluated (qt − σv0)/cv-profile anddifferent estimations of Nkt
54

The different approaches are compared to the values of the cone factor receivedfrom comparing field vane tests to CPT-soundings. At depths where multiplefield measurements exists, a mean value has been chosen. The evaluated profilefor the cone factor is shown in the figures as a dotted black line, along which,depths with conducted field vane tests are noted as crosses. In order to enhancethe trend, the data has been smoothed, resulting in the thicker, dash-dotted,black line. This profile was used for comparison with the parameters that werefound interesting, based on SGI’s relation for determination of the cone factorin clay, OCR and wL. Furthermore, K0 and lc were also tested as they sharedsimilar trends with OCR and wL.
Both linear and nonlinear least square fits were employed for the differentparameters and different combinations of them. The solution that presentedthe least error, when compared to the evaluated Nkt-profile, is based solely onthe overconsolidation ratio:
Nkt = 8.14 +
(OCR
7.65
)1.14
(5.2)
The top portion of the Figure 5.8 consists of a box and whiskers plot thatpresents the same statistic data as in Figure 5.6. However, in this plot thedeviation between the evaluated Nkt-profile and the different possible conefactors are presented. The mean deviation for Nkt,mean and Nkt,OCR are closeto 0, whereas a cone factor of 11 is almost 20 % higher than the measuredvalue. However, the standard deviation is significant and the results are to beinterpreted cautiously.
55


6 Analysis
To compare the data obtained by the CPT to the undrained shear strengthmeasured by field vane it is necessary to filter the CPT-data. Without smooth-ing of the cone resistance data, the scatter, and also the amount of data pointsthat statistically are considered outliers increases drastically. The used filter,which essentially is the middle ground between a floating mean value and thesmoothing criterion presented by Jacobsen, showed promising results as it ef-ficiently dealt with both local spikes caused by single coarse particles and thewider deviations corresponding to thicker lenses of friction soil. However, inorder to enhance the comparison to the field vane, it was necessary to manu-ally tone down deviations of large width and magnitude when it was obviousthat the field vane had missed the part of the soil volume that caused theanomaly. The general trend of the filtering process is that it lowers the mea-sured strength parameters, which in turn induces a degree of safety to theproceeding evaluation, previously to the application of a cone factor.
The different types of clay till analyzed in this project display a great variationin undrained shear strength, and also in grain size distribution. Furthermore,the degree of consolidation varies a lot between the different soils. Consideringthis, the mean cone factor, evaluated from field vane tests is in the range of9.3 to 10.2 for the investigated types of clay till. As seen in Figure 5.6 thevalues are connected to a considerable standard deviation, in the range of 0.7to 1.7. Furthermore, from the available statistical data it is not possible toeither confirm or rule out that a single cone factor can be used for all of thedifferent clay tills.
Traditionally a static approach is used when determining the cone factor forclay till, either 10 or 11 is used for the whole soil deposit. However, based onthe investigation at Tornhill, there seems to be a trend where the cone factordoes vary, as seen in Figure 5.8. In turn, this suggests that it could be beneficialto use a dynamic approach where the cone factor is set to different values foradequately chosen depth increments. The trend at Tornhill, when smoothed,shares similar traits to the distribution of OCR, K0, wL, and also lc to someextent. From a wide selection of least square fits, it was possible to determinethat a relation, which bases the cone factor solely on the overconsolidation ratio
57

yielded the least error. Furthermore, this relation presents a depth-profile thatis similar to a semi-dynamic approach that uses the average cone factor for thedifferent layers of clay till. However, in order to verify the relation between thecone factor and the overconsolidation ratio more data from various locationsis needed. The solutions featuring both OCR, and wL or K0 also seemedpromising, and might have more flexibility than a relation solely based on theOCR, if data from different sites are compared.
Whether a static or dynamic approach to the cone factor is utilized, the prob-lem with large standard deviations remains. The deviation is to some extentto be expected when investigating a non homogeneous material such as claytill. This is, however, magnified by using field vane tests for determining theundrained shear strength. The vane tests are known to provide very scattereddata when used for testing in clay till. Tests at the same depth just a fewmeters apart can give values that differ from tens to hundreds of kPa. In or-der to handle this problem, it has been previously suggested to conduct morefield vane tests and, by doing so, acquiring plausible values of the undrainedshear strength by averaging. An alternative is to carry out more sophisti-cated tests, for example triaxial compression tests, on samples obtained fromrepresentative depths as a mean to support field tests.
The triaxial tests results analyzed in this project show values of undrainedshear strength of a different magnitude than those obtained from the fieldvane tests or from the CPT-data, with a sensible cone factor applied. An ex-planation to this could be that the in-situ stress situation has not been properlyrecreated in the laboratory, more specifically the confining cell pressure in thetriaxial tests has been lower than the in-situ lateral soil pressure.
From the extensive data set available for the different types of clay till atTornhill it would seem plausible that the undrained shear strength is relatedto the preconsolidation stress, alternatively the overconsolidation ratio, andthe lateral stress, alternatively the coefficient of earth pressure at rest. Thehorizontal stress is in turn directly connected to the preconsolidation stressvia the Poisson’s ratio, as the horizontal stress represents the prevented lateraldisplacement of the soil during the consolidation phase. This further empha-sizes the importance of applying radial pressure of the correct magnitude inthe triaxial tests, in order to obtain good measurements of the strength pa-rameters.
Furthermore, at the same level of preconsolidation stress the Baltic clay till,which is rich in clay, experiences a significantly higher horizontal stress than
58
the clay till denoted as mixed. This could indicate a relation between thehorizontal stress and the clay content of the soil, that in turn is also relatedto the liquid limit, which can be summarized as:
τfu = f(σ′c, σ
′h, σ
′v0)
σ′h = f(σ′c, lc)
σ′h = f(σ′c, wL)
(6.1)
Finally, the empirical relations introduced earlier in the report for evaluatingthe key parameters undrained shear strength and the preconsolidation stressyielded poor results. The general trend is that the relations underestimatethe parameters when compared to field tests. Furthermore, the empiricallyevaluated trend is sometimes not even correct, when compared to directlymeasured data. A stronger empirical foundation could have been used forguidance when evaluating the scattered field test data, thus improving thequality of the chosen value. It would also enable the person who evaluates themeasurements to take a less defensive and more realistic stance.
59

7 Conclusions
The comparison between the undrained shear strength measurements fromfield vane tests and the filtered net cone resistance presents a mean value ofNkt in the range of 9.3 to 10.2. Due to the significant degree of scatter in thedata, partially caused by the inhomogeneous nature of the soil and partiallyinfluenced by primarily using field vane tests to evaluate the undrained shearstrength, the mean values are connected to a significant standard deviation,ranging from 0.7 to 1.7. Despite the relatively high standard deviations, it stillseems reasonable to use a cone factor lower than 11, especially when filteringthe CPT-data repeating the method used in this project.
Furthermore, it also appears that the cone factor is closely linked to the over-consolidation ratio and a dynamic approach to evaluate the cone factor fea-turing OCR seems reasonable. Moreover, K0 and wL also seem connected tothe variations in the cone factor.
Finally, the empirical relations available for evaluation of key parameters wheninvestigating clay till are insufficient. However, it seems conceivable to empir-ically relate the undrained shear strength of clay till to the preconsoidationstress in combination with either the lateral stress or the liquid limit. Usingsensible cone factors also gives good agreement between the net cone resistanceand the undrained shear strength.
61


8 Proposed Further Research
CPT-sounding
In the current project, as well as in previous investigations, it has been con-cluded that, in a profile entirely comprised of clay till, CPT-sounding is feasibleonly down to a depth of about 7 meters. A stop is reached about a meter intothe bottom layer of Northeast clay till. However, it has been noted that thisstop is often not related to the probe hitting a larger particle like a stone butinstead that the friction against the drill rods become to great. This problemcould possibly be mitigated by using a set of sleeves, welded onto the drillrods, that widens the hole above the CPT-probe slightly, and decreases thecontact area between the surrounding soil and the rods to a great deal.
Another approach could be to initially proceed as usual and use the CPT tothe point where it gets stuck, at this point the CPT-probe and the drill rodsare withdrawn and an auger is used to widen the hole down to about a meterabove where the stop was reached. From this point it might be possible tocontinue the CPT-sounding further into the soil profile.
Sampling
The quality of the specimens are absolutely crucial when performing advancedlaboratory tests. The methods used to obtain undisturbed samples includesvarious types of tube samplers, for example ”Americanerror”, triple tube coredrilling systems, for example ”Geobor S” and regular double tube push sam-plers like the piston sampler, St II. However, all these methods present dif-ferent problems. The standard piston sampler can only be used in softer claytill and/or clay till with small amounts of coarse particles, it also suffers fromhaving a small sampling dimension. The tube samplers can be used in alltypes of clay till. The great advantage is the expendable nature of the sam-pling tubes. When utilized, the sampling tube is hammered into the ground,which means that it can be driven further down into firm clay till, comparedto a push sampler. This, however, may have some compacting and disturbingeffects on the soil, especially in the outer rim of the sample. It has been shownthat the core drilling method is most suitable for firm clay tills with few lenses
63

of coarse soil. In softer clay tills larger particles are not drilled through butinstead pushed in front of the sampler. The flushing medium used to removedrill cuttings have a tendency to disturb the outer parts of the sample, as wellas washing away lenses of friction soil.
Another sampler that has not been tested to a degree worth mentioning isthe moraine sampler, ”Mullvaden”. It is a double tube sampler with a ringshaped drill bit that utilizes pushing and rotating motion just like the coredrilling system. The big difference from the core drilling system is that themoraine sampler is installed on a regular drill rig, whereas the triple tubecoring system requires a separate, much bigger, rig. Furthermore, testing adouble or triple tube hollow stem auger sampler could yield good results asrelatively big dimensions are available.
The proposed method is to compare undisturbed specimens taken with differ-ent samplers, exploiting the fact that the breaking point between the recom-pression and virgin loading curve, in an oedometer test, becomes more diffuseas the sample quality decreases. It is also possible to evaluate the sample qual-ity based on the water content and volumetric strain during reconsolidation.
Advanced laboratory testing
Strength parameters evaluated from field vane tests are connected to signifi-cant uncertainty. One approach to tackle this and to reinforce the evaluatedstrength profile from the vane tests is to consider more points for field vanetests and simply increase the amount of tests and improve the evaluated pa-rameters by averaging. On the other hand it is possible to employ advancedlab tests, essentially presenting the opportunity to replace quantity with qual-ity. For instance, from the advanced tests a wider array of soil parameters canbe evaluated, and in turn be utilized in sophisticated numerical calculations.Another benefit of evaluating soil parameters exploiting advanced tests is toavoid extensive usage of empirical relations in the attempt to evaluate toomany parameters from one test.
In order to conduct these tests it is of utmost importance to have reliablemeasurements of the in-situ stress and preconsolidation condition, and samplesof as high quality as possible.
64

Evaluation of the undrained shear strength of clay till
By conducting further comprehensive investigations of clay till at differentlocations it might be possible to derive a set of empirical relations that arebased on more sophisticated tests, and the parameters that seem to influencethe soils behaviour the most. This could then possibly be linked to the moreaffordable tests that are commonly used in regular geotechnical investigations.
Based on which parameters are most likely to influence the properties, andspecifically the undrained shear strength, of clay till it is possible to design amore suitable test program that can be used in further investigations. Thisshould involve a mean of determining the lateral stress condition, the precon-solidation stress, the composition of the soil material, and, also, a reliable wayof directly measuring the undrained shear strength.
65

Bibliography
[1] Anders H. Augustesen, J. N. Goth, and Jørgen S. Steenfelt. Triaxial test-ing of overconsolidated, low plasticity clay till. Proceedings from NordiskeGeoteknikermøde, Reykjavik, 2016.
[2] Marianne Bondo Hoff, Nik Okkels, and Morten Rasmussen. Conefaktor iSøvindmergel, Septarieler og fedt moræneler. Dansk Geoteknisk Forening,Kopenhamn, 2008.
[3] Ann Dueck. Reference site for clay till. Tekniska hogskolan i Lund,Avdelningen for geoteknik, Lund, 1995.
[4] Ann Dueck. Egenskaper i Lermoran, en laboratioriestudie utford vid Lab-oratorier for Fundering, Aalborgs Universitetscentrum. Institutionen forGeoteknologi, Lund, 1997.
[5] Ann Dueck. Shear strength and matrix suction in clay tills - Triaxialtest procedures to evaluate shear strenth of clay tills from south-westernSweden. Lunds Tekniska Hogskola, Avdelningen for Geoteknik, Lund,1998.
[6] Ann Dueck and Hakan Garin. Pressometerforsok i fast lera och lermoran.Institutionen for Geoteknologi, LTH, Lund, 1995.
[7] DGF Feltkomite. Referenceblad for vingeforsøg. Dansk Geoteknisk Foren-ing, Kopenhamn, 1999.
[8] Curt Freden. Berg och jord, Sveriges Nationalatlas. SNA Forlag, Stock-holm, 1994.
[9] Svenska Geotekniska Foreningen. Rekommenderad Standard forVingforsok i Falt. Tryck-Center, Linkoping, 1993.
[10] Svenska Geotekniska Foreningen. Rekommenderad standard for CPT-sondering. Roland Offset AB, Linkoping, 1999.
[11] Svenska Geotekniska Foreningen. Metodbeskrivning for provtagning medstandardkolvprovtagare. Svenska Geotekniska Foreningen, Linkoping,2009.
67

[12] Svenska Geotekniska Foreningen. Triaxialforsok - En vagledning. SvenskaGeotekniska Foreningen, Linkoping, 2012.
[13] Jan Hartlen. Skanska moranlerors hallfasthets- och barighetsegenskaper.Chalmers Tekniska Hogskola, Institutionen for Geoteknik medGrundlaggning, Goteborg, 1974.
[14] Statens Geotekniska Institut. Anvandarmanual CONRAD. StatensGeotekniska Institut, Linkoping, 3.1 edition, 2010.
[15] Moust Jacobsen. Strength and deformation properties of preconsoli-dated moraine clay. DGF - Bulletin no. 27. Dansk Geoteknisk Forening,Kopenhamn, 1970.
[16] Lars-Erik Johannesson. CPT-sondering i finjord, Olika aspekter pa hand-havande av utrustning och uttolkning av jordparametrar. Avdelningen forGeoteknik, LNTH, Lund, 1990.
[17] Charles C. Ladd and Roger Foott. New design procedure for stability ofsoft clays. Department of Civil Engineering, Massachusetts Institute ofTechnology, Massachusett, 1973.
[18] Rolf Larsson. Lermoran - En Litteraturstudie. Roland Offset AB,Linkoping, 2000.
[19] Rolf Larsson. Investigations and Load Tests in Clay Till. StatensGeotekniska Institut, Linkoping, 2001.
[20] Rolf Larsson. Jords egenskaper. Statens Geotekniska Institut, Linkoping,5 edition, 2008.
[21] Rolf Larsson. CPT-sondering, Utrustning - Utforande - Utvardering.Statens Geotekniska Institut, Linkoping, 2015.
[22] Rolf Larsson and M Mulabdic. Piezocone tests in clay. Rapport no. 42.Statens Geotekniska Institut, Linkoping, 1991.
[23] Rolf Larsson, Goran Sallfors, Per-Evert Bengtsson, Claes Alen, andLeif Erikson. Skjuvhallfasthet - utvardering i kohesionsjord. StatensGeotekniska Institut, Linkoping, 2007.
[24] Rolf Larsson and Helen Ahnberg. Utvardering av skjuvhallfasthet ochforkonsolideringstryck fran vingforsok, CPT-sondering och dilatome-terforsok. Varia no. 528. Statens Geotekniska Institut, Linkoping, 2003.
68

[25] Maurits Lindstrom, Jan Lundqvist, and Thomas Lundqvist. Sverigesgeologi fran urtid till nutid. Studentlitteratur, Lund, 2 edition, 2000.
[26] Kirsten Luke. Measuring Undrained Shear Strength using CPT and FieldVane. Dansk Geoteknisk Forening, Aalborg, 1992.
[27] Kirsten Luke. Cone Factors from Field Vane and Triaxial Tests in DanishSoils. Icelandic Geotechnical Society, Reykjavik, 1996.
[28] James K. Mortensen, G Hansen, and B Sørensen. Correlation of CPT andField Vane Tests for Clay Tills. Dansk Geoteknisk Forening, Kopenhamn,1991.
[29] Geoteknik och geokonstruktioner SIS/TK 183. Geoteknisk undersokningoch provning - Laboratorieundersokning av jord - Del 6: Konforsok(ISO/TS 17892-6:2004). SIS Forlag AB, Stockholm, 1 edition, 2004.
[30] Geoteknik och geokonstruktioner SIS/TK 183. Geoteknisk undersokningoch provning - Laboratorieundersokning av jord - Del 8: Okonsolideratodranerat triaxialforsok (ISO/TS 17892-8:2004). SIS Forlag AB, Stock-holm, 1 edition, 2005.
[31] Geoteknik och geokonstruktioner SIS/TK 183. Geoteknisk undersokningoch provning - Laboratorieundersokning av jord - Del 9: Konsoliderattriaxialforsok pa vattenmattad jord (ISO/TS 17892-9:2004). SIS ForlagAB, Stockholm, 1 edition, 2005.
[32] Geoteknik och geokonstruktioner SIS/TK 183. Geoteknisk undersokningoch provning - Provtagning genom borrnings- och utgravningsmetoder ochgrundvattenmatningar - Del 1: Tekniskt utforande (ISO 22475-1:2006).SIS Forlag AB, Stockholm, 1 edition, 2006.
[33] Geoteknik och geokonstruktioner SIS/TK 183. Geoteknisk undersokningoch provning - Laboratorieundersokning av jord - Del 12: Bestamning avAtterbergs konsistensgranser (ISO/TS 17892-12:2004). SIS Forlag AB,Stockholm, 1 edition, 2008.
[34] Geoteknik och geokonstruktioner SIS/TK 183. Geoteknisk undersokningoch provning - Faltprovning - Del 4: Pressometerforsok enligt Menard(ISO 22476-4:2012). SIS Forlag AB, Stockholm, 1 edition, 2012.
[35] Geoteknik och geokonstruktioner SIS/TK 183. Geoteknisk undersokningoch provning - Laboratorieundersokning av jord - Del 1: Bestamning av
69

vattenkvot (ISO 17892-1:2014). SIS Forlag AB, Stockholm, 1 edition,2014.
[36] Geoteknik och geokonstruktioner SIS/TK 183. Geoteknisk undersokningoch provning - Laboratorieundersokning av jord - Del 2: Bestamning avskrymdensiteten hos finkornig jord (ISO 17892-2:2014). SIS Forlag AB,Stockholm, 1 edition, 2014.
[37] Geoteknik och geokonstruktioner SIS/TK 183. Geoteknisk undersokningoch provning - Laboratorieundersokning av jord - Del 4: Bestamning avkornstorleksfordelning (ISO 17892-4:2016). SIS Forlag AB, Stockholm, 1edition, 2016.
[38] Geoteknik och geokonstruktioner SIS/TK 183. Geoteknisk undersokningoch provning - Laboratorieundersokning av jord - Del 5: Odometerforsokmed stegvis belastning (ISO 17892-5:2017). SIS Forlag AB, Stockholm, 1edition, 2017.
[39] Bertil Ringberg. Beskrivning till jordartskartan Trelleborg NV/MalmoSV. Lanstryckeriet, Nykoping, 1975.
[40] Bertil Ringberg. Beskrivning till jordartskartan Malmo SO. LiberKartor,Stockholm, 1980.
[41] Bertil Ringberg. Beskrivning till jordartskartan Malmo NO. OffsetcenterAB, Uppsala, 1987.
[42] Peter K. Robertson and K. L. Cabal. Guide to Cone Penetration Testingfor Geotechnical Engineering. Gregg Drilling & Testing, Inc., California,6 edition, 2015.
[43] Skredkommisionen. Anvisningar for slantstabilitet. In-genjorsvetenskapsakademin, Linkoping, 1995.
[44] Jørgen S. Steenfelt and Niels Foged. Claytill strength - SHANSEP andCSSM. DGF Bulletin no. 9 volume 1/3. Proceedings from NordiskeGeoteknikermøde, Aalborg, 1992.
[45] Jørgen S. Steenfelt and Carsten S. Sørensen. CPT - Contraption forprobing in Tills? Field Testing Paper R 9517. Aalborg: GeotechnicalEngineering Group, Aalborg, 1995.
[46] Sveriges Geologiska Undersokning. Jorddjupskarta over sydvastra SkaneSGU. Ba nr 28, 1:100000. SGU, Uppsala, 1980.
70

[47] Sveriges Geologiska Undersokning. Jordartskartan 2C Malmo NO. Ae nr85, 1:50000. Offsetcenter AB, Uppsala, 1987.
[48] Sveriges Geologiska Undersokning. Jordartskartan 3C Helsingborg SO.Ae nr 51, 1:50000. Sormlands Grafiska AB, Katrineholm, 1987.
71