report: west campus climate action plan
DESCRIPTION
Maximillian worked with a team of civil and environmental engineers to create a climate action plan for the West Campus sub-neighborhood of Champaign-Urbana, IL's Campustown area. Maximillian contributed mainly towards the completion of the land-use survey and calculating present-day carbon emissions. This work relied upon the eQUEST modeling software.TRANSCRIPT
UP 466
Spring 2015
Group 3
Vasco Yin Chun Chan
Maximillian Mahalek
Andrew Schwartz
Michael Taylor
West Campus Climate Action Plan
1
Executive Summary
The West Campus community is located to the west of the University of Illinois at Urbana-
Champaign’s main quadrangle. Composed primarily of apartment-style residences and
dormitories, during the academic season the neighborhood houses nearly 20% of the University’s
student body. In addition, West Campus is composed of educational facilities, restaurants, and a
variety of small retailers. Lifestyles, schedules, transportation choices, and even the urban
framework are unique in a campus-dominated setting, which differs from the urban or suburban
communities that climate action plans typically focus on. This study aims to quantify and observe
energy consumption and carbon dioxide emission trends within the West Campus area. In addition,
future consumption and carbon dioxide emissions are projected.
Once these calculations and projections are completed, candidate initiatives aimed at reducing
energy use and carbon dioxide emissions are identified. Residential electricity consumption is one
of the primary contributors to carbon dioxide emissions in West Campus. Two significant
strategies are recommended to minimize the high climate impact of this sector: the installation of
photovoltaic panels on existing buildings, as well as the installation of a deep-well, geothermal
generation system. In addition, demand for such energy may be reduced by requiring ENERGY
STAR rated appliances and providing conservation education. Policies to improve the annual
carbon footprints of other energy uses are identified, including building heating and transportation
within (or to and from) West Campus. Altogether, our recommendations are aimed at reducing
carbon dioxide emissions in West Campus by 75% by the year 2040.
Precedents reflecting our recommendations are discussed, and guidance is provided in the area of
coalition building and financing (areas key to the implementation of our recommendations).
This plan aims to provide an educational resource for environmentally conscious area residents,
promote increased climate awareness locally, and to identify a benchmark in energy behavior.
The breakdown of our group members’ contributions are seen in Appendix Item 1.
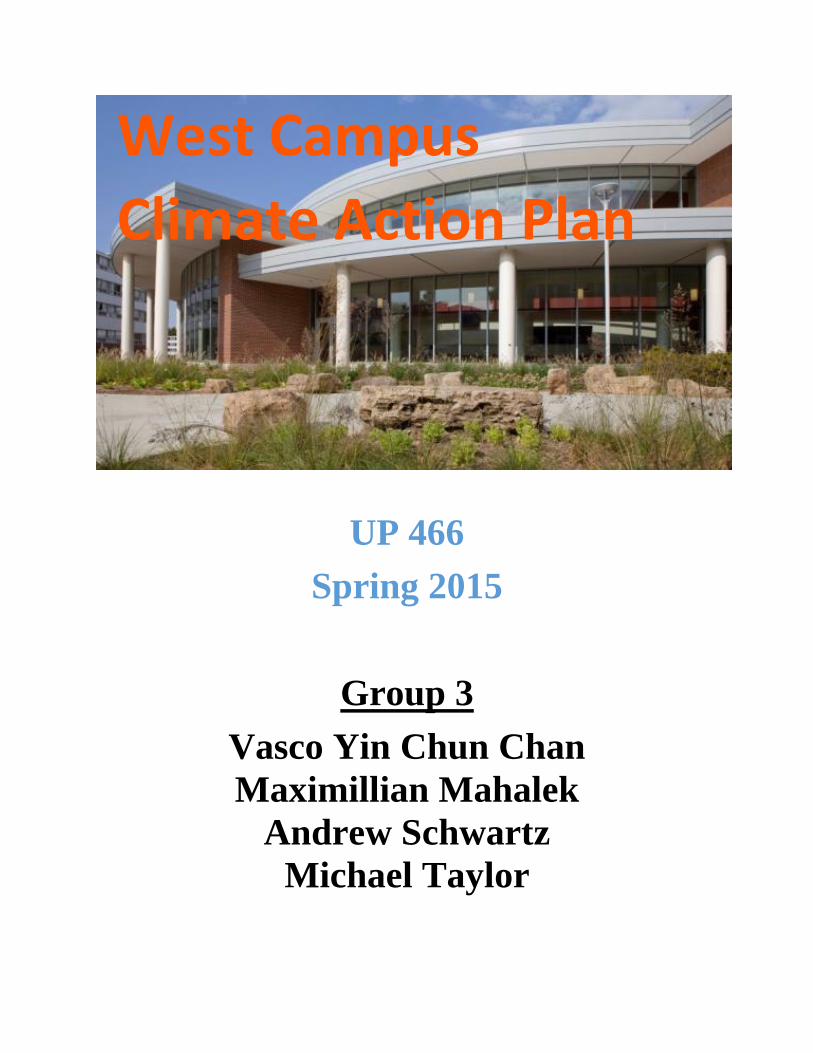
Image 1: West Campus houses many
University of Illinois students in high-density buildings. Source: http://commons.wikimedia.org/wiki/File:Illini_Tower.jpg
2
Table of Contents
Introduction 3
West Campus Ethnographic Discussion 4
Carbon Dioxide Emissions Inventory 6
Carbon Dioxide Emissions Projections 15
Energy and Carbon Dioxide Emissions Targets 17
Strategies for Energy and Emission Reductions 18
Mitigation Wedges 27
Results and Discussion 29
Precedents and Applying Recommendations 30
Conclusion 32
Works Cited 33
Appendix 35
Image 2: West Campus residents and visitors often rely on public transit. Source: https://www.flickr.com/photos/claygregory/4918241172/

3
Introduction
Our team has been tasked with developing a climate action plan for a large portion of the
Campustown neighborhood surrounding the campus of the University of Illinois at Urbana-
Champaign. Specifically, we are focusing on reducing both energy use and carbon dioxide
emissions in an area we have deemed “West Campus,” which incorporates a part of the campus
itself, as well the commercial and residential areas west of campus (all of which lays in the city
limits of the Champaign). West Campus is bordered on the west by First Street, Green Street on
the north, Peabody Drive on the south, and on the east by both Sixth Street and Wright Streets (see
Map 1). The intention of this plan is to identify the full range of contributors to carbon dioxide
emissions that are present within West Campus. Once this knowledge is established,
recommendations are made to help achieve a 75% drop in emissions by 2040.
Map 1: Geographic Boundaries of West Campus
Note that, for the purposes of this plan, energy use projections are estimated consistently
throughout the entire year, despite the fact that many students move elsewhere during the summer
months. This is done for four reasons: 1) despite the fact that many students leave West Campus
during the summer, there are many on-campus events and programs during the summer attracting
temporary residents to the neighborhood, 2) many, if not all, of the area’s offices and institutional
uses are utilized during the summer, 3) many in this neighborhood utilize energy late into the night,
increasing usage throughout the year as compared to other neighborhoods in Champaign and
Urbana, and 4) the conservation and load tactics recommended will even be more effective than
projected if indeed energy use in the neighborhood falls below estimations (due to less use in the
summer).
4
West Campus Ethnographic Discussion
Regional Context
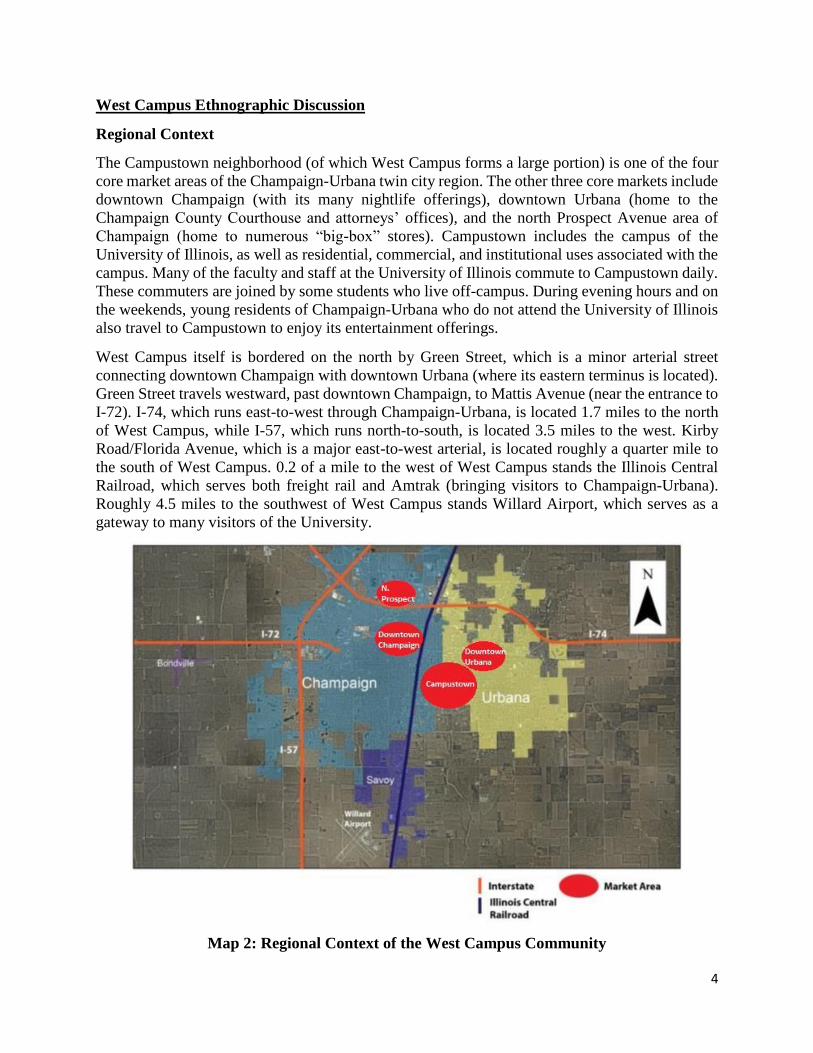
The Campustown neighborhood (of which West Campus forms a large portion) is one of the four
core market areas of the Champaign-Urbana twin city region. The other three core markets include
downtown Champaign (with its many nightlife offerings), downtown Urbana (home to the
Champaign County Courthouse and attorneys’ offices), and the north Prospect Avenue area of
Champaign (home to numerous “big-box” stores). Campustown includes the campus of the
University of Illinois, as well as residential, commercial, and institutional uses associated with the
campus. Many of the faculty and staff at the University of Illinois commute to Campustown daily.
These commuters are joined by some students who live off-campus. During evening hours and on
the weekends, young residents of Champaign-Urbana who do not attend the University of Illinois
also travel to Campustown to enjoy its entertainment offerings.
West Campus itself is bordered on the north by Green Street, which is a minor arterial street
connecting downtown Champaign with downtown Urbana (where its eastern terminus is located).
Green Street travels westward, past downtown Champaign, to Mattis Avenue (near the entrance to
I-72). I-74, which runs east-to-west through Champaign-Urbana, is located 1.7 miles to the north
of West Campus, while I-57, which runs north-to-south, is located 3.5 miles to the west. Kirby
Road/Florida Avenue, which is a major east-to-west arterial, is located roughly a quarter mile to
the south of West Campus. 0.2 of a mile to the west of West Campus stands the Illinois Central
Railroad, which serves both freight rail and Amtrak (bringing visitors to Champaign-Urbana).
Roughly 4.5 miles to the southwest of West Campus stands Willard Airport, which serves as a
gateway to many visitors of the University.
Map 2: Regional Context of the West Campus Community
5
Neighborhood Information and Systems
The following census block groups make up West Campus, per the 2010 US Census: Block Group
2/Census Tract 3.01, Block Group 1/Census Tract 3.01, Block Group 1/Census Tract 4.01, Block
Group 2/Census Tract 4.01, Block Group 2/Census Tract 4.02, Block Group 1/Census Tract 4.02,
and Block Group 1/Census Tract 14. Extrapolating the population numbers for these geographies
form the 2010 US census, it was estimated that 8,146 persons reside in West Campus.i This
population may decline upwards of 70% at various points throughout the summer, as many
students move elsewhere during that time. A survey of land-uses in the neighborhood is provided
later in this report.
West Campus is serviced by several bus lines, as the Champaign-Urbana Mass Transit District is
oriented towards serving the University of Illinois. These lines include the Illini, the Gold, the
Silver, the Yellow, the Red, the Green, the Air Bus, the Navy, the Brown, the Bronze, and the Blue
lines.ii A major bus transit facility is located at the Transit Plaza at the intersection of Wright and
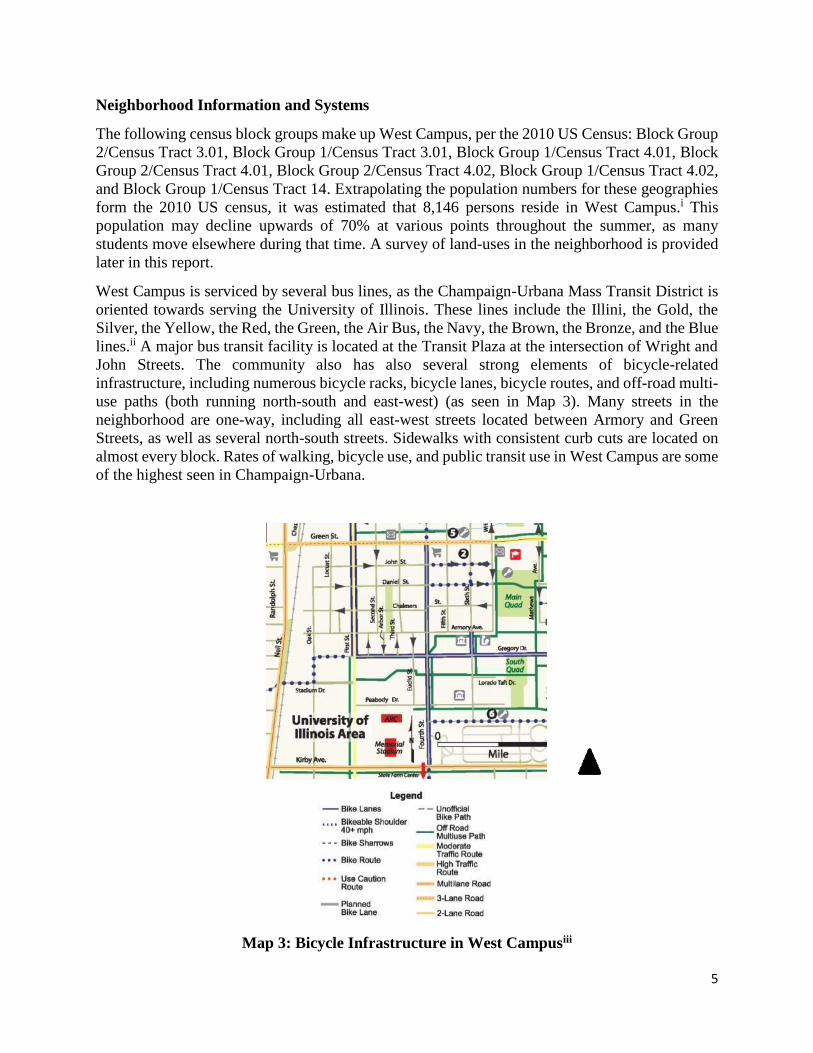
John Streets. The community also has also several strong elements of bicycle-related
infrastructure, including numerous bicycle racks, bicycle lanes, bicycle routes, and off-road multi-
use paths (both running north-south and east-west) (as seen in Map 3). Many streets in the
neighborhood are one-way, including all east-west streets located between Armory and Green
Streets, as well as several north-south streets. Sidewalks with consistent curb cuts are located on
almost every block. Rates of walking, bicycle use, and public transit use in West Campus are some
of the highest seen in Champaign-Urbana.
Map 3: Bicycle Infrastructure in West Campusiii
6
Generally, commuting patterns within West Campus flow from west-to-east in the morning, and
are reversed in the evening, as many students are on campus during the business day.
Notable landmarks/district in the neighborhood include the Ikenberry Commons programming
facility and related-dormitories in the southwest portion of the neighborhood, the Illini Union
Bookstore along Wright Street, the Green Street business district, numerous well-known sorority
and fraternity houses, and high-rises including Illini Tower, Sherman Hall, Presby Hall, the
Psychology Building, the Tower on Third, and 309 E. Green Street.
Carbon Dioxide Emissions Inventory
Building Survey
In the spring of 2015, our group completed a building survey for West Campus. Pertinent building
information, including use, construction type, and number of floors were recorded for each address
within the neighborhood. A list of addresses was provided by Champaign County, while square
the footage of the footprint of each building in West Campus was measured utilizing an online
tool.iv Total building square footages were then calculated by multiplying each building footprint
by the number of floors present at those buildings. The total calculated building square footage in
West Campus was then increased by 10% to account for underground parking lots and partial
floors.
The recorded buildings’ uses were then organized into building-type classifications provided by
the EIA (the US Energy Information Administration), with each building type corresponding to a
certain level of energy use, as projected by the EIA.v The following categories listed by the EIA
were utilized:
Education
Food Service
Health (Out Patient)
Lodging
Office
Parking (deck)
Public Assembly
Religious Worship
Retail (Other than Mall)
Retail (Strip Mall)
An example of the preliminary results for one of the many buildings surveyed is seen in Table 1
below.
Table 1: Preliminary square footage estimates and land-use
classification for buildings in West Campus.
Address Recorded
Building-Use
Number of
Floors
Construction
Type
Square Foot
per Floor
Total Square
Footage,
Plus 10%
EIA
Classification for
Energy Use
1004 S.
First Street
Apartment 5 Brick/Concrete 1,423 7,827 Lodging
7
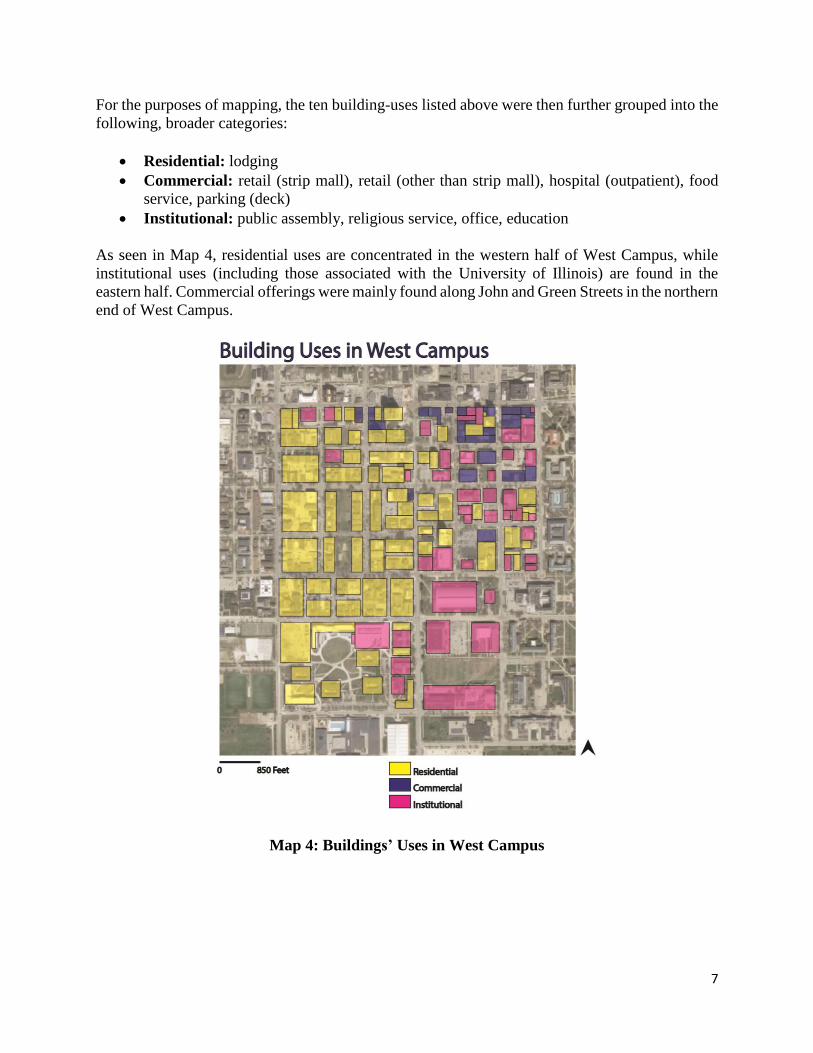
For the purposes of mapping, the ten building-uses listed above were then further grouped into the
following, broader categories:
Residential: lodging
Commercial: retail (strip mall), retail (other than strip mall), hospital (outpatient), food
service, parking (deck)
Institutional: public assembly, religious service, office, education
As seen in Map 4, residential uses are concentrated in the western half of West Campus, while
institutional uses (including those associated with the University of Illinois) are found in the
eastern half. Commercial offerings were mainly found along John and Green Streets in the northern
end of West Campus.
Map 4: Buildings’ Uses in West Campus
8
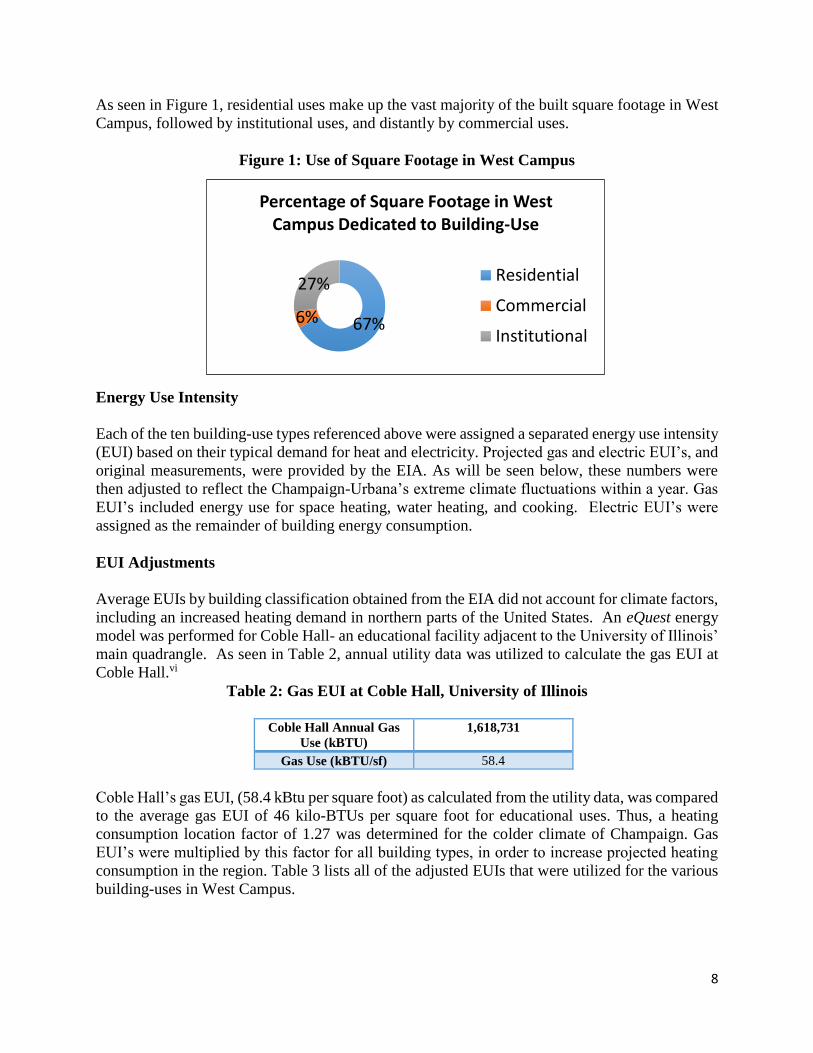
As seen in Figure 1, residential uses make up the vast majority of the built square footage in West
Campus, followed by institutional uses, and distantly by commercial uses.
Figure 1: Use of Square Footage in West Campus
Energy Use Intensity
Each of the ten building-use types referenced above were assigned a separated energy use intensity
(EUI) based on their typical demand for heat and electricity. Projected gas and electric EUI’s, and
original measurements, were provided by the EIA. As will be seen below, these numbers were
then adjusted to reflect the Champaign-Urbana’s extreme climate fluctuations within a year. Gas
EUI’s included energy use for space heating, water heating, and cooking. Electric EUI’s were
assigned as the remainder of building energy consumption.
EUI Adjustments
Average EUIs by building classification obtained from the EIA did not account for climate factors,
including an increased heating demand in northern parts of the United States. An eQuest energy
model was performed for Coble Hall- an educational facility adjacent to the University of Illinois’
main quadrangle. As seen in Table 2, annual utility data was utilized to calculate the gas EUI at
Coble Hall.vi
Table 2: Gas EUI at Coble Hall, University of Illinois
Coble Hall Annual Gas
Use (kBTU)
1,618,731
Gas Use (kBTU/sf) 58.4
Coble Hall’s gas EUI, (58.4 kBtu per square foot) as calculated from the utility data, was compared
to the average gas EUI of 46 kilo-BTUs per square foot for educational uses. Thus, a heating
consumption location factor of 1.27 was determined for the colder climate of Champaign. Gas
EUI’s were multiplied by this factor for all building types, in order to increase projected heating
consumption in the region. Table 3 lists all of the adjusted EUIs that were utilized for the various
building-uses in West Campus.
67%6%
27%
Percentage of Square Footage in West Campus Dedicated to Building-Use
Residential
Commercial
Institutional

9
Table 3: EUIs utilized to determine energy consumption by
building-use in West Campus.
Land-Use Annual Gas EUI
(kBTU/square foot)
Annual Electricity EUI
(kBTU/square foot)
Total EUI
(kBTU/square foot)
Education 58.4 37.1 95.5
Food Service 186.7 111.3 298.0
Health (Out Patient) 51.6 54.0 105.6
Lodging 35.7 71.9 107.6
Office 44.6 57.8 102.4
Parking (deck) 46.9 40.1 87.0
Public Assembly 65.4 42.4 107.8
Religious Worship 35.3 15.7 51.0
Retail (Other Than Mall) 33.7 47.4 81.1
Retail (Strip Mall) 44.1 67.5 111.6
Energy Use by Building-Use
Utilizing the EUIs listed above, it was determined that 332,298 million-BTUs of natural gas and
139,198,505 kilowatt-hours of electricity were consumed by the buildings in West Campus in one
year. The following tables (4 and 5) illustrate how this energy consumption was divided by general
building-use sector.
Tables 4 and 5: Energy Use by Sector in West Campus
for Natural Gas and Electricity
Building-Use Gas Use (mmBTU) Percentage (%)
Residential 179,736 54.1%
Commercial 36,399 11.0%
Institutional 116,163 35.0%
Total 332,298 100.0%
Building-Use Electricity Use (kWh) Percentage (%)
Residential 106,127,256 76.2%
Commercial
8,118,108 5.8%
Institutional 24,953,141 17.9%
Total 139,198,505 100.0%
Carbon Dioxide Emission Calculations by Building-Use
It was then necessary to project the amount of emissions that were expected to be generated by
these levels of energy use. As seen below in Figures 2 and 3, the buildings in West Campus
produced 86,025 metric tons of carbon dioxide emissions from electricity use, and 22,023 metric
tons of carbon dioxide emissions from natural gas use. Below these figures follows an explanation
of how these totals were determined.
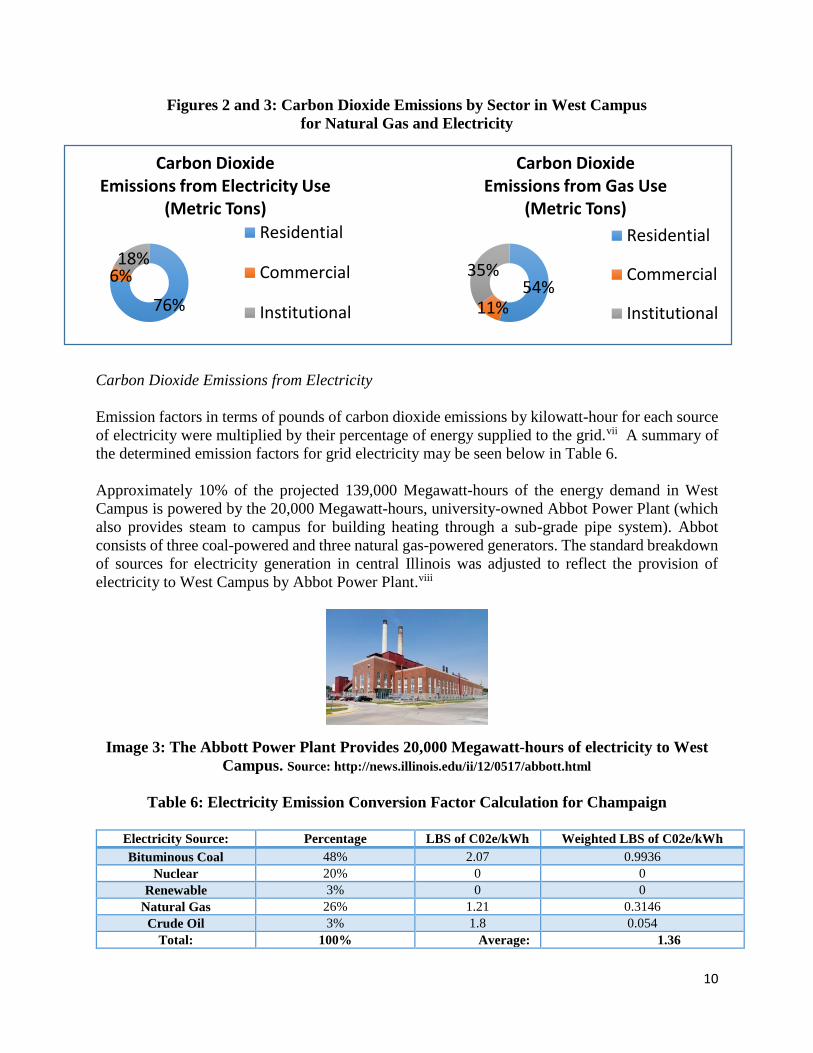
10
Figures 2 and 3: Carbon Dioxide Emissions by Sector in West Campus
for Natural Gas and Electricity
An explanation of these numbers were achieved follows:
Electricity
Carbon Dioxide Emissions from Electricity
Emission factors in terms of pounds of carbon dioxide emissions by kilowatt-hour for each source
of electricity were multiplied by their percentage of energy supplied to the grid.vii A summary of
the determined emission factors for grid electricity may be seen below in Table 6.
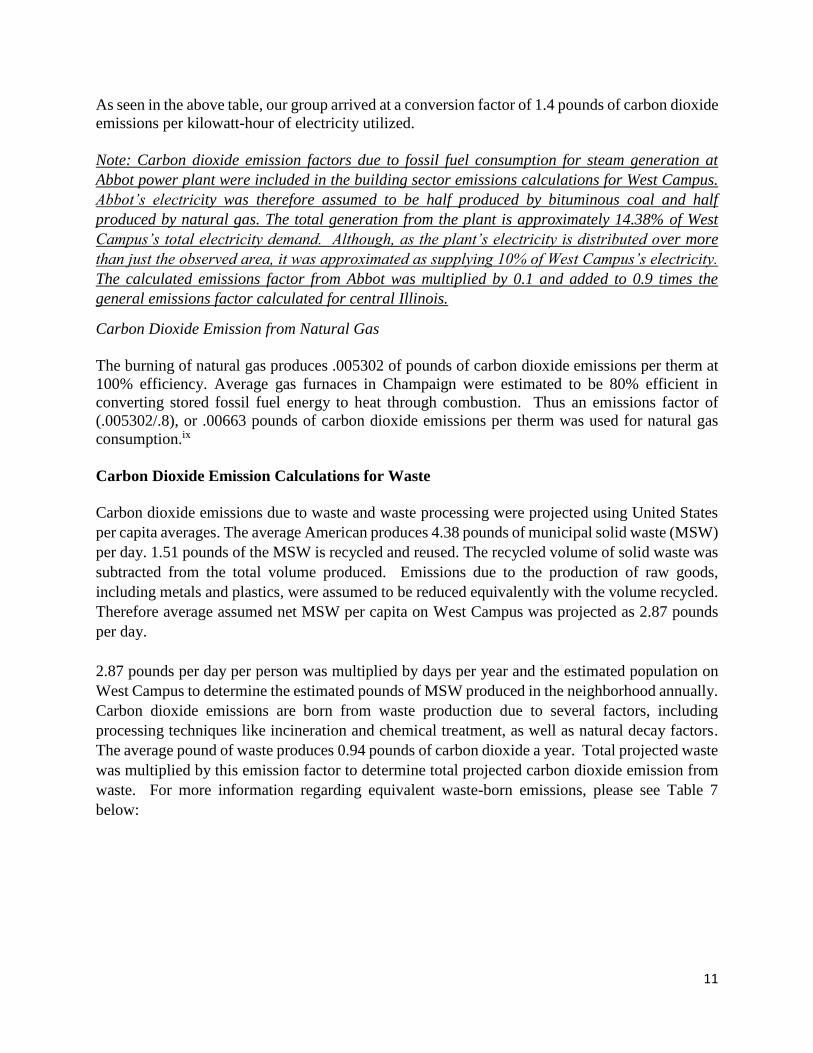
Approximately 10% of the projected 139,000 Megawatt-hours of the energy demand in West
Campus is powered by the 20,000 Megawatt-hours, university-owned Abbot Power Plant (which
also provides steam to campus for building heating through a sub-grade pipe system). Abbot
consists of three coal-powered and three natural gas-powered generators. The standard breakdown
of sources for electricity generation in central Illinois was adjusted to reflect the provision of
electricity to West Campus by Abbot Power Plant.viii
Image 3: The Abbott Power Plant Provides 20,000 Megawatt-hours of electricity to West
Campus. Source: http://news.illinois.edu/ii/12/0517/abbott.html
Table 6: Electricity Emission Conversion Factor Calculation for Champaign
Electricity Source: Percentage LBS of C02e/kWh Weighted LBS of C02e/kWh
Bituminous Coal 48% 2.07 0.9936
Nuclear 20% 0 0
Renewable 3% 0 0
Natural Gas 26% 1.21 0.3146
Crude Oil 3% 1.8 0.054
Total: 100% Average: 1.36
54%11%
35%
Carbon DioxideEmissions from Gas Use
(Metric Tons)
Residential
Commercial
Institutional76%
6%18%
Carbon DioxideEmissions from Electricity Use
(Metric Tons)
Residential
Commercial
Institutional
11
As seen in the above table, our group arrived at a conversion factor of 1.4 pounds of carbon dioxide
emissions per kilowatt-hour of electricity utilized.
Note: Carbon dioxide emission factors due to fossil fuel consumption for steam generation at
Abbot power plant were included in the building sector emissions calculations for West Campus.
Abbot’s electricity was therefore assumed to be half produced by bituminous coal and half
produced by natural gas. The total generation from the plant is approximately 14.38% of West
Campus’s total electricity demand. Although, as the plant’s electricity is distributed over more
than just the observed area, it was approximated as supplying 10% of West Campus’s electricity.
The calculated emissions factor from Abbot was multiplied by 0.1 and added to 0.9 times the
general emissions factor calculated for central Illinois.
Carbon Dioxide Emission from Natural Gas
The burning of natural gas produces .005302 of pounds of carbon dioxide emissions per therm at
100% efficiency. Average gas furnaces in Champaign were estimated to be 80% efficient in
converting stored fossil fuel energy to heat through combustion. Thus an emissions factor of
(.005302/.8), or .00663 pounds of carbon dioxide emissions per therm was used for natural gas
consumption.ix
Carbon Dioxide Emission Calculations for Waste
Carbon dioxide emissions due to waste and waste processing were projected using United States
per capita averages. The average American produces 4.38 pounds of municipal solid waste (MSW)
per day. 1.51 pounds of the MSW is recycled and reused. The recycled volume of solid waste was
subtracted from the total volume produced. Emissions due to the production of raw goods,
including metals and plastics, were assumed to be reduced equivalently with the volume recycled.
Therefore average assumed net MSW per capita on West Campus was projected as 2.87 pounds
per day.
2.87 pounds per day per person was multiplied by days per year and the estimated population on
West Campus to determine the estimated pounds of MSW produced in the neighborhood annually.
Carbon dioxide emissions are born from waste production due to several factors, including
processing techniques like incineration and chemical treatment, as well as natural decay factors.
The average pound of waste produces 0.94 pounds of carbon dioxide a year. Total projected waste
was multiplied by this emission factor to determine total projected carbon dioxide emission from
waste. For more information regarding equivalent waste-born emissions, please see Table 7
below:
12
Table 7: Calculations of Carbon Dioxide Emissions
from Waste Production in West Campus
MSW
(lb./day/person)
Recycled Net MSW
(lb./person/year)
Population MSW
(lb./year)
Carbon
Dioxide
Emissions
(lb./year)
Carbon
Dioxide
Emissions
(lb./year)
4.38 1.51 2.87 1,050 8,146 8,533,000 8,021,000 3,638
Carbon Dioxide Emission Calculations for Transportation
In order to get an accurate measurement of the carbon dioxide emissions produced by
transportation, the amount of miles driven by vehicles within West Campus must be established
over a given time period. Data from the Illinois Department of Transportation website provides an
average daily traffic (ADT) count for each road in West Campus.x The ADT count is a measure of
every car that uses a certain road or road section for a 24 hour period.
The following steps were taken to calculate emissions contributed by transportation:
a. The length of every road within West Campus was recorded utilizing an online tool. xi These
values were inputted into a spreadsheet along with the ADT for each road.
b. To calculate the vehicle miles travelled (VMT) in West Campus for a year, a time period of 365
days was used. The formula used to calculate the annual miles travelled in West Campus is as
follows:
VMT = (ADT) x (Road Length) x (Length in days)
c. The total VMT is taken by individually calculating the VMT for each road and summing the
values in a spreadsheet. Shown below (Table 8) is a small portion of a spreadsheet, where
individual roads are broken into sections by block.
Table 8: An example of vehicle miles traveled calculations.
Street Road Length Average Daily
Traffic (ADT)
Time Annual Vehicle
Miles Traveled
(VMT)
Green Street .087 10,500 365 3E+05
.08802 10,500 365 3E+05
John Street .08814 700 365 22,520
d. The VMT for West Campus for one year is calculated at 7,000,000 miles. The EPA website
provided a figure for the tons of carbon dioxide released per mile travelled in an average sized
car. 4.2E-4 tons of carbon dioxide per mile was used to find the total amount of carbon dioxide
emissions released by the transportation sector in West Campus. The yearly emission by
transportation is 2,924.6 tons of carbon dioxide.
13
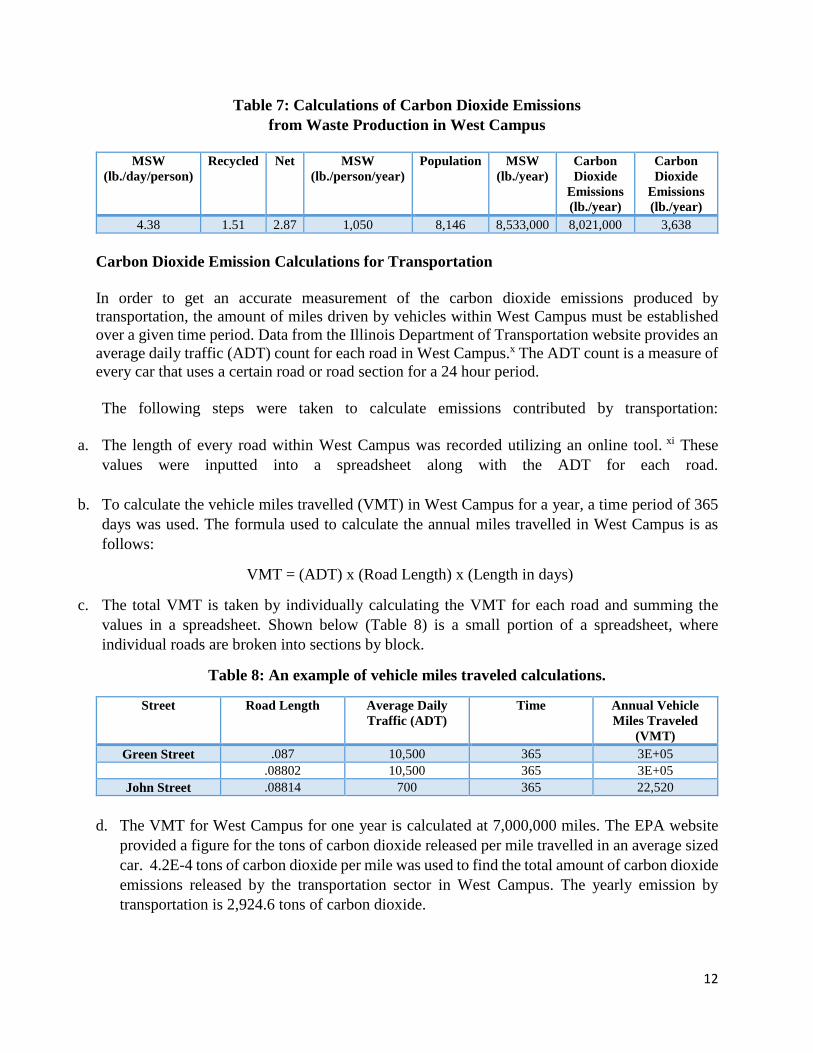
As compared to the Urbana Climate Action Plan and the Illinois Climate Action Plan, the
emissions from the transportation sector in West Campus are low relative to the other sector
emissions.xii A survey about transportation preferences was distributed to students online (by our
group) to establish whether automatic vehicle usage was particularly low due to the availability of
busses and ample biking and walking space. The link to the survey is
http://goo.gl/forms/9R3oUXlD3B, and the results are as follows (Figures 4 and 5):
Figures 4 and 5: Active transportation solutions are popular in West Campus
As shown, the majority of students do not have a car on campus to drive. Also, the primary mode
of transportation is the Champaign-Urbana Mass Transit District’s bus system, which greatly
reduces the amount of vehicle miles travelled in relation to how many people are in the vehicle.
Due to the results of the survey, it was concluded that the emissions from the transportation sector
are at acceptably low levels due to the low volume of annual traffic in West Campus.
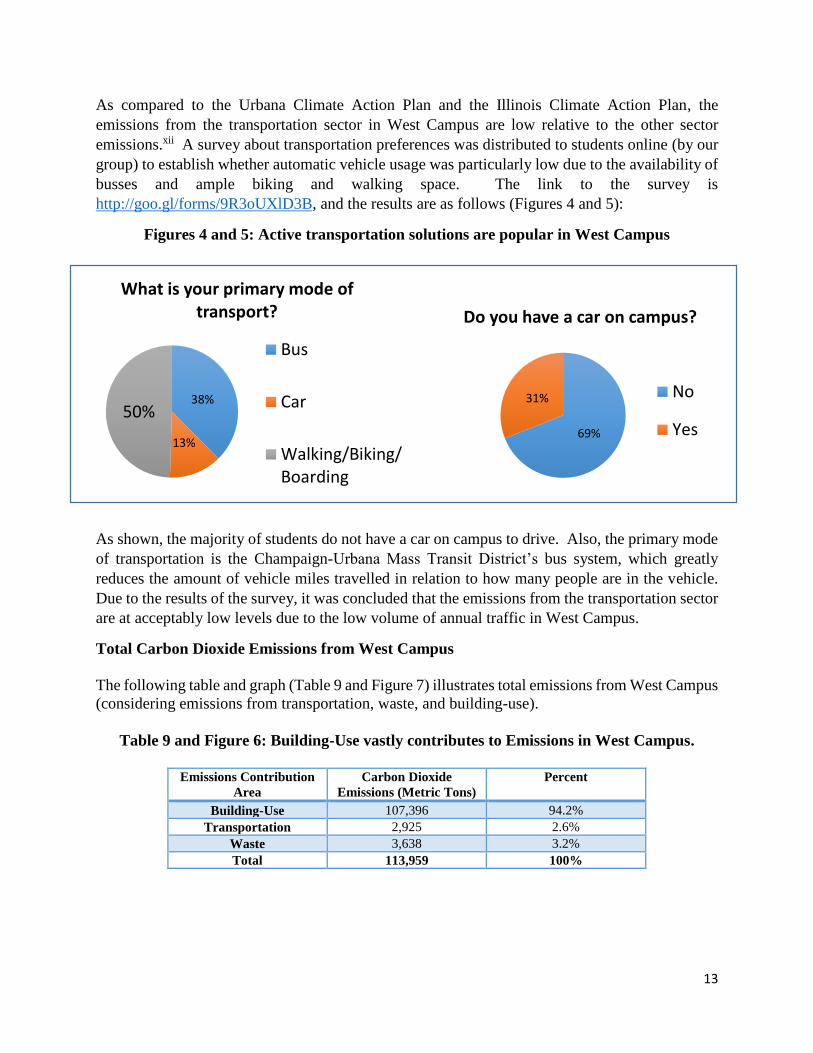
Total Carbon Dioxide Emissions from West Campus
The following table and graph (Table 9 and Figure 7) illustrates total emissions from West Campus
(considering emissions from transportation, waste, and building-use).
Table 9 and Figure 6: Building-Use vastly contributes to Emissions in West Campus.
Emissions Contribution
Area
Carbon Dioxide
Emissions (Metric Tons)
Percent
Building-Use 107,396 94.2%
Transportation 2,925 2.6%
Waste 3,638 3.2%
Total 113,959 100%
38%
13%
50%
What is your primary mode of transport?
Bus
Car
Walking/Biking/Boarding
69%
31%
Do you have a car on campus?
No
Yes

14
Comparisons of Emissions to Relative Geographies
It is important to calculate how the carbon dioxide emissions totals in West Campus compare to
that of other nearby areas. For the purposes of this analysis, the following geographies were
selected to compare the carbon dioxide output of West Campus with: the City of Champaign, the
City of Urbana, Champaign County, and the University of Illinois campus. The estimated carbon
dioxide output of these geographies are as follows:
City of Urbana, IL (2007): 548,700 metric tons of carbon dioxide, per the Urbana Climate
Action Plan.xiii
City of Champaign (2011): 1,227,085 metric tons of carbon dioxide, per Regional Planning
Commission Report.xiv
Champaign County (2010): 4,436,713 metric tons of carbon dioxide, per UP 466 Lab 2
(Spring 2015)
University of Illinois (2013): 390,570 metric tons of carbon dioxide, per Illinois Climate
Action Plan.xv
West Campus (2015): 113,959 metric tons of carbon dioxide, per analysis presented above
These carbon dioxide emission totals were then compared to the populations and/or enrollment
counts of the above geographies for the years measured. These counts are as follows:
City of Urbana, IL 2007 population, per US Census Bureau: 39,225
City of Champaign, IL 2011 population, per US Census Bureau: 81,887
Champaign County 2010 population, per US Census Bureau: 201,416
University of Illinois 2013 enrollment, per the University’s website: 43,398
*Note, enrollment count does not consider faculty and staff, but this error is
minimized by the fact that not all students are present on campus every day (or all
day)
West Campus 2015 population, as estimated above: 8,146
Based on the above data, the following per capita emissions were calculated for each of the
analyzed geographies.
94%
3%
3%
Contributions to Carbon Dioxide Emissions in West Campus
Buildings
Transportation
Waste
15
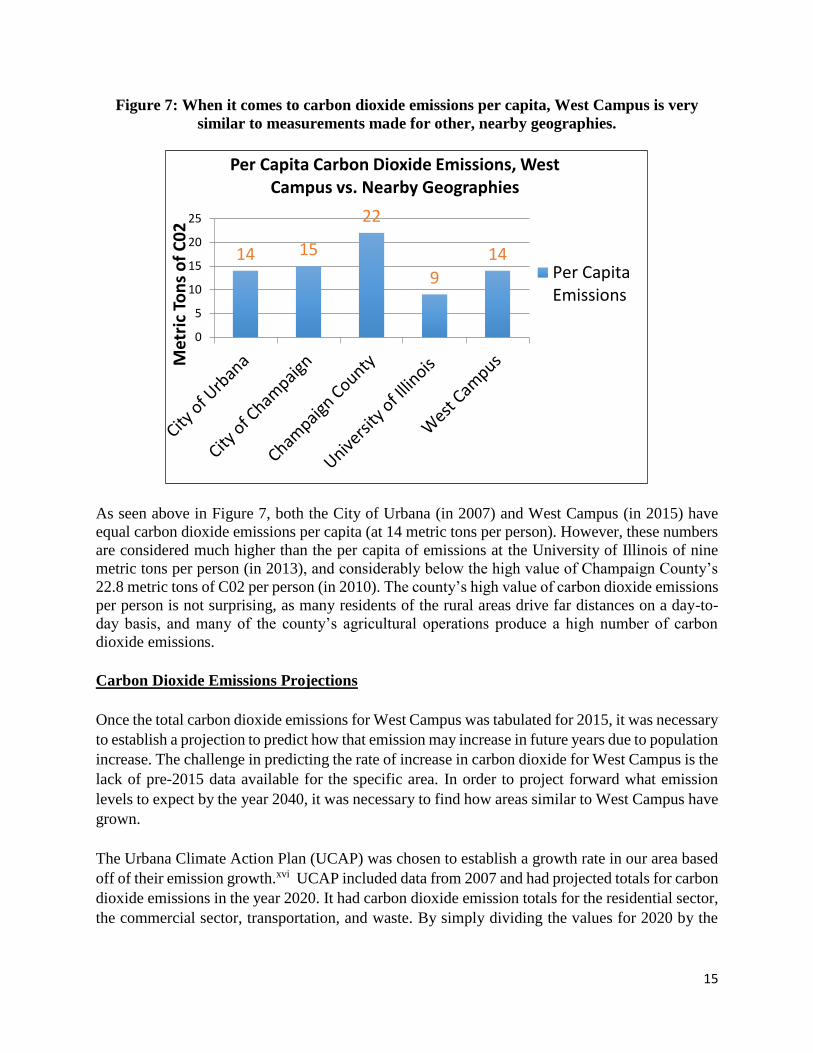
Figure 7: When it comes to carbon dioxide emissions per capita, West Campus is very
similar to measurements made for other, nearby geographies.
As seen above in Figure 7, both the City of Urbana (in 2007) and West Campus (in 2015) have
equal carbon dioxide emissions per capita (at 14 metric tons per person). However, these numbers
are considered much higher than the per capita of emissions at the University of Illinois of nine
metric tons per person (in 2013), and considerably below the high value of Champaign County’s
22.8 metric tons of C02 per person (in 2010). The county’s high value of carbon dioxide emissions
per person is not surprising, as many residents of the rural areas drive far distances on a day-to-
day basis, and many of the county’s agricultural operations produce a high number of carbon
dioxide emissions.
Carbon Dioxide Emissions Projections
Once the total carbon dioxide emissions for West Campus was tabulated for 2015, it was necessary
to establish a projection to predict how that emission may increase in future years due to population
increase. The challenge in predicting the rate of increase in carbon dioxide for West Campus is the
lack of pre-2015 data available for the specific area. In order to project forward what emission
levels to expect by the year 2040, it was necessary to find how areas similar to West Campus have
grown.
The Urbana Climate Action Plan (UCAP) was chosen to establish a growth rate in our area based
off of their emission growth.xvi UCAP included data from 2007 and had projected totals for carbon
dioxide emissions in the year 2020. It had carbon dioxide emission totals for the residential sector,
the commercial sector, transportation, and waste. By simply dividing the values for 2020 by the
14 15
22
9
14
0
5
10
15
20
25
Met
ric
Ton
s o
f C
02
Per Capita Carbon Dioxide Emissions, West Campus vs. Nearby Geographies
Per CapitaEmissions
16
values in 2007, a rough multiplier for each sector shows the rough 15-year growth for carbon
dioxide emissions. Shown below in Table 10 are the multiplication factors for each sector:
Table 10: Carbon Dioxide Emission factors based on the Urbana Climate Action Plan.
UCAP did not include the institutional sector, so the growth factor for the commercial sector was
used. To simulate population growth from 2007 to 2015, each sector’s emissions from West
Campus were divided by the corresponding multiplier. To simulate growth from 2000 to 2007,
each sector’s emissions from 2007 were divided by the square root of each multiplier. Similarly,
to project future emissions, each sector was multiplied by the corresponding factor to produce
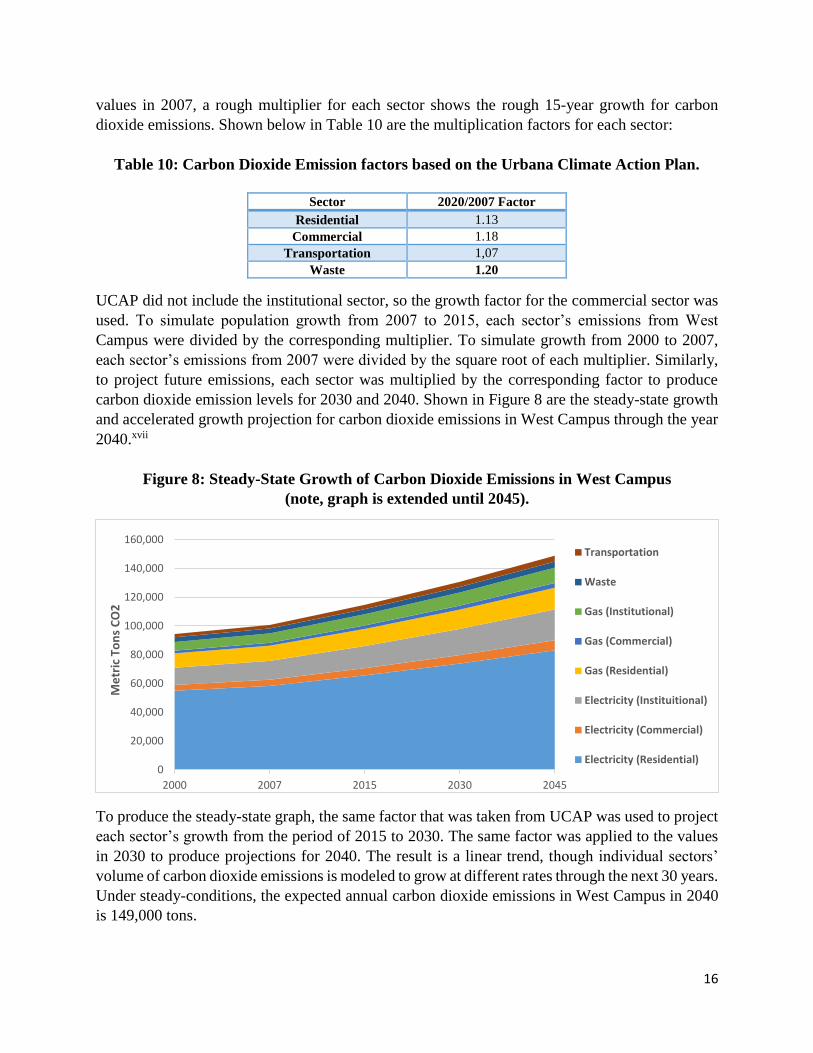
carbon dioxide emission levels for 2030 and 2040. Shown in Figure 8 are the steady-state growth
and accelerated growth projection for carbon dioxide emissions in West Campus through the year
2040.xvii
Figure 8: Steady-State Growth of Carbon Dioxide Emissions in West Campus
(note, graph is extended until 2045).
To produce the steady-state graph, the same factor that was taken from UCAP was used to project
each sector’s growth from the period of 2015 to 2030. The same factor was applied to the values
in 2030 to produce projections for 2040. The result is a linear trend, though individual sectors’
volume of carbon dioxide emissions is modeled to grow at different rates through the next 30 years.
Under steady-conditions, the expected annual carbon dioxide emissions in West Campus in 2040
is 149,000 tons.
0
20,000
40,000
60,000
80,000
100,000
120,000
140,000
160,000
2000 2007 2015 2030 2045
Me
tric
To
ns
CO
2
Transportation
Waste
Gas (Institutional)
Gas (Commercial)
Gas (Residential)
Electricity (Instituitional)
Electricity (Commercial)
Electricity (Residential)
Sector 2020/2007 Factor
Residential 1.13
Commercial 1.18
Transportation 1,07
Waste 1.20
17
Figure 9: Accelerated Growth of Carbon Dioxide Emissions in West Campus
(note, graph is extended until 2045).
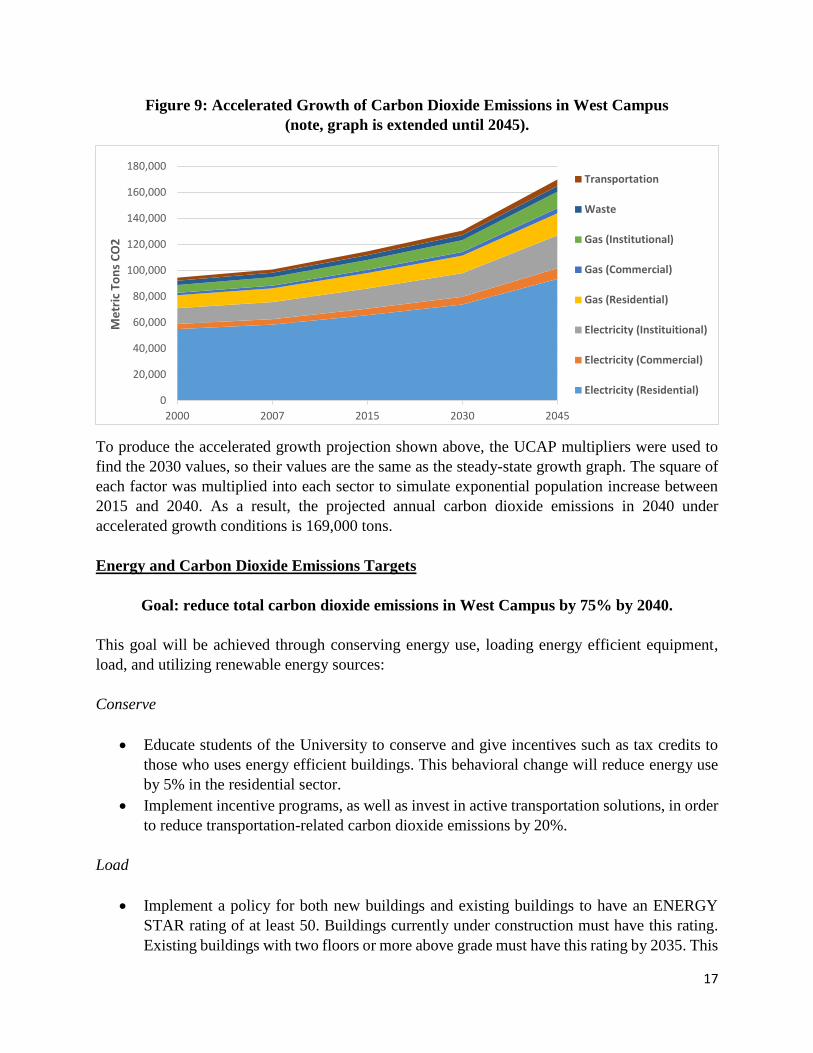
To produce the accelerated growth projection shown above, the UCAP multipliers were used to
find the 2030 values, so their values are the same as the steady-state growth graph. The square of
each factor was multiplied into each sector to simulate exponential population increase between
2015 and 2040. As a result, the projected annual carbon dioxide emissions in 2040 under
accelerated growth conditions is 169,000 tons.
Energy and Carbon Dioxide Emissions Targets
Goal: reduce total carbon dioxide emissions in West Campus by 75% by 2040.
This goal will be achieved through conserving energy use, loading energy efficient equipment,
load, and utilizing renewable energy sources:
Conserve
Educate students of the University to conserve and give incentives such as tax credits to
those who uses energy efficient buildings. This behavioral change will reduce energy use
by 5% in the residential sector.
Implement incentive programs, as well as invest in active transportation solutions, in order
to reduce transportation-related carbon dioxide emissions by 20%.
Load
Implement a policy for both new buildings and existing buildings to have an ENERGY
STAR rating of at least 50. Buildings currently under construction must have this rating.
Existing buildings with two floors or more above grade must have this rating by 2035. This
0
20,000
40,000
60,000
80,000
100,000
120,000
140,000
160,000
180,000
2000 2007 2015 2030 2045
Me
tric
To
ns
CO
2
Transportation
Waste
Gas (Institutional)
Gas (Commercial)
Gas (Residential)
Electricity (Instituitional)
Electricity (Commercial)
Electricity (Residential)
18
will reduce consumption by 27% in residential sector, 34% in institutional sector, and 40%
in commercial sector.
Institutional buildings will be retrofitted to have zoned heating by 2035, which will reduce
carbon dioxide emissions related to the institutional sector by 3%.
Renewable Energy
Use solar photovoltaic panels on all roofs of existing buildings in West Campus. This will
reduce total carbon dioxide emissions by 6%.
Install a geothermal power plant in the University of Illinois’s Research Farms to reduce
total emissions by 37%.
Strategies for Energy and Emission Reductions
Conserve
Education and Incentives: The first step to reducing energy consumption is to educate the
students of the University to conserve their energy usage. Most of the residential buildings in West
Campus are apartments, dormitories, and fraternity houses. This means that students of the
University are the target audience to educate about consumption reduction (particularly when it
comes to their homes). In addition, incentives will be added such as giving tax credits to the
residents living in energy efficient houses. Energy metering will be added to each household to
track their daily energy usage. The residents will have access to these meters and can monitor if
they are eligible for tax credits. This will reduce residential emissions by 5%.
Transportation Policy: Reducing transportation-related carbon dioxide emissions by 20% (or to
585 metric tons of carbon dioxide) is an important goal, although West Camus already enjoys a
high rate of transit-use, bicycle ridership, and walking. There still exists opportunities to reduce
the level of carbon dioxide emissions produced by the use of automobiles. One community that
may be the most important target of such an initiative is the faculty and staff that drive through
West Campus on their way to the University (and who often park in the several parking lots located
in West Campus). Indeed, it was observed during site-research at David Kinley Hall (which is
located just east of West Campus), that the vast majority of its faculty and staff members still drive
to campus. In order to reduce the emissions produced through automobile use in the community,
several initiatives can be attempted. These are as follows:
Providing incentives (either financial, or in terms of recognition) for faculty and staff that
carpool to campus.
Increasing transit accessibility in southwest Champaign and southeast Urbana (as well as
to-and-from Mahomet and St. Joseph), where many faculty and staff live, to the West
Campus area.
If 300 additional faculty/staff members were to be divided into 100 cars (or three employees per
car), with two rides a day averaging six miles, this would save 368 metric tons of carbon dioxide.
19
Furthermore, if an additional 100 faculty/staff members were to take the same trip via public
transit, this would reduce emissions in West Campus by a further 166 metric tons of carbon dioxide
(saving 66% of our goal for the transportation sector).
Meanwhile, the remaining 34% of our reduction goal, or 6.9% of West Campus’s transportation-
related carbon dioxide emissions, could be achieved through enhancing alternative transportation
solutions within West Campus. These solutions include:
Promoting education regarding the health and environmental benefits of bicycling and
walking.
Organizing a “bike to class day” event on “bike to work day.”
Increasing the number of delineated bicycle lanes present.
Expanding bicycle parking facilities.
Load
ENERGY STAR Rating of 50: Most appliances in the buildings in West Campus are not energy
efficient. These appliances consume relatively more energy than other appliances rated ENERGY
STAR. Below (Table 11) is a table of the EUIs in the United States as achieved through ENERGY
STAR. The median value, a rating of 50, is the middle value of the national population. By
comparing with the current EUI values in West Campus and the Site EUI values provided by Table
11, the percentage reduction in consumption can be calculated.
(Space Skipped Intentionally)
20
Table 11: US National Median EUI Reference Values for
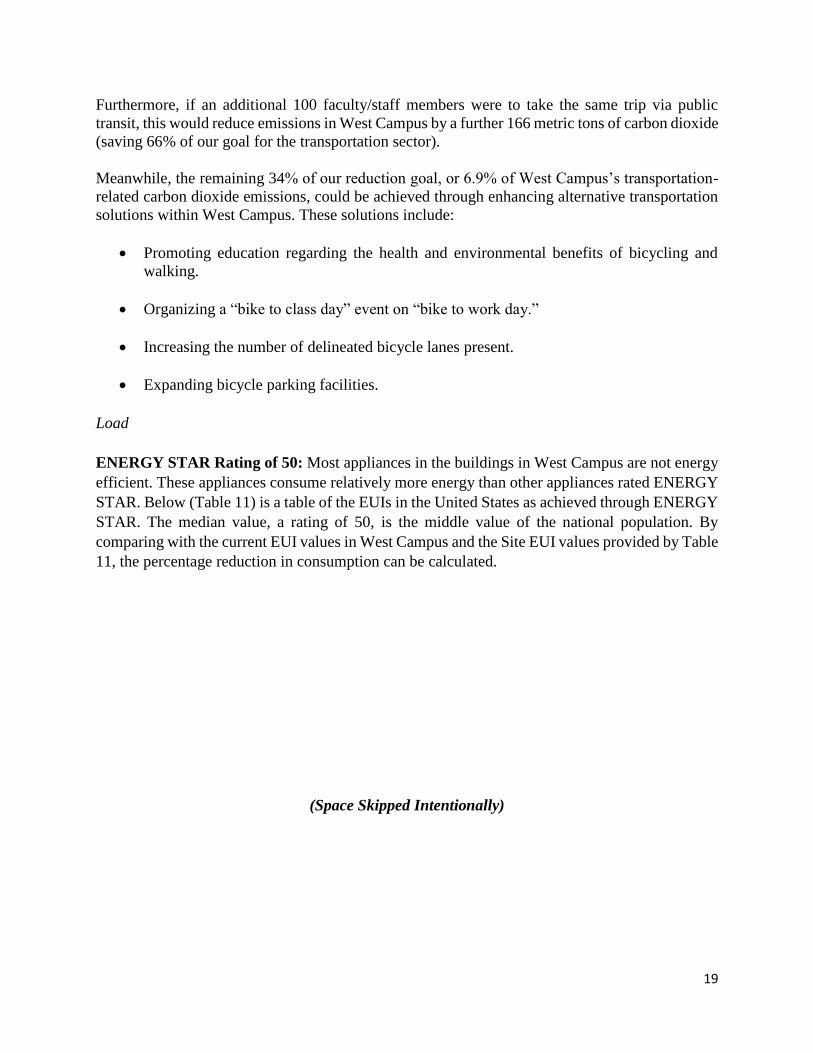
All Portfolio Manager Property Typesxviii
As seen below in Table 12, the ENERGY STAR EUI used for the residential sector will be 78.8
kilo-BTUs per square foot, for the institutional sector it will be 67.3 kilo-BTUs per square foot,
and for the commercial sector it will be 47.1 kilo-BTUs per square foot. These ENERGY STAR
EUIs are compared to the standard EUIs provided by the EIA in Table 12.
Table 12: Consumption Reduction after ENERGY STAR Rating of 50
A policy for both new buildings and existing buildings will be added to implement ENERGY
STAR. New buildings must be designed to have at least ENERGY STAR rating of 50. Existing
buildings must be retrofitted by 2035 to have at least ENERGY STAR rating of 50. Note that this
policy applies to buildings with two or more floors above grade.
Zoned heating: Implement zone heating for all institutional buildings in West Campus by 2035.
Because most institutional buildings have multiple floors, zoned heating is helpful to only heat up
specific zones (and floors) that require an increase in temperature instead of heating up the entire
building. By using a basic model in eQUEST (the out puts of which are seen in Tables 13 and 14),
Sector Current EUI
(kBTU/square foot)
ENERGY STAR EUI
(kBTU/square foot)
Consumption Reduction
Residential 107.59 78.80 27%
Institutional 102.38 67.30 34%
Commercial 81.06 47.10 40%

21
estimation in the impact of zoned heating can be made. The following shows a 10% reduction in
gas consumption in institutional buildings. This is approximated to a 3% consumption reduction
in the institutional sector.
Table 13: Gas Consumption without Zone Heating, per eQUEST
Table 14: Gas Consumption with Zone Heating, per eQUEST
Renewable Energy
Solar PV: Implement standard solar photovoltaic panels on the roofs of all buildings and public
parking lots in West Campus by 2020. First, the total rooftop area of the buildings are calculated
by adding the total square foot per floor (highest floor if there are multiple floors) of each building.
Next, the total public parking lot areas are calculated.
The electricity output for industrial buildings is calculated by using Google Earth to measure the
rooftop areas. A safety factor of 0.85 is multiplied to the rooftop areas to accommodate for rooftop
units and other machinery where solar panels cannot be installed. These rooftop areas are separated
into the directions that they face: north, east, south, and west and further split into pitched roofs or
flat roofs. Pitched roofs require about 100 square feet per kilowatt, where flat roofs require about
200 square feet per kilowatt. Parking lots are expected to have flat solar panels installed. These
values are inputted into PVWatts to estimate the electricity output for institutional buildings.xix

22
Assuming the rooftop designs are similar for institutional buildings and for all buildings in the
West Campus, this electricity output for institutional buildings is scaled to the rooftop areas for all
buildings in West Campus. Finally, the electricity output of the solar panels will be converted into
carbon dioxide emissions saved using the EPA’s greenhouse gas equivalencies calculator.xx
Table 15: PV panels can significantly contribute to reduced
carbon dioxide emissions in West Campus.
By installing solar panels on all buildings in West Campus, 7,500 Metric Tons of carbon dioxide
emissions can be saved.
Map 5: Location of Different Types of Solar Panels
on Buildings in West Campus
Rooftop Areas of
Institutional Buildings
Carbon Dioxide
Emissions Saved from
Institutional Buildings
Rooftop Areas of All
Buildings in West
Campus
Carbon Dioxide
Emissions Saved from
All Buildings in West
Campus
379,400 sq. ft. 1,550 Metric Tons 1,840,000 sq. ft. 7,500 Metric Tons
23
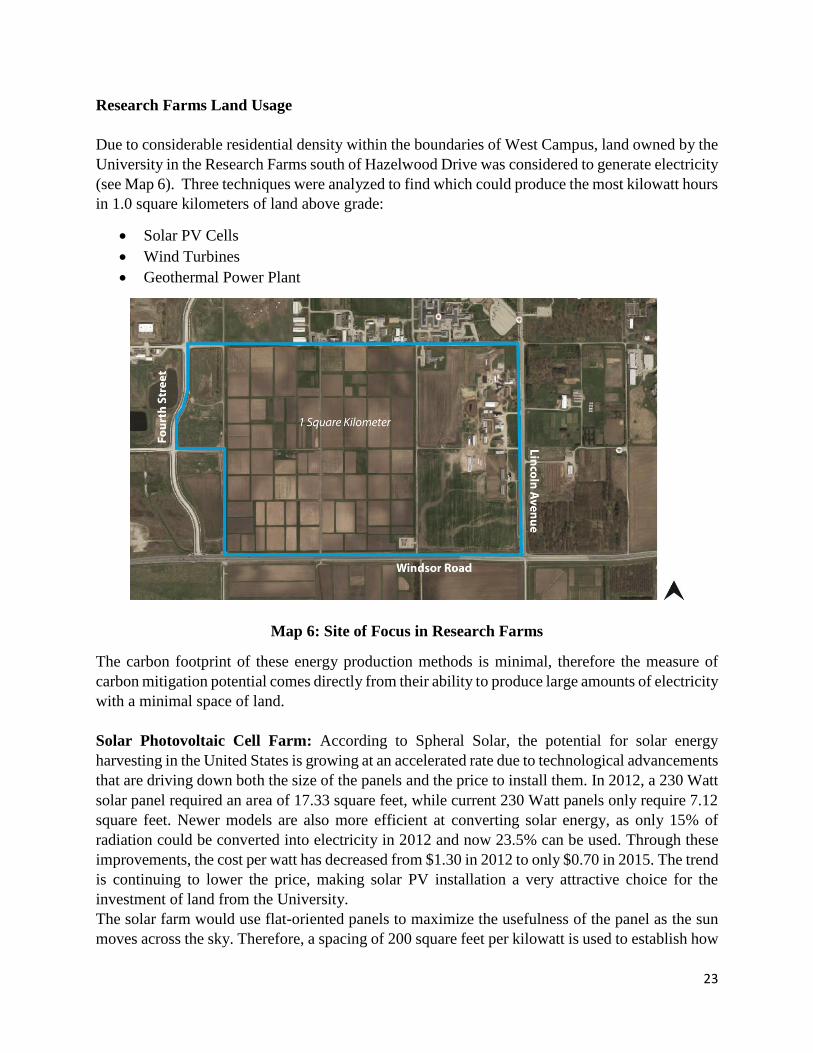
Research Farms Land Usage
Due to considerable residential density within the boundaries of West Campus, land owned by the
University in the Research Farms south of Hazelwood Drive was considered to generate electricity
(see Map 6). Three techniques were analyzed to find which could produce the most kilowatt hours
in 1.0 square kilometers of land above grade:
Solar PV Cells
Wind Turbines
Geothermal Power Plant
Map 6: Site of Focus in Research Farms
The carbon footprint of these energy production methods is minimal, therefore the measure of
carbon mitigation potential comes directly from their ability to produce large amounts of electricity
with a minimal space of land.
Solar Photovoltaic Cell Farm: According to Spheral Solar, the potential for solar energy
harvesting in the United States is growing at an accelerated rate due to technological advancements
that are driving down both the size of the panels and the price to install them. In 2012, a 230 Watt
solar panel required an area of 17.33 square feet, while current 230 Watt panels only require 7.12
square feet. Newer models are also more efficient at converting solar energy, as only 15% of
radiation could be converted into electricity in 2012 and now 23.5% can be used. Through these
improvements, the cost per watt has decreased from $1.30 in 2012 to only $0.70 in 2015. The trend
is continuing to lower the price, making solar PV installation a very attractive choice for the
investment of land from the University.
The solar farm would use flat-oriented panels to maximize the usefulness of the panel as the sun
moves across the sky. Therefore, a spacing of 200 square feet per kilowatt is used to establish how
24
many kilowatts can be expected from a certain land area. Using 1.0 square kilometer (or
10,100,000 square feet), the maximum kilowatts load that the farm could theoretically handle is
54,000 kilowatts, or 54 Megawatts
In the Midwest, the sun is down for roughly 12 hours a night, and daytime skies can range from
sunny to cloudy with precipitation throughout the entire year. The solar intensity also decreases in
the winter months, affecting the potential for solar cells to produce kilowatt hours at peak
efficiency. The geographic information was uploaded into PVWatts online, and inputting the 54
Megawatt load returned a maximum kilowatt-hour expectation of 65.4 million kilowatt-hours for
a Midwestern solar farm. This kilowatt-hour value will be rated against the other energy sources’
potential to produce kilowatt-hours.
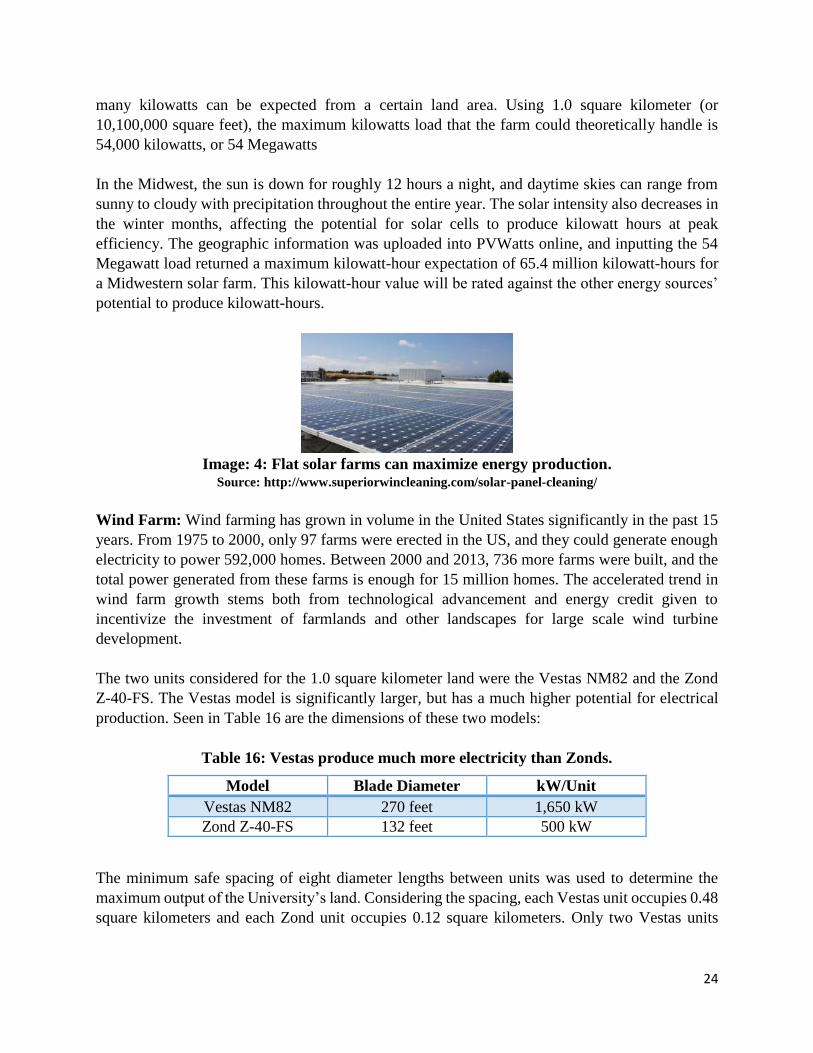
Image: 4: Flat solar farms can maximize energy production.
Source: http://www.superiorwincleaning.com/solar-panel-cleaning/
Wind Farm: Wind farming has grown in volume in the United States significantly in the past 15
years. From 1975 to 2000, only 97 farms were erected in the US, and they could generate enough
electricity to power 592,000 homes. Between 2000 and 2013, 736 more farms were built, and the
total power generated from these farms is enough for 15 million homes. The accelerated trend in
wind farm growth stems both from technological advancement and energy credit given to
incentivize the investment of farmlands and other landscapes for large scale wind turbine
development.
The two units considered for the 1.0 square kilometer land were the Vestas NM82 and the Zond
Z-40-FS. The Vestas model is significantly larger, but has a much higher potential for electrical
production. Seen in Table 16 are the dimensions of these two models:
Table 16: Vestas produce much more electricity than Zonds.
The minimum safe spacing of eight diameter lengths between units was used to determine the
maximum output of the University’s land. Considering the spacing, each Vestas unit occupies 0.48
square kilometers and each Zond unit occupies 0.12 square kilometers. Only two Vestas units
Model Blade Diameter kW/Unit
Vestas NM82 270 feet 1,650 kW
Zond Z-40-FS 132 feet 500 kW
25
could fit on the 1.0 square kilometer plot, while eight Zond units could fit. This equates to 3.3
Megawatts potential from the Vestas units and four Megawatt potential from the Zond unit.
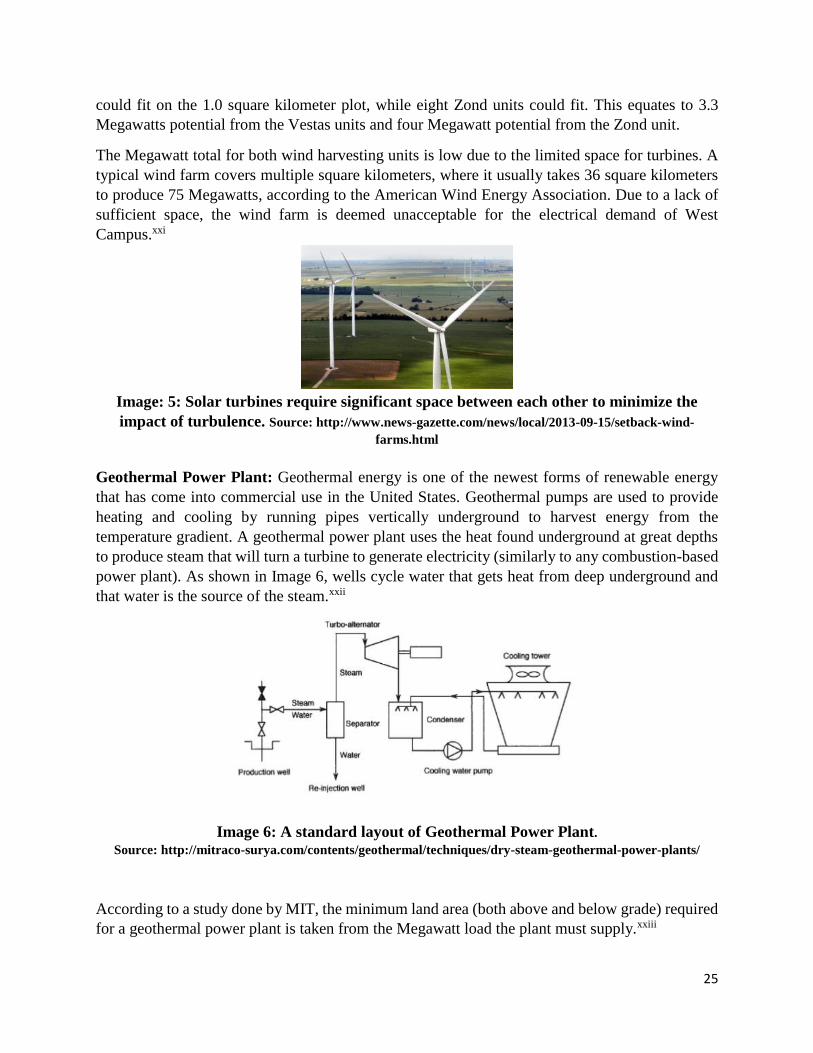
The Megawatt total for both wind harvesting units is low due to the limited space for turbines. A
typical wind farm covers multiple square kilometers, where it usually takes 36 square kilometers
to produce 75 Megawatts, according to the American Wind Energy Association. Due to a lack of
sufficient space, the wind farm is deemed unacceptable for the electrical demand of West
Campus.xxi
Image: 5: Solar turbines require significant space between each other to minimize the
impact of turbulence. Source: http://www.news-gazette.com/news/local/2013-09-15/setback-wind-
farms.html
Geothermal Power Plant: Geothermal energy is one of the newest forms of renewable energy
that has come into commercial use in the United States. Geothermal pumps are used to provide
heating and cooling by running pipes vertically underground to harvest energy from the
temperature gradient. A geothermal power plant uses the heat found underground at great depths
to produce steam that will turn a turbine to generate electricity (similarly to any combustion-based
power plant). As shown in Image 6, wells cycle water that gets heat from deep underground and
that water is the source of the steam.xxii
Image 6: A standard layout of Geothermal Power Plant.
Source: http://mitraco-surya.com/contents/geothermal/techniques/dry-steam-geothermal-power-plants/
According to a study done by MIT, the minimum land area (both above and below grade) required
for a geothermal power plant is taken from the Megawatt load the plant must supply.xxiii
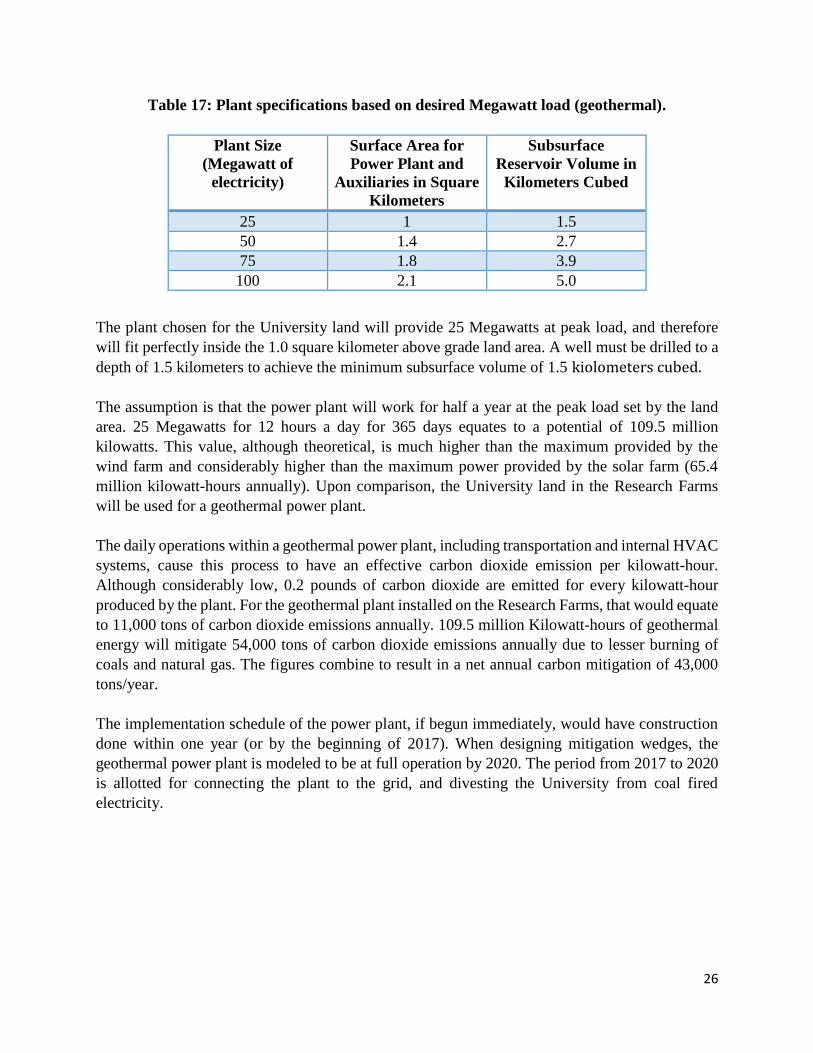
26
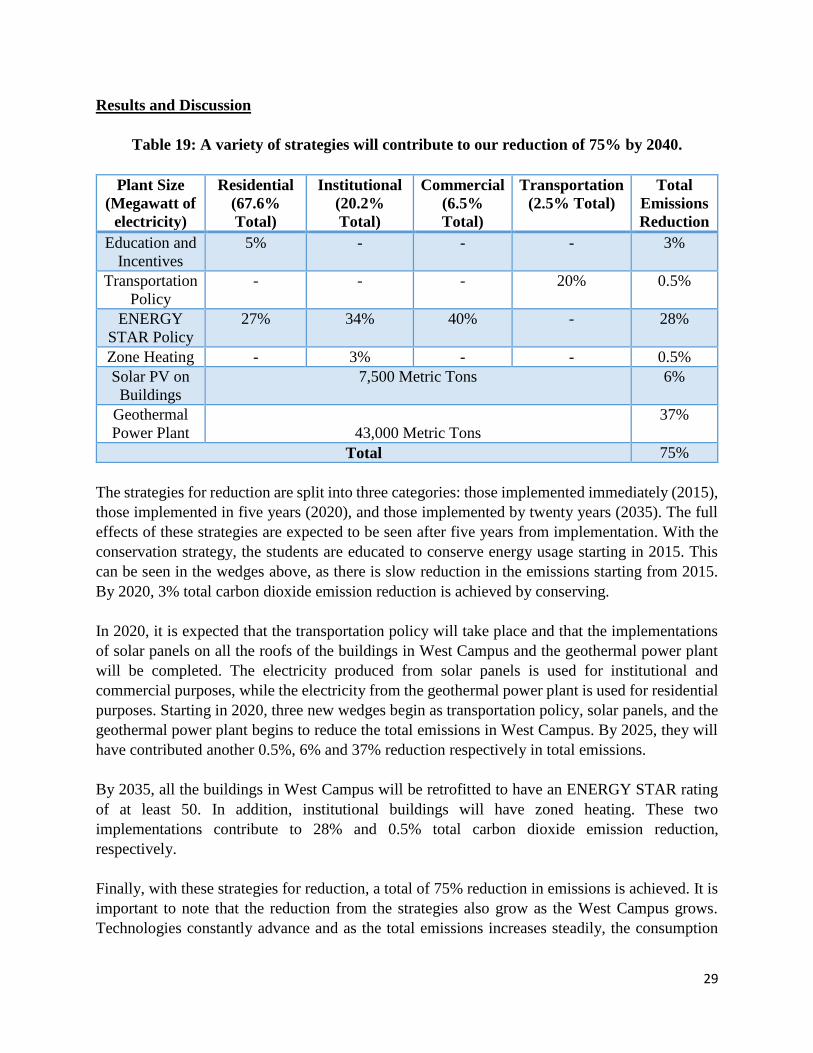
Table 17: Plant specifications based on desired Megawatt load (geothermal).
The plant chosen for the University land will provide 25 Megawatts at peak load, and therefore
will fit perfectly inside the 1.0 square kilometer above grade land area. A well must be drilled to a
depth of 1.5 kilometers to achieve the minimum subsurface volume of 1.5 kiolometers cubed.
The assumption is that the power plant will work for half a year at the peak load set by the land
area. 25 Megawatts for 12 hours a day for 365 days equates to a potential of 109.5 million
kilowatts. This value, although theoretical, is much higher than the maximum provided by the
wind farm and considerably higher than the maximum power provided by the solar farm (65.4
million kilowatt-hours annually). Upon comparison, the University land in the Research Farms
will be used for a geothermal power plant.
The daily operations within a geothermal power plant, including transportation and internal HVAC
systems, cause this process to have an effective carbon dioxide emission per kilowatt-hour.
Although considerably low, 0.2 pounds of carbon dioxide are emitted for every kilowatt-hour
produced by the plant. For the geothermal plant installed on the Research Farms, that would equate
to 11,000 tons of carbon dioxide emissions annually. 109.5 million Kilowatt-hours of geothermal
energy will mitigate 54,000 tons of carbon dioxide emissions annually due to lesser burning of
coals and natural gas. The figures combine to result in a net annual carbon mitigation of 43,000
tons/year.
The implementation schedule of the power plant, if begun immediately, would have construction
done within one year (or by the beginning of 2017). When designing mitigation wedges, the
geothermal power plant is modeled to be at full operation by 2020. The period from 2017 to 2020
is allotted for connecting the plant to the grid, and divesting the University from coal fired
electricity.
Plant Size
(Megawatt of
electricity)
Surface Area for
Power Plant and
Auxiliaries in Square
Kilometers
Subsurface
Reservoir Volume in
Kilometers Cubed
25 1 1.5
50 1.4 2.7
75 1.8 3.9
100 2.1 5.0

27
Mitigation Wedges
Shown below is the steady state projection of carbon dioxide emissions in West Campus from the
year 2015 to 2040 before the application of the mitigation strategies. The expected carbon dioxide
emission rate in 2040 without intervention is 149,000 tons.
Figure 10: West Campus is expected to grow significantly at current rates
(note, graph is extended until 2045).
After the application of the renewable energy, education and incentives, building retro-
commissioning, and policy adjustments, the lowering of carbon dioxide emissions can be seen in
the Table below. It is important to note that electrical emissions are seen is yellow, gas emissions
are seen in blue, transportation emissions are seen in forest green, and waste emissions are in grey.
The remaining portions of the graph depict carbon mitigation and a reduction in emissions. The
chart below shows the schedule of implementation of each mitigation strategy.
Table 18: Implementation of our suggested strategies will run through 2035.
Strategy Implemented By Sectors Affected
Education and Incentives 2015 Residential
Transportation Policy 2020 Transportation
Solar PV 2020 Institutional, Commercial
Geothermal Power Plant 2020 Residential
ENERGY STAR Rating of
50 2035
Residential, Institutional,
Commercial
Zone Heating 2035 Institutional
0
20,000
40,000
60,000
80,000
100,000
120,000
140,000
160,000
2015 2020 2025 2030 2035 2040 2045
Me
tric
To
ns
of
CO
2
Transportation
Waste
Gas(Institutional)Gas(Commercial)Gas (Residential)
Electricity(Instituitional)Electricity(Commercial)Electricity(Residential)

28
As shown in the figures below, the mitigation strategies reduce the emissions of each sector over
the course of 30 years to reach the cumulative 75% reduction by 2040. To visualize the mitigation
wedges growth, the emissions in the second figure have been grayed out.
The abbreviations shown in the following graph legends are as follows:
IG = Institutional Gas IE = Institutional Electricity
CG = Commercial Gas CG = Commercial Electricity
RG = Residential Gas RE = Residential Electricity
Figures 11 and 12: A 75% reduction in carbon dioxide emissions in West Campus
by 2040 is a realistic expectation (note, graph is extended until 2045).
0
20,000
40,000
60,000
80,000
100,000
120,000
140,000
160,000
2015 2020 2025 2030 2035 2040 2045
Me
tric
To
ns
of
CO
2
Zone HeatingEnergyStar IGEnergyStar CGEnergyStar RGEnergyStar IEEnergyStar CEEnergyStar REGeothermal RESolar PV C/I ETransportationConserve RGConserve RETransportationWasteGas (Institutional)Gas (Commercial)Gas (Residential)Electricity (Instituitional)Electricity (Commercial)Electricity (Residential)
0
20,000
40,000
60,000
80,000
100,000
120,000
140,000
160,000
2015 2020 2025 2030 2035 2040 2045
Me
tric
To
ns
of
CO
2
Zone Heating
EnergyStar IG
EnergyStar CG
EnergyStar RG
EnergyStar IE
EnergyStar CE
EnergyStar RE
Geothermal RE
Solar PV C/I E
Transportation
Conserve RG
Conserve RE
Emissions
29
Results and Discussion
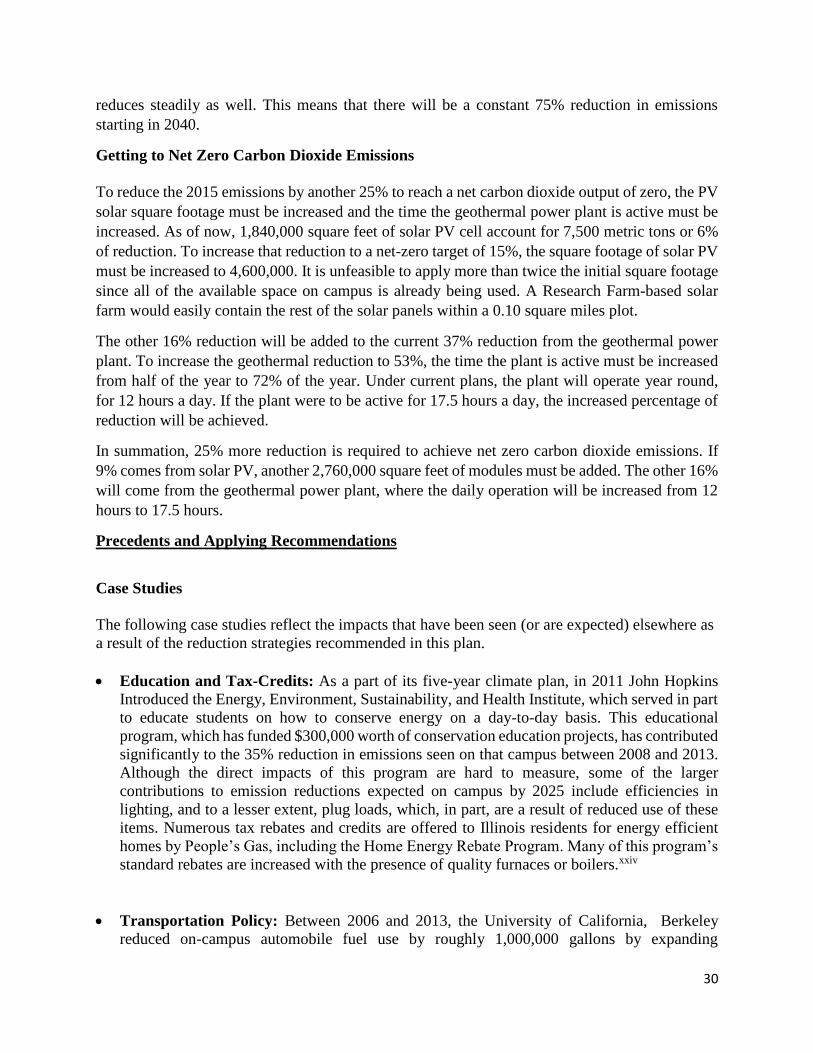
Table 19: A variety of strategies will contribute to our reduction of 75% by 2040.
The strategies for reduction are split into three categories: those implemented immediately (2015),
those implemented in five years (2020), and those implemented by twenty years (2035). The full
effects of these strategies are expected to be seen after five years from implementation. With the
conservation strategy, the students are educated to conserve energy usage starting in 2015. This
can be seen in the wedges above, as there is slow reduction in the emissions starting from 2015.
By 2020, 3% total carbon dioxide emission reduction is achieved by conserving.
In 2020, it is expected that the transportation policy will take place and that the implementations
of solar panels on all the roofs of the buildings in West Campus and the geothermal power plant
will be completed. The electricity produced from solar panels is used for institutional and
commercial purposes, while the electricity from the geothermal power plant is used for residential
purposes. Starting in 2020, three new wedges begin as transportation policy, solar panels, and the
geothermal power plant begins to reduce the total emissions in West Campus. By 2025, they will
have contributed another 0.5%, 6% and 37% reduction respectively in total emissions.
By 2035, all the buildings in West Campus will be retrofitted to have an ENERGY STAR rating
of at least 50. In addition, institutional buildings will have zoned heating. These two
implementations contribute to 28% and 0.5% total carbon dioxide emission reduction,
respectively.
Finally, with these strategies for reduction, a total of 75% reduction in emissions is achieved. It is
important to note that the reduction from the strategies also grow as the West Campus grows.
Technologies constantly advance and as the total emissions increases steadily, the consumption
Plant Size
(Megawatt of
electricity)
Residential
(67.6%
Total)
Institutional
(20.2%
Total)
Commercial
(6.5%
Total)
Transportation
(2.5% Total)
Total
Emissions
Reduction
Education and
Incentives
5% - - - 3%
Transportation
Policy
- - - 20% 0.5%
ENERGY
STAR Policy
27% 34% 40% - 28%
Zone Heating - 3% - - 0.5%
Solar PV on
Buildings
7,500 Metric Tons 6%
Geothermal
Power Plant
43,000 Metric Tons
37%
Total 75%
30
reduces steadily as well. This means that there will be a constant 75% reduction in emissions
starting in 2040.
Getting to Net Zero Carbon Dioxide Emissions
To reduce the 2015 emissions by another 25% to reach a net carbon dioxide output of zero, the PV
solar square footage must be increased and the time the geothermal power plant is active must be
increased. As of now, 1,840,000 square feet of solar PV cell account for 7,500 metric tons or 6%
of reduction. To increase that reduction to a net-zero target of 15%, the square footage of solar PV
must be increased to 4,600,000. It is unfeasible to apply more than twice the initial square footage
since all of the available space on campus is already being used. A Research Farm-based solar
farm would easily contain the rest of the solar panels within a 0.10 square miles plot.
The other 16% reduction will be added to the current 37% reduction from the geothermal power
plant. To increase the geothermal reduction to 53%, the time the plant is active must be increased
from half of the year to 72% of the year. Under current plans, the plant will operate year round,
for 12 hours a day. If the plant were to be active for 17.5 hours a day, the increased percentage of
reduction will be achieved.
In summation, 25% more reduction is required to achieve net zero carbon dioxide emissions. If
9% comes from solar PV, another 2,760,000 square feet of modules must be added. The other 16%
will come from the geothermal power plant, where the daily operation will be increased from 12
hours to 17.5 hours.
Precedents and Applying Recommendations
Case Studies
The following case studies reflect the impacts that have been seen (or are expected) elsewhere as
a result of the reduction strategies recommended in this plan.
Education and Tax-Credits: As a part of its five-year climate plan, in 2011 John Hopkins
Introduced the Energy, Environment, Sustainability, and Health Institute, which served in part
to educate students on how to conserve energy on a day-to-day basis. This educational
program, which has funded $300,000 worth of conservation education projects, has contributed
significantly to the 35% reduction in emissions seen on that campus between 2008 and 2013.
Although the direct impacts of this program are hard to measure, some of the larger
contributions to emission reductions expected on campus by 2025 include efficiencies in
lighting, and to a lesser extent, plug loads, which, in part, are a result of reduced use of these
items. Numerous tax rebates and credits are offered to Illinois residents for energy efficient
homes by People’s Gas, including the Home Energy Rebate Program. Many of this program’s
standard rebates are increased with the presence of quality furnaces or boilers.xxiv
Transportation Policy: Between 2006 and 2013, the University of California, Berkeley
reduced on-campus automobile fuel use by roughly 1,000,000 gallons by expanding
31
accessibility and mobility for pedestrians and bicyclists, as well as by enhancing public transit
access for students. In 2013, roughly 10% less students commuted via automobile than in
1990.xxv
ENERGY STAR Requirement: The City of Fort Collins, CO has integrated a variety of
ENERGY STAR criteria into its building code, with various scores for differing uses/design
styles required before a Certificate of Occupancy can be issued. These steps are aimed at
producing a 40% reduction in emissions by 2030.xxvi
Zoned Heating: Multi-family buildings in New York City have seen a reduction of 18% in
fuel costs when updating from single-zone to multi-zone heating schemes, while the City of
Seattle will provide financial assistance to homeowners utilizing multi-zone heating systems.
On average, this incentive helps to reduce heating efficiency losses by 15-20%.xxvii
Solar Farm (alternative): The Lawrenceville School Solar Farm, located in New Jersey and
established in 2011, is nearly 30 acres large and produces roughly 6.1 megawatts, covering
90% of the school’s need. It offsets almost 6,388 metric tons of carbon dioxide a year.xxviii
Wind Farm (alternative): Fort Hays State University, in Hays, Kansas, is in the process of
constructing two 400 foot tall Vesta wind turbines. These turbines will cover almost 97% of
the school’s electricity need, and will save the University roughly $600,000 to $1,000,000 in
energy costs annually.xxix
Geothermal Plant: The Missouri University of Science and Technology, located in Rolla,
MO, is constructing a geothermal power plant that will provide the University with 50% of its
energy needs, and reduce the campus’s carbon footprint by roughly 25,000 metric tons a year.
It will also reduce the campus’s water usage by roughly 10%.xxx
Resources for Application and Political Interference
A variety of resources will be required to implement the proposed emission mitigation schemes
for West Campus. Any building-related program, particularly the requirement of an Energy Star
Rating of 50, the retrofitting of institutional properties, and the offering of financial incentives for
energy efficient designs/retrofits, will require funding raised at the municipal or state level, as well
as the cooperation (and approval) of officials on these levels. Fortunately, the University has
oversight over its own properties, but its jurisdiction does not carry over directly into the core of
the West Campus neighborhood. Any regulations may face opposition from landlords or
developers that balk at the high initial costs of many retrofitting/energy saving schemes.
Consequently, it will be important to advertise to these stakeholders the long-term benefits of our
proposals.
Similarly, university approval, as well as university funding (and consequently, state funding) must
be secured through the expansion of a conservation education program, as well as the utilization
of any space on the Research Farms. Of course, the use of the site proposed would face opposition
from those academic departments that rely on this land at the moment for research, etc., and
alternative land/space may have to be provided for these departments. When it comes to raising

32
public finances, both at the municipal and state level, there is not a very welcoming political
environment for raising tax levies. However, funding can be obtained through other mechanisms,
including the promotion of private-public partnerships, adding minor fees to utility bills, and
reducing spending on initiatives that increase carbon dioxide emissions (including the expansion
of major arterial streets).
One unique conundrum that the West Campus Climate Action Plan faces is the fact that, in order
to obtain resources to realize the recommendations made here, payouts may be requested from
individuals who do not reside, work, or own property in West Campus- creating a possibly
politically contentious atmosphere.
Positive Externalities
In convincing various stakeholders to provide political and financial support for the proposed plan,
the positive externalities of the West Campus Climate Action Plan must be promoted. Such
benefits may include:
The reduction in obesity and traffic facilities gained through reduction in automobile use, as
well as the improvement in air pollution obtained through carbon dioxide emissions (and the
reduction in medical issues related with these emissions).
The cost savings associated with the less-intense levels of maintenance required for new,
energy-star appliances.
Providing local companies, and even students, to explore energy efficiency through studying,
and participating in, the proposed tactics.
Advertising the acclaim the University and Champaign may gain from implementing the
recommended strategies (and utilizing this acclaim to attract developers).
Conclusion
The West Campus Climate Action Plan provides municipal and university leaders with the
opportunity to remake the underlying energy infrastructure for a large part of Campustown by
2040, benefiting the local environment, public health, and providing an unprecedented opportunity
for the students and faculty of the University of Illinois to participate in large-scale sustainability-
related research efforts in their own backyard. However, in order to successfully implement the
recommendations made here, the concerns of stakeholders will need to be addressed on an
individual basis, while at the same time, these stakeholders need to be brought together in a diverse
coalition that can realize the political and financial support required to implement the
recommendations made in the plan.
33
Works cited
i “United States Census Bureau.” Web. Accessed at http://www.census.gov/.
ii Champaign-Urbana Mass Transit District.” Web. Accessed at http://www.cumtd.com/.
iii “Champaign County Bikes.” Web. Accessed at http://www.champaigncountybikes.org/.
iv “Daft Logic.” Web. Accessed at http://www.daftlogic.com/projects-google-maps-area-calculator-tool.htm.
v “Building Type Definitions.” Web. Accessed at http://www.eia.gov/consumption/commercial/building-type-
definitions.cfm#RetailStripMalls.
vi “Table E2A. Major Fuel Consumption (Btu) Intensities by End Use for All Buildings, 2003.” Web. Accessed at
http://www.eia.gov/consumption/commercial/data/2003/pdf/e02a.pdf.
vii “Illinois.” Web. Accessed at http://www.eia.gov/state/?sid=IL.
viii “Utilities and Energy.” Web. Accessed at http://www.fs.illinois.edu/services/utilities-energy.
ix “Greenhouse Gas Equivalencies Calculator.” Web. Accessed at http://www.epa.gov/cleanenergy/energy-
resources/calculator.html.
x “Getting Around Illinois.” Web. Accessed at http://www.gettingaroundillinois.com/gai.htm?mt=dtr.
xi “Daft Logic.” Web. Accessed at http://www.daftlogic.com/projects-google-maps-area-calculator-tool.htm.
xii “Climate Action Plan.” Web. Accessed at http://urbanaillinois.us/terms/climate-action-plan. And “iCAP – A
Climate Action Plan.” Web. Accessed at https://icap.sustainability.illinois.edu/files/project/36/iCAP_FINAL.pdf.
xiii “Climate Action Plan.” Web. Accessed at http://urbanaillinois.us/terms/climate-action-plan.
xiv “City of Champaign Greenhouse Gas Inventory Report.” Web. Accessed at http://ci.champaign.il.us/cms/wp-
content/uploads/2012/04/2010_Champaign_GHG_Inventory.pdf.
xv “iCAP – A Climate Action Plan.” Web. Accessed at
https://icap.sustainability.illinois.edu/files/project/36/iCAP_FINAL.pdf.
xvi “Climate Action Plan.” Web. Accessed at http://urbanaillinois.us/terms/climate-action-plan.
xvii “Climate Action Plan.” Web. Accessed at http://urbanaillinois.us/terms/climate-action-plan.
xviii “U.S. Energy Use Intensity by Property Type.” Web. Accessed at
https://portfoliomanager.energystar.gov/pdf/reference/US%20National%20Median%20Table.pdf.
xix “NREL’s PVWatts Calculator.” Web. Accessed at http://pvwatts.nrel.gov/.
xx “Solar Panel Efficiency Has Come a Long Way (Infographic)” Web. Accessed at
http://cleantechnica.com/2014/02/06/technological-advancements-drove-solar-panel-prices/.
xxi “Renewable Energy.” Web. Accessed at http://leam.faa.illinois.edu/up466/transportation/lab-5-demo/part-i-
renewable-energy/04-renewable-energy-wind-tips.html.
xxii “The future of Geothermal Energy.” Web. Accessed at https://mitei.mit.edu/system/files/geothermal-energy-
full.pdf

34
xxiii “iCAP – A Climate Action Plan.” Web. Accessed at
https://icap.sustainability.illinois.edu/files/project/36/iCAP_FINAL.pdf.
xxiv “John Hopkins University Climate Action Plan- Five year Progress Review.” Web. Accessed at
http://sustainability.jhu.edu/office_of_sustainability/reports_and_publications/Five%20Year%20Review%20Report.
pdf. And “Home Energy Rebate Program.” Web. Accessed at
http://www.peoplesgasdelivery.com/home/rebates_residential.aspx.
xxv “Two Years Early, UC Berkeley Meets its Carbon-Reduction Target.” Web. Accessed at
http://newscenter.berkeley.edu/2013/11/12/two-years-early-uc-berkeley-meets-its-carbon-reduction-target/.
xxvi “Energy Code Compliance.” Web. Accessed at http://www.fcgov.com/building/energy-code.php.
xxvii “Measures to Reduce Heating fuel Consumption.” Web. Accessed at
http://www.edf.org/sites/default/files/10073_EDF_BottomBarrel_Ch5.pdf. And “Ductless Heat Pump- Rebates-
Seattle, WA. Web. Accessed at http://www.lyonsheatingandair.com/REBATES.html.
xxviii “Solar Farm.” Web. Accessed at http://www.lawrenceville.org/about/green-campus-initiative/solar-
farm/index.aspx.
xxix “Wind Energy Project.” Web. Accessed at https://www.fhsu.edu/president/wind-energy/.
xxx “Power Plant Goes Quite as Campus Moves to Geothermal Energy.” Web. Accessed at
http://news.mst.edu/2014/05/power-plant-goes-quiet-as-campus-moves-to-geothermal-energy/.

35
Appendix
Item 1: Breakdown of Task Contribution
Executive Summary (Schwartz)
Table of Contents (Mahalek)
Introduction (Mahalek)
West Campus Ethnographic Discussion (Mahalek)
Carbon Dioxide Emission Inventory and Projections
Building Survey (Mahalek and Schwartz, Survey Initially Completed by All)
Energy and EUI Calculations (Schwartz)
Building Emissions (Mahalek and Schwartz), Electric Grid Emissions Factor (Schwartz),
Transportation Emissions (Taylor), and Waste Emissions (Schwartz)
Projections (Taylor)
Energy and Carbon Dioxide Emission Targets (Chan)
Strategies for Energy and Emission Reductions
Conserve: Education and Incentives (Chan), Transportation Policy (Mahalek)
Load: ENERGY STAR (Chan)
Solar PV (Chan)
Research Farms Usage: Wind, Solar PV, Geothermal Power Plant (Taylor)
Mitigation Wedges (Chan and Taylor)
Results and Discussion (Chan and Taylor)
Precedents and Applying Recommendations (Mahalek)
Conclusion (Mahalek)
Appendix (Chan and Mahalek)
Combined Various Portions of Final Written Report (Mahalek)
Edit Final Written Report (All)