reporte sr27 version 04eebweb.arizona.edu/courses/ecol406r_506r/final report_subregion 27.pdfedward...
TRANSCRIPT
Global International Water Assessment Sub-region 27: Gulf of California
1/91
GIWA UNEP/GEF
SUBREGION XXVII GULF OF CALIFORNIA
Edgar Arias
Consultant for WWF
Ivan Parra Mary Albar
Myriam Reza And Juan Carlos Barrera (now with Pronatura
Noreste) WWF-Gulf of California Program
Carlos Muñoz
Mariana Becerra Jaime Sainz
Instituto Nacional de Ecología (INE)
Amy Boone Arturo Vargas
Daniel Chia Berkeley School of Public Policy
June 2003
Global International Water Assessment Sub-region 27: Gulf of California
2/91
AKNOWLEDGEMENTS This report for the Global International Water Assessment Program is the result of the two workshops held during the entire process. We gratefully acknowledge the support of the World Wildlife Fund-Gulf of California Program, the Instituto Nacional de Ecología (INE) México City Office, the Comisión Nacional del Agua (CNA), Gerencia de la Peninsula de Baja California en Mexicali, the Instituto del Medio Ambiente del Estado de Sonora (IMADES) and the Berkeley Team of Public Policies. We also gratefully acknowledge the considerable contributions and guidance in obtaining and interpreting data throughout this process offered by Francisco Oyarzabal, Jorge Ramírez, Erick Mellink, Saúl Alvarez-Borrego, Eugenio A. Aragón Noriega, Jaqueline García Hernandez, Miriam Reza, Mary Albar, Ivan Parra, Gerardo Castillo and Luis G. Alvarez. We would like to thank Juan Carlos Barrera with for the support obtained during the entire program. We also would like to thank the following people for their wide range of advice, guidance, and assistance to the two previous workshops: Francisco Bernal, Steve Mumme, Amy Boone, Steven Cornelius, Jaime Saínz, Mariana Becerra, Juan Carlos Belasteguigoitia, Arturo Vargas, Daniel A. Chia, Marcia Márques, Hector Arias, Jose Luis Castro, Jose Campoy, Pablo Wong, Michael Cohen, Jennifer Pitt, Roberto R. Enriquez, Edward Glenn, Robert Meridith, Jesus Román Calleros, Robert G. Varady, Christopher Watts, Jose F. Zamora, Richard Brusca, Carlos Muñoz and Iván Parra (facilitator).
Global International Water Assessment Sub-region 27: Gulf of California
3/91
C O N T E N T
PREFACE ......................................................................................................................................................................... 6
EXECUTIVE SUMMARY............................................................................................................................................ 7 1. SCALING OF THE SUB-REGION.............................................................................................................................10 1.1 INTRODUCTION....................................................................................................................................................10 1.2. PHYSICAL CHARACTERISTICS OF THE SUB-REGION......................................................................................12
1.2.1 Physiography and Geology......................................................................................................................12 Hydrology .........................................................................................................................................................13 Climate................................ ................................ ................................ ................................ ..............................14 Soils and Land Use ...........................................................................................................................................14
1.3 SOCIO-ECONOMIC CHARACTERISTICS OF THE SUB-REGION 27 ....................................................................15 1.3.1 Socio-economic characteristics of the Colorado River Basin ...........................................................15 1.3.2 Legal Framework ......................................................................................................................................15
Mexico ................................ ................................ ................................ ................................ ..............................15 United States.....................................................................................................................................................15
Colorado River Compact .............................................................................................................................15 The US-Mexico Framework ........................................................................................................................15
1.4 CONCLUSIONS .....................................................................................................................................................15 2. ASSESSMENT OF MAYOR CONCERNS ..................................................................................................................15
2.1 Freshwater shortage ....................................................................................................................................15 Environmental Impact .................................................................................................................................15 Economic Impact................................ ................................ ................................ ................................ .........15 Health Impact...............................................................................................................................................15 Social and Community Impact ....................................................................................................................15 Conclusions and future outlook...................................................................................................................15
2.2 Pollution......................................................................................................................................................15 Environmental Impact .................................................................................................................................15 Economic Impact................................ ................................ ................................ ................................ .........15 Health Impact...............................................................................................................................................15 Social and Community Impact ....................................................................................................................15 Conclusions and future outlook...................................................................................................................15
2.3 Habitat and community modification ................................ ................................ ................................ .........15 Environmental Impact .................................................................................................................................15 Economic Impact................................ ................................ ................................ ................................ .........15 Health Impact...............................................................................................................................................15 Social and Community Impact ....................................................................................................................15 Conclusions and future outlook...................................................................................................................15
2.4 Unsustainable exploitation of fisheries and other living resources .............................................................15 Environmental Impact .................................................................................................................................15 Economic Impact................................ ................................ ................................ ................................ .........15 Health Impact...............................................................................................................................................15 Social and Community Impact ....................................................................................................................15 Conclusions and future outlook...................................................................................................................15
2.5 Global change .............................................................................................................................................15 3. PRIORITY CONCERNS FOR FURTHER ANALYSIS.................................................................................................15 4. CAUSAL CHAIN ANALYSIS....................................................................................................................................15
4.1 Introduction...................................................................................................................................................15 4.3 Methodology .................................................................................................................................................15 4.2 System Description ......................................................................................................................................15 4.4. Root Causes ..................................................................................................................................................15 4.5 The problem/s and why it is important .....................................................................................................15 4.6 Causes.............................................................................................................................................................15 4.8 Conclusions...................................................................................................................................................15
5. POLICY OPTION ANALYSIS..................................................................................................................................15

Global International Water Assessment Sub-region 27: Gulf of California
4/91
5.3 Identification of the recommended policy option...................................................................................15 6. CONCLUSIONS........................................................................................................................................................15
REFERENCES...............................................................................................................................................................15 ANNEXES ......................................................................................................................................................................15
Annex I Background information about GIWA............................................................................................15 Annex II Scoring Table .....................................................................................................................................15 Annex III List of important-water related programs and assessments in the Sub-region.......................15 Annex IV List of Conventions and specific laws that affect water use in the sub-region.....................15 Annex V Abbreviations and Conversions.......................................................................................................15
TABLES TABLE 1 FLOW STATISTICS FOR THE COLORADO RIVER (VOLUME IN ACRE-FEET × 106).....................................13 TABLE 2 MEAN ANNUAL WATER APPLIED FOR IRRIGATION IN THE COLORADO RIVER DELTA REGION’S
MAJOR IRRIGATION DISTRICTS (1000 AF). ......................................................................................................15 TABLE 3 PERCENT CHANGE IN REAL GROSS STATE PRODUCT , 1999-2000 ..........................................................15 TABLE 4 WATER RESOURCES AND DAMS IN THE COLORADO RIVER BASIN.........................................................15 TABLE 5 WATER WITHDRAWALS AND USES IN THE COLORADO RIVER BASIN....................................................15 TABLE 6 WATER ALLOCATIONS IN THE COLORADO RIVER BASIN .........................................................................15 TABLE 7 ESTIMATED COLORADO RIVER BUDGET.....................................................................................................15 TABLE 8 SALINITY IN THE DELTA REGION .................................................................................................................15 TABLE 9 CHANGES IN RELATIVE ABUNDANCE OF POSTLARVAE DURING A 5 YEAR PERIOD, DUE TO AN
UNUSUAL HIGH AMOUNT OF FRESHWATER FLOW FROM THE COLORADO RIVER INTO THE UPPER GULF OF CALIFORNIA (UGC) .......................................................................................................................................15
TABLE 10 SHOWS THE COSTS FOR P LUMBING SYSTEMS, WATER HEATERS, AND WATER USING APP LIANCES. .15 TABLE 11 PRESENTS AN ESTIMATE OF THE ADDED COST TO GROWERS OF INCREASED SALINITY......................15 TABLE 12 CONCENTRATIONS OF SELENIUM IN BIOTA COMPOSITE SAMPLES FROM THE COLORADO RIVER
DELTA ....................................................................................................................................................................15 TABLE 13 SUMMARIZES THE SALINITY IMPACTS ON CROP YIELDS.........................................................................15 TABLE 14 ECONOMIC IMPACTS CAUSED BY CHANGING SALINITY AS IT AFFECTS PROCESS WATER...................15 TABLE 15 ILLUSTRATES THAT THE INCREASED AMOUNT OF WATER REQUIRED WITH INCREASED SALINITY IS
ABOUT 0.00069 TIMES THE INCREASE IN THE SALINITY IN THE RANGE OF 500 TO 600 MG/L. THUS A 100-M G/L INCREASE IN SALINITY WOULD REQUIRE NEARLY A 7% INCREASE IN COOLING WATER USE.15
TABLE 16 INDUSTRIAL WATER USE BY CATEGORY IN SOUTHWESTERN CALIFORNIA..........................................15 TABLE 17 VOLUME OF SEDIMENT AND ESTIMATED COST OF DREDGING OPERATIONS IN MILLIONS OF
DOLLARS, 1997.....................................................................................................................................................15 TABLE 18 SHOWS THE NATIVE SPECIES OF FISHES AND THE INTRODUCED SPECIES OF FISH IN THE COLORADO
RIVER.....................................................................................................................................................................15 TABLE 19 ESTIMATED BY-CATCH IN THE UPPER GULF OF CALIFORNIA................................................................15 TABLE 20 POPULATION IN THE UPPER GULF OF CALIFORNIA .................................................................................15 TABLE 21 COLORADO RIVER MAIN STEM WATER USE IN THE LOWER BASIN, 1996 ............................................15 TABLE 22 MAJOR DAMS IN THE LOWER COLORADO BASIN AND MEXICO............................................................15 TABLE 23 WATER USE BY SECTOR FOR THE LOWER BASIN IN THE UNITED STATES AND MEXICO (ADAPTED
FROM MORRISON ET AL . 1996) ..........................................................................................................................15 TABLE 24 PRICE OF LEASING COMP ARED TO PURCHASING RIGHTS IN MEXICALI AND SAN LUIS RIO
COLORADO, MEXICO AND THE WELLTON-MOHAWK DRAINAGE AND IRRIGATION DISTRICT IN ARIZONA. TOTAL COST TO PROVIDE 32,000 MAF IS ALSO LISTED. (U.S. DOLLARS)..................................15
TABLE 25 SENSITIVITY ANALYSIS OF PURCHASE/LEASE ALLOCATION IN THE WELLTON-MOHAWK AND MEXICALI/SAN LUIS RIO COLORADO DISTRICTS. (THOUSANDS OF USD)..................................................15

Global International Water Assessment Sub-region 27: Gulf of California
5/91
FIGURES FIG. 1 ORIGINAL SKETCH MAP ......................................................................................................................................10 FIG. 2 FINAL MAP OF THE SUB-REGION 27 .................................................................................................................11 FIG. 3 CLIMATIC REGIONS FOR SUB-REGION 27........................................................................................................15 FIG. 4 SHOWS THE IMPACT OF AMOUNT OF W ATER THAT REACHES THE COLORADO RIVER DELTA AFTER THE
COMPLETION OF HOOVER DAM IN 1935 AND GLEN CANYON DAM IN 1962..............................................15 FIG. 5 INDICATES THE STATIC LEVELS OF THE MEXICALI AQUIFER FROM 1957-1994. IN 1972 THE BEGINNING
OF THE MESA ARENOSA OPERATION, 1978: BEGINNING OF THE COLORADO RIVER EXCEDENTS, 1987: ENDING OF THE COLORADO RIVER EXCEDENTS. ............................................................................................15
FIG. 6 RADIOACTIVE TAILING PILE NEAR MOAB, UTAH IN THE UPPER COLORADO RIVER................................15 FIG. 7 SHOWS THE CHANGES IN VEGETATION COVERAGE IN THE COLORADO RIVER DELTA AFTER THE
DAMMING OF THE RIVER, WITH COMPARISONS OVER FLOOD AND NON-FLOOD YEARS. THE COLORS IN THIS LANDSAT IMAGE REFLECT SENSITIVITY TO HEAT (RED DEPICTS VEGETATION).................................15
FIG. 8 SHOWS THE REINITIATING OF THE COMMERCIAL HARVEST FOR THE CYNOSCION OTHONOPTERUS IN THE UPPER GULF OF CALIFORNIA.............................................................................................................................15
FIG. 9 SHOWS THE ESCALATION OF FISHING VESSELS FOR THE SHRIMP INDUSTRY IN THE UPPER GULF OF CALIFORNIA FROM 1965 TO 1998......................................................................................................................15
FIG. 10 SHOWS THE DECLIVEMENT OF THE TOTOABA FISHERY AND THE REDUCTION OF THE COLORADO RIVERS FLOWS OF WASTER TO THE DELTA IN MEXICO. .................................................................................15
FIG. 11 THE LINING OF THE ALL AMERICAN CANAL.................................................................................................15 FIG. 12 THE COLORADO RIVER DELTA........................................................................................................................15 FIG.13 COLORADO RIVER DELTA REGION .................................................................................................................15
Global International Water Assessment Sub-region 27: Gulf of California
6/91
PREFACE The report presents the results of the research, information development and policy analysis. The Methodology is to cover issues such as water availability, regional imbalances, relationships between water use and water quality, and alternative low-cost natural systems for treating wastewater. The papers range from addressing fundamental scientific questions regarding the linkages of land use and water quality, to the ecological impacts of excessive water consumption, to the feasibility of applying alternative treatment options. The GIWA Sub-region 27 team, integrated from personnel of WWF Gulf of California Program, the Berkeley Public Policy team and Personnel from the Instituto Nacional de Ecología Mexico, City) , conducted the research described in this report. During the GIWA workshops for the Scaling and Scoping held through August 21-23, 2002 in Hermosillo, Son, Mexico and the Causal Chain Analysis and Policy Options (April 7-9, 2003) the main thematic was based on problems concerning transboundary issues in international waters and how to apply the results from scientific assessments to manage water resources. The study makes use of the work of others, especially in its descriptions of the region and the issues that it faces. We are grateful for the cooperation and permission that have been granted to use by the region’s planning agencies, the Instituto Nacional de Ecología (INE), Mexico City Office, the Comisión Nacional del Agua (CNA), Gerencia Regional Peninsula de Baja California, Mexicali, and the Instituto del Medio Ambiente del Estado de Sonora (IMADES). We also appreciate the many persons from the study area who participated in the GIWA workshops, and those who provided invaluable guidance through out the entire project. The Global International Water Assessment Program (GIWA) and the World Wildlife Fund (WWF), Gulf of California Program Project Number QQ98, funded the research. The information herein is believed to be reliable, but the investigators and their institutions do not warrant its completeness of accuracy. Opinions and estimates are the judgments of the research team. The sole purpose of this research is to provide information to the many stakeholders and jurisdictions of the region regarding issues, strategic planning choices, and their possible consequences related to the share of international waters. While the scientific community still debates the meaning of international water management, the concerns of environmental institutions still rely on how to interact with the environmental impacts with scarce water resources of an unsustainable urban development.

Global International Water Assessment Sub-region 27: Gulf of California
7/91
EXECUTIVE SUMMARY In regions where demands for water approach or exceed the limits of available supplies, competition intensifies among various interests, turning water scarcity into a potential source of conflict. The Global International Waters Assessment (GIWA) is a project of the United Nations Environment Program (UNEP) to assess existing conditions and problems of international waters. The assessment process also involves the identification of potential solutions to the problems. GIWA and the solutions are funded mainly by the Global Environment Facility (GEF). GIWA established the Gulf of California and Colorado River (Sub-region 27) as a priority concern, considering that The Colorado River, supplies more water for consumptive use than any other river in the U.S. and supports a vast number of plant, animal species and marine life. The Physical Framework The Colorado River basin drains an area of 632,000 km2 including 5,200 km2 in northern Mexico. Nine mayor reservoirs on the river have a total storage capacity of about 80 Mm3 (65 million acre-feet), or roughly 4.5 times the annual flow of 17 Mm3 (14 million acre-feet) measured at Lee Ferry, Arizona. The Socio-economic Framework The Colorado River basin region is extremely dynamic, especially the California -Baja California border region with expanding economies and increasing industrialization. Population in the region is growing rapidly and urban areas are spreading, often in a chaotic fashion. Unmanaged growth in the region has produced serious transborder environmental problems and concerns, just to mention one, the impact of urban development on the fauna and flora of already critical ecosystems. Although dams have provided societal benefits includ ing urban water supply, irrigation, hydroelectric power, flood control, and recreation, the environmental cost of these structures has been high. Important changes brought by dams include upstream impacts related to reservoirs and downstream impacts related to controlled flows, sediment dynamics, water quality, and water temperature. The Environmental Impacts The modification of stream flow has altered the environment causing loss of fish, wildlife, and native flora mainly of the Colorado River delta region. Historically the delta included wetlands and riparian vegetation along approximately 150 km of the Colorado River corridor in Mexico and the inter-tidal area where the Colorado River meets the Gulf of California. The 150 km stretch of the river in Mexico contains twice as much native riparian and wetland habitat as the upstream stretch in the U.S. The drastic decline in native forest vegetation has reduced the habitat value of the riparian zone for native species. Increases in river bank salinity and other alterations of the riparian zone have favored the establishment of invasive, salt tolerant species (e.g. Tamarix ramosissima) occupying great extensions of modified habitat. Its value to wildlife is minimum compared to native vegetation, for very few bird species have adapted to this new habitat.

Global International Water Assessment Sub-region 27: Gulf of California
8/91
The Objectives of the report The report offers key concepts and criteria for sustainable water use within the Colorado basin, and then, using those criteria, to present patterns of water management (use and allocation), that can support economic prosperity while maintaining ecological integrity. The overall objective is to determine factors that relate to water problems in the Colorado River basin and define both quantitatively and qualitatively the unsusta inable nature of current patterns of water use, and to demonstrate how technologies, policy actions, and management strategies can be combined to achieve more sustainable water use. While it is up to the regions stakeholders to research consensus on a vision for future water use in the basin, we are convinced that the basic principles of efficiency, equity and ecosystem integrity offer the best guidance toward reducing socio-political conflict and ecological degradation over the long term. We believe that the concepts, analytical approach, and broad findings of this report can provide insight into sustainable river basin management worldwide. The Problem Conflicts and problems surrounding the Colorado River delta region in Mexico and the U.S. have arisen with the reduction of water flows to the delta. In the last several years, it has become evident that traditional water policies, which permitted the region to become the agricultural and economic force it is today, are not up to the task of meeting the challenges of the 21st century. The following circumstances indicate the unsustainable nature of current management and use of Colorado River basin water resources. Methodology To determine priority concerns in the Sub-region 27, freshwater shortage was chosen among 22 GIWA issues for the Colorado River basin due to its damaging effects in a social, economic and above all ecological context. Factors such as unsustainable resource exploitation, inappropriate policies, poverty, population growth, and marginalization of the native population were considered for a Causal Chain Analysis and the determination of the Colorado River delta as a third sub-region and its importance to the understanding of the cause-effects of reductions of water flows in the Colorado River basin and its tributaries. Such understandings led to the construction of Policy Options recommended for the Sub-region, based on scientific data and a vast bibliography of the problems of the Colorado River, especially a detailed impact assessment was used as background for the construction of these policies considering the biophysics and socio-economic factors. The Results The results were based on scientific data regarding the modification of stream flow due to the construction of dams and withdrawal of water for irrigation purposes. The environmental degradation caused by flow modification includes habitat modification, declines in biodiversity, and reduced fish catches in the Upper Gulf of California. Flow modification has resulted in increased cases of water salinization of freshwater sources, degrading the living conditions for local communities. Water withdrawal use in the Colorado River basin has far exceeded recharge and degraded water quality resulting in significant effects upon resource.

Global International Water Assessment Sub-region 27: Gulf of California
9/91
The restoration of key areas for the Colorado River Delta depends greatly in applying a more efficient use of water that now flows to the delta. As a possible solution; if agriculture is managed to reduce water use, the pressure on precious water resources would be reduced and water can be released to other sectors. Agriculture has to produce more food with less water. The consumption of water for irrigated agriculture and the reduced quality of return flows adversely impacts on downstream ecosystems. Conclusions Under international law individual states are endowed with the right to control territorial resources. Consensus, however, is difficult to reach on what constitutes an equitable and reasonable utilization and when another state is adversely affected by such utilization, for the reduction of flow excedents would affect the delta ecosystem with or without an international treaty, and not by a reduction in flows of water already stipulated in the Mexican International Water Treaty. Considering the transboundary implications of the Colorado River delta as a shared watershed, the responsibility relies on both sides of the border. We believe that the restoration of the Colorado River Delta comes down to all water consumptive users in the Colorado River Basin. This report addressed the following problem: too little water is being allocated towards ecosystem maintenance or restoration in the Colorado River Delta. In fact, neither the United States nor Mexico officially allocates any water to the Delta. As a result, it has drastically modified the ecosystem and affected the lives that depend on it for survival. Therefore, we propose the following options that could possibly secure sources of water for the Colorado River Delta in a short, medium and long-term. 1) Lease water rights in the Mexicali and San Luis Rio Colorado Valleys and transfer associated water to Delta ecosystem, and 2) Convert electricity subsidies for Mexican farmers to cash subsidies, and eliminate price subsidies to municipal water users in Mexico as preliminary measures to assure minimal flows of freshwater into the Delta. Additionally, we also propose option 3) that attempts to increase the efficiencies of water use in Mexico through market mechanisms, thereby “freeing up” water potentially available for the Delta. The options proposed in this report are therefore, intended to complement proposals from government agencies, non-government organizations and universities that could help sustain and restore important habitat in the delta region. Implementing these proposals will result in benefits to both countries and most importantly, the ecology of the delta. Analyzing the future tendencies of water use in the Lower and Upper basin of the Colorado River the most viable way to obtain surplus water for ecological purposes is to change agricultural water use patterns without affecting present deliveries to water stakeholders and farmers in the Mexican part of the delta. This implies changes in the actual Mexican National Water Law, regarding to time and quantity deliveries of water for agricultural purposes. There must be a continuity of public participation in policy and management decisions and we recommend coordination among the various involved organizations to ensure that efforts are not duplicated.
Global International Water Assessment Sub-region 27: Gulf of California
10/91
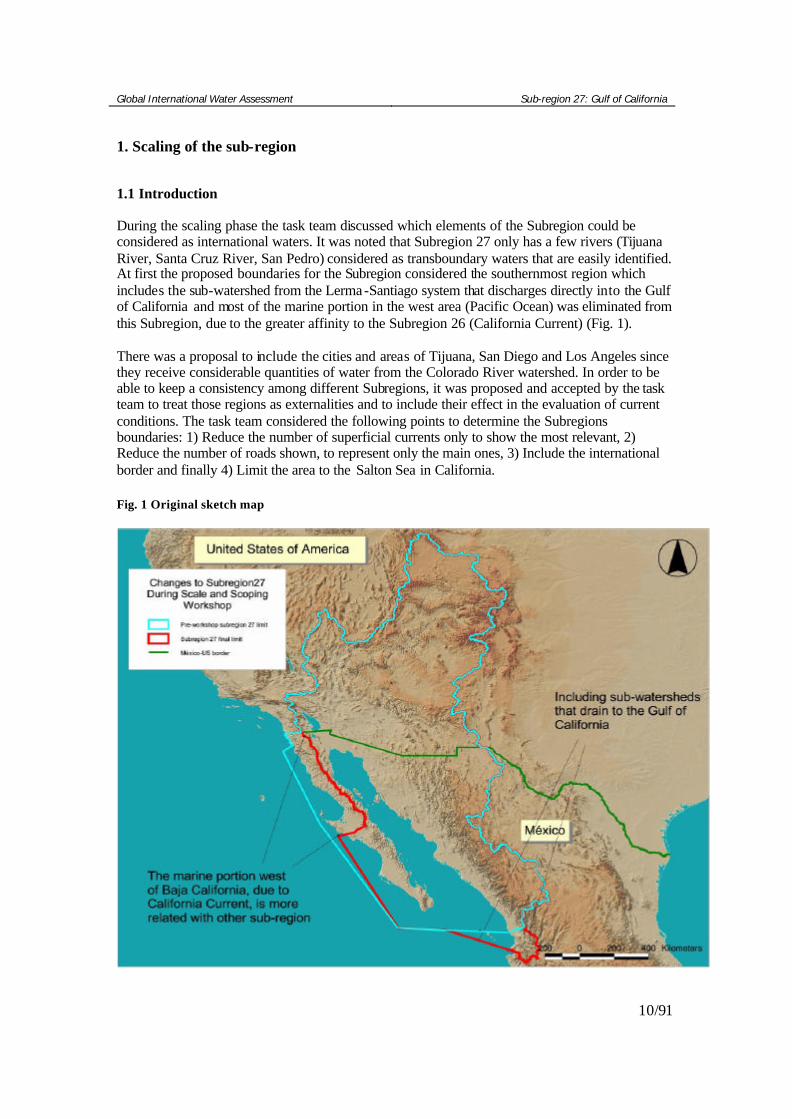
1. Scaling of the sub-region 1.1 Introduction During the scaling phase the task team discussed which elements of the Subregion could be considered as international waters. It was noted that Subregion 27 only has a few rivers (Tijuana River, Santa Cruz River, San Pedro) considered as transboundary waters that are easily identified. At first the proposed boundaries for the Subregion considered the southernmost region which includes the sub-watershed from the Lerma-Santiago system that discharges directly into the Gulf of California and most of the marine portion in the west area (Pacific Ocean) was eliminated from this Subregion, due to the greater affinity to the Subregion 26 (California Current) (Fig. 1). There was a proposal to include the cities and areas of Tijuana, San Diego and Los Angeles since they receive considerable quantities of water from the Colorado River watershed. In order to be able to keep a consistency among different Subregions, it was proposed and accepted by the task team to treat those regions as externalities and to include their effect in the evaluation of current conditions. The task team considered the following points to determine the Subregions boundaries: 1) Reduce the number of superficial currents only to show the most relevant, 2) Reduce the number of roads shown, to represent only the main ones, 3) Include the international border and finally 4) Limit the area to the Salton Sea in California. Fig. 1 Original sketch map
Global International Water Assessment Sub-region 27: Gulf of California
11/91
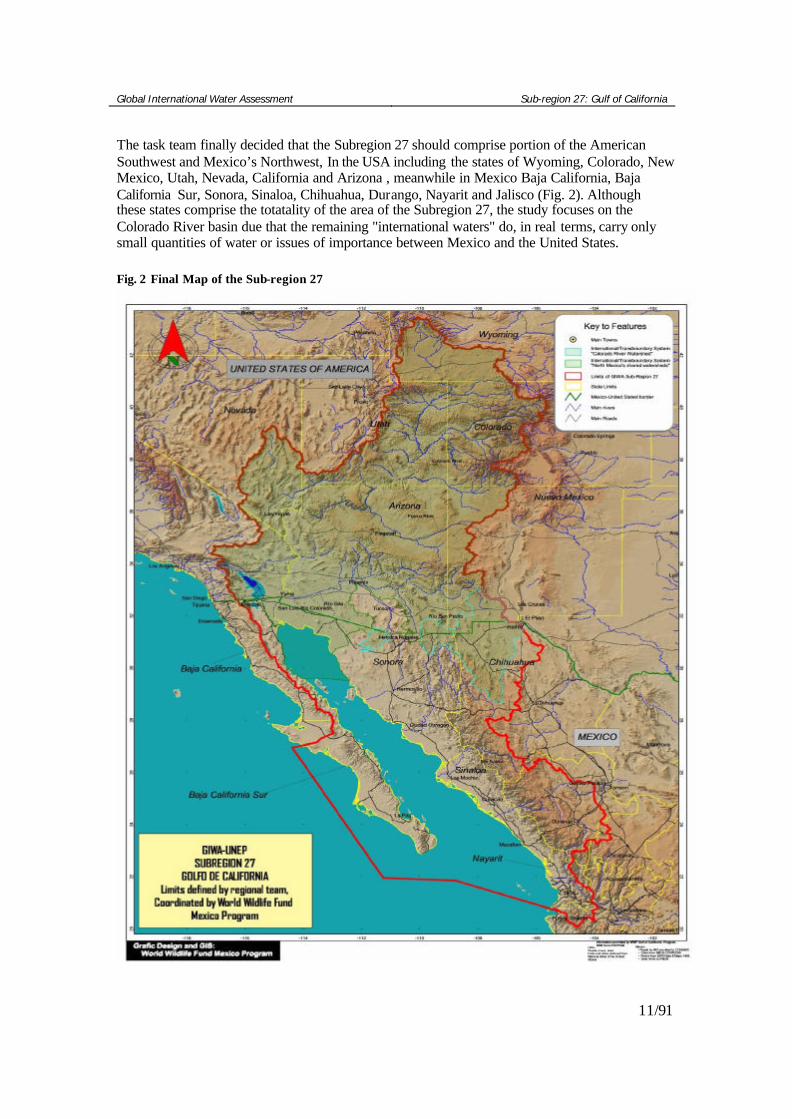
The task team finally decided that the Subregion 27 should comprise portion of the American Southwest and Mexico’s Northwest, In the USA including the states of Wyoming, Colorado, New Mexico, Utah, Nevada, California and Arizona , meanwhile in Mexico Baja California, Baja California Sur, Sonora, Sinaloa, Chihuahua, Durango, Nayarit and Jalisco (Fig. 2). Although these states comprise the totatality of the area of the Subregion 27, the study focuses on the Colorado River basin due that the remaining "international waters" do, in real terms, carry only small quantities of water or issues of importance between Mexico and the United States. Fig. 2 Final Map of the Sub-region 27
Global International Water Assessment Sub-region 27: Gulf of California
12/91
1.2. Physical characteristics of the Sub-region 1.2.1 Physiography and Geology The Colorado River is one of the great rivers in the American West. Major reservoirs in the Colorado River Basin include Lake Granby, Williams Fork Reservoir, Green Mountain Reservoir, Lake Dillon, Ruedi Reservoir, Taylor Park Reservoir, Blue Mesa Reservoir, McPhee Reservoir, Vallecito Reservoir, and Navajo Reservoir. Mayor rivers within the Colorado River Basin include the Gunnison, White, Yampa, Eagle, Animas, Dolores, San Juan, Roaring Fork, La Plata, Williams Fork, Blue, and the San Miguel Rivers. Water quality in this region generally is satisfactory, although runoff from agricultural areas, abandoned mines, and na turally occurring saline groundwater discharges causes localized problems:
The Eagle River has metals contamination in some reaches. The Colorado River main stem is subject to elevated salinity levels due to naturally occurring springs and agricultural drainage through saline deposits. The Gunnison River is subject to increased selenium levels. Previous mining activities have also impacted tributaries to the San Juan and White and Yampa Rivers (EPA, 2002).
The Colorado River and its tributaries flow through the Great Basin, the Sonoran and the Mojave Deserts, providing the vital lifeline to the arid American Southwest. The Colorado River is born about 3,048 m (10,000 feet) in the Rocky Mountains of Colorado and flows southwest for 2,333 km (1,450 miles) to the Gulf of California (Sea of Cortez) in Mexico. It is the international boundary for 27 km (17 miles) between Arizona and Mexico. Before the construction of a number of dams along its route, it flowed 128 km (80 miles) through Mexico to the Gulf of California. The 2,333 km (1,450 miles) of its route in the United States makes it the nation's fifth longest river. It drains a large portion of the North American continent covering 632,000 km2 (242,000 square miles) in the United States and 5,200 km2 (2,000 square miles) in Mexico. The Colorado and its tributaries drain southwestern Wyoming and western Colorado, parts of Utah, Nevada, New Mexico and California, and almost all of Arizona. Three fourths of the basin is federal land devoted to national forests and parks and Indian reservations. The terrain of the Colorado River is very unique. It consists of Wet Upper Slopes, Irregular Transition Plains and Hills, Deep Canyon lands, and the Dry Lower Plains. Wet Upper Slopes: Consist of numerous streams that feed into the Colorado River from stream cut canyons, small flat floored valleys often occupied by alpine lakes and adjacent steep walled mountain peaks. These areas are heavily forested and contain swiftly flowing streams, rapids, and waterfalls. The flow of the Colorado basin is located within an inside zone located between 95° and 120° west longitude marked as water defficiatary within the totality of its territory in the United States (González-Casillas, 1991). The annual average precipitation in the U.S. portion is of 762 mm, of which 560 mm are evapotranspirated directly to the atmosphere and the rest forms part of the surface and groundwater flow (USGS, 1996).
Global International Water Assessment Sub-region 27: Gulf of California
13/91
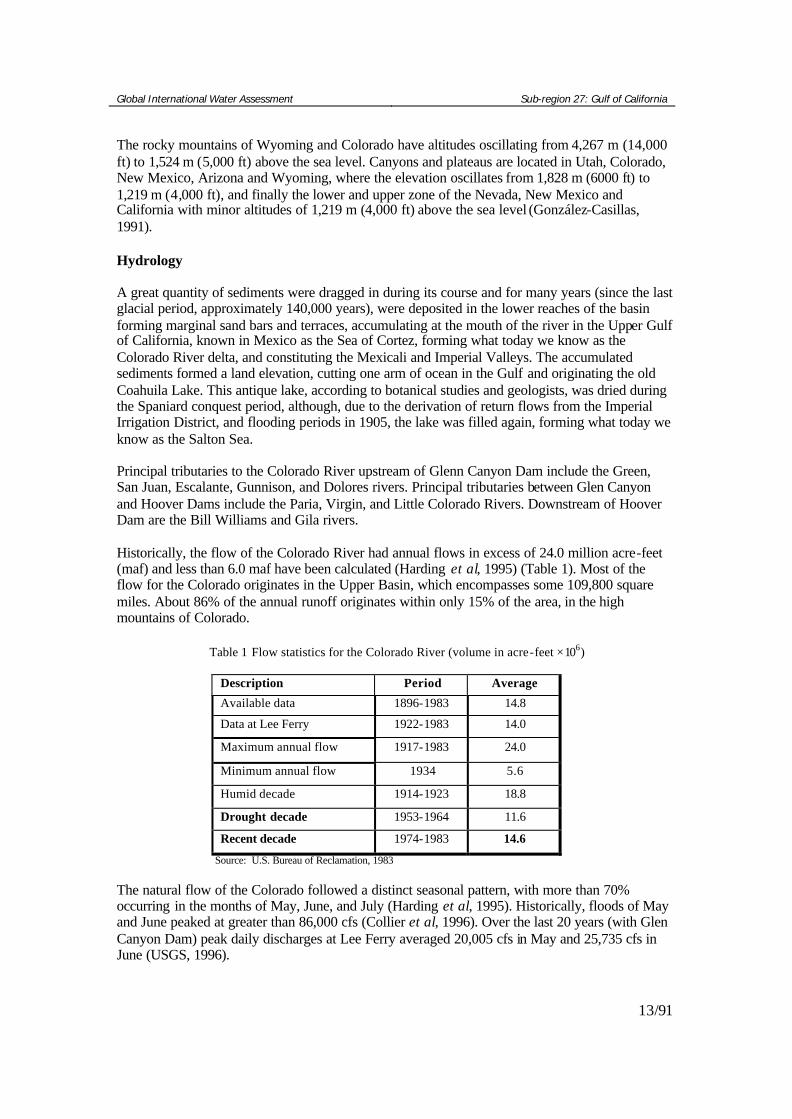
The rocky mountains of Wyoming and Colorado have altitudes oscillating from 4,267 m (14,000 ft) to 1,524 m (5,000 ft) above the sea level. Canyons and plateaus are located in Utah, Colorado, New Mexico, Arizona and Wyoming, where the elevation oscillates from 1,828 m (6000 ft) to 1,219 m (4,000 ft), and finally the lower and upper zone of the Nevada, New Mexico and California with minor altitudes of 1,219 m (4,000 ft) above the sea level (González-Casillas, 1991). Hydrology A great quantity of sediments were dragged in during its course and for many years (since the last glacial period, approximately 140,000 years), were deposited in the lower reaches of the basin forming marginal sand bars and terraces, accumulating at the mouth of the river in the Upper Gulf of California, known in Mexico as the Sea of Cortez, forming what today we know as the Colorado River delta, and constituting the Mexicali and Imperial Valleys. The accumulated sediments formed a land elevation, cutting one arm of ocean in the Gulf and originating the old Coahuila Lake. This antique lake, according to botanical studies and geologists, was dried during the Spaniard conquest period, although, due to the derivation of return flows from the Imperial Irrigation District, and flooding periods in 1905, the lake was filled again, forming what today we know as the Salton Sea. Principal tributaries to the Colorado River upstream of Glenn Canyon Dam include the Green, San Juan, Escalante, Gunnison, and Dolores rivers. Principal tributaries between Glen Canyon and Hoover Dams include the Paria, Virgin, and Little Colorado Rivers. Downstream of Hoover Dam are the Bill Williams and Gila rivers. Historically, the flow of the Colorado River had annual flows in excess of 24.0 million acre-feet (maf) and less than 6.0 maf have been calculated (Harding et al, 1995) (Table 1). Most of the flow for the Colorado originates in the Upper Basin, which encompasses some 109,800 square miles. About 86% of the annual runoff originates within only 15% of the area, in the high mountains of Colorado.
Table 1 Flow statistics for the Colorado River (volume in acre-feet ×106)
Description Period Average
Available data 1896-1983 14.8
Data at Lee Ferry 1922-1983 14.0
Maximum annual flow 1917-1983 24.0
Minimum annual flow 1934 5.6
Humid decade 1914-1923 18.8
Drought decade 1953-1964 11.6
Recent decade 1974-1983 14.6
Source: U.S. Bureau of Reclamation, 1983 The natural flow of the Colorado followed a distinct seasonal pattern, with more than 70% occurring in the months of May, June, and July (Harding et al, 1995). Historically, floods of May and June peaked at greater than 86,000 cfs (Collier et al, 1996). Over the last 20 years (with Glen Canyon Dam) peak daily discharges at Lee Ferry averaged 20,005 cfs in May and 25,735 cfs in June (USGS, 1996).

Global International Water Assessment Sub-region 27: Gulf of California
14/91
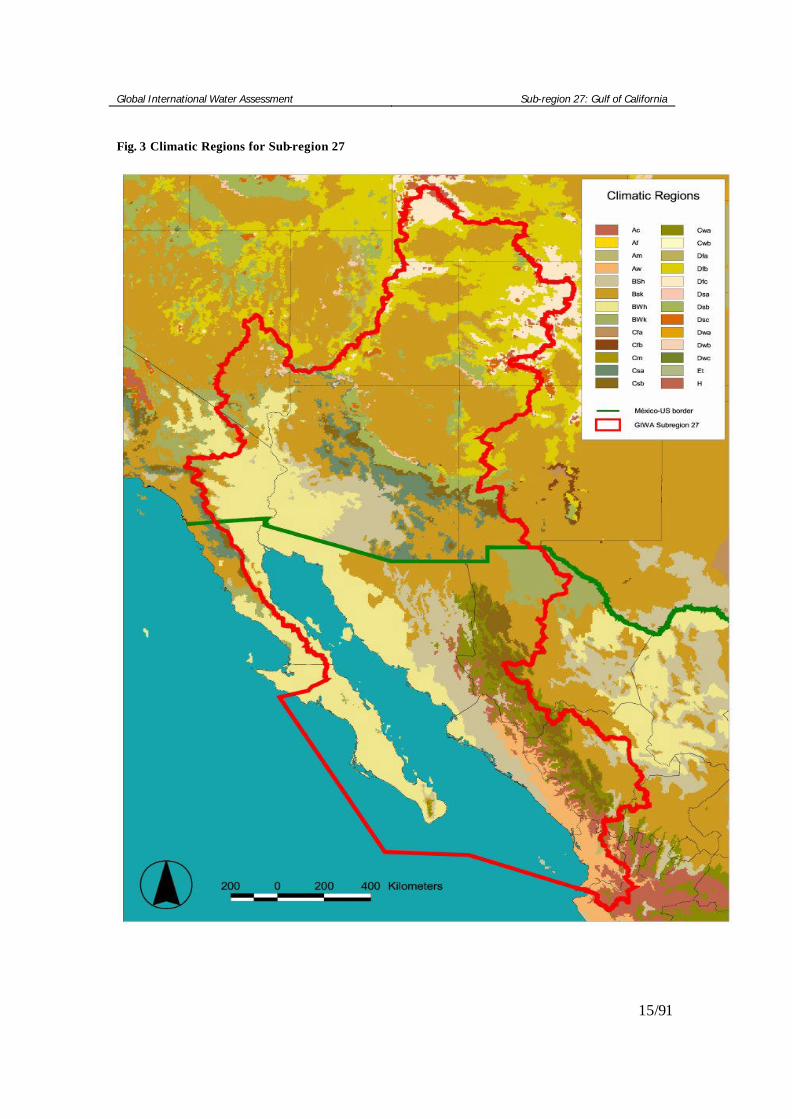
The river contains alternating sections of rapids and calm sections. The depth of the river varies from 6 feet to 90 feet, with the average being about 20 feet. The rapids are the shallow sections and the calm sections tend to be the deepest parts. Some deep holes have also formed at the base or foot of some of the more mayor rapids. The rapids represent only 10% of the river's total length through the Grand Canyon, but are responsible for more than half of the total drop in altitude. Before construction of the Glen Canyon Dam the river would carry 500,000 tons of silt and sediment per day, in an average day, through the Grand Canyon. The peak flow rate of the Colorado before construction of the dam would normally be around 85,000 cfs for the month of June. By examining river sediments, scientists have determined that on a number of occasions over the past 4,000 years, the river reached peak flow rates of over 250,000 cfs. The peak flow rate through the Grand Canyon after construction of the dam was reduced to 50,000 cfs on rare occasions and is normally around 30,000 cfs. The primary purpose for construction of the Glen Canyon Dam was to prevent silt from building up behind another dam, Hoover Dam, on the other side of the Grand Canyon, at the head of Lake Mead. The water temperature, which used to get as warm as 80 degrees F, is now icy-cold all year and averages around 42 degrees F. Because of the changes in the water temperature some native fish that used to inhabit the river have become extinct and still others are endangered Climate The temperatures in the Colorado River basin present variations from -45°C in the mountains, over 54°C in the deserts of California and Arizona (González-Casillas, 1991). The medium annual temperature is of 22.5°C with a extreme warm period, that goes from June to September with medium temperatures over 30°C. July is the hottest month with an average of 32.3°C and a maximum average of 41.8°C; the coldest month corresponds to January with a monthly average of 12°C. The annual average precipitation varies, depending on the place and goes from 63.5 mm (2.5 inches) to 1,524 mm (60 inches) in the mountains, in this last presenting itself in the form of rain or snow (USGS, 1996). Using Köepen climatic regions classification system, Subregion 27 show two mayor dominant climatic elements: desert and semi desert zones, in the Gulf of California, and more temperate climate in higher places, both in the upper watershed as in the Sierra Madre Occidental portion of the Subregion (Fig. 3). Soils and Land Use Over 56% of the land area in this watershed is owned and managed by federal government agencies, 8.5 percent is state owned land and an additional 16.5% is occupied by Indian reservations. Three fourths of the basin is federal land devoted to national forests and parks and Indian reservations. Approximately 19% of the watershed is privately owned. Two percent of the basin is in Mexico. Approximately 80 percent of the river’s supply is used for agriculture. The largest user of agricultural water is the Imperial Irrigation District (IID) in southern California, which alone accounts for approximately 2.87 maf annually (1964-96 average), or almost 20 percent of the river’s average annual flow (Pontius, 1997).
Global International Water Assessment Sub-region 27: Gulf of California
15/91
Fig. 3 Climatic Regions for Sub-region 27
Global International Water Assessment Sub-region 27: Gulf of California
16/91
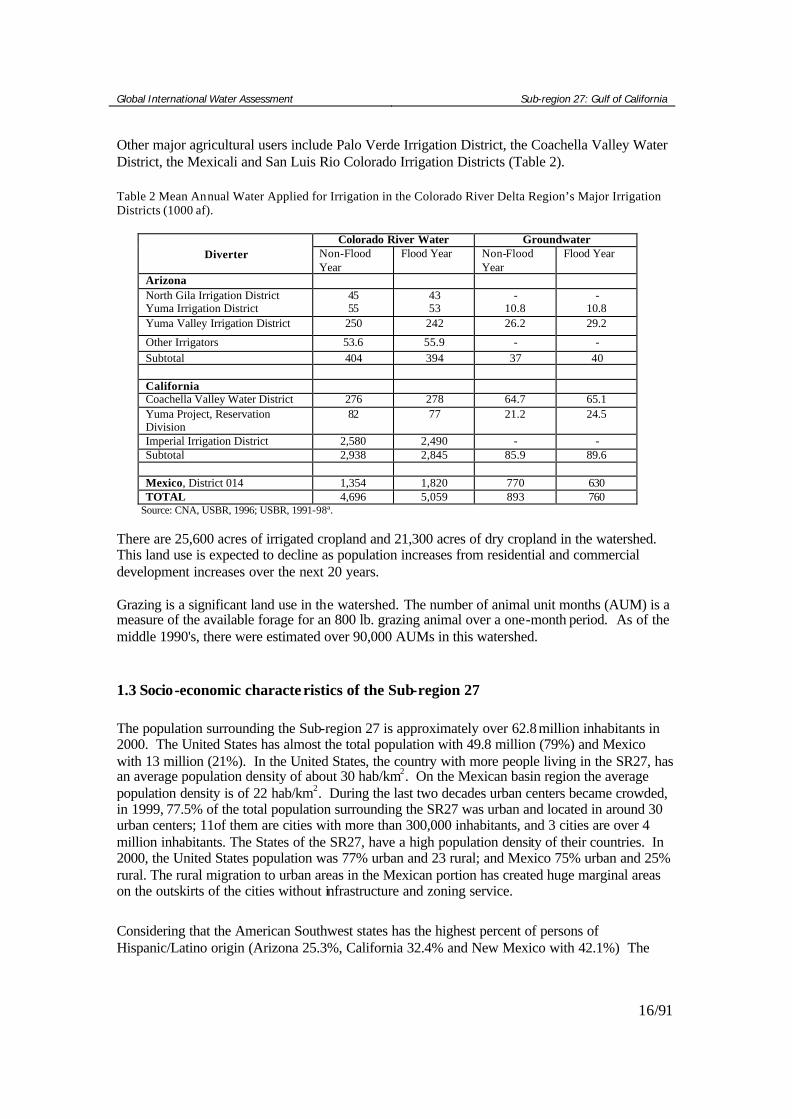
Other major agricultural users include Palo Verde Irrigation District, the Coachella Valley Water District, the Mexicali and San Luis Rio Colorado Irrigation Districts (Table 2). Table 2 Mean Annual Water Applied for Irrigation in the Colorado River Delta Region’s Major Irrigation Districts (1000 af).
Colorado River Water Groundwater Diverter Non-Flood
Year Flood Year Non-Flood
Year Flood Year
Arizona North Gila Irrigation District 45 43 - - Yuma Irrigation District 55 53 10.8 10.8 Yuma Valley Irrigation District 250 242 26.2 29.2
Other Irrigators 53.6 55.9 - - Subtotal 404 394 37 40 California Coachella Valley Water District 276 278 64.7 65.1 Yuma Project, Reservation Division
82 77 21.2 24.5
Imperial Irrigation District 2,580 2,490 - - Subtotal 2,938 2,845 85.9 89.6 Mexico, District 014 1,354 1,820 770 630 TOTAL 4,696 5,059 893 760
Source: CNA, USBR, 1996; USBR, 1991-98ª. There are 25,600 acres of irrigated cropland and 21,300 acres of dry cropland in the watershed. This land use is expected to decline as population increases from residential and commercial development increases over the next 20 years. Grazing is a significant land use in the watershed. The number of animal unit months (AUM) is a measure of the available forage for an 800 lb. grazing animal over a one-month period. As of the middle 1990's, there were estimated over 90,000 AUMs in this watershed. 1.3 Socio-economic characte ristics of the Sub-region 27 The population surrounding the Sub-region 27 is approximately over 62.8 million inhabitants in 2000. The United States has almost the total population with 49.8 million (79%) and Mexico with 13 million (21%). In the United States, the country with more people living in the SR27, has an average population density of about 30 hab/km2. On the Mexican basin region the average population density is of 22 hab/km2. During the last two decades urban centers became crowded, in 1999, 77.5% of the total population surrounding the SR27 was urban and located in around 30 urban centers; 11of them are cities with more than 300,000 inhabitants, and 3 cities are over 4 million inhabitants. The States of the SR27, have a high population density of their countries. In 2000, the United States population was 77% urban and 23 rural; and Mexico 75% urban and 25% rural. The rural migration to urban areas in the Mexican portion has created huge marginal areas on the outskirts of the cities without infrastructure and zoning service. Considering that the American Southwest states has the highest percent of persons of Hispanic/Latino origin (Arizona 25.3%, California 32.4% and New Mexico with 42.1%) The

Global International Water Assessment Sub-region 27: Gulf of California
17/91
population surrounding the SR27 is largely conformed by White and Hispanic/Latino origin persons. The Western States (Nevada, Utah, Arizona, New Mexico, Wyoming and Colorado) within the SR27 in the United States are considered the fastest growing states in the country, with a 20% population increase between 1990 and 2000 (U.S. Census Bureau, 2000). Nevada has been the fastest growing state in the nation (10.64%) for the past several years. Population growth in rural areas has been much less dramatic, and in some areas has shown decline. The Northern States of the Mexican portion surrounding the SR27 are not any dissimilar to those States of the U.S. Baja California, Chihuahua, Sonora and Sinaloa have a population over 2 million inhabitants. Problems such as overcrowding, health hazards, pollution, poor housing and unsanitary conditions, that affect the population’s quality life, are magnifying both poverty and social gaps. The increase of marginal urban settlements is a consequence of an unsustainable development applied model that limits new opportunities for rural inhabitants and the origin of a major environmental problem, especially in the U.S.-Mexico border region. Approximately 84.1% of the States of the SR27 had access to drinking water services in 1999. In the same year 78% of the SR27 popula tion had access to sanitation and waste disposal services. Regarding the population living below the national poverty line, the SR27 countries have different situations: U.S. 12.7% (1999) and Mexico 27% (1998). Most of the households living in poverty in the SR27 were in rural areas. The overall mortality rate in the SR27 countries was an average 7 per 1000. In the SR27, the infant mortality rate for the U.S. (6.76 per 1000 live births) and Mexico (25.36). The % ages of literacy (age 15 and over can read or write) are: U.S. 97% and Mexico 89.6%. The human development is by far higher in the U.S. States. In 1999 the industrial sector is one of the main economic activities in the SR27 region (Table 3). According to the U.S. Census Bureau in 1999 the U.S. GDP - composition by sector was: agriculture (2%), Industry (18%), and services (80%). Mexico; agriculture (5%), industry (27%), and services (68%). The agricultural sector has a major economic importance at national, regional and international levels. Although agriculture, cattle and fishery are the main exportation activities of all the SR27. The Timber and mining industry continues to play an important role in the SR27 economy. Mining is a traditional and important activity in the SR27. The timber and mining exportation to other states of each country or even to other countries of the world represent an important economic input for the SR27 economy. Table 3 Percent Change in Real Gross State Product, 1999-2000
State
Agriculture, Forestry and
Fishing
Mining
Manufac -turing
Services
Arizona 1.9 -6.4 14.4 6.4 New Mexico 1.2 -12.7 25.5 3.3 Colorado 0.4 -15.5 5.1 9.6 Utah 6.9 -6.6 6.4 5.6 Wyoming 2.3 -9.5 8.9 3.2 California 6.3 -11.0 10.1 9.5 Nevada 10.3 -7.0 7.1 4.4
Source: Panek and Downey, 2002
Global International Water Assessment Sub-region 27: Gulf of California
18/91
Finally, tourism, though not easily identifiable as a separate economic sector, is an important industry in the SR27. Both The U.S. and Mexican economy is shifting to services. For the United States and Mexico since the mid 1999, there has been certain growth of industrial production. However, regional output grew at a very slow pace (0.5%) in 2001 and growth prospects for 2002 have not been promising. This situation is directly linked to the global economic crisis and the events of September 11, which is affecting the region primarily through trade channels in the midst of unstable world financial markets. Given the scope of these adverse external factors, however, the region's economies succeeded in averting serious domestic or external disequilibria. The U.S. States in the years 1994-2000 witnessed solid increases in real output, low inflation rates, and a drop in unemployment to below 5%. Long-term problems include inadequate investment in economic infrastructure, rapidly rising medical costs of an aging population, sizable trade deficits, and stagnation of family income in the lower economic groups. In Mexico, on the other hand, the existing economic situation for the Mexican states has not been quite positive. Mexico has a free market economy with a mixture of modern and outmoded industry and agriculture, increasingly dominated by the private sector. Private consumption became the leading driver of growth in 2000, accompanied by increased employment and higher real wages. Mexico still needs to overcome many structural problems as it strives to modernize its economy and raise living standards. Income distribution is very unequal, with the top 20% of income earners accounting for 55% of income. 1.3.1 Socio-economic characteristics of the Colorado River Basin The primary source of the Colorado River Basin States water supply comes from the Colorado River (Table 3). Ground water is also an important resource. As the west’s population and need for water have grown, the Colorado River has been tapped through a system of dams and diversions that begin close to its source in the mountains of Colorado and Wyoming. More than 80 mayor diversions carry water away from the river for agriculture and other uses. Today the Colorado irrigates more than 1.5 million ha of farmland in the southwestern United States and Mexico, and supplies water to nearly 30 million people. While irrigated agriculture tops the list of Colorado River water uses (Table 4) in the United Sates and Mexico, the second largest consumption of water is evaporation from reservoirs. Diversions out of the Colorado Basin, such as water piped to Los Angeles, are the third largest draw, and are followed by municipal and industrial uses. Hydroelectric plants along the Colorado River generate about 12 billion kilowatt-hours of electricity annually. Due to various economic factors such as urbanization, past federal set-aside programs and increasing energy and water costs, agricultural pumpage has declined in the U.S. Probably the single most important contributing factor in this decrease is a reduction in planted acres.

Global International Water Assessment Sub-region 27: Gulf of California
19/91
Table 4 Water Resources and Dams in the Colorado River Basin
Water resources region U. Colorado L. Colorado
Total Area (Km2) 290,364 360,346
Number of dams by Size Classes
Total number of dams 1,164 446 Size= 10x Mm3, where x =
Total storage (Mm3) 57,168,043 59,644,098 U. Colorado L. Colorado
Total annual runoff (Mm3) 18,573,505 23,405,686 Unknown 4 19
Population 714,000 5,318,000 0-0.99 0 0
Area/Dams (Km2/dam) 248 810 1-1.99 272 98
Storage/Area (Mm3/km2) 1,072 429 2-2.99 764 210
Storage/Runoff 3.08 2.55 3-3.99 261 133
1st Year Storage>Runoff 1950 1936 4-4.99 101 55
Persons per Dam 613 11,924 5-5.99 25 19
Storage / Person (Mm3/pr) 80.07 11.22 6-6.99 3.6 7
Data From Solley et al, 1998 Agriculture continues to be a mayor contributor to the Colorado’s River Basin economy. In 2000 Wyoming with (2.4%), New Mexico (1.9%) California (1.8%) and Arizona (1.4) ranked the top agricultural Gross State Product. The value of the agricultural output in Wyoming annually approaches or exceeds one billion dollars with cash income. The cattle industry is by far the largest component of Wyoming’s agriculture accounting for over 70% of all cash receipts. Cattle also led the way in 2001 in terms of value production at $545.1 million. Table 5 Water Withdrawals and Uses in the Colorado River Basin Surface Water Withdrawals
Region Public Supply
Irrigation Livestock Industrial Mining Thermal Power
Cubic meters per year
U. Colorado 146 9666 73 8 32 202 L. Colorado 964 5807 55 65 20 23 Surface Water Uses
Region Pop Served
Acres Thermal Power
Hydropower
Thousand Persons
Thousands of cubic meters
Millions Kilowatts
Hours
Million Kilowatts
Hours U. Colorado 407 1812 94000 7220 L. Colorado 2510 1156 62400 9740
Data From Solley et al, 1998 California, the seventh largest economy in the world, leads the SR27 economy. California by itself receives more foreign direct investment than any other state of the SR27. California is by
Global International Water Assessment Sub-region 27: Gulf of California
20/91
far the largest exporting state in the SR27, generating some $107 billion in exports. It also tops the tourism and travel category, with 68 billion in sales in 1999. California has been the number one food and agricultural producer in the SR27. California’s agricultural output is nearly $ 25 billion per year and produces over 350 different crops. Along with California, Colorado is the second strongest economy in the SR27. Colorado’s economy is not dependent on any single sector, but has a strong base of businesses in a variety of high-tech and traditional industries. In 2001, Colorado ranked fifth in the nation for venture capital investment, with $1.5 billion invested in 111 Colorado companies. Colorado’s economy has a diverse manufacturing base, especially in high-tech durable goods, which puts the state along with California on the top economy’s of the SR27. Nevada’s primary source of investment is in the casino and tourism industry, although agriculture provides a cornerstone to the economies of many of Nevada's rural communities. Maquiladora-related development is occurring within the States of Arizona and New Mexico, especially in the southern part of the states. They represent the 25.5% (New Mexico) and 14.4% (Arizona) change in Real Gross State Product, in the Industrial Sector. The rapid growth of the industry south to the border is due to the close proximity of the Mexican border. The Economic development in Mexican portion of the Colorado River Basin is distinctively agricultural and industrial. Three Mayor cities constitute the use of the Colorado River waters. Agriculture once the economic stronghold in Mexicali and San Luis, represent a decreasing share of the state’s total output. Mexicali, Tijuana and San Luis Rio Colorado all have experienced a dramatic growth in the industrial sector, although in 2001 the manufacturing industry experienced a declivity in the physical volume production. Fast growing border region towns, have an average annual growth of 38% per annum over the last 5 years, largely associated with the maquiladora industries and trade with the U.S. The largest are Tijuana and Mexicali in Baja California, but also growing very fast are a number of smaller ones in B.C. (Ensenada) and Nogales (Sonora). Most like Los Angeles, Tijuana isn’t part of the cities that conform the Colorado River Basin, but is yet to be an important water user of the Colorado River Basin. There are 183 maquila plants operating in Mexicali, which puts Mexicali as the second most important city with direct capital investment in the Mexican portion of the river. Regardless of the economic growth in the maquila industry, the agricultural sector represents an important income to the rural areas of the Colorado River and provides jobs for thousands of day laborers. 1.3.2 Legal Framework Mexico In recent years, the government has shifted toward decentralization of federal water management, particularly in the area of sewage and water infrastructure. The 1992 National Waters Act,
Global International Water Assessment Sub-region 27: Gulf of California
21/91
administered by the National Water Commission (Comisión Nacional del Agua - CNA), is the main institutional framework for the water management in Mexico. CNA, whose responsibilities are primarily operational, oversees the development and use of Mexico’s water resources. Since its creation in 1989, CNA has sought to reduce the level of federal centralization in water resources management by conceding more operational functions to states, municipalities and private firms. The Department of Environment and Natural Resources (Secretaría del Medio Ambiente y Recursos Naturales – SEMARNAT), is directly charged with implementing federal environmental laws. By law, SEMARNAT is the leading agency responsible for protecting water quality, which it does by setting standards and enforcing compliance with regulatory requirements. Its authority in this area, however, is largely administrative rather than operational. Most operational functions (for example, ownership and management of waste treatment facilities), inspections and Monitoring are carried out by CNA and other federal, state and municipal entities. United States In the United States, water allocation is mainly of state law, with the western and southern states generally relying on prior appropriation systems for surface water allocations, and the northern and eastern states relying mainly on riparian rights systems. Groundwater allocation, which is also under state jurisdiction, is often managed separately from surface water – a perpetual problem in water resources management, given the pervasive interactions between groundwater and surface water. The federal Environmental Protection Agency implements laws to protect the environment, including water quality and aquatic habitat, for which many states have assumed administrative responsibility. Through the US Bureau of Reclamation and The US Army Corps of Engineers, the federal government has participated in the development large water projects. Interstate commissions administer water compact agreements between state governments. Apportionment of the Colorado River’s water within the United States is governed by a series of agreements constituting the “Law of the River.” A collection of international treaties, interstate compacts, court decrees, laws, rules, regulations and policies that govern the management, allocation and distribution of Colorado River water. The 1944 Water Utilization Treaty allocates a specific volume of the Colorado to Mexico-1,850 million cubic meters (Mm3) per year or 1.5 million acre-feet per year (maf/yr); equivalent to roughly 10 percent of the average annual flow-but was silent on the quality of water to be delivered. As a result, serious problems have arisen, the most important of which is the increased salinity caused by upstream irrigation. This problem was addressed in 1973 by Minute 242 to the 1944 treaty, but it continues to be a concern for Mexico. Colorado River Compact Seven western states and Mexico have beneficial interests in the Colorado River Basin. The Colorado River Basin states are: Arizona, California, Colorado, Nevada, New Mexico, Utah, and Wyoming. Each state is party to the Colorado River Compact entered into in Santa Fe, New Mexico, on November 24, 1922.

Global International Water Assessment Sub-region 27: Gulf of California
22/91
The Colorado River Compact divided the Colorado River Basin into the Upper Basin and the Lower Basin. The division point is Lees Ferry, a point in the main stem of the Colorado River about 30 river miles south of the Utah-Arizona boundary. The "Upper Basin" includes those parts of the States of Arizona, Colorado, New Mexico, Utah, and Wyoming within and from which waters naturally drain into the Colorado River system above Lees Ferry, and all parts of these States that are not part of the river's drainage system but may benefit from water diverted from the system above Lees Ferry. The "Lower Basin" includes those parts of the States of Arizona, California, Nevada, New Mexico, and Utah within and from which waters naturally drain into the Colorado River system below Lees Ferry, and all parts of these States that are not part of the river's drainage system but may benefit from water diverted from the system below Lees Ferry. The Colorado River Compact apportioned to each basin the exclusive, beneficial consumptive use of 7,500,000 acre-feet of water per year from the Colorado River system in perpetuity. In addition, the Compact gave to the Lower Basin the right to increase its annual beneficial consumptive use of such water by 1,000,000 acre-feet (Table 6). Table 6 Water allocations in the Colorado River Basin
Entity Apportionment (maf/year)
Authority
Upper Basin 7.5 1922 Colorado River Compact. (The Upper Basin has the right to use 7.5 maf only if that quantity is available after it has satisfied its delivery requirements of 7.5 maf/year to Lower Basin plus the amount required to satisfy the Mexican Treaty obligation.)
Arizona 0.05 1948 Upper Colorado River Compact Colorado 3.86 1948 Upper Colorado River Basin Compact. (Colorado is
apportioned 51.75% of the remaining flows after the Upper Basin’s delivery requirements have been met.)
New Mexico 0.84 1948 Upper Colorado River Compact (New Mexico is apportioned 11.25% of the remaining flows after the Upper Basin’s delivery requirements have been met.)
Utah 1.71 1948 Upper Colorado River Compact (Utah is app ortioned 23% of the remaining flows after the Upper Basin’s delivery requirements have been met.)
Wyoming 1.04 1948 Upper Colorado River Compact (Wyoming is apportioned 14% of the remaining flows after the Upper Basin’s delivery requirements have been met.)
Lower Basin 8.5 1922 Colorado River Compact Mexico 1.5 1944 Mexican Water Treaty
Arizona1 2.8 1963 U.S. Supreme Court decision Arizona vs. California California2 4.4 1963 U.S. Supreme Court decision Arizona vs. California
Nevada3 0.3 1963 U.S. Supreme Court decision Arizona vs. California Additional 1.0 Article III (b) of 1922 Colorado River Compact
Source: Pontius, 1997 On October 11, 1948, the Upper Basin States entered into the Upper Colorado River Basin Compact, which apportioned use of the Upper Basin waters among them. The compact permits Arizona to use 50,000 acre-feet of water annually from the upper Colorado River system, and apportioned the remaining water to the Upper Basin States in the following % ages: Colorado, 51.75%; New Mexico, 11.25%; Utah, 23%; and Wyoming, 14%. The Lower Basin States of Arizona, California, and Nevada were not able to reach agreement. In 1952, Arizona filed suit in the United States Supreme Court to determine how the waters of the

Global International Water Assessment Sub-region 27: Gulf of California
23/91
Lower Basin should be divided. In October 1962, the Court ruled that of the first 7,500,000 acre-feet of main stem water in the Lower Basin, California is entitled to 4,400,000 acre-feet, Arizona 2,800,000 acre-feet, and Nevada, 300,000 acre-feet. The United States has contracted with the States of Arizona and Nevada and with various agencies in Arizona and California for the delivery of Colorado River water. These contracts make delivery of the water contingent upon its availability for use in the respective States under the Colorado River Compact and the Boulder Canyon Project Act. The United States and Mexico entered into a treaty on February 3, 1944, which guarantees Mexico 1,500,000 acre-feet of Colorado River water annually. This entitlement is subject to increase or decrease under certain circumstances provided for in the treaty. The US-Mexico Framework The 1944 Treaty Relating to the Utilization of Waters of the Colorado and Tijuana Rivers and of the Rio Grande – also known as the 1944 Water Utilizations Treaty – is considered the centerpiece of the US-Mexico legal framework for managing transboundary waters. It established the binational International Boundary Water Commission (IBWC), which has many responsibilities including oversight of transboundary water allocation (as established in the 1944 treaty and subsequent agreements), management of reclamation works, and development of joint sewage and sanitation facilities. The 1944 Water Utilization Treaty has permitted IBWC’s administration role to evolve in response to emerging needs and circumstances. The commission has assumed responsibility for addressing the persistent problem of high salinity in waters flowing from the United States to Mexico, particularly the Colorado River. Growing concerns about environmental quality in the border region have fostered the creation of several recent binational institutions with responsibilities for transboundary water management. The United States-Mexico Border Environmental Cooperation Agreement (the La Paz Agreement) of 1983 established a process to reduce and prevent various forms of pollution in the border area. Working groups under the La Paz process have collaborated with IBWC to address specific problems, such as sewage and the discharges of hazardous substances into transboundary waters. The Border Environment Cooperation Commission (BECC) is a binational commission established in 1994 to address shortcomings in environmental infrastructure along the US-Mexico border. The Commission was created at the same time as the North American Development Bank (NADBank), both grew out of the North American Free Trade Agreement (NAFTA). BECC and NADbank have been particularly active in providing technical assistance to border communities for water and sanitation projects that meet strict environmental criteria. Another recent binational initiative, the Integrated Border Environmental Plan, or Border XXI, promotes intergovernmental cooperation and public involvement in sustainable development in the border region.

Global International Water Assessment Sub-region 27: Gulf of California
24/91
1.4 Conclusio ns The "Colorado River basin" is by it self a unit that deserves to be studied separated from the rest of the area. The Geographical limits for the Sub-region 27 where chosen on the basis of the totality of the Colorado River basin and the Gulf of California, although only the Upper Gulf of California encompasses the Colorado River watershed. The Socio-economic and environmental problems surrounding the Colorado River focuses mainly in the delta region in the U.S-Mexico border as a result of a reduction of water flows to the delta. Considering the importance of these problems we designated a second subsystem (Colorado River delta) evaluated during the Causal Chain Analysis and Policy Options. The most fundamental problem of the Colorado River basin is that the long-term planned use of the river’s water exceeds the available supply. Because total legal entitlements to water are greater than the river’s average annual flow, the river has been deemed “over apportioned”. Salinity is the mayor water quality issue facing the river basin. The Colorado is naturally salty. Half of the average annual salt load of nine million tons carried past Hoover Dam is attributed to natural sources. Human caused increases in salinity concentration account for the remainder and include saline irrigation return flows, reservoir evaporation, out-of the basin transfers and municipal/industrial uses. Sustainable rural and urban prosperity along the border between the United States and Mexico depends on the availability of suitable water supplies. Agricultural irrigation requires large volumes of water during certain periods of the year, and salt content must be low enough (<1,000 mg/L) to prevent damage to plant roots. Industrial manufacturers, such as offshore assembly industries (maquiladoras) need water for commercial applications (e.g., cleaning, processing, and cooling water). Many border communities are experiencing rapid population growth, which will provide labor for intensive agriculture, maquiladora industries, and cross border work, increasing the demand for industrial water resources. Irrigation projects tend to encourage population densities to increase either because they are part of a resettlement project or because the increased prosperity of the area attracts incomers. Mayor changes should be anticipated and provided for at the project planning stage through, for example, sufficient infrastructure provision. Impacts resulting from changes to the demographic/ethnic composition should also be considered. As with ecological impacts, the socio-economic impacts of irrigation projects will be significant outside the project area. A new project will both place demands on the region (marketing, migration, physical infrastructure) and contribute to regional development. For irrigation schemes to be economically viable, they need to complement other activities in the region and should consider the effects of any other development, such as agro-industries or new roads. Industrial and urban development may adversely affect irrigation schemes by competing for water and reducing the quality of water available. A regional planning system is essential to minimize conflicts and coordinate development.
Global International Water Assessment Sub-region 27: Gulf of California
25/91
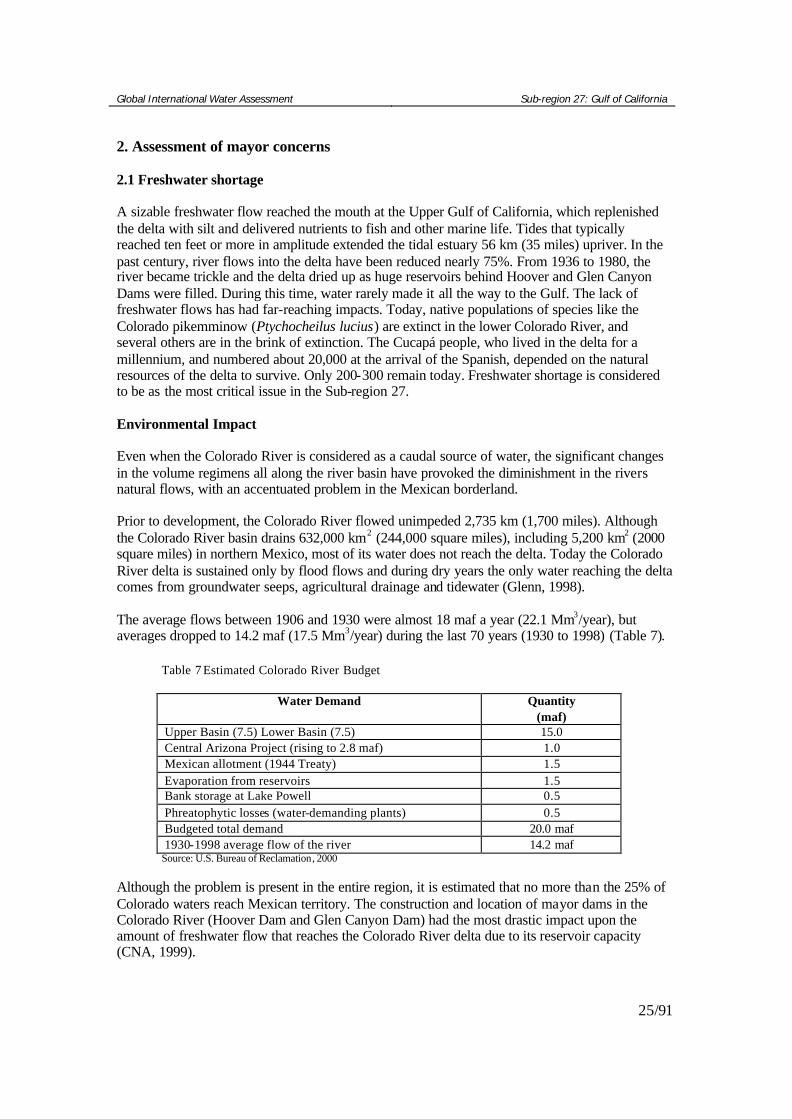
2. Assessment of mayor concerns 2.1 Freshwater shortage A sizable freshwater flow reached the mouth at the Upper Gulf of California, which replenished the delta with silt and delivered nutrients to fish and other marine life. Tides that typically reached ten feet or more in amplitude extended the tidal estuary 56 km (35 miles) upriver. In the past century, river flows into the delta have been reduced nearly 75%. From 1936 to 1980, the river became trickle and the delta dried up as huge reservoirs behind Hoover and Glen Canyon Dams were filled. During this time, water rarely made it all the way to the Gulf. The lack of freshwater flows has had far-reaching impacts. Today, native populations of species like the Colorado pikemminow (Ptychocheilus lucius) are extinct in the lower Colorado River, and several others are in the brink of extinction. The Cucapá people, who lived in the delta for a millennium, and numbered about 20,000 at the arrival of the Spanish, depended on the natural resources of the delta to survive. Only 200-300 remain today. Freshwater shortage is considered to be as the most critical issue in the Sub-region 27. Environmental Impact Even when the Colorado River is considered as a caudal source of water, the significant changes in the volume regimens all along the river basin have provoked the diminishment in the rivers natural flows, with an accentuated problem in the Mexican borderland. Prior to development, the Colorado River flowed unimpeded 2,735 km (1,700 miles). Although the Colorado River basin drains 632,000 km2 (244,000 square miles), including 5,200 km2 (2000 square miles) in northern Mexico, most of its water does not reach the delta. Today the Colorado River delta is sustained only by flood flows and during dry years the only water reaching the delta comes from groundwater seeps, agricultural drainage and tidewater (Glenn, 1998). The average flows between 1906 and 1930 were almost 18 maf a year (22.1 Mm3/year), but averages dropped to 14.2 maf (17.5 Mm3/year) during the last 70 years (1930 to 1998) (Table 7). Table 7 Estimated Colorado River Budget
Water Demand Quantity (maf)
Upper Basin (7.5) Lower Basin (7.5) 15.0 Central Arizona Project (rising to 2.8 maf) 1.0 Mexican allotment (1944 Treaty) 1.5 Evaporation from reservoirs 1.5 Bank storage at Lake Powell 0.5 Phreatophytic losses (water-demanding plants) 0.5 Budgeted total demand 20.0 maf 1930-1998 average flow of the river 14.2 maf
Source: U.S. Bureau of Reclamation, 2000 Although the problem is present in the entire region, it is estimated that no more than the 25% of Colorado waters reach Mexican territory. The construction and location of mayor dams in the Colorado River (Hoover Dam and Glen Canyon Dam) had the most drastic impact upon the amount of freshwater flow that reaches the Colorado River delta due to its reservoir capacity (CNA, 1999).
Global International Water Assessment Sub-region 27: Gulf of California
26/91
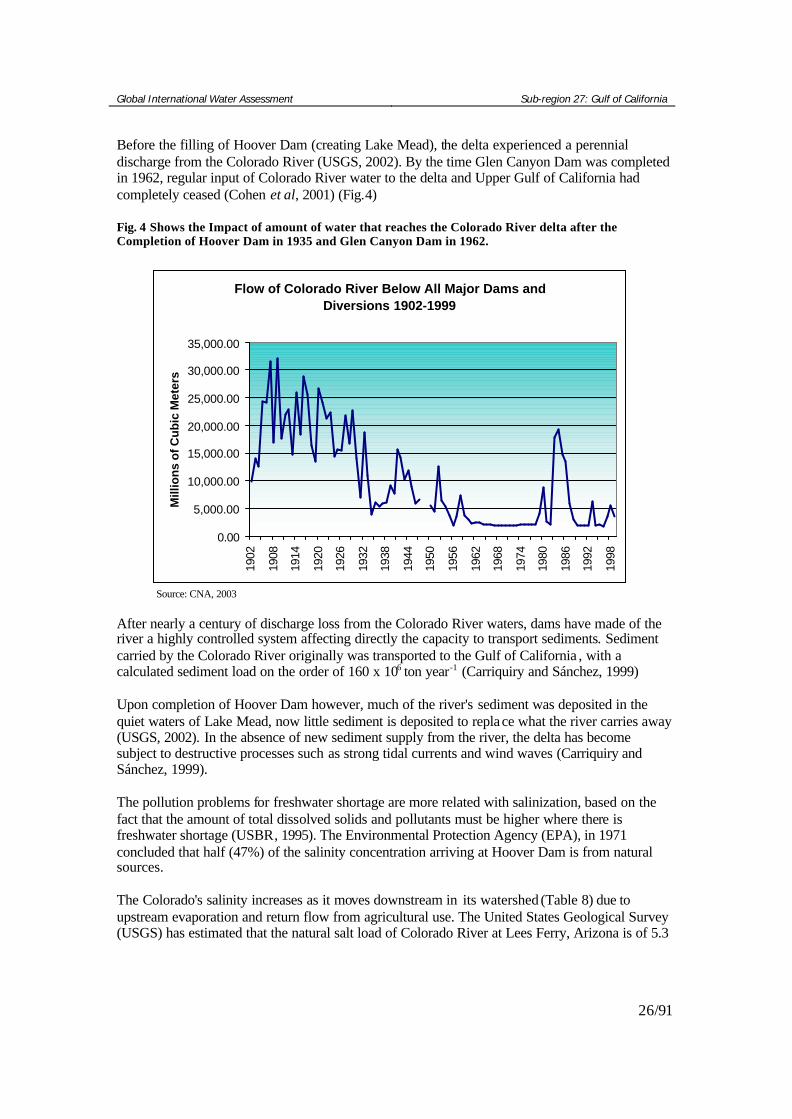
Before the filling of Hoover Dam (creating Lake Mead), the delta experienced a perennial discharge from the Colorado River (USGS, 2002). By the time Glen Canyon Dam was completed in 1962, regular input of Colorado River water to the delta and Upper Gulf of California had completely ceased (Cohen et al, 2001) (Fig.4) Fig. 4 Shows the Impact of amount of water that reaches the Colorado River delta after the Completion of Hoover Dam in 1935 and Glen Canyon Dam in 1962.
Flow of Colorado River Below All Major Dams and Diversions 1902-1999
0.00
5,000.00
10,000.00
15,000.00
20,000.00
25,000.00
30,000.00
35,000.00
1902
1908
1914
1920
1926
1932
1938
1944
1950
1956
1962
1968
1974
1980
1986
1992
1998
Mill
ion
s o
f Cu
bic
Met
ers
Source: CNA, 2003 After nearly a century of discharge loss from the Colorado River waters, dams have made of the river a highly controlled system affecting directly the capacity to transport sediments. Sediment carried by the Colorado River originally was transported to the Gulf of California , with a calculated sediment load on the order of 160 x 106 ton year-1 (Carriquiry and Sánchez, 1999) Upon completion of Hoover Dam however, much of the river's sediment was deposited in the quiet waters of Lake Mead, now little sediment is deposited to replace what the river carries away (USGS, 2002). In the absence of new sediment supply from the river, the delta has become subject to destructive processes such as strong tidal currents and wind waves (Carriquiry and Sánchez, 1999). The pollution problems for freshwater shortage are more related with salinization, based on the fact that the amount of total dissolved solids and pollutants must be higher where there is freshwater shortage (USBR, 1995). The Environmental Protection Agency (EPA), in 1971 concluded that half (47%) of the salinity concentration arriving at Hoover Dam is from natural sources. The Colorado's salinity increases as it moves downstream in its watershed (Table 8) due to upstream evaporation and return flow from agricultural use. The United States Geological Survey (USGS) has estimated that the natural salt load of Colorado River at Lees Ferry, Arizona is of 5.3

Global International Water Assessment Sub-region 27: Gulf of California
27/91
million tons a year. The Bureau of Reclamation (USBR, 1995) has determined that the salt load currently entering Lake Mead is about 9 million tons annually. Table 8 Salinity in the Delta Region
Total Dissolved Solids Sample Point Non-Flood Year
(mg/l) Flood
Year (mg/l) Colorado River at Hoover Dama 723 - Colorado River at Parker Dama 747 - Colorado River at Imperial Damb 784 713 Colorado River at NIBb 906 760 Other deliveries near SIBb 1,274 1,222 MODE (Main Outlet Drain Extension Canal)b 2,838 2,045 New River at Borderc 2,836 2,583 Hardy Riverc 1,810 560 Ciénega de Santa Clarac 3,000 5,000 Salton Seab 42,271 43,304
Source: a. MWD; USBR, 1998, b. USBR; IBWC 1991-98, c. Valdés-Casillas et al, 1998 The increase of total dissolved solids originated by erosion decreases the flood plain areas ecosystems and affects local fisheries. Studies have shown the effect of salinity on growth rate of penaeid postlarvae. During 1993 and 1997 the amount of freshwater discharged by the river diluted the salinity of the Upper Gulf of California, possibly expanding shrimp postlarvae habitat, considering that low salinity is reported as preferred by Litopenaeus stylirostris (Aragón-Noriega and Calderón-Aguilar, 2000). The relative abundance of postlarvae had the same pattern of the river flow (Table 9). The correlation was high and significant (r = 0.8815; p ‹ 0.05). On years 1994 and 1996 the salinity in UGC was higher than marine water. Presence of postlarvae was still observed during this period, but at a lower concentration than in those years when the Colorado River discharged water. Table 9 Changes in relative abundance of postlarvae during a 5 year period, due to an unusual high amount of freshwater flow from the Colorado River into the Upper Gulf of California (UGC)
Year Location River Flow (X 106 m3)
Average
Postlarvae relative abundance (Pl/m3)
Average
Standard error 1993 1994 1995 1996 1997
UGC UGC UGC UGC UGC
312.01 67.28 76.25 71.42
115.65
43.6 a 11.63 b 11.20 b 16.01 b 33.32 c
13.6 1.35 2.25 3.37 8.06
Source: Aragón-Noriega and Calderón-Aguilar, 2000 During low rainfall years in the Colorado Basin, there is insufficient water for full agricultural production in the Mexicali Valley, given current water use practices. In addition to the increased levels of suspended solids, including salts, there is some evidence of agricultural chemicals and pesticides (DDT, DDE and DDD) entering surface streams through the sewage systems and through urban runoff. In the Mexicali and Imperial valleys there is considerable concern about contamination of surface streams and aquifers by these chemicals (CNA, 2000).
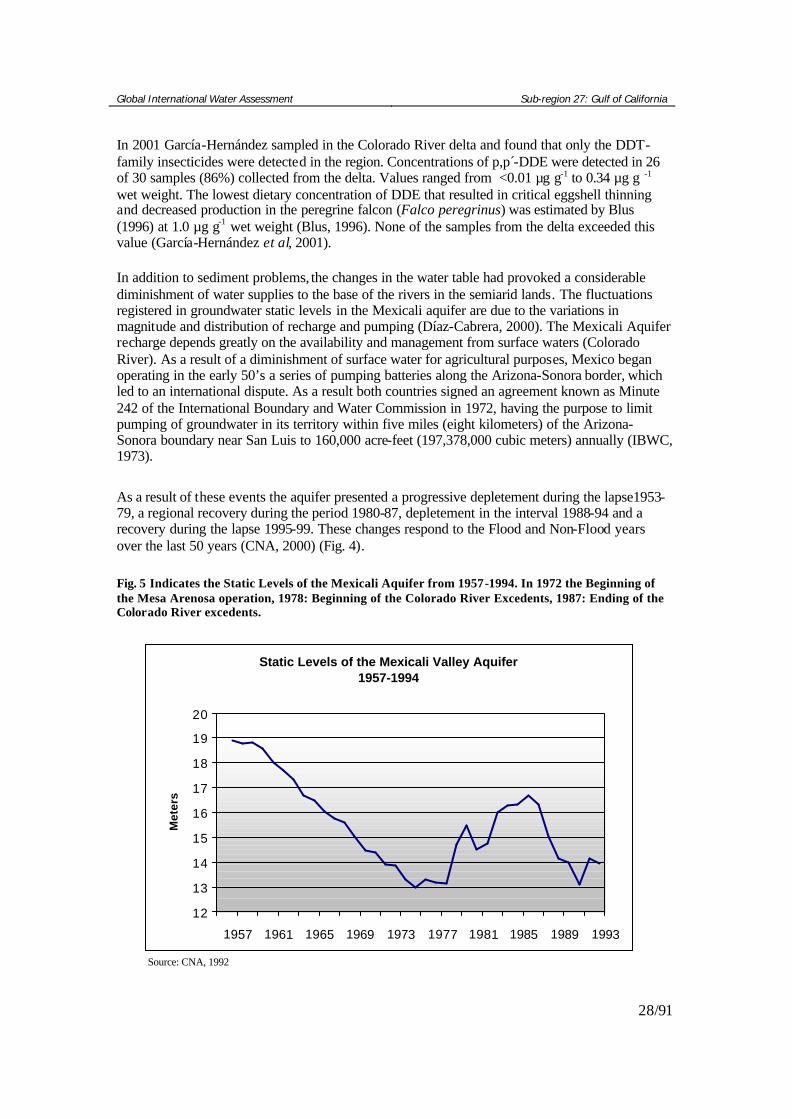
Global International Water Assessment Sub-region 27: Gulf of California
28/91
In 2001 García-Hernández sampled in the Colorado River delta and found that only the DDT-family insecticides were detected in the region. Concentrations of p,p -́DDE were detected in 26 of 30 samples (86%) collected from the delta. Values ranged from <0.01 µg g-1 to 0.34 µg g -1 wet weight. The lowest dietary concentration of DDE that resulted in critical eggshell thinning and decreased production in the peregrine falcon (Falco peregrinus) was estimated by Blus (1996) at 1.0 µg g-1 wet weight (Blus, 1996). None of the samples from the delta exceeded this value (García-Hernández et al, 2001). In addition to sediment problems, the changes in the water table had provoked a considerable diminishment of water supplies to the base of the rivers in the semiarid lands. The fluctuations registered in groundwater static levels in the Mexicali aquifer are due to the variations in magnitude and distribution of recharge and pumping (Díaz-Cabrera, 2000). The Mexicali Aquifer recharge depends greatly on the availability and management from surface waters (Colorado River). As a result of a diminishment of surface water for agricultural purposes, Mexico began operating in the early 50’s a series of pumping batteries along the Arizona-Sonora border, which led to an international dispute. As a result both countries signed an agreement known as Minute 242 of the International Boundary and Water Commission in 1972, having the purpose to limit pumping of groundwater in its territory within five miles (eight kilometers) of the Arizona-Sonora boundary near San Luis to 160,000 acre-feet (197,378,000 cubic meters) annually (IBWC, 1973). As a result of these events the aquifer presented a progressive depletement during the lapse1953-79, a regional recovery during the period 1980-87, depletement in the interval 1988-94 and a recovery during the lapse 1995-99. These changes respond to the Flood and Non-Flood years over the last 50 years (CNA, 2000) (Fig. 4). Fig. 5 Indicates the Static Levels of the Mexicali Aquifer from 1957-1994. In 1972 the Beginning of the Mesa Arenosa operation, 1978: Beginning of the Colorado River Excedents, 1987: Ending of the Colorado River excedents.
Static Levels of the Mexicali Valley Aquifer1957-1994
12
13
14
15
16
17
18
19
20
1957 1961 1965 1969 1973 1977 1981 1985 1989 1993
Met
ers
Source: CNA, 1992
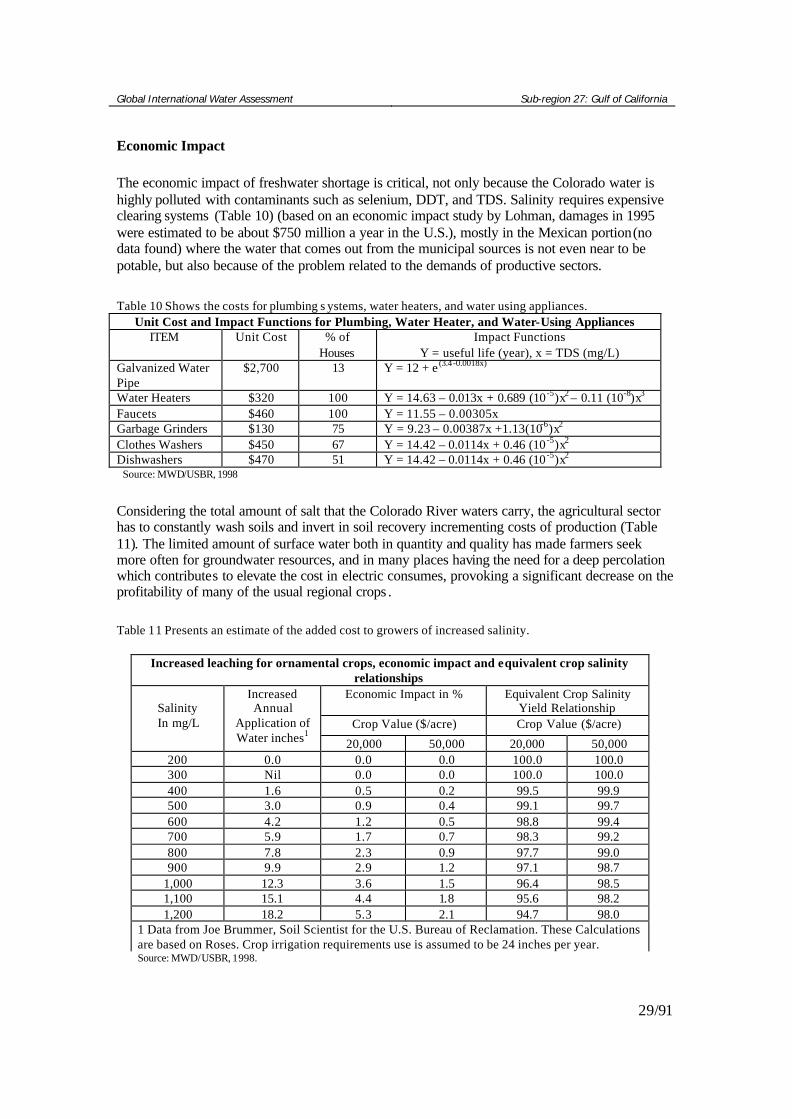
Global International Water Assessment Sub-region 27: Gulf of California
29/91
Economic Impact The economic impact of freshwater shortage is critical, not only because the Colorado water is highly polluted with contaminants such as selenium, DDT, and TDS. Salinity requires expensive clearing systems (Table 10) (based on an economic impact study by Lohman, damages in 1995 were estimated to be about $750 million a year in the U.S.), mostly in the Mexican portion (no data found) where the water that comes out from the municipal sources is not even near to be potable, but also because of the problem related to the demands of productive sectors. Table 10 Shows the costs for plumbing s ystems, water heaters, and water using appliances.
Unit Cost and Impact Functions for Plumbing, Water Heater, and Water-Using Appliances ITEM Unit Cost % of
Houses Impact Functions
Y = useful life (year), x = TDS (mg/L) Galvanized Water Pipe
$2,700 13 Y = 12 + e (3.4-0.0018x)
Water Heaters $320 100 Y = 14.63 – 0.013x + 0.689 (10 -5)x2 – 0.11 (10-8)x3 Faucets $460 100 Y = 11.55 – 0.00305x Garbage Grinders $130 75 Y = 9.23 – 0.00387x +1.13(10-6)x2 Clothes Washers $450 67 Y = 14.42 – 0.0114x + 0.46 (10 -5)x2 Dishwashers $470 51 Y = 14.42 – 0.0114x + 0.46 (10 -5)x2 Source: MWD/USBR, 1998
Considering the total amount of salt that the Colorado River waters carry, the agricultural sector has to constantly wash soils and invert in soil recovery incrementing costs of production (Table 11). The limited amount of surface water both in quantity and quality has made farmers seek more often for groundwater resources, and in many places having the need for a deep percolation which contributes to elevate the cost in electric consumes, provoking a significant decrease on the profitability of many of the usual regional crops . Table 11 Presents an estimate of the added cost to growers of increased salinity.
Increased leaching for ornamental crops, economic impact and equivalent crop salinity relationships
Economic Impact in % Equivalent Crop Salinity Yield Relationship
Crop Value ($/acre) Crop Value ($/acre)
Salinity In mg/L
Increased Annual
Application of Water inches1 20,000 50,000 20,000 50,000
200 0.0 0.0 0.0 100.0 100.0 300 Nil 0.0 0.0 100.0 100.0 400 1.6 0.5 0.2 99.5 99.9 500 3.0 0.9 0.4 99.1 99.7 600 4.2 1.2 0.5 98.8 99.4 700 5.9 1.7 0.7 98.3 99.2 800 7.8 2.3 0.9 97.7 99.0 900 9.9 2.9 1.2 97.1 98.7
1,000 12.3 3.6 1.5 96.4 98.5 1,100 15.1 4.4 1.8 95.6 98.2 1,200 18.2 5.3 2.1 94.7 98.0
1 Data from Joe Brummer, Soil Scientist for the U.S. Bureau of Reclamation. These Calculations are based on Roses. Crop irrigation requirements use is assumed to be 24 inches per year.
Source: MWD/USBR, 1998.

Global International Water Assessment Sub-region 27: Gulf of California
30/91
The Mexican portion of the river receives a guarantee delivery of 1,850 Mm3 (1.5 maf) stipulated in the 1944 U.S.-Mexico Water Treaty, but provides for a pro rata reduction in times of shortages. “In the event of extraordinary drought or serious accident to the irrigation system in the United States, thereby making it difficult for the United States to deliver the guaranteed quantity of 1,500,000 acre -feet (1,850,234,000 cubic meters) a year, the water allotted to Mexico under subparagraph (a) of Article10 of the 1944 Mexican Water Treaty will be reduced in the same proportion as consumptive uses in the United States are reduced ” (IBWC, 1944). Although all of the Colorado River water that reaches Mexico is diverted to Mexicali and the San Luis Rio Colorado irrigation districts, the second main source of water supply for irrigation is groundwater. The All American Canal originates at a reservoir behind Imperial Dam on the Colorado River. The 80-mile canal carries two-thirds of the 5.3 million acre-feet per year (6.5 Mm3/year) of water that California has recently been drawing from the Colorado River. Ultimately the state will be limited to 4.4 million acre-feet per year (5.4 Mm3/year). Some three million acre-feet per year (3.7 Mm3/year) is now applied to farmland in the Imperial Valley. In past millenniums the Colorado River emptied about half the time into the Gulf of California and half the time into the Salton Sea, forming the ancient Lake Cahuilla. The Colorado River historically is the main source of water that feeds the Mexicali Aquifer. Due to its characteristics it is one of the regional aquifers with most capacity. With the construction of Hoover Dam in 1935, the amount of water that recharges the acuifer decreased drastically, now ironically depending greatly on water seepage from the All American Canal, due to the physiographical and geological conditions in which they rely. To conserve water formerly lost through seepage 49 miles of the 123-mile Coachella Canal have recently been rebuilt and lined with concrete. The new section, is expected to save 132,000 acre-feet of water per year (162,000 cubic meters/year), reducing the amount drawn from the Colorado River via the All-American Canal from 498,000 acre-feet per year to 366,000 acre-feet. Since 1990 the U.S. government is seeking to line the nearby All American Canal (48 km) to reduce seepage into the U.S. and the Mexicali aquifers. The U.S. loss is an estimate of 100 Mm3/year of water, from what 90% infiltrates into Mexican territory (Mexicali Valley) (CNA, 2000). This plan anticipates lying down agricultural lands in the Imperial Valley and transferring water once used for agricultural purposes to the Metropolitan Water District San Diego. This plan would leave 2000 Mexican day laborers unemployed, without considering the economic costs in agricultural lands in Mexicali, Tijuana and Sonora. If the work is to be completed the Mexicali aquifer would loss 70 Mm3/year of water extracted mainly for agricultural purposes, leaving 1,200 ha of agricultural land that would stop being profitable (Cortéz-Lara, 1999). These 100 Mm3/year are used to supply 400 wells in lands where 1,000 producers already labor. Major relevance is giving to the size of sectors affected and to the severity of cases, due to immediate consequences in the regional and local economies.

Global International Water Assessment Sub-region 27: Gulf of California
31/91
Health Impact At a regional context the people affected in their health by the problem is still reduced. But In Mexico for example only the 85% of the population have free access to relatively potable water. The mayor concerns in health impacts are related to the absence of water for cleaning duties and demands increase for human consume during the summer season. However the severity of impact, when present, is highly severe (over 25 million people depend on the Colorado Rivers water) because water is an essential element for human survival. The frequency of cases with health problems due to water shortage is still considered as occasional. Social and Community Impact Only small portions of community faces real problems with water disposition, however when present the problem is vital due to the dependence of human activities in the resource. The livelihood of indigenous groups like the Cucapá people has been drastically affected by the lack of sufficient water flows into the Delta. For example, they are no longer able to harvest Palmer’s salt grass (Distichilis palmeri), a wild grain on which they relied for subsistence. The salt grass has limited reproductive capability without regular flooding to disperse seeds. Diminished flows in the River have forced many Cucapá to haul their boats miles to reach the nearest waterways to fish, and many travel further to find work in the agricultural fields of Mexicali Valley. No longer able to practice traditional subsistence fishing, hunting and gathering, the Cucapá now work as hunting and fishing guides, and sell their arts and crafts to tourists. The impact degree is considered as severe, and the limitation in water supplies is almost chronicle for the regional society. In the U.S. portion of the basin, Indian tribes are currently in the process of having previously unrecognized water rights granted and quantified, one of the most significant problems for all the stakeholders of the Colorado River is the complicated nature of the quantification process (Morrison et al, 1996). While there has been considerable disagreement over both the quantity of water and the manner in which control should be balanced between the federal government and the Indian tribes themselves. Therefore, any Colorado River management plan developed with the Bureau’s participation will have to address the water needs and rights of Indian tribes in the basin (Morrison et al, 1996). Mayor attention is given to the severity of the impact and the frequency because considered determinant for the development of human settlements. Conclusions and future outlook Since freshwater shortage has been identified as one of the greatest problems in the area, and the increase of uses, population and production are also going up; the scenario in this category has a significant deterioration trend over the next 20 years. In general terms, most of the experts associate the agriculture sector crisis to this issue and state and local governments claim this factor as an essential condition for the loss or attraction of investment to their territories.
Global International Water Assessment Sub-region 27: Gulf of California
32/91
Due to the geographic conditions of the area, we can expect this problem to maintain; furthermore the challenge is set for the improvement of water services, reducing the pressure over the resource and increasing its profitability. Health problems do not show a significant deterioration with the reduction of water supplies. Instead, trends show a low impact on general society. Although the water distribution schemes for the next 20 years seem complicated, considering the challenges to establish a water balance for the water re-assignation, therefore we can expect more and more conflicts between Mexico and US. Water issues concerning Indian American tribes and local communities (Cucapa), must be resolved as a fundamental part of any long-term management strategy for the Colorado River basin. Due to the Rio Grande crisis, both governments are now urged to take some decisions, which include radical changes in their legal framework. The primary tributary of the Rio Grande is the Rio Conchos, which flows out of the high desert of Mexico and fills the reservoirs that provide water for Texan farmers. Under the 1944 treaty, Mexico must send about 350,000 acre-feet (431,721 m3) water annually into the Rio Grande. The United States, in turn, releases 1.5 million acre-feet (1,850 Mm3) of Colorado River water to Mexico. Since 1992, Mexico has fallen more than 1.5 million acre-feet of water in arrears, due to a severe drought in the region, making a water war between farmers on both sides of the border, escalating into an international standoff (Yardley, 2002). The implication of these new regulations will have a tremendous impact on socioeconomic terms in both sides of the border. We envision a slow readjusting time due to the bureaucracy of political agreements. However there are important on going political processes in the region, as is the case of California, which is expected to present a water re-estructuration for the end of the year. 2.2 Pollution Although much of the pollution problems relate to salinization, water from tributaries brings leached chemicals from mining, industrial, municipal and agricultural operations, making water pollution a main problem in the Colorado River basin. Contaminant levels may be concentrated as some of the water is moved by pipelines outside the watershed. For it has long been understood that upstream users must be mindful of the quantity and quality of water they send downstream. Salinity among all pollutants in the Colorado River has been focused as a mayor problem in the Colorado River basin and the U.S.-Mexico relations since the early 1940’s. A variety of salinity control programs have been implemented in the Colorado River basin in response to Mexico’s concerns over salinity and salinity standards within the U.S. States. In an ecological context one of the major threats in the Colorado River wetlands is selenium and pesticides. Selenium can be bioaccumulated to levels toxic for wildlife and causes high rates of embryonic mortality and deformity. Selenium is a naturally occurring element originated from cretaceous formations in the Upper Colorado River and, due to its high solubility, is distributed along the Colorado River waters. Since the early 1970’s, there has been concern about the possibility of pesticide transport from the Mexicali Valley into the Upper Gulf. Pesticide levels

Global International Water Assessment Sub-region 27: Gulf of California
33/91
were found in organisms of the Mexicali Valley irrigation canals and the Upper Gulf of California. Environmental Impact The Colorado River is considered as mayor water polluted distributor since it carries a considerable amount of pollutants such as selenium, TDS, pesticides and the intensive contamination by chemical wastes (perchlorate, chromium 6, and MTBE) by the industry and the agricultural sector. The New River in south central California flows in from Mexico where it receives a variety of wastewater flows. Each year Mexicali, a Mexican border city, discharges about 40,000 acre-feet (4.9 x 10⁷ m3) of effluent into the International Boundary and flows north through Mexicali, crossing the border into California’s Imperial Valley. About 70 km (45 miles) to the north, it empties into California’s Salton Sea. Although some of Mexicali’s effluent is treated, raw sewage and industrial waste often flow directly into the New River through storm drains and other outlets. The New River is considered one of the most polluted rivers in the United States (Lueck et al, 1999). The nutrient rich-inflows that reach the Salton Sea facilitate extremely high biomass production in the Salton Sea, yet these same inflows have also created eutrophic conditions in the Sea. Eutrophication is responsible for the deaths of millions of fish in the Salton Sea, and may be responsible for creating an environment that fosters the spread of avian deseases (Setmire et al, 1993; USGS, 1996; Costa-Pierce, 1997; USBR et al, 1997; USFWS, 1997) Table 12 Displays recommended Phosphorus and Nitrogen loading levels and Annual Areal loading of the Salton Sea. Source: Primary data collection by CRWQCB 1980-92. Data Compiled by Richard Thiery, CVWD, in Cagle 1998 Selenium and salinity are of the most important concerns for the environment since they are the two mayor contributors to the regional water pollution. Extremely high concentrations of Se, 1,300 µg/L, were found in water from shallow wells sampled in the upstream reaches of the Colorado and Uncompahgre river valleys, located in the extensive alluvium and residuum of the Cretaceous Mancos shale (Presser et al., 1994). The Bioaccumulation of selenium (Se) has created toxicity problems for wildlife in the Ciénega de Santa Clara, in the east side of the Colorado River delta (García -Hernández, 1998). Concentrations in water ranged from 5-19 mg/L, increasing along a salinity gradient. Although water levels of selenium exceeded EPA criterion (.73 µg/g wet wt) for the protection of freshwater aquatic life, selenium levels in sediments (0.8-1.8 mg/g), plants (0-0.17 mg/g) and fish (2.5-6.4 mg/g) from the Ciénega de Santa Clara do not exceeded background levels found along the lower Colorado River ecosystems.
Grams/cubic meter Permisible Dangerous Salton Sea
Phosphorus Nitrogen Phosphorus Nitrogen Phosphorus Nitrogen 0.1 1.5 0.2 3.0 1.19 15.4

Global International Water Assessment Sub-region 27: Gulf of California
34/91
Table 13 Concentrations of Selenium in biota composite samples from the Colorado River delta
Species
No
Selenium (ppm
dry weight) Double-Breasted Cormorant (Phalocrocorax auritas) 9 16.7
Cattle egret (Bubulcus ibis) 15 4.6
Red Winged blackbird (Agelaius phoeniceus) 8 5.1
Great-tailed grackle (Quiscalus mexicanus) 14 5.3
Mourning dove (Zenaida macroura) 15 2.3
Tilapia (Tilapia zilii) 6 6.8
Largemouth bass* (Micropterus salmoides) 11 5.1 Source: Mora and Anderson 1995, *García-Hernández et al. 2000 Although, the use of DDT was banned in Mexico for agricultural use in 1978 due to its persistence in the environment and to the rejection by other countries of DDT contaminated products (Canseco-González et al., 1997). Nevertheless, 230,000 kg of DDT were used in 1971in the Mexicali Valley, Mexico, which left residual concentrations of DDE in wildlife (García-Hermández et al., 2001). Pesticides such as DDE, DDT and DDD were detected in fish and invertebrate sample d from the delta wetlands. The DDE: DDT ratio was lower than 50, which is thought to indicate recent exposure to the parent compound (Mora, 1997). Neverthless, under unknown exposure conditions, these ratios may not be indicative of recent DDT use but of long persistence and heavy use of DDT in the past (Mora, 1997), due that pesticides, like selenium tend to bioaccumulate. A pesticide study on cattle egrets (Bubulcus ibis) from the Mexicali Valley, concluded that hatching success was not significantly affected by DDE or other organochlorines (Mora, 1997). However, more studies are required to determine if organochlorine, organophosphates or carbamates pesticides as well as herbicides, are affecting the density of insects in the delta wetlands, which could potentially impact the habitat quality for insectivourous migratory birds. Waste left from the Atlas uranium mill near Moab, Utah, is poisoning endangered fish that live in the Colorado River, according to the USGS’s National Water-Quality Assessment Program - Upper Colorado River Basin. The USGS study conducted from August 1998 to February 2000, shows that 10.5 million tons of waste left from the mill are poisoning four endangered fish species in the Colorado River. The Atlas mill has leaked ammonia and other poisonous contaminants into the river for the past 40 years. The USGS study confirms that ammonia levels are far too high for the fish to survive. According to the report, ammonia levels in a stretch of the Colorado River about three miles north of Moab are as high as 1,500 milligrams per liter, greatly exceeding the 12 milligrams per liter that the fish can survive. When researchers put experimental fish into the river below the waste site, most of them died in less than one hour. The same area has been designated as critical habitat for the recovery of the endangered Colorado pike minnow, the razorback sucker, the humpback chub and the bony-tail chub.
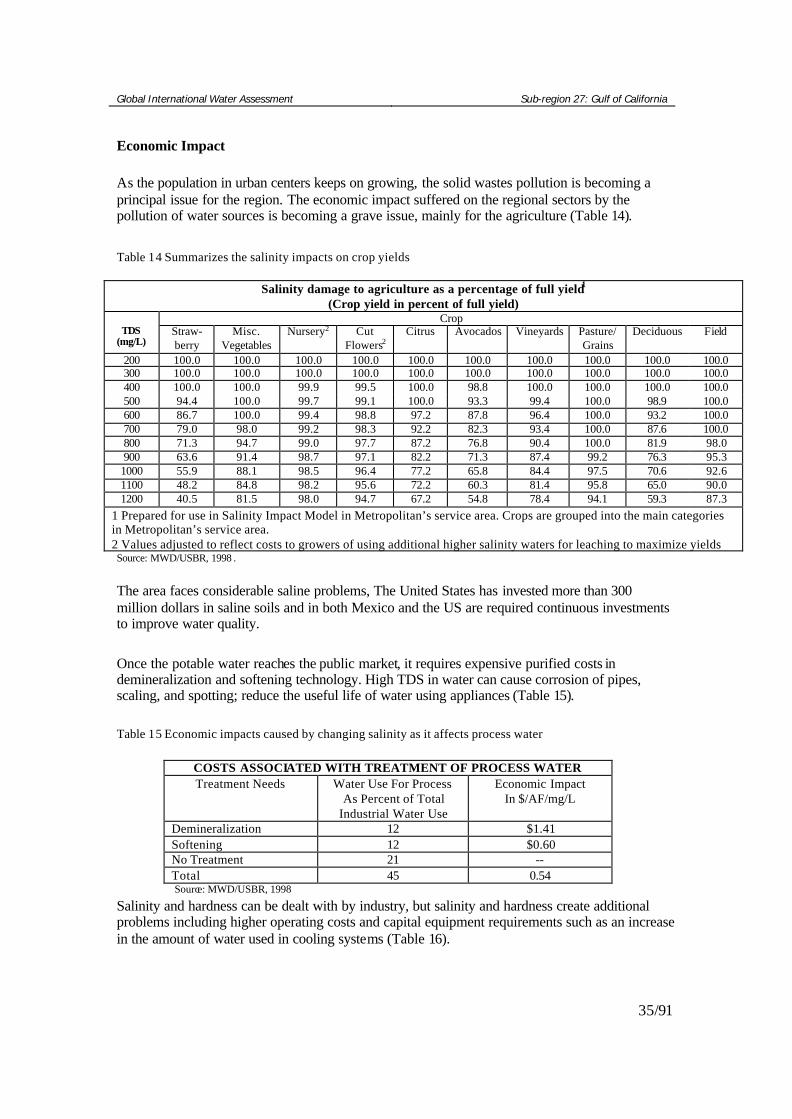
Global International Water Assessment Sub-region 27: Gulf of California
35/91
Economic Impact As the population in urban centers keeps on growing, the solid wastes pollution is becoming a principal issue for the region. The economic impact suffered on the regional sectors by the pollution of water sources is becoming a grave issue, mainly for the agriculture (Table 14). Table 14 Summarizes the salinity impacts on crop yields
Salinity damage to agriculture as a percentage of full yield1 (Crop yield in percent of full yield)
Crop TDS
(mg/L) Straw- berry
Misc. Vegetables
Nursery2 Cut Flowers2
Citrus Avocados Vineyards Pasture/ Grains
Deciduous Field
200 100.0 100.0 100.0 100.0 100.0 100.0 100.0 100.0 100.0 100.0 300 100.0 100.0 100.0 100.0 100.0 100.0 100.0 100.0 100.0 100.0 400 100.0 100.0 99.9 99.5 100.0 98.8 100.0 100.0 100.0 100.0 500 94.4 100.0 99.7 99.1 100.0 93.3 99.4 100.0 98.9 100.0 600 86.7 100.0 99.4 98.8 97.2 87.8 96.4 100.0 93.2 100.0 700 79.0 98.0 99.2 98.3 92.2 82.3 93.4 100.0 87.6 100.0 800 71.3 94.7 99.0 97.7 87.2 76.8 90.4 100.0 81.9 98.0 900 63.6 91.4 98.7 97.1 82.2 71.3 87.4 99.2 76.3 95.3
1000 55.9 88.1 98.5 96.4 77.2 65.8 84.4 97.5 70.6 92.6 1100 48.2 84.8 98.2 95.6 72.2 60.3 81.4 95.8 65.0 90.0 1200 40.5 81.5 98.0 94.7 67.2 54.8 78.4 94.1 59.3 87.3
1 Prepared for use in Salinity Impact Model in Metropolitan’s service area. Crops are grouped into the main categories in Metropolitan’s service area. 2 Values adjusted to reflect costs to growers of using additional higher salinity waters for leaching to maximize yields Source: MWD/USBR, 1998 .
The area faces considerable saline problems, The United States has invested more than 300 million dollars in saline soils and in both Mexico and the US are required continuous investments to improve water quality. Once the potable water reaches the public market, it requires expensive purified costs in demineralization and softening technology. High TDS in water can cause corrosion of pipes, scaling, and spotting; reduce the useful life of water using appliances (Table 15). Table 15 Economic impacts caused by changing salinity as it affects process water
COSTS ASSOCIATED WITH TREATMENT OF PROCESS WATER Treatment Needs Water Use For Process
As Percent of Total Industrial Water Use
Economic Impact In $/AF/mg/L
Demineralization 12 $1.41 Softening 12 $0.60 No Treatment 21 -- Total 45 0.54
Source: MWD/USBR, 1998
Salinity and hardness can be dealt with by industry, but salinity and hardness create additional problems including higher operating costs and capital equipment requirements such as an increase in the amount of water used in cooling systems (Table 16).

Global International Water Assessment Sub-region 27: Gulf of California
36/91
Table 16 Illustrates that the increased amount of water required with increased salinity is about 0.00069 times the increase in the salinity in the range of 500 to 600 mg/L. Thus a 100-mg/L increase in salinity would require nearly a 7% in crease in cooling water use.
Water purchased at retail $700/AF Disposal of blow down water $600/AF Chemicals $150/AF Total $1,450/AF
Costs = AF x increase in TDS x .00069 x $1450 = AF x increase in TDS x $1.00
Source: MWD/USBR, 1998 Many industries require water with very low salinity and treatment is required regardless of the salinity of supplied water. These include pharmaceutical, biotech, electronics and micro chip manufacturers (Table 17). Table 17 Industrial water use by category in Southwestern California
PROFILE OF INDUSTRIAL WATER USE Typical Percent of Water Use by Purpose2 Category Percent of Total
Industrial Use1 Process Boiler Cooling Sanit & Irrig.
Total
Electronics (367) 10.84 50.00 2.00 18.00 30.00 100.00 Aircraft (372) 9.72 50.50 2.20 8.80 38.50 100.00 Petroleum Refining (291) 8.29 14.00 36.00 48.00 2.00 100.00 Preserved Fruits (203) 6.61 58.00 17.00 19.00 6.00 100.00 Beverages (208) 6.23 79.40 11.30 7.20 2.10 100.00 Paper Mills (262) 5.12 3 62.00 21.00 9.00 8.00 100.00 Guided Missiles (376) 4.87 10.00 3.50 37.50 49.00 100.00 Communications (366) 4.15 27.00 2.00 39.00 32.00 100.00 Textile Finishing (226) 2.55 4 81.00 16.00 0.00 3.00 100.00 Metal Products (347) 2.27 3 13.00 5.00 24.00 58.00 100.00 Office/Computing (357) 2.17 46.00 1.00 22.00 31.00 100.00 Ships/Boats (373) 2.10 6 67.00 2.00 16.50 14.50 100.00 Dairy (202) 1.85 7 10.00 1.00 20.00 69.00 100.00 Sub Totals (Weighed Averages): 44.93 10.75 21.17 23.15 100.00 Other Manufacturing 33.23 8 44.93 10.75 21.17 23.15 100.00 Totals (Weighed Average): 44.93 10.75 21.17 23.15 100.00 1 Data obtained from “Commercial and Industrial Water Use in Southwestern California.” March 1990 2 Data from “Cost of Industrial Water Shortages.” November 1991. 3 Assumed typical percent of Water Use for Paper Mills – Paperbond 4 Based on information from Central Basin in MWD based on experience from service to textile plant 5 Assumed typical percent of Water Use for Metal Products – Fabricated Metals 6 Assumed typical percent of Water Use for Ship/Board – Motor Vehicles 7 Estimated 8 Assumes other manufacturing has same use profile as those listed (weighed average) Source: MWD/USBR, 1998
The pollution problems are considered continuous and historical. The salinity of waters delivered to Mexico increased markedly in the winter of 1961-62, increasing from less than 1,000 mg/l in prior years to 2,600 mg/l. Mexico protested the increase. In 1962, the presidents of the United
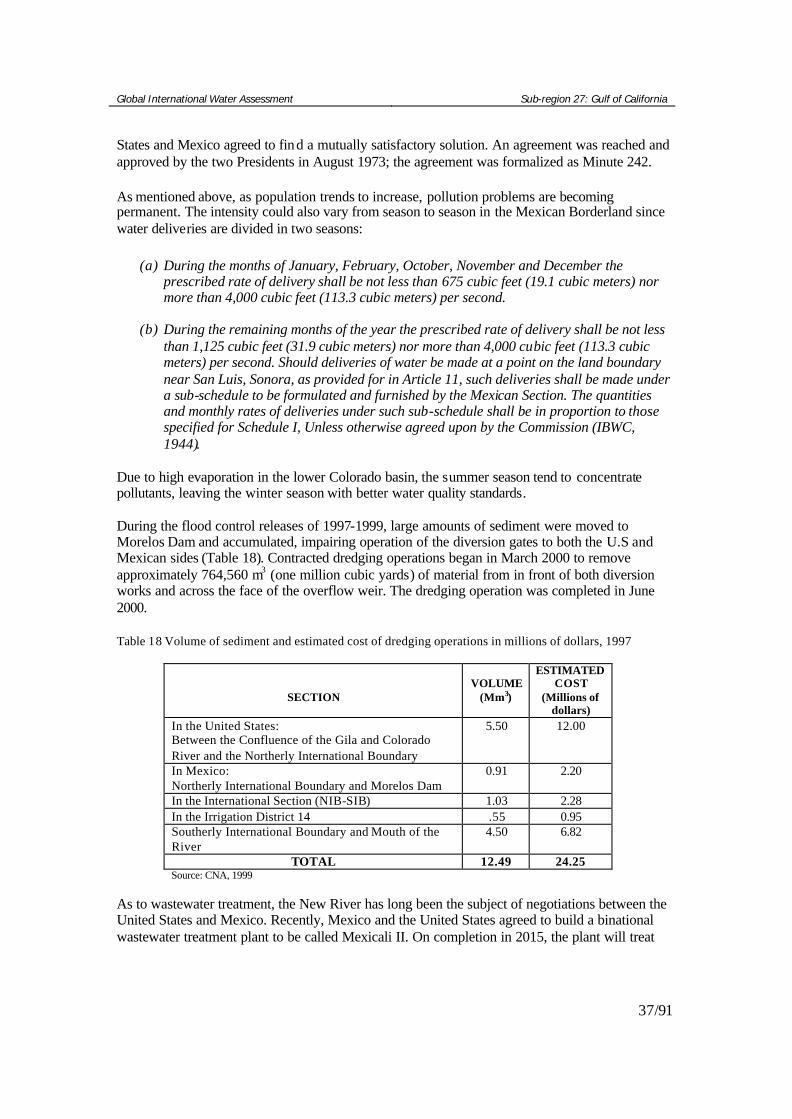
Global International Water Assessment Sub-region 27: Gulf of California
37/91
States and Mexico agreed to find a mutually satisfactory solution. An agreement was reached and approved by the two Presidents in August 1973; the agreement was formalized as Minute 242. As mentioned above, as population trends to increase, pollution problems are becoming permanent. The intensity could also vary from season to season in the Mexican Borderland since water deliveries are divided in two seasons:
(a) During the months of January, February, October, November and December the prescribed rate of delivery shall be not less than 675 cubic feet (19.1 cubic meters) nor more than 4,000 cubic feet (113.3 cubic meters) per second.
(b) During the remaining months of the year the prescribed rate of delivery shall be not less
than 1,125 cubic feet (31.9 cubic meters) nor more than 4,000 cubic feet (113.3 cubic meters) per second. Should deliveries of water be made at a point on the land boundary near San Luis, Sonora, as provided for in Article 11, such deliveries shall be made under a sub-schedule to be formulated and furnished by the Mexican Section. The quantities and monthly rates of deliveries under such sub-schedule shall be in proportion to those specified for Schedule I, Unless otherwise agreed upon by the Commission (IBWC, 1944).
Due to high evaporation in the lower Colorado basin, the summer season tend to concentrate pollutants, leaving the winter season with better water quality standards. During the flood control releases of 1997-1999, large amounts of sediment were moved to Morelos Dam and accumulated, impairing operation of the diversion gates to both the U.S and Mexican sides (Table 18). Contracted dredging operations began in March 2000 to remove approximately 764,560 m3 (one million cubic yards) of material from in front of both diversion works and across the face of the overflow weir. The dredging operation was completed in June 2000. Table 18 Volume of sediment and estimated cost of dredging operations in millions of dollars, 1997
SECTION
VOLUME
(Mm3)
ESTIMATED COST
(Millions of dollars)
In the United States: Between the Confluence of the Gila and Colorado River and the Northerly International Boundary
5.50 12.00
In Mexico: Northerly International Boundary and Morelos Dam
0.91 2.20
In the International Section (NIB-SIB) 1.03 2.28 In the Irrigation District 14 .55 0.95 Southerly International Boundary and Mouth of the River
4.50 6.82
TOTAL 12.49 24.25 Source: CNA, 1999 As to wastewater treatment, the New River has long been the subject of negotiations between the United States and Mexico. Recently, Mexico and the United States agreed to build a binational wastewater treatment plant to be called Mexicali II. On completion in 2015, the plant will treat

Global International Water Assessment Sub-region 27: Gulf of California
38/91
more than 37 million gallons per day (mgd) (1,645 liters/sec) and serve a projected population of more than half a million people (IBWC, 1996) Health Impact Sample results indicate there was not a widespread water quality or human health problem. Levels of bacteria, total suspended solids (TSS) and nutrients increased significantly, but dropped quickly after the flooding had stopped. Fecal coliform bacteria counts of 200 colonies per 100 milliliters were found, compared to normal levels of less than 10 colonies. However, testing showed that few of the samples that tested positive originated from human wastes. Of the 154 water well and lake pump potable water samples that were sampled, 64 tested positive for bacteria or showed elevated levels of total dissolved solids, total organic carbon or nitrates (CNA, 2000). From the sampled sites in the Colorado River delta, García-Hernández found that none of the edible fish (e.g. Micropterus salmoides, Cyprinus carpio, Ictalurus punctatus, Mugil cephalus, Lepomis macrochirus and Tilapia zilli) collected from the Colorado River delta wetlands exceeded the treshhold level of 6.5 µg g-1 dry wt. that warrants advisories by the U.S. health department, recommending limited fish consumption by humans (Skorupa et al, 1996). Semi-annual sampling of the New River at the Calexico gauge near the border by the California Regional Water Quality Control Board since 1994 shows consistently high levels of fecal coliform (130,000 counts/100 ml - 2.2 x10⁶ counts/100 ml) and TDS ( > 2400 mg/L) and low concentrations of dissolved oxygen (Varady and Mack, 1995). In short, the New River is not an acceptable raw water source for drinking water, but is likely used by some, at least in Mexico, that are not currently served by a community water system. Other Sources of contamination in the Colorado waters such as perchlorate, uranium and MTBE are beginning to increment attention. MTBE (a gasoline additive) is a highly toxic chemical, linked to cancer and neurological problems that spreads rapidly in groundwater, endangering the quality of water to the second most important source of water in the region. Uranium is leaking from an abandoned uranium mill near Moab, Utah (Fig. 6) into the Colorado River at 530 times the federal radiation limit, threatening the drinking water of more than 25 million people, serving mainly people in Las Vegas, Los Angele s, Phoenix and Tucson. Uranium ore was mined and milled in the Colorado River Basin beginning in the late 1940’s and continued through the 1950’s at an ever-increasing rate. When production finally reached its peak in 1958 nearly 8,960 tons of uranium ore were being milled each day in the Colorado Plateau. The mining and milling wastes pose serious threats to ground water from radionuclide contamination. High radium concentrations occur in shallow aquifers in Montrose County in association with uranium mining and milling operations. Many streams in the basin tend to have higher pH values than in other basins in the State, therefore strict un-ionized ammonia standards have been required of wastewater facilities in order to protect cold-water aquatic life (Driver, 1994)
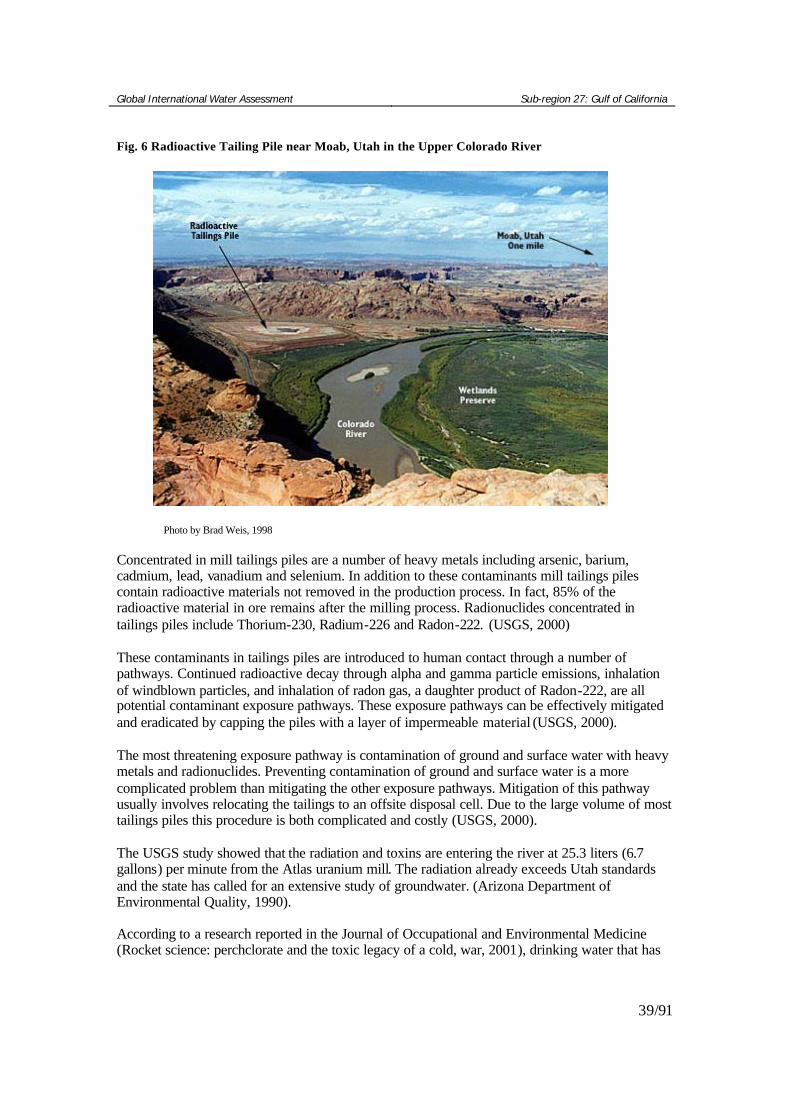
Global International Water Assessment Sub-region 27: Gulf of California
39/91
Fig. 6 Radioactive Tailing Pile near Moab, Utah in the Upper Colorado River
Photo by Brad Weis, 1998 Concentrated in mill tailings piles are a number of heavy metals including arsenic, barium, cadmium, lead, vanadium and selenium. In addition to these contaminants mill tailings piles contain radioactive materials not removed in the production process. In fact, 85% of the radioactive material in ore remains after the milling process. Radionuclides concentrated in tailings piles include Thorium-230, Radium-226 and Radon-222. (USGS, 2000) These contaminants in tailings piles are introduced to human contact through a number of pathways. Continued radioactive decay through alpha and gamma particle emissions, inhalation of windblown particles, and inhalation of radon gas, a daughter product of Radon-222, are all potential contaminant exposure pathways. These exposure pathways can be effectively mitigated and eradicated by capping the piles with a layer of impermeable material (USGS, 2000). The most threatening exposure pathway is contamination of ground and surface water with heavy metals and radionuclides. Preventing contamination of ground and surface water is a more complicated problem than mitigating the other exposure pathways. Mitigation of this pathway usually involves relocating the tailings to an offsite disposal cell. Due to the large volume of most tailings piles this procedure is both complicated and costly (USGS, 2000). The USGS study showed that the radiation and toxins are entering the river at 25.3 liters (6.7 gallons) per minute from the Atlas uranium mill. The radiation already exceeds Utah standards and the state has called for an extensive study of groundwater. (Arizona Department of Environmental Quality, 1990). According to a research reported in the Journal of Occupational and Environmental Medicine (Rocket science: perchclorate and the toxic legacy of a cold, war, 2001), drinking water that has

Global International Water Assessment Sub-region 27: Gulf of California
40/91
been contaminated with small amounts of perchlorate (CIO4-) - a man made chemical that is used in the manufacture of rockets, missiles and fireworks, among other products - may be the reason behind higher-than-normal thyroid hormone levels being identified in some newborns in Arizona. Due to the combination of its elements (chlorine and oxygen) perchlorate can persist for many decades under typical groundwater and surface water conditions, because of its resistance to reaction or degradation. In 1997, the State of California developed a method with detection of down to 4 micrograms per liter (ppb). Much to the surprise of water officials, perchlorate was detected in numerous water systems including the entire Lower Colorado River, mostly in Lake Mead (EPA, 2001) Although health problems related to water pollution are considered with medium severity because of the characteristics of the cases known to date, the duration of the problem is present since a long time, so it has a continuous impact on society. The severity and duration of impacts are extremely important not only from an environmental perspective but also from a social point to view, in order to call for government attention. Social and Community Impact Polluted water is a common issue between general societies in the region. People accept water condition because they depend on it. Pollution of water sources for the purpose of human water consume is of no threat, considering that 90% of the region employs purified water instead of potable water which comes directly via municipal sources. Almost all the area is affected by water quality, including the productive sectors (agriculture and industry). But even when the amount of people affected is high, considering the amount of people that depend on the Colorado River this does not imply radical changes on conduct or day-a-day activities. As mentioned above, the problem of polluted water in the sub region 27 is antique, so the frequency should relieve more attention over the severity and number of people affected. Conclusions and future outlook As the salinization for the use and reuse of water trend to increase, in a short term all industries and sectors will be obligated to treat their waters within established regulations. This implies direct consequences not only for the water productive users that will increase their costs, but also for the general public consumers, that must pay for better treated water for there consume. In addition, the aquifers will tend to have saline problems with the reduction of surface water, mainly by the Colorado River, provoking an unsustainable extraction of groundwater, in which many places already exists (California, Arizona, and Mexico) and making costs for soil recovery even higher. Groundwater is one of California’s and Arizona’s greatest natural resources. In an average water supply year, groundwater meets about 30% of California’s urban and agricultural demand. In drought years, this percentage increases to more than 40% (DWR, 1998). In 1995, an estimated 13 million Californians (nearly 43 percent of the State’s population) used groundwater for at least a portion of their public -supply needs (Solley et al, 1998). In Arizona, 400 million cubic meters

Global International Water Assessment Sub-region 27: Gulf of California
41/91
of groundwater are being removed annually which is about double the amount being replaced by recharge from rainfall. Although aquifer exploitation trend to increase, water pollution is expected to decrease due to the implementation of better technologies and water treatments. The impact of natural and non natural pollution for the basin will have a strong impact in the community’s water culture. The need for water will force society to develop more conscience concerning water use and its quality, the recycle culture will play and important role as a conservation contributor. It is expected that for the next 20 years the basin will be in the margins of a water quality crisis due to various factors such as population growth regarding to wastewater and increased salinity. 2.3 Habitat and community modification Water management practices caused dramatic changes in the Colorado River and resulted in a loss of nearly 76% of the historic wetland areas in the Colorado River delta in the last century, with severe consequences for wildlife and local communities. The delta has shrunk to approximately 60 ha (150,000 acres), five percent of its historic size. From 1980 to 1998, total water releases to the delta have amounted to an estimated 20% of the Colorado’s total flows over the same period, permitting a partial revegetation of wetlands and riparian forests. While most of the flows are either flood-water or agricultural and municipal wastewater, these flows are proving beneficial. Although flood flows are extremely unreliable and irregular, and wastewater is high in salinity and pollutants, this water has begun to restore some areas of the delta. Up to the early 20th century, the area had a vegetation pattern clearly associated with the river. Plant communities in this area were probably similar to those currently found immediately north of the U.S.-Mexico border. Currently, most of the massive riparian forests have disappeared, although some patches and isolated trees remain. Alien tamarisks (Tamarix ramosissima ) are widespread. The 150 km stretch of river in Mexico contains twice as much native riparian and wetland habitat as the upstream stretch in the U.S., yet even this modest regeneration of habitat, the result of flood and agricultural discharge waters over the past 20 years, is under treat from Bureau initiatives to eliminate this “slack” in the system and capture water flowing to Mexico for U.S. water users. Environmental Impact The modification and loss of habitat in the region is considered a mayor concern. Due to decades of dam construction and water diversions in the United States and Mexico along the Colorado River basin, the Colorado River delta’s vast wetlands and riparian zones, has been greatly altered to a remnant system of small wetlands and brackish mudflats. Once the Colorado River delta was lush with vegetation; it supported some 200-400 plant species, along with numerous birds, fish, and mammals (Glen et al, 1992).

Global International Water Assessment Sub-region 27: Gulf of California
42/91
Most of these species were native and now are in the border of extinction or are already extinct in the area, such as jaguars (Felis onca), Mule deer (Odocoileus hemionus) and Otters (Lutra canadensis) (Mellink, 1996). Much of the upper delta has been converted to irrigated farmland, and levees and channels have changed the physical delta significantly. Dam construction among other factors has provoked permanent changes in the natural ecosystems. Prior to dam construction the Colorado River delta covered 780,000 ha (1,930,000 acres) of plant, bird and marine life. Because most of the river’s flow reached the delta at that time, it’s freshwater, silt, and nutrients helped create a complex system of wetlands that provided feeding and nesting grounds for birds, and spawning habitat for fishes and crustaceans (Glenn et al., 1996). In the 1970’s and 1980’s the delta was considered as a “dewatered” or “dead ecosystem” (Fig. 7) (Spamer, 1990). Since 1981, the delta of the Colorado River has been partially revegetated by the discharge of floodwaters and agricultural drain water from the United States to Mexico during the past 20 years. From 1980 to 1998, total water releases to the delta have amounted to an estimated 20 percent of the Colorado’s total flows. These current conditions have allowed wetlands and riparian vegetation to flourish on about 60,000 ha (150,000 acres). Although, there exists a relative number and distribution of native species or families compared with current baselines. Increases in river bank salinity and other alterations of the riparian zone have favored the establishment of invasive, salt tolerant species (Glenn, 1998). Along most of the river the native gallery forests of cottonwoods (Populus fremonti) and willow (Salix goodingii) have been replaced by the introduced shrub, salt cedar (Tamarix ramosissima), with a resulting loss in habitat for native fauna, occupying great extensions of modified habitat (USBR, 2000). Fig. 7 Shows the changes in vegetation coverage in the Colorado River delta after the damming of the river, with comparisons over Flood and Non-flood years. The colors in this Landsat image reflect sensitivity to heat (red depicts vegetation)
Non-Flood 1973
Source: NALC, 1973, 1986.
Flood 1986

Global International Water Assessment Sub-region 27: Gulf of California
43/91
Tamarix ramosissima cause several problems, due to their high evapotranspiration rate they can dry out smaller water bodies, affecting fish such as the endangered desert pupfish (Cypranodon macularius). Also, due to its aggressiveness, they outcompete cottonwoods and willows, reducing the value of the habitat for several animals included the endangered Yuma Clapper Rail (Ralus longirostris yumanensis) (Mellink and Luevano, 1998) The drastic decline in native forest vegetation has reduced the habitat value of the riparian zone for the native species. The Southwestern Willow Flycatcher (Empidonax traillii extimus) as many other species has become endangered in the U.S-Mexico border region due to the reduction of its habitat. Willow Flycatcher breeding area formerly included the lower Colorado River and its delta. It appears now that the birds found in the delta were migrants (García -Hernández, et al, 2001). Many species of native fauna haven't been able to adapt to the actual conditions, for they have survived poorly . Close to 50 species of fish have been introduced in the hydrological system, many of them turning into predators or competing with native fishes (USBR, 2000). The introductions, along with the changes within the habitat conditions, have resulted in a drastic reduction of native fish communities (Table 19). There has been found marine fish species with a mayor frequency in the river, due to the effects of tides from the Gulf of California (USBR, 2000). Table 19 Shows the Native species of fishes and the introduced species of fish in the Colorado River. Source: USBR, 2000. *Marine species, ** Introduction did not succeed The damming of the Colorado River has modified the environment of the Upper Gulf of California (UGC). The reduction in freshwater flow has cut the influx of nutrients to the sea and reduced critical habitat for nursery grounds to many commercially important species (Cynoscion macdonali, Cynoscion othonopterus,and Litopenaues vannamei) (Aragón-Noriega, 2000). The UCG is the nursery area for Litopenaues stylirostris, the most profitable fishery in the zone.
Native Invasive Spotted sleeper (Eleoteris picta)* Common carp (Cyprinus carpio) Pacific tenpounder (machete) (Elops affinis)* Channel catfish (Ictalurus punctatus) Striped mullet (Mugil cephalus)* Silver salmon (Oncorhynchus kisutch)** Desert pupfish (Cyprinodon macularius) Pacific halibut (Hippoglossus stenolepis)** Bonytail (Gila elegans) Bonefish (Albula vulpes)** Roundtail chub (Gila robusta) Tilapia Mozambique (Tilapia mossambica) Colorado squawfish (Ptychocheilus lucius) Orange mouth corvina (Cynoscion xanthalus sp) Razorback sucker (Xyrauchen texanus) Sargo (Anisotremus davidsoni) Flannelmouth sucker (Catostomus latipinnis) Silver perch (Bairdiella chrysoura) Woundfin (Plagopterus argentissimus) Colorado squawfish (Ptychocheilus lucius)
Mosquitofish (Gambusia affinis) Largemouth bass (Micropterus salmoides) Bluegill sunfish (Lepomis macrochirus) Green sunfish (Lepomis cyanellus) Black crappie (Pomoxis nigromaculatus) Rainbow trout (Oncorhynchus mykiss) Red shiners (Cyprinella lutrensis) Threadfin shad (Dorsoma petenense) Striped bass (Morone saxatilis) The blue tilapia (Tilapia aureau) Flathead catfish (Pylodictis olivaris)
Fathead minnows (Pimephales promelas)
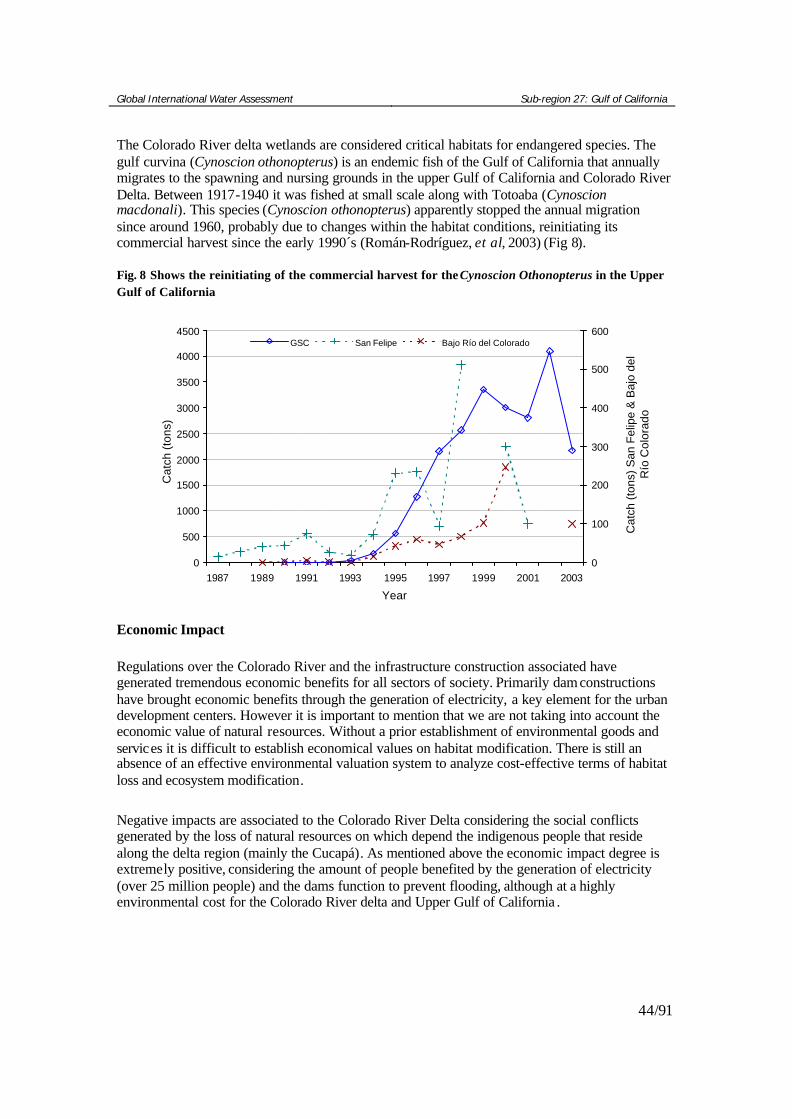
Global International Water Assessment Sub-region 27: Gulf of California
44/91
The Colorado River delta wetlands are considered critical habitats for endangered species. The gulf curvina (Cynoscion othonopterus) is an endemic fish of the Gulf of California that annually migrates to the spawning and nursing grounds in the upper Gulf of California and Colorado River Delta. Between 1917-1940 it was fished at small scale along with Totoaba (Cynoscion macdonali). This species (Cynoscion othonopterus) apparently stopped the annual migration since around 1960, probably due to changes within the habitat conditions, reinitiating its commercial harvest since the early 1990´s (Román-Rodríguez, et al, 2003) (Fig 8). Fig. 8 Shows the reinitiating of the commercial harvest for the Cynoscion Othonopterus in the Upper Gulf of California
0
500
1000
1500
2000
2500
3000
3500
4000
4500
1987 1989 1991 1993 1995 1997 1999 2001 2003
Year
Cat
ch (t
ons)
0
100
200
300
400
500
600
Cat
ch (
tons
) S
an F
elip
e &
Baj
o de
l R
ío C
olor
ado
GSC San Felipe Bajo Río del Colorado
Economic Impact Regulations over the Colorado River and the infrastructure construction associated have generated tremendous economic benefits for all sectors of society. Primarily dam constructions have brought economic benefits through the generation of electricity, a key element for the urban development centers. However it is important to mention that we are not taking into account the economic value of natural resources. Without a prior establishment of environmental goods and services it is difficult to establish economical values on habitat modification. There is still an absence of an effective environmental valuation system to analyze cost-effective terms of habitat loss and ecosystem modification. Negative impacts are associated to the Colorado River Delta considering the social conflicts generated by the loss of natural resources on which depend the indigenous people that reside along the delta region (mainly the Cucapá). As mentioned above the economic impact degree is extremely positive, considering the amount of people benefited by the generation of electricity (over 25 million people) and the dams function to prevent flooding, although at a highly environmental cost for the Colorado River delta and Upper Gulf of California .

Global International Water Assessment Sub-region 27: Gulf of California
45/91
Health Impact There are no known impacts related. Social and Community Impact The changes in natural structure over the Colorado River has been made to improve the water availability mainly in cities like San Diego and Los Angeles, without the infrastructure built for electric systems and the progress in the irrigation districts, these and other urban centers could not be what they are now. Therefore a large part of urban development is the cause for habitat modification and ecosystem degradation, although these changes imply social benefits related to economic growth and social prosperity. However the actual trend is to gradually translate water that was usually designated for agricultural purposes for new urban necessities that could increase economic revenues. Since agriculture uses over 90% of water resources at a low cost, urban water transfers, would imply the sale of water giving it a real economic value to the resource. We believe these costs would imply social implications, especially a change in water culture and a general perception over water resources . Since habitat modification dates from many years ago, the duration of the social impacts are considered as a continuous behavior. In agreement with the economic impacts, higher weights are given to severity and duration due to the social implications. Conclusions and future outlook Habitat modification provokes positive economic benefits in region communities. The expectative is to maintain the trends, since the infrastructure built to improve water supplies, will still encourage urban and productive sectors development. The U.S. Bureau of Reclamation has proposed new regulations and projects, including off stream storage of water and privatization of the Wellton-Mohawk Irrigation District which are likely to reduce flows to the Colorado River delta, without considering the impact on the delta ecosystems (USBR, 1997). The Yuma Desalting Plant is a $260 million water treatment plant built by the U.S. Bureau of Reclamation (USBR) in Yuma, Arizona, about 32 km (20 miles) from the international border. The plant was built to treat agricultural drainage from the Wellton-Mohawk Irrigation District in Arizona. Under the original plan, this treated water would be delivered to Mexico as part of minute 242, which defines maximum salinity levels for U.S. water deliveries as an amendment of the 1944 Treaty. The plant was completed in 1992, and has never been operated. The USBR is analyzing options for operating the plant and exploring possible markets, including California and the Middle East via supertanker. The city of Yuma has the right of first refusal on the water. A decision to operate the Yuma Desalting plant and divert Wellton-Mohawk drain water from MODE could have disastrous consequences for the Ciénega de Santa Clara. The reduction in inflow would shrink the wetland by 40%, affecting both wildlife populations and the residents of the nearby Johnson ejido. If water is diverted from this important wetland in the core zone of the Biosphere Reserve.

Global International Water Assessment Sub-region 27: Gulf of California
46/91
In positive terms, society will develop more conscience concerning water development, and think about the importance of environmental considerations . Future trends indicate that water recycle will play an important role as a conservation contributor. We can see how wastewater treatment for Mexicali (Mexicali II Project), can provide a new source of water for the Colorado River delta. 2.4 Unsustainable exploitation of fisheries and other living resources Historically the Upper Gulf of California has supported numerous fisheries and commercially valuable species, providing important spawning and nursery habitat for shrimp, fish and other species in the Upper Gulf food chain. Various forms of human activity (shrimp trawls, pollution, and freshwater shortage) may be altering the ecosystem of the Northern Gulf, which ultimately affect local fisheries, and the semi-enclosed nature of the Upper Gulf may serve to magnify the impact of these activities. In the Upper Gulf, the once prolific totaoba (Cynoscion macdonaldi), a highly prized commercial and sport fish, is nearly extinct, as is the vaquita (Phoceana sinus), the worlds smallest purpoise and most rare mammal. In the late 1980’s and 1990’s the shrimp catches dropped by over 50%, signaling a virtual collapse in the shrimp fishery. Although noticeably improved when flood waters reached the gulf, such as in 1983-88, when millions of cubic meters of water was spilled from upstream reservoirs and revitalized wetlands such as the Ciénega de Santa Clara. The Gila River floods in 1993 produced similar results. The totoaba fishery declined dramatically since 1970 due to declining population and to restrictions imposed (in 1975) when catch levels threatened the population. Despite closures, totoaba gillnet fisheries continue on a small scale and they remain a threat to the Phoceana sinus populations. Juvenile totoaba are also caught and killed in substantial numbers of shrimp trawls, which further endangers the totoaba population. Environmental Impact The overexploitation of fishery resources is a considerable problem in the Colorado River Delta region and Upper Gulf of California. A large number of invertebrates (e.g. Penaeus stylirostris and Penaeus californiensis), mammals (e.g. Tursiops truncatus) and commercial species of fishes such as totoaba (Cynoscion macdonaldi) and the gulf curvina (Cynoscion othonopterus) are under critical conditions and some of them like the endemic vaquita porpoise (Phoceana sinus) are at the limit of extinction (approximately there is a count of less than 600 vaquitas in the Upper Gulf of California) (Jaramillo-Legorreta, et al 1999). There have been drastic changes in sea bottom habitats (benthic communities) produced by the indiscriminate use of trawling nets (Mathews, 1974), which in some places goes more than ten times a year (e.g. Upper Gulf of California). Incidental capture for the unsustainable fishery arts is one of the major concerns for the marine environment. In the industrial shrimp fishery for example, Conservation International (2003) estimated that for each kg of shrimp, there are at least 10kg of by-catch (Table 20). Furthermore, species like dolphins (Tursiops truncatus), turtles (Dermochelys coracea), rays (Gymnura
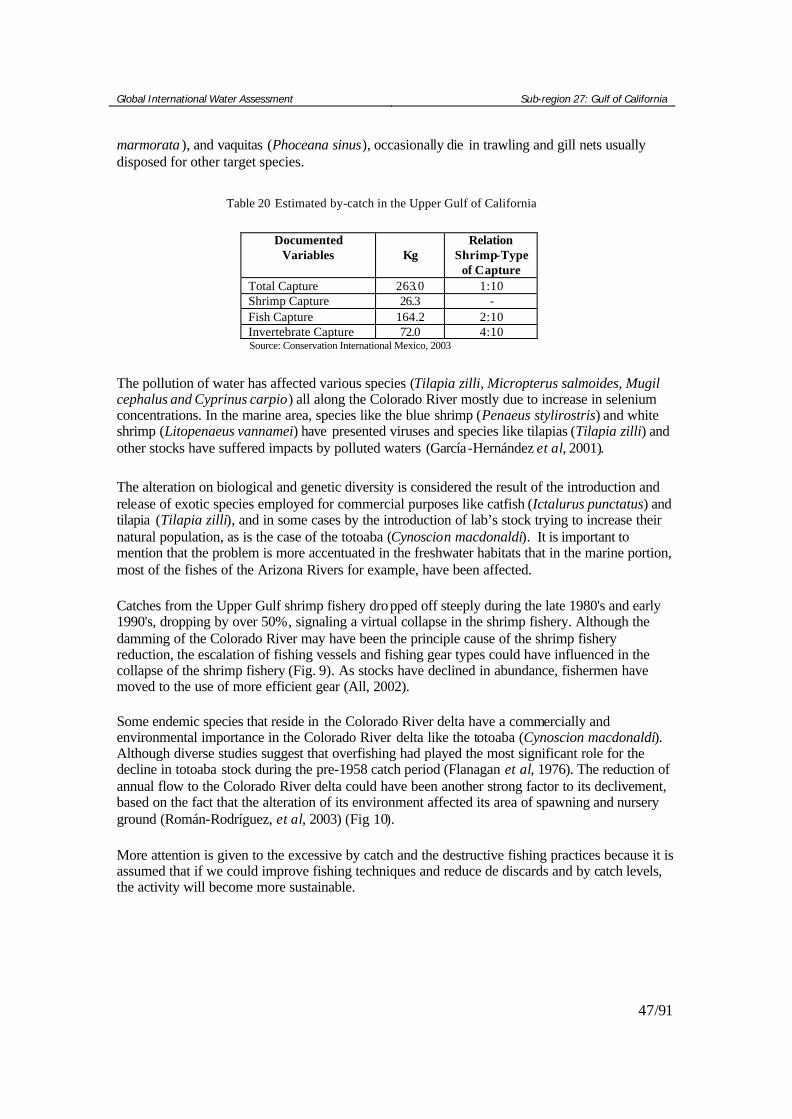
Global International Water Assessment Sub-region 27: Gulf of California
47/91
marmorata ), and vaquitas (Phoceana sinus), occasionally die in trawling and gill nets usually disposed for other target species. Table 20 Estimated by-catch in the Upper Gulf of California
Documented Variables
Kg
Relation Shrimp-Type
of Capture Total Capture 263.0 1:10 Shrimp Capture 26.3 - Fish Capture 164.2 2:10 Invertebrate Capture 72.0 4:10
Source: Conservation International Mexico, 2003
The pollution of water has affected various species (Tilapia zilli, Micropterus salmoides, Mugil cephalus and Cyprinus carpio) all along the Colorado River mostly due to increase in selenium concentrations. In the marine area, species like the blue shrimp (Penaeus stylirostris) and white shrimp (Litopenaeus vannamei) have presented viruses and species like tilapias (Tilapia zilli) and other stocks have suffered impacts by polluted waters (García-Hernández et al, 2001). The alteration on biological and genetic diversity is considered the result of the introduction and release of exotic species employed for commercial purposes like catfish (Ictalurus punctatus) and tilapia (Tilapia zilli), and in some cases by the introduction of lab’s stock trying to increase their natural population, as is the case of the totoaba (Cynoscion macdonaldi). It is important to mention that the problem is more accentuated in the freshwater habitats that in the marine portion, most of the fishes of the Arizona Rivers for example, have been affected. Catches from the Upper Gulf shrimp fishery dropped off steeply during the late 1980's and early 1990's, dropping by over 50%, signaling a virtual collapse in the shrimp fishery. Although the damming of the Colorado River may have been the principle cause of the shrimp fishery reduction, the escalation of fishing vessels and fishing gear types could have influenced in the collapse of the shrimp fishery (Fig. 9). As stocks have declined in abundance, fishermen have moved to the use of more efficient gear (All, 2002). Some endemic species that reside in the Colorado River delta have a commercially and environmental importance in the Colorado River delta like the totoaba (Cynoscion macdonaldi). Although diverse studies suggest that overfishing had played the most significant role for the decline in totoaba stock during the pre-1958 catch period (Flanagan et al, 1976). The reduction of annual flow to the Colorado River delta could have been another strong factor to its declivement, based on the fact that the alteration of its environment affected its area of spawning and nursery ground (Román-Rodríguez, et al, 2003) (Fig 10). More attention is given to the excessive by catch and the destructive fishing practices because it is assumed that if we could improve fishing techniques and reduce de discards and by catch levels, the activity will become more sustainable.

Global International Water Assessment Sub-region 27: Gulf of California
48/91
Fig. 9 Shows the escalation of fishing vessels for the shrimp industry in the Upper Gulf of California from 1965 to 1998
0
100
200
300
400
500
60065
/66
66/6
767
/68
68/6
969
/70
70/7
171
/72
72/7
373
/74
74/7
575
/76
76/7
777
/78
78/7
979
/80
80/8
181
/82
82/8
383
/84
84/8
585
/86
86/8
787
/88
88/8
989
/90
90/9
191
/92
92/9
393
/94
94/9
595
/96
96/9
797
/98
Season
# of
traw
ler
ship
s
0
10
20
30
40
50
60
70
San
Fel
ipe
Guaymas Puerto Peñasco Santa Clara San Felipe
Source: Roman-Rodríguez et al, 2003 Fig. 10 Shows the declivement of the totoaba Fishery and the reduction of the Colorado Rivers flows of waster to the delta in Mexico.
Totoaba Fishery annual yield and Colorado River flows to Mexico for the 1930-75 period
0.00
5,000.00
10,000.00
15,000.00
20,000.00
25,000.00
1929
1931
1933
1935
1937
1939
1941
1943
1945
1947
1949
1951
1953
1955
1957
1959
1961
1963
1965
1967
1969
1971
1973
1975
Mm
3 p
er y
ear
-
500
1,000
1,500
2,000
2,500
Cat
ch (
Tons
)
Flow Catch (tons)
Source: Flanagan et al, 1976 with data obtained from Arvizu & Chavez, 1974
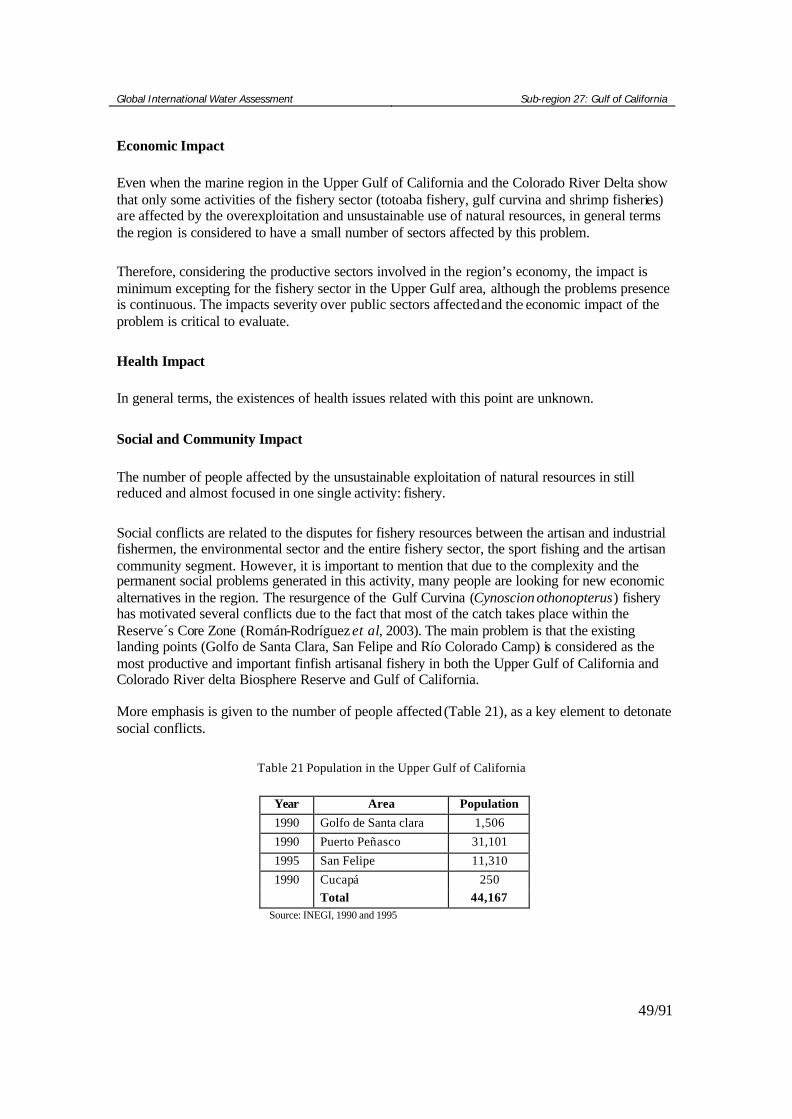
Global International Water Assessment Sub-region 27: Gulf of California
49/91
Economic Impact Even when the marine region in the Upper Gulf of California and the Colorado River Delta show that only some activities of the fishery sector (totoaba fishery, gulf curvina and shrimp fisheries) are affected by the overexploitation and unsustainable use of natural resources, in general terms the region is considered to have a small number of sectors affected by this problem. Therefore, considering the productive sectors involved in the region’s economy, the impact is minimum excepting for the fishery sector in the Upper Gulf area, although the problems presence is continuous. The impacts severity over public sectors affected and the economic impact of the problem is critical to evaluate. Health Impact In general terms, the existences of health issues related with this point are unknown. Social and Community Impact The number of people affected by the unsustainable exploitation of natural resources in still reduced and almost focused in one single activity: fishery. Social conflicts are related to the disputes for fishery resources between the artisan and industrial fishermen, the environmental sector and the entire fishery sector, the sport fishing and the artisan community segment. However, it is important to mention that due to the complexity and the permanent social problems generated in this activity, many people are looking for new economic alternatives in the region. The resurgence of the Gulf Curvina (Cynoscion othonopterus) fishery has motivated several conflicts due to the fact that most of the catch takes place within the Reserve´s Core Zone (Román-Rodríguez et al, 2003). The main problem is that the existing landing points (Golfo de Santa Clara, San Felipe and Río Colorado Camp) is considered as the most productive and important finfish artisanal fishery in both the Upper Gulf of California and Colorado River delta Biosphere Reserve and Gulf of California. More emphasis is given to the number of people affected (Table 21), as a key element to detonate social conflicts. Table 21 Population in the Upper Gulf of California
Year Area Population 1990 Golfo de Santa clara 1,506 1990 Puerto Peñasco 31,101 1995 San Felipe 11,310 1990 Cucapá 250
Total 44,167 Source: INEGI, 1990 and 1995

Global International Water Assessment Sub-region 27: Gulf of California
50/91
Conclusions and future outlook The fishery sector is in serious crisis at the present (shrimp catches have dropped by over 50%). The overexploitation of natural resources is getting commercial species at their limits and becoming fishery activities in some cases unviable (shrimp and curvina fisheries). The current efforts of national and International NGO´s (Conservation International, PRONATURA, WWF, Sierra Madre) joined to the coastal community’s and government participation are yielding solid results in the field to conserve the natural resources upon which a large number of people depend. Therefore, we definitely expect an improvement in the actual trends, conducted to improve the conditions of all marine habitats and ecosystems. The prediction is difficult. We can expect a moderate positive change, if the fishery industry and local fisherman respect the close seasons, spawning and nursery grounds in the Biosphere Reserve and replace trawling nets for more efficient gear. We optimistically consider that the fishery sector will reduce both in impact and social dependence and seek the diversification of the local economy. We rely on the fact that San Felipe and Puerto Peñasco were authorized concessions for the installation of touristic marinas in both harbors: 3 in San Felipe and 1 in Puerto Peñasco (SCT-CGPMM, 1996). These concessions are registered in the strategic promotion of touristic marinas in diverse points in the Baja California peninsula of the denominated “Nautical Route” promoted recently by the Fondo Nacional de Fomento al Turismo (FONATUR). 2.5 Global change Several considerations were made regarding to global climate changes impacts. Due to the lack of data or references over global change the issue was omitted considering the reluctance to confuse normal cyclic variations with global climatic changes. Even when impacts by ENSO (El Niño-Southern Oscillation) events were a matter of agreement, so the issue remained cautious because there is no hard evidence that the intensity or frequency of these events in the Gulf of California is outside of normal fluctuations. 3. Priority concerns for further analysis Management of water resources in the Colorado River basin is strongly influenced by the 1922 Colorado River Compact and the 1948 Upper Colorado River Basin Compact. With the exception of the Mexican Water Treaty of 1944, Mexico was practically left out of the water equation in the Colorado River Basin, living very few or none operation power over the Colorado’s water resources. During the last five years, water demands of the lower Colorado river basin states have increased from the “normal” year supply of 9.2 Mm3 to more than 10.1 Mm3. California’s 5.4 Mm3 apportionment has been exceeded for decades by at least 986,784 m3 and, under contracts with the United States, California may be legally required to reduce its water uses by this amount. Already in present conditions the Colorado River basin presents an over allocation of its water, without fully allocating the total of water requested by the basins users (Table 6). Considering
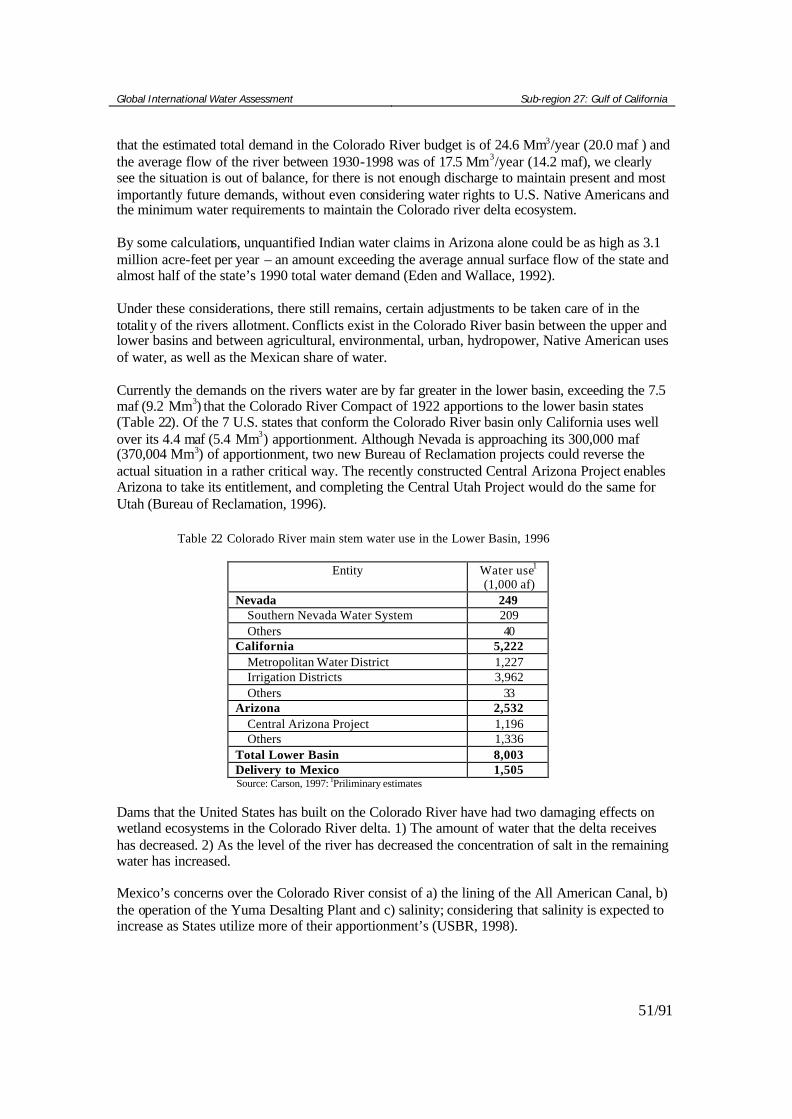
Global International Water Assessment Sub-region 27: Gulf of California
51/91
that the estimated total demand in the Colorado River budget is of 24.6 Mm3/year (20.0 maf ) and the average flow of the river between 1930-1998 was of 17.5 Mm3/year (14.2 maf), we clearly see the situation is out of balance, for there is not enough discharge to maintain present and most importantly future demands, without even considering water rights to U.S. Native Americans and the minimum water requirements to maintain the Colorado river delta ecosystem. By some calculations, unquantified Indian water claims in Arizona alone could be as high as 3.1 million acre-feet per year – an amount exceeding the average annual surface flow of the state and almost half of the state’s 1990 total water demand (Eden and Wallace, 1992). Under these considerations, there still remains, certain adjustments to be taken care of in the totality of the rivers allotment. Conflicts exist in the Colorado River basin between the upper and lower basins and between agricultural, environmental, urban, hydropower, Native American uses of water, as well as the Mexican share of water. Currently the demands on the rivers water are by far greater in the lower basin, exceeding the 7.5 maf (9.2 Mm3) that the Colorado River Compact of 1922 apportions to the lower basin states (Table 22). Of the 7 U.S. states that conform the Colorado River basin only California uses well over its 4.4 maf (5.4 Mm3) apportionment. Although Nevada is approaching its 300,000 maf (370,004 Mm3) of apportionment, two new Bureau of Reclamation projects could reverse the actual situation in a rather critical way. The recently constructed Central Arizona Project enables Arizona to take its entitlement, and completing the Central Utah Project would do the same for Utah (Bureau of Reclamation, 1996). Table 22 Colorado River main stem water use in the Lower Basin, 1996
Entity Water use1 (1,000 af)
Nevada 249 Southern Nevada Water System 209 Others 40
California 5,222 Metropolitan Water District 1,227 Irrigation Districts 3,962 Others 33
Arizona 2,532 Central Arizona Project 1,196 Others 1,336
Total Lower Basin 8,003 Delivery to Mexico 1,505
Source: Carson, 1997: 1Priliminary estimates Dams that the United States has built on the Colorado River have had two damaging effects on wetland ecosystems in the Colorado River delta. 1) The amount of water that the delta receives has decreased. 2) As the level of the river has decreased the concentration of salt in the remaining water has increased. Mexico’s concerns over the Colorado River consist of a) the lining of the All American Canal, b) the operation of the Yuma Desalting Plant and c) salinity; considering that salinity is expected to increase as States utilize more of their apportionment’s (USBR, 1998).
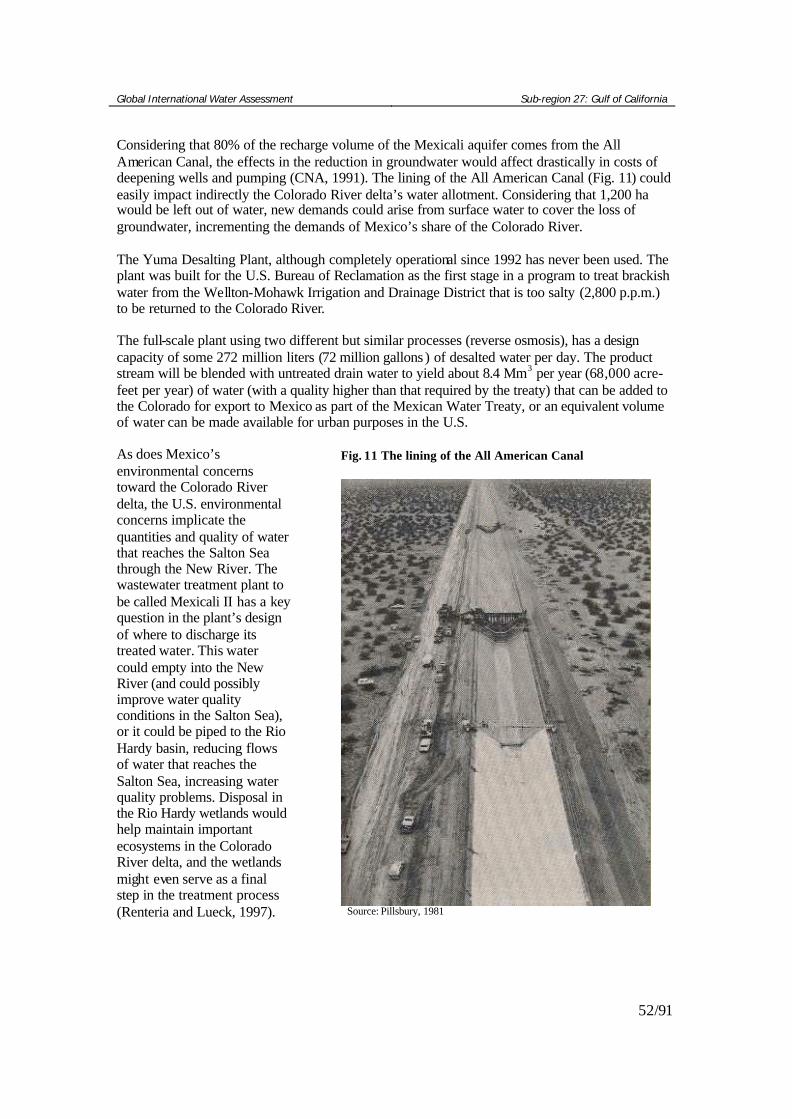
Global International Water Assessment Sub-region 27: Gulf of California
52/91
Considering that 80% of the recharge volume of the Mexicali aquifer comes from the All American Canal, the effects in the reduction in groundwater would affect drastically in costs of deepening wells and pumping (CNA, 1991). The lining of the All American Canal (Fig. 11) could easily impact indirectly the Colorado River delta’s water allotment. Considering that 1,200 ha would be left out of water, new demands could arise from surface water to cover the loss of groundwater, incrementing the demands of Mexico’s share of the Colorado River. The Yuma Desalting Plant, although completely operational since 1992 has never been used. The plant was built for the U.S. Bureau of Reclamation as the first stage in a program to treat brackish water from the Wellton-Mohawk Irrigation and Drainage District that is too salty (2,800 p.p.m.) to be returned to the Colorado River. The full-scale plant using two different but similar processes (reverse osmosis), has a design capacity of some 272 million liters (72 million gallons ) of desalted water per day. The product stream will be blended with untreated drain water to yield about 8.4 Mm3 per year (68,000 acre-feet per year) of water (with a quality higher than that required by the treaty) that can be added to the Colorado for export to Mexico as part of the Mexican Water Treaty, or an equivalent volume of water can be made available for urban purposes in the U.S. As does Mexico’s environmental concerns toward the Colorado River delta, the U.S. environmental concerns implicate the quantities and quality of water that reaches the Salton Sea through the New River. The wastewater treatment plant to be called Mexicali II has a key question in the plant’s design of where to discharge its treated water. This water could empty into the New River (and could possibly improve water quality conditions in the Salton Sea), or it could be piped to the Rio Hardy basin, reducing flows of water that reaches the Salton Sea, increasing water quality problems. Disposal in the Rio Hardy wetlands would help maintain important ecosystems in the Colorado River delta, and the wetlands might even serve as a final step in the treatment process (Renteria and Lueck, 1997).
Fig. 11 The lining of the All American Canal
Source: Pillsbury, 1981

Global Internation Waters Assessment Sub-region 27: Gulf of California
53/91
4. Causal chain analysis By Edgar Arias, Mariana Becerra, Carlos Muñoz and Jaime Saínz
4.1 Introduction The river’s delta (Fig. 12) once covered over 7,770 km2 (3,000 square miles) of riparian-wetland habitat, which supported over 400 species of plants and animals. A sizable freshwater flow reached the mouth at the Upper Gulf, which replenished the delta with silt and delivered nutrients to fish and other marine life. Tides that typically reached ten feet or more in amplitude extended the tidal estuary 35 miles upriver, in the past century, river flows into the delta have been reduced nearly 75%. Fig. 12 The Colorado River delta
Source: NASA, 2001 Socio-economic forces drove many of the changes made through out the 1900’s. Rapid immigration to the area ranks among the most important. As the West’s population and need for water have grown, the Colorado River has been trapped through a system of dams and diversions
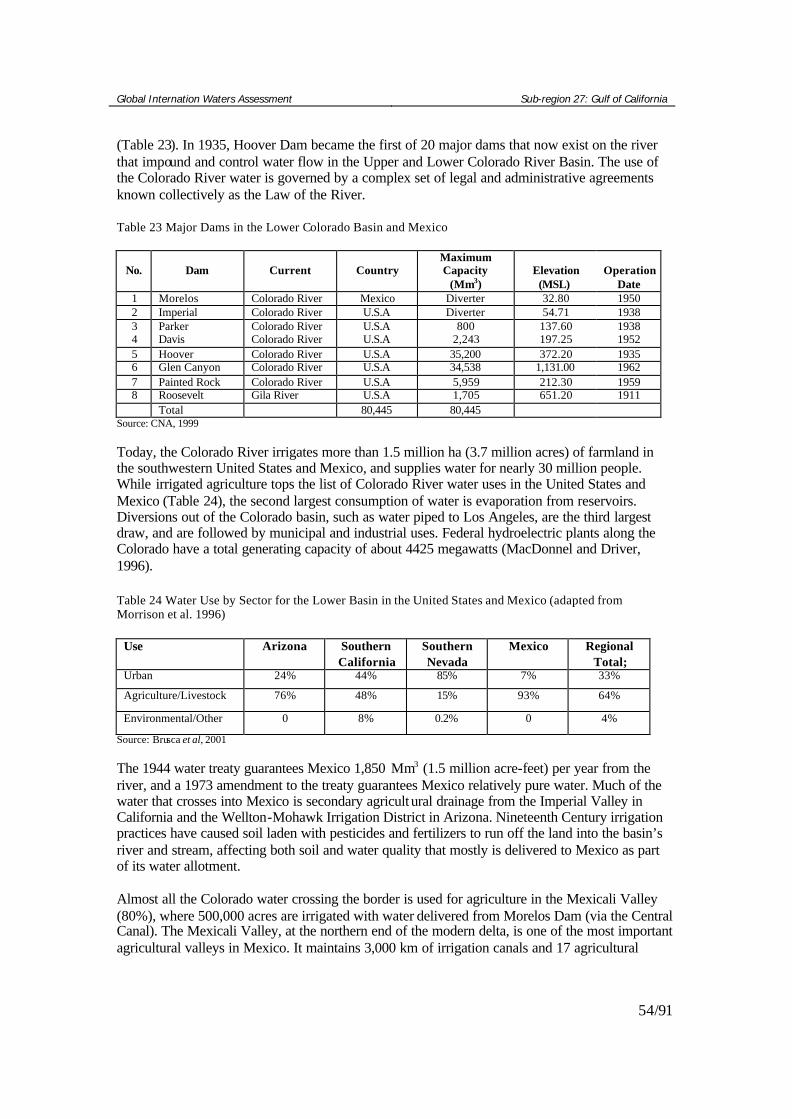
Global Internation Waters Assessment Sub-region 27: Gulf of California
54/91
(Table 23). In 1935, Hoover Dam became the first of 20 major dams that now exist on the river that impound and control water flow in the Upper and Lower Colorado River Basin. The use of the Colorado River water is governed by a complex set of legal and administrative agreements known collectively as the Law of the River. Table 23 Major Dams in the Lower Colorado Basin and Mexico
No.
Dam
Current
Country
Maximum Capacity
(Mm3)
Elevation
(MSL)
Operation
Date 1 Morelos Colorado River Mexico Diverter 32.80 1950 2 Imperial Colorado River U.S.A Diverter 54.71 1938 3 Parker Colorado River U.S.A 800 137.60 1938 4 Davis Colorado River U.S.A 2,243 197.25 1952 5 Hoover Colorado River U.S.A 35,200 372.20 1935 6 Glen Canyon Colorado River U.S.A 34,538 1,131.00 1962 7 Painted Rock Colorado River U.S.A 5,959 212.30 1959 8 Roosevelt Gila River U.S.A 1,705 651.20 1911 Total 80,445 80,445
Source: CNA, 1999 Today, the Colorado River irrigates more than 1.5 million ha (3.7 million acres) of farmland in the southwestern United States and Mexico, and supplies water for nearly 30 million people. While irrigated agriculture tops the list of Colorado River water uses in the United States and Mexico (Table 24), the second largest consumption of water is evaporation from reservoirs. Diversions out of the Colorado basin, such as water piped to Los Angeles, are the third largest draw, and are followed by municipal and industrial uses. Federal hydroelectric plants along the Colorado have a total generating capacity of about 4425 megawatts (MacDonnel and Driver, 1996). Table 24 Water Use by Sector for the Lower Basin in the United States and Mexico (adapted from Morrison et al. 1996)
Use Arizona Southern California
Southern Nevada
Mexico Regional Total;
Urban 24% 44% 85% 7% 33%
Agriculture/Livestock 76% 48% 15% 93% 64%
Environmental/Other 0 8% 0.2% 0 4%
Source: Brusca et al, 2001 The 1944 water treaty guarantees Mexico 1,850 Mm3 (1.5 million acre-feet) per year from the river, and a 1973 amendment to the treaty guarantees Mexico relatively pure water. Much of the water that crosses into Mexico is secondary agricultural drainage from the Imperial Valley in California and the Wellton-Mohawk Irrigation District in Arizona. Nineteenth Century irrigation practices have caused soil laden with pesticides and fertilizers to run off the land into the basin’s river and stream, affecting both soil and water quality that mostly is delivered to Mexico as part of its water allotment. Almost all the Colorado water crossing the border is used for agriculture in the Mexicali Valley (80%), where 500,000 acres are irrigated with water delivered from Morelos Dam (via the Central Canal). The Mexicali Valley, at the northern end of the modern delta, is one of the most important agricultural valleys in Mexico. It maintains 3,000 km of irrigation canals and 17 agricultural

Global Internation Waters Assessment Sub-region 27: Gulf of California
55/91
drains discharging onto the delta. However, emerging cities, especially along the border, are demanding more water for their growing urban needs, and it is probable that the percentage of the Colorado River water that goes to agriculture will diminish significantly in coming years. Maquiladoras have thrived in cities like Tijuana, Mexicali and San Luis Rio Colorado, all which are dependent on Colorado River water. Maquiladoras have priority over water intended for urban uses, and with their high profits these industries can afford to pay for water (Calbreath, 1998). Some industries have even bought water from treatment plants in the U.S., while others are trying to buy agricultural water rights from the Mexicali Valley (Coronado, 1999). These events mark the beginning of a new period where agricultural activities are being replaced by industrial activities on the border. Conflicts and problems surrounding the delta region in Mexico have arisen with the reduction of water flows to the delta region given unsustainable resource exploitation, inappropriate policies, poverty, population growth, and marginalization of the local population. 4.3 Methodology The present part of the methodology explores factors affecting the loss of freshwater to the Colorado River delta region. To determine the relevance and importance in explaining the loss of freshwater resources in the Colorado River delta region, it is necessary to understand root socioeconomic factors and circumstances that affect the freshwater flow, and linkages among these root causes between different users and governmental entities from local to international. It describes the socioeconomic factors that are shaping local and international use patterns. These include regional development forces; national policies and institutions that define the politics of water and its use. Basic questions such as: What are the direct causes of freshwater shortage? What explains the expansion of population growth in the region? What local patterns of resource use can be traced to incentives and limitations from national policies? Which types of activities are likely to increase and which are likely to decline in relative importance? Which technical changes and other types of changes (including regulatory changes) are likely to take place, which may substantially increase or reduce the pressure on the aquatic system? Basically all hypotheses of the problem over the delta region comes to one question: Is it viable to bring more water to the Colorado River delta for ecological purposes without reopening the Law of the River? Although the question remains the same, there still has been no political answer. Freshwater loss around the Colorado River delta region is driven primarily by local population growth and the heavy local reliance on natural resources, particularly of freshwater resources. Underlying these immediate driving factors is the failure to resolve the problems surrounding the water administration of the region. Population growth in the delta region is attributed to the economical attractions of the region, considering that the Southwestern part of the U.S. and Northwestern portion of Mexico is the most dynamic region in the U.S.-Mexico frontier. The lack of real economic alternatives to lie down agricultural lands is equally important in shaping resource use. The political and economic marginalization of the Colorado River delta have made it difficult to improve local socioeconomic conditions of the native population (Cucapá) or support resource use. Recent extensive changes in laws and policies shaping markets and land tenure may have important effects in the region in the long term, but for the moment

Global Internation Waters Assessment Sub-region 27: Gulf of California
56/91
remain distant from local resource use patterns. The creation of wetlands and the recovery of riparian forests in the delta through out the last 25 years however have brought attention to the region. Together with important local efforts to exert control over resources, international conservation interventions in the area offer some hope of slowing the loss of reliable freshwater resources to the Colorado River delta. 4.2 System Description The hydrologic boundaries for the delta region (Fig. 13), encompasses some 8,611 square kilometers (3,325 square miles) in the states of Arizona, Baja California, California, and Sonora, including the Imperial, Mexicali, and San Luis valleys, Yuma Project lands, and the lower Coachella Valley. Fig.13 Colorado River Delta Region
Global Internation Waters Assessment Sub-region 27: Gulf of California
57/91
The Colorado River Delta is located in the upper Gulf of California, Mexico. Encompassing a land area of roughly 600 km2 along the border of the Mexican states of Baja California and Sonora. The delta refers to the area downstream of Morelos Dam between the levees, plus the Rio Hardy wetlands northwest of the levee on the right bank, and also includes the intertidal zone along the final 19 km of the river, encompassing 440 ha. The entire Colorado River drainage basin shall not be included, for the full assessment and causal chain analysis due to the environmental importance of the Colorado River delta. 4.4. Root Causes The following section describes the main issues affecting the Colorado’s River Delta, the immediate causes that affect the Delta, the sector activities involved and the root causes that explain the problematic in the area. Most of the root causes are applied to both Mexico and the U.S. where in fact the main cause only applies to one country where it will be examined. The two issues that are analyzed are; a) modification of stream flow and, b) pollution of existing water supplies. a) Modification of stream flow Following increased diversion, which is the root cause that has the highest priority, reduced peak flows and the changes in return flow are the second in line that have more impact in the modification of stream flow. In addition, decreased inputs from natural causes and the increased evaporation are also considered as more subtle causes. More specifically, the sector activities that influence the modification of stream flow in order of importance are: Agriculture, Urbanization, Industry and Energy Production. However, we are going to concentrate only in the Agricultural sector. Agriculture: The root causes identified are numerous beginning with the (1) demographic aspects, which refer to migration policies incentives in the western states and Mexicali. Due to this increasing migration, meaning that there are more inhabitants in the area, the modification of the stream flow has been greater. Another identified root cause is the (2) technological aspect, which refers to access to construction and irrigation technology. In the last years the construction of dams, reservoirs, and diversion canals has had a very significant impact in the modification of the stream flow. The Colorado River itself is one of the most regulated rivers in North America, whose waters are destined to nine states in the U.S. and Mexico. Concerning (3) economical aspects, the existence of historical agricultural subsidies and the lack of economic validation of water distorts its use. Farmers not only receive subsidies in electricity in order to pump out ground water, they also not pay the real cost of water. These two elements provide an incentive to over consume water and they also create asymmetries in water transfers. Regarding (4) socio-cultural aspects, the need to produce food and other agricultural products in semi-desert and desert zones, and the idiosyncratic differences has molded the institutions and

Global Internation Waters Assessment Sub-region 27: Gulf of California
58/91
laws in different ways between the two countries. This is one explaining in the modification of stream flows in the Delta. As far as (5) legal aspects is concern, the current law that regulates the River is one of the main causes for the modification of stream flow, because it does not consider the environmental water use especially in the Mexican side. Another legal problem in the U.S. side is the difficulty that implies transferring water between users, especially among states. A third legal concern is the problem related to law enforcement in Mexico due to lack of economic and human resources. Finally, Mexico’s Water Act is very inflexible in its River Basin Councils, which represents a problem as well as the lack of clarity in the U.S. Indian Water Rights. Another identified cause refers to (6) knowledge in the Mexican side there is no precise information about the quantity, quality and temporality of water to satisfy the environmental water needs. One aspect that concerns both countries in the decision making process, is that studies and investigations are not ratified by the governments. If the governments do not accept the information originated from other sources such as institutes or universities, there are restrictions in the access to official public information. At the same time, the lack of information about the conditions of ground water represents a problem in both countries. All of this explains the lack of public conscience in the necessities and opportunities in the conservation of the Colorado’s River Delta. Concerning (7) governance, one of the root causes identified is the existence of subsidies in the use of water both in the U.S. and Mexico that do not provide incentives towards efficient use of water. It has been demonstrated that regular subsidies do not provide incentives towards efficient use of the resources. On the contrary, they create the wrong incentives in terms of conservation because the real price of the resource is not considered in farmers’ production decisions. Another important aspect concerning governance is the inadequate consideration of environmental services, which can be conserved through a payment for environmental services. This program operates through direct payments to such communities that participate in the conservation of the environment. That is not to say that every subsidy produce negative effects. Subsidies could be a good government option if they cover three criteria: 1) Increase income levels of poor people (equity); 2) Do not distort the market (efficiency), and 3) Incentive based environment protection. These three aspects could be covered under a scheme of Payment for Environmental Services (PES), where farmers get a payment if they follow the conservation practices stipulated in a contract. This program has been used mainly to provide incentives for forest conservation, oriented to the production of environmental services such as improvement of water quality, and biodiversity conservation or carbon capture. Other subsidies of this kind would be payment in exchange of servidumbres ecológicas, where individuals voluntarily refrain from certain uses that impact the environment in his property. Finally, the lack of executive faculties, budgetary and autonomy in the River Basin Councils represents a problem because they cannot fulfill the recommendations that are discussed at their meetings. Regarding (8), political aspects, the U.S. stakeholders and districts do not accept the information and studies presented that support propose water allotments for the environment. This represents a serious problem because there is no solid evidence for either country to make any decision regarding the assignation of water for the environment.

Global Internation Waters Assessment Sub-region 27: Gulf of California
59/91
As far as (9) environmental aspects are concern, the salinity problem, the water quality, and the land use forces the use of more water to other uses except for the environment. According to the National Water Commission in Mexico, the construction and location of major dams in the Colorado River (Hoover Dam and Glen Canyon Dam) had the most drastic impact upon the amount of freshwater flow that reaches the Delta due to its reservoir capacity. b) Pollution of existing water supplies The sector activities that influence the pollution of existing water supplies is mainly the urban sector and the industry sector. Urban: The root causes identified are several, starting with (1) demographic aspects. The population growth rate represents a root cause in U.S and Mexico, which directly influences the pollution status of existing water supplies. Another root cause identified is the migration policy that provides incentives in the Mexican side for the population to grow. Finally, tendencies in urbanization to occupy agricultural zones prevail. Regarding (2) economical aspects, the economic growth stimulation, as well as the necessity to generate employment are one of the main root causes that aggravate the pollution of existing water supplies. Concerning (3) the technological aspect, there is insufficient technology for the treatment and reuse of residual water, especially in Mexico. There is also a budget restriction in terms of applying desalination technology, which could be use as an alternative for water deviation in the Colorado River. The (4) socio-cultural aspects regarding the issue of pollution, concerns to the fact that there is no payment culture in Mexico, as well as a lack of water conservation culture. One important aspect that has to do with both countries is the idiosyncratic differences that have molded the institutions and laws in a different way. Another identified cause is the (5) legal aspect. The actual laws do not permit the suspension of water services for non-payment, which does not help to alter the no payment culture in Mexico. There are also problems in this country related to law appliance due to lack of economic and human resources. The Mexico’s Water Act is also very inflexible in its River Basin Councils. As far as the U.S. is concern, there are legacy problems that make water transferences between users very difficult especially between Border States. Regarding the aspect of (6) knowledge, there are restrictions in Mexico to access official public information as well as information about the efficiency of water use in the cities. The previous affects the lack of public conscience in the necessities and opportunities in the conservation of the Colorado River delta region. In Mexico there are several (7) governance aspects that have a direct effect in the water conservation effort. First, there is insufficient application of technology in the use of urban water. Second, the no-charge by the management to reprieve water debts sends the wrong signal to the municipalities in terms of not fulfilling their obligations. A third aspect that also concerns U.S. authorities is the historical subsidies of water that do not provide incentives for the efficient use of water. Another aspect of great importance is the lack of executive faculties, budgetary and

Global Internation Waters Assessment Sub-region 27: Gulf of California
60/91
autonomy of the River Basin Councils, so they can fulfill the recommendations discuss at their tables. Finally, in both countries, environmental consideration in the design of public policies is inadequate. The (8) Political aspect has to do with asymmetric power between the agricultural and urban sector. As far as (9) environmental aspects are concern, the salinity problem, the water quality and the land use forces the use of more water to other uses except for the environment. The problem with salinity is that dissolved solids and pollutants are higher where freshwater shortage prevails. This salinity problem increases as it moves downstream in its watershed due to upstream evaporation and return flow from agricultural use. Industry: With regards to (1) demographic aspects; population growth rate represents a root cause in U.S and Mexico, which directly influences the pollution status of existing water supplies. Another root cause identified is the migration policy that incentives in the border region for the population to grow. Concerning (2) governance, one of the root causes identified is the existence of subsidies in the use of water both in U.S. and Mexico that do not provide incentives for the efficient use of water. Another important aspect concerning governance is the lack of executive faculties, budgetary and autonomy in the River Basin Councils, which represents a problem because they cannot fulfill the recommendations that are discussed at their meetings. 4.5 The problem/s and why it is important Too little water is being allocated towards ecosystem maintenance or restoration in the Colorado River Delta. Background forces driving the lack of water include legal, economical, political and institutional mechanisms. The lack of water is a root cause of the habitat loss and ecosystem modification in this area. Impacts on the Delta The reduction in water has resulted in major changes to the Delta: less silt, fewer nutrients, higher salinity, and higher concentrations of pollutants. Erosion rather than accretion is now the dominant physical process in the Delta, a highly unusual condition. The consequences of these changes are significant. The Delta’s expanse has decreased from 780,000 ha (1,930,000 acres) to only 60,000 ha (150,000 acres), a 92% decrease. However, even in its diminished state, the Delta has richer and more diverse ecosystems than the Colorado River between the Grand Canyon and Morelos Dam, a stretch of river five times greater in length. The Delta also supports several threatened and endangered species such as the desert pupfish (Cypranodon macularius ) and the vaquita porpoise (Phoceana sinus) (Lueck et al, 1999). Fisheries and tourism in this area have declined or collapsed, such as the totoaba (Cynoscion macdonali) fishery that closed in 1975 and is now virtually extinct. Historic reductions in river flows have caused dramatic increases in salinity and changes in the distribution of nutrients.

Global Internation Waters Assessment Sub-region 27: Gulf of California
61/91
Impacts on the livelihood of the Indigenous People The livelihood of indigenous groups like the Cucapá people has also been drastically affected by the lack of sufficient water flows into the Delta. For example, they are no longer able to harvest Palmer’s salt grass (Disticilis palmeri), a wild grain on which they relied for subsistence. The salt grass has limited reproductive capability without regular flooding to disperse seeds. Diminished flows in the River have forced many Cucapá to haul their boats miles to reach the nearest waterways to fish, and many travel further to find work in the agricultural fields of Mexicali Valley. No longer able to practice traditional subsistence fishing, hunting and gathering, the Cucapá now work as hunting and fishing guides, and sell their arts and crafts to tourists (Lueck et al, 1999). 4.6 Causes We have identified legal and political factors that are the primary causes of the problem. Legal Framework The waters of the River are governed by the “Law of the River,” an array of statutes, court decisions and decrees, interstate compacts, administrative regulations, state laws, Mexican domestic laws, and international treaties. The Law of the River has resulted in a very rigid system of water rights allocation among the water interests in the U.S. and Mexico. Nearly every drop of water is accounted for in the allocation. The two most important components of the Law of the River are the Colorado River Compact of 1922 and the U.S.-Mexico Water Treaty of 1944 (US-Mexico Treaty for “Utilization of Waters of the Colorado and Tijuana Rivers and of the Rio Grande”). The Colorado River Compact is essentially a contract, ratified by Congress, negotiated among the Seven States in the U.S. apportioning the waters of the Colorado for “beneficial consumptive use”. The Compact divided the U.S. portion of the Colorado River Basin into two sections, with the dividing line at Lee’s Ferry, Arizona. The Upper Basin consists of Colorado, Wyoming, Utah, New Mexico, and a small section of Arizona, while the Lower Basin includes California, the remainder of Arizona, and Nevada. According to the Compact, each Basin has the right to 7.5 maf of water per year. The Lower Basin has the right to an additional 1 maf/year. The U.S.-Mexico Water Treaty, executed in 1944, obligates the U.S. to deliver at least 1.5 maf per year to Mexico, absent “extraordinary drought or serious accident,” and up to 1.7 maf in surplus years. The International Boundary Waters Commission (IBWC) was created to oversee the enforcement of the Treaty. “The Law of the River” has inherent problems. The Compact and the Treaty allocate at least 17.5 MAF from the River. When the Compact was signed in 1922, however, the annual flow of the River past Lee’s Ferry was estimated at 16.8 maf, based on flows from 1896 to 1921; another study based on 1906 to 1921 flows calculated the average at 18.1 maf. In actuality, flows over the past 400 years averaged only 13.5 maf. Thus, the River is over-allocated by almost 30%. Another problem with the “Law of the River” framework is that when the 1944 Water Treaty was signed, the Delta ecosystem was not considered as a beneficial user of the water. Because “The Law of the River” stipulates, “use it or lose it”, people are encouraged to over-consume the water. Article 3 of the Treaty outlines the following beneficial uses of water in order of preference: 1. Domestic and municipal uses; 2. Agriculture and stock raising; 3. Electric power; 4. Other

Global Internation Waters Assessment Sub-region 27: Gulf of California
62/91
industrial uses; 5. Navigation; 6. Hunting fishing and hunting; 7. Any other beneficial use determined by IBWC (IBWC, 1944). Political factors Ongoing disputes between the United States and Mexico over the allocation of Colorado River water have lasted for almost a century rendering it difficult for the two countries to agree on any amendments to the 1944 Treaty. Within Mexico and the U.S., farmers are a politically powerful lobby. In the past 40 years their interests have dominated the allocation of water to the detriment of the Delta ecosystem. Presently about 80-90% of water is used by agriculture in both the United States and Mexico. Farmers use the water essentially free of charge (El caso del agua dulce en Mexico, 2003). The only cost to farmers is that of pumping the water to their farmlands, which in the Mexican case is also highly subsidized (Tarifa 09 and Tarifa 09-cu). This has encouraged farmers to grow water intensive crops, such as alfalfa and asparagus in an arid climate. 4.7 Prospects for Restoration Despite literally being last in line to receive water, one cannot doubt the resiliency and determination of the Colorado River Delta (Delta) ecosystem to survive. After nearly two decades of minimal to no flows, three El Niño weather cycles in 1983, 1993, and 1997 produced above-average snow pack levels and spring floods that exceeded consumptive use and storage capacity of Lake Mead (Zamora et al, 2001 ).This excess of precipitation resulted in the release of substantial flood flows that reached the Delta. Figure 3 displays the annual water releases from the U.S. to Mexico in the River below the Southerly International Boundary in Mexico from 1955 to 2000. For example, in 1997, Mexico received 634,000 acre-feet (af) of excess flows beyond its annual 1.5 million af allocation (Clark et al, 2001) In 1998, 1999, and 2000, it received excess flows of 2.4 million af, 900,000 af, and 337,000, respectively. On average, from 1980 to 1993, annual flood flows in Mexico reached 3.9 million af (Lueck et al, 1999). This figure is about three times the amount that Mexico receives under treaty obligations (1.5 million af) and 25 percent of historic flows (prior to dam construction) into Mexico. While some of these excess flows have been diverted for agricultural and municipal purposes, most have flowed unimpeded into the Delta because there is no capacity to store and manage these flows. This extra bounty of water has contributed to a biological revival of vegetation, wildlife, and fisheries. For example, the Delta’s wetland and riparian areas have grown in size and biological diversity. Seasonal flows and operational over-deliveries have been a fortuitous if not dependable source of water for the Delta. Some scientists expect excess flows due to El Niño storm cycles to continue in the future (Zamora et al, 2001). However, there is no guarantee that the restoration of Delta habitat over the past two decades will be maintained by future flows. The western U.S. is experiencing its fourth year of drought and the level of Lake Mead is at its lowest level since Lake Powell began to be filled thirty-seven years ago (Kriz , 2003). Responsible management and genuine restoration of Delta ecosystems, therefore, dictates that a reliable source of water for the Delta must be secured. Culp predicts that the little water the Delta receives today will decline in the future as greater efficiencies in the operation of the River and storage of its waters will reduce floods and wastewater flows to the Delta. Moreover, population growth, overdraft of groundwater supplies, and fulfillment of tribal rights to water in the Lower Basin will all undoubtedly lead to more demands on River water. For

Global Internation Waters Assessment Sub-region 27: Gulf of California
63/91
example, by 2025, California’s population is expected to increase by 16 million people (likely concentrating in Southern California) while the population of regions served by River water in Arizona and Nevada is projected to double. Furthermore, since Lower Basin states are currently using groundwater supplies that are already over-exploited, even greater demand for water from the River will likely occur in the near future. Finally, as Indian tribes in the Lower Basin begin to exercise their full water rights, which are generally more senior than other users, an inevitable reallocation of water will occur. Culp admonishes that “Without a legally guaranteed flow of water, the Delta will inevitably be pushed -permanently- past its ecological limits”. Thus, even though the prospects for restoration are high, without a reliable source of water, these prospects grow dimmer day by day. Recently approved reforms to the National Law of Waters On April 24, 2003 (the reforms were approved on April 29, when the Chamber of Deputies voted the reforms previously proposed and approved by the Senate on April 24) the Mexican Congress approved important reforms to the National Water Law (NWL). These changes will improve the institutional framework of Mexico’s existing water market and may lead to the provision of water toward environmental purposes (Comisión de Recursos Hidráulicos, 2003). Mexican authorities have recognized that the main problem of water distribution in Mexico is institutional more than technical or geographic. Under the previous water law CNA had most of the responsibilities setting national water policy. State and local governments and even regional representatives of CNA were unable to design specific policies to improve the efficiency of water use and management according to the specific needs, characteristics and resources of each region. Local proposals were required to go through a time-consuming approval process of central authorities, leaving state and local governments with just a marginal role. During the 1990’s the federal government tried to decentralize CNA so states and local governments could manage water resources and find innovative solutions to water scarcity. However, opposition from CNA and farmers blocked the effort. In 2000, a new federal administration identified that a more decentralized system could be an effective strategy to reduce water inefficiencies such as leaks, illegal diversions, and avoidance of payment in urban areas (CNA, 2001). Under the new water law, CNA has greater autonomy to coordinate national policy while its regional representatives, renamed Regional Water Basin Organizations, are now the ones in charge of distributing, monitoring and charging for water in each state. State and local governments can also enter into new agreements with the federal government to administer the revenues from water fees coming from their own jurisdictions (Comisión de Recursos Hidráulicos, 2003). The recently approved water law establishes new rules to simplify the transfer of water rights and defines key terms and concepts that were previously subject to misinterpretations. Farmers and industries will receive incentives to implement technological improvements to reduce water consumption (CNA, 2001). Moreover, the law guarantees farmers that they will continue to receive the same allocation of water they are currently receiving even if they reduce their overall consumption (Comisión de Recursos Hidráulicos, 2003). With this guarantee, farmers will hopefully be motivated to reduce their total consumption of water and sell or lease their surpluses without the threat of losing their original allocation from CNA. The new legal framework allows the President of Mexico to declare as a “disaster zone” a specific region where an ecosystem is threatened by natural or human modifications. In this case, the federal government would have special powers (e.g. condemnation, special funds) to solve the

Global Internation Waters Assessment Sub-region 27: Gulf of California
64/91
problem. More importantly, using water for environmental purposes will be cons idered a “beneficial use” of water. Following domestic and urban use of water, which has the highest priority, fisheries and environmental are the second in line for water allocations (Comisión de Recursos Hidráulicos, 2003). This represents a fundamental reordering of beneficial use priorities. Delta Flow Needs Any effort to secure a guaranteed source of water for the Delta must be informed by the ecological needs of the Delta. Mexican and American scientists have conducted research on the River’s riparian corridor and its native vegetation, wetland habitat, and fauna that rely on these habitats. However, only one study has been published documenting the necessary flood flows to induce favorable biological responses and to maintain the Delta’s remnant habitat. Using satellite images and field inspections, Zamora-Arroyo analyzed the effects of flows to the Delta from 1992 to 1999 on the abundance of native vegetation. In particular, flood flows of 260,000 af in 1997 were sufficient to inundate most of the River’s floodplain. Since these flood flows produced a significant vegetation response (i.e. , an abundant emergence of seedlings), the study concluded that flows of 260,000 af every four years are adequate to support existing vegetation and germinate new stands of native trees (Lueck et al, 1999). Combined with flood flows, the study also found that annual flows of approximately 32,000 af should be sufficient to maintain the delta’s existing riparian and wetland habitat (Clark et al, 2001). It is important to note that flood flows of 260,000 af represent less than one pe rcent of the River’s average annual flow. Thus, Briggs et al. concludes that “Due to the resilience of the delta’s native riparian vegetation, the most important ecosystem functions can likely be supported by only a fraction of the historic flows…” and that “…large continuous flows of water in the river are not necessary to support the remaining delta riparian habitats”.(Clark et al, 2001) However, because the study by Zamora-Arroyo, only observed flood flow effects on vegetation after one season of flood flows, further study is needed to document long-term vegetative changes in response to the River’s flow regime and the freshwater needs of other species that depend on the Delta’s ecosystem. For example, in-stream flow needs for near-shore marine species such as the vaquita (Phocoena sinus) have yet to be definitively quantified and studies on the relationship between in-stream flows and the species (e.g., southwestern willow flycatcher) that depend on aquatic habitats for survival have not been conducted (Pitt, 2001). 4.8 Conclusions It is very unlikely that any surplus water from the Colorado River is to be used for riparian restoration projects in the Colorado River delta, due to the exceedingly demand of water in the U.S. western states. Although the Colorado River delta is maintained by the discharge of floodwaters and agricultural drain water from the United States to Mexico, it is known that even this source of water is to be questioned. The U.S. Bureau of Reclamation has proposed new regulations and projects, including off stream storage of water and privatization of the Wellton-Mohawk irrigation district which are likely to reduce such flows, without considering the impact on the delta ecosystems (U.S. Bureau of Reclamation, 2002). The Department of Interior, the states of California, Nevada and Arizona have developed to the main stem of the Colorado River from Lee’s Ferry, Arizona to the Southerly International

Global Internation Waters Assessment Sub-region 27: Gulf of California
65/91
Boundary a multispecies conservation program, with the purpose to remediate some of the damage to the riparian zone in the United States portion of the river. Yet no official recognition is given to the delta ecosystems in Mexico. Even if it were determined that more water should be given for the delta (0.2 maf), state interests and the United States government remain cautious about supplying more water to Mexico. "We don't have any jurisdiction over how Colorado River water is used once it crosses over the border into Mexico," said Robert Johnson, regional director for the Bureau's Lower Colorado Region. The question remains in how to increase those allocations to Mexico without reopening the Law of the River is considered by many to be a major undertaking and one that could involve massive litigation. The Pacific Institute in its 1996 report "The Sustainable Use of Water in the Colorado River Basin" indicate that the Mexicali Valley is suffering from a groundwater overdraft of roughly 118,414 m3/year (96,000 acre-feet annually). The overdraft could become even greater with the added lining of the All American Canal north of the border - a source of groundwater recharge for Mexico. Seepage from the All-American Canal has created a series of wetlands totaling over 6,200 hectares (15,500 acres) along the U.S.–Mexico border. Over half of these are in Mexico, east of the portion of the canal that is proposed for lining, and will therefore be impacted by lack of further seepage. The Andrade Mesa Wetlands are extensive and provide high-quality bird habitat in an isolated part of the northern Colorado River delta where replacement habitat is non-existent. The loss of this critical habitat should be considered in assessing the potential environmental impacts of the canal-lining project (Hinojosa-Huerta et al, 2003) Mexico's desire for more water has given rise to fears that increased flows to Mexico would be used to recharge ground water overdraft or to irrigate fields in Mexico instead of as in stream flows for the environment. First and foremost, the Colorado River provides water for agriculture, municipal and industrial needs as well as electricity generation in the lower Colorado basin. Major issues such as water rights to Native Americans, ecological and urban water resources, have made the question of how to allocate the shortage between actual flows and 21.5 Mm3 (17.5 million acre feet) in allocations that would occur at this moment has not been addressed.
Global Internation Waters Assessment Sub-region 27: Gulf of California
66/91
5. Policy Option Analysis
By Edgar Arias, Amy Boone, Daniel Chia, Arturo Vargas, Mariana Becerra, Carlos Muñoz and Jaime Saínz
This report recommends three options to secure at least a portion of the annual flow requirements for the delta ecosystem. We have categorized these options into short (less than 5 years), medium (5-10 years), and long-term (greater than 10 years) periods. The short-term option is to lease water rights from farmers in the Mexicali or San Luis Rio Colorado Valleys (District 14). Since existing Mexican laws and regulations allow for the lease and transfer of water rights for conservation purposes, we view this as the most expedient method to secure a guaranteed water supply for the Delta. Our medium-term proposal is to buy or lease water rights in the United States and transfer the water to the Delta. Since significant legal barriers (e.g., the 1944 U.S.-Mexico Treaty) exist to prevent the transfer of this water to Mexico, it may not be feasible to implement this option in the near-term. Finally, for the long-term, we propose a change in the allocation of water to Mexican farmers, and the elimination of electricity subsidies to these farmers in order to motivate them to use less water. At the same time, farmers would benefit from these changes by being able to market their water savings. We acknowledge that deep-seated institutional and political obstacles may very likely challenge any attempt to push these options forward. Thus, a long-term horizon is an appropriate way to frame their potential implementation. Any solution to secure a guaranteed flow of water for the Delta must come from existing users in the United States and Mexico. This is due to the fact that the River is already over-allocated; there is simply no more water to allocate. However, getting this water will undoubtedly be challenging considering the fact that agricultural interests, the largest users of water, are powerful and politically well connected, as are municipal users. Moreover, since existing users are not likely to voluntarily give up water for the good of the Delta, any non-voluntary effort must involve a reallocation of water under the auspices of the Law of the River, an effort that is almost certainly doomed to fail. Moreover, we strongly emphasize that any strategy to obtain a guaranteed source of water must be bi-national; that is, both countries should bear the ultimate responsibility of restoring the Delta ecosystem. As eloquently stated by Peter Culp:
The historical context must inform any solution to the Delta problem. Mexico has seen one of its largest rivers, wealthiest agricultural districts, and most important fisheries dried up, or salted up, by U.S. development upstream. From a Mexican perspective, the Mexico-U.S. Water Treaty--negotiated during a period of U.S. dominance and relative Mexican weakness--was substantively unfair. In the intervening years, the U.S. has consistently denied responsibility for the harsh environmental, social, and economic impacts to Mexico of its development policies on the Colorado…Of the 17.5 maf of Colorado River water that is allocated…the U.S. claims 16 maf--around 92 percent…To use only Mexico's apportionment to save what little is left of the Delta heaps insult upon injury. Equity requires that the burden of water needed for restoration be shared between the two countries (Glennon and Culp, 2002).
Consistent with this perspective, we propose options that can be implemented in both Mexico and the U.S. Below; we describe each option and general steps to implement each option. 5.1 Short-Term Policy Option: Lease water rights in the Mexicali and San Luis Rio Colorado Valleys and transfer associated water to Delta ecosystem.
Global Internation Waters Assessment Sub-region 27: Gulf of California
67/91
This option involves the leasing of water rights in District 14 as the primary mechanism in Mexico to secure a guaranteed annual water source for the Delta. This option can be implemented immediately as existing Mexican laws currently allow water transfers for conservation purposes. Other mechanisms to secure water include permanently purchasing water rights or land with associated water rights. However, as explained below, at this point, the most expedient and economical option is to lease water rights since farmers are reportedly opposed to selling their land and by extension, we reason, their water rights. This section briefly describes the legal basis for leasing and transferring water rights and the steps that generally should be taken to implement this option. Legal Basis for Leasing Water Rights Essentially all the water available in District 14 is defined as national waters, falling under the jurisdiction of the CNA. The Mexican government first allocated water rights in this district in 1938 (Clark et al, 2001). These rights are tied to the land and allocated commensurate with the size of the parcel. In most cases, a water-rights holder receives enough water to irrigate a twenty-hectare parcel (approximately 160 af or 8 af/hectare). However, depending on the availability of water, this amount can vary from year to year (IBWC, 1944). In 1992, the Mexican government passed a National Water Law (NWL) to legalize the purchase or lease of water between private parties. Water rights may be converted from an agricultural use to other uses (e.g., ecological purposes) as long as CNA approves the change and law permits the new use. When approved, a water (or irrigation) right is converted into a concession title and is valid for a period of 5 to 50 years. The concession title must then be registered in the Public Registry of Water Rights, created by the NWL as a way of legally proving the existence and status of a title. As of May 2001, CNA has never been requested to approve the transfer of water for ecological purposes. However, Clark et. al. and Carillo report that CNA officials in Mexicali generally would approve such transfers assuming the requirements of all laws and regulations are fulfilled. Comisión Nacional del Agua Mexico’s National Water Law (NWL) serves as the basis for the management of national waters. The Comisión Nacional de Aguas (CNA) is the federal agency designated to implement the policies of the NWL and develop associated regulations. To manage water allocations, CNA has divided water management districts into geographic modules. Each module is governed by a local government entity that is responsible for the management, operation, and maintenance of the module’s water distribution canals. Each module submits its water order to CNA who then delivers the order to the external boundary of each module. The module employs zanjeros (ditch riders) who make the final delivery of water to individual parcels. In District 14, CNA allocates water rights based on the assignment of regional and national cropping patterns. Thus, if a farmer grows a more water-intensive crop, he receives a greater amount of water. This system reportedly operates effectively while minimizing illegal water diversions (Carillo, 2002). However, Clark et al. recommends that “If the CNA canal system and delivery ditches within the modules are to be used to deliver water to the Delta ecosystem, it is imperative that an advocate for delivery of the Delta water be an active participant in the governance of the participating module or modules”.
Global Internation Waters Assessment Sub-region 27: Gulf of California
68/91
Step 1: Inventory Available Water Initially, we recommend that an inventory of available water supplies for lease in District 14 should be conducted. The Sonoran Institute (Institute) of Arizona is currently carrying out this task by focusing on those parcels that have not been under production for three to five years (Zamora, 2003). According to the Institute, if farmers do not use their land or water rights for agricultural purposes for four consecutive years, they may lose their water rights. Therefore, the above timeframe should provide a rough estimate of the total amount of water potentially available for lease. Step 2: Lease Water Rights from Willing Farmers After this inventory is available, individual farmers can then be approached to gauge their interest in leasing all or some of their water allotment. Alternatively, where appropriate, advertisements could be placed in newspapers or in the offices of CNA or modules. The price of water may be determined through three methods: (1) a standing offer, (2) individually negotiated contracts, or (3) through an auction (Pitt et al, 2002). Carillo surveyed farmers within and outside Dis trict 14 to assess their attitudes and willingness to lease their water rights or retire their land for Delta conservation purposes (Carrillo, 2002). For this reason, the survey was limited to farmers owning land adjacent to the River or its levees; that is, land is the most suitable for riparian or wetland restoration. The results of the survey indicated that 87% of the farmers surveyed with water rights are willing to lease them for purposes of maintaining and enhancing native riparian vegetation. Of 663.5 hectares (1639 acres) of irrigated land owned by these farmers, the water rights associated with about 214 hectares (529 acres) could be available for leasing. This amount of water is approximately 1,731 af and the cost to lease this water is between $54 and $271 per hectare/year or approximately $6.66 and $33.55 per af/year. Thus, using these figures, the cost to secure an annual flow of 32,000 af of water would range between $213,120 and $1,073,600. Purchasing water rights or land with water rights attached is another option to secure water for the Delta. Based on preliminary estimates, the cost to permanently purchase water rights in District 14 is approximately $1,000 per hectare or $123.46 per af (Zamora, 2003). Thus, the total cost to purchase 32,000 af of water would be $3,950,720. While a significantly greater upfront payment is necessary, purchasing water rights would be the most cost-effective approach as benefits can be permanently guaranteed. Compared to leasing water rights, one would break-even by purchasing water rights after approximately the fourth year of leasing (using the upper end of leasing costs). However, according to the survey by Carillo (2002), almost all farmers contacted (96%) would be unwilling to sell their land “…because it is the only legacy they could leave to their children” (Carrillo, 2002). With this in mind, high resistance to purchasing water rights may also be encountered assuming farmers wish to leave a legacy that involves the use of water. Nonetheless, because of it is more cost-effective than leasing water rights; this option should not be dismissed, as some farmers may be willing to sell their water rights. Further Steps With adequate funding from the Global Environmental Facility, a qualified non-governmental organization (NGO) could implement a water rights leasing program in Mexico. As discussed above, the Sonoran Institute is initiating such a program by inventorying available agricultural water supplies in District 14. After leasing water rights, we would expect the NGO to monitor the delivery of leased water to the Delta through the local CNA office, the responsible entity for
Global Internation Waters Assessment Sub-region 27: Gulf of California
69/91
delivering water to the Delta. As recommended by Clark et. al., representatives of the NGO should also establish relationships with the leaders of the module(s) in which the water rights were leased (Clark, 2001). Considering the precedent-setting nature of such a program, it is important that the NGO gain the trust of the leaders of the module and the community at large. Unresolved Concerns Assuming the actual amount of water available for lease in District 14 is consistent with that which Carrillo identified (1,731 AF); this amount represents only five percent of the estimated 32,000 AF in annual flow needs. In order to meet this need, the balance would have to be made up from U.S. or other sources. Nonetheless, even limited guaranteed flows to the Delta could benefit existing riparian or wetland habitat during periods of drought (Carrillo, 2002). Although this report does not address the potential economic effects of this option, they should not be ignored. We would expect that farmers would partic ipate in a water-leasing program if they expect to receive greater economic benefits than those received from farming. Farmers with water rights that are currently not farming would likely be most interested in participating. However, to the extent that the program offers a leasing price high enough to encourage farmers to stop farming, there could be adverse economic consequences. Moreover, this option does not address the documented need for periodic flood flows in order to inundate the floodplain and produce responses in native riparian vegetation. Briggs et al. recommend that when surpluses arrive in the River, they be delivered as flood flows to the Delta (Lueck et al, 1999). The U.S. Department of Interior (Bureau of Reclamation) and the International Boundary and Water Commission would likely be the most appropriate entities capable of addressing this need. More specifically, new surplus criteria should be developed to require environmental considerations to be taken into account when deciding how annual surplus flows are allocated. The results of Carillo’s (2000) survey indicate that Mexican farmers realize the importance of in-stream flows and are willing to participate in water leasing or land retirement programs that would provide these flows to the Delta ecosystem. In addition to financial gain, farmers also understand that healthy riparian forests minimize the loss of farmland to erosion during flood events by providing stabilizing riverbanks. Other farmers acknowledge that by converting their land to wetland or marsh habitat, they could, with expert advice, also explore other uses of their land such small-scale aquaculture operations or ecotourism activities such as bird watching and camping (Carrillo, 2002). This willingness holds much potential for a water leasing or land retirement programs that could ultimately be expanded to a greater level with community, NGO, and government support and funding. At the same time, efforts to assist farmers in developing economically viable alternatives to farming should also be encouraged. 5.1.1 Short Term Policy Option subcategory: Grant subsidies to farmers in the US and Mexico for implementing water conservation measures. In exchange, farmers would dedicate rights to water saved. This water could be diverted into the Delta. Mexico is experiencing a serious problem of water waste especially in the agricultural sector, according to the National Water Commission (2001) 83% of the water is dedicated to the agricultural sector. Of this, water loss fluctuates between 30% to 50%. One of the explanations
Global Internation Waters Assessment Sub-region 27: Gulf of California
70/91
for this water waste is the lack of resources to implement conservation measures. This is one of the reasons farmers get less water for their production activities, especially in areas where scarcity prevails. Implementing water conservation measures could help increase the quantity of water received in the agricultural sector, and thus farmers could divert water into the Delta for conservation purposes. Potential for water conservation in the agricultural sector According to Pontius (1997), water conservation is the most effective tool in demand management and often the cheapest source of new water supplies. Water conservation measures are one of the least expensive methods to provide water for growth and to assure an adequate supply for the future. Evidence suggests that there is much potential in the Colorado River Lower Basin (US and Mexico) for effective water conservation in the agricultural sector. Farmers would also save money from reduced water pumping costs. The importance of technological measures It is very important to balance available water resources especially if the demand for water is increasing. The technological methods that can be used to improve the conservation of water in the agricultural sector are as follow: better maintenance of existing irrigation systems, information management techniques, altered tillage and soil management, or changes in cropping patterns (e.g. reduce acreage, switch to less water intensive crops). The structural methods for the same purpose are: replacing open ditches with underground pipe, lining ditches, use of gated pipe, fitting gated pipe systems with surge-flow devices, conversion from furrow to sprinkler irrigation or drip irrigation, upgrading existing sprinkler systems, and installation of tail water recovery systems. One study suggests that approximately 1.2 million acre-feet of water savings could be achieved by the agricultural sector by investment in irrigation efficiency and retiring marginal land (Pacific Institute, 1996). The California State Water Resources Control Board found that the Imperial Irrigation District could save up to 400,000 af/year with irrigation efficiency improvements. Water transfers Water transfers of this kind are becoming more common in California including a proposed agreement by the San Diego County Water Authority and Imperial Irrigation District to “free up” 500,000 af of water. However, in order to transfer water to Mexico, a Minute to the 1944 Mexico- US Treaty would have to be executed. Political Feasibility In order for the farmers to dedicate water to the Delta and not keeping the water for their own use, they have to have the right incentives. As previously discuss, the leasing of water rights is an incentive to save water. 5.2 Medium Term Policy Option: Purchase or lease water rights in the United States in order to use the water for ecological purposes in the Colorado River Delta.

Global Internation Waters Assessment Sub-region 27: Gulf of California
71/91
Water transfers, or the purchase or lease of water, are an important and successful tool to redistribute water between geographic areas or between user groups. Water transfers such as those between the Central Arizona Project and other southwestern states have allowed for the redistribution of water that would have otherwise not been feasible because of the rigidity of the “Law of the River.” The purchase or lease of water rights in the U.S. may provide a signif icant portion of the annual flow needs of the Delta, although there exist legal cha llenges to transfer the water between the Lower and Upper River Basins and between the U.S. and Mexico. Because agricultural production in this region is of low value and uses water inefficiently, the purchase or lease of water represents an economically feasible way to ensure water for the Delta. Legal basis and needed changes for the purchase or lease of water in the U.S. Existing law establishes a strong foundation for this policy option. Under current U.S. law, water rights may be purchased or leased without buying the property to which the rights are assigned. However, property owners who have weak or junior water rights (those which have legal standing after water allocation to senior rights holders have been fulfilled) may be at a disadvantage to those with more secure rights and may receive a lower price for their water. Despite this foundation, there are legal challenges to the transfer of water between the Upper and Lower Basin states and between the U.S. and Mexico. The Colorado River Compact of 1922 allocates 7.5 maf of water to both the Upper (Colorado, Wyoming, Utah, and New Mexico) and Lower Basin States (Nevada, Arizona and California). If water is to be transferred from the Upper Basin for restoration of the Delta, the Compact may need to be amended in order to overcome political opposition from Lower Basin states. In addition, the Treaty of 1944 would need to be amended through a minute to allow water to flow from the U.S. into Mexico in excess of the 1.5 maf currently provided through the Treaty. For example, the Treaty of 1944 could be amended through a “congressional-executive” agreement that would accomplish the same results as a full-fledged amendment to the Treaty of 1944. However, it would be more politically feasible as it only requires a majority of both the U.S. House and Senate rather than a two-thirds vote required of the Senate for a treaty amendment. The minute will be able to overcome legal challenges raised by individual states because it is an executive agreement and as such, supercedes any conflicting state laws. Lease or Purchase Rights from Willing Farmers Agricultural production in the Colorado River Basin is often of low value and consists of water intensive crops such as wheat and upland cotton which return approximately $35 and $40/acre-foot of water, respectively (Pitt et al, 2002). A recent report has estimated the cost of leasing water in the Wellton-Mohawk Irrigation and Drainage District in Arizona to be $53/acre-feet plus an incentive payment. It would cost approximately $2 million per year to provide the Delta with an estimated annual flow of 32,000 acre-feet (Lueck et al, 1999). The cost for purchasing water in the Wellton-Mohwak is estimated to be about 10 times the cost of leasing it or about $530/acre-foot, excluding incentive payments (Pitt, 2003). Therefore, the estimated cost to purchase water rights equivalent to 32,000 maf would be $17 million. It is believed that securing permanent water rights will be significantly more difficult than leasing because it limits the options for agricultural production on the property.
Global Internation Waters Assessment Sub-region 27: Gulf of California
72/91
Institutional capabilities With adequate funding a non-profit or governmental entity could be charged with identifying available water to purchase or lease in the U.S. This entity would purchase/lease, hold, and monitor the delivery of the water to the Delta. The proper price of water may be determined through three methods: (1) a standing offer; (2) individually negotiated contracts; or (3) auctioning (Pitt et al, 2002) In the Upper Basin, it is impossible to quantify how much water each farmer uses because of a lack of gauging stations at individual parcels. The use of water is determined by comparing historic outflows (as a proxy of current inflows) to present-day outflows. Overall, Upper Basin usage is determined by what is used downstream, severely limiting the extent to which water rights purchased in the Upper Basin may be enforced. At the Mexican border, the IBWC would be responsible for ensuring that the purchased amount of water reaches the Delta. A stream gauge station should be located near or at the Delta to aid in monitoring. The IBWC has recently asserted its interests in ecological issues through Minute 306, passed in 2000, that provides a framework for bi-national cooperation in carrying out scientific research on the Delta ecosystems. The Minute establishes a “framework for cooperation” to address ecological concerns of the Delta and suggest possible alternatives for restoring the Delta. The process would include the “formulation of recommendations for cooperative projects” (IBWC, 2000). The Minute represents a substantial leap forward towards the restoration of the Delta. The entity holding the water rights must have the institutional capability to ensure, by checking stream gauge readings and water records, that IBWC is delivering the appropriate amount of water to the Delta. In addition, experts believe that independent observers may be necessary to ensure unbiased monitoring (El caso del agua dulce en Mexico, 2003). Political Feasibility Despite the fact that the water transfers are voluntary and economically feasible, there may be political opposition to this policy option because of the enormous pressure on the Colorado River’s resources. The Upper Basin states may oppose water transfers because it would signal that they are not using their entire allocation of water for “beneficial consumption”, opening up the possibility of a reallocation between Basins. In addition, the Lower Basin states may oppose the transfer because they currently benefit from water that the Upper Basin does not use and therefore flows into their states. Water transfers would effectively mean that the Lower Basin states would have to pay for the water they are now receiving for free (Culp, 2001). However, it is conceivable that water transfers for ecological purposes, as public goods, would not cause the political opposition that other water transfers may provoke. Despite the political and legal barriers to voluntary water transfers from the U.S. to the Delta, this policy option represents a way in which water can be transferred to the Delta without the need to renegotiate the “Law of the River.” Due to inefficiencies in agricultural production in the Colorado River Basin and the opportunity for farmers to benefit financially, a water transfer program could address the needs of the Delta ecosystem and water interests in both countries.

Global Internation Waters Assessment Sub-region 27: Gulf of California
73/91
5.3 Comparative Water Transfer Costs The cost of permanently acquiring water rights in the U.S. is expensive, ranging from 10 to 20 times the price of leasing water rights. The cost of leasing water in Mexico will become more expensive than permanently purchasing water rights after 3-18 years, based upon the range of leasing prices. In the U.S. the cost of leasing will exceed the cost of permanently purchasing rights after 10 years. However, one must consider that leasing costs will decrease in the future due to discounting. In addition, the cost of leasing water in the Wellton-Mohawk district is 2-7 times the price of leasing water in Mexicali and San Luis Rio Colorado. The cost of purchasing water in Wellton-Mohawk is roughly 4.3 times the price to purchase water rights in Mexicali and San Luis Rio Colorado. Table 25 Price of leasing compared to purchasing rights in Mexicali and San Luis Rio Colorado, Mexico and the Wellton-Mohawk Drainage and Irrigation District in Arizona. Total cost to provide 32,000 maf is also listed. (U.S. dollars) Location of Option Mexicali and San Luis Río Colorado,
Mexico Wellton-Mohawk, Arizona,U.S.
Price per acre-foot Total cost Price per acre-foot Total cost Lease $6.66 to $33.55 $213,120 to $1,073,600 per
year $53 $1,696,000 per year
Purchase $123.46 $3,950,720.00 $530 $16,960,000 Source: With data from J.Pitt (2002), Carrillo (2002), and Francisco Zamora (2003) Table 26 analyzes the cost of providing one -half (17,000 maf), three-fourths (25,000 maf) and the full amount of annual flows (32,000 maf) needed for the Delta based on preliminary estimates. In addition, it analyzes the difference between providing the amount of water exclusively within Mexico, exclusively within the U.S., and shared equally between the two countries. Table 26 Sensitivity Analysis of Purchase/Lease Allocation in the Wellton-Mohawk and Mexicali/San Luis Rio Colorado districts. (Thousands of USD) Location of purchase
Amount of water (maf)
100 percent lease 50 percent lease/ 50 percent purchase
100 percent purchase
17,000 342 1,220 2,099 25,000 503 1,795 3,087
100% Mexico
32,000 643 2,297 3,951 17,000 621 3,088 5,554 25,000 914 4,541 8,168
50% Mexico/ 50% U.S.
32,000 1,170 5,813 10,455 17,000 901 4,956 9,010 25,000 1,325 7,288 13,250
100% U.S.
32,000 1,696 9,328 16,960 Source: With data from J.Pitt (2002), Carrillo (2002), and Francisco Zamora (2003) The lowest cost option for leasing or purchasing water over all amounts is to obtain the water from the Mexicali/San Luis Rio Colorado district. However, the exclusive purchase and leasing
Global Internation Waters Assessment Sub-region 27: Gulf of California
74/91
of water in Mexico has serious equity concerns. It is frequently asserted that Mexico lacked bargaining power during the 1944 Treaty negotiations and thus, was under-allocated its fair share of water (Culp, 2001). We therefore recommend that the purchase or lease of water rights be shared to some degree by the U.S. and Mexico. 5.4 Long Term Policy Options Institutionalize the market for water in Mexico. Convert the electricity subsidy in the agricultural sector through a cash subsidy or decoupled subsidy in order to approximate to the real price of water. As well as eliminating the price subsidies of domestic users of water. Think about subsidies differently Currently, farmers receive water at a highly subsidized rate - essentially it is free. Not only does this provide an incentive to over-consume water, but it also distorts the water market for water. The estimate of the real price of water could be useful to reduce information asymmetries in water transfers. The different prices of water that have been negotiated by farmers do not always reflect the “real” cost of water; in economic terms, the market price does not equals the marginal cost of providing it. Authorities estimate that most transactions are below the marginal cost. Currently water rights sold in the Mexicalli Valley range between 700 and 1200 USD per hectare. The ‘real’ costs of water are estimated between 3000 and 4000 USD. (Oyarzabal, 2003) Farmers currently receive subsidies in the price of electricity to pump out ground water. These subsidies give farmers the incentive to over-exploit this source of water. Though eliminating this subsidy may not be politically feasible, converting it into a cash subsidy could lead to greater efficiencies in use. Currently, most farmers receive cash subsidies to compensate price subsidies elimination in agricultural inputs (e.g. seeds, fertilizer) through PROCAMPO. With a cash subsidy, farmers could choose if they prefer to consume other goods and reduce or eliminate their consumption of underground water. In other words, farmers may be able to find cheaper sources of water thereby reducing or eliminating their consumption of groundwater while using the money they save for other purposes. Therefore, this policy can lead to the reduction of market distortions, over-exploitation of groundwater, and save public resources without harming the interests of farmers. In addition, “Decoupling refers to the effects of a measure, or a set of measures”, a policy is decoupled if it has no or only very small effects on production and trade. According to the OECD, a decoupled policy should not affect either production or consumption decisions. Contrary to the decoupled subsidies, ordinary subsidies do not necessarily contribute to a more efficient way of production. They lack the incentives to use efficient ways of production, and the misuse of resources such as water or electricity is greater. It has been demonstrated that decoupled subsidies work better because there is compensation to the price increase, in which it is calculated how much payment is needed in order to raise the price of electricity for instance. As discussed above, it is natural to believe that there will be opposition coming from the agricultural sector especially because water price has not been an issue in their production decisions. However, with a decoupled subsidy this burden can be diminished. In the European Union one of the most important forms of support to the agricultural sector has been cash payment. Experts argue that these payments are more secure than a price support system, with a better guarantee behind them (Frawley et al, 1997). We believe that this option is politically feasible if the cash payments can indeed improve production in the agricultural sector. Therefore,
Global Internation Waters Assessment Sub-region 27: Gulf of California
75/91
this option would be more feasible in the long term, giving an opportunity to the farmers to adjust to the idea that water has a price. As far as water price is concern, we propose the elimination of price subsidies to domestic users of water. Although subsidies to export-oriented crops are difficult to modify given the possible reduction in competitiveness for agricultural products in the international markets. Similarly, modifying water subsidies for industry can affect the competitiveness of Mexico as a main recipient of foreign investment. In order to minimize polit ical opposition to this proposal the government can lower taxes to the general population and increase cash subsidies to the low-income population. Currently the low-income population is very well identified through a cash subsidy program called OPORTUNIDADES. This program targets the poorest families in the country offering cash grants if they met certain conditions (e.g. sending their children to school, go to clinics for regular check ups. To meet these conditions without enhancing current disparities in water distribution, a parallel increase of water distribution to underserved areas would be necessary. The recently approved changes obligate CNA, local, and state governments to expand the distribution of water to underserved areas and increase price subsidies for low-income groups. Approximately, 10% of urban population does not have access to water. Most of this population lives in poverty or extreme poverty. However, they have to pay the highest prices of water purchased from pipes (Roemer, 1993). However, this increase in price subsidies might be the wrong strategy to follow because it generates incentives for over-consumption and would probably represent an expensive burden to public finances. Similar to farmers using underground water, low-income groups might prefer increased cash subsidies to buy other goods while at the same time being able to cover their water needs by paying the “real” price of water. 5.4.1 Long Term Policy Options subcategory: Volumetric Allocation Potential for water conservation in the agricultural sector As we can see above one of the main problems of highly subsidized water prices is that subsidies give farmers the incentive to waste large amounts of water due to a lack of control of federal agencies (CNA). We examined that a possible way to reduce water waste from agricultural use, without reducing the farmer’s share of water or changing crop patterns is to allocate water portions volumetrically. This way every farmer or consumptive user gets a quantified measure of water and uses it efficiently, relying on the fact that they wont be able to acquire any more water then that designated or at least at a low cos t, unless they buy water rights from another stakeholder Political Feasibility Despite the fact that there may be political opposition to this policy option because of the enormous pressure of farmers who already have “stipulated” quantities of water, on the other hand there are new demands to give new concessions of water of an already overapportioned river. The only way of obtaining more water for agricultural purposes is to reduce waste water and make distribution more efficient. This could be a solut ion, although many farmers may
Global Internation Waters Assessment Sub-region 27: Gulf of California
76/91
oppose to volumetric allotments because it would signal that they are not using their entire allocation of water for “beneficial consumption”. The agricultural economic perspective relies that with a measured dotation of water, agricultures would begin to question if it is economically viable to continue growing high water consumptive crops instead of water efficient crops. 5.3 Identification of the recommended policy option This report addressed the following problem: too little water is being allocated towards ecosystem maintenance or restoration in the Colorado River Delta. In fact, neither the United States nor Mexico officially allocates any water to the Delta. As a result, it has suffered innumerable harms and affected the lives that depend on it for survival. Though it still supports diverse plant and animal life, including threatened and endangered species, its expanse has shrunk from approximately 7,770 km2 (3000 square miles) to only 60,000 ha (150,000 acres); and only five percent of its original wetlands still remain. Therefore, we propose the following options 1) and 2) as preliminary measures to assure minimal flows of freshwater into the Delta. Additionally, we also propose option 3) that attempts to increase the efficiencies of water use in Mexico through market mechanisms, thereby “freeing up” water potentially available for the Delta:
1. Lease water rights in the Mexicali and San Luis Rio Colorado Valleys and transfer associated water to Delta ecosystem. And granting subsidies to farmers in Mexico for implementing water conservation measures.
2. Buy or lease water rights in the United States and transfer associated water to Delta
ecosystem.
3. Convert electricity subsidies for Mexican farmers to cash subsidies. And eliminate price subsidies to municipal water users in Mexico.
Analyzing the future tendencies of water use in the Lower and Upper basin of the Colorado River the most viable way to obtain surplus water for ecological purposes is to change agricultural water use patterns without affecting present deliveries to water stakeholders and farmers in the Mexican part of the delta. This implies changes in the actual Mexican National Water Law, regarding to time and quantity deliveries of water for agricultural purposes. Although there are alternatives to water surplus deliveries like the Mexicali II Project, the implication of this alternative has negative impacts for the U.S. portion of the Colorado River delta. Each year Mexicali, discharges about 40,000 acre-feet (4.9 x10⁷ m3) of effluent into the International Boundary Drain, which empties in the New River. The New River originates 22 miles (35 km, south of the international boundary and flows north through Mexicali, crossing the border into California’s Imperial Valley. About 45 miles (70 km) to the north, it empties into California’s Salton Sea, a closed basin, where evaporation tends to concentrate its pollutants. To reduce pollutants diverted to the New River that empties in the Salton Sea, the U.S. and Mexico, agreed to build a binational wastewater treatment plant to be called Mexicali II. The projects objective is to treat more than 37 million gallons of water per day (1645 liters/sec) and serve a population of more than half a million people (IBWC, 1996). The Negative implication to the U.S. is a change in the plants design. If the plants treated water is discharged to the New River, this could possibly improve water quality conditions in the Salton Sea. But if the treated
Global Internation Waters Assessment Sub-region 27: Gulf of California
77/91
water were to be emptied in the Hardy River basin, a considerable amount of water would no longer reach the Salton Sea, creating more environmental problems than it already has. On the other hand disposal in the Rio Hardy wetlands would help maintain important ecosystems in the Colorado River delta. 6. Conclusions Under international law individual states are endowed with the right to control territorial resources. Consensus, however, is difficult to reach on what constitutes an equitable and reasonable utilization and when another state is adversely affected by such utilization. Although the two countries co-operate as good neighbors in developing the vital water resources of the shared river in which each has an equitable interest, there is the obligation to notify projects related to transboundary water, considering that any change in the water balance affects both sides of the border. The reduction of flow excedents would affect the delta ecosystem with or without an international treaty, and not by a reduction in flows of water already stipulated in the Mexican International Water Treaty. The long-term problem for the delta is the decline of water levels in the River. Changing the patterns of controlled flooding will not always solve this problem. In order to implement effective conservation programs Mexico needs more water flowing directly into the Delta, and economic and technical support from the United States. Realistically, however, the Lower Colorado River Basin states will probably not agree to allow more water to reach Mexico. Therefore the preservation of the Colorado River delta ecosystems will remain as a complex task. To keep sufficient water in the river requires the alignment of numerous institutions, agreements, and organizations. As a transboundary representative, the International Boundary and Water Commission (IBWC) still remains as the most eligible institution to achieve this goal in the long term, although the IBWC remains cautious in its jurisdiction over environmental problems relating to the Colorado River delta therefore the criticism of the way it operates and manages problems concerning to the environment. Mexico’s share of responsibility in the delta region has had an active and notorious decision making over the last years, like the challenge to establish the Reserva de la Biosfera Alto Golfo de California y Delta del Rio Colorado, demonstrating to the international community the importance of conserving this vital ecosystem for the federal government. Considering the transboundary implications of the Colorado River delta as a shared watershed, the responsibility relies on both sides of the border. To date, U.S. state and federal government agencies have resisted active cooperation with Mexico for the benefit of the River ecosystem and people in both countries. These agencies instead point to the absence of any formal agreement between the federal governments of the United States and Mexico regarding allocation of Colorado River water for delta conservation. There is extensive legal precedent for protection of the Delta region. There exists between Mexico and the United States a significant history of cooperation in the conservation of shared natural resources, including water, vegetation and wildlife. As evidenced by a substantial number of organizations, there exists broad international support for restoration and long-term protection of Mexico’s Colorado River Delta region.

Global Internation Waters Assessment Sub-region 27: Gulf of California
78/91
We believe that the restoration of the Colorado River Delta comes down to all water consumptive users in the Colorado River Basin. There must be a continuity of public participation in policy and management decisions and recommends coordination among the various involved organizations to ensure that efforts are not duplicated.
Global Internation Waters Assessment Sub-region 27: Gulf of California
79/91
REFERENCES All, John. (2002). International utilization of shared water resources: a case study of the Colorado River delta and the upper Gulf of California, Mexico. Department of Geography and Regional Development. The University of Arizona. Aragón-Noriega, E.A. and Calderón-Aguilera L.E. (2000). Does damming of the Colorado River affect the nursery area of blue shrimp Litopenaeus stylirostris (Decapoda: Penaeidea) in the Upper Gulf of California? Tropical Biology, 48(4): 867-871. Basich, G. Antonio.(1984). El Río Colorado y sus creceintes. Rev. Calafia 5 (2): 27-30. Blus, L.J. (1996). DDT, DDD and DDE in birds. In: Beyer, W.N., Heinz, G.H. & Redmon-Norwood, A.W. (Eds), Environmental Contaminants in Wildlife, Interpreting Tissue Concentrations, pp 49-71. Boca Raton, FL. CRC Lewis Publishers. 490 pp Brechner, R. (2000). Rocket Science: perchclorate and the toxic legacy of a Cold War. Journal of Occupational and Environmental Medicine . 42:777 Caire, William. (1978). The distribution and zoogeography of the mammals of Sonora. University of New Mexico. Albuquerque, New Mexico. Canseco-Gonalez, S., Castro-Diaz, J., Christián-Frías, A., Loredo-Medina, O.L., Prieto-Muñoz, E.C. & Ruiz-Ruiz, F. (1997). Programa de Gestion Ambiental de Sustancias Tóxicas de Atención Prioritaria. México, D.F.: Instituto Nacional de Ecología , 126 pp. Carothers, S.W. and B.T. Brown. (1991). The Colorado River through Grand Canyon. The University of Arizona Press, 235 p. Carrillo, Y. (2002). Wetland restoration in private and ejido land in the Colorado River delta, Mexico. Report prepared for the Sonoran Institute, Tucson, AZ. Carriquiry, J.D. and Sánchez, A. (1999). Sedimentation in the Colorado River delta and Upper Gulf of California.after nearly a century of discharge loss. Mar. Geol., 158: 125-145. Christopherson, Robert W. (2000). The Colorado River: a system out of balance. The Earth-Atmosphere Interface, Focus Study 15-1. Clark, J., Clinton, M., Cunningham, P., Getches, D.H., Lopezgamez, J.L., Hathaway, M., Morales, L.O., Bogada, B., Palafox, J., Valdes-Casillas, C. (2001). Immediate options for augmenting water flows to the Colorado River delta in Mexico. From URL site: www.sonoran.org Cohen, M.J., Henges-Jeck, C., and Castillo-Moreno, G. (2001). A preliminary water balance for the Colorado River delta, 1992-1998. Journal of Arid Environments, 49: 35-48 http://www.pacinst.org/missing_water_article_web.pdf Cohen, M.J., and Henges-Jeck, C. (2001). Missing Water: The uses and flows of water in the Colorado River delta region. Pacific Institute. http://www.pacinst.org/missing_water_report_web.pdf
Global Internation Waters Assessment Sub-region 27: Gulf of California
80/91
Collier, M., R.H. Webb, and J.C. Schmidt. (1996). Dams and rivers. Tucson, Az. USGS Circular 1126. Comisión de Recursos Hidráulicos/Comisión de Estudios Legislativos. (2003). Decreto que reforma, adiciona y deroga diversas disposiciones de la Ley de Aguas Nacionales. México, DF. Congreso de la Unión. Comisión Nacional del Agua (CNA). (1991). Efectos por el revestimiento del Canal Todo Americano sobre territorio mexicano. Comisión Nacional del Agua. Gerencia Estatal de Baja California, Subdirección General Técnica. Comisión Nacional del Agua (CNA). (2001). Programa Nacional Hidráulico 2000-2006. México DF, Presidencia de la República. Cortéz-Lara, Alfonso. (1999 May). Efectos socio-ambientales y productivos del revestimiento del All American Canal: percepción y participación de los usuarios del agua en el Valle de Mexicali. Paper presented at the Binacional Conference on Groundwater Management, La Paz, Baja California Sur, Mexico. CNA. (1999). Problemática del Río Colorado, documento central y anexos, Gerencia Regional Península de Baja California, Subgerencia Regional Técnica. CNA. (2000). Informe de Calidad del Agua de la Red Primaria de Aguas Superficiales en la Península de Baja California. Gerencia Regional Península de Baja California, Subgerencia Regional Técnica, Jefatura de Proyecto de Saneamiento y Calidad del Agua. CNA. (2000). Documentacion relativa al proyecto de revestimiento del canal Todo Americano, en California, Estados Unidos, y su impacto sobre territorio mexicano. Subdirección Regional Técnica Peninsula de Baja California, Gerencia de Aguas Subterráneas. Culp, P.W. (2001). Feasibility of purchase and transfer of water for the instream flow in the Colorado River Delta, Mexico. Tucson, AZ. Udall Center for Studies in Public Policy, University of Arizona. Díaz-Cabrera, Penélope. (2001). Simulación numérica del acuífero superior del Valle de Mexicali, Baja California, México. Tesis de Maestría. CICECE. División de Ciencias de la Tierra, Ensenada B.C., México. Driver, N.E. (1994). National Water-Quality Assessment Program - Upper Colorado River Basin Study. U.S. Geological Survey Open-File Report 94-102, 2 p. Eden , S. and Wallace, M.G. (1992). Arizona Water: information and issues. Water Resources Research Center. University of Arizona. Tucson, Arizona. El Caso del Agua Dulce en México. (2003). Segundo Taller Sub-Región XXVII Golfo de California, Hermosillo, Son., April 7-9 2003, mimeo. Environmental Protection Agency (EPA). (2003). Safe drinking water information system. http://www.epa.gov/enviro/html/sdwis/sdwis_ov.html.
Global Internation Waters Assessment Sub-region 27: Gulf of California
81/91
Flanagan, Christine A. and Hendrickson, John H. (1976) Observations on the commercial fishery and reproductive biology of the Totoaba, Cynoscion Macdonaldi, in the Northern Gulf of California. Fishery bulletin , 74(3): 531-544. Frawley, J.P., and Keeney. M. (1998). Production effects and policy implications of direct payments to farmers. Conference paper. García-Hernández, J. (1998). Bioaccumulation of Selenium in the Cienega de Santa Clara wetland, Sonora, Mexico. M.Sc Thesis dissertation. Department of Soil, Water and Environmental Sciences. University of Arizona. García-Hernández, J. (2001). Selenium, selected inorganic elements, and organochlorine pesticides in bottom material and biota from the Colorado River delta. Journal of Arid Environments, 49: 65-89. García-Hernández, J., O. Hinojosa-Huerta, V. Gerhart, Y. Carrillo-Guerrero y E.P. Glenn. (2001). Willow Flycatcher (Empidonax traillii) surveys in the Colorado River delta: implications for management. Journal of Arid Environments. 49: 161-169. Glenn, E.P., C. Lee, R. Felger and S. Zenegal. (1996). Effects of water management on the wetlands of the Colorado River delta, Mexico. Conservation Biology, 10: 1175-1186. Glenn P., Edward. (1998). Impacts of Water Flows from the United States on riparian, wetland and marine ecosystems. Defenders of Wildlife. http://www.swcenter.org/swcbd/Programs/watersheds/ lcr/glenn.pdf Glennon, R.J and Culp, P.W. (2002). The last green lagoon: how and why the Bush administration should save the Colorado River Delta. Ecology Law Quarterly, 28(4): 948-953. González-Casillas, Arturo. (1991). Contaminación salina del Río Colorado. Rev. Travesia 24: 12-21. Harding, B.L, T.B. Sangoyami, and E.A. Payton. (1995). Impacts of a severe drought in the southwestern United States. Report to the U.S. Department of State, Man and Biosphere Program. INEGI. (2000). Anuario estadístico por entidad federativa. México. International Boundary and Water Commission (IBWC). (1944). Treaty between the United States of America and Mexico relating to the utilization of the Waters of the Colorado and Tijuana Rivers and of the Rio Grande. Department of State, United States of America. International Boundary and Water Commission (IBWC). (1973). Minute 242: Permanent and definitive solution to the international problem of the salinity of the Colorado River. Department of State, United States of America. International Boundary and Water Commission (IBWC). (1996). Fact sheet on the Mexicali Sanitation Project, November 7, 1996. International Boundary and Waters Commission (2000). Minute No.306: Conceptual framework for United States-Mexico, studies for future recommendations concerning the riparian and
Global Internation Waters Assessment Sub-region 27: Gulf of California
82/91
estuarine ecology of the limitrophe section of the Colorado River and its associated Delta. Department of State, United States of America. Jaramillo, A., L. Rojas and T. Gerrodette. (1999). A new abundance for vaquitas: First step for recovery. Marine Mammal Science 15(4): 957-973. Kriz, M. (2003). The new water war: US vs. California. California Journal, April 2003, p. 5. Lueck, D., Pitt, J., Congdon, C., Glen, E.P., Valdés-Casillas, C., Briggs, M. (1999). A delta once more: restoring riparian and wetland habitat in the Colorado river delta. Environmental Defense Fund. MacDonnell, Larry, and Bruce Driver. (1996). Institutional options. In proceedings from the Colorado River workshop, Phoenix, Arizona. Mathews, C.P. (1974) Cuánto resistirá el camarón? Cienc. Mar. 1: 86-91 Mellink, Erick. (1995). Status of the muskrat in the Valle de Mexicali and the delta del Río Colorado, México. Calif. Fish and Game. 8(1): 33-38. Mellink, Erick. (1996). Mamíferos no marinos de la Península de Baja California; versión electrónica. Departamento de Ecología. CICESE, Ensenada, B.C. http://www.cicese.mx/~emellink/guia -mam.htm Mellink, E., E. Palacios and S. González. (1997). Non-breeding waterbirds of the delta of the Colorado River, Mexico. Journal of Field Ornithology, 68(1): 113-123. Mellink, E. and Luévano Jaime. (1998). Status of beavers (Castor canadensis) in Valle de Mexicali, México. Bull. Saouthern California Acad. Sci. 97(3): 115-120. Metropolitan Water District of Southern California (MWD). (2002). Member agency profiles. http://www.mwd.dst.ca.us/mwdh2o/pages/memberag/member02.html Morrison, Jason I., Postel Sandra L., Gleick, Peter H. (1996). The sustainable use of water in the Lower Colorado Basin. Pacific Institute. MWD/USBR. (1998). Salinity Management Study, final report and technical appendices, prepared by Bookman-Edmonston Engineering, Inc. http://www.awra.org/state/socal/salinity_mgmt/TechnicalAppendices1.pdf Organization for Economic Co-operation and Development (OECD). (2000). Decoupling: a conceptual overview, Directorate for Food, Agriculture and Fisheries. Trade Directorate. Osvel Hinojosa-Huerta, Pamela L. Nagler, Yamilett Carrillo-Guerrero, Enrique Zamora-Hernández, Jaqueline García -Hernández, Francisco Zamora-Arroyo, Kara Gillon, & Edward P. Glenn. (2003). Andrade Mesa Wetlands of the All-American Canal. Natural Resources Journal, 42(4): Oyarzabal, F. (2003). Comisión Internacional de Limites y Aguas, Mexicali. Personal Communication, May.
Global Internation Waters Assessment Sub-region 27: Gulf of California
83/91
Pitt, J. (2001). Can we restore the Colorado River delta. Journal of Arid Environments, 49(1): 211-220. Pitt, J., Fitzer, C.W and Force, L. (2002). New Water for the Colorado River: Economic and Environmental Considerations for Replacing the Bypass Flow. Denver, Co. University of Colorado. Pitt, J. (2003). Environmental Defense Fund, Boulder Co. Personal communication, May. Presser, T.S., Sylvester, M.A., and Low, W.H. (1994). Bioaccumulation of selenium from natural geologic sources in western states and it’s potential consequences. Environ. Manage., 183: 423-436. Renteria, Carlos de la Parra, and Daniel F. Lueck. (1997). Ecoparque: an innovative low-tech approach for water use and resource enhancement in the Tijuana River Valley. Environmental Defense Fund. Roemer, A. (1993). Derecho y economía: Políticas públicas del agua. Mexico DF, CIDE-Miguel Angel Porrúa. Román-Rodríguez, M., R. Castro-Longoria and J.R. Campoy F. (2003). Observations on the biology and fishery of the Gulf Curvina (Cynoscion othonopterus) in the northern Gulf of California. Unpublished. Scorupa, J.P., Morman, S.P & Sefchick-Edwards, J.S. (1996). Guidelines for interpreting selenium exposures of biota associated with nonmarine acuatic habitats. U.S. Fish and Wildlife Service, prepared for: The National Irrigation Water Quality Program. Sacramento, CA. 74 pp. SCT-CGPMM. (1996). Los puertos mexicanos en cifras. 1990-1996. México, Secretaría de Comunicaciones y Transportes. Coordinación General de Puertos y Marina Mercante. Setmire, J.G., Shroeder, R.A., Densmore, J.N., Goodbred, J.L., Audet, D.J., and Radke, W.R. (1993) Detailed study of water quality, bottom sediments, and biota associated with ir rigation drainage in the Salton Sea area, California, 1988-90: U.S. Geological Survey Water Resources Investigations Report 93-4014, 102 pp. Solley, W.B., Pierce, R.R., Perlman, H.A. (U.S. Geological Survey). (1998). Estimated use of water in the United States in 1995. Denver, Colo.: U.S. Geological Survey. Report No. 060790075X (alk. Paper). Ix, 71 p. U.S. Bureau of Reclamation. (1994). Lower Colorado River national wildlife refugees comprehensive management plan and environmental assesment. U.S. Bureau of Reclamation. (1995). Quality of water Colorado River Basin, Progress Report No. 17. Report for the Department of the Interior. U.S. Bureau of Reclamation. (1996). Description and assessment of operations, maintenance, and sensitive species of the lower Colorado River. U.S. Bureau of Reclamation, Boulder, Nevada. U.S. Bureau of Reclamation. (2000). Biological Assesment. U.S. Bureau of Reclamation, Boulder, Nevada. http://www.lc.usbr.gov/g2000/assess/toc.htm
Global Internation Waters Assessment Sub-region 27: Gulf of California
84/91
U.S. Bureau of Reclamation. (2003). Colorado River Basin Progress Report 21. Colorado River Basin Salinity Control Program. http://www.uc.usbr.gov/progact/salinity/ U.S. Census Bureau. (2000). From URL site: http://www.census.gov U.S. Department of Commerce. (1978). Workshop to evaluate the ecological status of Totoaba, Cynoscion macdonldi. National Marine Fisheries Service – South-west Fisheries Center, La Jolla, California U.S. Geological Survey. (1996). Daily mean discharge data, station name: Colorado River at Lees Ferry, Az. From URL site: h20.usgs.gov. U.S. Geological Survey. (1996). Foreword. From URL site http://webserver.cr.usgs.gov/nawqa/ucol/ucol_home.html. USGS. (2002). Sediment Studies in Lake Mead. Coastal and Marine Geology Program. http://woodshole.er.usgs.gov/project-pages/LakeMead/mapping.htm U.S. Geological Survey. (2000). National Water-Quality Assessment Program - Upper Colorado River Basin Study Unit. From URL site: h20.usgs.gov. Valdés-Casillas, C., Hinojosa-Huerta , O., Munoz-Viveros, M., Zamora-Arroyo, F.,Carrillo-Guerrero, Y., Delgado-Garcia, S. Lopez-Camacho, M., Glen, E.P., Garcia, J. Riley, J., Baumgartner, D., Briggs, M., Lee, C.T., Chavarria -Correa, E., Congdon, C., and Lueck, D. (1998). Manejo y restauración de humedales en el delta del Río Colorado: los primeros pasos. North American Wetlands Conservation Council. Varady, R. G., and M. D. Mack. (1995). Transboundary Water Resources and Public Health in the U.S.-Mexico Border Region. Journal of Environmental Health. Vol. 57, (8):8-4. Yardley, J. (2002). Water Rights War Rages on Faltering Rio Grande. New York Times, Late Edition (East Coast), April 19, 2002, p. A.16. Zamora, F., Nagler, P. L., Briggs, M., Garcia, J., Glenn, E. P., Huete, A., Radtke, D., Rodriquez, H., Valdes, C. (2001). Regeneration of native trees in response to flood releases from the United States into the delta of the Colorado River, Mexico. Journal of Arid Environments, 49(1): 49-64. Zamora, F. (2003). The Sonoran Institute. Personal communication, April.
Global Internation Waters Assessment Sub-region 27: Gulf of California
85/91
ANNEXES
Annex I Background information about GIWA Background The Global International Water Assessment (GIWA) program was developed to undertake assessments of environmental conditions affecting international water bodies throughout the world. Geographical scope of the Sub-region 27 aquatic system encompasses the entire Colorado River Basin and the Upper Gulf of California. The Sub-region (Colorado River delta region) chosen for the second stage (Causal Chain Analysis and Policy Options) was chosen due to the Socio-economic, and environmental influence over the Colorado system. In terms of political boundary, two countries enclose the System, 7 states of the U.S. and 2 of Mexico. To asses these concerns and give substantial background for the entire methodology the Sub-region 27 core team conducted two workshops dividing the GIWA methodology into two phases. The first workshop covered the Scaling and Scoping phase held through August 21-23, 2002 in Hermosillo, Son, Mexico. The purpose of the scoping methodology is to identify priority GIWA Issues for remedial action and intervention. During the first workshop 17 experts attended the meeting, 11 from Mexico and 6 by the U.S. plus supporting personnel, the expert’s background was chosen on the different issues proposed by GIWA (modification of stream flow, suspended solids, habitat and community modification, overexploitation of fisheries and global change). The second meeting of the GIWA Sub-region 27 was held, during the period of April 7 - 9, 2003 in the Hotel Araiza Inn, in Hermosillo, Son, Mexico. During this workshop we worked on the second phase of the GIWA Methodology, which implicates the Causal Chain Analysis and Policy Options review. The workshop was based on problems concerning transboundary issues in international waters and how to apply the results from scientific assessments to manage water resources . Previous work was held during this stage, regarding to the detailed impact assessment of the selected GIWA Issues, Issue 1 Freshwater Shortage. After identifying the appropriate indicators, the team revised them and carefully developed them for the final report. During Phase 2 we worked with experts on different backgrounds mainly on policy management and water administration (Berkeley Team of Public Policy and the Instituto Nacional de Ecologia ). During this meeting 15 experts attended the workshop (10 from Mexico and 5 from the U.S. plus supporting personnel) Information compilation Compilation of public data, both in digital and printed format, was gathered previous to the meeting and systematized to its better use in the workshop. GIS databases were compiled but not complete effort was made to stitch the Mexican and USA delimitations of units, excet for climatic regions and watersheds. All the information was handled in Lat/Long projection in ESRI Shapefiles and GRID files. ArcView GIS 3.2 was used in the process, with support of ESRI's Spatial Analyst 2.0, Image Analisys 1.0 and ArcPress 2.0.
Global Internation Waters Assessment Sub-region 27: Gulf of California
86/91
Experts information Experts Curriculum Vitae information was gathered and compiled in a database for its management (Microsoft Access 2002).
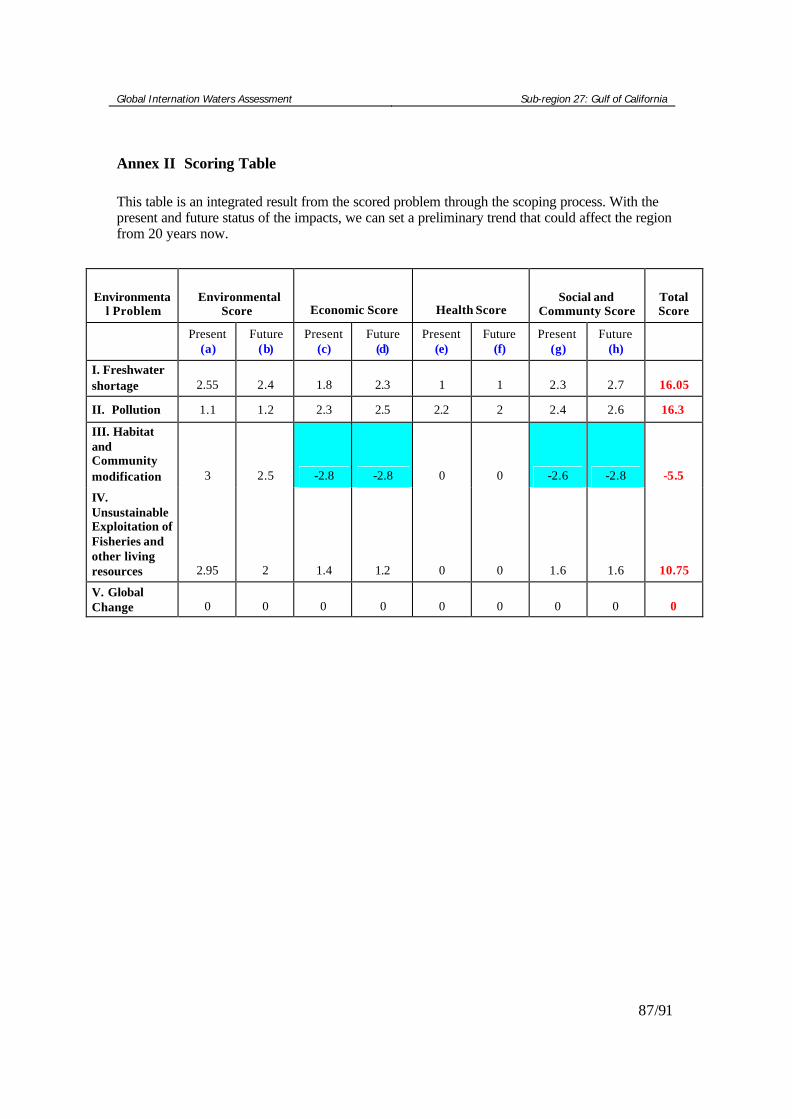
Global Internation Waters Assessment Sub-region 27: Gulf of California
87/91
Annex II Scoring Table This table is an integrated result from the scored problem through the scoping process. With the present and future status of the impacts, we can set a preliminary trend that could affect the region from 20 years now.
Environmental Problem
Environmental Score Economic Score Health Score
Social and Communty Score
Total Score
Present
(a) Future
(b) Present
(c) Future
(d) Present
(e) Future
(f) Present
(g) Future
(h)
I. Freshwater shortage 2.55 2.4 1.8 2.3 1 1 2.3 2.7 16.05
II. Pollution 1.1 1.2 2.3 2.5 2.2 2 2.4 2.6 16.3
III. Habitat and Community modification 3 2.5 -2.8 -2.8 0 0 -2.6 -2.8 -5.5
IV. Unsustainable Exploitation of Fisheries and other living resources 2.95 2 1.4 1.2 0 0 1.6 1.6 10.75
V. Global Change 0 0 0 0 0 0 0 0 0
Global Internation Waters Assessment Sub-region 27: Gulf of California
88/91
Annex III List of important-water related programs and assessments in the Sub-region. Binational Programs
• 1889 International Boundary and Water Commission • 1944 Water Utilization Treaty • 1983 The United States-Mexico Border Environmental Cooperation Agreement (The la
Paz Agreement) • 1994 The Border Environment Cooperation Commission (BECC) • 1994 North American Development Bank (NADbank)
United States Programs
• The Federal Clean Water Act • The National Environmental Policy Act (NEPA) • The Safe Drinking Water Act • The Federal Endangered Species Act • The Fish And Wildlife Coordination Act • The Wild and Scenic Rivers Act • The Pacific Northwest Power Planning and Conservation Act
Institutional Framework
• Environmental Protection Agency (EPA) • Council of Environmental Quality (CEQ) • Department of Agriculture (USDA) • Department of Energy (DOE) • Department of the Interior (DOI) • US Coast Guard
Interstate Compact Commissions
• Colorado River Commission • Native American Government
Mexico Programs
• National Water Act Institutional Framework
• Secretaria del Medio Ambiente y Recursos Naturales (SEMARNAT) • Comisión Nacional del Agua (CNA)

Global Internation Waters Assessment Sub-region 27: Gulf of California
89/91
Annex IV List of Conventions and specific laws that affect water use in the sub-region.
Major Components of the Law of the River
• The River and Harbor Act, March 3, 1889.
• The Reclamation Act of June 17, 1902.
• Reclamation of Indian Lands in Yuma, Colorado River, and Pyramid Lake Indian Reservations Act of April 21, 1904.
• Yuma Project authorized by the Secretary of the Interior on May 10, 1904, pursuant to section 4 of
the reclamation Act of June 17, 1902.
• Protection of Property Along the Colorado River Act of June 25, 1910.
• Warren Act of February 21, 1910.
• Patents and Water-Right Certificates Acts of August 9, 1912 and August 26, 1912.
• Yuma Auxiliary Project Act of January 25, 1917.
• Availability of Money for Yuma Auxiliary Project Act of February 11.
• Sale of Water for Miscellaneous Purposes Act of February 25, 1920.
• Federal Power Act of June 10, 1920.
• The Colorado River Compact of Santa Fe, 1922.
• The Colorado River Front Work and Levee System Acts of March 3, 1925; June 21, 1927.
• The Boulder Canyon Project Act of December 21, 1928.
• The California Limitation Act of March 4, 1929.
• The California Seven Party Agreement of August 18, 1931.
• The Rivers and Harbors Act of August 30, 1935.
• The Parker Dam Power Project Appropriation Act of May 2, 1939.
• The Reclamation Project Act of August 4, 1939.
• The Boulder Canyon Project Adjustment Act of July 19, 1940.
• The Mexican Water Treaty, February 3, 1944.
• Gila Project Act of July 30, 1947.
• The Upper Colorado River Basin Compact of October 11, 1948.
• Consolidate Parker Dam Power Project and Davis Dam Project Act of May 28, 1954.
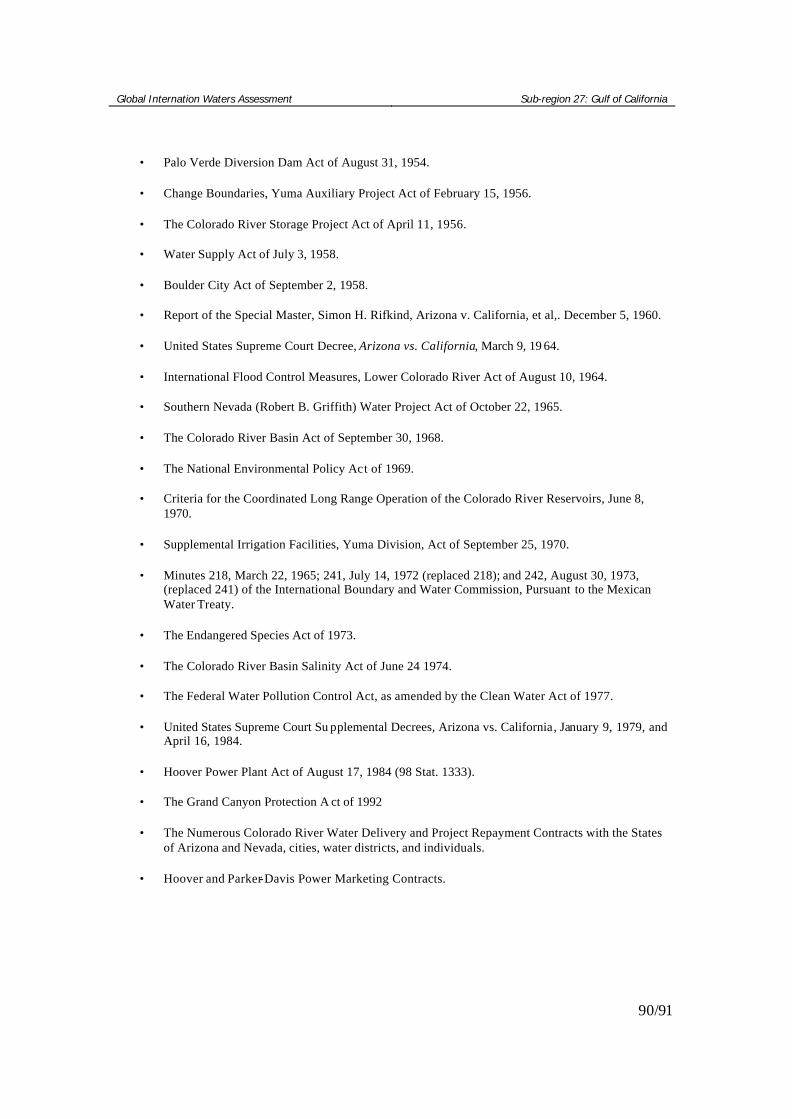
Global Internation Waters Assessment Sub-region 27: Gulf of California
90/91
• Palo Verde Diversion Dam Act of August 31, 1954.
• Change Boundaries, Yuma Auxiliary Project Act of February 15, 1956.
• The Colorado River Storage Project Act of April 11, 1956.
• Water Supply Act of July 3, 1958.
• Boulder City Act of September 2, 1958.
• Report of the Special Master, Simon H. Rifkind, Arizona v. California, et al,. December 5, 1960.
• United States Supreme Court Decree, Arizona vs. California, March 9, 19 64.
• International Flood Control Measures, Lower Colorado River Act of August 10, 1964.
• Southern Nevada (Robert B. Griffith) Water Project Act of October 22, 1965.
• The Colorado River Basin Act of September 30, 1968.
• The National Environmental Policy Act of 1969.
• Criteria for the Coordinated Long Range Operation of the Colorado River Reservoirs, June 8,
1970.
• Supplemental Irrigation Facilities, Yuma Division, Act of September 25, 1970.
• Minutes 218, March 22, 1965; 241, July 14, 1972 (replaced 218); and 242, August 30, 1973, (replaced 241) of the International Boundary and Water Commission, Pursuant to the Mexican Water Treaty.
• The Endangered Species Act of 1973.
• The Colorado River Basin Salinity Act of June 24 1974.
• The Federal Water Pollution Control Act, as amended by the Clean Water Act of 1977.
• United States Supreme Court Su pplemental Decrees, Arizona vs. California, January 9, 1979, and
April 16, 1984.
• Hoover Power Plant Act of August 17, 1984 (98 Stat. 1333).
• The Grand Canyon Protection A ct of 1992
• The Numerous Colorado River Water Delivery and Project Repayment Contracts with the States of Arizona and Nevada, cities, water districts, and individuals.
• Hoover and Parker-Davis Power Marketing Contracts.
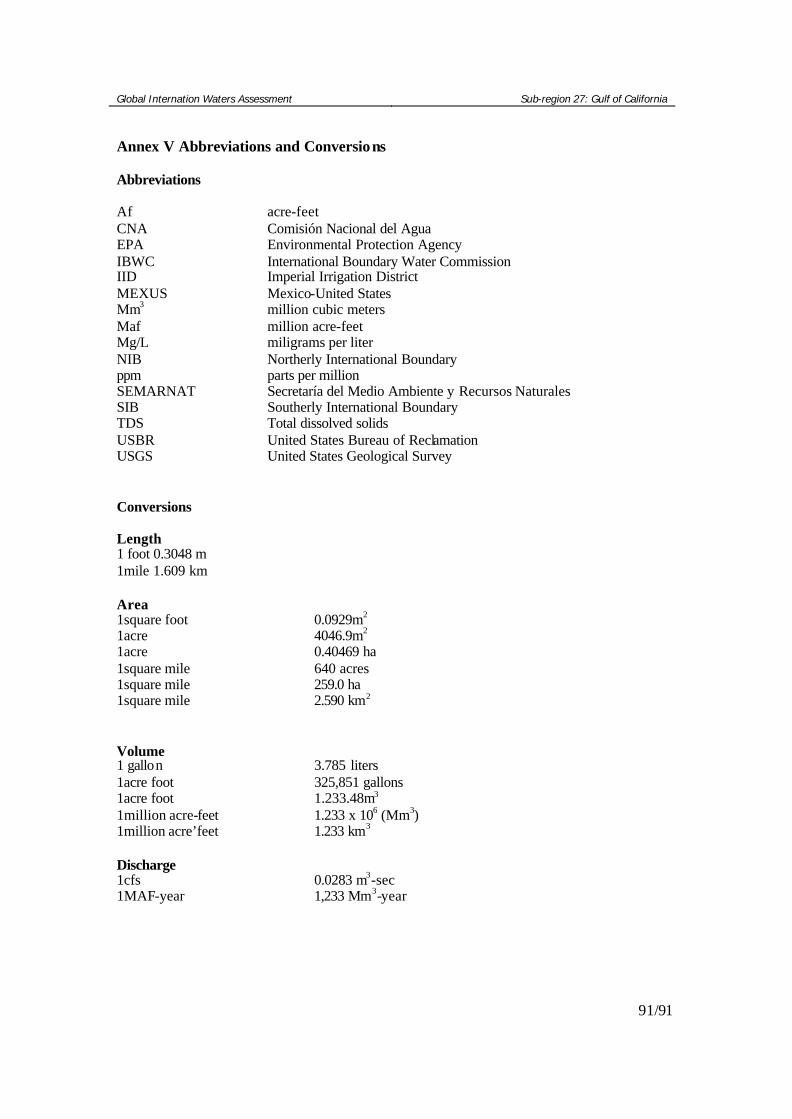
Global Internation Waters Assessment Sub-region 27: Gulf of California
91/91
Annex V Abbreviations and Conversions Abbreviations Af acre-feet CNA Comisión Nacional del Agua EPA Environmental Protection Agency IBWC International Boundary Water Commission IID Imperial Irrigation District MEXUS Mexico-United States Mm3 million cubic meters Maf million acre-feet Mg/L miligrams per liter NIB Northerly International Boundary ppm parts per million SEMARNAT Secretaría del Medio Ambiente y Recursos Naturales SIB Southerly International Boundary TDS Total dissolved solids USBR United States Bureau of Reclamation USGS United States Geological Survey Conversions Length 1 foot 0.3048 m 1mile 1.609 km Area 1square foot 0.0929m2 1acre 4046.9m2 1acre 0.40469 ha 1square mile 640 acres 1square mile 259.0 ha 1square mile 2.590 km2 Volume 1 gallon 3.785 liters 1acre foot 325,851 gallons 1acre foot 1.233.48m3 1million acre-feet 1.233 x 10⁶ (Mm3) 1million acre’feet 1.233 km3 Discharge 1cfs 0.0283 m3-sec 1MAF-year 1,233 Mm3-year