reporting to improve reproducibility and facilitate ... · pdf filereporting to improve...
TRANSCRIPT

Avai lable onl ine at www.sc iencedirect .com
journal homepage: www.elsevier .com/ locate / jva l
Original Report
Reporting to Improve Reproducibility and Facilitate ValidityAssessment for Healthcare Database Studies V1.0Shirley V. Wang1,2,*, Sebastian Schneeweiss1,2, Marc L. Berger3, Jeffrey Brown4, Frank de Vries5,Ian Douglas6, Joshua J. Gagne1,2, Rosa Gini7, Olaf Klungel8, C. Daniel Mullins9, Michael D. Nguyen10,Jeremy A. Rassen11, Liam Smeeth6, Miriam Sturkenboom12, on behalf of the joint ISPE‐ISPOR Special TaskForce on Real World Evidence in Health Care Decision Making1Division of Pharmacoepidemiology and Pharmacoeconomics, Brigham and Women’s Hospital, MA, USA; 2Department of Medicine,Harvard Medical School, MA, USA; 3Pfizer, NY, USA; 4Department of Population Medicine, Harvard Medical School, MA, USA;5Department of Clinical Pharmacy, Maastricht UMCþ, The Netherlands; 6London School of Hygiene and Tropical Medicine, England,UK; 7Agenzia regionale di sanità della Toscana, Florence, Italy; 8Division of Pharmacoepidemiology & Clinical Pharmacology, UtrechtUniversity, Utrecht, Netherlands; 9Pharmaceutical Health Services Research Department, University of Maryland School of Pharmacy,MA, USA; 10FDA Center for Drug Evaluation and Research, USA; 11Aetion, Inc., NY, USA; 12Erasmus University Medical CenterRotterdam, Netherlands
A B S T R A C T
Purpose: Defining a study population and creating an analytic datasetfrom longitudinal healthcare databases involves many decisions. Ourobjective was to catalogue scientific decisions underpinning studyexecution that should be reported to facilitate replication and enableassessment of validity of studies conducted in large healthcare data-bases. Methods: We reviewed key investigator decisions required tooperate a sample of macros and software tools designed to create andanalyze analytic cohorts from longitudinal streams of healthcare data.A panel of academic, regulatory, and industry experts in healthcaredatabase analytics discussed and added to this list. Conclusion: Evi-dence generated from large healthcare encounter and reimbursementdatabases is increasingly being sought by decision‐makers. Variedterminology is used around the world for the same concepts. Agreeingon terminology and which parameters from a large catalogue arethe most essential to report for replicable research would improve
transparency and facilitate assessment of validity. At a minimum,reporting for a database study should provide clarity regarding opera-tional definitions for key temporal anchors and their relation to eachother when creating the analytic dataset, accompanied by an attritiontable and a design diagram.
A substantial improvement in reproducibility, rigor and confidencein real world evidence generated from healthcare databases could beachieved with greater transparency about operational study parame-ters used to create analytic datasets from longitudinal healthcaredatabases.Keywords: Transparency, reproducibility, replication, healthcaredatabases, pharmacoepidemiology, methods, longitudinal data.
& 2017 Published by Elsevier Inc. on behalf of International Society forPharmacoeconomics and Outcomes Research (ISPOR).
1098-3015$36.00 – see front matter & 2017 Published by Elsevier Inc. on behalf of International Society for Pharmacoeconomics and
Outcomes Research (ISPOR).
http://dx.doi.org/10.1016/j.jval.2017.08.3018
Contributors to the joint ISPE‐ISPOR Special Task Force on Real World Evidence in Health Care Decision Making paper co‐led byShirley V. Wang and Sebastian Schneeweiss. The writing group contributors are the following: Marc L. Berger, Jeffrey Brown, Frank deVries, Ian Douglas, Joshua J. Gagne, Rosa Gini, Olaf Klungel, C. Daniel Mullins, Michael D. Nguyen, Jeremy A. Rassen, Liam Smeeth andMiriam Sturkenboom. The contributors who participated in small group discussion and/or provided substantial feedback prior to ISPE/ISPOR membership review are the following: Andrew Bate, Alison Bourke, Suzanne Cadarette, Tobias Gerhard, Robert Glynn, KristaHuybrechts, Kiyoshi Kubota, Amr Makady, Fredrik Nyberg, Mary E Ritchey, Ken Rothman and Sengwee Toh. Additional information islisted in Appendix.
This article is a joint publication by Pharmacoepidemiology and Drug Safety and Value in Health.* Address correspondence to: S. V. Wang, Division of Pharmacoepidemiology and Pharmacoeconomics, Brigham and Women’s Hospital
and Harvard Medical School, United States.E-mail: [email protected]
V A L U E I N H E A L T H 2 0 ( 2 0 1 7 ) 1 0 0 9 – 1 0 2 2

Introduction
Modern healthcare encounter and reimbursement systems pro-duce an abundance of electronically recorded, patient‐level lon-gitudinal data. These data streams contain information onphysician visits, hospitalizations, diagnoses made and recorded,procedures performed and billed, medications prescribed andfilled, lab tests performed or results recorded, as well as manyother date‐stamped items. Such temporally ordered data are usedto study the effectiveness and safety of medical products, health-care policies, and medical interventions and have become a keytool for improving the quality and affordability of healthcare [1,2].The importance and influence of such “real world” evidence isdemonstrated by commitment of governments around the worldto develop infrastructure and technology to increase the capac-ity for use of these data in comparative effectiveness and safetyresearch as well as health technology assessments [3–12].
Research conducted using healthcare databases currently suffersfrom a lack of transparency in reporting of study details [13–16]. Thishas led to high profile controversies over apparent discrepancies inresults and reduced confidence in evidence generated from health-care databases. However, subtle differences in scientific decisionsregarding specific study parameters can have significant impacts onresults and interpretation—as was discovered in the controversiesover 3rd generation oral contraceptives and risk of venous throm-boembolism or statins and the risk of hip fracture [17,18]. Clarityregarding key operational decisions would have facilitated replica-tion, assessment of validity and earlier understanding of the reasonsthat studies reported different findings.
The intertwined issues of transparency, reproducibility andvalidity cut across scientific disciplines. There has been anincreasing movement towards “open science”, an umbrella termthat covers study registration, data sharing, public protocols andmore detailed, transparent reporting [19–28]. To address theseissues in the field of healthcare database research, a Joint TaskForce between the International Society for Pharmacoepidemiol-ogy (ISPE) and the International Society for Pharmacoeconomicsand Outcomes Research (ISPOR) was convened to address trans-parency in process for database studies (e.g. “what did you plan todo?”) and transparency in study execution (e.g. “what did youactually do?). This paper led by ISPE focuses on the latter topic,reporting of the specific steps taken during study implementationto improve reproducibility and assessment of validity.
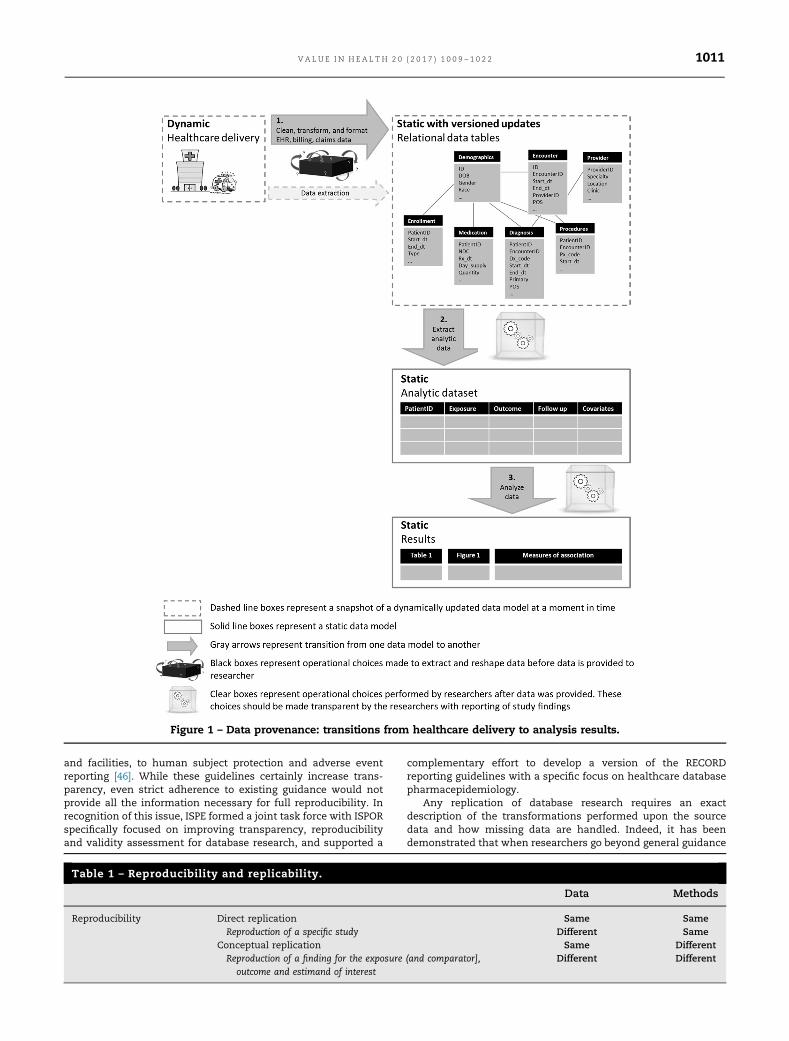
Transparency and reproducibility in large healthcare databases isdependent on clarity regarding 1) cleaning and other pre‐processingof raw source data tables, 2) operational decisions to create ananalytic dataset and 3) analytic choices (Figure 1). This paper focuseson reporting of design and implementation decisions to define andcreate a temporally anchored study population from raw longitudinalsource data (Figure 1 Step 2). A temporally anchored study populationis identified by a sentinel event—an initial temporal anchor. Charac-teristics of patients, exposures and/or outcomes are evaluated duringtime periods defined in relation to the sentinel event.
However understanding how source data tables are cut, cleanedand pre‐processed prior to implementation of a research study(Figure 1 Step 1), how information is extracted from unstructureddata (e.g. natural language processing of free text from clinicalnotes), and how the created dataset is analyzed (Figure 1 Step 3) arealso important parts of reproducible research. These topics havebeen covered elsewhere [14,29–36], however we summarize keypoints for those data provenance steps in the online appendix.
Transparency
Transparency in what researchers initially intended to do pro-tects against data dredging and cherry picking of results. It can be
achieved with pre‐registration and public posting of protocolsbefore initiation of analysis. This is addressed in detail in acompanion paper led by ISPOR [37]. Because the initially plannedresearch and the design and methodology underlying reportedresults may differ, it is also important to have transparencyregarding what researchers actually did to obtain the reportedresults from a healthcare database study. This can be achievedwith clear reporting on the detailed operational decisions madeby investigators during implementation. These decisions includehow to define a study population (whom to study), and how todesign and conduct an analysis (what to measure, when and howto measure it).
Reproducibility and replicability
Reproducibility is a characteristic of a study or a finding. Areproducible study is one for which independent investigatorsimplementing the same methods in the same data are able toobtain the same results (direct replication [38]). In contrast, areproducible finding is a higher order target than a reproduciblestudy, which can be tested by conducting multiple studies thatevaluate the same question and estimand (target of inference) but usedifferent data and/or apply different methodology or operationaldecisions (conceptual replication [38]) (Table 1).
Direct replicability is a necessary, but not sufficient, compo-nent of high quality research. In other words, a fully transparentand directly replicable research study is not necessarily rigorousnor does it necessarily produce valid findings. However, thetransparency that makes direct replication possible means thatvalidity of design and operational decisions can be evaluated,questioned and improved. Higher order issues such as conceptualreplication of the finding can and should be evaluated as well,however, without transparency in study implementation, it canbe difficult to ascertain whether superficially similar studiesaddress the same conceptual question.
For healthcare database research, direct replication of a studymeans that if independent investigators applied the same designoperational choices to the same longitudinal source data, theyshould be able to obtain the same results (or at least a near exactreproduction). In contrast, conceptual replication and robustness ofa finding can be assessed by applying the same methods to differentsource data (or different years from the same source). Here, lack ofreplicability would not necessarily mean that one result is more“correct” than another, or refutes the results of the original. Instead,it would highlight a need for deeper inquiry to find the drivers ofthe differences, including differences in data definitions andquality, temporal changes or true differences in treatment effectfor different populations. Conceptual replications can be furtherevaluated through application of different plausible methodologicand operational decisions to the same or different source data toevaluate how much the finding is influenced by the specificparameter combinations originally selected. This would encom-pass evaluation of how much reported findings vary with plausi-ble alternative parameter choices, implementation in comparabledata sources or after flawed design or operational decision iscorrected. However, the scientific community cannot evaluate thevalidity and rigor of research methods if implementation decisionsnecessary for replication are not transparently reporte.
The importance of achieving consistently reproducibleresearch is recognized in many reporting guidelines (e.g. STROBE[34], RECORD [39], PCORI Methodology Report [40], EnCePP [33])and is one impetus for developing infrastructure and tools toscale up capacity for generating evidence from large healthcaredatabase research [3,41–45]. Other guidelines, such as the ISPEGuidelines for Good Pharmacoepidemiology Practice (GPP)broadly cover many aspects of pharmacoepidemiology fromprotocol development, to responsibilities of research personnel
V A L U E I N H E A L T H 2 0 ( 2 0 1 7 ) 1 0 0 9 – 1 0 2 21010
and facilities, to human subject protection and adverse eventreporting [46]. While these guidelines certainly increase trans-parency, even strict adherence to existing guidance would notprovide all the information necessary for full reproducibility. Inrecognition of this issue, ISPE formed a joint task force with ISPORspecifically focused on improving transparency, reproducibilityand validity assessment for database research, and supported a
complementary effort to develop a version of the RECORDreporting guidelines with a specific focus on healthcare databasepharmacepidemiology.
Any replication of database research requires an exactdescription of the transformations performed upon the sourcedata and how missing data are handled. Indeed, it has beendemonstrated that when researchers go beyond general guidance
Table 1 – Reproducibility and replicability.
Data Methods
Reproducibility Direct replication Same SameReproduction of a specific study Different Same
Conceptual replication Same DifferentReproduction of a finding for the exposure (and comparator],
outcome and estimand of interestDifferent Different
Figure 1 – Data provenance: transitions from healthcare delivery to analysis results.
V A L U E I N H E A L T H 2 0 ( 2 0 1 7 ) 1 0 0 9 – 1 0 2 2 1011

and provide a clear report of the temporal anchors, codingalgorithms, and other decisions made to create and analyze theirstudy population(s), independent investigators following thesame technical/statistical protocol and using the same datasource are able to closely replicate the study population andresults [47].
The current status of transparency and reproducibility ofhealthcare database studies
Many research fields that rely on primary data collection haveemphasized creation of repositories for sharing study data andanalytic code [48,49]. In contrast to fields that rely on primarydata collection, numerous healthcare database researchers rou-tinely make secondary use of the same large healthcare datasources. However the legal framework that enables healthcaredatabase researchers to license or otherwise access raw data forresearch often prevents public sharing both of raw source dataitself as well as created analytic datasets due to patient privacyand data security concerns. Access to data and code guaranteesthe ability to directly replicate a study. However, the currentsystem for multi‐user access to the same large healthcare datasources often prevents public sharing of that data. Furthermore,database studies require thousands of lines of code to create andanalyze a temporally anchored study population from a largehealthcare database. This is several orders of magnitude largerthan the code required for analysis of a randomized trial or otherdataset based on primary collection. Transparency requires clearreporting of the decisions and parameters used in study execu-tion. While we encourage sharing data and code, we recognizethat for many reasons, including data use agreements andintellectual property, this is often not possible. We emphasizethat simply sharing code without extensive annotation to iden-tify where key operational and design parameters are definedwould obfuscate important scientific decisions. Clear naturallanguage description of key operational and design details shouldbe the basis for sharing the scientific thought process with themajority of informed consumers of evidence.
Recent efforts to improve transparency and reproducibility ofhealthcare database studies
To generate transparent and reproducible evidence that caninform decision‐making at a larger scale, many organizationshave developed infrastructure to more efficiently utilize largehealthcare data sources [9,50–56]. Recently developed compre-hensive software tools from such organizations use differentcoding languages and platforms to facilitate identification ofstudy populations, creation of temporally anchored analyticdatasets, and analysis from raw longitudinal healthcare datastreams. They have in common the flexibility for investigators toturn “gears and levers” at key operational touchpoints to createanalytically usable, customized study populations from raw lon-gitudinal source data tables. However, the specific parametersthat must be user specified, the flexibility of the options and theunderlying programming code differ. Many but not all, reusablesoftware tools go through extensive quality checking and vali-dation processes to provide assurance of the fidelity of the codeto intended action. Transparency in quality assurance andvalidation processes for software tools is critically important toprevent exactly replicable findings that lack fidelity to intendeddesign and operational parameters.
Even with tools available to facilitate creation and analysis ofa temporally anchored study population from longitudinalhealthcare databases, investigators must still take responsibilityfor publically reporting the details of their design and operational
decisions. Due to the level of detail, these can be made availableas online appendices or web links for publications and reports.
Objective
The objective of this paper was to catalogue scientific decisionsmade when executing a database study that are relevant forfacilitating replication and assessment of validity.
We emphasize that a fully transparent study does not implythat reported parameter choices were scientifically valid; rather,the validity of a research study cannot be evaluated withouttransparency regarding those choices. We also note that thepurpose of this paper was not to recommend specific softwareor suggest that studies conducted with software platforms arebetter than studies based on de novo code.
Methods
In order to identify an initial list of key parameters that must bedefined to implement a study, we reviewed 5 macro basedprograms and software systems designed to support healthcaredatabase research (listed in appendix). We used this as a startingpoint because such programs are designed with flexible param-eters to allow creation of customized study populations based onuser specified scientific decisions [54,57–60]. These flexibleparameters informed our catalogue of operational decisions thatwould have to be transparent for an independent investigator tofully understand how a study was implemented and be able todirectly replicate a study.
Our review included a convenience sample of macro basedprograms and software systems that were publically available,developed by or otherwise accessible to members of the TaskForce. Although the software systems used a variety of codinglanguages, from a methodologic perspective, differences in codeor coding languages are irrelevant so long as study parametersare implemented as intended by the investigator.
In our review, we identified places where an investigator hadto make a scientific decision between options or create studyspecific inputs to create an analytic dataset from raw longitudinalsource data, including details of data source, inclusion/exclusioncriteria, exposure definition, outcome definition, follow up (daysat risk), baseline covariates, as well as reporting on analysismethods. As we reviewed each tool, we added new parametersthat had not been previously encountered and synonyms fordifferent concepts.
After the list of parameters was compiled, the co‐authors, aninternational group of database experts, corresponded aboutthese items and suggested additional parameters to include. In‐person discussions took place following the ISPE mid‐year inLondon (2017).
This paper was opened to comment by ISPE membership priorto publication and was endorsed by ISPE’s Executive Board on July20, 2017. The paper was also reviewed by ISPOR membership andendorsed by ISPOR leadership.
Results
Our review identified many scientific decisions necessary tooperate software solutions that would facilitate direct replicationof an analytic cohort from raw source data captured in alongitudinal healthcare data source (Table 2). After reviewingthe first two comprehensive software solutions, no parameterswere added with review of additional software tools (e.g. “satu-ration point”). The general catalogue includes items that may notbe relevant for all studies or study designs.
V A L U E I N H E A L T H 2 0 ( 2 0 1 7 ) 1 0 0 9 – 1 0 2 21012
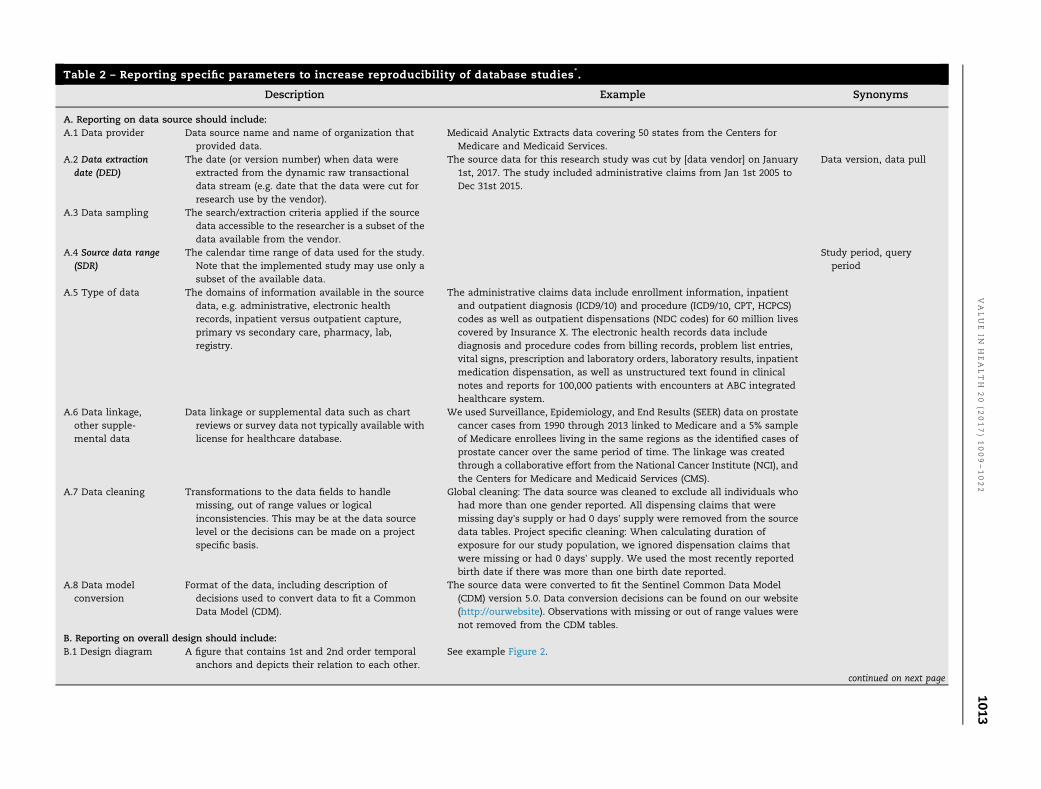
Table 2 – Reporting specific parameters to increase reproducibility of database studies*.
Description Example Synonyms
A. Reporting on data source should include:A.1 Data provider Data source name and name of organization that
provided data.Medicaid Analytic Extracts data covering 50 states from the Centers for
Medicare and Medicaid Services.A.2 Data extraction
date (DED)The date (or version number) when data were
extracted from the dynamic raw transactionaldata stream (e.g. date that the data were cut forresearch use by the vendor).
The source data for this research study was cut by [data vendor] on January1st, 2017. The study included administrative claims from Jan 1st 2005 toDec 31st 2015.
Data version, data pull
A.3 Data sampling The search/extraction criteria applied if the sourcedata accessible to the researcher is a subset of thedata available from the vendor.
A.4 Source data range(SDR)
The calendar time range of data used for the study.Note that the implemented study may use only asubset of the available data.
Study period, queryperiod
A.5 Type of data The domains of information available in the sourcedata, e.g. administrative, electronic healthrecords, inpatient versus outpatient capture,primary vs secondary care, pharmacy, lab,registry.
The administrative claims data include enrollment information, inpatientand outpatient diagnosis (ICD9/10) and procedure (ICD9/10, CPT, HCPCS)codes as well as outpatient dispensations (NDC codes) for 60 million livescovered by Insurance X. The electronic health records data includediagnosis and procedure codes from billing records, problem list entries,vital signs, prescription and laboratory orders, laboratory results, inpatientmedication dispensation, as well as unstructured text found in clinicalnotes and reports for 100,000 patients with encounters at ABC integratedhealthcare system.
A.6 Data linkage,other supple-mental data
Data linkage or supplemental data such as chartreviews or survey data not typically available withlicense for healthcare database.
We used Surveillance, Epidemiology, and End Results (SEER) data on prostatecancer cases from 1990 through 2013 linked to Medicare and a 5% sampleof Medicare enrollees living in the same regions as the identified cases ofprostate cancer over the same period of time. The linkage was createdthrough a collaborative effort from the National Cancer Institute (NCI), andthe Centers for Medicare and Medicaid Services (CMS).
A.7 Data cleaning Transformations to the data fields to handlemissing, out of range values or logicalinconsistencies. This may be at the data sourcelevel or the decisions can be made on a projectspecific basis.
Global cleaning: The data source was cleaned to exclude all individuals whohad more than one gender reported. All dispensing claims that weremissing day’s supply or had 0 days’ supply were removed from the sourcedata tables. Project specific cleaning: When calculating duration ofexposure for our study population, we ignored dispensation claims thatwere missing or had 0 days’ supply. We used the most recently reportedbirth date if there was more than one birth date reported.
A.8 Data modelconversion
Format of the data, including description ofdecisions used to convert data to fit a CommonData Model (CDM).
The source data were converted to fit the Sentinel Common Data Model(CDM) version 5.0. Data conversion decisions can be found on our website(http://ourwebsite). Observations with missing or out of range values werenot removed from the CDM tables.
B. Reporting on overall design should include:B.1 Design diagram A figure that contains 1st and 2nd order temporal
anchors and depicts their relation to each other.See example Figure 2.
continued on next page
VALUE
INH
EALTH
20
(2017)1009–1022
1013

Table 2 – continued
Description Example Synonyms
C. Reporting on inclusion/exclusion criteria should include:C.1 Study entry date
(SED)The date(s) when subjects enter the cohort. We identified the first SED for each patient.
Patients were included if all other inclusion/ exclusion criteria were met atthe first SED. We identified all SED for each patient. Patients entered thecohort only once, at the first SED where all other inclusion/exclusion criteriawere met. We identified all SED for each patient. Patients entered the cohortat every SED where all other inclusion/ exclusion criteria were met.
Index date, cohort entrydate, outcome date,case date, qualifyingevent date, sentinelevent
C.2 Person or episodelevel study entry
The type of entry to the cohort. For example, at theindividual level (1x entry only) or at the episodelevel (multiple entries, each time inclusion/exclusion criteria met).
Single vs multiple entry,treatment episodes,drug eras
C.3 Sequencing ofexclusions
The order in which exclusion criteria are applied,specifically whether they are applied before orafter the selection of the SED(s).
Attrition table, flowdiagram, CONSORTdiagram
C.4 Enrollmentwindow (EW)
The time window prior to SED in which anindividual was required to be contributing to thedata source.
Patients entered the cohort on the date of their first dispensation for Drug Xor Drug Y after at least 180 days of continuous enrolment (30 day gapsallowed) without dispensings for either Drug X or Drug Y.
Observation window
C.5 Enrollment gap The algorithm for evaluating enrollment prior toSED including whether gaps were allowed.
C.6 Inclusion/Exclusiondefinition window
The time window(s) over which inclusion/ exclusioncriteria are defined.
Exclude from cohort if ICD‐9 codes for deep vein thrombosis (451.1x,451.2x,451.81, 451.9x, 453.1x, 453.2x, 453.8x,453.9x, 453.40, 453.41, 453.42where x represents presence of a numeric digit 0‐9 or no additional digits)were recorded in the primary diagnosis position during an inpatient staywithin the 30 days prior to and including the SED. Invalid ICD‐9 codes thatmatched the wildcard criteria were excluded.
Concepts, vocabulary,class, domain
C.7 Codes The exact drug, diagnosis, procedure, lab or othercodes used to define inclusion/ exclusion criteria.
C.8 Frequency andtemporality ofcodes
The temporal relation of codes in relation to eachother as well as the SED. When definingtemporality, be clear whether or not the SED isincluded in assessment windows (e.g. occurred onthe same day, 2 codes for A occurred within 7 daysof each other during the 30 days prior to andincluding the SED).
C.9 Diagnosisposition (ifrelevant/available)
The restrictions on codes to certain positions, e. g.primary vs. secondary. Diagnoses.
C.10 Care setting The restrictions on codes to those identified fromcertain settings, e.g. inpatient, emergencydepartment, nursing home.
Care site, place of service,point of service,provider type
C.11 Washout forexposure
The period used to assess whether exposure at theend of the period represents new exposure.
New initiation was defined as the first dispensation for Drug X after at least180 days without dispensation for Drug X, Y, and Z.
Lookback for exposure,event free period
C.12 Washout foroutcome
The period prior to SED or ED to assess whether anoutcome is incident.
Patients were excluded if they had a stroke within 180 days prior to andincluding the cohort entry date. Cases of stroke were excluded if there wasa recorded stroke within 180 days prior.
Lookback for outcome,event free period
D. Reporting on exposure definition should include:D.1 Type of exposure The type of exposure that is captured or measured,
e.g. drug versus procedure, new use, incident,prevalent, cumulative, time‐ varying.
We evaluated risk of outcome Z following incident exposure to drug X or drugY. Incident exposure was defined as beginning on the day of the firstdispensation for one of these drugs after at least 180 days without
continued on next page
VALUE
INH
EALTH
20
(2017)1009–1022
1014

dispensations for either (SED). Patients with incident exposure to both drugX and drug Y on the same SED were excluded. The exposure risk windowfor patients with Drug X and Drug Y began 10 days after incident exposureand continued until 14 days past the last days supply, including refills. If apatient refilled early, the date of the early refill and subsequent refills wereadjusted so that the full days supply from the initial dispensation wascounted before the days supply from the next dispensation was tallied.Gaps of less than or equal to 14 days in between one dispensation plusdays supply and the next dispensation for the same drug were bridged (i.e.the time was counted as continuously exposed). If patients exposed toDrug X were dispensed Drug Y or vice versa, exposure was censored. NDCcodes used to define incident exposure to drug X and drug Y can be foundin the appendix. Drug X was defined by NDC codes listed in the appendix.Brand and generic versions were used to define Drug X. Non pill or tabletformulations and combination pills were excluded.
D.2 Exposure riskwindow (ERW)
The ERW is specific to an exposure and the outcomeunder investigation. For drug exposures, it isequivalent to the time between the minimum andmaximum hypothesized induction time followingingestion of the molecule.
Drug era, risk window
D.2a Induction period[1]
Days on or following study entry date during whichan outcome would not be counted as “exposedtime” or “comparator time”.
Blackout period
D.2b Stockpiling [1] The algorithm applied to handle leftover dayssupply if there are early refills.
D.2c Bridgingexposure episodes[1]
The algorithm applied to handle gaps that are longerthan expected if there was perfect adherence (e.g.non‐overlapping dispensation þ day’s supply).
Episode gap, grace period,persistence window,gap days
D.2d Exposureextension [1]
The algorithm applied to extend exposure past thedays supply for the last observed dispensation ina treatment episode.
Event extension
D.3 Switching/add on The algorithm applied to determine whetherexposure should continue if another exposurebegins.
Treatment episodetruncation indicator
D.4 Codes, frequencyand temporality ofcodes, diagnosisposition, caresetting
Description in Section C. Concepts, vocabulary,class, domain, care site,place of service, pointof service, provider type
D.5 ExposureAssessmentWindow (EAW)
A time window during which the exposure status isassessed. Exposure is defined at the end of theperiod. If the occurrence of exposure definescohort entry, e.g. new initiator, then the EAW maybe a point in time rather than a period. If EAW isafter cohort entry, FW must begin after EAW.
We evaluated the effect of treatment intensification vs no intensificationfollowing hospitalization on disease progression. Study entry was definedby the discharge date from the hospital. The exposure assessment windowstarted from the day after study entry and continued for 30 days. Duringthis period, we identified whether or not treatment intensified for eachpatient. Intensification during this 30 day period determined exposurestatus during follow up. Follow up for disease progression began 31 daysfollowing study entry and continued until the firsst censoring criterion wasmet.
E. Reporting on follow‐up time should include:E. 1 Follow‐up window
(FW)The time following cohort entry during which
patients are at risk to develop the outcome due tothe exposure. FW is based on a biologic exposurerisk window defined by minimum and maximuminduction times. However, FW also accounts forcensoring mechanisms.
Follow up began on the SED and continued until the earliest ofdiscontinuation of study exposure, switching/adding comparatorexposure, entry to nursing home, death, or end of study period. Weincluded a biologically plausible induction period, therefore, follow upbegan 60 days after the SED and continued until the earliest ofdiscontinuation of study exposure, switching/adding comparatorexposure, entry to nursing home, death, or end of study period.E.2 Censoring criteria The criteria that censor follow up.
F. Reporting on outcome definition should include:F.1 Event date ‐ ED The date of an event occurrence. The ED was defined as the date of first inpatient admission with primary
diagnosis 410.x1 after the SED and occurring within the follow up window.Case date, measure date,
observation dateF.2 Codes, frequency
and temporality ofcodes, diagnosisposition, caresetting
Description in Section C. Concepts, vocabulary,class, domain, care site,place of service, pointof service, provider type
continued on next page
VALUE
INH
EALTH
20
(2017)1009–1022
1015

Table 2 – continued
Description Example Synonyms
F.3. Validation The performance characteristics of outcomealgorithm if previously validated.
The outcome algorithm was validated via chart review in a population ofdiabetics from data source D (citation). The positive predictive value of thealgorithm was 94%.
G. Reporting on covariate definitions should include: Event measures,observations
G.1 Covariateassessment window(CW)
The time over which patient covariates are assessed. We assessed covariates during the 180 days prior to but not including theSED.
Baseline period
G.2 Comorbidity/riskscore
The components and weights used in calculation ofa risk score.
See appendix for example. Note that codes, temporality, diagnosis positionand care setting should be specified for each component when applicable.
G.3 Healthcareutilization metrics
The counts of encounters or orders over a specifiedtime period, sometimes stratified by care setting,or type of encounter/order.
We counted the number of generics dispensed for each patient in the CAP.We counted the number of dispensations for each patient in the CAP. Wecounted the number of outpatient encounters recorded in the CAP. Wecounted the number of days with outpatient encounters recorded in theCAP. We counted the number of inpatient hospitalizations in the CAP, ifadmission and discharge dates for different encounters overlapped, thesewere "rolled up" and counted as 1 hospitalization.
G.4 Codes, frequencyand temporality ofcodes, diagnosisposition, caresetting
Description in Section C. Baseline covariates were defined by codes from claims with service dateswithin 180 days prior to and including the SED. Major uppergastrointestinal bleeding was defined as inpatient hospitalization with: Atleast one of the following ICD‐9 diagnoses: 531.0x, 531.2x, 531.4x, 531.6x,532.0x, 532.2x, 532.4x, 532.6x, 533.0x, 533.2x, 533.4x, 533.6x, 534.0x, 534.2x,534.4x, 534.6x, 578.0 ‐ OR ‐ An ICD‐9 procedure code of: 44.43 ‐ OR ‐ A CPTcode 43255
Concepts, vocabulary,class, domain, care site,place of service, pointof service, provider type
H. Reporting on control sampling should include:H.1 Sampling
strategyThe strategy applied to sample controls for
identified cases (patients with ED meeting allinclusion/exclusion criteria).
We used risk set sampling without replacement to identify controls from ourcohort of patients with diagnosed diabetes (inpatient or outpatient ICD‐9diagnoses of 250.xx in any position). Up to 4 controls were randomlymatched to each case on length of time since SED (in months), year of birthand gender. The random seed and sampling code can be found in theonline appendix.
H.2 Matching factors The characteristics used to match controls to cases.H.3 Matching ratio The number of controls matched to cases (fixed or
variable ratio).I. Reporting on statistical software should include:I.1 Statistical
software programused
The software package, version, settings, packages oranalytic procedures.
We used: SAS 9.4 PROC LOGISTIC Cran R v3.2.1 survival package Sentinel’sRoutine Querying System version 2.1.1 CIDAþPSM1 tool Aetion Platformrelease 2.1.2 Cohort Safety
Parameters in bold are key temporal anchors
VALUE
INH
EALTH
20
(2017)1009–1022
1016

The group of experts agreed that the detailed catalogue ofscientific decision points that would enhance transparency andreproducibility but noted that even if every parameter werereported, there was room for different interpretation of languageused to describe choices. Therefore future development of clear,shared terminology and design visualization techniques wouldbe valuable. While sharing source data and code should beencouraged (when permissible by data use agreements andintellectual property), this would not be a sufficient substitutefor transparent, natural language reporting of study parameters.
Data source
Researchers should specify the name of the data source, whoprovided the data (A1), the data extraction date (DED) (A2), dataversion, or data sampling strategy (A3) (when appropriate), as wellas the years of source data used for the study (A4). As summarizedin the appendix, source data may have subtle or profound differ-ences depending on when the raw source data was cut forresearch use. Therefore, if an investigator were to run the samecode to create and analyze a study population from the same datasource twice, the results may not line up exactly if the investigatoruses a different data version or raw longitudinal source data cut bythe data holding organization at different time points.
When a researcher is granted access to only a subset of rawlongitudinal source data from a data vendor, the samplingstrategy and any inclusions or exclusions applied to obtain thatsubset should be reported. For example, one could obtain accessto a 5% sample of Medicare patients flagged with diabetes in thechronic condition warehouse in the years 2010–2014.
It is also important for researchers to describe the types ofdata available in the data source (A5) and characteristics of thedata such as the median duration of person‐time within the datasource. This is important for transparency and ability of decision‐makers unfamiliar with the data source to assess the validity orappropriateness of selected design choices. The data type hasimplications for comprehensiveness of patient data capture. Forexample, is the data based on administrative or electronic healthrecords? If the latter, does the data cover only primary care,inpatient settings or an integrated health system? Does it includelab tests, results or registry data? Does it contain data onprescribed medications or dispensed medications? Is therelinkage between outpatient and inpatient data? Is there linkageto other data sources? (A6) If so, then who did the linkage, whenand how?
If the raw source data is pre‐processed, with cleaning up ofmessy fields or missing data, before an analytic cohort is created,the decisions in this process should be described (A7). Forexample, if the raw data is converted to a common data model(CDM) prior to creation of an analytic cohort, the CDM versionshould be referenced (e.g. Sentinel Common Data Model version5.0.1 [61], Observational Medical Outcomes Partnership CommonData Model version 5.0 [62]) (A8). Or if individuals with incon-sistent dates of birth or gender were unilaterally dropped from allrelational data tables, this should be documented in meta‐dataabout the data source. If the data is periodically refreshed withmore recent data, the date of the refresh should be reported aswell as any changes in assumptions applied during the datatransformation [31,32]. If cleaning decisions are made on aproject specific basis rather than at a global data level, theseshould also be reported.
Design
In addition to stating the study design, researchers shouldprovide a design diagram that provides a visual depiction offirst/second order temporal anchors (B1, Table 3) and their
relationship to each other. This diagram will provide clarityabout how and when patients enter the cohort, baseline charac-teristics are defined as well as when follow up begins and ends.Because the terminology for similar concepts varies acrossresearch groups and software systems, visual depiction of time-lines can reduce the risk of misinterpretation. We provide oneexample of a design diagram that depicts these temporal anchors(Figure 2). In this figure, the study entry date is day 0. A requiredperiod of enrollment is defined during the 183 days prior to butnot including the study entry date. There is also washout forexposure and outcome in the 183 days prior to but not includingthe study entry date. There are two windows during whichcovariates are assessed, covariates 1–5 are defined in the 90 daysprior to but not including the study index date whereas cova-riates 6–25 are defined in the 183 days prior to but not includingthe index date. There is an induction period following study entryso follow up for the outcome begins on day 30 and continuesuntil a censoring mechanism is met.
Table 3 – Key temporal anchors in design of adatabase study.*
Temporal Anchors Description
Data Extraction Date ‐
DEDThe date when the data were extracted
from the dynamic raw transactionaldata stream
Source Data Range ‐
SDRThe calendar time range of data used
for the study. Note that theimplemented study may use only asubset of the available data.
First order anchors (event time):Enrollment Window ‐
EWThe time window prior to SED in which
an individual was required to becontributing to the data source
CovariateAssessmentWindow ‐ CW
The time during which all patientcovariates are assessed. Baselinecovariate assessment should precedecohort entry in order to avoidadjusting for causal intermediates.
Follow‐Up Window ‐
FWThe time following cohort entry during
which patients are at risk to developthe outcome due to the exposure.
Exposure AssessmentWindow ‐ EAW
The time window during which theexposure status is assessed.Exposure is defined at the end of theperiod. If the occurrence of exposuredefines cohort entry, e.g. newinitiator, then the exposureassessment may be a point in timerather than a window. If exposureassessment is after cohort entry,follow up must begin after exposureassessment.
Event Date ‐ ED The date of an event occurrencefollowing cohort entry
Washout forExposure ‐ WE
The time prior to cohort entry duringwhich there should be no exposure(or comparator).
Washout forOutcome ‐ WO
The time prior to cohort entry duringwhich the outcome of interestshould not occur
* Anchor dates are key dates; baseline anchors identify the avail-able source data; first order anchor dates define entry to theanalytic dataset, and second order anchors are relative to the firstorder anchor
V A L U E I N H E A L T H 2 0 ( 2 0 1 7 ) 1 0 0 9 – 1 0 2 2 1017

Exposure, outcome, follow up, covariates and various cohortentry criteria
A great level of detail is necessary to fully define exposure,outcome, inclusion/exclusion and covariates. As others havenoted, reporting the specific codes used to define these measuresis critical for transparency and reproducibility [47,63] especially indatabases where there can be substantial ambiguity in codechoice.
The study entry dates (C1) will depend on how they areselected (one entry per person versus multiple entries) (C2) andwhether inclusion/exclusion criteria are applied before or afterselection of study entry date(s) for each individual (C3). Reportingshould include a clear description of the sequence in whichcriteria were applied to identify the study population, ideally inan attrition table or flow diagram, and description of whetherpatients were allowed to enter multiple times. If more than oneexposure is evaluated, researchers should be explicit about howto handle situations where an individual meets inclusion/exclu-sion criteria to enter the study population as part of more thanone exposure group.
Also critical are other key investigator decisions including 1)criteria for ensuring that healthcare encounters would be cap-tured in the data (e.g. continuous enrollment for a period of time,with or without allowable gaps) (C4, C5), 2) specific codes used,the frequency and temporality of codes in relation to each otherand the study entry date (C6–C8), 3) diagnosis position (C9) andcare settings (C10) (e.g. primary diagnosis in an inpatient setting).Whenever defining temporal anchors, whether or not timewindows are inclusive of the study entry date should be articu-lated. Some studies use multiple coding systems when definingparameters. For example, studies that span the transition fromICD‐9 to ICD 10 in the United States or studies that involve datafrom multiple countries or delivery systems. If coding algorithmsare mapped from one coding system to another, details abouthow the codes were mapped should be reported.
When “wildcards” are used to summarize code lists instead oflisting out every single potential code, the definition of thewildcard should be specified. For example, if someone uses “x”as a wildcard in an algorithm to define a baseline covariate (e.g.ICD‐9 codes 410. x1), the definition should indicate over whattime period in relation to study entry (covariate assessmentwindow – CW), which care settings to look in (C11), whether toinclude only primary diagnoses (C10), and whether the wildcard“x” includes only digits 0–9 or also includes the case of noadditional digits recorded. Furthermore, when wildcards areused, it should be clear whether invalid codes found with awildcard match in the relevant digit were excluded (e.g. 410.&1 isnot a valid code but matches 410.x1).
It is important to report on who can be included in a study.Reporting should include specification of what type of exposuremeasurement is under investigation, for example prevalent versusincident exposure (D1) [64]. If the latter, the criteria used to defineincidence, including the washout window, should be clearlyspecified (C11). For example, incidence with respect to the expo-sure of interest only, the entire drug class, exposure and compa-rator, etc. When relevant, place of service used to define exposureshould also be specified (e.g. inpatient versus outpatient).
Type of exposure (D1), when exposure is assessed andduration of exposure influence who is selected into the studyand how long they are followed. When defining drug exposures,investigators make decisions regarding the intended length ofprescriptions as well as hypothesized duration of exposure effect.Operationally, these definitions may involve induction periods,algorithms for stockpiling of re‐filled drugs, creating treatmentepisodes by allowing gaps in exposure of up to X days to bebridged, extending the risk window beyond the end of days’supply or other algorithms (D2, D3). The purpose of applying suchalgorithms to the data captured in healthcare databases is tomore accurately measure the hypothesized biologic exposure riskwindow (ERW). The ERW is specific to an exposure and theoutcome under investigation. For drug exposures, it is equivalentto the difference between the minimum and maximum inductiontime following ingestion of a molecule [65,66]. Similar decisionsare necessary to define timing and duration of hypothesizedbiologic effect for non‐drug exposures. These decisions arenecessary to define days at risk while exposed and should beexplicitly stated. There may be data missing for elements such asdays’ supply or number of tablets. Decisions about how to handlemissingness should be articulated. When describing the studypopulation, reporting on the average starting or daily dose canfacilitate understanding of variation in findings between similarstudies conducted in different databases where dosing patternsmay differ. Specific codes, formulations, temporality, diagnosisposition and care settings should be reported when relevant (D4).
For some studies, exposure is assessed after study entry (D5).For example, a study evaluating the effect of treatment intensifi-cation versus no intensification on disease progression after ahospitalization could define study entry as the date of dischargeand follow up for outcomes after an exposure assessment window(EAW) during which treatment intensification status is defined. TheERW and follow up for an outcome should not begin until afterEAW has concluded [67]. The timing of EAW relative to study entryand follow up should be clearly reported when relevant.
The analytic follow up window (FW) covers the interval duringwhich outcome occurrence could be influenced by exposure (E1).The analytic follow up is based on the biologic exposure risk, butthe actual time at risk included may also be defined by censoringmechanisms. These censoring mechanisms should be enumer-ated in time to event analyses (E2). Reasons for censoring mayinclude events such as occurrence of the outcome of interest, endof exposure, death, disenrollment, switching/adding medication,entering a nursing home, or use of a fixed follow‐up window (e.g.intention to treat).
Outcome surveillance decisions can strongly affect studyresults. In defining the outcome of interest, investigators shouldspecify whether a washout period prior to the study entry datewas applied to capture incident events (C12). If a washout periodwas applied, it should be clear whether the washout included orexcluded the study entry date. The timing of the event date (F1)relative to the specific codes used and restrictions to certain caresettings or diagnosis position should be reported if they are partof the outcome definition (F2). If the algorithm used to define theoutcome was previously validated, a citation and performancecharacteristics such as positive predictive value should bereported (F3).
Figure 2 – Example design diagram.
V A L U E I N H E A L T H 2 0 ( 2 0 1 7 ) 1 0 0 9 – 1 0 2 21018

The same considerations outlined above for outcome defini-tion apply to covariates (G1, G4). If a comorbidity score is definedfor the study population, there should be a clear description ofthe score components, when and how they were measured, andthe weights applied (G2, Appendix C). Citations often link topapers which evaluate multiple versions of a score, and it can beunclear which one was applied in the study. When medicalutilization metrics are reported, there should be details abouthow each metric is calculated as part of the report (G3). Forexample, in counts of medical utilization, one must be clear ifcounts of healthcare visits are unique by day or unique byencounter identifier and whether they include all encounters oronly those from specific places of service. Hospitalizations aresometimes “rolled up” and counted only once if the admissionand discharge dates are contiguous or overlapping. Patients mayhave encounters in multiple care settings on the same date. Allencounters may be counted or an algorithm applied to determinewhich ones are included in utilization metrics. Different inves-tigator choices will result in different counts.
If sampling controls for a case‐control study, how and whencontrols are sampled should be clearly specified. Reportingshould include the sampling strategy (H1), whether it is basecase, risk set or survivor sampling. If matching factors are used,these should be listed and the algorithms for defining them madeavailable (H2). The number and ratio of controls should bereported, including whether the ratio is fixed or variable andwhether sampling is with or without replacement (H3). If multi-ple potential matches are available, the decision rules for whichto select should be stated.
In addition, the statistical software program or platform usedto create the study population and run the analysis should bedetailed, including specific software version, settings, proceduresor packages (I1).
The catalogue of items in Table 2 are important to report indetail in order to achieve transparent scientific decisions definingstudy populations and replicable creation of analytic datasetsfrom longitudinal healthcare databases. We have highlighted inTable 3 key temporal anchors that are essential to report in themethods section of a paper, ideally accompanied with a designdiagram (Figure 2). Other items from Table 2 should be includedwith peer reviewed papers or other public reports, but may bereported in online appendices or as referenced web pages.
After creating an analytic dataset from raw longitudinal datastreams, there are numerous potential ways to analyze a createdanalytic dataset and address confounding. Some of the mostcommon methods used in healthcare database research includemultivariable regression and summary score methods (propen-sity score or disease risk score matching, weighting, stratifica-tion) [68,69]. Other methods include instrumental variableanalysis, standardization and stratification. Each of these meth-ods comes with their own set of assumptions and details ofimplementation which must be reported to assess adequacy ofthose methods and obtain reproducible results. In the appendix,we highlight important descriptive or comparative resultsto report for several commonly used analytic methods(Appendix D).
Discussion
Evidence generated from large healthcare databases is increas-ingly being sought by decision‐makers around the world. How-ever, publication of database study results is often accompaniedby study design reported at a highly conceptual level, withoutenough information for readers to understand the temporality ofhow patients entered the study, or how exposure, outcome andcovariates were operationally defined in relation to study entry.
Only after decision‐makers and peer‐reviewers are reasonablyconfident that they know the actual steps implemented by theoriginal researchers can they assess whether or not they agreewith the validity of those choices or evaluate the reproducibilityand rigor of the original study findings.
Stakeholders involved in healthcare are increasingly inter-ested in evaluating additional streams of evidence beyondrandomized clinical trials and are turning their attention towardreal‐world evidence from large healthcare database studies. Thisinterest has led to groundbreaking infrastructure and software toscale up capacity to generate database evidence from public andprivate stakeholders. The United States FDA’s Sentinel System isone example of a large scale effort to create an open sourceanalytic infrastructure. Supported by FDA to achieve its publichealth surveillance mission, the tools and infrastructure are alsoavailable to the research community through Reagan UdallFoundation’s IMEDS system. Sentinel has committed itself totransparency through online posting of study protocols, finalreports, and study specifications, including temporal anchors,how data are processed into a common data model, and studydesign details. Similarly, the Canadian government, the EuropeanMedicines Agency (EMA) and several countries in Asia havedeveloped consortia to facilitate transparent evidence generationfrom healthcare databases, including the Canadian Network forObservational Drug Effect Studies (CNODES) [8], Innovative Med-icines Initiative (IMI), ENCePP [70] and others [9].
These efforts have made great strides in improving capacityfor transparent evidence generation from large healthcare data-bases, however many involve closed systems that do not influ-ence research conducted outside of the respective networks.Currently, there is not a clear roadmap for how the field shouldproceed. This is reflected in policies around the world. In the US,the recently passed 21st Century Cures Act and Prescription DrugUser Fee Act (PDUFA VI) include sections on evaluating when andhow to make greater use of real world evidence to supportregulatory decisions. In the EU, there is exploration of adaptivepathways to bring drugs to market more quickly by using health-care database evidence to make approval decisions [11] andactive work on harmonizing policies on use of real ‐worldevidence from databases to inform health technology assessmentdecisions [12].
Regardless of whether a study is conducted with softwaretools or de novo code, as part of a network or independently, asubstantial improvement in transparency of design and imple-mentation of healthcare database research could be achieved ifspecific design and operation decisions were routinely reported.We encourage researchers to prepare appendices that report indetail 1) data source provenance including data extraction date orversion and years covered, 2) key temporal anchors (ideally witha design diagram), 3) detailed algorithms to define patientcharacteristics, inclusion or exclusion criteria, and 4) attritiontable with baseline characteristics of the study population beforeapplying methods to deal with confounding. The ultimate meas-ure of transparency is whether a study could be directly repli-cated by a qualified independent investigator based on publicallyreported information. While sharing data and code should beencouraged whenever data use agreements and intellectualproperty permit, in many cases this is not possible. Even if dataand code are shared, clear, natural language description would benecessary for transparency and the ability to evaluate the validityof scientific decisions.
In many cases, attempts from an independent investigator todirectly replicate a study will be hampered by data use agree-ments that prohibit public sharing of source data tables anddifferences in source data tables accessed from the same dataholder at different times. Nevertheless, understanding howclosely findings can be replicated by an independent investigator
V A L U E I N H E A L T H 2 0 ( 2 0 1 7 ) 1 0 0 9 – 1 0 2 2 1019

when using the same data source over the same timeperiod would be valuable and informative. Similarly, evaluationof variation in findings from attempts to conceptuallyreplicate an original study using different source data or plausiblealternative parameter choices can provide substantial insights.Our ability to understand observed differences in findingsafter either direct or conceptual replication relies on clarityand transparency of the scientific decisions originallyimplemented.
This paper provides a catalogue of specific items to report toimprove reproducibility and facilitate assessment of validity ofhealthcare database analyses. We expect that it will grow andchange over time with input from additional stakeholders. Thiscatalogue could be used to support parallel efforts to improvetransparency and reproducibility of evidence from databaseresearch. For example, we noted that the terminology used bydifferent research groups to describe similar concepts varied. Anext step could include development of shared terminology andstructured reporting templates. We also had consensus withinour task force that a limited number of parameters are absolutelynecessary to recreate a study population, however there wasdisagreement on which. Empirical evaluation of the frequencyand impact of lack of transparency on the catalogue of specificoperational parameters on replicability of published databasestudies would be a valuable next step. Empirical data couldinform future policies and guidelines for reporting on databasestudies for journals, regulators, health technology assessmentbodies and other healthcare decision‐makers, where greaterpriority could be placed on reporting specific parameters withhigh demonstrated influence on replicability. It could alsohelp stakeholders create policies that triage limited resourcesby focusing on database evidence where reporting istransparent enough that validity and relevance of scientificchoices can be assessed. By aligning incentives of major stake-holders, the conduct and reporting of database research willchange for the better. This will increase the confidence ofdecision‐makers in real‐world evidence from large healthcaredatabases.
Ethics Statement
The authors state that no ethical approval was needed.
Acknowledgments
Provided comments during ISPE and ISPOR membership reviewperiod:
Shohei Akita PhD Pharmaceuticals and MedicalDevices Agency
René Allard PhD Grünenthal GmbHDorothee B BartelsMSc, PhD
Head of Global Epidemiology,Boehringer Ingelheim GmbH
Tânia Maria BeumeMBA
Instituto Nacional de Cancer
AstraZeneca
Boston Scientific
Grimsdyke House
Lance BrannmanPhD
Michael J CangelosiMA MPH
Gillian Hall PhDKenneth HornbuckleDVM, PhD, MPH
Eli Lilly
Hanna GyllenstenPhD
Karolinska Institute
Kris Kahler SM, PhD NovartisYH Kao Institute of Bio pharmaceutical
Science, College of Medicine,National Cheng KungUniversity
Hugh Kawabata PhD Bristol‐Myers SquibbRTI Health SolutionsJames Kaye MD,
DrPHOptumLincy Lai PhD,
PharmDLondon School of Hygiene andTropical Medicine
Sinead Langan FRCPMSc PhD
Tamar Lasky PhD MIE ResourcesJunjie Ma, MS PhDcandidate
University of Utah,Pharmacotherapy OutcomesResearch Center
Kim McGuigan PhDMBA
Teva Pharmaceuticals
Montserrat MiretMD, MPH
Nestle Health Science
Brigitta Monz MDMPH MA
Roche, Pharmaceuticals Division
Dominic MustonMSc
Bayer
Melvin Olsen PhD NovartisEberechukwuOnukwugha, MS,PhD
University of Maryland, School ofPharmacy
Chris L Pashos PhD(and colleagues)
Smitri Raichand
Takeda
University of New South WalesAustralia
Libby Roughead PhD,M.App.Sc.
School of Pharmacy and MedicalSciences, University of SouthAustralia
Martijn SchuemiePhD
Janssen
Lisa Shea MPGEmilie Taymore MSc MSDDavid L Van BruntPhD
AbbVie, Inc.
Amir Viyanchi MA,RN, PhD student
Medical Sciences University ofShahid Beheshti, Hamedan,Iran
Xuanqian Xie MSc Health Quality OntarioORCIDShirley V. Wang http://orcid.org/
0000-0001-7761-7090Joshua J. Gagne http://orcid.org/
0000-0001-5428-9733
Supplemental Materials
Supplemental material accompanying this article can be found inthe online version as a hyperlink at http://dx.doi.org/10.1016/j.jval.2017.08.3018 or, if a hard copy of article, at www.valueinhealthjournal.com/issues (select volume, issue, and article).
V A L U E I N H E A L T H 2 0 ( 2 0 1 7 ) 1 0 0 9 – 1 0 2 21020

R E F E R E N C E S
[1] Schneeweiss S, Avorn J. A review of uses of health care utilizationdatabases for epidemiologic research on therapeutics. J Clin Epidemiol2005;58:323–37.
[2] Califf RM, Robb MA, Bindman AB, et al. Transforming EvidenceGeneration to Support Health and Health Care Decisions. N Engl J Med2016;375:2395–400.
[3] Psaty BM, Breckenridge AM. Mini‐Sentinel and regulatory science‐‐bigdata rendered fit and functional. N Engl J Med 2014;370:2165–7.
[4] Fleurence RL, Curtis LH, Califf RM, et al. Launching PCORnet, a nationalpatient‐centered clinical research network. J Am Med Inform Assoc2014;21:578–82.
[5] Oliveira JL, Lopes P, Nunes T, et al. The EU‐ADR Web Platform: deliv-ering advanced pharmacovigilance tools. Pharmacoepidemiol Drug Saf2013;22:459–67.
[6] As PENc, Andersen M, Bergman U, et al. The AsianPharmacoepidemiology Network (AsPEN): promoting multi‐nationalcollaboration for pharmacoepidemiologic research in Asia.Pharmacoepidemiol Drug Saf 2013;22:700–4.
[7] Behrman RE, Benner JS, Brown JS, et al. Developing the SentinelSystem‐‐a national resource for evidence development. N Engl J Med2011;364:498–9.
[8] Suissa S, Henry D, Caetano P, et al. CNODES: the Canadian Networkfor Observational Drug Effect Studies. Open Medicine 2012;6:e134–40.
[9] Trifiro G, Coloma PM, Rijnbeek PR, et al. Combining multiple healthcaredatabases for postmarketing drug and vaccine safety surveillance: whyand how? J Intern Med 2014;275:551–61.
[10] Engel P, Almas MF, De Bruin ML, et al. Lessons learned on the designand the conduct of Post‐Authorization Safety Studies: review of 3 yearsof PRAC oversight. Br J Clin Pharmacol 2017;83:884–93.
[11] Eichler H‐G, Hurts H, Broich K, Rasi G. Drug Regulation and Pricing—CanRegulators Influence Affordability? N Engl J Med 2016;374:1807–9.
[12] Makady A, Ham RT, de Boer A, et al. Policies for Use of Real‐World Datain Health Technology Assessment (HTA): A Comparative Study of SixHTA Agencies. Value in health: J Int Soc Pharmacoecon Outcomes Res2017;20:520–32.
[13] Benchimol EI, Manuel DG, To T, et al. Development and use of reportingguidelines for assessing the quality of validation studies of healthadministrative data. J Clin Epidemiol 2011;64:821–9.
[14] Nicholls SG, Quach P, von Elm E, et al. The REporting of StudiesConducted Using Observational Routinely‐Collected Health Data(RECORD) Statement: Methods for Arriving at Consensus and Devel-oping Reporting Guidelines. PLoS One. 2015;10:e0125620.
[15] Collins GS, Omar O, Shanyinde M, Yu LM. A systematic review findsprediction models for chronic kidney disease were poorly reported andoften developed using inappropriate methods. J Clin Epidemiol2013;66:268–77.
[16] Bouwmeester W, Zuithoff NP, Mallett S, et al. Reporting and methodsin clinical prediction research: a systematic review. PLoS Med 2012;9:1–12.
[17] de Vries F, de Vries C, Cooper C, Leufkens B, van Staa T‐P. Reanalysis oftwo studies with contrasting results on the association between statinuse and fracture risk: the General Practice Research Database. Int JEpidemiol 2006;35:1301–8.
[18] Jick H, Kaye JA, Vasilakis‐Scaramozza C, Jick SS. Risk of venous throm-boembolism among users of third generation oral contraceptivescompared with users of oral contraceptives with levonorgestrel beforeand after 1995: cohort and case‐control analysis. BMJ: Br Med J2000;321:1190–5.
[19] Begley CG, Ellis LM. Drug development: Raise standards for preclinicalcancer research. Nature 2012;483:531–3.
[20] Kaiser J. The cancer test. Science 2015;348:1411–3.[21] Nosek BA, Alter G, Banks GC, et al. SCIENTIFIC STANDARDS. Promot-
ing an open research culture. Science 2015;348:1422–5.[22] Collins FS, Tabak LA. Policy: NIH plans to enhance reproducibility.
Nature 2014;505:612–3.[23] Goodman SK, Krumholz HM. Open Science: PCORI’s Efforts to Make
Study Results and Data More Widely Available. 2015.[24] Science CfO. Transparency and Openness Promotion (TOP) Guidelines.
Available from: http://centerforopenscience.org/top/. [Accessed July 20,2015].
[25] Meta-Research Innovation Center at Stanford. Available from: http://metrics.stanford.edu/. 2016.
[26] clinicalstudydatarequest.com. Available from: http://clinicalstudydatarequest.com/Default.aspx.
[27] Iqbal SA, Wallach JD, Khoury MJ, Schully SD, Ioannidis JP. ReproducibleResearch Practices and Transparency across the Biomedical Literature.PLoS Biol 2016;14:e1002333.
[28] Zika Open-Research Portal. Available from: https://zika.labkey.com/project/home/begin.view?.
[29] Hall GC, Sauer B, Bourke A, et al. Guidelines for good database selection anduse in pharmacoepidemiology research. Pharmacoepidemiol Drug Saf2012;21:1–10.
[30] Lanes S, Brown JS, Haynes K, et al. Identifying health outcomesin healthcare databases. Pharmacoepidemiol Drug Saf 2015;24:1009–16.
[31] Brown JS, Kahn M, Toh S. Data quality assessment for comparativeeffectiveness research in distributed data networks. Med Care 2013;51(8 Suppl 3):S22–9.
[32] Kahn MG, Brown JS, Chun AT, et al. Transparent reporting of dataquality in distributed data networks. Egems 2015;3:1052.
[33] EMA. ENCePP Guide on Methodological Standards in Pharmacoe-pidemiology. 2014.
[34] von Elm E, Altman DG, Egger M, et al. The Strengthening the Reporting ofObservational Studies in Epidemiology (STROBE) statement: guidelinesfor reporting observational studies. PLoS Med 2007;4:e296.
[35] Wilkinson MD, Dumontier M, Aalbersberg IJ, et al. The FAIR GuidingPrinciples for scientific data management and stewardship. ScientificData 03/15/online 2016;3:160018.
[36] Gini R, Schuemie M, Brown J, et al. Data Extraction and Management inNetworks of Observational Health Care Databases for ScientificResearch: A Comparison of EU‐ADR, OMOP, Mini‐Sentinel and MATRICEStrategies. Egems 2016;4:1189.
[37] Berger ML, Sox H, Willke R, et al. Good Practices for Real‐World DataStudies of Treatment and/or Comparative Effectiveness: Recommenda-tions from the Joint ISPOR‐ISPE Special Task Force on Real‐WorldEvidence in Healthcare Decision‐Making. Pharmacoepidemiol Drug Saf2017;26:1033–9.
[38] Nosek BA, Errington TM. Making sense of replications. Elife 2017;6:e23383.
[39] Benchimol EI, Smeeth L, Guttmann A, et al. The REporting of studiesConducted using Observational Routinely‐collected health Data(RECORD) statement. PLoS Med 2015;12:e1001885.
[40] Committee PP-CORIM. The PCORI Methodology Report. 2013.[41] Gagne JW, Wang SV, Schneeweiss S. FDA Mini‐Sentinel Prospective
Routine Observational Monitoring Program Tool: Cohort Matching.January. Technical Users’ Guide version: 1.0. 2014.
[42] Zhou X, Murugesan S, Bhullar H, et al. An evaluation of the THIN data-base in the OMOP Common Data Model for active drug safetysurveillance. Drug Saf 2013;36:119–34.
[43] Collins FS, Hudson KL, Briggs JP, Lauer MS. PCORnet: turning a dreaminto reality. J Am Med Inform Assoc 2014;21:576–7.
[44] Schuemie MJ, Gini R, Coloma PM, et al. Replication of the OMOPexperiment in Europe: evaluating methods for risk identification inelectronic health record databases. Drug Saf 2013;36(Suppl 1):S159–69.
[45] Schneeweiss S, Shrank WH, Ruhl M, Maclure M. Decision‐MakingAligned with Rapid‐Cycle Evaluation in Health Care. Int J TechnolAssess Health Care 2015;31:214–22.
[46] Public Policy Committee, International Society for Pharmacoepi-demiology. Guidelines for good pharmacoepidemiology practice (GPP).Pharmacoepidemiol Drug Saf 2016;25:2–10.
[47] Wang SV, Verpillat P, Rassen JA, et al. Transparency andReproducibility of Observational Cohort Studies Using Large HealthcareDatabases. Clin Pharmacol Ther 2016;99:325–32.
[48] Strom BL, Buyse M, Hughes J, Knoppers BM. Data sharing,year 1–access to data from industry‐sponsored clinical trials. N EnglJ Med 2014;371:2052–4.
[49] Science CfO. Open Science Framework now a recommended repositoryfor the Nature Publishing Group’s data journal, Scientific Data. https://cos.io/pr/2015-08-12/, 2016.
[50] Observational Medical Outcomes Partnership. Available from: http://omop.org/. 2016.
[51] Innovation in Medical Evidence Development and Surveillance (IMEDS).Available from: http://imeds.reaganudall.org/AboutIMEDS. 2016.
[52] Mini‐Sentinel Prospective Routine Observational Monitoring ProgramTools (PROMPT): Cohort Matching, SAS Code Package, Version 1.0. 2014.
[53] Essential Evidence for Healthcare. 2016. Available from: http://www.aetion.com/evidence/.
[54] Center M‐SC. Routine Querying Tools (Modular Programs). 2014.Available from: http://mini-sentinel.org/data_activities/modular_programs/details.aspx?ID=166. [Accessed June 12, 2017].
[55] EMIF. EMIF Platform. Available from: http://www.emif.eu/about/emif-platform.
[56] PROTECT. Available from: http://www.imi-protect.eu/.[57] Aetion, Inc.’s Comparative Effectiveness and Safety platforms version
2.2. Available from: https://www.aetion.com/. [Accessed July 7, 2017].[58] Observational Health Data Sciences and Informatics Atlas version 2.0.0.
Available from: https://ohdsi.org/analytic-tools/. [Accessed July 7, 2017].[59] Observational Health Data Sciences and Informatics CohortMethod
version 2.2.2. Available from:https://github.com/OHDSI/CohortMethod.[Accessed July 7, 2017].
V A L U E I N H E A L T H 2 0 ( 2 0 1 7 ) 1 0 0 9 – 1 0 2 2 1021

[60] Innovation in Medical Evidence in Development and Surveillance (IMEDs)Regularized Identification of Cohorts (RICO) version 1.2. Available from:http://imeds.reaganudall.org/RICO. [Accessed July 7, 2017].
[61] Mini‐Sentinel I. Mini‐Sentinel: Overview and Description of theCommon Data Model v5.0.1. Available from: http://www.mini-sentinel.org/work_products/Data_Activities/Mini-Sentinel_Common-Data-Model.pdf. [Accessed 2016].
[62] OMOP Common Data Model. Available from: http://omop.org/CDM.[Accessed March 21, 2016].
[63] Langan SM, Benchimol EI, Guttmann A, et al. Setting the RECORDstraight: developing a guideline for the REporting of studies Conductedusing Observational Routinely collected Data. Clin Epidemiol2013;5:29–31.
[64] Ray WA. Evaluating Medication Effects Outside of Clinical Trials:New‐User Designs. Am J Epidemiol 2003;158:915–20.
[65] Rothman KJ. Induction and latent periods. Am J Epidemiol1981;114:253–9.
[66] Maclure M. The case‐crossover design: a method for studying transienteffects on the risk of acute events. Am J Epidemiol 1991;133:144–53.
[67] Suissa S. Immortal time bias in pharmaco‐epidemiology. Am JEpidemiol 2008;167:492–9.
[68] Brookhart MA, Sturmer T, Glynn RJ, et al. Confounding control inhealthcare database research: challenges and potential approaches.Med Care 2010;48(6 Suppl):S114–20.
[69] Glynn RJ, Schneeweiss S, Sturmer T. Indications for propensity scoresand review of their use in pharmacoepidemiology. Basic ClinPharmacol Toxicol 2006;98:253–9.
[70] Agency EM. The European Network of Centres for Pharmacoepi-demiology and Pharmacovigilance (ENCePP) 2014. Available from:http://encepp.eu/. [Accessed December 13, 2014].
V A L U E I N H E A L T H 2 0 ( 2 0 1 7 ) 1 0 0 9 – 1 0 2 21022