reporting unit: wellness center (2013 – 2014) chris ... · reporting unit: wellness center (2013...
TRANSCRIPT

Reporting unit: Wellness Center (2013 – 2014) Person(s) completing report: Chris Suriano; Connie Martz
Assessment Plan Information Mission Statement: The Wellness Center is dedicated to developing and promoting opportunities for individuals of the University Community to incorporate the seven dimensions of wellness into their lifestyle.
Status of implementation of assessment plan: The overall Wellness Center Assessment plan is currently in a transition period, as the department completed a three (3) year assessment cycle in 2012-2013. The department Director position (currently vacant) will be undergoing a change, providing an opportunity for the department to develop a new assessment plan under new leadership. Through this transitional year, our department continued to work on the development of the Student Affairs Learning Agenda (SALA) rubrics. The SALA rubric tool was enhanced by the completion of two additional measurements in 2013-2014. In addition, our department began to develop an assessment project to determine the most effective way to communicate with NDSU students about programs, services, and wellness information. Focus groups will be the assessment instrument we will use to gather the information for this project, with focus groups being conducted in the Fall 2014/Spring 2015 semester.
Feedback: In response to the feedback on the Student Learning rubric, our supervisory staff will further examine opportunities to incorporate the use of the tool on a more frequent basis with our student employees. Future implementation of the rubric may include its use as a regular part of the semester performance evaluation and/or its incorporation into annual employee training.
Additional feedback, suggesting the development of an assessment for the Child Care Service, will guide our efforts to identify potential outcomes to measure for inclusion into our next assessment plan.
Student Learning and Development Student Learning and Development Outcomes: (SLDO):
Two additional Student Affairs Learning Agenda (SALA) items were selected for measurement during the 2013-2014 academic year. These additional items were included on the rubric assessment that is administered to our outgoing NDSU student employees. 1. Conflict Resolution - Learn to resolve conflict through understanding differences, value
systems and lifestyles. Open communication helps foster tolerance and appreciation of diverse perspectives.
3/4/2015 1

2. Function Collaboratively- Learn to work for a common purpose as an individual and as a team, and to understand the process of how a complex organization or institution functions.
The Conflict Resolution item from the Student Affairs Learning Agenda, closely aligns with the University Learning Outcome in the area of Critical Thinking, Creative Thinking and Problem Solving. Conflict resolution skills require the ability for one to identify the problem, identify and choose solutions. The Function Collaboratively item from the Student Affairs Learning Agenda, closely aligns with the University Learning Outcome in the areas of Communication and Understanding Human Societies. To achieve successful collaboration with others, communication is vital. While efforts to strengthen collaboration must include an understanding of individual differences when working with others.
Opportunities to Learn:
The objective of the Wellness Center student employee program is to provide the student with an out of the classroom experience that will further their development and assist them in finding full time employment upon graduation from North Dakota State University. The Student Affairs Learning Agenda items listed below are areas that our student employees are commonly faced with on a daily basis through their interactions with staff, colleagues, members, and guests. In the working environment, our student employees are presented with opportunities to resolve conflict and to function collaboratively as a part of a team. Conflict Resolution: In an ever-changing world, conflict can occur within the workplace, amongst employees, or between customers and employees. Resolving conflict in the workplace is an important skill that can contribute to improving the working climate, as well as creating a positive perception about customer service. Employers seek to find individuals who can succeed diplomatically in working through conflict, while providing solutions to resolve matters succinctly and effectively, in order to advance the delivery of the business and its services.
Function Collaboratively: Organizations face an increasingly complex and unpredictable competitive landscape, and one that is filled with new, aggressive competitors. Companies will need leaders who are highly adaptive, continuous learners, able to lead diverse groups across functional disciplines, regions, and cultures. They will also need to accomplish the difficult feat of driving results even where they do not have formal direct control or authority over resources. Companies will be growing through greater innovation, searching for new business opportunities across customer segments and leveraging best business practices to improve operational efficiency demand that employees and leaders know how to function collaboratively.
Summary of Assessment Process: The measurement process for the new student learning/development outcomes was conducted in the same manner as the previous year. The Wellness Center asked student employees leaving the Wellness Center, due to graduation or internships, to fill out
3/4/2015 2
retrospective rubrics for four of the six Student Affairs Learning Agenda (SALA) outcomes. These included the two new items developed this year, Conflict Resolution and Function Collaboratively.
The rubric assessment was conducted on five (5) Wellness Center student employees who were leaving NDSU at the end of the Fall 2013 semester. In addition to completing the rubric measurements, students were asked to reflect on their employment and write down a specific situation that was reflective of their learning under each of the SALA items.
Summary of Assessment Evidence: (See Attachment A)
The rubric results would suggest that student employees achieved overall growth and learning in the SALA topics of serving others, executing tasks to completion, conflict resolution and functioning collaboratively in a group. The top areas of improvement during the students’ employment at the Wellness Center were; Knowledge of Policies and Procedures (+2.60), Analyze/Identify Solutions (+1.80), Implement Solutions (+1.80), and Reflection on the Solution (+1.80). The area where departing student employees indicated the least amount of development is in the Be Punctual area (+0.20). The initial numbers also indicate students feel their greatest initial weakness was in the area of Reflection on Solutions (2.80).
Use of Assessment Evidence:
The current evidence reaffirms our intent to improve employee operational training over the past year. The evidence suggests that the large gains in the Knowledge of Policies and Procedures supports our efforts to ensure that employees understand the scope of their work and are confident with understanding and articulating the policies and procedures
To continue measuring student development, the Wellness Center staff is in the completion phase of finalizing the remaining two (2) rubrics: Lead and Participate as a Committed Citizen of the Community. The final implementation of the student development rubric is targeted for the 2013-14 academic year. We also intend explore the use of the electronic rubric for conducting the student learning outcome assessments.
Operational Effectiveness
Key Indicators and Goals: Facility utilization/visit statistics (See Attachment B) serve to provide our operation with key information about overall use of our facility and program areas. Through an analysis of the visit, membership, intramural participation, and demographics data, we are able to assess our operation to make decision on how to effectively serve our members.
3/4/2015 3
Another key indicator that we utilize to measure the operational effectiveness is the use of the Customer Service surveys (See Attachment C). The surveys provide us with information about how are staff are demonstrating strong customer service, helpfulness, operational knowledge, while creating a welcoming environment for all students.
Summary of Results:
The Wellness Center’s recreation software management system (RecTrac) tracks the utilization/visit statistics for all of our student and non-student members. The user visit is captured when a member checks-in to the facility by either a card swipe or a manual entry. The system also tracks membership sales, membership types, demographic information, and information for other programs and services that we offer. Data collection for our intramural program is conducted through the IM Leagues web registration portal. The results of the demographic information continue to show that there is a wide difference in the disparity in the user visits between males (64.91%) vs. females (35.09%). These numbers reflect nearly the same difference that was reported in the previous year. The Customer Service surveys were conducted within the last 2 weeks of the finals testing period for each of the Fall and Spring semester in 2013-2014. The results showed that over 70% of the respondents “strongly agreed” that our staff was informed and knowledgeable, courteous and welcoming, and knew the answer to their question.
Use of Results:
The Wellness Center used the demographic information to begin developing female specific programs. The “Women on Weights” program was developed to provide an educational and practical approach to helping our female students gain confidence and comfort in using more of the strength program areas. “Women on Weights” was implemented for a trial test in the Spring of 2014. Another program in development will target our female students in an effort to create a female only climbing class. This “women only” climbing class will be launched in the Fall of 2014. The use of the Customer Survey results, aid us in developing training to improve in specific areas of Customer Service.
Retention and Persistence
Programming: The Wellness Center facility with its wellness, recreation, and learning opportunities is considered a program that contributes to the campus-learning environment. Evidence of supporting retention and persistence: (See attachment D) Data: Fall and spring census files ranging from fall 2007 through spring 2013 were used to establish student population files. Wellness Center visit data was provided by Viet Doan, in conjunction
3/4/2015 4

with Wellness Center administrators. The number of visits refers to the number of times a student gained admittance to the Wellness Center for the respective fall or spring term. Professional students, graduate students, and non-degree seeking undergraduate students were excluded from the analyses. Summary (Degree Seeking Undergraduate students): There was found to be a statistically significant difference in the mean term GPA of undergraduate degree-seeking students who visited the Wellness Center and undergraduate degree-seeking students who did not visit the Wellness Center. On average, students who visited the Wellness Center at least once in a given term earned a term GPA 0.129 points higher than those who did not visit the Wellness Center. Further analysis of term GPA by academic level indicated the largest disparity in mean term GPA was that of undergraduate degree-seeking freshman, with students who visited the Wellness Center earning a term GPA, on average, 0.381 points higher than those freshman students who did not visit the Wellness Center. Paired comparison tests were also performed to analyze the change in term GPA from fall to spring terms (term-to-term analysis) and fall to fall terms (year-to-year analysis). As expected, there was found to be a statistically significant difference in the mean term GPA of students who attended the Wellness Center and those who did not visit the Wellness Center. Further detailed comparisons are provided in the following report. Based on these analyses, there appears to be fairly strong evidence suggesting there is a difference in term GPA for students who visit the Wellness Center and those who do not visit the Wellness Center. We cannot say term GPA is a direct result of usage of the Wellness Center, however, there is clearly a difference in these student populations which merits further investigation. Additional analysis is recommended to determine the significance of Wellness Center usage in the presence of other variables known to impact a student’s academic performance, such as high school GPA and ACT scores. Use of results: Emerging research is leading to growing investigations of the relationship between academic success and recreational participation. The Wellness Center will continue to explore and further analyze this relationship in an effort to gain more support to strengthen the messages aimed at encouraging recreational participation to our student community. The Wellness Center is also interested in broadening the variables that are investigated in this relationship. The results obtained will be used in educational campaigns targeted at our student population through outreach efforts and programs.
3/4/2015 5
ATTACHMENT A
Wellness Center
SALA Rubrics
3/4/2015 6

EXECUTE TASKS TO COMPLETION1 Employers value employees who understand and possess a willingness to work hard. In addition to working hard, it is also important to work smart. This means learning the most efficient way to complete tasks and finding ways to save time while completing daily assignments. Doing more than is expected on the job is a good way to show management that you utilize good time management skills and do not waste valuable company time attending to personal issues not related to the job.
Please indicate if there has been a change in each are below from the time you started at the Wellness Center until now on a scale of 1-5, 5 being highest.
Results -
Beginning Skill (1) Proficient Skill (5) Start of employment
End of employment
Average change
Ability to Prioritize and Plan – Creating a Plan
Unsure how to create a plan to complete a project.
Professional ability to create an efficient plan to complete a project.
4.00 4.80 0.80
Taking action Needs specific step-by-step instructions / direction from supervisor to start /complete a project.
Ability to recognize what needs to be done and execute a plan proficiently without supervision.
4.20 4.80 0.60
Obtaining resources Needs assistance with identifying and obtaining basic resources needed to complete a project.
Seeks out and finds on own, additional resources needed to complete a project.
4.00 4.80 0.80
Use of time
Difficulty recognizing tasks that needs to be completed.
Efficiently completes projects and prioritizes tasks
4.40 4.80 0.40
Transferable skill for your inventory of skills – resume information – interview example
- I have always been a very hard worker. I like to be busy so I find it easy to stay on task. When I became an assistant teacher, the amount of responsibility had increased. I love feeling important while working.
- Getting ready for snack takes a plan and so does doing diaper changes. - After being show what to do I knew what needed to be shown for the next time.
1 Modified and adapted from https://www.studentvoice.com/app/ClientWeb/Rubrics
3/4/2015 7

SERVICE Whether it is service to customers or service to fellow employees, the ability to serve is a basic work skill required in all work settings. High levels of customer service skills are likely to attract a growing premium in the labor market, as employers seek competitive advantage. Customer service is also likely to become of growing national economic importance as the skill-set forms a crucial ingredient in a businesses’ ability to attract repeat business.
Please indicate if there has been a change in each are below from the time you started at the Wellness Center until now on a scale of 1-5, 5 being highest.
Results -
Beginning Skill (1) Proficient Skill (5) Start of employment
End of employment
Average change
Knowledge of policies/ procedures and information provided in office/department / area
Unsure about policies / procedures that exist within the department.
Confident about the policies / procedures and information provided within department area and why they exist. 2.20 4.80 2.60
Response to Customers / customer questions
Unsure, seeks assistance to provide accurate information
Customer’s questions are welcomed and clearly answered with accurate information. 2.80 4.40 1.60
Approachability / Interaction / Relationships
Quiet, uncomfortable interacting with unfamiliar customers. Has difficulty demonstrating professional relationships with co-workers, supervisors and customers
Welcoming and proactively greets customers, invites customer interaction. Communicates with appropriate language and demonstrates appropriate behavior 4.40 4.80 0.40
Difficult Customers
Nervous about dealing with a difficult customer / waits for a situation to resolve itself.
Handles difficult customers with ease Responds quickly and appropriately to crisis situations Proactively identifies and addresses problems
3.60 4.00 0.40
Transferable skill for your inventory of skills – resume information – interview example
- I feel I become more comfortable with customers after getting to know more and more of the parents.
- I feel I became very comfortable working with other staff and interacting w/children and their parents. I have always been a very personable person, but I could definitely see a change in myself over the two years.
- When someone calls the daycare with a questions, I can politely answer it or get a supervisor.
3/4/2015 8

CONFLICT RESOLUTION2 In an ever-changing world, conflict can occur within the workplace, amongst employees, or between customers and employees. Resolving conflict in the workplace is an important skill that can contribute to improving the working climate, as well as creating a positive perception about customer service. Employers seek to find individuals who can succeed diplomatically in working through conflict, while providing solutions to resolve matters succinctly and effectively, in order to advance the delivery of the business and its services.
Please indicate if there has been a change in each are below from the time you started at the Wellness Center until now on a scale of 1-5, 5 being highest.
Results -
Beginning Skill (1) Proficient Skill (5) Start of employment
End of employment
Average change
Identify Conflict Difficulty recognizing the conflict or the reason for the conflict.
Can clearly recognize a conflict and state the reasons for the conflict.
3.20 4.60 1.40
Analyze/identify Solutions Seeks assistance from supervisor without an effort to identify a solution independently.
Able to analyze difficult situations and clearly identify a solution on your own.
3.00
4.80 1.80
Choose/Implement Solution
Difficulty getting involved waits for others to implement.
Willing and able to take action or implement a solution.
3.00 4.80 1.80
Reflection on Solution
Not performed Can evaluate the outcome of a resolution and make adjustments to maximize benefit.
2.80 4.60 1.80
Transferable skill for your inventory of skills – resume information – interview example
-I can solve conflicts with what I have learned from the Nutured Heart class that I took as a part of employment. -Over the course of 2 years, I learned a great deal about the Nurtured Heart approach. I love seeing how positive the children react to it. The Nurtured Heart approach was used as a way to positively reinforce the kids. -I feel that I can help children in multiple ways, when help is needed.
4 Modified and adapted from Utah Education Network – Cause and Effect Rubric for Conflict Resolution
3/4/2015 9
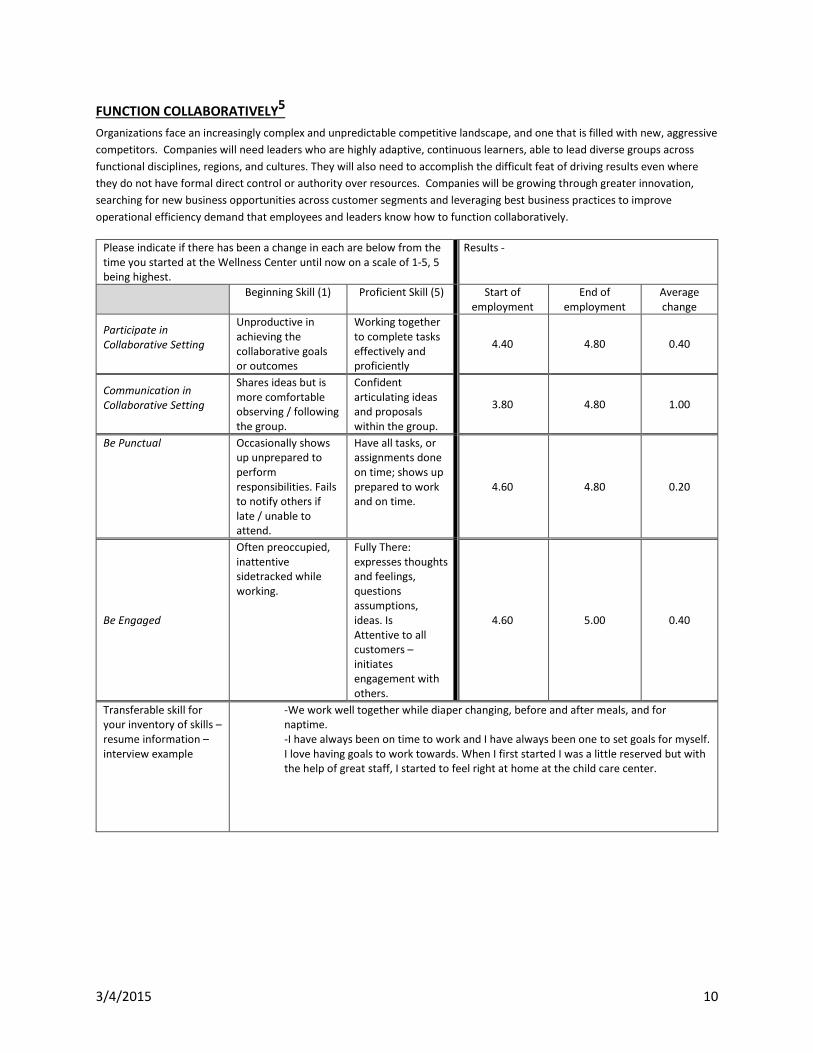
FUNCTION COLLABORATIVELY5 Organizations face an increasingly complex and unpredictable competitive landscape, and one that is filled with new, aggressive competitors. Companies will need leaders who are highly adaptive, continuous learners, able to lead diverse groups across functional disciplines, regions, and cultures. They will also need to accomplish the difficult feat of driving results even where they do not have formal direct control or authority over resources. Companies will be growing through greater innovation, searching for new business opportunities across customer segments and leveraging best business practices to improve operational efficiency demand that employees and leaders know how to function collaboratively.
Please indicate if there has been a change in each are below from the time you started at the Wellness Center until now on a scale of 1-5, 5 being highest.
Results -
Beginning Skill (1) Proficient Skill (5) Start of employment
End of employment
Average change
Participate in Collaborative Setting
Unproductive in achieving the collaborative goals or outcomes
Working together to complete tasks effectively and proficiently
4.40 4.80 0.40
Communication in Collaborative Setting
Shares ideas but is more comfortable observing / following the group.
Confident articulating ideas and proposals within the group.
3.80 4.80 1.00
Be Punctual Occasionally shows up unprepared to perform responsibilities. Fails to notify others if late / unable to attend.
Have all tasks, or assignments done on time; shows up prepared to work and on time.
4.60 4.80 0.20
Be Engaged
Often preoccupied, inattentive sidetracked while working.
Fully There: expresses thoughts and feelings, questions assumptions, ideas. Is Attentive to all customers – initiates engagement with others.
4.60 5.00 0.40
Transferable skill for your inventory of skills – resume information – interview example
-We work well together while diaper changing, before and after meals, and for naptime. -I have always been on time to work and I have always been one to set goals for myself. I love having goals to work towards. When I first started I was a little reserved but with the help of great staff, I started to feel right at home at the child care center.
3/4/2015 10

ATTACHMENT B
Wellness Center
Visit / Utilization Numbers
3/4/2015 11

Visit/Utilization Information for 2013-2014 OVERALL TOTAL VISITS: 07/01/2013-06/30/2014 = 390,883 MEMBERSHIP INFORMATION
Description 2013-14 2012-13 Difference
FS Payroll Deduct 319 316 3
Student Pass 10,802 10,644 605
Enrolled Summer Pass 1,160 962 198
AssocFall 23
19
4
Dual Fall 213 186 27
Fac/Staff Fall 21
15
6
AssocSpring 25
25
0
Dual Spring 215 235 (20)
Fac/Staff Spring 14 20 (6)
AssocSummer 14 12 2
Dualsummer 135 97 38
Student Summer Paid 377 330 47
Fac/Staff Summer 19 9 10
Associate Annual 42 38 4
3/4/2015 12
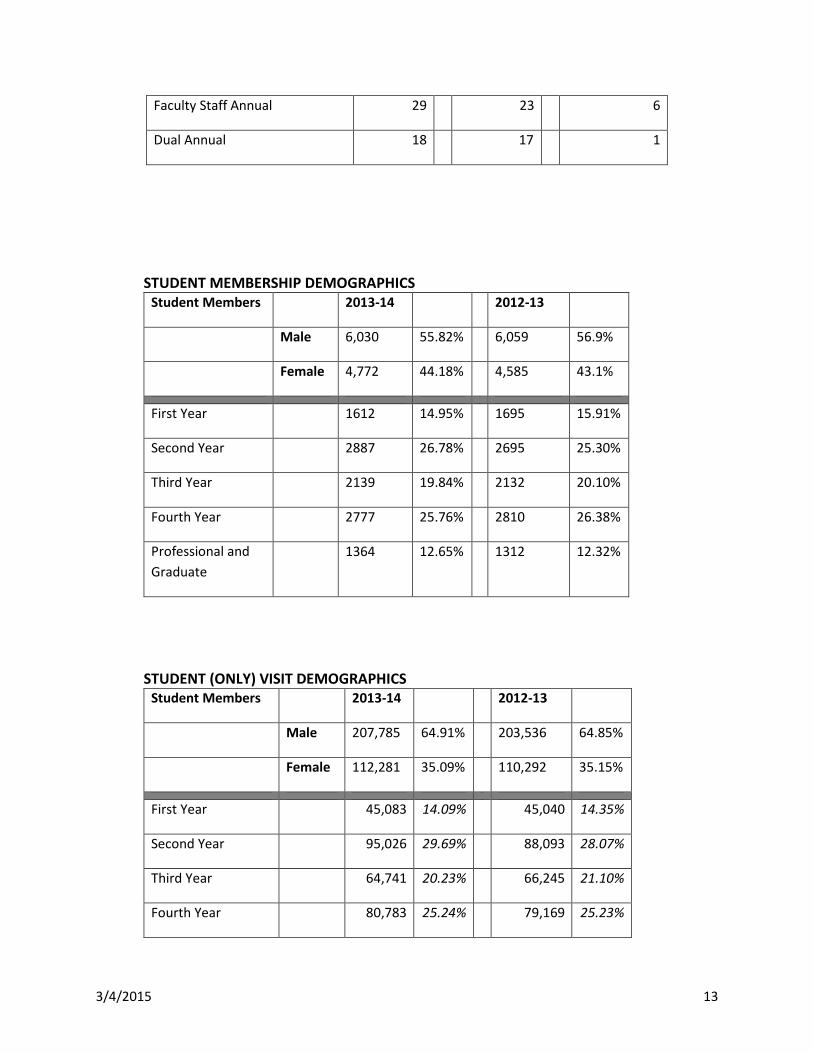
Faculty Staff Annual 29 23 6
Dual Annual 18 17 1
STUDENT MEMBERSHIP DEMOGRAPHICS
Student Members 2013-14 2012-13
Male 6,030 55.82% 6,059 56.9%
Female 4,772 44.18% 4,585 43.1%
First Year 1612 14.95% 1695 15.91%
Second Year 2887 26.78% 2695 25.30%
Third Year 2139 19.84% 2132 20.10%
Fourth Year 2777 25.76% 2810 26.38%
Professional and Graduate
1364 12.65% 1312 12.32%
STUDENT (ONLY) VISIT DEMOGRAPHICS Student Members 2013-14 2012-13
Male 207,785 64.91% 203,536 64.85%
Female 112,281 35.09% 110,292 35.15%
First Year 45,083 14.09% 45,040 14.35%
Second Year 95,026 29.69% 88,093 28.07%
Third Year 64,741 20.23% 66,245 21.10%
Fourth Year 80,783 25.24% 79,169 25.23%
3/4/2015 13
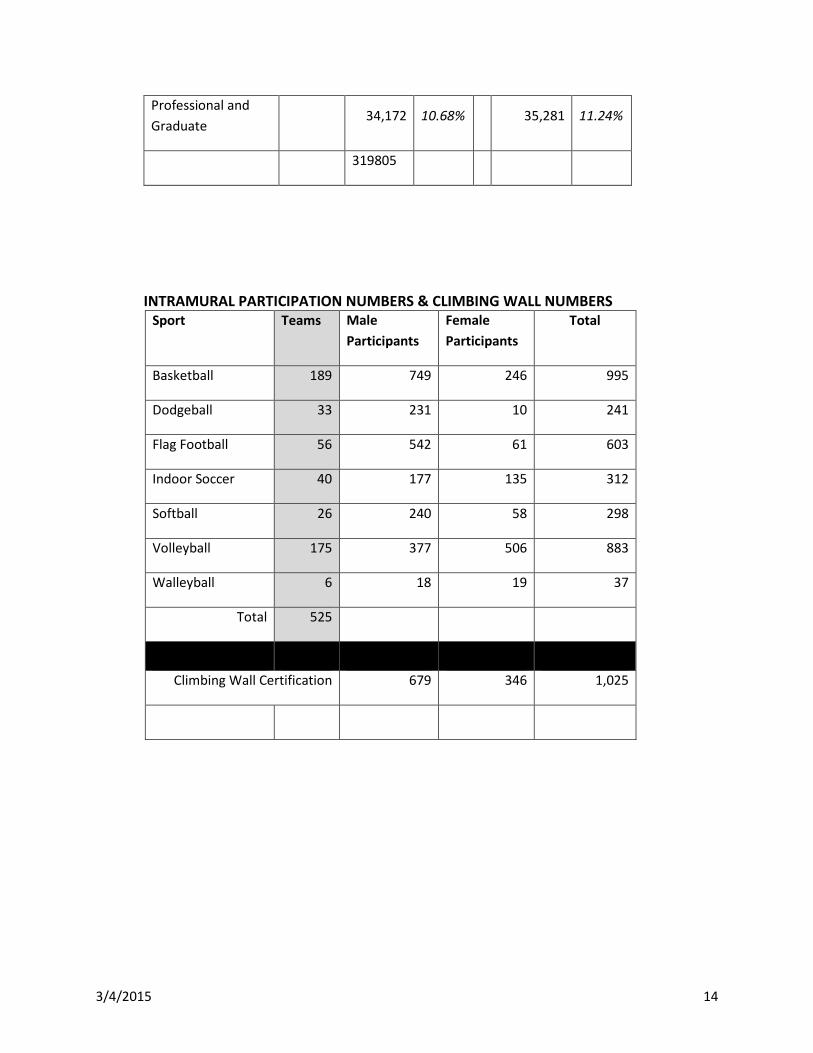
Professional and Graduate
34,172 10.68% 35,281 11.24%
319805
INTRAMURAL PARTICIPATION NUMBERS & CLIMBING WALL NUMBERS
Sport Teams Male Participants
Female Participants
Total
Basketball 189 749 246 995
Dodgeball 33 231 10 241
Flag Football 56 542 61 603
Indoor Soccer 40 177 135 312
Softball 26 240 58 298
Volleyball 175 377 506 883
Walleyball 6 18 19 37
Total 525
Climbing Wall Certification 679 346 1,025
3/4/2015 14
ATTACHMENT C
Wellness Center Customer Service Surveys
3/4/2015 15
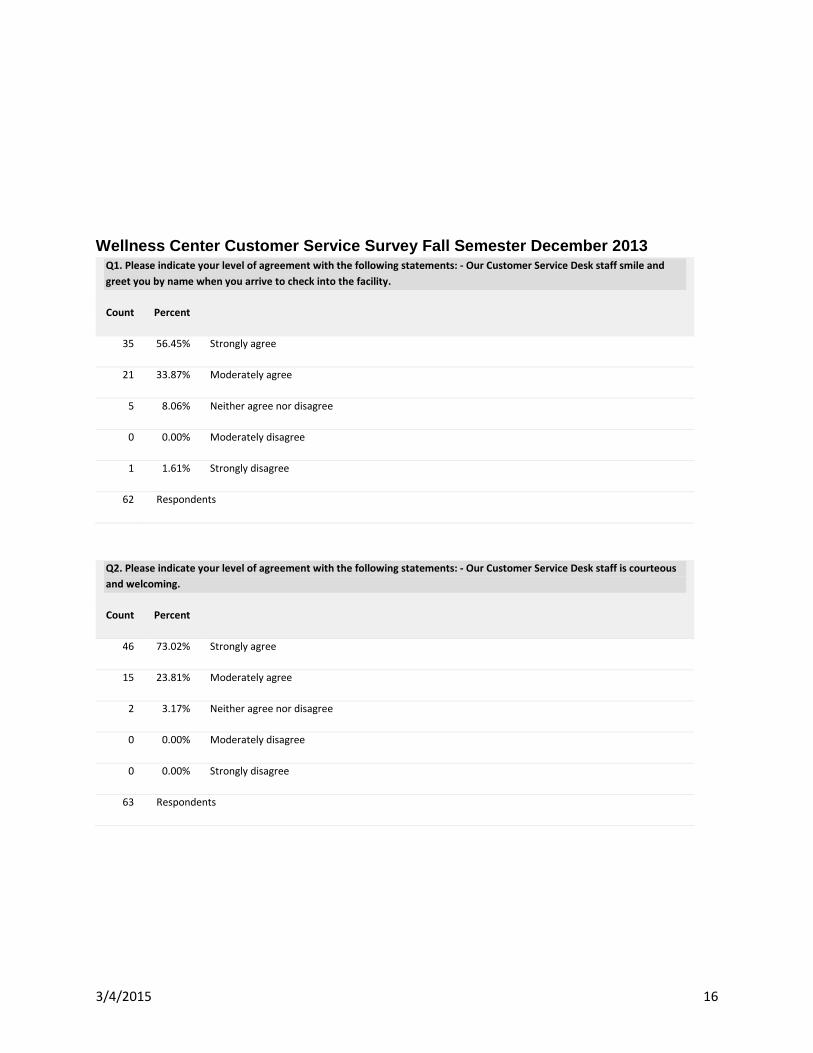
Wellness Center Customer Service Survey Fall Semester December 2013 Q1. Please indicate your level of agreement with the following statements: - Our Customer Service Desk staff smile and greet you by name when you arrive to check into the facility.
Count Percent
35 56.45% Strongly agree
21 33.87% Moderately agree
5 8.06% Neither agree nor disagree
0 0.00% Moderately disagree
1 1.61% Strongly disagree
62 Respondents
Q2. Please indicate your level of agreement with the following statements: - Our Customer Service Desk staff is courteous and welcoming.
Count Percent
46 73.02% Strongly agree
15 23.81% Moderately agree
2 3.17% Neither agree nor disagree
0 0.00% Moderately disagree
0 0.00% Strongly disagree
63 Respondents
3/4/2015 16
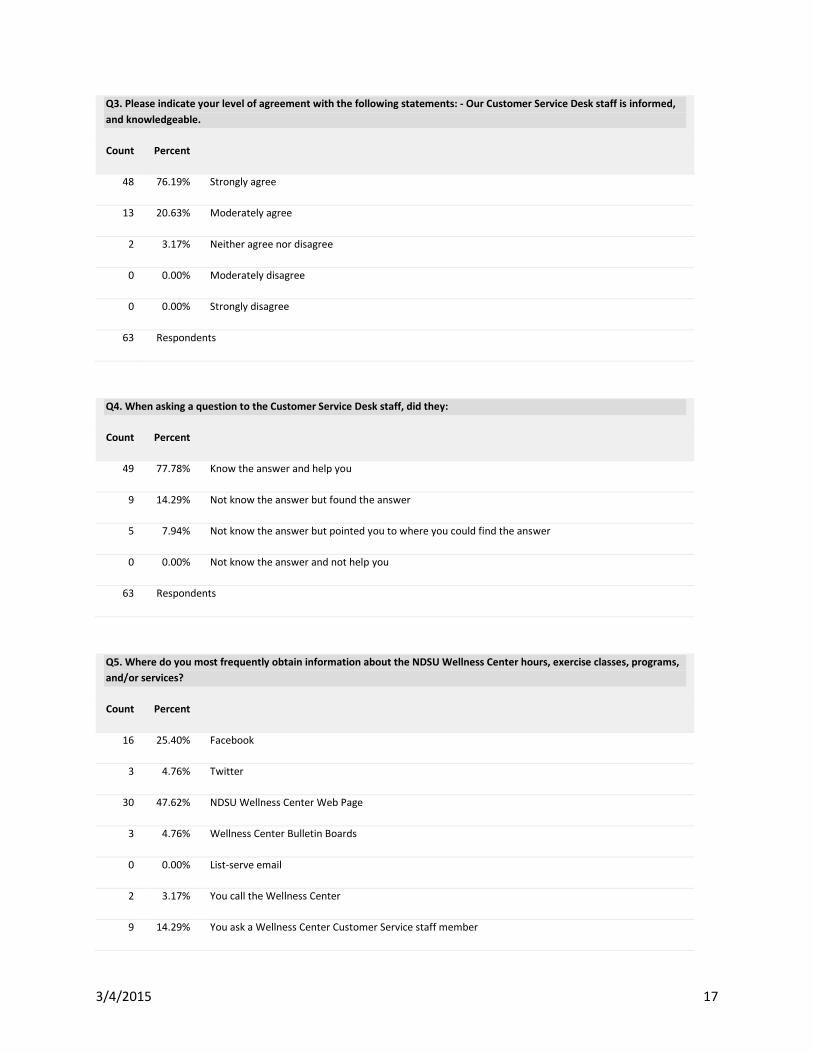
Q3. Please indicate your level of agreement with the following statements: - Our Customer Service Desk staff is informed, and knowledgeable.
Count Percent
48 76.19% Strongly agree
13 20.63% Moderately agree
2 3.17% Neither agree nor disagree
0 0.00% Moderately disagree
0 0.00% Strongly disagree
63 Respondents
Q4. When asking a question to the Customer Service Desk staff, did they:
Count Percent
49 77.78% Know the answer and help you
9 14.29% Not know the answer but found the answer
5 7.94% Not know the answer but pointed you to where you could find the answer
0 0.00% Not know the answer and not help you
63 Respondents
Q5. Where do you most frequently obtain information about the NDSU Wellness Center hours, exercise classes, programs, and/or services?
Count Percent
16 25.40% Facebook
3 4.76% Twitter
30 47.62% NDSU Wellness Center Web Page
3 4.76% Wellness Center Bulletin Boards
0 0.00% List-serve email
2 3.17% You call the Wellness Center
9 14.29% You ask a Wellness Center Customer Service staff member
3/4/2015 17
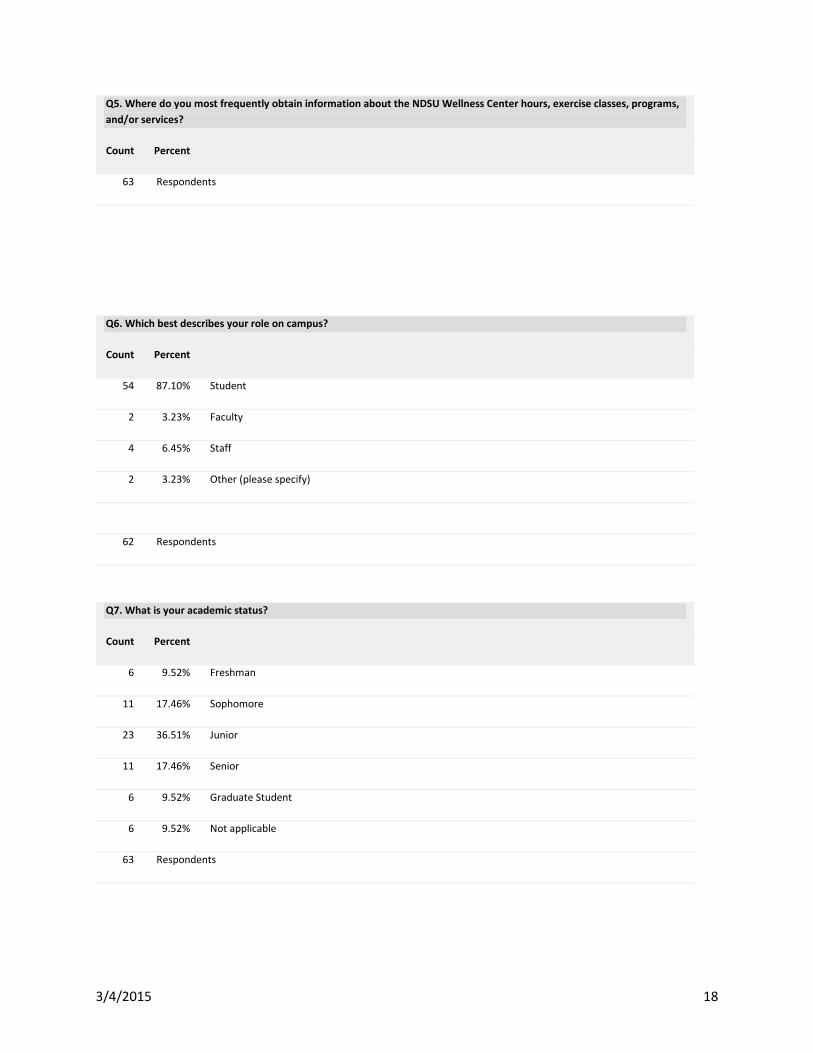
Q5. Where do you most frequently obtain information about the NDSU Wellness Center hours, exercise classes, programs, and/or services?
Count Percent
63 Respondents
Q6. Which best describes your role on campus?
Count Percent
54 87.10% Student
2 3.23% Faculty
4 6.45% Staff
2 3.23% Other (please specify)
62 Respondents
Q7. What is your academic status?
Count Percent
6 9.52% Freshman
11 17.46% Sophomore
23 36.51% Junior
11 17.46% Senior
6 9.52% Graduate Student
6 9.52% Not applicable
63 Respondents
3/4/2015 18

Wellness Center Customer Service Survey Spring Semester May 2014
Q1. Please indicate your level of agreement with the following statements: - Our Customer Service Desk staff smile and greet you by name when you arrive to check into the facility.
Count Percent
19 63.33% Strongly agree
10 33.33% Moderately agree
1 3.33% Neither agree nor disagree
0 0.00% Moderately disagree
0 0.00% Strongly disagree
30 Respondents
Q2. Please indicate your level of agreement with the following statements: - Our Customer Service Desk staff is courteous and welcoming.
Count Percent
21 72.41% Strongly agree
8 27.59% Moderately agree
0 0.00% Neither agree nor disagree
0 0.00% Moderately disagree
0 0.00% Strongly disagree
29 Respondents
3/4/2015 19

Q3. Please indicate your level of agreement with the following statements: - Our Customer Service Desk staff is informed, and knowledgeable.
Count Percent
22 75.86% Strongly agree
6 20.69% Moderately agree
1 3.45% Neither agree nor disagree
0 0.00% Moderately disagree
0 0.00% Strongly disagree
29 Respondents
Q4. When asking a question to the Customer Service Desk staff, did they:
Count Percent
23 79.31% Know the answer and help you
4 13.79% Not know the answer but found the answer
2 6.90% Not know the answer but pointed you to where you could find the answer
0 0.00% Not know the answer and not help you
29 Respondents
Q5. Where do you most frequently obtain information about the NDSU Wellness Center hours, exercise classes, programs, and/or services?
Count Percent
11 37.93% Facebook
3 10.34% Twitter
5 17.24% NDSU Wellness Center Web Page
0 0.00% Wellness Center Bulletin Boards
2 6.90% List-serve email
3 10.34% You call the Wellness Center
3/4/2015 20

Q5. Where do you most frequently obtain information about the NDSU Wellness Center hours, exercise classes, programs, and/or services?
Count Percent
5 17.24% You ask a Wellness Center Customer Service staff member
29 Respondents
Q6. Which best describes your role on campus?
Count Percent
25 86.21% Student
3 10.34% Faculty
0 0.00% Staff
1 3.45% Other (please specify)
29 Respondents
Q7. What is your academic status?
Count Percent
5 17.24% Freshman
6 20.69% Sophomore
9 31.03% Junior
3 10.34% Senior
2 6.90% Graduate Student
4 13.79% Not applicable
29 Respondents
3/4/2015 21
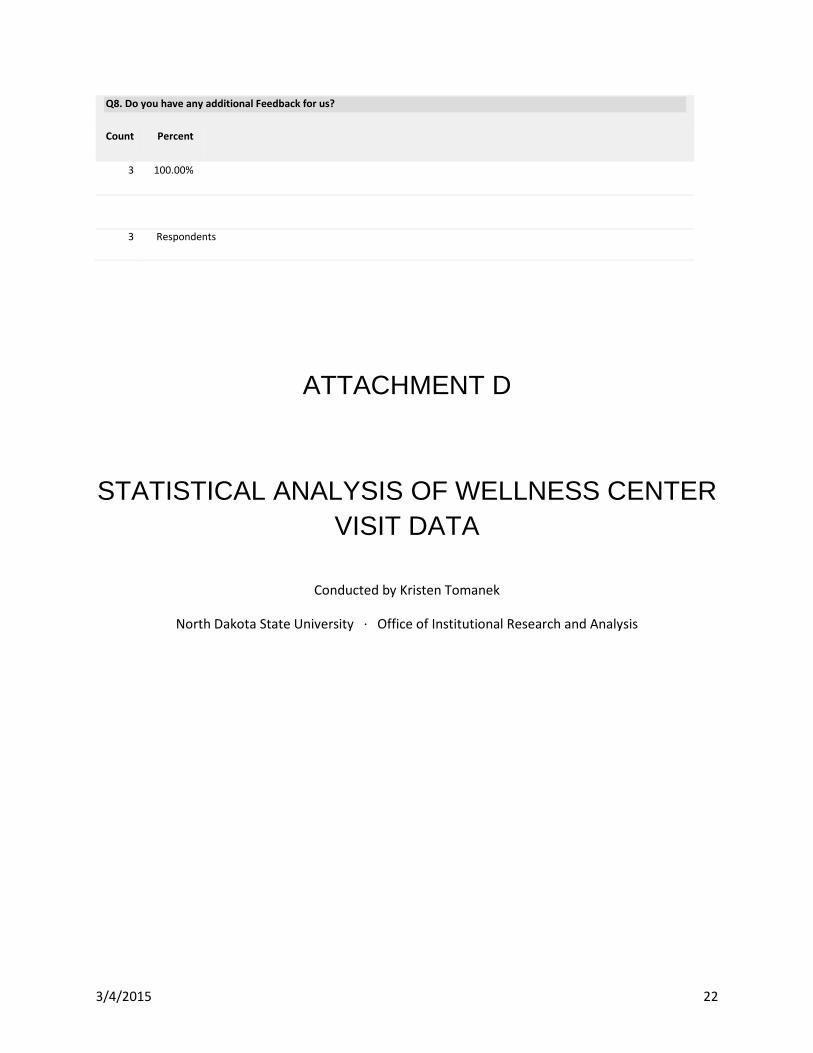
Q8. Do you have any additional Feedback for us?
Count Percent
3 100.00%
3 Respondents
ATTACHMENT D
STATISTICAL ANALYSIS OF WELLNESS CENTER VISIT DATA
Conducted by Kristen Tomanek
North Dakota State University ∙ Office of Institutional Research and Analysis
3/4/2015 22

Wellness Center Visit Data Analyses
Data: Fall and spring census files ranging from fall 2007 through spring 2013 were used to establish student population files. Wellness Center visit data was provided by Viet Doan, in conjunction with Wellness Center administrators. The number of visits refers to the number of times a student gained admittance to the Wellness Center for the respective fall or spring term. Professional students, graduate students, and non-degree seeking undergraduate students were excluded from the analyses. Summary: There was found to be a statistically significant difference in the mean term GPA of undergraduate degree-seeking students who visited the Wellness Center and undergraduate degree-seeking students who did not visit the Wellness Center. On average, students who visited the Wellness Center at least once in a given term earned a term GPA 0.129 points higher than those who did not visit the Wellness Center. Further analysis of term GPA by academic level indicated the largest disparity in mean term GPA was that of undergraduate degree-seeking freshman, with students who visited the Wellness Center earning a term GPA, on average, 0.381 points higher than those freshman students who did not visit the Wellness Center. Paired comparison tests were also performed to analyze the change in term GPA from fall to spring terms (term-to-term analysis) and fall to fall terms (year-to-year analysis). As expected, there was found to be a statistically significant difference in the mean term GPA of students who attended the Wellness Center and those who did not visit the Wellness Center. Further detailed comparisons are provided in the following report. Based on these analyses, there appears to be fairly strong evidence suggesting there is a difference in term GPA for students who visit the Wellness Center and those who do not visit the Wellness Center. We cannot say term GPA is a direct result of usage of the Wellness Center, however, there is clearly a difference in these student populations which merits further investigation. Additional analysis is recommended to determine the significance of Wellness Center usage in the presence of other variables known to impact a student’s academic performance, such as high school GPA and ACT scores.
3/4/2015 23
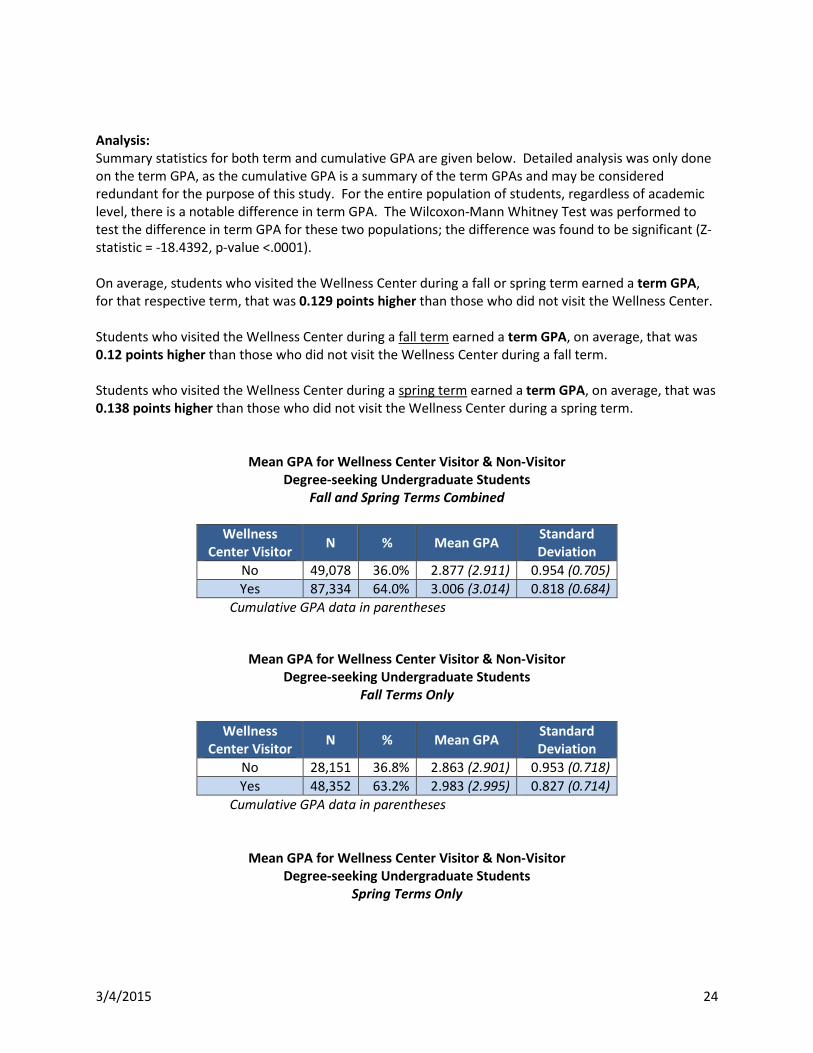
Analysis: Summary statistics for both term and cumulative GPA are given below. Detailed analysis was only done on the term GPA, as the cumulative GPA is a summary of the term GPAs and may be considered redundant for the purpose of this study. For the entire population of students, regardless of academic level, there is a notable difference in term GPA. The Wilcoxon-Mann Whitney Test was performed to test the difference in term GPA for these two populations; the difference was found to be significant (Z-statistic = -18.4392, p-value <.0001). On average, students who visited the Wellness Center during a fall or spring term earned a term GPA, for that respective term, that was 0.129 points higher than those who did not visit the Wellness Center. Students who visited the Wellness Center during a fall term earned a term GPA, on average, that was 0.12 points higher than those who did not visit the Wellness Center during a fall term. Students who visited the Wellness Center during a spring term earned a term GPA, on average, that was 0.138 points higher than those who did not visit the Wellness Center during a spring term.
Mean GPA for Wellness Center Visitor & Non-Visitor Degree-seeking Undergraduate Students
Fall and Spring Terms Combined
Wellness Center Visitor N % Mean GPA Standard
Deviation No 49,078 36.0% 2.877 (2.911) 0.954 (0.705) Yes 87,334 64.0% 3.006 (3.014) 0.818 (0.684)
Cumulative GPA data in parentheses
Mean GPA for Wellness Center Visitor & Non-Visitor Degree-seeking Undergraduate Students
Fall Terms Only
Wellness Center Visitor N % Mean GPA Standard
Deviation No 28,151 36.8% 2.863 (2.901) 0.953 (0.718) Yes 48,352 63.2% 2.983 (2.995) 0.827 (0.714)
Cumulative GPA data in parentheses
Mean GPA for Wellness Center Visitor & Non-Visitor
Degree-seeking Undergraduate Students Spring Terms Only
3/4/2015 24

Wellness Center Visitor N % Mean GPA Standard
Deviation No 20,927 34.9% 2.896 (2.924) 0.955 (0.686) Yes 38,982 65.1% 3.034 (3.037) 0.805 (0.644)
Cumulative GPA data in parentheses
Controlling for student academic level, the disparity in term GPA is more obvious. The Wilcoxon-Mann Whitney Test was again conducted for each academic level, and as expected, all were found to be significant with the following test statistics and p-values:
• Freshman: Z statistic = -23.8853, p-value <.0001 • Sophomore: Z statistic = -21.9295, p-value <.0001 • Junior: Z statistic = -15.0784, p-value <.0001 • Senior: Z statistic = -14.9610, p-value <.0001
The largest difference is seen in the freshman population, with those who visited the Wellness Center during a fall or spring term earning a term GPA, on average, 0.381 points higher, for that respective term, than those who did not visit the Wellness Center. The smallest difference is seen in the senior population, with those who visited the Wellness Center during a fall or spring term earning a term GPA, on average, 0.15 points higher, for that respective term, than those who did not visit the Wellness Center. A summary of these differences are found below, along with plots showing a longitudinal display of term GPA by Wellness Center usage and term.
Mean Term GPA for Wellness Center Visitor & Non-Visitor by Academic Level
Degree-seeking Undergraduate Students Fall and Spring Terms Combined
Wellness Center Visitor
Freshmen Mean GPA N=32,666
Sophomore Mean GPA
N=33,675
Junior Mean GPA N=28,733
Senior Mean GPA N=41,338
No 2.374 (21.2%)
2.736 (31.9%)
2.923 (39.2%)
3.099 (48.7%)
Yes 2.755 (78.8%)
2.986 (68.1%)
3.106 (60.8%)
3.249 (51.3%)
Difference (Yes-No) 0.381 0.25 0.183 0.15
Percent of population in parentheses
Mean Term GPA for Wellness Center Visitor & Non-Visitor by Academic Level Degree-seeking Undergraduate Students
Fall Terms Only
Wellness Center Visitor
Freshmen Mean GPA N=20,565
Sophomore Mean GPA
N=18,750
Junior Mean GPA N=15,533
Senior Mean GPA N=21,655
No 2.365 2.744 2.919 3.086
3/4/2015 25
(20.3%) (34.2%) (41.4%) (51.5%)
Yes 2.764 (79.7%)
2.971 (65.8%)
3.100 (58.6%)
3.237 (48.5%)
Difference (Yes-No) 0.399 0.227 0.181 0.151
Percent of population in parentheses
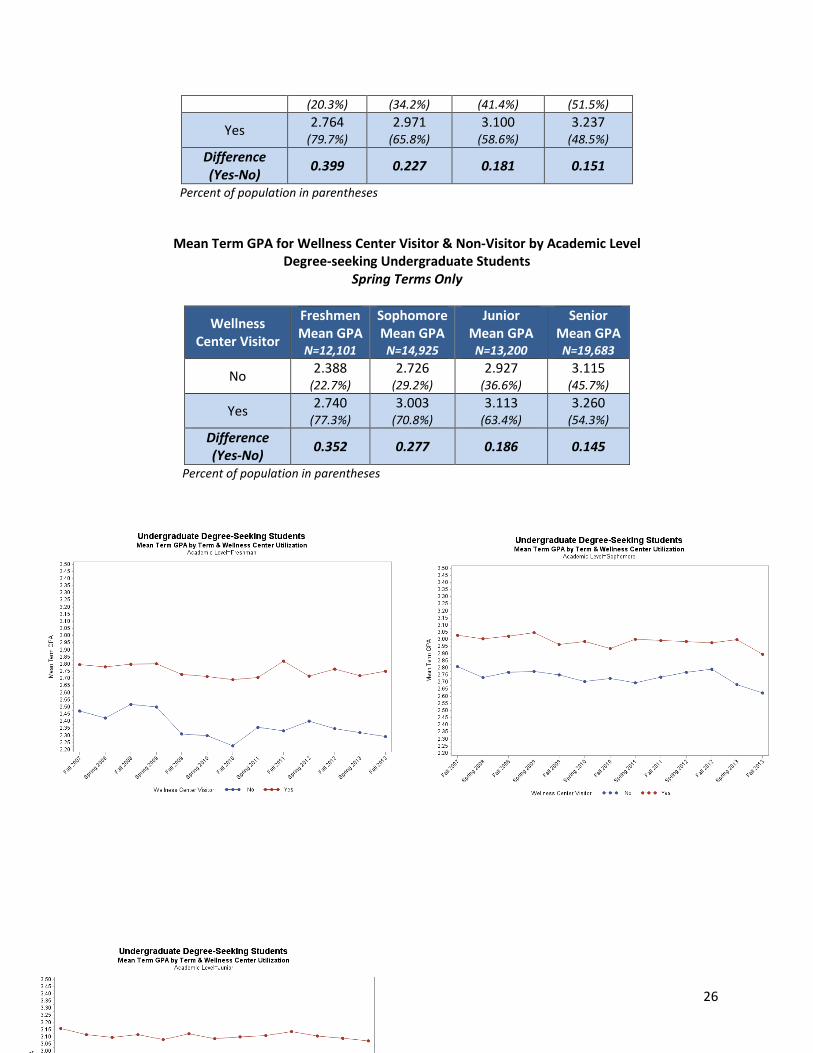
Mean Term GPA for Wellness Center Visitor & Non-Visitor by Academic Level Degree-seeking Undergraduate Students
Spring Terms Only
Wellness Center Visitor
Freshmen Mean GPA N=12,101
Sophomore Mean GPA
N=14,925
Junior Mean GPA
N=13,200
Senior Mean GPA N=19,683
No 2.388 (22.7%)
2.726 (29.2%)
2.927 (36.6%)
3.115 (45.7%)
Yes 2.740 (77.3%)
3.003 (70.8%)
3.113 (63.4%)
3.260 (54.3%)
Difference (Yes-No) 0.352 0.277 0.186 0.145
Percent of population in parentheses
3/4/2015 26

For further analysis, Wellness Center visit data was divided among six categories: • 0 visits in a fall/spring term • 1-8 visits in a fall/spring term • 9-16 visits in a fall/spring term • 17-24 visits in a fall/spring term • 25-32 visits in a fall/spring term • 33+ visits in a fall/spring term
Summary statistics for both term and cumulative GPA are given below. As noted before, detailed analysis was only done on the term GPA as the cumulative GPA is a summary of the term GPAs and may be considered redundant for the purpose of this study. For the entire population, regardless of academic level, there is a notable difference in term GPA by visit category. The Kruskal-Wallis Test was performed to test the difference in term GPA for these six categories; the difference was found to be significant (Chi-squared statistic 1235.5343, p-value <.0001).
Mean GPA by Visit Category
Degree-seeking Undergraduate Students Fall and Spring Combined
# Visits N % Mean GPA Standard Deviation
0 49,078 36.0% 2.877 (2.911) 0.954 (0.705) 1-8 36,753 26.9% 2.918 (2.938) 0.863 (0.708)
9-16 16,388 12.0% 2.999 (3.006) 0.811 (0.687) 17-24 10,327 7.6% 3.047 (3.049) 0.774 (0.661)
3/4/2015 27

25-32 7,366 5.4% 3.088 (3.085) 0.777 (0.661) 33+ 16,500 12.1% 3.145 (3.135) 0.735 (0.624)
Cumulative GPA data in parentheses
Mean GPA by Visit Category Degree-seeking Undergraduate Students
Fall Terms Only
# Visits N % Mean GPA Standard Deviation
0 28,151 36.8% 2.863 (2.901) 0.953 (0.718) 1-8 20,923 27.3% 2.900 (2.923) 0.870 (0.737)
9-16 9,272 12.1% 2.969 (2.982) 0.827 (0.720) 17-24 5,686 7.4% 3.023 (3.030) 0.791 (0.694) 25-32 3,933 5.1% 3.083 (3.075) 0.773 (0.684) 33+ 8,538 11.2% 3.129 (3.123) 0.736 (0.648)
Cumulative GPA data in parentheses
Mean GPA by Visit Category Degree-seeking Undergraduate Students
Spring Terms Only
# Visits N % Mean GPA Standard Deviation
0 20,927 34.9% 2.896 (2.924) 0.955 (0.686) 1-8 15,830 26.4% 2.942 (2.958) 0.853 (0.667)
9-16 7,116 11.9% 3.038 (3.037) 0.788 (0.641) 17-24 4,641 7.7% 3.077 (3.073) 0.752 (0.617) 25-32 3,433 5.7% 3.093 (3.096) 0.782 (0.634) 33+ 7,962 13.3% 3.162 (3.148) 0.734 (0.597)
Cumulative GPA data in parentheses When controlling for student academic level, the disparity in term GPA can clearly be seen. The Kruskal-Wallis Test was again conducted for each academic level, and as expected, all were found to be significant with the following test statistics and p-values:
• Freshman: Chi-squared statistic = 1,257.1064, p-value <.0001 • Sophomore: Chi-squared statistic = 789.7038, p-value <.0001 • Junior: Chi-squared statistic = 387.9356, p-value <.0001 • Senior: Chi-squared statistic = 327.9332, p-value <.0001
In general, the term GPA increased as the number of visits to the Wellness Center increased.
Mean Term GPA by Visit Category and Academic Level Degree-seeking Undergraduate Students
3/4/2015 28
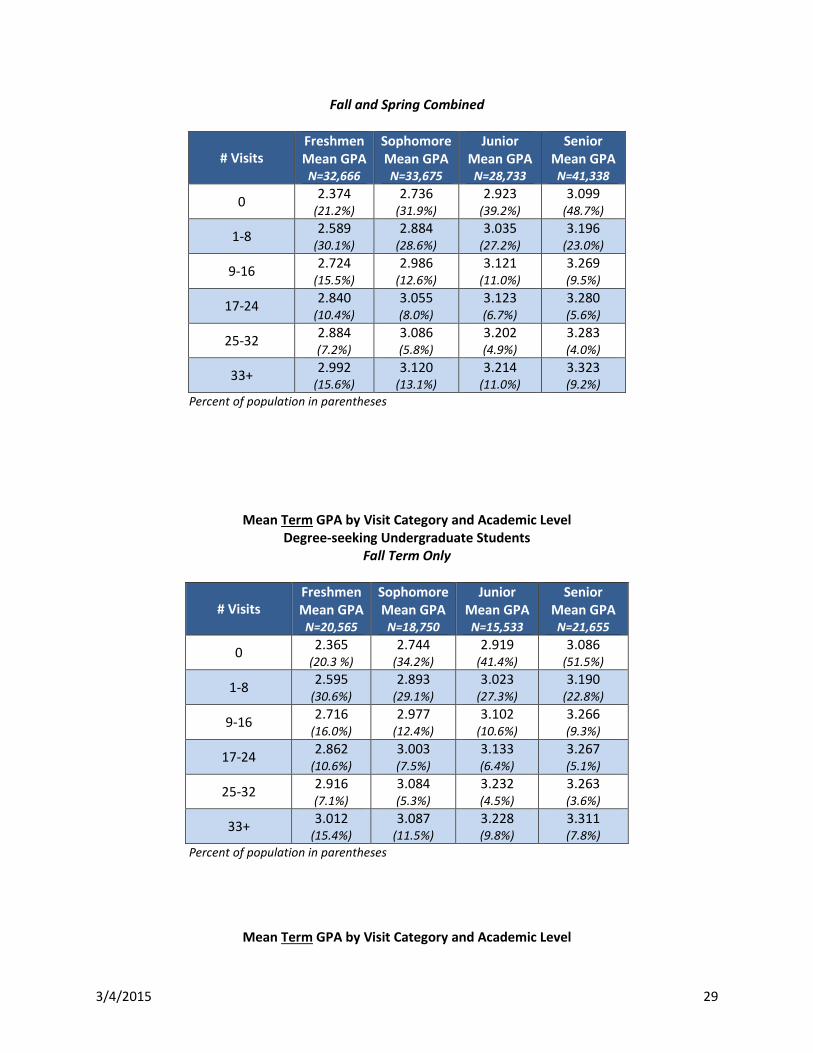
Fall and Spring Combined
# Visits Freshmen Mean GPA
N=32,666
Sophomore Mean GPA
N=33,675
Junior Mean GPA
N=28,733
Senior Mean GPA N=41,338
0 2.374 (21.2%)
2.736 (31.9%)
2.923 (39.2%)
3.099 (48.7%)
1-8 2.589 (30.1%)
2.884 (28.6%)
3.035 (27.2%)
3.196 (23.0%)
9-16 2.724 (15.5%)
2.986 (12.6%)
3.121 (11.0%)
3.269 (9.5%)
17-24 2.840 (10.4%)
3.055 (8.0%)
3.123 (6.7%)
3.280 (5.6%)
25-32 2.884 (7.2%)
3.086 (5.8%)
3.202 (4.9%)
3.283 (4.0%)
33+ 2.992 (15.6%)
3.120 (13.1%)
3.214 (11.0%)
3.323 (9.2%)
Percent of population in parentheses
Mean Term GPA by Visit Category and Academic Level Degree-seeking Undergraduate Students
Fall Term Only
# Visits Freshmen Mean GPA
N=20,565
Sophomore Mean GPA
N=18,750
Junior Mean GPA
N=15,533
Senior Mean GPA N=21,655
0 2.365 (20.3 %)
2.744 (34.2%)
2.919 (41.4%)
3.086 (51.5%)
1-8 2.595 (30.6%)
2.893 (29.1%)
3.023 (27.3%)
3.190 (22.8%)
9-16 2.716 (16.0%)
2.977 (12.4%)
3.102 (10.6%)
3.266 (9.3%)
17-24 2.862 (10.6%)
3.003 (7.5%)
3.133 (6.4%)
3.267 (5.1%)
25-32 2.916 (7.1%)
3.084 (5.3%)
3.232 (4.5%)
3.263 (3.6%)
33+ 3.012 (15.4%)
3.087 (11.5%)
3.228 (9.8%)
3.311 (7.8%)
Percent of population in parentheses
Mean Term GPA by Visit Category and Academic Level
3/4/2015 29
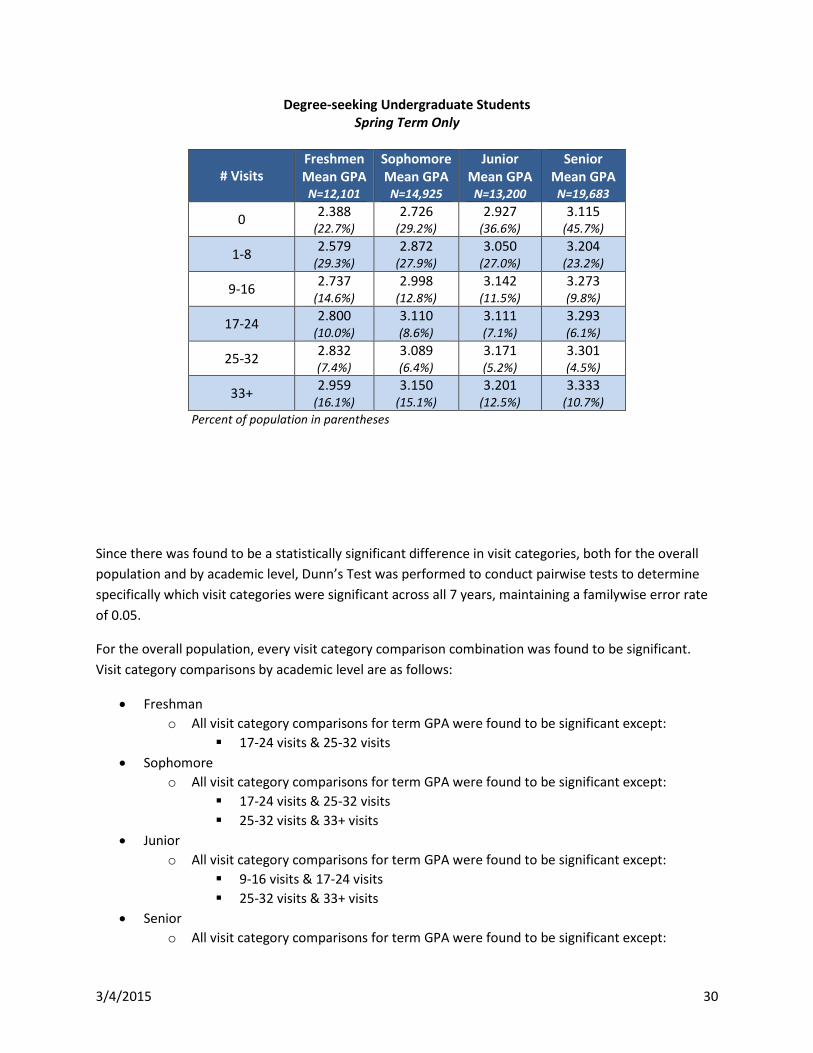
Degree-seeking Undergraduate Students Spring Term Only
# Visits Freshmen Mean GPA
N=12,101
Sophomore Mean GPA
N=14,925
Junior Mean GPA
N=13,200
Senior Mean GPA N=19,683
0 2.388 (22.7%)
2.726 (29.2%)
2.927 (36.6%)
3.115 (45.7%)
1-8 2.579 (29.3%)
2.872 (27.9%)
3.050 (27.0%)
3.204 (23.2%)
9-16 2.737 (14.6%)
2.998 (12.8%)
3.142 (11.5%)
3.273 (9.8%)
17-24 2.800 (10.0%)
3.110 (8.6%)
3.111 (7.1%)
3.293 (6.1%)
25-32 2.832 (7.4%)
3.089 (6.4%)
3.171 (5.2%)
3.301 (4.5%)
33+ 2.959 (16.1%)
3.150 (15.1%)
3.201 (12.5%)
3.333 (10.7%)
Percent of population in parentheses
Since there was found to be a statistically significant difference in visit categories, both for the overall population and by academic level, Dunn’s Test was performed to conduct pairwise tests to determine specifically which visit categories were significant across all 7 years, maintaining a familywise error rate of 0.05.
For the overall population, every visit category comparison combination was found to be significant. Visit category comparisons by academic level are as follows:
• Freshman o All visit category comparisons for term GPA were found to be significant except:
17-24 visits & 25-32 visits • Sophomore
o All visit category comparisons for term GPA were found to be significant except: 17-24 visits & 25-32 visits 25-32 visits & 33+ visits
• Junior o All visit category comparisons for term GPA were found to be significant except:
9-16 visits & 17-24 visits 25-32 visits & 33+ visits
• Senior o All visit category comparisons for term GPA were found to be significant except:
3/4/2015 30
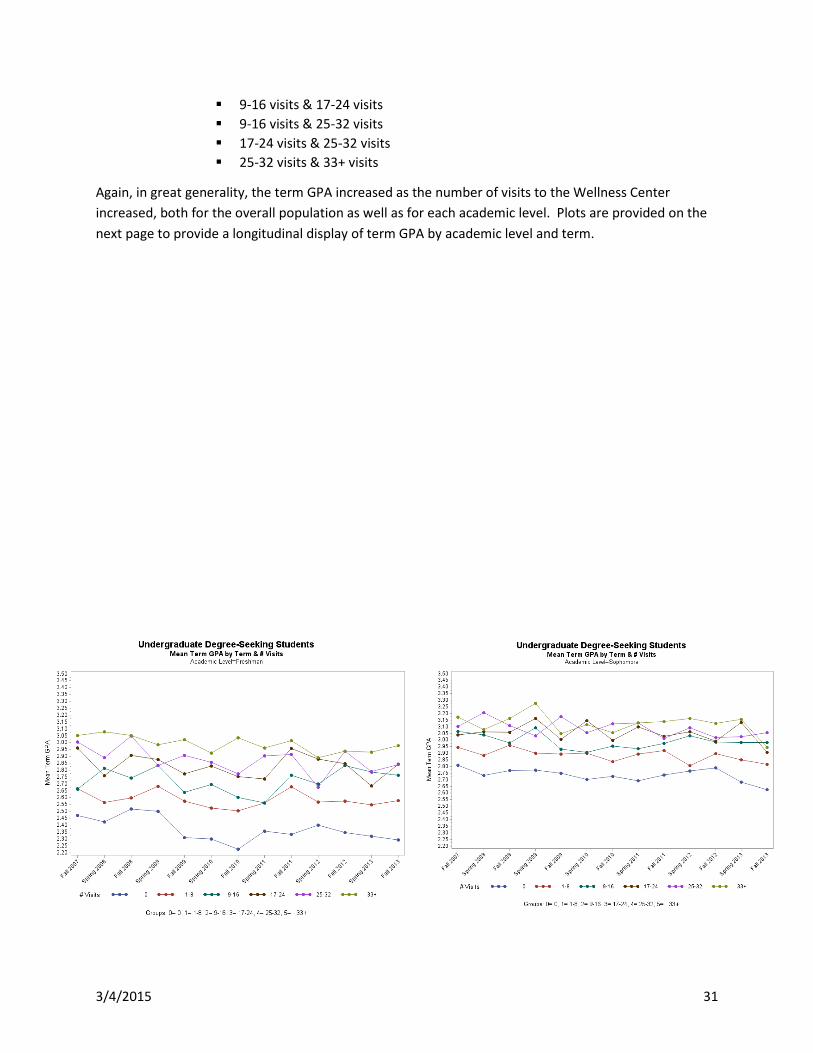
9-16 visits & 17-24 visits 9-16 visits & 25-32 visits 17-24 visits & 25-32 visits 25-32 visits & 33+ visits
Again, in great generality, the term GPA increased as the number of visits to the Wellness Center increased, both for the overall population as well as for each academic level. Plots are provided on the next page to provide a longitudinal display of term GPA by academic level and term.
3/4/2015 31
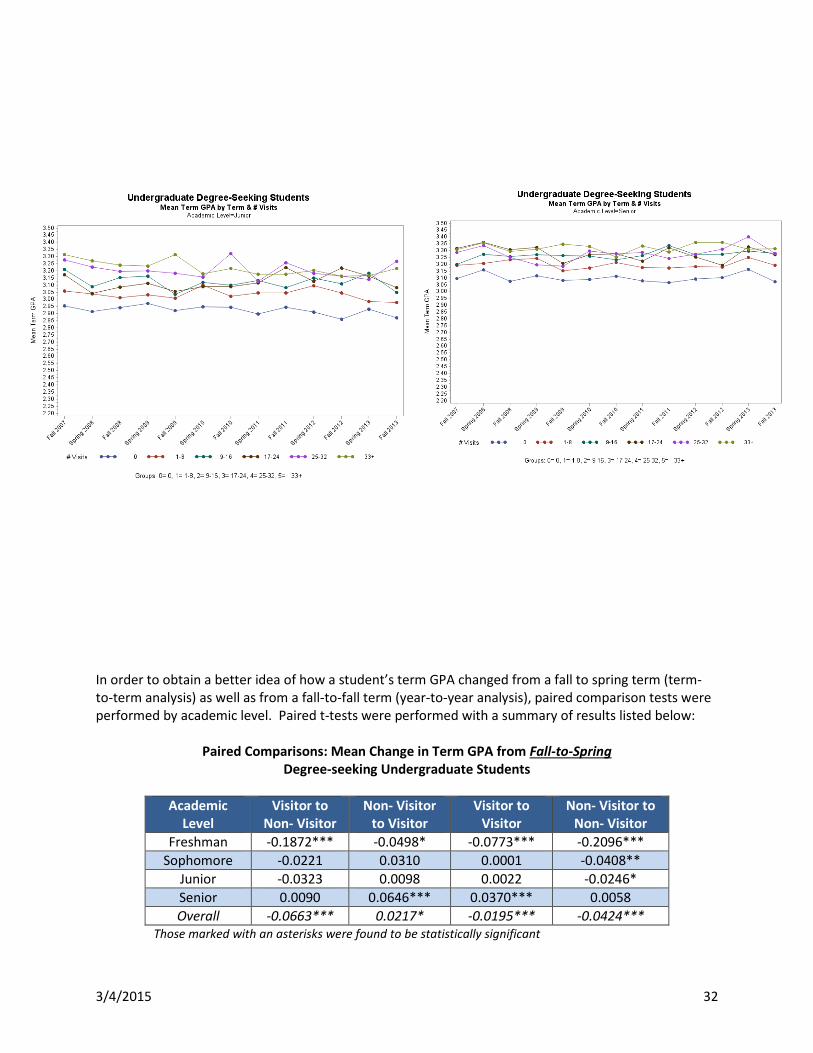
In order to obtain a better idea of how a student’s term GPA changed from a fall to spring term (term-to-term analysis) as well as from a fall-to-fall term (year-to-year analysis), paired comparison tests were performed by academic level. Paired t-tests were performed with a summary of results listed below:
Paired Comparisons: Mean Change in Term GPA from Fall-to-Spring
Degree-seeking Undergraduate Students
Academic Level
Visitor to Non- Visitor
Non- Visitor to Visitor
Visitor to Visitor
Non- Visitor to Non- Visitor
Freshman -0.1872*** -0.0498* -0.0773*** -0.2096*** Sophomore -0.0221 0.0310 0.0001 -0.0408**
Junior -0.0323 0.0098 0.0022 -0.0246* Senior 0.0090 0.0646*** 0.0370*** 0.0058 Overall -0.0663*** 0.0217* -0.0195*** -0.0424***
Those marked with an asterisks were found to be statistically significant
3/4/2015 32

* .01 < p-value < .05 , Moderately significant ** 0.001 < p < .01, Strong evidence suggesting a difference *** p-value <.0001 Overwhelming evidence suggesting a difference
In general, freshmen term GPA decreased from fall semester to spring semester, however, freshmen who visited the Wellness Center saw a significantly smaller decrease in term GPA. The only significant difference in term GPA for sophomores and juniors were students who did not visit the Wellness Center both fall and spring terms. Looking at the overall population, students who visited the Wellness Center in the fall term and did not the following spring saw the largest decrease in term GPA, -0.0663.
Paired Comparisons: Mean Change in Term GPA from Fall-to-Fall
Degree-seeking Undergraduate Students
Academic Level
Visitor to Non- Visitor
Non- Visitor to Visitor
Visitor to Visitor
Non- Visitor to Non- Visitor
Freshman -0.2026*** -0.0642* -0.1090*** -0.1764*** Sophomore -0.0573** 0.0208 -0.0107 -0.0547**
Junior -0.0503** 0.0024 0.0186* -0.0175 Senior -0.0353 0.0383 0.0307* -0.0178 Overall -0.1034*** 0.0018 -0.0355*** -0.0518***
Those marked with an asterisks were found to be statistically significant * .01 < p-value < .05 , Moderately significant ** 0.001 < p < .01, Strong evidence suggesting a difference *** p-value <.0001 Overwhelming evidence suggesting a difference
Freshman term GPA decreased from fall semester to the following fall semester, however, freshmen who visited the Wellness Center saw a significantly smaller decrease in term GPA. Sophomore students who visited the Wellness Center in the fall term and did not the following fall term, as well as those that did not visit the Wellness Center both fall terms, saw the largest decrease in term GPA. In general, students who visited the Wellness Center both fall terms saw the smallest decrease in term GPA.
3/4/2015 33