representing social influencers and influence …...representing social influencers and...
TRANSCRIPT

Appl. Math. Inf. Sci.9, No. 5, 2453-2465 (2015) 2453
Applied Mathematics & Information SciencesAn International Journal
http://dx.doi.org/10.12785/amis/090529
Representing Social Influencers and Influence usingPower-Law GraphsChiara Francalanci, Ajaz Hussain∗ and Francesco Merlo
Department of Electronics, Information and Bio-Engineering, Politecnico di Milano, I - 20133 Milano, Italy
Received: 30 Jan. 2015, Revised: 1 May 2015, Accepted: 2 May 2015Published online: 1 Sep. 2015
Abstract: This paper focuses on semantic networks that represent the user opinions expressed by social media users on a given setof topics. These networks are found to follow a power-law degree distribution of nodes, with a few hub nodes and a long tailofperipheral nodes. While there exist consolidated approaches supporting the identification and characterization of hub nodes, researchon the analysis of the multi-layered distribution of peripheral nodes is limited. In social media, hub nodes represent social influencers.However, the literature provides evidence of the multi-layered structure of influence networks, emphasizing the distinction betweeninfluencers and influence. The latter seems to spread following multi-hop paths across nodes in peripheral network layers. This paperproposes a visual approach to the graphical representationof peripheral layers. The core concept of our approach is to partition thenode set of a graph intohub andperipheral nodes. Then, a modified force-directed method is applied to clearly display localmulti-layered neighborhood clusters around hub nodes. Ourapproach is tested on a large sample of tweets from tourism domain. Ouralgorithm is visually compared with state-of-the-art network drawing techniques.
Keywords: Semantic networks,Power law graphs,Social media influencers,Social media influence,User Opinions
1 Introduction
Most network visualization methodologies and toolsfocus on identifying network hubs. Hubs represent centralnodes connecting sets of more peripheral nodes that arerather sparse and separate from each other, as discussedby [45]. Literature has focused on measuring centralityand provides a broad array of centrality metrics, each ofthem highlighting a different aspect of a hub’s prominentrole. As discussed by [19], degree centralitymeasures theabsolute number of connections of a node,closenesscentralitymeasures how far a node is from all other nodesin the network along the overall shortest paths, whilebetweenness centralityassesses the role of a node as ahub of information by analyzing the extent to which thenode connects separate subnetworks. These metricsrepresent the underlying concept of many networkvisualization tools. The assumption that most tools maketo visualize large networks is that hubs represent the maindriver of the structure of networks and, if they exist, theyshould be clearly highlighted to cope with complexity andobtain a nice and intuitive representation of the network.
The literature on social media makes a distinctionbetween influencers and influence [11,30]. The former
are social media users with a broad audience. Forexample, influencers can have a high number of followerson Twitter, or a multitude of friends onFacebook, or abroad array of connections onLinkedIn. The terminfluence is instead used to refer to the social impact ofthe content shared by social media users. The breadth ofthe audience was considered the first and foremostindicator of influence for traditional media, such astelevision or radio. However, traditional media are basedon broadcasting rather than communication, while socialmedia are truly interactive. It is very common thatinfluencers say something totally uninteresting and, as aconsequence, they obtain little or no attention. On thecontrary, if social media users are interested in something,they typically show it by participating in the conversationwith a variety of mechanisms and, most commonly, bysharing the content that they have liked. [8] has noted thata content that has had an impact on a user’s mindisshared. Influencers are prominent social media users, butwe cannot expect that the content that they share is boundto have high influence, as discussed by [6].
In previous research, Bruni et al. [10] has shown howthe content of messages can play a critical role and can be
∗ Corresponding author e-mail:[email protected]
c© 2015 NSPNatural Sciences Publishing Cor.

2454 C. Francalanci et al.: Representing Social Influencers and Influence...
a determinant of the social influence of a messageirrespective of the centrality of the message’s author.Results suggest that peripheral nodes can be influential:this paper starts from the observation made by [12] thatsocial networks of influence follow a power-lawdistribution function, with a few hub nodes and a long tailof peripheral nodes, consistent with the so-calledsmall-world phenomenon as noted by [45]. In socialmedia, hub nodes represent social influencers, butinfluential content can be generated by peripheral nodesand spread along possibly multi-hop paths originated inperipheral network layers.
The ultimate goal of our research is to understandhow influential content spreads across the network. Forthis purpose, identifying and positioning hub nodes is notsufficient, while we need an approach that supports theexploration of peripheral nodes and of their mutualconnections. In this paper, we exploit a modifiedforce-directed algorithm [24] to highlight the localmulti-layered neighborhood clusters around hub nodes.The algorithm is based on the idea that hub nodes shouldbe prioritized in laying out the overall network topology,but their placement should depend on the topology ofperipheral nodes around them. In our approach, thetopology of the periphery is defined by groupingperipheral nodes based on the strength of their link to hubnodes, as well as the strength of their mutualinterconnections.
The approach is tested on a large sample of tweetsexpressing opinions on a selection of Italian locationsrelevant to the tourism domain. Tweets have beensemantically processed and tagged with information ona) the location to which they refer,b) the location’sbrand driver (or category) on which authors express anopinion, c) the subject referred by the author,d) thenumber of retweets, ande) the identifier of theretweeting author. With this information, we drawcorresponding multi-mode networks highlighting theconnections among authors (retweeting), and theirinterests (brand or category). The data sample is referredto the tourism domain. We have adopted a modifiedversion of the Anholt’s Nation Brand index model todefine a set of categories of content referring to specificbrand drivers of a destination’s brand [2]. Based on a setof qualitative criteria, we visually compare theeffectiveness of our approach in highlighting features ofthe networks relevant to understand the influence ofcontent with previous state-of-the-art algorithms based onthe traditional spring and force-directed approaches (see,for example, [13] and [20]). Results highlight theeffectiveness of our approach, providing interestinginsights on how unveiling the structure of the periphery ofthe network can visually show the potential of peripheralnodes in determining influence.
The presentation is organized as follows. Section2discusses influence in social media, limitations of existingsemantic network drawing techniques and tools, andstandard graph drawing aesthetics criteria. Section3
discusses the implementation aspects of our work.Section 4 presents the experimental methodology,performance evaluation, and benchmark comparison.Conclusions are drawn in Section5.
2 State of the Art
In this section, we will discuss about limitations ofexisting network visualization techniques and tools. Wewill also highlights the most common and widelyaccepted visualization aesthetic criteria.
2.1 Network Visualization Techniques and Tools
The first spring-embedded model for networkvisualization was proposed by [15], who have simplifiedthe formulae used to compute spring forces, and madesignificant improvements by using a cooling schedule tolimit nodes’ maximum displacement. However, therepulsive force was still computed between all node pairs,yielding to an overall computational complexity ofO(N2)for a network withN nodes. Subsequent studies that tooka similar approach are the Online Force DirectedAnimated Visualization (OFDAV) technique by [23], andthe edge-edge repulsion approach by [34]. More recently,[44] has proposed the over relaxation algorithm for forcedirected drawing. Despite these efforts, theseforce-directed algorithms are still considered non-scalableand unsuitable for large networks, also noted by [21].
Several research efforts in network visualization havetargeted power-law algorithms and their combination withthe traditional force-directed techniques, as for examplein [27,1]. Among these approaches, the most notable isthe Out-Degree Layout (ODL) for the visualization oflarge-scale network topologies, presented by [38,12]. Thecore concept of the algorithm is the segmentation of thenetwork nodes into multiple layers based on theirout-degree, i.e. the number of outgoing edges of eachnode. The positioning of network nodes starts from thosewith the highest out-degree, under the assumption thatnodes with a lower out-degree have a lower impact onvisual effectiveness.
The most common and successful visualization toolsare surveyed in [39,28,35] and [43]. Widely discussedtools includeCytoscape, OntoGraf, OntSphere,Giny, graphViz, Hyper Graph, rdf Gravity,IsaViz, Jambalaya, Owl2Prefuse, Flowinspector, Gephi and SocNetV. There is noone-to-one mapping between techniques and tools. Thissection discusses usage results from the literature or fromexperimental evidence that we made with the tools.
Most of the tools are not highly scalable and withlarge-scale graphs, they are time inefficient or produceambiguous layouts. Many visualization tools supportgraphs up to a few hundred nodes, such asrdfGravity
c© 2015 NSPNatural Sciences Publishing Cor.

Appl. Math. Inf. Sci.9, No. 5, 2453-2465 (2015) /www.naturalspublishing.com/Journals.asp 2455
[21], Jambalaya [41], GraphViz [16], and Flowinspector [9]. With large-scale graphs, they are timeinefficient or produce ambiguous layouts, as observed by[21] with rdfGravity. Node cluttering issues and edgeoverlap issues are common, as inPrefuse [22], Gephi[5], GraphViz, and OntoGraf [17]. Force-directedand spring layouts are implemented in severalvisualization tools, but local minima problems arecommon, as observed inSocNetV [25], Gephi, and inFlow inspector.
The most practical limitations that we have observedin existing force-directed based graph drawing techniquesare the following:
–Scalability: To the best of our knowledge, mostimplementations scale up to few thousand nodes.
–Computational complexity: A major pitfallof existing force directed layout techniques is theircomputational complexity, which isΘ(N2 + E).Hence, performance of existing approaches is low forthe case of large scale networks.
–Aesthetics: Many tools suffer from nodecluttering and edge crossing problems in case ofdense graphs, as well as vertice occlusion over edges,and asymmetric drawings as noted by [34].
–Local Minima: The adoption of cooling schedulesand temperature mechanisms may reduce the problemsrelated to local minima; however, they need to be fine-tuned and optimized to be effective on large graphs.
–Topology layout: If a network contains manyedges and vertices, the structure of the visualizationbecomes complex due to the local minima problem.
–Convergence Nodes are moved back and forth withoutconverging.
2.2 Influencers and Influence in Social Networks
Traditionally, the literature characterizes a social mediauser as an influencer on the basis of structural properties.Centrality metrics are the most widely consideredparameters for the structural evaluation of a user’s socialnetwork. The centrality of a concept has been defined asthe significance of an individual within a network [18].Centrality has attracted a considerable attention as itclearly recalls concepts like social power, influence, andreputation. A node that is directly connect-ed to a highnumber of other nodes is obviously central to the networkand likely to play an important role [4]. [19] introducedthe first centrality metrics, named as degree centrality,which is defined as the number of links incident upon anode. A node with many connections to other nodes,likely to play an important role [40]. A distinction is madebetween in-degree and out-degree centrality, measuringthe number of incoming and outgoing connectionsrespectively. This distinction has also been consideredimportant in social networks. For example, Twitter makesa distinction between friends and followers. Normally, on
Twitter, users with a high in-degree centrality (i.e. with ahigh number of followers) are considered influencers.
In addition to degree centrality, the literature alsoshows other structural metrics for the identification ofinfluencers in social net-works. [31] presented anapproach, where users were identified as influencersbased on their total number of retweets. Resultshighlighted how the number of retweets are positivelycorrelated with the level of users’ activity (number oftweets) and their in-degree centrality (number offollowers). Besides structural metrics, the more recentliterature has associated the complexity of the concept ofinfluence with the variety of content. Several researchworks have addressed the need for consideringcontent-based metrics of influence [7]. Content metricssuch as the number of mentions, URLs, or hashtags havebeen proved to increase the probability of retweeting [3].
The more recent literature has associated thecomplexity of the concept of influence with the diversityof content. Several research works have addressed theneed for considering content-based metrics of influence[32,36,42]. Clearly, this view involves a significantchange in perspective, as assessing influence does notprovide a static and general ranking of influencers as aresult. However, there is a need for effective visualizationtechnique in social networks, which enable user tovisually explore large-scale complex social networks toidentify influencers in social networks. The layout shouldbe aesthetically pleasant and provide multi-layeredperiphery of the nodes in clustered networks to exploitspread of influence in social networks.
While the literature provides consolidated approachessupporting the identification and characterization of hubnodes i.e. influencers in a social network, research oninformation spread, which is multi-layered distribution ofperipheral nodes, is limited. The literature mainly focuseson the concept of influencers, while there is a need foreffective visualization techniques in social networks,which enable users to visually explore large-scalecomplex social networks to identify the users who areresponsible for influence. This paper presents apower-law based modified force-directed technique, thatextends a previous algorithm discussed in [24].
3 The Power-Law Algorithm
This section provides a high-level description of the graphlayout algorithm used in this paper. An early version ofthe algorithm has been presented by [24]. This paperimproves the initial algorithm by identifying multiplelayers of peripheral nodes around hub nodes. Thepower-law layout algorithm belongs to the class offorce-directed algorithms, such as the one by [12,20].
The base mechanism is that of starting from an initialplacement of graph nodes, and then iteratively refiningthe position of the nodes according to a force model. Theiteration mechanism is controlled by means of
c© 2015 NSPNatural Sciences Publishing Cor.
2456 C. Francalanci et al.: Representing Social Influencers and Influence...
Cooldown step. The main innovation in our approachconsists in the synergy between the exploitation of thepower-law distribution of the data and the adaptivetemperaturecooldown mechanism. The underlying ideais that of iterating on hub nodes first with smallcooldown steps, and subsequently on peripheral nodeswith large cooldown steps, in order to achieve fasterconvergence. The advantages of this approach are:
–The initial iteration on hub nodes is more efficient thaniterating on the whole node set, since|Nh| ≪ |N|. Asa consequence, it is possible to perform a fine-grainedpositioning of hub nodes (achieved by adopting smallcooldown steps), (peripheral nodes will then formclusters around hubs).
–The iteration over the set of peripheral nodes, whichwould be computationally expensive sinceNp
∼= N, islimited by the adoption of largecooldown steps.
Algorithm 1 provides a high-level overview of thewhole algorithm by showing its main building blocks.
Algorithm 1: Abstract Level Power-Law LayoutAlgorithm.
Input :Nh = Hub Nodes;Np = Peripheral Nodes;Eh = Edges;d = node’s Degree;T = Energy / Temperature Variable;Th = Temperature threshold;
1 begin2 call NodePartition()3 call InitialLayout()4 while Temperature> 0 do5 if Temperature> Th then6 call AttractionForce(Nh,Np)7 call RepulsionForce(Nh,E)8 else9 call AttractionForce(Np,Nh)
10 call RepulsionForce(Np,E)11 end12 call Cooldown(T)13 call resetNodesSizes(Np,Nt,d)14 end15 end
3.1 NodePartition
The NodePartition method is aimed at theexploitation of the power-law degree distribution of data.Provided that the degree-distribution of the nodes followsa power law, we partition the set of nodesN into the set ofhub nodesNh and the set of peripheral nodesNp, such
that N = Nh ∪Np, with Nh ∩Np = ∅. As a consequence,the set of edgesE is also partitioned in the set of edgesEhfor which at least one of the two nodes is a hub node, andthe setEp which contains all the edges connecting onlyperipheral nodes, withE = Eh ∪ Ep, and Eh ∩ Ep = ∅.The distinction of a noden as a hub node or as aperipheral node is based on the evaluation of its degreeρ(n) against the constantρh, which is a threshold definedas the value of degree that identifies the topith percentileof nodes, sorted by decreasing value of degree. Since thepower-law is supposed to hold in the degree distribution,assuming for examplei = 20 will end up in definingρh asthe 20th percentile, thus considering as hub nodes the20% of the nodes with the highest values of degree - thePareto’s 80-20 Rule, as suggested by [29].
3.2 InitialLayout
The InitialLayout() method responsible forrandom placement of graph nodes. However, as discussedby [13] and [27], it is known from the literature that theinitial layout of graph nodes is an important factor to beconsidered in order to avoid the local minima problem,especially as the number of graph nodes increases, asnoted by [27,15]. As suggested by [14], a combinedapproach can be helpful in solving this problem. In thispaper, we adopt a random initial placement of nodes;however, a combination with other algorithms such as[26] or [20] will be considered as part of our future work.
–The initial iteration on hub nodes is more efficient thaniterating on the whole node set, since|Nh| ≪ |N|. Asa consequence, it is possible to perform a fine-grainedpositioning of hub nodes (achieved by adopting smallcooldown steps), (peripheral nodes will then formclusters around hubs).
–The iteration over the set of peripheral nodes, whichwould be computationally expensive sinceNp
∼= N, islimited by the adoption of largecooldown steps.
3.3 Forces
In this paper, both forces formulae (Attraction andRepulsion) have been taken from the power-law basedmodified force-directed algorithm as presented in [24].
3.4 CoolDown
The CoolDown(T) method is responsible of coolingdown the system temperature, in order to make thealgorithm converge. We introduce a customized dynamictemperature cooldown scheme, which adapts thecooldown step based on the current value of thetemperature. As shown in Figure1, the temperature issupposed to be initialized at a valueTstart, and then to be
c© 2015 NSPNatural Sciences Publishing Cor.

Appl. Math. Inf. Sci.9, No. 5, 2453-2465 (2015) /www.naturalspublishing.com/Journals.asp 2457
reduced by a variablecooldown step∆ t based on thecurrent value of the temperature itself. This approachprovides a convenient way to adapt the speed of iterationof the algorithm to the number of nodes to be processed.While processing hub nodes (a few), the temperaturedecreases slowly; while processing peripheral nodes(many), the temperature decreases more rapidly to avoidexpensive computations for nodes that are notcentral tothe overall graph layout. The reference temperature valueTc is used as convergence threshold, i.e., when thetemperature reaches that point the iteration is stopped.
Fig. 1: Adaptive temperature cooldown mechanism.
Algorithm 2 presents the general overview of thetemperaturecooldown scheme. Variables∆ th and ∆ tpmay be parameterized to adapt the algorithm behavior toproperly fit the requirements given by the context ofanalysis. The values we used for the experimentalanalyses are∆ th = 0.0005 and∆ tp = 0.05.
3.5 resetNodesSizes
This method is responsible for resetting the sizes of eachnode in the graph, based upon their degree. The higher thedegree of a node, the greater the size and vice versa.
3.6 Computational complexity
We evaluate the overall computational complexity of thegraph layout algorithm by starting from the assessment ofthe computational complexity of its components.
Algorithm 2: Temperature Cooldown
1 begin2 if Temperature> Th then3 Temperature= Temperature−∆ th;4 else5 Temperature= Temperature−∆ tp;6 end7 if Temperature≤ Tc then8 Temperature= 0;9 end
10 end
–Node characterization. The computationalcomplexity of the node characterization step isO(|N|), since it requires complete iterations over allthe nodes of node setN.
–Initial layout. The computational complexityof the initial node placement depends on thecomplexity of the selected layout algorithm.Assuming that a random initial placement of nodes isused, the complexity is O(|N|).
–Attractive force. The computationalcomplexity of the attractive force is O(|Eh|) for eachiteration on hub nodes, and O(
∣
∣Ep∣
∣) for each iterationon peripheral nodes, with |Eh| >
∣
∣Ep∣
∣ and|E| = |Eh| +
∣
∣Ep∣
∣. Overall, the computationalcomplexity of the attractive force step is then O(|Eh|).
–Repulsive force. The computationalcomplexity of the repulsive force is O(|Nh|
2) for each
iteration on hub nodes, and O(∣
∣Np∣
∣
2) for each iteration
on peripheral nodes, with∣
∣Np∣
∣ > |Nh| and|N| = |Nh| +
∣
∣Np∣
∣. Overall, the computationalcomplexity of the repulsive force step is thenO(
∣
∣Np∣
∣
2).
–Cooldown. The computational complexity of thetemperature cooldown step is O(1).
–resetNodesSizes. The computationalcomplexity of the this step is also O(1).
Considering the computational complexity evaluationof each step of our algorithm, the overall computationalcomplexity is O(|Eh|) + O(
∣
∣Np∣
∣
2).
4 Experimental Methodology and Results
4.1 Data Sample
We collected a sample of tweets over a two-month period(December 2012 - January 2013). For the collection oftweets, we queried the public Twitter APIs by means ofan automated collection tool developed ad-hoc. Wequeried Twitter APIs with the following crawlingkeywords, representing tourism destinations (i.e. brands):Amalfi, Amalfi Coast, Lecce, Lucca, Naples, Palermoand
c© 2015 NSPNatural Sciences Publishing Cor.

2458 C. Francalanci et al.: Representing Social Influencers and Influence...
Rome. Two languages have been considered, English andItalian. Collected tweets have been first analysed with aproprietary semantic engine in order to tag each tweetwith information abouta) the location to which it refers,b) the location’s brand driver (or category) on whichauthors express an opinion,c) the subject referred to bythe author,d) the number of retweets (if any), ande) theidentifier of the retweeting author. Our data sample isrefers to the tourism domain. We have adopted a modifiedversion of the Anholt Nation Brand index model to definea set of categories of content referring to specific branddrivers of a destination’s brand [2]. Examples of branddrivers areArt & Culture, Food & Drinks, Events &Sport, Services & Transports, etc. A tweet is consideredGeneric if it does not refer to any Specific brand driver,while it is consideredSpecific if it refers to at leastone of Anholt’s brand drivers.
Tweets have been categorized by using an automaticsemantic text processing engine that has been developedas part of this research. The semantic engine can analysea tweet and assign it to one or more semantic categories.The engine has been instructed to categorize according tothe brand drivers of Anholt’s model, by associating eachbrand driver with a specific content category described bymeans of a network of keywords. Each tweet can beassigned to multiple categories. We denote withNC thenumber of categories each tweetw is assigned to; thespecificityS(w) of a given tweetw is defined in Equation1 as follows:
S(w) =
{
0,Nc = 01,Nc > 0
}
(1)
Table1 refer to the descriptive statistics of the originalnon-linear variables.
Table 1: Basic descriptive statistics of our data set.
Variable ValueNumber of tweets 957,632Number of retweeted tweets 79,691Number of tweeting authors 52,175Number of retweets 235,790
4.2 Network models
In order to verify the effectiveness of the proposedalgorithm with respect to the goal of our research, wehave defined different network models based on the dataset described in the previous section. Figure2 provides anoverview of the adopted network models.
–Author → Brand (N1) This model considersthe relationship among authors and domain brands,i.e., touristic destinations in our data set. The network
is modeled as an undirected affiliation two-modenetwork, where an author nodena is connected to abrand nodenb whenever authora has mentionedbrandb in at least one of his/her tweets. The weight ofthe edge connectingna to nb is proportional to thenumber of times that authora has named brandb inhis/her tweets.
–Author → Category (N2) This modelconsiders the relationship among authors and domainbrand drivers (categories), i.e., city brand drivers inour data set (namely,Arts & Culture, Events & Sports,Fares & Tickets, Fashion & Shopping, Food & Drink,Life & Entertainment, Night & Music, Services &Transport, and Weather & Environmental). Thenetwork is modelled as an undirected affiliationtwo-mode network, where an author nodena isconnected to a category nodenc whenever authorahas mentioned a subject belonging to categoryc in atleast one of his/her tweets. The weight of the edgeconnectingna to nc is proportional to the number oftimes that authora has named categoryc in his/hertweets.
–Author → Subject (N3) This model considersthe relationship among authors and domain subjects,i.e., relevant semantic lemmas in our data set. Thenetwork is modeled as an undirected affiliationtwo-mode network, where an author nodena isconnected to a subject nodens whenever authora hasmentioned subjects in at least one of his/her tweets.The weight of the edge connectingna to ns isproportional to the number of times that authora hasnamed subjects in his/her tweets.
–Author → Author (N4) This model considersthe relationship among authors producing a tweet andcorresponding retweeting authors. The network ismodeled as a directed one-mode network, where anauthor nodena1 is linked to another author nodena2whenever authora1 has retweeted at least one tweetof authora2. The weight of the edge connectingna1 tona2 is proportional to the number of times that authora1 has retweeted authora2.
4.3 Visualization Results and Discussions
In order to visually analyse the influencers (hub nodes)and influence (spread across the multi-layered peripheralnodes connected around hub nodes), we visualizedafore-mentioned networks in Section4.2. The colorscheme for node-pair for all networks, is consistent foreach graph (Yellow nodes:NA; Blue: NB). Figures4, 6, 7and 9 present visualizations of the each network(N1 − N4) from dataset, along with visual benchmarkcomparison with existing approaches. Table2 comparesthe average time performance of our algorithm againstthat of the [20] and [33] approaches. Our approach showsa significant improvement in layout computation time.
c© 2015 NSPNatural Sciences Publishing Cor.

Appl. Math. Inf. Sci.9, No. 5, 2453-2465 (2015) /www.naturalspublishing.com/Journals.asp 2459
Table 2: Summary of experimental results.
Dataset Size Computational Time and Speedup|N| |NA| |NB| |E| PL FR MR
(s) (s) (%) (s) (%)
N1
78 71 7 94 0.012 0.191 93.72 0.039 69.23275 268 7 540 1.223 3.422 64.26 2.25 45.64
2,627 2,621 7 3,705 4.962 196.387 97.47 96.837 94.8812,017 12,011 7 14,139 6.472 232.486 97.22 124.023 94.7821,000 20,993 7 24,349 9.635 328.745 97.07 256.382 96.2430,523 30,516 7 34,845 12.256 547.334 97.76 327.287 96.26
N2
58 32 26 181 0.0017 1.157 98.53 0.234 92.7487 56 31 327 0.114 1.638 93.04 0.545 79.08
301 268 38 1,897 1.236 3.427 63.93 2.678 53.852,659 2,615 44 11,602 3.248 187.218 98.27 146.213 97.78
12,049 12,005 44 35,192 7.623 412.349 98.15 318.641 97.61
N3
163 56 107 272 0.026 1.759 98.52 0.452 94.25583 263 320 1,849 1.367 4.768 71.33 2.984 54.19
3,694 2,614 1,079 10,489 2.923 178.382 98.36 136.231 97.85
N4
1,305 373 932 1,000 0.941 3.876 75.72 2.316 59.372,677 839 1,838 2,000 1.769 5.672 68.81 3.261 45.756,268 1,839 4,429 5,000 2.746 128.762 97.87 87.562 96.86
11,484 2,197 9,287 10,000 4.627 238.752 98.06 124.753 96.29Key to symbols:N: total number of nodes in network;NA: number of authornodes;NB: number of brand / subject / category / retweeting author nodes; E:number of edgesKey to algorithm acronyms:PL: Power-law;FR: Fruchterman-Reingold;MS:Modified Spring.
Fig. 2: Network models:a) N1: Author→ Brand;b) N2:Author → Category;c) N3: Author → Subject;d) N4:Author→ Author.
The dataset follow a power-law distribution, asdiscussed by [37]. Figure3 explains that the graphs in our
test set are ‘scale-free’ as they exhibits power-law degreedistribution.
4.3.1 Results –N1 Network (Brand Fidelity)
Networks N1 is related to the relationship betweenauthors and brands, i.e., touristic destinations which arebasically Italian cities. In this case, the clustering of nodesprovides a grouping of those authors who have tweetedabout the same destination. The layering of nodes aroundbrands is instead related to the intensity of tweeting abouta given destination; i.e., authors closer to a brand nodetweet a higher number of times about that destinationwith respect to farther authors. The emerging semantic ofthe network visualization is in this case related to theBrand Fidelityof authors. The visualized network layoutsupports the visual analysis of those authors who have ahigher fidelity to a given brand, or those authors whonever tweet about that brand. Moreover, it is possible topoint out which authors are tweeting about a brand aswell as a competing brand to support the definition ofspecific marketing campaigns. Through our visualizationapproach, we able to visually identify multiple peripherallayers of nodes surrounded by influencing hub nodes, thespread of these multi-layered peripheral nodes aroundhub nodes express the influence. Figures4 provides thevisualization of networksN1 of our dataset, together witha visual comparison with the layouts generated by two
c© 2015 NSPNatural Sciences Publishing Cor.

2460 C. Francalanci et al.: Representing Social Influencers and Influence...
(a) Linear Distribution (b) Logrithmic Distribution
Fig. 3: Power-Law degree Distribution from data setN2.
(a) NetworkN1: G(N=2627; E=3705).
(b) NetworkN1: G(N=12017;E=14139).
Fig. 4: Graphs upon networkN1 Author → Brand.
reference algorithms. Through our visualizationapproach, we able to visually identify multiple peripherallayers of nodes surrounded by influencing hub nodes, thespread of these multi-layered peripheral nodes aroundhub nodes express the influence.
4.3.2 Results –N2 Network (Category Specificity)
Figure 5 provides an enlarged view of networkN2visualized by means of the power-law layout algorithm.The network visualization depicted in Figure5 adoptsyellow (light) nodes to represent authors, and blue (dark)nodes to represent the categories on which authors haveexpressed opinions in their tweets. The layout of thenetwork produced by the power-law layout algorithm
clearly highlights that author nodes aggregate in severalgroups and subgroups based on their connections withcategory nodes, which in this case are the hub nodes. Theaggregation of author nodes can be analyzed from twodifferent perspectives:
1.Clusters. The groups of author nodes clustertogether all those authors that are connected to thesame hubs (i.e., categories); this provides a visualclustering for those authors who have tweeted aboutthe same categories. For example, Figure5 highlightsclusters that group all the authors who tweeted aboutEvents & Sports, Fashion & Shopping, Drink, andEntertainmentcategories, as well as the authors whotweeted about more than one category, such asTransportandCollege, or EntertainmentandPhoto.
2.Layers. The network layout shows that clusters areplaced at a different distance from the visualizationcenter based on the number of hubs to which they areconnected. In other words, the most peripheralclusters are those in which nodes are connected toonly one hub, while the central cluster is the one inwhich nodes are connected to the highest number ofhub nodes. An example of node layering is providedin the upper left area of Figure5: the cluster referringto those authors who have tweeted about categoryEntertainment is positioned above (i.e., on anoutermost layer) and the clusters grouping the authorswho have tweeted aboutEntertainmentandPhoto, orEntertainmentandPeopleare positioned below.
Authors belonging to the central cluster of nodes arein fact those who are moregeneralist in their contentsharing about the analyzed tourism destinations, sincethey refer to many different categories. On the contrary,authors belonging tho the most peripheral clusters arethose who are veryspecific in sharing content relatedto selected categories. Figure6 represents the benchmarkcomparison of our technique with existing techniques,and the results are evident that our approach producesaesthetically pleasant layouts by highlighting clusters ofmultiple peripheral layers surrounded by hub-nodes.
c© 2015 NSPNatural Sciences Publishing Cor.

Appl. Math. Inf. Sci.9, No. 5, 2453-2465 (2015) /www.naturalspublishing.com/Journals.asp 2461
Fig. 5: NetworkN2: Author → Category (enlarged view).
Fig. 6: Network N2: Author → CategoryG(N=2,659;E=11,602).
4.3.3 Results –N3 Network (Subject Specificity)
NetworkN3 is related to the relationship between authorsand subjects. Figures7 provides the visualization ofnetworks N3 of our dataset, together with a visualcomparison with the layouts generated by two referencealgorithms. The emerging semantic of the networkvisualization is similar to that ofN2, since the layoutprovides a visual representation of the level ofspecificity (or generality) of authors with respect tosubjects instead of categories. In this network, we foundmany subjects, upon which multiple authors expressedtheir opinions, hence the center of graph, seems dense.
c© 2015 NSPNatural Sciences Publishing Cor.

2462 C. Francalanci et al.: Representing Social Influencers and Influence...
Our approach able to produce multiple layers ofperipheral nodes surrounded by hub-nodes. In graph, wecan observe multiple outlier peripheral layers, which aresurrounded by distinct subjects, are drawn far from centerof graph. We also observe some influencing authors’nodes of large size, as they seemed to express theiropinions many times upon multiple subjects, henceshowing strong influence.
Fig. 7: Network N3: Author → SubjectsG(N=3,694;E=10,489).
4.3.4 Results –N4 Network (Retweeting phenomena)
Network N4 is related to the relationship among authorsretweeting other authors. Although very simple, thisnetwork model visually represents the complexity ofreal-world retweeting phenomena. As depicted in Figure8, different retweeting scenarios are associated withdifferent network topologies.
1.Cloud Retweeting:In casea) of Figure8, an authoris retweeted by many of his followers, is visuallyrepresented as a cloud of nodes aggregating around asingle hub.
2.Chain Retweeting:The opposite situation, depicted incasec) of Figure8, is that of a tweet that is retweetedby an author which is following the author who has lastretweeted.
3.Mixed Topology:In the middle, as represented by caseb) of Figure 8, a combination of the two basescenarios may happen, leading to intermediatetopologies of varying complexity.
For NetworkN4 visualizations which are provided] inFigure 8, Figure 9 and 10, a specific node coloringscheme is adopted in order to distinguish among differenttypes of authors.Yellow nodes represent those authorswho only retweets other authors, andBlue nodesrepresent those authors who only retweeted by otherauthors. Similarly,Green nodes represent authors whoboth retweet and retweeted by other authors.
Figure9 represents the benchmark comparison of ourtechnique with existing techniques. By considering only
Fig. 8: Examples of author-author retweeting scenarios:a) cloud retweeting;b) mixed topology; c) chainretweeting.
hub nodes, in fact, it is clear that there is no clue tounderstand how content spreads across the authorsnetwork, since the majority of hubs are just the centers ofisolated clouds of authors. Interesting insights can beprovided to the reader only by taking into account theperipheral nodes (i.e., those nodes that are not labeled ashubs), and thus by reconstructing the phenomenon ofchain retweeting. The network layout generated by theproposed power-law layout algorithm is clearly effectivein helping the reader in identifying the differentretweeting scenarios and interpreting how retweets spreadacross the network of authors.
Fig. 9: Network N4: Author → AuthorG(N=2,677;E=2000)
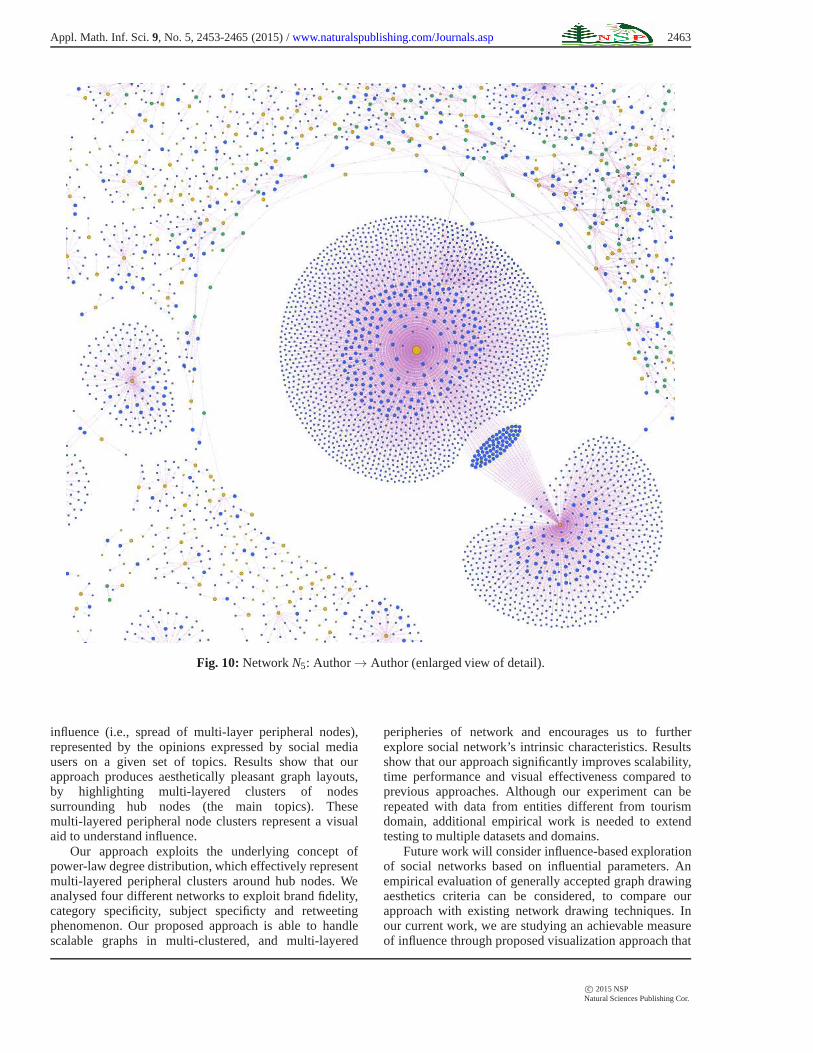
The interesting retweeting scenarios are thechainretweetingones as shown in Figure10. By consideringonly hub nodes, in fact, it is clear that there is no clue tounderstand how content spreads across the authorsnetwork, since the majority of hubs are just the centers ofisolated clouds of authors. Interesting insights can beprovided to the reader only by taking into account theperipheral nodes (i.e., those nodes that are not labeled ashubs), and thus by reconstructing the phenomenon ofchain retweeting.
5 Conclusions and Future Work
This paper proposes a novel visual aspect for the analysisand exploration of social networks in order to identify andvisually highlight influencers (i.e., hub nodes), and
c© 2015 NSPNatural Sciences Publishing Cor.
Appl. Math. Inf. Sci.9, No. 5, 2453-2465 (2015) /www.naturalspublishing.com/Journals.asp 2463
Fig. 10: NetworkN5: Author→ Author (enlarged view of detail).
influence (i.e., spread of multi-layer peripheral nodes),represented by the opinions expressed by social mediausers on a given set of topics. Results show that ourapproach produces aesthetically pleasant graph layouts,by highlighting multi-layered clusters of nodessurrounding hub nodes (the main topics). Thesemulti-layered peripheral node clusters represent a visualaid to understand influence.
Our approach exploits the underlying concept ofpower-law degree distribution, which effectively representmulti-layered peripheral clusters around hub nodes. Weanalysed four different networks to exploit brand fidelity,category specificity, subject specificty and retweetingphenomenon. Our proposed approach is able to handlescalable graphs in multi-clustered, and multi-layered
peripheries of network and encourages us to furtherexplore social network’s intrinsic characteristics. Resultsshow that our approach significantly improves scalability,time performance and visual effectiveness compared toprevious approaches. Although our experiment can berepeated with data from entities different from tourismdomain, additional empirical work is needed to extendtesting to multiple datasets and domains.
Future work will consider influence-based explorationof social networks based on influential parameters. Anempirical evaluation of generally accepted graph drawingaesthetics criteria can be considered, to compare ourapproach with existing network drawing techniques. Inour current work, we are studying an achievable measureof influence through proposed visualization approach that
c© 2015 NSPNatural Sciences Publishing Cor.
2464 C. Francalanci et al.: Representing Social Influencers and Influence...
can be used to rank influential nodes in social networks.Future research may address the development of anad-hoc tool, by using proposed technique, forinfluence-based exploration of social networks.
References
[1] R. Andersen, F. Chung, and L. Lu. Drawing power lawgraphs using a local global decomposition.Algorithmica,47(4):397, 2007.
[2] Simon Anholt. Competitive identity: The new brandmanagement for nations, cities and regions. PalgraveMacmillan, 2006.
[3] Eytan Bakshy, Jake M Hofman, Winter A Mason, andDuncan J Watts. Everyone’s an influencer: quantifyinginfluence on twitter. InProceedings of the fourth ACMinternational conference on Web search and data mining,pages 65–74. ACM, 2011.
[4] D. Barbagallo, L. Bruni, C. Francalanci, and P. Giacomazzi.An empirical study on the relationship between twittersentiment and influence in the tourism domain. InInformation and Communication Technologies in Tourism2012, pages 506–516. Springer, 2012.
[5] M. Bastian, S. Heymann, and M. Jacomy. Gephi: an opensource software for exploring and manipulating networks.In ICWSM, 2009.
[6] F. Benevenuto, M. Cha, K.P. Gummadi, and H. Haddadi.Measuring user influence in twitter: The million followerfallacy. In International AAAI Conference on Weblogs andSocial (ICWSM10), pages pp. 10–17, 2010.
[7] Carolina Bigonha, Thiago NC Cardoso, Mirella M Moro,Marcos A Gonçalves, and Virgílio AF Almeida. Sentiment-based influence detection on twitter.Journal of the BrazilianComputer Society, 18(3):169–183, 2012.
[8] D. Boyd, S. Golde, and G. Lotan. Tweet, tweet, retweet:Conversational aspects of retweeting on twitter.IEEE, pagespp. 1–10, 2010.
[9] L. Braun, M. Volke, J. Schlamp, A. Von Bodisco, andG. Carle. Flow-inspector: a framework for visualizingnetwork flow data using current web technologies.Computing, pages 1–12, 2012.
[10] L. Bruni, C. Francalanci, P. Giacomazzi, F. Merlo, andA. Poli. The relationship among volumes, specificity, andinfluence of social media information. InProceedings ofInternational Conference on Information Systems, 2013.
[11] Amparo E Cano, Suvodeep Mazumdar, and FabioCiravegna. Social influence analysis in microbloggingplatforms–a topic-sensitive based approach.Semantic Web,2011.
[12] D.S.M. Chan, K.S. Chua, C. Leckie, and A. Parhar.Visualisation of power-law network topologies. InNetworks, 2003. ICON2003. The 11th IEEE InternationalConference on, pages 69–74. IEEE, 2004.
[13] P. Eades. A heuristic for graph drawing.CongressNumerantium, 42:149–160, 1984.
[14] P. Eades. Navigating clustered graphs using force-directedmethods. Journal of Graph Algorithms and Applications,4(3):157–181, 2000.
[15] P. Eades and X. Lin. Spring algorithms and symmetry.Computing and Combinatorics, pages 202–211, 1997.
[16] J. Ellson, E. Gansner, L. Koutsofios, S. North, andG. Woodhull. GraphvizU open source graph drawing tools.In Graph Drawing, pages 594–597. Springer, 2002.
[17] S. Falconer. Ontograf, 2010.[18] Weiguo Fan and Michael D Gordon. The power of social
media analytics.Communications of the ACM, 57(6):74–81, 2014.
[19] Linton C Freeman. Centrality in social networks conceptualclarification.Social networks, 1(3):215–239, 1979.
[20] T.M.J. Fruchterman and E.M. Reingold. Graph drawingby force-directed placement. Software: Practice andExperience, 21(11):1129–1164, 1991.
[21] S. Goyal and R. Westenthaler. Rdf gravity (rdf graphvisualization tool).Salzburg Research, Austria, 2004.
[22] J. Heer, S.K. Card, and J.A. Landay. Prefuse: a toolkitfor interactive information visualization. InProceedingsof the SIGCHI conference on Human factors in computingsystems, pages 421–430. ACM, 2005.
[23] M.L. Huang, P. Eades, and J. Wang. On-line animatedvisualization of huge graphs using a modified springalgorithm. Journal of Visual Languages & Computing,9(6):623–645, 1998.
[24] A. Hussain, K. Latif, A. Rextin, A. Hayat, and M. Alam.Scalable Visualization of Semantic Nets using Power-LawGraphs. Applied Mathematics & Information Sciences,8(1):355–367, 2014.
[25] D Kalamaras. Social network visualizer (socnetv), 2010.[26] T. Kamada and S. Kawai. An algorithm for drawing general
undirected graphs.Information processing letters, 31(1):7–15, 1989.
[27] A. Katifori, C. Halatsis, G. Lepouras, C. Vassilakis, andE. Giannopoulou. Ontology visualization methodsUasurvey.ACM Computing Surveys (CSUR), 39(4):10, 2007.
[28] A. Katifori, E. Torou, C. Halatsis, G. Lepouras, andC. Vassilakis. A comparative study of four ontologyvisualization techniques in prot ´ege: Experiment setup andpreliminary results. InInformation Visualization, IV 2006.,pages 417–423. IEEE, 2006.
[29] R. Koch. The 80/20 principle: the secret to achieving morewith less. Crown Business, 1999.
[30] Haewoon Kwak, Changhyun Lee, Hosung Park, and SueMoon. What is twitter, a social network or a news media? InProceedings of the 19th international conference on Worldwide web, pages 591–600. ACM, 2010.
[31] Alex Leavitt, Evan Burchard, David Fisher, and SamGilbert. The influentials: New approaches for analyzinginfluence on twitter.Web Ecology Project, 4(2):1–18, 2009.
[32] Jingxuan Li, Wei Peng, Tao Li, Tong Sun, Qianmu Li, andJian Xu. Social network user influence sense-making anddynamics prediction. Expert Systems with Applications,41(11):5115–5124, 2014.
[33] C.C. Lin and H.C. Yen. A new force-directed graph drawingmethod based on edge-edge repulsion.IEEE ComputerSociety, 2005.
[34] Chun-Cheng Lin and Hsu-Chun Yen. A new force-directedgraph drawing method based on edge-edge repulsion.Journal of Visual Languages & Computing, 23(1):29–42,2012.
[35] B. Mike. Large-scale rdf graph visualization tools, 2008.http://www.mkbergman.com/414.
c© 2015 NSPNatural Sciences Publishing Cor.

Appl. Math. Inf. Sci.9, No. 5, 2453-2465 (2015) /www.naturalspublishing.com/Journals.asp 2465
[36] Mor Naaman, Jeffrey Boase, and Chih-Hui Lai. Is it reallyabout me?: message content in social awareness streams.In Proceedings of the 2010 ACM conference on Computersupported cooperative work, pages 189–192. ACM, 2010.
[37] Mark EJ Newman. Power laws, pareto distributions andzipf’s law. Contemporary physics, 46(5):323–351, 2005.
[38] Richard Perline. Strong, weak and false inverse power laws.Statistical Science, pages 68–88, 2005.
[39] M. Sintek. Visualizing protege ontologies, 2003.http://protegewiki.stanford.edu/wiki/OntoViz.
[40] Raymond T Sparrowe, Robert C Liden, Sandy J Wayne, andMaria L Kraimer. Social networks and the performance ofindividuals and groups.Academy of management journal,44(2):316–325, 2001.
[41] M. Storey, M. Musen, J. Silva, C. Best, R. Ernst,N.and Fergerson, and N. Noy. Jambalaya: Interactivevisualization to enhance ontology authoring and knowledgeacquisition in protégé. InWorkshop on Interactive Tools forKnowledge Capture (K-CAP-2001). Citeseer, 2001.
[42] Bongwon Suh, Lichan Hong, Peter Pirolli, and Ed H Chi.Want to be retweeted? large scale analytics on factorsimpacting retweet in twitter network. InSocial computing(socialcom), 2010 ieee second international conference on,pages 177–184. IEEE, 2010.
[43] Y. Sure, J. Angele, and S. Staab. Ontoedit: Guiding ontologydevelopment by methodology and inferencing.On the Moveto Meaningful Internet Systems 2002: CoopIS, DOA, andODBASE, pages 1205–1222, 2010.
[44] Y. Wang and Z. Wang. A fast successive over-relaxation algorithm for force-directed network graphdrawing. Science China Information Sciences, 55(3):677–688, 2012.
[45] X. Xu, N. Yuruk, Z. Feng, and T.A.J. Schweiger. Scan: astructural clustering algorithm for networks. InProceedingsof the 13th ACM SIGKDD international conference onKnowledge discovery and data mining, pages 824–833.ACM, 2007.
Chiara Francalanciis professor of informationsystems at Politecnico diMilano. Her research focuseson information systemengineering and, in particular,on feasibility analyses. Hermain research interests in thisarea are information design,social networks analysis,
sentiment analysis, architectural design of informationsystems, and cost-benefit analyses, as fundamentalcomponents of a feasibility study. She has over 15 yearsof experience in applied research and consulting. She haspublished on top international outlets on IT managementand cost-oriented IT design, has led several national andinternational research projects, and has broad consultingexperience.
Ajaz Hussain isa Doctoral Candidateof Information Technologyat the Politecnico di Milano.In 2011, he earned hisMS (IT) degree from NationalUniversity of Scienceand Technology (NUST),Pakistan. His researchinterests include identification
of Social Influencers, Empirical Analysis of SocialInfluence, Social Networks Analysis, Sentiment Analysis,Scale-Free Networks, Force-Directed Graphs Drawingsand Information Systems. His current research workemphasis on Visual and Empirical Analysis of SocialInfluence and Influencers using scalable power-law basedgraph drawing approach. As an IT professional, hehave around 5 years diverse academic and industrylevel experience in various sectors, including R&DDepartment, Project Management, Technology Servicesand Consulting, and Software Development.
Francesco Merlois post-doc researcherat Politecnico di Milano,where he took a Ph.D.in Information Engineeringand a master’s degreein Computer ScienceEngineering. His maininterests are the evaluationof software development and
maintenance costs, with particular focus on the OpenSource context, and the analysis of software qualitymetrics and their impact on the efficiency of the softwaredevelopment process. A collateral research interest is thedefinition of a graph query language.
c© 2015 NSPNatural Sciences Publishing Cor.