reproductions supplied by edrs are the best that can be ... scanning can also assist educational ......
TRANSCRIPT
DOCUMENT RESUME
ED 460 719 JC 990 294
TITLE Association of Colleges of Applied Arts and Technology ofOntario 1998-99 Environmental Scan.
INSTITUTION Association of Colleges of Applied Arts and Technology ofOntario, North York.
REPORT NO Ed-5PUB DATE 1998-09-00NOTE 95p.
PUB TYPE Numerical/Quantitative Data (110) Reports Research(143)
EDRS PRICE MF01/PC04 Plus Postage.DESCRIPTORS Community Colleges; Decision Making; Educational Change;
Educational Objectives; *Environmental Scanning; ForeignCountries; Governance; Higher Education; OrganizationalDevelopment; *Strategic Planning; Trend Analysis;Universities
IDENTIFIERS Ontario Colleges of Applied Arts and Technology
ABSTRACTThe 5th edition of the Environmental Scan is presented by
the Association of Colleges of Applied Arts and Technology of Ontario(ACAATO). This planning document builds on the feedback received from collegestakeholders regarding its value and usefulness in supporting the colleges'strategic planning processes. The Scan's primary objective is to lessen therandomness of information used in decision-making, and to alert managers anddecision makers to trends and issues that may affect organization.Environmental scanning assists educational institutions in understanding thechanging needs of learners and in shaping how they market their programs andservices to meet those needs. In order to focus this scanning, theenvironment is organized along three levels: (1) the macro environment, whichexamines the social, technological, economic, environmental and politicalsectors; (2) the industry environment, which focuses on those factors andforces influencing a specific sector, such as government student assistanceprograms; and (3) the task environment, which concentrates on those areasspecific to an institution. The nine sections of this document, each of whichpresents Key Findings and relevant tables, are divided as follows: (1)
Economy and the Labor Force; (2) Education and Training; (3) Funding andIncome; (4) Information Technology; (5) Ontario Population; (6) PublicPolicy; (7) Operating Expenses; (8) Learners; and (9) Human Resources. (36
references) (AS)
Reproductions supplied by EDRS are the best that can be madefrom the oliginal document.

1998-99
ENVIRONMENTAL SCAN
Association of Colleges of Applied Arts and Technology of OntarioAssociation des colleges d'arts appliqués et de technologie de l'Ontario
US. DEPARTMENT OF EDUCATIONOffice of Educational Research and Improvement
EDUCATIONAL RESOURCES INFORMATIONCENTER (ERIC)
This document has been reproduced asreceived from the person or organizationoriginating it.
D Minor changes have been made toimprove reproduction quality.
Points of view or opinions stated in thisdocument do not necessarily representofficial OERI position or policy.
www.acaato.on.ca
September 1998
PERMISSION TO REPRODUCE ANDDISSEMINATE THIS MATERIAL HAS
BEEN GRANTED BY
F. Hamblin
TO THE EDUCATIONAL RESOURCESINFORMATION CENTER (ERIC)
Next Page
2 BEST COPY AVAILABLE

The 1998-99 Environmental Scanfor
The Colleges of Applied Arts and Technology of Ontario
ContentsIntroduction
Key Sources of Information vii
1.0 Economy and the Labour Force 3
1.1 Projected Canadian Employment Growth bv Sector: 1998-2001 71.2 1998 Fastest Growing Companies in Canada 81.3 Projected Growth Occupations in High Technology to 2001 91.4 Employment in Ontario, by Industry, selected years 101.5 Employment in Ontario, by Occupation, selected years 111.6 Employment in Ontario, by Class of Worker, selected years 121.7 Employment in Ontario, by Employment Status and Age Group, selectedyears 131.8 Ontario Labour Force Participation Rates, selected years 141.9 Unemployment Rates in Ontario by Economic Region, *selected years 151.10 Labour Force Profile of College Graduates, 1996 161.11 Average Starting Salaries for Employed College Graduates, selected years 17
2.0 Education and Training 21
2.1 Workplace Training and Education 242.2 Corporate Benefits of Workplace Learning 252.3 Employer Performance Trends: Formal Trainers and Non-Trainers 262.4 Career Colleges in Ontario 27
3.0 Funding & Income 31
3.1 College System Revenue, by source 353.2 Activity Base Funded by the General Purpose Operating Grant 363.3 Apprenticeship Training in Ontario, training days purchased 373.4 General Purpose Operating Grants over 10 years 383.5 General Purpose Operating Grant vs. Total Operating Grants 393.6 College Tuition Fees, 1997-98 403.7 Table: College General Purpose Operating
Grant Changes vs. Government Revenue Changes 413.8 Table: Change in College System Revenue Between 1990-91
and 1996-97, by Source 42
ACAATO Environmental Scan 1998-99
tigl Previous Page 3Next Page4
Contents
3.9
3.10
4.0
Table: Full-time Postsecondary Enrolment andthe General Purpose Operating Grant
Trends in Corporate Giving in Canada
Information Technology
4344
47
4.1 Learning Technologies: Future Challenges 494.2 Ontario Households with Home Computers, Computer Modems,
and Access to the Internet 50
5.0 Ontario Population 53
5.1 Ontario Population Growth, by Region 555.2 Ontario Population by Age Group and Region 565.3 Ontario Population Change between 1991 and 1996, by Age Group and Region . . . . 575.4 Ontario Population Projections, by Age Group 58
6.0 Public Policy 61
7.0 Operating Expenses 65
7.1 Non-Labour Costs Increase, Operating and Capital 667.2 1997 Compensation Costs 687.3 College System Revenue and Expenditures, 1996-97 69
8.0 Learners 73
8.1 Full-Time Postsecondary Enrolment 758.2 Trends in Full-time Postsecondary Enrolment, by Program Division 768.3 Movement of College and University Students 778.4 Ontario Student Financial Assistance Program - College Trends:
I. Levels of Student Assistance and Number of Recipients 782. Number of Awards by Student Group 793. Average Loan Amount by Student Group 79
9.0 Human Resources 82
9.1 College Staff 849.2 Table: Full-time Staff in Ontario Colleges, 1984 to 1997 859.3 Trends in Human Resource Development 86
ACAATO Environmental Scan 1998-99-iv-
Introduction
The Association of Colleges of Applied Arts and Technology of Ontario (ACAATO) is pleased topresent the fifth edition of The Environmental Scan. This planning document builds on the feedbackreceived from college stakeholders on its value and utility in supporting the colleges' strategicplanning processes.
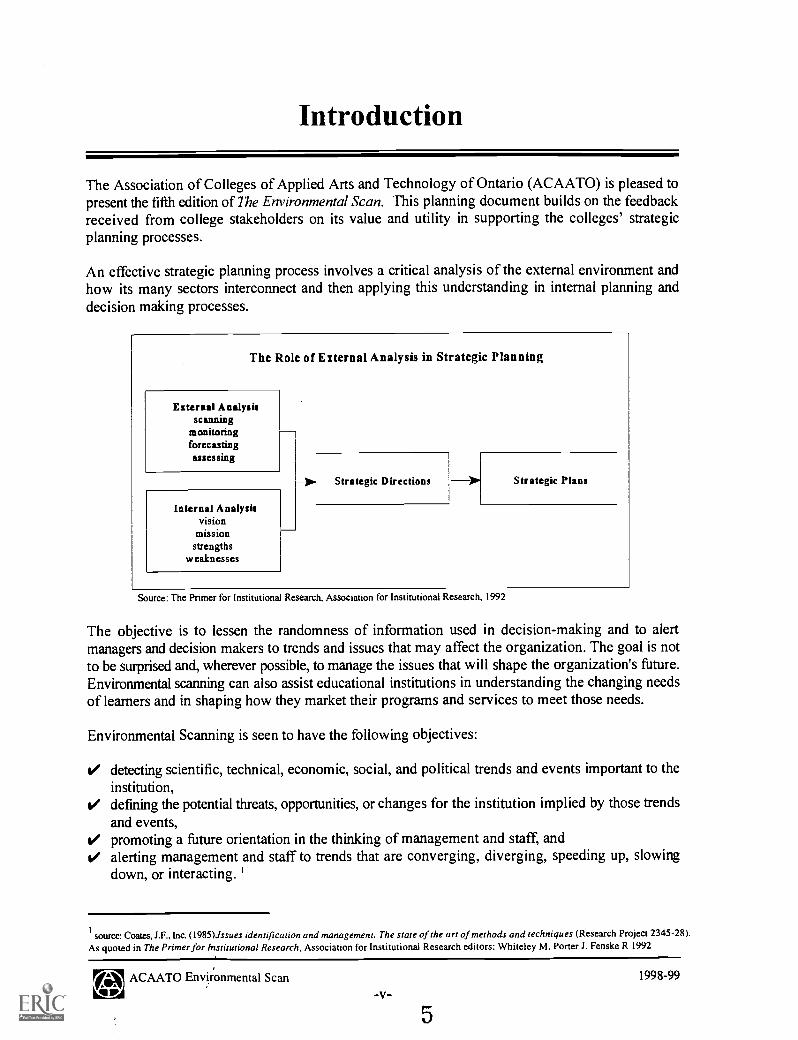
An effective strategic planning process involves a critical analysis of the external environment andhow its many sectors interconnect and then applying this understanding in internal planning anddecision making processes.
The Role of External Analysis in Strategic Planning
External Analysisscanning
monitoringforecastingassessing
Internal Analysisvision
missionstrengths
weaknesses
00 Strategic Directions Strategic Plans
Source: The Primer for Institutional Research, Association for Institutional Research, 1992
The objective is to lessen the randomness of information used in decision-making and to alertmanagers and decision makers to trends and issues that may affect the organization. The goal is notto be surprised and, wherever possible, to manage the issues that will shape the organization's future.Environmental scanning can also assist educational institutions in understanding the changing needsof learners and in shaping how they market their programs and services to meet those needs.
Environmental Scanning is seen to have the following objectives:
detecting scientific, technical, economic, social, and political trends and events important to theinstitution,defining the potential threats, opportunities, or changes for the institution implied by those trendsand events,promoting a future orientation in the thinking of management and staff, andalerting management and staff to trends that are converging, diverging, speeding up, slowingdown, or interacting.
1
source: Coates, IF., Inc. (198.5)./ssues identification and management. The state of the art of methods and techniques(Research Project 2345-28).As quoted in The Primer for institutional Research, Association for Institutional Research editors: Whiteley M. Porter J. Fenske R 1992
ACAATO Environmental Scan 1998-99
5

In order to focus this scanning, current research recommends that environment be organized alongthree levels. = The first level, and the broadest, is the macro environment which examines the social,technological, economic, environmental, and political sectors (STEEP) and how they affectinstitutions both directly and indirectly (an example being the Ontario recession of the early 1990's).Next is the industry environment which focuses on those factors and forces influencing a specificsector (for example, government student assistance programs) followed by the task environmentwhich focuses on those areas specific to an institution.
In order to increase the utility of the annual ACAATO Environmental Scan in each college's strategicplanning processes, the 1998-99 edition incorporates the following changes:
A new Economy and the Labour Force section consolidates the Economy and Employmentsections of the 1997 edition. Feedback received subsequent to the release of the 1997 editionrevealed that while both sections are critical areas for research and analysis, understanding ofhow the forces of change in these areas impact and challenge colleges would be enhanced throughtheir combination.The Politics section has been renamed Public Policy which is more in keeping with the section'sfocus on the influences of government policy directions and legislative/regulative changes.Where possible, regional information has been included. The Ontario Population section, forexample, presents census population data and population projections in groupings that areconsistent with the regional groupings of colleges.The 1998-99 edition will be available on the ACAATO web site in both "html" format for viewingon screen as well as "pdf' format for ease of downloading and viewing/printing through AdobeAcrobat Reader software.
The Association of Colleges of Applied Arts and Technology of Ontario (ACAATO) has preparedthe 1998-99 Environmental Scan on your behalf and we welcome your feedback on the usefulnessof this document in your advocacy and planning activities. We have provided a response sheet at theback of the Scan for your convenience. Feedback and comments should be directed to:
Julie MarshResearch and Policy Officer
Email: [email protected]: (416) 596-0744 extension 230
Fax: (416) 596-2364
2 Fahey, L. King, W.R., & Narayanan, V.K., Environmental Scanning and forecasting in strategic planning: the state of the art. Long Range Planning14(1), 32-39, 1981. As quoted in The Primer for Institutional Research, Association for Institutional Research, 1992.
ACAATO Environmental Scan 1998-99
-vi-

Key Sources of Information
1997 ACAATO Environmental Scan, September 1997.
American Society for Training and Development, 1997 National HRD Executive Survey on LearningTechnologies.
American Society for Training and Development, Training Industry Trends 1997, November 1997.
American Society for Training & Development, 1998 State of the Industry Report, January 1998.
Angus Reid Group / Ernst & Young, Competitiveness, Jobs & Training: Ontarians Attitudes Towards JobCreation and Economic Growth, July 1998.
Angus Reid Group, Workplace 2000 Working Toward the Millennium: A Portrait of Working Canadians,Fall 1997.
Bank of Montreal, Economics Department, Prospects for Canada's Industries to 2001, March 12, 1998.
Canada Health Monitor, 1996 Survey.
Canadian HR Reporter.
Canadian Policy Research Networks Inc., Developing Skills in the Canadian Workplace - The Results of theEkos Workplace Training Survey, Betcherman G., Leckie N., McMullen K., 1997.
Canadian Policy Research Networks Inc., Training for the New Economy: A Synthesis Report, BetchermanG., McMullen K., Davidson K., June 1998.
Chronicle of Higher Education.
Conference Board of Canada, Jobs in the Knowledge-Based Economy: Information Technology and theImpact on Employment, B. Lafleur and P. Lok, May 1997.
Conference Board of Canada, The Economic Benefits of Improving Literacy Skills in the Workplace, M.Bloom, M. Burrows, B. Lafleur, and R. Squires, August 1997.
Conference Board of Canada, Industrial Relations Outlook, 1998, S. Payette, January 1998.
Council of Ontario Universities, 1997 Resource Document, March 1998.
Cummins R.I., Movement between Ontario Universities and Colleges: Report to the College-UniversityConsortium Council, March 10, 1998.
Globe and Mail.
Hay Group, The Hay Group's Second Annual Information Technology Strategy Survey, October 21, 1997.
ACAATO Environmental Scan 1998-99-vii-
7

Human Resources Development Canada, Towards 2001: Occupational Trends in the Greater Toronto Area,December 1997.
Human Resources Development Canada, Statistics Canada,After High School: The First Report of the SchoolLeavers Follow-up Survey: 1995, Catalogue No. LM-419-09-96.
Ketchum Fund Raising Counsel, Philanthropic Trends, Spring 1998.
Ontario College Application Service.
Ontario College Committee on Disability Issues, Special Needs Statistical Report: April I, 1996 to March 31,1997, June 1997.
Ontario Council of Regents.
Ontario Ministry of Education and Training:Student Support BranchColleges BranchWorkplace Support ServicesPrivate Vocational Schools
Ontario Ministry of Education and Training, Employment Profile: Graduates of Ontario Colleges of AppliedArts and Technology, various years.
Ontario Ministry of Education and Training, College Financial Information System Report, various years.
Ontario Ministry of Finance, 1998 Ontario Budget Papers, May 1998.
Ontario Ministry of Finance, County Population Projections: 1992- 2021, May 1995.
PROFIT: The Magazine for Canadian Entrepreneurs.
Statistics Canada, Labour Force Annual Averages, Catalogue No. 71-529.
Statistics Canada, Household Facilities and Equipment Survey, Catalogue No. 64-202.
Statistics Canada, Census 1991 and 1996 data.
Toronto Star
World Health Organization, 1998 World Health Report: Life in the 21" Century - A Vision for All, Spring1998.
ACAATO Environmental Scan 1998-99

Section 1:Economy and the Labour Force
1998-99 Environmental Scan
9

Economy and the Labour Force
Key Findings
Actual
1997
Projected
1998 1999 2000Ontario Annual Average:
Real GDP Growth (x,) 4.8 3.5 3.0 3.0
Employment ('000) 5,413 Up to 5,629 Up to 5,800 Up to 5,973
Unemployment Rate (%) 8.5 7.1 - 7.4 6.4 - 7.1 6.2 - 6.9
CPI Inflation (%) 1.9 1.4 1.6 1.7
Source: Statistics Canada and Ontario Ministry of Finance. Table extracted from 1998 Ontario Budget Papers.
O While the provincial and national economies continue to grow in strength, the recession of theearly 1990's continues to be felt. According to Statistics Canada's 1996 Census:
Incomes of Canadians fell 6% between 1990 and 1995, wiping out the gains of the boom ofthe late 1980's;Average earnings fell for all ages and levels of education, but the youngest were hardest hit;75 cents of every income dollar now comes from employment, which is down from 78 centsin 1990 and 86 cents in 1970. The rest comes from pensions, employment insurance, socialassistance, tax benefits and investments. a
O Ontario's strong economic growth of 4.8% in 1997 was spurred by an increase in exports to theUnited States and a renewal in the income (and interest) sensitive areas of housing and big-ticketconsumer items. Ontario's economic growth is projected to continue to be strong in these areasbut more moderate in 1998 and subsequent years as exports to the U.S. slow moderately anduncertainty in the Asian markets continues to have an impact on the investment climate. b
O Strong national economic and productivity growth is, however, projected in the community,business, and personal services sector. b A recent economic outlook projects that close to half of
asource: Statistics Canada. Census 1996 as reported in the Globe and Mail. May 13, 1998.
see Exhibit 1.1
./AE ACAATO Enviionmental Scan Section 1T4rip 1998-99 Economy and the Labour Force
-3- 1 0

the jobs created during the next four years will be in this sector. This should position Ontario forcontinued positive economic conditions given that approximately 44% of the province'semployment is in these areas.
O In 1997, the strongest employment growth was concentrated in the central and southern regionsof the province. In 1998, it is projected to become more balanced regionally as thecommunications and the electronics manufacturing sectors in eastern Ontario continue to grow.Employment growth in the northern regions, however, is projected to continue to be slower giventhe weaknesses in the mining and primary metals sectors. e
O Employment is booming for small businesses that emphasize customer service.
A survey of Canadian entrepreneurs indicates that approximately 70% of survey respondentsplan to increase their staff. Of high technology entrepreneurs, the rate increased to 83% whilethose in the financial sector increased to 82%.
The emphasis on meeting the needs of the customer is a common theme among the top tenfastest growing companies in Canada, seven of which are based in Ontario. g
O Jobs for computer programmers and systems analysts almost doubled between 1992 and 1997according to a recent Statistics Canada study of the labour market for computer programmers. ii
While demonstrating that employment for computer programmers and software analysts isbooming, it raises questions about the widely projected high technology skills shortage:
Between 1992 and 1997, most of the employment growth occurred in urban areas. Ontario ledthe way (+58,000, a 90% growth rate) with Toronto, Ottawa-Hull, and Kitchener-Waterlooexperiencing the most rapid employment growth. Ottawa-Hull had the highest concentrationof software workers in 1997 (5.3% of all employed workers in the region).In 1997, 4 out of every 10 programmers were aged 25 to 34, yet only 20% of newly hiredworkers (in the job one year or less) were under 25. Most of the growth in employment hasbeen among workers old enough to have previous work experience.High tech wages averaged $843 a week, slightly lower than those of scientific and technicalworkers (averaging $877 per week), with higher salaries going to those workers with moresenior experience.
csource: Bank of Montreal, Economics DepartmentProspects for Canada's Industries to 2001, March 12, 1998. See also Exhibit 1.5
see Exhibit 1.5
e see Exhibit 1.9
fsource: as reported in Toronto Star, Want a job? Don't focus on big names, February I I, 1998.
g see Exhibit 1.2
source: Statistics Canada, as reported in The Daily, June 10, 1998 and in The Globe and Mail, June 11, 1998.
E/A ACAATO Environmental Scan Section 144 1998-99 Economy and the Labour Force
-4-I 1

The number of self-employed computer programmers almost tripled over the study period andthis growth accounted for almost one-third of the total growth in the sector. This suggests agrowing trend for contracting out.
O While the debate of massive skills shortages in the high technology sector continues, strong growthin the software and hardware areas of this sector is projected to continue. '
O Part-time employment continues to grow at a rate faster than full-time employment and is mostcommon in the sales and service sectors. It is also growing at a faster rate for workers betweenthe ages 25 and 44 as well as those aged 45 and older.
O Both full- and part-time employment grew at a faster rate for those aged 45 and older than foryounger workers.
This suggests a continued trend in the increasing skills and experience required in the changingeconomy which increases the importance of supporting the education and training needs ofyouths and ensuring the availability of support services and preparatory programs.
O The trend towards increased skills and experience and the employment opportunities that this'upskilling' presents can also be demonstrated by looking at labour force participation rates.
Since 1992, while participation rates have dropped for youths aged 15 to 24, the decline hasbeen especially large for those members of the total population who did not completesecondary school. k
O Self-employment continues to grow at a faster rate than traditional forms of employment. Thistrend is projected to continue.'
Between 1992 and 1997, self-employment grew 34% in contrast to the 8.2% increase inoverall employment.
O College graduates continue to do well in securing employment. In 1996, 81.7% of those in thelabour force were employed six months after graduation. By program area, the full- and part-timeemployment status of graduates varied considerably which may be reflective of the broader shifttowards part-time and self-employment occurring in the economy. m
i see Exhibit 1.3
j see Exhibit 1.7
ksee Exhibit 1.8
see Exhibit 1.6
m see Exhibit 1.10
0EACAA9TO Env,ironmental Scan Section 1
q P 9 Economy and the Labour Force-5- 1

O The proportion of 1996 college graduates not in the labour force also varied considerably byprogram area, which may be reflective of a trend toward seeking further training and educationprior to entering the workforce.
O Average starting salaries for college graduates overall have remained relatively constant between1991 and 1996. By program area, however, there is some variance which may be attributed towhether the occupation was primarily found in the public sector. "
Average starting salaries for program areas such as 'social services', 'health technology' and'nursing and related' declined moderately while the average starting salaries for areas such as'technology', 'visual and creative arts' and 'office and business administration' increasedmoderately.
n see Exhibit 1.11
EtAioN ACAATO Envfronmental Scan Section 1;I; 1998-99 Economy and the Labour Force
-6-
1 3

Exhibit 1.1
Projected Canadian EmploymentGrowth by Sector: 1998 - 20011
Higher GrowthAbove 2.5%
Medium Growth1% - 2.5%
Lower GrowthBelow I%
Machinery 4.8 Motor Vehicle Parts 2.5 Health Services 0.9Business Services 4.0 Retail Trade 2.4 Textiles 0.9Plastic 3.9 Motor Vehicles 2.4 Pipelines 0.9Hospitality/Recreation 3.4 Furniture 2.1 Beverages 0.7Electrical/Electronic 3.1 Transportation/Storage 2.1 Education Services 0.6Other Manufacturing 3.1 Wholesale Trade 2.1 Fishing 0.6Construction 3.0 Communications 2.0 Mining 0.5Personal Services 2.8 Rubber 2.0 Clothing 0.5Aircraft & Parts 2.7 Fabricated Metal Prod. 1.6 Oil & Gas 0.5
Chemicals 1.6 Government Services 0.3Non Metallic Minerals 1.6 Forestry 0.1Food 1.4 Other Utilities 0.0Agriculture 1.4 Other Transport. Equip. -0.1Printing & Publishing 1.1 Paper -0.3Financial/Real Estate 1.0 Primary Metals -1.1
Wood -1.1Refined Petrol. & Coal -1.3Leather -1.6Tobacco -2.4
All Industry Aggregate: 1.9%
source: Bank of Montreal, Economics Depamnent, Prospects for Canada's Industries to 2001, March 12, 1998
IA EACAATO EnVironmental Scan
wip 1998-99 -7-
14
Section 1Economy and the Labour Force

Exhibit 1.2
1998 Fastest Growing Companies in Canada'The 10th annual survey by Profit magazine ranks the country's Top 100 companies by their growth over thelast five years. In the 1998 ranking seven of the ten companies are based in Ontario. While not all companieshave gone high tech, many have unique products.
A common theme among all is their ability to connect with their customers, often through educationalseminars.
Company Expertise
Revenue
1992 1997
Employees
1992 1997
Image Processing Systems Inc.Markham, ON
Machine-vision systems $117,101 $30 M 11 225
RTO Enterprises Inc.Edmonton, AB
Rent-to-own furnitureand appliance company
$442,000 $56.1 M 16 770
Discreet Logic Inc.Montreal, QC
Special effectssoftware.
$892,000 $101.9 M 55 280
Versent Corp.Mississauga, ON
Laser Questentertainment outlets
$529,006 $52.4 M 3 721
Equisure Financial Network Inc.North Bay, ON
Insurance brokerages $820,800 $56.8 M 2 1,158
G.A.P. Adventures Inc.Toronto, ON
Adventure-touroperator
$140,866 $7.8 M 3 64
Tucows Interactive Ltd.Toronto, ON
Internet services andshareware distributor
$159,720 $8.6 M 3 161
NTS Computer Systems Ltd.Maple Ridge, BC
Specialty computers forschool use
$463,077 $20.6 M 5 121
Newcon International Ltd.Toronto, ON
Specialty opticalequipment
$101,374 $4.4 M 2 17
McGill Multimedia Inc.Windsor, ON
Interactive training andmarketing software
$248,466 $8.4 M 4 57
source: PROFIT: The Magazine for Canadian Entrepreneursiune 1998 issue.
E IAACAATO EnvironMental Scan
v4MV 1998-99
-8-
1 5
Section 1Economy and the Labour Force
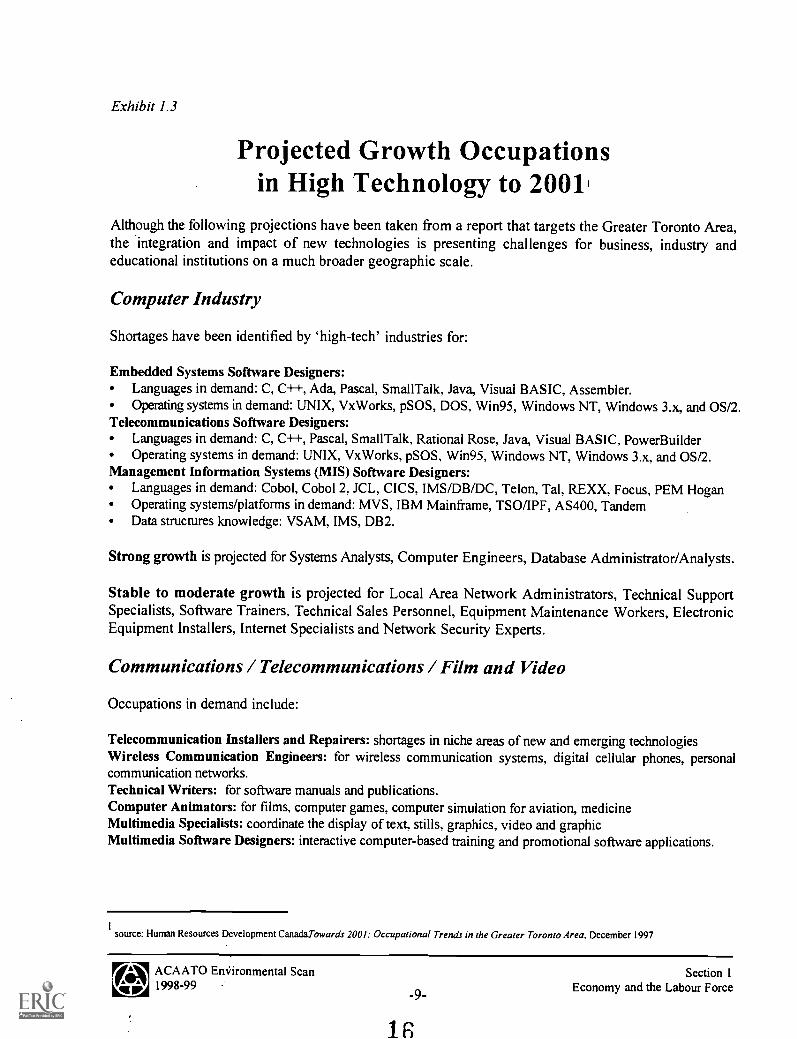
Exhibit 1.3
Projected Growth Occupationsin High Technology to 20011
Although the following projections have been taken from a report that targets the Greater Toronto Area,the integration and impact of new technologies is presenting challenges for business, industry andeducational institutions on a much broader geographic scale.
Computer Industry
Shortages have been identified by 'high-tech' industries for:
Embedded Systems Software Designers:Languages in demand: C, C++, Ada, Pascal, Small Talk, Java, Visual BASIC, Assembler.Operating systems in demand: UNIX, VxWorks, pSOS, DOS, Win95, Windows NT, Windows 3.x, and OS/2.
Telecommunications Software Designers:Languages in demand: C, C-H-, Pascal, Small Talk, Rational Rose, Java, Visual BASIC, Power BuilderOperating systems in demand: UNIX, VxWorks, pSOS, Win95, Windows NT, Windows 3.x, and OS/2.
Management Information Systems (MIS) Software Designers:Languages in demand: Cobol, Cobol 1 JCL, CICS, IMS/DB/DC, Telon, Tal, REXX, Focus, PEM HoganOperating systems/platforms in demand: MVS, IBM Mainframe, TSO/IPF, AS400, TandemData structures knowledge: VSAM, IMS, DB2.
Strong growth is projected for Systems Analysts, Computer Engineers, Database Administrator/Analysts.
Stable to moderate growth is projected for Local Area Network Administrators, Technical SupportSpecialists, Software Trainers, Technical Sales Personnel, Equipment Maintenance Workers, ElectronicEquipment Installers, Internet Specialists and Network Security Experts.
Communications / Telecommunications / Film and Video
Occupations in demand include:
Telecommunication Installers and Repairers: shortages in niche areas of new and emerging technologiesWireless Communication Engineers: for wireless communication systems, digital cellular phones, personalcommunication networks.Technical Writers: for software manuals and publications.Computer Animators: for films, computer games, computer simulation for aviation, medicineMultimedia Specialists: coordinate the display of text, stills, graphics, video and graphicMultimedia Software Designers: interactive computer-based training and promotional software applications.
source: Human Resources Development Canadarowards 2001: Occupational Trends in the Greater Toronto Area, December 1997
A9C9A8ATO Emiironmental Scan Section 1
9-Economy and the Labour Force
-
1 G

Exh
ibit
1.4
Em
ploy
men
t in
Ont
ario
, by
Indu
stry
'se
lect
edye
ars
Indu
stry
Em
ploy
men
t (T
hous
ands
)Pr
opor
tion
of E
mpl
oym
ent
1992
1994
1996
1997
1992
1994
1996
1997
Agr
icul
ture
and
Oth
er P
rim
ary
Indu
stri
es16
215
516
015
03.
2%3.
0%3.
0%2.
8%
Man
ufac
turi
ng88
990
198
81,
010
17.8
%17
.5%
18.6
%18
.7%
Con
stru
ctio
n27
028
426
729
45.
4%5.
5%5.
0%5.
4%
Tra
nspo
rtat
ion,
Com
mun
icat
ion
and
Oth
er U
tiliti
es35
035
938
338
47.
0%7.
0%7.
2%7.
1%
Tra
de85
288
390
892
717
.0%
17.1
%17
.1%
17.1
%
Fina
nce,
Ins
uran
ce a
nd R
eal E
stat
e35
634
033
734
97.
1%6.
6%6.
3%6.
4%
Set-
vice
1,78
71,
913
1,97
72,
013
35.7
%37
.1%
37.2
%37
.2%
Publ
ic A
dmin
istr
atio
n33
432
629
028
76.
7%6.
3%5.
5%5.
3%
ITO
TA
L *
:5,
001
5,16
15,
311
5,41
311
100.
0%I
100.
0%10
0.0%
100.
0%
* T
otal
sm
ay n
ot a
dd d
ue to
rou
ndin
g.
sour
ce: S
tatis
tics
Can
ada,
Lab
our
For
ce A
nnua
l Ave
rage
s, C
atal
ogue
No.
71-
529
L...
]IA
AC
AA
TO
Env
iron
men
tal S
can
v470
199
8-99 17
-10-
Sect
ion
1E
cono
my
and
the
Lab
our
Forc
e 13

Exh
ibit
1.5
Em
ploy
men
t in
Ont
ario
, by
Occ
upat
ion
'se
lect
edye
ars
Occ
upat
ion
Em
ploy
men
t (T
hous
ands
)Pr
opor
tion
of E
mpl
oym
ent
1992
1994
1996
1997
1992
1994
1996
1997
Man
ager
ial a
nd O
ther
Pro
fess
iona
l1,
673
1,74
91,
774
1,82
633
.5%
33.9
%33
.4%
33.7
%
Cle
rica
l83
178
275
774
616
.6%
15.2
%14
.3%
13.8
%
Sale
s49
052
153
757
59.
8%10
.1%
10.1
%10
.6%
Serv
ice
651
667
707
692
13.0
%12
.9%
13.3
%12
.8%
Prim
ary
Occ
upat
ions
145
149
148
147
2.9%
2.9%
2.8%
2.7%
Proc
essi
ng, M
achi
ning
and
Fabr
icat
ing
632
661
740
770
12.6
%12
.8%
13.9
%14
.2%
Con
stru
ctio
n23
925
024
926
64.
8%4.
9%4.
7%4.
9%
Tra
nspo
rt E
quip
men
t Ope
ratin
g16
718
619
119
23.
3%3.
6%3.
6%3.
5%
Mat
eria
l Han
dlin
g an
d O
ther
Cra
fts
173
195
208
199
3.5%
3.8%
3.9%
3.7%
TO
TA
L *
:5,
001
5,16
15,
311
5,41
310
0.0%
I10
0.0%
100.
0%10
0.0%
*Tot
als
may
not
add
due
to r
ound
ing
sour
ce: S
tatis
tics
Can
ada,
Lab
our
For
ce A
nnua
l Ave
rage
s, C
atal
ogue
No.
71-
529
AC
AA
TO
Env
iron
men
tal S
can
1998
-99
19
Sect
ion
1E
cono
my
and
the
Lab
our
Forc
e
20
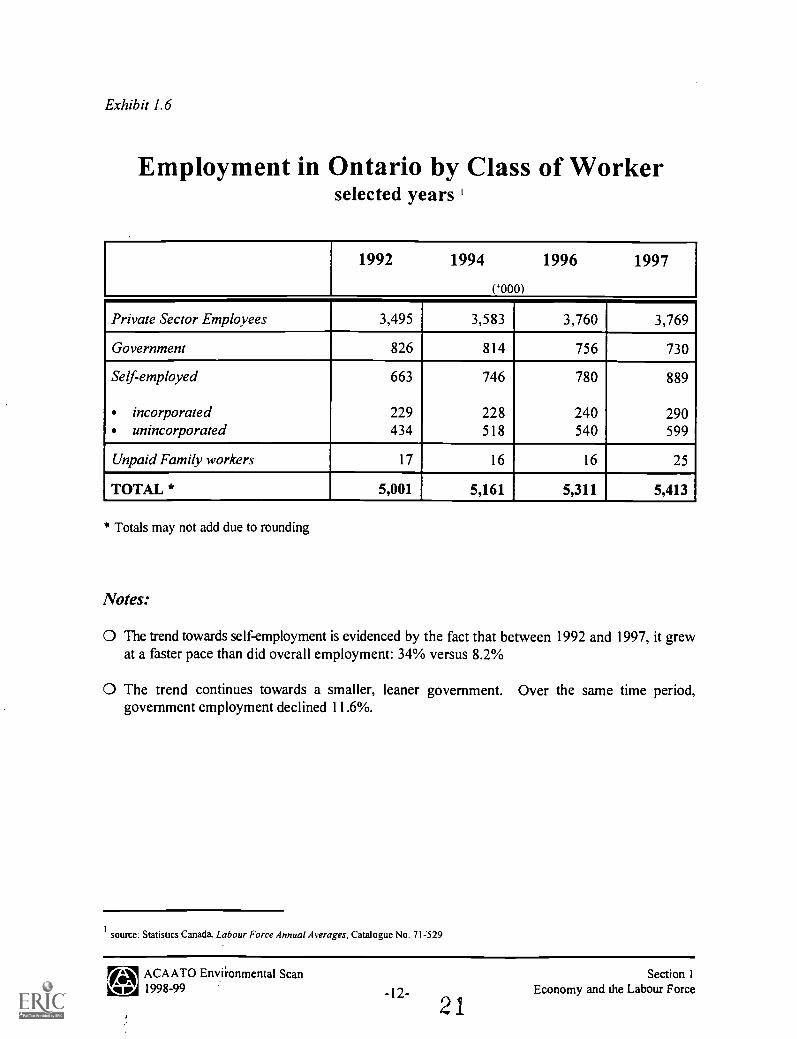
Exhibit 1.6
Employment in Ontario by Class of Workerselected years '
1992 1994 1996 1997
(`000)
Private Sector Employees 3,495 3,583 3,760 3,769
Government 826 814 756 730
Self-employed 663 746 780 889
incorporated 229 228 240 290unincorporated 434 518 540 599
Unpaid Family workers 17 16 16 25
TOTAL * 5,001 5,161 5,311 5,413
* Totals may not add due to rounding
Notes:
0 The trend towards self-employment is evidenced by the fact that between 1992 and 1997, it grewat a faster pace than did overall employment: 34% versus 8.2%
0 The trend continues towards a smaller, leaner government. Over the same time period,government employment declined 11.6%.
source: Statistics Canada. Labour Force Annual Averages, Catalogue No. 71.:529
ACAATO Envii-onmental Scan Section 1AiiiP 1998-99 Economy and the Labour Force
-12- 21

Exhibit 1.7
Employment in Ontarioby Employment Status and Age Group
selected years '
1992 1994 1996 1997
(4000)
Full-time: 4,075 4,191 4,298 4,381
15 - 24 445 396 387 38225 - 44 2424 2497 2545 259645 + 1206 1298 1366 1403
Part-time: 926 969 1,013 1,032
15 - 24 376 385 391 39025 - 44 330 352 374 37445 + 220 231 247 268
TOTAL * 5,001 5,161 5,311 5,413
* Totals may not add due to rounding
Notes:
O Between 1992 and 1997, part-time employment grew at a faster rate than full-time employmentand total employment: 11.5% versus 7.5% and 8.2% respectively.
O For those aged 45 and older, both part- and full-time employment grew at rates faster than thosefor younger workers. This signals a continued trend towards the economy's growing need forworkers with skills and experience.
O The impact of the recession of the early 1990's on those between the ages 15 and 24 is evidencedby the fact that between 1992 and 1997, youth full-time employment declined 14.8% while part-time employment grew a modest 3.7%. Over the same time period, youth labour forceparticipation rates have declined. 2 These facts suggest a growing trend for youths to stay inschool longer to obtain the skills and knowledge for success in the changing economy.
source: Statistics Canada, Labour Force Annual Averages, Catalogue No. 71-529
2see Exhibit 1.8
EiVAS ACAATO Environmental Scan Section 1viii1998-99 -13- Economy and the Labour Force
22
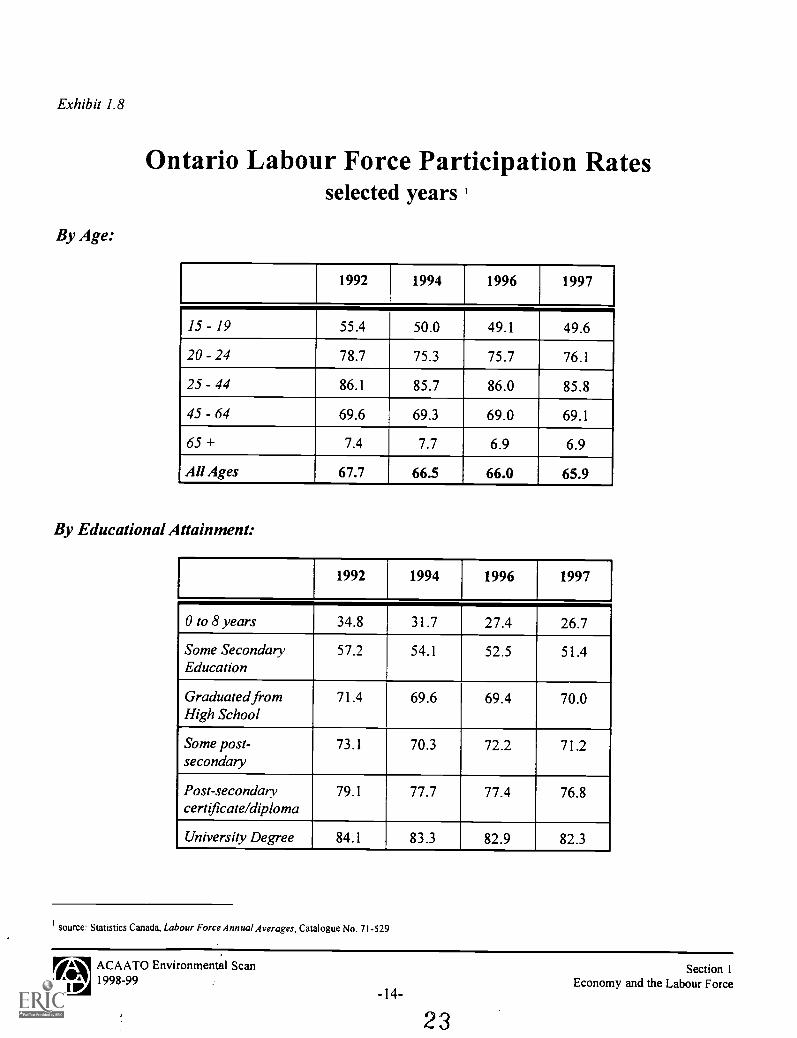
Exhibit 1.8
By Age:
Ontario Labour Force Participation Ratesselected years
1992 1994 1996 1997
15 - 19 55.4 50.0 49.1 49.6
20 - 24 78.7 75.3 75.7 76.1
25 - 44 86.1 85.7 86.0 85.8
45 - 64 69.6 69.3 69.0 69.1
65 + 7.4 7.7 6.9 6.9
All Ages 67.7 66.5 66.0 65.9
By Educational Attainment:
1992 1994 1996 1997
0 to 8 years 34.8 31.7 27.4 26.7
Some Secondary 57.2 54.1 52.5 51.4Education
Graduated from 71.4 69.6 69.4 70.0High School
Some post-secondary
73.1 70.3 72.2 71.2
Post-secondarycertificate/diploma
79.1 77.7 77.4 76.8
University Degree 84.1 83.3 82.9 82.3
source: Statistics Canada, Labour Force Annual Averages, Catalogue No. 71-529
EAIACAATO Environmental Scanmffil 1998-99qIIIP -14-
23
Section 1Economy and the Labour Force

Exhibit 1.9
Unemployment Rates in Ontarioby Economic Region, selected years
Economic Region 1992 1994 1996 1997
Ottawa 8.4 7.8 8.7 9.2
Kingston-Pembroke 10.7 10.0 10.9 11.5
Muskoka - Kawarthas 12.0 12.4 9.8 10.0
Greater Toronto Area 11.4 10.3 9.2-
8.1
Kitchener - Waterloo - Barrie 10.1 8.1 8.1 7.6
Hamilton - Niagara Peninsula 11.5 9.4 8.5 8.3
London 8.9 7.6 8.8 7.9
Windsor - Sarnia 11.1 9.5 9.6 8.8
Straord - Bruce Peninsula 8.4 6.9 5.7 6.5
Northeast 13.9 12.3 11.0 10.8
Northwest 9.9 10.1 10.0 9.7
Province wide 10.9 9.6 9.1 8.5
Notes:1. Ottawa: includes the counies of Stormont Dundas and Glengarry, Prescott and Russell, Leeds and Grenville and Lanark, as
well as the Ottawa-Carleton Regional Municipality.2. Kingston - Pembroke: includes the counties of Frontenac, Lennox and Addington, Hastings, Prince Edward, and Renfrew.3. Muskoka - Kawarthas: includes the counties of Northumberland, Peterborough, Victoria, and Haliburton, as well as the
Muskoka District Municipality.4. Greater Toronto Area: includes the municipalities of Durham Region, York Region, Metropolitan Toronto, Peel Region, and
Halton Region (excluding the city of Burlington).5. Kitchener - Waterloo: includes the counties of Dufferin, Wellington, and Simcoe as well as the Waterloo Regional
Municipality.6. Hamilton - Niagara Peninsula: includes the city of Burlington, Brant County and the municipalities of Hamilton-Wentworth,
Niagara Region, and Haldimand-Norfolk Region.7. London: includes the counties of Elgin, Oxford, and Middlesex.8. Windsor - Sarnia: includes the counties of Kent, Essex, and Lambton.9. Stratford - Bruce Peninsula: includes the counties of Perth, Huron, Bruce. and Grey.10. Northeast: includes the districts of Nipissing, Parry Sound, Manitoulin, Sudbury, Timiskarning, Cochrane, and Algoma, as
well as Regional Municipality of Sudbury.11. Northwest: includes the districts of Thunder Bay, Rainy River. and Kenora.
source: Statistics Canada, Labour Force Annual Averages, Catalogue No. 71-529
AN ACAATO Environmental ScanE Section 141; 1998-99
-15-Economy and the Labour Force
24

Exh
ibit
1.10
Lab
our
Forc
e Pr
ofile
of
Col
lege
Gra
duat
es, 1
9961
Soci
alSe
rvic
es
Vis
ual &
Cre
ativ
eA
rts
Hos
pita
lity
Off
ice
&B
usin
ess
Adm
inis
trat
ion
Hea
lthT
echn
olog
yN
ursi
ng &
Rel
ated
Tec
hnol
ogy
In th
e L
abou
r Fo
rce:
...E
mpl
oyed
Ful
l-tim
e55
.262
.868
.563
.455
.640
.069
.3
...E
mpl
oyed
Par
t-lim
e28
.220
.816
.416
.728
.838
.711
.2
...L
ooki
ng f
or W
ork
16.6
16.4
15.1
19.9
15.6
21.3
19.5
Not
in th
e L
abou
r Fo
rce:
I23
.7I
20.6
118
.8I
19.1
I10
.2I
12.1
I23
.0_
Not
es:
O P
erce
ntag
es a
re e
xpre
ssed
in p
ropo
rtio
n to
the
tota
l num
ber
of g
radu
ates
in th
e su
rvey
O "
Full-
time"
incl
udes
ful
l-tim
e re
late
d, p
artia
lly r
elat
ed, a
nd u
nrel
ated
.O
"Pa
rt-t
ime"
incl
udes
par
t-tim
e re
late
d, p
artia
lly r
elat
ed, a
nd u
nrel
ated
.
sour
ce: M
inis
try
of E
duca
tion
and
Tra
inin
g, E
mpl
oym
ent P
rofil
e: 1
995-
96 G
radu
ates
of O
ntar
io C
olle
ges
of A
pplie
d A
rts
and
Tec
hnol
ogy
IEZ
A A
CA
AT
O E
nvir
onm
enta
l Sca
nre
.wl 1
998-
99gi
ll IP
2 5
-16-
Sect
ion
1E
cono
my
and
the
Lab
our
Forc
e
28

Exhibit 1.11
Average Starting Salaries for EmployedCollege Graduates, selected years I
Program Area 1990 1993,
1996
Social Services $22,258 $21,975 $21,785
Visual & Creative Arts 19,696 20,730 23,246
Hospitality 17,853 17,871 18,088
Office & Business Administration 21,422 22,041 23,752
Health Technology 27,394 26,942 26,631
Nursing & Related 31,047 28,222 28,558
Technology 24,845 25,269 27,828
ITOTAL I $23,875 I $23,220 I $24,489
Notes:
0 Average starting salaries for college graduates six months after graduation have remainedrelatively constant since 1990. Modest gains in the average starting salaries were recorded in1996 which is most likely reflective of a recovering provincial economy that is growing instrength.
0 Significantly higher than average starting salaries in a number of individual program areas haveconsistently been recorded in the technology and health technology areas.
source: Ministry of Education and Traininggmployment Profile: Graduates of Colleges of Applied Arts and Technology. For the years 1989-90,1992-93 and 1995-96.
ACAATO Environmental Scan Section 11998-99 . Economy and the Labour Force
-17-

Section 2:Education & Training
1998-99 Environmental Scan

Education & Training
Key Findings
O A July 1998 opinion poll provides evidence of growing public recognition of the value of atechnical education.
35% of those polled chose a college diploma in a ttchnical education as the type of educationmost likely to lead to employment,24% chose apprenticeship programs,18% selected a university degree in science while only 3% chose an arts degree. a
O Employer investment in workplace education and training is critical to maintaining a competitiveedge in today's economy. Without adequate investment in workforce training and education,employers will be unable to develop the full potential of that investment.
In a recent Canadian study, it was shown that the top five benefits to employers of investingin training and education include:1. Increased ability to handle training on the job2. Better team performance3. Improved labour-management relations4. Increased quality5. Improved results in job-specific training / quicker training results b c
An American study further demonstrated that companies that invested more heavily inworkplace learning had higher net sales and gross profits per employee. It also found thatleading edge companies were more likely to:
train a larger proportion of their employees,outsource training, andincorporate more of the latest learning technologies into that training. d
O Opportunities and challenges exist for colleges in meeting the education and training needs of theworkforce. Becoming market driven will necessitate colleges to rethink how, when and wheretraining is provided in order to respond to individual and employer needs.
O Significant benefits also accrue to employees in terms of wage gains, greater employability, andincreased job satisfaction which also benefit employers.
a source: Angus Reid Group / Ernst & Young, Competitiveness, Jobs & Training: Ontarians Attitudes Towards Job Creation and EconomicGrowth, July 1998.
source: Conference Board of Canada, The Economic Benefits of Improving Literacy Skills in the WorkplacAugust 1997.
c see Exhibit 2.3
dsee Exhibit 2.2
E ACAATO EnVironmental Scan Section 2al; 1998-99
-21-Education & Training

O The trend towards non-standard employment currently has a negative impact on employersponsored training support and could result in a growing polarization in skills and educationbetween core employees and short-term / contractual workers. e
As job tenure, as well as the level of education, increases so does the level of employersponsored trainingIndividual responsibility for job-related skills training is projected to increase and take ongreater importance in a knowledge-based economy.Colleges will continue to be challenged to provide flexible delivery methods. The availabilityof fmancial assistance will also be increasingly important.
O Supporting literacy and lifelong learning are becoming especially important as the Canadianpopulation, and in turn the workforce, becomes proportionately older. The provision of adulteducation and upgrading programs are key tools in supporting these objectives.
As an incentive for adults to complete their high school education, effective July 1, 1998British Columbia eliminated tuition fees for adult basic education courses at colleges andtechnical institutes. Students enrolled in these courses had previously been required to payabout $120 per course.In Ontario, a restructuring of the Literacy and Basic Skills (LBS) Program has been proposedin order to standardize funding across sectors. This may impact the program funding levelsto colleges. Changes are anticipated to be phased in over the next several years in order tominimize impact.
O The Ontario Ministry of Education and Training is currently undergoing a review of programs andservices for adult learners 21 years and older. The Adult Education Project will be looking atEnglish as a Second Language (ESL) programs, high school adult credit programs, the GeneralEducational Development (GED) high school equivalency diploma, and alternative deliverystrategies. The objective is to develop a more coordinated approach across all sectors. For ESLprograms the aim is also to move to contract based funding versus the current formulaic approachwhich may be a consideration for colleges.
O Changes to the funding of apprenticeship training announced by the Ontario government inJanuary 1998 are moving forward. These changes involve:
the introduction of tuition fees for the classroom component of apprenticeship training (topartially compensate for the federal government's withdrawal of funding) [this component hasbeen deferred pending the completion of a Labour Market Development Agreement with the FederalGovernment];
the introduction of fees for MET services such as registration and examinations;the introduction of a new legislative and regulatory framework that will focus more ontraining than on conditions for employment; andmore involvement of industry through industry advisory committees.expanding apprenticeship eligibility in the following sectors: high technology, manufacturing,service, hospitality and tourism.
source: Canadian Policy Research Networks Inc., Training for the New Economy: A Synthesis Repote. Betcherman, K. McMullen, K.Davidman, June 1998.
ACAATO EnVironmental Scan Section 241; 1998-99
-22-Education & Training
.30

O With the changes to the Apprenticeship Program, the availability and affordability of fmancialassistance will be an important consideration for prospective students.
A 1995 study of high school leavers indicated that apprenticeship training was the mostcommonly sought program for those who pursued postsecondary education.With many school leavers indicating family and work responsibilities, the tuition and relatedfees may become a barrier to accessing training if adequate financial assistance is not madeavailable.
O In response to the growing need for Canadian retailers to be competitive with U.S. rivals, inSeptember 1998 Ryerson Polytechnic University's School of Retail Management began offeringa four year Bachelor of Commerce degree. This is the first of this kind in Canada as comparedto over 50 university level programs currently offered in the United States. g
O As the knowledge economy becomes a global economy and boundaries between countriesbecome increasingly open, the degree credential will continue to grow in profile as aninternationally recognized credential.
O Career colleges, or private vocational schools, continue to be competitive training providersdespite tuition fees and related costs that are substantially higher than those at communitycolleges. Shorter program lengths and flexible delivery methods are attracting a growing numberof adult learners.
The majority of program growth has occurred in the areas of Business and Applied Arts.In 1997-98, 52% of those students at career colleges receiving financial assistance wereclassified as married or sole support in contrast to 32% at colleges of applied arts andtechnology and 10% at universities. In absolute numbers, however, there were more marriedand sole support students attending colleges of applied arts and technology. Ii
O In order to continue to respond to the education needs of students and to support thetransferability of credits, Ontario colleges of applied arts and technology and universities areexploring more partnership and articulation arrangements. The web site of the Ontario College-University Transfer Guide is scheduled to be launched by the College-University ConsortiumCouncil in 1998-99 which will raise awareness of these arrangements and students' educationalchoices.
See also Section 8: Learners
source: Human Resources Development Canada, Statistics Canada, After High School: The First Report of the School Leavers Follow-up Survey:1995, Catalogue No. LM-419-09-96.
source: as reported in Canadian HR Reporter, April 6, 1998.
hsee Exhibit 2.4
,, ACAATO Environmental Scan"I" 1998-9941111, -23-
31
Section 2Education & Training

Exhibit 2.1
Workplace Training and Education
Commissioned by the Royal Bank of Canada, the Angus Reid Group undertook a national workplacesurvey in 1996 with a sample size of 850 individuals to explore job satisfaction and security, trainingissues, the company and the spirit of entrepreneurship in Canada. The survey was conducted againin 1997, with a sample size of 1.000 individuals, and a summary report with comparative results wasreleased in January 1998. In summary:
O Keeping skills and knowledge up to date for their current job was the primary motivation forindividuals to seek further training:
Upgrade knowledge or skills for current job
Computer or technology related
Develop skills for different job
Develop skills for entirely different career
1997 1.1 1996
O Over the next year, 49% of survey respondents planned on taking courses to upgrade theirknowledge or skills for their current job, and a further 46% planned on taking computer ortechnology related courses.
O 43% cited 'keeping up to date' as a challenge for the workplace but only 18% ranked it as apersonal strength:
Challenge Strength
Flexibility 23% 41%Innovation 27% 33%Initiative 23% 26%Leadership 28% 25%Teamwork 12% 23%Responsibility 8% 21%Keeping up to date / learning 43% 18%
Source: The Angus Reid Group, Workplace 2000 Working Toward the Millennium: A portrait of working CanadialEall 1997
E IAACAATO Environmental Scan
'''''' 1998-99II P -24-
32
Section 2Education & Training
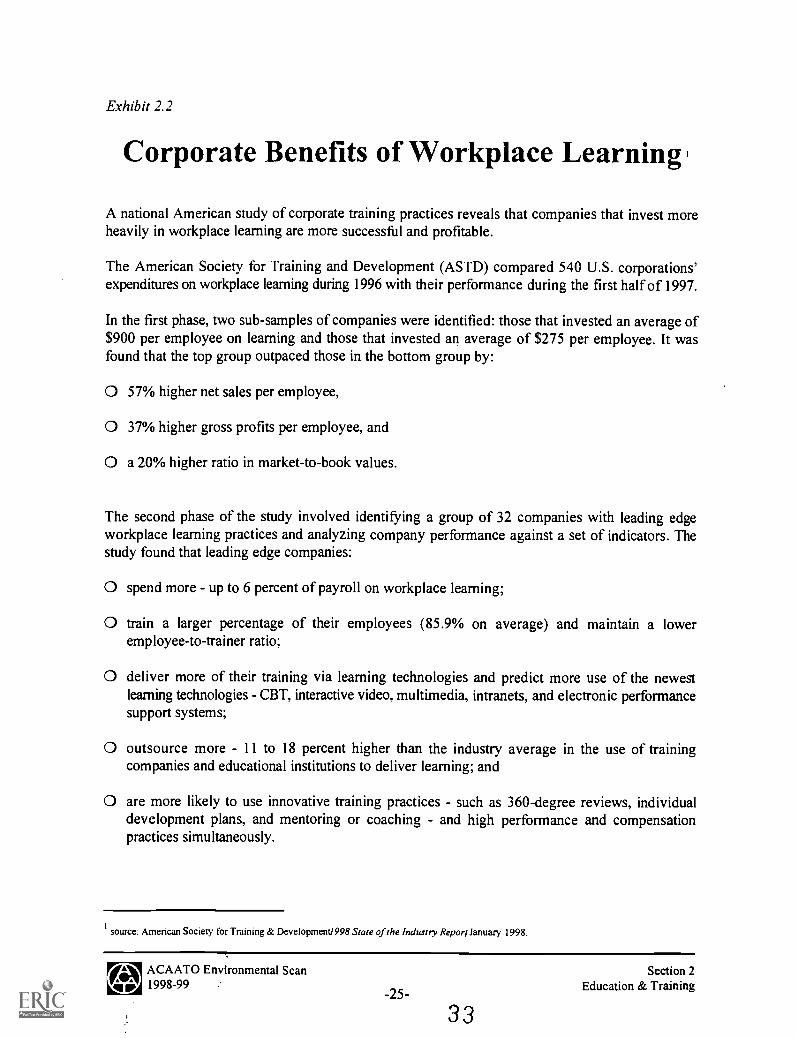
Exhibit 2.2
Corporate Benefits of Workplace Learning
A national American study of corporate training practices reveals that companies that invest moreheavily in workplace learning are more successful and profitable.
The American Society for Training and Development (ASTD) compared 540 U.S. corporations'expenditures on workplace learning during 1996 with their performance during the first half of 1997.
In the first phase, two sub-samples of companies were identified: those that invested an average of$900 per employee on learning and those that invested an average of $275 per employee. It wasfound that the top group outpaced those in the bottom group by:
O 57% higher net sales per employee,
O 37% higher gross profits per employee, and
O a 20% higher ratio in market-to-book values.
The second phase of the study involved identifying a group of 32 companies with leading edgeworkplace learning practices and analyzing company performance against a set of indicators. Thestudy found that leading edge companies:
O spend more - up to 6 percent of payroll on workplace learning;
O train a larger percentage of their employees (85.9% on average) and maintain a loweremployee-to-trainer ratio;
O deliver more of their training via learning technologies and predict more use of the newestlearning technologies - CBT, interactive video, multimedia, intranets, and electronic performancesupport systems;
O outsource more - 11 to 18 percent higher than the industry average in the use of trainingcompanies and educational institutions to deliver learning; and
O are more likely to use innovative training practices - such as 360-degree reviews, individualdevelopment plans, and mentoring or coaching - and high performance and compensationpractices simultaneously.
source: American Society for Training & DevelopmentI998 State of the Industry Report January 1998.
As ACAATO Environmental Scanvgrep 1998-99
-25-
33
Section 2Education & Training

Exhibit 2.3
Employer Performance Trends:Formal Trainers and Non-Trainers
Percent of Firms Reporting Significant Improvementfrom 1993-95, Based on 1993 Training Commitment
Overall Outlook
Productivity
Profits
Revenues
Notes:
0.0% 10.0% 20.0% 30.0%
Formal Trainers
Non-Trainers
40.0% 50.0% 60.0%
0 Benefits accrue to employee in terms of wage gains, increased self-confidence, greateremployability, improved job performance, and increased job satisfaction.
0 In addition to the benefits to firms in the areas of increased revenues, profitability, productivityand outlook, firms also benefit in terms of improved employee relations.
source: Canadian Policy Research Networks StudyDeveloping Skills in the Canadian Workplace - The Results of the Ekos Workplace TrainingSurvey, Betcherman, G., Leckie N., McMullen K., 1997 AS PRESENTED IN Training for the New Economy: A Synthesis RemBetchermanG., McMullen K., Davidman K., June 1998.
EAOv ACAATO Environmental ScanVW 1998-99
-26-
Section 2Education & Training

Exhibit 2.4
Career Colleges in OntarioGrowth in the number of delivery sites of major competitors:
1987-88 1991-92 1998-99 *
Academy of Learning 0 16 62
Toronto School of Business 6 14 30
Ontario Business College. 6 8 13
CDI Career Development Institutes 0 4 12
* As of May 28, 1998
Notes:
O Between 1997-98 and 1998-99, the number of delivery sites of the top four major career collegesincreased 13.6%, or by 14 delivery sites.
O Since the late 1980's, the majority of growth has occurred in the broad program areas of Businessand Applied Arts.
O While the number and profile of students enrolled in career colleges / private vocational schoolsacross the province is unknown, using OSAP awards data it can be determined that:
23,175 students in private vocational schools received both Canada and Ontario student loansthrough OSAP in 1997-98 2; an increase of 16% since 1993-94.
Of this number, approximately 36% were classified as independent, 29% as sole support, and23% as married. 12% were classified as dependent (either at home or away).
O In contrast, of the 73,450 students at colleges of applied arts and technology who receivedOSAP awards in 1997-98, approximately 34% were classified as independent, 12% as solesupport, and 10% as married. 44% were classified as dependent (again, either at home or away).
source: Private Vocational Schools, Ontario Ministry of Education and Training
2as of May 24, 1998
EAN ACAATO Environmental Scan Section 241, 1998-99 -
-27- Education & Training
35

Section 3:Funding & Income
1998-99 Environmental Scan
Funding & Income
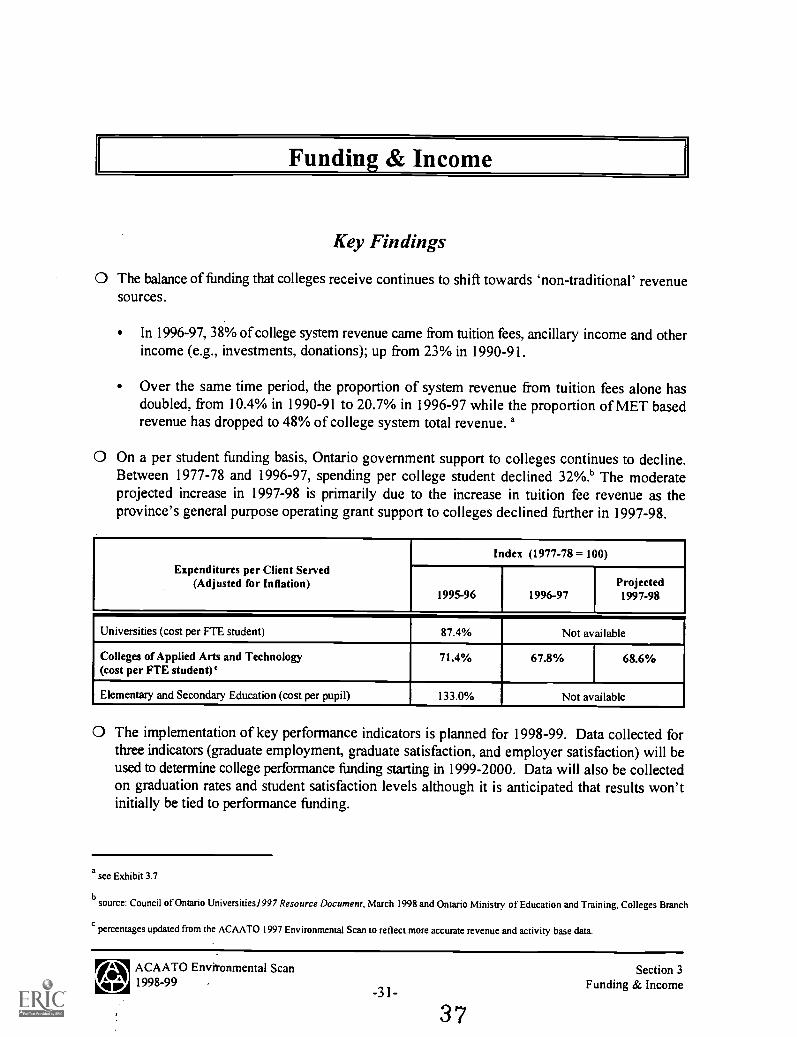
Key Findings
O The balance of funding that colleges receive continues to shift towards 'non-traditional' revenuesources.
In 1996-97, 38% of college system revenue came from tuition fees, ancillary income and otherincome (e.g., investments, donations); up from 23% in 1990-91.
Over the same time period, the proportion of system revenue from tuition fees alone hasdoubled, from 10.4% in 1990-91 to 20.7% in 1996-97 while the proportion of MET basedrevenue has dropped to 48% of college system total revenue. a
O On a per student funding basis, Ontario government support to colleges continues to decline.Between 1977-78 and 1996-97, spending per college student declined 32%.b The moderateprojected increase in 1997-98 is primarily due to the increase in tuition fee revenue as theprovince's general purpose operating grant support to colleges declined further in 1997-98.
Expenditures per Client Served(Adjusted for Inflation)
Index (1977-78 = 100)
1995-96 1996-97Projected1997-98
Universities (cost per Elt student) 87.4% Not available
Colleges of Applied Arts and Technology(cost per FTE student) C
71.4% 67.8% 68.6%
Elementary and Secondary Education (cost per pupil) 133.0% Not available
O The implementation of key performance indicators is planned for 1998-99. Data collected forthree indicators (graduate employment, graduate satisfaction, and employer satisfaction) will beused to determine college performance funding starting in 1999-2000. Data will also be collectedon graduation rates and student satisfaction levels although it is anticipated that results won'tinitially be tied to performance funding.
a see Exhibit 3.7
source: Council of Ontario Universities/997 Resource Document, March 1998 and Ontario Ministry of Education and Training, Colleges Branch
percentages updated from the ACAATO 1997 Environmental Scan to reflect more accurate revenue and activity base data.
E AsACAATO Envitonmental Scan
VG,/ 1998-99 -
-31-
37
Section 3Funding & Income

This initiative is part of the government's objective to demonstrate public sectoraccountability and is projected to be used to leverage change in other public sectors prior tothe next election.
The Ontario government plans to introduce a bill in 1998-99 that will require hospitals,nursing homes and other health care agencies to report publicly on their performance. Areasfor reporting being considered include: the number of nurses and the patient-nurse ratio, deathand disease rates, how long patients stay in the institution, and how often patients arereadm itted. d
0 While colleges continue to support demonstrating their accountability through the use of keyperformance indicators, efforts continue to achieve change in a separate but interrelated area, thedistribution mechanism of the general purpose operating grant.
The current formula based on each college's share of system activity over three years, withone slip year, has created a tendency to 'grow for growth's sake' in order to maintain one'sshare of the operating grant.
The 33% growth in college enrolment since 1990-91 corresponds with the high provincialunemployment rates characterizing this period: e
11
.*. ..*10
***". 75000
4
1987 1988 1989 1890 1991 1992 1893 1894 1995 1998
80000
..* .........
........
Provincial Unamploymant Rata (Y1)
das reported in the Toronto Star, June 16, 1998.
70000
a
F85000
80000
55000
50000
1997
1st Year Collage Enrolment (Y2)
e source: Statistics Canada, Labour Force Annual Averages, Catalogue No. 71-529 and Ontario Ministry of Education and Training
/A ACAATO Environmental Scan'Vgirp 1998-99
-32-
38
Section 3Funding & Income

While continuing to benefit the increasing number of Ontario residents seeking access toretraining and further education in order to be successful in an increasingly 'knowledge basedsociety', this growth, combined with government funding reductions, has had a negativeimpact on per student funding levels. Since 1990-91, it has decreased 42%; from $5,125 toapproximately $2,972 in 1997-98.
Per student funding is, however, projected to increase moderately in 1998-99 to $3,129with the reduction of 'off the top' targeted funds.
O A growing consideration for colleges is how to respond to the growing demand for training withfewer resources: between 1995-96 and 1996-97, skills training revenue to colleges from allsources (e.g., federal, provincial, and other contracts) declined 28% or approximately $100million.
O Colleges continue to serve as the main provider of apprenticeship training, although the numberof training days purchased from non-college trainers continues to increase. g
O The Federal government remains committed to withdrawing from funding training directly andis now negotiating with Ontario for the development of an agreement for a more coordinatedapproach to training. The outcomes of these negotiations are anticipated to have an impact onthe funding available for apprenticeship training, including the level of tuition fees for apprentices.
O Colleges will continue to be challenged to respond to the growing demand for this training withfewer resources.
O As colleges pursue corporate support in an increasingly competitive environment it is importantto demonstrate the tangible benefits that will accrue to the institution, the community, and thebenefactor as well as an urgency of need.
There is growing corporate interest in investing in human capital and the colleges'demonstrated responsiveness in meeting the education and training needs of individualsshould be an asset in cultivating support. h
O In response to strong concerns by industry of a 'high tech' skills shortage, the government hasestablished an 'Access to Opportunities' program which is intended to increase enrollment incomputer science and high demand engineering and related technology programs at both collegesand universities. $150 million over three years, including support for one-time start-up costs andnot including required industry funding support, has been committed for this program.
fsee Exhibit 3.3
8 see Exhibit 3.2
see Exhibit 3.10
(A ACAATO Environmental ScanE Section 3411; 1998-99
33-Funding & Income
-
3 9
O Effective 1998-99, colleges were given increased flexibility and discretion in the setting of tuitionfees by program. Under the new policy:
the maximum allowable fee increase for the majority of college programs in each of 1998-99and 1999-2000 is 5% for 'improving the quality of students' programs' with a further 5%allowable to invest in 'additional educational program improvements;deregulated fees for programs identified by Boards of Governors to have strong employmentprospects and an expectation of high incomes for graduates, as well as programs identifiedby the Ministry of Education and Training through the Access to Opportunities Programnoted above (the proviso that these programs are limited to a maximum of 15% of collegeenrolments);deregulated fees for post diploma programs;a maximum annual allowable increase of 20% for students currently enrolled in programs withderegulated fees; and30% of the annual increase in tuition fee revenues set aside for student financial assistance.
O Under the OSAP Program, the maximum allowable limit for tuition and incidental fees has beenset at $4,500. Colleges are required to provide financial assistance for students in need to coveramounts over $4,500.
O With this increased tuition fee setting flexibility, the availability of fmancial assistance and theOSAP maximum allowable limit will be increasingly important considerations for colleges,especially given the increased proportion of married and sole support students in the colleges.
Funds made available through the additional fee revenue and the $46.9 million raised throughthe Ontario Student Opportunity Trust Fund will address some of this need, however, thisissue is anticipated to remain a significant consideration for students in pursuing furthereducation.
For student information refer to Section 9: Learners
OA ACAATO Environmental Scan Section 31998-99 Funding & Income
-34-
4 0

Exhibit 3.1
College System Revenue I
REVENUESOURCE
1993-94(millions)
1994-95(millions)
1995-96(millions)
1996-97(millions)
General PurposeOperating Grant
708.3 696.9 691.7 604.3
Skills Training:Federal Purchases
95.1 95.5 79.3 57.0
Skills Training:MET/OTAB
167.9 185.7 169.3 108.8
Skills Training:Other Contracts
117 122.6 114.0 96.5
Specific PurposeOperating Grant
112.7 101 110.5 87.1
Capital Grants 59 29.8 84.1 29.0
Tuition Fees 231.3 245 275.2 309.3
Ancillary Income 126.4 129 132.6 124.1
Other Income 68.5 78.9 76.5 80.0
TOTAL*:I
1,686.2 I 1,684.4 I 1,733.2 I 1,496.1
Notes: Due to differing accounting and reporting methodologies used, CFIS revenues ascribed to an identifiedfunding agency or source may not reconcile precisely with the accounts of the agency and source for agiven year.
* Total Revenue is taken directly from CFIS reports. Revenue Sources may not add up due torounding.
Ontario Ministry of Education and Training, College Financial Information System, Summary Report, January 29, 1998
ACAATO Environmental Scan1998-99
-35- 4 1
Section 3Funding & Income

Exh
ibil
3.2
Act
ivity
Bas
e Fu
nded
by
the
Gen
eral
Pur
pose
Ope
ratin
g G
rant
'
Act
ivity
Bas
e (c
onve
rted
to F
undi
ng U
nits
)
YE
AR
Full-
Tim
ePo
stse
cond
ary
Inde
x of
Act
ivity
(198
6-87
=10
0)
Full-
Tim
eT
uitio
n Sh
ort
Inde
x of
Act
ivity
(198
6-87
=10
0)
Part
-Tim
ePo
stse
cond
ary
Inde
x of
Act
ivity
(198
6-87
=10
0)
Part
-Tim
eN
on-P
ost-
seco
ndar
y
Inde
x of
Act
ivity
(198
6-87
=10
0)
198-
6437
100,
830.
810
0.0%
5,29
5.5
100.
0%8,
935.
210
0.0%
5,89
6.9
100.
0%
1987
-88
100,
704.
999
.9%
5,47
2.4
103.
3%8,
971.
310
0.4%
6,57
5.5
111.
5%
1988
-89
100,
030.
499
.3%
5,87
9.8
111.
0%9,
336.
210
4.5%
6,68
1.1
113.
3%
1989
-90
102,
215.
810
1.4%
5,63
8.5
106.
5%8,
827.
798
.8%
6,70
3.2
113.
7%
1990
-91
109,
554.
010
8.7%
6,92
2.2
130.
7%9,
827.
811
0.0%
7,36
9.1
125.
0%
1991
-92
141,
657.
514
0.5%
8,08
7.9
152.
7%10
,969
.512
2.8%
7,64
2.4
129.
6%
1992
-93
151,
589.
115
0.3%
8,52
8.6
161.
1%15
,100
.316
9.0%
9,79
0.6
166.
0%
1993
-94
156,
745.
315
5.5%
8,32
2.9
157.
2%14
,632
.516
3.8%
9,23
1.5
156.
5%
1994
-95
161,
087.
115
9.8%
7,92
0.3
149.
6%13
,761
.315
4.0%
8,43
5.7
143.
1%
1995
-96
169,
269.
616
7.9%
7,34
4.5
138.
7%13
,455
.115
0.6%
8,61
8.0
146.
1%
1996
-97
167,
722.
316
6.3%
6,02
0.8
113.
7%12
,579
.814
0.8%
8,03
0.6
136.
2%
Par
t-T
ime
Pos
tsec
onda
ry in
clud
es:
Man
dato
ry P
osts
econ
dary
Pos
tsec
onda
ry E
lect
ives
Pos
t-di
plom
a H
ealth
l'art
-Tim
e N
on-P
osts
econ
dary
incl
udes
:B
asic
Com
mun
icat
ion
and
Num
eric
Ski
llsM
isce
llane
ous
Occ
upat
iona
l Cer
tific
atio
nT
uitio
n S
hort
Cou
rses
Prio
r Le
arni
ng A
sses
smen
t (as
of 1
993-
94)
Oth
er V
ocat
iona
lO
ntar
io M
anag
emen
t Dev
elop
men
t Pro
gram
(O
MD
P)
Not
e:N
ew p
rogr
am w
eigh
ts fo
r fu
ll-tim
e po
stse
cond
ary
intr
oduc
ed 1
991-
92. N
ew p
art-
time
conv
ersi
on fo
rmul
a in
trod
uced
effe
ctiv
e 19
92-9
3.
sour
ce: O
ntar
io M
inis
try
of C
olle
ges
and
Uni
vers
ities
, Col
lege
Affa
irs B
rand
t, S
umm
ary
of In
form
atio
n R
elev
ant t
o th
e G
ener
al P
urpo
se O
pera
ting
Gra
nt A
lloca
tions
. 198
1-82
to 1
990-
91, J
une 1
990
(as
pres
ente
d in
the
1993
AC
AA
TO
Env
ironm
enta
l Sca
n), a
nd 1
990-
97 d
ata
from
Min
istr
y of
Edu
catio
n an
d T
rain
ing,
Col
lege
s B
ranc
h
( ql IP
AC
AA
TO
Env
ironm
enta
l Sca
n19
98-9
9
4 2
-36-
Sec
tion
3F
undi
ng &
Inco
me
4 3
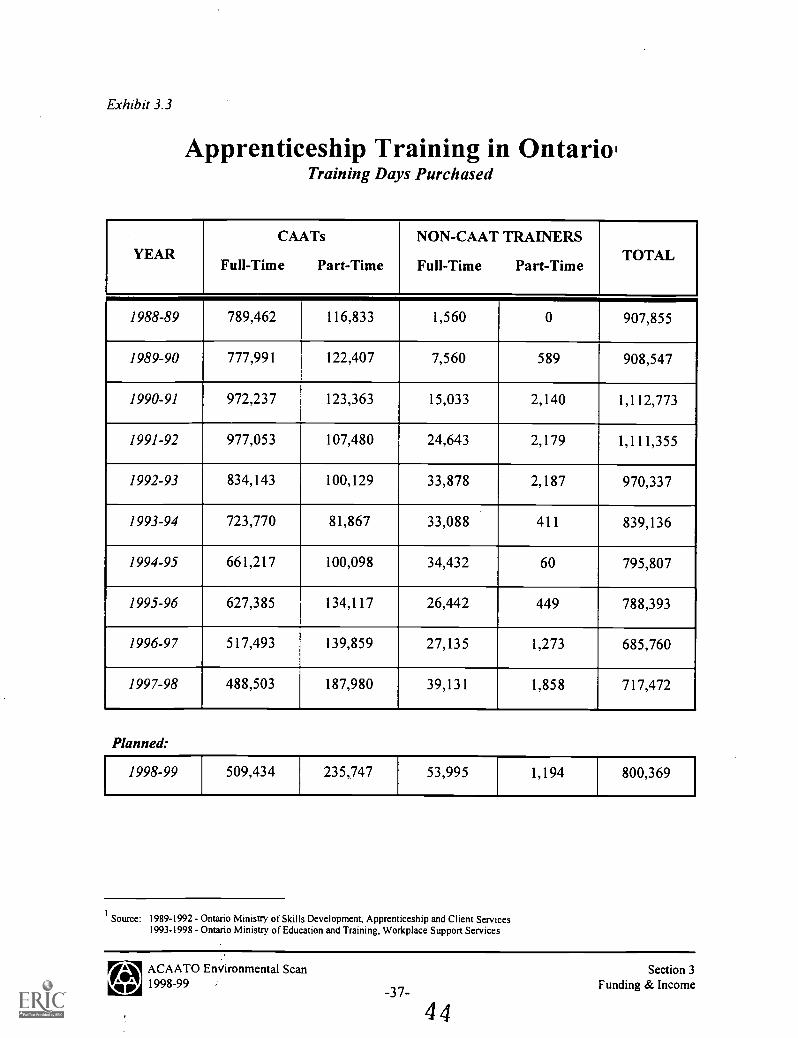
Exhibit 3.3
Apprenticeship Training in Ontario'Training Days Purchased
YEARCAATs
Full-Time Part-Time
NON-CAAT TRAINERS
Full-Time Part-TimeTOTAL
1988-89 789,462 116,833 1,560 0 907,855
1989-90 777,991 122,407 7,560 589 908,547
1990-91 972,237 123,363 15,033 2,140 1,112,773
1991-92 977,053 107,480 24,643 2,179 1,111,355
1992-93 834,143 100,129 33,878 2,187 970,337
1993-94 723,770 81,867 33,088 411 839,136
1994-95 661,217 100,098 34,432 60 795,807
1995-96 627,385 134,117 26,442 449 788,393
1996-97 517,493 139,859 27,135 1,273 685,760
1997-98 488,503 187,980 39,131 1,858 717,472
Planned:
1998-99 509,434 235,747 53,995 1,194 800,369
Source: 1989-1992 - Ontario Ministry of Skills Development, Apprenticeship and Client Services1993-1998 - Ontario Minisuy of Education and Training, Workplace Support Services
IA EACAATO EnVironmental Scan
VW 1998-99-37-
4 4
Section 3Funding & Income

Exhibit 3.4
General Purpose Operating Grants'Over 10 years
Fiscal Year Activity Base(Weighted Funding Units
supported by grant) 2
General PurposeOperating Grant'
Grant perWeighted
Funding Unit'
1987-88 121,724.1 586,836,175 $4,821
1988-89 121,927.5 613,243,803 $5,030
1989-90 123,385.2 645,773,556 $5,234
1990-91 133,673.1 685,039,064 $5,125
1991-925 168,357.3 723,192,315 $4,296
1992-93 185,008.6 739,947,106 $4,000
1993-94 188,932.2 700,747,370 $3,709
1994-95 191,204.4 690,747,370 $3,613
1995-96 196,667.8 684,961,891 $3,483
1996-97 194,353.3 597,621,175 $3,075
Projected
1997-986 195,663.8 581,595,887 $2,972
1998-99 195,663.8 612,153.320 $3,129
1
Ontario Ministry of Education and Training, Colleges Branch, April 21, 1998.
2den from annual audit of enrolment report. The number shown represents the reported weighted funding units for the activity year, not the two or
three year historical average used in the actual grant calculations.
3does not include special purpose grants. General Purpose Grant allocation for 1993-94 to 1995-96 has been reduced by $40 million to reflect the
impact of the social contract reduction. GPOG allocation for 1997-98 does not include the amounts set aside for the Strategic Programs InvestmentFund or Common Information Systems. In 1998-99, the GPOG allocation does not incude the amount set aside for Ministry initiatives.
4not adjusted for inflation. Not adjusted to reflect the additional impact of geographic and economy of scale adjustments included in the annual grant
calculation.
51991-92 first activity year with new weights. Introduction of the new weights caused an inflation in the number of weighted funding units.
6estimate, derived by increasing the 1996-97 activity base (weighted funding units supported by grant) by the percentage increase in enrolment
reported in the November 1997 and March 1998 enrolment reports by OCAS
7Assuming flatline enrolment.
E Ai ACAATO Environmental ScanviTIP 1998-99 -38-
4 5
Section 3Funding & Income
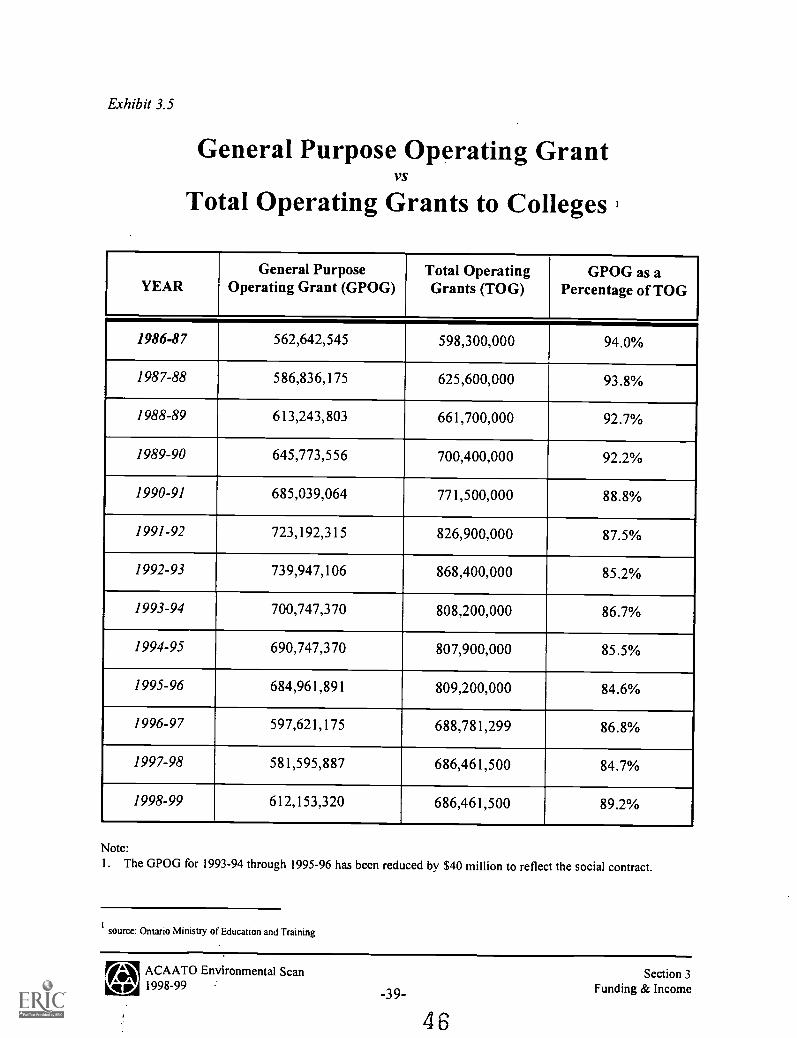
Exhibit 3.5
General Purpose Operating GrantVS
Total Operating Grants to Colleges
YEARGeneral Purpose
Operating Grant (GPOG)Total OperatingGrants (TOG)
GPOG as aPercentage of TOG
1986-87 562,642,545 598,300,000 94.0%
1987-88 586,836,175 625,600,000 93.8%
1988-89 613,243,803 661,700,000 92.7%
1989-90 645,773,556 700,400,000 92.2%
1990-91 685,039,064 771,500,000 88.8%
1991-92 723,192,315 826,900,000 87.5%
1992-93 739,947,106 868,400,000 85.2%
1993-94 700,747,370 808,200,000 86.7%
1994-95 690,747,370 807,900,000 85.5%
1995-96 684,961,891 809,200,000 84.6%
1996-97 597,621,175 688,781,299 86.8%
1997-98 581,595,887 686,461,500 84.7%
1998-99 612,153,320 686,461,500 89.2%
Note:1. The GPOG for 1993-94 through 1995-96 has been reduced by $40 million to reflect the social contract.
source: Ontario Ministry of Education and Training
EAI ACAATO Environmental Scanviii-jp1 1998-99
-39-
4 6
Section 3Funding & Income

Exhibit 3.6
College Tuition Fees, 1998-991
Province 1990-91 Fees
($)
1998-99 Fees($)
% Increase
Ontario 740 1,543 109%
Alberta (average) 573 1,923 236%
British Columbia (average) 1,060 1,575 49%
Manitoba (average) 605 1,322 119%
New Brunswick 500 2,000 300%
Newfoundland 484 1,452 200%
Nova Scotia (average) 766 1,200 57%
Quebec nil nil n/a
Prince Edward Island 1,118 2,000 79%
Saskatchewan 720 1,980 175%
1
MET Telephone Survey of Fees, Report Date March 9, 1998
IA EACAATO Environmental Scan
'F'1" 1998-99411P -40-4 7
Section 3Funding & Income
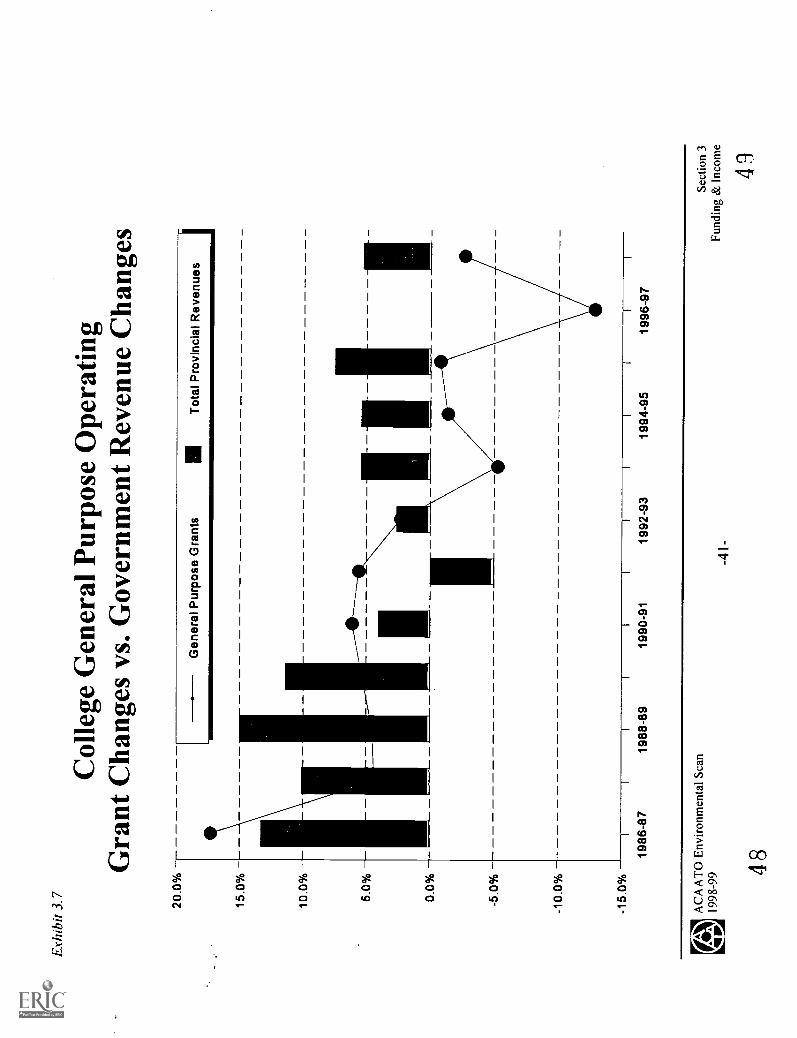
Exh
ibit
3.7
Col
lege
Gen
eral
Pur
pose
Ope
ratin
gG
rant
Cha
nges
vs.
Gov
ernm
ent R
even
ue C
hang
es
20.0
%
15.0
%
10.0
%
5.0%
0.0%
-5.0
%
-10.
0%
Gen
eral
Pur
pose
Gra
nts
Tot
al P
rovi
ncia
l Rev
enue
s
-15.
0%
1986
-87
1988
-89
1990
-91
1992
-93
1994
-95
1996
-97
1n/)
kA
CA
AT
O E
nviro
nmen
tal S
can
V4I
V19
98-9
9 4 8
-41
-
4 9

Exh
ibit
18
15.0
%
10.0
%
5.0%
0.0%
-5.0
%
-10.
0%
Cha
nge
in C
olle
ge S
yste
m R
even
ueB
etw
een
1990
-91
and
1996
-97,
by
Sour
ce!
10.3
%
-16.994
ME
TO
ther
Ont
ario
Fed
eral
Tui
tion
Anc
illar
yO
ther
sour
ce: O
ntar
io M
inis
try
of E
duca
tion
and
Tra
inin
g, C
olle
ge F
inan
cial
Info
rmat
ion
Sys
tem
Rep
orts
i.iA
CA
AT
O E
nvir
onm
enta
l Sca
nrw
l 199
8-99
IIP
5 0
-42-
Sect
ion
3Fu
ndin
g &
Inc
ome
5 1

Exhibit 3.9
Full-time Postsecondary Enrolment
The General Purpose Operating Grant'
160000
140000
120000
100000T-
sO 80000E
ui 60000
40000
20000
6000
1987 1988 1989 1990 1991 1992 1993 1994 1995 1996 1997
Legend
Operating Grant per Adjusted Funding Unit (Y2)First Year Enrolment (Y1)
Total Enrolment (Y1)
1
source: 1987 to 1994, Ministry of Education and Training OCIS and CAAT 2 surveys (excluding sponsored and International Students) November 1count 1995, 1996 and 1997 figures are from OCAS enrolment counts.
ACAATO Environmental Scan Section 31998-99 .
-4 3 -
5 2
Funding & Income

Exhibit 3.10
Trends in Corporate Giving in Canada
A Spring 1998 news bulletin from Ketchum Fund Raising Counsel, with data from the CanadianCentre for Philanthropy, provides detailed information regarding trends in corporate giving in Canada.By means of summary:
O In 1995, Canadian corporations reported charitable donations totalling $629 million whichrepresents 0.98% of 1995 Canadian pre-tax profits of $64 billion. The Centre for Business in theCommunity of the Conference Board of Canada revealed that corporate giving increased 6% in1996 and a projected 7% in 1997.
O By sector, the distribution of corporate contributions were as follows:
Hospitals/Health
111 Education
111 OtherSocial ServicesArts & Culture
O A Fall 1996 survey by the Canadian Centre for Philanthropy revealed that 50% of all corporatedonations go to charities with revenues exceeding $1.5 million and that over 40% of corporatesupport goes to not-for-profit organizations in Ontario.
O A 1995-96 Corporate Community Investment in Canada survey revealed that perceived needs ofthe community and support for company business are key factors considered in selecting charities.Employee areas of interest are also important factors in determining corporate support.
O The Fund Raising Counsel's campaign experience reveals a growing corporate interest ininvesting in human capital as opposed to contributing to major building projects associated withnot-for-profit organizations that are perceived as being overbuilt (e.g., hospitals and universities).
O Fast growing and high profit companies in the areas of finance, computer products,communications equipment and automotive parts is creating a new group of companies fromwhich not-for-profit organizations can begin to cultivate support. Relationship building includingdemonstrating how charitable giving will support business and community objectives will beespecially important to establish a pattern of giving.
1
Ketchum Fund Raising Counsel.Phdanthropic Trends. Spring 1998.
A9C9A8ATO Environmental Scan Section 3
44-Funding & Income
-
53
Section 4:Information Technology
1998-99 Environmental Scan
CO
Information Technology
Key Findings
0 Recognition is growing that people and the culture of the organization are critical factors insuccessfully integrating new technologies into the curriculum and the organization.
Provisions in the final version of a contract negotiated between York University and itsfaculty indicate that "professors would not be forced to use technology in their classroomsor to deliver courses over the Internet". Decisions to use technology for enhancing classroomsessions or for delivering courses to remote locations using video conferencing "shall beconsistent with the pedagogic and academic judgements and principles of the facultymember". It also specifies that "a faculty member will not be required to convert a coursewithout his/her agreement". a
In early 1998, as part of a labour dispute at Acadia University in Nova Scotia, facultysuspended their participation in the "Acadia Advantage" program. Under this program,students pay a tuition of approximately $5,000 and in return they receive a laptop computer,access to the Internet from almost anywhere on campus, training support, and the capacityto connect their computers in classroom and download notes and other material from theirinstructor's computer. As part of the labour dispute, faculty members unplugged theirclassroom computers which meant that students could not connect electronically withprofessors either in the classroom or by e-mail.
In a 1997 survey of information technology executives, 80% of respondents believed thattheir current work process and structures were not supportive of new systems beingimplemented. In addition, over 60% believed that current information technology staff skillswere not compatible with the new systems underway. e
0 In support of the human resource challenges in integrating new technologies, a 1997 survey ofHR executives indicates a growing trend for learning technologies that are flexible, easilycustomized, and able to be implemented quickly without a large change in infrastructure. d
a source: As reported in The Chronicle of Higher Education, Section: Information Technology, October 3, 1997.
bsource: As reported in The Chronicle of Higher Education, Section: International, February 13, 1998.
source: The Hay Group, The Hay Group's Second Annual Information Technology Strategy Survey, October 21, 1997.
see Exhibit 4.1
EtiA ACAATO Environmental Scan Section 44 1 ii, 1998-99 Information Technology47-

O Traditional, on-campus students are increasingly accessing distance education courses as a wayof easing busy schedules and balancing responsibilities. The need for flexible and customizedprogramming continues to increase.
At the University of Manitoba, in 1995, 65% of distance education students were 26 yearsold or younger and 66% of that proportion were also taking courses on campus.
The University of Colorado at Denver found that of 609 students enrolled in its distanceeducation program in Spring 1998, more than 500 were also taking regular courses in thecampus's classrooms. e
O Researchers in British Columbia have discovered that the appearance and structure of an on-linecourse can be as important as the lessons it conveys. Important factors include: integratingmaterial from other parts of the Web through the use of hyperlinks, consistent menus and othernavigational tools, accessibility through most Web browsers (including text-only versions), andinstructor disclosure and credibility (who is actually responsible for courses' content).
O The number of Ontario households going on-line continues to grow at an increasing rate; 41%of households in 1997 had a computer and of this proportion, 62% had a modem while 38% werealso using the Internet. g
It is also significant to note that 59% of Ontario households did not have a computer in 1997.The number of households without this technology continues to decline but at a slower ratethan those going on-line. For these households, the availability of and access to newtechnologies at schools and through workplaces will be increasingly important as a means foracquiring the skills to be successful in the increasingly knowledge-based economy.
O TV-based access devices are fast becoming the leading non-PC Internet access device in theUnited States and this trend may extend to Canada with the June 1998 launch of ' WebTV' inCanada by Microsoft.
72% of American subscribers to this service have indicated their preference for this approachbecause it gives them access to electronic mail and the Internet without the cost of a homecomputer.
With this technology, an opportunity may exist for colleges to reach a broader range ofindividuals via on-line programming. h
esource: The Chronicle of Higher Education, Section: Information Technology, March 27, 1998.
source: The Chronicle of Higher Education, Section: Information Technology, February 27, 1998.
see Exhibit 4.2
hsource: The Globe and Mail,Get your sets ready for Web71! June 10, 1998, Page E3.
E(A ACAATO Environmental Scan Section 441; 1998-99
-48- Information Technology
56
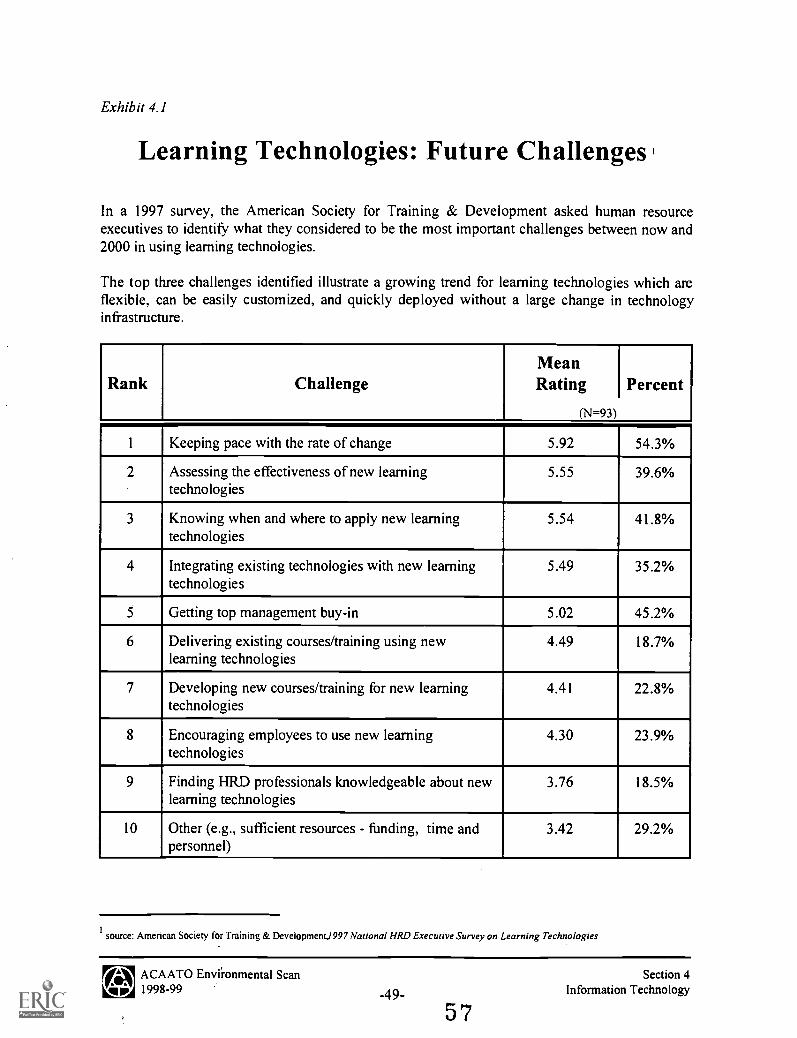
Exhibit 4.1
Learning Technologies: Future Challenges
In a 1997 survey, the American Society for Training & Development asked human resourceexecutives to identify what they considered to be the most important challenges between now and2000 in using learning technologies.
The top three challenges identified illustrate a growing trend for learning technologies which areflexible, can be easily customized, and quickly deployed without a large change in technologyinfrastructure.
Rank ChallengeMeanRating
(N=93)
Percent
1 Keeping pace with the rate of change 5.92 54.3%
2 Assessing the effectiveness of new learningtechnologies
5.55 39.6%
3 Knowing when and where to apply new learningtechnologies
5.54 41.8%
4 Integrating existing technologies with new learningtechnologies
5.49 35.2%
Getting top management buy-in 5.02 45.2%
6 Delivering existing courses/training using newlearning technologies
4.49 18.7%
7 Developing new courses/training for new learningtechnologies
4.41 22.8%
8 Encouraging employees to use new learningtechnologies
4.30 23.9%
9 Finding I-1RD professionals knowledgeable about newlearning technologies
3.76 18.5%
10 Other (e.g., sufficient resources - fiinding, time andpersonnel)
3.42 29.2%
source: American Society for Training & DevelopmentJ997 National HR.D Executive Survey on Learning Technologies
EAI ACAATO Envii.onmental Scanvia/ 1998-99 -49-
Section 4Information Technology

Exh
ibit
4.2
Ont
ario
Hou
seho
lds
with
Hom
e C
ompu
ters
,C
ompu
ter
Mod
ems,
and
Acc
ess
to I
nter
net
1991
1992
1993
1994
1995
1996
,
1997
(`00
0's)
Num
ber
of H
ouse
hold
sI
3,58
51
3,64
7I
3,76
53,
820
14,
143
I4,
193
I4,
227
With
hom
e co
mpu
ter
(1)
768
829
983
1,07
81,
346
1,50
31,
720
...w
ith c
ompu
ter
mod
ems
(2)
378
602
740
1,05
8
...us
ing
Inte
rnet
(3)
----
--36
364
8
With
out h
ome
com
pute
r[
2,81
7I
2,81
8I
2,78
3I
2,74
21
2,79
7I
2,69
0I
2,50
7
(1)
(2)
(3)
Exc
lude
s sy
stem
s w
hich
can
onl
y be
use
d to
pla
yga
mes
or
are
used
exc
lusi
vely
for
bus
ines
s pu
rpos
es.
Incl
udes
inte
rnal
and
ext
erna
l uni
tsIn
clud
es o
nly
thos
e ho
useh
olds
acc
essi
ng th
e In
tern
et f
rom
hom
e.
sour
ce: S
tatis
tics
Can
ada,
Hou
seho
ld F
acili
ties
and
Equ
ipm
ent S
urve
y, C
atal
ogue
No.
64-
202
E"A
AC
AA
TO
Env
iron
men
tal S
can
7471
0 19
98-9
9
5 8
-50-
Sect
ion
4In
form
atio
n T
echn
olog
y
5 9
Section 5:Ontario Population
1998-99 Environmental Scan
60

Ontario Population
Key Findings
O In 1996, the majority of the Ontario population was located in the Greater Toronto Area (43%)followed by 27.5% in the Southwest region, 16.4% in the Eastern region, and 5.4% in the Centralregion. 7.7% of the population resided in the North which is down from 8.2% in 1991. a
O While the Ontario population grew 6.6% between 1991 and 1996, slightly higher than the nationalaverage of 5.7%, there was significant variation by region:
There was virtually no population change in the Northern regions; the result being a shift inthe population towards those aged 45 and older.The largest percentage increase occurred in the Central region, although in absolute numbersthe majority of the increase occurred in the Greater Toronto Area.Both the Eastern and Southwest regions experienced growth approaching the nationalaverage.
O Between 1991 and 1996, the age distribution of the Ontario population as a whole remainedrelatively proportionate, though moderately older:
Although two-thirds of the population increase between 1991 and 1996 occurred in thoseaged 45 and older, this age group continues to comprise approximately one-third of the totalpopulation.Almost 25% of the population increase occurred in the 0 to 14 age group while the numberof those aged 20 to 24 declined 5.1%.
O This proportionate increase occurred in virtually all regions with the exception of the Northernregions.
The challenge of meeting the skills training and education needs of an increasingly olderpopulation across a larger geographic area is especially important for colleges in theseregions.
asee Exhibit 5.1
bsee Exhibits 5.2 and 5.3
IA ACAATO EnVironmental ScanViVir 1998-99 .
Section 5Ontario Population

O The number of youths under the age 25 is projected to continue to increase although at a slowerrate. They are projected to become a smaller proportion of the total population as the populationages.
The challenges of providing flexible programming, recognizing and assessing 'informal'learning and adapting teaching methods for an increasingly older population are anticipatedto continue for all colleges.The introduction of key performance indicators (KPI) for graduate placement and satisfaction,employer satisfaction as well as student satisfaction and graduation rates increases theimportance of responding to these challenges. d
O Increased life expectancy and death rates and declining fertility and birth rates accentuate thetrend towards a proportionately older Canadian population. Both the provincial and nationalpopulation and labour force growth in future will increasingly depend on immigration.
O The diversity of the Canadian population continues to increase, in large part to changingimmigration patterns. In the 1996 Census: e
4.7 million people reported a mother tongue other than English or French, a 15.1% increasefrom 1991, although only 2.8 million people reported speaking a non-official language athome.Almost 80% of immigrants between 1991 and 1996 reported a language other than Englishor French as mother tongue. More than half were from Asia and the Middle East.3.2 million people identified themselves as members of a visible minority.
O The increasing diversity of the Canadian population is, in turn, changing the composition of theOntario population, especially in its urban population:
42% of immigrants between 1991 and 1996 settled in Toronto.53% of the Canadian visible minority population resided in Ontario and of this proportion,80%, primarily of Chinese and South Asian descent, resided in Toronto.Members of visible minorities made up 12% of the Ottawa-Hull population.
O As the population becomes increasingly diverse, cultural diversity and sensitivity will beincreasingly important for colleges.
c see Exhibit 5.4
see also Section 3.0: Funding and Income.
source: Statistics Canada, Census 1996: Mother Tongue, Home Language and Knowledge of Languages, December 2, 1997
fsource: Statistics Canada, Census 1996: Ethnic Origin, Visible Minorities, February 17, 1998.
(A ACAATO Environmental ScanE Section 541; 1998-99
54-Ontario Population
-
82

Exhibit 5.1
Ontario Population Growth 1by Region
1991 1996% Change1991 - 1996
# Change1991 - 1996
1,672,320 1,766,640 5.6%East 94,320
Central 525,920 579,295 10.1% 53,375
GTA 4,235,735 4,628,880 9.3% 393,145
Northeast 581,910 582,175 0.0% 265
Northwest 240,550 244,120 1.5% 3,570
Southwest 2,828,340 2,952,465 4.4% 124,125
All Regions 10,084,775 10,753,575 6.6% 668,800
Notes:
East: includes the counties of Frontenac, Haliburton, Hastings, Lanark, Leeds and Grenville, Lennoxand Addington. Northumberland, Peterborough Prescott and Russell, Prince Edward, Renfrew,Stormont, Dundas and Glengarry, Victoria, and the Regional Municipality of Ottawa-Carleton.
Central: includes the counties of Bruce, Dufferin, Grey, Simcoe, and the Muskoka District Municipality.
GTA: includes the Regional Municipalities of Durham, Halton, Peel, York and the ToronbMetropolitan Municipality.
Northeast: includes the districts of Algoma, Cochrane, Nipissing, Parry Sound, Sudbury, Timiskaming andthe Sudbury Regional Municipality.
Northwest: includes the districts of Kenora, Rainy River and Thunder Bay.
Southwest: includes the counties of Brant, Elgin, Essex, Huron, Kent, Lambton, Middlesex, Oxford, Perth,Wellington and the Regional Municipalities of Haldimand-Norfolk, Hamilton-Wentworth,Niagara, and Waterloo.
1
source: 1991 and 1996 Population counts from: Statistics Canada. Census 1991 and 1996, Special Tabulations.
OA ACAATO Environmental Scan Section 51998-99 Ontario Population
-55-
63

Exh
ibit
5.2
Ont
ario
Pop
ulat
ion
byA
ge G
roup
and
Reg
ion,
199
61
Eas
tC
entr
alG
TA
Nor
thea
stN
orth
wes
tS
outh
wes
t
0 -
1435
6,56
012
7,70
593
7,99
011
8,03
554
,115
619,
805
15 -
19
112,
025
37,8
8029
0,27
542
,565
17,5
7019
7,71
0
20 -
24
111,
450
31,5
2530
8,92
038
,360
16,4
7519
6,74
5
25 -
44
558,
165
176,
135
1,59
4,23
017
5,01
076
,880
915,
830
45 -
64
388,
550
124,
860
988,
620
133,
700
49,4
0562
2,39
5
65 +
239,
890
81,1
9050
8,84
574
,505
29,6
7539
9,98
0
All
Age
s1,
766,
640
579,
295
4,62
8,88
058
2,17
524
4,12
02,
952,
465
sour
ce:
1991
and
199
6 P
opul
atio
n co
unts
from
: Sta
tistic
s C
anad
a, C
ensu
s 19
91 a
nd 1
996,
Spe
cial
Tab
ulat
ions
.
AC
AA
TO
Env
iron
men
tal S
can
vzp
1998
-99
6 4
-56-
Sect
ion
5O
ntar
io P
opul
atio
n
65

Exh
ibit
5.3
Ont
ario
Pop
ulat
ion
Cha
nge
1991
and
199
6by
Age
Gro
up a
nd R
egio
n'
Eas
tC
entr
alG
TA
Nor
thea
stN
orth
wes
tSo
uthw
est
0 -
146.
0%10
.7%
13.3
%-5
.9%
-0.1
%4.
1%
15 -
19
2.4%
5.9%
5.9%
-6:1
%-1
.4%
0.5%
20 -
24
-4.4
%-0
.9%
-6.4
%-3
.3%
-5.3
%-4
.4%
25 -
44
-0.1
%4.
8%5.
0%-4
.2%
-2.5
%0.
5%
45 -
64
16.0
%21
.3%
16.5
%9.
4%10
.7%
12.2
%
65 +
11.0
%12
.8%
16.5
%12
.0%
7.1%
9.8%
All
Age
s5.
6%10
.1%
9.3%
0.0%
1.5%
4.4%
sour
ce: S
tatis
tics
Can
ada,
Cen
sus
1991
and
199
6, S
peci
al T
abul
atio
ns.
AC
AA
TO
Env
iron
men
tal S
can
1998
-99
ir("
)
-57-
Sect
ion
5O
ntar
io P
opul
atio
n
6 7

Exh
ibit
5.4
Ont
ario
Pop
ulat
ion
Proj
ectio
nsby
Age
Gro
up'
2001
2011
2021
% C
hang
e20
01 -
202
1#
Cha
nge
2001
- 2
021
0 -
142,
384,
835
2,40
5,87
7..
2,48
8,68
44.
4%10
3,84
9
15 -
19
783,
014
885,
235
860,
434
9.9%
77,4
20
20 -
24
769,
910
901,
537
930,
538
20.9
%16
0,62
8
25 -
44
3,91
8,43
73,
840,
937
4,06
0,06
43.
6%14
1,62
7
45 -
64
2,79
6,10
93,
826,
616
4,16
1,22
848
.8%
1,36
5,11
9
65 +
1,54
4,10
81,
956,
134
2,71
4,28
175
.8%
1,17
0,17
3
All
Age
s12
,196
,413
13,8
16,3
3615
,215
,229
24.8
%3,
018,
816
sour
ce: O
ntar
io M
inis
tiy o
f Fin
ance
Cou
nty
Pop
ulat
ion
Pro
ject
ions
: 199
2 -
2021
, May
199
5.
.n01
% A
CA
AT
O E
nviro
nmen
tal S
can
r4v,
1998
-99
68
-58-
Sec
tion
5O
ntar
io P
opul
atio
n
6 9

Section 6:Public Policy
1998-99 Environmental Scan
0
1
7 0

Public Policy
Key Findings
O Expenditures on education are increasingly being seen by government as an investment that isintegral to social and economic development.
O Initiatives announced through the 1997 and 1998 Federal budgets are designed to support accessto, and the affordability of, postsecondary education. They also signal a growing recognition ofthe changing pattern of learning that is resulting because of economic and family responsibilities.Examples include:
establishing the Millennium Scholarship Fund through a $2.5 billion endowment. Beginningin 2000, scholarships averaging $3,000 a year will be awarded on the basis of both financialneed and merit.extending student loans and related education tax and child care credits to part-time students.introducing special opportunity grants for students with dependents.allowing RRSP savings to be used for educational purposes.enhancing the attractiveness of Registered Educational Savings Plans (RESPs) by providingCanada Education Savings Grants for contributions made to these plans.reforming student loan repayment to include a tax credit on interest accrued, extending theinterest relief and the repayment period, and providing debt reduction measures for individualsin financial difficulty.
O The Ontario government through its 1998 Budget established the Canada-Ontario MillenniumFund. It will be made up of the province's existing share of the Federal government's MillenniumFund as well as both Federal and Ontario spending on student loans for a total commitment of$9 billion over 10 years. While the province has not committed any additional funds for studentfmancial assistance, this initiative signals its commitment to harmonize programs with the Federalgovernment which will simplify administration.
O The Federal government also appears to be moving towards targetting spending in health,education and social welfare as means of raising its profile and receiving credit. This in turn isadding to conflict with provinces over jurisdictional issues.
O British Columbia is taking an innovative approach to addressing the affordability of postsecondaryeducation. Under Youth Community Action, students who participate in community-serviceactivities will receive financial credits toward their tuition.
Beginning September 1998, students between the ages of 15 and 24 who serve from 100 to300 hours of volunteer time with non-profit community organizations and other charitablegroups will be eligible for a tuition credit to a maximum of $2,400. The credit will beredeemable at any postsecondary institution in the province.
EAIACAATO Environmental ScanviiTP 1998-99 .
-61-
71
Section 6Public Policy

O The Ontario government's decision to allow a level of deregulation of fees at its colleges anduniversities is creating a level of conflict with other provinces. British Columbia is calling on theFederal government to introduce national standards for postsecondary education in order toensure student interprovincial mobility.
The main issue centers around B.C.'s decision to extend a freeze in tuition fees for a thirdyear while Ontario has introduced differential tuition fees. B.C. is concerned that the increasein cost differential between the two provinces will see increased numbers of Ontariopostsecondary students coming to B.C. It is now considering charging non B.C. studentshigher tuition.Out of province student attending a postsecondary institution in Quebec will also faceadditional fees.The extension of deregulated tuition fees in the public higher education sector also presentsa growing challenge to the financial underpinnings of a publically supported student assistanceprogram.
It also increases the importance for colleges and universities to develop partnerships,articulation agreements, and joint programs as a means of providing more affordableavenues to credentials.
O The colleges' research activities and demonstrated expertise in the areas of applied technologyand the diffusion of technology continue to receive increasing political profile and recognition.These activities are projected to become increasingly important given the more direct returns oninvestment.
In June 1998, the Canada Foundation for Innovation announced the creation of a $10 millionCollege Research Development Fund.Ontario's Research and Development Fund has included the colleges of applied arts andtechnology in its listing of applicants eligible to apply to the Fund.
O The Federal government has identified education as one of the pillars of the knowledge economy.In response to this, it is developing an international strategy for promoting educational services,products and learnware. This strategy builds on the international reputation of Canada'seducational institutions and presents an opportunity for Ontario colleges, especially consideringtheir activities in over 70 countries and territories around the world.
O Deficit reduction is rapidly shifting to deficit elimination for both the Federal government andOntario:
the Federal government's 1998 budget is the first balanced Federal budget in 28 years and thegovernment has committed to balanced budgets through to 2001. The budget also includesa $3 billion contingency fund which if not required will be applied to the national debt.at the provincial level, Ontario revealed through its 1998 budget that the 1997-98 budget was$5.2 billion (significantly down from the projected figure of $6.6 billion) and is forecasted tobe eliminated by the year 2000-01.
O With the 1998 throne speech and budget, the Ontario government moved into the second half ofits mandate. It is focusing its efforts in the areas of job creation and economic growth, health care,education, and community safety as it positions itself for an election in either 1999 or 2000.
E IAACAATO EnVironmental Scan
v4i1V 1998-99-62-
72
Section 6Public Policy

Section 7:Operating Expenses
1998-99 Environmental Scan
73

Operating Expenses
Key Findings
O While total college expenditures have decreased approximately 10% since 1993-94, salaries andbenefits continue to represent approximately two-thirds of college operating expenditures. a
O The consolidation of delivery points while maintaining community access to college programmingcontinues to be a priority:
Between 1994-95 and 1996-97, the amount spent on premise rentals decreased 36% whiletelecommunications expenditures increased 18%.
Over the same time period, travel expenditures decreased 12% which suggests that collegesare increasing their reliance on telecommunications to maintain communications linkagesbetween campuses and as a means for sharing college information and programming with thebroader public.
O A growing concern for colleges are the increasing costs for audit and professional services. Since1994-95, there has been a 28% increase. This may suggest a correlation with the agenda of theMinistry of Education and Training and the broader government to move forward with a level ofderegulation.
O The amount spent on building, site and leasehold improvements declined 58% between 1995-96and 1996-97 which most likely corresponds with the wrapping up of the Canada-OntarioInfrastructure Works Program, a federal-provincial capital initiative.
a see Exhibits 7.2 and 7.3
bsee Exhibit 7.1
AA ACAATO Environmental ScanE Section 71998-99 Operating Expenses-65-
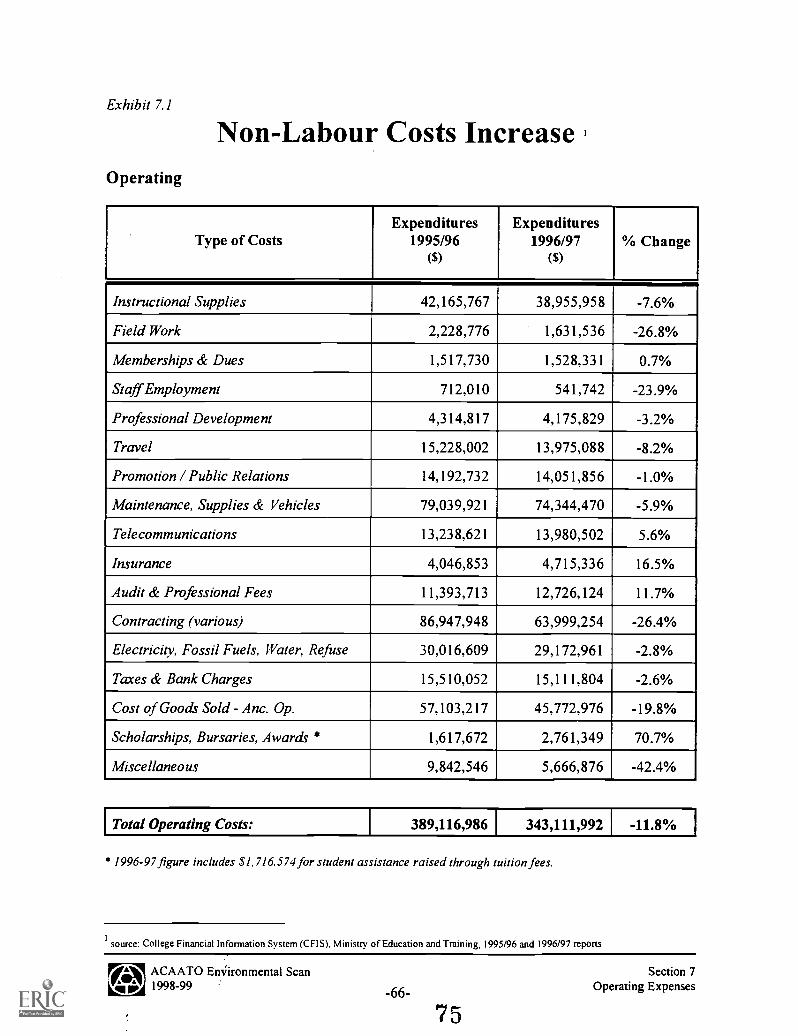
Exhibit 7.1
Non-Labour Costs Increase '
Operating
Type of CostsExpenditures
1995/96($)
Expenditures1996/97
($)% Change
Instructional Supplies 42,165,767 38,955,958 -7.6%
Field Work 2,228,776 1,631,536 -26.8%
Memberships & Dues 1,517,730 1,528,331 0.7%
Staff Employment 712,010 541,742 -23.9%
Professional Development 4,314,817 4,175,829 -3.2%
Travel 15,228,002 13,975,088 -8.2%
Promotion / Public Relations 14,192,732 14,051,856 -1.0%
Maintenance, Supplies & Vehicles 79,039,921 74,344,470 -5.9%
Telecommunications 13,238,621 13,980,502 5.6%
Insurance 4,046,853 4,715,336 16.5%
Audit & Professional Fees 11,393,713 12,726,124 11.7%
Contracting (various) 86,947,948 63,999,254 -26.4%
Electricity, Fossil Fuels, Water, Refuse 30,016,609 29,172,961 -2.8%
Taxes & Bank Charges 15,510,052 15,111,804 -2.6%
Cost of Goods Sold - Anc. Op. 57,103,217 45,772,976 -19.8%
Scholarships, Bursaries, Awards * 1,617,672 2,761,349 70.7%
Miscellaneous 9,842,546 5,666,876 -42.4%
Total Operating Costs: 389,116,986 343,111,992 -11.8%
* 1996-97 figure includes S1,716,574 for student assistance raised through tuition fees.
Isource: College Financial Information System (CFIS), Ministry of Education and Training, 1995/96 and 1996/97 reports
/AANin 11;
ACAATO EnVironmental Scan1998-99 -66-
Section 7Operating Expenses
75

Exhibit 7.1 [coned]
Non-Labour Costs Increase I
Capital
Type of CostsExpenditures
1995/96($)
Expenditures1996/97
($)
% Change
Rental - furniture & equipment 10,691,665 10,052,447 -6.0%
Purchase - furniture & equipment 61,674,656 51,883,618 -15.9%
Premise Rental 21,848,552 15,232,285 -30.3%
Building, Site, Leasehold Improvements 29,184,236 12,175,066 -58.3%
Building & Site Purchase 17,155,669 5,411,782 -68.5%
Building Construction 19,350,272 30,695,082 58.6%
Long Term Debt Interest 7,928,598 5,037,254 -36.5%
Total Capital Costs: 167,833,648 130,487,534 -22.3%
orA ACAATO Environmental Scan Section 74 g 1998-99 -67- Operating Expenses
76

Exhibit 7.2
1997 Compensation CostsFull-time Employees:
Academic Staff $402,031,5773,789,5172,325,1403,237,965
16,678,14660,055,777
Support Staff
Administrative Staff
Part-time Employees:
Academic Staff
Support Staff
Full-time salariesCoordinatorsOvertimeProfessional development leaveTermination gratuitiesMandatory and insured benefits and pensions
$488,118,122
$194,571,6842,129,246
40,5023,111,646
38,414,192
Full-time salariesOvertimeProfessional development leaveTermination gratuitiesMandatory and insured benefits and pensions
$238,267,270
$106,465,686100,129971,021
16,517,413
Full-time salariesProfessional development leaveTermination gratuitiesMandatory and insured benefits and pensions
$124,054,249
$22,258,17718,052,31942,349,2305,582,235
Sessional salariesPartial load salariesPart-time hourly salariesInsured benefits and pensions
$88,241,961
$44,662,694 Salaries
TOTAL COMYENSATION I $983,344,296
iSource: Ontario Ministry of Education and Training, College Financial Information System 1996-97 Report. As at March 31, 1997.
EAOACAATO Environmental Scanv4rip/ 1998-99
-68-
77
Section 7Operating Expenses
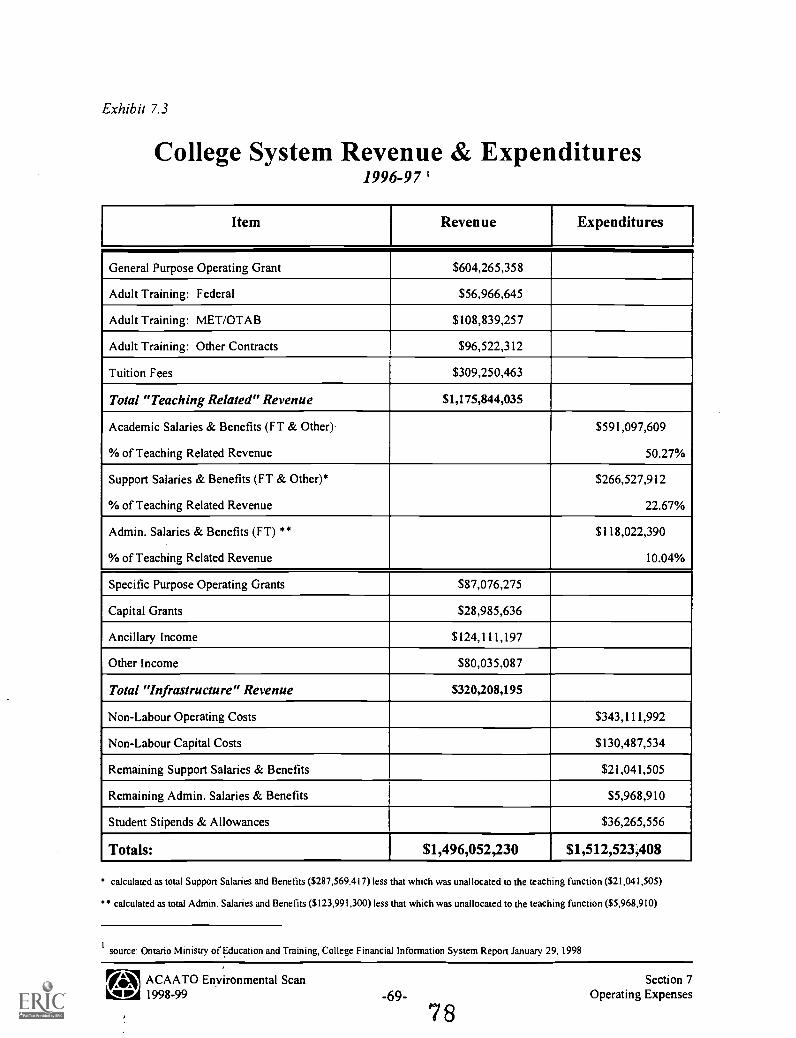
Exhibit 7.3
College System Revenue & Expenditures1996-97 '
Item Revenue Expenditures
General Purpose Operating Grant $604,265,358
Adult Training: Federal $56,966,645
Adult Training: MET/OTAB $108,839,257
Adult Training: Other Contracts $96,522,312
Tuition Fees $309,250,463
Total "Teaching Related" Revenue $1,175,844,035
Academic Salaries & Benefits (FT & Other)
% of Teaching Related Revenue
$591,097,609
50.27%
Support Salaries & Benefits (FT & Other)*
% of Teaching Related Revenue
$266,527,912
22.67%
Admin. Salaries & Benefits (FT) **
% of Teaching Related Revenue
$118,022,390
10.04%
Specific Purpose Operating Grants $87,076,275
Capital Grants $28,985,636
Ancillary Income $124,111,197
Other Income $80,035,087
Total "Infrastructure" Revenue $320,208,195
Non-Labour Operating Costs $343,111,992
Non-Labour Capital Costs $130,487,534
Remaining Support Salaries & Benefits $21,041,505
Remaining Admin. Salaries & Benefits $5,968,910
Student Stipends & Allowances $36,265,556
Totals: $1,496,052,230 $1,512,523,408
calculated as total Support Salaries and Benefits ($287,569,417) less that which was unallocated to the teaching function ($21,041,505)
calculated as total Admin. Salaries and Benefits ($123,991,300) less that which was unallocated to the teaching function ($5,968,910)
source: Ontario Minisny of Education and Training, College Financial Information System Report January 29, 1998
OE.N ACAATO Enyironmental Scan1998-99 -69-
Section 7Operating Expenses
79

Learners
Key Findings
0 Overall college enrolment continues to level out although the number of applicants continues tofar exceed the number of spaces available. Additionally, there is a large variation in enrolmentchange by broad program area.
Total college enrolment (including CEIC, and International students) grew approximately1.3%.Business and technology program areas grew above the system average, 4.3% and 3.4%respectively, while programs in the health sciences area dropped 12.8%. Applied artsenrolment grew at approximately the same rate as the overall system average.
0 Colleges continue to serve a diverse group of individuals. In 1997, and consistent with 1996application data, approximately 60% of applicants indicated on their application that they wereeither previous high school graduates or mature students. The remaining 40% applied directlyfrom secondary school. Further data on Fall 1997 applicants and registrants include:
Fall 1997 (from the Ontario College Application Service) Applicants Registrants
Age:19 and under 31.1% 34.3%20 to 24 44.5% 45.6%25 to 29 10.4% 8.5%30 and over 12.4% 10.2%unknown 1.6% 1.4%
Gender:F emale 51.7% 51.6%Male 48.3% 48.4%
Current Secondary School Student?:Yes 40.2% 44.0%
No 59.8% 56.0%
Mother Tongue:English 82.3% 83.8%French 4.0% 4.2%Bilingual 3.6% 3.4%Other 10.1% 8.6%
a see Exhibit 8.1
bsee Exhibit 8.2
tEA ACAATO Environmental Scan'v470 1998-99
-73- 80
Section 8Learners
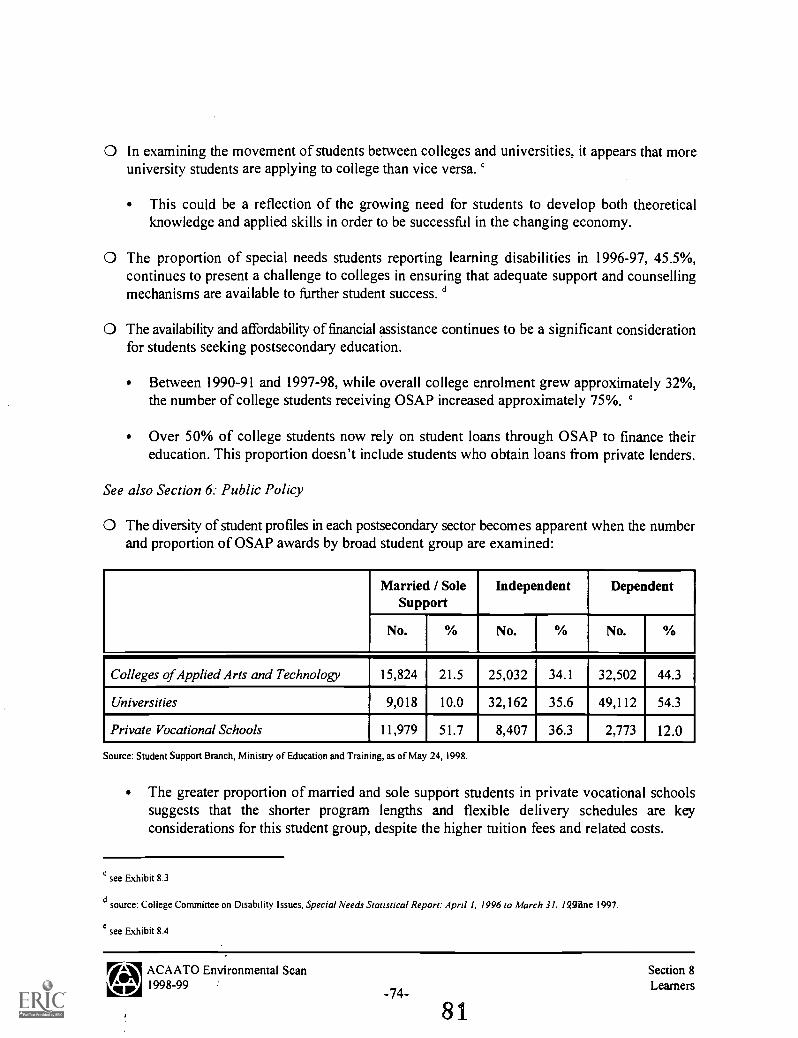
O In examining the movement of students between colleges and universities, it appears that moreuniversity students are applying to college than vice versa.
This could be a reflection of the growing need for students to develop both theoreticalknowledge and applied skills in order to be successful in the changing economy.
O The proportion of special needs students reporting learning disabilities in 1996-97, 45.5%,continues to present a challenge to colleges in ensuring that adequate support and counsellingmechanisms are available to further student success. d
O The availability and affordability of financial assistance continues to be a significant considerationfor students seeking postsecondary education.
Between 1990-91 and 1997-98, while overall college enrolment grew approximately 32%,the number of college students receiving OSAP increased approximately 75%. e
Over 50% of college students now rely on student loans through OSAP to finance theireducation. This proportion doesn't include students who obtain loans from private lenders.
See also Section 6: Public Policy
O The diversity of student profiles in each postsecondary sector becomes apparent when the numberand proportion of OSAP awards by broad student group are examined:
Married / SoleSupport
Independent Dependent
No. % No. % No. %
Colleges of Applied Arts and Technology 15,824 21.5 25,032 34.1 32,502 44.3
Universities 9,018 10.0 32,162 35.6 49,112 54.3
Private Vocational Schools 11,979 51.7 8,407 36.3 2,773 12.0
Source: Student Support Branch, Ministry of Education and Training, as of May 24, 1998.
The greater proportion of married and sole support students in private vocational schoolssuggests that the shorter program lengths and flexible delivery schedules are keyconsiderations for this student group, despite the higher tuition fees and related costs.
see Exhibit 8.3
dsource: College Committee on Disability Issues, Special Needs Statistical Report: April I, 1996 to March 31. /Rgane 1997.
see Exhibit 8.4
EAI ACAATO Environmental Scanvgirip 1998-99
-74-
Section 8Learners

Private vocational schools also had the highest OSAP default rates in 1997 (38.5%) ascompared to colleges (27.5%) and universities (13.9%).
A key objective of the Ministry of Education and Training is to reduce OSAP default ratesto under 10% overall in each sector by 2001. As the first step toward meeting this objective,beginning in 1998-99, postsecondary institutions whose 1997 loan default rate was 15percentage points or more above the provincial average of 23.5% will be required to sharethe cost of defaults for their high-default programs. In the following year, the policy willextend to default rates that are 10 percentage points or more above the 1997 provincialaverage.
E IAACAATO EnVironmental Scan
v4riV 1998-99-75-
8 2
Section 8Learners

Exhibit 8.1
Full-time Postsecondary Enrolmentin Ontario Colleges'
Year FTPS Enrolment excluding CEIC, FTPS Enrolment including CEIC,and International Students and International Students
1976 58,7571977 61,0941978 64,7931979 not available 70,5081980 76,5851981 81,5991982 90,692
1983 95,107 97,2391984 96,855 98,8591985 94,266 96,2691986 93,474 95,1181987 94,911 96,1911988 94,150 95,0511989 97,347 98,080
1990 102,998 103,5981991 113,594 114,3981992 121,919 122,7451993 125,238 127,5261994 129,857 132,0711995 134,127 135,8801996 134,409 136,1281997 135,831 137,862
1976 - 1994 enrolment figures from Ministry of Education and Training CAAT2 report (November I student count)1995 - 1997 enrolment figures from Ontario College Application Service November I survey of colleges
EAAA ACAATO Environmental ScanV`IwaN 1998-99 .
q111.1. -75-
Section 8Learners

Exh
ibit
8.2
Tre
nds
in F
ull-
time
Post
seco
ndar
y E
nrol
men
t at C
olle
ges
iY
ear
App
lied
Art
s
#%
Cha
nge
Bus
ines
s
#%
Cha
nge
Hea
lth S
cien
ces
#%
Cha
nge
Tec
hnol
ogy
#%
Cha
nge
TO
TA
L
1986
25,9
02--
32,1
92--
13,0
74--
23,9
50--
95,1
18
1987
28,8
9011
.5%
33,4
473.
9%13
,403
2.5%
20,4
51-1
4.6%
96,1
91
1988
30,1
014.
2%31
,981
-4.4
%13
,465
0.5%
19,4
96-4
.7%
95,0
43
1989
31,3
274.
1%32
,207
0.7%
13,8
633.
0%20
,657
6.0%
98,0
54
1990
33,6
577.
4%33
,446
3.8%
14,4
614.
3%21
,823
5.6%
103,
387
1991
38,5
2614
.5%
38,0
8113
.9%
14,3
36-0
.9%
23,4
557.
5%11
4,39
8
1992
41,7
548.
4%40
,846
7.3%
14,4
380.
7%25
,707
9.6%
122,
745
1993
44,7
287.
1%41
,515
1.6%
14,5
460.
7%26
,467
3.0%
127,
256
1994
47,5
036.
2%43
,629
5.1%
13,7
15-5
.7%
27,2
242.
9%13
2,07
1
1995
49,9
895.
2%42
,932
-1.6
%14
,561
6.2%
28,3
984.
3%13
5,88
0
1996
47,8
20-4
.3%
44,6
754.
1%14
,386
-1.2
%29
,247
3.0%
136,
128
1997
48,4
691.
4%46
,596
4.3%
12,5
42-1
2.8%
30,2
553.
4%13
7,86
2
Tot
al %
Cha
nge
87.1
%44
.7%
-4.1
%26
.3%
44.9
%
Not
e:In
clud
es C
EIC
and
Int
erna
tiona
l Stu
dent
s
Sou
rce:
Min
istr
y of
Edu
catio
n an
d T
rain
ing
AC
AA
TO
Env
iron
men
tal S
can
44 1
998-
99
8 4
-76-
Sect
ion
8L
earn
ers 85
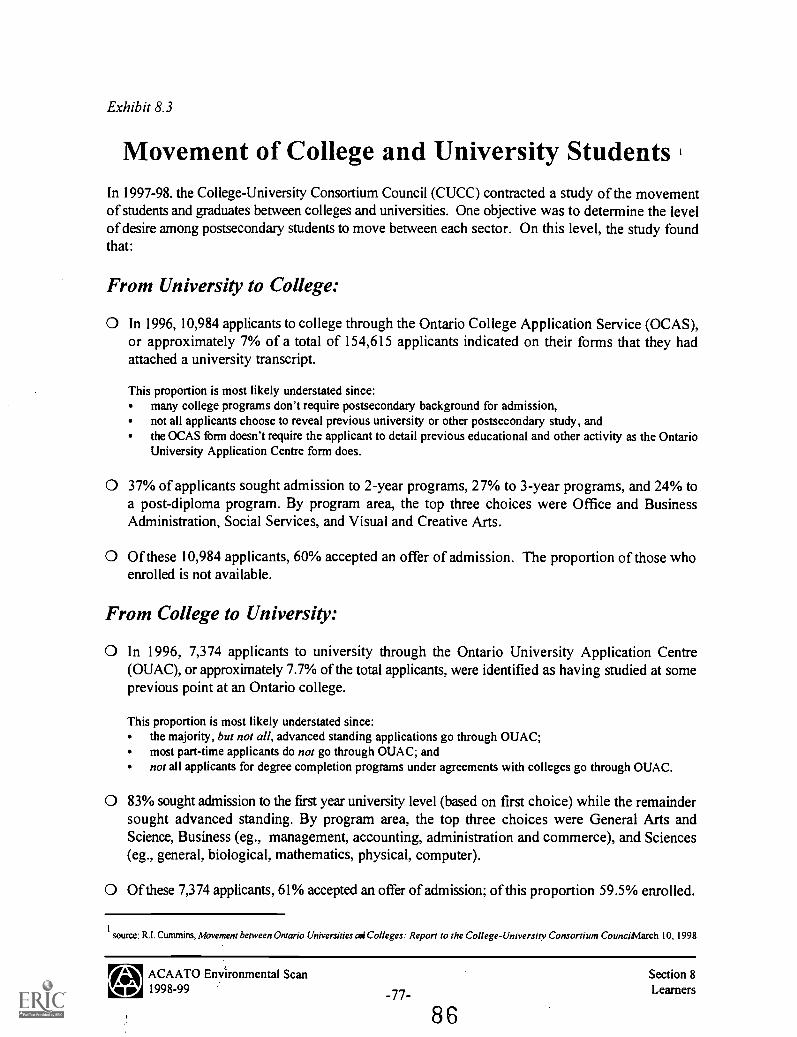
Exhibit 8.3
Movement of College and University StudentsIn 1997-98. the College-University Consortium Council (CUCC) contracted a study of the movementof students and graduates between colleges and universities. One objective was to determine the levelof desire among postsecondary students to move between each sector. On this level, the study foundthat:
From University to College:
O In 1996, 10,984 applicants to college through the Ontario College Application Service (OCAS),or approximately 7% of a total of 154,615 applicants indicated on their forms that they hadattached a university transcript.
This proportion is most likely understated since:many college programs don't require postsecondary background for admission,not all applicants choose to reveal previous university or other postsecondary study, andthe OCAS form doesn't require the applicant to detail previous educational and other activity as the OntarioUniversity Application Centre form does.
O 37% of applicants sought admission to 2-year programs, 27% to 3-year programs, and 24% toa post-diploma program. By program area, the top three choices were Office and BusinessAdministration, Social Services, and Visual and Creative Arts.
O Of these 10,984 applicants, 60% accepted an offer of admission. The proportion of those whoenrolled is not available.
From College to University:
O In 1996, 7,374 applicants to university through the Ontario University Application Centre(OUAC), or approximately 7.7% of the total applicants, were identified as having studied at someprevious point at an Ontario college.
This proportion is most likely understated since:the majority, but not all, advanced standing applications go through OUAC;most part-time applicants do not go through OUAC; andnot all applicants for degree completion programs under agreements with colleges go through OUAC.
O 83% sought admission to the first year university level (based on first choice) while the remaindersought advanced standing. By program area, the top three choices were General Arts andScience, Business (eg., management, accounting, administration and commerce), and Sciences(eg., general, biological, mathematics, physical, computer).
O Of these 7,374 applicants, 61% accepted an offer of admission; of this proportion 59.5% enrolled.
source: RI. Cummins, Movement between Ontario Universities atiColleges: Report to the College-University Consortium CounciMarch 10, 1998
E,..,ACAATO ErnAronmental Scan
vrip/ 1998-99 -77-
8 6
Section 8Learners

Exh
ibit
8.4
Ont
ario
Stu
dent
Ass
ista
nce
Prog
ram
-C
olle
ge T
rend
s1.
Lev
els
of S
tude
nt A
ssis
tanc
e an
d N
um b
er o
f R
ecip
ient
s:
Yea
rO
ntar
ioSt
udy
Gra
nt(c
urre
nt $
)
Can
ada
Stud
ent L
oan
(cur
rent
$)
Ont
ario
Stu
dent
Loa
n(c
urre
nt $
)
No.
of
Col
lege
OSA
P 1
Rec
ipie
nts
Tot
al F
ull-
time
Post
seco
ndar
yE
nrol
men
t%
of
Tot
al
1990
-91
80,8
38,9
0165
,510
,282
9,55
8,81
442
,145
102,
998
41%
109,
578,
596
112,
686,
222
I 8,
753,
774
55,2
7111
3,59
449
%_1
991-
92
1992
-93
125,
044,
943
123,
343,
781
20,6
97,1
6059
,612
121,
919
49%
1993
-94
n/a
187,
008,
735
151,
935,
794
64,4
5012
5,23
851
%
1994
-95
n/a
204,
453,
493
175,
897,
587
71,5
9512
9,85
755
%
1995
-96
n/a
234,
680,
293
197,
265,
690
73,0
9413
4,12
754
%
1996
-97'
n/a
270,
027,
858
250,
059,
461
72,3
3313
4,41
454
%
1997
-98
3n/
a27
7,15
4,80
925
5,10
4,12
173
,450
135,
831
54%
Not
es:
1.R
ecei
ving
Can
ada
Stud
ent L
oans
and
/or
Ont
ario
Stu
dent
Loa
ns. E
xclu
des
CE
IC, a
ndIn
tern
atio
nal S
tude
nts
2.U
pdat
ed to
ref
lect
rep
ort c
urre
nt a
s of
May
2, 1
998.
3.A
s of
May
24,
199
8.
iso
urce
: Ont
ario
Min
istr
y of
Edu
catio
n an
d T
rain
ing,
Stu
dent
Sup
port
Bra
nch.
Vni
raA
CA
AT
O E
nviro
nmen
tal S
can
iiv 1
998-
99
8 7
-78-
Sec
tion
8Le
arne
rs
8 53

Exhibit 8.4 [cont
Ontario Student Assistance ProgramCollege Trends
2. Number of Awards by Student Group ':
Student Group 1993-94 1994-95 1995-96 1996-97 2 1997-98 4
Dependent at Home 10,381 11,185 11,279 12,069 13,920
Dependent Away 14,971 17,311 16,328 16,627 18,582
Independent 24,838 27,692 29,332 27,971 25,032
Married 3 6,206 6,763 6,887 7,067 7,191
Sole Support 3 8,048 8,578 9,226 8,583 8,633
Other 6 31 42 16 92
TOTAL 64,450 71,560 73,094 72,333 73,450
3. Average Loan Amount by Student Group
Student Group 1993-94 1994-95 1995-96 1996-97 2 1997-98 '
Dependent at Home $3,150 $3,155 $3,220 $3,418 $3,168
Dependent Away $5,362 $5,388 $5,472 $5,632 $6,203
Independent $5,940 $5,940 $6,101 $6,358 $6,526
Married ' $5,720 $6,072 $5,853 $9,804 $10,813
Sole Support ' $5,333 $5,344 $6,062 $14,004 $15,192
Other $3,943 $5,203 $5,318 $7,967 $7,048
Notes:1. Receiving Canada Student Loans and/or Ontario Student Loans.2. Updated to reflect report current as of May 2, 1998.3. Effective 1996-97, married or sole support students taking a 60% or greater course load at a postsecondary
institution are required to apply to OSAP for both education and living costs instead of just the educationcosts (with social assistance providing for living costs).
4. As of May 24, 1998.
source: Ontario Ministry of Education and Training, Student Support Branch.
14NACAATO Environmental Scan1998-99 -79- 8
Section 8Learners

Section 9:Human Resources
1998-99 Environmental Scan1

Human Resources
Key Findings
O Employee supports are becoming increasingly important to developing and sustaining a healthywork environment.
According to a report on the state of the world's health by the World Health Organization,more working days are lost around the world as a result of mental disorders than physicalconditions. The report projects that by 2020, depression (mood and anxiety disorder) will bethe leading cause of disability in the developing world. a
A 1996 survey adds credence to this projection by finding that Canadian workers were almostthree times more likely to complain of health problems arising from workplace stress thanfrom workplace illnesses: 25% reported stress, mental or emotional health problems arisingfrom work, compared with 9% reporting workplace injury and a further 9% who said theysuffered from work-related physical illness. b
O Human resource considerations and support mechanisms are also an important factor inmaintaining a competitive advantage and to becoming more market driven.
O As the Ontario population and workforce becomes proportionately older, the need for successionplanning is projected to grow in importance for all organizations in an increasingly competitiveenvironment.
O Employee skills and competencies remain a key priority, however a growing challenge will be tomeasure the effectiveness of training provided; a shift towards outcomes based evaluation thatis inherent with demonstrating accountability.
O Increasing confidence in the economy and continuing economic growth are increasing the gapbetween management and labour over issues of wages and workplace flexibility; a trend occurringat both the national and provincial levels and in both the public and private sectors.
asource: World Health Organization, 1998 World Health Report: Life in the ZICentury - A Vision for All, Spring 1998.
bsource: Canada Health Monitor 1996 Survey as reported in The Globe and Mail, April 8, 1998.
see Exhibit 9.3
ACAATO Environmental Scan74hli 1998-99 -82- 91
Section 9Human Resources

Management pressures driven by competitive pressures are increasing the need for greaterflexibility in workplace practices. At the same time, as labour organizations continue to pushfor substantial wage increases to make up for real wage losses over the past decade, there isalso acceptance of the need for workplace flexibility in exchange for employment securityprovisions (e.g., protection against layoffs and guarantees for training for new jobs). d
Management Union
1. Flexible work practices I. Employment security2. Technological and/or organizational change 2. Wages3. Wages 3. Health and pension4. Health and pension 4. Outsourcing/contracting out
_5. Outsourcing/contracting out 5. Technological and/or organizational change
Source: Conference Board of Canada
O Contributions to the Canada Pension Plan will increase in steps over the next six years startingin 1997, from 5.85% to 9.9% of contributory earnings, to be shared equally between employersand employees, and then remain steady. The 1997 rate was adjusted to 6.0% with the difference,to a maximum additional cost of $24, collected through 1997 tax returns.
O Women in the labour force continue to make significant gains to senior management positions andoften entrepreneurial capacities. At the same time, however, they continue to be underrepresented on boards of directors.
A York University study of 951 firms found that women accounted for only 6% of boardpositions. 75% of the firms studied had no female directors.
In contrast, a report by a Toronto based consulting firm indicates that there are more than700,000 women-led businesses in Canada (representing nearly one third of all businesses)providing employment for 1.7 million Canadians. It also indicated that the number of women-led businesses are growing at a rate twice the national average for all businesses and arecreating employment at four times the average rate for all businesses. e
O The role ot and skills required for, educational leaders is changing as institutions become moreentrepreneurial and seek partnerships with industry.
A small, but growing, number of American colleges are picking business-school deans aspresidents because of their managerial sense and their fund raising skills. Business deans areseen to be in a strong position to cultivate corporate contacts "since they speak the samelanguage" and often have backgrounds similar to those of business leaders. They are also seenas being more effective in "translating the academic environment to the outside world". f
dsource: Conference Board of Canada, Industrial Relations Outlook /99,,Suzanne Payette, January 1998.
esource: Canadian FIR Reporter, April 6, 1998 and Bennett Gold: Chartered Accountants, June 8, 1998.
fsource: Chronicle of Higher Education, Section: Money and Management, March 27, 1998.
.SEN ACAATO Environmental Scan Section 91998-99 -83- Human Resources
9 9

Exhibit 9.1
College StaffOctober 1997
Full-time Staff:
Male Female Total
Academic 3,715 2,780 6,495
Support 1,641 3,745 5,386
Administration 639 805 1,444
Total 1 5,995 I 7,330'
Part-time Staff:
13,325
Male Female Total
Academic 4,970 4,515 9,485
Support 982 2,406 3,388
Total 5;952 6;921 12,87
source: Ontario Council of Regents, Human Resources Secretariat. College Surveys
fiEN ACAATO Enyironmental Scan44 1998-99 -84-
93Section 9
Human Resources

Exhibit 9.2
9000
8000
7000
00 6000
0.
Ili 5000to.00/1
4000
3000
Full-time Staff in Ontario Colleges1984 to 19971
..iicattemke
2000 Ar
Support
AdministrationA
1000
1989 1990 1991 1992 1993 1994 1995 1996 1997
Year
asource: Ontario Council of Regents, Human Resources Secretariat
ACAATO Env'ironmenta1 Scan Section 91998-99 -85- Human Resources
9 4

Exhibit 9.3
Trends in Human Resource Development 1
In a 1997 survey of human resource executives, the American Society for Training and Developmentidentified the top 10 trends in human resource development in both the current environment and inthe next three years.
The survey results indicate that while skills and competencies remain a key priority, growing insignificance is the importance of measuring and evaluating training and learning outcomes as well asdemonstrating performance.
Now:
1. Computer skills training2. Teamwork training3. Shift from training to performance4. Decision-making and problem-solving training5. Rapid development and deployment of training6. Systems-thinking training7. Demonstrating training outcomes8. Measuring performance outcomes9. Shift from training to learning10. Making a business case for training interventions
In the next 3 years:
1. Shift from training to performance2. Computer skills training3. Shift from training to learning4. Virtual organizations5. Demonstrating training outcomes6. Measuring performance outcomes7. Delivering training to meet specific needs8. Emphasis on knowledge management9. Rapid development and deployment of training10. Teamwork training
1
source: American Society for Training and Development, Training Industry Trends 199November 1997.
(INI II I P
ACAATO Environmental Scan1998-99 -86- 9 5
Section 9Human Resources

ut
ui
U.S. Department of EducationOffice of Educational Research and Improvement (OERI)
National Library of Education (NLE)Educational Resources Information Center (ERIC)
NOTICE
REPRODUCTION BASIS
a
IC
This document is covered by a signed "Reproduction Release(Blanket) form (on file within the ERIC system), encompassing allor classes of documents from its source organization and, therefore,does not require a "Specific Document" Release form.
This document is Federally-funded, or carries its own permission toreproduce, or is otherwise in the public domain and, therefore, maybe reproduced by ERIC without a signed Reproduction Release form(either "Specific Document" or "Blanket").
EFF-089 (9/97)