repub.eur.nl youssef... · 2016-03-10 · three-dimensional echo cardiography an accurate technique...
TRANSCRIPT

THREE-DIMENSIONAL ECHO CARDIOGRAPHY AN ACCURATE TECHNIQUE FOR CARDIAC
QUANTIFICATION

ISBN 90-73235-76-6
Printed by Optima Grafische Comillunicatie, Rotterdam.
© Youssef FM Nosir, 1999
All rights reserved. No part of this publication may be reproduced, stored in retrival system, or transmitted in any form by any means, mechanical, photocopying, recording, or otherwise, without permission in writing from the copyright holder.
Covel' iIIustt'ations: Upper diagram shows the principle of precordial 3DE acquisition using 2° rotational intervals from the apical transducer position. Middle figure sholVs the clinical application of paraplane analysis from 3DE data set to calculate the mitral valve area (upper left pancl), left ventricular volume (upper right panel), Left atrlalmyxoma (lower left panel) and left ventricular mass (lower right panel). Lower figure shows the principle of left ventricular volume measurement using the paraplane analysis with 8 parallel equidistant short axis slices spanning the ventricular cavity from the apex to the mitral annulus.
Back illustrations: Right photo, Imhotep (2800 B.C.), advisor to Pharaoh Djoser, Oliginator of the step pyramid at Saqqara and the first physician in history with a written records. Imhotep means literally "he who comes in peace". Left upper photo. The step pyramid at Saqqara (2800 B,C.). Left lower photo. The three pyramids of Kufu, Kafra and Menkaura at Giza (2500 B,C,),

THREE-DIMENSIONAL ECHO CARDIOGRAPHY AN ACCURATE TECHNIQUE FOR CARDIAC
QUANTIFICATION
Drie"dimensionale echocardiografie Een nauwkeurige techniek voor cardiale kwantificering
PROEFSCHRIFT
Tel' verkrijging van de graad van doctor aan de Erasmus Universiteit Rotterdam
op gezag van de rector magnificus Prof. dr P. W.C. Akkermans M.A. en volgens besluit van het College voor Promo ties
De openbare verdediging zal plaatsvinden op woensdag 13 Januari 1999 om 13.45 uur.
door
Youssef Fathy Mohamed Nosh'
geboren te Cairo, Egypt

Promotiecoll1l11issie
Promotor:
Overige Leden:
Co-promotor:
Prof.dr. J.R.T.e. Roelandt
Prof.dr. M.M. Gomaa Prof.dr. e.A. Visser Prof.dr.lr. N. BOIl1
Dr. F.J. ten Cate
Financial support by the Netherlands Heart Foundation for publication of this thesis is gratefully acknowledged.

To The Soul of My Father and To My Mother To Ghada, Mahmoud and Aimlcd
Whom I Love Very Much and Whom lOwe Much More Than That I Can Give


Chapter I
Chapter 2
Chapter 3
Chapter 4
Chapter 5
Chapter 6
Chapter 7
Chapter 8
Chapter 9
CONTENTS
Introduction.
Precordial lllultiplane echocardiography for dynamic anyplane. parapIalle and three-dimensional imaging of the heart. Thol'(fxeelltre J 1994;6:4-13
Accurate Measurement of Left Ventricular Ejection Fraction by Three-dimensional Echocardiography: a Comparison with Radionnclide Angiography. Cireulatiou 1996;460-66
Left Ventricular Ejection Fraction in Patients 'Vith Normal and Distorted left ventricular Shape by Three-dimensional Echocardiography: A Comparison With Radionuclide Angiography. JAm Soc Eehoeardiogr.1998;11(6):620-630
The Apical Long Axis Rather Than the Two Chamber View Should be Used in Combination With Four Chamber View for Accurate Assessment of Left Ventricular Volumes and Function. EliI' Heart J 1997;18:1175-85
Paraplane Analysis Fron} Precordial Three-dimensional Echocardiographic Data Sets for Rapid and Accurate Quantification of Left Ventricular Volume and Function: a Comparison With Magnetic Resonance Imaging. Am Heart J (Ill Press)
Measurements and Day-to-Day Variabilities of Left Ventricular Volumes and Ejection Fraction by Three-dimensional Echocardiography. Am J Cardiol. 1998;82:209-214
Precordial Rotational Acquisition at 16 Degree is Optimal for Left Ventricular Reconstruction and Quantification by Threedimensional Echocardiography. (Submitted)
Accurate Quantification of Left Ventricular Volume and Function by Three-dimensional echocardiography. (SlIbmitted)
7
23
39
55
71
85
95
107

Chapter IO
Chapter 11
Chapter 12
Chapter 13
Chapter 14
Accurate Mitral Valve Area Assessment in Patients with Mitra1 Stenosis by Three-dimensional Echocardiography. J Am Soc Echocardiogr. 1997;10:133-40
Quantification of the Aortic Valve Area in Three-dimensional Echocardiographic Datasets: Analysis of Orifice Overestimation Resulting Frolll Suboptimal Cutplanc Selection. Alii Hearl J 1998;135:995-1003
Assessment of the Left Ventricular Outflow Tract in Hypertrophic Cardiomyopathy Using Anyplane and Paraplunc Analysis of the Three-dimensional Echocardiographic Datasets. Am J Cal'dloi 1996;78:462-8
Improved Quantification of Myocardial Mass by Threedimensional Echocardiography Using a Deposit Contrast Agent. Ultrasollllli Med&BioI1998;24,5:647-53
Summary and Conclusions.
Samellvattillg.
Acknowledgement.
Curriculum Vitae.
Publications.
119
131
145
157
169
173
174
177
178

INTRODUCTION 1
CHAPTERl
INTRODUCTION BACKGROUND
Cardiac ultrasound has become the dominant imaging technology in clinical cardiology. Two-dimensional echocardiography (2DE) gained widespread use and allows rapid and comprehensive evaluation of anatomy and function by providing tomographic cardiac views recorded from transthoracic (TIE) or transesophageal (TEE) acoustic windows. However, the diagnosis of a cardiac disorder is based on a mental spatial reconstruction process of these views into their correct geometry. This process is not always easy and accurate particularly in complex congenital heart disease and in patients with coronary artery disease and distorted ventricles. Tlu"ee-dimensional echocardiography (3DE) obviates these limitations and is able to provide more accurate quantitative and qualitative information in complex disorders. The fIrst attempt to obtain 3DE images for cardiac diagnosis and quantification started two decades ago.1-4 3DEs were computed from a series of nonparallel echocardiographic images using either an articulated device or an acoustic ranging technique using multiple spark gaps for spatial registration. However, this approach was tedious and time consuming. In addition, cycle selection, border digitizing and tracing together with the computer analysis would take several days. With the revolutionalY advances in the computer technology, 3DE acquisition is considerably shortened with optimal spatial and temporal registration by using computer controlled transducer systems. Approaches (0 3DE are: • Random acquisition with external reference (mechanical, acoustic and electromagnetic). • Predetermined acquisition with internal reference (linear, fan like and rotational). • Real time acquisition (pyramidal volumetric scan). Real time volumetric scan is by definition the ideal technique for 3DE.5 Initial results are promising, but further improvement in image quality is needed for routine clinical application. In practice the most commonly used methods arc the random acquisition and the predetennined rotational acquisition technique.
Ralldom acquisitioll. In this method for left ventricular volume (L VV) measurement, the 3DE data set is acquired
using free-hand scanning to obtain a series of non-parallel parasternal short-axis images (8 to 9 images in end-diastole and end-systole). A line-of-intersection display is used as a guide. The constructed line of intersection is derived frol11 two temporally dispersed short axis views selected from two parasternal long axis views. Each acquired short axis is then readjusted by displaying this line of intersection several times. All images for ventricular reconstruction are acquired during suspended respiration. A polyhedral surface reconstruction algorithm has been adapted for L VV computation using the traced endocardial borders of the short axis image. 6
0
S However, with the parasternal window it is often impossible to define the basal and apical landmarks for the LV long axis in a single cross section. Two different long axis views are necessmy to avoid the possible errol' for alignment.

2 CHAPTER 1
PredefeJ"I1liued acquisitioll witli rotational approach. Rotational acquisition software has been interfaced to commercially available ultrasound
systems for both TIE and TEE. Rotational acquisition is pClfonned usually with steps of 2° or 3°. controlled by an EeG and respiratory gating algorithm. The images are formatted in their correct rotational sequence according to their EeG phase in a volumetric data set. Each complete data set contains images recorded between 0° to 1800 of rotation. The postprocessing of the data set is performed off-line and a "trilinear cylindric interpolation" algorithm is lIsed to fill the gaps in the far fields. 9
.!O Images can be displayed from the 3DE data in the following modes: anyplane (obtaining countless cut planes at any direction independent from the point of origin of the sector scan), paraplane (parallel short-axis cuts along a defined long axis) and volume rendering (different algOlithms are applied to maintain tissue grey level information and to give the perception of depth),
For quantitative purposes the paraplane mode is used to obtain multiple parallel equidistant cross-sectional views spanning the desired cardiac structure for area and volume measurements.
ADVANTAGES 3DE provides a unique tool to study patients with complex geometry. With the
standardized examination procedure and objective display of the anatomy and the complex relationships among different structures, 3DE improves the accuracy of qualitative assessment and decreases the variability of interpretation among echocardiographers. En face views are uniquely 3D and allow qualitative and quantitative assessment of patients with atrial septal defect (ASD), ventricular septal defect (YSD) and valvular diseases. Paraplane analysis allows accurate and reproducible pixel (surface area) and voxel (volume) based quantification. The advnntnges, display modalities and the possible clinical applications of 3DE using the rotational acquisition technique are discussed in chapter 2.
PRESENT LIMITATIONS Most currently available 3DE systems use ECG and respiration triggered image acquisition.
This requires 3 to 5 minutes and in certain circumstances up to 10 minutes, depending on the rotational intervals and the variability in cardiac cycle length. Artefacts from inadvertent patient or operator movement arc more likely when the procedure of image acquisition takes longer. This long acquisition time is a significant limitation in some clinical scenarios such as intra-operative studies, the interventional laboratory, stress echocardiography and contrast perfusion echocardiography. Real time 3DE would allow to overcome these limitations. 3DE using an ultrafast continuously rotating phased array transducer can be an alternative to rcal tinle imaging, as it will reduce the acquisition time to seconds. In addition, with the advances in computer technology, processing and analysis time has decreased from hours to minutes and is targeted to reach seconds in the near future.
With rotational acquisition systems the image accuracy in the 3D volumetric data set varies according to both the angular step and the width of the ultrasound beam. Since the beam width depends on the scan depth and scan angle, the image resolution will degrade at points further away from the transducer and at larger scan angle. This is important for the selection of anyplane images. CUlTently available experience suggests that, the best possible resolution is gained within the focal region along the central axis of the transducer.

INTRODUCTION 3
Reconstructed nnages of cut planes far away from the rotational axis will have a reduced reliability although they may look acceptable because of computerized smoothing. In addition, 3DE image information depends on the 2DE scan plane density. At certain scan depth, increase of the intervals angle will reduce the acquisition time, but at the same time wi1l increase the gaps between consecutive scan planes, resulting in lower sampling data of the volume. This allows for L VV studies, whereas anyplane studies for stmcturc analysis require a much higher sampling rate.
At present most of the endocardial border tracing is done manually. This is laborious, time consuming and subjective. Automated border detection algorithms are available and initial results show that it reduces the analysis time and allows more accurate calculation of L VV and function. In addition, endocardial border delineation can be enhanced by using the second harmonic imaging or adding intravenous injections of contrast agents for endocardial border delineation.
The aim of the present thesis was to assess feasibility and to validate 3DE with rotational acquisition technique for accurate and reproducible quantification of cardiac function and valve orifice area.
Serial monitoring of L VV and derived parameters is important for clinical decision making, prediction of outcome in many cardiac disorders and following medical or surgical interventions. II
,12 CUlTently used imaging methods including angiog:raphyl3~15, radionuclide angiography (RNA)16-17, and 2DE18
-21 require the use of geometric assumptions for LV shape.
MRI produces accurate measurement of LVV22-23
, but is not widely available. Since 3DE allows calculation of L VV and EF without geometric assumptions, the technique may be equally accurate and has practical advantages.?' 8, 10
Quantification of LV mass is important and has both therapeutic and prognostic implications in many cardiac diseases. 24 Measurement of myocardial mass has been performed by both M-mode and 2DE"-27 but needs LV geometrical assumptions. 28 3DE enables the analysis of complex anatomical structures in off-line reconstructed cutplanes from the dataset using Simpson's rule. 29
-31 In addition, the suboptimal delineation of epicardial and
endocardial contour could be overcome by intravenous injection of echocardiographic contrast agents.
Accurate measurement of the valve orifice area is essential in the evaluation of patients with valve stenosis. Measurement of valve orifice area using the formula of Godin and Gorlin32J3
from hemodynamic data obtained at cardiac catheterization has been considered the reference method. However this method is invasive and influenced by valve geometrl\ LV function, cardiac output,35 pressure gradients36 and severity of concomitant regurgitation.3?
Two-dimensional and Doppler echocardiography are presently the principal noninvasive tools to obtain morphologic and hemodynamic information conceming the mitral and aortic valves. 2DE allows imaging of the stenotic odfice and its direct measurement by plauimetry.38 However, 2DE is highly dependent on the examination technique particularly in locating the stenotic orifice in its short_axis.39
,4o :tv1itral valve orifice area derived by pressure half-time using Doppler echocardiography is now an acceptable method and can be used in the presence of mild regurge.41
,42 Limitations of this method include concomitant moderate or severe aortic regurgitation and poor left ventricular compliance.43
.44

4 CHAPTER 1
Doppler evaluation of aortic valve flow allows quantification of trans valvular gradient and valve resistance. Valve area calculation is usually indirect, based upon the continuity equation.45 3DE allows accurate valve orifice area measurement by generating a series of equidistant parallcl cross-sections through the long axis and identification of the smallest
iii f 'l 'I 3940 or lee area 0 ITIltra or aortIc va ve apparatus. .
OUTLINE OF THIS THESIS Chapter 2. Methodological description of precordial rotational 3DE technique was provided. In addition, an overview was given for its various display modalities with some examples. Chapter 3. The feasibility and reproducibility of 3DE using Simpson's rule for calculating left ventricular ejection fraction, was studied and compared with RNA. Special attention was paid to determine the largest slice thickness that can be used for left ventricular volume and ejection fraction calculation without loosing accuracy. Chapter 4. Left ventricular ejection fraction calculation from 3DE using both Simpson's rule and biplane modified Simpson's method was calculated and compared with values obtained from RNA, in patients with normal and abnormally shaped ventricles. In addition, the accuracy of left ventricular ejection fraction calculated by 3DE methods with respect to each individual left ventricular site of regional dysfunction was studied. Chapter S. The spatial angle between both the apical two chamber and the apical long axis views relative to the apical four chamber view, was calculated. In addition, values of left ventricular volume and ejection fraction calculated with biplane ellipse method using the apical four chamber view with either the apical two chamber or the apical long axis view, were compared with the values obtained from 3DE. Chapter 6. This study was designed to validate the paraplane analysis with 8 equidistant short axis slices for left ventricular volume and ejection fraction calculation with comparison to MRI. Chapter 7. The day-to-day variability of left ventricular volume and ejection fraction calculation by 3DE using the parapJanc analysis with 8 equidistant short axis slices was calculated. In addition, observer variability was studied and compared with values obtained from MRI. Chapter 8. In this study we defined a faster method for precordial 3DE rotational acquisition by finding the largest 3DE rotational interval that can be used for left ventricular volume calculation without loosing accuracy as compared with MRI. Chapter 9. Review article for different 3DE techniques used for calculating left ventricular volume and ejection fraction. Chapter 10. The feasibility, reproducibility and accuracy of 3DE for calculating mitral valve area in patients with native mitral stenosis were studied. Chapter 11. The feasibility, reproducibility and accuracy of 3DE for calculating aortic valve area in patients with native aortic stenosis were studied. In addition, the errors resulting from planimetry in suboptimally selected cross-sectional images were calculated. Chapter 12. This study was pelfonned to analyse the alteration in size and geometry of left ventricular outflow tract in patients with hypertrophic cardiomyopathy. Chapter 13. This study was aimed to determine whether myocardial enhancement \vith a novel contrast agent (Quanti son Depot TM) could improve the reproducibility of mass quantitication assessed with 3DE in a porcine model.

INTRODUCTION 5
REFERENCES Geiser EA, Ariel M, Conelta DA, Lupicwicz SM, Christie LG Jr, Conti CR. Dynamic three-dimensional echocardiograpbic reconstruction of the intact human left ventricle: Techniques and initial observation in patients. Am Heart J 1982;103:I056~65.
2 Moritz WE, Pearlman AS, IvIcCabe DH, ~'lcdema DK, Ainsworth ME, Boles MS. An ultrasonic technique for imaging the ventricle in three dimensions and calculating its volume. IEEE Trans Biomed Eng 1983;30:482-92.
3 Nb:on N, Saffer SI, Lipscomb K, Blomqvist CO: lluee-dimensional cchovcntriculography. Am Heart J 1983;106:435-442
4 Raichleu IS, Trivedi SS, Herman GT, Sutton rvfG, Rcichek N. Dynamic three-dimensional reconstruction of the left ventdcle from t\vo~dilllcnsional echocardiogmms. J Am Coll Cardiol 19868;2:364-70.
5 von Ramm OT; Smith SW; Pavy HG Jr. High-speed ultrasound volumetric imaging system. Part n. Parallel processing and imagc display, IEEE Trans Ultrason f'crroclec Freq Contr 1991 ;38: 109-115,
6 King DL, King DL Jr, Shao l\'lY-C. Evaluation of in vitro measurement accuracy of a three-dimensional ultrasound scanner. J Ultrasound Med 1991; 10:77-82.
7 Gopal AS, Sapin P~'I, Shen Z, Sapin PM, KeI1er Al\t Schncllbaecher MJ, Lcibowitz OW, Akinboboye 00, Rodncy RA, Blood DK, King DL. Assessmcnt of cardiac function by three-dimcnsional echocardiography compared ,vilh convcntional noninvasivc methods. Circulation 1995;92:842-52.
8 Sapin PM, Schroder Ki\t, Gopal AS, Smith },'ID, De1vlaria AN, King DL. Comparison of two- and threedimensional echocardiography with cineventriculography for measurcment of left vcntricular volume in paticnts. J Am Coli CardioI1994;24:1054-63.
9 Roelandl J, Salustri A, Vletter W, Nasir Y, Bruining N. Precordialmultiplane echocardiography for dynamic anyplane, paraplanc and three-dimensional imaging of thc heart. Thoraxcentrc J 1994;6:4-13.
10 Nasir YFtvl, Sall1stri A, Vleltcr WB, Cornel JH, Gcleijnse "ML, Krcnning E, Fiorelli P. Accurate measurcments of left ventricular cjection fmction: radionl1clide angiography versus thrcc-dimensional echocardiography (abst). Circulation 1995;92,:278.
II Becker LC, Silverman KS, Bulkley BH, et aJ. Comparison of early thalliuOl-201 scintigraphy and gated blood pool imaging for predicting mortality in patients with acute myocardial infarction. Circulation 1983;67:1272-82.
12 Pfeffer MA, Braunwald E, r-,'foye LV, et al. Effect of captopril on mortality and morbidity in patients with Icft. vcntricular dysfunction after myocardial infarction. N Eng J Med 1992;6:69-77.
13 Sandler 1-1, Dodge HT. The use of single plane angiocardiograms for the calculation of left ventricular volume in man. Am Heart J 1968;75:325-34.
14 Chapman CB, Baker 0, Reynolds J, Bonte FJ. Use of biplane cintluorography for measurement of ventricular volume. Circulation 1958;18:1105-17.
15 Dodge HT, Sandler H, Ballew DW, Lord Jf) Jr. The use of biplane angiocardiography for the measurement of left. ventricular volumc in man. Am Heart J 1960;60:762-76.
16 Hains AD, Khawaja lA, Lahiri A, Raftery FE. Radionuclide left. ventricular ejection fraction: a comparison of three methods. Br Heart J 1987;57:232-6.
17 Shah PK, Picher .r-,'I, Bennan DS, Singh BN, Swan HJe. Left ventricular ejection fraction detcmlined by radionuclidc ventriculography in early stages of fIrst transmural myocardial infarction. Am J Cardiol 1980;45:542-6.
18 Wyatt HL, Heng MK, Meerbaum S, Gueret P, Hestenes J, Dula E, Corday E. Cross-sectional echocardiography. Analysis of mathematic models for quantifying volume of the formalin-fLxed left ventriclc. Circulation 1980;61: 1119-25.
19 Schiller NB. Two-dimcnsional echocardiographic determination of left ventricular volume, systolic function and mass. Circulation 1991 ;84:280-7.
20 Garrison JB, Weiss JL, Maughan WL, Tuck O:~.J, Guier WH, Fortuin NJ. Quantifying regional wall motion and thickcning in two-dimensional cchocardiography with a computer-aided contouring system. In Ostrow H, Ripley K, eds: Proceedings in Computerized Cardiology, Long Beach, CA., 1977;p 25 ..
21 Schiller NB, Aquatella H, Ports TA, Drew D, Goerke J, Ringertz H, Silverman NH, Bnmdage B, Botvinck EH. Boswell R, Carlsson E, Pamlley WW. Left vcntricular volume from paired biplane two-dimensional echocardiography. Circulation 1979;60:547-55.,
22 Dilworth LR, Alsen AM, Mancini GBJ, Landc 1, Buda AJ. Detennination of left ventricular volumes and ejection fraction by magnetic resonance imaging. Am Heart J 1987; 113:24-32.
23 Van ROSSUOl AC, Visser Fe, Sprenger M, Van Eeoige MJ, Valk J, Roos JP. Evaluation of magnetic rcsonance imaging for detennination of left ventricular ejection fraction and comparison with angiography. Am J Cardiol 1988; 62:628-33.

6 CHAPTER 1
24 Koren MJ, Devereux RD, Casale PN, Savage DD, Laragh JH. Relation of left ventricular mass and geometry to morbidity and mortality in uncomplicated essential hypertension. Ann Intern Med 1991: 114:345-52.
25 Levy D, Garrison RJ, Savage DD, Kanllel WB, Castelli WP. Prognostic implications of cchocardiographically detemlined Jeft ventricular mass in the Framingham Heart Study. N EnglJ Mcd 1990;322: 1561-6.
26 Devereux RB, Reichek N. Echocardiographic detennination of left ventricular mass in man. Anatomic validation of the method. Circulation 1977;55:613-8.
27 Reichek N, Devereux RB. Left ventricular hypertrophy: relationship of anatomic, echocardiographic and electrocardiographic findings. Circulation 1981;63: 1391-8.
28 Weiss JL, McGaughey lvi, Guier WHo Geometric considerations in detennination of left ventricular mass by two-dimensional echocardiography. Hypertension 1987;9[Suppl. ILl: H-85-9.
29 Nanda NC, Pinheiro L, Sanyal R, Rosenthal S, Kirklin JF. Multiplane lransesophageal eehocardiographic imaging and three-dimensional reconstruction. Echocardiography 1992;9:667-76.
30 King DL, Gopal AS, Sapin PM, Schroder KJo.'I, DcMaria AN. Three-dimensional echocardiography: a review. Am J Card Imaging 1993;3:209-20.
31 Pandian NG, Roeland! JRTC" Nanda NC et al. Dynamic three-dimensional echocardiography: methods and clinical potential. Echocardiography 1994;1 1:237-59.
32 Godin R, Gorlin SG. Hydraulic formula for calculation of thc area of stenotic mitral valve, other cardiac valve, and central circulatory shunts. Am Hcart J 1951; 41: 1-29.
33 Cohen MV, Gorlin R. Modified orifice equation for the calculation of mitral valve area. Am Hcart J 1972;84:839-40.
34 Flachskampf FA, Weyman AE, Guerrero JL, Thomas JD. Influence of orifice gcometry and flow rate on effectivc valve area: an in vitro study. J Am Coll Cardiol 1990; 15: 1173-80.
35 Carabello BA. Advances in the hemodynamic assessment of stenotic cardiac valves. J Am Coli Cardiol 1987;10:912-9.
36 Hammermeister KE, !'Ilurray lA, Blackmon JR. Revision of Gorlin constant for calculation of mitral valve area from left heart pressures. Br Heart J 1973;35:392-6.
37 Fredman CS, Pearson AC, Labovitz AI, Kem MI. Comparison of hemodynamic pressure half-time method and Gorlin formula with Doppler and echocardiographic detenninations of mitral valve area in patients with combined mitral stenosis and regurgitation. Am Heart J 1990;119: 121-9.
38 Henry WL, Griffith JM, Michaelis LL, r..kintosh eL, Morrow AG, Epstein SE. Measurement of mitral orifice area in patients with mitral valve disease by real-time, two dimensional echocardiography. Circulation 1975;51:827-3l.
39 ! ... Iartin RP, Rakowski H, Kleiman JR, Bea\'er W, London E, Popp RL. Reliability and reproducibility of twodimensional ecbocardiographic measurement of stenotic mitral valve orifice area. Am J Cardiol 1979;43:560-8.
40 Dennig K, Rudolph W. Mitral valve disease. In: Roelandt JRTC, Sutherland GR, Iliceto S, Linker DT, cds. Cardiac Ultrasound. Churchill Livingstone: 1993:255-94. '
41 Hatle L, Bmbakk A, Tromsdal A, Angelsen B. Noninvasivc assessment of pressure drop in mitral stenosis by Doppler ultrasound. Br Heart J 1978;40: 131-40.
42 Hade L, Angelsen B, Tromsdal A. Noninvasive assessment of atrioventricular pressure balf-time by Doppler ultrasound. Circulation 1979;60:1096-104.
43 Moro E, Nicolosi GL, Zanuttini D, Cervesato E, Roelandt I. Influence of aortic regurgitation on the assessment of the pressure half-time and dcri\'ed mitral valve area in patients with mitral stenosis. Eur Heart I 1988;9; 1010-17.
M Karp K, Teien D, Bjerle P, Eriksson P. Reassessment of valve area detenninations in mitral stenosis by the pressure balf-iinle method: Impact of left ventricular stiffness and peak diastolic pressure difference. I Am Call CardioI1989;13:594-9.
45 Bednarz JE, Krauss D, Lang RM. An ecbocardiographic approach to the assessment of aortic stenosis. J Am oc Echocardiogr 1996;9:286-94.

PRECORDIAL 3DE OF THE HEART 7
CHAPTER 2
PRECORDIAL MULTIPLANE ECHOCARDIOGRAPHY FOR DYNAMIC ANYPLANE, PARAPLANE AND THREE
DIMENSIONAL IMAGING OF THE HEART
Roelalldt J, Salustri A, Vletter W, Nosir Y, Bl'Uillillg N.
ThoraxceJl(re J 1994;6:4-13

8 CHAPTER 2
In two decades, cardiac ultrasound has become the most widely disseminated diagnostic imaging method in clinical cardiology. The method allows one to noninvasively look into the heart by providing serial tomographic views recorded from limited precordial and transesophagcal acoustic windows. However, most of our diagnostic decision making is based on a mental reconstl11ction of these tomographic views into their three-dimensional geometry. Clearly, this is a difficult process requiring skill and experience. Thus, the availability of objective and more intelligible three-dimensional images would greatly facilitate the diagnosis of unknown and complex pathology and improve diagnostic accuracy in general. This also applies to other tomographic techniques such as computer tomography and magnetic resonance imaging.
The most practical approach to three-dimensional echocardiograpby is the acquisition of a consecutive series of tomographic views using standard available ultrasound equipment together with accurate spatial and temporal information and subsequent "off-line" reconstruction. Recently, computer technology became available allowing both precordial and transesopbageal controlled image acquisition using parallel,I.3 fan-like4
.6 and rotational
scanning methods.7-9 Data processing algorithms for volume rendered reconstruction with
grey scale tissue imaging represented another major breakthrough. 10
Three-dimensional reconstruction using transesophageal rotational acquisition with a commercially available l11ultiplane imaging probe has been described.7
•s In this approach, a
computer-based steering logic which considers both heart cycle variation and the respiration phase controls a step motor which rotates the imaging plane in predetermined steps via the external control knob of the 111ultiplane probe.
However, the rotational approach can also be used at a single pivot point over a small acoustic window. A transducer assembly has been constructed which can accommodate any commercial1y available transducer for precordial rotational image acquisition.9 The transducer is centered in the inner cylindrical housing of a double walled cylindrical rotation mechanism and can be rotated around its center axis via a step-Illotor under control of the same steering logic as is used for transesophageal image acquisition. With this transducer assembly, controlled precordial multiplane echocardiography can be performed similar to multiplane transesophageal echocardiography. Tills approach is not only the basis for routine three-dimensional echocardiography but also for a more standardized semi-automated
.. d 8·9 exallllllatlOll proce ure. In this chapter we discuss various possibilities with this prototype transducer assembly
demonstrating the feasibility of precordial three-dimensional echocardiography in adult patients.
REQUIREl\IENTS FOR THREE-DIMENSIONAL RECONSTRUCTION WITH ROTATIONAL APPROACH
(1) Acquisition (sequential rotational cardiac cross-sections with spatial and temporal information)
(2) Processing (resampling and conversion from polar to Cartesian coordinates) (3) Interpolation (filling the space between individual cross-sections) (4) Enhancement (noise suppression)

PRECORDIAL 3DE OF THE HEART 9
(5) Display (anyplane, paraplanc echocardiography and volume rendered images). II
THE PRECORDIAL TRANSDUCER ASSElVillLY AND ULTRASOUND SYSTEM The inner components of the transducer assembly for precordial image acquisition consist
of a cylindrical housing with a cog-wheel to which any standard precordial imaging transducer can be adapted. This cylindrical housing with the contained transducer fits into a cylindrical holder and can be rotated with a step-motor via a wheel-work interface (figure I), The step-lllotor is cOlllmanded by a steering-logic for controlled image acquisition (Echoscan, TOlllTec GmbH, Munich, Germany). The transducer assembly is hand-held and can be placed either over the parasternal, apical or subcostal window (figure 2), The probe can be aimed in any direction to find the center axis of the sector images encompassing the region or stnlcture of interest. During acquisition, the probe is kept stationary while the transducer is rotated through 1800 degrees around tlus center axis in predeternulled steps by means of the step-motor. The sampled cardiac cross-sections encompass a conical image volume with the transducer positioned at its apex. The video output of the echocardiograpluc imaging system is intelfaced with the TomTec Echo-scan system for three-dimensional reconstl1lction. 11
•13
Figure 1. The hand· held transducer assembly used for precordial image <lcquisition containing a Vingmcd 3.5 !\'IHz scctor scanning tnlllsducef. TIle stepmotor is mounted on the cylindrical holder and rotates via a wheel-work interface, the transducer inside the holder. A cable which transmits the pulses from the computcr algorithm to stecr tbe step-motor for controlled acquisition is attached to the connector mounted next to the step-motor. There is a micro-switch to control the start at 0 degrees and the end at 178 degrees of the image acquisition. By adapting the size and shape of the inner housing any commercially available precordial transducer can be used.
PRECORDIAL IlVIAGE ACQUISITION
Figure 2. This diagram explains the principle of acquisition of sequential cross-sectional images at 2 degrees steps from the apical transducer position
The step-motor in the transducer assembly is commanded by a software-based steering

10 CHAPTER 2
logic which controls the image acquisition in a given plane by an algorithm considering both heart cycle variation by ECG-gating and respiratOlY cycle phase by impedance measurement. These parameters are recorded prior to the achJal image acquisition for a certain time period to select the average cardiac cycle and respiratory phase pattern. Based on this information, the step-motor is commanded by the steering logic to acquire cross-sections of cardiac cycles that fall within a selected range of cycle length and respiratory phase. This permits optimal temporal and spatial registration of the precordialitnages. After a cardiac cycle is selected by the steering logic, the cardiac images are sampled at 40 lllsec intervals (25 frames/sec), digitized and stored in the computer memOly. Then, the step-motor is activated and rotates the transducer 2 degrees to the next scanning plane, where the same steering logic is followed. To fiJI the conical data volume, 90 sequential cross-sections from 0-178 degrees mllst be obtained each during a complete cardiac cycle. The transducer assembly can also be used for routine precordial multiplane echocardiography (figure 3) or semi-automated echocardiographic inlage acquisition for left ventricular function studies or stressechocardiography. Respiration gated recording of cardiac cycles in a given plane reduces the influence and random error caused by extracardiac Illotion effecls· 11
.13
Figure 3. I computer control, the plane is rotated over 180° starting with a left ventricular long-axis plane and with steps of 35°. The axis of is indicated in panel A. All images are recorded in the same phase of the respiratory cycle. Images A and F are mirror images. The images can be recorded 011 videotape or optical disc for further analysis. Increments of 2° during acquisition allow the completion of a rotational dataset for three-dimensional reconstruction.
DATA PROCESSING The recorded images are formatted in the correct sequence according to their ECO phase
in volumetric data sets (256*256*256* pixel/each 8 bit). To convel1 the rotated images into an isotropic cubic data set, a geometric transformation is necessary. To fill the gaps in the far fields, a "trilinear cylindric interpolation" is used. The size of the gaps is dependent on the distance from the rotation axis and the angle increment between two acquired images.

PRECORDIAL 3DE OF THE HEART 11
An QversampJing is done near the rotation axis and an undersampling in the outer region. This phenomenon can be compared to a regular two-dimensional sector image. In such an image, the near field is over- and the far field is under-sampled as wel1. To reduce motion artifacts which can be created by patient movement, respiratory artifacts or probe movement, a dedicated image processing filter is used (ROSA filter: Reduction Of Spatial Artifacts).11-13
CLINICAL PROCEDURE Echocardiographic studies are performed with the transducer system in the parasternal or
apical positions while the patient is comfortable lying in the 45-degree left recumbent position. The operator has to find the center axis around which the imaging plane is rotated to encompass the structure(s) or region of interest. Since the spatial coordinate system changes with transducer movement, motion of the transducer must be avoided. An experienced operator, after a learning period is able to keep the transducer stationary during the acquisition period. Inadvertent patient movement during the unage acquisition can be largely prevented by thoroughly explaining the procedure before the study. The examination, including the calibration procedures, selection of the optimal gain settings and conical volume with a few test runs and the actual image acquisition, requires approximately 8-10 minutes in patients with sinus rhythm. In order to secure optimal image quality of individual regions of interest, different image acquisition sequences from different windows are peifonned. Calibration and storage of the data in the computer memory between acquisition sequences requires approximately 3 minutes. Off-line three-dimensional reconstruction of an area of interest requires 30-60 minutes depending how difficult it is to select the optimal cut planes to visualize a given stl11cture UI its three-dimensional perspective as there may be significant anatomical variability between patients. Guidelines to identify approximate cutting planes in various disease categories have been proposed. I 1·12
DISPLAY MODALITIED OF THREE·DThIENSIONAL ECHO CARDIOGRAPHY Different displays from three-dimensional data sets can be produced.
(1) Two·dimensional display from: (a) individual selected cut·planes (anyplane echocardiograpby):
Any desu'ed cross-section of the heart or of a selected stl11cture which is difficult or physically impossible to obtain from standard precordial or transesophageal acoustic wUldows can be computed from the data set and displayed in motion with zoom facility in cine-loop format at 25 frames/sec 11,12(figure 4).
(b) parallel short-axis cuts along a defined long-axis (paraplane); Parallel slicing through the data 'set is possible and allows the generation of equidistant cross-sections at selected intervals in any plane through a region or structure of interest (figure 5). These computed cross-sections can be displayed in cine-loop format at 25 frames/sec.
(c) long-axis cuts (up to 8 different views at different angle increment) (2) Three·dimensional reconstruction (Volume rendered technique),
From any defined cut-plane, different algorithms are applied to represent the infollllatioll in space. To distinguish between a structure of interest and the background image, a greylevel threshold is used. This difficult process is known as image segmentation.

12 CHAPTER 2
A "hard" decision is somewhat relaxed by using a "fuzzy segmentation", where a probability is assigned to each greylevel. to decide whether it belongs to a structure or the background. A more or less subjective decision is always necessary (Le. to adjust for the Time Gain Compensation used during acquisition of the original two-dimensional images).1I,12
:Figurc 4. Anyplnne echocardiogmphy. From the three-dimensional data sel up to 8 cut planes can and reconstructed by computer. In this example left yentricular (LV) long-a"{is views are generated (panels B-1) and their orientation is shown in panel A. A comprehensive standardized analysis of the shape, size and wallmolion of the left ventricle is possible.
!<'igure 5. Parapiane echocardiography using the three-dimensional data set of a patient with hypertrophic cardiomyopathy. The parastemallong-axis view is shown in panel A and the lines indicate the computer generated parallel short axis views of the left ventricle from B to I.
Since ultrasound images are noisy, algoritllllls for edge enhancement and noise reduction must be applied. The performance characteristics of these algorithms will have an effect on the overall quality of the three-dimensional image. Furthermore, the definition of a tlll'eshoid

PRECORDIAL 3DE OF THE HEART 13
to recognize the interface between cardiac structures and the blood pool during the segmentation procedure is based on visual inspection. This introduces a subjective factor similar to the optimization of two-dimensional echocardiogrmns during standard examination procedures.
Figure 6, same now axis view from interventricular septum to the lateral wall. Panel E corresponds to the standard parasternallong-a.xis view.
Different rendering algorithms are used and mixed with different weighting factors to create a three-dimensional shaded display,l4 These algorithms are: (a) distance shading; (b) transparent adaptive greyJeveJ gradient shading; (c) texture shading and (d) maximulll intensity projection. The tissue display of the three-dimensional reconstructions has a close resemblance to the actual anatomy of the heart. Tlus effect can be further enhanced by creating rotational sequences on the output screen.
CLINICAL APPLICATIONS OF THREE-DIMENSIONAL ECHOCARDIOGRAPHY The initial results of the application of three-dimensional echocardiography in humans are
promising (8- J 0, J 5- J 9).
(A) "ANYPLANE TWO-DIMENSIONAL Th'IAGING The linutations of acoustic access and registration of individual two-dimensional images can
potentially be overcome by three-dimensional echocardiography. From the original threedimensional data set, new individually optinuzed otherwise unobtainable image planes can be computed and displayed in motion (dynamic anyplane echocardiography). Zoom facility allows visualization of detailed structures. Slicing of a given structure can be performed with parallel scanning in a way similar to computed tomography or magnetic resonance imaging. Up to 8 longitudinal cut planes with different angle interval can be simultaneously displayed f01: better spatial appreciation (Figure 2). Fm1hennore, the final assessment of cavity dimensions or the evaluation of a given st111cture will be more objective and less operator dependent.

14
B) QUANTIFICATION (1) Volllllles lIIeaSlltelllellts.
CHAPTER 2
Various two-dimensional approaches for measuring left ventricular volume have been proposed, but all make some assumption about cavity shape 20, With standard two-dimensional echocardiography only a limited number of planes can be obtained, thus a theoretical geometrical model mLIst be assumed which is often far from the reality. From the threedimensional data set, orthogonal long-axis cut planes can be automatically selected, which partially compensates the geometric assumption for biplane methods.
The major advantage of three-dimensional echocardiography over standard twodimensional imaging relies on more objective assessment of ventricular shape and size, since it does not rely Oll any specific transducer location or orientation plane. Thus, three-dimensional echocardiography should be able to define chamber volume in an accurate and reproducible manner. Manual tracings of endocardial borders from a series of parallel short-axis cut planes of the left ventricle at variable intervals allow computation of left ventricular volumes independent from theoretical models. Volumes of individual slices are calculated (V=Axh, where A=area of the slice, and h=distance between adjacent cut planes) and summed to obtain the total 13 volume (figure 3). Serial studies with three-dimensional echocardiography will provide more insight into the natural histOlY of complex cardiac pathology and in the rate of progression of its severity (e.g. ventricular remodeling). (2) Distallce meaSllrelllellts.
The different slUface points of a three-dimensional reconstruction are not in one plane. Thus, a distance measurement must take always the depth into account. From the volume rendered display, the definition of a start and end point of the distance to be measured will result in the computation of the distance in the voxel space. (3) Area meaSllremellts.
Although area measurements can only be applied to two-dimensional images, three-dimensional echocardiography permits sectioning of the heart in any desired Ollentation. Thus, cut-planes can be selected which cross section the stmcture in the desired optimal orientation. Tins makes orifice area measurement more accurate.
Preliminaty study in Thoraxcenter 12 includes 97 patients (mean age 32 ± 9 years) selected on the basis of good precordial image quality and sinus rhythm with a variety of cardiac disorders including myocardial disease (26), valvular heart disease (26), congenital heart diseasc (35) and normal subjects (10). In these patients, a total of 176 acquisition sequences, 78 with the transducer in the parasternal and 98 in the apical position, were pcrformcd. Adequate dynamic volume rendered display was possible in 77% of the patients. Threedimensional image quality was considered adequate when there was complete visualization in depth of the structures of interest. Inadequate reconstmctions may result from incomplete acquisition, poor image quality or inadequate gain settings during acquisition of the original data so that structures could not be detected by threshold changes during the volume rendered procedure. Dynamic anyplane and paraplane echocardiography were always possible and allowed the display of CLIt planes unobtainable from precordial windows of selected structures.

PRECORDIAL 3DE OF THE HEART
Figure 7. Three-dimensional reconstmclion with volume rendered display of the aortic valve (A V). Electronic aortotomy is performed and the valve is visualized from above in the closed position during diastole (A) and open position during systole (B),
SiD
15
Figure 8. Three-dimensional volume rendered display of a subaortic membrane (~.J) seen from within the left ventricle. Note the aortic valve (A V) closed in diastole (A) and open in systole (D). AML: anterior mitral leaflet.
Figure 9. Examples of volume rendered three-dimensional reconstnlclions of nonnal, stenotic and prolapsing mitral \'alves. Electronic atriotomy is performed and the mitral valve leatlets are seen from an atrial viewpoint. Panel A shows a nonnal mitral valve in the closed position during systole and panel B in the open position during diastole (B). A stenotic mitral valve is shown closed in panel C and in the open position during diastole in panel D. Note the small stenotic orifice. The prolapsing scallops of both mitral leaflets are seen in panel E (sec asterisks). Panel P shows the mitral valve open in diastole. Ao: aorta; AML and P.ML: anterior and posterior mitral valve leaflets; CS: coronary sinus; IAS: interatrial septum; MV: mitral valve; TV: tricuspid valve.
Three-dimensional reconstructions showing the aortic valve from the ascending aorta allow a direct qualitative evaluation (figure 7).
The left ventricular outflow can be visualized from a ventricular viewpoint and th~ nature of subaortic pathology is directly visualized (figure 8),
Imaging of the normal and pathologic mitral valve is possible from both atrial and ventricular viewpoints. Excellent delineation of the leaflets and qualitative analysis of the pathology is possible (figures 9 and 10),

16 CHAPTER 2
Direct visualization of the ventricular septal defect and its stl11ctural relationships in a patient with tetralogy of Fallot is shown in figure 11. In these conditions the pathomorphology was better appreciated from the three-dimensional than from the standard two-dimensional images.
The potential of electronic anyplane and paraplane echocardiography for both qualitative and quantitative analysis of specific cardiac pathologies is illustrated in figures 4-6, 12 and 13.
Figure 10. Three-dimensional rcconslntClions of a stenotic mitral valve viewed from within the left ventricle in the closed position during systole (A) and open during diastole (B).
l. Figure 11. i following a Iong-a.xis cut plane of the left ventricle in diastole of a patient with tetralogy of Fallot. TIle ventricular septal defect (arrow) and the overriding aorta are visualized.
Figure I data set (panel A), 8 parallel cut planes in orientation (anyplane capability) I the mitral valve are generated and the corresponding two-dimensional images are represented in panels B to I. This allows a slicing of the structure in a way similar to computed tomography or magnetic resonance imaging. The smallest orifice area is represented in panel F. This approach allows accurate planimetry of the mitral valve orifice.

PRECORDIAL 3DE OF THE HEART 17
Figure 13, The principle of left ventricular volume measurement using a three-dimensional data set. An enddiastolic long-axis view is selected as a reference view (panel A) and the left ventricle is sliced at equidistant intervals to generate a series of short axis views (parapJane capabilities), The surface area of each cross-section is measured by pianimelry and the volume of each slice calculated. Adding lip the volumes of all slices provides an accurate volume measurement of the left ventricle (Simpson's rule). This is pcrfonncd for both end-diastolic and end-systolic data sets. The figure shows an end-diastolic long-axis view on which the two lines A and B correspond to the shorHlXis views shown in the middle panels A and B. Panel C shows reconstmctions of the left ventricle using the pianimetered contours of short a.xis views obtained at 3 mill intervals.
DISCUSSION Three-dimensional reconstruction of the heart has been an important research goal ever
since the introduction of two-dimensional echocardiography. Several directions have been followed. Scanning in "real-time" of a pyramidal volume encompassing the whole heart is the most exciting development but progress is slow and clinical application remote.21 Most approaches towards three-dimensional echocardiography are "off-line" and are based all the sequential acquisition of multiple cross-sectional images together ,vith their spatial position and orientation using either external or internal coordinate reference systems. Mechanical
. I d 22 d . I k 2324 I' II I . artlcu ate arm an acollstlca spar' gap' ocatlOn systems a ow t le contll1uous registration of the transducer position and the imaging plane with respect to an external reference point and have been used for precordial image acquisition. In most of these studies, static wire-frame or surface rendered displays have been generated. These displays do not contain the important grey scale information about tissue?5
Parallel, fan-like and rotational scanning methods are based on internal coordinate reference systems and have recently been successfully applied for precordiaf6
.29 acquisition
in infants and small children. However, it appears that small acoustic windows make rotational scanning the most effective precordial acquisition approach in children and certainly in adults since the basic images are obtained from a small and fixed pivot point.3o
The possibility of generating three-dimensional reconstructions from standard precordial two-dimensional images will undoubtedly stimulate interest and expand the clinical application of three-dimensional echocardiography since information similar to that obtained

18 CHAPTER 2
from other tomographic imaging techniques including radiolluclide, computed tomography and magnetic resonance can be obtained with the additional advantages of better temporal resolution, portability, bedside application and relatively low cost. Three-dimensional echocardiography is still in its infancy and interest in tIlls technique is growing.
From our experience we feel that three-dimensional reconstruction will facilitate the assessment of strnchues and pathology of unknown or complex geometry such as the right ventricle, aneurysmatic ventricles in coronary artery disease and complex congenital heart disease.3I ,32 Topographic maps of elusive stl1lctures such as the mitral valve can be created helping to better understand its pathology. 33 The surgeon can now have a preview of what he will find during surgery (electronic cardiotomy) but with additional information on function. This will be of particular help in valve and congenital defect repair.
The acquisition time is at present short enough to consider three-dimensional imaging as part of a standard echocardiographic examination whenever is felt that it would provide incremental information for clinical decision-making. However, at this stage of its development the long reconstruction time and the need for a dedicated operator remain major limitations of its routine use. Although we have demonstrated the feasibility of precordial acquisition using rotational scanning, it should be emphasized that this study included only patients in sinus rhythm with good image quality. It thus remains an investigational tool with respect to clinical practicality and the independent additional information it provides in different clinical conditions and scenarios.
Perhaps the greatest advantage of acquiring a three-dimensional data-set is that now crosssectional images can be computed in any desired plane independent from orientations dictated by the available acoustic \vindows and that parallel slicing of selected structures can be performed electronically.
These capabilities allow the selection of cut planes for optimal visualization of a cardiac structure and accurate quantitative measurement. By using a series of computer generated equidistant parallel cross-sections accurate measurement of specific structures can be made such as orifice areas of normal or pathologic valves (figure 12). Accurate volume calculation of the right or left ventricle is possible and the need for making geometric assumptions is eliminated (figure 13). Clearly, new complex parameters to define global and regional left ventricular function will become available in the fUhlre. 3
-1
The semi-automated and controlled registration of multiplane precordial with the handheld transducer assembly will allow an easier and more standardized examination procedure for routine echocardiography in the future.29 For example, the exact relationship between the apical views can be accurately documented rather than assuming an orthogonal relationship. Respiration gated cardiac cycles can be recorded during stress echocardiography thus avoiding random variability resulting from extracardiac motion in both interpretation and quantitative analysis.35 Automatic endocardial border detection can be integrated to calculate left ventricular volumes on-line from a limited number of cross-sections. The echocardiographic examination will become less operator-dependent and more objective. Most of the performance variability will thus be avoided.

PRECORDIAL 3DE OF THE HEART 19
ADVANTAGES AND ECHOCARDIOGRAPHY
LIMITATION OF THREE· DIMENSIONAL
Advalltages of thl'ee·dimellsiollal ec/lOcal'diogl'aphy (Ire: (1) Standardized examination procedure (2) Objective imaging (3) Improved accuracy of qualitative infonnation (4) New quantitative parameters of cardiac function (5) Preoperative simulation of repair
Presellt problems with thl'ee·dimellsiollal echocal'diography. (1) Acquisition and processing time (storage space, computing power) (2) Transducer stability dming acquisition (3) Limited resolution (4) Susceptibility for background noise artefacts (5) No on-line three-dimensional representation
IN SUMMARY We arc entering an exciting new era in the development of cardiac ultrasound, which may
ultimately have a greater impact on clinical cardiology than two-dimensional echocardiography. With further developments in computer technology both the image quality and display facilities will improve and the reconstruction time rapidly decrease. The SCllll
automated standardized examination procedure with the transducer assembly necessary for three-dimensional image acquisition will change the practice of echocardiography in the future by making the procedure less operator dependent. The computer generation of anyplane and paraplane images will further expand the range of clinical diagnostic problems that can be solved.
REFERENCES \Vollschlager H, Zeiher AM, Klein HP, Geibel A, \VollschIager S. Transesophageal echo computer tomography (echo-CT): a new method for perspective views of the beating heart. Circulation 1990;82(suppl 3):111-670 [abstract}.
2 Pandian NO, Nanda NC, Schwartz SL, Fan P, Cao QL, Sanyal R, Hsu TL, Mumm B, \VolIschIager B, Weintraub A. 11lree-dimensional and four-dimensional transesophageal echocardiographic imaging of the heart and aorta in humans using a computer tomographic imaging probe. Echocardiography 1992;9:677-87.
3 Vogel M, Losch S. Dynamic three-dimensional echocardiography with a computed tomography imaging probe: initial clinical experience with transthoracic application in infants and children with congenital heart defects. Br Heart J 1994;71:462-7.
4 Martin R\V, Bashein G, Zimmer R, Sutherland 1. An endoscopic micro-manipulator for multiplallar transesophageal imaging. Ultrasolind Med Bioi 1986,'12:965-75
5 Kuroda T, Kinter 1M, Seward JB, Yanagi H, Greenleaf IF. Accuracy of three-dimensional volume measurement using biplane transesophageal echocardiographic probe: in vitro experiment. J Alii Soc Echocardiagr 1991 ;4:475-84.
6 Belohlavek M, Foley DA, Gerber TC, Kinter TM, Greenleaf JF, Seward lB. Three- and fourdimensional cardiovascular ultrasound imaging: a new era for echocardiography. Mayo Clin Proc 1993;68:211-40.

20 CHAPTER 2
7 Roelandt J, Cate FJ tcn, Bruining N, Salustri A, Vletter \VB, Mumm B, Putten N van der. Transesophageal rotoplane echo-CT. A novel approach to dynamic three-dimensional cchocardiography. TllOrtlxcentre J 1994;6/1:4-8.
8 Roelandt JRTC, Cate FJ ten, Vletter WB, Tamns MA. Intrasonic dynamic three-dimensional visualization of the heart with a multiplane transesophageal imaging transducer. J Am Soc EcllOcardiagr 1994;7:217-29.
9 Roelandt J, Salustri A, Bruining N. Precordial and transcsophagcaI dynamic three-dimensional echocardiography with rotatable (muItiplane) transducer systems. Ultrasound Med Bioi 1994;20:S32 [absn·actJ.
10 Levy M. Display of surfaces from volume data. IEEE Compuf Graphics Applications 1988;8:29-37
I I Salustri A, Roelandt J. Ultrasonic three-dimensional reconstraction of the heart. illtrasound Med & BioI 1995;21:281-293.
12 Roelandt J, Salustri A, Vletter W, Nosir Y, Bmining N. Precordial multiplane echocardiography for dynamic anyplane, paraplane and three-dimensional imaging of the heart. Thoraxcentre J 1994;6:4-13
13 Nasir YFM, Fioretti PM, Vletter \V, Boersma E, Salustri A, Postma JT. Reijs AEM, TenCate FJ, Roelandt JRTC. Accurate measurements of left ventricular ejection fraction by three-dimensional echocardiography: a comparison \vilh radionuclide angiography. Circulation 1996,94:460-66.
14 Hoehne KH et al. Three-dimensional imaging in medicine. NATA AS! Series, Vol F60, Springer Verlag New York, Heidelberg, Berlin 1990.
15 Handschumacher rvID, Lethor JP, Sill SC, Mele D, Rivera J~'I, Picard MH, Weyman AE, Levine RA. A new integrated system for three-dimensional echocardiographic reconstruction: developmcnt and validation for ventricular volume with application in human subjects. J Am Coil Cordial; 1993:21 :743-53.
16 Rivera JM, Sill SC, Handschumachcr MD, Lelhor JP, Guerrero JL, Vlahakcs OJ, MitcheH JD, 'Veyman AB, King rvtEE, Levine RA. lluee-dimensional reconstruction of ventricular septal defects: validation studies and in vivo feasibility. J Am Call Cardiol 1994;23:201-8.
17 Belohlavck M, Foley DA, Gerber TC, Greenleaf JF, Seward m. Three-dimensional ultrasound imaging of the atrial septum: normal and pathologic anatomy. J Am Call CardioI1993;22:1673-8.
18 Ragueno R, Ghosh A, Nanda NC, Schott J, Moos S. Four-dimensional rcconstl1lction of Iwodimensional echocanliographlc images. Echocardiography 1989;6:323-337.
19 Schwartz SL, Cao Q, Azevedo J, Pandian NO. Simulation of intraoperative visualization of cardiac stlUctures and study of dynamic surgical anatomy with real-time three-dimensional echocardiography. Am J Cardiol 1994;73:501-507.
20 American Society of Echocardiogmphy Committee on Standards, Subcommittee on Quantitation of Two-dimensional Echocardiograms. Recolllll1endations for quantilation of the left ventricle by twodimensional cchocardiography. J Am Soc Echocardiogr 1989;2:358-367.
21 Shcikh KH, Smith SW, Von Ramm 0, Kisslo J, Real-time, three-dimensional echocardiography: feasibility and initial use. Ec/wcardiograph)' 1991;8: 119-25.
22 Geiser EA, Ariet ?'t'I, Conetta DA, Lupkiewicz SM, Christie LO Jr, Conti CR. Dynamic threcdimensional echocardiographlc reconstruction of the intact human left ventricle: technique and initial observations in patients. Am Heart J 1982,'103:1056-65.
23 Moritz WE, Shrcve PL. A microprocessor-based spatial-locating system for use with diagnostic ultrasound. Prac IEEE 1976;64:966-74.
24 Levine RA, Handschumacher MD, Sanfilippo AJ, Hagege AA, Harrigan P, Marshall JE, Weyman AB. Three-dimensional echocardiographic reconstruction of the mitral valve, with implications for the diagnosis of mitral valve prolapse. Circulation 1989,'80:589-98.

PRECORDIAL 3DE OF THE HEART 21
25 Sill SC, Rivera M, Guerrero L, Halldschumacher MD, Lethor JP, \Veyman AE, Levine RA, Picard 1m. Three~dimensional echocardiography. In vivo validation for left ventricular volume and function. Circulation 1993;88:1715-23.
26 Pundian N, Roelandt J, Nanda NC, et a1. Dynamic three-dimensional echocardiography: methods and clinical potential. EcllOcardiography 1994; 11 :237-59.
27 Vogel M, Pandian N, Marx G, Fulton D, Azevedo J, Cao QL, Buhlmeycr K. Transthoracic realtime three-dimensional echocardiography in 100 pediatric and adult patients with heart disease: clinical utility of unique new views unavailable in 2-dimensiollul echocardiography [abstract1. CirclIlatiaIl1993;88:1868.
28 Fulton DR, Marx GR, Pandian NO, Romero BA, Mumm B, Krauss M, \VollscWager H, Ludomirski A, Cao QL. Dynamic three-dimensional echocardiographic imaging of congenital heart defects in infants and children by computer-controlled tomographic parallel slicing using a single integrated ultrasound instnlll1ent. Echocardiogmphy 1994; 11: 155-64.
29 Pandian NO, Cao QL, Caldeira M, ct a1. Application of semi-automated multi plane imaging transducer to transthoracic echocardiograpby makes transthoracic examination easier and faster, and yields ne\" imaging planes - a new direction in transthoracic echocardiography [abstract]. J Alii Coli Cardia11993;1 :346A
30 Ludomirsky A, Silbcrbach M, Kenny A, Smola T, Rice MJ, Klas B, Krauzowicz E, Klein P, Derman R, SalIn DJ. Superiority of rotational scan reconstruction strategies for transthoracic 3-dimensional real-time echocardiography studies in pediatric patients with CHD [abstract]. CirclIlatioIl1994:89;169A.
31 Levine RA, \Veyman AE, Handschumacker MD. Three-dimensional echo-cardiography: techniques and applications. Am J CardioI1992;69(20): 121 H-30H.
32 Linker DT, Moritz WE, Pearlman AS. A new three-dimensional echocardiographic method of right ventricular volume measurement: in vitro validation. JAm Call CardioI1986;8: 101-6.
33 Flachskampf FA, Handschumacher M, Vandervoort PM, Hanrath P, \Veyman AE, Levine RA, et al. Dynamic three-dimensional reconstruction of the mitral annulus using a multiplane transesophageal ccho-transducer [abstract]. Circulaaoll 1991 ; 84(Suppl 2):Il-686.
34 Halldschumacher MD, Lethor JP, Sin SC, Mele D, Rivera JM, Picard MH, Weyman AB, Levine RA. A new integrated system for three-dimensional echocardiographic reconstruction: development and validation for ventricular volume with application in human subjects. J Alii Coli Cardial; 1993:21 :743-53.
35 Assmann PE, Slager CJ, Borden 0 van der, Sutherland GR, Roelandt J. Reference systems in echocardiographic quantitative wall motion analysis with registration of respiration. J Am Soc EcllOcardiogr 1991;4:224-34.

I
I

LVEI<' CALCULATION BY 3DE YS RNA 23
CHAPTER 3
ACCURATE MEASUREMENT OF LEFT VENTRICULAR EJECTION FRACTION BY THREE-DIMENSIONAL
ECHOCARDIOGRAPHY A COMPARISON WITH RADIONUCLIDE
ANGIOGRAPHY
Youssef FM Nosir MD, Paolo M Fioretti MD, Wim B Vletter BSc, Eric Boersma MSc, Alessandro Salustri MD, Joyce Tjoa Postma Bsc,
Ambroos EM Reijs MSc, Folkert J Ten Cate MD, Jos RTC Roelandt MD.
Circulation 1996;94:460-66

24 CHAPTER 3
ABSTRACT Backgrollnd. Three-dimensional echocardiography is a promlsmg technique for left ventricular ejection fraction calculation, since it allows its measurement without geometric assumptions. However, few data exist studying its reproducibility and accuracy in patients. Methods. 25 patients underwent radionuclide angiography and three-dimensional echocardiography using rotational technique (2-degrce interval, ECG and respiratory gating). Left ventricular volume and ejection fraction were calculated using Simpson's rule at 3-mlll slice thickness. Analyses were performed to define the largest slice thickness required for accurate left ventricular volume and ejection fraction calculation. Results. Three-dimensional echocardiography had excellent correlation with radionuclide angiography for left ventricular ejection fraction calculation (mean±SD = 38.9±19.8 and 3S.S±IS.0 respectively, 1'=0.99), their mean difference was not significant (0.03 ± 0.17, p=0.3). They had a close limit of agreement (-0.385, +0.315). Intraobserver variability for radionuclide angiography and three-dimensional echocardiography were 4.2% and 2.6% respectively, wllile interobserver variability were 6.2% and 5.3% respectively. There was no significant difference of left ventricular volume and ejection fraction calculated by 3-mm thickness and those calculated at different slice thickness up to 24-n1111. However, the standard deviation of the mean difference showcd stepwise increase, particularly above 15-mIll slice thickness. At IS-mm slice thickness the probability of three-dimensional echocardiography to detect >=6% difference in ejection fraction was 80%. Conclusions. Three-dimensional cchocardiography has excellent correlation an close limits of agreement with radionuclide angiography for calculating left ventricular ejection fraction in patients and has at least similar observer variability of radionuclide angiography. We recommend to use IS-nUll slice tllickness for accurate and rapid left ventricular volume and ejection fraction measurements.
INTRODUCTION Calculation of left ventricular ejection fraction has important diagnostic, prognostic and
therapeutic implications and a rapid, accurate, reproducible and noninvasive method would be desirable. 1-2
Radionuclide angiography is an accepted method for the measurement of left ventricular ejection fraction.3
.4 However, since it is mther expensive and necessitates the exposure of the
patient to radiation, it is a suboptimal test when serial calculations of left ventricular ejcction fraction are required.
Two-dimensional echocardiography is a widespread technique for clinical evaluation of left ventricular ejection fraction. However, assessment of left ventricular performance by two-dimensional cchocardiographic techniques is based on geometric assumptions.5
.6
Accurate measurement of left ventricular volume and function rcquires the reconstmction of the true geometry of the heart, particularly in patients with distorted left ventricular geometry and impaired left ventricular fimction.7
.g
Three-dimensional echocardiographic technique reduces the linlitations of twodimensional echocardiography and allows quantification of left ventricular volumes and ejection fraction without geometric assumptions.9 Three-dimensional echocardiography was
L VEF CALCULATION BY 3DE vs RNA 25
shown to be highly accurate in determining volumes in vitro. In studies using phantoms and excised ventricles, left ventricular volumes calculated by three-dimensional echocardiography agreed closely with the actual volumes.lO Few data have been published so far on the comparison between three-dimensional echocardiographic calculation of left ventricular volumes and ejection fraction with other techniques in humans. II
-12
The aim of this study was to determine the feasibility and accuracy of three-dimensional echocardiography for calculating left ventricular ejection fraction in comparison with radionuclide angiography. Reproducibility of both techniques were compared in terms of intraobserver and interobserver variability. In addition, left ventricular volumes and ejection fraction were assessed using different slice distances to determine the largest slice thickness required for calculating left ventricular volumes and ejection fraction without loosing accuracy.
SUBJECTS AND METHODS Study populatiou.
Three-dimensional echocardiography was pedormed in 25 patients undergoing multigated radionuclide angiography for evaluation of left ventricular ejection fraction. Patients were not selected clinically but for cchocardiographic quality, patients in whom it was possible to visualise the whole left ventricle in all standard apical echocardiographic views were included in tltis study. Of the 25 patients 15 were men and 10 were women ranging in age from 25 to 82 years with a mean age of 53 ± 16 years. Eleven patients had ischaentic heart disease (10 with previous myocardial infarction and 1 with angina pectoris), 5 patients had dilated cardiomyopathy, 8 patients were evaluated during chemotherapy for cancer and 1 normal volunteer was also studied.
Study protocol. Informed consent was taken from every patient after full explanation of the procedure. In
each patient a muItigated radionuclide angiogram for evaluation of left ventricular ejection fraction was performed. This was followed by a three-dimensional echocardiographic study on the same day in 17 patients and at an interval of I - 9 days (mean 3.5 days) in 8 patients. The clinical condition of the patient and medical therapy remained stable between the two studies.
MULTIGATED RADIONUCLIDE ANGIOGRAPHY Radionuclide angiography was pelfonned in the 45° left anterior oblique view after in
vivo labelling of the red blood cells with 15 mCi (540 MBq) of tcchnctium-99m. Acquisitiou was performed during a six minute period with a Siemens (Orbiter) gamma camera equipped with a low energy all pUipose collimator. The data were processed with standard software and background cOlTectioll and the left ventricular ejection fraction was computed fron'! the end systolic and end diastolic images.
ECHOCARDIOGRAPHIC EXAMINATION Echocardiographic studies were performed with a transducer system in the apical
position, wIllie the patient was comfortable lying in the 45-degree left recumbent position.

26 CHAPTER 3
To acquire the cross-sectional images for reconstmction, the operator has to find the centre axis around which the imaging plane is rotated to encompass the whole left ventricular cavity. Since the spatial coordinate system changes with transducer movement, motion of the transducer must be avoided. Inadvertent patient movement during the image acquisition can be largely prevented by thoroughly explaining the procedure before the study. The examination, including the calibration procedures, selection of the optimal gain settings and conical volume with a few test nms and the actual image acquisition. requires approximately 8 -10 minutes ill patients with sinus rhythm.
The pl'econlia{ h"mlSducer assembly and ultrasollud system: \Ve used a newly developed custom-build hand-held transducer assembly that can be
rotated with a step motor via a wheel-work interface. 13-14 A commercially available 3.75
MHz sector scanning transducer (Toshiba Sonolayer SSH-140A system) is mounted in the probe assembly (figure 1). The step-motor is commanded by a steering-logic for controlled image acquisition (Echo-scan, Tom Tec GmbH, Munich, Germany).
THREE-DIMENSIONAL ECHO CARDIOGRAPHY Reconstruction of the left ventricle by three-dimensional echocardiography requires three
basic steps: image acquisition, image processing, and data analysis.
Image acquisition: A software-based steering logic activates the step-motor in the transducer assembly that
controls the image acquisition in a given plane by an algoritlllll considering both heart rate variations (ECG-gating) and respiratOlY phase by thoracic impedance measurement. Prior to the actual image acquisition the R-R intervals were predetermined with an acceptable variability of 150 msec or less and respiration was gated at the end-expiratory phase. Based on this information, the step-motor is commanded by the steering logic to acquire crosssections of cardiac cycles that fall within the preset ranges. This allows optimal temporal and spatial registration of the cardiac images. After a cardiac cycle is selected by the steering logic, the cardiac images are sampled at 40 msec intervals (25 frames/sec), digitized, and stored in the computer memory. Then, the step motor is activated and rotates the transducer 2 degrees to the next scanning plane, where the same procedure is followed. Cycles that do not meet the preset ranges are rejected. To fill the conical data volume, 90 sequential crosssections from 0 to 178 degrees must be obtained each during a complete cardiac cycle.
Image processing: The recorded images are formatted in their correct rotational sequence according to their
ECG phase in volumetric data sets (256x256x256 pixel/each 8 bit). The post-processing of the data sets is performed off-line using the analysis program of the system. To fill the gaps in the far fields, a "trilinear cylindric interpolation U algorithm is used.
Trilillear cylilldrical il/lelpolaliol/ algorithm: When a rotational device is used to acquire an image, the rotation axis is assumed to be
parallel to the vertical axis ( ::::; y-axis) of each acquired image(the x position of the rotation

L VEF CALCULATION BY 3DE YS RNA 27
axis is defined as 'axpos'). Each yoxel x,y in the acquired image 'n' of the rotational series may be then considered as a point in a cylindrical coordinate system with R = {x-axpos}. <t> = n* angular stepwidth + 0 or + ISO degrees (depending on the sign of x - axpos) and Z = y. If the above parameters and a pixel resolution of hllm for the acquired image arc assumed, the maximal gap width will be approximately 6.7 mm. It is obvious that some kind of interpolation algorithm has to be applied to fill the gaps. A trilinear interpolation in the cylindrical space gives acceptable results. Each Cartesian yoxel coordinate x, y, z of the volume to be reconstructed is transformed into a cylindrical coordinate R. cI> .Z. The greyvalues of the eight points in the cylindrical coordinate system of the acquired images, That come closest to r. <P.z contribute to a weighted sum, that makes up the grey value at voxels x, y, z. Weights are inversely proportional to the distances of point r. <I> .z to its neighbours R(i),<lJ (i),Z(i) (i=l...S).
(A) (B) Figure 1. This diagram explains the principle of acquisition of sequential cross-sectional images at 2 degl"ees steps from the apical transducer position (panel A). The figure in (panel B) shows the hand-held transducer assembly used for precordial image acquisition containing a Toshiba 3.75 !vlhz sector scanning transducer. The stepmotor is mounted on the cylindrical holder and rotates via a wheel-work interface, the transducer inside the holder. A cable which transmits the pulses from the computer algorithm to steer the step-motor for controlled acquisition is attached to the COllllector mounted next to the step-molor. There is a micro-switch to control the start at 0 degrees and the end at 178 degrees of the image acquisition.
Image analysis: Left ventricular ejection fraction was calculated from the three-dimensional data sets by
using Simpson's method. By this method left ventricular volume is calculated by manual tracing of sequential short-axis views of the left ventricle from the apex to the mitral annulus. After selecting the long-axis view of the left ventricle, end-diastolic ( the first frame before closure of the mitral valve) and then end-systolic ( the first frame before the opening of the mitral valve) data sets are selected. Parallel slicing through the data sets was then
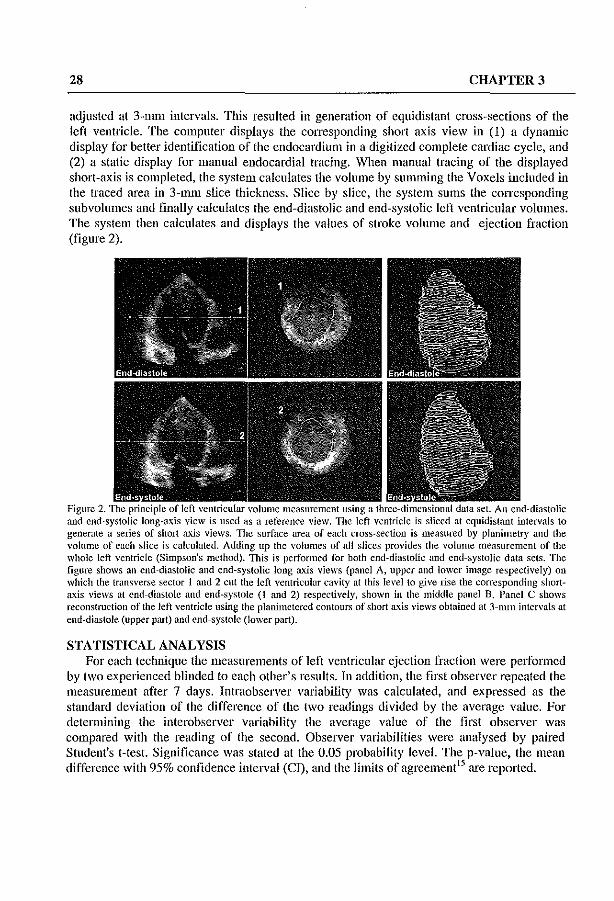
28 CHAPTER 3
adjusted at 3-111lll intervals. Tllis resulted in generation of equidistant cross-sections of the left ventricle. The computer displays the corresponding short axis view in (1) a dynamic display for better identification of the endocardium in a digitized complete cardiac cycle, and (2) a static display for manual endocardial tracing. When manual tracing of the displayed short-axis is completed, the system calculates the volume by summing the Yoxels included in the traced area in 3-n1111 slice thickness. Slice by slice, the system sums the corresponding subvolumcs and finally calculates the end-diastolic and end-systolic left ventricular volumes. The system then calculates and displays the values of stroke volume and ejection fraction (figure 2).
Figure 2. The I volume measurement and end-systolic long-axis view is used as a reterence view. TIle left yentricle is sliced at equidistant intervals to generate a series of short axis views. The surface area of each cross-section is measured by plonimetry and the volume of each slice is calculated. Adding up the volumes of all slices provides the yolume measurement of the whole left ventricle (Simpson's method). TIlis is performed for both end-diastolic and end-systolic doto sets. The figure shows on end-diastolic and end-systolic long axis views (panel A, upper and lower image respectively) on which the transverse sector I and 2 cut the left ycntricular cavity at this level to give rise the corrcsponding shortaxis views at end-diastole and end-systole (I and 2) respectively, shown in the middle panel B. Panel C shows reconstruction of the left yentricle using tbe planimetercd contours of short axis views obtained at 3-mm intervals at end-diastole (upper pari) and end-systole (IO\ver part).
STATISTICAL ANALYSIS For each technique the measurements of left ventricular ejection fraction were performed
by two experienced blinded to each other's results. In addition, the first observer repeated the measurement after 7 days. Intraobserver variability was calculated, and expressed as the standard deviation of the difference of the t\VO readings divided by the average value. For determining the interobserver variability the average value of the first observer was compared with the reading of the second. Observer variabilities were analysed by paired Student's t-test. Significance was stated at the 0.05 probability level. The p-value, the mean difference with 95% confidence interval (Cn. and the limits of agrcement15 are reported.

LVEF CALCULATION BY 3DE vs RNA 29
A paired t-test was also performed to compare radionuclide angiography and threedimensional echocardiography, using the average values of the first observer obtained at 3 mm slice distance. Pearson's correlation coefficients are presented.
In addition, left ventricular end-diastolic and end-systolic volumes, and ejection fraction were calculated by the first observer from three-dimensional cchocardiography by using slice distances ranging from 6 to 24 mm, with stepwise increments of 3 mm. Repeated (7) comparisons were made with the value obtained at a slice distance of 3 11Ull by paired t-tests with Bonferroni' s correction. Power analysis was performed to determine the possibilities of a beta error in the comparison with the 15-mm slice distance.
RESULTS Feasibility.
Three~dimensional echocardiographic acquisition and reconstruction could be performed in all patients recruited in this study without difticulties. Three-dimensional echocardiographic acquisition was repeated in one patient due to an error in the calibration procedure of the rotational axis. All patients included in this study were in sinus rhythm, the difference between the mean ± standard deviation of the patients heart rate during radionuclide angiography and three-dimensional echocardiography was not significant ( 82 ± 11 and 81 ± 10 respectively, p=0.7 ). Echocardiographic examination revealed that 10 patients had segmental wall motion abnormalities, 5 patients had global hypokinesis and 10 patients had normal wall motion. In each case the examination including the calibration procedures, selection of optimal gain setting and conical volume, and image acquisition required approximately 8-10 minutes. Calibration and storage of the data in the computer melllOlY required approximately 3 minutes. Off-line image processing and analysis required on average 50 minutes.
Table 1. Mean ± SD of left ventricular ejection fraction (LVEF) calculated by radionuclide angiography (RNA) and three-dimensional echocardiography Simpson's method (3DS), with intra- and interobserver variability, 95%~I an~_limits_~( ag!'~em~J~t ~tea~ll method,",_~~_ Method RNA 3DS
"--"---~-" ~~ Obs. IA (Meall±SD) 39.0±19.6 3S.S±IS.7 Obs. IB (Mean±SD) 3S.0±20.0 3S.3± 17.4 Average obs. I (Mean±SD) 3S.5±19.S 3S.6±IS.1 Obs. 2 (Mean±SD) 3S.3±19.6 37.0±16.1 Intraobserver variability 95% CI Limit of agreement Interobserver variability 95% CI Limit of agreement
4.2% -0.002, +0.062 -0.17, +0.23 6.2% -0.034, ++0.046 -0.19, +0.21
2.6% -0.019, +0.021 -0.1, +0.1 5.3% -0.02, +0.06 -O.IS, +0.22
Obs.lAo::::: first reading of first observer, Obs.l B- second reading of first observer.

30 CHAPTER 3
1ntraobserver and interobserver variability of radiollliclide angiography (table 1). There was no significant difference in measurement of left ventricular ejection fraction
obtained by the same observer in two different settings (mean difference (SD) = 0.03(0.016), p::::O.07}, with an intraobscrver variability of 4.2%. There was no significant difference in measurement of left ventricular ejection fraction obtained by the two independent observers (mean difference (SD) = 0.007(0.024), p=0.8), with interobserver variability of 6.2%. In addition there were close limits of agreement and 95% CI between both intraobserver and interobscrver measurements obtained by radiol1uclide angiography.
Illh'aobserver aud illterobsen'er variability of three-dimensional ecltocardiograplzy, Simpson's method (table 1).
There was no significant difference in measurement of left ventricular ejection fraction obtained by the same observer in two different settings (mean difference (SD) = 0.001(0.01), p=O.9}, with intraobserver variability of 2.6%. There was no significant difference in measurement of left ventricular ejection fraction obtained by the two independent observers (mean difference (SD) = 0.02(0.02), p=0.3}, with interobserver variability of 5.3%. In addition there were close limits of agreement and 95% CI between both intntobserver and interobserver measurements obtained by three-dimensional echocardiography-true Simpson's method.
Comparisol/ of radiollliclide al/giography and t/tree-dimel/siol/al ecllOcardiogmplly. The mean ± SD values of left ventricular ejection fraction obtained by radionuclide
angiography and three-dimensional echocardiogntphy are presented in table 1. There was excellent cOlTelation in the measurements of left ventricular ejection fraction obtained by radionuclide angiography and three-dimensional echocardiography (r value = 0.99) (figure 3). No significant difference existed in the mean difference between the average values of left ventricular ejection fraction obtained by radionuclide angiography and three-dimensional echocardiography (figure 4) (table 2). In addition, there were close limits of agreement and 95% CI between the measurements of radionuclide (lngiography and three-dimensional echocardiographic Simpson's method (table 2).
Three·,limensional ecllOClIrtliograplzic measurement of {eft ventricular volumes (Iuti ejectiol/ fractiol/ at different slice distal/ces.
The mean values ± standard deviation of left ventricular end·diastolic and end-systolic volumes and ejection fraction me(lsuremcnt using different slice distances are represented in table 3. There was no significant difference between the mean difference of left ventricular end-diastolic and end-systolic volume and ejection fraction calculated at a 3 mOl slice distance and those calculated at different slice distances ranging from 6 to 24 lTIm, with stepwise increments of 3 mm (table 3, figure 5). The difference between left ventricular ejection fraction calculated by radionuclide angiography and that by three-dimensional echocardiography at different slice distances ranging from 3 to 24 nUll with stepwise increments of 3mm, was not significant for the whole group of patients as well as in patients subgroups with normal and abnormal left ventricular wall motion (table 4, figure 6).

LVEF CALCULATION BY 3DE vs RNA
UJ 0
'" ~ LL LIJ > -'
80
80
40-
20
o o
.. ' /.
• .. ..... •
• . ' . '. . n~25
r~O.99
y~3. 7+0.9x
20 40 60 80
LVEF for RNA
Figure 3. Linear regression of left ventricular ejection fraction (L VEF) in all patients, measured by three-dimensional echocardiographic Simpson's method (3DS) versus radiolluclide angiography (RNA). n = number of patients, r = correlation cocft1cients. The dashed line represents the identity line.
TabJ~2. Comparison beh~~en"~A and 3DE.
10
" Q
" ~ 5 0
LL ill > " 0-
< z < ~ 0 ·5 LL ill
~ .10
0
..
31
.t ----.----, •
~ 40 W
Average lVEF by RNA and 3DS 10
Figure 4. Difference of each pair of radionuclide angiography - three-dimensional echocardiographic left ventricular ejection fraction measurements plotted against the average value.
Method Mean difference + (SEE) p value: __ 9";5:,-%",o:;cC,,,I-;c--=: RNA-3DE -0.035 + 0.035 0.3 -0.11, +0.035
.Jjn~!!~~ agreement -0.~S5, +0",.3,",1;;;.5~~_
SEE = standard error of differences, other abbreviation as in table 1
Table 3. Mean values and mean differences of end-diastolic and end-systolic LVV and LVEF calculated at diff<;!'e~t slice thickness b~ 3DS ...
ESV (ml) EDV (nu) EF(%) Mean+SD MD+SD Mean+SD MD+SD Mean±SIL---.MD+SD
3-mm 90.2±63.3 \35.6±67.1 3S.7±IS.4 6-null 90.7±63.S 0.8±2.0 I 36.0±67.S 0.3±2.3 38.5±IS.5 0.13±1.6 9-111111 90.8±63.3 0.6±3.2 136.1±67.4 0.4±3.5 38.6±IS.2 0.03±2.2
12-mm 90.4±64.2 0.2±3.7 137.3±6S.5 1.7±4.9 39.6±IS.6 0.SS±2.4 15-mlll 92.5±65.3 2.3±4.4 136.4±6S.4 O.S±7.1 38.3±IS.1 0.37±3.3 I8-mm 91.1±65.6 0.9±6.3 136.3±67.3 O.6±9.1 39.7±19.5 0.98±5.1 21-mlll 89.2±61.7 1.0±12.0 133.3±70.0 2.3±12.7 37.6±18.9 1.07±8.48 24-111111 91.9+6S.1 1.6+8.5 137.9+70.8 2.3+15.4 38.4+22.9 0.23+11.8 ESV~end-systolic volume, EDV-end-dia~tolic volume, MD±SD- mean difference between values at 3 mm and values at 6, 9,12, 15, 18,21.24 nun slice thickness respectiYcly, all other abbreviations as in table I.

32 CHAPTER 3
Table 4. i'o'fean difference ± SD of L VEF calculated by RNA and 3DS at different slice thickness of the whole
,=£alie~l~",~!~,2"i&£i!!l!!!~~!!!~p.o~lal !-=~~~~~lL~.2!,!,~ (Bl!nd ,£~ent~ with abnomlUl_I::YJ;~l!}~lotion (C).
MD + SD ( A ) MD + SD J B ) ____ . __ .MD ± SD Cc:._)_~_~~ MD±SD MD±SD MD±SD
3-111111 -O.S±3.2 -1.6±4.0 -O.3±2.5 6-111111 -O.9±3.S -1.6±S.O -O.5±2.7 9-n1111 -O.S±3.7 -2.0±3.9 -O.1±3.4
12-lllll1 -O.1±4.1 -O.4±4.6 O.4±3.9 lS-llllll -1.2±4.S -3.0±S.1 -O.Ol±4.4 lS-llllll O.2±5.6 -O.7±3.7 O.8±6.7 21-11Ull -1.9±9.6 -3.5±S.8 -O.8±1I.S 24-mm -1.0±11.9 1.0±S.3 -2.4±13.S
=~~<"'"~~,=,,~===,=,=;=~~""'=,=v,~",_=..,.."""''''''''''~·_· __ ~~== ivlD±SD- mcan difference between LVEF calculated by RNA and that by 3DS at 3, 6, 9, 12, 15, 18.21,24 mm slice thickness respectively, All abbreviations as in table 1.
15 ~ EDV (ml)
Q) II
() ESV (ml) c::
Q) ~
• EF (%) Q)
10-~
:= '0
c:: • III ro Q) III E
5~ • ~ III 0 III 0 III • (J) I • • 0'
6 9 12 15 18 21 24
Slice thickness (mm)
Figure 5. The standard deviation of the mean difference of left ventricular end-diastolic (EDV) and end-systolic (ESV) volumes and ejection fraction (EF) calculated by three~dimensional echocardiography at 3-mm slice thickness and values calculated at different slice thickness ( from 6 to 24 mm) plotted against the slice thickness, in the whole group of patients.
At a IS-mm slice distance with this number of patients, three-dimensional echocardiographic Simpson's method was able to detect a difference of 6% in left ventricular ejection fraction with a power of 80%, while tills power was 99% for detecting a difference of 10% (table 5).

LVEF CALCULATION BY 3DE YS RNA 33
Table 5. The probability for detecting the differences of LVEF(%) in the study group using 3DS at IS-HUll slice distance.
% Difference 1% 2.5% 5% 6% 7.5% 10% Absolute difference ±0.4 ±I ±2 ±2.3 ±2.9 ±3.9 Power 1% 10% 58% 80% 96% 99% All abbreviations as in table I
" 15 " c: all patients ~ • " • ;;: i:-I Abnormal LVWM ~ "0
"0 1Qe Normal LVWM • • c:
0
~ L III .;; • III " 5 i III , ~ "0
~ "0 • I .. :;; "0 c:
'" - 0' (f) 0 3 6 9 12 15 18 21 24
Slice interval (mm)
Figure 6. The standard deviation of the mean difference of left ventricular ejection fraction calculated by radionuclide angiography and that by three-dimensional echocarJiography at different slice thickness ( f.rom 3 10 24 nilll) plotted against the slice thickness, in the whole group of patients and in subdivision of patients with nonnal and ahnonllullcft ventricular wall motion.
DISCUSSION. Calculation of left ventricular ejection fraction is frequently needed for the evaluation of
patients with heart disease. Radionuclide angiography is an established method for the noninvasive measurements of left ventricular ejection fraction.3
-4 TIlls teclmique .is rather
expensive and becomes impractical if repeated evaluation of left ventricular pelformance is needed.3
"'-16
Two-dimensional echocardiography gained widespread use in clinical evaluation of left ventricular ejection fraction, as it allows comprehensive evaluation of anatomy and function in a short period of time, it is noninvasive, mobile, and relatively inexpensive when compared to radionuclide or other emerging imaging techniques like magnetic resonance imaging. However, assessments of left ventricular performance by two-dimensional echocardiograpillc techniques have suffered from a reputation of limited accuracy and reproducibility.I7-18 WIllIe fairly accurate estimates of volumes and ejection fraction can be made using quantitative methods, it continues to be based on geometric assumption.5
-6
Moreover, quantitative evaluation of left ventricular volume and function requires reconstruction of the fme geomehy of the heart, particularly in patients with a distorted left ventricular cavity.7-S Three-dimensional echocardiography provides accurate measurement of
34 CHAPTER 3
left ventricular volume and function by the reconstmction of the true left ventricular geometry. 19
This shldy is the first comparison in patients of left ventricular ejection fraction calculated by three-dimensional echocardiography. using precordial rotational technique with ECG and respiratory gating, with that calculated by an accepted clinical method, radionuclide angiography. Our results demonstrated an excellent correlation of left ventricular ejection fraction calculated by three-dimensional echocardiographic Simpson's method with that of radionuclide angiography. There were close limits of agreement and 95% CI between radionuclide angiography and three-dimensional echocardiographic Simpson's mcthod.20
COlllparison witlt otlter studies. Our findings are in agreement with the study conducted by Gopal et al,,2' who compared
left ventricular ejection fraction calculated by radionuclide angiography and threedimensional echocardiography in 51 patients with suspected heart disease. They calculated left ventricular volumes from a series of real-time parasternal short-axis images (7 to 10) acquired with a line-of-intersection display as a guide. This line is computed and displayed in each image to indicate the position and orientation of that image with respect to the other image. All images for ventricular recollstmction are acquired during suspended respiration. A polyhedral surface reconstruction algorithm has been adapted for left ventricular volume computation using the traced endocardial borders of the short axis image. In their patients left ventricular ejection fraction measured by radiolluclide angiography ranged from 9 - 75% with a mean of 47%. They reported a very good correlation between three-dimensional echocardiography and radionuclide angiography, r ~ 0.94 and r ~ 0.98 for both threedimensional echocardiographic observers, respectively.
Sapin et al.,22 achieved higher correlation between left ventricular end-diastolic and endsystolic volume measured by three-dimensional echocardiography using the same method dcscribed by Gopal et al.," and cineventriculography (r value for both observer ~ 0.97 and 0.98 respectively). than between two-dimensional echocardiography and cineventriculography (r value for both observer ~ 0.85 and 0.91 respectively). The same authors did not achieve a corresponding improvement in calculating left ventricular ejection fraction by three-dimensional echocardiography over two-dimensional echocardiography (1' value for both observer ~ 0.82 and 0.80 respectively). In the same study the agreement (mean difference ± 2 SD) of three-dimensional echocardiographic end-diastolic and end-systolic volume measurements with that of cineventriculography (l2.9±25,4 and -0.7±24.8 respectively) was better than that of two-dimensional echocardiography (21.1±54 and 2.4±44.8 respectively). wlule far the ejection fraction a corresponding improvement in the agreement between both three-dimensional and two-dimensional echocardiography with that of cineventriculography (6.6±19.6 and 7.5±21.4 respectively) was not obtained. They explained this discrepancy by the possible balance in volume error measurements of enddiastolic and end-systolic volumes by two-dimensional echocardiography and cineventriculography. These errors were nullified when calculating ejection fraction. On the other hand, end-diastolic and end-systolic volume errors by three-dimensional echocardiography were not correlated because they were derived from multiple cardiac cycles from wluch elTars of ejection fractions were obtained.

LVEF CALCULATION BY 3DE "s RNA 35
Sapin et al.22 found a lower correlation and wider limit of agreement for left ventricular ejection fraction calculation in comparison with the study by Gopal et al.21 and the results of this sttJdy. This may be related ta the different reference methad Jlsed by Sapin et al (cineventriculography). Differences in methodology lUay also explain inpart the discrepancy between our results and those of Sapin et al,22 We performed left ventricular imaging for three-dimensional reconstruction from the apical window which allows the simultaneous identification of a basal and apical landmark for the long axis determination. They lIsed the parasternal window from which it is often impossible to define these landmarks in a single cross section and two different long axis views are necessary. Three-dimensional image acquisition is then guided by a constructed line of intersection which is derived from two temporally dispersed short axis views selected from the two parasternal long axis views. Each acquired short axis is then readjusted by displaying this line of intersection several times. We lIsed the standard apical four chamber view in which the longest left ventricular axis for rotational acquisition is identified to encompass the whole left ventricular cavity. In our technique image acquisition is ECG and respiratory gated, so that the cardiac images fall at the same moment in each accepted cardiac cycle. This allows more accurate threedimensional left ventricular reconstlllction and volume calculation. Sapin et al. 22 acquired their basic images at sllspended end-expiration which were likely produces motion artefacts. The data set has then to be discarded and the procedure repeated. We reconstruct the heart from 90 cross sections planes which allows faithful reconstl1lction of the true geometry particularly in the presence of asynergy. Sapin et a1. used 8 or 9 slices with wider gaps and hence the possibility to miss asynergic segments.
In our study, the intraobserver and interobserver variability for three-dimensional echocardiographic Simpson's method were at least similar to that of radionucHde angiography. This can be attributed to controlling the image acquisition by ECG and respiratory gating techniques and improvement of image selection by identifying the rotational long-axis.
In the study by Gopal et al.,21 intraobserver and interobserver standard errors of the estimate of left ventricular ejection fraction measurements obtained by three-dimensional echocardiography were one-third to one half as compared with that of two-dimensional echacardiagraphy (3.4 - 5.5 % versJls. 7.5 - 9.0%) respectively. The limits of agreements alsa showed no systematic over or underestimation of left ventricular ejection fraction by threedimensional cchocardiography.
The present data showed that there were no significant differences between left ventricular end-diastolic and end-systolic volumes and ejection fraction calculated by threedimensional echocardiography at 3 nun and those calculated from 6 to 24 Illm slice thickness with stepwise increments of 3 mm. Nevertheless, with the increase of the slice distances there is a correlated conesponding increase in the standard deviation of the mean differences of left ventricular end-diastolic and end-systolic volumes and ejection fraction particularly above 15 mm slice distances (table 3). There was no significant difference between left ventricular ejection fraction calculated by radionuclide angiography and that calculated by three-dimensional echocardiography at different slice thickness from 3 to 24 mm with stepwise increments of 3 mm. With the increase of the slice thickness there is a correlated corresponding increase in the standard deviation of the mean differences of left ventricular ejection fraction particularly above 15 mm slice distances (table 4, figure 5). Accordingly,

36 CHAPTER 3
applying lS-mm slice thickness instead of 3-mm will overcome the major limitation for the routine use of three-dimensional echocardiography for left ventricular volumes and ejection fraction calculations, as it reduces the number of short axis slices from (20 to 30) for 3-ml11 thickness to (5 to 8) when using 15mm slice thickness and consequently dramatically reducing the analysis time from 40 to 10 min on average.
In our group of patients, we calculated the probability of three-dimensional echocardiography Simpson's method at 15-lmn slice distance to detect several differences of left ventricular ejection fraction (table 5). There was an acceptable probability of 80% to detect clinically relevant differences (>5%). Obviously, for detecting small differences (up to 5%) a larger study population would be required. By using 15 mm slice thickness, we reduce the analysis time by having a lower number of short axis slices. The analysis time at 15 mm slice thickness was 10 minutes in comparison to the 40 minutes needed in using 3 mm slice thickness. This eliminates the limitation imposed on three-dimensional echocardiography and provides a rapid and accurate method for calculating left ventricular ejection fraction.
ADVANTAGES AND LIMITAIONS OF THE STUDY Three-dimensional echocardiography allows calculation of left ventricular volumes and
ejection fraction without any geometric assumption. Image processing of ultrasonic data is complicated by the presence of artefacts and a substantial amount of noise in the image. In our technique image conditioning is done using ROSA filter (Reduction of Spatial Artifacts). linage acquisition in a given plane is controlled by an algorithm considering both ECG and respiratory phase gated technology, so that the computer accepts cycles which fall in tbe preset range. Based on this information, cycles that do not meet the preset range are rejected, thus avoiding rotational and movement artefacts and allowing optimal temporal and spatial registration of the cardiac images. From the volumetric dataset, it is possible to adjust the reference image with the longest apical long axes which guide the short axis series and allows more accurate left ventricular volumes calculation. The time factor is the most important limiting factor that currently restricts the routine use of three-dimensional echocardiography. Developing faster computers and applying automated border recognition software for area and volume analysis technique will shorten the time needed for image acquisition, post-processing and data analysis. In addition, using slice thickness up to 15 111111
will reduce the analysis time. Prolonged acquisition time increases the chances of patient motion or rotation artefacts which can be prevented by thoroughly explaining the procedure to the patient.
With radionucHde angiography left ventricular volumes were not ca1culated in tIns study. As left ventricular ejection fraction is more tolerant of volume errors than are absolute volumes, there is still a need to validate tins teclunque for volumes with other well established techniques. In tbis study, patients with good image quality were selected. Thus, the value of three-dimensional echocardiography independent of image quality has to be proven. A larger population is required for the probability study of three-dimensional echocardiographic Simpson's method with use of I5-mm slice thickness to detect smaller differences « 5%) ill left ventricular ejection fraction.

L VEF CALCULATION BY 3DE vs RNA 37
CONCLUSIONS Three-dimensional echocardiography has excellent correlation and close limits of
agreement with radionuclide angiography for the calculation of left ventricular ejection fraction. Three-dimensional echocardiographic Simpson's method has at least equivalent intraobserver and interobserver variability as that of radionuclide angiography. Therefore, three-dimensional echocardiography may be a preferable test when serial assessment of left ventricular ejection fraction is requested. Based on the data at different sUce distances we suggest to use slice thickness less than IS-mm for accurate and rapid left ventricular volume and ejection fraction measurements.
REFERENCES 1 Becker Le, Silvennan KS, Bulkley BIi, Kallman CH, Mellits ED, Weisfeldt M. Comparison of
early thallium-20l scintigraphy and gated blood pool imaging for predicting mortality in patients with acute myocardial infarction. Circulation 1983;67:1272-82.
2 Pfeffer MA, Braumvald E, Moye LA, Basta L, Brown El, Cuddy TE, Davis BR, Gettman EM, Goldman S, Flaker GC, Klein M, Lamas GA, Packer M, Rouleau 1, Rouleau JL, Rutherford J, Wertheimer lH, Hawkins CM. Effect of captopril on mortality and morbidity in patients with left ventricular dysfunction after myocardial infarction. N Eng 1 Med 1992;327:669-77.
3 Hains AD, Khawaja IA, Lahiri A, Raftery FB. Radionuclide left ventricular ejection fraction: a comparison of three methods. Br Heart J 1987;57:232-6.
4 Shah PK, Picher M, Berman DS, Singh BN, Swan H1C. Left ventricular ejection fraction detenllined by radionuclide ventriculography in early stages of first transmural myocardial infarction. Am J Cardiol 1980;45:542-6.
5 \Vyatt HL, Heng MK, Meerbaulll S, Gueret P, Hestenes 1, Dula E, Corday E. Cross-sectional echocardiography. Analysis of mathematic models for quantifying volume of the formalin-fixed left ventricle. Circulation 1980;61: 1119-25.
6 Schajsira lN, Kahn MS, Beaver \VI, Popp RL. In vitro quantification of canine left ventricular volume by phased-array sector scan. Cardiology 1981;67:1-11.
7 Garrison ill, \Veiss JL, Maughan WL, Tuck OM, Guier \VH, Fortuin NJ. Quantifying regional wall motion and thickening in two-dimensional echocardiography with a computer-aided contouring system. In Ostrow 1-1, Ripley K, eds: Proceedings in Computerized Cardiology, Long Beach, CA., 1977;25.
8 \Veiss JL, Eaton L\V, Manghan WL, Brinker lA, Bulkley B, Guzman P, Yin FCP. Ventricular size and shape by two-dimensional echocardiography. Fed Proc 1981 ;40:2031-36.
9 Siu SC, Rivera 1M, Guerrero JL, Handschumacher MD, Lethor JP, \Veyman AE, Levine RA, Picard MH. Three-dimensional echocardiography: In vivo validation for left ventricular volume and function. Circulation 1993; 88:1715-23.
10 Handschumacher.MD, Lethor JP, Siu SC, Mele D, Rivera 1M, Picard MH, Weyman AB, Levine RA. A new integrated system for three dimensional echocardiographic reconstruction: development and validation for ventricular volume with application in human subjects. J Am CoIl Cardiol 1993;21 :743-753.
11 King DL, King DL Jr, Simo MY-C. Evaluation of in vitro measurement accuracy of a threedimensional ultrasound scanner. 1 Ultrasound Med 1991; 10:77-82.
12 Moritz \\'E, Pearlman AS, McCabe DH, Medema DK, Ainsworth ME, Boles MS. An ultrasonic technique for imaging the ventricle in three dimensions and calculating its volume. IEEE Trans Biomcd Eng 1983;30:482-92.
13 Roelandt 1, Salustri A, Vletter W, Nosir Y, Bwilling N. Precordial Illuitiplane echocardiography for dynamic anyplane, parapJane and tluee-dimensional imaging of the heart. TIlOraxcentre 1 1994;6:4-13

38 CHAPTER 3
14 Salustri A, Roelandt 1. Ultrasonic three-dimensional reconstraction of the heart. Ultrasound Med & BioI 1995;21 :281-93.
15 Altman DO, Bland 1M. Measurement in medicine: the analysis of method comparison studies. Statistician 1983;32:307-17.
16 Geiser EA, Ariel M, Conctta DA, Lupiewicz SM, Christie LG Jr, Conti CR. Dynamic threedimensional cchocardiographic reconstruction of the intact human left ventricle: Techniques and initial observation in patients. Am Hem! J 1982;103: 1056-65.
17 Amico AF, Lichtenberg as, Reisner SA, Stone CK, Schwartz RO, Meltzer RS. Superiority of visual versus computerized echocardiographic estimation of radionuclide left ventricular ejection fraction. Am Heart J 1989; 118: 1259-65.
18 King DL, Harrison ~IIR, King DL Jr, Gopal AS, Kwun 01, De~llaria AN. Ultrasound beam oricntation during standard two-dimensional imaging: assessmcnt by three-dimensional cchocardiography. J Am Soc Echocardiogr 1992;5:569-76.
19 Schroeder K, Sapin PM, King DL, Smith MD, DelVlaria AN. Three-dimensional echocardiographic volume computation: in vitro comparison to standard two-dimensional echocardiography. J Am Soc Echocardiogr 1993;6:467-75.
20 Nosir YFM, Salustri A, Vletter WB, Cornel JH, Geleijnse .r."IL, Krenning E, Fioretti P. Accurate measurements of left ventricular ejection fraction: radionuclide angiography versus threedimensional echocardiography (abst). Circulation 1995;92,:278.
21 Gopal AS, Sapin PM, Shen Z, Sapin PM, Keller AM, Schnellbaecher M1, Leibowitz DW, Akinboboye 00, Rodney RA, Blood DK, King DL. Assessment of cardiac function by threcdimensional echocardiography compared with conventional noninvasive methods. Circulation 1995;92:842-52.
22 Sapin PM, Schroder KM, Gopal AS, Smith MD, Ddvlaria AN, King DL. Comparison of two- and three-dimcnsional echocardiography with cilleventriculography for measurement of left ventricular volume in patients. J Am Coli CardioI1994;24:1054-63.

LVEF BY 3DE IN PATIENTS WITH ABNORMAL LV 39
CHAPTER 4
LEFT VENTRICULAR EJECTION FRACTION IN PATIENTS WITH NORMAL AND DISTORTED LEFT
VENTRICULAR SHAPE BY TWO THREE-DIMENSIONAL ECHO CARDIOGRAPHIC METHODS
A COMPARISON WITH RADIONUCLIDE ANGIOGRAPHY
Nosil' et al / LVEF by 3DE vs. RNA
YoussefFM Nosir MD*, Alessandro Salustri MD, Jaroslaw D Kasprzak MD, Christian S Breburda MD Folket"t J Ten Cate MD, Jos RTC
Roelandt MD.
With Technical Assistance of Wim B Vletter BSc, Ron T vanDomburg Msc, Rene Prowijn, Joyce Tjoa Postma Bsc, Ambroos EM Rcijs MSc
From Thoraxcenter, AZR-Dijkzigt and Erasmus University. Rotterdam, The Netherlands, * Department of Cardiology, AI-Hussein University Hospital, AI-Azhar University, Cairo,
Egypt.
J Am Soc EcllOcal'diogl'. 1998j11(6):620-630

40 CHAPTER 4
STRUCTURED ABSTRACT. Objectil'es. Serial evaluation of left ventricular (LV) ejection fraction (EF) is impOltant for the management and foHow up of cardiac patients. Our aim was to compare L YEF calculated from two three-dimensional cchocardiographic (3DE) methods with l11ultigated radionuclide angiography (RNA), in patients with Honnai and abnormal shaped ventricles. Methods: 41 consecutive patients refclTcd for RNA underwent precordial rotational 3DE acquisition of 90 cut-planes. From the volumetric dataset LVEF was calculated by, (a) Simpson's mle (3DS) through manual endoclli'dial tracing of LV short axis selies at 3-mm slice distance and (b) apical biplane modified Simpson's method (EMS), in 29 patients, by manual endocardial tracing of apical four chamber and its computer derived orthogonal view. Patients included three groups, (A) 17 patients with LV segmental wall motion abnonl1alities(SWMA), (B) 13 patients with LV global hypokiuesis(GH) and (C) II patients with normal LV wall motion(N). Results. For all the 41 patients, there was excellent correlation, close limits of agreement and non significant difference between 3DS and RNA for LVEF calculation [1=0.99, (-6.7, +6.9) and p=0.9J respectively. For the 29 patients, excellent correlation and non significant differences between L VEF calculated by both 3DS and BMS and values obtained by RNA were found (1=0.99 and 0.97) (p=O.7 and p::::O.5) respectively. In addition, no significant difference existed between values of LVEF obtained from RNA, 3DS and BMS by the analysis of variance (p=0.6). The limits of agreement tended to be closer between 3DS and RNA (-6.8, +7.2) than between BMS and RNA (-8.3, +9.7). The intraobserver and interobserver variability of RNA, 3DS and BMS for calculating LVEF(%) were (0.8,1.5), (1.3, 1.8) and (1.6, 2.6) respectively. There were closer limits of agreements between 3DS and RNA for L YEF calculation in A, Band C patients subgroup [(-3.5, +5), (-8.4, +5.6) and (-7.8, +8.6)J, than that between BMS and RNA [(-8.1, +10.7), (-11.9, +9.3) and (-9.1, +11.3)] respectively. COI/e1l/siol/s: No significant difference existed between RNA, 3DS and BMS for L VEF calculation. 3DS has better correlation and closer limits of agreement than BMS with RNA for LVEF calculation par1icularly in patients with segmental WMA and GH. 3DS has a comparable observer variability with RNA. Therefore the use of 3DS for serial accurate L YEF calculation in cardiac patients is recolllmended.
Key words: ejectiolljractiOll, three-dimellsiOlwl echocardiograpliy, radio1l11clide angiography.
INTRODUCTION Serial evaluation of left ventricular (LV) ejection fraction (EF) is often needed for the management of cardiac patients. Therefore, the availability of a reproducible, accurate, and noninvasive method is desirable. 1
,2
Radionuclide angiography (RNA) is widely used for measurement of L YEF because it is noninvasive and does not rely on assumption of LV geometry. However, it is 110t optimal for serial assessment as it involves radiation energy.3-5
Echocardiography allows rapid comprehensive evaluation of anatomy and function and gained widespread use in evaluation of cardiac patients.6
,7

LVEF BY 3DE IN PATillNTS WITH ABNORMAL LV 41
M-mode echocardiography is limited by its inability to account for regional wall motion abnormalities' Wllile two-dimensional echocardiography is less restricted by segmental wall motion abnormalities (S'WMA)9,JQ and fairly accurate estimates of LV volumes (V) can be
d .. illb d . . fLV I 11-17 lUa C, It 1S st ase all geometriC assumption 0 s mpe. Three-dimensional echocardiography (3DE) allows quantification of LVV and function
without geometric assllmptions 11 ,I8, but few data are available on the cOInparison of LV V and EF calculation with other techniques,19-21
The aim of tllis study was to compare L VEF calculated from 3DE data sets using both Simpson's mle (3DS) and apical biplane modified Simpson's method (BMS) with values obtained by RNA in patients with normal and abnormal LV and to measure reproducibility of all techniques.
SUBJECTS AND METHODS Forty four consecutive patients in sinus rhythm and stable clinical condition underwent a
multigated RNA study and 3DE. First a multigated RNA for evaluation of L VEF lVas perfonned in each patient. TillS was followed by a 3DE sttldy on the same day in 36 patients and in 8 patients at a mean of 3.5 days later. Informed consent was taken from every patient after full explanation of the procedure.
From the 44 patients recmited in tltis study. 3 were excluded (2 for poor apical echocardiograpltic window and I for an error in the calibration procedure of rotational axis for 3DE). Of the 41 patients included, 29 were men with a mean age of 51 ± 17 years (age range from 21 to 82 years). Patients were categorized into three groups, (A) patients with old myocardial infarction and SWMA. (B) patients with dilated cardiomyopathy and global hypokinesis (GH) and (C) patients with normal LV geometry who were evaluated during chemotherapy for a malignancy.
MULTIGATED RADIONUCLIDE ANGIOGRAPHY Multigated radionuc1ide angiography was performed in the 45 0 left anterior oblique view
after in vivo labelling of the red blood cells with 15 mCi (540 MBq) of technetillm-99m. Acquisition was performed during a six minute period with a Siemens (Orbiter) gamma camera equipped with a low energy all purpose collimator. Data were processed with standard software and background con-ectioH and the left ventricular ejection fraction was computed from the end diastolic and end systolic images.
ECHO CARDIOGRAPHIC EXAMINATION Echocardiographic studies were performed with a transducer in the apical position and the
patient was comfortably lying in 45-degree left recumbent position. To acquire the crosssectional images for reconstl11ction, the operator has to find the center axis around which the imaging plane is rotated to encompass the LV cavity in the conical volume. Since the spatial coordinate system changes with transducer movement, motion of the transducer must be avoided. Inadvertent patient movement during the image acquisition can be prevented by explaine the procedure prior to the study and ensure the cooperation of the patient.

42 CHAPTER 4
The precordiallrallsdllcer assembly alllllllh'asolllld syslem We used a custom-build hand-held transducer assembly on which a 3.75 MHz phased
array transducer (Toshiba Sonolayer SSH-140A system) is mounted. The transducer assembly for precordial image acquisition consist of a cylindrical housing in which any standard precordial imaging transducer can be adapted. This cylindrical housing with the contained transducer fits into a cylindrical holder and is rotated via a wheel-work interface with a stcp-motor.22,23 The step-motor is commanded by a software-based steering-logic (Echo-scan, Tom Tee GmbH, Munich, Germany) and the acquisition can be performed in steps of preselected intervals (in tIus study 2 degrees).
THREE-DIMENSIONAL ECHO CARDIOGRAPHY 3D reconstmction of the LV from sequentially recorded cchocardiographic images
requires two basic steps: image acquisition and processing. Image acquisition:
A software-based steering logic which considers a preset R-R intervals with a variability of ±150 msec and phase of respiration (expiration) by thoracic impedance measurement activates the step-motor in the transducer assembly and controls the image acquisition. Only cross-sections which fall within the preset RR range and phase of respiration are used for 3DE reconstruction to insure optimal temporal and spatial registration in order to avoid artifacts. After a cardiac cycle is accepted the steering logic activates the step motor which rotates the imaging plane 2 degrees to the next position. The images within a cardiac cycle are sampled at 40 msec intervals (25 frames/sec), digitized, and stored in the computer memOly. To fill the conical data volumes, 90 cross-sections from 0 to 178 degrees. recorded during a complete cardiac cycle must be obtained. (figure 1) Image processing:
The recorded images are formatted in their conect rotational sequence according to their ECG phase in volumetric data sets (256*x256*x256* pixel/each 8 bit). The post-processing of the data sets is pelfonned off-line lIsing the software program of the system. To fill the gaps in the far fields, a "trilinear cylindric interpolatioll lt algorithm is used. 21
Im((ge ((II((lysis: Prom the 3DE volumetric data sets, L YEP lVas calculated by both;
(A) Simpson's rule. After selecting the long-axis view of the LV, end-diastolic (the tlrst frame before closure
of the mitral valve) and then end-systolic (the fIrst frame before the opening of the mitral valve) volumetric data sets are selected. By this method LVV is calculated by manual endocardial tracing of sequential short-axis views of the LV from the apex to the mitral annulus at 3-1111l1 intervals. The computer displays the conesponding short axis view in (I) a dynamic display which facilitates identitlcation of the endocardium, and (2) a static display for manual endocardial tracing. When endocardial tracing of the short-axis views is completed, the slice volume is calculated by summing the voxels included in the traced area in 3-mm slice thickness. Slice by slice, the system sums the corresponding subvolumes in order to yield the end-diastolic and end-systolic L YY and EP2I (fIgure 2).

LVEF BY 3DE INPATIENTS WITH ABNORMAL LV 43
Figure I.The principle of left ventricular volume measurement I
An end-diastolic and end-systolic long-a.xis view is used as a reference vicw. equidistant intervals to generate a series of short axis views. TIle surface area of each cross-section is measured by plunimctry and the volume of each slice is calculated. Adding up the volumes of all slices provides the yolume measurement of the whole left ventricle (Simpson's method), The figure shows an end-diastolic and end-systolic long a.xis views (panel A, upper and lower image respectively) on which the transverse sector I and 2 cut the left ventricular cavity at this level to give rise to the corresponding short-axis views at end-diastole and end-systole ( I and 2) respectively, shown in the middle panel B.
Figure 2. The principle of left ventricular volume mea~urement using a three-dimensional data set by computer derived apical biplane modified Simpson's method. Left ventricular elld-dia~tolic (upper part) and end-systolic (lower part) volumes are calculated by manual endocardial tracing of apical fOLlr chamber view (panel A) and its computer deri"ed orthogonal "iew (panel B) from the three-dimensional data set. Panel C shows the short axis with the orthogonal sectors for the two apical long axis views.

44 CHAPTER 4
(E) Apical biplane modified Simpson's method. The investigator selects the apical four chamber view in the volumetric data sets and the
system gives its orthogonal view. L VV and EF were calculated by manual endocardial tracing of the two orthogonal long axis views at end-diastole and end-systole (figure 3).]his was done in 29 out of the 41 patients, because this method was discarded from the new version of the software. For the manual tracing we trace on the bright endocardial side and the papillary muscles are included in left ventricular volume.
STATISTICAL ANALYSIS L YEF calculation was performed for each technique [RNA and 3DE methods (3DS and
EMS)] independently and blindly from the results of the other two techniques. For the entire group of patients (n=41) LVEF was computed by RNA and 3DS. The
Pearson correlation coefficient, paired Student t-test and limits of agreement as described by Altman and Bland24
, for the whole group of patients as well as for A. Band C subgroups, were used for their comparison.
In 29 patients LYEF was calculated by RNA and 3DE methods (3DS and EMS) by two experienced observers blinded to each other's results. In addition, the first observer repeated the measurement after 7 days. Observer variabilities were analyzed by paired Student's t-test and expressed as the standard deviation of the difference of the two readings divided by the average value.
For the 29 patients as well as for its A, Band C subgroups, and to compare the three methods (RNA, 3DS and BMS) the analysis of variance was used. In addition, a paired t-test was peIformed to compare 3DE methods (3DS and BMS) with the values of RNA. Significance was stated at the 0.05 probability level. The p-value. the mean difference and the limits of agreement are reported. Pearson's cOlTelation coefficients are presented.
Group A patients were studied with respect to the site of LV SWMA. Patients were grouped according to LV wall that included one or more segments with abnormal motion into 6 subgroups. The mean difference ± SD. p. value and the limits of agreemeut between LVEF calculated by 3DE methods (3DS and EMS) with values of RNA were calculated. In addition, to compare the three methods (RNA. 3DS and BMS) the analysis of variance was pelformed.
RESULTS Feasibility.
3DE acquisition and reconstruction could be performed in 41 out of the 44 patients recmited in tIus sttldy. Accordingly, in this study 3DE success rate was 93%. In 4 patients a second acquisition sequence was necessary because of inadverted motion 01' loss of central rotational axis by the operator. All patients were in sinus rhythm, the difference between the patients heart rate (mean±SD) during the RNA and 3DE study was not significant (80±12 bpm versus and 79±1I bpm respectively, p=0.6). Echocardiographic examination revealed that 17 patients had SWMA (group A), 13 patients had GH (group E) and II patients had normal waH motion at rest (group C).

L VEF BY 3DE IN PATillNTS WITH ABNORMAL LV 45
The examination including calibration, selection of the optimal gain settings and definition of a complete conical volume, few test runs and the actual image acqUIsItIOn, requires approximately 8 -10 minutes in patients with sinus rhythm. Calibration and storage of the data in the computer memory required approximately 3 minutes. Off-line unage processing required 15 minutes. Data analysis using 3 mm slice intervals required 30 to 40 minutes.
Comparisoll betweell 3DS witll RNA/or LVEF calculatioll. The mean value ± SD of LYEF calculated by 3DS and RNA for all the 41 patients and
for A, Band C subgroups are presented in table l. An excellent correlation, close limits of agreement and non significant difference between LVEF calculation by 3DS and RNA was found in all patients as well as in the subgroups (table I) (figure 4).
Comparison between 3DE and RNA
Correlation between 3DE and RNA Agreement between 3DE and RNA
RNA-LVEF{%)
(A)
._'h"'-'_W .-\I=,)Oj B,"-l9~
c,=Il&J
•• . .• ___ • __ ~!_+E.'? __
•• ______ ~~.J __ .! ___ _
--.----------~--M_l;L>
Awrage .ms and RNA LVEF(%)
(8)
Figure 3. (A) Linear regression of left ventricular ejection fraction (LVEF) in all the 41 patients, measured by threedimensional echocardiographic Simpson's rule (3DS) versus radionuclide angiography (RNA). n :=: number of patients, r = correlation coefficients, (A, Band C) are patients subgroups. TIle dashed line represents the identity linc. (B) Difference of each pair of (radionuclide angiography ~ three-dimensional echocardiographic Simpson's rule) for left ventricular ejection fraction measurements plotted against the average value, in all the 41 patients. 4
Table I. MeaIl±SD of LYEF calculated by RNA and 3DS (Simpson's rule) methods, with the comparison between L YEF calculated by both methods in the whole group of patients (41 patients) and when these patients were divided into A, Band C subgroups.
RNA 3DS r MD ± SD p Agreement (mean± SD) (mean± SD)
All Patients n=41 32.S±19.6 32.S±IS.S 0.99 0.07±3.4 0.9 -6.7, +6.9 Group A n=17 2S.4±11.32 27A±IOA 0.9S 1±2A 0.1 -3.S, +5.S Group B n=13 16.1±9.4 17.5±7.5 0.94 -1.4±3.5 0.2 -SA, +5.6 Group C n=11 59.5+6.7 59.2+7.2 0.S3 004+4.1 O.S -7.S, +S.6 LVEF- left ventricular ejection fraction, RNA_ radionuclide angiography, 3DS- three-dimensional cchocardiography, r = correlation coefficient, i\1D±SD= mean diffcrellce±standard deviation, agreem.= limits of agreement.

46 CHAPTER 4
Obser"er .'ariability of RNA alld 3DE methods. In 29 patients as we)} as for their A, Band C subgroups intraobserver and interobserver
variabilities of RNA and 30E methods (3DS and BMS) were comparable. There was no significant difference in L VEF obtained by the same observer in two different settings as well as between the two independent observers for all three methods (table 2, figure 5).
ffi 1.50
~ C
1.20
~ 0.90
'[iJ > 0.60 ~
'" 1: 0.30
" w .0 0 0.00
Observer variability (SEE) for LVEF calclliatioll by RNA, 3DS and EMS
n Intraobscrvcr • Intcrobserver
RNA 3DS BMS
Figure 4.lllC intmobservcr and interobserver variability of left \'entricular ejection fraclion calculation by radiool1clide angiography and three-dimensional echocardiographic both Simpson's nlle and apical biplane modified Simpson's ,presented by the standard error of the estimate (SEE%), in all the 29 patienls as well as in A, Band C subgroup of patients.
Table 2. Mean ± SD of LYEF calculated by RNA, 3DS and apical biplane modified Simpson's (EMS) methods, with the observer variability of all methods for calculating LYEF
. in the 29.£!l.tients and \yhen these patients divided in,!?2, Band C) snbgroups~~ •. ~ .. ~~_
RNA
3DS
BMS
M±SD Intraobs. Interobs. M±SD Intraobs. Interobs. M±SD Intraobs. Interobs.
SEE SEE
SEE SEE
SEE SEE
All patients, Group A, Group B, Group C, n=29 n=12 n=6 N=ll
39±20.1 30±12 18±14 60± 7 0.3 0.7 0.7 0.4 ~6 ~8 ~8 I~
38±19 29±1l 20±10 59± 7 0.5 0.3 0.7 1.0 0.7 0.7 0.8 1.1 38±19 28±1l 19± 9 58± 8 0.6 0.8 0.5 1.2 1.0 1.1 0.7 2.1
SEE = standard error of estimate, C-SEE = corrected SEE for the mean mlue, other abbreviations as in table-I.
3DE (3DS alld BMS) methods with comparisoll to RNA. L YEF (mean ± SD) obtained by RNA and 3DE (3DS and BMS) methods for the 29
patients and the 3 subgroups are presented in table 2. No significant difference existed between the three methods by the analysis of variance for the whole group (p=0.6) and for A,

LVEF BY 30E IN PATIENTS WITH ABNORMAL LV 47
Band C subgroups (table 2). There was excellent COiTelatioli of values of L VEF by 3DE (3DS and BMS) methods with those obtained by RNA (table 3) (figure 6). There were closer limits of agreement and a non significant difference between L VEF obtained by 3DS and RNA than that between apical BMS method and RNA (table 3, figure 7).
Comparison between 3DS and BMS with RNA
for L VEF calculation
Corfe-Iulion between 3DS and RNA
R..'<A LVU'(q)
IA)
,,",={IW
A,,",,.I'J 8,=<>9> C,,",,,J
Correlation belneen nMS and R.t~A
•
RNA L\'EF('l')
(8)
. . /
/
'-',=')01 A,dl9J B,.<l.>7 C,=,}T1
Figure 5.(A) Linear regression of left ventricular ejection fraction (LVEP) in the 29 patients as well as in A, B and C patients subgroups, measured by Simpson's rule (3DS) versus radiooudide angiography (RNA). 11 = number of patients, r = correlation coefticients, The dashed line represents the identity Iinc. (B) Linear regression of left ventricular ejection fraction (LVEF) in the 29 patients as ,veil as in A, Band C patients subgroups, measured by apical biplane modified Simpson's method (BMS) versus radionuclide angiography (RNA). n = number of patients, r = correlation coefficients. TIle dashed line represents the identity line.
COlllparison between 3DS and BMS with RNA
for L VEF calculation
Agreement Bctween 3DS and RNA Agreemcnt between llMS and Rt'lA
" f : ~"N ,
u.~'... • .. ," , , ~ -
"
.--.-- -.---..-
IA)
.. .~ , .. [ "~
"'D" , : I ~::-
,,""J,:L ,':': """"""" '0" ",~: "
~t.~D
" '
(8)
Figure 6. (A) Difference of each pair of (radionuclide angiography - Simpson's rule) left ventricular ejection fraction measurements plolted against the average value, in all the 29 patients. (B) Difference of each pair of (radionuc1ide angiography - apical biplane modified Simpson's method) left ventricular ejection fraction
mea~urements plotted against the average value, in all the 29 patients.

48 CHAPTER 4
3DE Accl/racy with respect to the site of walllllotiol/ abl/orlllalities. For group A patients. the specification of type and site of resting LV SWMA are
presented in table 4. No significant difference existed between the three methods by the analysis of variance (table 4). In addition, no significant difference existed in the mean difference between LVEF calcnlated by 3DE (3DS and BMS) methods with valnes obtained by RNA for each individual LV wall in group A (table 4). For each individual site of LV SWMA there was closer limits of agreement for L VEF calculation between 3DS and RNA than that between BMS method with RNA. (table 4, figure 8).
Table 3. Comparison between LVEF calculated by both 3DS and BMS aud values obtained
..!X RNA. Snbject All Patients
Group A
Gronp B
Group C
Differences RNA-3DS RNA-BMS RNA-3DS RNA-BMS RNA-3DS RNA-BMS RNA-3DS RNA-BMS
All abbreviation as in tables 1 and 2.
.~I,,-·. -,--,-__ MP+SD 0.99 0.2±3.5 0.97 0.7±4.5 0.99 1.0±2 0.93 1.3±4.7 0.99 -1.4±3.5 0.97 -1.3±5.3 0.83 0,4±4.1 0.77 1.l±5.1
~ .. 0.7 0.5 0.1 0.3 0.2 0.6 0.8 0.5
Agreement -6.8 +7.2 -8.3, +9.7 -3, +5 -8.1, +10.7 -8,4, +5.6 -11.9, +9.3 -7.8, +8.6 -9.1, +11.3
Table 4. Specification of segmental wall motion abnormalities (WMA) in group A patients, with comparison between both 3DS and BMS for calculating L YEF with values obtained by
RNA in gronc p.. catients accordirIg to the site ~..:L;;:.V,:.. ~-\::TV""M~A"":~~~~~---c~~:---~~~ _____ -=c--;----;,-_.cA"' . .eex Anterior SeEtulll Lateral Posterior hlferior
Diskinetic 5 1 LV-WMA Akinetic
Hypokinetic Total MD±SD
3 6
3DS-RNA p Agreement MD±SD
BMS·RNA p
5 13 0.7±2.l 0.2 ±4.1 0.4±3.6 0.7
Agreement ±7.2 All abbreviations as in tables I and 2.
DISCUSSION.
7 7 7 14 ·0.1±2.2 0.6±2.0 0.9 0.3 ±4,4 ±4.0 0.0±4,3 0,4±3.6 LO 0.7 ±8.6 ±7.2
9 9 O.l±2.0 0.9 ±4.0 -0,4±3.8 0.8 ±7.6
5 5 II 0.3±2.0 0.7 ±4.0 ·0.1±3.7 0.9 ±7,4
6 5 II 1.l±2.3 0.1 ±4.6 1.2±4.5 0,4 ±9.0
3DE allows reconstruction of LV without geometric assumption. The method provides accurate measurements of L VV and function?I-23
In the total group, we found excellent correlation and close limits of agreement between 3DS with RNA for calculating LVEF (r=0.99) and (-6.7, +6.9) respectively. These were also found in patients subgroups with SWMA (table I).

L VEF BY 3DE IN PATIENTS WITH ABNORMAL LV 49
Intraobserver and interobserver variability for 3DE (3DS and BMS) methods were similar to that of RNA (table 2). Excellent correlation between 3DE (3DS and BMS) methods with RNA was found for the calculation of LVEF (r=0.99 and r=O.97 respectively). There were closer limits of agreement between 3DS and RNA (-6.8. +7.2) than between BMS and RNA (-8.3, +9.7) (table 3). The limits of agreement between 3DS and RNA for LVEF calculation were less than half of that between BMS method and RNA when patients were classified according to site of LV SWMA (table 4).
10
o
Agreement between 3DS and BMS "ith RNA according to site of \Vi\lA (Group A)
3IJS-RNA _ BMS-RNA
infcri,,,
SileorLV·W~IA
Figure 7, This diagram represents the limit of agreement (±2SD) for left ventricular ejection fraction calculated by 3DS and m.'IS with comparison to values obtained by RNA in group A patients with regards to the site of len ventricular wall motion abnormalities.
Compal'isoll willi oilier 3DE silldies. OUf findings are in agreement with the Shldy conducted by Gopal et al.,25 , who compared
L YEF calculated by RNA and 3DE in 5 I patients with suspected heart disease. They calculated LVV and EF from a series of real-time parasternal short-axis unages (7 to 10) acquired with a line of intersection display as a guide-during suspended respiration. The traced endocardial borders of the short axis image were reconstructed by polyhedral surface reconstruction algorithm. They reported a very good correlation between 3DE and RNA, r ;:::: 0.94 and r = 0.98 for two 3DE observers, respectively. In addition, Gopal et al compared L YEF calculated by 3DE and two dimensional echoeardiography using apical biplane summation of discs method with values obtained by RNA in 44 patients. They found that the limits of agreement between 3DE and RNA was 1.5 to 2 times lower than the corresponding valucs of two-dimensional echocardiography using subjective (visual estimation) and quantitative methods respectively. There was no significant systematic under-or overestimation of L VEF by 3DE, however underestimation was dctected for the quantitative technique (+6.84) and by visual estimation (+8.3). Illtraobserver and ulterobserver standard enors of the estimate of LVEF measurements obtauled by 3DE were one-third to one half as

50 CHAPTER 4
compared with that of two-dimensional echocarrliography (3.4 - 5.5 % versus. 7.5 - 9.0%) respectively.
Sapin et al.,26 lIsing the same 3DE technique of Gopal et a1.,27 found a lower cOlTclation and wider limit of agreement for L YEF calculation in comparison with the study by Gopal et al25 and our study. This may be related to the different reference method lIsed by Sapin et al. (cineventriculography). In addition, differences in methodology21.may inpart also explain the discrepancy between our results and those of Sapin et al.
Comparisoll witlt preJ'iolls ec//Ocardiograpltic stlldies ill patiellts witlt LV SII'MA. SWMA and LV aneurysm are common complications of acute myocardial infarction
which are detected by two-dimensional cchocarrliography with a high level of sensitivity (93%) and specificity (94%). However, both quantification of L VEF and aneurysmal volume by two-dimensional echocardiography are limited by its heterogeneous geometry, which restricts application of simple geometric models which assume symmetrical shape,27-28 Albin ct al.29 measured L YEP using 6 different two-dimensional echocardiographic algorithms and compared the results with RNA in 49 patients with regional and dim!se Wl'vlA. They concluded that two-dimensional cchocardiography can accurately assess L YEF in these patients. The apical biplane Simpson's formula was found the most accurate (1'=84, SEE=9.7, p=O.17 and agreement=2±9.8). Formulas including the .LV short axis view consistently overestimate EF. bl patients with anterior myocardial infarction and dilated cardiomyopathy, motion at the base of the heart is frequently preserved. Therefore, wall motion in the LV short axis views does not represent motion at all levels of the LV in patients with regional or diffuse \VMA. The apical biplane formula, by measuring LV wall motion over the entire length in two orthogonal planes effectively integrates regional wall motion abnormalities and therefore yield a more accurate assessment of global L YEP.
Jiang et a1.30 studied the feasibility and accuracy of 3DE measurement of LVV and aneurysm volumes in 10 phantoms and 12 gel filled autopsied human hearts with aneurysms, comparing cavity volumes to those measured by fluid displacement; and in 4 dogs with surgically created LV aneurysms comparing total volumes with the actual instantaneous values measured by intracavitary balloon connected to external column for validation. They found that, in vitro calculated volumes agreed well with actual values (r::::0.99) and SEE of (3.2 to 6.1 cm') for phantoms and (3.4 to 4.2 cn,') for autopsied hearts. In vivo LV enddiastolic, end-systolic. stroke volumes and EF calculated by 3DE correlated well with actual values (r=0.99, 0.99, 0.95 and 0.99 respectively) and agreed closely with them (SEE=4.3 cm3
, 3.5 cm3, 1.7 cm3 and 2% respectively). Recently. Buck et ae l demonstrated that in 23
patients with chronic stable LV aneurysms 3DE correlated and agreed favourably with magnetic resonance imaging for the calculation of end-diastolic L VV (r=0.97, SEE= 14.7 nul, end-systolic LVV (r=0.97, SEE=12.4 mI) and LVEF (r=0.74, SEE=5.6%).
3DE: a techJliqJle to replace RNA/or serial LVEF assessmeJlts. 3DE allows faithful reconstl1lction of the cardiac geometry and hence avoid most of the
limitations of two-dimensional echocardiography.

LVEFBY 3DE IN PATlliNTS WITH ABNORMAL LV 51
Biplane modified Simpson's method has been considered the best algorithm for LVV and EF. The results of this study showed tbat, even under optimal conditions (ECG and respiratory gating data set, longest LV long axis and true computer derived orthogonal apical biplane views) for BMS method, 3DS is superior for calculating LVEF in terms of accuracy and reproducibility, particularly for patients with SWMA (all sites). Using 3DS with l5-mm slice thickness21 reduces the number of slices to be traced from 30 to 7 slices for each phase and will significantly reduces 3DE analysis time from 40 to 10 minutes in average, and therefore make its routine use more pracrtical. 3DS can be frequently repeated for patient follow up studies which is a limitation of RNA. The results of tltis study suggest that 3DS is accurate, reproducible and may replace RNA for serial evaluation of LVEF in patients with SWMA and GH.
Ad"aJllages alld limilaliolls of Ille silldy. linage processing of ultrasonic data is complicated by the presence of artefacts and a
substantial amount of noise in the image. Image conditioning in 3DE is done with ROSA filter (Reduction of Spatial Artifacts). Image acquisition is controlled by an algorithm considering both ECG and respiratory phase gated technology, this avoids rotational and movement artifacts and allows optimal temporal and spatial registration of the cardiac images for LV reconstruction. From the volumetric dataset, it is possible to adjust the reference image with the longest apical long axes which guide the short axis series and aUows more accurate L VV calculation. Analysis time is the most important limiting factor that cUlTently restricts the routine use of 3DE. Using less cross sections in the dataset (rotational intervals at 20°), short axis series at IS-mm slice thickness and applying automated border recognition software for area and volume analysis technique will shorten the time needed for image acquisition, post-processing and data analysis. This study was designed as an extension of our previous paper," to compare L YEF calculation by two 3DE methods (3DS and BMS) with values obtained by RNA in patients with SWMA and GH. Therefore, we continue to use 3DS at 3-lllll1 slice thickness slices.
In this Shldy, apical BMS method has better correlation and closer limits of agreement with RNA for L VEF calculation, than previous studies using conventional standard apical views. This can be attributed to the fact that, the two apical orthogonal planes were obtained from the 3DE dataset with ECG and respiratory gating to reduce spatial and temporal m1ifacts. In addition, 3DE data set allows faithful selection of the apical four chamber orthogonal view within the same LV long axis to avoid foreshortening of the LV apex.
CONCLUSIONS No significant difference existed between RNA, 3DS and BMS for LVEF calculation.
L YEF calculation by 3DE methods (3DS and BMS) cOlTelate favonrably and have close Iintits of agreement with RNA. 3DS measurements have a similar observer variability of RNA. In patients with distol1ed LV geometry. 3DS has better correlation and closer limits of agreement than BMS with RNA for L VEF calculation. Therefore, the use of 3DS is recommended for serial evaluation of L VEF in patients with left ventricular asynergy.
52 CHAPTER 4
Ackllowledgemellts. YFM Nosir is supported by TI10 NUFFIC, The Hague, The Netherlands.
REFERENCE 1 Becker Le, Silverman KS, Bulkley BH, Kallman CH, Mellils ED, \Veisfeldt M. Comparison of
early thallium-201 scintigraphy and gated blood pool imaging for predicting mortality in patients with acute myocardial infarction. Circulation 1983;67:1272-82.
2 Pfeffer MA, Braul1wald E, Moye LA et a1. Effect of captopril on In0l1aIity and morbidity in patients with left ventricular dysfunction after myocardial infarction. N Eng J Med 1992;327:669-77.
3 Hains AD, Khawaja lA, Lnhiri A, Raftery FB. Radionuclide left ventricular ejection fraction: a comparison of three methods. Bf Heart J 1987;57:232-6.
4 Shah PK, Picher M, Berman DS, Singh BN, Swan HJc. Left ventricular ejection fraction determined by radionuclidc ventriculography in early stages of first transmural myocardial infarction. Am J Cardiol 1980;45:542-6.
5 Geiser EA, Ariet M, Conetta DA, Lupiewicz SM, Christie LG Jr, Conti CR. Dynamic threedimensional echocardiographic reconstmction of the intact human left ventricle: Techniques and initial observation in patients. Am Heart J 1982; 1 03: I 056-65.
6 Amico AF, Lichtenberg OS, Reisner SA, Stone CK, Schwartz RO, Meltzer RS. Superiority of visual versus computerized echocardiographic estimation of radionuc1ide left ventricular ejection fraction. Am Heart J 1989; 118: 1259-65.
7 King DL, Harrison MR, King DL Jr, Gopal AS, Kwan oJ, Ocrvlaria AN. Ultrasound beam orientation during standard two-dimensional imaging: assessment by three-dimensional echocardiography. J Am Soc Echocardiogr 1992;5:569-76.
8 Teichholz LE, Kreulen T, Herman MV, Gorlin R. Problems in echocardiographic volume determinations: cchocardiographic angiographic correlation's in the presence of asynergy. Am J Cardiol 1976;37:7-11.
9 Folland ED, Parisi AP, Moyniham PF, Jones DR, Fcldman CL, Two DE. Assessment of left ventricular ejection fraction and volumes by real time, two-dimensional echocardiography. A comparison of cineangiographic and radionuclide techniques. Circulation 1979;60:760-66.
10 Mercier JC, DiScssa TO, larmakani JM, Nakanishi T, Hiatishi S, Isabel, Jones J, Friedman \VF. Two-dimensional echocardiograplllc assessment of left vcntricular volumes and ejection fraction in children. Circulation 1982;65:962-69.
11 Handschumacher MD, Lethor JP, Siu SC et al. A new integrated system for three-dimcnsional echocardiographic reconstmction: development and validation for ventricular volume with application in human subjects. J Am Coil CardiolI993;21:743-53.
12 King DL, King DL Jr, Shao :MY-C. Evaluation of in vitro measurement accuracy of a threedimensional ultrasound scanner. J Ultrasound Mcd 1991; 10:77-82.
13 Moritz \VE, Pearlman AS, McCabe DH, Medema DK, Ainsworth ME, Boles :MS. An ultrasonic techniquc for imaging the ventricle in three dimensions and calculating its volume. IEEE Trans Biomcd Eng 1983;30:482-92.
14 Wyatt HL, Heng MK, Meerbaum S et aI. Cross-sectional echocardiography. Analysis of mathematic models for quantifying volume of the formalin-fixed left ventricle. Circulation 1980;61: 1119-25.
15 Schajsira JN, Kohn tvlS, Beaver WI, Popp RL. In vitro quantification of canine left ventricular voluillc by phased-array sector scan. Cardiology 1981;67: 1-11.
16 Garrison JB, \Veiss JL, Maughan WL, Tuck OM, Guier WH, Fortuin NJ. Quantifying regional wall motion and thickening in two-dimensional echocardiography with a computer-aided contouring system. In Ostrow H, Ripley K, eds: Proceedings in Computerized Cardiology, Long Beach, CA., 1977;25.
LVEF BY 3DE IN PATIENTS WITH ABNORMAL LV 53
17 ·Weiss JL, Eaton LW, Manghan WL et at Ventricular size and shape by two-dimensional echocardiography. Ped Proc 1981 ;40:2031-36.
18 Siu SC, Rivera JM, Guerrero JL ct a1. Three-dimensional echocardiography: In vivo validation for left ventricular volume and function. Circulation 1993; 88,4,1: 1715-23.
19 King DL, King DL Jr, ShaD MY -CO Evaluation of in vitro measurement accuracy of a threedimensional u1trasound scanner. J Ultrasound Med 1991; 10:77-82.
20 Moritz WE, Pearlman AS, McCabe DH, Medema DK, Ainsworth ME, Boles MS. An ultrasonic technique for imaging the ventricle in three dimensions and calculating its volume. IEEE Trans Biomed Eng 1983;30:482-92.
21 Nasir YFM, Fioretti PM, Vlctter 'VB et a1. Accurate measurements of left ventricular ejection fraction: radionuclide angiography vcrsus three-dimensional echocardiography. Circulation 1996,94:460-66 .
22 Roelandt 1, Salustri A, Vletter \V, Nosir Y, Bruining N. Precordiallllultiplane echocardiography for dynamic allyplane, para plane and three-dimensional imaging of the heart. Thoraxcentre 1 1994;6:4-13
23 Salustri A, Roelandt 1. Ultrasonic three-dimensional reconstruction of the hcart. Ultrasound in Med & Bioi 1995;21 :281-293.
24 Altman DG, Bland 1M. Measurcmcnt in medicine: the analysis of method comparison studies. Statistician 1983:32:307-17.
25 Gopal AS, Sapin PM, Shen Z et al. Assessment of cardiac function by three-dimensional echocardiography compared with conventional noninvasive mcthods. Circulation 1995;92:842-52.
26 Sapin PM, Schroder KM, Gopal AS, Smith ~1D, DeMaria AN, King DL. Comparison of two- and three-dimensional echocardiography ,vith cineventriculography for measurement of left ventricular volume in patients. 1 Am Coli Cardiol 1994;24: 1054-63.
27 Weyman AE, Peskoe SM, \Villiams ES, Dillon JC, Fcigenbaum H. Detection of left ventricular aneurysms by cross-sectional echocardiography. Circulation, 1976;54:936-44.
28 Ryan '1', Petrovic 0, Armstrong \VF, Feigenbaum H. Quantitative two-dimensional echocardiographic assessmcnt of patients undergoing left ventricular aneurysmectomy. Am Heart 1, 1986; III :714-20.
29 Albin G and Rahko PS. Comparison of echocardiographic quantitication of left ventricular ejection fraction to radiolluclide angiography in patients with rcgional wall motion abnormalities. Am 1 Cardiol 1990;65: 1031-32.
30 liang L, DePrada JAY, Handschumacher MD et al. Quantitative three-dimensional reconstnlction of ancurysmalleft ventricles: In vitro and in vivo validation. Circulation 1995;91 :222-30.
31 Buck T, Hunold P, Wentz KU, Tkalee W, Nesser HJ, Erbel R. Tomographic three-dimensional echocardiographic determination of chamber size and systolic function in patients with left ventricular aneurysm. Circulation 1997;96:4286-97.


APICAL LONG AXIS RATHER THAN THE TWO CHAMBER 55
CHAPTERS
THE APICAL LONG AXIS RATHER THAN THE TWO CHAMBER VIEW SHOULD BE USED IN COMBINATION
WITH FOUR CHAMBER VIEW FOR ACCURATE ASSESSMENT OF LEFT VENTRICULAR VOLUMES AND
FUNCTION
Youssef FM Nosh', Wim B Vletter, Eric Boersma, Rene Frowijn, Folkert J Ten Cate, Paolo M Fioretti, Jos RTC Roelandt.
From the Thoraxcenter, Division of Cardiology and Department of Nuclear :Medicine, University Hospital Rotterdam-Dijkzigt and Erasmus University, Rotterdam, The
Netherlands.
YFM Nasir is supported by The NUFFIC, The Hague, The Netherlands and Cardiology Department, AI-Hussein University Hospital, AI-Azhar University, Cairo, Egypt.
EliI' Heart J.1997;18:1175-85

56 CHAPTERS
ABSTRACT Backgrollnd. Most biplane methods for the echocardiographic calculation of left ventricular volumes (L VV) assume orthogonality between paired views from the apical window. Our aim was to study the accuracy of biplane L VV calculation when either the apical two chamber or apical long axis views are combined with the apical four chamber view. L VV calculated from three-dimensional echocardiographic (3DE) data sets were used as a reference. Therefore, 27 patients underwent precordial 3DE using rotational acquisition of planes at 2-degrees intervals with ECG and respiratory gating. Calculation of end-diastolic (ED) and end-systolic (ES) LVV and ejection fraction (EF) from the 3DE data sets were done by (I) Simpson's method (3DS) at 3-mm short axis slice thickness (reference method) and (2) biplane ellipse from paired views using either apical four and two chamber views (BE-A) or apical four and long axis views (BE-B). Observer variabilities were studied by the standard error of the estimate % (SEE) in 19 patients for all methods. Results. The spatial angles (mean±SD) between the apical two chamber and apical long axis views and the apical four chamber view were 63.3°±19.7 and 99.1 o±2S.6 respectively. The mean±SD of ED and ES LVV (ml) and EF (%) by 3DS were 142.2±60.9, 91.8±59.6 and 39.6±17.5, while that by BE-A were I 26.7±60,4, 84.0±57.9 and 39±17 and by BE-B were I 34.3±62,4, 88.6±59.7 and 39.1±16.7 respectively. BE-B intraobserver (8.4, 6.7 and 3.5) and interobserver (9.8, 11.5 and 5.4) SEE for ED and ES L VV and EF respectively, were smaller than that for BE-A (10.8, 8.8 and 4.1) and ( 11.4, 14.7 and 6.1) respectively. There was excellent conelation between 3DS and BE-A (r=0.99, 0.98 and 0.98) and BE-B (0.98, 0.98 and 0.98) for calculating ED-, ES-L VV and EF respectively. There were no significant difference between BE-A and BE-B with 3DS for ED and ES LVV and EF calculation (p=0.2, 0.3 and 0.4) and (p=O.S, 0.5 and 0.4) respectively. There were closer limits of agreement (MD±2SD) between 3DS and BE-B 7.9±18.8, 3.2±14.2 and 0.8±S.8, than that between 3DS and BE-A IS.5±19.6, 7.8±16.2 and 1.l±7.4, for calculating ED, and ES LVV and EF respectively. Conclusion. Both apical two chamber and apical long axis views are not orthogonal to the apical four chamber view. Observer variabilities of BE-B were smaller than that for BE-A. BE-A and BE-B have excellent correlation and non significant differences with 3DS for LVV and EF calculation. There were closer limits of agreement between BE-B with 3DS for L VV and EF calculation than that between BE-A and 3DS. Therefore, we reconllilend to use the apical long axis rather than the two chamber view in combination with the four chamber view for accurate LVV and EF calculation.
INTRODUCTION Cross-sectional echocardiography a110ws comprehensive evaluation of cardiac anatomy
and function. This widely available imaging method is relatively inexpensive when compared to radionuclide or other emerging non invasive imaging techniques like magnetic resonance imaging. 1
•2
A qualitative assessment of both global and regional left ventricular function is readily performed but their quantitatioll remains a challenge.3 Quantitative assessment of left ventricular volume and function is based Oll the assumption of models for left ventricular

APICAL LONG AXIS RATHER THAN THE TWO CHAMBER 57
geometry. Unfortunately there is lack of consensus about the appropriate models and algorithms to apply ,4 Left ventricular volume and ejection fraction have been calculated from tomographic planes imaged from the apical window.5.s Although an estimation of volume can be obtained from single apical views, biplane calculations have a better reproducibility.9 Most of the biplane methods assume orthogonality between paired apical views. The apical four chamber is a standard view in all algorithms, as it is the easiest and most reproducible to perform.9
,10 but there is still a controversy about its orthogonal vic\\'. The apical long axis view has been considered as the best orthogonal view to apical four chamber, as it is lllore easier to standardize because the aortic and mitral valves serve as anatomical landmarks.9
-11
However, the American Society of Echocardiography has recently recommended to use the apical two chamber view in conjunction with the four chamber view for biplane volume measurements .12,13
The aim of this study was to verify the spatial angle between both the apical two chamber and the apical long axis views relative to the apical four chamber view. In addition, left ventricular volumes were calculated by the biplane ellipse method using apical four chamber with either the apical two chamber or the apical long axis views. Measurements of left ventricular volumes and ejection fraction obtained by the previous paired orthogonal views were then compared with the measurements obtained by three-dimensional echocardiography (reference method). Observer variabilities were studied for all methods.
PATIENTS AND lVIETHODS Study population.
Data acquisition for three-dimensional echocardiography was performed in 27 patients for evaluation of left ventricular volume and function. Eleven patients had previous myocardial infarction, 5 had dilated cardiomyopathy 9 were evaluated during chemotherapy and 2 llormal volunteers. Of the 27 patients 16 were men, patients ranged in age from 21 to 82 years with a mean age of 51.3 ± 17.4 years (table I). Informed consent was given by every patient after full explanation of the procedure. Patients with technically adequate apical windows were included in this study.
ECHOCARDIOGRAPHIC EXAMINATION Echocardiographic studies were performed with a transducer system in the apical position,
while the patient was comfortable lied in the 45-degree left recumbent position. To acquire cross-sectional images for reconstl11ction, the operator has to tind the centre axis around which the imaging plane is rotated to encompass the whole Jeft ventricular cavity. Since the spatial coordinate system changes with transducer movement, motion of the transducer must be avoided. Inadve11ent patient movement during the image acquisition can be prevented by thoroughly explaining the procedure before the study.
The precordialtrallsducer assembly alld image acquisition We used a newly developed custom-build hand-held transducer assembly that can be
rotated with H step motor via a wheel-work interface. 14,15 A commercially available 3.75 J\1Hz
transducer (Toshiba Sonolayer SSH-140A system) is mounted in the probe assembly.

58 CHAPTERS
The step-motor is cOlllmanded by a steering-logic for controlled image acquisition (Echoscan, TomTec GmbH, Munich, Germany).
A software-based steering logic activates the step-motor in the transducer assembly, which controls the image acquisition in a given plane by an algorithm that considers both heart rate variations (ECG-gating) and respiratory phase by thoracic impedance measurement. Prior to the actual image acquisition R-R intervals were predetermined with an acceptable variability of 150 msec or less and respiration was gated at the end-expiratory phase. Based on this information, the step-motor was commanded by the steering algorithm to acquire cross-sections of cardiac cyc1es that fell within the preset ranges. This allowed optimal temporal and spatial registration of the cardiac images. Prior to the actual image acquisition we performed test acquisition runs to make sure that the left ventricular outflow tract \vas included in the conical volume in every patient. After a cardiac cycle was selected by the steering logic, the cardiac images were sampled at 40 Insec intervals (25 frames/sec), digitized, and stored in the computer memory. Then, the step motor was activated and used to rotates the transducer 2 degrees to the next scanning plane, where the same steering logic was followed. Cycles that did not meet the preset ranges were rejected. To fill the conical data volume, 90 sequential cross~sections from 0 to 1780 had to be obtained, each during a complete cardiac cycle.
Image processing The recorded images were formatted in their correct rotational sequence according to their
ECG phase in volumetric data sets (256*x256*x256* pixel for each 8 bit). The postprocessing of the data sets was performed off-line using the analysis program of the system.
III/age analysis: [a] Three-dimensional echocf)l'(liographic Simpson's method
Left ventricular volumes and ejection fraction were calculated from the three-dimensional data sets by using Simpson's method. TIllS method used left velltdcular manual tracing of sequential short-axis vie\vs of the left ventricle from the apex to the mitral nnnulus to calculate left ventricular volume. After the long-axis view of the left ventricle was selected, the end-diastolic (the first frame before closure of the mitral valve) and then the end-systolic (the first frame before the opening of the mitral valve) data sets were selected. \Ve then adjusted the parallel slicing through the data sets at 3-null intervals. This resulted in generation of equidistant cross-sections of the left ventricle. The computer displayed the corresponding short axis view in (1) a dynanllc display for better identification of the endocardium in a digitized complete cardiac cycle, and (2) a static display for manual endocardial tracing. \Vhen manual tracing of the displayed short-axis was completed, the system calculated the volume by summing up the voxels included in the traced area in 3-nllllthick slice. Slice by slice, the system summed the corresponding subvolumes and finally calculated the end-diastolic and end-systolic left ventricular volumes. The system then calculated and displayed the values of stroke volume and ejection fraction (figure 1).

APICAL LONG AXIS RATHER THAN THE TWO CHAlVIDER S9
[b] Left ventricular volumes analysis using paired orthogonal views The end-diastolic and the end-systolic data sets were selected as described in Simpson's
method. Left ventricular volumes and ejection fraction were calculated by :
Figure 1. The principle of left ventricular volume measurement lIsing a three-dimensional data sel. An end-diastolic and end-systolic long-a .. xis view is lIsed as a reference view. The left ventricle is sliced at equidistant intervals to generate a series of shorl axis views. TIle surface area of e;teh cross-section is measured by planimclry and the volume of each slice is calculated. Adding up the volumes of all slices provides the volume measurement of the whole left ventricle ( Simpson's method). This is performed for both end-diastolic and end-systolic dat.a sets. The figure shows an end-diastolic and end-systolic long axis views (panel A, upper and lower image respectively) 011
which the transyerse sector I and 2 cut the left ventricular cayity at this level to give rise the corresponding shortaxis views at end-diastole and end-systole ( 1 and 2 ) respectively, shown in the middle panel B. Panel C shows reconstruction of the left ventricle using the planimetered contours of short axis views obtained at 3-mm intervals at end-diastole (upper part) and end-systole (lower part).
Biplane ellipse method: In this method, the apical four chamber view (with both mitral and tricuspid valves transected in their mid portion), the apical two chamber view (the mitral annular diameter is maximised and the aorta and right ventricle are not imaged) and the apical long axis view (the left atrium, left ventricular outflow tract, aortic valve and proximal part of the ascending aorta are imaged) were then identified, both in the end-diastolic and cndsystolic data sets (figure 2) blindly and independently from the angle of rotation. The spatial angle between four chamber view and both apical two chamber and apical long ax is views were then determined for each data set in end-diastole.
Left ventricular volumes were calculated by the biplane ellipse algorithm. Left ventricle was assumed to be nn ellipsoid. It was defined by the two orthogonal ellipses whose long axis was the same and whose short axes were obtained by applying the area-length technique to the two orthogonal left ventricular images. 16 The long axis was measured from the apex to the mid mitral valve plane in the apical four chamber view. The papiHary muscles are included in left ventricular volume. The left ventricular volume (v) was obtained as:

60
V= 8*AI*A2
3*n * LI Where;
Ll = left ventricular long axis common for both apical 0l1hogonal views.
CHAPTERS
Al = left ventricular endocardial smface afea at apical four chamber view. A2 ;::: left ventricular endocardial surface area in the second apical view (two chamber or long axis). Left ventricular end-diastolic and end-systolic volume and ejection fraction were calculated using apical four chamber and apical two chamber views (method A) and apical four chamber and apical long axis views (Method B).
Figure 2. I j measurement I
dimensional data set an end-diastolic and end-systolic long-axis view is used as a reference view. The best appearing apical four chamber (panel A), two chamber (panel B) and apical long axis (panel C) views arc selected and endocardial borders are traced manually (endocardial surface area are displayed). Left ventricular volume are calculated by biplane ellipse lIsing apical four chamber ,vith apical two chamber views (method A), and apical four chamber with apical long axis views (method B).
STATISTICAL ANALYSIS The interval between measurements of left ventricular volume and ejection fraction for
every method was two weeks and done independently. In 19 patients, for each method measurements of left ventricular volume and ejection fraction were calculated by two experienced observers blinded to each other's results. In addition, the fIrst observer repeated the measurement after 7 days. Intraobserver and interobserver variabilities were calculated, and expressed as the standard error of the estimate.
Paired student t-tests were performed to compare left ventricular volumes and ejection fraction calculated by A and B biplane ellipse methods with measurements obtained by threedimensional echocardiographic Simpson's method (reference method). Significance was stated at the 0.05 probability level. The p-value, the mean difference and the limits of agreement (mean difference±2SD)17 are reported. Pearson's correlation coefficients are presented.

APICAL LONG AXIS RATHER THAN THE TWO CHAlYIDER
RESULTS Feasibility.
61
Three-dimensional echocardiographic acquisition and reconstmction could be performed in all patients recruited in tIus study without difficulties. Three-dimensional echocardiographic acquisition was repeated in one patient on a separate day due to an error in the calibration procedure of the rotational axis. All patients included in tIus study were in sinus rhythm.
Spatial angle of apical two chamber and apical long axis views relative to apical foul' chamber yieVi'
The angle between the apical two chamber and the apical four chamber views ranged between 18° and 96° (mean ± SD = 63.3° ±19.7) in end diastole. The angle of the apical long axis from the apical four chamber views ranged between 34° and 138° (mean ± SD = 99.1° ± 25.6) (figure 3, table I).
Figure 3. TIlis figure represents mean Iwo i long axis (B) views from the apical four chamber view (transverse Hne) in relation to its true orthogonal view (vertical line) illustrated on the left ventricular short axis view.
Left ventricular volumes and ejection fraction The mean ± SD of left ventricular end-diastolic and end-systolic volume and ejection
fraction obtained by three-dimensional echocardiographic Simpson's rule were (l42.2±60.9, 91.8±59.6 and 39.9±17.5) and for biplane ellipse method A (I 26.7±60A, 84±57.9 and 39.0±17.0) and method B (I34.3±62A, 88.6±59.7 and 39.1±16.7) respectively (tables 2 and 3).

62 CHAPTERS
Observer variabilities of all methods No significant differences existed between left ventricular volumes and ejection fraction
calculated by the same observer as well as between the two independent observers for all methods. Three-dimensional echocardiography achieved the smallest observer variabilities, while intraobserver and interobserver variabilities of biplane ellipse B method were smaller than that for A method (table 4).
Table]. Patients clinical data, site of left ventricular wall motion abnormalities (\VMA) and
.•• tl!!c}:2H\!t£ll}~.~l,!!;\I!O.£L!'picaltwo chamberJAJ.':Z.dll..~)!,d. aEica'.l()llga~~ .. ~b.J.'~Lx) views : ....• ~ WMA Rotational Angel
-"'-,~,-,---- ",._--Patient Sex Diagnosis Type Site Ap.2ch.o Ap. Lx.o
e 29 F NC 86 130
2 48 F NC 56 110 3 48 F NC 18 72
4 35 F NC 30 78
5 35 M NC 54 98 6 25 F NC 70 118 7 32 r NC 48 80 8 82 M NC 70 96 9 31 M NC 88 108 10 34 M NC 68 92
11 21 !vi NC 80 99 12 53 M !IF GH 76 124 13 63 F !IF GH 62 120 14 49 M !IF GH 58 34 15 61 M HF GH 50 70 16 54 F !IF GH 72 98 17 60 F CAD S D(ap),A(inf.,post.,sep.) 72 116 18 68 F CAD S A(ap.,sep.,inf.) 90 126 19 56 M CAD S A(inr. ),H(allt. ,sep., lat.,ap.,posI.) 76 110 20 71 M CAD S A (ap. ),H( ani. ,lat., i nf. ,post. ,sep.) 96 128 21 70 M CAD S A(post.), H(lat.,inf.) 42 136 22 33 F CAD S H(ap.,sep.) 72 52 23 58 M CAD S A(inf.,post), H(ap.,sep.,ant.,lat.) 28 72
24 49 M CAD S H(inf) 64 138 25 77 M CAD S D(ap.), H(inr.,post.,ant.,sep.) 80 106 26 72 M CAD S A(inf,post.), H(ap.,lat.,sep.) 45 83 27 70 !vi CAD S D(ap.), H(iof.,post.,sep.) 78 100
""""""'''''''' • ~>=' "-"
F- female, 1'\'1= male, NC= noncardiac, HF= heart failure, CAD- coronary artery disease, GH- glopaJ hypokinesis, S= segmental \VMA, D= diskinesis, A= akinesis H= hypokinesis, ap=apix, ant.=anterior, scp.=septum, laL=latcml, inf.=inferior and poSt.=poslcrior.

APICAL LONG AXIS RATHER THAN THE TWO CHA~mER 63
Table 2. Left ventricnlar end-diastolic (EDV), end-systolic (ESV) volume and ejection fraction (EF) by thrce-dimensional echocardiographic Simpson's rule (3DS), and biplane ellipse using both apical four and two chamber views (BE-A) and apical four and apical long
BE-A Patic,[lt EDV ESV._ EF EDV ESV .. EF EDV ESV EF
126.9 51.0 59.6 102.2 45.5 55.5 108.7 50,6 53.5 2 128.2 53.6 58.1 113.3 50.2 55.3 128.4 53,6 58.3 3 152.4 64.3 57.7 133.6 64.7 51.8 137.7 65,2 52.7 4 116.9 50.4 56.9 99.5 47.3 52.5 107.2 50,1 53.2 5 168.5 80.2 52.4 142.1 76.6 46.1 152.1 80.0 47.4 6 102.7 48.2 53.1 98.5 51.9 47.3 108.9 54,1 50.3 7 75.2 30.0 60.0 66.1 26.8 59.4 71,5 28.2 60.5 8 72.0 21.3 70.4 58.1 16.5 71.6 65.0 19.8 69.5 9 65.4 29.7 54.5 56.3 39.2 45.9 58.3 30.4 47.8 10 112.4 49.9 55.0 91.2 37.1 59.3 96.1 44.6 53.5 11 149.6 61.2 59.1 127.3 52.3 58.9 136.7 55.6 59.3 12 226.9 194.8 14.2 218.0 186.6 14.4 227.9 192,6 15.5 13 215.4 188.7 12.4 194.3 174.4 10.2 206.5 184,2 10.8 14 197.2 150.7 23.3 205.9 161.4 21.6 213.1 166,1 22.1 15 189.4 162.6 14.1 159.9 138.3 13.5 165.8 142,1 13.7 16 42.7 26.9 37.9 32.5 20.5 36.8 38.7 24.9 35.7 17 144.0 112.7 22.0 134.5 98.9 26.4 136.1 102,5 24.7 18 175.6 135.4 22.9 163.5 123.2 24.7 170.5 129,4 24.1 19 234.9 179.7 23.5 230.7 169.8 26.4 237.5 178,4 24.8 20 174.0 114.1 34.3 141.0 88.3 37.9 147.6 95,6 35.2 21 108.8 76.0 30.1 100.1 65.5 34.4 104.2 68,9 33.9 22 59.9 26.5 55.7 42.9 16.5 61.7 42.8 18,2 60.2 23 305.0 232.0 23.9 285.1 226.2 20.6 299.5 236.0 21.7
24 80.7 52.1 35.3 78.3 51.8 33.8 80.2 53,8 32.9 25 146.1 104.7 28.2 120.5 90.7 24.7 136.4 99,8 26.8 26 126.7 78.3 35.0 95.4 58.1 36.8 106.3 64.8 39.0 27 103.4 143.1 27.7 131.0 97.9 25.4 141.9 101.9 28.4 ~~=~,~ __ ~, ~A'~~T~ ''''~,=
Table 3. TIle mean + SD of left ventricnlar EDV (m!), ESV (m!) and EF %. Mean +SD EDV(mI) ESV(ml) EF(%) 3DS 142.2±60.9 91.8±60.9 39.9±17.5 BE-A 126.7±60.4 84.0±57.9 39.0±17.0 BE-B 134.3±62.4 88.6±59.7 39.1±16.7 All appreviation as table 2

64 CHAPTERS
Comparison between biplane volumes calculation from orthogonal ,iews with three~ dimensional eChOC31'diographic ShUllSOll'S rule
Biplane ellipse using both A and B methods has excellent correlation and non significant differences with three-dimensional echocardiographic Simpson's rule, for left ventricular volume and ejection fraction calculation (tables 5) (figure 4), The limits of agreement between BE-B and 3DS were closer than that between BE-A and 3DS (tables 5) (figure 5). Biplane ellipse using method B has lesser underestimation % values than biplane ellipse method A for left ventricular volumes and ejection fraction calculation compared to the reference method (table 5) (figure 6).
Table 4. Observer variability of 3DS, BE-A and BE-B presented by intraobscrver (Intra.) and _l!!l~E'?2scrver (Inter.) % S!'!!lE!~l:~L~!.':'?Lof the",stimate (SEE): __ . __________ .~~~~
Intra. SEE Inter. SEE 3DS 3.1 4.9 BE-A 10.8 11.4 BE-B 8.4 9.8 All olher apprcyiation as in table 2.
Left Ventricular Volumes (1111)
1 ~ 100-
• ~;~.,
,(,' . ,,
:t 200
~ m W 100 m
, ,
• •
• EOV, r~O.99
, ESV, ruO.98
N ~ 27
100 ~oo 300
:lOS LW (ml)
'00
• EOV, r~O.98
ESV, (EO.98
tJ R 27
'" 3DS lVV (ml)
Intra. SEE 3.6 8.8 6.7
(1 )
(2)
.... J.,!.' Inter. SEE Intra. SEE Inter. SEE
6.6 2.4 5.1 14.7 4.1 6.1 11.5 3.5 5.4
- -,_, __ ~ ___ w''''~''~'"_
Ejection Fraction (%)
~ 60-
'" " w :> 40-
" 1 w m"
" w
"
0') -
~ 40
m
~ ~o ~
• •
.'
I. l' .. . \.
't'
"
r~O.98
N~27
" " 3DS lV-EF (%)
., .... ..
r~O.98
tJ m 27
N (0 --0,",--" aDS LV·EF ('1,)
Figure 4. Linear regression of left Ycnlricular end-diastolic and end-systolic yolumes and ejection fraction, measured by three-dimensional echocardiographic Simpson's method (3DS) versus biplane ellipsis using either apical four and two chamber views (BE-A) upper part (I), or apical four chamber and apical long axis views lower pari (2). n = number of patients, r = correlation coefficients. The dashed line represents the identity line.

APICAL LONG AXIS RATHER THAN THE TWO CHAMBER 65
Table S. The mean difference (MD±SD), % underestimation (underes!.), p value, limit of agreement and correlation coefficient (r) between 3DS and both BE-A and BE-B for calculating E~V, ESV and LVEF
MD±SD
3DS-BEA EDV IS.S±9.8
ESV EF 0.9±3.7
3DS-BE-B EDV ESV EF 7.9±9.4 0.8±2.9
%Underest p
1l±1O 7.8±8.1 8.5±11.5 0.3
2.3±1O.1 5.6±8.5 3.2±7.1 3.5±9.4 0.5
2.0±7.6 0.4 0.98 0.8+5.8
0.2 0.4 0.5 0.98 0.98 0.98 r
Agreement 0.99 15.5+19.6 7.8+16.2 0.9+7.4 7.9+18.8
0.98 3.2+14.2
All apprcviation as table 2 Left Ventricular End-diastolic Vo!ume(ml)
"~ ~ ~z21 ~ 31-
o
~ nU-!55.
g o ,
g-~ _1) ,
, , ~~
, ,
, , , , " , ,
11·1$0
-<So-- W -;1 I) I') ,~,~'t;l';Ii'm })l'~ I'J'<5~ ~l'r.4
AWI;~ 3»3 a~ 6£·A(~'1
.\ ~ l> N·21
o ~ l)•
.~ "
~
11-7.9 t' " ,,
1/.<$0
II ;L-I~~~_
I, " " "'·120
-<'5 0 n '111 /,1')ol'1:t'lm"3rArnl'lmm)..~ AI"rl;. ';03 I.'.j BE-Sir!)
(A)
Left Ventricular End-~y,lo!ic Volurne(ml) (I)
.J!
~ ,N-U
~ ": o I ,
" I • "p;:","U0 l.a • II C • L'
\5 ' ", :. I I " \ I. ,
(2)
'1,-
(B)
II' <$0
, -'--0--,-
Ej~~lion Fraction %
II;
-:- L . , J 11: N-21
o ! ,
~ II- !.1 • g . 'I j .SL
o .'l'--'--
, , , , , , ,
" ,
, , " ,
IItlSD
o 1} B ~ • ~ /,1 n
..
A,m,. ;iDS <'-d BE·,.!'<)
, , , , •
lI.aD
• -~-'--~''o:-,,' I ... , , ,
~---'-' ~ '-J !~ !oJ 11
(e) Figure 5, Limits of agreement of left ventricular end-diastolic (panel A), end-systolic (panel B) volume and ejection fraction (panel C) calculated by three-dimensional echocardiographic Simpson's method (3DS) versus biplane ellipsis using either apical four and two chamber views (BE-A) upper part (I), or apical four chamber and apical long axis views lower part (2). Difference of each pair of 3DS and either BE-A or BE-B for left ventricular enddiastolic, end-systolic volume and ejection fraction measurements plotted against the average value of both measurements.
DISCUSSION Three-dimensional echocardiography allows accurate calculation of left ventricular
volume and ejection fraction without geometric assumptions. and has been validated against radionuclide angiography and magnetic resonance imaging. 18
-20 Therefore, offers a faithful
echocardiographic reference for left ventricular volume and ejection fraction calculation. In practice apical views are used for biplane left ventricular volume and ejection fraction
calculation. However, there is still lack of consensus whether to lise the apical two chamber
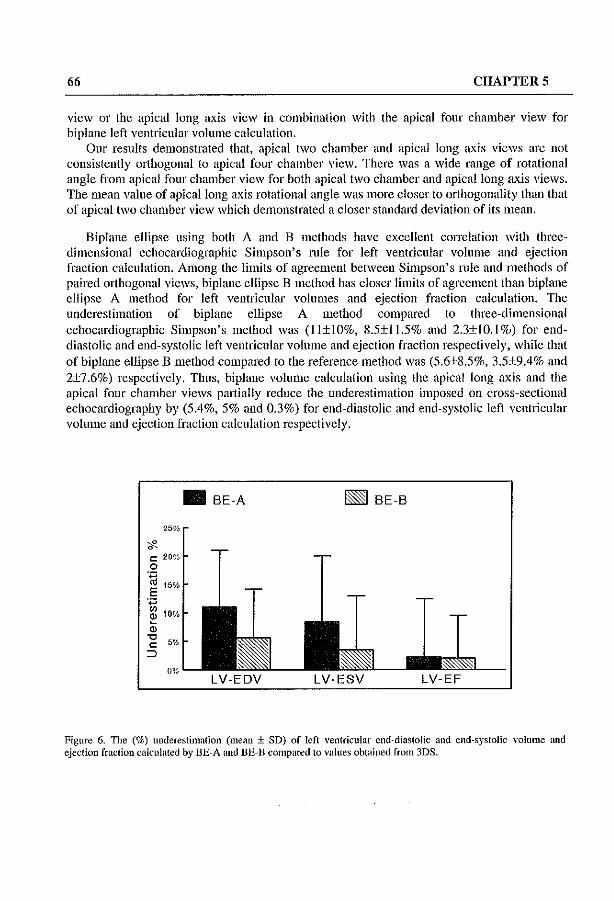
66 CHAPTERS
view or the apical long axis view in combination with the apical four chamber view for biplane left ventricular volume calculation.
Our results demonstrated that, apical two chamber and apical long axis views are not consistently orthogonal to apical four chamber vicw. There was a wide range of rotational angle from apical four chamber view for both apical two chamber and apical long axis views. The lllean value of apical long axis rotational angle was more closer to orthogonality than that of apical two chamber view which demonstrated a closer standard deviation of its mean.
Biplane ellipse using both A and B methods have excellent correlation with threedimensional cchocardiographic Simpson's mle for left ventricular volume and ejection fraction calculation. Among the limits of agreement between Simpson's rule and methods of paired orthogonal views, biplane ellipse B method has closer limits of agreement than biplane ellipse A method for left ventricular volumes and ejection fraction calculation. The underestimation of biplane ellipse A method compared to three-dimensional echocardiographic Simpson's method was (ll±IO%, 8.5±11.5% and 2.3±1O.1 %) for enddiastolic and end-systolic left ventricular volume and ejection fraction respectively, while that of biplane ellipse B method compared to the reference method was (5.6±8.5%, 3.5±9.4% and 2±7.6%) respectively. Thus, biplane volume calculation using the apical long axis and the apical four chamber views partially reduce the underestimation imposed on cross-sectional echocardiography by (5.4%, 5% and 0.3%) for end-diastolic and end-systolic Icft ventricular volume and ejection fraction calculation respectively.
• BE-A ~ BE-B
25%
ci"-t: 20% 0 .~
15% E
',,"
"' 10% ~
" '0 5% c:
::;)
0% LV-EDV LV-ESV LV-EF
Figure 6. The (%) underestimation (mean ± SD) of left ventricular end-diastolic and end-systolic volume and ejection fraction calculated by BE-A and BE-B compared to values obtained from 3DS.

APICAL LONG AXIS RATHER THAN THE TWO CHAMBER 67
Comparison with previous studies using the apical four chamber and the apical long axis views for biplane volume measurements
The apical long axis represents a better orthogonal view to apical four chamber for biplane volume measurements than the apical two chamber vicw. Also, the apical long axis view is more reproducible due to the presence of anatomical landmarks of the aortic and mitral valve which allows better standardisation. The apical two-chamber view is frequently foreshortened resulting in a shorter long axis length (apex to mid base). If the difference in the axis lengths of the two orthogonal views is greater than 15%, biplane calculations are not valid.9
OUf results are in agreement with the study conducted by lenni et al.I I who compared left ventricular volume and ejection fraction calculation by two-dimensional echocHrdiography and biplane cineventriculography in 42 consecutive patients. Two orthogonal apical long axis views were recorded, the four chambers view and the 'RAG equivalent' view or apical long axis view whieh including the left ventricular outflow tract. They achieved excellent correlation between cine-ventriculography and two-dimensional echocardiography for calculating end-diastolic volume ( r = 0.98 and SEE = 21 ml), endsystolic volume (r = 0.97 and SEE =17 1111) and ejection fraction (r = 0.87 and SEE =5.4 %).
Comparison with previous studies using the apieal four and two chamber views for biplane volume measurements
The American Society of Echocardiography recommends to calculate left ventricular volume from the dimensions and area measurements obtained from paired apical views (both two- and four-chamber) that may be considered nearly orthogonaL.J
Katz et aI.,13 studied the assumption that apical four and two chamber views are perpendicular along the left ventricular long axis. The validity of this assumption was tested using custom-designed 3.5-Mhz transducers with an electric 1110tor that rotated the transducer by 2.9° increments through 180° about a central axis. Images were acquired beginning at the best appearing apical four chamber views and rotating to the best appearing apical two chamber views. The mean degree of rotation between the apical four and two chamber views were 95° ± 21 ° (minimum:::; 30° and maximulll :::; 136°). They conclude that apical four and two chamber views represent pairs of orthogonal imaging planes within 10° of orthogonality in about half of the subjects, but this assumptions was inaccurate in many patients. Moreover, in their study they did not demonstrate the accuracy of volume measurements on applying this formula, and they did not adress the alternative approach of using apical long axis instead of two chamber as an orthogonal to the apical four chamber view.
Spain et al.,21 studied biplane volume measurements using the apical four and two chamber views in 31 patients. Their aim was to determine whether use of the line of intersection display will improve positioning of the apical four chamber and apical two chamber views and thereby, improve the agreement between estimates of left ventricular volume by apical biplane echocardiography and cineventriculbgraphy. They found that, guided image positioning was not able to conect displacement of the ultrasound beam anterior to ventricular apex \vithout deterioration of image quality in most patients. In addition, the underestimation and the agreement between echocardiographic and cineventriculographic volumes was not changed, for unguided images the correlation and the

68 CHAPTERS
limits of agreement are (r ~ 0.84, ±62,4 cc and r ~ 0.94, ±49 cc) for end-diastolic and endsystolic volumes respectively. While, that for the line of intersection guided views ( r ~ 0.85, ±60.8 cc and r ~ 0.91, ±52.2 cc) respectively. Starling et a/.," demonstrated that cross sectional biplane cchocardiography using the apical four chamber and the apical two chamber views underestimated left ventricular volume calculation by 28% compared with radionuclide angiographic volumes in 30 patients (26 with coronary artery disease and wall motion abnormalities). This underestimation of volume measurements was reported in liallY other studies using the apical four and the two chamber views for biplane left ventricular volumes calculation.6
Advantages and limitations of the study In this study we addressed most of the factors which may affect the accuracy of biplane
volume measurements by standard cross-sectional echocardiography. We studied the spatial orientation of the apical long axis and two chamber views relative to the apical four chamber view. With the biplane ellipse model, these views are assumed to be orthogonal to the four chamber view. We lIsed the three-dimensional data sets obtained from the apical window which encompassed the whole left ventricular cavity. The acquisition software allows to avoid artefacts resulting from respiratory variation and motion artefacts. Standard apical views were derived from the data set and the spatial position of the long axis and two chamber was measured relative to the apical four chamber view and should be conect.
We compared the results of volumes calculated with the two standard approaches based on a model assuming orthogonality between the two planes with those obtained from threedimensional echocardiography using Simpson's rule as an echocardiographic gold standard technique. Three-dimensional echocardiographic Simpson's method was proved to be an accurate and reproducible method for calculating left ventricular volumes and ejection fraction with comparison to both radionuclide angiography and magnetic resonance imaging techlliques. IS
.20
In this study the basic apical views for biplane volume measurement were obtained from the three-dimensional echocardiographic data set, therefore there is still a need to compare biplane volume calculation from the standard cross-sectional echocardiographic apical views.
CONCLUSIONS Apical two chamber and apical long axis views are not consistently orthogonal to apical
four chamber view. Observer variabilities of Biplane ellipse-B method were smaller than that for Biplane ellipse-A. Biplane ellipse using both A and B methods has excellent correlation and non significant differences with three-dimensional echocardiographic Simpson's rule for left ventricular volume and ejection fraction calculation. Among the limits of agreement between Simpson's rule and methods of paired orthogonal views, biplane ellipse B method has closer limits of agreement than biplane ellipse A method for left ventricular volume and ejection fraction calculation. Therefore, we recolllmend the use of apical long axis rather than the two chamber with four chamber views for accurate biplane left ventricular volumes and ejection fraction calculation.

APICAL LONG AXIS RATHER THAN THE TWO CHAlVIDER 69
REFERENCES. \VyaU lll., Heng MK, MeerbaUill S, Oueret P, Hestenes J, Dula E, Corday E. Cross-sectional echocardiography. Analysis of mathematic models for quantifying volume of the fonnalin-fixed left ventricle. Circulation 1980;61: 1119-25.
2 Schajsira IN, Kohn MS, Beaver WI, Papp RL. In vitro quantification of canine left ventricular volume by phased-array sector scan. Cardiology 1981 ;67: 1-11.
3 Erbcl R, Schweizer P, Lambertz H, Henn G, Meyer J, Krebs \V, Effert S. Echovcntriculography - a simultaneous analysis of two-dimensional echocardiography and cineventriculography. Circulation, 1983;67:205-15.
4 Schiller NB. Two-dimensional echocardiogmphic determination of left ventricular volume, systolic function, and mass: Summary and Discllssion of the 1989 Recommendations of the American Society of Echocardiography. Circulation 1991 ;84[suppl I J: 1-280_1-287.
5 Carr K\V, Engler RL, Forsythe lR, 10hnson AD, Gosink B. MeaslH'emcnt of left ventricular ejection fraction by mechanical cross-sectional echocardiography. Circulation 1979;59: 1196-206.
6 Schiller NB, Acquatella H, Ports TA, et al. Left ventricular volume from paired biplane twodimensional echocardiography. Circulation 1979;60:547-55.
7 Folland ED, Parisi AF, Moynihan PF, 10nes DR, Feldman CL,Tow DE. Assessment of left ventricular ejection fraction and volume by real time, two-dimensional echocardiography. A comparison of cine-angiographic and radionucllde techniques. Circulation 1979;60:760-6.
8 Silverman NH, Ports TA, Snider AR, et a1. Detennination of left ventricular volume in children: echocardiographic and angiographic comparisons. Circulation 1980;62:548-57.
9 Roelandt 1, vd Borden S, Vletter WB, van Daele M, vd Putten N. Ultrasonic quantitation of cardiac function, what is suitable today? Computerized Echocardiography 1993, Centro Scientifico Editore. Centro Scientifico Editore Torino;137-155.
10 Weyman AE: Cross-sectional echocardiography. Philadelphia. lea & Febiger, 1982,pp283-97. 11 lenni R, Viell A, Hess 0, Anliker M, KrayenbueW lIP. Estimation of left ventricular volume from
apical orthogonal 2-D echocardiograms. European Heart Journal 1981 ;2:217-25. 12 Schiller NB, Shah PM, Crawford M, DeMaria A, Devereux R, Feigenbaum H, Gutgesell H, Reichek
N, Sahn D, Schnittger I, Silvennan NH, Taijk AJ: Recommendation for quantitation of the left ventricle by two dimensional echocardiography: American Society of Echocardiography Committee on Standards Subcommittee. J Am Soc Echo 1989;2:358-67.
13 Katz AS, '''allerson DC, Pini R, Devereux RB. Visually deternlination long-and short-axis parasternal views and four-and two-chamber apical echocardiographic views do not consistently represent paired orthogonal projections. Am 1 Non-invasive CardioI1993;7:65-70.
14 Roelandt 1, Salustri A, Vletter 'V, Nosir Y, Bruining N. Precordial multiplane echocardiography for dynamic anyplane, paraplanc and three-dimensional imaging of the heart. Thoraxcentre 1 1994;6:4-13
15 Salustri A, Roelandt l. Ultrasonic three-dimensional reconstruction of the heart. Ultrasound in Med & BioI 1995;21:281-93.
16 Erhel R, Kreps W, Henn G, Schweizer P, Richter P, Meyer 1, Effert S. Comparison of single-plane and biplane volume determination by two-dimensional echocardiography. l. Asymmetric model hearts. European Heart 10urnal 1982;3:469-80
17 Altman DG, Bland 1M. Measurement in medicine: the analysis of method comparison studies. Statistician 1983;32:307-17.
18 Nosir YFM, Fioretti PM, Vletter 'V, Boersma E, Salustri A, Postma JT. Reijs AEM, TenCate FJ, Roelandt JRTC. Accurate measurements of left ventricular ejection fraction by three-dimensional echocardiography: a comparison with radionuclide angiography. Circulation 1996,94:460-66.

70 CHAPTERS
19- Nosir YRvl. Vletter \V, Boersma E, Ten Catc Fl, Fioretti Pi'vl, Roelandt JRTC. Transthorathic Ihrccdimensional echocardiography: defining requirements for rapid and accurate left ventricular volumes and ejection fraction measurements. J Am Coli Cardial 1996;27,: 150A Abstract.
20 Nasir YFM, Stoker J, Vlcttcr WB, Kasprzak ro, Lequin r-.rn, Boersma E, Ten Catc Fl, Fioretti PM, Roelandt JRTC. Paraplane analysis from precordial three-dimensional echocardiographic data sets for rapid and accurate quantification of left ventricular volumes and function: a comparison with magnetic resonance imaging. J Am Soc Echo 1996;9:371 (abstract supp1.).
21 Spain PM, Schroeder KM, Gopal AS, Smith MD, King DL. Three-dimensional echocardiography: Limitation of apical biplane imaging for measurements of left ventricular volume. J Am Soc Echocardiog 1995;8:576-84.
22 Starling MR, Crawford MH, Sorensen SG, Levi B, Richards KL, O'Rourke RA. Comparative accuracy of apical biplane cross-sectional echocardiography and gated equilibrium radionuclide angiogmphy for estimating left ventricular size and perfonnance. Circulation 1981 ;63: 1075-84.

PARAPLANE3DE "sWIRl FORLVV AND EF 71
CHAPTER 6
PARAPLANE ANALYSIS FROM PRECORDIAL THREEDIMENSIONAL ECHO CARDIOGRAPHIC DATA SETS FOR RAPID AND ACCURATE QUANTIFICATION OF
LEFT VENTRICULAR VOLUME AND FUNCTION. A COMPARISON WITH MAGNETIC RESONANCE
IMAGING
YoussefFM Nosir MD', Jaap Stoker MD PhD, Jaroslaw D Kasprzak MD, Maarten H Lequin MD, Anita Dall' Agata MD, Folkert J Ten Catc
FACC, Jos RTC Roelandt FACC.
With Technical Assistance of Wim B Vletter BSc, Eric Boersma MSc, Ron T van Domburg MSc, Rene Froll'ijn.
From Thoraxcenter, AZR-Dijkzigt and Erasmus University, Rotterdam, The Netherlands, "'Department of Cardiology, AI-Hussein University Hospital. Al-Azhar University, Cairo,
Egypt.
Am Heart J. (Ill Press)
72 CHAPTER 6
ABSTRACT Objectives: Three-dimensional echocardiography (3DE) calculates left ventricular volumes (L VV) and ejection fraction (EF) without geometric assumptions, but prolonged analysis time limits its routine use. TillS study was designed to validate a modified 3DE method for rapid and accurate L VV and EF calculation with comparison to magnetic resonance imaging (MRI). Methods. 40 subjects, included (a) IS normal volunteers and (b) 25 patients with segmental wall motion abnormalities and global hypokinesis secondary to ischaclllic heart disease, underwent 3DE using precordial rotational acquisition technique (2-dcgrees interval with ECG and respiratory gating) and MRI at 0.5 T, ECG-triggered multislice multi phase Tl weighted fast field echo. End-diastolic and end-systolic LVV and EF were calculated from both techniques using Simpson's rule by manual endocardial tracing of equidistant parallel left ventricular short axis slices. Slicing from the 3DE data sets were done by both 2.9-l11m slice thickness (3DE-A) and by S equidistant short axis slices (3DE-B). While for MRI analysis, 9-mm slice thickness was used. Results. Analysis time required for manual endocardial tracing of end-diastolic and endsystolic short axis slices was IO-minutes for 3DE-B method, compared to 40-minutes by 3DE-A method. For all 40 subjects the mean±SD of end-diastolic LVV (ml) were IS1±76, 179±73 and IS2±76, for end-systolic LVV (ml) 120±76, 120±75 and 122±77 and for EF (%) 39±IS, 3S±18 and 38±18 for MRI, 3DE-A and 3DE-B methods respectively. The differences between 3DE-A and 3DE-B with MRI for calculating end-diastolic and end-systolic LVV and EF were not significant for the whole group of subjects as well as for (a) and (b) subgroups. 3DE-B method had excellent correlation and close limits of agreement with MRI for calculating end-diastolic and end-systolic LVV and EF (r= 0.98, 0.99 and 0.99), (-1.3±26.6, -1.6±21.2 and 0.2±5.2)} respectively. The correlation between 3DE-A and MRI were(r=0.97, 0.9S and 0.9S) and the limits of agreement were (-1.4±36, -0.6±26 and 0.6±8) for calculating end-diastolic and end-systolic L VV and EF respectively. In addition, excellent correlation and close limits of agreement between 3DE-A and -B with MRI for LVV and EF calculation was also found for (a) and (b) subgroups. Intraobserver and interobserver variability (SEE) of MRI for calculating end-diastolic and end-systolic L VV and EF were (6.3,4.7 and 2.1) and (13.6,11.5 and 4.7) respectively, while that for 3DE-B were (3.1, 4.4 and 2.2) and (6.2, 3.8 and 3.6) respectively. Comparable observer variability was also found for (a) and (b) subgroups. Conclusions. 3DE-A and -B methods have excellent couelation and close limits of agreement with MRI for calculating LVV and EF in both normal subjects and cardiac patients. 3DE-B method using paraplane analysis with 8 equidistant short axis slices has similar observer variability as MRI, reduces the 3DE analysis time to 10 minutes and therefore offers a rapid, reproducible and accurate method for L VV and EF calculation.
Calculation of left ventricular volume and ejection fraction has important diagnostic, prognostic and therapeutic implications. Therefore a rapid and accurate non-invasive method for their computation is desirable. 1
,2

PARAPLANE 3DE vs MRI FOR LVV AND EF 73
Radionuclide angiography is an accepted method for ejection fraction calculation.3.4 However, it is not accurate for left ventricular volume measurements, cannot be easily performed at bedside, lllay carry biological hazards for the patient and is relatively expensive when used for serial studies. Cineventriculography using biplane left ventricular angiography has been considered the reference method for left ventricular volume and ejection fraction calculation.5
,6 However, cineventriculography is invasive and angiographic measurements are highly dependent on the assumption of geometric models.
Magnetic resonance imaging is a non-invasive technique that has proven to be very accurate in determining left ventricular volume and ejection fraction both in normal subjects and patients.7-
9 However, the technique is not widespread available, expensive, time consuming and cannot be pedormed at bedside.
Two-dimensional echocardiography is widely available and commonly used for estimations of left ventricular volume and ejection fraction, but is also based on geometric assumptions. lO,11 Accurate calculation of left ventricular volume and ejection fraction requires the reconstruction of the true geometry of the heart, particularly in patients with distorted left ventricular shape. 12-14 Three-dimensional echocardiography has this potential. It has been demonstrated in vitro using phantoms and excised ventricles that the technique yield accurate volume determination. 15-17 Few data have been published so far on the comparison between three-dimensional echocardiographic calculation of left ventricular volume and ejection fraction with other imaging techniques in humans,18-20 but prolonged analysis time still limits its routine use.
The aim of this study was to validate a modified precordial rotational three-dimensional echocardiographic method for rapid and accurate left ventricular volume and ejection fraction calculation, Magnetic resonance imaging was used as the reference method.
SUBJECTS and METHODS Study popUlation.
Three-dimensional echocardiography was pelformed in 40 subjects with no contraindication for magnetic resonance imaging and with adequate echocardiographic quality (assessed by checking the three staudard apical views). Subjects included (a) IS normal volunteers and (b) 25 patients with ischaemic heart disease (10 with global hypokinesis and 15 with segmental wall motion abnormalities including 4 with apical aneurysm). Subjects included 31 men; ranged in age from 26 to 72 years with a mean age of S2 ± 16.5 years.
Informed verbal consent was obtained from each subject after they were given a full explanation of the procedure. In each subject magnetic resonance imaging for left ventricular volume and ejection fraction calculation was pelformed followed by a three-dimensional echocardiographic study on the same day.
MAGNETIC RTESONANCE IMAGING Magnetic resonance imaging was performed at O.S T (Gyrosean TS-II Philips Medical
Systems. The Netherlands). First, axial coronal and sagittal spin-echo localizing views were acquired. Multislice multiphase ECG-triggered Tl weighted fast field echo {repetition time =

74 CHAPTER 6
800-1200 ms, echo time = 22m8, t1ip angle = 70', field of view 240 x 300 mm' slice thickness 9 111111, inter slice gap 0.9 nun, imaging matrix (90 x 128)} was performed. Heart phase interval was 32-39ms and the number of heart phases 14-32 (median 21).
The window level and width of all magnetic resonance imaging in every subject were selected for the optimal contrast between the relatively hypointense ventricular waH and the relatively hyperintense blood in the ventricular cavity. A short axis view was performed with a coronal and a sagittal survey. On the best linages the short axis slices were positioned perpendicular to the septum.
Left ventricular volume measurements were done off line on a work station (Gyrovicw HR). End-diastole was defined as the time frame with maximal left ventricular volume. Endsystole was defined as the time frame with minimal left ventricular volume. End-diastolic and end-systolic left ventricular volume, stroke volume and ejection fraction were calculated by lllanual endocardial tracing of the short axis series spanning the left ventricle from the apex to the base.
THREE· DIMENSIONAL ECHOCARDIOGRAPHY Echocardiographic studies were performed with a transducer system in the apical
position, while the subject lay comfortably in the 45-degree left recumbent position. To acquire the cross-sectional images for reconstmction, the operator has to find the centre axis around which the imaging plane is rotated to encompass the whole left ventricular cavity. Reconstruction of the left ventricle by three~dilllensional echocardiography requires three basic steps: image acquisition, image processing, and data analysis. Image acquisition: We used a custom-build hand-held transducer assembly that can be rotated with a step motor via a wheel-work interface2J
.22 A commercially available 3.75 :MHz
sector scanning transducer (Toshiba Sonolayer SSH-140A system) is mounted in the probe assembly. The step-motor is cOillmanded by a steering-logic for controlled image acquisition (Echo-scan, TomTec GmbH, Munich, Germany).A software-based steering logic activates the step-illotor in the transducer assembly which controls the image acquisition in a given plane by an algorithm that considers both heart rate variations (ECG-gating) and respiratory phase by thoracic impedance measurement. Prior to the actual image acquisition the R-R intervals were predetermined with an acceptable variability of 150 msec or less and respiration was gated at the end-expiratory phase. Based on this information, the step-motor is commanded by the steering logic to acquire cross-sections of cardiac cycles that t~lll within the preset ranges. TillS allows optimal temporal and spatial registration of the cardiac images. The heart phases were adjusted at 12 phases/cardiac cycle. After a cardiac cyclc is selected by the steering logic, the cardiac images arc sampled at 80 msec intervals (12 frames/sec), digitized, and stored in the computer memory. Then, the step motor is activated and rotates the transducer 2 degrees to the next scanning plane, where the same steering logic is followed. Cycles that do not meet the preset ranges are rejected. To fill the conical data volume, 90 sequential cross-sections from 00 to 1780 must be obtained each during a complete cardiac cycle. Image processing: The recorded images are formatted in their correct rotational sequence according to their ECG phase in volumetric data sets (256*x256*x256* pixel/each 8 bit).

PARAPLANE 3DE YS MRI FOR L VV AND EF 75
The post-processing of the data sets is performed off-line using the analysis program of the system. To fill the gaps in the far fields, a "trilinear cylindric interpolation" algorithm is used. 2o To reduce motion artefacts that can be created by patient movement or probe movement, a dedicated ullage processing tilter is used (ROSA filter: Reduction of Spatial Artefacts), In order to reduce the time needed for image processing, end-diastolic (the first frame before mitral valve closure) and then end-systo1ic (the first frame before mitral valve opening) phases are selected before starting the processing procedure. Through tltis technique we reduce the llnage processing time to be 5 minutes, which represents approximately 20% of the usual time needed for processing the whole data set.
Figure 1. The principle of LVV measurement using a 3DE-A method, from the 30E data set an end-dia~tolic and end-systolic long-axis views arc used as a reference view. The left ventricle is sliced at equidistant intervals (2.9mm) to generate a series of short axis views. The surface area of each cross-section is measured by planimetry and the volume of each slice is calculated. Adding up the volumes of all slices provides the measurement of LVV (Simpson's method). This is performed for both end-diastolic and end-systolic data sets. TIle figure shows an enddiastolic and end-systolic long axis views (panel A, upper and Imver image respecth'ely) on which the transverse sector I and 2 respecth'ely cut the left ventricular cavity at this level to give rise the corresponding short-axis views at end-diastole and end-systole shown in panels B upper and lower images respectively.
Image analysis. Left ventricular volume and ejection fraction are calculated from the threedimensional echocardiographic data set by using Simpson's lUle. By this method enddiastolic and end-systolic left ventricular volume are calculated by manual endocardial tracing of sequential short-axis views spanning the left ventricular cavity from the apex to the mitral annulus. After the long-axis view of the left ventricle was selected from the volumetric data set, end-diastolic and then end-systolic phases were loaded and reflected

76 CHAPTER 6
around the selected long axis. Slicing of the left ventricular cavity was performed by using the "fixed slice thickness" (method 3DE-A) using the paraplane technique to generate a series of equidistant cross-sections at 2.9-mm intervals and a "fixed Humber of slices " (method 3DE-B) a rapid paraplane method using 8 parallel equidistant slices at both enddiastole and end-systole. For both methods, when manual tracing of the displayed short-axis was completed, the system calculated the volume by slimming the voxels included in the traced area in the pre-set slice thickness. Slice by slice, the system summed the corresponding suhvolumcs and finally calculated the end-diastolic and end-systolic left ventricular volume and ejection fraction (figures 1-2).
(A) (B) (C)
Figure 2. The principle of LVV measurement using a 3DE-B method, from the 3DE data set an end~diastolic and cnd-systolic long-axis view is used as a reference view. The left ventricle is sliced by the paraplane analysis into 8 equidistant parallel short axis slices that spanning the left ventricular cavity from the apex to mitral annulus (panel A). The surface area of each cross-section is measured by planimetry and the volume of each slice is calculated (panel B). Adding up the volumes of all slices provides the volume measurement of LVV at end-diastole and endsystole (Simpson's method) (panel C shows the reconstructed left ventricular cavity).
STATISTICAL ANALYSIS For each technique measurement of left ventt-lcular volume and ejection fraction were
pelformed by two experienced observers blinded to each other's results and the first observer repeated the measurement after at least 7 days. Observer variability was calculated, and expressed as the standard error of the estimate (SEE).
To compare the calculation of end~diastolic and end-systolic left ventricular volume and ejection fraction by 3DE-A and -B methods with magnetic resonance imaging the limits of agreement were computed using the method described by Altman and Bland.23 A paired t-test lVas petformed and significance was stated at the 0.05 probability level. The p-value, the mean difference and the limits of agreement are reported. Pearson's correlation coefficients are presented.

PARAPLANE3DEvsMRI FORLVV AND EF
RESULTS Feasibility
77
40 subjects out of 53 recruited in this study completed both three-dimensional echocardiography and magnetic resonance imaging. For three-dimensional echocardiography, 4 patients were excluded from the study (l for an error in calibrating the central rotational axis for image acquisition, and 3 for poor uninterpretable echocardiographic unage). While for magnetic resonance imaging. 9 patients were excluded from the study (4 due to claustrophobia and 5 due to incomplete magnetic resonance imaging acquisition). All subjects included in tlus study wcre in sinus rhythm, the mean ± SD of their heart rate was 79± 9.5. In each case the time required for three-dimensional echocardiographic acquisition, processing and image analysis for both 3DE-A and 3DE-B are in table I. With method 3DE-B the average slice tIuckness (mm) ± SD were 9.9±0.6 and 8.1 ±0.9 for end-diastole and end-systole respectively.
Table I. Comparison of the time required for all procedures of 3DE-A (using 2.9-111111 §.lice thickness) and 3DE-B (using 8 parallel eq,uidistant slices) methods. Procedure Time Required for Time Required for Time Required for
_:-:-:--_-;;.3D""!':A (",m",i",n),-__ . ~DE-B (min) MRI (min) Image Acquisition 8 - 10 8 - 10 40 - 50 Calibration and 3 3 5 Image Processing 20 - 25 4 - 6 20 LVVanalysis 30 - 40 10 30 - 40 Tot~al~ __ ~ __ ~~6~1~-~7~8~ __ ~ __ ~2~5~-;""2~9~ ______ .~~9~5=-~1~15~ __ ~~ 3DE = three-dimensional cchocardiography. MRI = magnetic resonance imaging, LVV::::: end-diastolic and end-systolic left ventricular volumes.
Table 2. Observer variabilities ofMRI and 3DE-B for calculating LV end-diastolic volume (EDV) and end-systolic volume (ESV) and ejection fraction (EF) for the whole group as well
~ as for t and 2 sub~rouEs. All Patient n-40 Nonllllls..l n-I 5 EatiCllls 2 1}-2S
Observer Variability SEE C-SEE(%) SEE C-SEE(%) SEE C-SEE(%) EDV Intra. 6.3 3.5 6.5 5.8 3.9 1.8
Inter. 13.6 7.5 10.6 9.4 15.2 6.8 MRI ESV Intra. 4.7 3.9 6.4 13.6 3.2 2.0
Inter. 1l.5 9.6 7.5 16.0 14.7 9.1 EF Intra. 2.1 5.4 3.3 5.7 1.2 4.4
Inter. 4.7 12.2 9.8 16.9 2.0 7.4 EDV Intra. 3.1 1.7 3.0 2.7 3.3 1.5
Inter. 6.2 3.4 6.6 5.9 3.9 1.7 3DE-B ESV Intra. 4.4 3.6 5.1 10.9 3.1 1.9
Inter. 3.8 3.1 6.8 14.5 2.5 1.5 EF Intra. 2.2 5.8 3.4 6.0 0.6 2.2
Inter. 3.6 9.5 5.8 10.2 0.9 3.3 SEE = standard error of the estimate, C-SEE = corrected SEE to the mean value, Intra. = intraobservcr, hlter = interobservcr, other abbreviation as table 1.
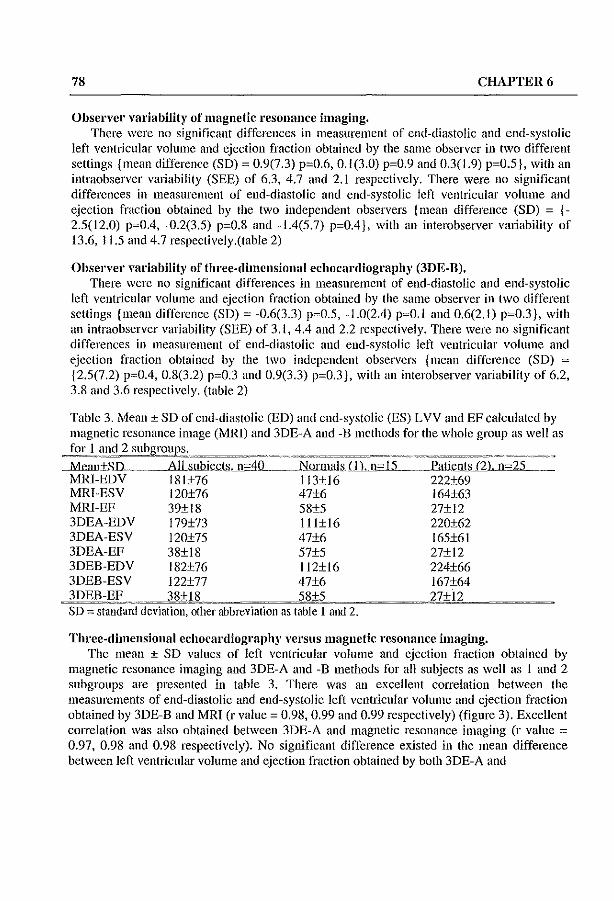
78 CHAPTER 6
Observer variability of magnetic resonance imaging. There were no significant differences in measurement of end-diastolic and end-systolic
left ventricular volume and ejection fraction obtained by the same observer in two different settings {mean difference (SD) ~ 0.9(7.3) p~0.6, 0.1(3.0) p~0.9 and 0.3(1.9) p~0.5}, with an intraobserver variability (SEE) of 6.3, 4.7 and 2.1 respectively. There were no significant differences in measurement of end-diastolic and end-systolic left ventricular volume and ejection fraction obtained by the two independent observers {mean difference (SD) = {-2.5(12.0) p~O.4, -0.2(3.5) p~0.8 and -1.4(5.7) p~O.4), with an interobserver variability of 13.6, 11.5 and 4.7 respectively.(table 2)
Observe,' variability of three-dimensional echocardiography (3DE-B), There were no significant differences in measurement of end-diastolic and end-systolic
left ventricular volume and ejection fraction obtained by the same observer in two different settings {mean difference (SD) ~ -0.6(3.3) p~0.5, -1.0(2.4) p~O.1 and 0.6(2.1) p~0.3), with an intraobserver variability (SEE) of 3. t. 4.4 and 2.2 respectively. There were no significant differences in measurement of end-diastolic and end-systolic left ventricular volume and ejection fraction obtained by the two independent observers {mean difference (SD) :::: {2.5(7.2) p~O.4, 0.8(3.2) p~0.3 and 0.9(3.3) p~O.3), with an interobserver variability of 6.2, 3.8 and 3.6 respectively. (table 2)
Table 3. Mean ± SD of end-diastolic (ED) and end-systolic (ES) LVV and EF calculated by magnetic resonance image (MRI) and 3DE-A and -B methods for the whole group as well as
I 2 ....Mean±,sn .. __ .....AILsubiecls,.Jl='IO __ .Norlnals.LlLjj.~-~L~S __ .. l'atie.nls_(2}, n~25
MRl-EDV 181±76 113±16 222±69 MRI-ESV 120±76 47±6 164±63 MRI-EF 39±18 58±5 27±12 3DEA-EDV I 79±73 1l1±16 220±62 3DEA-ESV 120±75 47±6 165±61 3DEA-EF 38±18 57±5 27±12 3DEB-EDV I 82±76 112±16 224±66 3DEB-ESV 122±77 47±6 I 67±64 3DEB-EF 38+18 58+5 27+12 SD := standard deviation, other abbreviation as table 1 and 2.
Three-dimensional echocardiography versus magnetic resonance imaging. The mean ± SD values of left ventricular volume and ejection fraction obtained by
magnetic resonance imaging and 3DE-A and -B methods for an subjects as well as I and 2 subgroups are presented in table 3. There was an excellent correlation between the measurements of end-diastolic and end-systolic left ventricular volume and ejection fraction obtained by 3DE-B and MRI (r value ~ 0.98, 0.99 and 0.99 respectively) (figure 3). Excellent cOHelation was also obtained between 3DE-A and magnetic resonance imaging (r value :::: 0.97, 0.98 and 0.98 respectively). No significant difference existed in the mean difference between left ventricular volume and ejection fraction obtained by both 3DE-A and

PARAPLANE 3DE \'s MRI FOR L VV AND EF 79
-B methods magnetic resonance imaging. In addition, there were close limits of agreement between the measurements of left ventricular volume and ejection fraction obtained by 3DEA and -B methods with magnetic resonance imaging (figure 4) (table 4).
Correlation Between 3DE-B and MRI For L VV and EF Calculation
Left Ventricular Volume
"'IRILYV(ml)
(A)
EDVr=Ql'l L>,',~O"J
Left V('ntricular Ejection Fraction
r~(l'il
.~,:=ili. 01'.ri.T"
" " MRlLVEF(':1:)
(8)
Figure 3. Linear regression of end-diastolic and end-systolic LVV (panel A) and EF (panel B) calculated by 3DE-B method using 8 short axis slices versus IvIRI. n = number of subjects, r = correlation coefficient. The dashed line represents the identity line.
Table 4. Comparison between both 3DE-A and 3DE-B with MRI for calcnlating ED and ES LVV and EF.
===~?~-~~="
MRl-3DEA MRI- 3DEB r MD±SD l' Agreel~. r MD+SD l' Agrecm.
EDV 97 1.4±18.3 0.5 1.4±36.6 98 - J.3±I3.3 0.6 -1.3±26.6 All ESV 98 -0.6±13.4 0.4 -0.6±26.8 99 -1.6±10.6 0.8 -1.6±21.2
EF 98 0.6±4.0 0.6 0.6±8.0 99 0.2±2.6 0.4 0.2±5.2 EDV 96 1.7±4.8 0.1 1.7±9.6 99 0.9±2.3 0.2 0.9±4.6
Nannal ESV 94 -0.6±J.9 0.2 -0.6±3.8 93 -0.7±2.1 0.2 -0.7±4.2 EF 9S 0.7±1.7 0.1 0.7±3.4 97 0.6±1.4 0.1 0.6±2.8 EDV 94 1.2±23.1 0.4 1.2±26.2 97 -2.6±16.7 0.8 -2.6±33.4
Patient ESV 96 -0.6±17.0 0.4 -0.6±34.0 98 -2.1±13.4 0.9 -2.1±26.8 EF 92 0.5+4.9 0.9 0.5+9.6 96 ___ 00.03+3.1 0.6 -0.03+6.2
r = correlation coefficient, MD ::::: mean difference, SD = standard deviation of the mean differences, p. = p value, agrecm. = limits of agreement, other abbreviation as table 1 and 2.

80
Limits of Agreement Between 3DE-B and MRI
For L VV and EF Calculation
CHAPTER 6
Ldl Ventricular End·diastollc Volume tt'ft Ventricular End-systolic Volume I.dt Ventricular Ejection Fraclion
(A) (B) (C)
Figure 4. Limits of agreement of end-diastolic (pancl A), end-systolic (pancl B) LVV and EP (panel C) calculated by l\ofRI - 3DE-B method using 8 short a.xis slices. Difference of each pair of MRl - 3DE-B end-diastolic, endsystolic L VV and EF measurements plotted against the average value of both measurements.
DISCUSSION Calculation of left ventricular volume and ejection fraction is important for the evaluation
of patients with heart disease. Segmental wall motion abnormality and left evntricular aneurysm arc common complications of acute myocardial infarction.
Quantification of left ventricular volume by two-dimensional echocardiography are limited by its hctcrogeneous geometry, which restricts application of simple geometric models which assume symmetrical shape?4-26
Three-dimensional echocardiography provides an accurate measurement of left ventricular volume and function by the reconstruction of the true left ventricular geomehy, but remains time consuming. Tllis study was peif0l111ed to validate the 3DE-B as a rapid method for left ventricular volume and ejection fraction calculation against magnetic resonance imaging. Our results demonstrate an excellent correlation and close limits of agreement bctween left ventricular volume and ejection fraction measured by threcdimensional echocardiography using two different methods (A and B) and magnetic resonance imaging for the whole subjects recruited in this study as well as for (a) and (b) subgroups (table 4). Thus, with the rapid 8 parallel equidistant slice method we have achieved at least the same accuracy as with the time consuming 2.9-mm fixed slice thickness method.

PARAPLANE 3DE YS MRI FOR LVV AND EF 81
In average for 3DE-B the analysis time was reduced from 40 to 10 minutes, in addition the required time for the whole 3DE-B procedures were reduces to 25% of that required for 3DEA method (table I).
Comparison with other studies Our findings are in agreement with the study conducted by Gopal et al.,18 who compared
end-diastolic and end-systolic left ventricular volume and ejection fraction in 15 normal volunteers measured by magnetic resonance imaging and three-dimensional echocardiography. These authors calculated their echocardiographic left ventricular volume from a series of (8 to 9) nonparallel, unequally spaced real-time parasternal short-axis images which were acquired with a linc-of-intersection display as a guide. This line is computed and displayed in each image to indicate the position and orientation of that image with respect to the other image. All images for ventricular reconstruction are acquired during suspended respiration. A polyhedral surface reconstruction algorithm has been adapted for left ventricular volume computation using the traced endocardial borders of the short axis images. The interobserver variability for three-dimensional echocardiography was 5% and 8%, while that magnetic resonance imaging was 6.6% and 9%. Both methods were in close agreement for end-diastolic volume (r = 0.92, SEE = 6.99 ml) and for end-systolic volume (r = 0.81, SEE = 4.01 mI).
Sapin et aI.,19 studied two- and three-dimensional echocardiography in 35 patients 1 to 3 hours before left ventricular cine ventriculography and used the same method described by Gopal et aI., n; for three-dimensional echocardiography. The correlation and limits of agreement between end-diastolic and end-systolic left ventricular volume mcasured by threedimensional echocardiography and cincvcntriculography is better than between twodimensional echocardiography and cine ventriculography . Howevcr, they did not find an improvemcnt in calculating ejection fraction by three-dimensional echocardiography over two-dimensional echocardiography. They explained this by the possible balance in volume error calculations of end-diastolic and end-systolic volume by two-dimensional echocardiography and cineventriculography. These errors were nullified when calculating ejection fraction. On the other hand end-diastolic and end-systolic volume errors by threedimensional echocardiography were not correlated because they were derived from multiple cardiac cycles from which enors of ejection fraction were obtained.
Our results demonstrated excellent correlation and close limits of agreement between three-dimensional echocardiography and magnetic resonance imaging for calculating both left ventricular volume and ejection fraction. Differences in methodology22 may in part explain the discrepancy between our results and those of Sapin et al. 19 In addition, this can be attributed to the different reference method used by Sapin et aI., the cineventriculography.
Three-dimensional echocardiography has been shown to yield accurate left ventricular volume with comparison to actual volumes in the in vivo study conducted by Jiang et al.,27 using 4 dogs with surgically created left ventricular aneurysms. They found that, left ventricular end-diastolic, end-systolic, stroke volumes and ejection fraction calculated by three-dimensional ecllocardiogrnphy correlated well with actual values (r=0.99, 0.99, 0.95 and 0.99 respectively) and agreed closely with them (SEE=4.3 cm', 3.5 cm', 1.7 cm3 and 2% respectively).

82 CHAPTER 6
Three-dimensional echocardiography 'lith 8 short axis slices is optimal for accurate left ventricular volume aud ejection fraction calculation
The mean ± SD of slice thickness \vith 3DE-B, using 8 equidistant parallel slices, were within the recommended limits for slice thickness previously reported. Accurate left ventricular volume and ejection fraction requires a slice thickness of less than 15_mm.2o
Tllis was also in agreement with the previous recommendation of \Veiss et al}8 for accurate and reproducible two-dimensional echocardiography calculation of left ventricular volume by Simpson's rule. They used different progressively decreasing number of short axis slices (from 19 to 1) and concluded that high accurate volumes with low variability in measurement can be obtained, but this accuracy begins to deteriorate significantly when fewer than four cross sections C>15-mm thickness) were used.
Siu et al.,29 studied the influence of number of component images on accuracy of left ventricular volume quantitlcation by three-dimensional echocardiography using the nonparallel intersecting images. They concluded that, accurate calculation of left ventricular volume and ejection frnction can be obtained by three-dimensional echocardiography with as few as 8 to 12 nonparallel intersecting images.
In our study, there were closer limits of agreement and comparable intraobserver and interobserver variability between 3DE-B method and magnetic resonance imaging for left ventricular volume and ejection fraction calculation. This can be explaincd by the fact that both methods calculate left ventricular volume using Simpson's rule with almost the same slice thickness. We therefore recommcnd the use of paraplane analysis from threedimensional echocardiography with 8 equidistant parallel slices for rapid, reproducible and accurate left ventricular volume and ejection fraction calculation.
Advantages and limitations of 3DE in this study Three-dimensional cchocardiography allows the calculation of left ventricular volume
without geometric assumption. The prolonged analysis time which was the most important limiting factor that currently restricts the routine use of three-dimensional echocardiography, is now partially solved by using the rapid analysis method with 8 parallel equidistant short axis slices. In future, developing fastcr computers and applying automated border recognition software for area and volume analysis technique will shortell more the time needed for threedimensional echocardiographic procedures.
Since the spatial co-ordinate system changes with transducer movement, motion of the transducer must be avoided. Inadvertent patient movement during the image acquisition can be prevented for the most part by thoroughly explaining the procedure before the study, in addition a dedicated linage processing filter is used (ROSA fIlter: Reduction of Spatial Artefacts),
Precordial rotational three-dimensional echocardiographic acquisition from the apical window necessitate the identification of the longest left ventricular long axis around which data wm be acquired. However, sometimes its identification was not possible and the left ventricle was foreshortened because of rib interference and Harrow intercostal space. \Vith 3DE-B method we have achieved accurate left ventricular volume and ejection fraction calculation within acceptable time consumption.

PARAPLANE3DEvsMRIFOR LVV AND EF 83
Using 1.5 T magnetic resonance imaging with breath-hold and scmiautomated border detection algorithm provides better image resolution, shortens the procedure and reduce motion and respiratory artefacts.
CONCLUSIONS 3DE-A and -B methods have excellent correlation and close limits of agreement with
magnetic resonance imaging for calculating left ventricular volume and ejection fraction in both normal subjects and cardiac patients with segmental wall motion abnormalities and global hypokinesis. 3DE-B method using parapiane analysis with 8 equidistant short axis slices has similar observer variability as magnetic resonance imaging, reduces the threcdimensional echocardiographic analysis time to 10 minutes and therefore offers a rapid, reproducible and accurate method for left ventricular volume and ejection fraction calculation.
REFERENCES. Becker LC, Silverman KS, Bulkley BH, Kallman CH, Mcllits ED, Wcisfeldt M. Comparison of carly thallilllll-201 scintigraphy and gatcd blood pool imaging for predicting mortality in patients with acute myocardial int~'lrction. Circulation 1983;67:1272-82.
2 Pfeffer MA, Braul1wald E, Moye LA et al. Effect of captopril on mortality and morbidity in patients with left ventricular dysfunction after myocardial infarction. N Eng J IVIed 1992;327:669-77.
3 Hains AD, Khawaja IA, Lahiri A, Rnftery FE. Rndiol1uc1ide left ventricular ejection fraction: a comparison of three methods. Br Heml J 1987;57:232-6.
4 Shah PK, Picher M, Bcrman OS, Singh BN, Swan HJe. Left ventricular ejection fmction determined by radionuclide ventriculography in early stages of first transmural myocardial infarction. Am J CardioI1980;45:542-6.
5 Arvidsson H. angiocnrdiographic determination of left ventricular volumc. Acta Radial 1961 ;56:321-339.
6 Sandler H, Dodge HT. The use of single plane angiocardiograms for the calculation of left ventricular volume in man. Am Heart J 1968;75:325-334.
7 Dilworth LR, Aisen AM, !vIancini GBJ, Lnnde I, Blida AJ. Determination of left vcntricular volumes nl1d ejection fraction by magnetic resonance imaging. Am Hcart J 1987; 113:24-32.
8 Debatin JF, Nadel SN, Paolini JF ct al. Cardiac ejection fraction phantom study comparing cineMRI, radionuclide angiography and contrast ventriculography. J rvIagell ReSOll Imaging 1992;2:135-42.
9 Van Rossum AC, Visser FC, Sprenger lVI, Vnn Eenige IVI1, Vnlk J, Roos JP. Evaluation of magnetic resonance imaging for determination of left ventricular ejection fraction and comparison with angiography. Am J Cardiol 1988; 62:628-33.
to \VyaH I-ll.., Heng r't'IK, Meerbaull1 S, Glleret P, Hestenes J, Dliin E, Corday E. Cross-sectional echocardiography. Analysis of mathematic models for quantifying volume of the formalin-fixed left ventricle. Circulation 1980;61: 1119-25.
11 Schajsira IN, Kohn MS, Beaver WI, Popp RL. In vitro quantification of canine left ventricular volume by phased-army sector scan. Cardiology 1981 ;67: 1-11.
12 Garrison JB, \Veiss JL, Maughan \\,L, Tuck OM, Guier \VII, Fortuill NJ. Quantifying regional wall motion and thickening in two-dimensional echocardiogmphy with a computer-aided contouring system. In Ostrow H, Ripley K, eds: Proceedings in Computerized Cardiology, Long Beach, CA., I 977;p 25.

84 CHAPTER 6
13 'Veiss JL, Eaton LW. Manghan WL et al. Ventricular size and shape by two-dimensional echocardiography. Ped Proc 1981;40:2031-36.
14 Sill se, Rivera 1M, Guerrero JL et a1. Three-dimensional echocardiography: In vivo validation for left ventricular volume and function. Circulation 1993; 88,4,1: 1715-23.
15 Handschumacher MD, Lethor JP, Sill SC et al. A new integrated system for three dimensional echocardiographic reconstruction: development and validation for ventricular volume with application in human subjects. J Am Coli CardioI1993;21:743-753.
16 King DL, King DL Jr, Sima MY-c. Evaluation of in vitro measurement accuracy of a threedimcnsiollalultrasolll1d scanner. J Ultrasound Med 1991; 1 0:77-82.
17 Moritz WE, Pearlman AS, McCabe DR, Medema DK, Ainsworth :ME, Boles MS. An ultrasonic technique for imaging the ventricle in three dimensions and calculating its volume. IEEE Trans Biomed Eng 1983;30:482-92.
18 Gopal AS, Keller AM, Rlgling R, King DL, King DL. Left ventricular volume and endocardial surface area by three-dimensional echocardiography: comparison with hvo-dimellsional echocardiography and nuc1ear magnetic resonance imaging in llomlai subjects. J Am Coll Cardiol 1993;22:258-70.
19 Sapin PM, Schroder Ki\l, Gopal AS, Smith ?'t'ID, DeMaria AN, King DL. Comparison of two- and three-dimensional echocardiography with cillevenlriculogmphy for measurelllent of left ventricular volume in patients. 1 Am ColI Cardiol 1994;24 :1054-63.
20 Nosir YFM, Fioretti PM, Yletter \VB et al. Accurate measurements of left ventricular ejection fraction by three-dimensional echocardiography: a comparison with radionuc1ide angiography. Circulation 1996;94,:460-466.
21 Roelandt 1, Salustri A, Yletter W, Nosir Y, Bruining N. Precordial multiplane echocardiography for dynamic anyplane, paraplane and three-dimensional imaging of the heart. Thoraxcentre 1 1994;6:4-13
22. Salustri A, Roelandt 1. Ultrasonic three-dimensional reconstruction of the heart. Ultrasound in Med & BioI 1995; 21:281-293.
23 Altman DG, Bland 1M. Measurement in medicine: the analysis of method comparison studies. Statistician 1983;32:307-17.
24 Amico AF, Lichtenberg GS, Reisner SA, Stone CK, Schwartz RG, Meltzer RS. Superiority of visual versus computerized echocardiographic estimation of radionuclide left ventricular ejection fraction. Am Heart J 1989; 118: 1259-1265.
25 King DL, Harrison MR, King DL lr, Gopal AS, Kwan 01, DeMaria AN. Ultrasound beam orientation during standard two-dimensional imaging: assessment by three-dimensional echocardiography.l Am Soc Echocardiogr 1992;5:569-576.
26. Schroeder K, Sapin PM, King DL, Smith MD, DeMaria AN. Three-dimensional echocardiographic volume computation: in vitro comparison to standard hvo-dimensional echocardiography. J Am Soc Echocardiogr 1993;6:467-75.
27 liang L. DePrada lAY, Randschumacher MD et al. Quantitative three-dimensional recollstmction of aneurysmal left ventricles: In vitro and in vivo validation. Circulation 1995;91 :222-30.
28 Weiss lL, Eaton LW, Kallman CH, Maughan WL. Accuracy of volume detemlil1ation by twodimensional echocardiography: defining requirements under controlled conditions in ejecting caninc left ventriclc. Circulation 1983;67:889-895.
29 Sill SC, Rivera 1M, Randschumacher MD, \\'eyman AB, Levine RA, Picard MR. Threedimensional echocardiography: the influence of number of component images on accuracy of left ventricular volume quantification. 1 Am Soc Echocardiogr 1996;9:147-155.

3DE DAY -TO-DA Y AND OBSERVER VARIABILITY 85
CHAPTER 7
MEASUREMENTS AND DAY TO DA Y VARIABILITIES OF LEFT VENTRICULAR VOLUMES AND EJECTION
FRACTION BY THREE-DIMENSIONAL ECHO CARDIOGRAPHY AND COMPARISON WITH
MAGNETIC RESONANCE IMAGING
Youssef FM Nosir MD*, Maarten H Lequin MD, Jaroslaw D Kasprzak MD, Ron T. van Domburg MSc, Wim B Vletter BSc, Jiefen Yao MD,
Jaap Stoket· MD, Jos RTC Roelandt MD FACC.
From the Heart Center and Thoraxcenter, Division of Cardiology, University Hospital Rotterdam-Dijkzigt, Erasmus University, Rotterdam, The Netherlands *Cardiology Department, AI-Hussein University Hospital, Al-Azhar University. Cairo, Egypt.
Am J Cardiol. 1998;82:209-214

86 CHAPTER 7
ABSTRACT The aim of this study was to assess day-ta-day variability of left ventricular (LV) volume
and ejection fraction (EF) calculated from 3-dimensional echocardiography (DE) and to compare the reproducibility of the measurement with magnetic resonance imaging. 46 subjects were examined including 15 normal volunteers (group A) and 31 patients with LV dysfunction (group B), Precordial 3DE acquisition was performed at 2-degree rotational intervals and repeated olle week later. Magnetic resonance imaging was performed at 0.5 T. End-diastolic and end-systolic LV volume were derived lIsing Simpson's rule by manual endocardial tracing of 8 equidistant parallel LV short axis slices with 3DE, while 9-mm slices was used with magnetic resonance imaging. The mean±SO of end-diastolic and end-systolic LV volume (uti) and EP (%) from magnetic resonance imaging were (lS2±75, 121±76 and 39±18), wIllie those from 3DE were (lS2±76, 121±77 and 39±IS) respectively. Day-to-day measurements of end-diastolic and end-systolic LV volume, and EF from 30E were not significantly different with standard error of the estimate of (2.7, 1.1 and 2.4) respectively. Intra- and inter-observer standard error of the estimate for calculating end-diastolic and endsystolic LV volume and EF for magnetic resonance imaging were (6.3, 4.7 and 2.1) and (13.6, 11.5 and 4.7) respectively, wlille those for 3DE were (3.1, 4.4 and 2.2) and (6.2, 3.8 and 3.6) respectively. COllc[usio1l.fi, Oay-to-day variability of LV volume and EF calculation from 3DE were small and not significantly different for normal and dysfunctional left ventricles. Observer variabilities of 3DE were smaller than that of magnetic resonance imaging. Therefore, 30E is recommended for serial assessment of LV volume and EF in normal and abnormally shaped ventricles.
Left ventricular (LV) volume and function is affected in many clinical situations. Serial monitoring of LV volume and function changes is important for clinical decision making, prediction of the outcome in many cardiac disorders and following various medical or surgical interventions. 1-2 The currently used two-dimensional methods including angiography,J'7 radionuclide angiographl- IO and echocardiography ll-16 have to employ geometric assumptions for LV. Magnetic resonance imaging produces accurate measurement of LV volumes,17-19 but is not widely available. Three-dimensional echocardiography ODE) allows accurate LV volume and EF calculation by obviating geometric assUInptions?O.27 Few data are available concerning the reproducibility of LV volume and function assessment by volume rendered 30E using sequential data acquisition and day-ta-day variability of these measurements has not been investigated. Therefore, this study was designed to evaluate dayto-day variability of LV volume and EF from 30E and the accuracy and reproducibility of the measurements using magnetic resonance imaging as a reference.
SUBJECTS AND METHODS 30E and magnetic resonance imaging were performed in 46 subjects including 36 men
and 10 women (aged 51 ± 17 years, ranging from 26 to 72 years). Group A included 15 healthy volnnteers (aged 32 ± 7 years, men only). Group B included 31 patients (21 men and 10 women, aged 54 ± 18 years) with the diagnosis ofischaemic heart disease demonstrating

3DE DAY-TO-DAY AND OBSERVER VARIABILITY 87
either regional (n= 19) or global (n= 12) wall motion abnormalities. All subjects stndied were in sinus rhythm. The mean ± SD of their heart rate was 78 ± 10 beats / minutes. Informed verbal consent was obtained fro111 each subject after a fuB explanation of the procedure had been given. In each subject, magnetic resonance imaging of the left ventricle was performed, on the same day, as 3DE study. A second 3DE acquisition was peiformcd one week latcr in 15 patients. provided that the clinical conditions of the patient remained stable and no therapeutic changes were made between the 2 studies.
MAGNETIC RESONANCE IMAGING Magnetic resonance imaging was pClfonned at 0.5 T (Gyroscan TS-II Philips !\1edical
Systems, The Netherlands). Axial, coronal and sagittal spin-echo was lIsed to localize views of the left ventricle. The lllultislice multiphase electrocardiogram-triggered Tl weighted fast field echo was performed with a repetition time of 800-1200 ms. echo time 22ms, flip angle 70° and the field of view 240 x 300 mm. The level and width of magnetic resonance imaging window in every subject were selected to obtain an optimal contrast between the relatively hypointense ventricular wall and the relatively hyperintense blood pool in the ventricular cavity. The best images were chosen for data collection of short axis slices perpendicular to the septum following a coronal and a sagittal survey. Sequential images of the heart were collected using 9 lIUll slice thickness with 0.9 mm inter-slice gap and imaging matrix (90 x 128). Heart phase interval was 32-39 illS with the number of heart phases 14-32 (the median at 21). Left ventricular volume measurement was carried out off line all a work station (Gyroview HR) by two independent observers (MHL and JS) separately, both nnaware of the 3DE measurements. The end-diastole was defined as the frame with the largest LV cavity size and the end-systole the smallest LV cavity size. The endocardial border of the left ventricle was traced manually on all short axis views to derive end-diastolic and end-systolic LV volume and EF. The image acquisition required from 45 to 60 minutes. Image analysis required 30 minutes 011 average.
THREE-DIMENSIONAL ECHOCARDIOGRAPIDC EXAMINATION A commercially available ultrasound unit (Toshiba Sonolayer SSH-140A) with the
transducer frequency of 3.75 NfHz was coupled with a 3DE processing computer (Echo-scan, TomTec GmbH, Munich, Germany) for data acquisition.28
,29 The echocardiographic images of the left ventricle were collected from an apical window in rotational format at 2° intervals, gated to proper R-R intervals of electrocardiogram and thoracic impedance of expiration, while the patient was resting comfortably in a 45° left recumbent position. Images were readjusted in their correct spatial and temporal sequence and were reformatted digitally. Gaps between the images of end-diastolic and end-systolic phases were interpolated using a "trilinear cylindric interpolation" algorithm. 26 A voxel based volumetric data set was thus resulted.
From the 3DE data set, the end-diastolic and end-systolic LV volumes were calculated off line by two independent observers (YFMN and JDK) on a 3DE work station (TomTec system Echo View 3.1) using Simpsonfs rule. After a reference LV long axis view was defined, 8 parallel equidistant short-axis slices spanning the LV cavity from the apex to the

88 CHAPTER 7
mitral annulus were derived automatically by the computer. The endocardial border of the left ventricle on each slice was traced in frames with biggest and smallest cavity areas. The volume was calculated automatically by the computer using a sUlllmation of the Yoxels included in the traced area. An accumulation of the subvolumcs on all slices yielded the LV volumes at end-diastole and end-systole. from which the EF was calculated. (figure 1) One of the observers (YFMN) repeated the same measurements after 7 days or longer. Data from the second 3DE acquisition was analyzed in the same manner by the same observer to examine day-la-day variability of LV volume and EF. In each case the examination, including the calibration procedures, selection of optimal gain setting and conical volume, and image acquisition, required approximately 8-10 minutes. Calibration and storage of the data in the computer memory required approximately 3 minutes. Off-line Ullage processing and analysis required on average 15 minutes ..
1 (A)
~ ........ . ... Figure I. The principle of left vcntricular yolume measurement using Simpson's rule with volume rendered threedimensional echocardiography. A long-a.xis view is selected as a reference image from the three-dimcnsional cchocardiographic data set. TIle left ventricle is sliccd by parapJane analysis method into 8 equidistant parallel short a.xis slices spanning the left ventricular cavit), from the apex to mitral annulus (panel A). The endocardial bordcr of the left vcntricle on each cross-section is traccd manually las the white labcl (lower panel from I to 8 short axis slices )}. The yolume of the traced region on each slice is calculated. Adding up the volumes of all slices provides the lcft vcntricular volume at a chosen phase (cnd-diastolc or end-systole). The rcconstructcd left ventricular cavit), is shown in (panel B).
STA TISTICAL ANALYSIS All values of the measurements were expressed as mean ± SD. To compare the
calculation of end-diastolic and end-systolic LV volume and EF by 3DE with magnetic resonance imaging, the limits of agreement were computed using the method described by Altman and Bland30
, A paired I-test was performed and significance was stated at the 0.05 probability level. The p-value, the mean difference and the lunits of agreement (mean differences ± 2SD) are reported. Pearson's correlation coefficients are presented.

3DEDAY-TO-DAY AND OBSERVER VARIABILITY 89
Intraohservcl' and interobserver variabilities were calculated as the standard error of the estimate (SEE). Illtraohserver and interobserver measurements and day-ta-day variability of end-diastolic and cnd-systolic LV volume and EF were studied by the limits of agreement using the method described by Altman and Bland,30 Statistical significance was defined at the 0.05 probability level. Pearson's correlation coefficients were derived.
RESULTS The mean ± SD of end-diastolic and end-systolic LV volumes and EF calculated by 3DE
and magnetic resonance imaging from all the subjects as well as from groups A and B are presented in table I. The results from both techniques showed excellent correlation (r = 0.98, 0.98 and 0.98) with close limits of agreement (Mean difference ± 2SD's)30 (-1.4±27, -1.5±21 and 0.2±5.1) and non-significant differences (p = 0.6, 0.7 and 0.5) for calculating LV enddiastolic and end-systolic volume and EF, respectively .(figure 2)
REPRODUCIBITY OF MAGNETIC RESONANCE IMAGING There were no significant differences between intraobserver measurements of end
diastolic and end-systolic LV volumes and EF (p=0.2, 0.1 aud 0.3) with the illtraobserver standard error of the estimate of 6.3, 4.7 and 2.1, respectively. Also, no significant differences were found between interobscrver measurements of end-diastolic and endsystolic LV volumes and EF (p=0.2, 0.1 and 0.4) with the interobserver variability of 13.6, Il.S and 4.7, respectively. Excellent correlation's and small limits of agreement were observed between intraobserver and interobserver measurements of LV volumes and EF by magnetic resonance imaging from all subjects as well as from groups A and B. (table 2 and figures 3,4)
REPRODUCIBILTY OF 3DE There was no significant difference bctwcen intraobserver measurements of end-diastolic
and end-systolic LV volumes and EF (p=OA, 0.6 and 0.3) with the intraobserver variability (SEE) of 3.1,4.4 and 2.2, respectively. Similarly no significant difference was found between interobservcr measurements of end-diastolic and end-systoHc LV volumes and EF (p=O.4, 0.5 and 0.6) with the interobserver variability of 6.2, 3.8 and 3.6, respectively, in all subjects. Groups A and B revealed similar results. There were excellent correlation and close limits of agreement between intraobserver and interobservcr measurements of LV volumes and EF by 3DE from all the subjects as well as from gl'Oups A and B. (table 2 and figures 3,4)
DAY -TO-DA Y VARIABILITY OF 3DE MEASUREMENTS No significant difference was found in day-to-day measurements of end-diastolic and
end-systolic LV volumes and EF with the mean difference (SD) of -1.2(11.3) (p=0.2), -0.9(9.3) (p=OA) and -0.5(4.2) (p=0.2) and the day-to-day variability (SEE) of 2.7, l.l and 2.4, respectively. There were excellent correlation and close limits of agreement between day-to-day measurements of LV volumcs and EF by 3DE from all the subjects as well as from groups A and B. (table 2 and figure 3)
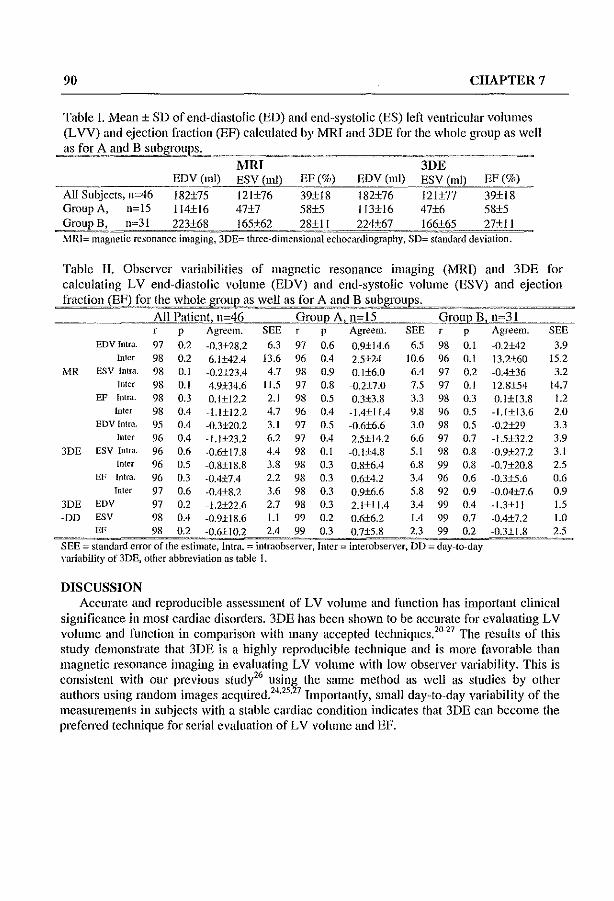
90 CHAPTER 7
Table I. Mean ± SD of end-diastolic (ED) and end-systolic (ES) leti ventricular volumes
(L VV) and ejection fraction (EF) calculated by MRI and 3DE for the whole group as well
as fo!~,~ ~nd B subgrouPL_ _ __ ~ __ ~~~~~~~~::: MRI 3DE
,-_---cc_-=EDV (ml) ESV (ml) EF (%) EDV (ml) ESV (ml) EF (%)
All Subjects, n~46 182±75 121±76 39±18 182±76 12l±77 39±18 Group A, n~15 114±16 47±7 58±5 113±16 47±6 58±5 ~oup !le, n~31 223+68,___ 165+62 _____ 28i;_1 __ ~__ 224+67~2§_t';~(j5 27+ 11
?vtRI= magnetic resonance imaging, 3DE= three-dimensional echocardiography, SD= standard deviation.
Table II. Observer variabilities of magnetic resonance imaging (MRD and 3DE for
calculating LV end-diastolic volume (EDV) and end-systolic volume (ESV) and ejection
fraction(Ell:)Jor _t!_l~ whole gro~l:ell as for A and B !22groups. _"_==~_=~"_~H __ ="'"==
------ All Patient, n-46 GroUl) A"_n-15 __ group B, n-31 p Agrecm. SEE p Agreem. SEE p Agreem.
EDVlntra. 97 02 -03±28_2 63 97 0.6 0.9±14_6 65 98 0.1 -0_2±42 Inter 98 0.2 6.1±42A 13.6 96 OA 2.5±24 10-6 96 0.1 13_2±60
I..,lR ESV Intra. 98 0.1 -0.2±23A 4_7 98 0.9 0.1±6_0 6A 97 02 -OA±36 Tnter 98 O.t 4_9±34.6 tt.5 97 0_8 -O.2±7.0 75 97 O.t 11.8±54
EF Intra. 98 03 O.I±I2.2 2_1 98 0.5 O.3±3.8 3.3 98 0.3 OJ±13.8 Inter 98 OA -1.l±12.2 4.7 96 OA -L4±IIA 9.8 96 05 -L1±13.6
EDV Intra. 95 OA -0.3±20.2 3.t 97 05 -0.6±6.6 3.0 98 05 -O.2±29 Inter 96 OA -1.I±23.2 62 97 OA 2_5±14_2 6_6 97 0.7 -1.5±32.2
3DE ESV Intra. 96 0_6 -0.6±17_8 4A 98 0.1 -0_1±4_8 5_1 98 0.8 -0_9±27_2 Inter 96 05 -0.8±t8.8 3.8 98 0.3 0.8±6A 6.8 99 0_8 -0_7±20.8
EF Intra. 96 03 -OA±7A 22 98 03 0_6±42 ]A 96 0.6 -0.3±5.6 Inter 97 0_6 -OA±82 3.6 98 0.3 0.9±6.6 5.8 92 0.9 -0_04±7.6
3DE EDV 97 0.2 -L2±22_6 2.7 98 03 2_1±IL4 ]A 99 0.4 -L3±11 -DD ESV 98 OA -0.9±t8.6 I.t 99 0.2 O.6±6.2 1.4 99 0_7 -0.4±7.2
EF 98 0.2 -0_6±102 2A 99 0.3 O.7±5.8 23 99 0.2 -03±1.8 SEE _ standard error of the estimate, Intra. - inlraobservcr, Inter _ interobservcr, DD _ day-Io-day variability of 3DE, other abbreviation as table I.
DISCUSSION
SEE 3_9
t5_2 3.2
14.7 1.2 2_0 3.3 B 3_1 25 0.6 0_9 1.5 1.0 25
Accurate and reproducible assessment of LV volume and function has important clinical significance in most cardiac disorders. 3DE has been shown to be accurate for evaluating LV volume and function in comparison with many accepted techniques. 2
0-27 The results of tlus
study demonstrate that 3DE is a highly reproducible technique and is more favorable than magnetic resonance imaging in evaluating LV volume with low observer variability. This is consistent with our previous study26 using the same method as \vell as studies by other authors using random images acquired. 24
•25
,27 Importantly, small day-to-day variability of the measurements in subjects with a stable cardiac condition indicates that 3DE can become the preferred technique for serial evaluation of LV volume and EF.
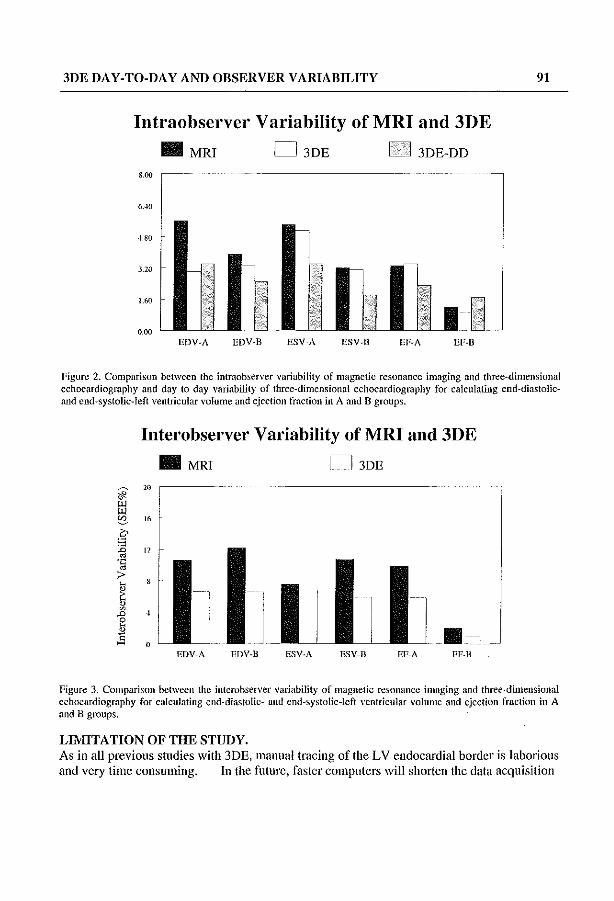
3DE DAY-TO-DAY AND OBSERVER VARIABILITY 91
Intraobserver Variability of MRI and 3DE
• MRI D 3DE Ie I 3DE-DD
800
6...10
4.80
3.20
1.60
0.00 .. ~ EDV-A EDV-B
Figure 2. Comparison between the intraobscrver variability of magnetic resonance imaging and three-dimensional echocardiography and day to day variability of three-dimensional echocardiography for calculating end-diastolicand end-systolic-Ieft ventricular volume and ejection fraction in A and B groups.
Interobserver Variability ofMRI and 3DE
• MRT n 3DE
20
16
12
o .,
EDV-A EDV-B ESV-A ESV-B EF-A EF-B
Figure 3. Comparison between the inlerobserver variability of magnetic resonance imaging and three-dimensional ecbocardiography for calculating end-diastolic- and cnd-systolic-Ieft ventricular volume and ejection fraclion in A and B groups.
LIMITATION OF THE STUDY. As in all previous studies with 3DE, manual tracing of the LV endocardial border is laborious and very time consuming. In the future, faster computers will shorten the data acquisition

92 CHAPTER 7
time and application of automated border detection aJgorithms will faci1itate its application in routine studies. For practical reasons, we did not repeat magnetic resonance imaging for comparison with the second 3DE acquisition and for studying day-la-day variability of this method. However, the present measurements have proven the reliability of 3DE for serial assessment of LV volumes and EF.
REFERENCES. 1 Sandler H, Dodge HT. Hay RE, Rackley CE. Quuntitation of valvular insufficiency in man by
angiocardiography. Am Heart J 1963;65:501-13. 2 Dodge HT, Kennedy JW, Peterson JL. Quantitative angiocardiographic methods of in the
evaluation of valvular heart disease. Prog Cardiovusc Dis 1973;16: 1-23. 3 Arvidsson H. allgiocardiographic determination of left ventricular volume. Acta Radiol
1961 ;56:321-39. 4 Sandlcr H, Dodge HT. The use of single plane angiocardiograms for the calculation of Icft
ventricular volume in man. Am Heart 1 1968;75:325-34. 5 Chapman CB, Baker 0, Reynolds 1, Bonte FJ. Use of biplane cinfluorography for mcasurement of
ventricular volume. Circulation 1958; 18: 1105-17. 6 Gribbe P, Hirvonen L, Lind 1, \Vegelills C. Cineangiocardiographic recording of the cyclic
changes in volume of the left ventricle. Cardiologia 1959;34L: 348-66. 7 Dodge HT, Sandler H, Ballew D'Y, Lord ID lr. The use of biplane angiocardiography for the
measuremcnt of left ventricular volume in man. Am Hcart 1 1960;60:762-76. 8 Hains AD, Khawaja lA, Lahiri A, Raftery FB. Radionuclide left ventricular ejection fraction: a
comparison of three methods. Br Heart 1 1987;57:232-6. 9 Shah PK, Picher M, Berman DS, Singh BN, Swan HIC. Left ventricular ejection fraction
determined by radionuclide ventriculography in early stages of first transmural myocardial infarction. Am J CardioI1980;45:542-6.
10 Levy WC, Cerqueira MD, Matsuoka DT, Harp GD, Sheehan FH, Stratton JR. Four radiollllclide methods for left ventricular volume determination: comparison of a manual and automated tecillliqlle. J Nlici Med 1992;33:763-70.
11 'Vyatt HL, Heng MK, Meerbaulll S, Gueret P, Hestenes J, Dula E, Corday E. Cross-sectional echocardiography. Analysis of mathematic models for quantifying volume of the formalin-fixed left ventricle. Circulation 1980;61: 1119-25.
12 Schiller NB. Two-dimensional echocardiographic detennination of left ventricular volume, systolic function and mass. Circulation 1991;84:280-7.
13 Garrison IB, 'Yeiss JL, Maughan WL, Tuck OM, Guier WH, Fortuin Nl. Quantifying regional wall motion and thickening in two-dimensional echocardiography with a computer-aided contouring system, In Ostrow H, Ripley K, eds: Proceedings in Computerized Cardiology, Long Beach, CA" 1977;25.
14 Tortoledo FA, Quinones MA, Femandez GC, 'Vaggoner AD, 'Yinters WL. Quantification of left ventricular volumes by two-dimensional echocardiography: a simplified and accurate approach. Circulation 1982;67:579-84
15 Schiller NB, Aquatella H, Ports TA, Drew 0, Goerke 1, Ringertz H, Silvennao NH, Brundage B, Botvinck Ell. Boswell R, Carlsson E, PannIey 'v\V. Left ventricular volume from paired biplane two-dimensional echocardiography. Circulation 1979;60:547-55.,
16 Parisi AF, Moynihan PF, Feldman CL, Folland ED. Approaches to determination of left ventricular volume and ejection fraction by rcal-time two-dimcnsional cchocardiography. Clio Cardiol 1979;2:257-63.

3DE DAY-TO-DAY AND OBSERVER VARIABILITY 93
17 Dilworth LR, Aisen AM, Mancini GBJ, Lande I, Buda AJ. Determination of left ventricular volumes and ejection fraction by magnetic resonance imaging. Am Heart J 1987; 113:24-32.
18 Benjelloun H, Granney GB, Kirk KA, Blackwell GO, Lotan CS, Pohst OM. Interstudy reproducibility of biplane cine nuclear magnetic resonance measurements of left ventricular function. Am J Cardiol 1991;1413-20.
19 Van Rossum AC, Visser Fe, Sprenger M, Van Eenige MI, Valk J, RODs JP. Evaluation of magnetic resonance imaging for detennination of left ventricular ejection fraction and comparison with angiography. Am J Cardio11988; 62:628-33.
20 Siu SC, Rivera JM, Guerrero JL, Handschumacher MD, Lethor JP, Weyman AE, Levine RA, Picard MH. Three-dimensional echocardiography: In vivo validation for left ventricular volume and function. Circulation 1993; 88,4,1: 1715-23.
21 Halldschumacher MO, Lethor JP, Siu SC, Weyman AE, Levine RA. A new integrated system for three dimensional echocardiographic reconstruction: development and validation for ventricular volume with application in human subjects. J Am Coil CardioI1993;21:743-53.
22 King OL, King DL Jr, Shao MY-C. Evaluation of in vitro measurement accuracy of a threedimensional ultrasound scanner. J Ultrasound Med 1991 ;10:77-82.
23 Moritz 'VE, Pearlman AS, McCabe DB, Medema OK, Ainsworth ME, Boles MS. An ultrasonic technique for imaging the ventricle in three dimensions and calculating its volume. IEEE Trans Biomed Eng 1983;30:482-92.
24 Gopal AS, Keller AM, Rigling R, King DL, King DL. Left ventricular volume and endocardial surface area by three-dimensional echocardiography: comparison with two-dimensional echocardiography and nuclear magnetic resonance imaging in nonnal subjects. J Am CoIl Cardiol 1993;22:258-70.
25 Sapin PM, Schroder KM, Gopal AS, Smith MD, DeMaria AN, King OL. Comparison of two- and three-dimensional echocardiography with cineventriculography for measurement of left ventricular volume in patients. J Am Coil Cardiol 1994;24: 1054-63.
26 Nasir YFM, Fioretti PM, Vletter WB, Boersma E, Salustri A, Tjoa Postma J, Reijs AEM, Ten Cate FJ, Roelandt JRTC. Accurate measurements of left ventricular ejection fraction by thrcedimensional echocardiography: a comparison with radionuclide angiography. Circulation 1996;94,:460-6.
27 Gopal AS, Sapin PM, Shell Z, Sapin PM, Keller AM, SchneHbaecher MJ, Leibowitz D\V, Akinboboye 00, Rodney RA, Blood OK, King DL. Assessment of cardiac function by thrcedimensional echocardiography compared with conventional noninvasive methods. Circulation 1995;92:842-52.
28 Roeland! J, Salustri A. Vletter W. Nosir Y. Bruillillg N. Precordial multiplaue echocardiography for dynamic anyplane, parapJane and three-dimensional imaging of the heart. Thoraxcentre J 1994;6:4-13.
29 Salustri A, Roelandt 1. Ultrasonic three-dimensional reconstruction of the heart. Ultrasound in Mcd & Bioi 1995; 21:281-93.
30 Altman DG, Bland 1M. Measurement in medicine: the analysis of method comparison studies. Statistician 1983;32:307-17.


OPTIMAL ROTATIONAL INTERVAL FOR 30E 9S
CHAPTERS
OPTIMAL ROTATIONAL INTERVAL FOR THREEDIMENSIONAL ECHOCARDIOGRAPHIC DATA
ACQUISITION FOR RAPID AND ACCURATE MEASUREMENT OF LEFT VENTRICULAR FUNCTION
Nosir et ai, Optimal 3DE rotatiollal intervals
YoussefFM Nosir MD*, Wim B Vletter BS, Jaroslaw D Kasprzak MD, Eric BON'sma MSc, Maarten H Lequin MD, Jaap Stoker MD, Jiefen Yao MD, Abdou Elhendy MD, Christian S Breburda MD, Folkert J Ten Cate
MD, Jos RTC Roelandt FACC,
From The Thoraxcenter, The Heart Center and Erasmus University, Rotterdam, The Netherlands, *The Cardiology Department, AI-Hussein University Hospital, AI-Azhar
University, Cairo, Egypt.
YFM Nosir is supported by the Nuftlc, Den Haag, The Netherlands.
Submitted

96 CHAPTER 8
AllSTRACT Backgrollnd. Prolonged three-dimensional cchocardiographic acquisition time may lead to motion artifacts, caused by inadvertent patient or operator movements and currently limits its routine lise for calculating left ventricular ejection fraction. Objectil'es. OUf aim was to reduce the acquisition time by defining the largest rotational acquisition interval, which still allows three-dimensional echocardiographic reconstruction for accurate and reproducible left ventricular volume and ejection fraction calculation. Methods. 21 subjects (5 normals and 16 patients with abnormal shaped left ventricle) underwent magnetic resonance imaging and precordial three-dimensional cchocardiography with 2° acquisition intervals. The images were processed to result in data sets containing images at 2°, 4°, 8°, 16°,32° and 64° intervals by excluding the inteljacent images. Using the paraplane feature, 8 equidistant short axis slices were generated from each data set. The suitability of these short axis slices for manual endocardial tracing was scored visually by 4 independent experienced observers. Left ventricular volume and ejection fraction were calculated using Simpson's rule from three-dimensional echocardiographic data sets with 2°, 8° and 16° intervals and the results were compared with values obtained from magnetic resonance imaging. The probability of three-dimensional echocardiography to detect left ventricular volume and ejection fraction differences was calculated. Results. All patients were in sinus rhythm with a mean±SD heart rate of 72±12 bpm. Visual estimation of endocardial border adequacy for tracing the left ventricular short axis views generated from data sets reconstructed with images at different interpolation intervals, by the four observers, showed that images obtained from data sets with rotational scanning intervals of 16° allowed left ventricular endocardial tracing in all subjects. \Vhile data sets obtained at 32° and 64° were inadequate for endocardial tracing. There was good correlation, dose limits of agreement and non- significant differences between values of left ventricular volume and ejection fraction calculated with three-dimensional echocardiography at 2°, 8° and 16° rotational intervals and those obtained with magnetic resonance imaging. At steps of 16°, three-dimensional echocardiography had excellent correlation (r = 98, 99 and 99), close limits of agreement (±38, ±28.6 and ±4.8) and non-significant differences (p = 0.5, 0.8 and 0.2) with values obtained from .MRI for calculating end-diastolic and end-systolic left ventricular volume and ejection fraction, respectively. With the small number of subjects (21), three-dimensional echocardiography using 16° rotational intervals could detect 15 ml differences in end-diastolic volume with a probability of 95%, II ml differences in end-systolic volume with a probability of 92 % and 2 % differences in ejection fraction with a probability of 95%. Conclusions. Three-dimensional echocardiographic data sets reconstructed with images selected at 16° intervals from data sets obtained at 2° precordial rotational acquisition interval, allowed the generation of left ventricular short axis images with adequate quality for endocardial border tracing. Tins ShIdy therefore proves that precordial acquisition at 16° intervals would be sufficient for the reconstruction of three-dimensional echocardiographic data sets for left ventricular function measurement. This approach would result in a significant reduction in acquisition time with enough accuracy for clinical decision making and therefore make three-dimensional echocardiography more practical as a routine method.

OPTIMAL ROTATIONAL INTERVAL FOR 3DE 97
Key lVords: Three-dimensional echocardiography, left ventricular volume, ejection fraction, magnetic resonance linage.
Left ventricular volumes and ejection fraction may vary in many clinical situations and following various medical or surgical interventions and thus often require serial monitoring for accurate detection of early changes.
Three-dimensional echocardiography allows accurate left ventricular volume and ejection fraction calculation without geometric assumptions l
-8 and is therefore an ideal tool for serving
tlus purpose. However, prolonged data acquisition time is one of the limitations that hinder the clinical application of three-dimensional echocardiography for routine left ventricular volume and ejection fraction calculation. Therefore, tius shldy was designed to define a faster method for precordial three-dimensional echocardiographic acquisition and to evaluate its accuracy for left ventricular volume and ejection fraction calculation by comparison with magnetic resonance imaging.
SUBJECTS AND METHODS Three-dimensional echocardiography and magnetic resonance imaging were pelfonned on
the same day in 21 subjects including IS males and 6 females (age 49 ± 16 years, ranging from 26 to 66 years). These subjects included 5 healthy volunteers and 16 patients with left ventricular abnormalities (12 with ischaemic segmental wall motion abnormalities and 4 with global hypokinesis due to dilated cardiomyopathy). Informed verbal consent was obtained from each subject after a detailed explanation of the procedure.
MAGNETIC RESONANCE IMAGING Magnetic resonance imaging was pelfofmed at 0.5 T (Gyroscan T5-11 Philips Medical
Systems, The Netherlands). The multi slice multiphase ECG-triggered TI weighted fast field echo was pelfonned with a repetition time of 800-1200 ms, echo time 22ms, flip angle 70° and the field of view 240 x 300 nun. The level and width of magnetic resonance imaging window in every subject were selected to obtain an optimal contrast between the relatively hypointense ventricular wall and the relatively hyperintense blood pool in the ventricular cavity. Axial, coronal and sagittal spin-echo was used to select optimal short axis views of the left ventricle for image acquisition. Sequential images of the heart were collected using 9 nlIll
slice thickness with 0.9 mm inter slice gap and imaging matrix (90 x 128). Heart phase interval was 32-39 ms with the number of heart phases 14-32 and a median at 21.
Left ventricular volume measurement was carried out off line on a work station (Gyroview HR) using Simpson's rule by two independent experienced observers (MHL and JS). The end-diastole was deftned as the frame with the largest left ventricular cavity size and end-systole as the frame with the smallest left ventricular cavity size. The endocardial border of left ventricle was traced manually on all short axis views to derive end-diastolic and endsystolic left ventricular volume and ejection fraction.
THREE-DIMENSIONAL ECHOCARDIOGRAPHIC EXAMINATION A commercially available ultrasound unit (Toshiba Sonolayer SSH-140A) with the
transducer frequency of 3.75 MHz was coupled with a 3DE processing computer {Echo-scan,

98 CHAPTERS
TomTcc GmbH, Munich, Germany) for data acquisition.9•10 The echocardiographic images of
the left ventricle were collected from the apical window in a rotational format at 2° intervals, gated to proper R-R intervals of ECG and thoracic impedance of expiration. while the patient was resting comfortably in a 45° left recumbent position.
The acquired data were processed and analyzed off line on a three-dimensional echocardiographic work station (TomTec Inc. system). Images selected at intervals of 2°,4°, go, 16°, 32° and 64° from the original data set were readjusted in their correct spatial and temporal sequence, digitally reformatted and processed to obtain 6 different data sets. Gaps between the images were interpolated using a "trilinear cylindric interpolation It algorithm 7 to produce voxel based volumetric data sets (figure I),
With the paraplane option 8 parallel and equidistant short axis slices of the left ventricle were derived from each data set at end-diastole and end-systole, respectively. The adequacy for endocardial border tracing of the left ventricular short axis images, generated from the reconstructed data sets with different interpolation intervals, was scored visually by 4 independent experienced observers.
A B Figure 1. Reconstructcd left vcntricular short axis views from three-dimensional echocardiographic data sets at diftcrent degrees of rotational acquisition. Panel A shows the left ventricular long axis (the reference image), with the transyerse section indicator sector at the level of the papillary Illuscle. Panel B shows the corresponding short axis views reconstructed at different rotational degrees of acquisition (at 2°, 4°, 8°, 16°, 32° and 64°).
The end-diastolic and end-systolic left ventricular volume were calculated by two independent experieuced observers (YFMN aud JDK) using Simpsou's mle for the tlu'eedimensional echocardiographic data sets obtained with images selection at 2°, 8° and 16° intervals. Measurement of left ventricular volume at 2°, 8° and 16° was pelfonned independently with at least 2 days apart. After a reference image of the left ventricular long axis view was defIned, 8 parallel equidistant short-axis slices spamung the left ventricular cavity from the apex to the nutral annulus were derived. The end-diastolic and end-systolic endocardial border of the left ventricle was traced in each slice.

OPTIMAL ROTATIONAL INTERVAL FOR 3DE 99
The volume of the left ventricle on each slice was calculated automatically by the computer using a sUlllmation of the voxels included in the traced arca. An accumulation of the subvolumcs on all slices yielded the left ventricular volume at end-diastole and end-systole. from which the ejection fraction was calculated. (figure 2)
Figure 2. The principle of left ventricular volume measurement using Simpson's nile with volume rendered thrcedimensional echocardiography. A long-axis view is selected as a reference image from the three-dimensional echocardiographic data set. TIle left ventricle is sliced by paraplanc analysis method into 8 equidistant parallel short axis slices spanning the left ventricular cavity from the apex to mitral annulus (panel A). The endocardial border of the left ventricle on each cross-section is traced manually delineating the white label (short axis slices from 1 to 8). The volume of the traced region on each slice is calculated. Adding up the volumes of all slices provides the left ventricular volume at a chosen phase (end-diastole or end-systole).
STATISTICAL ANALYSIS All images were scored by four independent observers. We define the feasibility of
endocardial tracing on left ventricular Sh0I1 axis views from the three-dimensional echocardiographic data sets as very good (endocardial borders are clearly identified and completely present in all left ventricular short axis slices), good (endocardial borders can be identified and completely traced in all short axis slices), possible (endocardial borders can be identified and traced in at least 75% of left ventricular short axis slices) and impossible (endocardial borders are not clearly identified or incomplete in most left ventricular short axis slices).
Left ventricular volume and ejection fraction were calculated by two independent observers (YFMN and JOK for 30E) and (MHL and JS for MRI). All values of the left ventricular volume and ejection fraction measurements were expressed as mean ± SD. hlterobserver vadability were calculated as the standard error of the estimate (SEE). To compare the calculation of end-diastolic and end-systolic left ventricular volume and ejection fraction from three-dimensional echocardiographic data sets at 2°, 8° and 16° rotational intervals with values obtained by magnetic resonance imaging, the limits of agreement -were

100 CHAPTER 8
computed using the method described by Altman and Bland." A paired t-test was pelformed and significance was stated at the 0.05 probability level. Pearson's correlation coefficients were used.
Power analysis was performed to determine the possibilities of a beta enor in the comparison with the 2°, go, and 16° of rotation to detcct differences in len ventricular volume and ejection fraction with comparison to magnetic resonance imaging.
RESULTS Three-dimensional echocardiographic data acquisition and analysis were possible in all
subjects recruited in tItis Shldy. All subjects studied were in sinus rhythm with a mean ± SD heart rate of 72 ± 12 bpill. A data set at 2° rotational scanning intervals was acquired in each subject. By interpolating llnages at 2°, 4°, go, 16°, 32° and 64° intervals during data processing, a total of 6 data sets of the left ventricle were obtained. The average slice thickness (nun) ± SD were 9.9 ± 0.8 and 8.2 ± 0.9 for end-diastole and end-systole respectively.
Visual estimation of manual endocardial tl'acing feasibility at different rotational intervals for three-dimensional echocardiography.
The endocardial border definition of the left ventricular short axis images was scored by four observers and the average values are shown in table I (figure 3),
Average Visual Estimation (% ) -very good ~ good ~ possible ~ impossible
110
100
" ~
w
" ~ 60
~~ J~ " e " ~ > w <: ;0
'" 10 •
20 40 80 160 320 64°
Figure 3. The average % value of the four independent observers that visually scored the suitability of 3DE data sets obtained at variable degrees of rotation (at 2°, 4°, go, 16°, 32° and 64°), for manual endocardial tracing.
Observer v31'iability of magnetic resonance imaging and three-dimensional echocardiography at 2°, 8 °and 16° of rotational intervals.
Interobserver variabilities for calculating end-diastolic and end-systolic left ventricular volume and ejection fraction with magnetic resonance imaging and with three-dimensional

OPTIMAL ROTA TIONAL INTERVAL FOR 30E 101
echocardiography at 2°. 8 o~md 16° intervals were calculated and presented as the standard error of the estimate between the two observers (table 2).
Table I. Visual scoring of suitability of left ventricular (LV) short axis, obtained from different tlu'ee-dimensional echocardiographic (3DE) acquisition degree, for manual endocardial traciIl~.
Observer I Observer 2 Observer 3 Observer 4 Average (%) a b C d a b c d a b c d a b c d a b C d
2' 5 13 3 6 14 3 II 7 4 14 3 21.4 61.9 16.7
4' 5 13 3 6 14 I 3 II 7 4 14 3 21.4 61.9 16.7
8' 2 14 5 4 14 3 9 12 2 13 6 9.5 59.5 31
16' 12 9 12 9 6 15 12 9 50 50
32' 18 3 21 5 16 17 4 72.6 27.4
64° 21 21 21 21 100
a -very good, b - good, c - possible and d - impossible.
Table 2. Mean ± of left ventricular volume (L VV) and ejection fraction (EF), together with illterobserver standard error of the estimate (SEE), calculated by MRI and 3DE at 2, 8 and 16 of rotational acquisition,).
EDV ESV EF MRI Mean ±SD 218 ± 98 154 ± 98 34.7 ± 17.9
Interohserver SEE 11.7(ml) 10.5 (ml) 4.7 (%) 3DE-2' Mean±SD 217±95 I 55±99 34±17.9
Interobservcr SEE 4.2 (mI) 3.8 (mI) l.l (%) 3DE-8' Mcan±SD 216±95 153±98 34±17.7
Intcrohsc[vcr SEE 3.9 (ml) 4.1 (ml) 1.2 (%) 3DE-16' Mean±SD 215±94 153±99 34±18
Interohserver SEE 4.6 (mI) 3.9 (ml) 1.4 (%) 1'lRI - magnetic resonance imaging.
Comparison between measurements of left ventricular volume and ejection fraction by three-dimensional cchocardiogra)lhy at 2°, 8 °and 16° intcrvals and values obtained by magnetic resonance imaging.
Mean ± SD of end-diastolic and end-systolic left ventricular volume and ejection fraction for magnetic resonance imaging and three-dimensional echocarrliography at 2°, 8°and 16° image interpolation intervals are presented in table 2. There was excellent cOlTclatioll, close limits of agreements and nOll significant differences between measurements of end-diastolic and end-systolic left ventricular volume and ejection fraction from three-dimensional echocarrliography at 2°, 8°and 16° intervals and that obtained from magnetic resonance imaging (table 3, figure 4). At 16' intervals, three-dimensional echocardiography had excellent correlation (1' = 98, 99 and 99), close limits of agreement (±38, ±28.6 and ±4.8) and non significant differences (p = 0.5, 0.8 and 0.2) with values obtained from magnetic resonance imaging for the calculation of end-diastolic and end-systolic left ventricular volume and ejection fraction, respectively.
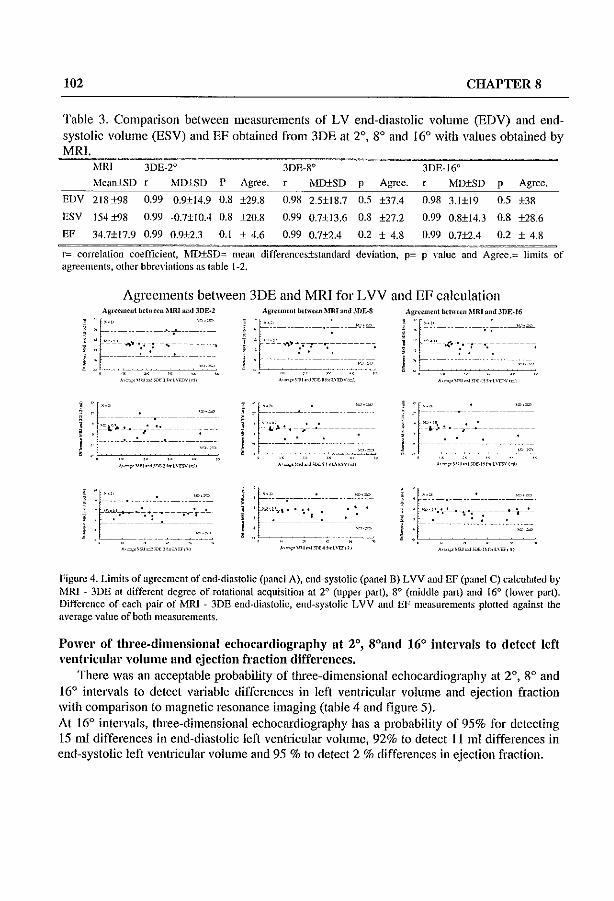
102 CHAPTER 8
Table 3. Comparison between measurements of LV end-diastolic volume (EDV) and endsystolic volume (ESV) and EF obtained from 3DE at 2°, go and 16° with values obtained by MRI.
rvfRJ 3DE-2° 30E-8° 3DE-16° . ~ • .'Iean±SD r MD±SD P Agree. MD±SD P Agree. MD+SD p Agree .
EDV 2t8±98
ESV 154±98
EF 34.7±t7.9
0.99 0.9±14.9 0.8 ±29.8
0.99 -0.7±IOA 0.8 ±20.8
0.99 0.9±2.3 0.1 ± 4.6
0.98
0.99
0.99
2.5±18.7 0.5 ±37A
0.7±13.6 0.8 ±27.2
0.7±2A 0.2 ± 4.8
0.98 3.1±19 0.5 ±38
0.99 0.8±14.3 0.8 ±28.6
0.99 0.7±2.4 0.2 ± 4.8 ------~~~. ~-.~-~--
r= correlation coefticient, ~'ID±SD= mean differcnccs±standard deviation, p= p value and Agree.= limits of agreements, other bbrc"ialions as table 1-2.
Agreements between 3DE and MRI for LVV and EF calculation Aglffmeni bfl".-.,n.'lUU and 3DE_l AI:«'~m~nt ~hHW ;\IRI ;lnd JDF.·16
1 :r~ ---, ~ ..'- '"" ':~. ---. ~ ~.~ ':r"'-l : 'e_'_ " ':',' " ' , -_'_~'.:,:_,~_n ___ ~ , . -.. ""':' :' __ ' __ n ___ • i' - - - - - . -- - - -, - . _ -"" " " ,. '" " ,,~, ~__c~~___:c__~
:~"'-~ '-- - -"~ 'r-- - ~ '- - -,0''':' · "'i.",I.' .--;'--~--------- . '~'~.!.·-7'---'----------· .' . . ' . .' .
- - - -",= ,..,,, ....
~ " ~ r'
, , ------------.-----
, '=-"":'J--. __ ~_'--"_
,: ~------"--~:---~->< .,,, ."",,
"~'£'''jJ~.l'''~ 1 '~l"-W(~" ~,=,,~"',,"("_r'ht":WCrJ,
'E" , 'O.~ ,~.. ' ~.~ : ~ ... :". ~ .. -;=.-=-=-;-.!.- : '=:'"'~~=-~"':;-=-=-+~ "- - -' - '- - '. '..
• ,.-, "'. y-,,= . ~.',
~'="'''''''''''_''_<L\rr,,, A,,,,,,,'''-''''--''C>E ",-,t\u,,,
Figure 4. Limits of agreement of end-diastolic (panel A), end-systolic (panel B) LVV and EF (panel C) calculated by MRI -- 3DE at different degree of rotational acquisition at 20 (upper part), 80 (middle part) and 16° (lower part). Difference of each pair of 1\00 - 3DE end-diastolic, end-systolic LVV and EF measurements plotted against the average value of both mea~urements.
Power of three-dimensional echocardiography at 2°, 8°and 16° intervals to detect left ventricular volume and ejection fraction differences.
There was an acceptable probability of three-dimensional echocardiography at 2°, 8° and 16° intervals to detect variable differences in left ventricular volume and ejection fraction with comparison to magnetic resonance imaging (table 4 and figure 5). At 16° intervals, three-dimensional echocardiography has a probability of 95% for detecting 15 Illi differences in end-diastolic left ventricular volume, 92% to detect II ml differences in end-systolic left ventricular volume and 95 % to detect 2 % differences in ejection fraction.

OPTIMAL ROTA TIONAL INTERVAL FOR 3DE 103
Table 4. Probability of 3DE at 2°, 8° and 16° of rotational acquisition differences in L VVand EF with comparison to MRI.
to detect variable
Differences EDV (ml) ESV ,,(I="I"-)_--c~_--,-,-__ -=E,,-P--,(-,,%,,-). 2 5 IO 15 L5 4 7.5 11 1.5
2 degrees 5 40 85 99 IO 40 90 99 50 85
8 degrees 1 25 70 65
95
95
5
5
30
25
70 65
95
92
50
45
81
80 16 Degrees 0 20
All abbreviation as table 1-2
Probability of 3DE at Different Rotational Degrees To Detect LVV and EF Differences -2 ();';grM$
'" r; 100
00 ., " , " f ;0
."
30
~ '" 10 , I
lO(ml)
EDV
I
I , 1S(ml)
h I
II 75(mJ)
ESV
W(ml) 2(%)
EF
2 98
97 95
Figure 5. The probability of three-dimensional cchocardiography at 2°, 8° 16° of rotational acquisition to detect variable differences in end-diastolic and end-systolic left ventricular volume (ml) and ejection fraction (%).
DISCUSSION. Accurate and reproducible assessment of left ventricular volume and function is important
for predicting the outcome of various medical or interventional procedures. 12-13
The results of this study demonstrated that left ventricular short axis images from precordial three-dimensional cchocardiographic data sets with images acqui red at 16° rotational intervals, may still be adequate for endocardial border tracing and accurate quantification of left ventricular volume. This implies that the data acquisition time may be reduced from 5 minutes to 30 seconds in average, as only 12 instead of 90 cutting planes are required. In addition, despite the small number of subjects recnrited in tlus study, a 16' intelpolation interval provides an acceptable probability level for the detection of differences (± 8 % of the mean value) in left ventricular volume and ejection fraction.
The results of tillS study are in agreement with the study conducted by Siu et al.,27 in which the influence of number of component images on accuracy of left ventricular volume quantification by three-dimensional echocardiography using the nonparallel intersecting images was examined. They concluded that, accurate calculation of left ventricular volume and ejection fraction can be obtained by three-dimensional echocardiography with as few as 8

104 CHAPTERS
to 12 nonparallel intersecting images. They demonstrated that in both symmetric and asymmetric ventricles, the error in calculating volume was relatively constant when the number of llnages was at least 8 (3 long axis and 5 short axis) but increased progressively when the number of images was lower.
CLINICAL IMPLICATIONS Most of the currently available imaging techniques such as contrast angiography,14-1S
radionuclide angiography 19-21 and echocardiography22-25 are either invasive or employ geometric assumptions of the left ventricle. Although magnetic resonance imaging is able to produce accurate measurement of left ventricular yolume,26-.28 it has limitations for repeated studies, is not portable and is not widely available.
Volume rendered three-dimensional echocardiography. using sequentially collected images. produces reproducible data sets of the left ventricle and therefore, is an ideal technique for repeated measurements of left ventricular volume29
• Rotational 3DE data acquisition at 20 requires 90 cutting planes of the heart with each containing images of a whole cardiac cycle. With EeG and respiratOlY gating, the acquisition usually requires approximately 5 minutes. This is a limitation for the routine use of this technique. In addition, a prolonged acquisition time increases the possibility of patient or operator induced artifact that may lead to inaccurate or unreadable data and the need to repeat the procedure.
Since the introduction of three-dimensional echocardiography, efforts have been directed to find a simple, rapid and accurate protocol that would facilitate its routine use in clinical practice. The results of this ShIdy enable us to reach this goal. Precordial rotational acquisition at 160 will shorten the acquisition time to 30 seconds. Selecting end-diastolic and end-systolic data sets before image processing will take approximately 2 minutes with the software used in this study. Processing time, however, will be negligible with the new software generation. The contour tracing time using the paraplane option with 8 paral1el equidistant short axis slices which is sufficiently accurate will take approximately 10 minutes. In addition, the application of automated border recognition software for area and volume analysis technique will be integrated soon.
Because the numbers of subjects recmited in each group were small we did not analyse the accuracy of left ventricular volume and ejection fraction measurements in normal and deformed left ventricle but we could show an acceptable probability level for detecting left ventricular volume and ejection fraction differences.
CONCLUSIONS Three-dimensional echocardiographic data sets rcconstmcted with images selected at 16°
rotational intervals, from data set obtained at 20 acquisition rotational interval, allowed the generation of a three-dimensional echocardiographic data set from which left ventricular short axis slices could be obtained with adequate quality for endocardial border tracing. Tllis study therefore proves that precordial acquisition at 160 intervals would be sufficient for obtaining three-dimensional echocardiographic data sets for left ventricular function measurement. This approach would result in a significant reduction in acquisition time with

OPTIMAL ROTATIONAL INTERVAL FOR 3DE 105
enough accuracy for clinical decision making and therefore make it more practical as a routine method.
Ackllowledgmellt. We would like to thank Rene Frowijn for his technical assistance throughout this work.
YFM Nasir is supported by The NUFFIC, The Hague, Netherlands.
REFERENCES. 1 Siu SC, Rivera JM, Guerrero JL ct al. Three-dimensional echocardiography: In vivo validation for left
ventricular volume and function. Circulation 1993; 88,4, I: 1715-23. 2 Handschumucher MD, Lethor JP, Sill SC et al. A new integrated system for three dimensional
echocardiographic reconstruction: development and validation for ventricular volume with application in human subjects. J Am Coil Cardial 1993;21 :743-53.
3 King DL, King DL Jr, Shao MY-C. Evaluation of in vitro measurement accuracy of a threedimensional ultrasound scallller. J Ultrasound Med 1991;10:77-82.
4 Moritz WE, Pearlman AS, McCabe DH, Medema DK, Ainsworth ME, Boles MS. An ultrasonic tcchnique for imaging the ventricle in tluee dimensions and calculating its volume. IEEE Trans Biomed Eng 1983;30:482-92.
5 Gopal AS, Keller AM, Rigling R, King DL, King DL. Left ventricular volume and endocardial surface area by three-dimensional echocardiography: comparison with two-dimensional echocardiography and nuclear magnetic resonance imaging in normal subjects. J Am Coll Cardiol 1993;22:258-70.
6 Sapin PM, Scluoder KM, Gopal AS, Smith MD, DeMaria AN, King DL. Comparison of two~ and three-dimensional echocardiography with cincventriculography for measurement of left ventricular volume in patients. J Am Coli Cardiol 1994;24 : 1054-63.
7 Nosir YFM, Fioretti PM, Vlelter \VB ct al. Accurate measuremcnts of left ventricular ejection fraction by thrce-dimensional echocardiography: a comparison with radionuclide angiography. Circulation 1996;94,:460-6.
8 Gopal AS, Sapin PM, Shen Z, Sapin PM, Keller AM, Schllellbaecher MJ, Leibowitz D\V, Akinboboye 00, Rodney RA, Blood DK, King DL. Assessment of cardiac function by threedimensional echocardiography compared with conventional noninvasive mcthods. Circulation 1995;92:842-52.
9 Roelandt J, Salustri A, Vlcttcr \V, Nosir Y, Bruining N. Precordial multiplane echocardiography for dynamic anyplalle, parapJane and tluee-dimensional imaging of the heart. Thoraxcentre J 1994;6:4-13
10 Salustri A, Roelandt 1. Ultrasonic three-dimensional reconstruction of the heart. Ultrasound in Med & Bio11995; 21:281-93.
11 Altman DG, Bland JM. Measurement in medicine: the analysis of method comparison studies. Statistician 1983;32:307-17.
12 Sandler H, Dodge HT, Hay RE, Rackley CEo Quantitation of valvular insufficiency in man by angiocardiography. Am Heart J 1963;65:501-13.
13 Dodge HT, Kennedy J\V, Peterson JL. Quantitative angiocardiographic methods of in the evaluation of valvular heart disease. Prog Cardiovasc Dis 1973; 16: 1-23.
14 Arvidsson H. angiocardiographic detennination of left ventricular volume. Acta Radial 1961;56:321-39.
15 Sandler H, Dodge HT. The use of single plane angiocardiograms for the calculation of left ventricular volume in man. Am Heart J 1968;75:325-34.

106 CHAPTER 8
16 Chapman CB, Baker 0, Reynolds J, Bonte Fl. Use of biplane cintluorography for measurement of ventricular volume. Circulation 1958;18: 1105-17.
17 Gribbe P, Hirvoncn L, Lind J, Wegelius C. Cineangiocardiographic recording of the cyclic changes in volume of the left ventricle. Cardiologia 1959;34L: 348-66.
18 Dodge HT, Sandler H, Ballew DW, Lord JD Jf. The llse of biplane angiocardiography for the measurement of left ventricular volume in man. Am Heart J 1960;60:762-76.
19 Hains AD, Khawaja lA, Lahiri A, Raftery FE. Radionuclide leff ventricular ejection fraction: a comparison of three methods. Bf Heart J 1987;57:232-6.
20 Shah PK, Picher M, Bennan DS, Singh BN, Swan HJe. Left ventricular ejection fraction detemlined by radionuclide ventriculography in early stages of first transmural myocardial infarction. Am I Cardiol 1980;45:542-6.
21 Levy \VC, Cerqueira MD, Matsuoka DT, Harp GO, Sheehan FH, Stratton JR. Four radionuclide methods for left ventricular volume determination: comparison of a manual and automated technique. J Nucl Med 1992;33:763-70.
22 Wyatt HL, Heng MK, Meerbaum S, Gueret P, Hestenes I, Dula E, Corday E. Cross-sectional cchocardiogmphy. Analysis of mathematic models for quantifying volume of the fonnalin-fixed left ventricle. Circulation 1980;61: 1119-25.
23 Schajsim IN, Kohn MS, Beaver WI, Popp RL. In vitro quantification of canine left ventricular volume by phased-array sector scan. Cardiology 1981 ;67: 1-11.
24 GmTison IB, Weiss JL, Maughan WL, Tuck OM, Guier \VH, Fortuin NJ. Quantifying regional wall motion and thickening in two-dimensional echocardiography with a computer-aided contouring system. In Ostrow H, Ripley K, cds: Proceedings in Computerized Cardiology, Long Beach, CA., 1977;25.
25 \Veiss lL, Eaton L\V, Manghan WL et al. Ventricular size and shape by two-dimensional echocardiography. Fed Proc 1981 ;40:2031-6.
26 Dilworth LR, Aiscn AM, Mancini GBJ, Lande I, Blida AJ. Determination of left vcntricular volumcs and ejection fraction by magnetic resonance imaging. Am Heart 11987; 113:24-32.
27 Siu SC, Rivera llvl, Handschumacher MD, Weyman AB, Levine RA, Picard nffi. Three-dimensional echocardiography: the influence of number of component images on accuracy of left ventricular volume quantification. I Am Soc Echocardiogr 1996;9: 147-155.
28 Nosir YFM, Lcquin MH, Vletter WB, Kasprzak ID, Dall' Agata A, Stoker J, vanDomburg RT, Ten Cate Fl. Three-dimensional echocardiography for quantification of left ventricular volumes and function with comparison to magnetic resonance imaging .in both patients and nomlal subjects Circulation 1996;94 (Suppl. 1):1-212 (Abstract).
29 Nosir YFM, Lequin MH, Kasprzak ro, vanDomburg RT, Vletter WB, Yao J, Stoker J, Ten Cate FJ, Roelandt JRTC. Measurements and Day-to-Day Variabilities of Left Ventricular Volumes and Ejection Fraction by Three-dimensional Echocardiography. Am J Cardiol. 1998;82:209-214.

QUANTIFICATION OF LVV AND FUNCTION BY 3DE 107
CHAPTER 9
ACCURATE QUANTIFICATION OF LEFT VENTRICULAR VOLUME AND FUNCTION BY THREE-DIMENSIONAL
ECHOCARDIOGRAPHY
Jiefen Yao, MD, YoussefF.M. Nosh', MD, Jos R.T.C. Roelandt, MD.
From Thoraxcenter, AZR, Erasmus University, Rotterdam, The Netherlands
SUBMITTED

108 CHAPTER 9
Accurate quantification of left ventricular volumes and function is imp0l1ant in clinical practice of cardiology. The previously employed methods for measuring left ventricular volumes and function have various limitations. Two-dimensional echocardiographic approaches often have to apply geometric assumptions to the left ventricle by using a few standard views. Three-dimensional echocardiography is able to overcome those funitations by obtaining a volumetric data set of the left ventricle and thus obviates the Heed for any geOIiletric assumptions. Various methods for three-dimensional data acquisition, data processing. data analysis and three-dimensional image reconstmction have been developed along with different algorithms for volumetric calculation. In tIus article, we reviewed the currently employed three-dimensional echocardiographic methods for measuring left ventricular volumes and the results obtained from previous studies in comparison \vith other established methods. Three-dimensional echocardiography has proven to be accurate in quantitative measurements of left ventricular volumes and function both experimentally and clinically and is ready to serve as a new standard for volumetric measurements.
Left ventricular volume is an important index of global cardiac performance and an indicator of the adaptation of left ventricle to various pathological conditions and response to illterventional procedures. Accurate deternullation of left ventricular volume and function is important in clinical management for stratification of lugh risk patients after myocardial infarction or with dilated cardiomyopathy and for time selection of surgical therapies in patients with valvular diseases. 1
-7 Although various other techniques including invasive
angiography, 8-11 radionuclide angiographyI2-14 and magnetic resonance imagillg15-l6 have been
used, echocardiography is the most commonly applied modality for quantifying left ventricular volume and function in cardiological practice due to its easy manipulation, proved accuracy and non-invasive nature. 17
-21 However, al1 the previously used two-dimensional methods have
to extrapolate left ventricular volume from only one or a few selected cutting planes by employment of certain geometric assumptions for the left ventricle. Three-dimensional echocardiography, on the other hand, encloses the whole left ventricle with more image information and thus allows more accurate measurement of left ventricular volumes without the need of any geometric assumptions and thus is able to predict the left ventricular function more reliably.22-26
Currently Available Techniques for Measuring Left Ventricular Volumes and Function There are various techniques clll1"ently available for calculating left ventricular volumes and
function. The earliest being used tec111uque is invasive angiography.s-ll The left ventricular volume is assessed using either a single plane or two orthogonal planes of the left ventriculogram based on the assumption that the left ventricle is ellipsoid in shape. Although biplane angiography has frequently served as a reference standard, the geometric assumption hinders its accuracy for measuring left ventricles of various shapes and the requirement of invasive cardiac catheterization prevents it from daily employment and repeated studies.
QUANTIFICATION OF LVV AND FUNCTION BY 3DE 109
Radionuclide angiography has also been used for determination of left ventricular volume,12-14 Though non-invasive, injection of radioactive agents is well known for the side effects caused by ionizing energy. In addition, it employs the same geometric assumptions as in invasive angiography.
Magnetic resonance imaging has proven to be accurate in determining left vcntricular volume and ejection fraction both in normal subjects and in patients. 15
-16 By adding up the
volumes of left ventricular cavity on all slices, no geometric assumption is needed for left ventricular volume measurement. Though noninvasive, this technique is not being widely used since it is very expensive, time consuming and cannot be performed at bedside.
M-mode echocardiography, a one dimensional ultrasound scanning of the cardiac structures, was developed in the eady 1970's. It was immediately used for volume and function assessment of the left ventricle for its simple algorithm and non-invasiveness. 17 Ejection fraction was calculated simply by a percentage derived from the mid left ventricular diameters in end-systole and end-diastole. Though satisfactory results were achieved, problems were raised in asynergic ventricles with myocardial infarction.27
-28
Two-dimensional echocardiography, with the ability of imaging the heart in cross-sectional views and easier access to various cutting planes, improved the accuracy of left ventricular volume measurement. IS
-21 Among different mathematical models, modified biplane Simpson's
mle has provided accurate data in both animal and human studies and in symmetric as well as asymmetric left ventricles.29 Algorithms for automatic border detection and on-line calculation left ventricular volume and ejection fraction have been developed, but its clinical application is limited by the quality of ultrasound images. Because of the noninvasiveness and portability, two-dimensional echocardiography has become a routine examination clinically for left ventricular volume and function assessment. However, geometric assumptions are still needed for left ventricular volumetric measurements.
Expectation of a technique that could overcome limitations of the above mentioned techniques was realized by the advent of three-dimensional echocardiography which led to immediate utilization in volumetric assessment of left ventricle in both experimental and clinical studies and accurate results were obtained in comparison with established methods.22
-26
, 30-32
Three-dimensional Echocardiog.'aphy for Left Ventricular Volume Quantification With the ability of reconstructing cross-sectional views of the left ventricle and other
cardiac structures into three-dimensional images, the advantage of three-dimensional echocardiography in left ventricular volume measurement is the obviation of any geometric assumptions of the left ventricle. Over the last twenty years or more, various techniques has been developed for three-dimensional reconstruction and volume measurement of the left ventricle. The currently available techniques for three-dimensional data acquisition, processing, reconstmction and volume quantification arc discllssed below.

110 CHAPTER 9
Polygonal imaging A simple way of three-dimensional reconstmction of the left ventricle is to acquire 3 to 4
orthogonal long-axis views of the left ventricle from the apical window. With or without interpolation of short-axis views, a polygonal image of the left ventricle can be reconstructed and its volume measured automatically by the computer.31
-32 The endocardial borders of the
left ventricle need to be traced manually. Diastolic and systolic volumes of the left ventricle can be measured by endocardial tracing of the respective images. Stroke volume and ejection fraction can then be derived from these values. TillS method is easy to apply and has proved accurate for gross volume and mass measurement of the left ventricle. But in severely asymmetric ventricles, the reconstructed three-dimensional image cannot depict the regional shape of the cavity or movement of the myocardium in detail.
Random imaging For accurate measurement of left ventricular volumes, accurate spatial registration of
randomly acquired cross-sectional images is necessary. Different devices (such as mechanical ann, acoustic or magnetic sensors) have been developed for locating the ultrasound transducer or the cutting plane of the images.33
-35 This allows imaging ~f the left ventricle from any
optimal acoustic windows by moving the transducer freely at one acoustic window or at different acoustic windows. An intersectional line or an image plane (usually longitudinal view of the left ventricle) is usually used to guide the position and orientation of other imaging planes and to document the local curvature of the left ventricular wall. The endocardial border of the left ventricle on each cross-sectional view is manually traced. All the traced lines are connected according to their spatial order form a three-dimensional wire-frame image. This fashion of reconstruction is also named line-of-intersection display. Volume of the left ventricle can then be computed by the computer. Accurate results from tIus mode of reconstl1lction have been achieved in both symmetrical or aneurysmal left ventricles as well as in right ventricle or other objects.22
-25
, 36-38 The limitation of this method is that the spaces between the sampled cross-sectional inmges are uneven and mistakes may result from interpolation of big gaps between imaged planes. Furthermore, the reconstructed threedimensional images are usually static and lack of tissue depiction. Therefore, performance of the myocardium, especially regional myocardial tiuckening, can not be judged with this technique.
Sequelltial imagillg To image the heart in averagely spaced cutting planes and to retain the ultrasound
characteristics of the cardiac tissue, different algorithms have been developed for computercontrolled sequential imaging of the heart.39 The probe or transducer is moved in pre-defined manners with equal incremental steps while cross-sectional images of the heart are collected using EeG and respiratory gatings (the former being used for temporal registration and the

QUANTIFICATION OF LVV AND FUNCTION BY 3DE 111
later for minimizing respiration-related artifacts), At present, parallel, fan-like and rotational modes of data acquisition area available (Fig I), with the later being used most frequently for both left ventricular volumetric evaluation and assessment of other cardiac problems.26
,40-42
These modes of data acquisition can collect closely and evenly distributed images that cover the whole left ventricle. By automatic interpolation, spaces between the imaging planes arc filled by the computer and the collected images are transferred into a vaxel-based thrcedimensional data set. Three-dimensional reconstruction from vaxel-based data set can be realized without lllanual tracing of the endocardial border and, with volume-rendering and various shading techniques, the reconstructed unage accurately portrays tbe tissue characteristics and depth of the cardiac anatomy. In addition, the volumetric three-dimensional data set can be electronically dissected in different manners resulting in numerous possible cross-sectional views of the left ventricle and other cardiac structures. Anyplane and paraplane methods provides arbitrarily arranged or equally spaced parallel cutting planes allowing systematic cross-sectional review of the three-dimensional data set and the later also provides accurate measurement of the left ventricular volume by endocardial tracing us.ing disc sunllllation method without the necessity of any geometric assumptions:B Using various cutting planes, volume-rendered three-dimensional echocardiography is able to display dynamically the interior of the heart such as the cardiac chambers and valves in different display projections.39 Not only the sizes and shapes of the left ventricle, but also the regional thickening and wall motioll of the myocardium can be observed and measured with this technique.44
Parallel Scanning Fan-like Scanning Rotational Scanning
~ ~ Figure 1. Schematics showing 3 different modes of sequential data acquisition for three-dimensional left ventricular reconstruction. The motion of the probe or the transducer inside the probe is predet1ned and automatically controlled.
Real-time imaging The most idealistic way of three-dimensional echocardiography is on-line data acquisition
and display of three-dimensionalullages of the heart.

112 CHAPTER 9
A volumetric pyramidal ultrasound imaging probe has been developed and preliminary experience has proved its promising prospects both in on-line display of three-dimensional cardiac anatomy and in quantification of ventricular volume and function. 4S
-47 The advantage of
this technique is that it acquires directly three-dimensional linages of the heart, saving computer interpolation of the cross-sectional images, and thus could avoid spatial motion artifacts and result in anatomically accurate three-dimensional data set.
Rcvien' of Literature on Left Ventl'iculal' Volume l\tIeasurcmcl1f by ThrecRDimensiollal Echoca .. diogt'uplty
Many studies have been directed in quantification of left ventricular volumes and function by three-dimensional echocardiography in comparison with previously established conventional methods. 22
-26
, 30-31, 33, 48-49 An overview of the results of these studies is summed up and shown in the table below. Here in this article, we will discuss two most sophisticated and presently most commonly used methods for left ventricular volume and function measurements. Table, Tlu·ee-dimensional echocardiographic left ventricular volume and function measurements in comparison with other established methods Authors 3D Mea,u",ments Validalion Method;; Linear Regression N SEE MO+SO
Nixon et al Yl LVVe..:! angiogr.Jphy y=O.39x+101 9 .95 9ml <.001 LVVes r=O.75x+21 9 ." 7ml <.001
Fazzalari el al ll LVVcd&es angiography y.={J.73x-L73 24 .86 8.51ml <.05 LVSV y=51x+1.01 12 .88 4.40ml <.001 LYVed&e;; 20 F..:ho (area· y=I.09.\-.-o.09 52 .99 2.60ml LVSV length) y=l.06x+O.09 26 .99 1.67ml LVVed&es y=I.1x·0.6 " .97 5.47ml LVSV 2D Echo (biplane) y=I.25x.{).73 26 .97 2.4Jml
Zoghbi et alH LVVed angiography r.={J·8X+.U 24 .92 23ml LVVc, y=O,971;:·1 24 .96 16ml LVEF }"=1.17x·--1- 24 .82 IO':~_
Gopal et al23 LVVe..:! MRI y=O.8--h+22 " .92 6.99ml <.001 LVVe;; y=O.51x+18.2 " .81 4,01ml <.001
Ilandschumacher LVV actual value )"=0.99.\+0.11 II .99 5.9m! 4.6ml et all) LVSV lOE (Doppler) y=O.97x~O.9.J 28 .95 3.2ml 2.lm!
Siu et al ll LVV actual ya!ue )"-=1.0x·0.79 " .98 3.S8ml 0.8:1:3,6ml LVSV y=O.9Sx·0.lS 38 .96 2.99m! -O.6±J.Om! LVEF y=O.99.\+o.29 38 .96 5.Mm! -.-o.3±S.6ml
King e! al~9 LVVoo MRI y.={J.S.Jx+22 15 .92 6.99ml <JlOl LVVe, y.={J.SI.HI8.2 IS .81 4.01ml <JlOl LVVed y=O.72x+29.7 JO .90 7.0ml <.001 LVVes y=O.45x+20.2 JO .88 3.lml <.001
Sapin et aiLS LVVed angiography y.={J.S8.HI.9 35 .97 11m! <J)OOI 12.9±12.7ml LVYes y.={J.86~-+8.8 35 .9S 1O.2ml <.0001 -O.7±12.4m1 LVEF y=O.79.H.057 35 .81 .103% <.0001 6.6±9.S%
Gopal ctaf1 LYF.F (00,,,"',, I) RNA y=O.79x+9.39 51 ." S.3S% o.57:t6_6S% LVEF(0!:o;"''' I) )'=0.80.'1:+7.72 51 .97 3.6--1-% 1.37±S5.J%
Nosir et af6 LVEF RNA y.={J.9x+3.7 25 .99
3D - three-dimensional echocardiography; N :::: number of subjects; SEE:::: standard error of estimate, 1'.1D :::: mean difference; LVV :::: left ventricular volume, cd:::: end-diastolic; es:::: end-systolic; SV= stroke volume; LVEF:::: LV ejection fraction; MRI:::: magnetic resonance imaging;; RNA:::: radionuclide angiography.

QUANTIFICATION OFLVV AND FUNCTION BY 3DE 113
\Vedge slIllllllatiolllllethod This method for left ventricular volume measurement is employed in three-dimensional
data set acquired using free-hand imaging with a line or image plane for spatial alignment reference?2-25, 33, 49 For measurement of end-diastolic or end-systolic left ventricular volume, the respected frame from each acquired cine loop is selected and the endocardium traced.
/ J \ ~~ ~~
I~
Figure 2. Schematic drawings showing the principle of left ventricular volullle measurement by summation of wedges method. The three-dimensional data set of left ventricle is obtained randomly. The slices of left ventricular cavity between traced endocardial borders arc divided into multiple (180) sectors or wedges. Each wedge will then be subdivided into three tetrahedrons. The volume of eaeh tetrahedron will be calculated automatically by the computer as well as the volume of each wedge. TIle summation of the volume of all the wedges of all slices yield the total volume of the left ventricle at a given frame(cardiae phase).
Figure 3. Schematics showing the principle of left ventricular volume measurement by summation of discs method. TIle sequentially acquired volumetric three-dimensional data set of the left ventricle can be sectioned into multiple equidistant parallel slices or discs. TIle left ventricular endocardial border on each slice is traced and the area as well as the volume of each disc derived by the computer. Summation of the volumes of the traced cavity on all slices yield the total volume of the left ventricle al a given lime (such as end-diastole or end-systole).

114 CHAPTER 9
The traced borders are divided into 180 equidistant segments by interpolation and a centroid is defined automatically for each traced endocardial border. Consecutive pairs of corresponding points on adjacent borders arc connected forming a pair of triangles that is also connected to the centroid of each tracing so as to define a sector or wedge resulting in 180 wedges enclosing the volume between the two traced boundaries. Then each wedge is decomposed into three tetrahedrons and the volume of each tetrahedron and the total volume of the 540 tetrahedrons between the two boundaries are yielded. Volume between all tracings arc in turn calculated and sumllled up to yield the total volume of the left ventricle at end-diastole or end-systole (Fig. 2).
Disc summation method With yoxel-based or volumetric three-dimensional data set acquired with sequential or on
line image collection, the left ventricle can be electronically sectioned into multiple parallcl equidistant short-axis slices (discs), The left ventricular cavity is traced along the endocardium on each short-axis image. Area of the traced region on each slice is derived and the volume is calculated by the computer provided with the known slice thickness. A summation of the segmental left ventricular volumes on all slices yields the total volume of the left ventricular cavity at that time point (end-diastole or end-systole) (Fig. 3).26 Subtraction of end-systolic volume from end-diastolic volume results in stroke volume of the left ventricle. The percentage of stroke volume over end-diastolic volume represents left ventricular ejection fraction.
Voxel-Based Three-Dimensional Echocardiogl'aphy: The Standard for Left Ventricular Volume and Function Assessment
Voxel-based three-dimensional echocardiography, for its ability of accurately measure left ventricle volumes and function as well as tissue-depicting demonstration of global and regional left ventricular myocardial performance in various clinical settings, has a great potential of becoming a new gold standard for left ventricular volumetric measurements instead of invasive angiography, radionuclide angiography and magnetic resonance imaging. With their many limitations that have been discussed above, these methods should no longer be used for routine clinical left ventricular volume measurement unless other purposes that need their specific diagnostic abilities such as coronary angiography are to be carried Ollt at the same time. Threedimensional echocardiography, on the other hand, is noninvasive without any clinically recorded side effects and can be performed in many clinical scenarios and thus is ideal for daily pClformance and for serial follow-up examinations of left ventricular volume and function. Volume-rendered three-dimensional echocardiography has been used for reevaluation and reflllement of the standard two-dimensional echocardiographic methods for left ventricular volume quantification.S0-
51

QUANTIFICATION OF LVV AND FUNCTION BY 3DE 115
Present Limitations and Future Directions Regardless of the many improved techniques in three-dimensional echocardiography, time
consumption has been the major limitation that hampers its routine employment for daily diagnostic echocardiography and for left ventricular volume and function assessment. Sequential data acquisition with ECG and respiration gatings takes several to 10 minutes, movement of the patient or probe during this period may lead to motion artifacts in the acquired data set and error in volume measurements. Faster data acquisition that is being investigated using high speed transducer or a volumetric real-time three-dimensional echocardiographic transducer rotation will minimize this drawback. Data processing and threedimensional image reconstruction has been accelerated and on-line proceSSIng and reconstruction is under investigation. Manual cndocardial tracing needed for volume measurcment is both laborious and prone for subjective ell'ors. Development of various automatic border detection algorithms along with the improvement of ultrasound spatial resolution and advances in other novel modalities such as digital imaging, power-mode Doppler tissue imaging and development of stable intravenous ultrasound contrast agents that enhance the delineation of endocardium should be able to avoid the need of manual border tracing and provide automatic, even on-line, volume measurement.
REFRENCES The Multicenter Postinfarction Research Group. Risk stratification and survival after myocardial infarction. Nell' Eng! J Med 1983;309:331-336
2 Alderman EL, Fisher LD, Litwin P, Kaiser GC, Myers \VO, ~'Iaynard C, Levine F, Schloss M. Results of coronary artery surgery in patients with poor left ventricular function (CASS). Circulation 1983;68:785-795
3 Boucher CA, Bingham JB, Osbakken MD, Okada RD, Strauss HW, Block PC, Levine PH, Phillips HR, Pohost GM. Early changes in left ventricular size and function after correction of left ventricular volume overload. Am J Cardio!1981 ;47:991-1004
4 SerfllYs P\V, Somoons ML, Suryapranata H, Venneer F, Wijns \V, Van Den Brand M, Bar F, Zwaan C, Krauss XH, Remme WJ, Res J, Verheught FWA, Van Domburg R, Lubsen J, Hligenholtz PG, for the Working Group on Thrombolytic Therapy in Acute Myocardial Infarction of the Netherlands Interuniversity Cardiology Institute. Preservation of global and regional left ventricular function nfter early thrombolysis in acute myocardial infarction. J Am Call CardioI1986;7:729-742
5 Borow K, Green LH, Mann T, Sloss LJ, Braunwald E, Collins 11 Jr, Cohn L, Grossman \V. Endsystolic voluille as a predictor of postoperative left ventricular performance in volume overload from valvular regurgitation. Alii J Med 1980;68:655-663
6 Cohn PF, Gorlin R, Cohn L, Collins JJ. Left ventricular ejection fraction as a prognostic guide in surgical management of coronary and valvular heart disease. Am J Cardio! 1974;34: 136-141
7 Cintron G, Johnson G, Francis G, Cobb F, Colm IN, for the V-HeFT VA Cooperative Studies Group. Prognostic significance of serial changes in left ventricular ejection fraction in patients with congestive heart failure. Circulation 1993;87(suppl VI):VI-17-VI-23

116 CHAPTER 9
8 Chapman CB, Baker 0, Reynolds J, Bonte FJ. Use of biplane oinefluorography for measurement of ventricular volume. Circulation 1958; 18: 1105-1117
9 Dodge HT, Sandler H. Ballew DW, Lord JD Jr. The use of biplane angiocardiography for measurement of left ventricular volume in man. Am Heart J 1960;60:762-776
10 Kennedy J\V, Trenholme SE, Kasser IS. Left ventricular volume and mass from single-plane cineangiocardiogram. A comparison of anteroposterior and right anterior oblique methods. Am Heart J 1970;80:343-352
11 Cohn PF, Gorlin R, Adams OF, Chahine RA, Vokonas PS, Herman MY. Comparison of biplane and single plane left ycntriculograms in patients with coronary artery disease. Am J Cardial 1974;33: 1-6
12 Levy \Ve, Cerqucira MD, Matsuoka DT, Harp OD, Sheehan PH, Stratton JR. Four radionuclide methods for left ventricular volume determination: comparison of a manual and automated technique. J Nuc/ Med 1992;33:763-770
13 Shah PK, Picher M, Berman DS, Singh BN, Swan HJC. Left ventricular ejection fraction determined by radionuclide ventriculography in early stages of flrst transmural myocardial infarction. Am J Cardia! 1980;45:542-546
14 Slutsh.'}' R, Karliner J, Ricci D, Kaiser R, Pfisterer M, Gordon D, Peterson K, Ashburn W: Left ventricular volumes by gated equilibrium radionuclide angiography: A new method. Circulation 1979;60:556-564
15 Dilworth LR, Aisen AM, Mancini GBJ, Lande I, Buda AJ. Determination of left ventricular volumes and ejection fraction by magnetic resonance imaging. Am Heart J 1987;113:24-32
16 Van Rossllm AC, Visser FC, Sprenger :r."I, Van Eenige MJ, Valk J, Roos lP. Evaluation of magnetic resonance imaging for detennination of left ventricular ejection fraction and comparison with angiography. Am J Cardia! 1988;62:628-633
17 Feigenbaum H, Popp RL, \Volfe SB, Troy BL, Pombo JF, Baine CL, Dodge HT: Ultrasound measurements of left ventricle. A correlative study with angiocardiography. Arch Intern Med 1972; 129:461-467
18 Parisi AF, Moynihan PF, Feldman CL, Folland ED. Approaches to determination of left ventricular volume and ejection fraction by real-time two-dimensional echocardiography. Clill Cardiol 1979;2:257-263
19 Schil1er NB, Acquatel1a H, Ports TA, Drew 0, Goerke J, Ringertz H, Silvennan NH, Brundage B, Botvillick EH, Boswell R, Carlsson E, Pannley WW. Left ventricular volume from paired biplane two dimensional echocardiography. Circulation 1979; 60:547-555
20 Gehrke J, Leeman S, Raphael M, Pridie RB. Noninvasive left ventricular volume determination by two-dimensional echocardiography. Br Heart J 1975;37:911-9 J 6
21 Fol1and ED, Parisi AF, Moynihan PF, Jones DR, Feldman CL, Tow DE. Assessment of left ventricular ejection fraction and volumes by real-time, two-dimensional echocardiography: a comparison of cineangiographic and radionuclide techniques. Circulation 1979;60:760-766
22 Gopal AS, Shell Z, Sapin PM, Keller AM, Schnellbaecher MJ, Leibowitz DW, Akinboboye 00, Rodney RA, Blood DK, King DL: Assessment of cardiac function by three-dimensional echocardiography compared with conventional noninvasive methods. Circulation 1995;92:842-853
23 Gopal AS, Keller AM, Rigling R, King Jr DL, King DL: Left ventricular volume and endocardial surface area by three-dimensional echocardiography: comparison with two-dimensional echocardiography and nuclear magnetic imaging in nonnal subjects. JAm Coil Cardiol 1993;22:258-270

QUANTIFICATION OF LVV AND FUNCTION BY 3DE 117
24 Siu SC, Rivera Th1, Guerrero JL, Handschumachcr MD, Lethor JP, Weyman AE, Levine RA, Picard MH: l1lfce-dimcnsional echocarrliography: in vivo validation for left ventricular volume and function. Circulation 1993;88 [part 1]:1715-1723
25 Sapin PM, Schroder KM, Gopal AS, Smith :MD, DeMaria AN, King DL: Comparison of two- and three-dimensional cchocardiography with cinevcntdculography for measurement of left ventricular volume in patients. JAm Coil CardioI1994;24:1054-1063
26 Nosir YFM, Fioretti PM, Vlcttcr WB, Boersma E, Salustri A, Postma IT, Reijs AEM, Ten Cate PJ, Roelandt JRTC: Accurate measurement of left ventricular ejection fraction by three-dimensional echocardiography. A comparison with radionuclide angiography. Circulation 1996;94:460-466
27 Teichholz LE, Kreulen T, Herman MV, Gorlin R. Problems in echocardiographic volume determinations: echocardiographic-angiographic correlations in the presence or absence of asynergy. Alii J CardioI1976;37:7-11
28 Nixon JV, Blomqvist CG, Willerson IT. Serial echocarrliography in patients with acute myocardial infarction: its value and prognostic significance. Ellr J Cardiol 1979;9: 161-172
29 \Vyatt HL, Meerbaum S, Gueret P, Corday E. Cross-sectional echocardiography. ill. Analysis of mathematical models for quantifying volumes of symmetric and asymmetric left ventricles. Am Heart J 1980;100:821-828
30 Nixon lV, Saffer SI, Lipscomb K, Blomqvist CG: Three-dimensional echovcntriculography. Am Hearl J 1983; 106:435-442
31 Fazzalari NL, Goldblatt E, Adams APS: A composite three-dimensional echocardiographic technique for left ventricular volume estimation in children: comparison with angiography and established echocardiographic melhod. J Cli" Ultrasound 1986; 14:663-674
32 Gustavsson T, Pascher R, Caidahl K. Model based dynamic 3D reconstruction and display of the left ventricle from 2D cross-sectional echocardiograms. Computerized Medical Imaging alld Graphics 1993;17:273-278
33 Handschumacher MD, Lethor JP, Sill SC, Mele D, Rivera M, Picard rvrn, \\'eyman AB, Levine RA. A new integrated system for three-dimensional cchocardiographic reconstruction: development and validation for ventricular volume with application in human subjects. J Am Call Cordial 1993;21 ;743-753
34 Gopal AS, King DL, Katz J, Boxt LM, King DL Jr, Shao MY. Three-dimensional echocardiographic volume computalion by polyhedral surface reconstruction: In vitro validation and comparison to magnetic resonance imaging. J Am Soc Eclwcardiogr 1992;5: 115-124
35 Geiser EA, Christie LG Jr, Conetta DA, Conti CR, Grossman GS. A mechanical arm for spatial registration of two-dimensional echocardiographic sections. Catllet Cardiovase Diagll 1982;8:89-10 I
36 Jiang L, Vazquez de Prada lA, Handschumacher MD, Yuille C, Guererro JL, Picard MH, Joziatis T, Fallon IT, "'eyman AB, Levine RA. Quantitative three-dimensional reconstruction of aneurysmallefl ventricles: in vitro and in vivo validation. Circulation 1995;91 :222-230
37 Jiang L, Siu SC, Handschumacher .MD, Guererro JL, Vazquez de Prada JA, King ME, Picard MH, \Veyman AE, Levine RA. Three-dimensional echocardiography: in vivo validation for right ventricular volume and function. Circulation 1994;89:2342-2350
38 liang L, Siu SC, Handschumacher MD, Guererro JL, Vazquez de Prada lA, King ME, Picard MH, Weyman AE, Levine RA. Three-dimensional echocardiography: in vivo validation for right ventricular volume and function. Circulation 1994;89:2342-2350

118 CHAPTER 9
39 Pandian NO, Roelandt JR, Nunda NC, Sugcng L, Cao QL, Azevedo J, Schwartz SL, Vannan MA, Ludomirski A, Marx G, Vogel M. Dynamic three-dimensional echocardiogmphy: Methods and clinical potential. EcllOcardiography 1994: II :237-259
40 Salustri A, Roelandt 1. Three dimensional reconstruction of the heart with rotational acquisition: methods and clinical applications. Br Heart J 1995;73: 10-15
41 Delabays A, Pandian NO, Cao QL, Sugcng L, Marx G, Ludomirski A, Schwartz S. Transthoracic real-time three-dimensional echocardiography using a fan-like scanning approach for data acquisition: methods, strength, problems, and initial clinical experience. EcllOcardiograph)' 1995;12:49-59
42 Borges AC, Bartel T, Muller S, Baumann G. Dynamic three-dimensional transesopbageal cchocardiography using a computed tomographic imaging probe-clinical potential and limitation. International J Cardiac Imaging 1995; 11 :247-254
43 Roelandt J, Salustri A, Vletter 'V, Nosir Y, Bruining N. Precordial multipianc echocardiography for dynamic anyplane, parapiane and three-dimensional imaging of the heart. The T!wraxcellfre Journal 1994;6(5):4-13
44 Yao J, Cao QL, Masani N, Delabays A, Magni G, Acar P, Laskari C, Pandian NG. Three-dimensional echocardiographic estimation of infarct mass based on quantification of dysfullctionalleft ventricular mass. Circulation (in press)
45 Sheikh KH, Smith SW, Von Ramm OT, Kisslo J: Real-time, three-dimensional echocardiography: feasibility and initial use. EcllOcardiography 1991 ;8: 119-125
46 Feishman CE, Ota T, Li J, Bengur AR, Von RanUll 0, Kisslo J: Real-time, three-dimensional echo: System improvements, scanning methods and normal cardiac anatomy [abstract ]. J Am Coli Cordial 1996;27(2) [suppl A]: 149A
47 Fleishman CE, Ota T, Ohazama Cl, Stetten G, Lewis CW, Li J, von Rmnm OT, Kisslo J: Real-time three-dimensional 'cchocardiography: Measurement of left ventricular mass in dogs [abstract J. Circlliation 1996;94(8):1-688
48 Zoghbi 'VA, Buckey JC, Massey MA, Blomqvist CO: Determination of left ventricular volumes with use of a new nongeometric echocardiographic method: Clinical validation and potential application. J Am Call CordioI1990;15:610-617
49 King DL, Gopal AS, Keller AM, Sapin PM, Schroder KM: Three-dimensional echocardiogmphy. Advances for measurement of ventricular volume and mass. Hypertellsion (suppl I) 1994;23:1-172-1-179
50 Katz AS, Wnllerson DC, Pini R, Devereux RB. Visually detemlined long- and short-axis parasternal views and four- and two-cambcr apical echocardiogmphic views do not consistently represent paired orthogonal projections. Am J NOllillvosil'e CardioI1993;7:65-70
51 Nosir YFM, Vletter WB, Boersma E, Frowijn R, Ten Cate FJ, Fioretti PM, Roelandt JR. TIle apical long axis rather than the two chamber view should be llsed in combination with four chamber view for accurate assessment of left ventricular volumes and [ullction. EliI' Hearl J 1997;18:1175-85

MY A ASSESSMENT BY 3DE 119
CHAPTER 10
ACCURATE MITRAL VALVE AREA ASSESSMENT IN PATIENTS WITH MITRAL STENOSIS BY THREE
DIMENSIONAL ECHOCARDIOGRAPHY
Qingwei Chen MD, Youssef F.M. Nosit· MD, Wim B. Vletter BSc, Peter P. Kint RN, Alessandro Salustri MD and Jos R.T.C. Roelandt MD
From the Thoraxcenter, Division of Cardiology, University Hospital Rotterdam - Dijkzigt and Erasmus University, Rotterdam, The Netherlands
J Alii Soc Echocardiogr. 1997;10:133.40
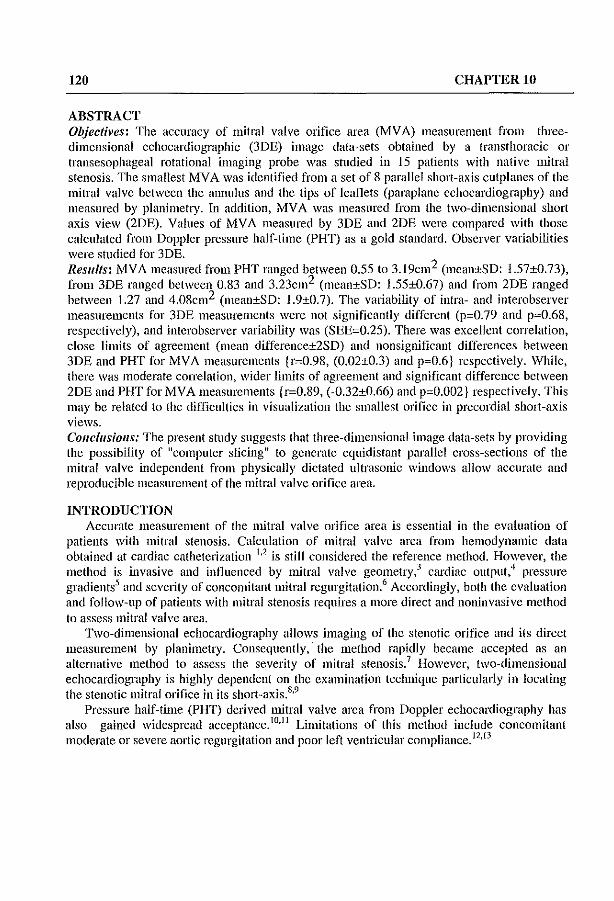
120 CHAPTER 10
ABSTRACT Objectives: The accuracy of mitral valve orifice aren. (MV A) measurement from threedimensional echocardiographic (3DE) image data-sets obtained by a transthoracic or transesophageal rotational imaging probe was studied in 15 patients with native mitral stenosis. The smallest MV A was identified from a set of 8 parallel short-axis cutplanes of the mitral valve between the annulus and the tips of leaflets (paraplanc echocardiography) and measured by planimetry. In addition, MY A was measured from the two-dimensional short axis view (20E). Values of MV A measured by 30E and 20E were eompared with those calculated from Doppler pressure half-time (PHT) as a gold standard. Observer variabilities were studied for 30E. ReslIlts: MYA measured from PHT ranged between 0.55 to 3.19cm2 (mean±SO: 1.57±0.73), from 3DE ranged between 0.83 and 3.23em2 (mean±SD: 1.55±0.67) and from 2DE ranged between 1.27 and 4.08em2 (mean±SD: 1.9±0.7). The variability of intra- and interobserver measurements for 3DE measurements were not significantly different (p=O.79 and p=O.68, respectively), and interobserver variability was (SEE=O.25). There was excellent correlation, close limits of agreement (mean difference±2SD) and nonsignificant differences between 30E and PHT for MY A measurements (1',,0.98, (0.02±0.3) and p,,0.6) respectively. While, there was moderate correlation, wider limits of agreement and significant difference between 20E and PHT for MV A measurements (1',,0.89, (-0.32±O.66) and p,,0.002) respectively. This may be related to the difficulties in visualization the smallest orifice in precordial short-axis views. Conclusions: The present shldy suggests that three-dimensional image data-sets by providing the possibility of "computer slicing" to generate equidistant parallel cross-sections of the mitral valve independent from physically dictated ultrasonic windows allow accurate and reproducible measurement of the mitral valve orifice area.
INTRODUCTION Accurate measurement of the mitral valve orifice area is essential in the evaluation of
patients with mitral stenosis. Calculation of mitral valve area frolH hemodynamic data obtained at cardiac catheterization 1,2 is still considered the reference method. However, the method is invasive and influenced by mitral valve geometry,3 cardiac output.4 pressure gradients5 and severity of concomitant mitral regurgitation.6 Accordingly, both the evaluation and foHow-up of patients with mitral stenosis requires a more direct and noninvasive method to assess mitral valve area.
Two-dimensional echocardiography allows imaging of the stenotic orifice and its direct measurement by planimetIy. Consequently, the method rapidly became accepted as an alternative method to assess the severity of mitral stenosis.7 However, two-dimensional echocardiography is highly dependent on the examination technique particularly in locating the stenotic mitral orifice in its short-axis.8
•9
Pressure half-time (PHT) derived mitral valve area from Doppler echocardiography has also gained widespread acceptance. IO
,11 Limitations of this method include concomitant moderate or severe aortic regurgitation and poor left ventricular compliance. 12
,I3

MV A ASSESSMENT BY 3DE 121
Recently, three-dimensional echocardiography has been introduced, and theoretically offers advantages for quantitatioll, by allowing to generate a series of equidistant parallel cross-sections through the mitral valve apparatus,14,15 Thus, the smallest orifice area can be identified and planimctry performed.
The purpose of this study was to determiue the feasibility aud reproducibility of threedimensional echocardiography for calculating mitral valve area in patients with mitral stenosis. In addition, the accuracy of mitral valve area measurement from three-dimensional cchocardiography and two-dimensional cchocardiography were compared with values obtaiued by Doppler PHT.
METHODS Study patients
We studied 15 consecutive patients (11 women, aged from 20 to 74 years, mean 50.9 years) referred to the outpatient clinic with native mitral stenosis between January 1994 and July 1996. All patients were in sinus rhythm and 4 patients had atrial fibrillation CAP). Ten patients were in functional class I and five patients in class II New York Heart Association. None of patients had undergone surgery or valvuloplasty before. Four patients had mild mitral regurgitation but non as a predominant lesion, and 6 patients had grade 1 + aortic regurgitation. Six patients had mild degree mitral valve calcification (2 at the anterior leaflet and 4 at the posterior leaflet) (see table I). They all underwent Doppler, two-dimensional echocardiography and three-dimensional echocardiographic examinations. Informed consent for three-dimensional echocardiographic examination was obtained.
ECHO CARDIOGRAPHIC STUDIES Two-dimensional echocardiography and continuous-wave Doppler studies were
performed with a Vingmed CFM 800 using a 2.5 MHz phased-array transducer. Twodimensional echocardiographic images were recorded on VHS videotape. Doppler velocity traces were recorded with a strip chart recorder at a paper speed of 100 mmls.
Two-dimensional echocardiographic analysis of the mitral valve area were made from the precordial parasternal short-axis views,16 The smallest orifice of the mitral valve was identified by scanning from the left atriulll in the direction of the left ventricular apex. The gain settings were adjusted until the lowest level was determined at which the circumference of the mitral orifice was still visible. After identification of the videoframe with the oritice at its maximal opening in early diastole, mitral valve area was measured by planimetry of its contours using a digitizing tablet. The mean value of five consecutive mitral valve area measurements of cardiac cycles was used. Two-dimensional echocardiographic measurement of mitral valve area was repeated in one patient (patient 4) due to error in the calibration procedure.
For Doppler analysis, continuous-wave Doppler recordings of transmitral blood flow velocity were made in the apical four-chamber view. Doppler velocity recordings were traced on a digitizing graphics tablet and analyzed with an off-line computer analysis system. Mitral valve area was determined by the PHT method. 10.11 A mean value was calculated from

122 CHAPTER 10
analysing 10 consecutive beats from a series of 16 beats in each patient with sinus rhythm, while 15 beats were used in patients with AF.
THREE-DIMENSIONAL ECHOCARDIOGRAPHY image acquisition procedure:
Tmnsesophageal acquisition (TEE) of the cardiac cross-sections for reconstruction was performed in 6 patients (patients 1-6, table I) using a 5 MHz, 64-element rotational-anay transducer (Delft Medical Imaging B.V,Delft, The Netherlands) mounted at the distal end of a standard gastroscope.17,18 The control knob on the 1ll1lltiplane probe is mechanically rotated via a custom-build wheel-work inteliace by a step motor which is cOlllmanded by a computer algorithm which controls the acquisition of cross-sections which fall within preset ranges of heart cycle length by EeG-gating and respiratory phase by thoracic impedance measurement, for optimal temporal and spatial registration. Standard transesophageal examination procedures were followed. 19 The imaging transducer was positioned at the mid-esophageal level to acquire the cross-sectional images of the mitral valve for the three-dimensional reconstruction.
Transthoracic acquisition (TIE) was performed in 9 patients (patients 7-15, table I ) with a custom-build transducer assembly. 20 A cOIllmercially available 2.5 MHz transducer is fixed in a cog-wheel which fits into a cylindrical holder. The transducer is rotated by a step-motor which is commanded by the same computer algorithm as used for the transesophageal acquisition. The patient was lying in a 45-degree left recumbent position and the transducer placed over the apical window which allowed best visualization of the mitral valve.
Both the transesophageal and precordial transducer systems were interfaced with a Toshiba SSH-140A system and the video output connccted to the three-dimensional reconstruction system (Echo-scan, Tom-Tee GmbH, Munich, Germany). The operator has to locate the center axis around which the imaging plane is rotated to encompass the mitral valve. The cross-sections are sampled at 40 ms intervals (25 frames/s), digitized and stored in the computer memory. After for a given cross-section the preset cardiac cycle and respiration phase criteria are fulfilled, this cardiac cycle is accepted and the step-motor is activated to rotate the transducer 2 degrees to the next scanning plane. Then, the same steering-logic is followed. To fill the conical data volume, 90 sequential cross sections must be obtained each during a complete cardiac cycle. Inadverted patient and probe movement during the image acquisition must be avoided. In some instances two acquisition sequences are necessary. Image processing:
The acquired cardiac images are formatted in their conect sequence according to their ECG phase in volumctric data sets (256*256*256* pixel/each 8 bit). The post-processing of the data set is performed off-line using the reconstruction software. To fill the gaps between images conversion from polar to Cartesian coordinates is necessary. A ROSA (Reduction Of Spatial Artefacts) filter is used to reduce motion artefacts created by patients, probe movement or respiration. Image display: The mitral valve can be visualized in computer generated long-axis and short-axis views from the three-dimensional data-set. The mitral valve is transected in shOlt axis planes from the
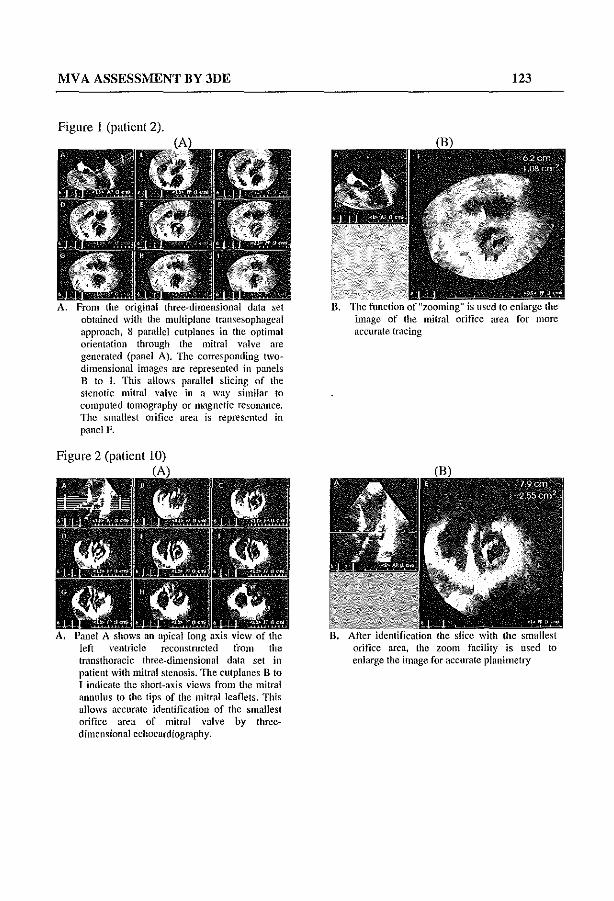
MV A ASSESSMENT BY 3DE
Figure I (patient 2).
A. From the original three-dimensional data set obtained with the muitipianc lransesophageal approach, 8 parallcl cutplanes in the optimal orientation through the mitral valve are generated (panel A). TIle corresponding Iwodimensional images are represented in panels B to I. This allows parallel slicing of the stenotic mitral valve in a way similar to computed tomography or magnetic reSOn.1llce. TIle smallest orifice area is represented in panel F.
Figure 2 (patient 10)
left ventricle reconstructed from the transthoracic three-dimensional data sel in patient with mitral stenosis. The clilpianes B to I indicate the short-axis views from the mitral annulus to the tips of the mitral leaflets. This allows accurate identification of the smallest orifice area of mitral valve by thrcedimensional echocardiography.
123
image of the mitral orifice area for more accurate tracing
orifice area, the zoom facility is used to enlarge the image for accurate planimetry

124 CHAPTER 10
annulus to the tips of the leaflets in early diastole when the valve is maximally opened by equidistant 8 parallel cutplanes at 3-l11m intervals. The smallest mitral valve area is visually identified from these images. The mitral valve area measurement procedure is illustrated in figures I and 2.
Image analysis: After identifying the cross-section with the smallest orifice area, a "zoom" function is
used to enlarge the mitral orifice area for more accurate planimetric measurement of the mitral valve area. The mitral valve area is determined as the mean value of 10 circumference measurements
Feasibility Acquisition of the three-dimensional echocardiographic data-set and reconstruction was
possible in all patients. Calibrating the system, optimizing the position of the probe and gain settings and acquisition required approximately 10 minutes. Off-line image post-processing and analysis required approximately 60 minutes. Both transthoracic and transesophageal approaches provided adequate visualization of the mitral valve area for quantitative analysis.
STATISTICAL ANALYSIS All values are expressed as mean ± SD. Mitral valve area obtained with the different
methods was compared by analysis of variance for measurement. Significant differences between groups were assessed using the paired two-tailed student's test. Differences were considered statistically significant at a p value of <0.05. The conelation between mitral valve area obtained from the three-dimensional echocardiographic data set and two- dimensional echocardiographic planimetric methods with values obtained by Doppler PHT was determined by using linear regression analysis. The limits of agreement between mitral valve area obtained from the three-dimensional echocardiography data set and Twodimensional echocardiography planimetric methods with values obtained by Doppler PHT were assessed as described by Altman and Bland.21
RESULTS Intra-and interobserver variability of the three-dimensional echocardiogl'aphic measurements
The mitral valve area measurements of IS patients determined from Doppler PHT, threedimensional echocardiography and two-dimensional echocardiography are presented in Table 1. To assess the variabiJity of the measurement of the mitral valve area by the threedimensional echocardiography method, the measurements were repeated in 10 patients by the same observer 3 weeks after the initial evaluation. Another observer independently performed the detelmination in all patients to obtain interobserver variability. Observers were blinded to each other's results. The correlation coefficient obtained between the two observers was 0.99 (y=O.OI+O.99x, SEE=O.25). Intra- and interobserver measurements were not significantly different (p=O.79 and p=O.68, respectively).

MV A ASSESS1\IENT BY 3DE 125
TABLE 1: Clinical data and mitral valve area (MVA) in 15 patients with mitral stenosis . . "~"~~~~~""~······~~(~~;~Tl~···~·~·· •.•.•..•••.•.. :~__ . ..~"~ ....
PHT 3DE 2DE AR Age Gender AF Calc if. Mean(Range) Mean(Range) Mean(Rullge) grade
I 67 F +, post. 1.96(1.79·2.00) 1.78(1.71·1.80) 2.23(2.18·2.39)
2 41 F 1.14(1.13·1.16) 1.05(0.92·1.17) 1.32(1.27·1.37) + 3 66 F IAO( 1.32· 1.49) 1.20(1.13·1.34) 1.53(1.44·1.58) + 4 52 F +,ant. 0.55(0.45·0.65) 0.83(0.72-0.91 ) 1.35( 1.25·1045)
5 51 F 0.93(0.85· 1.04) 0.97(0.86·1.02) 1.33(1.29·1.36)
6 74 tv! +, post. 1.71(1.64·1.79) 1.56(1.42·1.61) 1.5 I (1.43·1.59)
7 43 M 0.89(0.78·1.02) 1.06(0.94·1.15) 1.78( 1.64·1.84)
8 51 F 1.74(1.67·1.84) 1.88(1.82·1.89) 1.95(1.91·2.02) + 9 20 F 3.19(2.93·3.34) 3.23(3.13·3.34) 4.08(3.98.4.15)
10 28 F +, ant. 2.55(2.33·2.62) 2.54(2.40·2.61) 2045(2.25·2.52)
11 72 M + 2.3 (1.75·3.1 ) 2.1 (1.88·2.39) 2.56(2.52·2.80) + 12 62 F + 1.1 (0.87·1.36) 1.2 (1.09·1.32) 1.5 (1.46·1.66) + 13 37 M + +, post. 1.4 (1.03·1.77) 1.47(1.24·1.68) 1.76( 1.63·1.91) + 14 61 F + +. post. 1.09(0.74·1.33) 0.87(0.51·0.92) 1.27(0.85·1.40)
15 38 F 1.60( 1.39·1.89) 1.5 (1.19·1.61) 1.7 (1.66·1.83) '~"-'-'-'_~~_"~'="~~O'. __ '_~C_E"·"~~'~Y~'~'~ __ ~~~'_a'~"",",~", __ "=="",~~~~=,==~~ _ ,~
AF=atrial tlbrillation, 3DE=thrce~dimensional echocardiography; Calcif.- calcification, PHT-pressure half-time; 2DE:::two-dimensionaI echocardiography; AR=aortic valve regurgitation: + prescnt, - absent, anl.=unterior mitral valve leaflct, POSI.=poslerir mitral valve leaflet, values between brackets represents the range of MVA measurements for each patient.
3DE versus PHT
" PHI - MVA (em)
(A)
r~O.9B
n-15
':
('I 4l El 2. I ~ 3, , . , w a "
2DE versus PHT
l' /// rn O.89 0-15
o( 2 -,,--"-,~, PHI. MVA (em) 2
(B) Figure 3. (A) Linear-regression analysis compares the 3DE with the Doppler PHT method for the calculation of MV A. r=0,98, (B) Linear-regression analysis compares the 2DE with the Doppler PHT method for the calculation of MV A. r=0.89.
Three-dimensional echocardiography versus Doppler PHT method. Mitral valve area determined by three-dimensional echocardiography ranged from 0.83 to
3.23 cm2 (mean±SD: 1.55 ± 0.67). These values correlated well with the calculated PHT mitral valve area (range 0.55·3.19 cm2; mcan±SD: 1.57±0.70), the cOlTelation coefficient being 0.98 (Fig 3A). There was no statistically significant difference and close limits of

126 CHAPTER 10
agreement between the mitral valve area obtained by three-dimensional echocardiography and that measured from the Doppler PHT (p=O.62) (agreement = O.02±O.3) (Fig 4A).
Mitral Stenosis: Valve Orifice Area Agreement Between 3DE and PHT
,~ e . g !
5 i II-C,N· • • to •
~ 01 ~. • •
J ~ " "0 I.
M.,a." PHT and 3DE (vi')
(A)
).1+ 2S0
u· ,so
Mitral Stenosis: Valve Orifice Area Agreement Between 2DE and PHT
'c ~i i w o " . 5 .,U-·D_n
" < I go'! ~ ~
. ... ...
E 02'.-__ ~_~_~~_ . " Ave'.ga PHT and 2DE (crrf)
(ll)
U.2S0
U -250
Figure 4. (A) Agreement behveen the 3DE and the Doppler PHT estimates of MVA. Difference in l\'IVA (y axis) is plotted against the mean valve of the two areas ( x axis; average 1'lVA). There were close limits of agreement between the values obtained by the two methods (-0.28, +0.32). (B) Agreement between the 2DR and the Doppler PliT estimates of IvlV A. Difference in r-"IVA (y axis) is plaited against the mean valve of the two arcas ( x axis; average MV A). l1lCre were wide limits of agreement between the values obtained by the two methods (-0.98, +0.34) and 2DE overestimate PHT MVA by (0.32 cm2).
Two-dimensional echocardiogmphy verslIs Doppler PHT method. Mitral valve area measured from two-dimensional cchocardiography ranged between 1.27
and 4.08 cm2 (1.9 ± 0.73). There was moderate correlation between the two-dimensional echocardiography and PHT mitral valve area detenninations (1'=0.89) (Fig 3B), There was a statistically significant difference between the two methods (p=0.002) and a wider limits of agreement (,0.32±O.66 cm') (Fig 4ll). Two-dimensional echocardiography overestimated the PHT determined mitral valve area by an average of (0.32 cm2).
DISCUSSION Despite many limitations, the Godin formula, described 40 years ago, is still considered
the reference method to calculate the stenotic mitral valve area in native and prosthetic valves. However, mitral valve area is not directly measured, and the method requires accurate measurement of stroke volume or cardiac output, the diastolic filling period and the mean pressure difference across the stenotic valve.4 At present, pre-operative cardiac catheterization for assessment of the severity of mitral stenosis is reserved for selected patients with either complex valvular disease or those in whom uncertainty exists after clinical and noninvasive assessment. 22
Assessment of the stenotic mitral valve area is now more and more being pelfonned noninvasively by tracing mitral valve area in two-dimensional echocardiographic images or by the PHT method derived from Doppler velocity recordings of transmitral blood flow. Most decision-making on surgical and valvuloplasty procedures is C1ll1'ently based on both of these methods. However, faithful visualization of the smallest mitral valve area by two-dimensional echocardiography does not only depend on optimal machine gain settings but also on visualizing the plane transecting the smallest mitral valve area from a parasternal window.

MV A ASSESSMENT BY 3DE 127
The stenotic mitral valve is a deformed funnel-shaped three-dimensional structure and the smallest orifice may be difficult to visualize. Even though one tries to circumvent this 1imitation by sweeping up and down the interrogating imaging plane through the valve, it is not always possible to find this optimal cross-sectioll.9,2J OUf study, although a limited number of patients was included, suggests that the mitral valve area determined by the anyplane and paraplanc analytic facilities lIsing a three-dimensional echocardiographic data set is feasible and correlates well with mitral valve area measured from Doppler PHT.
Mitral valve area derived from two-dimensional echocardiography overestimates PHT determined mitral valve area. This may be explained by limitations of visualizing the smallest orifice in parasternal short-axis views. Overestimation of 0.04 to 0.27 cm2 with correlation coefficients ranging from 0.41 to 0.95 have been reported.16,22,24~28 In our study, twodimensional echocardiography overestimated the PHT determined mitral valve area by an average of (0.32 cm2). This discrepancy between hemodynamic and echocardiographic mitral valve area measurements may in part be explained by the inability to find the optimal crosssection through the smallest orifice area from a limiting precordial acoustic window 6.16,25.
In our study, no significant differences were found between mitral valve area derived by three-dimensional echocardiography and values obtained by Doppler PHT methods, even though there were six patients associated with mild aortic regurgitation. Previous studies 12,28,29 indicated that Doppler PHT is not influenced by mild aortic regurgitation.
In our ShIdy, there were 6 patients with mild degree of mitral valve calcification but Hils did not interfere with echocardiograplilc quantification of mitral valve area. The value of two~ dimensional echocardiography in judging the pliability and the degree of calcification is well documented.30 However, in patients with massive calcification measurement of mitral valve area by two~dimensional echocardiography will be more difficult due to diffuse tlilckening of the leaflets with irregular mitral valve orifice and fused commissures. Paraplane analysis from the three-dimensional echocardiographic data set is superior to two-dimensional echocardiography, as it allows faithful screening of the mitral valve leaflet for the extent of calcification and its effect on the valve motion together with the identification of the smallest valve orifice despite the degree of calcification.
Validity and advantages of the pl'esent method The greatest advantage of acquiring a three~dimensional echocardiographic linage data set
is that, cross-sectional images of a stl1lChIre can be generated in any desired plane independent from orientations dictated by the acoustic windows. Electronic parallel slicing allows the selection of parallel cut-planes in a way similar to computed tomography or magnetic resonance imaging to select the cut-plane with the smallest orifice area. Threedimensional echocardiography, thus allows more accurate measurement of the orifice area in patients with mitral stenosis.
Limitation of the stndy At present, the major limitation of three-dimensional echocardiography is the time
consuming process of image acquisition, post-processing and data analysis. Developing faster computer and automated border recognition software for area analysis will stimulate the routine use of this method.
128 CHAPTER 10
In thCOlY, three-dimensional echocardiographic reconstructions from precordial images are of less quality than those from transesophageal images. because they have a better resolution and the probe has a closer position to the mitral valve.
CONCLUSIONS Three-dimensional echocardiography offers advantages for the morphologic assessment
of the stenotic mitral valve. The image data set also allows accurate and reproducible measurement of the stenotic mitral valve area. It appears that tius Hew technique has the potential for a more comprehensive assessment of the severity of mitral stenosis.
REFERENCES I Gorlin R, Gorlin SO. Hydraulic formula for calculation of the area of stenotic mitral valve, other
cardiac valve, and central circulatory shunts. Am Heart 11951; 41: 1-29. 2 Cohen lvfV, Gorlin R. Modified orifice equation for the calculation of mitral valve area. Am Heart 1
1972;84;839-40. 3 Flachskampf FA, 'Veyman AB, Guerrero JL, Thomas ID. Influence of orifice geometry and flow
rate on effective valve area: an in vitro study. 1 Am Coll CardiolI990;15:1173-80. 4 Carabello BA. Advances in the hemodynamic assessment of stenotic cardiac valves. 1 Am Coll
CardioI1987;10;912-9. 5 Hammermeister KE, Murray lA, Blackmon JR. Revision of Gorlin constant for calculation of mitral
valve area from left heart pressures, Br Heart 1 1973;35:392-6, 6 Fredman CS, Pearson AC, Labovitz AI, Kern MJ. Comparison of hemodynamic pressure half-time
method and Gorlin formula \vith Doppler and echocardiographic determinations of mitral valve area in patients with combined mitral stenosis and regurgitation. Am HeartJ 1990; 119: 121-9.
7 Henry 'VL, Griffith 1M, Michaelis LL, Mcintosh CL, Morrow AG, Epstein SE, Measurement of mitral orifice area in patients with mitral valve disease by real-time, two dimensional echocardiography. Circulation 1975;51:827-31.
8 Martin RP, Rakowski H, Kleiman IH, Beaver 'V, London E, Popp RL. Reliability and reproducibility of two-dimensional echocardiographic measurement of stenotic mitral valve orifice area. Am J CardioI1979;43:560-8.
9Dennig K, Rudolph \V. Mitral valve disease. In: Roeland! JRTC, Sutherland GR, lliceto S, Linker DT, eds. Cardiac Ultrasound. Churchill Livingstone: 1993:255-94.
10 Hatle L, Bmbakk A, Tromsdal A, Angelsen B. Noninvasive assessment of pressure drop in mitral stenosis by Doppler ultrasound. Br Heart J 1978;40: 131-40.
11 Hatle L, Angelsen B, Tromsdal A. Noninvasive assessment of atrioventricular pressure half-time by Doppler ultrasound. Circulation 1979;60: 1096-104.
12 Moro E, Nicolosi GL, Zanuttini 0, Cervesato E, Roelandt 1. Influence of aortic regurgitation on the assessment of the pressure half-time and derived mitral valve area in patients with mitral stenosis. Eur Heart J 1988;9:1010-17.
13 Karp K, Teien D, Bjerle P, Eriksson P. Reassessment of valve area detenninations in milral stenosis by the pressure half-time method: Impact of left ventricular stiffness and peak diastolic pressure difference. J Am Coll CardioI1989;13:594-9.
14 Salustri A, Roelandt 1. Ultrasonic three-dimensional reconstruction of the heart. Ultrasound in Mcd & BioI1995;21:281-93.
15 Roelandt 1, Salustri A, Vletter \V, Nasir Y, Bruining N. Precordial multiplane echocardiography for dynamic anyplane, parapJane and three-dimensional imaging of the heart. Thoraxcenter 1 1994;6/5:4-13.

MV A ASSESSMENT BY 3DE 129
16 \Vann LS, \Veyman AE, Feigenbaum H, Dillon Ie, Johnston K\V, Eggleton Re. Determination of mitral valve area by cross-sectional echocardiography. Ann Intern Med 1978;88:337-41.
17 Roelandt J, Ten Cate FI, Vletter \VB, Taams MA. Ultrasonic dynamic three-dimensional visualization of the heart with a multiplane transesophagcal imaging transducer. J Am Soc Echocardiogr 1994;7:217-29.
18 Roelandt J, 111OIllson JR, Vlcttcr \VB, Brommersma P, Bam N. Multiplane transesophageal echocardiography: Latest evolation in an imaging revolution. J Am Soc Echocardiogr 1992;5:361-7.
19 Mitchell MM, Sutherland GR, Gussenhoven EJ, Taams 1M, Roelandt J. Transesophageal echocarrliography. J Am Soc Echocardiogr 1988;1:362-77.
20 Roelandt J, Salustri A, Mumm B, Vletter WB. Precordial three-dimensional echocardiography with a rotational imaging probe. Echocardiography 1995; I 2:243-52.
21 Altman DO, Bland 1M. Measurement in medicine: the analysis of method comparison studies. Statistician 1983;32:307-17.
22 Leitch J\Y, Mitchell AS, Harris PJ, Fletcher PJ, Bailey BP. The effect of cardiac catheterization upon management of advanced aortic and mitral valve disease. Eur Heart J 1991 ;12:602-7.
23 Kawahara T, Yamagishi M, Seo H, et ai. Application of Doppler color flow imaging to determine valve area in mitral stenosis. J Am Coll Cardiol 1991 ;18:85-92.
24 Nair M, Arora R, Mohan JC, et a1. Assessment of mitral valve stenosis by echocardiography: utility of various methods before and after mitral valvotomy. Int J CardioI1991;32:389-94.
25 Nichol PM, Gilbert BW, Kisslo lA. Two-dimensional echocardiographic assessment of mitral stenosis. Circulation 1977;55: 120-8.
26 Smith r-.m,Handshoe R, Handshoe S, Kwan OL, Demaria AN. Comparative accuracy of twodimensional echocardiography and Doppler pressure half-time method in assessing severity of mitral stenosis in patients with and without prior commissurotomy. Circulation 1986;73: 100-7.
27 Otto CM, Davis KB, Holmes DR, et a1. Methodologic issues in clinical evaluation of stenosis severity in adults undergoing aortic or mitral balloon valvuloplasty. Am J Cardiol 1992;69: 1607-16.
28 Oraybuffi PA, Smith MD, Gurley le, Booth DC, Demaria AN. Effect of aortic regurgitation on the assessment of mitral valve orifice area by Doppler pressure half-time in mitral stenosis. Am 1 Cardiol 1987;60:322-6.
29 Moro E, Nicolosi GL, Zanuttini D, Cervesato E, Roeland!, J. Influence of aortic regurgitation on the assessment of the pressure half-time and derived mitral-valve area in patients with mitral stenosis. Eur.Heart J 1988,9:1010-17.
30 Zanolla L, Marino P, Nicolosi GL, Peranzoni PF, Poppi A. Two-dimensional echocardiographic evaluation of mitral valve calcification. Sensitivity and specificity. Chest 1982;82: 154-7.


QUANTIFICATION OF A VA BY 30E 131
CHAPTER 11
QUANTIFICATION OF THE AORTIC VALVE AREA IN THREEDIMENSIONAL ECHO CARDIOGRAPHIC DATASETS
ANALYSIS OF ORIFICE OVERESTIMATION RESULTING FROM SUBOPTIMAL CUTPLANE SELECTION
3D echo evaluation of aortic valve area
Jaroslaw D. Kasprzak* MD,PhD, YoussefF.M. Nosh' MD, Anita Dall' Agata MD, Abdou Elhendy MD, Meindert Taams MD,PhD, Folkert J. Ten Cate
MD,PhD Jos R.T.C. Roelandt MD,PhD
Thoraxcenter, Division of Cardiology, Erasmus University and University Hospital Rotterdam -Dijkzigt, Rotterdam, The Netherlands *Cardiology Department, Medical University of £6dz,
Poland
Alii Heart J 1998j135:995-1003

132 CHAPTER 11
ABSTRACT Background. OUf study was designed to determine the feasibility of three-dimensional echocardiographic (3DE) aortic valve area planimetry and to evaluate potential enors resulting from suboptimal imaging plane position. lVlethods. Transesophageal echocardiography with acquisition of images for 3DE was performed in 27 patients. Aortic valve orifice was pianimetcrcd in two-dimensional echocardiogram (2DE) and in two-dimensional views reconstl11cted from 3DE datasets optimized for the cusp tips level. To evaluate the errors caused by suboptimal cntpiane selection, orifice was also measured in cntplanes angulated by 10',20° and 30° or shifted by 1.5 to 7.5 mm. Results. Planimetered orifice areas was similar in 2DE and 3DE studies: 2.09 ± 0.97 cm2 vs 2.07 ± 0.92 cm2. Significant overestimation was observed with cutplane angulation (0.09 cm2, 0.19 cm' and 0.34 em' at 10" increments) or parallel shift (O.llem', 0.22cl11', 0.33cl11', 0.43cl11' and 0.63c1l12 at 1.5mm increments). 3DE measurement reproducibility was very low and superior to that of 2DE. Conclusions. 3DE allows the accurate aortic valve area quantification with excellent reproducibility. Relatively small inaccuracy in cutpiane adjustment is a major source of errors in aOliic valve area planimetry.
INTRODUCTION Two-dimensional (2DE) and Doppler echocardiography are principal noninvasive tools used
to obtain quantitative information concerning the aortic valve. In transthoracic echocardiography, the most common approach includes Doppler evaluation of aortic valve flow, enabling quantification of transvalvular gradient and valve resistance. Valve area calculation is usually indirect, based upon the continuity equation. I Transesophageal cchocardiography provides a better acoustic window and superior image resolution, enabling direct aortic valve area planimetry in the majority of patients?-6 This approach has been well validated and the best results are achieved by multiplane transesophageal probes. However, in some patients an optimal two-dimensional imaging plane for true aortic orifice cannot be obtained, leading to area overestimation. Recently introduced, three-dimensional echocardiography (3DE) allows the objective visualization and quantification of cardiac structures.7
-10 The method can be used for
the imaging of the aortic valve 1 1,12 but its value for area planimetry has not been assessed. Our study was conducted to analyze the feasibility, accuracy and reproducibility of the measurements of aortic valve area in two-dimensional views reconstructed from a three-dimensional echocardiographic dataset. In addition, the unique opportunity of unrestricted cutplanc manipulation in registered dataset aHowed us to quantify the errors resulting from planimetry in suboptimally selected cross-sectional images.

QUANTIFICATION OF AVA BY 3DE 133
METHODS The study group consisted of 7 patients with a normal aortic valve and 20 consecutive patients with aortic valve abnormalities diagnosed by transesophageal echocardiography and subsequently undergoing lransesophageal study. All patients were in sinus rhythm. The group included 13 WOlllen and 14 Illen of mean age 53.2 ± 17.7 years (range 22-82). Aortic pathology included 3 patients with bicuspid valve and 15 patients with acquired valve lesions; 2 patients had undergone aortic valve replacement with Ross procedure. Calcification of the aortic valve was identified in 5 patients. There was no preselection of the patients for three-dimensional cchocardiographic examination based on two-dimensional image quality.
Two-dimensional echocardiogl'aphy was performed using a Toshiba SSH-140A system with a 5 MHz, 64-element llluitiplane transesophageal transducer and a transthoracic 3.75 MHz probe. In the transesophageal study, standard precautions, patients preparation and probe insertion procedure were followed as described elsewhere. 13 For the aortic valve area planimetry, a shortaxis view of the aortic valve, optimized for the smallest orifice area wns used. The gain was set at the lowest value providing complete delineation of cusps.
Transthoracic imaging was used to coHect the data used in continuity equation. Left ventricular outflow tract (L VOT) diameter was measured immediately below the aortic nnulus in a long axis parasternal view and its area was calculated assuming a circular geometry. The LVOT flow velocity was registered at the same level using pulsed wave Doppler in apical five-chamber view. The peak transaortic flow velocity was measured with continuous wave Doppler from the apical, right parasternal or suprasternal window.
Threc~dill1ensional cchocal'diogl'aphic data acquisition and processing Informed consent for three-dimensional echocardiographic examination was obtained from
all patients. After the diagnostic 111ultiplane transesophageal study had been finished, the probe
was located at mid-esophageal level. A test sequence with 1800 rotation of the transducer alTay was performed to ensure whether the aortic valve is encompassed within the conical acquisition
volume. The basic images were acquired at 20 intervals and sampled at 25 Hz using a threedimensional echocardiographic system (Echo-Scan 3.0, TomTec GmbH, Munich, Germany). The system has been described in detail elsewhere.s
Data processing was performed off-line by the analysis program of three-dimensional echocardiographic system. RelVl·itable optical disks lVere lIsed for the permanent storage of data.
Aortic valve area lucasuremcllts. (1) Two-dimellsiollal ecilOcal'diogmphy
After the identification of the video frame with the maximal opening of the aortic valve in early systole, the area was measured by tracing of the inner CllSpS contours using a digitizing tablet. The mean value of five consecutive measurements was calculated.

134 CHAPTERll
Measurements were made independently by two experienced observers, blinded to each other's results. Additional measurements were peiformcd after 7 days for the evaluation of the intraobserver vadability.
(2) Aortic valve area meaSlIremellt by cOlltimti/y eqllatioll Planimetry of a stenotic aortic valve may be less reliable due to orifice non-planarity and
calcifications. Therefore, in the subgroup of patients with planimetered aortic valve area below 2 cm2, additional calculation of aortic valve orifice area was petformed lIsing the continuity equation (I }.The mean value of five conseclItive measurements was calculated. (3) Allyplalle tltree·dimellsiollal ecltocardiograplty
The dataset was lIsed to generate two-dimensional cross-sectional views of the aortic valve at its maximal opening during a heart cycle. A series of long-axis views was displayed as a reference for localization of the level at which the separation of aortic cusps tips was the smallest (Figure 1). A cut-line was placed at this level and a cOlTesponding orthogonal (short-axis) view was reconstructed. Subsequently, a fine angulation of tius cross-sectional image was performed to ensure a continuous orifice outline. This optimized view was used to trace the inner contour of aortic cusps using the 3DE system software. The mean value of five consecutive measurements was calculated. Measurements were made independently by two experienced observers, blinded to each other's results and to those from two-dimensional planimetry. These measurements were repeated after 7 days for the evaluation of intraobserver variability.
4. EI'aillatioll of slIboptimal cllipialles In order to evaluate possible errors in aortic valve area calculation, a series of suboptimal
valve cross-sections images was analyzed. Aortic valve area was measured in 5 paraUel planes shifted toward the aortic anulus in 1.5 mm intervals and in three planes, angulated by 10°, 20° and 30° from the initially selected. optimal plane through the valve (Figure I). The mean value of three consecutive measurements was used for each plane.
STATISTICAL ANALYSIS All data are expressed as mean ± standard deviation. Lineal' regression was used to evaluate
relations between measurements obtained with two methods and Bland-AItman l4 analysis was performed for agreement assessment. Limits of agreement were defined as mean ±1.96 x standard deviation of differences. Repeated-measures analysis of variance was used to assess the influence of imaging plane shift and angulation upon measurement of the aortic valve area. Pairwise comparisons against the optimal plane were performed with Dunnett test. A value of p<0.05 was considered statistically significant. Equality of variances was tested with F test. Observer variability was expressed in coefficients of variation (calculated as standard deviation of differences between measurements divided by the mean area value).
QUANTIFICATION OF AVA BY 3DE 135
7.5mm<>O 0102030
Figure 1. TIle principle of two-dimensional echocardiograpbic planimelry error evaluation. Left panel - cutplane adjustment wilh parallel shifts towards the anulus at 1.5mm interval from the optimal plane. Right panel - cutplane angulation al IOOintcn'ul from the optimal cutplane.
Figure 2. Parapiane echocardiography using the three-dimensional dataset of a patient with a stenotic aortic valve. All the two-dimensional views are computer-reconstructed Panel A displays a reference long-axis image enabling the placement of the short-a. xis clitpianes at different levels through the vaiyc (distance between cutplanes 1.5mm) - panels B-O. Optimized short-axis cross-section through the orifice at the level of cusp tips is shown at the panel B. Panels Hand I (shift of 9mm and IO.5mm) did not contain the area infonnation and were not used for analysis.

136 CHAPTER 11
Figure 3. valve. All the two~dilllcllsional views are computer-reconstructed Optimized short-axis cross-section through the Olit1ce at the level of cusp tips is showil at the panel B. Panel A displays a reference long-axis image enabling the placement of the angulated cutplanes (10" - C, 20" - 0, 30° ~ E). Panel F is a corresponding volume-rendered view, not used for direct planimctry with current software.
RESULTS Feasibility of two- and three-dimensional eChOC81'diogl'aphic aortic valve area Illeasurements
Transesophageal echocardiography with image acquisition for three-dimensional reconstruction was successfully performed in all patients. Additional examination time required for the calibration procedures and the 3DE data acquisition never exceeded 10 minutes. The time required for data postprocessing ranged from 5 to 15 minutes and for image analysis - between 5 and 15 minutes.
In 2DE, aortic valve planimetry was feasible in 26/27 studies (96%) - in one patient an adequate short-axis image of the aortic valve could be obtained. Planimetric measurements of aortic orifice in reconstructed anyplane views, optimally positioned at the level of cusp tips could be performed in 26/27 patients (Figure 2). In one three-dimensional dataset the measurements were precluded by a motion artifact; minor artifacts, not interfering with aortic valve planimetly were found in 6 other studies.
Aortic valve area measurements Head-to-head analysis was feasible in 25 patients (one exclusion because of low quality 2DE
pianimetry and one due to a large artifact in 3DE dataset). Aortic valve area measured in 2DE ranged from 0.6 to 4.31 em', mean 2.09 ± 0.97 em2

QUANTIFICATION OF A VA BY 3DE 137
The values obtained in three-dimensional planimetry were similar, ranging 0.64 to 3.92cm2,
mean 2.07 ± 0.92 cm2• Excellent correlation between the area estimates in both methods was
found: r=0.982, p.<O.OOOI, y = 1.033x - 0.04, SEE=0.19 cm', Figure 3). Mean difference between methods was not statistically significant with close limits of agreement (0.02 ± 0.19 cm2
) as shown in Figure 3.
2,5
2.0
S.2 1,5 a 1,0 N w 0,5
~ 0,0 w ·0,5
ffi ·1,0 ~ -1,5 o .2,0
·2,5
cm 2 0,0
5,0 4.5 4,0
-« 3,5 us 3,0
~ 2,5 c 2,0 M
1,5
1,0 0,5 0,0
20/30 DIFFERENCE
._._.-.•. -.-.-.-.-.•. -.-._ . .:;._ ... .:;.-.-._._. __ ._._.-. ..
1,0 2,0 3,0
MEAN VALUE
20 f3D CORRELATION
r = 0.982 p<O.0001 y'" 1.033 x - 0.04
see", 0.19 cm 2
n=25
1,0 2,0 3,0
20 AREA
4,0 5,0
4,0 5,0
Figure 4. Upper panel - plot of agreement behveen the 3- and 2-dimensional echocardiographic estimates of the aortic valve area. Difference in area (y a:ds) is plotted against the mean value of the two measurements (x a.xis). lllCfC are close limits of agreement between the values obtained by the hvo methods (-0.34, +0.40). Lower panel - a linear regression plot of area values obtained in two-dimensional (x axis) and three-dimensional echocardiography (y axis).
Importance of optimal cutplane position A significant area overestimation (0) was observed at each cutplane angulation (0 = 0.09 cm2
at 10°, 0.19 cm2 at 20° and 0.34 cm' at 30°) and confIrmed by repeated-measures analysis of variance (p<O.OO l) with Dunnett test.

138 CHAPTER 11
Overestimation was linearly correlated to the angle (r=0.992, p<0.008). Similarly, every parallel shift of viewing plane caused a significant overestimation of the area (0 = O.llcm2 /1.5 ll1lll,
0.22cm' / 3 ll1lll, 0.33cm' /4.5 mm, 0.43cm' / 6 mm and 0.63em' / 7.5 mm), ANOVA p<O.OOI. Linear conelation of overestimation and plane shift was found (r=0.993, p<O.OOI). The degree of error was not cOlTelated with the optimal planimctered area of the valve. The influence of cutplane optimatization on mean measured valve area is summarized in Figure 3.
Variability Intraobserver and interobserver variability of aortic valve area planimctry in 3DE was very
low (mean difference 0.03 ± 0.08cm', 0.01 ± O.lIcm' resp.), coefficients of variation: intraobserver 3.9%, interobserver 5.3%. The variability of 3DE measurements compared favorably against 2DE: mean intraobserver difference 0.04 ± 0.10 cnl, coefficient of variation 4.8%, F test against 3D: p=NS and mean interobserver difference 0.10 ± 0.21 cm' , coefficient of variation 10.0%, F test against 3D: p= 0.002.
4 -
-r -,---, - -~ r 3
r-I- r-I-~ '-
r- '- r-
2 - -
.... --
_L 1-- - .... 1
2.41 2.26 2.16 2.07 2.18 2.29 2.40 2.50 2.70
±1.00 ±O.96 ±O.93 ±O.92 ±O.97 ±O.95 +0.97 ±0.9 ±1.05 cm2
o 30 dog 20 dog 10 dog lop11mail1.5mm 3.0mm 4.5mm 6.0mm 7.5mm
Figure 5, Bar plot demonstrating an increase in measured aortic valve area in angulated (30 deg. 20 deg. 10 deg) cutplanes and parallel shifted cutplanes (1.5mm, 3mm, 4.5mm. 6mlll, 7.5mm) as compared to the optimal cutting plane. Abbreviations: deg - degree.
DISCUSSION Invasive aortic valve area quantification
The formula of Godin and Gortin,15 introduced in 1951, is still used as a reference method for aortic valve area calculation but its significant limitations are known. 16 The area estimates are clearly flow-dependent and related to the functional rather than anatomical orifice. In practice, it is sometimes difficult to obtain accurate values for cardiac output and a mean transvalvular pressure difference. The method requires tedious standardization and due to the invasive

QUANTIFICATION OF AVA BY 3DE 139
character is expensive and not suited for everyday routine use and repetitive studies. Recently described, accurate measurement of aortic valve area with intracardiac ultrasound probes shares the same Jimitation,17,18 Nowadays, the use of pre-operative cardiac catheterization for the assessment of aortic stenosis severity is decreased and reserved for patients with inconsistency between cHnical symptoms and non-invasive imaging data. Therefore, a need exists for a cheaper, noninvasive technique for the calculation of the aortic valve area.
Tlro-dimensional echocardiogl'aphic assessment of the aortic valve Transthoracic two-dimensional and Doppler echocardiography are the main techniques used
for the noninvasive assessment of aortic valve stenosis. Aortic valve area can be calculated with the continuity equation but small inaccuracy in data collection may result in major error. Direct planimetry of the aortic valve area is limited by valve calcifications and not widely used in clinical practice. This may improve with better images of new generation echocardiographs. 19
Most limitations encountered in precordial studies are overcome by transesophageal approach. Recently reported, the use of the continuity equation for aortic valve area calculation has been reported using tIus modality.20 A more comlllon and simple approach, however, is to measure aortic valve area using direct planimehy. Higher frequency ultrasound transducers providing better image resolution with no chest wall inteIference enable such evaluation and yield reliable values of aortic valve area. The method has been well validated and provides values close to those calculated with the Gorlin formula.'" A recent study by Kim et al.,6 demonstrates that the aortic valve area estimates from both methods are practically equivalent. Optimal feasibility and accuracy was found with multiplane transesophageal echocardiography, due to easier image plane manipulation than single plane or biplane probes.5,21 The variability of transesophageal echocardiographic planimetry of the aortic valve area in our study is similar to the values reported previously.2~6,21
Although the results obtained with transesophageal 2DE are encouraging, the alignment of viewing plane with real short axis of the aortic valve is subjective and remains a major problem. Duling the data collection there are no obvious anatomical landmarks confirming that imaging plane is positioned at the smallest anatomical area, which is at the tips of aortic cusps exactly in the plane of the valve orifice. To the best of our knowledge, the quantitative aspects of improper cutplane location on aortic valve area quantification have not been investigated yet.
Thl'ee-dimensional cchocal'diogl'aphy The reconstruction of cardiac morphology from 3DE datasets represents a major advance in
noninvasive imaging techniques. The stmctures of the heart can be displayed in "anatomical" or trsurgica{'r perspectives,22 with direct perception of conect spatial relations. Recognition of complex anatomy and pathology is thus facilitated." Three-dimensional reconstruction of the aortic valve with transesophageal approach is feasible and provides reliable information in various types of pathology.",24,25 Three-dimensional echocardiographic datasets allow unrestricted off-line manipulation, unlike the images stored on videotapes. Off-line reconstmction of any desired view, even not present in originally acquired images can now be

140 CHAPTER 11
pClfoIlned (anyplallc mode). However, only preliminmy data are available about the quantification of aortic valve area with this approach. Good feasibility and agreement versus G I, " , I d2627 II d" , or III or contlllUlty equation met 10 ' as we as treet mtraoperahve measurements were repOlted,"
An important part of our study was dedicated to the evaluation of potential enors, resulting from the measurements in inappropriate short-axis cutplanes. Significant overestimation of the area was caused by as little displacement as l.Snun parallel shift or 10° angulation. Overestimation was linearly related to angle or distance in the analyzed range of values. Majority of images obtained at 10° and 20° angles or 1.5mm and 3mm was visually pleasing and could be mistaken for the optimal short axis view. This identities a potential source of errors in twodimensional studies taken by less experienced operators. Such overestimation may be of clinical importance in borderline cases, considering that the absolute magnitude of error was similar in valves with stenotic and with normal orifice. Noteworthy, this kind of error analysis could be performed exclusively with use of three-dimensional datasets, because no other technique allows the controHed modification of cutplane parameters in the same analyzed heart cycle.
In our study the feasibility of aortic valve planimetry in optimal cross-sections obtained from three-dimensional datasets was good and similar to that obtained in 20E. The measurements of aortic valve area, obtained for a wide range of values, were in close agreement with those provided by two-dimensional planimetry and, in a subgroup of patients with the most diseased valves, by continuity equation. Excellent reproducibility of three-dimensional measurements compared favorably with two-dimensional data, the difference reaching statistical significance for interobserver variability. This can be explained by the unique possibility of unrestricted off-1ine clitplane selection from the 30E dataset which allows to precisely align a viewing plane with the true orifice of the valve. In our study, a long axis view of the ascending aorta was used to optimize the selection of orthogonal short-axis view. Such visual feedback can explain better reproducibility due to easier selection of an optimal cutplane used for planimetry in threedimensional datasct.
Clinical potential and limitation of the study The quantitication of aortic valve area from three-dimensional datasets acquired using a
rotational mcthod can be pelfonned in the vast majority of patients. The time necessary for both reconstl1lction and selection of optimized two~dilllellsiol1al imaging planes with modern hardware is acceptable. The method is more time-consuming, however, than 20E, and requires some experience for efficient data manipulation. The possibility to reconstmct a short -axis image of aortic orifice from original imaging planes, aligned parallel to the long axis of the valve, provides a potential to minimize the artifacts caused by calcifications as the artifacts are cast off the plane of aortic orifice. Three-dimensional planimetry of the a0l1ic valve can be an additional tool in unequivocal cases and, due to its low variability, might be useful to monitor the progression of borderline aortic valve stenosis.

QUANTIFICATION OF A VA BY 3DE 141
Invasive aortic valve area assessment with Gorlin formula, still considered as a reference method, was 110t available in our patients. However, recent studies suggest that the Gorlin formula and multiplane transesophageal planimetry provide very similar values of aortic valve area.6
Tmnsesophageal data collection can be considered semi-invasive but transthoracic images of a thin, rapidly moving object such as aortic valve do not provide sufficient quality of data for reliable three-dimensional reconstmction and area quantification in majority of adult patients. The flow-dependence of aortic valve area is another potential source of variability in studies comparing different quantitative techniques, particularly when measurements are taken at different points of time and under variable medication regimens. In our study, however, all measurements were taken within one hour (including transthoracic imaging) in hemodynamically stable patients so that significant changes in cardiac output were unlikely. As regards the error evaluation, the measurements were taken from the same dataset that was used for optimized 3DE planimetry and tlus source of vmiability was completely eliminated.
In spite of technological progress, three-dimensional technique is still subject to limitations. The acquisition of images may be complicated in patients with very irregular arrhythmia. Inadvertent patient or transducer movements during data acquisition often produce significant artifacts in three-dimensional datasets. In our experience, a rotational transesophageal approach provides a sufficient stability and appropriate instl11ctions given to a patient before the procedure help to acquire acceptable quality data. Spatial and temporal resolution of computerreconstl11cted two-dimensional views are worse than original two-dimensiollnl data, possibly leading to area underestimation. However, the agreement of both methods was good in our study, suggesting sufficient three-dimensional data quality. Finally, current software does not allow area measurements in volume-rendered three-dimensional views, which provide most du"ect visual information about the valve orifice (Figure 3F). TIlls implementation may simplify the planimetry procedure in future software updates.
CONCLUSIONS Our study demonstrates that three-dimensional echocardiography can be used for aortic valve
area planimetry with excellent reproducibility. The results are in close agreement with transesophageal two-dimensional planimetry and continuity equation estimates. Our observations confirm the risk of significant, clinically relevant aortic valve area overestimation resulting from relatively small inaccuracy in two-dimensional imaging plane adjustment. Off-line cutplane optimization, feasible in three-dimensional datasets, improves measurement accuracy and reproducibility by eliuunation of errors related to inappropriate viewing plane selection.
REFERENCES I Bednarz JE, Krauss D, Lang RM. An echocardiographic approach to the assessment of aortic stenosis. J
Am Soc Echocardiogr 1996;9:286-94. 2 Hoffmann R, Flachskampf FA, Hanrath P. Planimetry of orifice area in aortic stenosis using multiplane
transesophageal echocardiography. J Am Coll Cardiol 1993;22:529~34.

142 CHAPTERll
3 Hofmann T, Kasper 'V, Meinertz T, Spi11ner G, Schlosser V, Just H. Determination of aortic valve orifice area in aortic valve stenosis by two-dimensional transesophageal cchocardiography. Am J CardioI1987;59:330-5.
4 Stoddard MF, Arce J, Liddell NE, Peters G, Dillon S, Kupersmith J. Two-dimensional transesophageal echocarrliographic determination of aortic valve area in adults with aortic stenosis. Am Heart J 1991; 122: 1415-22.
5 Tribouilloy C, Shen WF, Peltier M, Mirade A, Rey JL, Lcsbre JP. Quantitation of aortic valve area in aortic stenosis with multi plane transesophageal echocardiography: comparison with monoplane transesophageal approach. Am Heart J 1994;128:526-32.
6 Kim el, Berglund H, Nishioka T, Lua H, Siegel RJ. Correspondence of aortic valve area detennination from transesophageal echocardiography, transthoracic echocardiography and cardiac catheterization. Am Heart J 1996;132:1163-72.
7 Pandian NG, Roelandt I, Nanda NC, Sugeng L, Cao Q, Azevedo I et al. Dynamic three-dimensional echocardiography: methods and clinical potential. Echoeardiography 1994;11:237-59.
8 Roelandt JRTC, Ten Cate Fl, Vletter \VB, Taams MA. mtrasonic dynamic three-dimensional visualization of the heart with a multiplane transesophageal imaging transducer. J Am Soc Echocardiogr 1994;7:217-29.
9 Belohlavek M, Foley DA, Gerber TC, Kinter TM, Greenleaf JF, Seward lB. Three- and fourdimcnsional cardiovascular imaging: a new era for echoeardiography. Mayo Clin Proe 1993~68:221-40.
10 Salustri A, Roelandt IRTC. mtrasonic three-dimcnsional reconstruction of the hcart. Uhr Med Bioi 1995;21 :281-93.
11 Nanda NC, Roychoudhury D, Chung SM, Kim KS, Ostlund V, KIas B. Quantitative assessment of nonnal and stenotic aortic valve using transesophageal threc-dimensional echocardiography. Echocardiography, 1994; 11:617-25.
12 Kasprzak JD, Salustri A, Roelandt IRTC, Tcn Cate Fl. Three-dimensional echoeardiography of the aortic valve: feasibility, clinical utility and limitations. Echo;ardiography, in press.
13 Roelandt IRTC, Thomson JR, Vletter \VB, Brommersma P, Bom N, Linker DT. MultipJanc transesophageal echocardiography: latest evolution in an imaging revolution. I Am Soc Echocardiogr 1992;5:361-7.
14 Bland JM, Altman DG. Statistical methods for assessing agreement between two methods of clinical measurement. Lancet 1986;1:307-10.
15 Godin R, Godin S. Hydraulic formula for calculation of of the area of the stenotic mitral valve, other cardiac valves and central circulatory shunts. Am Heart J 1951 ;41: 1-45.
16 Cannon SR, Richards KL, Crawford M. hydraulic estimation of stenotic orifice area: a correction of the Godin formula. Circulation 1985;71: 1170-8.
17 Foster GP, \Veissman NJ, Picard :MH, Fitzpatrick PI, Shubrooks lr. SJ, Zarich SW. Determination of aortic valve area in valvular aortic stenosis by direct measurement using intracardiac echocardiography: a comparison with the Gorlin and continuity equations. J Am Coil Cardiol 1996;27:392-8.
18 Jiang L, de Prada JAV, Lee MY, He J, Padial LR, Fallon JT et al. Quantitative assessment of stenotic aortic valve area by using intracardiac echocardiography: in vitro validation and initial in vivo illustration. Am Heart J 1996;132: 137-44.
19 Akasaka T, Yamamuro A, Morioka S. Noninvasive assessment of aortic valve area in patients with valvular aortic stenosis using planimetry by transthoracic two-dimensional echocardiographic approach. Circulation 1996;94 (Supp!. 1):1-616.

QUANTIFICATION OF A V A BY 3DE 143
20 Stoddard MF, Hammons RT, Longaker RA. Doppler transcsophageal echocardiographic determination of aortic valve area in adults with aortic stenosis. Am Heart J 1996; 132:337-42.
21 Kim KS, Ma.xted \V, Nanda NC, Coggins K, Roychoudhry D, Espinal M et al. Comparison in multiplane and biplane transesophageal echocardiography in the assessment of aortic stenosis. Am J CardioI1997;79:436-41.
22 Schwartz SL, Cao QL, Azevedo J, Pandian NO. Simulation of intraoperative visualization of cardiac structures and study of dynamic surgical anatomy with real-time three-dimensional echocardiography. AmJCardioI1994;73:501-7.
23 Belohlavck M, Foley DA, Seward JB, Greenleaf IF. Diagnostic performance of two-dimensional versus three-dimensional transesophagcal echocardiographic imagcs of selected pathologies evaluated by receiver operating charactcristic analysis. Echocardiography 1994;11 :635-45.
24 Kasprzak JD, Salustri A, Roelandt JRTC, Ten Cate FJ., Comprehensive analysis of aortic valve vegetation with anyplane, paraplane and three-dimensional echocardiography. Eur Heart J 1996; 17:317-8.
25 Hsu TL, Ho S1, Lai ST, Yu T1, Chang Y, Shih CC et al. Enhanced diagnostic accuracy of aortic and mitral valvular perforation by three-dimensional echocardiography. 1 Am Coll Cardiol 1997 ;29: 173A.
26 Menzel T, Mohr-Kahaly S, Koelsch B, Kupferwasscr I, Kopp H, Spiecker M, et al. Quantitative assessment of aortic stenosis by three-dimensional echocardiography. J Am Soc Echocardiogr 1997; 10:215-23_
27 Ge S, 'Varner 1G, Abraham TP, Kon NO, Brooker RF, Nomeir AM et a!. Three-dimcnsional transesophageal echocardiography for detennining aortic valve area in valvular aortic stenosis: a prospective clinical study. J Am ColI CardioI1997;29:Supp1. A:4A.
28 Srivastava S, Kanoija A, Mittal S, Kasliwal R, 8apna R, Trehan N et al. How accurate is threedimensional echocardiographic detennination of aortic valve area in patients with aortic stenosis? -comparison with direct anatolnic aortic valve area measurement at surgery. 1 Am ColI Cardiol 1997;29(Suppl. A): 173A.


ASSESSMENT OF LV OUTFLOW TRACT IN HCM BY 3DE 145
CHAPTER 12
ASSESSMENT OF LEFT VENTRICULAR OUTFLOW TRACT IN HYPERTROPHIC CARDIOMYOPATHY
USING ANYPLANE AND PARAPLANE ANALYSIS OF THREE-DIMENSIONAL ECHOCARDIOGRAPHY
Alessandro Salustri MD, PhD; Marcel JM Kofflard MD; Jos RTC Roelandt MD, PhD; Youssef Nosir MD; Giuseppe Trocino MD; David
Keane, MB, MRCPI; Wim B Vletter BSc; Folkert J Ten Cate MD, PhD.
Thoraxcenter, Department of Cardiology, University Hospital Rotlerdam-Dijkzigt and Erasmus University, Rotterdam, The Netherlands.
Am J CardioI1996;78:462-8

146 CHAPTER 12
ABSTRACT This study analyzes the alterations in size and geometty of the left ventricular (LV) outflow tract which occur in hypertrophic cardiomyopathy (He) using transthoracic 3-dimcnsional echocardiography. Transthoracic 3-dimensional echocardiography was pedormed in 17 patients with He (4 after myectomy) and in 10 normal subjects. Images were acquired with the rotational approach, with electrocardiographic and respiratory gating. From the 3-dimcllsional datasets, short-axis parallel slicing of the LV outflow tract at I-nun distance was pelformed at the onset of systole. For each slice, cross-sectional area and maximal and minimal diameter were calculated. Reconstruction of the LV outflow tract could be displayed in 3 dimensions in all patients, allowing orientation and clear definition of the inegular geometry. In patients with He, the minimal LV outflow tract cross-sectional area was smaller than in normal subjects (2.3±l.O cnl vs 5.0±O.9 cm2
, p<O.OOOl). The ratio between maximal and minimal cross-sectional areas was higher in He than in nonnals (2.6±O.9 vs 1.4±0.2, p<O.OOOl). The ratio between maximal and minimal diameter of the smallest cross-section of the L VOT was also significantly higher in He than in nonnals (1.6±O.3 vs 1.2±0.1, p<O.OOI) and a value of 1.36 separated normals from HCpatients without previous myectomy. In conclusion, precordial 3-dimensiollal echocardiography allows detailed qualitative and quantitative information on the LV outflow tract. Patients with HC are characterized by a highly eccentric and asymmetric shape of the LV outflow tract, and by a smaller minimal cross-sectional area cOlllpared to normal subjects.
INTRODUCTION PostmOIiem studies and intraoperative findings indicate that 2-dimensional echocardiography
lllay fail to give the full picture of the left ventricular (LV) outflow tract in patients with hypertrophic cardiomyopathy (HC).l-6 Three-dimensional echocardiography is a new imaging modality which provides unique information on the spatial geometry of a given structure.7 Based on our experience in an unselected population,8,9 we felt that the alterations in size and geometry of the LV outtlow tract in patients with He could be more accurately analyzed with precordial 3-dimensional echocardiography. \Vith these concepts in mind, we designed tltis study to gain fmiher insight into the complex geomett)' of the LV outflow tract in patients with HC. \Vith this aim, analysis of the LV outtlow tract was petf0l111ed using the 3-dimensional datasets obtained after acquisition of precordial echocardiograpltic images.
METHODS STUDY PATIENTS
We prospectively selected 17 patients (13 men and 4 women; meal1±SD age 39±15 years, range 19 to 65) with HC referred to the outpatient clinic of our institution for routine transthoracic echocardiographic follow-up. High-quality images was a pre-requisite for inclusion in this study. The diagnosis of He was based on M-mode and 2-dimensional echocardiographic demonstration of a non-dilated hypelirophic left ventricle in the absence of other cardiac or systemic disease that could produce LV hypeJirophy.lO According to a previously established classification, II the patterns of distribution of left ventlicular hypertrophy were type I-I patient, type II-3 paticnts, type ill-12 patients, and type IV -I paticnt. Systolic anterior motion of the mitral valve was present in 12 patients and its severity was evaluated
ASSESSMENT OF LV OUTFLOW TRACT IN HCM BY 3DE 147
semiquantitatively from O:::absence to 3+;::;contact with the interventricular septum during systole.
5 At the time of the cchocardiographic ShIrly a pressure difference was calculated from
Doppler LV outflow tract velocity recordings, and obstmction (gradient >30 mm Hg under basal conditions) was detected in 4 patients. A septal myectomy had been perfollllcd in4 patients.
Ten asymptomatic subjects without evidence of LV hypertrophy were also studied for comparison. These controls were 20-49 years old (mean 28±8 years) and 8 were male.
Examination procedure Two-dimensional echocardiographic studies were pcrfonned with a cOllllllcrcially available
system (Vingmed CFM 750 or Toshiba Sonolayer SSH-140A) equipped with a 3.5 MHz transducer, while the patient was lying in the 45-degree left recumbent position. After the followup 2-dimensional echocardiographic study, the probe was positioned either at the left parasternal or apical window for acquisition of the tomographic images of the LV outflow tract for 3-dimensional reconstruction. Patient movement during the image acquisition can be prevented by thoroughly explaining the procedure before the snlcty. The operator has to tind the central mus of rotation so that the corucal datasets encompass the LV outflow tract. During the acquisition, movements of the transducer holder must be avoided diligently. Minor images of the first and the final cut plane indicate a conect ISO-degree rotation. Informed consent was obtained in all subjects.
THREE· DIMENSIONAL ECHOCARDIOGRAPHY Image acquisition
After the standard 2-dimensional examination, the video output of the echocardiographic system is interfaced to the acquisition system (Echo-scan, TomTec GmbH, .Munich, Germany) and the transducer is fixed into a cylindrical holder. A step-motor mounted on tIlis holder can rotate the probe around its longitudinal ax.is via a wheel-work interface. The step-lllotor is connected to the acquisition system which cOlllmand the rotation of the probe at 2-degree intervals over a span of 180 degrees. Respiratory and electrocardiograpllic gating are performed after the operator has selected the end-expiratOI), phase by thoracic impedance measurement and an adequate R-R interval. Thus, only those beats falling in the predetermined R-R interval and at the end-expiratory phase are selected by the steering logic of the system and acquired. Cycles that do not meet the preset ranges are rejected. Ninety sequential cross-sections are acquired each dUling a complete heart cycle, encompassing a 3-dimensional cOlucal volume. After distance calibration, images are stored in the computer memory for subsequent analysis. Image processing
The raw data are resampled off-line according to their temporal and spatial location. The coordinates of each point are converted from a polar to a rectangular system, and the space behveen contiguous points is electronically filled with a ttilinear cylindric interpolation. Several algoritluns are used to reduce noise and H11ifacts which can be created by patient and probe movements. Image display alld alia lysis
linages were analyzed as follows: I) After thourough examination of the 3-dimensional datasets with analysis of cardiac cross-

148 CHAPTER 12
sections in any desired plane ("anyplane cchocardiography"), a cnt-plane is selected where the LV outflow tract is visualized along its longitudinal axis. 2) The onset of ventricular systole is selected, as the first frame during the cardiac cycle in which the mitral val ve appears closed. 3) Electronic parallel slicing ("paraplane echocm-diography") of the LV ourt1ow tract pClpendicuiar to the vertical axis is pClfollllCd at I-111m intervals, from the hinge point of the antedor mitral lea net to the point of coaptation of the mitral leaflets, and the corresponding 2-dimensional images (both the stop frame at onset of systole and the dynamic sequence) arc displayed_ 4) On the stop frame image at the onset of systole, the endocardial contonr of the cross-section is manually traced for automatic area measurement, and maximal and minimal diameters are also measured. 5) Finally, reconstruction of the LV outflow tract at the onset of ventricular systole is displayed in wire framc mode and the representative image can be rotated on the screen for versatile 3-dimensional evaluation (Figure 1).
Figure 1. Analysis of the LV outflow tract in a patient with hypertrophic cardiomyopathy. From the three-dimensional dataset, parallel slicing of the LV outflow tract perpendicular to the long-a.xis (paraplane echocardiography) is perfonned at 1 mm interYals, at the onset of yentricular systole. In the left panel, three representative cut-planes are indicated. TIle cOJT('sponding cross-sectional p,yo-dimcnsionai images with the manually traced endocardial contours are shown in the middle panels. The final wire fmme mode display represented in the right panel can be rotated on the screen along the three main axes for yersatile qualitative three-dimensional eyaluation. MIL = anterior mitral leaflet; AV ::: aortic yaIve; IVS = interyentncular septum, LV = left ventricle.
From the analysis of the 3-dimensional datasets, thc following measurements of the LV outflow tract at the onset of systole were considered: 1) minimal cross-sectional area; 2) ratio between maximal and minimal cross-sectional area (max/min cross-sectional area), as an index of the "eccentricity" of the LV outflow tract (the higher the value the greater the variations of the cross-sectional area throughout the length of the LV outflow tract; 3) ratio between maximal (latero-medial) and minimal (antero-postedor) diameter (maximin diameter) at the level of the cross-section with the minimal area, as an index

ASSESSMENT OF LV OUTFLOW TRACT IN HCM BY 3DE 149
of the "asymmetry" of the LV outflow tract (a ratio of I indicates a circular shape, with the highest values conesponding to the more elliptical shape of the cross-sections).
Inter- and intraobselver reproducibility for the measurements of LV outflow tract with 3-dimensional cchocardiography was assessed in all 27 patients. To assess intcrobscrvcr variability, two observers (A.S., Y.N.) independently measured the outflow tract area from the 3-dimensional datasets without prior knowledge of clinical data and without preselection of cutplanes. In addition, LV outflow tract cross-sectional area measurements were performed by onc observer (A,S.) on two occasions (3 months apalt, without preselection of cut-planes from the 3-dimensional datasets) to assess intraobserver vatiability.
STATISTICAL ANALYSIS Values are given as mean±SD. Student's unpaired t test was used to compare the differences
between HC and control subjects. Values of p<O.05 were considered to be significant. Reproducibility of the LV outflow tract measurements was expressed in terms of mean differences and Ihe 95% confidence inlervals (C.L)."
RESULTS Three-dimensional acquisition could be pelfonned successfully in all patients.
Echocardiographic acquisition of the image of the LV outflow tract for 3-dimensional reconstmction was pelfol1ned either from the parastemal (n=20) or apical (n=7) windows, according to the image quality. The examination including the caHbration procedure, selection of the optimal axis of rotation, a number of test I1I11S, and the actual image acquisition required approximately 10 minutes in addition to the time required for the standard 2-dimensional echocardiogram. Three-dimensional reconstl1lction of the images was possible and of good quality in all patients. The time required for post-processing the raw data, reconstmctioll and analysis of the images was approximately 20 minutes. Demographics, echocardiographic characteristics, and measurements of the LV outflow tract in the individual patients with He are reporled in Table I.
LV outflow tract in HC vs lIormals. a) Cross-sectional area. The values of minimal cross-sectional area of the individual subjects are plotted in Figure 2. The minimal LV outflow tract cross-sectional area calculated with 3-dimensional echocardiography was significantly smal1er in patients with HC than in the control group (2.3±I.O vs 5.0±O.9 em', p<O.OOOl). Thirteen of Ihe 17 palienls wilh HC had a value smaller Ihan the conlrols, and 2 of Ihe 4 HC palieuls with higher values (ur. 6 and 17) were evaluated after myectomy. After cOlTection for body surface area the values were 1.3±0.5 and 2.7±O.6 em', respeclively (p<O.OOOI). b) Shape. From Ihe 3-dimensional dalasels, Ihe reeonslmcted LV outflow lracl could be displayed as observed from different viewpoints. This facilities the appreciation of the geomehy and shape as well as the localization of the nalTowing of the LV outflow tract in patients with HC (Figure 3). A similar display in a nonnal patient is shown in Figure 4. Some examples of threedimensional reconstmction of the LV outflow tract in normal subjects and in patients with HC are shown in Figure 5.

150 CHAPTER 12
Table 1. Demographics, patient characteristics, and measurements of the left ventricular outflow tract in Eatients with h~eerlroEhic cardiomJ'oEath~. Patien Agel Type Therapy Gradient SAM CSA MaxiMin MaxIMin
-1 ____ Sex IliH (C0l2) CS~_D1'illleteL.....
I 19M III V 58 3+ 2.9 2.0 1.9 2 21M III dO 2+ 2.4 2.5 1.7 3 22M I dO 1+ 3.0 1.8 1.4 4 24M IV dO 2+ 2.9 2.4 1.6 5 25M III V dO 2+ 2.7 2.4 1.6 6 3IF III S. V 50 3+ 1.3 4.2 2.0 7 38F II V dO 0 2.4 2.7 1.7 8 39F III V dO 0 3.2 2.1 1.6 9 41M III V 20 1+ 1.9 1.7 1.8 10 46F II A,V dO 2+ 0.7 4.1 1.4 II 53M III dO 1+ 1.5 3.8 1.9 12 63M II M 100 3+ 1.5 3.0 2.6 13 65M III V 35 3+ 2.0 3.0 1.6 M±S 37±15 2.2±O.7 2.7±O.8 1.75±0.3 14 31M* III dO 0 2.1 2.4 1.3 15 34M* III S dO 1+ 0.9 3.9 1.2 16 44M* III S, V <10 0 4.7 1.5 1.3 17 59M* III V <10 0 3.0 1.6 1.3 M±S 42±12 2.7±1.6 2.3±1.l 1.27±0.05 M±S 39±l5 2.3±1.0 2.6±O.9 1.6±O.3
* - patients e\'aluatcd after myectomy, A= amidaronc, CSA =- cross sectional area; LVH = left yentricular hypertrophy, M, metropoioI, MaxflvIin= maximal/minimal, S=sotalol, SAM" systolic anterior movement,
V=verapamil.
p<Ooo:l!
6
!o I < 0 ~ u , " ~ "0;+ j 0
H
9 0 + l;i +
0,
0
HeM Nonnals
Figure 2. 11inimal cross-sectional area (CSA) of the LV outflow tract in patients with hypertrophic cardiomyopathy (HC) and in normal subjects (m). + = patients withont obstruction; = patients after myectomy; = patients with obstruction.
Maximin cross-sectional area ("Eccentricity index"). The maximin cross-sectional area of the LV outflow tract derived from the 3-dimensional datasets are displayed in Figure 6. From this figure, it is apparent that patients with He had higher ratios (2.6±O.9) with a broad range of

ASSESSlVillNT OF LV OUTFLOW TRACT IN HCM BY 3DE 151
values (from 1.5 to 4.2) indicative of many irregular different shapes of the LV outflow tracts in He patients. In contrast, Honnal subjects had smaller ratios (1.4±O.2) with a narrow range of values (from 1.1 to 1.6), In pm1icular, each of the controls had a ratio of 1.6 or less, whereas 15 of 17 patients with HC had a ratio of greater than 1.6. The two patients with maximin crosssectional area of 1.6 or less (nr. 16 and 17) were evaluated after myectomy. Thus, an outflow tract area ratio of 1.6 to separate patients with from subjects
Figure 3. In this patients with hypertrophic c,1rdiomyopathy, the wire frmne display of the reconstructed LV outflow tract is represented as observed from different viewpoint .. , 111e view at 00
corresponds to the cut-plane represented in the central panel. T1\C images obtained aner incremental 600
clockwise rotation are displayed in the corresponding panels. There is an eccentric and asymmetric shape of the LV outflow tmct. From these images it is also apparent that the narrowing is localized at the middlecaudad part of the LV outflow tract and is mainly related to a reduction
Figure 4. Three-dimensional reconstruction of the LV outflow tract in a normal SUbject, with the ~ame display as in Figure 3. Note the uniformity (indicated by the minimal yariations of the diameters throughout the lenght of the LV outflmy tract) as well as the symmetry (indicated by the similar diameters of individual crosssections from different viewpoints) of the LV outflow tract.
Figure 5. Three-dimensional reconstruction of the LV outflow tract with wire frame display in normal subjecl<; (panels AC) and in patients with hypertrophic cardiomyopathy (panels D-F). Thc different irregular configumtion of the LV outflow tract in patients with hypertrophic cardiomyopathy can be evaluated.

152 CHAPTER 12
;>«I_if!)1
V
0
~
l:J I,V
~ +
ncl+ 1; , v ~
8' c~o I <-'
HOI Normals
Figure 6. Ratio between maximal and minimal cross-sectional area (max/min CSA) of the LV outflow tmct in patients with hypertrophic cardiomyopathy (He) and in nannal subjects. A high ratio indicates an eccentric shape of the LV outflow tract. Symbols as in Figure 2.
!'<'l_WI
V
~ 13 * .~ v !+ ~
.~ s* 23 I ~ 0 ~
, HeM Normals
Figure 7. Ratio between maximal and minimal diameter (maximin diameter) measured at the cross-section of the LV outflow tract with the minimal area, in patients with hypertrophic cardiomyopathy (He) and in normal subjects. A high ratio indicates an asynunetric shape of the LV outflow tract. Symbols a<; in Figure 2.
Maximin diameter ("AsynunetIy index"), The individual values of max/min diameter of the LV outflow tract cross-section are displayed in Figure 7. TItis ratio was significantly higher in patients with He than in normal subjects (1.6±O.3 vs 1.2±D.I, p=O.OOI). Of interest, patients evaluated after myectomy had the lowest values, while in contrast the highest values were found in patients with He and LV outflow tract obstmction. An index of 1.36 appearcd to separate normal subjects from non-operatcd He patients.

ASSESSMENT OF LV OUTFLOW TRACT IN HCM BY 3DE 153
Reproducibility analysis of three-dimensional echocardiography. illferobseJl'el' l'ariaiJiUty. The difference between the two observers for measurements of the
LV outflow tract was compared with the average of the two measurements for each patient. The mean difference between the measurements of the two observers was 0.04 cm2 (95% C.I. -0.08 to 0.12 cm2
) for cross-sectional area. Illtraobsen'el' variabiUfy. TIle difference between the two measurements made by the same
observer was compared with the average of the two measurements for each patient. The mean difference between the two measurements was 0.13 cm' (95% C.I -0.01 to 0.25 cm') for crosssectional area.
DISCUSSION Hypertrophic cardiomyopathy is a disease with a great individual variability and "no two
heat1s are alike".!3 The results of the present study indicate that 3-dimensional echocardiography allows visualization of the varied complex geometty of the LV outflow tract in patients with He. With the quantitative analysis of the 3-dimensional datasets, we demonstrated that in patients with He the minimal cross-sectional area is smaller than in normal subjects. In addition, the vast majority of patients with He have an ilTegular shape of the LV outflow tt"act as demonstrated by an "eccentticitytl index of 1.5 or greater. hl nomml subjects this index is always 1.6 or less, indicating a unifonn shape of the LV outflow tract, without significant variation of the crosssectional area throughout its length. We have also demonstrated that the cross-sectional shape of the LV outflow tract is more elliptical in patients with He than in nOluml subjects, as indicated by a higher ratio of maximin diameter measured at the plane of the minimal cross-sectional area. Tlus fInding is in agreement with the concept that in He the hypertrophic ventricular septum nalTOWS the LV outflow tract mainly along its antero-posterior diameter. Of interest, this 1!asymmctry" index was highest in patients with He and obstmction of the LV outflow tract at rest. In contrast, in He neither the minimal cross-sectional area nor the "eccentricity" index of the LV outflow tract separated tlus subgroup. Tlus fInding indicates that for sinular crosssectional area the aSYlllllletry of the LV outflow tract play an important role in dctcnnining the presence of significant obstmction at rest.
Patients who had undergone myectomy had a minimal cross-sectional area similar to other patients with He, including those with obstlUction (Figure 2). However, from Figure 7 it is clear that after myectomy the "asymmetlY" index was lowest, indicating that the surgical remodelling of the LV outflow tract was adequate for the relief of the obstlllction dcspite the finding that the cross-sectional area remained small compared to normal controls and in the same range of the other HC patients without previous myectomy. Thus, in patients with HC precordial 3-dimensional echocardiography has the potential to playa major role in tailoring the standard surgical resection of the interventlicular septum to the individual patient's anatomy wluch is clllcial for safe and efficacious perfonnance of myectomy, and also in the evaluation of the rcsults of surgely.
Evaluation of LV outllow tract using 3·dimensional echocardiography Previous experience with 3-dimensional echocardiography for the evaluation of the LV
outflow tract was based on morphologic analysis with volume rendered display. 14 In contrast, for

154 CHAPTER 12
the quantitative analysis of the LV outflow tract perfonllcd in the present study we selected a multittlde of cut-planes ("anyplane echocardiographyl!) and pClfonned a parallel scanning of the LV outflow tract at I-mill intervals ("paraplallc echocardiography"). This rate of sampling of the dataset is similar to the analysis done with magnetic resonance imaging or computed tomography. and allows detailed spatial infonnation,I5 ·While some display modalities such as volume rendering are more indicated for representation of anatomical detaiJs,16-18 the wire frame display [o11nat appears particularly suited to 3-dimcnsional reconstillction of the cardiac cavities, where areas, volumes, size and shape can be adequately evaluated.
Lhnitations of three-dimensional ecllocardiography. In this study, patients were selected on the basis of high-quality images at 2-dimensional
echocardiography, which yielded a success rate of 3-dimensional reconstruction of 100%. The same results cannot be expected from an ullselected population where poor quality precordial images may prevent adequate quality of the reconstmction.
Echocardiographlc images were acquired by an experienced technician and reconstmction were peifol1ned by a cardiologist after a teaming period of over 50 studies. 111is previous experience of 3-dimensional echocardiography prevented m1ifacts in the 3-dimensional datasets, limited the time required both for acquisition and reconstmction, and resulted in a minimal variability for the measurements.
ACKNOWLEDGEMENTS Dr Nasir is supported by the Nuffic, The Netherlands, and AI-Azhar University Hospital, Department of Cardiology, Cairo, Egypt. Dr Keane is the recipient of a travel grant from Peel Medical Research T111st, London, United Kingdom. The expelt technical assistance of Rene Frowijn. BSc for the preparation of the illustrations is greatly acknowledged.
REFERENCES 1 Henry \VL, Clark CE, Roberts \VC, Morrow AG, Epstein SE. Difference in distribution of myocardial
abnonnalities in paticnts with obstmctivc and nonobstmctive asymmetric scptal hypclirophy (ASH). Echocardiographlc and gross anatomic findings. Circufaaon 1974;50:447-455.
2 Maron 8J, Bonow RO, Cannon RO III, Leon MB, Epstcin SE. Hypertrophic cardiomyopathy. Interrelations of clinical manifestations, pathophysiology, and therapy. (First of two parts). N Eng' J Med 1987;316:780-789.
3 Panza JA, Maris TJ, !vIaron B1. Development and determinants of dynamic obstmction to left ventricular outflow in young patients with hypertrophic cardiomyopathy. Circulation 1992;85: 1398-1405.
4 Klues HG, Roberts \VC, Maron B1. Morphological detenninants of echocardiographic patterns of mitral valve systolic anterior motion in obstmctive hypel1rophic cardiomyopathy. Circulation 1993;87:1570-1579.
5 Spirito P, Maron B1. Significance of left ventricular outflow tract cross-sectional area in hypertrophic cardiomyopathy: A two-dimensional echocardiographic assessment. Cirwlatioll 1983;67: 1100-1108.
6 McIntosh CL, Maron B1. Current operative treatment of obstmctive hypertrophic cardiomyopathy. Circulation 1988;78:487-95.
7 Salustri A, Roelandt JRTC. Three-dimensional reconstmction of the hemi with rotational acquisition: mcthods and clinical applications. Br Heart J 1995;73(suppI2): 10-15.

ASSESSMENT OF LV OUTFLOW TRACT IN HCM BY 3DE 155
8 Roelandt JRTC, Salustri A, Bekkering L. Bmining N, Vletter \VB. Precordial three-dimensional echocardiography with a rotational imaging probe: Methods and initial experience. EcllOcardiography 1995;12:243-252.
9 Saiuslri A, SpitacIs S, McGhie J, Vletter \V, Roelandt JRTC. l11ransthoracic three-dimensional echocardiography in adult patients with congenital heart disease. JAm Coli C'ardioI1995;26:759-767.
10 Maron BJ, Epstein SE. HeM: a disclission of nomenclature. Am J CardioI1979;43: 1242-1244. 11 Maron BJ, Gottdiener JS, Epstein SE. Pattcms and significance of distribution of left ventricular
hypertrophy in hypertrophic cardiomyopathy. A wide-angle, two-dimensional cchocardiographic study of 125 patients. Am J CardioI1981;48:418-428.
12 Bland 1M, Allman DG. Statistical method for assessing agreement between two methods of clinical measurement. Lancet 1987; 1 :307-310.
13 Roberts CS, RObel;S We. MOlphologic feature. Prog CardioI1989;2(pt 2):3-32. 14 Fyfe DA, Ludomirsky A, Sandhu S, Dhar PK, Silberbach M, Sahn DJ. Left ventricular outflow tract
ohstmction defmed by active three-dimensional echocardiography using rotational transthoracic acquisition. Echocardiography 1994;11:607-615.
15 Salustri A, Roelandt JRTC. Left atrial myxoma visualized by transesophageal Echo-CT. Circulation 1995;91:2290.
16 Roeland! JRTC, ten Cate FJ, Vlctter WB, Tamns MA. illtrasonic dynamic three-dimensional visualization of the heart with a multiplane transesophageal imaging transducer. JAm Soc EcJwcurdiogr 1994;7:217-229.
17 Pandian NO, Roeland! J, Nanda NC et aI. Dynamic three-dimensional cchocardiography: Methods and clinical potential. EclwcardiograpJIy 1994; 11 :237-259
18 Schwartz SL, Cao Q, Azevedo J, Pandian NG. Simulation of intraoperative visualization of cardiac structures and study of dynamic surgical anatomy with real-time three-dimensional cchocardiography. Am J CardioI1994;73:501-507.


IMPROVED QUANTIFICATION OF MYOCARDIAL lYIASS BY 3DE 157
CHAPTER 13
IMPROVED QUANTIFICATION OF MYOCARDIAL MASS BY THREE-DIMENSIONAL ECHOCARDIOGRAPHY
USING DEPOSIT CONTRAST AGENT
Jaroslaw D. KasJll'zak* MD, Wim B. Vlettel' Msc, Jan R. van Meegen BS, Youssef F.M. Nosil' MD, Richal'd Johnson PhD**, Folkel't J. Ten
Cate MD and Jos R.T.C. Roelandt MD.
Thoraxcentre, University Hospital Rotterdam - Dijkzigt and Erasmus University, Rotterdam, The Netherlands,
Ulh'asolllld Med&BioI1998;24,5:647-53

158 CHAPTER 13
ABSTRACT Aims. Two-dimensional echocardiography is a common noninvasive approach to calculate
myocardial mass. The method requires geometrical assumptions and suboptimal definition of endocardial and epicardial borders remains an important source of measurement variability. Our study was aimed to determine whether the myocardial enhancement with a novel contrast agent can improve the reproducibility of mass quantification assessed with three-dimensional echocardiography in a porcine model.
Methods. Three-dimensional reconstruction of the left ventricular myocardium was performed from echo images obtained with rotational epicardial acquisition in 8 open-chested pigs. Imaging was performed before and after left atrial injection of a deposit echocardiographic contrast agent - Quantison DepotThf.
Results. Myocardial enhancement was retained in three-dimensional datasets. Threedimensional echocardiographic myocardial mass values had close agreement with weighed mass (differences -1.6±S.Og for end-diastolic frame, -2.8±4.5g for end-systolic frame, l.O±l.Og for end-diastolic frame with contrast and O.6±2.0g for end-systolic frame with contrast, p::::NS). Values obtained after the contrast injection were more accurate (correlation with a real mass at r=0.99) and measurements reproducibility after contrast injection was improved.
Conclusions. Myocardial lllass calculation using three-dimensional echocardiography is feasible and accurate. Injection of a deposit contrast agent allows to further improve measurement reproducibility.
INTRODUCTION Quantification of left ventricular hypel1rophy is important and has both therapeutic and
prognostic implications in a variety of cardiovascular diseases. 1-4 Measurement of myocardial mass in vivo is feasible by M-mode and two-dimensional echocardiography5-7 but ilTegular shape of left ventricular myocardium is a challenge for methods based upon geometrical assumptions.8 Recently introduced three-dimensional echocardiography (3DE) enables the analysis of complex anatomical stl1lChlIeS in off-line reconstructed cutplanes.9
-12 The
quantification of complicated shapes using a disc summation approach allows to improve the accuracy. Another problem in myocardial volume measurements, a suboptimal delineation of epicardial and endocardial contour could be overcome by echocardiographic contrast agents. Recently introduced, echocardiographic deposit contrast agent - Quantison DepotThf provides long-term myocardial enhancement, suitable for 3DE data acquisition with cUlTently used equipment.
The purpose of our study was to test the additional advantage of myocardial contrast enhancement for improved quantification of myocardial mass using three-dimensional reconstruction with an internal reference echocardiographic system.
MATERIALS AND lVlETHODS Tile al/imaT stlldy desigll.
The experiments were peifOlu1ed according to the principles of care and use of animals approved by the Council of American Physiological Society (DHEW Publication No [NllI)

IMPROVED QUANTIFICATION OF MYOCARDIAL MASS BY 3DE 159
80-23,1980) under the regulations of the animal care committee of the Erasmus University Rotterdam, The Netherlands. The study was conducted on 8 Yorkshire pigs, weighing 21.5 -31kg (mean 25.8±3.lkg). Animals were sedated with i.m. 25 mg/kg ketamine HCl, followed by Lv. 20 mglkg pentobarbital. During the experiments a continuous Lv. infusions of 10 mg/kg/hr pentobarbital and 0.25 mllkglmin physiological saline were given. The pigs were intubated and ventilated with a mixture of oxygen and nitrogen (1 :2) under gasometric control using a Bourns BV-502 (Medical Systems Inc., lliverside, CA, USA) ventilator. After the muscle relaxation with 4 mg pancuronium bromide, median sternotomy was performed and the heart was suspended in a pericardial cradle. A catheter was positioned in the left atrium for contrast injection. Heart rate, ECG, aortic pressures, left ventricular pressures and their derivatives were monitored throughout the experiments. Experimelltal protocol
Before the contrast study. i. v. indomethacin O.2mglkg/body weight was given. As soon as the hemodynamic parameters stabilized after the animal preparation, 3DE data acquisition was performed. After one minute, the contrast agent was injected through the left atrial catheter in the dose of 20 ml. In three previous pilot experiments, not described in the present study, this dose was empirically found to be safe and providing optimal myocardial opacification. As soon as the contrast agent had been washed away from the heart cavities, the second 3DE Ullage acquisition was performed. Animals were monitored until 30 minutes after the contrast injection. The left ventricular muscle mass (with papillary muscles excised) was weighed after animal sacrifice.
Three-dimellsiol/al cOl/h'ast ec!/Ocardiography Deposit cOl/lrast agel/I: Quantison Depot"l (Andaris Ltd, Nottingham, UK) consists of air
filled albumin microcapsules with an average diameter of 10 11m and less than 2% exceeding 20 11m. The walls of the microcapsules are composed of human serum albumin cross-linked to confer stability in the microcirculation. The agent is formulated as dry powder for sllspension in an aqueous diluent providing a concentration of 5 x 10⁷ microcapsules/ml.
Three-dimensional ecllOcardiograpity. Epicardial acquisition of two-dimensional images was performed for three-dimensional reconstruction. 13 Data were collected using a 5 MHz, 64-element transesophagealmultiplane probe (Delft Instruments Medical Inlaging BV, Delft, Hollaud) connected to a Sonos 500 (Hewlett-Packard, Andover, MA, USA) system. Video output of the echocardiograph was interfaced to a 3DE system (Echo-Scan 3.0, TomTec GmbH, Munich, Germany).
Image acquisitioll. The probe was placed epicardially over the middle of the right ventricular wall. The imaging window was optimized so that during a 1800 rotation of the imaging plane the entire left ventricular muscle was encompassed. The standard settings of two-dimensional images (except for a linear postprocessing curve) providing optimal visualization of left ventricular endocardium were used dml11g acquisition. The images for 3DE reconstruction were acquired during computer-controlled rotation of the transducer at 2° intervals (internal reference system) using EeG gating. Data processing was pedormed offline by the 3DE system software. Digitized data were reformatted from the original polar Ollentation into Cartesian coordinates (256 x 256 x 256 voxels, i.e. lIvolume pixels It).

160 CHAPTER 13
The gaps between adjacent cross-sections were filled with interpolation procedures. Additional computer procedures were applied to reduce noise, enhance edges and reduce artifacts. Image display alld evaluatioll. The postprocessed dataset was used for reconshuction of eight parallel short-axis cutplanes perpendicular to the operator-selected left ventricular long axis (paraplane echocardiography), independent from the original ultrasonic window. Slice thickness was adjusted as 118 of the distance between apical epicardium and the plane of mitral anulus so tbat entire left ventricular muscle volume was encompassed in 8 adjacent slices. Epicardial and endocardial left vcuticular muscle contours were manually traced by 2 observers in end-diastolic and end-systolic frames to calculate myocardial volume using Simpson's method with the software of 3DE system, according to the quantification method validated in the Thoraxcentre (Fig. 1).14 Corresponding muscle mass was calculated as: volume x muscle density (1.05 g/ml). Measurements were repeated after 3 months by observer I (J.O.K.) to evaluate long-term intraobserver reproducibility of the results.
Figure 1. Panel A. Measurement of left ventricular myocardial volume using reconstructed paraplane cross-sections. Top left panel displays the reference long-axis view with line marks indicating the relationships of eight adjacent parallel cross-sections reconstmcted at 8mm intervals. The traced epicardial and endocardial muscle contours are superimposed on the cross-sections. The calculated muscle volume is 65.6 mI, corresponding with real weight 68.8 g in the example shown. Panel B. Three-dimensional representation of left ventricular myocardial shape viewed from different angles.
Statistical analysis. Numerical data are expressed as mean ± standard deviation. Linear regression was used to
determine the correlation between 3DE estimates of myocardial mass and gross specimen weight. Analysis of agreement for muscle mass calculations was performed according to the

IMPROVED QUANTIFICATION OF MYOCARDIAL MASS BY 3DE 161
method proposed by Bland and Altman. I' Limits of agreement were deftned as mean ± 1.96 x
standard deviation of differences. Comparison of data obtained at different stages of experiment was made using repeated-measures analysis of variance with pairwise comparisons according to the Dunnett method. Additional comparisons of numerical variables were performed using paired t-test. Differences were considered significant at p<0.05. Variability coefficients were calculated as the standard deviation of the differences between measurements expressed as a percent of the average value. Equality of variances was controlled with F test. Calculations were made with SYSTAT 5.0 for Windows (SYSTAT Inc. 1990-92) package.
RESULTS COlltrast effectivelless alld hemodYllamic effects of the deposit agellt.
The data obtained by hemodynamic monitoring of pigs during the experiment disclosed no adverse hemodynamic effects of Quantison depot™ administration. After the left atrial injection, Quantison depotTM caused a visible increase in echointensity of myocardium in two-dimensional echocardiographic images. Enhancement started within few beats after the injection, improving endocardial and epicardial definition. Intense myocardial opacification was observed in all pigs until the end of experiment (30 minutes), whereas the agent disappeared from the heart cavities within 2 minutes. Three·dimellsiollal cOlltrast echocardiography.
A total of twelve 30E acquisitions was successfully peIfol1ned. The complete procedure. preceded by optimalization of probe position, system calibration and a fe\" test mns required 5-8 minutes. Off-line image postprocessing and analysis was completed within 70 minutes per animal. Contrast enhancement of the perfused muscle was visible in computerreconstmcted cross-sections. Reconstruction quality allowed the delineation of left ventricular myocardium in every study. Minor motion artifacts were present in 4 datasets, not precluding the myocardial mass evaluation. Myocardial mass qllalltificatioll.
Slice thickness in Simpson's method calculation ranged 7.1 - 10.3n11n in diastolic frames and 6.2 - 9.30101 in systolic frames. Weighed myocardial mass ranged from 64.1 - 102.3g (mean 79.5 ± 13.2g). 30E myocardial mass estimates showed excellent agreement with real lllass as shown in Table 2. Mean difference between 30E and real mass was -1.6±S.Og in enddiastolic frame, -2.8±4.5g in end-systolic frame, 1.0±l.lg in end·diastolic frame with contrast and O.6±2.0g in end-systolic frame with contrast. The differences were not significant according to ANOV A analysis and Dunnett method. Linear regression analysis confirmed high correlation of 3DE estimates with real mass as shown in Table 1. Measurements taken after the contrast injection yielded more accurate results, reflected by closer correlation with a real mass (r = 0.99) and lower standard eITOI' of estimate (Table I). Limits of agreement of 3DE mass values significantly decreased after contrast injection (F test p=0.0004 and 0.05 for end-diastolic and end-systolic measurement, respectively). Measllremellt reprodllcibility.
For the evaluation of short-term intraobscrver variability. the values obtained in endsystolic and end-diastolic frames were compared.

162 CHAPTER 13
There were no significant differences between mean values of myocardial mass estimates as shown in Table 2. There were no statistically significant differences in the reproducibility of myocardial mass measurement in different phases of heart cycle but the differences between end-systolic and end-diastolic frame measurement showed less variance after contrast injection (F test p=O.005). Similarly. values obtained after 3 months did not differ from the initial results. Interobserver and long-term intraobserver measurement reproducibility after contrast injection was significantly improved (Table 2).
Table 1. Correlation of myocardial mass calculated with three-dimensional echocardiography (3DE) in comparison with weighed myocardialm3ss. 3DE mass calculation vs weighed 3DE mass values myocardial mass (Dunnett p::::NS)
End-diastolic frame 77.8 ± 14.6g (range 58.0-107.0g)
End-systolic frame 76.6 ± Il.lg (range 65.2-94.9g)
End-diastolic frame 80.5 ± 13.0g after contrast injection (range 65.0-102.9)
End-systolic frame 80.0± 13.lg after contrast injection (range 65.7-100.7g)
Regression equation r
y-0.85x + 13.2 0.940
y=l.l2x - 6.8 0.947
y=1.02x - 2.2 0.997
y=1.00x - 0.7 0.988
p SEE
0.001 4.86
0.0004 4.60
<0.0001 1.05
<0.0001 2.17
3DE= three-dimensional echocardiography, p: probability, NS-Ilot significant, f- Pearson's correlation coefficient, and SEE= standard error of the estimate.
" 31lE I [l ASTa.E
" 31lE I SYSTa.E
" " ~
'" " ~ , • E • • 1 , • .t " " " " " " '00 ." .. ~
., • • ." • ill
0 <') ·15
§ ,. ~ , E
I • • • '" " " " " .,
" "" ." .. ~ ., • • • W -10 • • 0
" ." W€i4'ed mass (9) Weighed mass (g) ." ."
" 3DE + CONTRAST I rn ASTOlE ,. 3DE + CctrrRAST J SYSTOlE
" " § " § ,.
" , . E '. II • • ,
" ,.
" "' " " " ,., ,., ..
f ., B ,
• . • . i • .-.
" ". " .. " " " 100·10, .. ., w
.,. a ." "
w .,. a ", ·15
Weighed mass (g) Weighed mass (g)
." .,.
Figure 2.Agreement plols of the three-dimensional cchocardiographic myocardial mass data with weighed mass - in end-diastole (A), in end-systole (B), in end-diastole after contrast injection (C) and in end-systole after contrast injection (D). Dashed lines mark the bias and limits of agreement (95% confidence intervals).

IMPROVED QUANTIFICATION OF MYOCARDIAL MASS BY 3DE 163
Table 2. Reproducibility of three-dimensional echocardiographic (3DE) measurements of myocardial mass.
Variability Intraobscrver short-term (end-diastole vs, end-systole)
Difference between measurements (p=NS) 2.7 ± 5.7 g
F test p value 0.005
Variability coefficient 7.5%
Idem, after contrast injection O.5± 1.7 g 2.2 % Intraobserver long-term (end-diastolic frame) 2.9 ± 4.9 g 6.1 % Idem, after contrast injection 1.7 ± 2.4 g 0.091 3.0% Intraohserver long-term (cnd-systolic frame) 1.4 ± 7.3 g 9.4% Idem, after contrast injection 1.9 ± 2.8 g 0.022 3.5% Interohservcr (end-diastolic frame) 0.4 ± 7.8g 10.1 % Idem, after contrast injection 1.2 ± 3Ag 0.013 4.2% Interobserver (end-systolic frame) 1.7 ± 7.0g 9.2% Idem, after contrast iniection 1.6 + 3Ag 0.076 4.3% F test p value significance of ,'anance differences in baseline and contra, ted images, other appreviations as table I.
DISCUSSION Myocardial mass quautijicatioll usillg three-dimellsiollal ecllOcardiogl'llphy.
The main finding of our study is that myocardial mass can be accurately measured in vivo using 3DE voxel imaging and that myocardial signal enhancement with a deposit contrast agent facilitates accurate deHneation of epicardial and endocardial contours, improving accuracy and measurement error. Conventional M-mode using Penn convention [5,6] as well as more refIned two-dimensional echocardiographic algorithms,7,16,17 commonly used for left ventricular mass quantification, suffer from simplified geometrical assumptions. Complex spatial shape of myocardium, particularly in diseased hearts, cannot be precisely reflected in a single cross-section, which precludes in accurate calculation. Operator-dependent cutplane selection is another major source of error. Therefore, 3DE 18 is a possible solution for those issues. Most evidence for the improvement in quantification of left ventricular mass with 3DE was obtained using external reference systems - with acoustic or magnetic locator. With this approach, the endocardial and epicardial smface is reconstructed using several randomly acquired and manually traced cardiac cross-sections and a polyhedral smface reconstruction algoritlml. This technique is efficient for left ventricular mass quantification as demonstrated in the experimental setting 19-21 and in human studies .9,22 Low measurement error and good reproducibility was reported, with an error 2-3 times lower than with two-dimensional echocardiography and even more than with M_mode?3,24
In our study, we used 3DE vaxel imaging. The systematic. computer controlled acquisition of basic echo data encompassing the region of interest is theoretically more complete and uniform. The disc summation method is possible by off-line reconstruction of operatorselected two-dimensional cross-sections allowing volume quantification of any anatomical structure. Preliminary reports exist regarding the application of voxel imaging for the myocardial mass quantification. 25-27 Results recently reported by KUhl et a1.,28 were superior to those obtained with the Penn convention. Although the optimal strategy for image acquisition and analysis is still unclear ,25,27 our data support the usefulness of a rotational data acquisition and modified Simpson's algorithm.14 The calculation of myocardial mass was feasible in all three-dimensional datasets and the results achieved in beating porcine

164 CHAPTER 13
hearts are comparable with those of Ktihl et al.28 Main problem in the mass quantification procedure is suboptimal delineation of myocardial borders. The injection of a deposit contrast agent offers a solution of tIus problem as demonstrated by improvement in measurement reproducibility and closer limits of agreement.
Deposit cOl/h'ast agel/to COllllllonly used myocardial contrast agents arc rapidly removed from the myocardial
microcirculation. Quantison depotThf, with its relatively large and thick-walled bubble, is a deposit agent. Myocardial signal enhancement appears within few beats after injection and persists long after the contrast has disappeared from heart cavities. The benefits of sllch approach include lack of attenuation from cavity contrast and long temporal window for data acquisition, essential for high quality three-dimensional reconstruction with presently available equipment. These properties are related to prolonged stay of the agent in capillaries, similarly to radiolabelled microspheres. This implies microembolization of a number of microvessels, and concerns about safety arise. In our study, no hemodynamic effects of contrast injection were observed. It is known from studies using radiolabelled microspheres of ISpm diameter that a dosis of 5 x 10⁵
, gram tissue is needed to aITest the heart.29 To our knowledge, no data are available for microspheres with sizes comparable to the microcapsules used in the present study. The dosage was chosen after a number of pilot experiments. Nevertheless, safety studies are needed before Quantison depotTIlf can be applied in humans.
The properties of the new agent encouraged us to investigate a novel application - to improve the definition of myocardium. Until now the application of myocardial contrast enhancement was aimed at the evaluation of perfusion. No data are available concerning the impact of contrast enhancement on the accuracy of myocardial mass quantification. In agreement with preliminary reports,JO,JI the contrast effect is reliably reproduced in threedimensional datasets. The enhancement of myocardial signal markedly facilitates the delineation of endocardium, epicardiulll and atrioventricular groove, thus improving measurement reproducibility of contrast-enhanced images as compared to baseline.
Limitatiolls of tilis stlldy. Our study included a relatively small number of animal experiments. The deposit contrast
agent used in our study, Quantison depotThf, is still investigational and its safety and clinical usefulness has to be further studied.
\Ve have used the epicardial acquisition technique which will be replaced in clinical practice by the use of transesophageal or transthoracic acquisition as an extension of a routine examination. Epicardial data acquisition poses some specific problems. which can affect the measurement accuracy. The transducer placed on a beating heart cannot be perfectly stabilized which lUay result in motion artifacts. Moreover, even with the epicardial right ventricular window, the left ventricle can be close to the transducer, sometimes precluding to encompass the entire muscle volume within the conical dataset. TillS is a possible source of volume underestimation, particularly in end-diastole.
Three-dimensional echocardiography, despite major progress in software and instrumentation still suffers from temporal and spatial resolution problems. Data processing requires time and real-time three-dimensional echocardiography may be relieved of tIus

IMPROVED QUANTIFICATION OF l'I'lYOCARDIAL MASS BY 3DE 165
problem?2 Implementation of advanced border detection techniques can shorten the analysis time by elimination of tedious manual tracing.
SUMMARY Tins study demonstrates the feasibility and accuracy of three-dimensional
echocardiographic determination of myocardial mass in vivo. The measurement accuracy and reproducibility is further improved by a deposit contrast agent, facilitating the detection of myocardial borders. Future developments in three-dimensional echocardiographic instnll11entation and contrast agents may simplify the procedure and expand its clinical applicability.
References. 1. Devereux RE, Alderman MH. Role of preclinical cardiovascular disease in the evolution from risk
factor exposure to development of morbid events. Circulation 1993;88: 1444-55. 2. Casale PN, Devereux RB, ~Ilillner M ct al. Value of echocardiographic measurement of left
vcntricular mass in predicting cardiovascular morbid events in hypertensive men. Ann Intern Med 1986;105: 173-8.
3. Koren Ml, Devereux RB, Casale PN, Savage DO, Laragh JH. Relation of left ventricular mass and geometry to morbidity and mortality in uncomplicated essential hypertension. Ann Intern Med 1991 ;114:345-52.
4. Levy 0, Garrison RJ, Savage DD, Kannel \VB, Castelli WP. Prognostic implications of cchocardiographically determincd left ventricular mass in the Framingham Heart Study. N Engl J Med 1990;322:1561-6.
5. Devereux RB, Reichek N. Echocardiographic determination of left ventricular mass in man. Anatomic validation of the method. Circulation 1977;55:613-8.
6. Reichek N, Devereux RB. Left ventricular hypertrophy: relationship of anatomic, echocardiographic and electrocardiographic fIndings. Circulation 1981;63: 1391-8.
7- Reichek N, Helak J, Plappert T, St.John Sutton M, \Veber KT. Anatomic validation of left ventricular mass estimates from clinical two-dimensional echocardiography: initial results. Circulation 1983;67:348-52.
8. \Veiss JL, McGaughey M, Guier \VH. Geometric considerations in dctermination of left vcntricular Illass by two-dimensional echocardiography. Hypertension 1987;9[Suppl. m: II-85-9.
9. Nanda NC, Pinheiro L, Sanyal R, Rosenthal S, Kirklin JF. Multiplane transesophageal echocardiographic imaging and three-dimensional reconstruction. Echocardiography 1992~9:667-76.
10. King DL, Gopal AS, Sapin PM, Schroder KM, DeMaria AN. Three-dimensional echocardiography: a review. Am J Card Imaging 1993;3:209-20.
11. Pandian NG, Roelandt JRTC, Nanda NC et at Dynamic three-dimensional echocardiography: methods and clinical potential. Echocardiography 1994; 11 :237-59.
12. Roelandt JRTC, Salustri A, Mumm B, Vlelter W. Precordial three-dimcnsional echocardiography with a rotational imaging probe: methods and initial clinical experience. Echocardiography 1995; 12:243-52.
13. Roclandt JRTC, Ten Cate FJ, Vlctter WB, Taams MA. Ultrasonic dynamic three-dimensional visualization of the heart with a llluitiplane transesophageal imaging transducer. J Am Soc Echocardiogr 1994;7:217-29.
14. Nosir YFM, Fiorctti PM, Vletter \VB et a1. Accurate measurement of left ventricular ejection fraction by three-dimensional echocardiography: a comparison with radionuclide angiography. Circulation 1996;94:460-6.

166 CHAPTER 13
15. Bland JM, Altman DO, Statistical methods for assessing agreement between two methods of clinical measurement. Lancet 1986; I :307-10.
16. Byrd BF Ill, \Vahr D, \Vang YS, Bouchard A, Schil1er NB. Left ventricular mass and volume/mass ratio determined by two-dimensional echocardiography in normal adults. J Am Coli Cardial 1985;6:1021-5.
17. Schiller NB, Skioldebralld CO, Schiller EJ. Canine left ventricular Illass estimation by hvo-dimensional echocardiography. Circulation 1983;68:210-6,
18. Ariet M, Geiser EA, Lupkie\vicz SM, Conetta DA, Conti CR. Evaluation of a three-dimensional reconstruction to compute left ventricular volume and mass. Am J Cardial 1984;54:415-20.
19. Gopal AS, Keller AM, Shcn Z et a1. Three-dimensional echocardiography: in vitro and in vivo validation of left ventricular mass and comparison with conventional echocardiographic methods. J Am Coil CardioI1994;24:504-13.
20. Legget ME, Martin RW, McDonald JA et al. Three-dimensional echocardiography of the left ventricle using a magnetic location system: in vitro validation of volume and mass. J Am Soc Echocardiogr 1995;8:386(Abstract).
21. Sapin PM, Gopal AS, Clarke GB, Smith MD, King DL. Three-dimensional echocardiography compared to two-dimensional echocardiography for measurement of left ventricular mass anatomic validation in an open chest canine model. Am J Hypertens 1996;9:467-74.
22. Chuang ML, Beaudin RA, Riley MF et a1. Accurate measurement of left ventricular mass by threedimensional echocardiography with unrestricted plane positioning. Circulation 1996;94 (Suppl D:1-688(Abstract).
23. King DL, Gopal AS, Keller AM, Sapin PM, Schroder KM. Three-dimensional echocardiography Advances for measurement of ventricular volume and mass. Hypertension 1994;23(Suppl 1):1-172-9.
24. Schnellbaecher MI, Gopal AS, Shen Z, Akinboboye 00, Sapin PM, King DL. Human in vivo anatomic validation using explanted hearts: superior accuracy of 3D echo over 2D and ID echo for left ventricular mass determination. Circulation 1995;92 (Suppl. 1): 1-798(Abstract).
25. Lama D, Yao J, Masani N et al. Longitudinal rotational tomographic approach for in vivo determination of left ventricular lllass - comparison of a new three-dimensional echocardiographic method to anatomy. J Am Coli CardioI1997;29:521A(Abstract).
26. Laskari C, Delabays A, Yao J et al. Accurate estimation of left ventricular mass in vivo by voxelbased three-dimensional echocardiography. J Am Coil CardioI1996;27:239A (Abstract).
27. Rodevand 0, Bjornerheim R, Kjekshus J. Left ventricular lllass assessed by three-dimensional echocardiography lIsing rotational acquisition. Circulation 1996;94 (Suppl. I): 1-688(Abstract).
28. KOhl HP, Franke A, Frielingsdorf J et al. Determination of left ventricular mass and circumferential wall thickness by three dimensional reconstruction: in vitro validation of a new method that lIses a Illultiplane transesophageal transducer. J Am Soc Echocardiogr 1997; 10: 107-19.
29. \Vu XS, Ewert Dl, Lin YR, Ritman EL. In vivo relation of intramyocardial blood volume to myocardial perfusion. Circulation 1992;85:730-7.
30. Delabays A, Sugeng L, Cao QL, MagIll G, Schwartz S, Pandian NG. Three-dimensional echocardiographic delineation of myocardial perfusion territories: description of a new 3D-image processing approach with a new ultrasound contrast agent. J Am Coll Cardiol 1995 ;25 :39A.(Abstract).
31. Kasprzak JD, Aiazian A, Vletter \VB, Sutton A, Ten Cate FJ, Roelandt JRTC. Three-dimensional myocardial perfusion using contrast echo. Eur Heart J 1995;16 Abstr. Suppl:205(Abstract).
32. Fleishman CE, Ota T, Ohazama CI et al. Real-time, three dimensional echocardiography: measurement of left ventricular mass in dogs. Circulation 1996;94 (Suppll):I-688(Abstract).


CONCLUSIONS AND SUMMARY 169
CHAPTER 14
CONCLUSIONS
Rapid developments have taken place in three-dimensional echocardiography (3DE) in the last few years and clinical applications are rapidly expanding. The technique potentially meets most of the requirements for the ideal diagnostic tool. The technique is noninvasive and can be pelfoIlned frequently for follow up studies. Currently available experience suggests that 3DE visualization and quantification of cardiac structures has a role in patients with valvular disorders, congenital heart disease, mass lesions, aortic abnormalities and for the assessment of left ventricular function.
The studies presented in this thesis were designed to assess the feasibility and the accuracy of 3DE for quantification of valve disease and ventricular fUllction.
3DE for qllalltificatioll of left vellh'iclliar volllllle (LVV) alld fllllCtiOIl In this part we have studied the feasibility, reproducibility and accuracy of 3DE for
calculating L VV and ejection fraction (EF) with comparison to values obtained from radionuclide angiography (RNA) and magnetic resonance imaging (MRI). Furthermore, \ve evaluated a faster 3DE method suitable for serial LVV and functional quantification. This is relevant for routine LV studies. We demonstrated that 3DE has an excellent conelation and close limits of agreement with RNA for EF calculation (chapter 3), In addition, 3DE has a closer limits of agreement than biplane modified Simpson's method (which used 2DE with two orthogonal cut planes) with RNA for EF calculation particularly in ischaemic patients with segmental and global left ventricular wall motion abnormalities (chapter 4). Segmental wall motion abnormalities and left ventricular shape abnormalities are common complications of coronary artery disease and affect both the accuracy and the reproducibility of L VV quantitation with conventional two-dimensional echocardiography (2DE). Our results show that 3DE allows assessment of the LV wall and provides more accurate calculation of EF using Simpson's 11I1e than that by the biplane modified Simpson's method when compared with RNA. This was also validated for patients with segmental wall motion abnormalities and when classified according to the site of the wall motion abnormality (chapter 4), When MRI was used as a reference method, 3DE provided accurate calculations of L VV and EF with comparable observer variability (chapter 6). In addition, 3DE has a small day-to-day variability. which is important for serial evaluation of L VV and EF in cardiac patients (chapter 7),
In order to make the 3DE quantitation method more practical for routine LV function calculation, we found that LV short axis sections obtained at 15 mm slice intervals allow accurate calculation of L VV and EF with acceptable probability level for detecting variable differences in EF when compared with RNA method (chapter 3), Automated pampl.ne selection of 8 equidistant short axis slices from base to apex is now incorporated and is accurate enough for calculating L VV and EF with Simpson's rule as compared to:MR.I

170 CHAPTER 14
method (cllapter 6). This approach can reduce the analysis time to 10 minutes. Increasing the angular intervals reduces the acquisition time and avoids motion artefacts. We found that reducing the number of component sections by selecting 16° rotational intervals the acquisition time can be reduced to 30 seconds and still allowing accurate calculation of L VV and EF with acceptable probability for detecting variable differences of L VV and EF for clinical decision making (cllapter 8).
3DE volumetric data sets allow us to study the spatial angle between the apical two chamber and the apical long axis views relative to the apical four chamber view and to study the accuracy of the biplane ellipse method for L VV calculation. Our data demonstrated that neither the apical two chamber view nor the apical long axis view was orthogonal to the apical four chamber view. It appears that the biplane ellipse method using the apical four chamber view with the apical long axis view rather than the apical two chamber view is more accurate for LVV and EF calculation (chapter 5).
3DE ill Ihe assessmelll of val villar heart disease 3DE allows optimal visualization of the smallest valve orifice area by paraplane analysis
through the long axis of valve apparatus in patients with mitral or aortic valve disease. Mitral valve area derived froIll 3DE data sets showed excel1ent con-elation, closer limits of agreement and non significant difference with areas calculated frOIll Doppler pressure half lime. 2DE derived valve areas showed moderate cOlTelation, wider agreement and significant difference with comparison to the Doppler reference method (cllapter 10). Aortic valve orifice area measurements were similar in both 2DE and 3DE studies. However, with cutplane angulation or parallel shift, significant overestimation of aortic valve area was observed (chapter 11).
3DE ill the assessmellt of patiellts with hypertrophic cardiomyopathy (HeM) alld calclIlatioll of L V mass
Our 3DE data demonstrated that patients with hypertrophic cardiomyopathy are characterized by a highly eccentric and asymmetric LV outflow tract and by smaller minimal cross sectional area compared to normal subjects (chapter 12). Calculation of myocardial mass by 3DE had close agreement with weighted mass. Intravenous contrast injection improved both the accuracy and the reproducibility of LV mass calculation by 3DE through enhancing epicardial and endocardial border delineation for planimetry (chapter 13).
3DE FUTURE DIRECTIONS AND NEW APPLICATIONS 3DE using real time volumetric scanning provides on-line data acquisition and display of
3DE images of the heart. 3DE using the ultrafast acquisition by continuously rotating phased alTay transducer will reduce the acquisition time to seconds and therefore facilitate its routine use. This has advantages to use during stress echocardiography and myocardial perfusion agents. It will also facilitate peri-operative assessment of patients with valvular and congenital heart diseases.
3DE allows to obtain an unlimited number of cutting planes through the heart which is not possible with standard 2DE.

CONCLUSIONS AND SUMMARY 171
The ability to electronically dissect a specific structure and display it in any projection has advantages in planning surgical procedure of valve replacement or repair in patients with mitral valve disease. Volume rendered technique can assess in diagnosis of complex congenital anomalies and planning surgical procedures. As in patients with atrial septal defect (ASD) and ventricular septal defect (VSD), 3DE can assess the flolV through the defect and also to detect the size, site and relations of the defect for device closure.
In future virtual reality from 3DE data can simulate surgical and interventional procedures in a computer model. This will allow the surgeon to better plan the procedure. 3DE computer model can also be used in teaching and training of various procedures.
Paraplane analysis from 3DE allows to span and to measure the volume of any cardiac or illtracardiac stmcture and abnormal flow jet. \Vith the application of myocardial contrast we can see the myocardial pelfusion defect not only on 2DE but also in 3DE paraplane 81 ices that can be labeled and extracted. This would allow quantification of the mass of the perfused, the ischaemic and the infarct areas and to correlate their magnitude.
Manual endocardial tracing is laborious and time consuming. 3DE with automated border detection algorithm needs to be validatcd for accurate and rapid volume and function quantification. In addition, endocardial border delineation can be enhanced by using the second harmonic mode and by intravenolls ultrasound contrast agents in rcconstmction methods using standard equipment.
Dynamic 3DE reconstruction can be used in the future to quantify abnormal flow jets in all its dircctions. Together with accurate LVV measurement, the assessment of severity of valve regurgitation well be improved.
Continuous advances in computet and ultrasound technology will strengthen the application of 3DE and will guarantee echocardiography to dominate other imaging techniques in clinical cardiology.
SUMMARY We demonstrated that, 3DE is an accurate and reproducible technique for L VV and EF calculation and compares
favorably with both RNA and MRI. We suggest the following protocol for 3DE reconstruction and quantification of LV: * Precordial rotational acquisition at 160 intervals, * unage processing of end-diastolic and end-systolic phases, * Paraplane analysis using 8 parallcl equidistant short axis slices We found that the use of the apical four chamber view in combination with the apical long
axis view provides accurate LVV and EF calculation using the biplane modified Simpson's method.
3DE allows reproducible measurement of the stenotic valve area which has similar accuracy as presently used Doppler methods.
Precordial 3DE provides detailed qualitative and quantitative infonnation on the LV outflow tract. Patients with hypeltrophic cardiomyopathy arc charactelized by a highly eccentric and asymmetric shape of the LV outflow tract, and by a smaller minimal cross-sectional area compared to normal subjects.

172 CHAPTER 14
Myocardial mass calculation using 3DE is feasible and accurate. Injection of a deposit contrast agent enhanced epicardial and endocardial border delineation and allows further improvement of measurement reproducibility.

SAMENV ATTING 173
SAMENV ATTING
Quantificatie van cardiale funetie parameters heeft belangrijke diagnostische. prognostische en therapeutische consequenties. Daarom is het gewenst over een methode te beschikken die de cardiale fUllctie snel, nauwkeurig, reproducecrbaar en op een niet bloedige wijze bepaalt. Met driedimensionale echocardiografie kunnen sOIlllllige bepcrkingcn van twecdimcllsionale echocardiografie worden vDorkomcn. Dit staat een betrouwbare quantificatie van de cardiale functie toe zander gebruik te maken van geometrische aallllames.
CONCLUSIES
1. Driedimcnsionale echocardiogral1c heeft bewezen een nauwkeurige en rcproducecrbarc tcchniek te zijn voor de berckcning van linker kamcr valumina en ejecticfractie met een goede vcrgclijkbaarheid met radionucleide angiografie en magnetische resonantie.
2. We stcllcn het volgende protokol voor ter bestudering van cen snel1e en nauwkemige 3D echocardiografische reconstmctie en kwantificering van de linker kamer functie. *' precordiaal roterende acqmsltIe met een interval van 16 graden. *' beeldverwerking van einddiastolische en eindsystolische perioden. '" paral1eUe analyse door gebruik te maken van 8 korte as doorsneden met een gelijke
onderlinge afstand. 3. We stellen voor om de apikale lange as doorsnede (3 kamer doorsnede ) te samen met de
apikale 4 kamer doorsnede te gebruiken i.p.v. de apikale 2 kamer doorsnede te samen met de apikale 4 kamer doorsnede voor een nauwkeurlge bepaling van linker kamer volumina en ejectiefractie.
4. Driedimensionale echocardiografie heeft voordelen voor de morfologische bestudering van de mitraal - en aortakleppen. Vit de geregistreerde dataset kan een nauwkcurige reproduceerbare meting van de oppervlakte van de mitralis- en aortaklep worden bepaald.
5. Precordiale driedimensionale echocardiografie geeft gedetaiHeerde kwalitaticve en kwantitatieve informatie over de linker ventrlkel uitstroombaan. Paticnten met hypertrofische cardiomyopathie worden gekellmerkt door cen stcrk excentrische en asymmetrische vorm van de linker ventrikel uitstroombaan en door een kleinere doorsnede indien vergelekellmet normal en.
6. Bepaling van de myocardiale massa m.b.v. 3D echocardiografie is mogelijk en nauwkeurig. Indien een echogratisch contrastmiddel wordt gebmikt, blijkt de reproduceerbaarheid van de meting toe te nemen.

174
ACKNOWLEDGEMENT
My deepest appreciation goes to Prof. Jos RTC Roelandt, who provided the unique opportunity to work at the Thoraxcenter. He encouraged me to start the validation of 3DE for cardiac quantitatioll purposes. Indeed this was laborious and time consuming. He told me in clinical research you have to invest a lot of time to solve one simple problem, but this is the only way to solve bigger problems. His creativity and determination to achieve the intended goal enable us to continue and emphasize our eff0l1s to find a clinically applicable protocol fOf cardiac quantification using 3DE. I am very grateful for the hours he has spent in reviewing the articles of this thesis. It is true to say that this project wouldn't have succeeded without his support.
I am particularly indebted to Prof. Mokhtar M GOlliaa for his continuous encouragement and support. He was the impetlls for my fellowship at the Thoraxcenter in Rotterdam. A most kind and generous indivedual. Prof. Gomaa was a constant source of stimulation and he suppOlted me in every possible way to continue and complete this work. Words are not sufficient to express my gratitude to him.
I would like to convey my appreciation to my co-promotor Dr. Folkert J Ten Cate and also to Dr. Paolo M Fioretti for their support throughout my fellowship period at the Thoraxcenter Rotterdam. Their invaluable scientific criticism and ideas had a decisive influence which enabled this work to become reality.
I would like to tbank Wim B Vletter as he provided me with great support and with many valuable suggestions to complete this thesis. I am velY grateful to Eric Boersma and Ron T van Domburg for supporting my studies with the appropriate statistical analysis. I am also grateful to Rene Frowijn for his patience assistance with the compute technology.
I would like to thank Ad van DlUnen, Willeke Korpershoek, Marianne Eichhoitz, YVOlme Kalkman-Schotting, and Arita Orgers for their valuable help and advice.
I would like to thank every member of the big faruily of The Thoraxcenter particularly those working in The Echocardiography Laboratory and members of The Department of Nuclear Medicine and The Department of Radiology, Dijkzigt Hospital, for the help I received to complete these studies.
I would like to convey my deepest appreciation to all the staff members and my colleges at The Cardiology Department, AI-Hussein University Hospital, AI-Azhar University, Cairo, Egypt, for their continuous encouragement and support to complete tius work.

175
As the Thoraxcenter is really a multinational center, I have enjoyed the friendship and to work with many fellows. They include Kasprzak JD (Poland), Salustri A (Italy), EI-Said EM (Egypt), Elhendy A (Egypt), Cornel J (Netherlands), Poldermans D (Netherlands), Geleijnse M (Netherlands), Dall' Agata A (Italy), Rambaldi R (Italy), LIlias V (Hungary), Chen Q (China), Yao J (China), Aiazian (Russia), Olaf F (Germany), Bernard Paelinck (Belgium), Rocchi G (Italy) and Chlebus K (Poland).
I would like also to convey my deepest appreciatIOn to Wagdy and Mohamed (my brothers) and more particularly to the soul of my father-in-law Lotty Nasir, for their indispensable support, encouragement and devotion.
Finally I would like to thank my wife Ghada and my sons Mahmoud and Ahmed, who provided the understanding and the emotional support which enabled me to continue and complete this work.
Support by a Fellowship of the NUFFIC (Netherlands organization for international cooperation ill higher education) is gratefully acknowledged

176
Met dank aan: AJldaris Limited, Schering Nederland BF, Tom Tee Imaging Systems, Hewlett Packard, Toshiba Medical System BV, Pfizer BV, Boeringer ingelheim BV.
Name: Nationality: Birth Date. Place of Birth. Marital State:
Education. 1966-72: 1972-75: 1975-78: 1978-85: 1986-87:
1988-9 I:
1991-98:
1994-99:
Certificates.
M.B.B.Ch.:
M.Sc.:
M.D.:
Curriculum Vitae
Youssef F.M. Nosir. Egyptian. 25-01- I 960. Cairo, Egypt. Married with Ghada L.M. Nosir. Having 2 sons (Mahmoud and Ahmed).
Ahmed Amin primary school, Cairo, Egypt. Al-Mohamadia prep school, Cairo, Egypt. Banba Kaden Secondary School, Cairo, Egypt. Faculty of medicine, AI-Azhar University, Cairo, Egypt. House Officer, AI-Hussein University Hospital, AI-Azhar University. Cairo, Egypt Resident of cardiology, Cardiology Department, AI-Hussein University Hospital, AI-Azbar University, Cairo, Egypt. Assistant Lecturer of Cardiology, Cardiology Department, AI-Azhar University, Cairo, Egypt. Research Fellow, Thoraxcentcl\ Academic Hospital Rotterdam, Erasmus University. Rotterdam, The Netherlands.
1985 from Faculty of Medicine, AI-Azhar University, Cairo, Egypt. 199 I Master degree of Cardiology, AI-Azhar University, Cairo, Egypt. 1991 Registered for M.D. in Cardiology, AI-Azhar University, Cairo, Egypt
177
178
PUBLICATION LIST
( I) Roelandt 1, Salustri A, Vletter W, Nosh' Y, Bruining N Precordial Multiplane Echocardiography for dynamic anyplane, parapiane and tlu'ee-dimensional imaging of the heart. Thoraxcellter J 1994;6/5:6-15.
( 2) Youssef FM Nosh' MD, Paolo M Fiorelli MD, Wim B Vletter BSc, Eric Boersma MSc, Alessandro Salustri MD, loyce Tjoa Postma Bse, Ambroos EM Reijs MSc, Folkert 1 Ten Cate MD, los RTC Roelandt MD Accurate measurement of left ventricular ejection fraction by three-dimensional echocardiography. A comparison with radionuclide angiography. Circulatioll 1996;94:460-66.
3) Youssef FM Nosir MD, Alessandro Salustri MD, Folkert J Ten Cate MD, los RTC Roelandt :MD. Left ventricular ejection fraction in patients with normal and distorted left ventricular shape by two three-dimensional echocardiographic methods. A comparison with radionuclidc angiography. J Am Soc Echocardiogr.1998,11 (6):620-630
( 4) Youssef FM Nosh', Wim B Vleller, Erie Boersma, Rene Frowijn, Folkert 1 Ten Cate, Paolo M Fioretti, los RTC Roelandt. The apical long axis rather than the two chamber view should be used in combination with four chamber view for accurate assessment of left ventricular volumes and function. EliI' Heart J. 1997j18:1175·85
5) Youssef FM Nosir MD, laap Stoker MD PhD, laroslaw D Kasprzak MD, ), Maarten H Lequin MD,A Dall' Agata MD, Folkert 1 Ten Cate MD FACC, los RTC Roelandt lvID FACC. Paraplane analysis from precordial three-dimensional echocardiographic data sets for rapid and accurate quantification of left ventricular volume and function: A comparison with magnetic resonance imaging. Am Heart J (111 Press)
( 6) liefen Yao, Youssef FM Nosir, los RTC Roelandt. Three-dimensional Echocardiographic Reconstmction of the Heart: the Gateway to Accurate Quantification of Left Ventricular Volume and Function. Submitted
( 7) Chen Q, Nosir YFM, Vletter W, Kint PP, Saillstri A, Roelandt JRTC. Accurate assessment of mitral valve area in patients with mitral stenosis by three-dimensional echocardiography. J Alii Soc Eclwcardiogr. 1997;10:133-40.
( 8) Kasprzak lD, Nosir YFM, A Dall' Agata, Fioretti PM, Roelandt lRTC. Quantitative three-dimensional echocardiography of the aortic valve: Comparison with twodimensional echocardiography. Alii Heart J 1998;135:995-1003

179
( 9) Salustri A, Kofflard M, TenCate FJ, Nosh' YFM, Trocino G, Keane 0, Vletter W, Roelandt JRTC. Assessment of left ventricular outflow in hypertrophic cardiomyopathy using anyplane and paraplanc analysis of three-dimensional echocardiography. Alii J CardiolI996;78:462·8.
(10) Kasprzak JD, Roelandt JRTC, Salustri A, Nosh' YFM, EI-Said ME, Taams M, TenCate Fl. Three-dimensional cchocardiography of the thoracic aorta. Ell,. Heart J 1996;17:1584·92.
(11) Youssef FM Nosir, Maarten H Lequin, Jaroslaw 0 Kasprzak, Jiefen Yao, Jaap Stoker, Jos RTC Roelandt. Measurements and day to day variabilities of left ventricular volumes and ejection fraction by three-dimensional echocardiography. Am J Cardiol. 1998;82:209·214
(12) Kasprzak JD MD, Wim B Vletter MSc, Jan R. van Meegen, Youssef FM Nosir MD, Richard Johnson PhD, Folkert J Ten Cate MD, Roelandt JRTC MD. Improved Quantification of myocardial mass by three-dimensional echocardiography using deposit contrast agent. Ultmsolilid Med&BioI1998;24,5:647·53
(13) Abdou Elhendy MD PhD, Marcel L Geleijnse MD, Ron T van Domburg MSc, Peter R Nierop MD, Don Poldennans MD, PhD, Folkert J TenCate MD, PhD, Youssef FM Nosir MD, Jos RTC Roelandt MD, PhD. Gender Differences in the accuracy of dobutamine stress echocardiography for diagnosis of coronmy artery disease. Am J CardioI1997;80:1414·18
(14) Kasprzak JD, Nosir YFM, Roelandt JRTC. Three-dimensional echocardiography -clinical potential and initial experience. [111 Polish}. Kardiol Pol 1997;46:515·22
(15) N. Born, A.F.W. van der Steen, Y.F.N, Nosir, J.D. Kasprzak. Studies of cardiac function and myocm'dial tissue characterization. J EIIgIIg. Med (Submitted)

180
... '1'.
AI-Azhar University, Cairo, Egypt
Erasmus University, Rotterdam, The Netherlands