research achievements institutional/ divisional … achievements.pdfresearch achievements...
TRANSCRIPT

1
Research Achievements
Institutional/ Divisional projects
Development of management advisories for sustaining marine fisheries of Andhra
Pradesh
The total marine fish production of A.P. for 2010 was 2.53 lakh t. Pelagic resources accounted for
1.39 lakh t forming 55% of the total landings for the state. The dominant groups landed were
clupeids (0.76 lakh t and 54.5%), mackerels (0.17 lakh t and 12.5%), carangids (0.14 lakh t and
10.2%), ribbonfishes (0.11 lakh t and 8.2%), tunas (0.085 lakh t and 6%) and seerfishes (0.07 lakh t
and 5%). Among clupeids the major contributors were Stolephorus contributing 0.18 lakh t, oil
sardine contributing 0.15 lakh t and lesser sardines contributing 0.26 lakh t. Carangids landed were
contributed by horse mackerel (15.8%), scads (30.5%), leatherjackets (8.5%) and other carangids
(45%). More than 99% of the mackerel landings were contributed solely by Rastrelliger kanagurta.
Seerfish catch was dominated by Scomberomorus commerson (70%) and Scomberomorus guttatus
(30%). Among tuna the dominant species landed were Euthynnus affinis (47.5%), followed by
Thunnus albacares (38.9%), Katsuwonus pelamis (7.1%) and Auxis thazard (6.5%). The landings
of billfishes and barracudas for the year were 0.01 lakh t and 0.02 lakh t, respectively. The major
groups that contributed to demersal landings were sciaenids, perches, pomfrets, silverbellies, goat
fish, elasmobranchs and catfish. Penaeid prawn and crab resources landed along the Andhra Coast,
was monitored. Penaeid prawn catch landed at Visakhapatnam Fishing Harbour was 10,940.5 t with
3.83 kg cph. Penaeid prawn formed 14.85% of total trawl landings. M. monoceros dominated. The
estimated crab catch was 2394.3 t with 0.93 kg cph. Crab formed 3.45% of total trawl landings. P.
sanguinolentus dominated.The total landing of cephalopods in Andhra Pradesh was estimated at
2808 t, forming 1.09% of the total fish landings. Cuttlefish landings were estimated at 1734 t, and
squid 1074 t. The mechanized trawlers (MDSOTN + MDTN + MSOTN +MTN) contributed
entirely (98.9 %) to the cephalopod landings. The cephalopod (cuttlefish, squids, and octopus)
fishery and biology of dominant species of the Visakhapatnam Fisheries Harbor was studied. The
estimated landings of cephalopods at the VFH were 1572 t. Cuttlefish landings was estimated at
869 t and squid at 703.2 t. During the period Sepia pharaonis, S aculeata and Sepiella inermis
(cuttlefish), Loligo duvauceli, (squids), were observed in the fishery. Octopus was not landed at all.
Cuttlefishes landed 869 t (55.3 %) squids 703.2 t (44.7 %) and Octopus nil. Among cuttlefish, S

2
pharaonis (782.2 t) 45.1 %. Sepia aculeata landed (737.9 t) 42.6% and Sepiella inermis (223 t) 7
%. Among squids Loligo duvauceli was the only species landed. Maximum landings of
cephalopods occurred during July-August.
The bivalve fishery of the Bhimili estuary was monitored during the year. The total bivalve
production exploited from this estuary was estimated at 88.7 t. The total effort was 1835 units. The
average catch per unit effort was 48.3 Kg. The average monthly catch was 7.4 t and average effort
153 units. Three species of clams (Meretrix meretrix, M casta, Anadara sp) and the oyster
Crassostrea madrasensis are exploited from this estuary. Meretrix casta landed 39.98 t, M meretrix
landed 23.9 t, Anadara sp 1.95 t and Crassostrea madrasensis landed 47.8 t. The bivalve fishery
declined significantly compared to previous year 2010 (113.6 t). The total bivalve catch declined by
22 % (25 t). The effort also declined by 570 units (23.7 %). However, the catch per unit effort
increased during this year at 48.3 Kg as against 47.2 Kg in 2010. The catch of Meretrix casta
declined by 62.5 %, M meretrix by 41.8%, Anadara sp.by 57.3%. However landings of C
madrasensis increased to 58.9 t by 23.4 % from 47.8 t in 2010. The bivalve catch as well as effort in
the Bhimili estuary has been declining drastically over the past 10 years. This has been mainly due to
inclement weather, with frequent cyclones and thunderstorms. The bivalve and gastropod fishery of
Kakinada Bay of Andhra Pradesh was monitored from two major landing centres, viz; Chollangi and
Peddavalsala during the year
The estimated total bivalves landed from Kakinada Bay were 836.9 t, with an average monthly
landing of 72.5 t. The total effort was 8212 units and the average catch per unit affort was 131.2 Kg.
The species landed were Anadara sp. (276.65 t), M meretrix (72.83 t), Meretrix casta (24.71 t),
Paphia malabarica (14 .0 t), t. Geloina sp. (9.3 t) Katelysia opima (4.5 t), and others (6.6 t). The total
clam production was 401.9 t. Oysters landed were indowpane oyster, Placuna placuna (383.8 t),
edible oyster Crassostrea madrasensis (51.2 t) and other oysters (5.8 t.) The total oyster production
was 435 t. The price of the bivalves ranged from Rs. 5 to 12 per Kg.
The estimated total gastropod landings from Kakinada Bay were 328.8 t with average monthly
landings of 23.4 t. The total effort was 5010 units and the average catch per unit effort was 48.6 Kg.
The species landed were Cerithidium sp. (257.7 t), Telescopium sp (23.7 t), Thais sp. (15.3 t), Murex
sp (10.3 t) Hemifusus sp (9.9 t), Umbonium sp (3.1 t), Dolostium sp. (0.3 t) and other gastropods (8.5
t). Maximum landings were during August- September. The price of gastropods ranged from Rs. 5 to
8 per Kg.

3
Production trends in Visakhapatnam- Resource wise Fishery & Biology
Sardine
The estimated catch of sardine from the trawlnets at Visakhapatnam was 1,934 t. It formed 3% of
the trawl net catches with a catch rate of 0.75 kg/h. The catch and catch rates were higher during the
third and first quarter. Trawl catch was composed chiefly of lesser sardines (43.1%), rainbow sardines
(33.4%) and oil sardine (23.5%). In seines, the catch was 85.1 t with a catch rate of 23.4 kg/unit
forming more than a quarter of the total catch. The seine catch was dominated by oil sardine (60.3%)
and lesser sardines (39.7%). The length ranges recorded for Sardinella longiceps, Sardinella
fimbriata and Sardinella gibbosa were 95 to 219 mm, 55 to 184 mm and 45 to 184 mm, respectively
with mean lengths of 150.9 mm, 126.5 mm and 97 mm. A sex ratio of 1.15 was recorded for
Sardinella longiceps with mostly immature females occurring throughout the year. For Sardinella
gibbosa, the sex ratio was 1.14 with equal occurrence of mature and immature specimens. Immature
females dominated in Sardinella fimbriata with a sex ratio of 1.5.
Mackerel
The estimated mackerel landings by trawlers, boat seines and gill netters in Visakhapatnam were
6130 t, 10 t and 481 t, respectively with an average catch rate of 2.5 kg/h for trawls, 2.8 kg/unit for
boat seines and 40 kg/unit for gill nets. Around half of the gillnet catches at Visakhapatnam (46%)
were contributed by mackerel. However in trawlnet catches the contribution of mackerel was 9%.
More than 99% of the trawl catches were composed of Rastrelliger kanagurta while in gill nets the
contribution of Rastrelliger kanagurta was 63.2%, the rest being constituted by Rastrelliger faughnii.
In Rastrelliger kanagurta caught by trawlers the size ranged from 160 to 264 mm (mean: 209.8 mm)
while in Rastrelliger kanagurta caught by gill netters the size ranged from 145 to 279 mm (mean:
217.5 mm). The sex ratio was 1.04 and 1.3 in trawl and gill catches with mostly immature females
occurring throughout the year. Rastrelliger faughnii caught in trawlnets and gillnets varied from 185
to 249 mm and 175 to 259 mm, respectively with mean lengths of 222.4 mm and 217.4 mm. There
was a preponderance of females in the catch of both the gears with most of them in immature state.
Ribbonfish
The estimated ribbonfish landing by trawlers at Visakhapatnam was 3,899 t (5.6 % of the trawl net
catches) with the catch rate of 1.5 kg/h. The catches along with catch rates were significantly higher
during the post monsoon months. Trichiurus lepturus was the sole species with size ranging from 280
to 919 mm (mean: 549.2 mm and mode: 609 mm) and having a sex ratio of 1.86 with mostly mature

4
(53.8%) females occurring throughout the year. The high IRI values of nonpenaeid Acetes,
cephalopods, juveniles of sciaenids, ribbonfishes and other teleosts and digested fish imply that they
were the principal food constituents of Trichiurus lepturus.
Seerfish
The seerfish landing by trawlers and gill nets at Visakhapatnam was 554.3 t and 99.2 t with catch
rates of 0.2 kg/h and 8.3 kg/unit. Seerfishes contributed on an average 9.5 % to the total gill net
catches at Visakhapatnam. Scomberomorus guttatus (92.4%) dominated the gillnet landings while the
trawl fishery was supported by both Scomberomorus guttatus (73.2%) and Scomberomorus
commerson (26.8%). The size of S. guttatus ranged from 320 to 439 mm with a mean length of 363.6
mm.
Tuna
The annual catch of tuna recorded by hooks and lines at Visakhapatnam was 641.3 t with the catch
rate of 16.46 kg/unit. More than one third of the hooks and lines catches (34.2 %) at Visakhapatnam
was contributed by tunas alone. The dominant species landed in hooks and lines were Thunnus
albacares (45.8%), Euthynnus affinis (41.7%) and Katsuwonus pelamis (12.5%). The length ranges
recorded for Thunnus albacares, Euthynnus affinis, Katsuwonus pelamis and Sarda orientalis were
200 to 2019 mm, 280 to 439 mm, 540 to 699 mm and 340 to 379 mm, respectively with mean lengths
of 1010 mm, 357.5 mm, 634 mm and 363 mm. Females outnumbered males in Thunnus albacares,
Euthynnus affinis, Katsuwonus pelamis and Sarda orientalis. Majority of the females encountered in
the catch were immature in Thunnus albacares, Euthynnus affinis, Katsuwonus pelamis and Sarda
orientalis. The high IRI values of young ones of clupeids, ribbonfishes, mackerel, tunas and
carangids along with cephalopods, crabs and digested fish and shrimps imply that they were the
principal food constituents of tunas.
Carangid
The annual estimated landings of carangids by trawlers and gill netters in Visakhapatnam were
5,449 t and 385.7 t, respectively with an average catch rate of 2.4 kg/h for trawls and 32.1 kg/unit for
gill nets. It formed 37% of the gillnet catches and 8.5% of the trawl catches. Among carangids, Selar
crumenophthalmus (43.8%) and Megalaspis cordyla (39.8%) dominated the gill net catches while
Decapterus russelli (41.8%) dominated the trawl landings. The size ranges recorded for M. cordyla
was between 440 to 499 mm with a mean size of 462 mm. The number of females in the catch was
higher for M. cordyla with majority of them in immature condition The IRI values showed that

5
digested fish and crustaceans along with cephalopods, Acetes and fish juveniles were the major food
item in the stomach contents of M. cordyla.
Cobia
Rachycentron canadum was the species with size ranging from 360 to 919 mm (mean: 578.1 mm)
with females dominating the commercial catches. The principal food items encountered in the gut
were carangids, lizardfishes, clupeids and a variety of other fin and shell fishes.
Growth parameters of pelagic resources landed at Visakhapatnam
Linf k Z M F E Lc Recruitment Peak pulse
Sardinella
longiceps
21.84
cm
1.1 5.39 2.04 3.35 0.62 18.49
cm
Bimodal Major Aug-
Oct
60%
Sardinella
gibbosa
19.11
cm
1.2 2.61 2.24 0.37 0.14 6.18
cm
Unimodal April-July >90%
Rastrelliger
kanagurta
27.51
cm
0.6
5
2.91 1.36 1.55 0.53 19.34
cm
Unimodal May-Sept >70%
Rastrelliger
faughnii
25.94
cm
0.9
6
4.5 1.78 2.72 0.6 22.13
cm
Unimodal June-Sept 70%
Thunnus
albacares
211.0
5 cm
0.1 0.32 0.23 0.09 0.29 60.76
cm
Bimodal Major Oct-
Nov
>30%
Trichiurus
lepturus
95.55
cm
0.2
3
0.88 0.49 0.39 0.45 41.11
cm
Bimodal Major Aug-
Nov
70%
Stock assessment of pelagic resources landed at Visakhapatnam
Stock (t) Biomass (t) MSY(t) Annual yield (t)
Sardinella longiceps 735 136 366 455
Rastrelliger kanagurta 12168 3954 5752 6128
Thunnus albacares 3817 3267 523 294
Trichiurus lepturus 15033 9997 4399 3899
The total marine fish production of A.P. for 2011 was 2.75 lakh t. Pelagic resources accounted for 1.6
lakh t (58.3% of the total landings), followed by demersal resources with 0.73 lakh t (26.6% of the
total landings), crustacean resources with 0.34 lakh t (12.3% of the total landings) and cephalopods

6
with 0.036 lakh t (1.31% of the total fish landings). The dominant pelagic groups landed were
clupeids (0.68 lakh t and 42.25%), mackerels (0.22 lakh t and 14%), tunas and billfishes (0.22 lakh t
and 13.88%), carangids (0.17 lakh t and 10.53%), ribbon fishes (0.15 lakh t and 9.52%) and seer
fishes (0.06 lakh t and 3.47%). The major groups that contributed to demersal landings were sciaenids
(18.4%), perches (18.4%), pomfrets (13.2%), goatfish (9.2%), catfish (9.2%) and elasmobranchs
(11.0%). Penaeid prawns dominated with an annual landing of 0.26 lakh t forming 78% of the
crustacean catch. Crabs with an annual catch of 0.06 lakh t (17%) and nonpenaeid prawns with 0.01
lakh t (3%) were the other notable contributors to the crustacean catch. Cuttlefish landings were
estimated at 0.024 lakh t, and squid 0.012 lakh t.
Among clupeids, the major contributors were lesser sardines contributing 0.34 lakh t, oil sardine
contributing 0.12 lakh t and Stolephorus contributing 0.05 lakh t. Carangids landed were contributed
by horse mackerel (21.8%), scads (22.4%), leatherjackets (8.8%) and other carangids (47.1%). The
mackerel landings were contributed solely by Rastrelliger kanagurta. Seer fish catch was dominated
by Scomberomorus commerson (59.4%) and Scomberomorus guttatus (40.6%). Among tuna, the
dominant species landed were Thunnus albacares (34.1%), followed by Euthynnus affinis (28.8%),
Katsuwonus pelamis (28%) and Auxis thazard (9.1%). The landings of billfishes and barracudas for
the year were 0.04 lakh t and 0.04 lakh t, respectively.
0.08 lakh t of elasmobranchs was landed of which 25.6% were sharks, 1.3% was skates and 73.1%
were rays. Sharks were mainly caught by hook and lines, trawl nets and gill nets. Rays were mainly
landed by mechanized trawls. 0.13 lakh t of sciaenids were landed of which majority were landed by
mechanized trawls. 0.07 lakh t of goat fish was landed of which more than 90% were landed by
mechanized trawls alone. 0.05 lakh t of threadfin breams were landed of which around 90% was
landed by mechanized trawls alone. 0.045 lakh t of lizard fish was landed of which more than 90%
were landed by mechanized trawls.
The penaeid prawn landings by small mechanised trawlers at Visakhapatnam were 3417 t. The annual
catch of penaeid prawns by sona boats at Visakhapatnam was 7425 t. The mechanized trawlers
contributed entirely (98.9 %) to the cephalopod landings. Among cuttlefish, S pharaonis contributed
45.1 %, Sepia aculeata contributed 42.6% and Sepiella inermis contributed 7 %. Among squids,
Loligo duvaucelli was the only species landed.
The catch of sardine from the trawlnets at Visakhapatnam was 2705 t. It formed 3.85% of the trawl
net catches with a catch rate of 1.07 kg/h. Trawl catch was composed chiefly of lesser sardines

7
(44.6%), rainbow sardine (31.9%) and oil sardine (23.5%). In silk nets (33 mm mesh size), the catch
was 619 t with a catch rate of 175 kg/unit forming 98.7% of the total catch. The silk net catch was
dominated by lesser sardines (69.2%), oil sardine (18.7%) and rainbow sardine (12.1%).
The mackerel landings by trawlers and gill netters (55 mm mesh size) in Visakhapatnam were 7832 t
and 636 t, respectively with an average catch rate of 3.1 kg/h for trawls and 53.1 kg/unit for gill nets.
Around half (49%) of the gillnet catches at Visakhapatnam were contributed by mackerel. However
in trawlnet catches the contribution of mackerel was 11.2%. More than 99% of the trawl catches and
gill net catches were composed of Rastrelliger kanagurta and the rest being constituted by
Rastrelliger faughnii.
The ribbonfish landing by trawlers at Visakhapatnam was 4316 t (6.15 % of the trawl net catches)
with the catch rate of 1.71 kg/h. The catches along with catch rates were significantly higher during
August - September.
The seerfish landing by trawlers at Visakhapatnam was 412 t with catch rate of 0.16 kg/h.
Scomberomorus guttatus dominated the gillnet landings while the trawl fishery was supported by
both Scomberomorus guttatus and Scomberomorus commerson.
The annual catch of tuna recorded by hooks and lines at Visakhapatnam was 2714 t with the catch
rate of 42.3 kg/unit. 43.4% of the hooks and lines catches at Visakhapatnam was contributed by tunas
alone. The dominant species landed in hooks and lines were Thunnus albacares (53%), Katsuwonus
pelamis (31%) and Euthynnus affinis (16%). In gill netters at Visakhapatnam, the annual catch was
675 t, at a catch rate of 35 kg/unit forming a quarter of the total gill net catches. One third of the gill
net catches was constituted by Thunnus albacares. The annual catch of tuna by hooks and lines at
Pudimadaka was 397 t with a catch rate of 14.2 kg/unit forming 46% of the total hook and line
catches. The dominant tuna species was Thunnus albacares contributing 59% to the total tuna catch.
The annual hook and line catches of tuna at Kakinada (Dummulapeta and Bhairavapalem) amounted
to 3363 t at a catch rate of 126.1 kg/unit. Tunas formed 35.4% of the total hook and line catches at
Kakinada. The major contributor to the tuna fishery at Kakinada was Thunnus albacares contributing
37.2% to the total tuna catch.
The average catch rate of sciaenids, goatfish, threadfin breams and lizardfish in mechanized trawls
was 1.68 kg/hr, 1.4 kg/hr, 0.8 kg/hr and 0.95 kg/hr, respectively. The dominant species of sciaenids
landed were Otolithes ruber (25.4%), Protonibea diacanthus (25.3%), Pennahia macarophthalmus
(10.8%) and Nibea maculata (11.7). The major species of goatfish landed were Upeneus vittatus

8
(43.6%), U. moluccensis (28.7%) and U. sulphureus (27.1%). The major species of threadfin breams
landed were Nemipterus japonicus (52.4%), N. mesoprion (18.4%), N. delagoae (12.1%), N. tolu
(9.5%) and N. luteus (7.6%). The major species of lizardfish landed were Saurida undosquamis
(57.4%), S. micropectoralis (23.3%) and S. tumbil (18.9%).The average catch rate of sharks, skates
and rays in mechanized trawls was 0.08 kg/hr, 0.01 kg/hr and 0.8 kg/hr respectively. The most
common shark species were Iago omanensis, Sphyrna lewini and Chiloscyllium sp. The most
common ray species landed were Gymnura poecilura, Himantura jenkinsii, Torpedo marmorata,
Aetomylaeus nichoffii and Aetobatus narinari.
The catch of small mechanized trawlers was represented by 22 species of penaeid prawns, dominated
by M. monoceros (31.2 %), followed by M. dobsoni (18.9 %), M. barbata (6.6 %), S. melantho
(6.5%), S. crassicornis (5.9 %), P. maxillipedo (5%), T. curvirostris (4.3%) and P. stylifera (4.2%).
The catch landed by sona boats was constituted of 15 genera/ species of penaeid prawns, dominated
by M. monoceros (29.9%), followed by M. dobsoni (16.8%), Solenocera spp (18 %) and
Metapenaeiopsis spp (11.4%).
The total bivalve production exploited from Bhimili estuary was 88.7 t. The average catch per unit
effort was 48.3 kg. The average monthly catch was 7.4 t. Three species of clams (Meretrix meretrix,
M casta, Anadara sp) and the oyster Crassostrea madrasensis are exploited from this estuary.
Meretrix casta landed was 39.98 t, M meretrix landed was 23.9 t, Anadara sp landed was 1.95 t and
Crassostrea madrasensis landed was 47.8 t.
The total bivalves landed from Kakinada Bay were 836.9 t, with an average monthly landing of 72.5
t. The average catch per unit effort was 131.2 kg. The species landed were Anadara sp. (276.65 t), M
meretrix (72.83 t), Meretrix casta (24.71 t), Paphia malabarica (14.0 t), Geloina sp. (9.3 t), Katelysia
opima (4.5 t), and others (6.6 t). The total clam production was 401.9 t. Oysters landed were
windowpane oyster, Placuna placuna (383.8 t), edible oyster Crassostrea madrasensis (51.2 t) and
other oysters (5.8 t).
The total gastropod landings from Kakinada Bay were 328.8 t with average monthly landings of 23.4
t. The average catch per unit effort was 48.6 kg. The species landed were Cerithidium sp. (257.7 t),
Telescopium sp (23.7 t), Thais sp. (15.3 t), Murex sp (10.3 t) Hemifusus sp (9.9 t), Umbonium sp (3.1
t), Dolostium sp. (0.3 t) and other gastropods (8.5 t).
Length measurements and reproductive biology of major finfish and shellfish species of Andhra Pradesh
Length range Mean length Annual Sex Spawning Fecundity Ova diameter

9
(mm) (mm) ratio months (mm)
Sardinella
longiceps
57-214 143.5 1.16 May-Sept 19028-66513 0.21-0.73
Sardinella
fimbriata
60-179 127.2
Sardinella
gibbosa
160-189 175.6
Rastrelliger
kanagurta
143-248 194.2 0.97 Feb-Nov 37690-
170455
0.18-0.84
Rastrelliger
faughnii
95-239 153.5 1.05
Trichiurus
lepturus
200-979 0.88
Katsuwonus
pelamis
300-650 504.7 1.73 Feb-March 61516-
606966
0.23-0.7
Thunnus
albacares
330-1980 944.5 0.61 Apr-Aug 398705-
11130000
0.18-0.83
Nemipterus
japonicus
95-315 177 0.6 Aug-Oct &
Feb-March
18407-75874 0.17-0.58
Pennahia
macrophthalmus
100-260 188 0.9
Upeneus vittatus 83-198 138 0.8
Saurida
undosquamis
121-393 214 3.5
Penaeus indicus 136-208 171.3 1.07 Feb-June 437500-
550000
0.03-0.11
Penaeus monodon 153-295 217.8 0.84 Feb-July 323007-
1072174
0.03-0.13
Metapenaeus
monoceros males
83-188 138.5 1.8
Metapenaeus
monoceros
females
108-218 156.1 Feb-Sept
Metapenaeus
dobsoni males
58-103 87.4 1.2
Metapenaeus
dobsoni females
53-108 81.4 Oct

10
Portunus
sanguinolentus
males
73-168 126 2
Portunus
sanguinolentus
females
68-163 120.4 Jan-March &
July-Sept
Sepia aculeata
males
87-182 119.5 1.1
Sepia aculeata
females
94-279 141.8
Sepia pharaonis 70-300 169 1.5
Loligo duvaucelli
males
50-140 76 0.82
Loligo duvaucelli
females
60-154 82.3 Round the
year
11802-73464 1-1.45
Catch of major finfish and shellfish resources of Andhra Pradesh
Group Catch (t) in
2011
Catch (t) in 2010 Increase (+) / Decrease (-) %
Clupeids 67697 75789 -10.7
Mackerel 22401 17331 29.3
Ribbon fish 15252 11432 33.4
Carangids 16873 14179 19
Tunas 18614 8458 120.1
Seer fishes 5559 7068 -21.3
Barracudas 4332 2088 107.5
Bill fishes 3624 1037 249.5
Threadfin breams 5027 5336 -5.8
Sciaenids 13488 9264 45.6
Lizardfish 4539 4956 -8.4
Goatfish 6735 7352 -8.4

11
Sharks 2054 1254 63.8
Rays 5872 4390 33.8
Penaeid Prawns 26368 27408 -2.3
Non penaeid
Prawns
1081 2000 -46
Crabs 5703 6281 -5
Cuttlefish 2380 3020 -21.2
Squid 1209 837 44.4
Length at first maturity of the major species studied
Species Lm (cm)
S. longiceps 14.5
S .gibbosa 15.0
R. kanagurta 19.5
T. lepturus 37.0
S .guttatus 28.0
T. albacares 85.0
N. japonicus 16.8
S. undosquamis 23.0
U. vittatus 13.8
J. carutta 15.4
O. ruber 20.2
M. monoceros (male) 9.5
M. monoceros ( female) 11.5
P. sangunolentus 8.0
P. sanguinolentus ( female) 8.6
M. dobsoni (male) 6.0
M. dobsoni (female) 7.8

12
Growth and mortality parameters of finfish and shellfish resources landed at Visakhapatnam
Stock Assessment of major finfish and shellfish resources
Stock (t) Biomass (t) Biomass per
recruit (g)
MSY(t) Annual average
yield (t)
Yield per
recruit (g)
Sardinella longiceps (gill net
& seines)
23403 6688 1.04 11303 9096 1.42
Rastrelliger kanagurta (trawl
net)
17760 7977 22.43 7538 6302 17.72
Rastrelliger kanagurta (gill
net)
24828 11152 22.43 10539 8810 17.72
Katsuwonus pelamis (hooks
and lines)
11800 6709 506.9 4227 3824 288.94
Thunnus albacares (hooks and
lines)
50284 39936 16063.16 9585 11182 4497.68
Linf Winf k Z M F E Lc
Sardinella longiceps 22.5 cm 85 g 1.1 3.38 2.03 1.36 0.4 18.73 cm
Rastrelliger kanagurta 27.4 cm 220 g 0.47 1.89 1.1 0.79 0.42 17.62 cm
Katsuwonus pelamis 68.2 cm 5.72 kg 0.34 1.26 0.69 0.57 0.45 50.58 cm
Thunnus albacares 208.9 cm 150 kg 0.08 0.48 0.2 0.28 0.59 109.8 cm
Trichiurus lepturus 114.4 cm 1.24 kg 0.13 0.74 0.32 0.42 0.57 40.26 cm
Nemipterus japonicus 34.5 cm 513.9 g 0.3 1.87 0.4 1.47 0.78 13.85 cm
Pennahia macrophthalmus 32.5 cm 530.9 g 0.32 2.05 0.43 1.62 0.79 18.03 cm
Upeneus vittatus 24.0 cm 171.5 g 0.31 2.25 0.46 1.79 0.80 12.97 cm
Saurida undosquamis 42.5 cm 578.1 g 0.34 3.25 0.41 2.84 0.87 20.2 cm
Metapenaeus monoceros males 18 cm 32.8 g 2.2 13.81 1.79 12.02 0.87 7.98 cm
Metapenaeus monoceros females 22.4 cm 79.1 g 1.78 7.03 1.49 5.54 0.79 8.39 cm
Metapenaeus dobsoni males 11.9 cm 10 g 1.4 7.62 1.52 6.11 0.8 5.33 cm
Metapenaeus dobsoni females 12.5 cm 11.9 g 1.75 7.57 1.73 5.84 0.77 5.56 cm
Portunus sanguinolentus males 23 cm 615.5 g 1.4 6.53 1.26 5.27 0.81 7.35 cm
Portunus sanguinolentus females 22 cm 508.4 g 1.3 7.82 1.22 6.6 0.84 6.85 cm
Sepia aculeata 24.2 cm 3.2 g 0.4 1.058 0.55 1.61 0.34 8.09 cm
Sepia pharaonis 28.99 cm 5.0 g 0.87 1.67 1.19 2.86 0.42 21.17 cm
Loligo duvaucelli 17.5 cm 6.08 g 0.3 0.958 0.22 1.20 0.2 6.08 cm

13
Trichiurus lepturus (trawl net) 34016 24036 100.40 8893 10095 42.17
Nemipterus japonicus (trawl
net)
5507.1 2491.1 25.9 2329.2 3661.9 38.06
Pennahia macrophthalmus
(trawl net)
1292.6 549.4 32.84 563.1 890.0 53.2
Upeneus vittatus (trawl net) 4762.5 1893.6 25.89 2130.3 3389.5 38.1
Saurida undosquamis (trawl
net)
1604.6 474.6 17.7 771.2 1347.8 50.3
Metapenaeus monoceros
males (trawl net)
191.8 176.5 0.6 1218.7 315 3.89
Metapenaeus monoceros
females (trawl net)
525.7 505.3 1.97 1776.1 524.1 6.71
Metapenaeus dobsoni males
(trawl net)
107.3 107.3 0.2 408.8 172.7 1.01
Metapenaeus dobsoni females
(trawl net)
169.2 113.5 0.12 429.6 225.9 1.15
Portunus sanguinolentus
males (trawl net)
95.5 91.9 3.64 300.1 263.8 32.4
Portunus sanguinolentus
females (trawl net)
184.7 152.5 2.24 596.3 433.7 23.5
Sepia aculeata (trawl net) 0.85 0.9 0.22 0.206 0.779 0.121
Sepia pharaonis (trawl net) 2.0 0.7 0.18 0.138 0.782 0.210
Loligo duvaucelli (trawl net) 7.7 4.5 0.03 0.448 1.074 0.006
F-multipliers for maximum Yield and Yield/Recruit for species caught in trawls (2007-2011)
Species Maximum
Y/R (g)
Maximum
Yield (t)
Increase in
Y/R (g)
from the
present
Increase in
Yield (t)
from the
present
F-
multiplier
at
maximum
Y and Y/R
Level of
Exploitation
Rastrelliger
kanagurta
21.45 7630 3.73 1328 1.6 Under
Exploited
Trichiurus lepturus 42.34 10135.7 0.17 40.7 1.4 Under
Exploited
Nemipterus
japonicus
42.45 4084.3 4.39 422.4 0.4 Over
exploited
Pennahia
macrophthalmus
53.23 890.5 0.03 0.5 0.8 Over
exploited
Upeneus vittatus 42.45 3776.5 4.35 387 0.4 Over

14
exploited
Saurida
undosquamis
56.07 1502.4 5.77 154.6 0.2 Over
exploited
Metapenaeus
monoceros males
3.90 315.3 0.01 0.3 0.8 Over
exploited
Metapenaeus
monoceros females
6.73 526.3 0.02 2.2 1.2 Under
Exploited
Metapenaeus
dobsoni males
1.02 174.65 0.01 1.95 1.4 Under
Exploited
Metapenaeus
dobsoni females
1.155 227.13 0.005 1.23 0.8 Over
exploited
Portunus
sanguinolentus
males
39.19 319.1 6.79 55.3 0.4 Over
exploited
Portunus
sanguinolentus
females
30.35 560 6.85 126.3 0.2 Over
exploited
Sepia aculeata 0.18 1.17 0.06 0.39 3 Under
Exploited
Sepia pharaonis 0.31 1.15 0.1 0.37 3 Under
Exploited
Loligo duvaucelli 0.01 1.79 0.004 0.72 3 Under
Exploited
Management Advisories:
For Rastrelliger kanagurta, Trichiurus lepturus, Metapenaeus dobsoni males and Metapenaeus
monoceros females, maximum yield is obtained by increasing the present fishing effort by 20 – 60%.
The increase in yield at the increased fishing effort is 1328 t for Rastrelliger kanagurta at 160% of
the present effort, 40.7 t for Trichiurus lepturus at 140% of the present effort, 2.2 t for Metapenaeus
monoceros females at 120% of the present effort and 1.95 t for Metapenaeus dobsoni males at 140%
of the present effort. We can conclude from the above that for penaeid prawns the present effort is
optimum as the change in yield and yield per recruit is negligible and balances out on
increasing/decreasing present fishing effort. Similarly for Trichiurus lepturus, a minor increase in
yield and yield per recruit is only obtained by increasing the present fishing effort by 40%. In trawls
targeting Rastrelliger kanagurta, 21% increase in yield and yield per recruit is obtained by increasing

15
the present fishing effort by 60%, which is uneconomical. Therefore trawls targeting mackerel,
ribbonfishes and penaeid prawns can continue to fish at the same effort.
The yield and yield per recruit of cephalopods can be increased by 50% for cuttlefishes and by 67%
for squids by tripling the present fishing effort. However the lack of trawlers targeting cephalopods
alone and the trifling nature of the catch necessitates that the present fishing effort is continued.
In sharp contrary to the above, for other species caught in trawls maximum yield is obtained by
decreasing the present fishing effort by 20 – 80%. The increase in yield at the decreased fishing effort
is 422.4 t for Nemipterus japonicus at 40% of the present effort, 0.5 t for Pennahia macrophthalmus
at 80% of the present effort, 387 t for Upeneus vittatus at 40% of the present effort, 154.6 t for
Saurida undosquamis at 20% of the present effort, 0.3 t for Metapenaeus monoceros males at 80% of
the present effort, 1.23 t for Metapenaeus dobsoni females at 80% of the present effort, 55.3 t for
Portunus sanguinolentus males at 40% of the present effort and 126.3 t for Portunus sanguinolentus
females at 20% of the present effort.
However for demersal resources especially for Nemipterus japonicus, Upeneus vittatus and Saurida
undosquamis and crabs, substantial increase in yield and yield per recruit is obtained by decreasing
the present fishing effort by 60%. Hence, trawls targeting demersal resources and crabs should
immediately reduce effort drastically so as to fish at 40% of the present effort. These management
advisories if implemented will help to sustain the marine fisheries of the state on long term basis.
Strategies for sustaining tuna fishery along the coast of India
The annual catch of tuna recorded by hooks and lines at Visakhapatnam was 2714 t with the catch rate
of 42.3 kg/unit. 43.4% of the hooks and lines catches at Visakhapatnam was contributed by tunas
alone. The dominant species landed in hooks and lines were Thunnus albacares (53%), Katsuwonus
pelamis (31%) and Euthynnus affinis (16%). In gill netters at Visakhapatnam, the annual catch was
675 t, at a catch rate of 35 kg/unit forming a quarter of the total gill net catches. One third of the gill
net catches was constituted by Thunnus albacares. The annual catch of tuna by hooks and lines at
Pudimadaka was 397 t with a catch rate of 14.2 kg/unit forming 46% of the total hook and line
catches. The dominant tuna species was Thunnus albacares contributing 59% to the total tuna catch.
The annual hook and line catches of tuna at Kakinada (Dummulapeta and Bhairavapalem) amounted
to 3363 t at a catch rate of 126.1 kg/unit. Tunas formed 35.4% of the total hook and line catches at
Kakinada. The major contributor to the tuna fishery at Kakinada was Thunnus albacares contributing

16
37.2% to the total tuna catch. The length of skipjack tuna, Katsuwonus pelamis at Visakhapatnam
ranged from 300 mm to 650 mm with an annual mean of 504.7 mm. The highest mean length of
572.2 mm was recorded in the month of March and the lowest mean length of 443.8 mm was
recorded in November. Annual sex ratio was 1.73 with significant dominance by males in February
and March and by females in rest of the months. Only mature females were recorded in February and
March indicating it to be the peak breeding season. The average gonadosomatic index was 1.5 with a
maximum of 2.1 recorded in February. Their fecundity ranged from 61516 to 606966 with ova
diameter varying from 0.23 mm to 0.7 mm. The high IRI values of cephalopod, penaeid prawn,
frigate tuna, carangids and flying fish along with digested food imply them to be the principal food
constituents. The length of yellowfin tuna, Thunnus albacares at Visakhapatnam ranged from 330
mm to 1980 mm with an annual mean of 944.5 mm. Maximum mean length of 1411 mm was
recorded in December and minimum mean length of 470.6 mm was recorded in September. Annual
sex ratio was 0.61. Males dominated the catch from March – August and from October - December
while females dominated the catch in January, February and September. Mature females were
encountered in most months with peak occurrence during April – August (70.8% - 100%). The
gonadosomatic index varied from 0.5 to 1.9 with an average of 1.1. Their fecundity ranged from
398705 to 11130000 with ova diameter varying from 0.18 mm to 0.83 mm. Cephalopods are their
preferred prey, followed by mackerel, crab, squilla, balistids, carangids and flying fish.
Growth parameters of pelagic resources landed at Visakhapatnam
Linf k Z M F E Lc Recruitment Peak pulse
Katsuwon
us pelamis
68.2
cm
0.34 1.26 0.69 0.57 0.45 50.58
cm
Bimodal in March –
June and Aug - Oct
Thunnus
albacares
208.9
cm
0.08 0.48 0.2 0.28 0.59 109.8
cm
Unimodal May – Oct
with peak in July
84.4%
Stock Assessment of pelagic resources landed at Visakhapatnam
Stock
(t)
Biomass
(t)
Biomass
per recruit
(g)
MSY(t) Annual
average
yield (t)
Yield per
recruit (g)
Katsuwonus pelamis (hooks
and lines)
11800 6709 506.9 4227 3824 288.94
Thunnus albacares (hooks
and lines)
50284 39936 16063.16 9585 11182 4497.68
Index of Relative Importance (%) of food items encountered in the gut of Katsuwonus pelamis

17
Digested
fish
Loligo Penaeid
prawns
Frigate
tuna
Carangids Decapterus Flying
fish
Others
March 3 97
April 26 74
June 74 26
July 95 5
October 70 20 11
November 33 31 34 2
January 99 1
Index of Relative Importance (%) of food items encountered in the gut of Thunnus
albacares Loligo Mackerel Crab Digested
fish
Flying fish
Squilla Balistid Scad Frigate
tuna
Purple
back
squid
Others
February 53 37 1 4 5
March 74 7 2 17
April 52 48
June 3 2 73 18 4
July 2 26 4 19 45 4
August 16 25 1 15 36 1 6
September 93 6 1
October 81 9 10
November 89 4 2 1 4
December 10 20 17 9 41 3
January 5 1 1 55 18 13 7

18
Pathogen profiling, diagnostics and health management in maricultured finfish
and shellfish
Several bacterial strains isolated from sediment, seaweeds and fish gut samples exhibited clear zone
of inhibition > 10 mm diameter against Vibrio alginolyticus in the double layer method and against
Vibrio alginolyticus and Vibrio anguillarum in the cross streak method. The biochemical tests were
performed and these strains were found to belong to genera Bacillus, Vibrio, Aeromonas,
Pseudomonas and Micrococcus.
Innovations on sea cage farming and development of sustainable Capture Based
Aquaculture (CBA) systems
Seed/Nursery sea cages were designed, fabricated and used for holding as well as rearing the fish
seed.
(Asian seabass) fry were collected from wild in the Bay of Bengal off shore of Baliapal, Balasore,
Orissa with the help of local fishermen.
Seabass fry were reared to fingerling size in seed cage with average 10.25 % survival.
Season-wise capture-based seed availability was studied along Andhra Pradesh coast.
Few species of carangid were collected and culture experiments were conducted in cage.
Broodstock development, captive breeding and seed production techniques for
selected marine finfishes and ornamental fishes
Total 55 numbers live Epinephelus coioides (orange-spotted grouper) were collected from
Bhuminipatnam and Visakhapatnam fishing area for broodstock development.
Decompressed fishes were recompressed to relieve from the barotrauma stress (A technique was
developed to recompress the adult groupers to relieve from barotrauma stress with 85 % success).
Development of broodstock of E. coioides (wild- collected) was done in sea cages with special
broodstock feed supplemented with vitamins, mineral mixture, cod liver oil, etc.
Tagging of individual brooder was carried out with Passive integrated Transponder (PIT) tags, a kind
of electronic tag with radio-frequency identification.
One 6 m dia HDPE cage was installed in Bay of Bengal off Visakhaptnam for developing sex-
reversed male for breeding purpose.

19
Sex reversal of E. coioides from female to male by hormonal implantation (17 alpha methyl
testosterone) was successfully achieved.
For the first time, aromatase inhibitor Letrazole was successfully used for sex reversal of orange-
spotted grouper.
Induced breeding of orange-spotted grouper was achieved in Visakhaptnam Regional center of
CMFRI. Three induced spawning trials were carried out in mariculture hatchery of the center and in
all the three spawning trials fishes were spawned after 12 hrs of last injection.
Stock culture of Phytoplankton, Nannochloropsis sp., Isochrysis sp. was being maintained and
cultured in mass for producing the rotifers.
Rotifers were cultured at low salinity and high temperature to reduce the size of the rotifers.
Resource damage assessment in marine fisheries: impact of selective fishing of
juveniles, bycatch and discards in trawl fisheries on stock
Low value bycatch landed at Visakhapatnam Fishing Harbour and discards thrown at sea by the
trawlers based at Visakhapatnam fishing harbour were monitored. The estimated annual low value
by catch was 19,385 t with 7.5 kg cph and low value by catch formed 27.7% of total trawl landings.
The estimated annual discards were 40,089 t with 15.54 kg cph, and it was equivalent to 57.3 % to
the total landings.
Recruitment Dynamics of Penaeid Prawns
The data collected on M. monoceros at VRC of CMFRI during 1997-2006 was analyzed. Two
recruitment peaks were identified for M. monoceros off Visakhapatnam coast and Ricker model
was fitted for relation between spawning stocks and recruitments. The standing stock biomass of
spawning females ranged between 0.01 t to 33.6 t. The Rickers relationship showed density
dependence. The spawning stock was 0.03 to 45.66 t and the size at maturity was 115 mm. The
spawning peak months were during February to April. The fecundity size relationship was, F= -
507+4.96 L. with peaks of egg production during February to April. The recruitment peaks was
during Aug to October.
Species variation and biodiversity of the fishes of the family Lutjanidae of India

20
Diversity of the species of family Lutjanidae studied at Visakhapatnam. The most commonly observed
species were Lutjanus johnii, Lutjanus rivulatus, Lutjanus russelli and Lutjanus malabaricus.
Lutjanus lutjanus and Lutjanus lunulatus were observed occasionally.
Impact of anthropogenic activities on coastal marine environment and fisheries
Comparing the three sites chosen for the study, the sewage disposal site at Lawsons Bay showed
higher values of CO2, NH
3, and TSS.
Fishing village of Mangamaripeta exhibited comparatively low values in all the parameters (CO2,
NH3, and TSS)
The fishing harbour samples also showed high values but lesser when compared with Lawsons bay
samples.
Salinity was lower in Lawsons bay samples as there is frequent flushing of freshwater and domestic
waste water.
Impact and yield study of environmental changes on the distribution shifts in
small pelagic along Indian coast
The estimated catch of sardine from the trawlnets at Visakhapatnam was 2705 t. It formed 3.85% of
the trawl net catches with a catch rate of 1.07 kg/h. Trawl catch was composed chiefly of lesser
sardines (44.6%), rainbow sardine (31.9%) and oil sardine (23.5%). In silk nets (33 mm mesh size),
the catch was 619 t with a catch rate of 175 kg/unit forming 98.7% of the total catch. The silk net
catch was dominated by lesser sardines (69.2%), oil sardine (18.7%) and rainbow sardine (12.1%).
The length of oil sardine, Sardinella longiceps at Visakhapatnam ranged from 57 mm to 214 mm with
an annual mean of 143.5 mm. The highest mean length of 196.4 mm was recorded in the month of
August and the lowest mean length of 76.2 mm was recorded in October. Juveniles dominated the
catches from October – January. The annual sex ratio was 1.16. Males dominated the catch in
February, May, July and September while females dominated the catch in March, June and August.
May - September is the breeding season of oil sardine with a peak during May - July. This is
substantiated by the presence of high proportion of spawners (55.6% - 90.5%) and by high
gonadosomatic index (6.3 – 8.8) in these months. Their fecundity ranged from 19028 to 66513 with
ova diameter varying from 0.21 mm to 0.73 mm. The analysis of food components revealed an

21
abundance of planktonic matter (Coscinodiscus, Copepods, Peridinium, Fragilaria, Spicules,
Tintinnids, Fish eggs and larvae, Bivalve larvae and oyster larvae) in the gut of oil sardine and
mackerel.
The length ranges in gill nets recorded for Sardinella fimbriata and Sardinella gibbosa were
from 60 to 179 mm and 160 to 189 mm, respectively with mean lengths of 127.2 mm and 175.6 mm.
The highest mean length of 153.5 mm for Sardinella fimbriata was recorded in June and the lowest
mean length of 91.7 mm was recorded in October. Females dominated the catches of Sardinella
fimbriata and Sardinella gibbosa throughout the year with very few in mature states.
The estimated mackerel landings by trawlers and gill netters (55 mm mesh size) in
Visakhapatnam were 7832 t and 636 t, respectively with an average catch rate of 3.1 kg/h for trawls
and 53.1 kg/unit for gill nets. Around half (49%) of the gillnet catches at Visakhapatnam were
contributed by mackerel. However in trawlnet catches the contribution of mackerel was 11.2%. More
than 99% of the trawl catches and gill net catches were composed of Rastrelliger kanagurta and the
rest being constituted by Rastrelliger faughnii.
The length of Indian mackerel, Rastrelliger kanagurta at Visakhapatnam ranged from 143
mm to 248 mm with an annual mean of 194.2 mm. Maximum mean length of 235 mm was recorded
in February and minimum mean length of 178.4 mm was recorded in November. Annual sex ratio
was 0.97. Males dominated the catch in January, February, July - October and December while
females dominated the catch in March, April and November. Mature females were encountered in the
catch in all the months except December and January. The gonadosomatic index varied from 3.6 to
9.1 with the highest value recorded in February. Their fecundity ranged from 37690 to 170455 with
ova diameter varying from 0.18 mm to 0.84 mm. The analysis of food components revealed an
abundance of copepods, decapods, ostracods, Coscinodiscus, Foraminifera along with minute
quantities of cladocerans, fish eggs and larvae, zoea, tintinnids and nematods.
Rastrelliger faughnii caught in trawlnets and gillnets varied from 180 to 249 mm and 95 to
239 mm, respectively with mean lengths of 227 mm and 153.5 mm. There was a preponderance of
females in the catch of both the gears with annual sex ratio of 1.5 in trawlnets and 1.05 in gill nets.
Most of the females encountered in both the gears were in immature stages.
Growth parameters of pelagic resources landed at Visakhapatnam
Linf k Z M F E Lc Recruitment Peak pulse
Sardinella
longiceps
22.52
cm
1.1 3.38 2.03 1.36 0.4 18.73
cm
Unimodal June – Aug
with peak in July
86.2%

22
Rastrelliger
kanagurta
27.4
cm
0.47 1.89 1.1 0.79 0.42 17.62
cm
Unimodal April – July
with peak in May -
June
56.6%
Stock Assessment of pelagic resources landed at Visakhapatnam
Stock
(t)
Biomass
(t)
Biomass
per recruit
(g)
MSY(t) Annual
average
yield (t)
Yield per recruit
(g)
Sardinella longiceps (gill
net & seines)
23403 6688 1.04 11303 9096 1.42
Rastrelliger kanagurta
(trawl net)
17760 7977 22.43 7538 6302 17.72
Rastrelliger kanagurta
(gill net)
24828 11152 22.43 10539 8810 17.72
Monthly seawater samples from two stations were collected and analyzed for 16 parameters and were
documented.
DNA samples collected from Oil Sardine and Mackerel were sent to HQ for further analysis.
Zooplankton samples were also taken from different sampling locations and preserved and sent to
CMFRI HQ for further analysis
Collected data on morphometric analysis, truss analysis, food and feeding and otolith.
The mean sea surface temperatures values recorded for the four stations from which water samples
were collected was 28.32°c.
Water temperatures were high during Quarter 2 (April – June) for the surface waters, which is
summer months and during quarter 3 (July – Sept) for the bottom waters
Minimum water temperatures were recorded during Quarter 4 (Oct – Dec) for the surface waters,
which is winter period in this part and during quarter 1 for the bottom waters
The mean value of salinity of surface waters is 30.42 ppt. The salinity values were higher during
Quarter 2 and lower during quarter 4 for both the surface and bottom waters. This corroborates with
the increase in the mean sea surface temperatures during summer months. A maximum salinity value
of 34.50 ppt was recorded during the quarter 2. It went upto a minimum of 23 – 25 ppt during quarter
4.
Chlorophyll values collected from all the four stations were plotted in graph and compared with data
collected during 2007 – 2010. The peak values were found during the 3rd
quarter of 2011, which is in
similarity with the previous years. Chlorophyll values were higher for the surface waters than bottom

23
waters. Even among the surface waters chlorophyll is higher for near shore waters than deep waters.
This may be related to the deposition of nutrients from the runoff of land.
Development of Fisheries Ecosystem restoration plans for critical marine habitats
A survey was conducted / initiated for assessment of coastal habitats and recording the level of
sustainability and degradation of molluscan fishery resources of Kakinada bay and bhimili estuary
area of Visakhapatnam.
Technological up gradation of Molluscan mariculture
Pearl production in Pinctada fucata: 500 pearl oysters were nucleated during the period. Rejection of
implanted nucleus was high and only 50 oysters with retention of implanted nucleus were obtained.
Heavy mortality and rejection occurred due to very high temperature rise. They were maintained in
the onshore rearing system for pearl production. The pearls will be harvested after a period of 8
months. Nucleus implantation was also constrained by the renovation (civil and electrical) works in
the hatchery for over 8 months.
Research cum farming demonstration of mussel culture in Bhimili estuary: Hatchery produced spat of
Perna viridis were transferred to Bhimili estuary for monitoring growth and studying the suitability
of the site for mussel farming and farming demonstration. The hydrological parameters were also
monitored. From an initial DVM of 17.7 mm and 0.6 g, the spat attained a growth of 51.4 mm DVM
and 12.6 g total weight in 4 months. The Bhimili site was conducive for mussel farming and good
growth was attained. However, during February – March there was significant mortality due to
predation by crabs.
Open sea rearing of Hatchery produced spat of Perna viridis: Hatchery produced spat of P viridis was
reared in the open sea in netlon cages. The spat were reared in two stocking densities at two depths.
The netlon cages were suspended from the rim of the open sea grouper cage moored off the coast of
Visakhapatnam. Spat of average DVM of 17.7 mm and average total weight of 0.6 g were stocked at
200 and 400 numbers each in netlon cages and suspended at 2m and 3 m from the surface and reared
for 30 days. They attained average DVM of 44.8 mm, total weight of 9.1 g, meat weight of 2.6 g and
meat % of 29.5 in 30 days of culture. However there was no significant difference in the growth with
respect to the two stocking densities. There was also no difference in growth at the two depths. The

24
production after 30 days of culture was 2.3 Kg from an initial stocking of 16 g, which reflects a very
good growth of the green mussel in the open sea.
Technology development for seed production of shellfish
Spawning and spat production of green mussel: Broodstock of green mussels were collected from the
Kakinada fishing harbor. Spawning of the green mussel P viridis occurred on four occasions, 06-06-
2011, 23-06-2011, 01-11-2011 and 02-11-2011. However, due to high temperature the larvae did not
reach settlement stage. The marine hatchery is undergoing renovation works and therefore for over 8
months spawning trials could not be carried out. Further trials will be carried out to develop a low
cost method for large scale spat production of the green mussel.
Collection and maintenance of Pinctada margaritifera (Development of broodstock): P margaritifera
spat were collected from Lawson’s Bay during February 2010 and 2011. They were maintained on
Isochrysis galbana, Nanochloropsis sp and Cheatoceros calcitrans. The broodstock was successfully
developed with a strict feeding regime and 7 successful spawnings were achieved during the year
from June onwards. However, spat settlement could be achieved only in the second cycle and in all
the other cases the larval rearing could not be completed up to settlement stage due to high
temperatures causing total mortality of the larvae in the “D” stage. Spawning and larval rearing was
also constrained due to the civil and electrical works in the hatchery.
Stock cultures of five species of microalgae, Chaetoceros calcitrans, Isochrysis galbana,
Nanochloropsis sp., Tetraselmis sp.and Pavlova sp are being maintained. Mass culture of three
species of microalgae viz. C. calcitrans, I. galbana, Nanochloropsis sp. was maintained as feed to
bivalve hatchery and zooplankton production.
Assessment of Elasmobranch Resources in the Indian Seas
Contribution of elasmobranch resources to demersal resources of Andhra Pradesh declined drastically
by 37% from 11.15% in 2012 to 6.7% in 2013. Contribution of elasmobranchs to the demersal
landings of the state has been decreasing from 18.8% in 1985 to 6.7% in 2013. Composition of
elasmobranch landings in the state has changed over the past 26 years. In 1985 sharks contributed
77% and rays 19.6% to elasmobranch landings. By 2012 contribution of sharks has declined to 16%
and that of rays has increased to 83%. Rays have replaced sharks as the dominant elasmobranch
group landed in the state. The major sharks groups landed in the state are the houndsharks,

25
hammerhead sharks and the cat sharks. The major species landed are Iago sp, Sphyrna lewini,
Scoliodon laticaudus, Chiloscyllium sp and Carcharhinus sorrah. The major rays landed in the state
are Gymnura poecilura, Himantura jenkinsii, Neotrygon kuhlii and Aetobatus narinari. The major
skates landed in the state are Rhinobatos obtusus and Rhinobatos granulatus.
Trawl fishery of the North east coast of India: An appraisal
The project is an appraisal of the trawl fishery of three states namely, Andhra Pradesh, Odisha
and West Bengal. The total production by trawlers during 2012 along the north east coast of India
was 4.315 lakh t. The catch rate was 40.7 kg / h.
Catch and catch rate of major resources in trawls along north east coast of India
0 1 2 3 4 5 6 7 8 9
0 10 20 30 40 50 60 70 80 90
100
Cat
fish
es
Oth
er …
Thre
adfi
n …
Oth
er …
Goat
fish
es
Cro
aker
s
Rib
bonfi
s…
Hors
e …
Oth
er …
Sil
ver
bel
lies
India
n …
Pen
aeid
…
Non
-…
Catc
h r
ate
kg/h
Catc
h X
1000t
Catch Catch …

26
Catch composition in trawlers along north east coast of India
Monthwise landing by trawlers along with their catch rates and their % contribution to total catch
along north east coast of India
Trawl landings and catch rate
Catfishes
2%
Threadfin
breams
3% Goatfishes
4%
Croakers
14%
Ribbonfishes
9%
Horse
Mackerel
3% Silverbellies
2% Indian
mackerel
4%
Penaeid
prawns
23%
Non-penaeid
prawns
3%
Other species
33%
0
10
20
30
40
50
60
70
80
90
100
0
10
20
30
40
50
60
70
80
Jan
Feb
Mar
Ap
r
Jun
Jul
Au
g
Sep
Oct
No
v
Dec
Ca
tch
ra
te i
n k
g/h
&
% c
on
trib
uti
on
of
traw
l ca
tch
to t
ota
l ca
tch
Catc
h X
1000t
AP
West Bengal
Odisha
Catch rate
% contribution to total catch

27
Trawl landings in Andhra Pradesh was 1.57 lakh t forming 51.6 % of the total marine landings. The
overall catch rate was 29.3 kg/h for the state. The contribution of sona boats to the trawl landings of
Andhra Pradesh was 66 % and the contribution of small mechanized trawlers was 34%. The catch
rate in sona boats was 30.6 kg / h and in small mechanized trawlers was 27.1 kg / h.
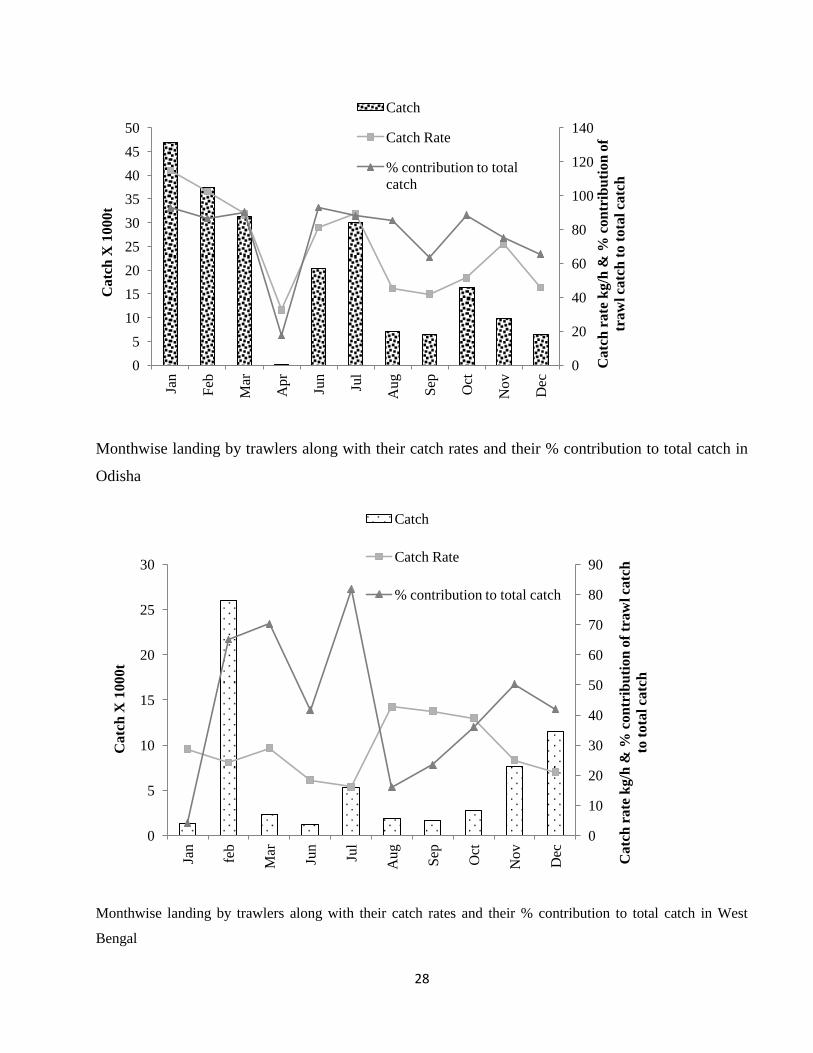
In Odisha, the trawl catch was 2.13 lakh t forming 85.95 % of the annual marine catches. The overall
catch rate in Odisha was 80.9 kg / h. More than 95 % of the catches were contributed by multiday
trawlers and less than 5 % were contributed by singleday trawlers. The catch rate in multiday trawlers
was 79.3 kg / h and in singleday trawlers was 147.8 kg / h.
In West Bengal, 0.62 lakh t was landed by trawlers forming 39.8 % of the total marine landings. The
overall catch rate in West Bengal was 23.7 kg / h.
Monthwise landing by trawlers along with their catch rates and their % contribution to total catch in
Andhra Pradesh
0
10
20
30
40
50
60
70
80
0
5
10
15
20
25
30
Jan
Feb
Mar
Apr
Jun
Jul
Aug
Sep
Oct
Nov
Dec
Catc
h r
ate
kg/h
& %
con
trib
uti
on
of
tra
wl ca
tch
to
to
tal
catc
h
Catc
h X
1000t
Catch
Catch Rate
% contribution to total catch
28
Monthwise landing by trawlers along with their catch rates and their % contribution to total catch in
Odisha
Monthwise landing by trawlers along with their catch rates and their % contribution to total catch in West
Bengal
0
20
40
60
80
100
120
140
0
5
10
15
20
25
30
35
40
45
50
Jan
Feb
Mar
Apr
Jun
Jul
Aug
Sep
Oct
Nov
Dec
Ca
tch
ra
te k
g/h
& %
co
ntr
ibu
tio
n o
f
tra
wl ca
tch
to
to
tal
catc
h
Ca
tch
X 1
00
0t
Catch
Catch Rate
% contribution to total
catch
0
10
20
30
40
50
60
70
80
90
0
5
10
15
20
25
30
Jan
feb
Mar
Jun
Jul
Au
g
Sep
Oct
No
v
Dec
Ca
tch
ra
te k
g/h
& %
co
ntr
ibu
tion
of
traw
l ca
tch
to t
ota
l ca
tch
Ca
tch
X 1
000t
Catch
Catch Rate
% contribution to total catch

29
Catch composition of trawl landings
Penaeid prawns, croakers, ribbonfish, scads, mackerel and goatfish were common dominant
groups in the trawl catch composition across all the three states.
Trawl catch composition (dominant groups and species) along the north east coast of India
Catch
composition
Andhra Pradesh Odisha West Bengal
Penaeid prawns (15%)
Ribbonfishes (9%)
Carangids (8%)
Rastrelliger kanagurta (7%)
Croakers (6%)
Goatfishes (4%)
Black pomfret (4%)
Threadfin breams (3%)
Rays (3%)
Silverbellies (3%)
Crabs (3%)
Penaeid prawns (24%)
Croakers (18 %)
Clupeids (9%)
Carangids (9%)
Ribbonfishes (8%)
Non-penaeid prawns (4%)
Goatfishes (3%)
Rastrelliger kanagurta (3
%)
Soles (2%)
Penaeid prawns (15%)
Croakers (9 %)
Megalaspis cordyla (8%)
Threadfin breams (6 %)
Other clupeids (5%)
Setipinna spp (5%)
Harpadon nehereus (4%)
Thryssa spp (4%)
Catfishes (4%)
Coilia dussumieri (3%)
Goatfishes (3%)
Species composition in the trawl landings of Andhra Pradesh
Rays
3% Threadfin
breams
3%
Goatfishes
4% Croakers
6%
Ribbon
fishes
9%
Carangids
8%
Silverbellie
s
3% Black
pomfret
4%
Indian
mackerel
7%
Penaeid
prawns
15%
Crabs
3%
Other
species
35%

30
Species composition in the trawl landings of Odisha
Species composition in the trawl landings of West Bengal
Andhra Pradesh
The landings of ribbonfishes, mackerel, croakers, goat fishes, threadfin breams and
lizardfishes were 13718 t, 10671 t, 8719 t, 6433 t, 4933 t and 4374 t at catch rates of 2.56 kg / h, 1.99
Clupeids
9%
Goatfishes
3%
Croakers
18%
Ribbon fishes
8%
Carangids
9%
Indian
mackerel
3%
Soles
2%
Penaeid
prawns
24%
Non-penaeid
prawns
4%
Other species
20%
Catfishes
4% Coilia
3%
Setipinna
5%
Thryssa
4% Other
clupeids
5%
Bombayduck
4% Threadfin
breams
6%
Goatfishes
3%
Croakers
9% Horse
Mackerel
8%
Penaeid
prawns
15%
Other species
34%

31
kg / h, 1.62 kg / h, 1.20 kg / h, 0.92 kg / h and 0.82 kg / h. Croakers landed were contributed chiefly
by Otolithes ruber (22.8%), Protonibea diacanthus (24.2%), Pennahia macarophthalmus (12.3%),
Nibea maculata (10.2%) and Johnius carutta (7.9%). Upeneus vittatus (47.1%) dominated the
goatfish landings followed by U. sulphureus (24.6%) and U. moluccensis (27.3%). Threadfin bream
and lizardfish landings were composed chiefly of Nemipterus japonicus (51.1%) and N. mesoprion
(36.5%) and Saurida undosquamis (60%), S. micropectoralis (24.4%) and S. tumbil (12.7%),
respectively. The catch of carangids was 12763 t with almost half of the catches being supported by
scads. Pomfret landed was 9073 t with black pomfret (68.5 %) dominating the landings.
Elasmobranch landing amounted to 6030 t of which rays contributed 86.9 %. The catch rate of scads,
black pomfret and rays were 1.02 kg / h, 1.17 kg / h and 0.98 kg / h. Around 13704 t of clupeids were
landed and Stolephorus spp accounted for more than a quarter of the total landings at a catch rate of
0.68 kg / h. The other major groups of fin fishes landed were silverbellies (4926 t), catfishes (3303 t),
barracudas (2934 t) and flat fishes (1648 t). Their catch rates were 0.92 kg / h, 0.62 kg / h, 0.55 kg / h
and 0.31 kg / h, respectively. The total crustacean landing was 31951 t of which the contribution of
penaeid prawns, non penaeid prawns and crabs were 24296 t, 1943 t and 4879 t. Their catch rates
were 4.53 kg / h, 0.36 kg / h and 0.91 kg / h, respectively. Metapenaeus monoceros dominated (49.6
%) the penaeid prawn catches in sona boats followed by Solenocera spp (17.3 %), Metapenaeopsis
spp (15.1 %) and Penaeus monodon (5.2 %). In the catches of small mechanised trawls, Metapenaeus
monoceros (31.8 %), Solenocera spp (29.4 %) and Trachypenaeus curvirostris (9.5 %) were the chief
contributors. More than 80 % of the edible crabs landed by sona boats and small mechanised trawls
were constituted by Portunus sanguinolentus. Among cephalopods, the catches of cuttlefish was 2484
t at a catch rate of 0.46 kg / h and the catches of squid was 1544 t at a catch rate of 0.29 kg / h.
Cuttlefish landing was contributed by Sepia aculeata (47.6 %), S. pharaonis (45 %) and Sepiella
inermis (7.3 %) while squid landing was contributed entirely by Loligo duvaucelli.
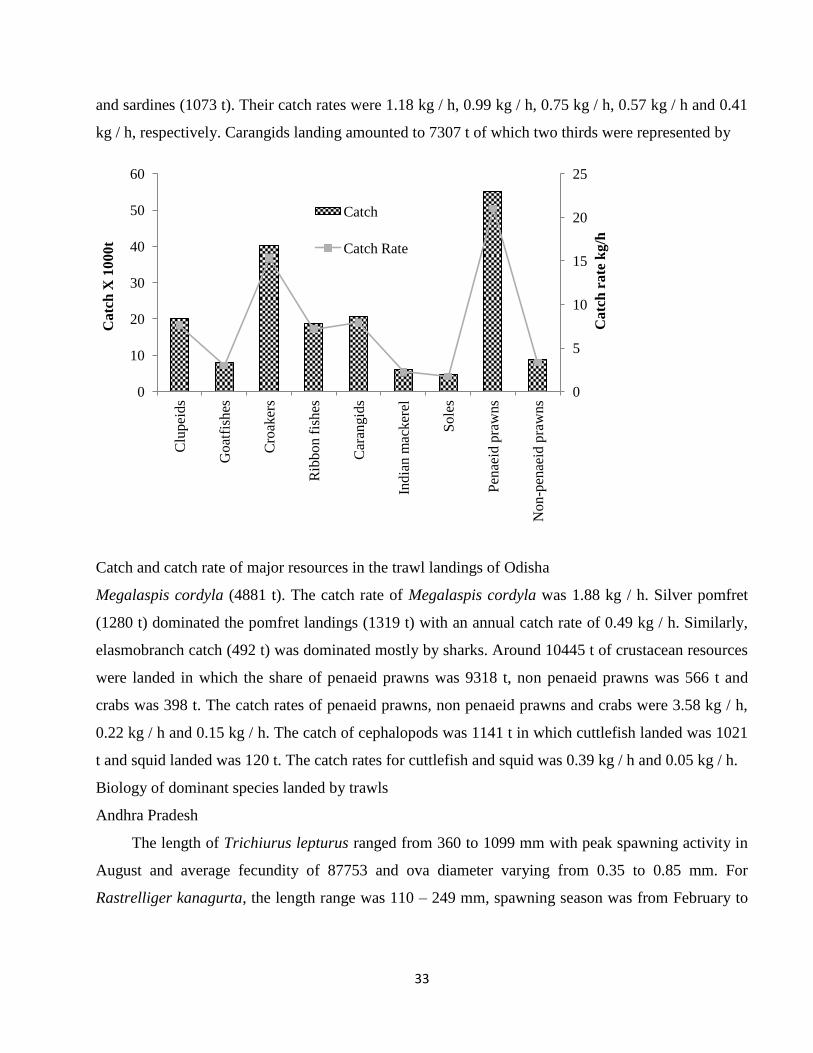
Odisha
The landings of croakers, ribbonfishes, goat fishes, mackerel, soles and catfishes were 40226
t, 18848 t, 7902 t, 6007 t, 4597 t and 3962 t at catch rates of 15.31 kg / h, 7.17 kg / h, 3.01 kg / h, 2.29
kg / h, 1.75 kg / h and 1.51 kg / h. Carangids landed amounted to 20737 t with a catch rate of 7.89 kg
/ h. Among carangids, the landings of Megalaspis cordyla was 3297 t at a catch rate of 1.25 kg / h.
The catch of clupeids was 20013 t with Stolephorus spp (2942 t), Setipinna spp (2897 t) and Coilia
dussumieri (2140 t) being the dominant species. Their catch rates were 1.12 kg / h, 1.10 kg / h and

32
0.81 kg / h, respectively. Pomfret landing (3640 t) was shared more or less equally by black pomfret
and silver pomfret. The catch rates of black pomfret and silver pomfret was 0.68 kg / h and0.64 kg /
h.
Catch and catch rate of major resources in the trawl landings of Andhra Pradesh
Similarly, elasmobranch catch (1491 t) was shared between rays (962 t) and sharks (524 t). Catch
rates for rays and sharks was 0.37 kg / h and 0.20 kg / h. The other major groups of fin fishes landed
were silverbellies (2805 t), lizardfishes (2800 t) and threadfin breams (1350 t). Their catch rates were
1.07 kg / h, 1.07 kg / h and 0.51 kg / h, respectively. Crustacean landing was 67076 t of which
penaeid prawns landed was 55257 t, non penaeid prawns landed was 8791 t and crabs landed was
2152 t. Their catch rates were 21.03 kg / h, 3.35 kg / h and 0.82 kg / h, respectively. Around 2519 t of
cephalopods were caught in which the contribution of squid was 1244 t and cuttlefish was 1275 t. The
catch rate for squids was 0.47 kg / h and for cuttlefish was 0.49 kg / h.
West Bengal
The landings of croakers, threadfin breams, catfishes, bombay duck, goatfishes, soles,
silverbellies and ribbonfishes were 5680 t, 3776 t, 2108 t, 2067 t, 2020 t, 1712 t. 1412 t and 1081 t at
catch rates of 2.18 kg / h, 1.45 kg / h, 0.81 kg / h, 0.79 kg / h, 0.78 kg / h, 0.66 kg / h, 0.54 kg / h and
0.42 kg / h.. The catch of clupeids was 14046 t in which the major species encountered were
Setipinna spp (3068 t), Thryssa spp (2567 t), Coilia dussumieri (1943 t), Chirocentrus dorab (1488 t)
0
0.5
1
1.5
2
2.5
3
3.5
4
4.5
5
0
5
10
15
20
25
Ray
s
Thre
adfi
n b
ream
s
Goat
fish
es
Cro
aker
s
Rib
bon f
ishes
Car
angid
s
Sil
ver
bel
lies
Bla
ck p
om
fret
India
n m
acker
el
Pen
aeid
pra
wns
Cra
bs
Ca
tch
ra
te k
g/h
Ca
tch
X 1
00
0t
Catch Catch Rate
33
and sardines (1073 t). Their catch rates were 1.18 kg / h, 0.99 kg / h, 0.75 kg / h, 0.57 kg / h and 0.41
kg / h, respectively. Carangids landing amounted to 7307 t of which two thirds were represented by
Catch and catch rate of major resources in the trawl landings of Odisha
Megalaspis cordyla (4881 t). The catch rate of Megalaspis cordyla was 1.88 kg / h. Silver pomfret
(1280 t) dominated the pomfret landings (1319 t) with an annual catch rate of 0.49 kg / h. Similarly,
elasmobranch catch (492 t) was dominated mostly by sharks. Around 10445 t of crustacean resources
were landed in which the share of penaeid prawns was 9318 t, non penaeid prawns was 566 t and
crabs was 398 t. The catch rates of penaeid prawns, non penaeid prawns and crabs were 3.58 kg / h,
0.22 kg / h and 0.15 kg / h. The catch of cephalopods was 1141 t in which cuttlefish landed was 1021
t and squid landed was 120 t. The catch rates for cuttlefish and squid was 0.39 kg / h and 0.05 kg / h.
Biology of dominant species landed by trawls
Andhra Pradesh
The length of Trichiurus lepturus ranged from 360 to 1099 mm with peak spawning activity in
August and average fecundity of 87753 and ova diameter varying from 0.35 to 0.85 mm. For
Rastrelliger kanagurta, the length range was 110 – 249 mm, spawning season was from February to
0
5
10
15
20
25
0
10
20
30
40
50
60 C
lupei
ds
Goat
fish
es
Cro
aker
s
Rib
bon f
ishes
Car
angid
s
India
n m
acker
el
Sole
s
Pen
aeid
pra
wns
Non
-pen
aeid
pra
wns
Ca
tch
ra
te k
g/h
Ca
tch
X 1
00
0t
Catch
Catch Rate

34
June with average fecundity of 96980 and ova diameter of 0.16 – 0.64 mm. The length ranges
recorded for Otolithes ruber, Upeneus vittatus, Nemipterus japonicus and Saurida undosquamis were
Catch and catch rate of major resources in the trawl landings of West Bengal
190 – 399 mm, 110 – 199 mm, 120 – 249 mm and 110 – 399 mm. Spawning season for Upeneus
vittatus, Nemipterus japonicus and Saurida undosquamis was during July – August, December –
February and November – December. Their average fecundity was 99759, 38487, 44004 and 72747
and their ova diameter ranged from 0.28 mm – 0.59 mm, 0.23 mm to 0.47 mm, 0.15 mm to 0.58 mm
and 0.24 mm to 1.35 mm. The mean length of Sphyraena obtusata was 265.5 mm with
gonadosomatic index of 3.4. The average fecundity was 75901 with ova diameter varying from 0.35
mm to 0.48 mm. Around half of the fishes possessed empty stomachs. The lengths for Penaeus
monodon and Penaeus indicus ranged from 168 – 278 mm and 132 – 203 mm with peak spawning
during February – March and ova diameter varying from 0.03 – 0.1 mm and 0.03 – 0.06 mm. Mean
length for Metapenaeus dobsoni was 75.1 mm for males and 83.5 mm for females with sex ratio
favouring males and majority (80 %) of the females in immature state. In Portunus sanguinolentus,
the mean length was 126.9 mm for males and 126.1 mm for females with dominance of mature
females in the catches. Length range for Sepia aculeata varied from 89 mm to 278 mm with
preponderance of females in the catch. More than half of the females were found to be mature. For
Loligo duvaucelli, the size varied from 65 mm to 159 mm with mature females encountered in most
0
0.5
1
1.5
2
2.5
3
3.5
4
0
1
2
3
4
5
6
7
8
9
10 C
atfi
shes
Coil
ia
Set
ipin
na
Thry
ssa
Oth
er c
lupei
ds
Bom
bay
duck
Thre
adfi
n b
ream
s
Goat
fish
es
Cro
aker
s
Hors
e M
acker
el
Pen
aeid
pra
wns
Ca
tch
ra
te k
g/h
Ca
tch
X 1
00
0t
Catch
Catch Rate

35
months of the year and ova diameter ranging from 0.78 mm to 1.3 mm. Juveniles of Sepia aculeata
and Loligo duvaucelli were encountered in the fishery throughout the year in high numbers.
Odisha
Length recorded varied from 260 mm to 349 mm for Otolithes ruber, 540 mm to 719 mm for
Trichiurus lepturus, 120 mm to 179 mm for Upeneus vittatus, 160 mm to 209 mm for Rastrelliger
kanagurta, 200 mm to 309 mm for Nemipterus japonicus and 280 mm to 439 mm for Saurida
undosquamis. Peak spawning months for Rastrelliger kanagurta, Nemipterus japonicus and Saurida
undosquamis was August, July – August and November – December. Mature females of Penaeus
monodon and Penaeus indicus were recorded in most months with peak during August – December.
Loligo duvaucelli ranged in length from 65 mm to 169 mm and high proportion of mature females
was recorded in all months of the year.
West Bengal
Lengths for Otolithes ruber, Johnius dussumieri, Trichiurus lepturus, Nemipterus japonicus,
Rastrelliger kanagurta, Saurida tumbil, Upeneus sulphureus and Saurida undosquamis varied from
200 mm to 329 mm, 160 mm to 259 mm, 440 mm to 659 mm, 130 mm to 319 mm, 140 mm to 229
mm, 170 mm to 369 mm, 110 mm to 189 mm and 210 mm to 279 mm. Peak spawning was observed
during September – December for Johnius dussumieri, December for Trichiurus lepturus and Saurida
undosquamis, April for Nemipterus japonicus, April and July – September for Rastrelliger kanagurta,
October – December for Saurida tumbil and July for Upeneus sulphureus. Mean length of
Cynoglossus arel was 248 mm with length ranging from 200 mm to 289 mm and preponderance of
males in the catch. For Penaeus monodon and Penaeus indicus, the length ranged from 155 mm to
247 mm and 119 mm to 175 mm. Breeding season was February – July for Penaeus monodon and
March – August for Penaeus indicus. The length for Loligo duvaucelli varied from 60 mm to 189 mm
with peak spawning observed in July.
Mean length, sex ratio, gonado somatic index and maturity % of major species caught in trawlers at Visakhapatnam,
Paradeep and Digha
Mean length (mm) Sex ratio Gonado somatic index % Maturity
Species Name Vizag Paradip Digha Vizag Paradip Digha Vizag Paradip Digha Vizag Paradip Digha
Rastrelliger kanagurta 186.9 181.2 195.2 1.5 0.8 0.9 2.71 5.7 19.3 25.7
Nemipterus japonicus 183.6 235.2 193.9 4.4 1.3 2.98 3 35.1 6.46
Trichiurus lepturus 186.9 181.2 195.6 1.5 0.8 0.9 2.71 5.6 19.3 25.7
Upeneus vittatus 148.1 140.7 1.6 1.1 3.24 0.5 40.6 2.2

36
Upeneus sulphureus 143.6 2.5 5.9 14.5
Otolithes ruber 263.8 310.7 255.1 2.7 1.1 2.4 1.41 8.3
Saurida tumbil 250.6 1.6 3.08 13.6
Saurida undosquamis 271.3 330.3 233.3 2.6 1.5 5.7 2.4 2.94 4.86 33.7 17.4 12.7
Johnius dussumieri 194.7 1.2 5.39 38.0
Penaeus monodon 218.2 193.7 0.5 1.8 7.2 9.73 43.6 19.1
Penaeus indicus 173.7 152.6 2.9 1 8.1 11.1 33.0 12.7
Metapenaeus monoceros 146.8 17 7.85 17.7
Loligo duvaucelli 98.2 92.4 104.3 1.7 1.3 2.1 9.4 12.28 57.6 87.9 17.9
Index of Relative Importance (%) of various prey items encountered in the stomach contents of major species caught in
trawlers at Visakhapatnam, Paradeep and Digha
IRI % Values Nemipterus japonicus Upeneus vittatus Trichiurus lepturus Saurida undosquamis Otolithes ruber
Diet Contents Vizag Paradip Digha Vizag Paradip Digha Vizag Paradip Digha Vizag Paradip Digha Vizag Paradip Digha
Digested fish 36.9 63.9 84.4 76.0 71.7 56.8 70.4 71.8 43.0 54.1 87.0 46.5 67.0 64.3
Metapaeneus sps 4.2 7.9 1.1 3.0 25.6 1.0 11.4 1.5 14.9 1.9 10.5 0.0
Crab 26.1 0.7 13.2 0.7
Squilla 12.5 0.3 1.1 0.1 0.1 6.0
Loligo 9.0 1.4 0.4 1.8 0.9 1.0 5.1 13.0 0.3 1.3
Leiognathus 0.2 0.7
Fish Juveniles 25.3 2.3 2.7 17.3 25.9 21.0
Upeneus vittatus 0.3 1.2
Octopus 0.4
Eel 0.1 0.5
Nemipterus sps 0.5 0.1
Lactarius
lactarius 0.2
Acetes sps 5.6 16.5 15.6 0.4 4.4 0.0 29.6
Anchovies 4.7 19.7
Lesser sardine 0.6 17.8 10.1
Saurida sps 0.2 7.1 1.1
Gastropod 0.3
Seerfish
0.4
Barracuda
3.4
Ribbon fish
2.6 3.1 0.1
Silver bellies
0.6
Other clupeids
8.0 2.1

37
Decapterus sps
0.5 2.4
Coilia dussumieri 1.5
Stolephorus sps 13.1 5.3
Solenocera sps 0.2 17.0
Apogon sps 1.6
Oil sardine 20.5
Otolithes ruber 11.3
Pentaprion sps 1.4
Parapenaeopsis
sps 0.2
Feeding intensity (%) of major species caught in trawlers at Visakhapatnam, Paradeep and Digha
Feeding Intensity (%) Empty-Trace Quarter Full-Half Full Three fourth-Full
Species Name Vizag Paradip Digha Vizag Paradip Digha Vizag Paradip Digha
Rastrelliger kanagurta 30.04 53.74 53.79 58.64 36.61 35.60 25.22 9.64 12.72
Nemipterus japonicus 55.9 49.6 54.08 28.69 37.34 20.95 16.63 13.04 24.95
Trichiurus lepturus 40.77 59.49 75.42 37.88 14.82 10.18 21.33 5.43 14.39
Upeneus vittatus 61.3 39.08 32.07 33.18 6.59 1.04
Upeneus sulphureus 87.67 9.11 3.2
Otolithes ruber 56.02 29.4 55.05 25.67 16.66 19.19 16.66 3.88 25.75
Saurida tumbil 78.25 5.85 14.3
Saurida undosquamis 49.04 65.87 79.28 31.41 13.18 2.5 19.04 3.87 18.21
Johnius dussumieri 88.98 4.92 8.19
Penaeus monodon 44.56 76.88 38.69 24.75 16.74 10.66
Penaeus indicus 26.27 73.85 41.35 22.81 32.37 3.33
Metapenaeus monoceros 19.61 44.69 40.59
Loligo duvaucelli 78.54 77.07 14.03 20.77 8.16 2.15

38
Dendrogram showing similarity of diet of Nemipterus japonicus for different months at
Visakhapatnam
Dendrogram reflecting the regional differences in the pooled diet contents of five major finfishes
(Nemipterus japonicus, Upeneus vittatus, Saurida undosquamis, Otolithes ruber and Trichiurus
lepturus) caught in trawls.
Stock Assessment of flagship species landed in trawls
Nemipterus japonicus
Sep
Aug
Mar
Apr
Feb
Oct
Nov
Jan
Dec
Jun
Jul
Visakhapatnam
100
80
60
40
20
Sim
ilari
ty
Transform: Square root
Resemblance: S17 Bray Curtis similarity
Par
adee
p
Vis
akha
patn
am
Dig
ha
100
80
60
40
Sim
ilari
ty
Transform: Square root
Resemblance: S17 Bray Curtis similarity

39
The growth parameters and stock estimates of three flagship species viz., Rastrelliger
kanagurtha, Nemipterus japonicus and Loligo duvaucelli landed in trawls along the north east coast
of India are depicted in tables. It is imperative from the tables that since the present exploitation level
for all are less than their Emax and the annual average yield is less than the maximum sustainable
yield, all the three species are underexploited with possible scope for increasing their exploitation.
Recruitment was unimodal in Rastrelliger kanagurtha and Nemipterus japonicus and bimodal in
Loligo duvaucelli. The peak months of recruitment were March – July for Rastrelliger kanagurtha,
March – August for Nemipterus japonicus and January – February and April – June for Loligo
duvaucelli. The peak pulse produced on an average 73% of the recruits for Rastrelliger kanagurtha
and Nemipterus japonicus and 72% of the recruits for Loligo duvaucelli. Virtual Population Analysis
indicated that the main loss in the stocks for Rastrelliger kanagurtha upto 17.5 cm was due to natural
causes. Fishes became more vulnerable to the gear after this size and mortality because of fishing
increased.
Growth parameters of flagship resources landed in trawls along north east coast
Linf (cm) k Z M F E Emax Lc (cm) Lr (cm)
Rastrelliger
kanagurta
25.67 0.43 2.01 1.07 0.94 0.47 0.71 19.48 10.45
Nemipterus
japonicus
33.02 0.22 1.18 0.65 0.53 0.45 1 17.24 12.45
Loligo
duvaucelli
19.63 0.16 0.88 0.61 0.27 0.31 1 9.33 5.7
Stock Assessment of flagship resources landed in trawls along north east coast
Recruitment
(in millions)
Standing
Stock /
Biomass (t)
Biomass
per recruit
(g)
Annual
average
yield (t)
MSY (t) Yield per
recruit (g)
Rastrelliger kanagurta 2609 18264 7 17168 18355 6.58
Nemipterus japonicus 366 11387 31.1 6035 6719 16.49
Loligo duvaucelli 874.5 10767 12.31 2907 4737 3.32

40
Restructured growth curve of Rastrelliger kanagurta
Length converted catch curve of Rastrelliger kanagurtha
Length structured Virtual Population Analysis for Rastrelliger kanagurtha

41
Restructured growth curve of Nemipterus japonicus
Length converted catch curve of Nemipterus japonicus
Length structured Virtual Population Analysis for Nemipterus japonicus
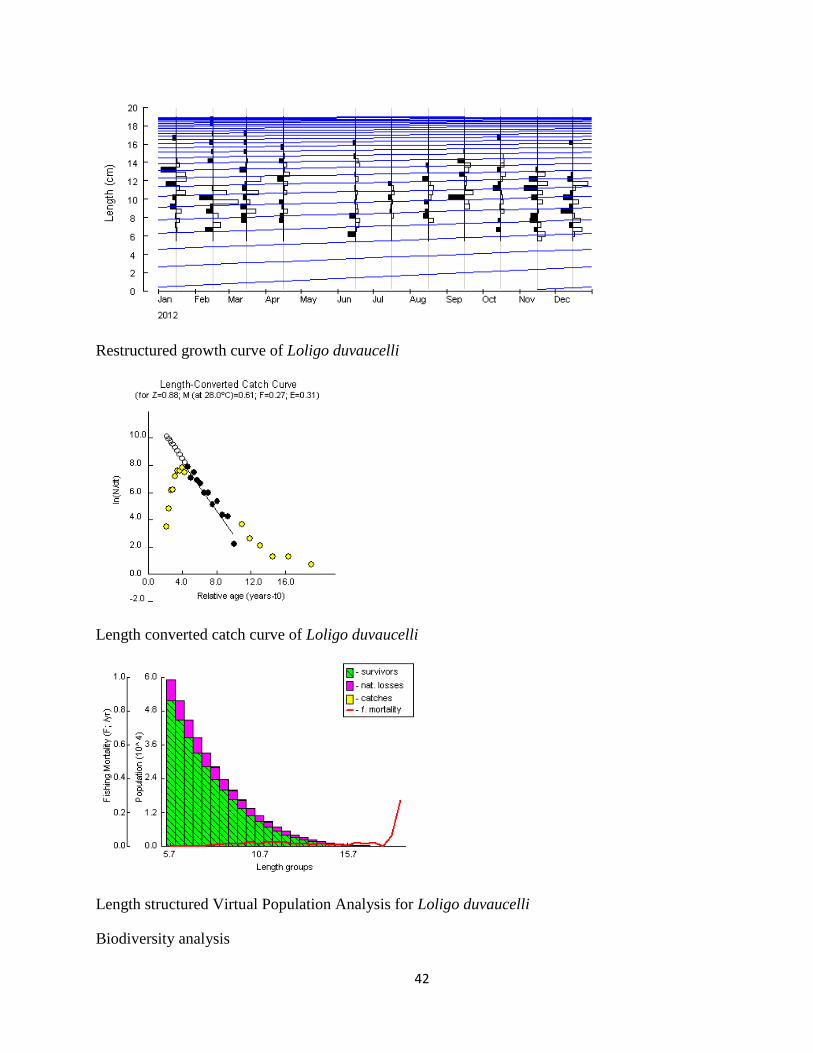
42
Restructured growth curve of Loligo duvaucelli
Length converted catch curve of Loligo duvaucelli
Length structured Virtual Population Analysis for Loligo duvaucelli
Biodiversity analysis

43
Trawl samples were collected from trawlers operating off Visakhapatnam in Andhra Pradesh,
Paradeep in Odisha and Digha in West Bengal and the data was analyzed with respect to diversity
indices, dominance plot, Bray–Curtis similarity and abundance and biomass comparison plot.
Diversity Indices - In line with the higher number of species, Shannon diversity {H’(log 2)} was
more in Paradeep (4.82) as compared to Digha (2.82) and Visakhapatnam (3.63) reflecting the diverse
nature of these centres. The Simpson species richness index for Paradeep (0.95) was also found to be
more than that of Digha (0.74) and Visakhapatnam (0.82).
Diversity indices of trawl catches at Visakhapatnam, Digha and Paradeep
Stations/Indices Species
richness (d)
Pielou’s
evenness (J')
Shannon
H'(log2)
Simpsons
1-Lambda'
Hill abundances
(N1)
Digha 7.99 0.46 2.82 0.74 7.07
Paradeep 7.53 0.89 4.82 0.95 28.43
Visakhapatnam 9.32 0.57 3.63 0.82 12.45
Dominance plot – The species dominance plot indicates the rich diversity of trawl catches in
Paradeep as compared to Digha and Visakhapatnam with respect to the number of species.
Dominance plot showing higher diversity in Paradeep as compared to Visakhapatnam and
Digha
Bray–Curtis similarity analysis - The Bray–Curtis similarity in species composition and abundance
among Digha, Paradeep and Visakhapatnam was 16.67-21.87%.
Trawl catch data of North East Coast
1 10 100
Species rank
0
20
40
60
80
100
Cu
mu
lative
Do
min
an
ce
%
Digha
Paradeep
Visakhapatnam

44
Species composition and abundance similarity in trawl catches at Visakhapatnam, Paradeep
and Digha
Abundance/biomass comparison plots - The abundance/biomass comparison (ABC) plot for Paradeep
showed the K dominance curve for biomass to be above the curve for abundance. W statistics value
was highest in Paradeep (0.063). These indicate higher degree of evenness and lower degree of
disturbance at Paradeep. The ABC plot for Digha and Visakhapatnam showed the K dominance curve
for abundance to be above the curve for biomass. W statistics values for Digha and Visakhapatnam
were -0.193 and -0.151. These indicate lower degree of evenness with higher disturbance level at
Digha and Visakhapatnam.
Species abundance biomass curve for Digha
Trawl catch data of North East CoastGroup average
Para
deep
Dig
ha
Vis
akhapatn
am
Samples
100
80
60
40
20
0
Sim
ila
rity
Transform: Square root
Resemblance: S17 Bray Curtis similarity
Trawl catch data of North East CoastDigha
1 10 100
Species rank
0
20
40
60
80
100
Cu
mu
lativ
e D
omin
an
ce%
Abundance
Biomass
W = -0.193

45
Species abundance biomass curve for Paradeep
The total production by trawlers during 2013 along the north east coast of India was 4.28 lakh
t. The catch rate was 39.49 kg / h. Trawl landings in Andhra Pradesh was 1.34 lakh t forming 51.8 %
of the total marine landings. The overall catch rate was 25.2 kg/h for the state. The contribution of
sona boats to the trawl landings of Andhra Pradesh was 96.1 % and the contribution of small
mechanized trawlers was 3.9 %. The catch rate in sona boats was 25.3 kg / h and in small mechanized
trawlers was 24.4 kg / h. In Odisha, the trawl catch was 2.13 lakh t forming 85.9 % of the annual
marine catches. The overall catch rate in Odisha was 80.91 kg / h. More than 95 % of the catches
were contributed by multiday trawlers and less than 5 % were contributed by singleday trawlers. The
catch rate in multiday trawlers was 79.32 kg / h and in singleday trawlers was 147.78 kg / h. In West
Trawl catch data of North East CoastParadeep
1 10 100
Species rank
0
20
40
60
80
100C
umul
ativ
e D
omin
ance
%Abundance
Biomass
W = 0.063
Trawl catch data of North East CoastVisakhapatnam
1 10 100
Species rank
0
20
40
60
80
100
Cu
mu
lativ
e D
om
ina
nce
%
Abundance
Biomass
W = -0.151

46
Bengal, 0.67 lakh t was landed by trawlers at catch rate of 25.25 kg/h forming 31.4 % of the total
marine landings.
Catch
composition
Andhra Pradesh Odisha West Bengal
Penaeid prawns (18.3%)
Ribbonfishes (8.5 %)
Croakers (5.7 %)
Black pomfret (5.0%)
Rastrelliger kanagurta (4.2 %)
Silverbellies (3.6 %)
Stolephorus (3.7%)
Goatfishes (3.5 %)
Scads (3.4 %)
Threadfin breams (3.2%)
Catfishes (3.1%)
Crabs (2.9 %)
Lizardfishes (2.9%)
Penaeid prawns (22.32%)
Croakers (19.69 %)
Ribbonfishes (10.32 %)
Non-penaeid prawns (5.9
%)
Setipinna (3.28 %)
Stolephorus (2.95 %)
Thryssa (2.86 %)
Crabs (2.32 %)
Penaeid prawns (14.55%)
Croakers (12.37 %)
Coilia dussumieri (5.56 %)
Harpadon nehereus (4.57
%)
Setipinna (4.53 %)
Lesser sardines (3.43%)
Silverbellies (3.41 %)
Catfishes (3.32 %)
Thryssa (3.14 %)
Ribbonfish (2.68 %).
Species Name Fecundity Ova diameter (microns)
Rastrelliger kanagurta 153505 0.28-1.02
Sardinella longiceps 31200 0.38-0.54
Trichiurus lepturus 139290 0.31-0.74
Otolithes ruber 147458 0.2-0.53
Nemipterus japonicus 84396 0.2-0.56
Saurida undosquamis 75932 0.26-0.67
Sphyraena jello 270606 0.20-0.50

47
Feeding intensity (%) Empty - Trace %
One fourth - One half
% Three fourth - Full %
Species Name Vizag Digha Vizag Digha Vizag Digha
Rastrelliger kanagurta 11.7 49.0 62.0 42.5 26.3 8.5
Sardinella longiceps 61.1 70.2 32.2 15.6 6.7 14.1
Trichiurus lepturus 56.8 78.4 20.3 7.1 22.8 14.5
Otolithes ruber 68.5 78.0 27.8 12.8 3.6 9.1
Nemipterus japonicus 41.7 57.9 38.1 22.6 20.2 19.5
Loligo duvaucelli 70.0
21.0
9.0
Saurida undosquamis 68.9
18.9
12.2
Scomberomorus guttatus 59.6
20.0
20.4
Katsuwonus pelamis 62.1
22.4
15.5
Sphyraena jello 49.7
37.8
12.5
Length range (mm)
Mean length
(mm) Sex ratio Mature % GSI
Species Name Vizag Digha Vizag Digha Vizag Digha Vizag Digha Vizag Digha
Rastrelliger kanagurta 110-269 140-259 189.9 199.3 2.3 1.1 32.7 49.8 5.5 4.4
Sardinella longiceps 60-219 130-209 126.2 168.2 1.0 1.2 4.3 27.6 5.9 7.8
Trichiurus lepturus 380-1059 480-819 582.3 596.6 3.5 1.8 24.3 24.9 3.5 4.8
Otolithes ruber 150-419 180-409 276.3 267.6 1.8 1.9 21.3 19.7 2.4 3.2
Nemipterus japonicus 110-289 110-319 184.6 200.6 1.8 3.8 39.1 13.2 3.8 3.9
Loligo duvaucelli 55-194 60-194 95.7 95.2 2.7 1.3 63.3 31.9 11.7 16.0
Saurida undosquamis 120-389
213.9
3.4
14.4
4.1
Scomberomorus guttatus 200-379
304.2
2.4
0.0
Katsuwonus pelamis 360-679
511.7
1.0
10.7
1.2
Sphyraena jello 180-599
335.3
0.8
20.4
2.6
Sphyraena obtusata 210-299
238.8
6.0
61.7
4.2
Upeneus vittatus 100-199
146.4
1.2
33.0
3.3
Metapenaeus monoceros 104-196
148.0
1.1
47.4
10.4
Upeneus sulphureus
110-179
134.0
1.1
40.1
4.5
Saurida tumbil
180-379
263.1
2.0
18.3
7.0
Cynoglossus arel
160-299
235.5
1.8
13.3
5.1
Penaeus monodon
149-258
190.9
1.4
47.5
7.1

48
Sphyraena obtusata 83.3
8.3
8.3
Upeneus vittatus 58.7
30.3
11.1
Metapenaeus monoceros 12.7
56.0
31.3
Upeneus sulphureus
91.4
2.6
6.0
Saurida tumbil
70.9
12.5
16.7
Cynoglossus arel
96.2
3.8
0.0
Penaeus monodon
49.0
34.8
16.2
IRI % values Trichiurus lepturus Otolithes ruber Nemipterus japonicus Loligo duvaucelli
Food contents Vizag Digha Vizag Digha Vizag Digha Vizag Digha
Acetes
12.9
9.5
Apogon
0.7
0.1
Carangids 11.0
5.7
Clupeids
1.5
Coilia
3.6
Crab
0.7
8.1 0.4
Dig fish 37.3 95.7
57.1 99.1
Dig matter
37.8 78.2 45.0 78.2
Eel
0.2
1.5
Fish juvenile
1.0
6.5 3.3 2.0
Goatfish
0.4
Leiognathus
1.9
Lizardfish
0.5
Mackerel 0.5
0.8
Myctophids
0.1
Octopus
0.2
Polynemus 2.5
Ponyfish
4.0
Puffer fish 0.2
Sardine 38.0
1.3
15.3
Saurida
0.1
Sciaenid
1.5
1.4
Shrimp
1.4 27.7 9.9 16.5 17.4
0.9
Sillago
Silverbellies 3.0
Solenocera
1.7 6.5
Squid
0.3 0.5
6.0 0.3

49
squilla
4.4 1.7
Stolephorus 7.5 1.7 0.1
0.5
18.1
Threadfin bream
0.1
Thryssa
Upeneus
8.0
Remote sensing assisted biodynamic forecasting paradigm for Indian marine
fishery resources
Experimental fishing was conducted for the collection of fishing data off Visakhapatnam coast and
data was collected from 26 hauls (11 trips) by using commercial trawlers.
Gangavaram (27%), Rushikonda (23%) and Yarada (23%) were the main places covered for the
fishing. Trawl net was the single major gear used for the fishing.
Mesh size varied between 12 mm, 15 mm and 20 mm. 15 mm mesh size was used for fishing for
most of the time. Depth of operation ranged from 20-66 m and 38 m was the average depth. 2.2
Nautical miles was the average speed maintained during fishing. Total fish catch was about 415 kg
out of which 167 kg was the discarded catch. Discarded catch varied from 17-66% and 41% was the
average discard catch. Catch per hour (cph) varied from 1.6 to 26.3 kg and 9.7 kg was the average
cph. 2.10 hr was the average haul duration of fishing.
Around 82 species contributed to the single day fishery, among that Lapturacanthus savala (14%),
Leiognathus bindus (8%), Johnius carruta (5.4%), Gazza minuta (4.9%), Pennahia macrophthalmus
(4.85%), Pomadasys maculata (3.9%), Saurida undosuamis (3.5%), Apogon sps (3.16%) and
Upeneus vittatus (3.13%) were the major fishery resources.
About 76 species were observed in discard catch, among that Lapturacanthus savala (21%), Apogon
sps (12.64%), Leiognathus bindus (10%), other crabs (9.1%), Lagocephalus sps (6.4%), Squilla
(3.95%), Pomadasys maculata (3.55%) and Secutor (3%) were the major discard fishes.
Development and standardization of seed production technologies of selected high
value fin fishes and shellfishes
Protocol for female broodstock development of E. coioides in cage was standardized with successful
year round female broodstock availability.

50
Successful sex reversal (female grouper to male) was achieved with the hormonal and enzymatic
manipulation and 60% of the implanted fishes were sex reversed after 4 months.
Female and male brooders of orange spotted grouper in re-circulatory system successfully matured
with 450 µ ova size in cannulated female and milt in sex reversed male.
Persistent sex reversed male orange spotted grouper: Orange spotted grouper with oocytes in the
perinucleolus stage were implanted with 5 mg 17 α-MT kg -1
body weight (T1), 5 mg 17 α-MT and
0.2 mg letrozole kg -1
body weight (T2) and 5 mg 17 α-MT with 0.4 mg letrozole kg -1
body weight
(T3) and no androgens/enzyme inhibitor implanted. The 17 α-MT alone and in combination of
letrozole-induced sex reversal in orange spotted grouper, whereas untreated control fish showed
normal ovarian development. Sex-reversed males successfully fertilized the eggs during induced
spawning. Thus 17 α-MT (5.0 mg kg -1
BW) in combination with letrozole (0.2 mg kg-1
BW) has the
potential to produce 100% sex- reversed male in short period in orange spotted grouper.
Induced spawning of orange spotted grouper was achieved and fertilized eggs were produced.
Hormonal doses for induced breeding of orange spotted grouper were standardized. Larval rearing of
orange-spotted grouper was carried out successfully for the first time in India. Two cycle of larval
rearing were completed and seed were produced.
Thirteen number of adult Trachinotous mookalee were collected and stocked in cage for broodstock
development. Two male and two mature female broodstock was developed. Induced spawning of
Indian pompano was carried first time in world. Successful larval rearing of Indian pompano was
carried out and seed were produced for the first time in the world.
Phytoplankton, Nannochloropsis sp., Chlorela sp. and Isochrysis sp. were cultured for feeding to
rotifers.
Stock culture of Cheatocerous sp. and Thallasocera sp. was maintained and a revenue of Rs. 5.79
lakhs were generated by selling different phytoplankton species.
The mass production method of copepod (Calanoid spp.) culture was developed for producing
copepod nauplii for larval rearing of grouper.
A method for small rotifers production of less than 100 µ size was standardized.
Innovations in Sea Cage Farming and Coastal Mariculture
Hatchery produced fingerlings of 6 cm size (0.57g) were stocked in hapa of 2 mm mesh size attached
to cage and it has grown to 12.11 cm (18.93 g) after 2 months of cultured period.

51
Orange spotted grouper seed of 12.11 cm in length and 18.93 g in weight were stocked in cage and
fed with trash fish and have grown to 28.44 cm in length and 410.38 gm in weight after 6 month of
culture period. The survival rate during the culture period was 100%.
Wild grouper seed (6-7 cm) were collected along Nagayalanka coast of West Godavari Dist. of
Andhra Pradesh and stocked in pond for growth monitoring. They were fed with trash fish and
artificial pellet @ 8-10 % body weight. After six month of culture period, they have grown to 20.5 cm
in average length and 134.0 g in average weight.
Live ageing to revalidate growth parameters of Oil sardine and Indian Mackerel: An experiment was
conducted in open sea cage to revalidate the growth parameters of Oil sardine and Mackerel from 14th
December 2013 to 22nd
March, 2014 at VRC of CMFRI, Visakhapatnam. About two hundred
numbers of Oil sardines of average length of 86 mm and two numbers of Mackerel of average length
of 159 mm was collected from wild and stocked in cage. Random sampling of forty species was taken
for measuring the length and weight at an interval of 15 days. An average length of 146 mm and 222
mm for Oil sardine and Mackerel was obtained after three months of stocking. The increase in length
of about 60 mm and 63 mm was obtained for Oil sardine and Mackerel after three months of
stocking.
Health management in selected finfish and shellfish for mariculture and
aquariculture & bioprospecting from marine resources
Regular survey for parasitic infection in grouper revealed sea lice, Lepeophtheirus kabatai infestation
among wild collected orange spotted grouper (Epinephelus coioides) which is reared in captive
condition.
A method for controlling sea lice infestation in orange-spotted grouper with formalin of 200 ppm for
30 minutes followed by freshwater bath for 5 minutes was found best among different treatment
groups carried out.
Infestation with the Isopod spp. was recorded among the Orange spotted grouper (Epinephelus
coioides) broodstock during the winter period.
The formalin treatment with 200 ppm for 30 minutes followed by freshwater bath for 5 minutes was
the best among different treatment groups to control this parasite.

52
Development of Fisheries Management Plans (FMPs) for sustaining marine
fisheries of Andhra Pradesh
The total marine fish production of A.P. for 2012 was 3.05 lakh t. Pelagic resources accounted for
1.68 lakh t forming 55% of the total landings for the state. The dominant groups landed were clupeids
(0.67 lakh t and 39.9%), mackerels (0.28 lakh t and 16.95%), ribbon fishes (0.22 lakh t and 13%),
carangids (0.21 lakh t and 12.25%), tunas and billfishes (0.15 lakh t and 9.16%) and seer fishes (0.07
lakh t and 4.21%). Among clupeids, the major contributors were lesser sardines contributing 0.25
lakh t, oil sardine contributing 0.09 lakh t and Stolephorus contributing 0.10 lakh t. The catch rate of
oil sardines, lesser sardines and Stolephorus in trawlers were 0.15 kg/h, 0.40 kg/h and 0.68 kg/h. The
catch rate of ribbon fishes in trawlers was 2.56 kg/h. Carangids landed were contributed by horse
mackerel (23.3%), scads (26.8%), leatherjackets (5.3%) and other carangids (44.6%). The catch rate
of horse mackerel, scads and other carangids in trawl nets were 0.39 kg/h, 1.02 kg/h and 0.89 kg/h.
The mackerel landings were contributed solely by Rastrelliger kanagurta. The catch rate in trawlers
was 1.99 kg/h. Seer fish catch was dominated by Scomberomorus commerson (66.9%) and
Scomberomorus guttatus (33.1%). Among tuna, the dominant species landed were Thunnus albacares
(45.5%), followed by Euthynnus affinis (27.5%), Katsuwonus pelamis (23.2%) and Auxis thazard
(3.8%). The landings of billfishes and barracudas for the year were 0.025 lakh t and 0.04 lakh t,
respectively. The catch rate of barracudas in trawlers was 0.55 kg/h.
Production trends in Visakhapatnam: Resource wise Fishery & Biology
Sardine
The estimated catch of sardine from the trawlnets at Visakhapatnam was 1177.5 t. It formed 1.8%
of the trawl net catches with a catch rate of 0.43 kg/h. Trawl catch was composed chiefly of lesser
sardines, rainbow sardine and oil sardine. In silk nets (33 mm mesh size), the catch was 408.5 t with a
catch rate of 126 kg/unit forming 66% of the total catch. The silk net catch was dominated by
Sardinella longiceps (45.85%), Sardinella fimbriata (42.06%) and Sardinella gibbosa (12.09%). The
length of oil sardine, Sardinella longiceps at Visakhapatnam ranged from 80 mm to 219 mm with an
annual mean of 166.85 mm. The highest mean length of 206.13 mm was recorded in the month of
May and the lowest mean length of 106.26 mm was recorded in January. The annual sex ratio was
1.55. Males dominated the catch in February and March while females dominated the catch in rest of
the months. May - August is the peak breeding season of oil sardine. This is substantiated by the
presence of high proportion of spawners (66.11%) and by high gonadosomatic index (6.55) in these

53
months. Their fecundity ranged from 12253 to 91992 with ova diameter varying from 0.24 mm to
0.68 mm. Food component analysis in gut revealed an abundance of planktonic matter.
Mackerel
The estimated mackerel landings by trawlers and gill netters (55 mm mesh size) in
Visakhapatnam were 6992.8 t and 824.8 t, respectively with an average catch rate of 2.45 kg/h for
trawls and 44 kg/unit for gill nets. More than half (58%) of the gillnet catches at Visakhapatnam were
contributed by mackerel. However in trawlnet catches the contribution of mackerel was 10.15%. 80%
of the gill net catches and 70% of the trawl catches were composed of Rastrelliger kanagurta and the
rest being constituted by Rastrelliger faughnii. The length of Indian mackerel, Rastrelliger kanagurta
at Visakhapatnam ranged from 110 mm to 249 mm with an annual mean of 186.97 mm. Maximum
mean length of 221.28 mm was recorded in March and minimum mean length of 143.19 mm was
recorded in October. Annual sex ratio was 1.54. Males dominated the catch in January - March and
July while females dominated the catch in rest of the months. June appears to be the peak breeding
month with two third of the females in mature condition and high gonadosomatic index value of 4.6.
Their fecundity ranged from 37714 to 298953 with ova diameter varying from 0.16 mm to 0.64 mm.
The analysis of food components revealed an abundance of copepods, decapods, ostracods,
Coscinodiscus, Foraminifera along with minute quantities of cladocerans, fish eggs and larvae, zoea,
tintinnids and nematods.
Ribbonfish
The estimated ribbonfish landing by trawlers at Visakhapatnam was 4672.6 t (6.77 % of the trawl
net catches) with the catch rate of 1.69 kg/h. The catches along with catch rates were significantly
higher during August - September. Trichiurus lepturus was the sole species with size ranging from
360 to 1099 mm and having mean length of 590.71 mm. There was a preponderance of females in the
catch with mature females encountered only in August, November and December. Fecundity varied
from 22533 to 186667 with ova diameter ranging from 0.35 mm to 0.85 mm. The high IRI values of
nonpenaeids, cephalopods, penaeids, clupeids, juveniles of sciaenids, ribbon fishes, scombrids and
carangids and other teleosts and digested fish imply that they were the principal food constituents of
Trichiurus lepturus.
Seerfish
The seerfish landing by trawlers at Visakhapatnam was 414.85 t with catch rate of 0.15 kg/h.
Scomberomorus guttatus dominated the gillnet landings while the trawl fishery was supported by

54
both Scomberomorus guttatus and Scomberomorus commerson. The catch in gill nets was 119 t at a
catch rate of 8.38 kg/unit forming 6.3% of the gill net landings. The length of Scomberomorus
guttatus at Visakhapatnam ranged from 280 mm to 479 mm with an annual mean of 369.09 mm.
Significant dominance of females in catch was recorded in all the months. Mackerel, sardine,
anchovies and squid were the principal food components encountered in their gut.
Tuna
The annual catch of tuna recorded by hooks and lines at Visakhapatnam was 611.1 t with the catch
rate of 18.4 kg/unit. 30.94% of the hooks and lines catches at Visakhapatnam was contributed by
tunas alone. The dominant species landed in hooks and lines were Thunnus albacares (53.4%),
Euthynnus affinis (24.56%) and Katsuwonus pelamis (22.03%). The length of skipjack tuna,
Katsuwonus pelamis at Visakhapatnam ranged from 380 mm to 679 mm with an annual mean of
519.5 mm. The highest mean length of 600.16 mm was recorded in the month of October and the
lowest mean length of 489.2 mm was recorded in March. Annual sex ratio was 1.35 with significant
dominance by males in September and by females in February – March and November - December.
More than 80% of the females were mature in March indicating it to be the peak breeding season.
Average gonadosomatic index was 1.47. Their fecundity ranged from 205947 to 1758204 with ova
diameter varying from 0.18 mm to 0.7 mm. The high IRI values of cephalopod, penaeid prawn,
carangids, sardines and anchovies along with digested food imply them to be the principal food
constituents. The length of yellow fin tuna, Thunnus albacares at Visakhapatnam ranged from 120
mm to 1719 mm with an annual mean of 783.05 mm. Maximum mean length of 1182.4 mm was
recorded in April and minimum mean length of 434.62 mm was recorded in December. Annual sex
ratio was 2.82. Males dominated the catch in January and October while females dominated the catch
in January, September and December. High percentage (83.33%) of mature females was observed in
October. Their fecundity ranged from 2306062 to 3815101 with ova diameter varying from 0.2 mm
to 0.56 mm. Cephalopods are their preferred prey, followed by mackerel, crab, squilla, coastal tunas,
carangids and other scombrids.
Growth parameters of pelagic resources landed at Visakhapatnam
Linf (cm) Winf (g) k Z M F E Lc (cm) Lr (cm)
Sardinella
longiceps
22.52 85.3 1.19 8.39 2.95 5.45 0.65 9.86 8.45

55
Rastrelliger
kanagurta
25.67 189.9 0.55 2.49 1.26 1.23 0.49 20.74 10.45
Katsuwonus
pelamis
89.2 13834.9 0.59 2.63 0.93 1.7 0.65 43.43 38.95
Thunnus
albacares
179.5 95428.3 0.06 0.4 0.17 0.23 0.57 157.6 12.95
Trichiurus
lepturus
114.4 1243.4 0.12 0.87 0.31 0.56 0.65 56.15 36.95
Stock Assessment of pelagic resources landed at Visakhapatnam
Recruitment
(in millions)
Standing
Stock /
Biomass
(t)
Biomass
per recruit
(g)
Annual
average yield
(t)
Yield per
recruit (g)
Sardinella longiceps 1135 1678 1.48 9146 8.06
Rastrelliger kanagurta 6003.4 20786 3.46 25567 4.26
Katsuwonus pelamis 2 1904 940.72 3237 1599.23
Thunnus albacares 46 25157 546.79 5786 125.76
Trichiurus lepturus 297.7 35434 119.04 19843 66.66
Index of Relative Importance (%) of food items encountered in the gut of Thunnus
albacares
January July August September October December
Digested fish 54.8 0.0 86.9 94.0 0.0 65.4
Squid 4.9 0.0 1.6 0.0 0.2 4.1
Sthenoteuthis 13.2 0.0 0.0 0.0 0.0 0.0
Crabs 1.0 2.5 0.0 0.0 99.8 0.0
Shrimp 0.0 0.0 10.2 0.0 0.0 0.0
Squilla 0.0 97.5 0.0 0.0 0.0 4.8
Mackerel 1.3 0.0 0.0 4.0 0.0 0.0

56
Auxis 0.0 0.0 1.3 0.0 0.0 0.0
Euthynnus 0.0 0.0 0.0 0.0 0.0 0.0
Carangid 0.0 0.0 0.0 2.0 0.0 0.0
Priacanthus 0.0 0.0 0.0 0.0 0.0 6.8
Decapterus 14.6 0.0 0.0 0.0 0.0 0.0
Selar 3.4 0.0 0.0 0.0 0.0 0.0
Nemipterus 0.3 0.0 0.0 0.0 0.0 0.0
Fish Juvenile 0.8 0.0 0.0 0.0 0.0 0.0
Megalopa 5.4 0.0 0.0 0.0 0.0 18.9
Sea Horse 0.2 0.0 0.0 0.0 0.0 0.0
The total marine fish production of A.P. for 2013 was 2.66 lakh t. Pelagic resources accounted for
1.47 lakh t forming 55.4% of the total landings for the state. The dominant groups landed were
clupeids (0.46 lakh t and 31.1%), mackerels (0.34 lakh t and 22.9%), carangids (0.21 lakh t and
14.0%), ribbon fishes (0.19 lakh t and 12.8%), tunas and billfishes (0.16 lakh t and 11.0%) and seer
fishes (0.05 lakh t and 3.4%).
Among clupeids, the major contributors were lesser sardines contributing 0.11 lakh t, oil sardine
contributing 0.07 lakh t and Stolephorus contributing 0.07 lakh t. Carangids landed were contributed
by horse mackerel (31.6%), scads (30.1%), leatherjackets (4.4%) and other carangids (33.9%).
Rastrelliger kanagurta formed almost the entire of the mackerel landings, the rest being formed by
Rastrelliger faughni. Seer fish catch was dominated by Scomberomorus commerson (72.8%) and
Scomberomorus guttatus (27.2%). Among tuna, the dominant species landed were Thunnus albacares
(48.0%), followed by Euthynnus affinis (26.9%), Katsuwonus pelamis (19.1%) and Auxis thazard
(6.0%). The landings of billfishes and barracudas for the year were 0.03 lakh t and 0.04 lakh t,
respectively.
Half of the ribbonfish, horse mackerel and other carangids catches were by trawlers, whereas for
scads, Stolephorus and barracudas, three-fourth of the catches were by trawlers. One-fourth of the
lesser sardine and mackerel landings were contributed by trawl nets. The catch rate of mackerel in
trawlers was 1.05 kg/h. The catch rate of lesser sardines and Stolephorus in trawlers were 0.23 kg/h
and 0.93 kg/h. The catch rate of ribbon fishes in trawlers was 2.14 kg/h. The catch rate of horse

57
mackerel, scads and other carangids in trawl nets were 0.51 kg/h, 0.85 kg/h and 0.55 kg/h. The catch
rate of barracudas in trawlers was 0.53 kg/h.
More than half of the tuna catches and half of the Scomberomorus commerson catches were in gill
nets. Catch rates in gill nets of Rastrelliger kanagurta, Thunnus albacares, Scomberomorus
commerson, Katsuwonus pelamis and Euthynnus affinis were 10.89 kg/unit, 9.67 kg/unit, 5.60
kg/unit, 4.69 kg/unit and 2.75 kg/unit. The catch rate of oil sardine, lesser sardine and ribbonfish in
gill nets was 1.51 kg/unit, 3.47 kg/unit and 5.63 kg/unit.
More than half of the billfish and one third of the yellowfin tuna catches were by hooks and lines.
Their catch rates were 15.36 kg/unit and 19.97 kg/unit.
Visakhapatnam:
Sardine and mackerel landed in silk (gill) nets amounted to 242 t and 875 t at catch rates of 126.24
kg/unit and 65.7 kg/unit. The landing of sardine and seerfish in small trawlers and sona boats was
meager to the tune of 100 t and 170 t. Mackerel landing in small trawlers and sona boats were 2330 t
and 1982 t at catch rates of 1.61 kg/h and 1.33 kg/h. Landing of ribbonfish in small trawlers and
sona boats were 1565 t and 1172 t at catch rates of 1.08 kg/h and 0.79 kg/h. In small trawlers, 3252 t
of carangids and 1116 t of barracuda was landed at catch rates of 2.25 kg/h and 0.77 kg/h. whereas
in sona boats, 2916 t of carangids and 839 t of barracuda was landed at catch rates of 1.96 kg/h and
0.56 kg/h. Tuna landing from the non-motorized and motorized boats was 1256 t and 1241 t at catch
rate of 976 kg/unit and 306 kg/unit, of which yellowfin tuna formed 64.1% and 43.4 %.
Kakinada:
Tuna catches at Dummulapeta and Bhairavapalem was 1684 t and 839 t at catch rates of 528.7
kg/unit and 920.6 kg/unit. Yellowfin tuna contributed 42.3% of the tuna catches at Dummulapeta
and 38.6 % of the tuna catches at Bhairavapalem.
Sardine
The length of oil sardine, Sardinella longiceps at Visakhapatnam ranged from 60 mm to 219 mm
with an annual mean of 126.24 mm. The highest mean length of 199.20 mm was recorded in the
month of January and the lowest mean length of 85.01 mm was recorded in October. The annual sex
ratio was 1.04. Males dominated the catch in December while females dominated the catch in May
and July. Juvenile fishes were only caught during August – November. May - July is the peak
breeding season of oil sardine. This is substantiated by the presence of high proportion of spawners
and by high gonadosomatic index (5.92) in these months. Their average fecundity was 31200 with

58
ova diameter varying from 0.38 mm to 0.54 mm. Food component analysis in gut revealed an
abundance of planktonic matter. Empty or trace amounts of food in stomach was encountered in
most fishes. Feeding intensity was highest in January. The length of Sardinella fimbriata ranged
from 55 mm to 199 mm with all juveniles recorded during September – December. There was a
preponderance of males in the catch in all months with annual sex ratio of 0.5.
Mackerel
The length of Indian mackerel, Rastrelliger kanagurta at Visakhapatnam ranged from 110 mm to
269 mm with an annual mean of 189.86 mm. Maximum mean length of 227.69 mm was recorded in
January and minimum mean length of 136.16 mm was recorded in June. Annual sex ratio was 2.38.
Males dominated the catch in January - February and August-September while females dominated
the catch in rest of the months. August appears to be the peak breeding month with all the females in
mature condition and high gonadosomatic index value of 6.85. Their fecundity ranged from 81346
to 270500 with ova diameter varying from 0.28 mm to 1.02 mm. The analysis of food components
revealed an abundance of copepods, decapods, ostracods, Coscinodiscus, Foraminifera along with
minute quantities of cladocerans, fish eggs and larvae, zoea, tintinnids and nematods. Feeding
intensity revealed most of the individuals to have stomachs quarter – half filled. For, Rastrelliger
faughni, the length varied from 190 mm to 279 mm. Females dominated the catches in most months
with sex ratio of 1.75. April appears to be their peak spawning month with high proportion of gravid
females.
Ribbonfish
Trichiurus lepturus was the sole species with size ranging from 380 to 1059 mm and having
mean length of 582.28 mm. There was a preponderance of females in the catch in all months except
December. Mature females were encountered in high numbers in January and again in July –
August. Highest GSI % of 5.46 was observed in August. Fecundity varied from 24636 to 260834
with ova diameter ranging from 0.31 mm to 0.74 mm. The high IRI values of nonpenaeids,
cephalopods, penaeids, clupeids, juveniles of ribbon fishes, scombrids and carangids and other
teleosts and digested fish imply that they were the principal food constituents of Trichiurus lepturus.
More than half of the fishes had their stomachs either empty or had trace amounts of food material
in it. Feeding intensity was highest in December.
Tuna
The length of skipjack tuna, Katsuwonus pelamis at Visakhapatnam ranged from 360 mm to 679

59
mm with an annual mean of 511.7 mm. The highest mean length of 578.4 mm was recorded in the
month of October and the lowest mean length of 475.8 mm was recorded in August. Annual sex
ratio was 1 with male domination in December and female domination in August, September and
November. Mature females were encountered in September and December. Average gonadosomatic
index was 1.15. Feeding intensity was highest in September and lowest in December. The high IRI
values of cephalopod, penaeid prawn, carangid, mackerel, little tuna, sardine and anchovy along
with digested food imply them to be the principal food constituents. The length of yellow fin tuna,
Thunnus albacares at Visakhapatnam ranged from 320 mm to 1659 mm with an annual mean of
681.54 mm. Maximum mean length of 1056.1 mm was recorded in November and minimum mean
length of 471.12 mm was recorded in July. Cephalopods are their preferred prey, followed by
mackerel, crab, squilla, coastal tunas, carangids and other scombrids. For, Euthynnus affinis, the
length ranged from 360 mm to 579 mm with an annual of 443.57 mm.
Seer fish
The length of Scomberomorus guttatus at Visakhapatnam ranged from 200 mm to 379 mm with an
annual mean of 304.22 mm. Significant dominance of females in catch was recorded in all the
months. Feeding intensity was high in November – December and low during October. Mackerel,
sardine, anchovies, nonpenaeid prawns and squid were the principal food components encountered
in their gut. For, Scomberomorus commerson, the length varied between 560 mm to 1459 mm with
annual mean of 862.56 mm. Highest mean length of 966.22 mm was recorded in December and
lowest mean length of 823.75 mm in September.
Barracuda
The length of Sphyraena jello at Visakhapatnam ranged from 180 mm to 599 mm with an annual
mean of 335.31 mm. Annual sex ratio was 0.84. Females dominated the catches in July while males
dominated in rest of the months. Average GSI % was 2.55 with mature females mostly encountered
during June – July. Average fecundity was 270606 with ova diameter ranging from 0.20 – 0.50 mm.
Feeding intensity was higher during January and August – September. The high IRI values of squid,
mackerel, carangid and clupeid along with digested food imply them to be the principal food
constituents. The mean length of Sphyraena obtusata was 238.79 mm with length ranging from 210
mm to 299 mm. There was significant domination by females in the catch. Most females
encountered in catch were in mature state with average gonadosomatic index value of 4.22. Feeding
intensity was very low in most months. Carangids were their preferred prey items.

60
Dolphin fish
The length of Coryphaena hippurus ranged from 460 to 1279 mm with mean of 724.96 mm. Highest
mean length of 790 mm was recorded in August and lowest mean length of 701.5 mm was recorded
in December. Carangids, frigate tuna and sucker fishes were the principal food items encountered in
their gut.
Cobia
The mean length recorded for Rachycentron canadum was 565.67 mm with length varying from 330
mm to 1139 mm. The highest mean length of 594.64 mm was recorded in November and the lowest
mean length of 521.4 mm was recorded in September.
Group Catch (t) in 2013 Catch (t) in 2012 Increase (+) / Decrease (-) %
Clupeids 45839 68108 -32.7
Mackerel 33718 25377 32.9
Ribbon fish 18800 19193 -2.0
Carangids 20691 19732 4.9
Tunas 13243 17945 -26.2
Seer fishes 4961 5824 -14.8
Barracudas 3752 3954 - 5.1
Bill fishes 2999 3590 -16.5
Contribution of demersal resources to total landings of Andhra Pradesh remained the same at 28.5%
and 28.4% during 2012 and 2013 respectively. The major groups that contributed to demersal
landings were perches, pomfrets, sciaenids, elasmobranchs, silverbellies, goatfish and catfish.
Relative abundance of threadfin breams and sciaenids in trawls decreased by 10% and 23%
respectively from 2012 to 2013. The main threadfin bream species landed were Nemipterus
japonicus, N. randalli, N. bipunctatus, N. peronii and N. nematophorus. The major species of
sciaenids were Otolithes ruber, Nibea maculata, Johnius carutta and Pennahia anea.
The relative abundance of flatfish in trawls remained the same at 0.3 kg/hr for the state during 2012
and 2013. The major groups that contributed to flatfish landings were soles, halibut and flounders.
The relative abundance of catfish in trawls increased by 33% from 2012 to 2013. The main species

61
landed were Netuma thalassina and Plicofollis tenuispinis. Studies were made on the variation of
seawater temperature, salinity, dissolved oxygen, hydrogen-ion concentration and nutrients in the
surface-waters of the Visakhapatnam coast. Seawater temperature shows a double oscillation in a year
showing a major peak during summer month at May and a minor peak in September. There was a fall
in water temperature in July and second one in December. The salinity of coastal waters showed
marked seasonal fluctuations, registering low values during the north-east monsoon period and
increasing gradually from Nov - Dec onwards to record the maximum values during the summer
months. The coastal waters are influenced by the southerly and northerly currents alternately. During
the north-east monsoon period, there is an influx of freshwater from local rivers and land runoffs
which bring marked lowering in salinity of the coastal waters. The nutrient salts also showed seasonal
variations. During the north-east monsoon period the concentration of the nutrients went up due to the
discharge of fresh and polluted waters from the rivers and land runoffs. After the cessation of the
north-east monsoon their concentration decreased. The dissolved oxygen content of the coastal waters
also showed some variation. The value was high during the winter months, (when salinity is low) and
north east monsoon period and was low during May to June. The hydrogen-ion concentration showed
similar trends of temperature.
The estimated penaeid prawn catch was 29570 t and it contributed 10.4% to total marine fish
landings in 2012. Mechanized trawlers contributed high (81.7%) with 4.9 kg cph, followed by
driftnets and others operated by in built motorised boats (10.3%) with 27.8 kg cpue, non motorized
gill nets (2.6%) with 19.41kg cpue, and motorized gill nets (2.4%) with 22.82 kg cpue. The estimated
crab catch was 5946 t. Mechanized trawlers contributed maximum (73.9%) with 0.896 kg cph,
followed by motorized gill nets (10.0%) with 0.7 kg cpue, drift nets and others operated by in built
motorised boats (8.3%) with 4.56 kg cpue and non motorised gill nets (5.7%) with 0.65 kg cpue
Penaeid shrimp catch has increased by 12.4% (3202 t). The catch by trawlers has increased by
7.47% due to increase in effort by 1.1% as well as increase in cph by 6.29%. The catch of driftnets
and others operated by in built motorised boats has increased by 580% due to increase in effort by
220% as well as increase in cpue by 112%. The catch of non-motorized gill nets has increased by
75.7% due to increase in in cpue by 36.87%. Despite increase in effort by 117% the catch of
motorized gill nets has decreased by 66.38% due to decrease cpue by 84.5%.
Crab catch has increased by 4.26% (243t). Despite increase in effort by 1.1%, the catch of
mechanized trawlers has decreased by 50% due to decrease in cph by 50.55 %.The catch of motorized

62
gill nets has increased by 116.85% due to increase in effort by 117%. Catch of non motorized gill
nets has increased by 60.09% due to increase in effort by 36.62%.
The catch of small mechanized trawlers was represented by 25 species of penaeid prawns, dominated
by M. monoceros (29.52 %), followed by S. crassicornis (15.41 %), T. curvirostris (8.99%), M.
dobsoni (6.93 %), P. stylifera (5.47%) and P.semisulcatus (3.23%). The catch landed by sona boats
was constituted of 15 genera/ species of penaeid prawns, dominated by M. monoceros (38.44%),
followed by Solenocera spp (13.91 %), Metapenaeiopsis spp (10.89%), M. dobsoni (10.18%) and
Parapenaeopsis spp. The crab catch by trawlers was constituted with commercial crabs (49.38%) and
other crabs (50.62%). The catch of commercial crabs was supported by P. sanguinolentus (83.61%),
P. pelagicus (10.35%) and Charybdis sp (6.02%).
The estimated penaeid prawn catch was 28744 t and it contributed 10.8% with 3 kg cph to total
marine fish landings in 2013. Mechanized trawlers contributed high 83.4% (23966 t) with 4.6 (4.9) kg
cph, followed by other units operated by outboard motorised boats 13.84% (3932t) with 3.53 kg cph,
non motorized gill nets 1.2 % with 0.3 kg (430 t) cph and motorized gill nets 1.13 % (324 t) with 0.23
kg cph, others operated by in built motorised boats 0.2 % with 0.1 kg cph. The estimated crab catch
was 4999 t and it contributed 2 % with 0.5 kg cph. Mechanized trawlers contributed 76% with 0.73kg
cph, followed by other units operated by outboard motorised boats 14.3% with 0.63 kg cph,
motorized gill nets 5.3% (266 t) with 0.2 kg cph and non motorised gill nets 4.5% with 0.14 kg cph.
The catch of small mechanized trawlers was represented by 20 species of penaeid prawns, dominated
by M. monoceros (27.6%), followed by M. barbata (12%), S. crassicornis (11%), Solenocera
melantho (9.4%), M. dobsoni (5.4%), T. curvirostris (4.8%) P. indicus (4.7%) and P. uncta (4.1%).
The catch landed by sona boats was constituted of 12 species of penaeid prawns, dominated by M.
monoceros (29%), followed by S. crassicornis (25%), Metapenaeopsis stridulans (20.3%),
Parapenaeopsis stylifera (10%), P. indicus (4%), P. monodon (3%) and M. dobsoni (3%). The crab
catch by trawlers was constituted with commercial crabs 3321 t (66%) and other crabs 1678 t (34%).
The catch of commercial crabs was supported by P. sanguinolentus (70.5%), P. pelagicus (19.3%)
and Charybdis sp (10%).
The total landing of cephalopods in Andhra Pradesh was estimated at 4222 t, forming 1.4% of the
total fish landings in 2012. Cuttlefish landings were estimated at 2670 t (63.2 %), and squid 1552 t
(36.8 %). The mechanized trawlers (MDSOTN + MDTN + MSOTN +MTN) contributed almost
entirely (99.1 %) to the cephalopod landings. The estimated landing of cephalopods at the

63
Visakhapatnam was 2098.5 t. Cuttlefish landings was estimated at 1646.8 t and squid at 1051.4 t.
During the period Sepia pharaonis, S aculeata and Sepiella inermis (cuttlefish), Loligo duvauceli,
(squids), were observed in the fishery. Octopus was not landed at all. S pharaonis (450.22 t) 21.5 %.
Sepia aculeata landed (476.9 t) 22.73 % and Sepiella inermis (73.5 t) 3.5 %. Among squids Loligo
duvauceli was the only species landed. Maximum landings of cephalopods occurred during July-
August. The total catch of cephalopods in Andhra Pradesh increased by 1414 t (33.5 %) over the
previous year 2011 (2808 t). The cuttlefish landings increased by 934 t (35 %) as against the previous
year (1734 t). The squid landings increased by 478 t as against 1074 t in 2011 by 30.8 %. Juveniles of
Sepia pharaonis occurred throughout the year. 19.6 % of the total landings were juveniles. Maximum
percentage of juveniles occurred during April (45.9 %) and March (32.6 %). Juveniles of S aculeata
occurred throughout the year. 49.7 % of the total landings were juveniles. Maximum percentage of
juveniles occurred during March (75.9 %), February (75 %), April (71.1 %). Juveniles of Loligo
duvauceli occurred throughout the year. 49.9 % of the total landings were juveniles. Maximum
percentage of juveniles occurred during February (64.7%), October (58.7%), December (57.9 %), and
July (57.7 %). Juveniles of Sepia pharaonis occurred throughout the year. 19.6 % of the total
landings were juveniles. Maximum percentage of juveniles occurred during April (45.9 %) and
March (32.6 %). Juveniles of S aculeata occurred throughout the year. 49.7 % of the total landings
were juveniles. Maximum percentage of juveniles occurred during March (75.9 %), February (75 %),
April (71.1 %). Juveniles of Loligo duvauceli occurred throughout the year. 49.9 % of the total
landings were juveniles. Maximum percentage of juveniles occurred during February (64.7%),
October (58.7%), December (57.9 %), and July (57.7 %).
The total landing of cephalopods in Andhra Pradesh in 2013 was estimated at 3325 t, forming 1.25%
of the total fish landings. Cuttlefish landings were estimated at 1970 t (59%), and squid 1355 t
(41%).The estimated landing of cephalopods at the Visakhapatnam was 1407 t. Cuttlefish landings
was estimated at 627 t and squid at 779 t. Maximum landings of cephalopods occurred during July.
The total catch of cephalopods in Andhra Pradesh decreased by 897 t (21%) over the previous year
2012 (4222 t). The cuttlefish landings decreased by 1020t (62%) as against the previous year 2012
(1647 t). The squid landings decreased by 272 t as against 1051t in 2012 by 26 %.The mechanized
trawlers contributed 100 % to the cephalopod landings. During the period Sepia pharaonis, S
aculeata and Sepiella inermis (cuttlefish), Loligo duvauceli, (squids), and other species were
observed in the fishery. Octopus was not landed at all. The S. pharaonis landed (280 t) 45 %, S.

64
aculeata (286t) 45.6 % and Sepiella inermis (33t) 5 %. Among squids, L. duvauceli was the only
species landed. Juveniles of S. pharaonis, S aculeata, L. duvauceli was observed throughout the year.
Juveniles of S. pharaonis were 6.3 % of the total landings. Juveniles of S. aculeata were 41 % of the
total landings. Juveniles of L. duvauceli were 21 % of the total landings.
Pollution and litter in the coastal and marine ecosystem and their impact
Among the three sites monitored, water quality was found to be affected in the sewage outfall area
where carbon dioxide level was high and dissolved oxygen low. Though the environmental
parameters showed seasonal variations, the water quality at sewage outfall site (Lawson’s bay) was in
hypoxic condition.
One significant observation was the low level of dissolved oxygen and moderately high Biological
Oxygen Demand (BOD) in both fishing harbour and Lawsons bay locations. The impact of
urbanization on the near shore regions is evident in the water quality as indicated by the low oxygen
levels. However, high levels of nutrients were also observed in fishing harbour as well as Lawson’s
bay samples compared to Mangamaripeta samples.
Monthly samples of Non biodegradeable wastes dumped along the beaches revealed that the quantity
of NBW were highest in Rushikonda (192.30 g/m2) closely followed by Bhimili (174.74 g/m
2) and
comparatively lower in RK Beach (139.54 g/m2). Bhimili had more Glass wastes (91.67 g/m
2)
whereas Rushikonda had more of Plastics (127.90 g/m2) and RK Beach had more of Glass as well as
Plastics (48.71 g/m2, 44.97 g/m
2) respectively.
A survey on status of marine litter and beach sanitation along north Andhra coast revealed higher
litter accumulation recorded in Visakhapatnam beaches. Probably, the intense use of beaches for
recreation, tourism, and religious activities has increased the potential for litter contamination in the
urban beaches of Visakhapatnam. Visakhapatnam is followed by East Godavari and Srikakulam in
the total amount of litter accumulation. Vizianagaram district recorded comparatively the lowest
among all the districts.
Ecosystem process of critical marine habitats and development of protocols for
restoration
Three sites viz., fishing harbour (Surface and Bottom), Lawsons Bay and Mangamaripeta were
monitored for environmental degradation. They were graded as per USEPA, 2004 as Good, Fair and

65
Poor. These grades are clearly depicting that fishing harbor surface and bottom waters are Fair and
Lawson’s bay samples are poor when compared with the reference site Mangamaripeta which is
having a good grade among the different sites studied. Cluster analysis or Bray-Curtis similarity and
dendogram of water quality parameters of different stations revealed that there is distinct grouping of
stations that apparently reflected differences in the physiochemical parameters of the water samples.
There is high similarity between the fishing harbor samples and Mangamaripeta samples. Lawson’s
bay is distinct from these two stations, confirming the high levels of pollution due to domestic wastes.
However fishing harbor samples may contain some polluted materials but some in-depth study
involving different parameters may reveal in detail.
Many species of coastal birds were identified and photographed from the surveys conducted in these
coastal regions of Visakhapatnam. Terns, Black Terns flock consisting of more than 100 birds were
observed at Munagapakkam. The fishes in the catch corresponding to the tern sighting mainly
comprised of oil sardine. Brown headed gull (Larus brunnicephalus) flock consisiting of more than
200 birds visited bhimili during October – December and they were also observed coinciding with
high catches of oil sardine.
GIS based resource mapping of distribution and abundance of fin fishes and
shellfishes off Indian coast for suggesting operational based strategies for fisheries
management
Mapping of yellowfin tuna fishing grounds accessed by Pudimadaka fishermen was carried out.
Multiday fishing from Visakhapatnam was mainly conducted north of Visakhapatnam up to Chilika
Lake in Odisha at a distance of 317 km from Visakhapatnam. Total catch ranged from 20 kg to 450
kg/haul of the trawler with the trash component ranging from 10% to 70% Catch rate ranged from a
low of 10.6 kg/hr to a high of 126.32 kg/hr. The main species landed were ribbonfish, goatfish, squid,
threadfin bream, lizardfish and penaeid prawns.
The catch rate in single day trawling trips ranged from a low of 1.6 kg/hr to a high of 21.8 kg/hr.
Percentage of discards ranged from 25% to 66.7%. The farthest trip was 12 km away from
Visakhapatnam and shortest was at a distance of 4 km from Visakhapatnam
Trawl samples were collected from trawlers operating from Paradeep in Orissa and Digha in West
Bengal and the data was analyzed with respect to diversity indices, dominance plot, Bray–Curtis
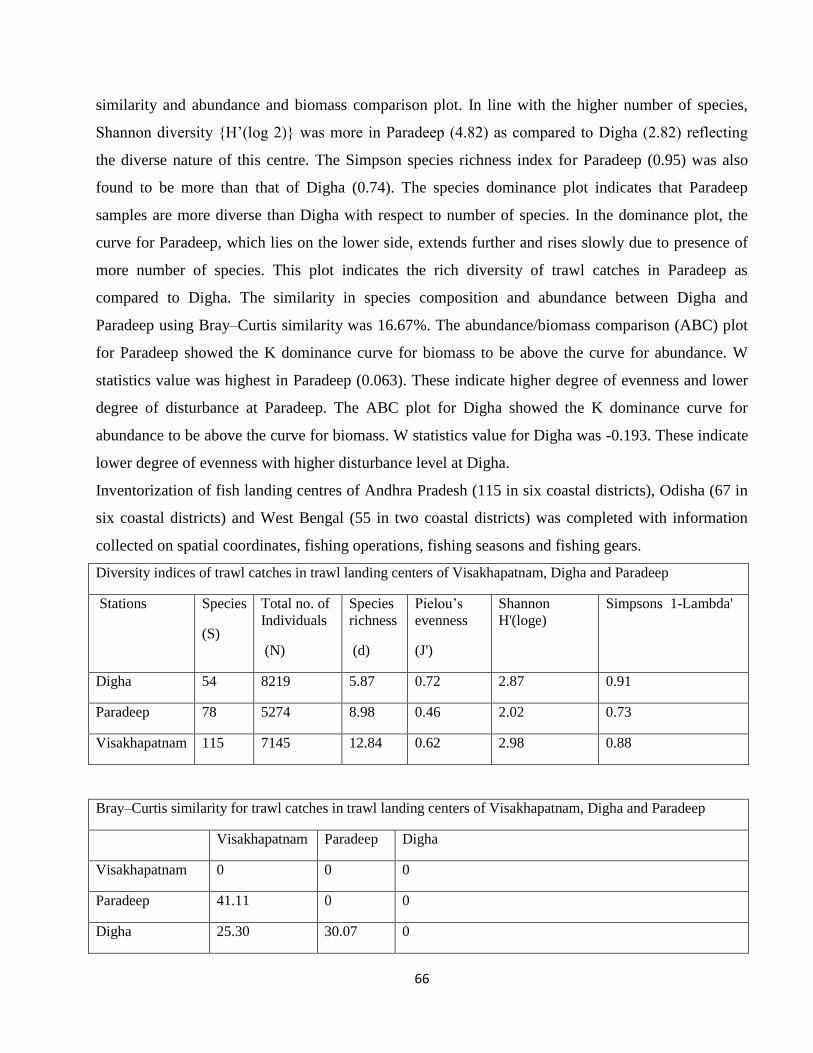
66
similarity and abundance and biomass comparison plot. In line with the higher number of species,
Shannon diversity {H’(log 2)} was more in Paradeep (4.82) as compared to Digha (2.82) reflecting
the diverse nature of this centre. The Simpson species richness index for Paradeep (0.95) was also
found to be more than that of Digha (0.74). The species dominance plot indicates that Paradeep
samples are more diverse than Digha with respect to number of species. In the dominance plot, the
curve for Paradeep, which lies on the lower side, extends further and rises slowly due to presence of
more number of species. This plot indicates the rich diversity of trawl catches in Paradeep as
compared to Digha. The similarity in species composition and abundance between Digha and
Paradeep using Bray–Curtis similarity was 16.67%. The abundance/biomass comparison (ABC) plot
for Paradeep showed the K dominance curve for biomass to be above the curve for abundance. W
statistics value was highest in Paradeep (0.063). These indicate higher degree of evenness and lower
degree of disturbance at Paradeep. The ABC plot for Digha showed the K dominance curve for
abundance to be above the curve for biomass. W statistics value for Digha was -0.193. These indicate
lower degree of evenness with higher disturbance level at Digha.
Inventorization of fish landing centres of Andhra Pradesh (115 in six coastal districts), Odisha (67 in
six coastal districts) and West Bengal (55 in two coastal districts) was completed with information
collected on spatial coordinates, fishing operations, fishing seasons and fishing gears.
Diversity indices of trawl catches in trawl landing centers of Visakhapatnam, Digha and Paradeep
Stations Species
(S)
Total no. of
Individuals
(N)
Species
richness
(d)
Pielou’s
evenness
(J')
Shannon
H'(loge)
Simpsons 1-Lambda'
Digha 54 8219 5.87 0.72 2.87 0.91
Paradeep 78 5274 8.98 0.46 2.02 0.73
Visakhapatnam 115 7145 12.84 0.62 2.98 0.88
Bray–Curtis similarity for trawl catches in trawl landing centers of Visakhapatnam, Digha and Paradeep
Visakhapatnam Paradeep Digha
Visakhapatnam 0 0 0
Paradeep 41.11 0 0
Digha 25.30 30.07 0

67
Bio inventorying and biodiversity valuation of marine organisms in selected
marine ecosystems along the Indian coast
A systematic list of 453 species of marine fauna distributed along Visakhapatnam coast was prepared.
A systematic list of 155 species of elasmobranch distributed along Indian coast was prepared.
One fin fish species was identified and reported as first record along east coast of India and eight fin
fish species were identified as first record along Visakhapatnam coast.
Consolidated list of 555 species of marine fauna were prepared for the valuation purpose which are
distributed along Visakhapatnam coast.
A total of twenty two species which are new to Visakhapatnam and east coast of India were identified
and lists of species were prepared.
Four fin fish species (Roa jayakari, Acanthurus bariene, Stegastes fasciolatus and Tripterodon orbis)
were deposited in national biodiversity repository of CMFRI and accession no. were obtained.
Investigations on vulnerable coral reef ecosystems of Indian waters with special
emphasis on formulation of management measures for conservation
A survey was undertaken along Puri, Paradeep and Gahirmatha for coral associated fauna of Odisha
coast. The abundances of jelly fishes were located along Gahirmatha of Odisha coast. No other coral
associated fauna were located in this area.
Two different soft coral (Pteroeides sp. & Stylatula sp.) were collected from trawl discards from
Visakhapatnam fishing harbour.
Spiny sea urchin and zooanthid were located at Lawson’s bay of Visakhapatnam coast.
Marine ornamental fish samples were collected from fish landing at Visakhapatnam fishing harbor.
The fish samples were identified based on standard references. Altogether ninety one species
belonging 33 families and five orders were identified. Order perciformes contributes more in terms
number of species (85%).
A survey on coral and coral associated fauna were undertaken by Line intercept transect (LIT)
method at Amini and Kadamat Island of Lakshadweep from 30.01.14 to 11.02.14. During survey
different species of hard corals, soft coral, sponges, Echinoderms, mollusks, coelenterates, seaweed,

68
seagrass and marine ornamental fishes were located at specific latitude and longitude from two
Islands.
During survey some specimen of soft corals were taken from intertidal areas from Amini Island. The
collected specimen were preserved in 10% alcohol and brought to the laboratory for further
examination. Some sections of specimens were taken and kept in test tube and sodium hypochlorite
solutions were added to it for digestion of organic matters and separations of spicules. The silicious
spicules were taken for microscopic observations. Different shapes of spicules were observed under
microscopes and photographs were taken for species identifications.
The galloping sea star, Stellaster equestris (Retzius, 1805) was collected from trawl discards from
Visakhapatnam fishing harbour. The abundances of jelly fishes were located along Kakinada and
Visakhapatnam coast of Andhra Pradesh.
Assessment of fishing impacts on biodiversity loss, with special reference to the
threatened species, to formulate management options for their protection
Technical characteristics details of destructive fishing gears mostly trawl were collected and
documented. Bycatch sample from commercial trawler were taken and analysis were carried out to
find the species compositions. Informations regarding the number and quantity of protected species
mostly turtle were collected for evaluation of threatened species.
Altogether 11 different groups were found, of which finfishes are most dominant in terms of biomass
(84%) whereas shrimps in terms of abundances (75%).
Quantification of juveniles of commercially important species was done to estimate the economic loss
due to juvenile fishing by commercial trawler.
Analyses of discard samples were carried out and 130 species were identified from discard samples.
Ninety five species of finfishes, 4 species of gastropods, 1 species of bivalves, 6 species of
cephalopods, 13 species of shrimps, 2 species of stomatopods, 8 species of crabs, 1 species of lobsters
and juveniles of unidentified sharks and rays.
Informations regarding the number and quantity of protected species mostly turtle were collected for
evaluation of threatened species Landings of protected species such as juvenile of tiger shark,
bowmouth guiter fish and turtles (Olive Ridley and green turtle) were observed along Visakhapatnam
coast

69
Genetics, genomics and biotechnological applications in mariculture and fishery
resources management
In this project, DNA bar-coding of grouper was done to resolve the ambiguity in the morphological
based species identification of the fish selected for breeding. For the comparative analysis, a total of
five different individuals were collected, and the details of five individuals are follows: 1. Brood
stock maintained in the cage; 2.Juvenile fish produced in the hatchery and 3. Three different sizes
(Small, medium and large size fish) of fishes collected from the landing centres. Tissue samples of
five individuals were collected and DNA Bar-coding was carried out with cox-1 gene. After DNA
bar-coding, the sequence information was used in BOLD search, and after the analysis the fish
specimens were identified as Epinephelus coides.
Development of strategies to sustain the stock and fishery of large pelagics in Indian
waters
The annual catch of tuna recorded by hooks and lines at Visakhapatnam during 2012 was 2714 t with
the catch rate of 42.3 kg/unit. 43.4% of the hooks and lines catches at Visakhapatnam was contributed
by tunas alone. The dominant species landed in hooks and lines were Thunnus albacares (53%),
Katsuwonus pelamis (31%) and Euthynnus affinis (16%). In gill netters at Visakhapatnam, the annual
catch was 675 t, at a catch rate of 35 kg/unit forming a quarter of the total gill net catches. One third
of the gill net catches was constituted by Thunnus albacares.
The annual catch of tuna by hooks and lines at Pudimadaka was 397 t with a catch rate of 14.2
kg/unit forming 46% of the total hook and line catches. The dominant tuna species was Thunnus
albacares contributing 59% to the total tuna catch.
The annual hook and line catches of tuna at Kakinada (Dummulapeta and Bhairavapalem)
amounted to 3363 t at a catch rate of 126.1 kg/unit. Tunas formed 35.4% of the total hook and line
catches at Kakinada. The major contributor to the tuna fishery at Kakinada was Thunnus albacares
contributing 37.2% to the total tuna catch.
The length of skipjack tuna, Katsuwonus pelamis at Visakhapatnam ranged from 300 mm to
650 mm with an annual mean of 504.7 mm. The highest mean length of 572.2 mm was recorded in
the month of March and the lowest mean length of 443.8 mm was recorded in November. Annual sex
ratio was 1.73 with significant dominance by males in February and March and by females in rest of

70
the months. Only mature females were recorded in February and March indicating it to be the peak
breeding season. The average gonadosomatic index was 1.5 with a maximum of 2.1 recorded in
February. Their fecundity ranged from 61516 to 606966 with ova diameter varying from 0.23 mm to
0.7 mm. The high IRI values of cephalopod, penaeid prawn, frigate tuna, carangids and flying fish
along with digested food imply them to be the principal food constituents.
The length of yellowfin tuna, Thunnus albacares at Visakhapatnam ranged from 330 mm to
1980 mm with an annual mean of 944.5 mm. Maximum mean length of 1411 mm was recorded in
December and minimum mean length of 470.6 mm was recorded in September. Annual sex ratio was
0.61. Males dominated the catch from March – August and from October - December while females
dominated the catch in January, February and September. Mature females were encountered in most
months with peak occurrence during April – August (70.8% - 100%). The gonadosomatic index
varied from 0.5 to 1.9 with an average of 1.1. Their fecundity ranged from 398705 to 11130000 with
ova diameter varying from 0.18 mm to 0.83 mm. Cephalopods are their preferred prey, followed by
mackerel, crab, squilla, balistids, carangids and flying fish.
Growth parameters of pelagic resources landed at Visakhapatnam
Linf k Z M F E Lc Recruitment Peak pulse
Katsuwonus
pelamis
68.2
cm
0.34 1.26 0.69 0.57 0.45 50.58
cm
Bimodal in March –
June and Aug - Oct
Thunnus
albacares
208.9
cm
0.08 0.48 0.2 0.28 0.59 109.8
cm
Unimodal May – Oct
with peak in July
84.4%
Stock Assessment of pelagic resources landed at Visakhapatnam
Stock (t) Biomass (t) Biomass
per recruit
(g)
MSY(t) Annual
average
yield (t)
Yield per
recruit (g)
Katsuwonus pelamis
(hooks and lines)
11800 6709 506.9 4227 3824 288.94
Thunnus albacares
(hooks and lines)
50284 39936 16063.16 9585 11182 4497.68
Index of Relative Importance (%) of food items encountered in the gut of Katsuwonus pelamis
Digested
fish
Loligo Penaeid
prawns
Frigate
tuna
Carangids Decapterus Flying
fish
Others
March 3 97

71
April 26 74
June 74 26
July 95 5
October 70 20 11
November 33 31 34 2
January 99 1
Index of Relative Importance (%) of food items encountered in the gut of Thunnus albacares
Loligo Mackerel Crab Digested
fish
Flying
fish
Squilla Balistid Scad Frigate
tuna
Purple
back
squid
Others
February 53 37 1 4 5
March 74 7 2 17
April 52 48
June 3 2 73 18 4
July 2 26 4 19 45 4
August 16 25 1 15 36 1 6
September 93 6 1
October 81 9 10
November 89 4 2 1 4
December 10 20 17 9 41 3
January 5 1 1 55 18 13 7
Seer fish catch was dominated by Scomberomorus commerson (66.9%) and Scomberomorus guttatus
(33.1%). More than 40 % of the seer fishes were landed by hooks and lines. Tunas were exploited
mainly by gill netters and hooks and lines. Their catch rate in hooks and lines was 49.54 kg/unit.
Among tuna, the dominant species landed were Thunnus albacares (45.5%), followed by Euthynnus
affinis (27.5%), Katsuwonus pelamis (23.2%) and Auxis thazard (3.8%). The landings of billfishes
and barracudas for the year were 0.025 lakh t and 0.04 lakh t, respectively. The catch rate of

72
barracudas in trawlers was 0.55 kg/h. Around two third of the bill fishes were landed by the non
mechanized sector alone.
The seerfish landing by trawlers at Visakhapatnam was 414.85 t with catch rate of 0.15 kg/h.
Scomberomorus guttatus dominated the gillnet landings while the trawl fishery was supported by
both Scomberomorus guttatus and Scomberomorus commerson. The catch in gill nets was 119 t at a
catch rate of 8.38 kg/unit forming 6.3% of the gill net landings. The length of Scomberomorus
guttatus at Visakhapatnam ranged from 280 mm to 479 mm with an annual mean of 369.09 mm.
Significant dominance of females in catch was recorded in all the months. Mackerel, sardine,
anchovies and squid were the principal food components encountered in their gut.
The annual catch of tuna recorded by hooks and lines at Visakhapatnam during 2013 was 611.1 t
with the catch rate of 18.4 kg/unit. 30.94% of the hooks and lines catches at Visakhapatnam was
contributed by tunas alone. The dominant species landed in hooks and lines were Thunnus albacares
(53.4%), Euthynnus affinis (24.56%) and Katsuwonus pelamis (22.03%). The length of skipjack tuna,
Katsuwonus pelamis at Visakhapatnam ranged from 380 mm to 679 mm with an annual mean of
519.5 mm. The highest mean length of 600.16 mm was recorded in the month of October and the
lowest mean length of 489.2 mm was recorded in March. Annual sex ratio was 1.35 with significant
dominance by males in September and by females in February – March and November - December.
More than 80% of the females were mature in March indicating it to be the peak breeding season.
Average gonadosomatic index was 1.47. Their fecundity ranged from 205947 to 1758204 with ova
diameter varying from 0.18 mm to 0.7 mm. The high IRI values of cephalopod, penaeid prawn,
carangids, sardines and anchovies along with digested food imply them to be the principal food
constituents. The length of yellow fin tuna, Thunnus albacares at Visakhapatnam ranged from 120
mm to 1719 mm with an annual mean of 783.05 mm. Maximum mean length of 1182.4 mm was
recorded in April and minimum mean length of 434.62 mm was recorded in December. Annual sex
ratio was 2.82. Males dominated the catch in January and October while females dominated the catch
in January, September and December. High percentage (83.33%) of mature females was observed in
October. Their fecundity ranged from 2306062 to 3815101 with ova diameter varying from 0.2 mm
to 0.56 mm. Cephalopods are their preferred prey, followed by mackerel, crab, squilla, coastal tunas,
carangids and other scombrids.
The length of Sphyraena jello at Visakhapatnam ranged from 280 mm to 679 mm with an annual
mean of 408.88 mm. Annual sex ratio was 1.33. The high IRI values of mackerel, carangids and

73
whiting along with digested food imply them to be the principal food constituents. The mean length
of Sphyraena obtusata was 265.5 mm. There was significant domination by females in the catch.
Most females encountered in catch were in mature state with average gonadosomatic index value of
3.37. Their fecundity varied from 45838 to 105964 with ova diameter ranging from 0.35 mm to
0.48 mm. Carangids were their preferred prey items.
The length of Coryphaena hippurus ranged from 260 to 1099 mm with mean of 690.83 mm.
Fecundity ranged from 329540 to 1357007 with ova diameter varying from 0.68 mm to 1.27 mm.
Carangids, frigate tuna and sucker fishes were the principal food items encountered in their gut.
The mean length recorded for Euthynnus affinis, Rachycentron canadum, Istiophorus platypterus,
Makaira indica and Xyphius gladius were 382 mm, 499.17 mm, 1983.33 mm, 1850 mm and 1266
mm, respectively at Visakhapatnam.
Development of regional Fishery Management Plans (FMPs) for the clam
fisheries of Southern India
The bivalve fishery of the Bhimili estuary: The total bivalve production exploited from this estuary
was estimated at 49.2 t in 2012. The total effort was 1167 units. The average catch per unit effort
was 38.6 Kg. The average monthly catch was 4.1 t and average effort 97.3 units. Three species of
clams (Meretrix meretrix, M casta, Anadara sp) and the oyster Crassostrea madrasensis are exploited
from this estuary. Meretrix casta landed 6.59 t, M meretrix landed 2.8 t, Anadara sp 0.22 t and
Crassostrea madrasensis landed 39.6 t.
The bivalve fishery declined significantly compared to previous year 2011 (88.7 t). The total bivalve
catch declined by 44.5 % (39.46 t). The effort also declined by 668 units (36.4 %). The catch per unit
effort declined during this year at 38.6 Kg as against 48.3 Kg in 2011. The catch of Meretrix casta
declined by 56.1 %, M meretrix by 79.8 %, Anadara sp. by 74.1 %. Landings of C madrasensis also
decreased by 32.8 % from 58.93 t in 2011.
The bivalve fishery of the Kakinada Bay: The bivalve fishery of Kakinada Bay of Andhra Pradesh
was monitored from two major landing centres, viz; Chollangi and Peddavalsala during the year. The
estimated total bivalves landed from Kakinada Bay were 914.1 t, with an average monthly landing of
47 t. The total effort was 5565 units and the average catch per unit affort was 99.5 Kg. The species
landed were Anadara sp. (250.6 t), M meretrix (120.3 t), Paphia malabarica (28.9 t), Katelysia opima
(20.8 t), Meretrix casta (3.1 t), t. Geloina sp. (0.75 t), and others (26.1 t). The total clam production

74
was 424.4 t. Oysters landed were Windowpane oyster, Placuna placuna (447.4 t), edible oyster
Crassostrea madrasensis (42.2 t) and other oysters (14.5 t.) The total oyster production was 504.1 t.
The price of the bivalves ranged from Rs. 8 to 12 per Kg.
The clam production in Kakinada bay increased by 22.6 t (5.6%) in 2012 compared to the previous
year. The landings of M meretrix increased by 47.5 t (39.5%), P malabarica by 14.9 t (51.6%), K
opima 16.3 t (78.4%). However, the landings of Anadara sp declined by 26.1 t (9.4%), M casta by
21.6 t (87.5 %), Geloina sp by 8.5 t (91.9 %).
Evaluation of ornamental gastropod fisheries in India and assessment of shell
craft industry
Gastropod fishery of the Kakinada Bay: The estimated total gastropod landing from Kakinada Bay
during 2012 was estimated at 216.9 t with average monthly landings of 18.1 t. The total effort was
5565 units and the average catch per unit effort was 37.9 Kg. The species landed were Cerithidium
sp. (99.5 t), Telescopium sp (26.3 t), Thais sp. (15.2 t), Murex sp (20.8 t) Hemifusus sp (20.7 t),
Umbonium sp (14.24 t), and other gastropods (20.2 t). Maximum landings were during March and
August- October. The price of gastropods ranged from Rs. 6 to 12 per Kg.
The total gastropod landings declined by 96 t (31 %) as against the previous year. The effort declined
by 555 (10%); however the catch per unit effort increased by 10.2 Kg (21%). The landings of
Cerethidium sp registered an increase of 141.4 t (58.7 %); all other species recorded a decline in
landings viz., Umbonium sp 11.1 t (78.2 %), Hemifusus sp 10.9 t (52.7%), Murex sp 10.5 t (50.5%),
Telescopium sp 3.3 t (12.5%) and Thais sp. 1.3 t (8.6%).
Sustainable molluscan mariculture practices
Green Mussel (Perna viridis) Spat production: Brood stock of green mussels was collected from the
Kakinada fishing harbor. Spawning of the green mussel P viridis occurred on 11 September 2012
(10th
successful spawning in the Mariculture hatchery of Visakhapatnam Regional Centre of Central
Marine Fisheries Research Institute). 10.3 million larvae were reared and over 2.5 lakh spat were
settled after 21 days. The spat were reared and further used for nursery rearing experiment.
Nursery rearing: An upwelling system was set up for rearing the green mussel spat to develop a
nursery technique for faster growth of spat to the seeding size for further farming in the estuaries and
sea. The spat of initial average shell length of 6.8 mm and average weight of 0.04 g were stocked in

75
the PVC tubes set in the upwelling tank, provided with continuous aeration and feed (Isochrysis
galbana and Chaetoceros calcitrans). The spat attained an average shell length of 12.15 mm,
average width of 6.8 mm and average weight of 0.34 g in 50 days. Preliminary results indicate faster
growth in the upwelling system compared to growth in tanks. This will shorten the nursery rearing
phase and produce seed for stocking in the farm in a much shorter period. The experiment is in
progress.
Spawning and production of hatchlings of Hemifusus pugilinus: The sea snail, Hemifusus pugilinus
collected from the Kakinada Bay of Andhra Pradesh spawned in the Mariculture hatchery of
Visakhapatnam Regional Centre of Central Marine Fisheries Research Institute. Female of 80.13 mm
shell height, 41.39 mm shell width and total weight 53.04.g, laid a string of 40 egg capsules on 16
October 2012. The capsules were held together by a common holdfast. Development was inside the
capsule and the hatchlings were released from the capsules on the 28th
to 30th
day of incubation. A
total number of 3000 hatchlings hatched out from 40 capsules. The hatchlings were fed bivalves such
as Perna viridis, Meretrix casta and also meat paste of squids and attained a size of 6-8 mm in 35
days. Hatchlings of Hemifusus sp. have been produced in the hatchery for the first time and given
their fast growth under captive conditions; it is a suitable candidate for mariculture. Hatchery
produced hatchlings can be sea ranched for wild stock replenishment since they are highly targeted
for their ornamental shells and operculum which is used in Unani medicine.
Sponsored Projects
Strengthening of database and GIS for the Fisheries Sector-Marine Fisheries
Census-2010
All India Marine Fisheries Census 2010 was conducted by Visakhapatnam Regional centre in three
Maritime states of India namely Andhra Pradesh, Orissa and West Bengal where 27 supervisors
and 743 enumerators were involved in census of approximately 4,54,200 households belonging to
2,313 villages. During second phase, in two districts of West Bengal, census was conducted for
about 50,000 households involving 106 enumerators and 3 supervisors.
Open Sea floating cage demonstration farm for R&D in marine finfish & shellfish
production

76
Open sea floating cage culture demonstration project, sponsored by the National Fisheries
Development Board, was operated by the Central Marine Fisheries Research Institute at Balasore,
Orissa. The project started in February and harvest was carried out in November 2009. The HDPE
open sea circular floating cage (net dimensions; 6 m dia and 6 m height) was stocked with 4,500
fingerlings of sea bass, Lates calcarifer (44.68 g. mean average wt.). Stocked population was fed with
trash fish available from the local landing centres at an appropriate feeding rate (7.0-15.0 % of
biomass). The harvest was done in November, 2009, after 8 months of culture period, in the presence
of Dr. S. Ayyappan, DDG (Fy.), ICAR, Dr. G. Syda Rao, Director, CMFRI, Dr. C. Vasudevappa,
Chief Executive, NFDB, Dr. Anil Kumar, TIFAC, DST, New Delhi, Prof. C. K. Mukherjee and Prof.
P. Srinivas Rao, IIT, Kharagpur, Dr. B. Dandapat, ADF (Marine) Balasore, Orissa and other
extension officials from Orissa State Fisheries Department. About 3.1 t of fish was harvested (Wt.
range 0.55- 1.1 kg). Around 5000 nos. of sea bass fingerlings which were reared in the seed cages (2
m dia and 4.5 m deep) for a culture period of 3 months were also handed over to the Fishermen
society by the DDG (Fy.), ICAR and the Chief Executive NFDB for the next crop.
Cage was installed in Bay of Bengal (N 18o 52’ 284” E 84
o 36’ 156”) off Baruva-Kothuru,
Srikakulam, Andhra Pradesh. Lates calcarifer (Seabass) fry, procured from CIBA, Chennai were
reared upto fingerling size (30.83 g) with 60 % survival and stocked in cage.
Cage culture of Asian seabass was demonstrated to the Marine Fishermen Co-operative Society,
Baruva-Kothuru. Demonstration of open sea cage culture of Sea bass to the Burma repatriates Marine
fishermen multipurpose co- operative society Ltd., Uppada, Andhra Pradesh was conducted. After
7.5 months culture harvest was done with 53.0% survival. Total harvested production was 1.3 t. Size
range was from 0.25 -1.45 kg.
An experiment to find out the suitability of Tiger shrimp (Penaeus monodon) culture in open sea cage
was carried out. A good yield with survival of 31.0 % and FCR of 4.26 in 99 days period was
achieved.
An experiment to develop proper nursery rearing system for Asian seabass, Lates calcarifer in open
sea floating cage was carried out. Around 10,000 no. of sea bass fingerlings (55 ± 0.46 mm) were
stocked in two hapa (5000 no. in each) fixed in the cage. Mixed feeding was followed with live
Artemia, shrimp feed, Artemia flakes and Acetes during different stages of nursery rearing. Stocked
fishes attained 198 ± 32.02 mm with survival of 81% after 145 days.

77
National Initiative on Climate Resilient Agriculture (NICRA)
Modeled the effect of climatic and oceanographic parameters on oil sardine, Indian mackerel and
silver pomfrets catch rates in gillnets of Andhra Pradesh. Survey of fishermen revealed that they
believed in climate change. Wind was the parameter that had changed the most in the last two
decades. Sea status was ranked as the most problematic to fishermen. Avenue for safe exit from
villages in case of natural calamities was the highest scoring adaptation measure. Wind was the most
critical parameter affecting the marine fishery and overfishing was the biggest problem facing
fisheries. Mapping of PFZ areas along north coastal Andhra Pradesh was carried out and two areas of
consistent high PFZ hits were identified. Phytoplankton (Nannochloropsis oculata) was cultured at
temperature range of 28 to 32 0C with the temperature difference of 1
oC for 7 days and a significantly
higher growth and multiplication of phytoplankton was found in the culture which was maintained at
29oC. Experiments on influence of environmental parameters for production of small rotifers for
feeding fish larvae were carried out. Digitising of old data on water quality parameters is under
progress. This data may be used for correlating with the fishery data. Rainfall, wind velocity and
wind direction data were collected from IMD, Chennai through Cyclone warning centre in
Visakhapatnam. Data collection on real time water parameters from ICOADS and SeaWIFFS were
done and collected data will be used for further analysis with fishery data. Correlation between
quarter wise data of catch and water analysis revealed that there is a direct relationship between
temperature and fish catch of oilsardine while DO was having an inverse relationship with fish catch.
Skip jack is also having inverse relationship with temperature and fish catch.
Climate change
Features of the ocean environment off the north-east coast of India (Andhra Pradesh, Orissa and West
Bengal)
Clear evidence of warming of the ocean off Andhra Pradesh and Orissa as seen from SST anomaly
plots for SST data from 1960-2010. (Source of SST data: ICOADS)
Evidence of warming of the ocean off West Bengal is seen though intensity is less, possibly, a
consequence of the influx of freshwater from the Ganges-Brahmaputra river systems.
Weak linear association of SST anomalies for the region with El Nino or La Nina for data from 1960-
2010.

78
SST plots show a 0.87 OC (from 28.14
OC to 29.01
OC) rise in temperature for Andhra Pradesh, 0.78
OC (from 27.6
OC to 28.37
OC) for Orissa and 1.7
OC (from 27.34
OC to 29.04
OC) for West Bengal
from 1960-2010.
Positive linear association of average decadal SST for the region with the decadal average intensity of
the Indian Ocean Dipole (IOD) was observed for data from 1960-2010. The IOD was measured as
Dipole Mode Index (DMI), wherein positive DMI reflected a positive IOD year (Source of DMI data:
www.jamstec.go.jp).
Positive linear association was detected between DMI and Chlorophyll-a for the region from 1997-
2010. Correlation coefficient was 0.42 for Andhra Pradesh, 0.43 for Orissa and 0.30 for West Bengal.
Peak chlorophyll-a values were recorded from July-September for Andhra Pradesh, July-November
for Orissa and August-December for West Bengal during 1997-2010.
Average annual chlorophyll-a values were the highest for West Bengal with an average value of 4.04
mg/m3, followed by Orissa with 1.27 mg/m
3 and Andhra Pradesh with 0.47 mg/m
3.
Positive linear association (correlation coefficient of 0.52) was detected between SST and
Chlorophyll-a values for Andhra Pradesh during 1997-2010.
North to South meridional winds dominated during the last quarter (October-December) over Andhra
Pradesh coast (Source of wind data: ICOADS). Published literature reported that the winds change
direction in September every year.
Positive linear association between quarterly wind intensity and direction with Chlorophyll-values for
Andhra Pradesh was observed for second half of the year during 1998-2010. The correlation
coefficients for wind and Chlorophyll-a values for the third quarter from 1998-2010 was 0.32 and for
the fourth quarter was 0.30.
Increased incidence of cyclones during the last decade.
http://disastermanagement.ap.gov.in/website/history.htm.
The Indian Ocean Dipole (IOD) is a coupled ocean-atmosphere phenomenon in the Indian Ocean. It
is normally characterized by anomalous cooling of SST in the south eastern equatorial Indian Ocean
(00 – 10
0S and 90
0E – 110
0E) and anomalous warming of SST in the western equatorial Indian Ocean
(100N – 10
0S & 50
0E -70
0E). Several authors have identified the influence of the Indian Ocean
Dipole (IOD) on the interannual variability of the Indian summer monsoon rainfall (ISMR). The IOD
and the ENSO have complementarily affected the ISMR during the last four decades. Whenever the
ENSO-ISMR correlation is low (high), the IOD-ISMR correlation is high (low). The IOD plays an

79
important role as a modulator of the Indian monsoon rainfall and influences the correlation between
the ISMR and ENSO.
R² = 0.0777
-2
-1.5
-1
-0.5
0
0.5
1
1.5
2
2.5
19
60
19
62
19
64
19
66
19
68
19
70
19
72
19
74
19
76
19
78
19
80
19
82
19
84
19
86
19
88
19
90
19
92
19
94
19
96
19
98
20
00
20
02
20
04
20
06
20
08
20
10
SST Anomalies of North East Region of Bay of Bengal
Avg SST 28.23
23
24
25
26
27
28
29
30
31
32
19
60
19
62
19
64
19
66
19
68
19
70
19
72
19
74
19
76
19
78
19
80
19
82
19
84
19
86
19
88
19
90
19
92
19
94
19
96
19
98
20
00
20
02
20
04
20
06
20
08
20
10
0 C
Annual SST of West Bengal, Orissa & Andhra Pradesh during 1960 - 2010 (ICOADS)
WB ORISSA AP

80
-2
-1.5
-1
-0.5
0
0.5
1
1.5
2
19
60
19
62
19
64
19
66
19
68
19
70
19
72
19
74
19
76
19
78
19
80
19
82
19
84
19
86
19
88
19
90
19
92
19
94
19
96
19
98
20
00
20
02
20
04
20
06
20
08
20
10
Trend of Andhra Pradesh SST Anomalies & Dipole Mode Index of Indian Ocean during 1960-2010
AP_anomaly
DMI
R² = 0.1552
-1
-0.8
-0.6
-0.4
-0.2
0
0.2
0.4
0.6
0.8
19
60
19
65
19
70
19
75
19
80
19
85
19
90
19
95
20
00
20
05
20
10
SST Anomalies of Andhra Pradesh during 1960 - 2010 (ICOADS) indicating El Nino & La Nina Years
Red colour indicates El Nino Years Yellow colour indicates La Nina Years Green Colour indicates Normal Years AVG SST=28.38

81
R² = 0.1165
-3
-2.5
-2
-1.5
-1
-0.5
0
0.5
1
1.5
2
2.5
19
60
19
65
19
70
19
75
19
80
19
85
19
90
19
95
20
00
20
05
20
10
SST Anomalies of Orissa during 1960 - 2010 (ICOADS) indicating El Nino & La Nina Years
Red colour indicates El Nino Years Yellow colour indicates La Nina Years Green Colour indicates Normal Years AVG SST= 28.33
R² = 0.0145
-6
-5
-4
-3
-2
-1
0
1
2
3
4
5
19
60
19
65
19
70
19
75
19
80
19
85
19
90
19
95
20
00
20
05
20
10
SST Anomalies of West Bengal during 1960 - 2010 (ICOADS) indicating El Nino & La Nina Years
Red colour indicates El Nino Years Yellow colour indicates La Nina Years Green Colour indicates Normal Years Avg SST=27.97

82
0
0.1
0.2
0.3
0.4
0.5
0.6
0.7
0.8
Jan Feb Mar Apr May Jun Jul Aug Sep Oct Nov Dec
Ch
l-a
[mg/
m**
3]
Mean Monthly Chlorophyll-a Values of Andhra Pradesh during 1997-2010 (SeaWifs)
0
0.5
1
1.5
2
Jan Feb Mar Apr May Jun Jul Aug Sep Oct Nov Dec
Ch
l-a
[mg/
m**
3]
Mean Monthly Chlorophyll-a Values of Orissa during 1997-2010 (SeaWifs)
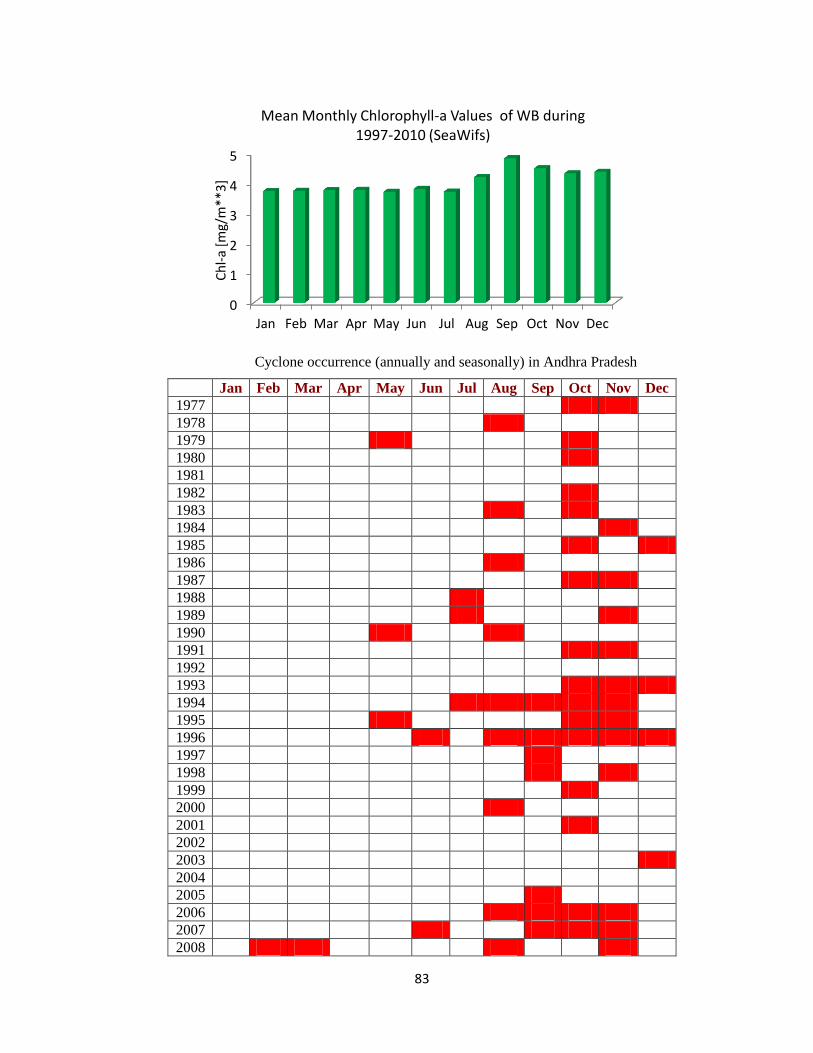
83
Cyclone occurrence (annually and seasonally) in Andhra Pradesh
Jan Feb Mar Apr May Jun Jul Aug Sep Oct Nov Dec
1977
1978
1979
1980
1981
1982
1983
1984
1985
1986
1987
1988
1989
1990
1991
1992
1993
1994
1995
1996
1997
1998
1999
2000
2001
2002
2003
2004
2005
2006
2007
2008
0
1
2
3
4
5
Jan Feb Mar Apr May Jun Jul Aug Sep Oct Nov Dec
Ch
l-a
[mg/
m**
3]
Mean Monthly Chlorophyll-a Values of WB during 1997-2010 (SeaWifs)

84
2009
2010
Impact of climate change on marine fish catch
Both SST and marine fish landings for the region showed an increasing trend during 1985-2010.
Negative linear association was recorded between rainfall rates and fish landings for Orissa & Andhra
Pradesh.
Negative linear association was observed between Particulate Inorganic Carbon and fish landings of
West Bengal.
Positive linear association was observed between Coloured Dissolved Organic Material and fish
landings of Orissa and between Particulate Organic Carbon and fish landings of Andhra Pradesh.
Positive linear association was recorded between Chlorophyll-a levels and pelagic fish landings for
Andhra Pradesh. Both sardine landings and Chlorophyll-a values peaked in the third quarter.
Mackerel landings peaked during the first quarter of the year.
Highest mean landings of yellowfin tuna in the fourth quarter was observed when wind direction was
from north to south. The north to south winds during October - January is favorable for tuna fishery
with tuna moving along with wind and current from offshore deeper waters to near shore shallower
waters.
Impact of climate change on fish catch rates
Negative association between water temperature at 30 m and threadfin bream catch rates possibly as a
result of vertical migration of fish.
Increased catch rates and contribution in trawler landings by small pelagic fish viz., sardine and
mackerel and decreased catch rates and contribution to gillnet landings possibly indicating a vertical
migration of the resource with increasing SST.

85
24
25
26
27
28
29
30
31
0
0.5
1
1.5
2
2.5
3
Jan
Feb
Mar
Ap
r
Jun
Jul
Au
g
Sep
Oct
No
v
De
c
Jan
Feb
Mar
Ap
r
Jun
Jul
Au
g
Sep
Oct
No
v
De
c
Tem
per
atu
re 0
C
CP
H
Nemipterid Catch Rate in trawls vs Temperature (30 m depth) (INCOIS) of Andhra Pradesh during 2009 - 2010
CPH Temperature
R² = 0.4311
27.6
27.8
28
28.2
28.4
28.6
28.8
29
29.2
0
5
10
15
20
25
30
35
40
45
20
01
20
02
20
03
20
04
20
05
20
06
20
07
20
08
20
09
20
10
0 C
Per
cen
tage
Oil sardine & Mackerel contribution in Gill net Vs SST (ICOADS) of Andhra Pradesh
% of oil Sardine in gill net % of Mackerel in gill net SST
27.2 27.4 27.6 27.8 28 28.2 28.4 28.6 28.8 29 29.2
0
5
10
15
20
25
19
95
19
96
19
97
19
98
19
99
20
00
20
01
20
02
20
03
20
04
20
05
20
06
20
07
20
08
20
09
20
10
0C
Cat
ch r
ate
Kg/
Un
it
Catch rate of Oil Sardine & Mackerel in Gill nets Vs SST (ICOADS) of Andhra Pradesh
Mackerel
Sardine

86
Impact of climate change on reproductive biology of fishes
27.2 27.4 27.6 27.8 28 28.2 28.4 28.6 28.8 29 29.2
0
0.5
1
1.5
2
2.5
3 1
99
5
19
96
19
97
19
98
19
99
20
00
20
01
20
02
20
03
20
04
20
05
20
06
20
07
20
08
20
09
20
10
0 C
Cat
ch r
ate
Kg/
hr
Catch rate of Oil Sardine, Mackerel & Threadfin breams in Trawl net Vs SST (ICOADS) Of Andhra Pradesh
Mackerel Sardine
R² = 0.1547 R² = 0.7156
27.2 27.4 27.6 27.8 28 28.2 28.4 28.6 28.8 29 29.2
0 5
10 15 20 25 30 35 40 45 50
19
85
19
87
19
89
19
91
19
93
19
95
19
97
19
99
20
01
20
03
20
05
20
07
20
09
0 C
Per
cen
tage
Oil sardine & Mackerel contribution in trawl net Vs SST (ICOADS) of Andhra Pradesh Sardine % in trawl net Mackerel % in trawl net
SST Linear (Sardine % in trawl net)
Linear (Mackerel % in trawl net)

87
Seasonality of spawners of threadfin breams of Andhra Pradesh during 1990 – 1999 (Rajkumar et. al.,
2003)
R² = 0.4848
24.0
25.0
26.0
27.0
28.0
29.0
30.0
0
10
20
30
40
50
60
Jan Feb Mar Apr Jun Jul Aug Sep Oct Nov Dec
0 C
Per
cen
tage
of
Spaw
ner
s Seasonality of spawners of threadfin breams Vs SST of Andhra pradesh
during 2002 - 2010
% Of Spawners

88
Resourcewise fishery, reproductive biology and trophodynamics
Salient findings from three states which can be related to environmental parameters
Length
Mean length for most of the species with the exception of yellowfin tuna and tiger shrimp were lower
at Visakhapatnam and higher at Digha and Paradeep.
Mean length for oil sardine and white shrimp was highest at Digha during October – January.
Mean length for oil sardine was lowest at Visakhapatnam during October – January.
0
5
10
15
20
25
Jan Feb Mar Apr Jun Jul Aug Sep Oct Nov Dec
Average monthly contribution of spawners to the average annual spawning population of mackerel during 2001 - 2005 & 2006 - 2010
% of spawners to the total annual spawning population
2006-2010 Average Temp (deg C): 28.58
2001-2005 Average Temp (deg C): 28.61
26
26.2
26.4
26.6
26.8
27
27.2
170
175
180
185
190
195
200
205
210
2003 2004 2005 2006 2007 2008 2009 2010
Length at first maturity of mackerel for Andhra Pradesh Length at first maturity Temperature (deg C)
Len
gth
at
firs
t m
atu
rity
(m
m)
Tem
p (d
eg C
)
r = -0.61
89
Mean length for mackerel at Paradeep and Visakhapatnam was higher during the premonsoon
months.
Mean length for Liza macrolepis and Nemipterus japonicus was lower at Digha during the warmer
months.
Mean length at Visakhapatnam for yellowfin tuna, tiger shrimp and white shrimp was higher during
October – March, December – April and January – April, respectively.
Reproductive biology
Preponderance of females in the catch of oil sardine at Paradeep and Digha from September –
December. Peak breeding season of oil sardine at Digha was from April – July and at Visakhapatnam
from May – September.
Dominance of males in the catch of mackerel for all the three states. Prolonged peak breeding season
of mackerel at Visakhapatnam was from February – October and at Digha was from June –
November.
Abundance of females in the catch of Liza macrolepis at Visakhapatnam and Digha from March –
September. Breeding season for Liza macrolepis was throughout the year at Visakhapatnam but from
August - December at Paradeep and from October – January at Digha.
Significant dominance of females in the catch of Nemipterus japonicus and Loligo duvaucelli at
Visakhapatnam and Digha. Mature females of Nemipterus japonicus and Loligo duvaucelli were
observed throughout the year at Visakhapatnam in high numbers but only during monsoon in low
numbers at Digha.
Domination by females in the catch of skipjack tuna and by males in the catch of yellowfin tuna at
Visakhapatnam. Peak breeding season at Visakhapatnam for skipjack tuna was in February and
March and for yellowfin tuna from April – August.
Significant dominance by males of tiger shrimp at Visakhapatnam and Paradeep was during January
– June and by females of tiger shrimp at Digha and Paradeep was during July - December. Peak
breeding season of tiger shrimp at Visakhapatnam was from March – June and at Digha from June -
July.
Significant domination by females of white shrimp at Visakhapatnam was during January – July and
at Digha was throughout the year except December. Peak breeding season for white shrimp at
Visakhapatnam was from February – June and at Digha from March - August.
Trophodynamics

90
Fishes with considerable amount of food in stomach was higher at Visakhapatnam than that of
Paradeep and Digha for oil sardine, mackerel, Liza macrolepis, tiger shrimp, white shrimp and tuna.
No empty or trace amount of food in stomachs were observed in tiger shrimp at Visakhapatnam
during April – June.
The incidence of squids with empty or trace amount of food in stomachs was very high in all the three
states.
Indigenous Traditional Knowledge
Andhra Pradesh: Traditional sector (Number of respondents: 122):
Name of the ITKs’ (title) and description of the ITK with respect to the parameter of climate change
with which it is linked:
a) Diverse catch of small pelagics with decreasing salinity/increasing rainfall
b) Wind blowing from north-east direction favors tuna catch
c) Change in water color coupled with decreasing transparency caused by upwelling results in more
catch of small and large pelagics
d) Unidirectional flow of surface currents and wind leads to good pelagic catch
Table: Climate change parameters ranked as 1st, 2
nd, 3
rd and 4
th by majority of respondents in
the traditional sector.
Parameter/Rank Temperature (%) Sea Level rise
(%)
Wind
Direction/Speed
(%)
Rainfall (%) Others (%)
1st 37.7 0.8 39.3 22.1 0.1
2nd
18.9 3.3 44.3 32 1.5
3rd
33.6 11.5 13.9 36.1 4.9
4th 9 57.4 2.5 9.8 21.3
Motorised sector (Number of respondents: 86):
Name of the ITKs’ (title) and description of the ITK with respect to the parameter of climate change
with which it is linked:
a) Decreasing temperature, moderate sea state and north-east wind favors tuna catch in the months
from October - February

91
b) Change in water color coupled with decreasing transparency caused by upwelling results in more
catch of small and large pelagics
c) Unidirectional flow of surface currents and wind leads to good pelagic catch
Table: Climate change parameters ranked as 1st, 2
nd, 3
rd and 4
th by majority of respondents in
the motorised sector.
Parameter/Rank Temperature
(%)
Sea Level rise
(%)
Wind Direction/Speed
(%)
Rainfall (%) Others
(%)
1st 23.3 2.3 47.7 26.7
2nd
31.4 7 32.6 29.1
3rd
32.6 18.6 15.1 30.2 3.5
4th 11.6 59.3 4.7 12.8 11.6
Mechanised sector (Number of respondents: 93):
Name of the ITKs’ (title) and description of the ITK with respect to the parameter of climate change
with which it is linked:
a) Increase in catch of crustacean and cephalopod resources with increase in temperature
b) Qualitative and quantitative increase in catch of demersal resources with increasing
rainfall/decreasing salinity
c) Inadvertent intrusion of jelly fishes into the coastal waters during summer months resulting in
reduced catch rates of commercially important marine fin and shell fishes
d) High current flow in postmonsoon months reduces the operational efficiency of trawlnets
Table: Climate change parameters ranked as 1st, 2
nd, 3
rd and 4
th by majority of respondents in the
mechanised sector.
Parameter/Rank Temperature
(%)
Sea Level rise
(%)
Wind Direction/Speed
(%)
Rainfall (%) Others
(%)

92
1st 28 43 25.8 3.2
2nd
33.3 6.5 45.2 15.1
3rd
35.5 2.2 10.8 49.5 2
4th 3.2 53.8 1.1 7.5 34.4
0.0
50.0
100.0
1st Rank
2nd Rank
3rd Rank
4th Rank
5th Rank
Pe
rcen
tage
Perception of fishermen -Rank based on Change of climate variables in Andhra Pradesh
Current/Others
Rainfall
Wind
Sea Level Rise
Temperature
0.00
50.00
100.00
150.00
1st Rank
2nd Rank
3rd Rank
4th Rank
5th Rank
Pe
rce
nta
ge
Perception of fishermen -Rank based on impact of climate variables to the fishery of Andhra Pradesh
Chlorophyll
Current/Others
Temperature
Rainfall
wind

93
0%
20%
40%
60%
80%
100%
1st Rank
2nd Rank
3rd Rank
4th Rank
5th Rank
Pe
rcen
tage
Ranks based on Problems faced by fishermen in the last 20 years in Andhra Pradesh
others
Salinisation of ground water
sea status
cyclone
erosion
0%
20%
40%
60%
80%
100%
1st Rank
2nd Rank
3rd Rank
4th Rank
5th Rank
Pe
rce
nta
ge
Ranks based on Problems faced in fisheries sector of Andhra Pradesh
Others
Climate change
Habitat Destruction
Juvenile Exploitation
Overfishing
0%
20%
40%
60%
80%
100%
1st Rank
2nd Rank
3rd Rank
4th Rank
5th Rank
Pe
rcen
tage
Ranks given on Adaptation options suggestions by the fishermen
Others
Rehabiliation
Common Shelter
Coastal Protection structures
Safe exit

94
7.6% of the respondents are prepared to take weather related insurance without external support.
98% of the respondents read or watch newspapers, radio, TV and other bulletins.
69.8% of the respondents are of the opinion that there is increase/change in disease occurrence among
fishermen in the last 20 years.
73.8% of the respondents are of the opinion that there is change in the type and quantity of fish
availability in recent years.
62.1% of the respondents are able to predict weather from climatic/oceanographic conditions.
60.5% of the respondents are able to predict fish catch from climatic/oceanographic conditions.
West Bengal: Mechanised sector (Number of respondents: 137):
Name of the ITKs’ (title) and description of the ITK with respect to the parameter of climate change
with which it is linked:
a) Increase in catch of clupeids and mackerel with increase in temperature
b) Diverse catch of clupeids with decreasing salinity/increasing rainfall
Table: Climate change parameters ranked as 1st, 2
nd, 3
rd and 4
th by majority of respondents in
the mechanised sector.
Parameter/
Rank
Temperature
(%)
Salinity
(%)
Sea
Level
Rise
(%)
Coastal
upwelling
(%)
Wind
Direction
/Speed
(%)
Rainfall
(%)
1st 97.1 2.9
0
20
40
60 P
erc
en
tage
Sector Wise vulnerability to weather related problems

95
2nd
19.7 9.5 48.9 21.9
3rd
8.8 62.7 24.1 4.4
4th 0.7 3.7 2.9 13.1 26.3 53.3
Frequent cyclonic storm (99%) is the other major problem affecting the fisherfolk of west Bengal.
There are of the opinion that coastal protection structures are a must to counter the effect of cyclones.
Orissa: Mechanised sector (Number of respondents: 183):
Name of the ITKs’ (title) and description of the ITK with respect to the parameter of climate change
with which it is linked:
a) Increase in catch of clupeids and mackerel with increase in temperature
b) Diverse catch of clupeids with decreasing salinity/increasing rainfall
c) Qualitative and quantitative increase in catch of demersal and crustacean resources with
increasing rainfall/decreasing salinity and with extremities of temperature
Table: Climate change parameters ranked as 1st, 2
nd, 3
rd and 4
th by majority of respondents in the
mechanised sector.
Parameter/Rank Temperature
(%)
Sea Level rise
(%)
Wind Direction/Speed
(%)
Rainfall (%) Others
(%)
1st 47.5 19.1 23 10.4
2nd
25.1 7.1 19.1 48.7
3rd
13.1 34.4 23.5 27.3 1.7
4th 14.2 12.6 29 13.6 30.6
Unlike in West Bengal where cyclone is a major problem, in Orissa sea state (53%) appears to be
other major problem.
49% were of the opinion that marine ecosystem is seriously threatened by habitat destruction.
Mariculture
An experiment was conducted to assess the growth and multiplication of marine phytoplankton
Nannochloropsis sp. in relation to different temperatures. Since the average temperature in the
hatchery tank was 28oC, the experiments were conducted in the temperature range of 28 to 32
0C. The

96
temperature difference between the treatments was 1oC. The experiment was carried out in 20 liter pet
jars. Pet jars were washed with salt and dried before use. After drying, pet jars were filled with 18
liter filtered and UV treated water. A thermo stable heater with auto cut was fixed in the jar to control
the required temperature. F/2 medium was added at required quantity before adding the inoculums
(Nannochloropsis sp.). Nannochloropsis sp was added in the jars as inoculums at concentration of
approximately 0.85 million per ml. The initial stocking density of algae was counted from all the
treatment jars. The algal density in each jar was counted daily at morning 10.00 hrs.
The algal count was significantly similar on the first day of culture at all the cultured
temperatures, since the inoculums were added from the same stock of algae. A significant difference
at 5% level in growth and density of algae occurred from fourth day onwards. On day four of culture,
the highest algal count was found at 29oC and the lowest at 32
oC. The algal biomass crashed on the
fifth day in culture tank which was maintained at 32oC. During the culture period of seven days, a
significantly higher growth and multiplication of phytoplankton was found in the culture which was
maintained on 29oC.

97
a, b, c - Values with different superscripts in each column are significantly different at 5% level
In situ monitoring of marine environment
Sea water samples were collected twice a month for assessing water quality from the surface and
bottom of 5 m, 10 m, 20 m and 30 m depth. Sampling dates were fixed in accordance to the lunar
cycles.
The mean sea surface temperature values recorded for the four stations from which water samples are
collected was 28.32°C.
Water temperatures were higher during Quarter 2 (April – June) for the surface waters, which are the
summer months and during quarter 3 (July – Sept) for the bottom waters.
Minimum water temperatures were recorded during Quarter 4(Oct – Dec) for the surface waters,
which are the winter months and during quarter 1(Jan – March) for the bottom waters.
The mean value of salinity for surface waters was 30.42 ppt.
The salinity values were higher during Quarter 2 and lower during quarter 4 for both the surface and
bottom waters. This corroborates with the increase in the mean sea surface temperatures during
summer months. Maximum salinity of 34.50 ppt was recorded during quarter 2, which decreased to a
minimum of 23 – 25 ppt during quarter 4.
Temperature
(oC)
Nannochloropsis sp. count (million/ml)
Day1 Day 2 Day 3 Day 4 Day 5 Day 6 Day 7
28 0.85 ±
0.005
1.27 ±
0.23
1.60 ±
0.25
1.99ab
±
0.09
2.77 ±
0.37
2.85b ±
0.05
3.49b ±
0.04
29 0.85 ±
0.00
1.40 ±
0.01
1.60 ±
0.25
2.07a ±
0.13
3.15 ±
0.05
3.67a ±
0.17
5.47a ±
0.27
30 0.85 ±
0.005
1.55 ±
0.25
1.55 ±
0.07
1.70bc
±
0.05
2.43 ±
0.07
3.00b ±
0.05
4.27b ±
0.32
31 0.85 ±
0.001
1.71 ±
0.14
1.41 ±
0.06
1.90ab
±
0.01
2.70 ±
0.01
2.89b ±
0.01
4.35b ±
0.21
32 0.86 ±
0.001
1.60 ±
0.01
1.60 ±
0.05
1.60c ±
0.05
crashed ---- ---

98
Chlorophyll values collected from all the four stations were plotted and compared with data from
2007 – 2010. The peak values were found during the 3rd
quarter of 2011, which are in full agreement
with previous years. Chlorophyll values were higher for the surface waters than for bottom waters. In
surface waters, it was higher for near shore waters than for deep waters. This can be attributed to the
influx of nutrients from land runoff.
Life Cycle Assessment
Carbon emitted per kg of fish caught at Visakhapatnam was 0.39 kg. Carbon dioxide emitted per kg
of fish caught at Visakhapatnam was 1.43 kg.
The contribution of marine fisheries at Visakhapatnam, Nizamapatnam and Machilipatnam at all
stages of its life cycle to climate change was studied by determining their carbon footprints. Pre-
harvest phase consisted of vessel construction and maintenance and provision of fishing gear, harvest
phase included harvest from mechanized and motorized crafts and post-harvest phase involved fish
transportation and fish processing. The functional unit selected was 1 kg of marine fish to the
consumer.
Visakhapatnam: Fuel and electricity consumption was 0.48 l / kg and 0.255 kWh/ kg of marine fish.
The C and CO2 emitted were 0.382 kg C / kg and 1.404 kg CO2 / kg.
Nizamapatnam: Fuel and electricity consumption was 0.52 l / kg and 0.26 kWh/ kg of marine fish.
The C and CO2 emitted per kg were 0.408 kg C and 1.501 kg.
Machilipatnam: Fuel and electricity consumption was 0.48 l / kg and 0.21 kWh/ kg of marine fish.
The C and CO2 emitted per kg were 0.374 kg C and 1.374 kg CO2.
The highest consumption and the highest emissions were observed from the harvest phase. The fuel
and electricity consumption and C and CO2 emissions were high for mechanized landings and low for
motorized landings.
Under National Initiative on Climate Resilient Agriculture (NICRA) project Integrated
District Level Adaptations and Mitigations (IDLAM) survey was conducted for 1500 households
from 15 villages of Krishna District of Andhra Pradesh by interviewing fishermen to determine their
perception on climate change.
Satellite Telemetry studies on migration patterns of tunas in the Indian seas
Initially targeted cruise were made to find out the suitability of Catamaran for tagging purpose and to
find the survival status of tuna when kept onboard for longer time. Frequent meetings with fishermen

99
for finding out the regular status of tuna fishery along Visakhapatnam coast.Seawater collected from
the tuna tagging sites was analyzed.
Successful Tagging of Yellow fin Tuna was done in the first year at Visakhapatnam and
Lakshadweep coast. Yellowfin tunas were tagged in the second year using pop-up satellite tags off
Visakhapatnam, Lakshadweep and Mangalore. Preliminary results emanating out suggests that the
species movement is restricted to Indian waters but they undergo huge vertical dives frequently.
Development of library of putative probionts of the genus Bacillus, Pseudomonas
and Micrococcus for use in mariculture systems
Twenty eight strains isolated from sediment, seaweeds and fish gut samples exhibited clear zone of
inhibition > 10 mm diameter against Vibrio alginolyticus in the double layer method and against
Vibrio alginolyticus and Vibrio anguillarum in the cross streak method. The biochemical tests were
performed and these strains were found to belong to genera Bacillus, Vibrio, Aeromonas,
Pseudomonas and Micrococcus.
Several bacterial strains isolated from sediment, seaweeds and fish gut samples exhibited clear
zone of inhibition > 10 mm diameter against Vibrio alginolyticus in the double layer method and
against Vibrio alginolyticus and Vibrio anguillarum in the cross streak method. The biochemical tests
were performed and these strains were found to belong to genera Bacillus, Vibrio, Aeromonas,
Pseudomonas and Micrococcus.
Stock Characterization, Captive Breeding, Seed Production and Culture of Hilsa
(Tenualosa ilisha)
Two cages of 6 m diameter and 4 m depth were fabricated and launched at Sagar Island and
Barrackpore to study grow-out of hilsa.
Two small cages (2 m dia) was installed, one at Barrackpore and other at Sagar Island and stocked
with 6-7 mm fingerlings to examine the survivability of hilsa in cages.
Two cages of 6 m diameter and 4 m depth were launched at Sagar Island and Barrackpore to study
grow-out of hilsa in different salinity regimes. The cage launched at Sagar Island used single-point
mooring system, wherein the cage was allowed to rotate around the mooring system. The cage
launched at Barrackpore used fix mooring system, wherein the cage was fixed at both the ends with

100
chains and concrete blocks. Two small cages (2 m dia) was installed at Barrackpore and Sagar Island
and stocked with 6-7 mm fingerlings to examine the survivability of hilsa in cages. However stocked
hilsa did not survived for more than 24 hrs.
Consultancy Projects
Study on the use of fly ash for the manufacture of artificial reefs (Reel Balls)
Miniature models of artificial reefs were designed and constructed with inclusion of different levels
of replacement of Cement with Fly Ash. Three different designs of artificial reef modules were
constructed using different concentrations of fly ash and their suitability tested under laboratory
conditions. Designed Reefs were kept in one t tanks with vigorously aerated seawater to study the
leaching of minerals and metals under lab condition and attachment of microflora and algae will also
be studied. All water quality parameters were analyzed. Minerals and metals leaching was studied by
collecting water and analyzed by outsourcing the samples. Leaching of Zinc, Sulphur and Magnesium
into sea water occurred. The fly ash modules were found to be stable to immersion in sea water.
Detailed final report was prepared and submitted to NTPC.
Installation of artificial reef at a selected site off Visakhapatnam, Andhra Pradesh
Client: NTPC – Simhadri Thermal Power plant, Visakhapatnam, Andhra
Pradesh and Dist Admn (Dept of Fisheries)
Site selection was performed along the near shore waters off the coast of Visakhapatnam.
Sensitization of fishermen of the selected site (Muthyalmmapalem) was done regarding artificial reef
and its benefits.
Collection of baseline data on socio-economic status of the fishermen community of the selected
fishing village was achieved through bench mark survey.