research analysis of weld fabrication flaws in high-level
TRANSCRIPT

SKI Report 2004:31
Research
Analysis of Weld Fabrication Flaws inHigh-Level Radioactive Waste DisposalContainers: Experiences from the USProgramme
Daniel BullenMick Apted
November 2002
ISSN 1104–1374ISRN SKI-R-04/31-SE
SKI perspective
Background In Sweden the basic concept for disposal of spent nuclear fuel is encapsulation in canisters and subsequent emplacement in the rock at about 500 m depth. The canisters consist of an inner iron insert and a copper outer shell. The canisters are planned to be sealed by electron beam welding or friction stir welding. The quality of the sealing is a critical safety factor for the performance of the repository. According to preliminary SKB plans, a license application for an encapsulation plant will be sent in to SKI 2006. The review of the application will require analysis of the processes and methods employed in canister fabrication, sealing, non-destructive testing (NDT) and performance assessment modelling of fabricated canisters in the deep repository. As a preparation for this review, SKI need to gather information and experience on the possibility and nature of defects and flaws in welds, methods to test welds as well as the use of this information in performance assessments.
Purpose of the project The purpose with this project was to gather experience on statistical analysis of fabrication flaws in welding, especially from the US repository programme. The project investigates approaches and identifies available data for more in-depth evaluation and quantitative assessments. Special emphasis is laid on how to handle the fact that only a limited number of test data will be available before and under production.
Results The result of the project is a review of defect related failures of canisters in various industries (pressure vessels, fuel rods, underground storage tanks etc) and a further review of mechanisms for early failures in welds in waste containers. For the latter some approaches to estimate probabilities and consequences are shown, including the use of (usually scarce) non-destructive testing (NDT) data.
Effects on SKI work The reported approaches for analysing and categorising defects, failure mechanisms and their consequences for the canister integrity, and for estimating probabilities, will be applicable in the Swedish programme, even though the Swedish KBS-3 canister design is differing (both in materials and design) from that in the reported US programme. For SKI these results will be used in the review of the SKB RD&D-programme (reviewed every third year) and in the preparations for the review of license applications.
Project information Responsible for the project at SKI has been Christina Lilja. SKI reference: 14.9-020815/02163

SKI Report 2004:31
Research
Analysis of Weld Fabrication Flaws inHigh-Level Radioactive Waste DisposalContainers: Experiences from the USProgramme
Daniel Bullen*Mick Apted
Monitor Scientific LLC3900 S. Wadsworth Blvd. #555Denver CO 80235 USA
*Monitor Scientific Associate Consultant
November 2002
SKI Project Number XXXXX
This report concerns a study which hasbeen conducted for the Swedish NuclearPower Inspectorate (SKI). The conclusionsand viewpoints presented in the report arethose of the author/authors and do notnecessarily coincide with those of the SKI.

i
Table of Contents
Executive Summary.........................................................................................................1
1 Introduction ...............................................................................................................3
2 Manufacturing Flaws in Closure Welds..................................................................7
3 Weld Stability.............................................................................................................9 3.1 Closure-Weld Residual Stress Uncertainty .......................................................10 3.2 Threshold Stress for Crack Initiation ................................................................11 3.3 Orientation of Manufacturing Flaws in Closure Weld......................................12
4 Threshold for Initiation of Stress Corrosion Cracking in Alloy 22 ....................13
5 Uncertainties in Orientation of Manufacturing Flaws in Closure Lid Welds ...17
6 Review of Defect Related Failures of Canisters in Various Industries...............19 6.1 Boilers and Pressure Vessels.............................................................................19 6.2 Nuclear Fuel Rods .............................................................................................21 6.3 Underground Storage Tanks..............................................................................23 6.4 Radioactive Cesium Capsules ...........................................................................24 6.5 Dry Storage Casks for Spent Nuclear Fuel .......................................................24 6.6 Tin-plate Cans ...................................................................................................27 6.7 Summary ...........................................................................................................27
7 Early Waste Package Failure Mechanisms ...........................................................29 7.1 Weld and Base Metal Flaws..............................................................................30 7.2 Improper Weld Material....................................................................................36 7.3 Improper Heat Treatment ..................................................................................37 7.4 Contamination ...................................................................................................40 7.5 Improper Handling ............................................................................................43
8 Prototype Fabrication and Weld Flaw Analysis...................................................45
9 Conclusion ................................................................................................................47
10 References.................................................................................................................49
Appendix A: Potential Impacts of Canister Failure on Repository Safety ............53 A.1 Distribution in Containment Failures over Time ..............................................53 A.2 Repository Case Studies on Distributed Canister Failure .................................54 A.3 Summary of Distributed Canister Failure .........................................................56

1
Executive Summary The purpose of this report is to examine key issues regarding the fabrication, closure and defect detection in canisters for radioactive waste disposal in a deep geological repository. As a preliminary step, a review is made of the closure-weld design and non-destructive evaluation (NDE) of the closure seal for the US high-level waste repository programme. This includes statistical analysis of the data obtained by NDE and identification of key areas of investigation where additional data are required. Information from other industrial experiences on closure and flaw detection of metal containers is also reviewed. The canister material and closure methods for the US programme and industrial activities reviewed here differ from those of SKB’s KBS-3 reference design. The issues and approaches to issue resolution identified from the US programme and industrial analogues, however, can provide an initial basis for preparing for independent review of SKB’s canister closure plans and encapsulation facility.

2

3
1 Introduction The long-term performance of high-level radioactive waste canisters used for the deep geological disposal of spent nuclear fuel and high-level radioactive waste will be significantly affected by the integrity of the final closure weld. The closure weld on the final waste package (i.e., canister loaded with waste form), which will be subjected to residual stresses up to the yield point of the material, will include a range of flaw types with various orientations with respect to the canister surface. The size, shape, orientation and distribution of these flaws will have a significant impact on the potential premature failure of the canister seal. The ability of non-destructive evaluation (NDE) techniques to locate and identify critical fabrication flaws prior to emplacement of the waste package into a deep geological repository will also significantly influence the results of long-term performance assessment calculations for the entire repository system (see Appendix A). The purpose of this report is to review the current information on closure weld design and NDE of the closure seal from the US high-level waste repository programme. In addition, a review of the efforts by the US programme to validate the effectiveness of the NDE techniques to be employed in waste package closure, including statistical analysis of the data obtained by NDE will be provided. This information is supplemented by review of closure and defect detection data from other industrial activities. It should be noted that the canister material, closure methods, and other aspects of the US programme and industrial examples differ from the current KBS-3 design being investigated by SKB. There are, nevertheless, important methods, insights and issues identified from the US programme and industrial analogues that can be valuable in future independent assessment of SKB own canister encapsulation programme. The current US repository concept includes horizontal emplacement of relatively large waste packages containing spent nuclear fuel and defense reprocessing wastes. The waste packages will vary in size from 1.5 meters to 2.0 meters in diameter and will be approximately 5 meters in length. A schematic representation of a proposed emplacement drift is shown in Figure 1. Each waste package will include a 5 cm-thick inner barrier of Type 316 stainless steel covered with a 2 cm-thick Alloy 22 outer barrier as shown in Figure 2. The outer barrier will have two closure lids each made out of Alloy 22. The flat closure lid will be 1-cm thick and will be stress relieved by laser peening following welding. The extended closure lid is designed to allow a solution anneal heat treatment for stress relief after welding. The laser peening evaluation is currently being optimized by Lawrence Livermore National Laboratory. The solution anneal methodology is being developed by AJAX Induction Services, Inc.

4
Figure 1: Arrangements for Different Types of Waste Packages and the Drip Shield in an Emplacement Drift (DOE 2001a)
Figure 2: Typical Waste Package Designed for 21-PR Fuel Assemblies (DOE 2001a)

5
Numerous experimental and modeling studies have been undertaken at Lawrence Livermore National Laboratory (LLNL) in support of the waste package materials performance effort. These studies have incorporated welded specimens to evaluate the long-term performance of the final closure seal of the waste package. These studies have been completed to support the development of waste package degradation models that are incorporated into the Total System Performance Assessment for Site Recommendation (TSPA-SR). The most recent developments in this program have been published in the Yucca Mountain Science and Engineering Report (S&ER) (DOE 2001a), the Supplemental Science and Performance Analyses (SSPA) Report, Volumes I and II (DOE 2001b and DOE 2001c), and the Yucca Mountain Preliminary Site Suitability Evaluation (PSSE) Report (DOE 2001d). Each of these reports addresses to some extent, the issue of impact of the final closure welds on the overall system performance. In addition, the effect of canister manufacturing defects or imperfections that could potentially result in early canister failure is address in the Analysis and Model Report (AMR) entitled, “Analysis of Mechanisms for Early Waste Package Failure” (DOE 2000). The Yucca Mountain Project recently completed an extensive effort to address waste package weld flaw detection and analysis (Senior Flexonics 2002). This study was completed by Senior Flexonics and first reported at the Fifth Nickel Development Institute (NiDI) Workshop on the Fabrication and Welding of Nickel Alloys and Other Materials for Radioactive Waste Containers, which was held on 17 October 2002, in Las Vegas, NV. The results of this study have only recently (13 October 2002) been delivered to the Yucca Mountain Project and are not yet publicly available. A summary of the major activities completed for this project, including the welding of test specimens, NDE of each specimen, the production of weld flaw maps for each specimen, measurement of surface stresses, and the metallographic examination of each identified weld flaw is provided in subsequent sections of this report. In addition, this report summarizes the recent developments in the experimental and modeling efforts related to fabrication and NDE of the waste package closure weld.

6

7
2 Manufacturing Flaws in Closure Welds An input to the stress corrosion cracking (SCC) modeling approach is information regarding defects, incipient cracks, and manufacturing defects. There are no differences between “defects” and “manufacturing defects” from a safety assessment viewpoint because both can potentially lead to premature canister failure. Each of these defects can have an influence on canister performance as corrosion proceeds. “Manufacturing defects” are defined here as defects formed during the casting, forming or welding process for most metals. Preexisting manufacturing flaws in the closure lid welds are the most likely sites for SCC failure. The frequency and size distributions for manufacturing flaws in the closure welds are based on published data for stainless steel pipe welds in nuclear power plants. The published data used to develop the manufacturing defect model utilize relevant welding techniques and post-weld inspection methods. In the TSPA-SR analysis, preexisting surface-breaking defects and defects embedded in the outer 25 percent of the weld thickness are considered as potential sites for SCC crack growth. There is uncertainty associated with this assumption because, as general corrosion propagates, some of the existing surface-breaking defect flaws may disappear and some of the embedded defects may become surface-breaking defects. Use of this assumption is conservative because the WAPDEG model does not allow existing surface-breaking defects to be removed due to general corrosion processes during the simulation, leading to a greater number of defects capable of propagation. In addition, weld flaws are assumed to be randomly distributed spatially, as represented by a Poisson process. This assumption is reasonable for the manufacturing process being considered. As described above, the residual stress analysis shows that the dominant stress in the closure lid welds after stress mitigation is hoop stress, which drives radial cracks through the closure-lid weld region. This analysis indicates that only radial flaws are potential sites for through-wall SCC if it occurs. The TSPA-SR assumes that all manufacturing flaws are oriented in such a way that they could grow in the radial direction in the presence of hoop stresses. This is a highly conservative assumption. More realistically, most weld flaws, such as lack of fusion and slag inclusions, would be expected to be oriented within a few degrees of the weld centerline). Available published data and limited flaw measurements from the viability assessment design mockups also show that most weld flaws (about 99 percent) tend to be oriented in a circumferential direction. Analyses show it is extremely unlikely that cracks initiating from circumferential flaws grow in the radial direction.

8

9
3 Weld Stability Gas-tungsten-arc welds, which were made from 0.5-inch thick Alloy 22 base metal in a single V-groove configuration using nine passes, were examined using optical microscopy at magnifications of 200 and 400 times. These welds were produced and aged at 593°, 649°, 704°, and 760°C for times up to 1,000 hours at Haynes International, Inc. in Kokomo, Indiana. Volume fraction measurements were also made. The measurements to date are preliminary. The amount and size of precipitates in the welds vary with position in the weld. For example, relatively few and smaller precipitates tend to be present near weld pass boundaries, while many larger precipitates tend to be present at the top of the last weld pass. The measurements presented here represent averages over several positions in the weld. Future studies will correlate precipitate amount with location in the weld. These welds are also much thinner than those called out in the current waste package design. Welding conditions, such as heat input, that might affect the starting weld structure and the subsequent precipitation kinetics will be different for thicker welds. A study of precipitation kinetics in thicker welds is currently planned. Also, several phases are expected in Alloy 22 welds; intermetallic phases denoted σ, µ, and P have been observed. Such intermetallic phases consist of specific structures formed by two metals with limited solubility in a metal matrix. Intermetallic phases can significantly change the mechanical properties of the bulk metal. The growth kinetics for each of these phases may be different. In the base metal, it is likely that the amount of σ -phase precipitating is small at temperatures below about 750°C and that µ- and P-phases are similar. In the weld, however, the amount of σ -phase may be quite high due to chemical segregation. More refined studies that take these factors into account are being done to reduce uncertainties associated with conclusions drawn about weld stability. In the as-welded condition, the volume fraction of precipitates measured was 0.029 at 200-fold magnification and 0.025 at 400-fold magnification. The times required for this volume fraction to increase to 0.05 and 0.10 are plotted against reciprocal temperatures in Figure 3. The time required for this volume fraction to increase to 0.05 is represented by the extrapolation of the data represented by diamonds (the right-most line) on Figure 3. The time required for this volume fraction to increase to 0.10 is represented by the extrapolation of the data represented by squares (the left-most line) on Figure 3. The data in Figure 3 are for isothermal conditions. The temperature of the repository is expected to peak below 200°C and decrease over thousands of years. Weld stability does not appear to be a problem for Alloy 22. Because the extrapolation is done over very long times from relatively short-term data, very small changes in the measured data can cause a shift in the extrapolated cutoff temperature to give a 10,000-year life of a hundred degrees or more. Theoretical calculations similar to those being made for the topologically close-packed (TCP) phase precipitation will be done to account for any uncertainties associated with segregation in the welds, the different phases present, and the other experimental difficulties mentioned above.

10
Figure 3: Extrapolation of Volume Fraction Data from Half-inch Thick, Alloy 22, Double-V, Gas-Tungsten-Arc Welds (DOE 2000) 3.1 Closure-Weld Residual Stress Uncertainty The closure welds of the outer and inner lid of the waste package outer barrier will be treated by induction heating and laser peening, respectively, to mitigate stresses and generate compressive stress at the surface and down to a significant depth. The stress mitigation treatments will be limited to the closure weld area. In particular, the induction heating will be performed in such a way that other areas are not heated to undesirable temperatures. The resulting residual stress profiles in both of the closure lids were calculated, as a function of depth. Hoop stress is the dominant stress to potentially drive radial cracks through the wall thickness. Therefore, the profile with the highest hoop stress was used as a mean stress profile for the outer and inner closure lid welds. Because no measured data are available for the waste package design, the uncertainties in the residual stress were addressed in the TSPA-SR by considering three scenarios (optimum, realistic and worst case) for welding and post-weld mitigation operations and assigning separate uncertainty ranges for each scenario. The uncertainty bounds for
11
individual scenarios were based on literature data. The optimum case is the best case scenario that is achievable through stringent control of such processes as welding, stress mitigation, material variability, and other fabrication steps, and is represented by the stress uncertainty range of ±5 percent of the yield strength. The realistic case is assumed achievable through appropriate levels of process controls, and is represented with the stress uncertainty range of ±10 percent of the yield strength. The worst case is a case that might result from inadequate control of the processes, represented with the stress uncertainty range of ±30 percent of the yield strength. The TSPA-SR considers the uncertainty range of the worst case (±30 percent of the yield strength) as the base case, and evaluates the ranges of ±10 percent and ±5 percent of the yield strength in sensitivity analyses. The triangular distributions around the mean and the bounds (i.e., ±5, ±10, and ±30 percent of the yield strength) are assumed for the residual stress uncertainty. The TSPA-SR base case uncertainty bounds are highly conservative, based on information available in the literature and considering the strict process control and inspections that will be implemented during the waste package manufacturing process. Additional analyses have been conducted since the completion of the TSPA-SR to further quantify the residual stress uncertainty and remove the conservatism in the base case. In the absence of measured data for the waste package design, those analyses focused on relevant literature data for similar stress mitigation techniques applied to similar materials. The outer closure lid weld region of the waste package outer barrier will be induction annealed. Consideration of the literature data resulted in a revision of the symmetric upper and lower bounds on the stress and stress intensity factor profile uncertainty distribution from ±30 percent to ±21.4 percent. The inner closure lid weld region of the waste package outer barrier will be laser peened. Consideration of the literature data resulted in the development of a cumulative distribution function for the symmetric upper and lower bounds on the stress and stress intensity factor profile uncertainty distribution. 3.2 Threshold Stress for Crack Initiation The slip dissolution model assumes crack growth can initiate at any surface flaw that can generate a stress intensity factor, regardless of flaw size and tensile stress. Examination of relevant literature indicates that there may be a threshold stress below which stress corrosion cracking will not initiate on a “smooth” surface (i.e., free of surface breaking flaws). In the absence of relevant Alloy 22 test results, literature results on Stainless Steel Type 304 were used to assess the expected stress corrosion crack susceptibility of Alloy 22 in terms of initiation threshold stress. These results were obtained in very aggressive boiling magnesium chloride or in 0.1 M sodium chloride solutions dripped onto stressed specimens heated to 200°C. Under these very aggressive conditions, lower-bound initiation threshold stresses of 20 to 30 percent of the yield strength were observed. Hence, this range was conservatively selected for waste package design applications. Accordingly, in the TSPA analysis, the uncertainty in the threshold stress for initiation of stress corrosion crack is conservatively estimated to be approximately 20 to 30 percent of the Alloy-22 yield strength. A uniform distribution between the bounds is assumed for the threshold stress uncertainty.

12
However, in these very aggressive environments, initiation stress threshold values for higher nickel-content stainless steels and nickel-base alloys may exceed 80 percent of the yield strength. In the case of Alloy 22 U-bends (10 to 15 percent strain) in boiling magnesium chloride, the initiation threshold may exceed approximately 200 percent of the yield strength. The literature data and YMP measured data generated since completion of the TSPA-SR were used to reevaluate the initiation threshold stress and quantify its associated uncertainty. These evaluations concluded that the initiation threshold stress should be sampled from a uniform distribution between 80 and 90 percent of the yield strength. 3.3 Orientation of Manufacturing Flaws in Closure Weld The waste package analysis considers both incipient cracks and manufacturing flaws. Preexisting manufacturing flaws in the closure lid welds are the most likely sites for waste package failure by stress corrosion cracking. Therefore, characteristics of flaws in the waste package closure welds are important input to the waste package stress corrosion cracking analysis. In the TSPA-SR, the frequency and size distributions for manufacturing flaws in the closure welds were developed based on published data for stainless steel pipe welds in nuclear power plants. The published data used to develop the manufacturing defect model are those utilizing welding techniques and post-weld inspection methods that are relevant to waste package manufacturing. As discussed previously, the hoop stress is the dominant stress in the closure lid welds, which drives radial cracks through the closure lid weld region. This analysis indicates that only radial flaws are potential sites for through-wall stress corrosion cracking, if it occurs. The TSPA-SR assumes conservatively that all manufacturing flaws are oriented in such a way that they could grow in the radial direction in the presence of hoop stresses. This is a highly conservative assumption. Considering additional literature information and limited measured data from the mockups developed for the viability assessment analysis, analyses were conducted to quantify the uncertainty associated with the orientation of weld flaws in the waste package closure welds. It was determined that, based on weld flaw orientation, the fraction of weld flaws capable of propagation in the radial direction should be sampled from a log-normal distribution with a mean of one percent, an upper bound of 50 percent, and lower bound of 0.02 percent.

13
4 Threshold for Initiation of Stress Corrosion Cracking in Alloy 22
Initially, in the absence of relevant Alloy 22 stress corrosion cracking test results, literature results on Stainless Steel Type 304 were used to assess the expected susceptibility of Alloy 22 in terms of initiation stress threshold. These results were obtained in either very aggressive boiling magnesium chloride or in 0.1 M sodium chloride solutions dripped onto stressed specimens heated to 200°C. Under these very aggressive conditions, lower-bound initiation stress threshold of 10 to 30 percent of yield strength was observed. This range was conservatively selected for waste package design applications. In these same very aggressive environments, initiation stress threshold values for higher nickel-content stainless steels and nickel base alloys may exceed 80 percent of the yield strength. In the case of Alloy 22 U-bends (10 to 15 percent strain) in boiling magnesium chloride, the initiation stress threshold may exceed approximately 200 percent of the yield strength. More recently, a series of constant load and slow strain rate stress corrosion initiation tests was performed in more relevant test environments to assess the expected stress corrosion susceptibility of Alloy 22 in terms of stress threshold for crack growth initiation. In addition, highly stressed U-bend specimens of Alloy 22 were examined after up to two years of exposure in a range of environments in the Long-Term Corrosion Test Facility (DOE 2000). These crack initiation tests were performed on Alloy 22 specimens with machined surfaces typical of those expected on the waste package, and no evidence of stress corrosion crack initiation has been found to date. These tests included: • Constant load tests at 105° to 125°C on approximately 100 specimens (Figures 4
and 5). These tests had a range of stresses up to approximately 250 percent of yield strength in concentrated J-13 well water solutions (equivalent to being evaporatively concentrated to approximately 5500-fold, pH = 12.4). These tests included a range of metallurgical conditions, including annealed, welded, thermally aged and cold-worked material. No stress corrosion crack initiation was observed on any Alloy-22 specimen in any of these tests out to approximately 2,500 hours of exposure.
• Alloy 22 U-bend tests (estimated stress at approximately 200 percent of yield
strength) at 90°C. These tests included annealed and as-welded materials exposed up to two years in the Long-Term Corrosion Test Facility over a range of expected and bounding waste package surface environmental conditions. These environmental conditions included simulated concentrated water [approximately 1000-fold J-13 well water, pH = 8], simulated acidic water [approximately 1000 to 3000-fold J-13 well water, pH = 2.7], and simulated dilute water [approximately 10-fold J-13 well water, pH = 9.9]). The materials did not exhibit any cracking during the exposure period.
• Slow strain rate tests at 76 to 105°C covering a range of relevant and bounding
environments (including trace element lead additions) and applied potentials (Table

14
1). Examination of these results indicates a high degree of stress corrosion crack resistance at open circuit potentials in relevant environments, even in the presence of dissolved lead at pH values as low as 3. If beneficial buffer ions are not present (e.g., in a chloride-rich 4 M NaCl solution), the potential for either stress corrosion crack or crevice corrosion exists at applied potentials greater than approximately 350 mV versus Ag/AgCl. However, it should be noted that the expected waste package surface environments will be buffered and less prone to stress corrosion cracking.
• In addition to the various SCC initiation tests cited above, fracture mechanics type
crack growth tests have been performed at 110°C in near-saturated (approximately 50,000 fold) J-13 well water at a pH of 13.43. In these tests, a sharp flaw generated by fatigue pre-cracking the specimens is subjected to slow load cycling in the desired test environment at stress intensities of 30 or 45 MPa·m2
until an active stress corrosion (or corrosion fatigue) crack is initiated. The crack is then forced to continue growing by very slow load cycling. With time, the cycling frequency is reduced in steps, and eventually, the sample is held under constant load and the crack growth rate measured. For Alloy 22, this growth rate is extremely low and tends to arrest with time at constant load. The measured growth rate on 20 percent cold-worked Alloy 22 samples was approximately 4 x 10⁻¹⁰
mm/s, a rate that is near the lower limits of such measurements. Consider materials with such low growth rates, and under the constant loading conditions representative of the waste package closure welds (i.e., no load cycling occurs). For such materials there is a high probability that even if an actively growing stress corrosion crack were to initiate, it would subsequently arrest after a small amount of growth.
Based on these recent tests, the stress threshold can be conservatively increased to a range of 80 to 90 percent of yield strength. A uniform distribution is assumed between the bounds, and the entire distribution represents uncertainty in the stress threshold. A still higher value could be justified based on the recently available Alloy 22-specific test results. It is prudent, however, to limit the upper bound value to 90 percent of yield strength at this time to provide a safety margin, considering the relatively limited test exposure times compared to the waste package emplacement period under consideration.

15
Figure 4: Constant Load (Uniaxial Tension) Stress Corrosion Crack Initiation Test No. 1
Figure 5: Constant Load (Uniaxial Tension) Stress Corrosion Crack Initiation Test No. 2

16
Table 1: Slow Strain Rate Test Results for Alloy 22
Specimen
ID
Test
Environment
Applied Potential (mV vs.
Ag/AgCl)
Crevice
Temperature
(°C)
Summary Results
ARC22-12 Air N/A N/A Room Temp. full ductility (58% strain to failure nominal)
ARC22-123 4M NaCl 350 None 98 Full ductility (55% stain to failure nominal)
ARC22-117 4M NaCl 400 Halar 98 SCC at gage (6% strain to failure)
ARC22-120 BSW pH 13 400 None 105 Full ductility (52% strain to failure nominal)
ARC22-119 BSW pH 13 400 Halar 105 Full ductility (61% strain to failure nominal)
ARC22-115 BSW pH 13, no NO3
400 Halar 105 Full ductility (56% strain to failure nominal)
ARC22-129 BSW pH 3, no So4 400 Halar 105 Full ductility (60% strain to failure nominal)
ARC22-128 BSW pH 13, no NO3 or SO4
400 Halar 98 Severe crevice corrosion at gage 4% strain to failure
ARC22-126 BSW pH 13, no NO3 or SO4
300 Halar 98 Crevice corrosion at gage 22% strain to failure
ARC22-122 BSW pH 13, no NO3 or SO4
200 Halar 98 Full ductility (60% strain to failure nominal)
ARC22-124 BSW pH 13, no NO3 or SO4
100 Halar 98 Full ductility (60% strain to failure nominal)
ARC22-127 BSW pH 13, no NO3 or SO4
Open circuit
Halar 98 Full ductility (60% strain to failure nominal)
ARC22-125 SSW pH 6.25 400 Halar 100 Full ductility (53% strain to failure nominal)
ARC22-112 SCW 400 Halar 76 Some impact on ductility (41% strain to failure)
ARC22-113 SCW 317 Halar 76 Full ductility (53% strain to failure nominal)
ARC22-15 SAW Open circuit
Halar 76 Full ductility (60% strain to failure nominal)
ARC22-13 1% PbCl2, pH 4, aerated water
Open circuit
N/A 95 to 76 Full ductility (57% strain to failure nominal)
ARC22-16 Pb in SAW pH 3 Open circuit
Halar 76 Full ductility (60% strain to failure nominal)
ARC22-17 Pb in SAW pH 3 Open circuit
Halar 76 Full ductility (60% strain to failure nominal)
ARC22-18 Pb in SAW pH 3 Open circuit
Halar 76 Full ductility (60% strain to failure nominal)

17
5 Uncertainties in Orientation of Manufacturing Flaws in Closure Lid Welds
As discussed previously, the residual stress analyses showed that the hoop stress is the dominant stress in the closure lid welds; thus, only radial flaws are potential sites for through-wall stress corrosion cracking, if it occurs, in the presence of hoop stress. The stress corrosion cracking analysis in the TSPA-SR assumed conservatively that all manufacturing flaws are oriented in such a way that they could grow in the radial direction in the presence of hoop stresses. Only two weld methods are being considered for the fabrication process, gas metal arc and tungsten inert gas methods. These welding processes are designed to eliminate slag inclusions, a common flaw in other welding techniques. The most common flaws for gas metal arc and tungsten inert gas are lack of fusion flaws due to missed side wall or lack of penetration in the side wall. These flaws are generally large and readily detected by ultrasonic and radiographic inspections. Because both ultrasonic and radiographic methods will be used for post-weld inspections, there should be no large undiscovered flaws. Furthermore, flaws from the lack of fusion are, by definition, oriented in the direction of the weld bead, and thus are not subject to the applied hoop stress profile. The observations noted above are supported by the limited data available from the lid welds on a 4-inch thick carbon-steel cylinder mockup using multiple passes for the viability assessment waste package design. Overall, sixteen indications were detected by ultrasonic testing on the bottom lid weld. Thirteen of these were classified as potential lack of fusion flaws because of their location at the weld fusion zone and their orientation parallel to the weld groove orientation. The other three indications were due to laminations in the base metal. Similarly, on the top lid welds of the same cylinder, three indications were detected; all were classified as lack of fusion very near the base of the weld root. The orientation of all of these indications was planar with respect to welding direction. A statistical treatment of weld flaw orientations based on analysis of a significant data set of flaw orientation measurement was described by Shcherbinskii and Myakishev (Shcherbinskii and Myakishev 1970). This study concluded that planar-type weld flaws, detected ultrasonically, tend to be predominately oriented parallel to the direction of the weld center line. More than 98 percent of the flaws detected fall within ±16 degrees of the weld center line in the case of steam pipe welds (e.g., the tails of the distributions decrease to less than 2 percent probability as the azimuth angle approaches 90 degrees). A similar conclusion, drawn from the data for plate welds, indicates that statistical distribution of the flaws with respect to the orientation angle can be approximated with a centered normal distribution with a maximum standard deviation of 5 degrees. This yields a probability of 99 percent that a flaw is oriented within about ±13 degrees of the weld centerline. This suggests that less than one percent of these flaws have a potential to undergo stress corrosion cracking (i.e., radial crack propagation) under the action of the applied hoop stresses. Visual inspection of both the figures suggests a maximum probability of less than 2 percent at an azimuth between 12 and 16 degrees.

18
In summary, most weld flaws, such as lack of fusion and slag inclusions, would be expected to be oriented within a few degrees of the weld centerline. Available published data and YMP limited flaw measurements from the viability assessment design mockups also show that most weld flaws (about 99 percent) tend to be oriented in the circumferential direction. Recent analyses showed it is extremely unlikely that cracks initiating from circumferential flaws grow in the radial direction. Based on this information, consider the fraction of weld flaws in the waste package closure welds, which are capable of growing in the radial direction in the presence of hoop stress. The uncertainty in this fraction is represented as a log-normal distribution with a mean of one percent, upper bound of 50 percent, and lower bound of 0.02 percent. The entire range of the distribution is assumed to be due to uncertainty. Considering additional results identified in the literature (Shcherbinskii and Myakishev 1970), the mean of one percent is reasonably conservative.

19
6 Review of Defect Related Failures of Canisters in Various Industries
This section presents the results of a literature review performed to determine the rate of manufacturing defect-related failure for various types of canisters. The results cited here were originally reported in an analysis and model report prepared by the DOE (DOE 2000). In addition to providing examples of the rate at which defective canisters occur, this information provides insight into the various types of defects that can occur and the mechanisms that cause defects to propagate to failure. 6.1 Boilers and Pressure Vessels Pressure vessels are similar to waste packages in the sense that they are welded, metallic components of similar thickness that are typically fabricated in accordance with accepted standards and inspected prior to entering service. In addition, there are several sources of statistics on the number and types of failures that have occurred in a fairly large population. One study (Doubt 1984) examined data on 229 failures of United Kingdom (UK) pressure vessels that had occurred in a population of 20,000 vessels (Smith and Warwick 1978). The vessels were all welded or forged unfired pressure vessels with wall thickness greater than 9.5 mm (3/8 inch) and working pressure in excess of 725 kPa (105 psi). The vessels included in the study were indicated as being less than 40 years old as of 1976 (Smith and Warwick 1978) and were constructed to Class I requirements of various UK standards. Doubt (1984) identified 17 instances of external leakage or rupture in-service that were indicated as being caused by pre-existing defects in weld or base metal, or by incorrect material. Failures that were indicated as being due to thermal or mechanical fatigue, corrosion, internal leaks, and part-through cracks found by visual examination or non-destructive examination (NDE) were excluded. This yielded an estimated failure rate due to manufacturing defects of 8.5 x 10⁻⁴
per vessel. Further examination of the data (Smith and Warwick 1978) indicate that four of the failures were attributed to use of incorrect material in the weld, one to improper heat treatment, one to improper joint design, and the remaining failures were due to weld flaws. In all of the cases involving weld flaws, the vessels were in service for several years prior to failure, which suggests that fatigue was also the cause of the flaws propagating through-wall. In some cases, failures that were attributed to fatigue, and thus not included in the calculation of the above failure rate, also involved propagation of pre-existing defects. Overall, approximately 29% of the failures appear to have involved a pre-existing defect of some kind. Finally, it should be noted that the original source of the failure data (Smith and Warwick 1978) indicates that many of the defects occurred in areas where it was not the practice at the time of construction, even with Class I Standard vessels, for NDE to be performed. Since waste packages are not subject to cyclic stresses, and will be volumetrically examined, application of the above failure data to the direct determination of an early failure rate would be extremely conservative.

20
Another source of information on failures is available from the National Board of Boiler and Pressure Vessel Inspectors (NBBPVI 1999). The NBBPVI maintains records on all boilers and pressure vessels that carry a National Board-registered stamping. For the period of 1919 through to 1997, incident reports indicate the number of failures that have occurred as a result of various causes. For the category of “Faulty Design or Fabrication” the average incident rate is 83 per year. Assuming that this rate is constant over the 78 years in which vessels were registered, a point estimate probability of 2.3 x 10⁻⁴
per vessel for failure due to fabrication or design defects can be calculated. Unfortunately, the NBBPVI information does not contain information on the cause of failure, and thus, its utility for this analysis is limited. Data from the above sources, and from similar databases in Germany, have been used in various studies to calculate the annual probability of vessel failure for use in risk assessments. The expected value for disruptive failure rates range from 2 x 10⁻⁶
to 4 x 10⁻⁵
per vessel-year, and the upper bound (99% confidence) failure rates range from 5 x 10⁻⁶
to 8 x 10⁻⁵ per vessel-year (Tschoepe et al. 1994). In general, these rates were not
based on actual failures that had occurred, but on reports on the size of the weld defects observed during inspection, and the perceived consequences had the vessel been returned to service without repair of the defect. Therefore, since these rates involve significant interpretation as to the effect of weld flaws on component life under a specific set of operating conditions, they cannot be directly used to determine a waste package early failure rate. Finally, two instances were also found in the literature where cracking of stainless steel cladding on the interior surface of reactor coolant system components occurred as a result of human-induced defects that occurred during fabrication or transport. In one case, during a post-hot functional test visual exam conducted in March 1975, Indian Point-3 personnel noted rust colored deposits in the primary water boxes of all four steam generators (S.M. Stoller and Company 1976). A detailed chemical and metallurgical analysis of cladding samples was performed. Three distinct types of cracking were identified: 1) longitudinal inter-bead cracks in the upper parts of the heads that propagated along grain boundaries, 2) transverse cracks adjacent to repair welds, and 3) extensive cracking in the lower half of the heads. Studies of the cladding samples identified stress corrosion and dilution of the clad deposit with base metal as possible causes for the imperfections. The supposition of stress corrosion was supported by the fact that the channel heads were accidentally exposed to seawater during shipment. In a second instance, microfissures were found in the cladding of two straight and two elbow sections of reactor coolant system piping during construction of Oconee 1 (B&W 1970a and 1970b). The fissures were found during a routine dye penetrant exam while they were being reworked to accommodate the installation of Westinghouse reactor coolant pumps (e.g., they would likely not have been found before operation if the original Bingham pumps were installed). The cracks in the straight sections were caused by low delta ferrite levels that resulted from use of an improperly manufactured batch of flux in the submerged-arc weld cladding of these sections. The cracking that occurred

21
on the two elbow sections was attributed to the improper use of acidic etchants in the identification and removal of surface contamination. Evidence suggested that a full-strength copper sulfate etchant (Strauss solution) may have been used, rather than the dilute solution normally permitted. The Indian Point 3 and Oconee 1 cases were the only examples of contamination related failures found in the nuclear industry literature, and no efforts to determine their frequency of occurrence have been previously made. While this review has provided general information on the reliability of large, welded, pressure significant differences in operational conditions and degree of inspection performed prior to service. However, this review has identified several types of manufacturing defects that may be applicable to waste packages. These types of defects are: • Weld flaws • Base metal flaws • Use of improper material in welds • Improper heat treatment of welded or cold-worked areas • Improper weld flux material • Poor joint design • Contaminants The applicability of these types of defects to waste packages, and their potential consequences to postclosure performance, are discussed in subsequent sections of this report. 6.2 Nuclear Fuel Rods Nuclear fuel rods are conceptually similar to waste packages in the sense that they are manufactured in large numbers, are subjected to rigorous quality controls and inspections, and have radionuclide containment as one of their primary functions. As such, it is useful to review the reliability of these components and the rate at which manufacturing-induced defects occur. However, they are also simple, single-barrier components, with a very small wall thickness compared to waste packages, and significantly different operating conditions and a much shorter period of operation. Thus, the failure rate information presented here cannot be directly used to develop a waste package early failure rate. Since a significant amount of scrutiny by utilities, vendors, and the Nuclear Regulatory Commission (NRC) follows any report of failure in nuclear fuel, there is a large database on the number and causes of fuel rod failures. The fuel rod failure rate for both

22
Pressurized Water Reactor (PWR) and Boiling Water Reactor (BWR) fuel through 1985 ranged from 2 x 10⁻⁴
to 7 x 10⁻⁴ per rod (EPRI 1997). As a result of vendor efforts to
develop improved fuel designs to address some of the causes of failure, the current range of failure rates is from 6 x 10⁻⁵
to 3 x 10⁻⁴ per rod (EPRI 1997). The failures of
fuel rods have been caused by a variety of mechanisms. These include: handling damage, pellet-clad interaction, debris, baffle plate jetting, grid fretting, primary hydriding, delayed hydride cracking, crudding/corrosion, cladding creep collapse, and undetected manufacturing defects (Yang 1997, FCF 1996). Debris and grid fretting appear to be the dominant causes of failure in PWRs, while pellet-clad interaction and crud-induced corrosion appear to be the dominant causes of failure in BWRs. Only two of the fuel rod failure mechanisms identified above are applicable to waste packages. These are handling damage and manufacturing defects. Handling damage represents a relatively minor cause of fuel failures. It can occur during fabrication if loaded fuel rods are subjected to excessive flexing that causes defects which lead to in-core failure, or as a result of drops, or other handling accidents which could occur at the utility. During the period from 1989 through 1995, there were a total of 10 handling damage failures in a population of 21,810 PWR assemblies (a rate of 4.6 x 10⁻⁴
per assembly; Yang 1997). In each case, only a few rods in each assembly were actually damaged. Manufacturing defects also represent a small fraction of fuel failures. Types of manufacturing defects associated with the cladding include: contamination by solvents, oils or filings, flawed or missing seal welds, flawed, missing or mislocated endcap welds, base metal flaws (stringers, inclusions), and out-of-spec material (FCF 1996). Rates of fuel rod failure due to manufacturing defects are generally around 10-5
per rod. General Electric reports only 47 manufacturing defect-related failures in 4,734,412 rods fabricated between 1974 and 1993 (Potts and Proebstle 1994, p. 92), which yields a rate of 9.9 x 10⁻⁶
per rod. As of October 1990, Advanced Nuclear Fuels (now owned by Siemens) had experienced 7 BWR fuel rod failures and 9 PWR fuel rod failures related to manufacturing defects out of 570,200 BWR fuel rods and 1,391,740 PWR fuel rods placed into service (Tschoepe et al. 1994). The resulting rates are 1.2 x 10⁻⁵, 6.4 x 10⁻⁶, and 8.2 x 10⁻⁶
for BWR, PWR, and combined failures, respectively. Framatome Cogema Fuels (FCF) does not have a manufacturing defect category, but reports only one failure due to unknown causes out of 400,000 Mark-BW rods fabricated between 1987 and 1999 (FCF 1996). This yields a rate of 2.5 x 10⁻⁶
unknown (possibly manufacturing defect) failures per rod. The only defect-specific occurrence rate was obtained from FCF, where there was one occurrence of a missing weld that was not found by inspection, out of approximately 2.3 million rods fabricated to present (FCF 1996). This yields a rate of 4.3 x 10⁻⁷
per rod for this defect. Unfortunately, none of the other sources provided data on the occurrence rate of specific manufacturing defects. While this review has provided general information on the reliability of fuel rods, the failure rate data cannot be directly applied to waste packages due to significant differences in construction and operational conditions. However, general types of manufacturing defects were identified in the review that may be applicable to waste packages. These types of defects are:

23
• Weld flaws • Base metal flaws • Mislocated welds • Contamination • Missing welds • Material out-of-specification • Handling damage The applicability of these types of defects to waste packages, and their potential consequences to postclosure performance, are discussed in subsequent sections of this report. 6.3 Underground Storage Tanks A substantial amount of information was also available on causes of early failure for underground storage tank (UST) systems. The most extensive data source, compiled by the Environmental Protection Agency, provides data on a large population of bare steel, clad/coated steel, and fiberglass reinforced plastic tank systems through 1987 (EPA 1987a and 1987b). While overfilling and leakage of attached piping are dominant contributors to leakage from UST systems, failure of the tank itself is also a significant contributor. The majority of the tanks in service at the time were bare steel tanks, and 95% of those failures were indicated as being caused by corrosion (EPA 1987a). One interesting observation was that many bare steel tanks that have been unearthed were found to have corrosion holes that were plugged with corrosion product and showed no signs of leakage (EPA 1987a). The study also indicates that 5 to 7% of bare steel tanks actually leaked when they were tested for the first time (EPA 1987a) due to manufacturing or installation defects. However, failures found during such a leak test would generally be repaired, and the fraction of the total population initially failed by unidentified defects would be much lower. The study indicates that 4% of a population of 980 tanks were found to be leaking, and 0.9% of 24,452 leaking tanks were found to be leaking in within 0 to 5 years of being placed into service (EPA 1987a). This suggests an upper bound of approximately 0.04% on the fraction of the total population initially failed by an unidentified defect. Additional information provided by the Steel Tank Institute indicates that the fraction of the population failed by unidentified manufacturing defects is closer to 0.0003% (Grainawi 1999). Types of non-corrosion defects identified as causing failure include installation damage (EPA 1987a) or failure of weld seams (EPA 1987b).

24
While this review has provided general information on the fraction of the total population of USTs that may be initially failed, rates of early failure by defects are generally obscured by the high rate of early corrosion failures. The information obtained is not directly applicable to waste packages because bare steel USTs are basically a single, less robust, non-corrosion resistant barrier to release. However, it still indicates that even commercial grade quality controls can produce components that have a relatively low rate of unidentified failures entering service. In addition, general types of manufacturing defects were identified in the review that may be applicable to waste packages. These types of defects are: • Weld flaws • Handling/installation damage The applicability of these types of defects to waste packages, and their potential consequences to postclosure performance, are discussed in subsequent sections of this report. 6.4 Radioactive Cesium Capsules During the period between 1974 and 1983, 1,600 radioactive cesium capsules were fabricated at the Department of Energy’s Hanford facility for use by commercial companies as gamma sources (Tschoepe et al. 1994). One of these capsules failed during 1988 as a result of its use in environmental conditions that were drastically different from those for which the capsules were designed and from the development test conditions. An investigation into this failure concluded that, despite other deficiencies that were found, the capsule would not have failed if it had operated in the environment for which it was designed. The remaining capsules were recalled to Hanford after this incident, and there have been no other failures to date. Thus, the failure rate to date is 6.3 x 10⁻⁴
per capsule. While this type of administrative/operational error does not represent an actual defect in the fabrication of the component, it, nonetheless, caused an early failure. Therefore, the applicability of this type of defect to waste packages, and its potential consequences to postclosure performance, are discussed in subsequent sections of this report. 6.5 Dry Storage Casks for Spent Nuclear Fuel Dry storage casks that are sealed with a closure weld (as opposed to bolting) represent the closest analog to waste packages that can be found. Examples include the Dry Shielded Canister that is part of TransNuclear’s NUHOMS system, and the Ventilated Storage Cask Model No. 24 (VSC-24) system fabricated by Sierra Nuclear Corporation (Hodges 1998). While there have been no recorded cases of closure welds failing after casks were placed into service, there have been four cases where cracks in closure welds have been identified during post-weld inspection of the cask (Hodges 1998). All of
25
these cases have been associated with the VSC-24, of which there were 19 in service through July 1998. Table 2 summarizes relevant information on each of the cracking events. Figure 6 provides an illustration of the VSC-24 closure welds. A VSC-24 Owners Group weld review team, composed of industry experts in metallurgy, welding, and NDE, evaluated each of the four weld cracking events to identify the root cause(s). The team concluded that the Palisades weld crack was caused by an existing condition in the rolling plane of the shell material that was opened up by the process of making the shield lid weld (Hodges 1998). Metallographic analysis revealed a crack that propagated along prior austenitic grain boundaries of a pre-existing weld of unknown origin (the weld had not been documented during fabrication). This defect may have resulted from improper repair, or incomplete removal, of temporary low quality welds used to facilitate the fabrication process (i.e., attachment of strong backs to assist in the rolling of plate material). The causes of the weld cracks at Point Beach were found to be associated with weld flaws caused by poor welding technique and moisture contamination (Hodges 1998). The cracks on the root pass of the structural lid-to-shell weld were caused by wide fit-up gaps that were not properly filled by the welding technique. The cracking and weld porosity found in the structural lid-to-shield lid seal weld were found to be caused by moisture contamination of the weld. The moisture came from water forced out of the drain line during cask loading. The team concluded that none of the cracks at Point Beach were caused by the mechanism that produced the Palisades cracks. The crack in the shield lid-to-shell weld for the first cask loaded at Arkansas Nuclear One was initially attributed to lamellar tearing based on visual observations of the crack by the welders before it was repaired (Hodges 1998). However, it was later shown that this crack was similar in appearance to the second crack that was discovered, which was attributed to hydrogen-induced cracking (HIC). The HIC was attributed to 1) high hydrogen content of the weld wire, 2) susceptible microstructure of the steel welded, and 3) a highly restrained weld joint configuration leading to residual stresses at or near the yield level. General types of manufacturing defects were identified in the review that may be applicable to waste packages. These types of defects are: • Weld flaws • Base metal flaws • Contamination The applicability of these types of defects to waste packages, and their potential consequences to postclosure performance, are discussed in subsequent sections of this report.

26
Table 2. Summary of VSC-24 Weld Cracking Events (DOE 2000)
Figure 6. Illustration of Closure Welds for the VSC-24 Dry Storage Cask (DOE 2000)

27
6.6 Tin-plate Cans Another source of data on the reliability of welded metallic canisters was obtained by contacting the canning industry. SST Food Machinery reports that 0.15 mm resistance-welded tin-plate cans that are fabricated and inspected using automation have a failure rate of 1.5 in 10,000 cans at the leak tester, and essentially a “zero” failure rate thereafter (Ros 1998). No information was provided on the causes of failure. While this information is not directly applicable to waste packages due to differences in fabrication methods and materials, it still indicates that even commercial grade quality controls can produce components that have a relatively low rate of unidentified failures entering service. 6.7 Summary Table 3 briefly summarizes the information obtained from the literature search on the rate and causes of manufacturing defects in welded metallic canisters. In general, eleven generic types of defects were identified. These are: • Weld flaws • Base metal flaws • Improper weld material • Improper heat treatment • Improper weld flux material • Poor weld joint design • Contaminants • Mislocated welds • Missing welds • Handling/installation damage • Administrative/operational error Weld flaws (e.g., slag inclusions, porosity, lack of fusion, hydrogen induced cracking) were a dominant contributor to early failure, but usually required an external stimulus (e.g., cyclic fatigue) or environmental condition to cause the flaw to propagate to failure. In many cases, components with unidentified defects entered service not because the defect was missed by an inspection, but because no inspection for that type of defect was required at the time they were fabricated. For dry storage casks, all of the

28
defects were identified by post-weld inspection prior to commencement of the storage phase, and thus do not represent true instances of early failure as it is defined for this analysis. The eleven types of defects are reviewed for their applicability to waste packages. As indicated above, many of the defects require an external stimulus, or the component was not subjected to inspections that would have identified the defect. Furthermore, there is insufficient information available to defensibly relate the cumulative effect of the environment or stresses that the component was subjected to that of the waste package. That is to say, the cumulative effects of the stresses and environmental conditions experienced by a pressure vessel in a 40 to 60 year life equivalent to 100, 1,000, or 10,000 years of waste package lifetime is uncertain. Accordingly, the information on the fraction of components that experienced defect-related failure during their intended service life is not directly applicable to waste packages. In addition, these population-based failure rates do not provide any insight into the time distribution of early failures. However, in some cases, information on the occurrence rate of particular types of defects was obtained from the literature search. This information proved useful in the waste package defect probability and consequence portion of the analysis. Table 3. Summary of Defect-Related Failures in Various Welded Metallic Canisters.

29
7 Early Waste Package Failure Mechanisms The review of early failures of various types of welded metallic canisters previously identified eleven generic types of defects (DOE 2000). Many of these same types of defects could also be introduced to a waste package during fabrication, transport to the repository, storage, loading, or emplacement. However, the following generic defect types are considered not applicable to waste packages: • Improper weld flux material – waste package welds will employ a tungsten-inert-gas
(TIG) welding method that does not use weld flux material1. • Poor joint design – A significant amount of development and testing will have gone
into the selected final-closure, weld-joint design. Lessons learned from the types of closure weld problems that have been experienced in the dry storage cask systems would be expected to be incorporated in the design of closure welds for waste packages. Therefore, it is not expected that generic problems with the design of the weld joint for the waste packages will be an issue. This does not exclude weld flaws or other types of weld related defects that could occur during the closure process.
• Missing welds – Data on the occurrence of this type of defect in fuel rods indicated
that it occurred at a rate on the order of 10-7 per rod. A missing weld on a waste
package would be easier to identify than on a fuel rod. It would have a noticeable effect on the configuration of the waste package (i.e., a missing closure weld could cause the lid to fall off when the waste package is rotated to a horizontal position). Therefore, it is expected that the occurrence rate of this defect for a waste package would be much less than 10-8
per waste package. • Mislocated welds – This defect is mainly applicable to very small, single pass welds
(i.e., fuel rod end caps). For larger multi-pass welds, such as those on the waste package, any significant mislocation of the electrode would cause the weld arc to not strike. This would be immediately obvious to both the operator and the control system for the automated welder.
• The remaining defects are evaluated in the following subsections. Similar types of
defects, such as weld and base metal flaws, have been grouped together. For each category of defects, the probability of occurrence in a waste package and the consequences to the long-term performance of the package, should it occur, are estimated. Users of this information should verify that the assumptions made regarding waste package fabrication and inspection methods are applicable to the waste package design being considered.
1 Some welding technologies, such as electron beam welding (EBW) and friction stir welding (FSW) which are under consideration for canister closure in the Swedish programme, do not employ flux materials. These welding techniques have the potential to produce fewer weld defects and better quality welds.

30
7.1 Weld and Base Metal Flaws Of the various types of defects that could be present on the waste package, weld flaws have been the most extensively studied. This research has been directed toward providing inputs that describe the number and sizes of flaws in welds to support probabilistic structural mechanics models for predicting the reliability of piping and reactor vessels. Work performed by Pacific Northwest National Laboratory and Rolls-Royce has lead to the development of the RR-PRODIGAL weld simulation code (Chapman et al. 1996). This code uses mathematical models and expert elicitation results to simulate the weld manufacture, the errors that lead to different types of flaws, and the reliability of various inspection methods for identifying flaws. Types of flaws simulated include centerline cracking, heat affected zone cracking (hydrogen induced cracking), lack of fusion, slag inclusions, and porosity. Flaw densities and size distributions are then developed from the simulated weld. Comparisons of flaw frequencies predicted by RR-PRODIGAL with observed flaws found in actual piping and vessel welds have been performed in an effort to benchmark the code. The results provided by RR-PRODIGAL were found to be consistent with measured flaw data, or conservative by a factor as large as ten (Simonen and Chapman 1999). Recently, the Nuclear Regulatory Commission has sponsored research, using RR-PRODIGAL, to support the development of NRC guidance for the implementation of risk-informed in-service inspection of piping. A matrix of cases were run to investigate the effects of weld thickness, material, welding method, and post-weld inspection(s) of flaw density and size distribution (Khaleel et al. 1999). The results of this study will provide the information necessary to allow initial estimates of flaw frequency and size distribution to be performed for the waste package barriers. The above-mentioned study determined that the log-normal distribution provided the best fit to the flaw size data (Khaleel et al. 1999). Least squares fits of the data for TIG welded stainless steel (Khaleel et al. 1999) provided the following expressions for the median flaw size (in inches) and shape parameter (standard deviation of ln[x]) of the log-normal distribution as a function of weld thickness (x, in inches):
200797.00445.01159.0 xxmedian +−==µ
207288.03425.009733.0 xx −+=σ The lognormal cumulative distribution function has the form:
θσ
µθθπσ
daFa
⎥⎦⎤
⎢⎣⎡ −−= ∫ 2
0
)(ln21exp1
21)(
Using the above expressions, complementary cumulative lognormal distributions (CCDFs) of flaw depth as a function of time (θ) were calculated using MicroSoft Excel 97 using the LOGNORMDIST function. Since this Excel function uses a form of the lognormal distribution that uses the mean rather than the median (µ), the mean was

31
taken to be ln(median). This was done for 20 mm (shell) and 25 mm (lid) thick welds in the Alloy 22 barrier, and the 50 mm (shell) and 95 mm (lid) thick welds in the 316 stainless steel barrier. Probability density functions were then numerically derived from each of the CCDFs. Next, the total flaw density (flaws per meter of weld) was estimated. A base flaw density of 0.6839 flaws/meter of weld for a 1-inch thick stainless steel TIG weld performed in the shop (as opposed to field conditions) and subjected to radiographic (RT) and dye penetrant (PT) exams was selected (Khaleel et al. 1999). The resulting flaw density after credit for RT and PT examinations was eliminated was 8.8271 flaws/meter of weld for a 1-inch thick stainless steel shop TIG weld. The flaw density of 0.6839 flaws/ meter weld was measured after RT and PT. An estimate of the flaw density prior to (or without) RT and PT was 8.8271 flaws/ meter weld. This data was normalized to allow an estimate of potential flaws with no RT or PT. Shop conditions were considered to be representative of the highly controlled environment that will be present at the fabricator and in the disposal-canister cell within the waste-handling building. The information on the effect of weld thickness on flaw density was used to adjust the base flaw density to the weld thickness being evaluated (Khaleel et al. 1999). This information, which has been normalized to a weld thickness of 1 inch, is summarized in Figure 7. To develop an estimate of the flaw density for an uninspected weld, the base flaw density was increased by the sum of the flaw reduction factors provided by RT and PT exams. A radiographic exam, and subsequent weld repair, reduces the flaw density by a factor of 12.8 (Khaleel et al. 1999, p. 133). A PT exam, and subsequent weld repair, reduces the density of outer surface breaking flaws by a factor of 31.4 (Khaleel et al. 1999). Since, on average, 0.34% of flaws are surface breaking (Khaleel et al. 1999), this provides an additional increase factor of 0.1 to the total flaw density if a penetrant exam is not performed.
Figure 7. Effect of Weld Thickness on Flaw Density Normalized to a Thickness of 25.4 mm (DOE 2000)

32
Finally, since the waste package closure weld will be performed in a hot cell, and subjected to only an ultrasonic exam (UT), information on the reliability of UT methods must be obtained. Since the version of RR-PRODIGAL used for the NRC study did not include information on UT reliability, a literature search was performed to obtain UT probability of non-detection (PND) as a function of flaw depth. The resulting distributions identified during this search are summarized in Figure 9. Most of the data presented are from NUREG/CR-3110, and represent data collected on UT reliability for detecting intergranular stress corrosion cracking (IGSCC) cracks in stainless steel through 1978 (Bush 1983). This reference summarizes the results of previous studies on UT reliability, and provides parameters for a modified log-normal function giving the probability of non-detection as a function of flaw depth:
*))/ln(*(*)1(*5.0)( aaverfcaPND εε −+= where ε is the lower limit of PND (0.005 based on Bush 1983), erfc is the complementary error function, a is the crack depth in mm, a* is the crack depth in mm with a PND of 0.5, and ν is a unitless shape factor (Bush 1983). A more recent study on UT detection of IGSCC cracks in stainless steel, reported in NUREG/CR-5068, shows significantly improved reliability (Heasler and Doctor 1996). This reference provides the parameters for a complementary logistic function giving probability of non-detection as a function of crack depth for near-side IGSCC. This distribution has the form:
121 ))*exp(1(1)( −−−+−= xxPND ββ
where β1 = -2.67, β2 = 16.709 cm-1, and x is crack depth in cm (Heasler and Doctor 1996). All of the references reviewed indicate that the probability of non-detection for various size defects is dependent on a number of variables such as the type of material, operator skill, access to the weld, and type of defect. Therefore, since these variables cannot be completely defined at this time, the modified log-normal distribution showing a 50% probability of detection for a 2.5 mm defect, and a more conservative non-detection probability for larger defects, was selected for use. This distribution essentially represents the mid-point between the most optimistic and pessimistic distributions for probability of non-detection. Using the information on linear flaw density, flaw size distribution, and inspection reliability presented above, and information on various weld lengths, frequencies of various size outer surface breaking weld flaws have been estimated. The procedure is essentially the same for all cases. First, the total flaws per type of waste package weld was calculated by multiplying the weld length by the linear flaw density and by an adjustment factor for the weld thickness summarized in Figure 8. The base linear flaw density with credit for RT and PT inspections was used for the shell and bottom lid welds, and the uninspected flaw density was used for the top lid closure weld.

33
Figure 8. Probability of Non-Detection for Ultrasonic Examination from Various Sources (DOE 2000)
Figure 9. Size Distribution for Indicated Frequency of Occurrence for Outer Surface Breaking Flaws in Waste Package Alloy 22 Shell Welds (Monteleone 1998).

34
Next, the flaw size distribution for that weld thickness was used to determine the probability that a flaw would have a size within a given range. A range size of 0.5% of the weld thickness was used. This was the largest range size that could be used without introducing any significant (within 2 significant figures) amount numerical error associated with discretizing a continuous size distribution. The probability for each range was then multiplied by the total number of flaws per weld to determine the expected number of flaws within that size range. For welds subjected to a UT inspection, the expected number of flaws within each range was then reduced by multiplying by the PND for the lower end of the size range (this is conservative because the PND is higher for smaller flaws). The UT PND is based on a single angle UT examination, and a multi-angle examination is planned for the lid welds (possibly as many as four different angles; see CRWMS M&O 1998). Hence, the square of the PND was used for the lid welds (this effectively treats a multi-angle exam as two independent examinations). For all cases, each range was then multiplied by 0.34% to yield the expected number of outer surface breaking flaws within that range. Finally, the expected number of outer surface breaking flaws in each size range were summed to determine a new value for total flaws per weld which accounts for the UT inspections. A complementary cumulative distribution of outer surface breaking flaw size was also determined. These results are summarized in Figure 9 for the Alloy 22 barrier shell welds, and in Figure 10 for the Alloy 22 barrier lid welds. In addition to the depth of the flaw, the length and orientation of the flaw may also be of interest. Flaw aspect ratios (ratio of flaw length to flaw depth) were reported in one series of pressure vessel weld examinations (total of 2,500 flaws found) to be uniformly distributed between ratios of 2:1 to 10:1, with the deeper flaws tending to have somewhat smaller aspect ratios (Monteleone 1998). Information was also found on the angle between the plane of the flaw and a line normal to the surface of the weld (Chapman and Simonen 1998). For most flaw types, a beta distribution between +5° and -5° from a line normal to the surface is indicated. For shrinkage cracks, the distribution is between ±15°, and for slag or lack of fusion between weld runs, the distribution is between 70° and 90° from a line normal to the weld surface. No information was found in the literature regarding angle of the flaw from a line parallel to the direction of the weld. However, most planar defects, such as lack of fusion and slag inclusions would logically be expected to be oriented within a few degrees of the same direction in which the weld head is moving. In contrast to the wealth of information on the occurrence of weld flaws, information on the occurrence of flaws in base metal material is sparse. The only recorded data on the occurrence of base metal flaws was obtained from detailed ultrasonic examination of an unused reactor pressure vessel (Monteleone 1998). While the primary emphasis of this study was to obtain data on the density and size distribution of weld flaws, flaw densities in the base metal regions just outside of the heat affected zone were also examined. Flaw densities in the base metal region were found to be about an order of magnitude lower than flaw densities in the weld region (Monteleone 1998). However, since metallographic studies of the base metal were not performed, the percentage of
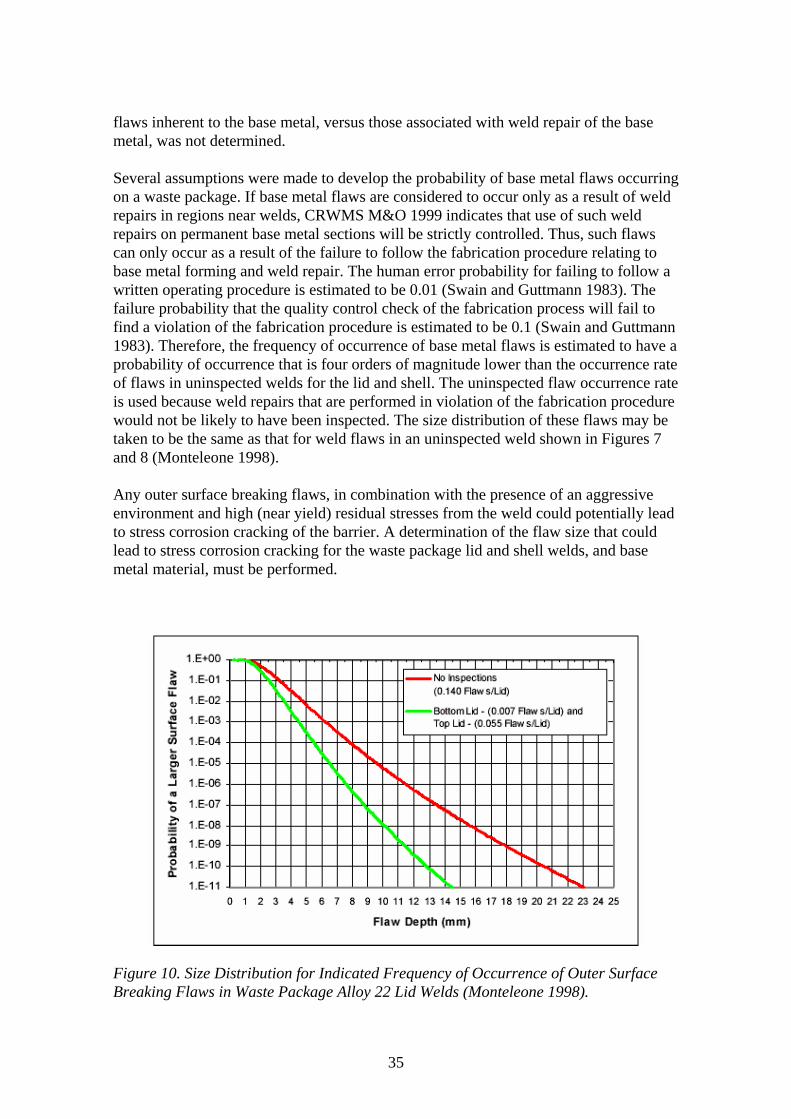
35
flaws inherent to the base metal, versus those associated with weld repair of the base metal, was not determined. Several assumptions were made to develop the probability of base metal flaws occurring on a waste package. If base metal flaws are considered to occur only as a result of weld repairs in regions near welds, CRWMS M&O 1999 indicates that use of such weld repairs on permanent base metal sections will be strictly controlled. Thus, such flaws can only occur as a result of the failure to follow the fabrication procedure relating to base metal forming and weld repair. The human error probability for failing to follow a written operating procedure is estimated to be 0.01 (Swain and Guttmann 1983). The failure probability that the quality control check of the fabrication process will fail to find a violation of the fabrication procedure is estimated to be 0.1 (Swain and Guttmann 1983). Therefore, the frequency of occurrence of base metal flaws is estimated to have a probability of occurrence that is four orders of magnitude lower than the occurrence rate of flaws in uninspected welds for the lid and shell. The uninspected flaw occurrence rate is used because weld repairs that are performed in violation of the fabrication procedure would not be likely to have been inspected. The size distribution of these flaws may be taken to be the same as that for weld flaws in an uninspected weld shown in Figures 7 and 8 (Monteleone 1998). Any outer surface breaking flaws, in combination with the presence of an aggressive environment and high (near yield) residual stresses from the weld could potentially lead to stress corrosion cracking of the barrier. A determination of the flaw size that could lead to stress corrosion cracking for the waste package lid and shell welds, and base metal material, must be performed.
Figure 10. Size Distribution for Indicated Frequency of Occurrence of Outer Surface Breaking Flaws in Waste Package Alloy 22 Lid Welds (Monteleone 1998).

36
Another possible consequence of the surface flaws of any size is the growth of these flaws into deeper pits or crevices. This, however, is highly unlikely in view of the high resistance of the materials such as Alloy 22 to pitting under the expected repository conditions. The critical pitting temperature for Alloy 22 in much more aggressive environments has been measured to be higher than 150 °C (Gdowski 1991). Therefore the surface flaws are not expected to grow by pitting mechanisms under the repository conditions. 7.2 Improper Weld Material While the improper weld material defect was responsible for early failures in several of the canister types examined in the previous section of this report, there is little information to support the development of its probability of occurrence for a waste package. A number of assumptions were made to estimate the probability of an improper weld material defect occurring on a waste package. The only well documented occurrence of the extent to which a weld population was affected by improper weld material is described in Babcock and Wilcox’s response to NRC Bulletin 78-12 (B&W 1979). This inspection of all vendors’ welding records was prompted by the discovery that the weld chemistry of a portion of the Crystal River 3 surveillance block weld did not meet the specification requirements. A 1,706,556 lb of low-alloy, steel-weld wire (B&W 1979) was used by B&W to make 47 reactor vessels from 1965 to 1975 (B&W 1979, Table 1). Out of this total, it was estimated that 65 lb (one spool) to 350 lb (half of a drum) of weld wire was affected (B&W 1979). This population of vessels represents approximately 30% of the vessels fabricated for use in the United States (ANS 1999), and no other instances of improper weld material were reported in other vendors’ responses to NRC Bulletin 78-12. Thus, the total mass of weld material used in this estimate is increased to 5,688,520 lb. Based on this information, the estimated probability of occurrence for improper weld material ranges from 1 x 10⁻⁵
to 6 x 10⁻⁵ per lb of weld material. A mean probability of 3.5 x 10⁻⁵
per lb will be used for this analysis. The general conclusion of the B&W response to NRC Bulletin 78-12 was that the evolution of shop practices as of 1979 had virtually eliminated the possibility that off-chemistry weld material would be used in the fabrication of a reactor vessel. New instrumentation, such as portable x-ray spectroscopy equipment, makes it possible to perform quick field measurements of material compositions (ASM International 1990). However, there is still the possibility that the operator performing such verifications fails to perform the operation correctly. This human error probability can be approximated by the probability of improperly checking a digital display, 0.001 (Swain and Guttmann 1983). Therefore, based on the assumption that such verifications will be performed for waste package weld material, the above probability of improper weld material is reduced to 3.5 x 10⁻⁸
per lb of weld material. Using an assumed mass of weld material in the Alloy 22 barrier of 200 kg (440 lb), this yields an estimated probability of 1.5 x 10⁻⁵
per waste package for this defect. Since the

37
stainless steel structural barrier is little over twice the thickness of the Alloy 22 barrier, but has a smaller outer diameter, it is estimated that the probability of the use of improper weld material is approximately twice that of the outer barrier. In the case of the improper weld material used in the reactor vessel weld discussed above, the substituted material had a composition that was only slightly different than the specified material, and further evaluation indicated that no impact on performance would be expected. However, there have been pressure vessel failures associated with the use of incorrect weld material, although it is not stated whether the specified material was incorrect, or the material used was not that which was specified. In the case of the waste package, it is expected that any use of incorrect material would be similar to the reactor vessel case, and simply result in the use of another nickel based alloy for the outer barrier, or another stainless steel alloy for the structural barrier. However, such substitution could still have an impact on the corrosion performance of the barrier. 7.3 Improper Heat Treatment To quantify the probability of a waste package being put into service that was subject to an improper heat treatment, an event sequence tree was developed focusing on human errors. The decision points are mainly human errors; there is one hardware failure. Many assumptions have been made to develop the event sequence tree. The information provided by Cogar (1999) on the general elements of the heat treatment (annealing) process for waste package components was also used in the development of the event sequence tree. The following human error probabilities (HEPs) and equipment failure rates have been used to quantify the tree: • Failure to match components with proper written procedures is approximated by
failing to read a digital display with an HEP of 0.001 (Swain and Guttmann 1983, pp. 20-26).
• Failure to follow a written operating procedure has a HEP of 0.01 (Swain and
Guttmann 1983, pp. 20-22). Improper heat treatment from failure to follow a written procedure is considered to require two failures of the procedure or a single failure and a failure of self-recovery – either way, a HEP of (0.01)(0.01)= 1 x 10⁻⁴
is used. • Failure of QA is approximated by a check failure using written materials with a HEP
of 0.1 (Swain and Guttmann 1983, pp. 20-38). • Failure of the independent lab check is approximated by failure to follow a written
operating procedure with an HEP of 0.01 (Swain and Guttmann 1983, pp. 20-22). The probability of a catastrophic failure for the furnace is estimated to be 0.001; the probability of a non-catastrophic failure for the furnace is 0.002. The former probability is developed by considering a simple/conceptual furnace. The furnace is composed of a heater, with a failure rate of 2.5 x 10⁻⁵
per hour (high, catastrophic rate from IEEE 1984,

38
p. 283), and a thermostat, with a failure rate of 1.7 x 10⁻⁵ per hour (high, all modes rate
from IEEE 1984, p. 543). If failure of either of these components during the waste package heat treatment is considered to lead to catastrophic failure of the furnace, the resulting probability of furnace failure during waste package heat treatment is 0.001 ([1.7 + 2.5] x 10-5/hr x 24 hr = 0.001). The non-catastrophic failure rate was conservatively taken to be twice the catastrophic failure rate. Based on a review of the failure data for a variety of components in IEEE (1984), the non-catastrophic failure rate for most components is generally no more than twice the catastrophic failure rate, and is often lower. Table 4 provides detailed descriptions of the actions in the improper heat treatment event sequence tree. The event sequence tree developed for this case had 23 sequences; each was labeled with an identification multiplying the probabilities of each of the events that appear in a given sequence. There are three end-state status indicators, which are described in Table 5. Table 4. Description of Actions in Improper Heat Treatment Event Sequence Tree (DOE 2000)

39
Table 5. End-state Status Indicators for Improper Heat Treatment Event Sequence Tree
Note that some of the sequences are truncated (only partially developed). These are sequences that logically end with some discovery (i.e., QA result, catastrophic failures). The probability of a sequence that results in a waste package with improper heat treatment being placed in service is identified in the analysis. The sum of these sequences, that is, the probability that a waste package (both barriers) will be placed into service with an improper heat treatment is 2.2 x 10⁻⁵. Note that 95% of this probability comes from a single sequence in which a non-catastrophic equipment failure produces a defect in the metal during ramp-up/hold-time that is not identifiable during the QA check (since this is not a procedure error). There is only one opportunity (with this model) to uncover the defect in the independent laboratory check. There is some subjectivity in estimating the human error probabilities; as such, the Excel spreadsheet has been developed to facilitate sensitivity analyses. Any of the failure probabilities (except where “none” is indicated) can be changed in the table to the left of the event sequence tree, except for the F-series actions that were itemized separately on the table. For example, if events D and G are multiplied by 32 (the error factor in Swain and Guttmann (1983)) to a human error probability of (0.01)(0.01), the resulting failure probability is 3.2 x 10⁻⁵. (Note there is no absolute linear effect; the sum of failure probabilities increase by a factor of 1.4.) It should be noted that the probability of improper heat treatment developed here is independently corroborated by the pressure vessel failure statistics reported previously. Those statistics indicated that 1 vessel in 20,000 experienced failure due to improper heat treatment. This yields a probability of 5 x 10⁻⁵
per vessel for this type of defect. While the likelihood of improper heat treatment is extremely small due to both administrative (procedural) controls and multiple checks, the consequences of improper heat treatment can be significant depending upon the nature of the error. Improper rate of cooling of alloys such as Alloy 22 may result in the precipitation of carbides and intermetallic phases in the grain boundaries. A review of the isothermal time-temperature-precipitation diagram for Alloy 22 suggests that the cooling down to 700-750 °C, from the solution temperature of 1121 °C within the first 0.1 hour (6 minutes) is required to avoid formation of grain boundary precipitates (Gdowski 1991).

40
In Alloy 22, formation of grain boundary precipitates and long range ordering can lead to several different adverse consequences. Under the repository conditions, the waste package is expected to experience temperatures in the range of 200-250 °C for hundreds of years and during this period, ordering and precipitation of the carbides and intermetallic phases will continue. Formation of grain boundary precipitates is accompanied by depletion of Cr and Mo near the grain boundaries, and as a result, the susceptibility of the material to localized corrosion by attack along the grain boundaries is increased (Agarwal and Herda 1997). Formation of grain boundary precipitates also enhances the susceptibility of the material to stress corrosion cracking. Improper heat treatment is also a problem for the stainless steel structural shell. This material could suffer from the same type of grain boundary precipitation of carbides and fail by IGSCC (Clarke and Gordon 1973). 7.4 Contamination To quantify the probability of a waste package being put into service after being subjected to (corrosion enhancing) surface contamination, an event sequence tree was developed. For the introduction of this defect (contamination), the event sequence tree estimates the probability that contamination occurred on a per cleaning basis. This probability is then multiplied by the number of cleanings for the outer barrier. The last cleaning of the outer barrier also considers the probability that a waste package already contaminated was not properly cleaned (leaving a foreign material on the waste package). Many assumptions have been made to develop the event sequence tree and subsequent calculations (as discussed below). The input provided in CRWMS M&O (1999) on the general elements of the cleaning process for waste package components was used in the development of the event sequence tree. The following human error probabilities and equipment/process failure rates have been used to quantify the tree: • Failure to have the proper (approved) cleaning agents on site is estimated to be
0.001. This is based on the expectation that mislabeling of cleaning supplies or misunderstanding what are allowable supplies by the person stocking the storage room is similar to failure to follow a written procedure (0.01 from Swain and Guttmann (1983)). It is assumed that the stocking person also fails to recover during a self-check of his activities (0.1 from Swain and Guttmann (1983)).
• Failure of the operator to check the cleaner and failure of the post-cleaning check
are approximated by a check failure using written procedures with an HEP of 0.1 (Swain and Guttmann 1983); the lower limit 0.1/5 = 0.02 is used for the more rigorous check.
• Failure of the cleaning process is approximated by a failure to follow a written
operating procedure with an HEP of 0.01 (Swain and Guttmann 1983).
41
• The probability that there is contamination on the waste package just prior to its final cleaning is 0.0163. This is a high probability based on limited data from the commercial nuclear industry, and should be considered very conservative. This probability is based on the two examples of contamination identified earlier, the Indian Point 3 steam generators and the nuclear fuel rods. In the first case, a total of four contaminated steam generators were discovered. Comparable components include reactor coolant system (RCS) hot and cold legs, the reactor vessel, and the pressurizer. Since the four failures were identical and commonly caused, treat each of the five major components as five single entities. There have been approximated 75 operating PWRs operating in the U.S. (ANS 1999). Thus, a rough probability of a contaminated component is: 1/(75 x 5), where the “5” represents the five RCS entities. This probability (0.0027) represents the event that a contaminated component was put into service after cleaning, so the probability that a contaminated component exists is 0.0027 divided by the failure of the cleaning process, for which 0.01 has been used above, or 0.0027/0.01 = 0.27. In the case of the fuel rods, Section 6.1.2 reports that the rate of manufacturing defect failure in fuel rods is generally in the range of 10-5, and that a significant contributor is internal contamination. Conservatively assuming that all manufacturing defect related failures of fuel rods are related to contamination, and using the 0.01 probability of placing a contaminated component into service, yields a contamination occurrence rate of 10-3. The 0.0163 probability of initial contamination of a waste package was taken to be the logarithmic midpoint between the RCS component and fuel rod contamination probabilities estimated above.
Table 6 provides detailed descriptions of the actions in the surface contamination event sequence tree. The event sequence tree shows nine developed sequences; each was labeled with an identification number, an end-state status, and an end-state probability. The probability was calculated by multiplying the probabilities of each of the events that appear in a given sequence. There are three end-state status indicators, as indicated in Table 7. Table 6. Description of Actions in Surface Contamination Event Sequence Tree (DOE 2000)

42
Table 7. End-state Status Indicators for Surface Contamination Event Sequence Tree (DOE 2000)
Note that three of the sequences are truncated (only partially developed). In sequence (1) the correct cleaning agent is used on a component with no contamination; there can be no failure state no matter how poorly the cleaning or subsequent check is performed. In sequence (2), while there is a contaminated component, the cleaning process is successful in removing it; the check can only verify this. At worst, an incorrect check will remove an acceptable component from service. The last sequence, (5) ends with the discovery of an improper cleaning agent prior to use. The contamination probability per cleaning estimated by the event sequence tree is 1.0 x 10⁻⁵; the probability estimated for the last cleaning is 1.3 x 10⁻⁵. It is estimated that the outer barrier will be subjected to six cleanings prior to the final cleaning before emplacement (three welds, prior to heat treatment/annealing, prior to shipping, and prior to SNF loading). Therefore, the total probability for a waste package with a contaminated Alloy 22 outer barrier is: 6 x [1.0 x 10-5
] + 1.3 x 10-5 =7.3 x 10⁻⁵. Since the
inner stainless steel barrier would only be subjected to four cleanings (three welds and prior to fit into inner barrier), the probability of contamination is lower: 4 x [1.0 x 10-5]
= 4 x 10⁻⁵ per waste package.
The specification for fabrication of the waste packages will restrict the chemical compositions of the cleaning materials and solvents (CRWMS M&O 1999). Currently the allowable materials are restricted as follows:
“Expendable materials such as cleaning solvents, temperature indication sticks, tapes, nondestructive examination (NDE) penetrant materials, and other compatible materials that contact stainless steel or Inconel surfaces shall be low chloride/halogen (less than 100 parts per million [ppm]) and shall not contain more than 200 ppm total of metal and metal salts such as zinc, lead, copper, cadmium, mercury or other low melting metals.” This concentration shall be determined as the net concentration of these metals, regardless of whether they are present as metals, alloys, salts, or other compounds. In addition, no halogenated cleaning agents or solvents shall be used on austenitic stainless steel or Inconel except technical grade trichlorotrifluoroethane (FREON TF).”

43
The fabrication process also calls for removal of all contaminants prior to heat treatment, and other operations. However, as indicated above, human error could cause either the cleaning to be insufficiently carried out or not carried out at all. This could potentially lead to surfaces contaminated with dried solvents. The consequence of this error is not expected to be significant from the corrosion standpoint. The waste package materials have been undergoing long-term corrosion tests in concentrated (1,000 times) environments expected in the repository, and these test environments include significantly high chloride concentrations (~7,000 ppm) and acidic conditions (pH of 2.7) compared to the potential contamination and do not exhibit increased corrosion rates (McCright 1998). 7.5 Improper Handling This section estimates the probability that a waste package is subjected to handling damage during transport to the repository or during subsequent handling at the repository. Handling damage is defined as any gouging or denting of the waste package surface that is significant enough to affect postclosure performance of the Alloy 22 barrier. For this analysis, it is considered that damage significant enough to cause penetration of the barrier would so deform the package that it would not fail to go unnoticed (malicious intent is not considered). Furthermore, such a breach occurring after SNF had been loaded would be likely to activate alarms that would facilitate its identification more readily than a passive inspection. To develop the probability of handling damage, an event sequence tree focusing on human errors was constructed. The probability of this defect is estimated on a per waste package basis. Several assumptions have been made to develop the event sequence tree and subsequent calculations (as discussed below). These assumptions were summarized previously. The following human error probabilities and equipment/process failure rates have been used to quantify the tree: • Handling damage during transport of the waste package or handling at the repository
occurs with a probability of 0.0005 based on the rate of PWR fuel assembly handling damage.
• Failure of the operator moving the waste package to realize that he has caused
damage to the package as a result of a handling error is taken to be 0.01. NRC (1983, pp. 4-24) indicates that most tasks performed in nuclear industry environments have very low human error probabilities, typically on the order of 10-3. This has been conservatively increased by a factor of 10, to 0.01, for this situation. This is further supported by HEPs that are available for events where an operator fails to notice that a component being manually operated has not functioned properly. For example, the HEP for a person failing to detect a stuck manual valve with no means of position indication is 0.01 (Swain and Guttmann 1983)

44
• Failure of the inspections for damage are approximated by a check failure using written procedures with a HEP of 0.1 (Swain and Guttmann 1983).
Table 8 provides detailed descriptions of the actions in the handling-damage, event-sequence tree. The event sequence tree shows ten developed sequences; each is labeled with an identification number, an end-state status, and an end-state probability. The probability is calculated by multiplying the probabilities of each of the events that appear in a given sequence. There are three end-state status indicators (OK-W, OK-R, and NOK) that follow the same pattern as in Tables 5 and 7 for waste packages that are placed into service with unidentified handling damage. The resulting probability that a waste package is emplaced with unidentified handling damage is 5.1 x 10⁻⁶. Discussion of the truncated sequences and uncertainty is similar to the discussion provided for the improper heat treatment and surface contamination sequence event trees. Note, in particular, that after damage due to transport is discovered; the waste package would then be removed from the stream to be repaired and later re-enter the waste package stream. The probability of damage to the inner stainless steel barrier is much lower than for the outer Alloy 22 barrier, because it can only be scratched or gouged prior to fit-up with the outer barrier at the fabricator. Events B, C, and D would then represent handling and inspection of the inner barrier at the fabricator prior to fit-up. The resulting probability of unidentified stainless steel barrier handling damage is 5 x 10⁻⁷
per waste package. Gouges on the waste package outer surface may provide sites for crevice corrosion of the Alloy 22. This would also be the case for gouges on the outer surface of the stainless steel barrier once the Alloy 22 barrier has been penetrated. Table 8. Description of Actions in Handling Damage Event Sequence Tree (DOE 2000)

45
8 Prototype Fabrication and Weld Flaw Analysis Small-scale waste package prototypes similar to those proposed for use at the Yucca Mountain site have been fabricated and tested for residual stresses. This initial fabrication included the completion of a full diameter, one-quarter height mock up of the waste package. This fabrication was completed at the Framatome Cogema facility in Lynchburg, Virginia. The mock up was then shipped to Nooter, Inc. in St. Louis, Missouri for heat treatment and returned to Lynchburg for final closure welding. This fabrication was completed during calendar year 2001. The final solution annealing of the outer barrier Alloy 22 material is currently being planned for November 2002 at AJAX Induction Services in Warren, Ohio. A significant effort to understand the types, distribution, and orientation of weld flaws in the final closure welds of Alloy 22 waste packages was completed by the Yucca Mountain Project during FY 2002. This effort, which was completed by Senior Flexonics (2002), included the fabrication of sixteen full-scale weld ring sets to simulate the final closure weld in a YMP waste package. Each ring was evaluated using ultrasonic (UT), liquid penetrant (PT) and eddy current (ET) non-destructive evaluation (NDE) techniques prior to welding to provide baseline data for the test. The baseline NDE evaluated flaws in four categories (less than 1 mm, 1-4 mm, 4-10 mm and greater than 10 mm). This data formed the baseline data with flaw size, orientation and location described to the degree that the NDE method allowed. Each of the sixteen sets of rings was welded together using cold wire, narrow groove gas tungsten arc welding (GTAW) techniques. Significant difficulty was initially noted this welding effort. A more robust weld fixture and additional tack welds were required to reduce the level of distortion during the welding process.

46

47
9 Conclusion A review is made of recent progress by the US high-level waste repository programme in development of closure techniques for canisters. These canisters will encapsulate spent fuel and high-level borosilicate glass waste forms in waste package for direct geological disposal. In addition, fabrication steps, non-destructive evaluation (NDE) techniques and statistical interpretation of possible manufacturing flaws/ defects from the US repository programme and other industrial fields are reviewed. All of these examples employ materials, welding techniques and fabrication steps that differ from the reference KBS-3 waste-package design. Direct comparison of the US examples to the Swedish situation is further limited by SKB’s current consideration of competing canister closure methods, specifically electron beam welding (EBW) or friction stir welding (FSW). There are, however, certain fundamental issues revealed by these examples that are broadly applicable to future independent review of SKB’s closure methods, NDE testing, and overall encapsulation facility. These issues include: • different types of defects that may arise during canister fabrication, • capabilities and limitation to current NDE methods in detecting flaws, and • development of statistical inferences on rate of fabrication defects based on sparse
NDE data with a finite resolution. Premature failure of canisters attributable to manufacturing defects is, in turn, part of the overall consideration of how the distribution of canister failures affects long-term performance and safety of a repository. This issue is introduced and explored on a preliminary basis in Appendix A of this report.

48

49
10 References Agarwal, D.C. and Herda, W.R., 1997. "The 'C' Family of Ni-Cr-Mo Alloys'
Partnership with the Chemical Process Industry: The Last 70 Years." Materials and Corrosion (Wekstoffe und Korrosion). 48, 542-548. Weinheim, Germany: VCH Verlagsgesellschaft mbH.
Ahn, J., Kawasaki, D. and Chambré, P., 2002, “Relationship among performance of geologic repositories, canister-array configuration, and radionuclide mass in waste”, Nucl. Tech., V. 140, pp. 94-112.
Alexander, W. R., McKinley, I.G., MacKenzie, A.B., and Scott, R.D., 1990, “Verification of matrix diffusion by means of natural decay series disequilibria in a profile across a water-conducting fracture in granitic rock”, Sci. Basis Nuc. Waste Management, XIII, pp. 567-576.
Andersson, J., 1999, “SR 97: Compilation of Data and Data Uncertainties for Radionuclide Transport Calculations,” SKB Technical Report TR 97-18, Swedish Nuclear Fuel and Waste Management Company, Stockholm, Sweden.
ANS (American Nuclear Society) ,1999. "World List of Nuclear Power Plants." Nuclear News, 42, (3), 52-56. La Grange Park, Illinois: American Nuclear Society.
ASM International, 1990. “Properties and Selection: Irons, Steels, and High Performance Alloys.” Volume 1 of Metals Handbook. 10th Edition. Metals Park, Ohio: ASM International.
Atomic Energy of Canada Limited, 1994, “The Disposal of Canada’s Nuclear Fuel Waste: Postclosure Assessment of a Reference System,” AECL-10717/ COG-93-7, Atomic Energy of Canada Limited, Pinawa, Manitoba, Canada.
Babcock & Wilcox (B&W), 1970a. Analysis and Resolution of Dye-Penetrant Indications in Submerged Arc Weld Cladding of Reactor Coolant System Straight Piping. BAW-1363. Barberton, Ohio: Babcock & Wilcox.
Babcock & Wilcox (B&W), 1970b. Analysis and Resolution of Dye-Penetrant Indications in AISI-304 Alloy Cladding of Reactor Coolant System Elbows. BAW-1364. Barberton, Ohio: Babcock & Wilcox.
Babcock & Wilcox (B&W), 1979. Records Investigation Report Related to Off-Chemistry Welds in Materials Surveillance Specimens and Response to IE Bulletins 78-12 and 78-12A - Supplement. March 1979, Mt. Vernon, IN: Babcock & Wilcox.
Bush, S.H., 1983. “Reliability of Nondestructive Examination.” NUREG/CR-3110, Volume 3. Washington, D.C.: U.S. Nuclear Regulatory Commission.
Chapman, O.J.V. and Simonen, F.A., 1998. RR-PRODIGAL - A Model for Estimating the Probabilities of Defects in Reactor Pressure Vessel Welds. NUREG/CR-5505. Washington, D.C.: U.S. Nuclear Regulatory Commission.
Chapman, O.J.V.; Khaleel, M.A.; and Simonen, F.A., 1996. "A Simulation Model for Estimating Probabilities of Defects in Welds." The 1996 ASME Pressure Vessels and Piping Conference, Montreal, Quebec, Canada, July 21-26, 1996, PVP-Volume 323, 375-391. New York, New York: American Society of Mechanical Engineers.

50
Clarke, W.L. and Gordon, G.M., 1973. "Investigation of Stress Corrosion Cracking Susceptibility of Fe-Ni-Cr Alloys in Nuclear Reactor Water Environments." Corrosion, 29, (1), 1-12. Houston, Texas: National Association of Corrosion Engineers.
Cogar, J.A., 1999. "Annealing." E-mail from J.A. Cogar to P. Pasupathi, G. Gordon, and J. Massari (CRWMS M&O), May 28, 1999, with attachment.
CRWMS M&O, 1998. Waste Package Phase II Closure Methods Report. BBA000000-01717-5705-00016 REV 00. Las Vegas, Nevada: CRWMS M&O.
CRWMS M&O, 1999. Waste Package Fabrication Process Report. BBA000000-01717-2500-00010 REV 03. Las Vegas, Nevada: CRWMS M&O.
DOE, 1998, Viability Assessment of a Repository at Yucca Mountain, DOE/RW-0508, U.S. Department of Energy, Washington D.C., December 1998.
DOE (U.S. Department of Energy), 2000, Analysis of Mechanisms for Early Waste Package Failure, ANL-EBS-MD-000023 REV 1, January 2000, Office of Civilian Radioactive Waste Management.
DOE (U.S. Department of Energy), 2001a, Yucca Mountain Science and Engineering Report, DOE/RW-0539, May 2001. Office of Civilian Radioactive Waste Management,
DOE (U.S. Department of Energy), 2001b, Supplemental Science and Performance Analyses, Volume 1: Scientific Bases and Analyses, TDR-MGR-MD-000007 REV 00, June 2001, Office of Civilian Radioactive Waste Management.
DOE (U.S. Department of Energy), 2001c, Supplemental Science and Performance Analyses, Volume 2: Performance Analyses, TDR-MGR-PA-000001 REV 00, July 2001, Office of Civilian Radioactive Waste Management.
DOE (U.S. Department of Energy), 2001d, Yucca Mountain Preliminary Site Suitability Evaluation, DOE/RW-0540, July 2001, Office of Civilian Radioactive Waste Management.
Doubt, G., 1984. Assessing Reliability and Useful Life of Containers for Disposal of Irradiated Fuel Waste. AECL-8328. Chalk River, Ontario, Canada: Atomic Energy of Canada Limited.
EPA (Environmental Protection Agency), 1987a. Causes of Release from UST Systems. EPA 510-R-92-702. Washington, D.C.: Environmental Protection Agency.
EPA (Environmental Protection Agency), 1987b. Causes of Release from UST Systems: Attachments. EPA 510-R-92-703. Washington, D.C.: Environmental Protection Agency.
EPRI (Electric Power Research Institute), 1997. The Technical Basis for the Classification of Failed Fuel in the Back-End of the Fuel Cycle. EPRI TR-108237. Palo Alto, California: Electric Power Research Institute.
Framatome Cogema Fuels (FCF), 1996. Fuel Integrity. Proprietary 12-1244558-00. Lynchburg, Virginia: Framatome Cogema Fuels.

51
Gdowski, G.E., 1991. Survey of Degradation Modes of Four Nickel-Chromium-Molybdenum Alloys. UCRL-ID-108330. Livermore, California: Lawrence Livermore National Laboratory.
Grainawi, L., 1999. "Manufacturing Defects." Memo from L. Grainawi (Steel Tank Institute) to J. Massari (Framatome Technologies), April 20, 1999.
Heasler, P.G. and Doctor, S.R., 1996. Piping Inspection Round Robin. NUREG/CR-5068. Washington, D.C.: U.S. Nuclear Regulatory Commission.
Hodges, M.W., 1998. "Confirmatory Action Letter 97-7-001, Technical Evaluation, Docket No: 72-1007." Washington, D.C.: U.S. Nuclear Regulatory Commission. Accessed 11/02/99. http://www.nrc.gov/OPA/reports/sn072298.htm
IEEE Std 500,1984. IEEE Guide to the Collection and Presentation of Electrical, Electronic, Sensing Component, and Mechanical Equipment Reliability Data for Nuclear-Power Generating Stations. Institute for Electrical and Electronic Engineers, New York, New York.
Johnson, L. and Tait, J., 1997, Release of Segregated Nuclides from Spent Fuel, SKB Technical Report TR 99-09, Swedish Nuclear Fuel and Waste Management Company, Stockholm, Sweden.
KBS, 1983, Final Storage of Spent Nuclear Fuel- KBS-3, 5 volumes, Swedish Nuclear Fuel Supply Company, Stockholm, Sweden.
Khaleel, M.A.; Chapman, O.J.V.; Harris, D.O.; and Simonen, F.A., 1999. "Flaw Size Distribution and Flaw Existence Frequencies in Nuclear Piping." Probabilistic and Environmental Aspects of Fracture and Fatigue: The 1999 ASME Pressure Vessels and Piping Conference, PVP-386, 127-144. New York, New York: American Society of Mechanical Engineers.
McCright, R.D., 1998. Corrosion Data and Modeling Update for Viability Assessment . Volume 3 of Engineered Materials Characterization Report. UCRL-ID-119564, Rev. 1.1. Livermore, California: Lawrence Livermore National Laboratory.
Monteleone, S., 1998. Transactions of the Twenty-Sixth Water Reactor Safety Information Meeting, Held at Bethesda Marriott Hotel, Bethesda, Maryland, October 26-28, 1998. NUREG/CP-0165. Washington, D.C.: U.S. Nuclear Regulatory Commission.
National Board of Boiler and Pressure Vessel Inspectors, 1999. "Incident Reports." Columbus, Ohio: National Board of Boiler and Pressure Vessel Inspectors. Accessed 9/29/99. http://www.nationalboard.com/incidents.html
Nilsson, L., Moreno, L., Neretnieks, I., and Romero, L., 1991, “A Resistance Network Model for Radionuclide Transport into the Near-field Surrounding a Repository for Nuclear Waste,” SKB Technical Report TR 91-30, Swedish Nuclear Fuel and Waste Management Company, Stockholm, Sweden.
Pigford, T., Chambre, P. and Lee, W.W.-L., 1990, A Review of Near-field Mass Transfer in Geologic Disposal Systems, LBL-27045, Lawrence Berkeley Laboratory, University of California, Berkeley, California.
52
Potts, G.A. and Proebstle, R.A., 1994. "Recent GE BWR Fuel Experience." Proceedings of the 1994 International Topical Meeting on Light Water Reactor Fuel Performance, West Palm Beach, Florida, April 17-21, 1994, 87-95. La Grange Park, Illinois: American Nuclear Society.
Ros, L.A., 1998. "Information on Can Defect Rates." E-mail from L. Ros (SST Food Machinery) to J. Massari (Framatome), January 5, 1998.
S.M. Stoller and Company, 1976. Nuclear Power Experience. 44. Boulder, Colorado: S.M. Stoller and Company.
Savage, D. (editor), 1995, The Scientific and Regulatory Basis for the Geological Disposal of Radioactive Waste, John Wiley and Sons, New York, New York.
Senior Flexonics, 2002, “Waste Package Weld Flaw Analysis Project,” presented at The Fifth NiDI Workshop on the Fabrication and Welding of Nickel Alloys and Other Materials for Radioactive Waste Containers, Las Vegas, NV, 17 October 2002, Pathway Senior Operations, Inc.
Shcherbinskii, V.G. and Myakishev, V.M., 1970, “Statistical Distribution of Welding Defects with Respect to Azimuth.” Translated from Defektoskopiya, No. 4, (1970) 143-144. New York, New York: Plenum Publishing.
Simonen, F.A. and Chapman, O.J.V., 1999. "Measured Versus Predicted Distributions of Flaws in Piping Welds." Probabilistic and Environmental Aspects of Fracture and Fatigue: The 1999 ASME Pressure Vessels and Piping Conference, PVP-386, 101-113. New York, New York: American Society of Mechanical Engineers.
Smith, T.A. and Warwick, W.A., 1978. "Survey of Defects in Pressure Vessels Built to High Standards of Construction." The Annual Winter Meeting of the American Society of Mechanical Engineers, San Francisco, California, December 10-15, 1978, PVP-PB-032, 21-53. New York, New York: American Society of Mechanical Engineers.
Spahiu, K., Eklund, U.-B., Cui, D. and Lundstrom, M., 2002, “The influence of near-field redox conditions on spent fuel leaching”, Mat. Res. Soc. Proc., Vol. 713, pp. 633-638.
Swain, A.D. and Guttmann, H.E., 1983. Handbook of Human Reliability Analysis with Emphasis on Nuclear Power Plant Applications (Final Report). NUREG/CR-1278. Washington, D.C.: U.S. Nuclear Regulatory Commission.
Tschoepe, E., III; Lyle, F.F., Jr.; Dancer, D.M.; Interrante, C.G.; and Nair, P.K., 1994. Field Engineering Experience with Structural Materials. San Antonio, Texas: Center for Nuclear Waste Regulatory Analyses.
Yang, R.L., 1997. "Meeting the Challenge of Managing Nuclear Fuel in a Competitive Environment." Proceedings of the 1997 International Topical Meeting on LWR Fuel Performance, Portland, Oregon, March 2-6, 1997, 3-10. La Grange Park, Illinois: American Nuclear Society.

53
Appendix A: Potential Impacts of Canister Failure on Repository Safety A.1 Distribution in Containment Failures over Time The detailed distribution of canister failures over time, will be a function of both • possible pre-mature failures of a small number of canisters because of fabrication
flaws, and • the distribution of failures of non-defected canisters by expected corrosion modes,
typically distributed around a mean containment time. This latter distribution will be a function of type of canister material, operative corrosion modes for the bulk canister material, and variability of repository conditions. As discussed below, this detailed distribution of containment failures over time can affect the calculated release rate of radionuclides, hence safety, of a geological repository for the disposal of spent nuclear fuel. The main report has identified various statistical treatments of canister (specifically, weldment) failures arising from flaws or defects in fabrication. Such failures of weldments can lead to earlier (premature or juvenile) failure of nuclear waste canisters than projections based on application of corrosion models to bulk canister material. Early (within several hundred years after emplacement and repository closure) failure of canisters is of concern for several reasons. First, temperature within the near-field and engineered barrier system (EBS) portion of the repository may still be elevated well above ambient temperature because of radiogenic heating. Most of the parameters used in performance assessment are obtained at lower temperature, and higher temperature may mitigate the effectiveness of certain isolation factors such as radioelement solubilities and sorption. Second, the inventories of several short-lived but highly radiotoxic radionuclides, such as 90Sr and 137Cs, will still be non-negligible in canisters that fail well before 1000 years. While other processes and isolation factors of a geological repository may attenuate the release of such radionuclides, their release behavior under elevated temperature conditions must be separately evaluated. The great majority of fabricated canisters will not be defective. Over time, corrosion of the bulk canister material will lead to thinning of the canister and eventual failure. Consideration must be made of the potential impact of such time-distributed failures on subsequent release of radionuclides. The release rates of most radionuclides from the UO2 matrix of spent nuclear fuel within an engineered barrier system with a low-permeability, diffusion-controlled buffer (such as the KBS-3 style repository) are expected to be constrained either by radioelement solubility limits (Andersson 1999) or perhaps by an extremely low dissolution rate of the UO2 matrix (Spahiu et al. 2002). In either case, the release rates of relatively long-

54
lived radionuclides (half-lives greater than several thousand years) quickly reach a steady-state value based on diffusive transport across the compacted bentonite buffer. For these radionuclides, the distribution of containment failures over time does not appreciably affect the peak release rate out of the EBS, or the peak dose rate from the repository itself. The release rates of some radionuclides, however, are not constrained by either the UO2 dissolution rate or radioelement solubility limits. Of particular concern is the instant release fraction (IRF) composed of 129I, 135Cs and other highly soluble fission products and activation products present within spent fuel (Johnson and Tait 1997; Andersson 1999). The abundance of these IRFs can be several percent of their total inventory (Johnson and Tait 1997). In addition, many of these radionuclides are low- or non-sorbing with respect to the buffer and host rock (Andersson 1999). These radionuclides will be released as a pulse (Pigford et al. 1990) and this pulse of high concentration can migrate through the buffer of the EBS into the repository system largely unattenuated (see Figure A-1). Because of the pulse-nature of the release of IRF radionuclides, the distribution of containment failures over time can significantly affect the calculated peak dose from a repository. Consider a calculated release-rate profile (Pigford et al. 1990) for 129I through a 30-cm thick buffer shown in Figure A-1, and assume a hypothetical repository composed of 1000 canisters. If all canisters were to fail at the same time, the peak release rate of 129I from the EBS for the total repository would simply be 1000 times higher than the peak release rate for an individual canister, as shown in Figure A-1 (PRRtotal = 1000 x PPRindividual). As an alternative, however, consider that the canisters fail at a uniform rate of one canister every 1000 years. Examination of Figure A-1 indicates that the superposition of the 129I pulse from the second canister to fail would add only about 2% to the peak dose from the initial pulse from the first canister to fail. The third canister to fail would add only addition 1% to the peak dose from the first failed canister, and each subsequent canister to fail would add increasingly smaller amounts to the release rate attributable to the first canister to fail (Figure A-2). For this case of distributed canister failure, PRRtotal ≈ 1.04 x PPRindividual, which is approximately a reduction by a factor of 960 in peak release rate for 129I from the IRF. A.2 Repository Case Studies on Distributed Canister Failure Many repository programs have explicitly considered both early canister failures due to fabrication defects, as well as possibly long-term distribution of canister failures over time. A few representative examples are described below. In particular, the time-distribution of canister failures has been shown to be of particular importance to calculated repository performance. The KBS-3 analysis (KBS 1983) of disposal of spent fuel in long-lived (≥ one million years) copper canisters was the first to identify and deal with the issues of early canister

55
failure and distributed containment failures over time. A “Canister Damage Scenario” was considered in which one waste canister was assumed to fail 60 years after emplacement, due to a manufacturing defect. This represents a value of about 1-in-4000 flaws per fabricated package. KBS-3 also evaluated an expected “Central Scenario” (Table 20-1, Volume 4, KBS 1983) in which it was assumed that canister failures start by a factor of 10 sooner (105 years after repository closure) than the expected lifetime of the canister (106 years). This factor of 10 reflected uncertainty in estimates of canister life, as well as possible variations in repository conditions over time and space. The KBS-3 Central Scenario further assumed that canisters would fail “at an even pace” (i.e., uniform distribution of failures) between 105 and 106 years. This assumed distribution led to an average of one canister failing every 200 years during this 900,000-year interval (Section 20.4.4, Volume 4, KBS 1983). While this assumed distribution of containment failures over time was based on uncertainty, the calculated peak dose rate of 129I (and other IRF radionuclides) was effectively decreased compared to any alternative assumption using a more narrow distribution of canister failures over time to reflect this uncertainty. The Environmental Impact Statement report by the Atomic Energy of Canada Limited (AECL 1994) for geological disposal of CANDU spent fuel also explored the impacts of initially defective canisters and long-term distributed canister failure. For initially defected canisters, it was assumed, based on industrial analogue information that 1-in-5000 canisters would fail within 50 years of repository closure due to fabrication defects. These few early failed canisters were not found to significantly affect the peak dose rates calculated by AECL (1994). For the failure distribution of non-defected canisters, AECL (1994) adopted a phenomenological basis to derive this distribution; the different temperature-time histories of waste canisters located in the center (hottest location), edge (cooler locations), and corners (coolest location) of a repository. These different temperature-time histories were then factored into corrosion-rate models for the canister material (titanium in this case) to generate a distribution of canister failures over both time and space. For the several scenarios considered by AECL, there were essentially no failures before 500 years after repository closure and almost all canisters were calculated to have failed after 104 years. However, the predicted rate of canister failure was extremely narrow (~80% failed over a 200-year interval) and centered at 2000 years after repository closure (Figure D-2, Volume 7, AECL 1994). Because of the narrow interval of this distribution of canister failures, the calculated rate of release of IRF radionuclides basically was identical to the shape of derived canister failure distribution (Figures D-5 and D-6, Volume 7, AECL 1994). That is to say, there was no significant reduction in peak release rate of IRFs (the main contributor to dose rates for the AECL study) due to distributed canister failure. Total system performance assessments (e.g., TSPA-VA, DOE 1998) for the disposal of spent fuel at the Yucca Mountain site, Nevada, USA have also employed models to estimate both initial defected canisters (“juvenile failures”) and the distribution of canister failures over time. The assumed upper limit of juvenile failures (i.e., failing

56
within 1000 years of repository closure) was estimated to be about 1-in-1000 canisters because of an undetected critical defect, and a lower limit was estimated at 1-in-100,000. Accordingly, sensitivity analyses assumed a range of one to ten waste canisters (out of 10,500 total canisters) initially failing because of fabrication defects. The calculated peak dose rates were not significantly affected, even for the upper limit in assumed juvenile failed canisters. With respect to the failure distribution of non-defected canisters over time, DOE (1998) adopted models reflecting uncertainties in both corrosion mechanisms, as well as spatial and temporal variation in environmental conditions within the repository. For example, the first failure of a corrosion-resistant canister (also called “containers”) by dripping water was estimated to begin 3000 years after repository closure and essentially all such canisters to fail after one million years (Figure 3-47, Volume 3, TSPA-VA, DOE 1998). The calculated dose rate for released radionuclides was shown by sensitivity studies to be highly dependent on the distribution of canister failures over time; in general, the wider the time distribution of failures, the lower the calculated peak dose rate. A.3 Summary of Distributed Canister Failure To summarize, the time-distribution of canister failures can impact safety assessments for geological repositories primarily in two ways: • early (within the first 1000 years after repository closure) failure of canisters due to
juvenile fabrication defects, and • broad distribution of canister failures for repository systems in which the peak dose
rates are governed by the release of instant release fraction (IRF) radionuclides, such as 129I and 135Cs.
With respect to juvenile failures, early canister failure (well before 1000 years) means that relatively short-lived, highly radiotoxic radionuclides such as 90Sr and 137Cs, will still be present. The release behavior of such radionuclides, normally eliminated by containment times greater than 1000 years, will require separate analysis, which is made more complex because of the elevated temperature in the near-field of repository during this early time period. For the long-term failure distribution of non-defective canisters to be effective in lowering peak dose rate for a repository, the time-distribution of failures must be broad with respect to the characteristic time interval (for example, the half-maximum width) of the characteristic pulse of released IRF radionuclides (see Figure A-1). The characteristics of such pulses will depend on design factors and radioelement-specific sorption properties of the buffer, as well as radionuclide half-life. A time-distribution in canister failures that is significantly broader than the characteristic release pulse will lead to reduction in peak dose rates of IRF radionuclides (illustrated in Figure A-2). Such time-distributions, however, should be based on actual

57
design factors and demonstrable variability in environmental conditions rather than assumed uncertainties to avoid the issue of risk dilution (see Chapter 10, Savage 1995). It should also be noted that other processes might contribute to diminution of the peak release rate of IRF radionuclides from a repository. If the canister failure is a small pinhole, the mass-transfer resistance of this opening may attenuate the release rate of all radionuclides into the surrounding buffer (Nilsson et al. 1991). Furthermore, consideration of the geometrical configuration of canisters in a repository, particularly the superposition of release plumes from neighboring failed canisters (Ahn et al. 2002), could lead to an reduction in concentration gradients of such radionuclides across the buffer, hence attenuating their peak release rates from the EBS. In addiiton, there will be a certain degree of dispersion, including matrix diffusion, of a pulsed release of an IFR radionuclide from the EBS during transport in the far-field rock (Alexander et al. 1990), and these processes also will lead to a reduction in the peak release rates of IFR radionuclides from a repository.
Figure A-1. Calculated Fractional Release Rate of Some Instant Release Fraction (IRF) Radionuclides Through 30-cm Thick Buffer (from Pigford et al. 1990).

58
Time
RR(1)
RR(N) = RR(1) x N
RR(N) = RR(1)
Time
Time
RR(1)
SimultaneousContainer
Failure
DistributedContainer
Failure
Figure A-2. Schematic Diagram of Effect of Distributed Canister Failures on Peak Release of an Instant Release Fraction (IRF) Radionuclide. “RR(1)” is a characteristic release rate curve for an IRF radionuclide from the EBS to the far-field rock (for example, Figure A-1).

STATENS KÄRNKRAFT INSPEKT ION
Swedish Nuclear Power Inspectorate
POST/POSTAL ADDRESS SE-106 58 StockholmBESÖK/OFFICE Klarabergsviadukten 90TELEFON/TELEPHONE +46 (0)8 698 84 00TELEFAX +46 (0)8 661 90 86E-POST/E-MAIL [email protected]/WEB SITE www.ski.se
www.ski.se