research and optimization of the bloom filter algorithm in...
TRANSCRIPT

IT 13 020
Examensarbete 30 hpMars 2013
Research and optimization of the Bloom filter algorithm in Hadoop
Bing Dong
Institutionen för informationsteknologiDepartment of Information Technology


Teknisk- naturvetenskaplig fakultet UTH-enheten Besöksadress: Ångströmlaboratoriet Lägerhyddsvägen 1 Hus 4, Plan 0 Postadress: Box 536 751 21 Uppsala Telefon: 018 – 471 30 03 Telefax: 018 – 471 30 00 Hemsida: http://www.teknat.uu.se/student
Abstract
Research and optimization of the Bloom filteralgorithm in Hadoop
Bing Dong
An increasing number of enterprises have the need of transferring data from atraditional database to a cloud-computing system. Big data in Teradata (a datawarehouse) often needs to be transferred to Hadoop, a distributed system, forfurther computing and analysis. However, if data stored in Teradata is not synced withHadoop, e.g. due to data loss during the communication, sync and copy process, it willcause the data to disaccord. A survey shows that except for the algorithm providedby Hadoop, the Bloom filter algorithm can be a good choice for data reconciliation.MD5 hash technology is applied to reduce the amount of data transmission. In theexperiments, data from both sides was compared using a Bloom filter. If there wasany data loss during the process, different primary keys could be found. The result canbe used to track the change of the original data.
During this thesis project, an experimental system using the Mapreduce mode ofHadoop was implemented. For the implementation, real data was used and theparameters were adjustable to analyze different schemes (Basic join, CBF, SBF andIBF).
Basic knowledge and the key technology of the Bloom filter algorithm are introducedinitially. Then the thesis systematically expounds the existing Bloom filter algorithmsand the pros and cons of each. It also introduces the principle of the Mapreduceprogram in Hadoop. In the next part, three schemes, all in concordance with therequirements are introduced in detail. Then in the 4th phase, the implementation ofschemes in Hadoop as well as the design and implementation of the testing system areintroduced. In the 5th phase, testing and analysis of each scheme is carried out. Thefeasibility of the schemes is analyzed with respect to performance and cost usingexperimental data. Finally, conclusions and ideas for further improvement of theBloom filter are presented.
Tryckt av: Reprocentralen ITCIT 13 020Examinator: Ivan ChristoffÄmnesgranskare: Ivan ChristoffHandledare: Qin Liu


Acknowledgement
First and foremost, I would like to thank my supervisor Dr. Liu,Qin, I appreciated
your guidance to my thesis and the comments to my report. In addition, I very much
appreciated the help of my reviewer Ivan Christoff, thank you for being my reviewer
and your advice.
I would like to thank my family, it is because of their financial and psychological
support that I was able to study in Sweden. And I would like to thank my friends and
all the people who are involved in the Sino-Swedish master program, Yang,Xiaowen,
Anders Berglund and all the others both in Sweden and in China, for providing us
such an opportunity to see the world, to experience different culture.
I would like to thank my friends and tutors in Tongji University, thank you for
providing the opportunity to live and learn from you. The three years of my master
study is one of the best time in my life.


Contents
1 Introduction 7
1.1 Background .............................................................................................................. 7
1.2 Study objective ........................................................................................................ 8
1.3 Content arrangement .............................................................................................. 8
2 Related Technology about Bloom filter 11
2.1 Principle of Bloom filter algorith ........................................................................... 11
2.2 Introduction on extensions of Bloom Filter ........................................................... 12
2.2.1 Counting Bloom Filter ..................................................................................... 12
2.2.2 Scalable Bloom Filter ...................................................................................... 13
2.2.3Invertible Bloom Filter ..................................................................................... 13
2.3 Principle of Mapreduce ......................................................................................... 14
2.4 Chapter Conclusion ............................................................................................... 15
3 Scheme design 17
3.1 Proposal ................................................................................................................. 17
3.1.1 Comparison of schemes ................................................................................. 18
3.1.2 Reduce size of dataset .................................................................................... 19
3.1.3 Comparison on dataset consistency ............................................................... 19
4 The Realization of Experimental Program 27
4.1 Framework ............................................................................................................. 27
4.2 The architecture design of Bloom Filter module ................................................... 28
4.2.1 Basic framework ............................................................................................. 28
4.2.2 Realize the program switch with Java reflection mechanism ........................ 28
4.2.3 The realization of main functions ................................................................... 29
4.3 MapReduce workflow ........................................................................................ 31

4.3.1 BasicJoin program........................................................................................... 32
4.3.2 BF program ..................................................................................................... 32
4.3.3 The BF program and IBF integrated program ................................................. 36
5 Evaluation and Results 41
5.1 Experiment setting ................................................................................................ 41
5.1.1 Experiment environment ............................................................................... 41
5.1.2 Generation of experiment data ...................................................................... 41
5.1.3 Algorithm parameter table ............................................................................. 42
5.1.4 Evaluating index and experiment execution .................................................. 43
5.2 Experiment result .................................................................................................. 44
5.2.1 Reduce size of dataset .................................................................................... 45
5.2.2 Accuracy ......................................................................................................... 45
5.2.3 Relationship between number of data and runtime ...................................... 48
5.2.4 Diagram of relationship between Accuracy and Runtime .............................. 51
6 Conclusion 55
7 Bibliography
57

7
Chapter 1 Introduction
1.1 Background
As a new concept proposed at the end of 2007, cloud computing was a great
revolution in the IT field. It means that computing can be used as a commodity,
like coal gas or electricity. The only difference between them is cloud computing is
transported by the computer networks. Organizations may use Hadoop to run
"big data" business intelligence-type operations. Practical applications for using
Hadoop include supply-chain management, sales analytics, call-center record
analysis, web event analysis and financial reporting. Up to now, Google, Microsoft,
Alibaba, Amazon and some other famous cooperation have proposed their cloud
computing applications and take cloud computing as one of the vital strategies of
the future. Under this circumstance, data immigration and data reconciliation
between database and distributed system are quite common. How to find a better
algorithm which can help to speed up the reconciliation process and ensure the
result is what enterprises concern about.
eBay has the largest e-commerce platform on earth, which accepts magnitude
millions of trading activity orders each day. eBay has poured money and resources
in data analysis platform and is committed to efficient data analysis in order to
better grasp users‘ behavior. eBay not only applies traditional data warehouse
(TeraData) but also estimates applying the latest Hadoop technology platform.
They have conducted large amount of research and inputs on the efficiency of data
transfer between the data warehouse and Hadoop platform as well as consistency
maintenance.
Data in a data warehouse (TerraData, short as TD) need to be migrated to the
Hadoop file system for OLAP (On-Line Analytical Processing) calculation and
analysis, with time lapse, data in TD has changed while the replica in Hadoop does
not synchronize updates in time, or replica is destroyed due to network
transmission. Therefore, comparison needs to be conducted to identify differences
between datasets in TD and datasets in the Hadoop file system.
Following issues are covered in this thesis: policy of data reconciliation,
guarantee of data quality (accuracy), policy and performance of data transfer.

8
1.2 Study objective
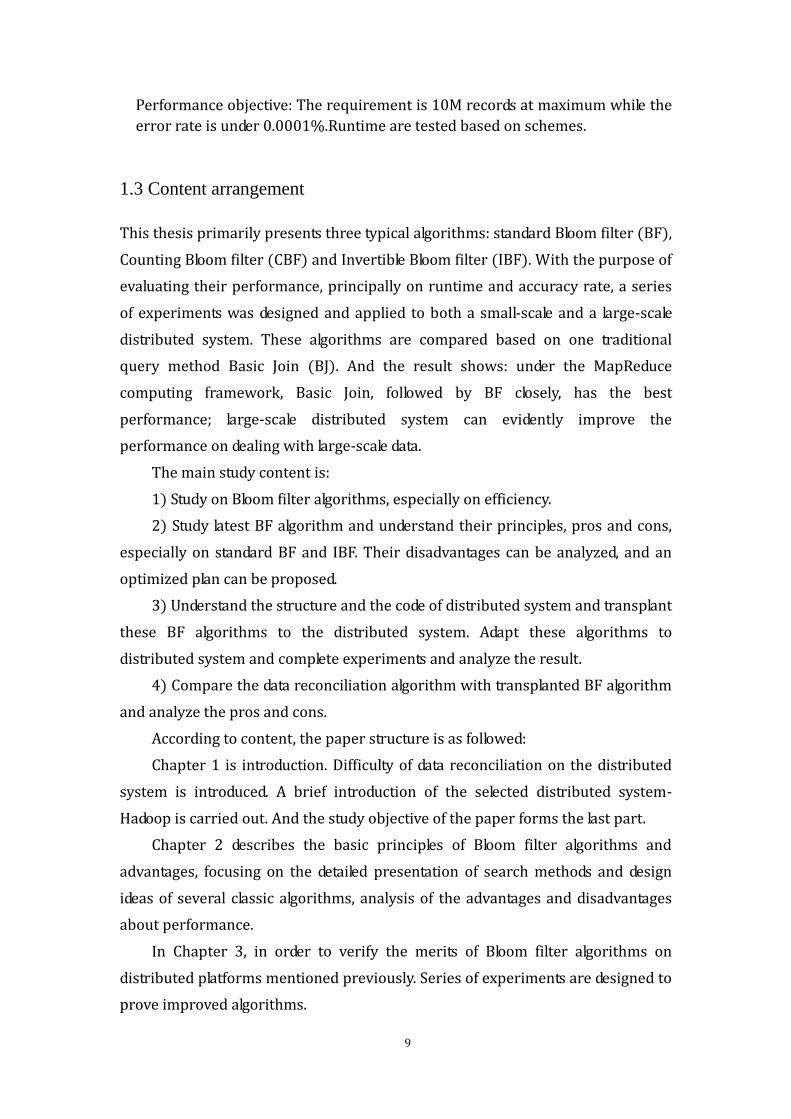
The problem can be defined as Figure1.1. First, in database, data is stored as
records, and each record can be considered as a tuple of <PK, Value>. Then,
considering two data sets DSA (data in TD) and DSB (data in Hadoop), the problem
can be defined as finding records in part A (the set of records in DSA but not in
DSB) and part C (the set of records in DSB but not in DSA). Part D
(inconsistency) means the set of records is in DSB and DSA but they are not the
same. Data reconciliation in this thesis is to get the PK of each record in part A
and part C.
Figure 1.1: Diagram of datasets
Normally, DSA is considered as original data, while DSB is a duplicated of DSA.
Inconsistent data can be caused by following operations:
1. Insert, One record is added to A while an Insert operation is conducted in
DSA;
2. Delete, One record is added to C while a delete operation is conducted in DSA;
3. Update, when an update operation is conducted, PK remains the same while
value changes and one record is added in D.
9
Performance objective: The requirement is 10M records at maximum while the
error rate is under 0.0001%.Runtime are tested based on schemes.
1.3 Content arrangement
This thesis primarily presents three typical algorithms: standard Bloom filter (BF),
Counting Bloom filter (CBF) and Invertible Bloom filter (IBF). With the purpose of
evaluating their performance, principally on runtime and accuracy rate, a series
of experiments was designed and applied to both a small-scale and a large-scale
distributed system. These algorithms are compared based on one traditional
query method Basic Join (BJ). And the result shows: under the MapReduce
computing framework, Basic Join, followed by BF closely, has the best
performance; large-scale distributed system can evidently improve the
performance on dealing with large-scale data.
The main study content is:
1) Study on Bloom filter algorithms, especially on efficiency.
2) Study latest BF algorithm and understand their principles, pros and cons,
especially on standard BF and IBF. Their disadvantages can be analyzed, and an
optimized plan can be proposed.
3) Understand the structure and the code of distributed system and transplant
these BF algorithms to the distributed system. Adapt these algorithms to
distributed system and complete experiments and analyze the result.
4) Compare the data reconciliation algorithm with transplanted BF algorithm
and analyze the pros and cons.
According to content, the paper structure is as followed:
Chapter 1 is introduction. Difficulty of data reconciliation on the distributed
system is introduced. A brief introduction of the selected distributed system-
Hadoop is carried out. And the study objective of the paper forms the last part.
Chapter 2 describes the basic principles of Bloom filter algorithms and
advantages, focusing on the detailed presentation of search methods and design
ideas of several classic algorithms, analysis of the advantages and disadvantages
about performance.
In Chapter 3, in order to verify the merits of Bloom filter algorithms on
distributed platforms mentioned previously. Series of experiments are designed to
prove improved algorithms.

10
The fourth chapter describes the architecture and implementation of the
experimental system.
The fifth chapter analyses accuracy and efficiency of improved algorithms.
The final chapter is a summary and prospects for the future work.

11
Chapter 2 Related Technology about Bloom filter
Bloom filter query algorithm based on theoretical research in recent years has
been concerned. published at home and abroad from the current literature, there
have been a number of standard bloom filters query algorithm algorithms,
including: counting bloom filter query algorithm, compressed bloom filter query
algorithm, Spectral bloom filters query algorithm, split- loom filter query algorithm,
dynamic bloom filters query algorithms, scalable bloom filter query algorithm,
multidimensional filter query algorithm, basket Bloom filter query algorithms etc.
The Bloom filter expansion algorithms have made considerable contribution to
bloom filter query algorithm research and development, but owing to lack of early
concern to the field of algorithms, the algorithm is still in rising phase while there
are a lot of interesting theoretical issues yet to be resolved.
2.1 Principle of Bloom filter algorithm
A Bloom filter, conceived by Burton Howard Bloom in 1970[1] ,is a space-efficient
probabilistic data structure that is used to test whether an element is a member of
a set. Bloom filter is a space-saving, efficient data representation and the structure
of query. This algorithm can simply use bit arrays to represent a set, and to
determine whether an element is in the set with a high probability. Therefore, this
data structure is suitable for application in low-error -rates-tolerance occasions.

12
Figure 2.1 Principle of Bloom filter
It is known from Figure 2.1, the nature of Bloom Filter structure is to map
elements in one set to bit string vector via k hash function, and for each element it
just needs to save several bits. Bloom filter, as a query-supported data structure, is
efficient, and simple in reperesenting set. It may exist false-positive misjudgment
(possibilities of an element does not belong to one data set and is refers to be
judged to belong to the data set), and does not exist false- negative misjudegment
(possibilitiesof an element does belong to one data set and is refers to be judged
not belong to the data set).
Due to the false-positive misjudgement feature of Bloom Filer, in practice, the
misjudgment rate must be evaluated so as to design appropriate Bloom filters and
decrease the impact on applications.
2.2 Introduction on extensions of Bloom Filter
2.2.1 Counting Bloom Filter

13
Deleting elements from a Bloom filter cannot simply be done by changing ones
back to zero, since a single bit may correspond to multiple elements. A counting
Bloom filter uses an array of n counters instead of bits to support for deletion
while there is a dynamic change in a set, the counters track the number of
elements currently hashed to that location. It uses a counter instead of v vectors
for each bit, and completes the insertion and deletion of elements by operating
addition, subtraction on k Counter corresponds to elements. When using counting
Bloom filter, the insert and delete operations cause corresponding k Counter in
bloom filters to plus 1 or minus 1. And when determining whether an element is
in the collection, it just needs to check all k Counter counters are greater than 1.
2.2.2 Scalable Bloom Filter
Because with a certain misjudgment f0, the standard Bloom filters can only
accommodate a certain number of data n0, scalable Bloom filter is a better choice
when Bloom filter needs to hold more data.
The initial conditions is a standard Bloom filter, when the number of data
records n inserted in V0 (length is m0) is more than upper level of n0,another V1
is assigned with length m1=2m0. With a fixed f0, number of data V1 can
accommodate is n1=2n0, and so on, with i times extensions, data number
accommodated by scalable Bloom filter is (2I-1) n0, the length of vector Vi mi=2i
x m0, Figure 2.2 shows this situation:
Figure 2.2 Scalable Bloom Filter
2.2.3Invertible Bloom Filter
Invertible Bloom filter extends the Bloom filter data structure to key-value pairs
and the ability to list out the pairs it contains with high probability, as long the

14
number of key-value pairs is below a designed threshold. Instead of bits in
standard Bloom filter, IBF uses Cells, structured as Figure 2.3.
counter KeySum hashKeySum valSum hashValSum
Figure 2.3 Cell structure
Among them,
(1) counter stores records stored in the unit <key, value>;
(2) keySum stores sum of all key in the unit of <key, value>;
(3) hashKeySum records the unit of all <key, value> key
(4) valSum records the unit of all <key, value> value
(5) hashValSum records the unit of all <key, value> value
IBF in addition to supporting operations such as querying, inserting, deleting,
and also support the listing element set operations, IBF can be an existing, <key,
value> all, has it that the IBF reduced the entire data set into several cells.
Compared with the process of BF, IBF just need to generate one filter and only do
data reconciliation one time, due to IBF‘s characteristic.
Though those algorithms perform very well in terms of communication cost
and computation complexity, however, little research is done on large-scale
distributed system, where distributed computation, the bandwidth cost and other
factors may influence the performance.
2.3 Principle of Mapreduce
MapReduce can take advantage of locality of data, processing data on or near the
storage assets to decrease transmission of data. It is a framework for processing
parallelizable problems across huge datasets using a large number of computers
(nodes), collectively referred to as a cluster (if all nodes are on the same local
network and use similar hardware) or a grid (if the nodes are shared across
geographically and administratively distributed systems, and use more
heterogenous hardware). Computational processing can occur on data stored
either in a filesystem (unstructured) or in a database (structured).
Mapreduce divides the whole data computation process into two parts: ―Map‖
and ―Reduce‖ [5]. Map-Reduce[6][7] framework is based on <key,value> which

15
means data input is a number of <key,value> and the result is also a number of
<key,value>, but sometimes their types are different.
"Map" step: The master node takes the input, divides it into smaller
sub-problems, and distributes them to worker nodes. A worker node may do this
again in turn, leading to a multi-level tree structure. The worker node processes
the smaller problem, and passes the answer back to its master node.
"Reduce" step: The master node then collects the answers to all the
sub-problems and combines them in some way to form the output – the answer
to the problem it was originally trying to solve.
Work flow was shown in the following Figure 2.4:
Figure 2.4 Principle of Mapreduce
2.4 Chapter Conclusion
The chapter is like its name suggested, several common BF algorithms and how
Mapreduce work is introduced here.

16

17
Chapter 3 Scheme design
Detailed solutions to requirements and technologies mentioned above were
carried out in this chapter. Before this chapter will be based on demand and
technology described before specific solutions were made. Framework, solutions
(including Basic Join, BF and IBF) were described in details.
In the selection of Hash function, according to the compression experiment
(An experiment to test on compressing 100 billion record finished by our lab),
LCH and LDH aka. Bernesten and BKDRHash were selected. Experiment data was
illustrated in table 3.1.
Hash function name Number of conflict Time spent on
compressing 100 billion
records
APHash 134 296ms
Bernestein(LCH) 223 186ms
BKDRHash(LDH) 224 181ms
DJBHash 228 179ms
RSHash 231 186ms
DEKHash 236 189ms
rotatingHash 244 200ms
FNVHash 245 188ms
SDBMHash 250 235ms
Table 3.1 Comparison on Hash function performance
3.1 Proposal
Before raising the schemes, issues need to be solved must be clarified:
The first issue is to reduce the number of data. Considering the size of data in
Teradata and Hadoop is really huge, which may cause the transfer, access difficult
and inefficient. Data is compressed to 128bits length by MD5 algorithms so as to
reduce the size of data.

18
And the second issue is data reconciliation. Using the specific of BF algorithms,
the schemes are designed to realize the compare of reduced dataset. Get a higher
efficiency with some loss of accuracy.
There are various BF algorithms candidates, therefore, a rational structure to
arrange these data structure is important. How to design the appropriate data type
and port is the key.
3.1.1 Comparison of schemes
Experiments were designed to compare the participle plan, analyze their pros and
corns in the space cost, runtime, accuracy so as to select the best scheme. The
stage contained design and realization of the whole system.
According to issues mentioned above, experimental design contains two parts.
The first part aims at reducing the size of dataset while the second part aims at
compare data. There are 3 routines of schemes and all of them is realized on
Mapreduce platform. The whole picture was illustrated in figure 3.1:
Figure 3.1 Structure of the overall scheme

19
3.1.2 Reduce size of dataset
MD5 is a hash encryption algorithm that generates a fixed-length (128bit) string
of bytes, you can use the MD5 algorithm to encrypt the original data, get 128bit
byte strings can relieve the pressure on networks, is more conducive to
subsequent data to work. MD5 collision rate is very low which makes it feasible
for this project.
3.1.3 Comparison on dataset consistency
First, in database, data is stored as records, and each record can be considered as a
tuple of <key, value>. The problem can be defined as, assume
T={(key,value)|(key,value) in TD}, and H={(key,value)|(key,value) in Hadoop }.
Data reconciliation[8] in this thesis is to each record in part A and part C and part
D in figure1.1. (Since e-Bay does not care about correct records, part B is not
taken into account.)
In the test, according to basic research done before, Basic Join(aka BJ), Bloom
filter (aka BF) as well as Inversed Bloom filter (IBF) were chosen. They would be
described in details below:
a) Basic Join (BJ)
The basic idea of this method was to view through records in one dataset
one-by-one to check whether one record exists in another dataset and the area
one record belongs can be found directly by comparing. Basic operation was as
follows:
Take t ∈ t,
1. If there is no h ∈ H which enables t.key=h.key, then t ∈ A
2. If there is h ∈ H which enables t.key=h.key AND t.Val ≠ h.val, then t ∈ D
Take h ∈ h,
3. If there is no t ∈ T which enables t.key=h.key then h ∈ C
Analysis: the basic algorithm was to use a nested loop, traversal H for every
record in T. The complexity of this algorithm is O (n2). But since this scheme was
implemented by Mapreduce on Hadoop, advantages of Mapreduce's grouping
mechanisms can be taken to optimize this algorithm.
Advantage of Mapreduce's nature can be used completely to easily performs
Intersection Operation (Join Operation) on two sets which was string comparison.

20
At the same time, sorting method of Mapreduce is close to TerraSort Benchmark
standards which means the efficiency of this scheme is considerable and justified.
Work flow was shown in the following figure:
Figure 3.2: Basic Join Scheme
b) Bloom Filter Scheme(BF)
The basic idea of this scheme was to build corresponding bloom filters for
original data on both sides, and then record from one side was determined

21
whether it exists in another dataset through query operation which avoided
loop comparison of each piece of data. Query execution time of bloom filter
depends on the k number of hash functions, and the time complexity of data N is
constant. Algorithm design was as follows:
1. Generate BF1 in T(each record inserted in T), generates BF2 in H (each
record inserted in H)
2. take each record h in H to conduct query h BF1, if the query result is that h
was not in BF1, then h was added to set nT
3. take each record t in T to conduct query h BF2, if the query result is that t
was not in BF2, then h was added to set H
4. so far A,C,D were obtained by set operations like: D=nT ∩ nH;A=nH –
D;C=nT – D;
Analysis: bloom filter is a query-efficient algorithm, its time complexity is O(k),
only depends on efficiency of hash function not on data n (Time complexity of
building bloom filter isO(n)); since efficiency of query algorithms like traditional
tree shaped structure algorithm was related to data quantity n directly, therefore
efficiency of bloom filter has advantages dealing with large data quantity.
Scheme process is shown in the figure 3.3:

22
Figure 3.3: Bloom Filter scheme
c) Inverted Bloom Filter Scheme(IBF)
The scheme used the feature of IBF listing all the elements it represents, using one
IBF without having to establish two independent Bloom filter data structures
compared to b). In this scenario, data on both sides was inserted into IBF in a
reverse manner firstly, specifically insert operations was performed on one side,
and delete operation was performed on the other side, after this action finished,
same elements were offset on both sides and elements stored in IBF were the
different records at both sides. Then all elements in the IBF were listed, because
the operation was reversed on two sides which generated two sets, one with the

23
data from insertion and another with data from deletion. Algorithm design was as
follows:
1. Generate the initial IBF
2. IBF inserted each record of H
3. IBF deleted each record of T
4. List all the elements at this point into two sets nH and nT
5. The same with scheme b) , find the set A,C,D.
Analysis: the scheme was based on the Bloom filter algorithm, while IBF was
simple in process since it need just one filter comparing to BF need two filter to
build data structure, but since the algorithm need to store redundant information
which made a larger space cost.Secondly, hash value need to compute repeatedly
in the stage of listing data element, at this stage the data record stored in IBF
happens to be different on both sides, the efficiency is O(d). On the other hand,
advantage of IBF compared to BF is that IBF does not execute the query operation
in the scheme, so there is no false positive, accuracy of algorithms is 100%.
Scheme process is shown in the figure 3.4:

24
Figure 3.4: Scheme of Inverted Bloom Filter
d) Bloom filter parameters
Determination of vector length
The length of bit vector (filters the required storage space) must be determined
while establishing Bloom filter data structures in a program,
The length of bit vector of Standard Bloom filters is determined by the three input
parameters: 1. n0: the number of data can accommodat; 2. f0: the maximum rate
of misjudgment; 3. k: the number of hash functions. And length of Bloom filters bit
vectors calculation formula is:

25
f0 in fact is an indicator to show the precision of algorithms, and in this thesis,
is treated as an input parameter. Space is allocated according to its value to ensure
accuracy, which means the accuracy of the program is controllable, requirements
about accuracy can be met when space is enough.
Determination of the number of hash function
Number of hash function impacts accuracy greatly, from the formula above, in
order to ensure accurate rate remain unchanged, the vector length must be
extended which would increase the space cost, therefore, take space cost and
accuracy into consideration together, the number of hash function k is not the
bigger the better. When k was between 2~4, accuracy rose greatly, and while k
grew, rise of accuracy was no longer significant. On the other hand, time of Bloom
filter query operations was also determined by k therefore, in order to ensure the
efficiency of calculation, k should not be too large. Therefore, k was determined as
3 in this thesis.
Choose of experimental parameters
On choosing parameters of experiments, size of data and different error ratio was
considered. While the minimum of data was 10 thousand and the maximum was
300 million. Error ratios were 2%.10%, 20% and 50%.Detailed parameters would
be showed in Chapter 5.

26

27
Chapter 4 The Realization of Experimental Program
Based on the realization task of comparison stage for experimental system data
set proposed in the program design of last chapter, this chapter firstly conducted
brief introduction for the overall framework of the experimental system, and
subsequently described the realization of different programs in the Mapreduce
platform respectively, which included Basic Join program, BF program, and
succession programs for BF and IBF.
4.1 Framework
The purpose of this program was to realize a set of experimental system, which
included not only the implementation of the 3 programs, but also the comparison
of the performance of various programs under the experimental system. The
diagram of the overall framework was as follows:
Figure 4.1: The framework diagram of the experimental system
The part on the left of the dotted line was the program put forward by this
thesis. After Mapreduce processing (Experiment Solution), TD Data and Hadoop

28
data would generate Reconciliation Result. Bloom Filter or Basic Join scheme was
used in this process; meanwhile, the Performance Statistics Gathering module was
applied to conduct statistics for the running time of the program. The part on the
right of the dotted line was the control group. The same data was used for the
standard program to gain the right result, and then the Accuracy Statistics
Gathering module was used to compare the two sets of results, the accurate date of
the experimental results, and Statistics could finally be obtained.
The following sections of this chapter would explain the main components of
the above mentioned modules: the 4.2 section described the realization of Bloom
filter algorithm module; the 4.3 section described the structure and realization of
the MapReduce processing. Since the part on the right side of the dotted line and
the statistics module were used as references and comparison rather than the
actual needs of the program, it would not be further elaborated in this thesis.
4.2 The architecture design of Bloom Filter module
4.2.1 Basic framework
Various Bloom filters applied in this thesis were improved on the basis of
standard Bloom filter, but their basic principles were the same: map the data
through hash algorithm to the bit vector. Therefore, the various algorithms were
in the same logic base class. First, established BloomFilterBase. Such interface for
hash algorithm was used by sub-bases, and then IHashes interface needed to be
established. As k choice of hash function was a parameter of the following
experiments, different programs of hash combination needed to be implemented.
When the BloomFilterHashBase achieved the IHashes interface, different
combination programs of hash functions would inherit this base, and different
Bloom filter would inherit BloomFilterBase so as to call a unified method for
operation.
4.2.2 Realize the program switch with Java reflection mechanism

29
Both BloomFilterBase and BloomFilterHashBase mentioned in 4.2.1 contained a
static method getInstance of Java reflection mechanism, which could specify the
instantiated base name (complete path name) by inputting parameters through
the program, establish the appropriate bases by the Class.forName method, and
then generate specified type of instances by calling the newInstance method of
Class instance. In this way, as long as the program parameter with specified
sub-base of the Bloom filter was input, the corresponding instance of reduce
phase could be obtained to implement the corresponding programs.
The base diagram was shown as below:
Figure 4.2 Class diagram of Bloom filter
4.2.3 The realization of main functions
1. BloomFilterBase
getMBits: the method calculated the bit vector length by inputting parameters
getInstance: utilized JAVA reflection mechanism, input Bloom filter class, called the
static method of Class.forName, obtained a Class object, and then called the
newInstance method of the Class object to return an instance of a BloomFilterBase
Class.
2. Hash combination
BloomFilterHashBase also realized the getInstance method and achieved the
flexible switch of subclasses. Moreover, it realized the combination of two sets of
30
hash functions. Selected three kinds from 9 common hash functions for the
combination, and it was found that LeastCollisionHash was the combination with
the lowest conflict rate, and LeastDurationHash was the combination with the
shortest calculation time.
3. Counting BloomFilter
insert: calculated the hash value according to the data records and added 1 at the
counter value of the hash value points.
delete: calculated the hash value according to the data records and reduced 1 at
counter value of the hash value points.
exists: calculated the hash value according to the data records and read the
counter value the hash value points; if all were greater than 0, it would return true,
otherwise, it would return false.
4. ScalableBloomFilter
insert: first checked the number of records stored in the current filter: if it was
greater than the threshold value n0, it would extend (call extend) or find a latest
extended bit vector, and then calculate the hash value according to the data records,
and place the hash value at the location of 1.
extend: when at the ith expansion, the allocation length of 2in0 was the new bit
vector and was initialized into 0.
exists: calculated the hash value according to the data records, and read the
counter value of that hash value points in the first bit vector: if all were greater
than 0, it would return true, otherwise, it would be checked again in the next bit
vector. If all bit vectors were checked as false, it would return false.
5. InvertedBloomFilter
insert: calculated the hash value according to the data record <key, val> and
conducted the following operations for the cell the hash value points:
The counter added 1,
keySum cumulatively added key,
hashKeySum cumulatively added g(key) (g(x) was an independent hash function),
valSum cumulatively added val,
hashValSum cumulatively added g(val)
delete: opposite to the operation of insert, replaced the addition with subtraction

31
recover: listed all data records in the set represented in the filter. The specific
method was:
1. Find the cell with counter value of 1 or -1
2. As for the counter value of 1, <keySum, valSum> could represent a data record.
If g (keySum) = hashKeySum and g (valSum) = hashValSum, it meant this record
was from the insertion end, and this record would be output into a queue.
3. Delete this record from the filter (call the delete method)
4 As for the counter value of -1, <-keySum-valSum> could represent a data record,
if g (keySum) + hashKeySum = 0 and g (valSum) + hashValSum = 0, it indicated
that this record was from delete end, t this record would be output into another
queue.
5. Insert this record to filter (call the insert method)
6. Repeat the above operation until the filter is returned to the initial state
4.3 MapReduce workflow
The system implemented design and development in the Hadoop platform.
According to the MapReduce programming model, the input of Mapreduce was a
2-tuple of (Key, Value), the map phase would collate the data and generate the
appropriate intermediate results based on the need. After the output of
intermediate results, it entered reduce stage, which mainly performed computing
processing on the data, and finally output the results. Each Mapreduce operation
was divided into the following modules:
Mapper: first called setup method to obtain the program context and
configuration files, and then called the map method to execute the operation at
the map phase. In this way, users could realize the desired computing through
rewriting the map method. For each 2-tuple of (key, value) executed the map
method for one time until all the data was processed.
Partitioner: performed grouping operation, and grouped the output results of
the map according to certain rules so as to make them with the same Key to
inherit such custom actions.
Reducer: performed reduce operations and the result was output to the file
system and hereditament such custom operations.
Driver: used for configuring the various parameters and submission of

32
Mapreduce operations.
4.3.1 BasicJoin program
This program included the four basic modules required in Mapreduce model. The
map stage would obtain the raw data, and the intermediate results would be
directly output by adding the flag bit. Data obtained in reduce stage was the sorted
data and all data with the same key would get a corresponding set of values to
determine the situation of these flag bits and whether the value was equal so as to
get the final result.
HMapper: read data from Hadoop end, and added flag bit of ‗H‘
TMapper: read data from TD end, and added flag bit of ‗T‘
JoinReducer: compared if the value of the same key was equal, and finally wrote
the obtained final results into the file
The input and output data flow was as follows:
Component Input Output
HMapper Offset : long, row : Text Key : long, Hashes : String
TMapper Offset : long, row : Text Key : long, Hashes : String
BFPartitioner Key : long, Hashes : String Partition index : int
BFReducer Key : long, Hashes : String Left(A)、Middle(C)、Right(D)
Table 4.1: data flow of Basic Join
4.3.2 BF program
The main process of BF program and IBF was divided into two stages: the first
stage was to generate Bloom Filter, while the second stage was the Data
Reconciliation.

33
Figure 4.3 The stage diagram of program design
The following components need to be realized at the first stage:
The entry program of BFGenDriver Mapreduce was used for the preparation and
submission of tasks
BFGenMapper generated map method of Bloom filter and MD5 set
The BFGenPartitioner Grouper: it needed to be noted that the grouping strategies
of the two stages must be consistent, as only this strategy could guarantee the
Bloom filter to execute query operation when the Bloom filter record was
inserted.
BFGenReducer generated reduce method of Bloom filter
BFGenerator generated interface for the generated Bloom filter method
The class diagram was as follows:

34
Figure 4.4 The stage class diagram of BFGeneration in program design
The sequence diagram was as follows
Figure 4.5 The stage sequence diagram of BFGeneration in BF program

35
The output of this stage was the Bloom filter, which output it into a file; the file
would be read when doing data reconciliation in the second stage. As here the data
structure of Bloom filter needed to be output to a file, it was necessary to realize its
serialization. The method was to use Bloom filter class to realize the
WritableComparable interface packed by Hadoop. After realizing the read and
write methods in this interface, it could support the read and write operations of
this class to the disk.
The second stage also needed to realize several classes of Mapreduce basic
framework (as it was similar to 2.2.4, hereby it would not be described again)
Figure 4.6 The stage class diagram of Reconciliation in BF diagram
Here the IBF interface was left out, but because the number and structure of
intermediate results (Bloom filter) generated in BF program and IBF program
were different, the realization of two sets of programs was needed, for this
designed program was not scientific enough.
The sequence diagram is as follows

36
Figure. 4.7 The stage sequence diagram of Reconciliation in BF diagram
After the completion of the above two stages, the nT and nH needed in the
algorithm could be obtained. The third stage was the Join operation. As the output
data was also stored in the distributed file system, and its data scale could not be
estimated, it also adopted Mapreduce to execute Join operation. To complete this
set of program, a total of three Mapreduce tasks must be executed.
4.3.3 The BF program and IBF integrated program
As described in the above 4.3.2, after testing, it could be found that as this design
needed to execute three Mapreduce tasks, data I / O operation occupied a large
proportion of the total running time, while BasicJoin only executed one
Mapreduce task, and the I / O operation time of two sets of programs was not
equal; their operation time was not comparable, as a result, the experimental
results were convincing enough. Therefore, the improvement of the program and
the aim of the new program integrated the two stages mentioned in 2.2.4 into

37
Mapreduce operation.
The advantage of this program was that it solved the large cost of I/ O; on the
one hand, it could improve the execution efficiency, on the other hand, it made the
program comparable with BasicJoin. The reason for not applying this program
before was that originally the intermediate results written in a file must be read
and written on the memory, which has a greater requirement on memory space.
However, in the actual eBay experimental environment, the memory space and
storage space of the distributed system were very large; moreover, the demand
also mentioned that eBay concerned more about saving time and improving
efficiency rather than save space. Therefore, this strategy of ―exchanging space
for time‖ was feasible.
In addition to the four basic modules required in the Mapreduce model, the
program also included Bloom filter algorithm interface. The two programs were
unified encapsulated in an interface of IBFOperator in order to create an interface
for the Bloom filter operation. This interface mainly provided the two methods of
create and reconcile. Here the create was used to create the data structure of the
Bloom filter; while reconcile was used to execute query operation, and obtain the
nH and nT set in the algorithm process.
Interface Join offered the method for the last set operation, and found the
final results of A, C, and D with nH and nT as input parameters. The class Operator
realized the IBFOperator interface. For the two different programs, it respectively
realized the two classes inherited from Operator: BFOpr and IBFOpr, which
respectively realized BF program and IBF program. The reason for applying this
kind of realization in the experiment was that this program better utilized the
common characteristics of BF program and IBF program, simplified the
procedures, saved the execution steps and embodied the polymorphism and
encapsulation advantages of the object-oriented programming design.
As the program adopted Mapreduce program, the original data needed to be
divided into several blocks. As for the Bloom filter generated in each block (the
mapping rule was BFKey = recordKey / nRecords, that is, divided the record key
by the maximum number the filter could hold). In fact, with the Mapreduce
parallel computing features, it reduced the needed storage space, and better
played the performance advantage.

38
The class diagram of this program:
Figure. 4.8 The Mapreduce framework diagram of Bloom filter program
The realization of the main functions:
Operator and its sub-classes: the base of Operator utilized JAVA reflection
mechanism to realize the getInstance method.
The realization of the two sub-classes of BFOpr and IBFOpr: the former was
responsible for the operation of the BF program, while the latter was in charge of
the operation of the IBF program. The main functions were described as follows:
BFOpr:
initialize method - creating two initial Bloom filters;
create method – inserting the data of both ends (determined by the flag bit
added at the map stage) into a Bloom filter respectively;
reconcile methods – implementing the query operation in the Bloom filter
generated at another end of the data with the data at the both ends.

39
IBFOpr:
initialize method - creating an initial reversible Bloom filter;
create method - utilizing data at the TD end to execute the delete operation in
the filter, and executing insert operation for the data at the Hadoop end;
reconcile method - calling IBF.recover, listing all data records stored in the IBF
and putting them into two output queues.
Mapper:
1. Added different flag bits on the input data of both ends so that they could be
processed respectively at the reduce stage.
2. Called IHashes interface to calculate the hash value, and passed it to reduce in
the form of character string. Calculating the hash value in the map stage was
because the hash value would be used in both create and reconcile stages.
Therefore, calculating only once could save computing time. In order not to
concentrate the calculating pressure of the operation on the reduce stage, it was
executed in the map stage.
3. According to data recorded key, the corresponding key in the Bloom filter
(BFKey) was calculated. That is, each data record was mapped to the
corresponding Bloom filters.
4. The BFKey was the output Key of the map, the key of flag bit and data record
were connected with the hash value as the output Value of the map.

40
Reducer:
1. Allocated instances for IBFOperator interface in the setup.
2. In order to avoid the re-allocated memory space, the memory must be reused,
and the IBFOperator.clear method must first be called before each execution of
the data processing operation so as to empty the contents of the allocated Bloom
filter data structure for apllication.
3. Called IBFOperator.create method to establish the required filter data structure
4. Executed IBFOperator.reconcile method to get nH and nT set.
5. Called the calculation method provided by Join interface provides, found the
final results and then wrote to the file.
Table 4.2 Dataflow of integrated program
Component Input Output
HMapper Offset : long, row : Text BFKey : long, Hashes : String
TMapper Offset : long, row : Text BFKey : long, Hashes : String
BFPartitioner BFKey : long, Hashes :
String
Partition index
BFReducer BFKey, Hashes : String Left(A)、Middle(C)、Right(D)

41
Chapter 5 Evaluation and Results
Experiment design and excute proess, result and analysis are carried out in this
chapter.
5.1 Experiment setting
5.1.1 Experiment environment
1. Small cluster
Small cluster experiment is carried out in a three-node Hadoop cluster, with the
following configures:
CPU: Inter(R) Core ™ 1.86GHZ
Memory: 8G
OS: Ubuntu 10.04
Hadoop version: Cloudera CDH3u2.
It has one Name node and three Data nodes and executed small-scale data from
10K rows to 10M rows.
2. Large-scale cluster
Large-scale cluster experiment is carried out in a 1000-node Hadoop cluster
provided by eBay CDC. The input data size starts from 10M rows, with 10M
incremental data rows for each time, till it reaches 300M data rows.
5.1.2 Generation of experimental data
Data stimulated both from TD and Hadoop and got prepared beforehand. All data
has been put into binary set and stored in Hadoop.
The scale of output data was determined with requirement proposer and the
input parameter was put in table 5.1.

42
Data ID MD5bits Number of records Error rate
G041 128bits 1M 2%
G051 128bits 5M 2%
G012 128bits 10K 10%
G022 128bits 100K 10%
G032 128bits 500K 10%
G042 128bits 1M 10%
G052 128bits 5M 10%
G062 128bits 10M 10%
G013 128bits 10K 20%
G023 128bits 100K 20%
G033 128bits 500K 20%
G043 128bits 1M 20%
G053 128bits 5M 20%
G063 128bits 10M 20%
G044 128bits 1M 50%
G054 128bits 5M 50%
Table 5.1 Input parameter of experiment data
5.1.3 Algorithm parameter table
Parameters blow are input parameters of experiment:
Algorith
m ID
Solutions Hash
combinations
Error rate allowed by
data structure
BJ BF IBF CBF SBF LCH LDH 1.0000 0.0100 0.0001
A10 √
A21 √ √ √ √
A31 √ √ √ √
A41 √ √ √ √
A51 √ √ √ √
A61 √ √ √
A71 √ √ √
A22 √ √ √ √
A32 √ √ √ √
A42 √ √ √ √

43
A52 √ √ √ √
A62 √ √ √
A72 √ √ √
A23 √ √ √
A33 √ √ √
A43 √ √ √ √
A53 √ √ √
A63 √ √ √
A73 √ √ √
Table 5.2 Input parameters for algorithms
5.1.4 Evaluating index and experiment execution
Accuracy evaluation was divided into two indicators, one is cover rate while
another is accuracy.
A.
Set A is defined as record with difference in the original dataset in Figure 1.1, Set
B is record identified by the program (matched with Set A, records with
difference), Set C is all of the record identified by the program.
Coverage refers to the ratio that record in Set B divided by record in Set C
record, and typically in consistency comparative tests, there is likely to find some
not correct result records, that is why this indicator need to be measured. The
formula is
B.
Accuracy refers to the ratio that records in Set B divided by record in Set A. In
order to get the actual differences, an accurate result done by Basic Join for each
dataset is made as a reference, so as to evaluate the accuracy of Bloom filters. The
formula is:
C.

44
Memory space is the total memory space of all filters. Total memory space is
measured as follows:
1. Establish a global accumulator - ExMem ;
2. In the setup phase of Reducer, the program builds and when the Bloom
filters are completed, space of the filters can be determined , MemUsage
method is called to get the space of this filter;
3. This value is cumulative to the accumulator ExMem;
4. View the value of the accumulator ExMem when the program finished,
write down the total memory consumption.
Note: due to Mapreduce parallel mechanisms, total memory space demand is not
the maximum memory requirements at the same time, because this value does
not have a typical representative meaning, it can only be used as a macro
reference. So it is not concerned in this thesis.
What really useful is memory space for Bloom filters allocated by all the
parallel Reducer at the same time , but since how many Reducer nodes are
running parallelly at the same time cannot be measured , this value is hard to be
calculated, so space overhead is not further discussed in this experiment .
D.
Running time is time of Mapreduce start running to end running and is measured
as follows:
1. Write down the time before program starts- start;
2. Call the statement execute Mapreduce job-waitforcomplete ();
3. Write down the end time, find the time of executing the job (including
I/O time in Mapreduce and computing time) , Duration=end-start;
4. Write a statistics program. Use Java to generate a program to statistic
results, including program running time, memory required and accuracy.
The program used Hadoop HDFS API, to read and write file in Stream way.
5. Write experiment script using bash shell [15], subject was a loop, table 3
and table 4 were used as input parameters for experiment, and all the
input parameters were the Cartesian product of two tables. The file also
included the setting of input parameters.

45
5.2 Experiment result
5.2.1 Reduce size of dataset
It was mentioned in the experimental design part that MD5 is used to reduce the
size of data in this scheme. MD5 method is to convert each record to a pair of (PK,
MD5) key, theoretically, dataset size cannot be reduced using this method if the
length of raw data is less than 128 bits. The effect is related to length of data, which
means the bigger the raw data, the bigger the scale.
Data sample generated according to real need, the result of this stage is shown
below:
Number of
data(row)
Size of raw
data(KB)
Size of data after
applying
MD5(KB)
Reduction
Scale
100K 5632 3950 29.8%
500K 29460 19966 32.2%
1M 59245 40474 31.6%
5M 309245 204536 33.8%
10M 621745 414497 33.3%
Table 5.3 Experiment result of reducing dataset using MD5
It can be regarded that, dataset size is reduced to 70%. The advantage of this
method is that all records are mapped into a fixed-size file. Data is standardized
while it is reduced.
5.2.2 Accuracy
Part of the result was put below in table5.4, number of data records was 1M and
5M while error rate was 20% and the accuracy was based on different input
parameters.
Data
sour
ce
Algorith
m type
Numb
er of
recor
ds
Error
rate
Algorith
m Error rate
Cover
rate Accuracy

46
G043 BJ
A10 1M
20
% 1 0 1 1
G043 BF
A21 1M
20
% 2 1.0000% 1 0.99891
G043 BF
A31 1M
20
% 3 1.0000% 1
0.998526
667
G043 BF
A41 1M
20
% 4 1.0000% 1 0.99891
G043 BF
A51 1M
20
% 5 1.0000% 1
0.998526
667
G043 BF
A61 1M
20
% 6
1.0000
% 1 1
G043 BF
A71 1M
20
% 7
1.0000
% 1 1
G043 BF
A22 1M
20
% 2 0.0100% 1
0.999986
667
G043 BF
A32 1M
20
% 3 0.0100% 1 0.99996
G043 BF
A42 1M
20
% 4 0.0100% 1
0.999986
667
G043 BF
A52 1M
20
% 5 0.0100% 1 0.99996
G043 IBF
A62 1M
20
% 6
0.0100
% 1 1
G043 IBF
A72 1M
20
% 7
0.0100
% 1 1
G043 BF
A23 1M
20
% 2 0.0001% 1 1
G043 BF
A33 1M
20
% 3 0.0001% 1 1
G043 BF
A43 1M
20
% 4 0.0001% 1 1
G043 BF
A53 1M
20
% 5 0.0001% 1 1

47
G043 IBF
A63 1M
20
% 6
0.0001
% 1 1
G043 IBF
A73 1M
20
% 7
0.0001
% 1 1
G053 BJ
A10 5M
20
% 1 0 1 1
G053 BF
A21 5M
20
% 2
1.0000
% 1
0.99898
467
G053 BF
A31 5M
20
% 3
1.0000
% 1
0.99855
533
G053 BF
A41 5M
20
% 4
1.0000
% 1
0.99898
467
G053 BF
A51 5M
20
% 5
1.0000
% 1
0.99855
533
G053 IBF
A61 5M
20
% 6
1.00
00
%
1 1
G053 IBF
A71 5M
20
% 7
1.0000
% 1 1
G053 BF
A22 5M
20
% 2
0.0100
% 1
0.99998
867
G053 BF
A32 5M
20
% 3
0.0100
% 1
0.99996
933
G053 BF
A42 5M
20
% 4
0.0100
% 1
0.99998
867
G053 BF
A52 5M
20
% 5
0.0100
% 1
0.99996
933
G053 IBF
A62 5M
20
% 6
0.0100
% 1 1
G053 IBF
A72 5M
20
% 7
0.0100
% 1 1
G053 BF
A23 5M
20
% 2
0.0001
% 1 1
G053 BF 5M 20 3 0.0001 1 1

48
A33 % %
G053 BF
A43 5M
20
% 4
0.0001
% 1 1
G053 BF
A53 5M
20
% 5
0.0001
% 1 1
G053 IBF
A63 5M
20
% 6
0.0001
% 1 1
G053 IBF
A73 5M
20
% 7
0.0001
% 1 1
Table 5.4 Experiment result of accuracy
If Bloom filter predicates a set does not contain an element it cannot make
mistake, therefore in the program made in this thesis , eventually results in the
does not contains those does not in a,, and c, and d in the of records; butdue to
bloom filter exists positive miscalculation in query , so it may predicate some
elements which does not exist in one set that in fact they are in by mistake which
caused loss of accuracy .
It is known from table 5.4 above:
The accuracy of BJ is 100%, the same as the scheme guesses.
Considering about BF algorithms (shown in light grey part) when the false rate
of one algorithm is high, the accuracy of result is low and they maintains at the
same accuracy. (For example, when false rate is 1%, accuracy is higher than
99% which means the misjudgment in result is lower than 1%.) Dark grey in
table means, when false rate of one algorithm is lower, accuracy gets higher,
nearly 100%.
Accuracy of IBF is 100% based on the specification of the algorithm, the same
as scheme assumes.
Similarly the same law appears when the number of data is 5M.In the regard,
considering about accuracy, Basic Join and IBF scheme can guarantee a 100%
accuracy based on algorithm features. Accuracy in BF schemes is adjustable based
on input parameters, specifically is to set the false rate in input paremeters
based on requirement(for example , when the false rate is below 0.0001%, then
the parameter need to be set 0.0001%). Based on the result above, accuracy of all
the schemes can meet the requirement of the project

49
5.2.3 Relationship between number of data and runtime
Six groups of different number of data were tested in this experiment, 10
thousand; 100 thousand; 500 thousand; 1 million; 5 million and 10 million. And
related parameters were: error rate: 20%, algorithm false rate:0.0001.
Experiments were conducted with these parameters. Results were shown in the
table below, 1 was BJ, 2 was CBF, 4 was SBF and 6 was IBF. Each experiment was
conducted twice at least to minimize the accidental error and the time is the
average value of all the runtime. This table shows the runtime trend with a
growing number of data, x-axis is number of data (row) while y-axis is runtime
(second)
Figure5.1 Diagram of the number of data and runtime
It can be told from the diagram that with a small number of data(less than 1M),
the differences are very little. However, with the growing of data, Basic Join
showed its superiority. It can be told from the diagram that Basic Join cost more
time than others only when number of data was 10 thousand while it cost the
least during all other cases. Therefore, BJ would be regarded as reference group in
analysis below.
Time cost of BJ minus time cost of other algorithms divided by time cost of BJ
will be used to compare differences of other three algorithms with BJ.

50
Number
of data
BJ compared to other
algorithms
Speed Ratio
CBF SBF IBF CBF SBF IBF
10K -0.15 -2.40 -2.01 -0.3% -5.7% -4.8%
100K 0.83 0.63 0.32 1.9% 1.4% 0.7%
500K 2.78 3.68 2.61 5.4% 7.2% 5.1%
1M 3.86 1.80 9.25 6.2% 2.9% 14.8%
5M 27.95 7.12 32.15 21.6% 5.5% 24.9%
10M 97.05 10.83 85.70 36.4% 4.1% 32.1%
Table 5.5 Runtime comparison between Basic Join and other algorithms
It can be told from the table, when number of data was 10 thousand, BJ was
the slowest of them all. 5.7% (2.4sec) slower than SBF and 0.3%(0.15sec) than
CBF.
When number of data was 100 thousand, BJ was the fastest among all
algorithms, 0.7%(0.32 sec) than IBF, 1.9%(0.83 sec) faster than CBF and
1.4%(0.63 sec) faster than SBF.
When number of data was 500 thousand, BJ was the fastest among all
algorithms, 5.1%(2.61 sec) than IBF, 5.4%(2.78 sec) faster than CBF and
7.2%(3.68 sec) faster than SBF.
When the number of data was 100 thousand, BJ was the fastest among all
algorithms, 0.7%(0.32 sec) than IBF, 1.9%(0.83 sec) faster than CBF and
1.4%(0.63 sec) faster than SBF.
When the number of data was 5 million, BJ was the fastest among all
algorithms, 5.5%(7.12 sec) than IBF, 21.6%(27.95 sec) faster than CBF and
24.9%(32.15 sec) faster than SBF.
When the number of data was 10 million, BJ was the fastest among all
algorithms, 4.1% (10.83 sec) than IBF, 36.4%(97.05 sec) faster than CBF and
32.1%(85.7 sec) faster than SBF.
It can be told from the diagram that with a small number of data (10
thousand), the differences was very little. However, with the growing of data,
Basic Join showed its superiority. When the number of data was 100 thousand,
500 thousand and 1 million, BJ was faster than other three schemes but the gap
was only 7%, not that wide. With a greater number of data like 5 million and 10

51
million, BJ was about 30% faster than CBF and IBF while the speed of SBF was
5.5% and 4.1%, still quite close. Overall, the greater the number of data was the
more obvious the advantage of BJ was. SBF can keep a good performance (about
5% slower than BJ) no matter number of data was big or small, which means
change of the number of data did not affect SBF‘s performance. CBF and IBF had a
bad performance when the number of data was big.
It can be concluded from the experiment that BJ is the most efficient
regardless of the size of data which is consistent with the description of paper (in
Chapter 3). Analysis of other three algorithms was as follows:
Theoretically, time cost in query phase of CBF and SBF only associated with the
execution time of a hash function, not affected by the amount of data, thus the
reason of time-consuming increase was inferred due to building Bloom filters in
data insert phases since its time complexity was O(n).
On the other hand, with the increases of input data, the memory space
assigned to the Bloom filter data structures by program also increased, thus
resulted in increased cost of visiting memory; this was also the reason why CBF‘s
efficiency was not as good as SBF‘s since SBF required less memory space than
CBF from the analysis of structure data, so SBF‘s runtime was the closest to Basic
Join. Impact of memory cost on runtime can be further optimized in the follow-up
job.
On considering No.6 algorithm-IBF scheme, time to generate the data
structure would be affected by the number of data, the runtime to recover was
related to number of inconsistent data. The more inconsistent data there was, the
more time ―recover‖ need. In the experiment, data error rate stand the same,
therefore, with the increasing of data, the number of inconsistent was going to
increase which increased the time cost of IBF scheme.
The difference between IBF and BF was that in data structure generating
phrase, the former performes aonly one traverse while BF have to perform
traverses for the source data on both sides in order to generate their own data
structures. Due to different data structure, IBF consumes more time on operating
metadata, so total time was different based on different input data. And statistical
data can be concluded from the first column of the chart (10K) that IBF took the
minimum runtime due to rare inconsistent data and in the recovery phase also.
And IBF defeated BF in building structure stage as well.

52
5.2.4 Diagram of the relationship between Accuracy and Runtime
G052 (5 million) was selected as experimental input data, runtime of different
algorithm with different accuracy is illustrated below (false rate are 0.01; 0.0001;
0.000001 while Basic Join is set as 0). A10 was Basic Join, A2* and A3* were CBF;
A4* and A5* were SBF while A6* and A7* were IBF.
Figure 5.2 Diagram of the relationship between accuracy and runtime
It can be concluded from this diagram that different accuracy for different
algorithm leads to different run time. In all the schemes, BJ has the shortest run
time meanwhile it is not affected by parameter. A table can be concluded using the
same way as table 5.5:
No. Algorithm Time cost of algorithm
–time cost of BJ(s)
Speed Ratio
0.000001 0.0001 0.01 0.000001 0.0001 0.01
1 2 397.02 35.50 55.43 322.9% 6.8% 35.0%
2 3 409.11 31.65 25.29 332.7% 5.9% 16.4%
3 4 21.10 25.24 16.44 17.2% 17.5% 11.1%
4 5 25.82 17.60 16.85 21.0% 11.8% 12.0%
5 6 187.39 32.10 14.95 152.4% 10.3% 9.6%
6 7 255.16 38.43 31.29 207.5% 10.2% 19.4%
Table 5.6 Runtime comparison of algorithms on different accuracy
It can be seen from 1st and 2nd lines that CBF required a very high accuracy
(error less than 0.000001) and the difference was very obvious. Its runtime was

53
approximately 3 times more than Basic Join‘s (332.9% and 332.7%), When
accuracy was 0.0001, its runtime was a few percentage points more compared to
Basic Join. But when accuracy requirement was low (0.01), its runtime was a
dozen percentage points more than Basic Join‘s. And it can be concluded that
when accuracy is 0.0001 CBF has a better performance.
It can be seen from the 4th and 5th line when accuracy changes ,change of
SBF‘s runtime was small compared to Basic Join, both showed a dozen
percentage points which means its performance is not affected by accuracy
greatly.
It can be seen from the 5th and 6th lines that IBF required an extremely high
accuracy. When error was less than 0.000001, its runtime was approximately
1.5~2 times more than Basic Join, the differences were very obvious. And when
accuracy was 0.0001 and 0.01, runtime showed little difference, 10% more than
Basic Join. With validation in the previous chapter, IBF can guarantee a
completely accurate result, so here accuracy was just one incoming parameters
which affects memory space allocated to IBF data structures by system, thus
precision parameters should not be configured too high but fits the actual
situation to reduce the memory space allocated.
When accuracy rate was low (<0.000001), time-consuming of different
scenarios was not notable, but when accuracy rate was high, time-consuming of
CBF and IBF increased bursting. The reason can be explained as, with the
increase of accuracy rate,in order to guarantee accuracy more memory space
must be distributed so as to guarantee the low conflict rate of hash
algorithm.Therefore it was inferred that this time-consuming increase situation
was due to increase of memory need. And while this algorithm was short of
memory space, it caused a large amount of page-changing operation which
brought interference to experimental results. And since SBF need smaller memory
space comparing to CBF and IBF, it was not affected significantly.

54

55
Chapter 6 Conclusion
With the advantage of Mapreduce‘s parallel computing capabilities, three
scenarios were generated using the Mapreduce program model on Hadoop
platform. And according to customer needs, this thesis generated mass of data
(maximum 10M records) for experiment and validated the feasibility, conducted
experiments on the improved scenario. In order to meet the need of the
experimental process, the whole experimental system was designed using the
object-oriented method; and on program structure, JAVA reflection mechanism
was used to achieve a flexible class-switching code which enabled the flexibility so
as to experiment with mass data by adjusting parameters.
Last, analysis was made through current experimental results, with accuracy,
and runtime. In accuracy, the conclusion was that all three scenarios can provide
enough guarantee and can meet customer of needs (errors in 0.0001% within).
Basic Join and IBF can guarantee a 100% accurate rate while BF can reach an
acceptable accurate rate by adjusting parameters like gaining more space.
In efficiency, when the amount of data was small (10,000), BF was faster
than Basic Join and when the amount of data was greater than 10,000, efficiency
of Basic Join was the best in three scenarios. On the premise of ensuring accuracy,
SBF was close to Basic Join, while CBF and IBF were about 2~3 times slower.
When the need for accuracy was low, CBF, SBF and IBF were almost the same
in runtime while Basic Join was slightly better. And when the need for accuracy
was high, due to the sharp increase in memory space, which caused a spurt in the
runtime of CBF and IBF, and SBF was not sensitive to accuracy adjustment.
According to laboratory test results, on one hand, increase of runtime was
found in memory operations during experiments with a higher accuracy which
caused a certain amount of interferences on results. On the other hand, if
experiments were conducted in an environment with better hardware and bigger
memory space, the results may also change. In short, memory operations can be
optimized, such as how to reduce the space requirements of CBF. It can be said
that the win of Basic Join further validates the efficiency of Mapreduce.

56

Chapter 7 Bibliography
[1] Donald Knuth. "The Art of Computer Programming, Errata for Volume 3 (2nd ed.).
[2] B. Bloom. Space/time tradeoffs in hash coding with allowable errors. CACM ,
13(7):422-426,1970.
[3] Kun Xie. A Scalable Bloom Filter For Membership Query[C]. Global Telecommunications
Conference, 2007. GLOBECOM '07. IEEE: 543-547
[4] Goodrich, M.T., Mitzenmacher, M. Invertible bloom lookup tables[C]. Communication,
Control, and Computing (Allerton), 2011 49th Annual Allerton Conference on:792 - 799
[5] Jeffrey Dean and Sanjay Ghemawat. MapReduce: Simplified Data Processing on Large
Clusters[C]. COMMUNICATIONS OF THE ACM January 2008/Vol. 51, No. 1
[6] Dean, J. and Ghemawat, S. 2004. MapReduce: Simplified data processing on large clusters.
In Proceedings of Operating Systems Design and Implementation (OSDI). San Francisco, CA.
137-150.
[7] Chuck Lam, Hadoop in Action, Manning Publications; 1 edition , 2010
[8] Ai Wen,Lei Wang. High-efficiency HDFS—Practice on Hadoop file system Tsinghua
University Press 1-May-2012
[9] Tom White. Hadoop:The Definitive Guide(2nd edition)[M]. 2011
[10] Owen O’Malley. TeraByte Sort on Apache Hadoop. 2008
[11] Jim Wyllie. SPsort: How to Sort a Terabyte quickly.
http://alme1.almaden.ibm.com/cs/spsort.pdf , date visited “13:20-53 1-May-2012”
[12] John Byers, Jeffrey Considine, Michael Mitzenmacher. Fast Approximate Reconciliation of
Set Differences. BU Computer Science TR. 2002-19
[13] Broder A, Mitzenmacher M. Network applications of Bloom filters: A survey. Internet
Mathematics, 2002, 1(4):636 − 646
[14] Jie Hou. Java reflection mechanism. The Programmer 2004(10)
[15] Bash operating booklet by GNU:http://www.gnu.org/software/bash/manual/bash.html, date
visited “14:15-3, 21-May-2012”
[16] Skjegstad, Magnus and Maseng, Torleiv. Low complexity set reconciliation using Bloom
filters. Proceedings of the 7th ACM 2011(11) 33-41
[17] Jens Dittrich, Jorge-Arnulfo Quian e-Ruiz, Alekh Jindal. Hadoop++: Making a Yellow
Elephant Run Like a Cheetah(Without It Even Noticing)
[18] LI Xiang, Analysis of Cloud Computing Infrastructure Based on Hadoop,2011
[19] Github help, https://help.github.com/articles/creating-a-new-repository, date visited “8:18-50
12-June-2012”
[20] B. Bloom. Space/time trade-offs in hash coding with allowable errors. Communications of
the ACM, 13(7): 422-426, 1970.
57