research article a comparison of variant calling pipelines using genome...
TRANSCRIPT

Research ArticleA Comparison of Variant Calling Pipelines UsingGenome in a Bottle as a Reference
Adam Cornish1 and Chittibabu Guda1,2,3,4,5
1Department of Genetics, Cell Biology and Anatomy, University of Nebraska Medical Center, Omaha, NE 68198, USA2Bioinformatics and Systems Biology Core, University of Nebraska Medical Center, Omaha, NE 68198, USA3Department of Biochemistry and Molecular Biology, University of Nebraska Medical Center, Omaha, NE 68198, USA4Fred and Pamela Buffet Cancer Center, University of Nebraska Medical Center, Omaha, NE 68198, USA5Eppley Institute for Research in Cancer and Allied Diseases, University of Nebraska Medical Center, Omaha, NE 68198, USA
Correspondence should be addressed to Chittibabu Guda; [email protected]
Received 17 November 2014; Accepted 17 December 2014
Academic Editor: Aparup Das
Copyright © 2015 A. Cornish and C. Guda. This is an open access article distributed under the Creative Commons AttributionLicense, which permits unrestricted use, distribution, and reproduction in any medium, provided the original work is properlycited.
High-throughput sequencing, especially of exomes, is a popular diagnostic tool, but it is difficult to determine which tools are thebest at analyzing this data. In this study, we use the NIST Genome in a Bottle results as a novel resource for validation of our exomeanalysis pipeline.We use six different aligners and five different variant callers to determine which pipeline, of the 30 total, performsthe best on a human exome that was used to help generate the list of variants detected by the Genome in a Bottle Consortium. Ofthese 30 pipelines, we found that Novoalign in conjunction with GATK UnifiedGenotyper exhibited the highest sensitivity whilemaintaining a low number of false positives for SNVs. However, it is apparent that indels are still difficult for any pipeline to handlewith none of the tools achieving an average sensitivity higher than 33% or a Positive Predictive Value (PPV) higher than 53%. Lastly,as expected, it was found that aligners can play as vital a role in variant detection as variant callers themselves.
1. Background
In the past few years there have been many advances madeto high-throughput sequencing technologies. Due to theseadvances, it is now possible to detect a great number ofpotential disease-causing variants [1], and, in a few cases,next generation sequencing (NGS) data has even been usedfor diagnostic purposes [2–4]. This is partially due to thedevelopments in sequencing technologies over the past fewyears but also due to the number of improvements made tothe various bioinformatic tools used to analyze themountainsof data produced by NGS instruments [5].
When searching for mutations in a patient, a typicalworkflow is to sequence their exome with an Illuminasequencer, align the raw data to the human reference genome,and then identify single nucleotide variants (SNVs) or shortinsertions and deletions (indels) that could possibly causeor influence the phenotype of interest [6]. While this is
fairly straightforward, deciding on the best tools to use ateach stage of the analysis pipeline is not. There are a largenumber of tools that are used in various intermediate steps,but the two most important steps in the entire process arealigning the raw reads to the genome and then searchingfor variants (i.e., SNVs and indels) [7]. In this study, we aimto help today’s bioinformatician by elucidating the correctcombination of short read alignment tool and variant callingtool for processing exome sequencing data produced by NGSinstruments.
A number of these studies have been performed inthe past, but they all had drawbacks of some form oranother. Ideally one should have a list of every known variantcontained in a sample so that when a pipeline of analysistools is run, you can test it to know with certainty that itis performing correctly. However, in the past no such listexisted, so validation had to be performed by less completemethods. In some instances, validation was performed by
Hindawi Publishing CorporationBioMed Research InternationalVolume 2015, Article ID 456479, 11 pageshttp://dx.doi.org/10.1155/2015/456479

2 BioMed Research International
generating simulated data so as to create a set of known truepositives (TP) and true negatives (TN) [8–10]. While thisconveniently provides a list of every TP andTN in the dataset,it does a poor job of accurately representing biology. Othermethods of validating variant calling pipelines include usinggenotyping arrays or Sanger sequencing to obtain a list ofTPs and false positives (FP) [11]. These have the upside ofproviding biologically validated results, but they also havethe downside of not being comprehensive due to the limitednumber of spots on genotyping arrays and the prohibitivecost of Sanger validationwhenperformed thousands of times.Lastly, none of these studies aimed at looking at the effect theshort read aligner had on variant calling. Consequently, theupstream effect of aligner performance could not be assessedindependently.
In this study, we have the advantage of a list of variantsfor an anonymous female from Utah (subject ID: NA12878,originally sequenced for the 1000 Genomes project [12])that was experimentally validated by the NIST-led Genomein a Bottle (GiaB) Consortium. This list of variants wascreated by integrating 14 different datasets from five differentsequencers, and it allows us to validate any list of variantsgenerated by our exome analysis pipelines [7]. The novelty ofthis work is to validate the right combination of aligners andvariant callers against a comprehensive and experimentallydetermined variant dataset: NIST-GiaB.
To perform our analysis we will be using one of theexome datasets originally used to create the NIST-GiaBlist. We chose only one of the original Illumina TruSeq-generated exomes because we wanted to provide a standarduse case scenario for someone who wishes to perform NGSanalysis, and while whole genome sequencing is continuingto drop in price, exome sequencing is still a popular andviable alternative [1]. It is also important to note that, perBamshad et al., currently the expected number of SNVs perEuropean-American exome is 20,283 ± 523 [13]. Despite this,the total number of SNVs found in the NIST-GiaB list withthe potential to exist in TruSeq exome dataset was 34,886,which is significantly higher than expected. This is likely dueto the fact that while the exome kit was used to generateNIST-GiaB data it was also supplemented by whole genomesequencing.
Lastly, we considered a large number of aligners [14–21] and variant callers [22–29] but ultimately chose the 11tools based on prevalence, popularity, and relevancy to ourdataset (e.g., SNVMix, VarScan2, and MuTect were not usedas they are intended for use on tumor-derived samples). Ouranalysis itself involves comparing six aligners (Bowtie2 [14],BWA sampe [15], BWAmem [16], CUSHAW3 [17], MOSAIK[18], and Novoalign) and five variant callers (FreeBayes[22], GATK HaplotypeCaller, GATK UnifiedGenotyper [23],SAMtools mpileup [24], and SNPSVM [25]). In this studywe also try to determine how much of an effect, if any, thealigner has on variant calling and which aligners performbest when using a normal Illumina exome sample. To ourknowledge, this is the first report which validates all possiblecombinations (total of 30 pipelines) of a wide array of alignersand variant callers.
Table 1: Alignment percentages for filtered reads and unfilteredreads.The average depth of coverage is for the alignment files createdwith the filtered reads.
Aligner % reads aligned(unfiltered)
% reads aligned(filtered)
Averagedepth ofcoverage
Bowtie2 89.73 98.73 47.97BWAmem 92.91 99.85 46.89BWA sampe 85.95 97.49 46.67CUSHAW3 85.00 99.81 47.69MOSAIK 85.68 96.22 45.14Novoalign 82.21 94.20 45.62
2. Methods
2.1. Datasets. Human reference genome hg19 was down-loaded from the UCSC browser (http://hgdownload.soe.ucsc.edu/goldenPath/hg19/chromosomes/) and was used to per-form the alignments. The human exome, SRR098401,was downloaded from the Sequence Read Archive (SRA)(http://www.ncbi.nlm.nih.gov/sra). For annotation and cal-ibration purposes, dbSNP137 without sites after version 129,HapMap 3.3, Human Omni 2.5 BeadChip, and Mills and1000G gold standard indel set lists were used (all from ftp://ftp.broadinstitute.org/distribution/gsa/gatk resources.tgz).
2.2. The Pipeline. Figure 1 shows the workflow used in thisstudy, which is similar to the one outlined in the BestPractices guide produced by The Broad Institute [30]. Thisinvolves a number of steps to ensure that the alignmentfiles produced are of the highest quality as well as severalmore to guarantee the variants are called correctly. First, rawreads were aligned to hg19, and then PCR duplicates wereremoved from the alignment. Next, to help with indel identi-fication later in the pipeline, read realignment was performedaround indels. The last step of alignment processing was toperform a base quality score recalibration step, which helpsto ameliorate the inherent bias and inaccuracies of scoresissued by sequencers. Unfortunately, despite these steps, thealignment rate of each aligner was significantly lower thanexpected, so to offset this, the fastx toolkit was used to filterout lowquality reads (Table 1). Lowquality readswere definedas those reads that had at least half of their quality scoresbelow 30. Following alignment processing, variant callingand variant filtering were performed.
The six tools used to generate alignments were Bowtie2,BWA mem, BWA sampe, CUSHAW3, MOSAIK, andNovoalign, and the five tools used to generate variants wereFreeBayes, GATK HaplotypeCaller, GATK UnifiedGeno-typer, SAMtools mpileup, and SNPSVM, as can be seen inTable 2.
2.3. Filtering. Raw data was acquired from the SRA(SRR098401), split with fastq-dump, and filteredusing the fastx toolkit. Specifically, fastq-dump usedthe --split files and --split spot flags, and

BioMed Research International 3
Filter raw reads
Align reads to hg19 using six aligners
Remove PCR duplicates from alignments
Realign reads around indels
Recalibrate base quality scores
Perform variant calling using five variant callers
Filter variants using tool-specific filters
Compare variant to Genome in a Bottle results
Bowtie2 CUSHAW3
BWA-mem MOSAIKBWA-sampe Novoalign
Prepare alignment files for variant calling
FreebayesGATK—UnifiedGenotyperGATK—HaplotypeCaller
SAMtools mpileupSNPSVM
Call variants using alignment files
Figure 1: Schematic of the data analysis pipeline used. To ensure that the highest quality alignments are created, reads are first filtered andthen aligned to the human reference genome, hg19. Next, PCR duplicates are removed, reads are aligned around putative indels, and basequality scores are recalibrated. Finally, variants are called and validated against the NIST-GiaB list of variants.
Table 2:These are the 11 different tools used thatmade up the 30 (sixaligners ∗ five variant callers) different pipelines. Software versionsare also included to ensure reproducibility.
Tool Type Version ReferenceBowtie2 Aligner 2.1.0 [14]BWA sampe Aligner 0.7.5a [15]BWAmem Aligner 0.7.5a [16]CUSHAW3 Aligner 3.0.3 [17]MOSAIK Aligner 2.2.3 [18]Novoalign Aligner 3.02.07 N/AFreeBayes Genotyper v9.9.2-19-g011561f [22]GATKHaplotypeCaller Genotyper 2.7-2 N/A
GATKUnifiedGenotyper Genotyper 2.7-2 [23]
SAMtools mpileup Genotyper 0.1.19 [24]SNPSVM Genotyper 0.01 [25]
fastq quality filter was run with the following arguments:-Q 33 -q 30 -p 50. Then reads were properly paired with acustom script.
2.4. Aligning. Aligners used default arguments except whena threads argument was used where available.The commandsused are as follows.
2.4.1. Bowtie2
(1) bowtie2 -p 10 -x $INDEX -1 raw data/read 1 filtered.fastq -2 raw data/read 2filtered.fastq -S alignments/NA12878.bt2.sam
2.4.2. BWA Sampe
(1) bwa aln -t 10 genome/hg19.fa rawdata/read 1 filtered.fastq > alignments/NA12878.R1.sai
(2) bwa aln -t 10 genome/hg19.fa raw data/read 2 filtered.fastq > alignments/NA12878.R2.sai
(3) bwa sampe genome/hg19.fa alignments/NA12878.R1.sai alignments/NA12878.R2.sairaw data/read 1 filtered.fastq raw data/read 2 filtered.fastq > alignments/NA12878.bwa-sampe.sam
2.4.3. BWAMem
(1) bwa mem -t 10 genome/hg19.fa raw data/read 1 filtered.fastq raw data/read 2filtered.fastq > alignments/NA12878.bwa-mem.sam
2.4.4. CUSHAW3
(1) cushaw3 align -r $INDEX -t 10 -oalignments/NA12878.CUSHAW3.sam -qraw data/read 1 filtered.fastqraw data/read 2 filtered.fastq
2.4.5. MOSAIK
(1) MosaikBuild -q raw data/read 1filtered.fastq -q2 raw data/read2 filtered.fastq -st illumina -outalignments/NA12878.MOSAIK.mkb
4 BioMed Research International
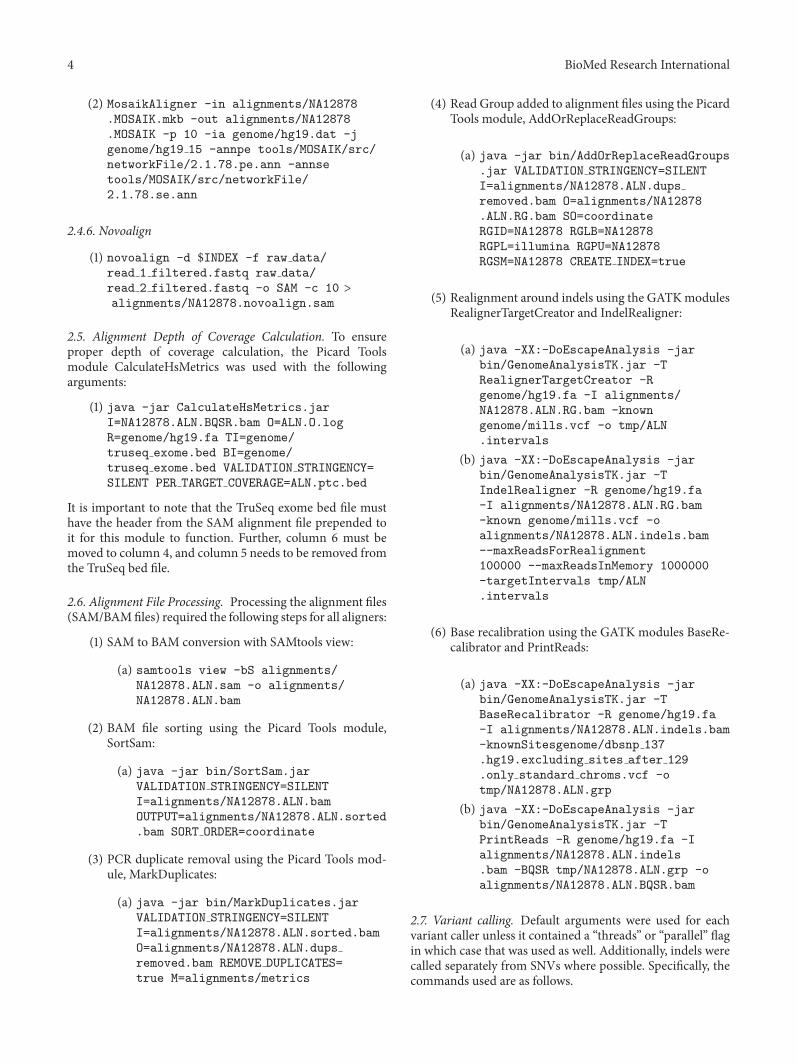
(2) MosaikAligner -in alignments/NA12878.MOSAIK.mkb -out alignments/NA12878.MOSAIK -p 10 -ia genome/hg19.dat -jgenome/hg19 15 -annpe tools/MOSAIK/src/networkFile/2.1.78.pe.ann -annsetools/MOSAIK/src/networkFile/2.1.78.se.ann
2.4.6. Novoalign
(1) novoalign -d $INDEX -f raw data/read 1 filtered.fastq raw data/read 2 filtered.fastq -o SAM -c 10 >alignments/NA12878.novoalign.sam
2.5. Alignment Depth of Coverage Calculation. To ensureproper depth of coverage calculation, the Picard Toolsmodule CalculateHsMetrics was used with the followingarguments:
(1) java -jar CalculateHsMetrics.jarI=NA12878.ALN.BQSR.bam O=ALN.O.logR=genome/hg19.fa TI=genome/truseq exome.bed BI=genome/truseq exome.bed VALIDATION STRINGENCY=SILENT PER TARGET COVERAGE=ALN.ptc.bed
It is important to note that the TruSeq exome bed file musthave the header from the SAM alignment file prepended toit for this module to function. Further, column 6 must bemoved to column 4, and column 5 needs to be removed fromthe TruSeq bed file.
2.6. Alignment File Processing. Processing the alignment files(SAM/BAMfiles) required the following steps for all aligners:
(1) SAM to BAM conversion with SAMtools view:
(a) samtools view -bS alignments/NA12878.ALN.sam -o alignments/NA12878.ALN.bam
(2) BAM file sorting using the Picard Tools module,SortSam:
(a) java -jar bin/SortSam.jarVALIDATION STRINGENCY=SILENTI=alignments/NA12878.ALN.bamOUTPUT=alignments/NA12878.ALN.sorted.bam SORT ORDER=coordinate
(3) PCR duplicate removal using the Picard Tools mod-ule, MarkDuplicates:
(a) java -jar bin/MarkDuplicates.jarVALIDATION STRINGENCY=SILENTI=alignments/NA12878.ALN.sorted.bamO=alignments/NA12878.ALN.dupsremoved.bam REMOVE DUPLICATES=true M=alignments/metrics
(4) Read Group added to alignment files using the PicardTools module, AddOrReplaceReadGroups:
(a) java -jar bin/AddOrReplaceReadGroups.jar VALIDATION STRINGENCY=SILENTI=alignments/NA12878.ALN.dupsremoved.bam O=alignments/NA12878.ALN.RG.bam SO=coordinateRGID=NA12878 RGLB=NA12878RGPL=illumina RGPU=NA12878RGSM=NA12878 CREATE INDEX=true
(5) Realignment around indels using the GATKmodulesRealignerTargetCreator and IndelRealigner:
(a) java -XX:-DoEscapeAnalysis -jarbin/GenomeAnalysisTK.jar -TRealignerTargetCreator -Rgenome/hg19.fa -I alignments/NA12878.ALN.RG.bam -knowngenome/mills.vcf -o tmp/ALN.intervals
(b) java -XX:-DoEscapeAnalysis -jarbin/GenomeAnalysisTK.jar -TIndelRealigner -R genome/hg19.fa-I alignments/NA12878.ALN.RG.bam-known genome/mills.vcf -oalignments/NA12878.ALN.indels.bam--maxReadsForRealignment100000 --maxReadsInMemory 1000000-targetIntervals tmp/ALN.intervals
(6) Base recalibration using the GATK modules BaseRe-calibrator and PrintReads:
(a) java -XX:-DoEscapeAnalysis -jarbin/GenomeAnalysisTK.jar -TBaseRecalibrator -R genome/hg19.fa-I alignments/NA12878.ALN.indels.bam-knownSitesgenome/dbsnp 137.hg19.excluding sites after 129.only standard chroms.vcf -otmp/NA12878.ALN.grp
(b) java -XX:-DoEscapeAnalysis -jarbin/GenomeAnalysisTK.jar -TPrintReads -R genome/hg19.fa -Ialignments/NA12878.ALN.indels.bam -BQSR tmp/NA12878.ALN.grp -oalignments/NA12878.ALN.BQSR.bam
2.7. Variant calling. Default arguments were used for eachvariant caller unless it contained a “threads” or “parallel” flagin which case that was used as well. Additionally, indels werecalled separately from SNVs where possible. Specifically, thecommands used are as follows.

BioMed Research International 5
2.7.1. FreeBayes
(1) freebayes -f genome/hg19.fa -i -X -u -vvcf files/NA12878.ALIGNER.freebayes.raw.snv.vcf alignments/NA12878.ALIGNER.BQSR.bam
(2) freebayes -f genome/hg19.fa -I -X -u -vvcf files/NA12878.ALIGNER.freebayes.raw.indel.vcf alignments/NA12878.ALIGNER.BQSR.bam
2.7.2. GATK HaplotypeCaller
(1) java -XX:-DoEscapeAnalysis -jar bin/GenomeAnalysisTK.jar -T HaplotypeCaller-R genome/hg19.fa -I alignments/NA12878.ALIGNER.BQSR.bam --dbsnp $DBSNP -ovcf files/NA12878.ALIGNER.HC.raw.vcf -stand call conf 50
2.7.3. GATK UnifiedGenotyper
(1) java -XX:-DoEscapeAnalysis -jarbin/GenomeAnalysisTK.jar -TUnifiedGenotyper -R genome/hg19.fa-nt 10 -I alignments/NA12878.ALIGNER.BQSR.bam -o vcf files/NA12878.ALIGNER.UG.raw.snv.vcf -glm SNP -D $DBSNP
(2) java -XX:-DoEscapeAnalysis -jarbin/GenomeAnalysisTK.jar -TUnifiedGenotyper -R genome/hg19.fa -nt10 -I alignments/NA12878.ALIGNER.BQSR.bam -o vcf files/NA12878.ALIGNER.UG.raw.indel.vcf -glm INDEL -D $MILLS
2.7.4. SAMtools Mpileup
(1) samtools mpileup -uf genome/hg19.faalignments/NA12878.ALIGNER.BQSR.bam | bcftools view -bvcg - >vcf files/NA12878.ALIGNER.mpileup.bcf && bcftools view vcf files/NA12878.ALIGNER.mpileup.bcf > vcf files/NA12878.ALIGNER.mpileup.raw.vcf
2.7.5. SNPSVM
(1) java -XX:ParallelGCThreads=10 -jartools/SNPSVM/snpsvm.jar predict -Rgenome/hg19.fa -B alignments/NA12878.ALIGNER.BQSR.bam -M tools/SNPSVM/models/default.model -Vvcf files/NA12878.ALIGNER.SNPSVM.raw.vcf
Due to the nonexistence of requisite CIGARflags in the align-ment file, SNPSVM failed to call variants for CUSHAW3,and SAMtools mpileup could not call variants on MOSAIKalignments for the same reason. Also, due to the fact that
SNPSVM only detects SNVs, no indels were reported for thisprogram.
2.8. Variant Filtration. Filtration varied depending on thevariant caller being used. In the cases of GATK Haplotype-Caller and GATK UnifiedGenotyper, the GATK modules,VariantRecalibrator and ApplyRecalibration, were used tofilter SNVs using HapMap 3.3, the Omni 2.5 SNP BeadChip,and dbSNP 137 without 1000 Genome data as training sets.For SNPSVM, QUAL scores ≥ 4 and DP values ≥ 6 wereused. For FreeBayes and SAMtools, QUAL scores ≥ 20 andDP values ≥ 6 were used.
2.9. Variant Comparison. For variant comparison,USeq 8.8.1 was used to compare SNVs shared betweenall datasets. To compare indels, the vcflib toolvcfintersect was used. The TruSeq hg19 exome bed filetruseq exome targeted regions.hg19.bed.chr, obtained inDecember 11, 2013, was used to restrict comparisons tolocations that could be captured by the exome pull downkit used in the sequencing of SRR098401. This file can beobtained from Illumina here: http://support.illumina.com/sequencing/sequencing kits/truseq exome enrichment kit/downloads.ilmn. To ensure that variants were representedidentically between different call sets, the vcflib toolvcfallelicprimitives was used to preprocess vcf files.
2.10. Statistical Calculations
True Positive (TP). It is a mutation that was detected by thepipeline being tested and is one that exists in the NIST-GiaBlist.
False Positive (FP). It is a mutation that was detected by thepipeline being tested but is one that does not exist in theNIST-GiaB list.
True Negative (TN). It is a mutation that was not detected bythe pipeline being tested and is one that does not exist in theNIST-GiaB list.
False Negative (FN). It is a mutation that was not detected bythe pipeline being tested but is one that does exist in theNIST-GiaB list:
PPV = TP(TP + FP)
,
Sensitivity = TP(TP + FN)
.
(1)
3. Results and Discussion
3.1. Prefiltering Variants. When performing variant analysis,one of themany pitfalls that must be taken into considerationis the exome sequence space (as defined by the exome capturekit) and how it can affect the analysis results. In this case, wehad a single exome (SRR098401) that was extracted using theIllumina TruSeq exome kit and sequenced on a HiSeq 2000.

6 BioMed Research International
Table 3: Raw variant statistics for the 30 pipelines, including SNVs and indels.
Aligner Genotyper Raw TP SNVs Raw FP SNVs Raw TP indels Raw FP indelsBowtie2 FreeBayes 23,985 73,473 806 2,482Bowtie2 GATK HC 21,631 273 771 1,103Bowtie2 GATK UG 25,136 2,276 418 420Bowtie2 mpileup 21,930 1,030 734 1,414Bowtie2 SNPSVM 17,613 47 — —BWAmem FreeBayes 23,857 18,256 785 2,088BWAmem GATK HC 21,707 367 779 1,348BWAmem GATK UG 21,925 213 402 408BWAmem mpileup 25,081 2,129 761 1,772BWAmem SNPSVM 17,920 65 — —BWA sampe FreeBayes 23,789 27,143 737 1,872BWA sampe GATK HC 21,878 263 758 1,161BWA sampe GATK UG 22,153 321 394 385BWA sampe mpileup 25,206 2,205 684 1,401BWA sampe SNPSVM 18,017 78 — —CUSHAW3 FreeBayes 23,191 53,525 624 3,310CUSHAW3 GATK HC 19,673 14,814 751 4,727CUSHAW3 GATK UG 19,113 13,184 360 1,005CUSHAW3 mpileup 22,171 9,694 681 1,983CUSHAW3 SNPSVM — — — —MOSAIK FreeBayes 23,373 39,203 783 3,359MOSAIK GATK HC 13,528 111 500 458MOSAIK GATK UG 17,147 76 392 284MOSAIK mpileup — — — —MOSAIK SNPSVM 14,586 8 — —Novoalign FreeBayes 22,794 2,970 678 1,554Novoalign GATK HC 21,407 473 779 1,370Novoalign GATK UG 21,113 144 387 365Novoalign mpileup 24,512 1,861 773 1,781Novoalign SNPSVM 17,109 164 — —
With this in mind, we wanted to make sure that we weremeasuring the ability of the bioinformatic tools to do theirjobs and not how well the Illumina TruSeq exome capturekit worked. That is, we only want to try to call variants thatare supposed to be present in the exons as defined by thepull down kit. For this reason, we use the bed file providedby Illumina, not a generic annotation bed file, for example,RefSeq for hg19. We found that for this particular individual,according to the NIST-GiaB list, there should be a total of34,886 SNVs and 1,473 indels within the regions defined bythe TruSeq bed file.
Once we filtered out variants that were not located in theregions defined by the Illumina TruSeq exome bed file, wewent from hundreds of thousands of putative variants (datanot shown) to, on average, about 23,000 variants (SNVs andindels) per pipeline (Table 3). This is an important step forresearchers to beginwith, as it significantly reduces the searchspace for potentially interesting variants.
3.2. Raw Variant Results Compared to GiaB. One aspect wewanted to understand when doing this comparison was theimportance of filtering variants detected by these tools. Thereason for this is that ideally one would like to have as high alevel of sensitivity as possible so that the mutations of interestdo not get lost in the filtering process. It therefore behoovesus to determine whether or not this step is necessary and towhat degree it is necessary, since it is clear from the NIST-GiaB results and the Bamshad et al. [13] review that sensitivitycould be an issue.
As we can see in Table 3, filtering is neededmore for somevariant callers than for others when it comes to SNVs, and itis absolutely necessary for indels. In most cases, the numberof TP variants is close to or higher than our expected numberof about 20,000 [13], but, on the other hand, in some cases thenumber of FPs is very high.
Clearly there is a lot of variation in the numbers generatedby each pipeline. However, one can find some commonalities

BioMed Research International 7
in the numbers that likely stem from the algorithmic originsof each tool. FreeBayes produces both the largest numberof unfiltered variants and the highest number of FPs. Itis likely that we only see this kind of performance fromthis tool due to the fact that while it is not the onlyvariant caller based on Bayesian inference it is unique in itsinterpretation of alignments. That is, it is a haplotype-basedcaller that identifies variants based on the sequence of thereads themselves instead of the alignment, the latter of whichis how GATK’s UnifiedGenotyper operates.
Additionally we see the Burrows-Wheeler based alignersperform very similarly to each other: Bowtie2, BWA mem,and BWA sampe achieve similar results across the board. Onemight surmise that this is likely due to the fact that all ofthese tools utilize similar algorithms when performing theirdesignated task.This observation is supported by the fact thatMOSAIK (gapped alignments using the Smith-Watermanalgorithm) and CUSHAW3 (a hybrid seeding approach) bothhave very different underlying algorithms and subsequentlyproduce very different results.
This difference in results correlating with different algo-rithms is seen best in the SNPSVM results. Of the variantcallers, it is the only one that utilizes support vector machinesand model building to generate SNV calls. It would appearthat while it has the disadvantage of not being as sensitive asother methods it does benefit from being extremely accurateregardless of the aligner being used. This suggests that oneis able to skip the filtering step altogether when using thisvariant caller.
With regard to indels, no aligner seems to stand outamong the rest as one that handles this type of mutationwell. In fact, when looking at the number of FPs, it is clearthat it is the variant caller that plays the largest role in theaccuracy of indel identification. Additionally, there are datafor neither CUSHAW3 plus SNPSVM nor MOSAIK plusSAMtools mpileup pipelines due to the alignment files notcontaining the necessaryCIGAR strings for the variant callersto function downstream. Lastly, the reason there are no indeldata for SNPSVM is because this tool is solely used foridentification of SNVs.
3.3. Filtered Results Compared to GiaB. As in Table 4, stan-dard filtering practices manage to remove a large numberof FP SNVs for each pipeline; however it seems that thesefilters are a bit too aggressive inmost cases for SNVdetection,but not strict enough for indels. This is made obvious whenlooking at the differences in the number of FPs reported ineach dataset. For example, Bowtie2 with Freebayes sees aremoval of 72,570 FP SNVs (a reduction of 98%) but onlya removal of 1,736 FP indels (a reduction of 70%). It shouldalso be noted that the filters used were pipeline-dependentand, for the most part, within each pipeline produced similarreductions in SNV and indel FPs. The one exception hereis the number of variants identified from the CUSHAW3alignments when compared to other alignments: overall thenumber of TP SNVs is lower, the number of FP SNVs ishigher, and it is the only aligner that produces more than1,000 FP indels after filtering.
Given the fact that filtering significantly reduces thenumber of TP variants, it might be wise to, with the exceptionof pipelines using CUSHAW3 and FreeBayes, skip this stepwhen searching for rare, high-impact variants. Instead, onemight spend more time on a filtering process that is based onbiology rather than statistics. For example, it may make moresense to invest time identifying a small list of variants thatare likely to be high-impact: splice site mutations, indels thatcause frameshifts, truncationmutations, stop-loss mutations,or mutations in genes that are known to be biologicallyrelevant to the phenotype of interest.
3.4. Average TPR and Sensitivity. As can be seen in Table 5,the Positive Predictive Value (PPV) for each tool, with theexception of CUSHAW3, ranges from 91% to 99.9% for SNVs,but the average sensitivity is very low (around 50%). Thisdiscrepancy could be due to a number of reasons, but themost likely one is variable depth of coverage across exons.We can see that, in addition to low SNV sensitivity, indelsensitivity is low (around 30%); however the PPV for indelsis considerably lower (35.86% to 52.95%). This could be dueto any of the following reasons: very short indels are hardto detect by conventional NGS [31], the representation ofindels by different variant callers can cause tools to incorrectlyclaim that two indels are different, or alignment tools producedifferent representations of the same indel [7].
Perhaps the most likely explanation for both types ofmutations is the issue of depth. As is the case with any variantanalysis study, an increase in depth of coverage leads to anincrease in sensitivity, but it is impossible to guarantee gooddepth of coverage due to the inability of exome capture kits touniformly pull down exons [32–34]. Additionally, no singleexome capture kit covers every exon. Indeed, it has beenshown that variant analysis of whole genome sequencingat an average depth lower than an exome performs betterdue to the uniformity of said depth. Thus, it is likely thata large number of variants are missing due to the fact thatthe NIST-GiaB list was created from a compilation of exomicand genomic sequencing data. Ultimately, to achieve propersensitivity one will eventually need to performwhole genomesequencing, but that is currently cost-prohibitive for mostlabs. Fortunately, this cost is continuing to drop, and we willsoon see a gradual shift from exome analysis to the morecomplete whole genome analysis.
3.5. Sensitivity as a Function of Depth. Because sensitivityreflects one of the most important performance metrics ofa tool and most of the tools struggle to achieve sensitivityhigher than 50%, we would like to further explore how depthaffected variant calling sensitivity. We looked at a number ofdifferent combinations of tools to determine what the bestpipelines, variant callers, and aligners were. For Figure 2,we took the five best combinations of variant callers andaligners as determined by their sensitivity and false positiverate (FPR). That is, we selected those which had the highestnumber of TP SNVs called in addition to the lowest numberof FP SNVs. Upon inspection, the thing that stands outimmediately is that the sensitivity is lower than expected.

8 BioMed Research International
Table 4: Filtered variant statistics for the 30 pipelines, including SNVs and indels.
Aligner Genotyper Filtered TP SNVs Filtered FP SNVs Filtered TP indels Filtered FP indelsBowtie2 FreeBayes 17,504 903 481 746Bowtie2 GATK HC 17,330 29 648 687Bowtie2 GATK UG 19,937 49 395 338Bowtie2 mpileup 17,049 153 402 541Bowtie2 SNPSVM 13,983 8 — —BWAmem FreeBayes 17,376 347 461 739BWAmem GATK HC 19,388 302 689 860BWAmem GATK UG 20,000 48 397 355BWAmem mpileup 17,070 57 403 606BWAmem SNPSVM 15,060 10 — —BWA sampe FreeBayes 17,435 450 443 647BWA sampe GATK HC 19,438 214 630 725BWA sampe GATK UG 19,557 27 384 336BWA sampe mpileup 17,049 111 387 518BWA sampe SNPSVM 15,218 10 —CUSHAW3 FreeBayes 16,620 7,627 362 1,294CUSHAW3 GATK HC 16,590 2,195 665 1,551CUSHAW3 GATK UG 17,939 2,202 357 545CUSHAW3 mpileup 15,942 4,029 368 796CUSHAW3 SNPSVM — — — —MOSAIK FreeBayes 17,177 679 458 645MOSAIK GATK HC 11,616 33 426 255MOSAIK GATK UG 16,423 42 381 224MOSAIK mpileup — — — —MOSAIK SNPSVM 4,727 3 — —Novoalign FreeBayes 16,658 219 384 559Novoalign GATK HC 19,406 385 702 872Novoalign GATK UG 20,521 46 386 315Novoalign mpileup 16,493 62 396 579Novoalign SNPSVM 14,451 18 — —
Table 5: Average Positive Predictive Value (PPV) and sensitivity for each tool.
Tool Average SNV PPV Average SNV sensitivity Average indel PPV Average indel sensitivityBowtie2 98.69% 49.19% 45.45% 32.69%BWAmem 99.15% 50.96% 43.24% 33.10%BWA sampe 99.09% 50.85% 45.31% 31.30%CUSHAW3 80.69% 48.08% 29.50% 29.74%MOSAIK 98.51% 35.79% 52.95% 28.63%Novoalign 99.17% 50.18% 44.55% 31.70%FreeBayes 90.95% 51.00% 35.86% 32.79%GATK HaplotypeCaller 97.05% 51.03% 43.17% 31.79%GATK UnifiedGenotyper 97.93% 50.77% 52.12% 31.57%SAMtools mpileup 94.99% 50.76% 39.15% 31.30%SNPSVM 99.92% 50.85% N/A N/A

BioMed Research International 9
Bowtie2.UGBWA-mem.UGBWA-sampe.HC
BWA-sampe.UGNovoalign.UG
0 50 100 150 200 250
0
0.1
0.2
0.3
0.4
0.5
0.6
Sens
itivi
ty (T
PR)
Depth at SNV position
Top 5 pipelines
Figure 2: Sensitivity as a function of depth for the top five pipelines.The top five pipelines are shown here with the depth of every SNVplotted against sensitivity.
All of the pipelines perform at roughly the same level: theyidentify most of their variants by the time a depth of about150x has been reached, which indicates that this depth is likelysufficient and that the number of missing variants is probablydue to certain exons having lower than average coverage.Notethat four out of the five best performing pipelines have GATKUnifiedGenotyper as their variant caller, demonstrating itssuperior performance irrespective of the aligner used asshown in Figure 3(b).
In addition to looking at the top five pipelines, we deter-mined it would be useful to perform the same analysis on thebest aligner coupled with every variant caller (Figure 3(a)),as well as the best variant caller coupled with every aligner(Figure 3(b)). As with the pipelines, the best aligner wasidentified as that which produced the highest number of TPSNVs and the lowest number of FP SNVs—in this case BWAmem.Despite having the best alignment to workwith, we stillsee a fairly large difference between the variant callers, whichis likely attributable to the different algorithms they employ(Figure 3(a)). However, in the case of the best performingvariant caller, GATK UnifiedGenotyper, there seems to beless variation among the top four aligners indicating that itperforms fairly well in most situations with the exceptionsbeing CUSAHW3 and MOSAIK.
3.6. Shared Variants among the Top Pipelines. Lastly, wewanted to know just how unique the variant call setswere between the different pipelines. To do this, we againfocused on the top five variant calling pipelines: Bowtie2plus UnifiedGenotyper, BWA mem plus UnifiedGenotyper,BWA sampe plus HaplotypeCaller, BWA sampe plus Uni-fiedGenotyper, andNovoalign plusUnifiedGenotyper. As canbe seen in Figure 4, there is a large amount of overlap between
BWA-mem.Freebayes BWA-mem.HCBWA-mem.UGBWA-mem.mpileup
BWA-mem.SNPSVM
0 50 100 150 200 250
0
0.1
0.2
0.3
0.4
0.5
0.6
Sens
itivi
ty (T
PR)
Depth at SNV position
Top aligner
(a)
Sens
itivi
ty (T
PR)
Bowtie2.UGBWA-mem.UGBWA-sampe.UG
CUSHAW3.UGMOSAIK.UGNovoalign.UG
0 50 100 150 200 250
0
0.1
0.2
0.3
0.4
0.5
0.6
Depth at SNV position
Top variant caller
(b)
Figure 3: Sensitivity as a function of depth for the top aligner andtop variant caller. (a) Results for the depth of every SNV plottedagainst sensitivity for the top aligner, BWA mem, paired with everyvariant caller. (b) Results for the depth of every SNV plotted againstsensitivity for the top variant caller, GATKUnifiedGenotyper, pairedwith every aligner.

10 BioMed Research International
15
30
509
137
20
4
1813
191
2452
100
397 26 69
730
205
380
15489 308
14
906
9
71
367
24343
35
1764
5826
BWA-sampe + UG
BWA-mem + UG
BWA-sampe + HC
Novo + UG
Bowtie2 + UG
Figure 4: The intersection of the SNVs identified by the top fivepipelines.
the five different pipelines in question, with 15,489 SNVs(70%) shared out of a total of 22,324 distinct variants.However, one could also argue that this is largely due tofour of the five pipelines using the UnifiedGenotyper as theirvariant caller. This notion is corroborated by the fact that thelargest number of variants unique to a pipeline, 367, belongsto the BWA sampe plus HaplotypeCaller combination. It isalso worth noting that the second highest number of uniqueSNVs also belongs to the BWA sampe aligner, so it is possiblethat the high number of unique SNVs is better attributed tothe aligner than the variant caller.
4. Conclusions
We found that among the thirty different pipelines testedNovoalign plus GATKUnifiedGenotyper exhibited the high-est sensitivity while maintaining a low number of FP forSNVs. Of the aligners, BWAmem consistently performed thebest, but results still varied greatly depending on the variantcaller used. Naturally, it follows that the best variant caller,GATK UnifiedGenotyper, mostly produced similar resultsregardless of the aligner used. However, it is readily apparentthat indels are still difficult for any pipeline to handle withnone of the pipelines achieving an average sensitivity higherthan 33% or a PPV higher than 53%. In addition to the lowoverall performance we see in detecting indels, sensitivity,regardless of mutation type, is a problem for every pipelineoutlined in this paper. The expected number of SNVs forNA12878’s exome is 34,886, but even when using the union ofall the variants identified by the top five pipelines, the greatestnumber identified was very low (22,324). It seems that whilestill very useful exome analysis has its limitations even whenit comes to something as seemingly simple as SNV detection.
Disclosure
Adam Cornish is a graduate student in Chittibabu Guda’s labwith training in computer science and genomics. ChittibabuGuda (Associate Professor) has an interdisciplinary back-ground in molecular and computational biology. He haspublished a number of computational methods with a varietyof applications in biomedical research, since 2001.
Conflict of Interests
The authors are unaware of any competing interests.
Authors’ Contribution
Adam Cornish designed the study, performed all analyses,made the figures, and wrote the paper. Chittibabu Gudaprovided essential feedback on improvements to the paperand input on the analyses themselves and thoroughly editedthe paper. All authors read and approved the final paper.
Acknowledgments
This work was supported by the development funds toChittibabu Guda from the University of Nebraska MedicalCenter (UNMC).The authorswould like to thank the creatorsof Novoalign for making the software available as the trialversion and the Bioinformatics and Systems Biology Corefacility at UNMC for the infrastructure support facilitatingthis research.
References
[1] N. Paria, L. A. Copley, J. A. Herring et al., “Whole-exomesequencing: discovering genetic causes of orthopaedic disor-ders,” Journal of Bone and Joint Surgery—Series A, vol. 95, no.23, pp. e1851–e1858, 2013.
[2] L. G. Biesecker and R. C. Green, “Diagnostic clinical genomeand exome sequencing,” The New England Journal of Medicine,vol. 370, no. 25, pp. 2418–2425, 2014.
[3] N. Delanty andD. B. Goldstein, “Diagnostic exome sequencing:a new paradigm in neurology,” Neuron, vol. 80, no. 4, pp. 841–843, 2013.
[4] M. E. Shanks, S. M. Downes, R. R. Copley et al., “Next-generation sequencing (NGS) as a diagnostic tool for retinaldegeneration reveals amuchhigher detection rate in early-onsetdisease,” European Journal of Human Genetics, vol. 21, no. 3, pp.274–280, 2013.
[5] H. P. Buermans and J. T. den Dunnen, “Next generationsequencing technology: advances and applications,” Biochimicaet Biophysica Acta (BBA)—Molecular Basis of Disease, vol. 1842,no. 10, pp. 1932–1941, 2014.
[6] X. Liu, S. Han, Z. Wang, J. Gelernter, and B.-Z. Yang, “Variantcallers for next-generation sequencing data: a comparisonstudy,” PLoS ONE, vol. 8, no. 9, Article ID e75619, 2013.
[7] J. M. Zook, B. Chapman, J. Wang et al., “Integrating humansequence data sets provides a resource of benchmark SNP andindel genotype calls,” Nature Biotechnology, vol. 32, no. 3, pp.246–251, 2014.

BioMed Research International 11
[8] P. Krawitz, C. Rodelsperger, M. Jager, L. Jostins, S. Bauer, andP. N. Robinson, “Microindel detection in short-read sequencedata,” Bioinformatics, vol. 26, no. 6, Article ID btq027, pp. 722–729, 2010.
[9] Z. Wei, W. Wang, P. Hu, G. J. Lyon, and H. Hakonarson,“SNVer: a statistical tool for variant calling in analysis of pooledor individual next-generation sequencing data,” Nucleic AcidsResearch, vol. 39, no. 19, article e132, 2011.
[10] R. Nielsen, T. Korneliussen, A. Albrechtsen, Y. Li, and J. Wang,“SNP calling, genotype calling, and sample allele frequencyestimation from new-generation sequencing data,” PLoS ONE,vol. 7, no. 7, Article ID e37558, 2012.
[11] J. Kim, Y. Lee, and N. Kim, “Bioinformatics interpretation ofexome sequencing: blood cancer,” Genomics & Informatics, vol.11, no. 1, pp. 24–33, 2013.
[12] G. R. Abecasis, D. Altshuler, A. Auton et al., “A map of humangenome variation from population-scale sequencing,” Nature,vol. 467, no. 7319, pp. 1061–1073, 2010.
[13] M. J. Bamshad, S. B.Ng,A.W. Bighamet al., “Exome sequencingas a tool for Mendelian disease gene discovery,” Nature ReviewsGenetics, vol. 12, no. 11, pp. 745–755, 2011.
[14] B. Langmead and S. L. Salzberg, “Fast gapped-read alignmentwith Bowtie 2,” Nature Methods, vol. 9, no. 4, pp. 357–359, 2012.
[15] H. Li and R. Durbin, “Fast and accurate short read alignmentwith Burrows-Wheeler transform,” Bioinformatics, vol. 25, no.14, pp. 1754–1760, 2009.
[16] H. Li, “Aligning sequence reads, clone sequences and assemblycontigs with BWA-MEM,” http://arxiv.org/abs/1303.3997.
[17] Y. Liu, B. Popp, and B. Schmidt, “CUSHAW3: sensitive andaccurate base-space and color-space short-read alignment withhybrid seeding,”PLoSONE, vol. 9, no. 1, Article ID e86869, 2014.
[18] W.-P. Lee, M. P. Stromberg, A. Ward, C. Stewart, E. P. Gar-rison, and G. T. Marth, “MOSAIK: a hash-based algorithmfor accurate next-generation sequencing short-read mapping,”PLoS ONE, vol. 9, no. 3, Article ID e90581, 2014.
[19] F. Hach, F. Hormozdiari, C. Alkan, I. Birol, E. E. Eichler, and S.C. Sahinalp, “mrsFAST: a cache-oblivious algorithm for short-read mapping,” Nature Methods, vol. 7, no. 8, pp. 576–577, 2010.
[20] M. David, M. Dzamba, D. Lister, L. Ilie, and M. Brudno,“SHRiMP2: sensitive yet practical short read mapping,” Bioin-formatics, vol. 27, no. 7, pp. 1011–1012, 2011.
[21] G. Lunter and M. Goodson, “Stampy: a statistical algorithm forsensitive and fastmapping of Illumina sequence reads,”GenomeResearch, vol. 21, no. 6, pp. 936–939, 2011.
[22] E. Garrison and G. Marth, “Haplotype-based variant detectionfrom short-read sequencing,” http://arxiv.org/abs/1207.3907.
[23] M. A. DePristo, E. Banks, R. Poplin et al., “A framework forvariation discovery and genotyping using next-generationDNAsequencing data,” Nature Genetics, vol. 43, no. 5, pp. 491–501,2011.
[24] H. Li, B. Handsaker, A. Wysoker et al., “The sequence align-ment/map format and SAMtools,”Bioinformatics, vol. 25, no. 16,pp. 2078–2079, 2009.
[25] B. D. O’Fallon, W. Wooderchak-Donahue, and D. K. Crock-ett, “A support vector machine for identification of single-nucleotide polymorphisms from next-generation sequencingdata,” Bioinformatics, vol. 29, no. 11, pp. 1361–1366, 2013.
[26] K. Cibulskis, M. S. Lawrence, S. L. Carter et al., “Sensitive detec-tion of somatic point mutations in impure and heterogeneouscancer samples,”Nature Biotechnology, vol. 31, no. 3, pp. 213–219,2013.
[27] R. Goya, M. G. F. Sun, R. D. Morin et al., “SNVMix: predictingsingle nucleotide variants from next-generation sequencing oftumors,” Bioinformatics, vol. 26, no. 6, pp. 730–736, 2010.
[28] D. C. Koboldt, Q. Zhang, D. E. Larson et al., “VarScan 2: somaticmutation and copy number alteration discovery in cancer byexome sequencing,” Genome Research, vol. 22, no. 3, pp. 568–576, 2012.
[29] R. Li, Y. Li, X. Fang et al., “SNP detection for massively parallelwhole-genome resequencing,” Genome Research, vol. 19, no. 6,pp. 1124–1132, 2009.
[30] G. A. Van der Auwera, M. O. Carneiro, C. Hartl et al.,“From fastQ data to high-confidence variant calls: the genomeanalysis toolkit best practices pipeline,” Current Protocols inBioinformatics, vol. 43, 2013.
[31] C. A. Albers, G. Lunter, D. G. MacArthur, G. McVean, W. H.Ouwehand, and R. Durbin, “Dindel: accurate indel calls fromshort-read data,” Genome Research, vol. 21, no. 6, pp. 961–973,2011.
[32] V. N. Rykalina, A. A. Shadrin, V. S. Amstislavskiy et al.,“Exome sequencing from nanogram amounts of starting DNA:comparing three approaches,” PLoS ONE, vol. 9, no. 7, ArticleID e101154, 2014.
[33] A. M. Meynert, M. Ansari, D. R. FitzPatrick, and M. S. Taylor,“Variant detection sensitivity and biases in whole genome andexome sequencing,” BMC Bioinformatics, vol. 15, article 247,2014.
[34] C. S. Chilamakuri, S. Lorenz,M.-A.Madoui et al., “Performancecomparison of four exome capture systems for deep sequenc-ing,” BMC Genomics, vol. 15, article 449, 2014.

Submit your manuscripts athttp://www.hindawi.com
Hindawi Publishing Corporationhttp://www.hindawi.com Volume 2014
Anatomy Research International
PeptidesInternational Journal of
Hindawi Publishing Corporationhttp://www.hindawi.com Volume 2014
Hindawi Publishing Corporation http://www.hindawi.com
International Journal of
Volume 2014
Zoology
Hindawi Publishing Corporationhttp://www.hindawi.com Volume 2014
Molecular Biology International
GenomicsInternational Journal of
Hindawi Publishing Corporationhttp://www.hindawi.com Volume 2014
The Scientific World JournalHindawi Publishing Corporation http://www.hindawi.com Volume 2014
Hindawi Publishing Corporationhttp://www.hindawi.com Volume 2014
BioinformaticsAdvances in
Marine BiologyJournal of
Hindawi Publishing Corporationhttp://www.hindawi.com Volume 2014
Hindawi Publishing Corporationhttp://www.hindawi.com Volume 2014
Signal TransductionJournal of
Hindawi Publishing Corporationhttp://www.hindawi.com Volume 2014
BioMed Research International
Evolutionary BiologyInternational Journal of
Hindawi Publishing Corporationhttp://www.hindawi.com Volume 2014
Hindawi Publishing Corporationhttp://www.hindawi.com Volume 2014
Biochemistry Research International
ArchaeaHindawi Publishing Corporationhttp://www.hindawi.com Volume 2014
Hindawi Publishing Corporationhttp://www.hindawi.com Volume 2014
Genetics Research International
Hindawi Publishing Corporationhttp://www.hindawi.com Volume 2014
Advances in
Virolog y
Hindawi Publishing Corporationhttp://www.hindawi.com
Nucleic AcidsJournal of
Volume 2014
Stem CellsInternational
Hindawi Publishing Corporationhttp://www.hindawi.com Volume 2014
Hindawi Publishing Corporationhttp://www.hindawi.com Volume 2014
Enzyme Research
Hindawi Publishing Corporationhttp://www.hindawi.com Volume 2014
International Journal of
Microbiology