research article an exact method to determine the...
TRANSCRIPT
Research ArticleAn Exact Method to Determine the Conductivity ofAqueous Solutions in Acid-Base Titrations
Norma Rodriacuteguez-Laguna1 Alberto Rojas-Hernaacutendez1 Mariacutea Teresa Ramiacuterez-Silva1
Lucero Hernaacutendez-Garciacutea1 and Mario Romero-Romo2
1Laboratorio R-105R-107 Area de Quımica Analıtica Departamento de Quımica Division de Ciencias Basicas e IngenierıaUniversidad Autonoma Metropolitana-Iztapalapa Avenida San Rafael Atlixco 186 Colonia Vicentina 09340 Mexico DF Mexico2Area Ingenierıa de Materiales Departamento de Materiales Division de Ciencias Basicas e IngenierıaUniversidad Autonoma Metropolitana-Azcapotzalco Avenida San Pablo 180 Colonia Reynosa-Tamaulipas02200 Mexico DF Mexico
Correspondence should be addressed to Alberto Rojas-Hernandez suemi918xanumuammx
Received 6 November 2014 Accepted 8 January 2015
Academic Editor Patricia Valentao
Copyright copy 2015 Norma Rodrıguez-Laguna et al This is an open access article distributed under the Creative CommonsAttribution License which permits unrestricted use distribution and reproduction in any medium provided the original work isproperly cited
Several works in the literature show that it is possible to establish the analytic equations to estimate the volume 119881 of a strong baseor a strong acid (119881119887 and 119881
119886 resp) being added to a solution of a substance or a mix of substances during an acid-base titration
as well as the equations to estimate the first derivative of the titration plot 119889pH119889119881 and algebraic expressions to determine thebuffer (120573) capacity with dilution (120573dil)This treatment allows establishing the conditions of thermodynamic equilibria for all specieswithin a system containing a mix of species from one or from various polyacid systems The present work shows that it is possibleto determine exactly the electric conductivity of aqueous solutions for these Broslashnsted acid-base titrations because the functionalrelation between this property and the composition of the system in equilibrium is well known this is achieved using the equivalentconductivity (120582119894) values of each of the ions present in a given system The model employed for the present work confirms theexperimental outcomes with the H2SO4 B(OH)3 CH3COOH and H3PO4 aqueous solutionsrsquo titration
1 Introduction
It is well known that electrolyte solutions frequently obeyOhmrsquos Law where the conductance (119871 reciprocal of theresistance (119877)) is the electrical property of the solutionthat establishes readily the inherent facility with whichit transports electric charges under the influence of anelectric field The conductance depends on the tempera-ture the solutionrsquos composition and the geometry of theelectric field applied in reference to the solution Howeverthe electrical conductivity (120581) of the system can also bedefined which does not depend on the said geometry[1ndash4]
The functional relation between the electrical conduc-tivity and the conductance is established with reference toa geometric empirical factor (119867 known as cell constant
with units of the length reciprocal) in agreement with thefollowing
120581 = 119871119867 (1)
On another respect Kolhrauschrsquos law or law of ionsrsquoindependent migration correlates the electric conductivitywith the solution composition this being a linear law ofconcentrations as shown by the following
120581 =
119899
sum
119894=1
10038161003816100381610038161003816119911119883119894
10038161003816100381610038161003816120582119900
119883119894[119883119894] (2)
where |119911119883119894| is the absolute value of the charge 120582119900
119883119894is the
limiting equivalent conductivity (at infinite dilution) and[119883119894] is the molar concentration of the 119894th ion whereas thesum concerns all ions comprised
Hindawi Publishing CorporationJournal of ChemistryVolume 2015 Article ID 540368 13 pageshttpdxdoiorg1011552015540368
2 Journal of Chemistry
During the course of volume titration changes occur onthe number and type of ions present in the solution to betitrated also with an increase of the overall solution volumeThus in order to represent the conductometry plots obtainedfrom the said titrations it is recommended to define thecorrected electric conductivity through dilution (120581corr) for themeasured value of the conductivity [4ndash7] in agreement withthe following expression
120581corr = 120581(119881119900 + 119881)
119881119900
(3)
119881119900 is the initial volume of the titrated system and119881 the titrantadded volume
The literature states that there are linear relations (persegments) of the 120581corr with the titrantrsquos volume with differentslopes at each side of any of the equivalence points providedthe titrating reactions are quantitative The plots of 120581corr =
119891(119881) deviate from linearity in the vicinity of the equiva-lence point when the reactions are less quantitative whichgenerally occurs when the solution becomes more dilutedThus the linear behaviors of the said plots are observed onlyat points far from the equivalence points [5ndash7] Thereforein systems where there are several titration reactions withrelatively small slope changes it becomes difficult to decidewhat points can be considered within the linear trends of theplot
Several works reported in the literature describe robustmodels to predict and interpret pH plots as a function of thetitrant added obtained during acid-base titrations Amongthem documents can be found that describe the functionswhere the titrant volume (119881) is resolved as a function of pH[8ndash12] up to more extensive works such as that excellentrevision by Asuero and Michalowski [13] that apart fromdescribing much more robust models to predict acid-basetitration plots describe other functions related with themsuch as the pH derivatives with respect to 119881 or the buffer (120573)capacity of various systems
In previous works we have presented explicit titrantvolume expressions as a function of pH (119881 = 119891(pH)) fortitrations ofmixtures of species of the same proton polydonorsystem with a strong acid or base [14 15] Also these paperspresented the exact equations for the pH derivative withrespect to the119881 and the buffer capacity with dilution (120573dil) ofthose systems In order to construct the plots obtained fromthe said equations several spread sheets were built at ExcelMicrosoft
The objective of this work is to present a robust modelthat allows estimation of the conductometric titration plotsin complicated mixtures without the need to find the linearregions of the plots before and after each equivalence pointwith the aim to define exactly and precisely the volume ofeach of those equivalence points
Thus the present paper shows how to apply advanta-geously these equations in order to build the conductometricplots (120581 = 119892(119881)) without approximations using nonlinearfunctions that remain implicit over the spread sheets used tobuild the graphs of the acid-base titrations
2 Materials and Methods
21 Methodology
211 Acid-Base Titrations of Mixtures of Species of the SameProton Polydonor System 119867119899119871119867(119899minus1)119871 sdot sdot sdot 119867119895119871 sdot sdot sdot 119867119871
119871119867+ In order to establish a model that allows determina-
tion of the systemrsquos equilibrium conditions during an acid-base titration and to estimate the pH-metric plot namelypH = 119891(119881) it seems adequate to solve the pH as a function ofthe volume (as established in the previous function) using thenecessary equations to express the equilibrium condition interms of the two variables However apart from the titrationsof strong acid with strong base or those of strong base withstrong acid the equation to solve at least is a 3rd orderpolynomial equation [16]
Further the equation is linear with respect to the volumeeven in the case of mixtures of species that belong to thesame protons polydonor system namely 119867119899119871119867(119899minus1)119871 sdot sdot sdot 119867119895119871 sdot sdot sdot 119867119871119871H+ In order to simplify the nomenclaturenote that in the previous notation the electric charges ofcomponent 119871 species have been omitted
A common way to obtain the equation from whichthe titrantrsquos volume is solved results from establishing theelectroneutrality equation in the system and substituting init the equilibrium concentrations of the ions comprised
Then a robust model is obtained for estimations whensolving the strong base (119881119887) and strong acid (119881119886) volumesthat were added in an acid-base titration as a function of pH[8 13 14]
This way the added titrantrsquos volume is a function of pH asvariable as well as other parameters namely
(1) the initial volumes (119881119900119895) of the solutions that containeach of the species of the polydonor system for titra-tion (119867119895119871) considering also its counterions (whenappropriate) that after mixing lead to the initialvolume of the mix to be titrated (119881119900 = sum
119899
119895=0119881119900119895)
(2) the electric charges of the species of the polydonorsystem and its counterions (119895 minus 119886) where 119886 representsthe absolute value of the electric charge of the base ofthe system 119871
(3) the equilibrium concentrations of the hydroniumion ([H+] = 10
minuspH) and of the hydroxide ion([OHminus] = 119870119908[H
+] = 10
(pHminusp119870119908) where 119870119908 is theautoprotolysis constant of the solvent)
(4) the initial molarities of the species (119862119900119895) that becauseof the balance of the 119871 component lead to (119881119900119862119900 =sum119899
119895=0119881119900119895119862119900119895)
(5) the molar fractions in the equilibrium (119891119895) defined inaccordance with the mass balance for the 119871 compo-nent Generally these molar fractions are graphicallyrepresented through a distribution diagram because
Journal of Chemistry 3
they are functions that depend only on the dissolu-tionrsquos pH
119891119895 = 119891119867119895119871=
[119867119895119871]
[119871]total=
1
sum119899
119895=0(120573119895 [119867]
119895)
=1
sum119899
119895=0(10(log120573119895minus119895pH))
(4)
where 120573119900 equiv 1 and 120573119895 are the global formation constants of the(119899 + 1) species of 119871 in the system because 119895 isin 1 2 119899
Therefore if a volume 119881119900 of a mixture of species of thesame proton polydonor system (119867
119899119871119867(119899minus1)119871 sdot sdot sdot 119867119895119871 sdot sdot sdot
119867119871119871H+) with overall molarity [119871]total = 119862119900 is titratedwith a strong base or a strong acid of molarity 119862119887 or 119862119886respectively it can be shown that the added titrant volumefor titration with a strong base (119881119887) gives rise to (5) whereasfor titration with a strong acid (119881119886) it leads to (6) as follows
119881119887 = (minus119881119900119862119900[
[
119899
sum
119895=0
(119895 minus 119886) 119891119895]
]
+
119899
sum
119895=0
(119895 minus 119886) (119881119900119895119862119900119895)
minus 119881119900 ([H+] minus
119870119908
[H+]))(119862119887 + [H+] minus
119870119908
[H+])
minus1
(5)
119881119886 = (119881119900119862119900[
[
119899
sum
119895=0
(119895 minus 119886) 119891119895]
]
minus
119899
sum
119895=0
(119895 minus 119886) (119881119900119895119862119900119895)
+ 119881119900 ([H+] minus
119870119908
[H+]))(119862119886 minus [H+] +
119870119908
[H+])
minus1
(6)
Now for the same titration and considering (2) it ispossible to deduce (7) to estimate the conductivity at everypH
In (7)119876119879 represents the titrant counterion and119876119895 repre-sents the counterion of the species119867119895119871 while 120582119883 representsthe equivalent conductivity of the ion 119883 away from thelimiting conditions that theoretically should be smaller thanor equal to the 120582119900
119883[2]
120581 =
120582119900
H+ [H+] + 120582119900
OHminus [OHminus] +
119899
sum
119895=0
(1003816100381610038161003816119895 minus 119886
1003816100381610038161003816 120582119900
119895[119867119895119871])
+
10038161003816100381610038161003816119911119876119879
10038161003816100381610038161003816120582119900
119876119879[119876119879] +
119899
sum
119895=0
(1003816100381610038161003816119895 minus 119886
1003816100381610038161003816 120582119900
119876119895[119876119895])
=
120582119900
H+ [H+] + 120582119900
OHminus119870119908
[H+]+
119881119900119862119900
119881119900 + 119881
119899
sum
119895=0
(1003816100381610038161003816119895 minus 119886
1003816100381610038161003816 120582119900
119867119895119871119891119895)
+
10038161003816100381610038161003816119911119876119879
10038161003816100381610038161003816120582119900
119876119879
119881119862
119881119900 + 119881+
119899
sum
119895=0
(1003816100381610038161003816119895 minus 119886
1003816100381610038161003816 120582119900
119876119895
119881119900119862119900119895
119881119900 + 119881)
asymp 120582H+ [H+] + 120582OHminus
119870119908
[H+]+
119881119900119862119900
119881119900 + 119881
119899
sum
119894=0
(1003816100381610038161003816119895 minus 119886
1003816100381610038161003816 120582119867119895119871119891119895)
+
10038161003816100381610038161003816119911119876119879
10038161003816100381610038161003816120582119876119879
119881119862
119881119900 + 119881+
119899
sum
119895=0
(1003816100381610038161003816119895 minus 119886
1003816100381610038161003816 120582119876119895
119881119900119862119900119895
119881119900 + 119881)
(7)
It must be pointed out that the second term in (7)involves the autoprotolysis equilibriumThe third term in thisequation rests its greater dependence on the pH following (4)which involves the global formation equilibria of the speciesfrom the protons polydonor system The fourth term whichcomes from the spectator counterion that accompanies theacid or basic particle of the solvent as titrant has a directdependencewith119881 through (5) or (6) depending on the caseThe last term is the one that comes from the counterions ofthe species of the protons polydonor system and almost doesnot depend on pH The dependence of the third fourth andfifth terms in (7) with the pH through the 119881 that appearsin the denominator is very small and practically null if therewere little dilution during the course of titration
Further (7) provokes the use of a spread sheet or softwareto estimate titration plots pH = 119891(119881) using (5) and (6) withit it becomes possible to estimate also (exactly) the electricconductivities of the system at every pH and hence at everyadded volume 119881 provided the equivalent conductivities aregiven of all ions comprised in the titrationThis leads then tothe determination of the conductometric titration plots 120581 =
119891(119881) using (7)The robust model also leads to obtaining many more
points with very small pH increments therefore small 119881increments allow estimating the derivatives through the ratioof the said increments 119889pH119889119881 asymp ΔpHΔ119881 and 119889120581119889119881 asymp
Δ120581Δ119881
212 Acid-Base Titrations of Mixtures of Species in SolutionThat Come from Different Protons Polydonor Systems Whenthere is a mixture of species that comes from various particlepolydonor systems even when the problem of determiningthe titration plots of these systems can appear to be muchmore difficult it turns out to be of practically equal com-plexity the samemethodology is followed as described in theprevious section
This is even when the polynomial to be dealt with in[H+] can be of higher order every time considering moreparticle polydonor systems (or more components with acid-base properties) the electroneutrality equation and the otherindependent equations of the system involve a 119881 only inlinear terms which allows factorizing this variable and solveit in simpler manner
The result is that the terms under the summation signover the index 119895 in (5) (6) and (7) transform into a doublesum the first over the species of a polydonor system and
4 Journal of Chemistry
the second over the components present in the differentpolydonor systems [17]
22 Experimental
221 Reagents All reagents used were of analytical grade toprepare the dissolutions described in this paper in deionizedwater type I (182MΩ cm) from a Milli-Q equipment Milli-pore The NaOH (99 Baker) used was free from carbonateand was titrated with potassium hydrogen phthalate (Merck)following the procedures described by Harris [18]
Concentrated H2SO4 (98 Baker) was used to preparea nominal solution 0025molsdotLminus1 of sulfuric acid which wastitrated with NaOH for the first part of this work
CH3COOH (glacial Baker) and H3BO3 (99 Baker)were used to prepare the nominal solutions 005molsdotLminus1acetic acid and 010molsdotLminus1 boric acid and the mixture of20mL of each onewas titrated withNaOH in the second partof the present paper
Finally CH3COOH (glacial Baker) H3PO4 (85Baker) and H3BO3 (99 Baker) were employed to preparethe equimolar nominal solutions 0015molsdotLminus1 acetic acidphosphoric acid and boric acid The mixture of 30mL oreach one known as Britton-Robinson solution was titratedwith NaOH in the third part of this contribution
222 Equipment and Materials Used for Preparation of Solu-tions and Titrations Solid reagents were accurately weighedon an analytical balance OHAUS (Discovery DV215CD)with a readability of 001mg
Liquid reagents were dispensed with plastic pipettesbrand (Transferpette adjustable) 704174 (10ndash100 120583L) 704180(100ndash1000 120583L) or 704182 (05ndash5mL) with accuracy betterthan or equal to 06 or glass volumetric pipettes (PyrexClass A) of 1 10 or 20mL of capacity with accuracy betterthan or equal to 06 were used in order to dispense theadequate amounts of the diverse liquid reagents to preparesolutions
Glass volumetric flasks (Pyrex Class A) of 100 or 250mLwith tolerance better than or equal to 08 were used to fillthe volume to the mark
Glass burettes (Kimax Class B) of 10 25 or 50mL ofcapacity with tolerance better than or equal to 04 wereused to dispense the titrant volumes
223 Conductometric Titrations Using Initial Large Disso-lution Volumes A laboratory instrument (PC45 Conduc-tronicMexico) was used whichwas equippedwith a temper-ature sensor and a cylindrical conductivity cell of immersion(C1 8mL capacity 1 cm internal diameter 10 cm height)Thecell has two platinized nickel electrodes electric contact typemini DIN and a cell constant 119867 = 1 cmminus1 (readability of1 120583S) The minimum volume of solution required to coverall the inner cavity of the conductivity cell was 350mLcontained in a 600mL beaker The equipment was cali-brated with an aqueous standard KCl 001M solution (Hach)with 1413mS cmminus1 conductivity at 25∘C The solution was
vigorously stirred for 2 minutes after every titrant additionwith a magnetic stirrer then the stirring was suspended inorder to take a stable conductivity recording
224 Conductometric Titrations Using Initial Small Dissolu-tion Volumes A laboratory instrument (CDM230 Radiome-ter Denmark) was used equipped with a conductivity cellCDC641T with temperature sensor and a cable A94P002The cell has platinized nickel electrodes and a cell constant119867 = 1 cmminus1 (readability better than 1 120583S) The minimumvolume of solution required to cover all the inner cavity of theconductivity cell was 30mL contained in a 100mL beakerThe equipment was calibrated and used as described in theprevious paragraph
225 pH-Metric Titration A Conductronic PC45 (Mexico)laboratory instrument was used which was equipped witha temperature sensor and a PC100 combined electrode witha BNC electric contact (ΔpH = plusmn001) The equipment wascalibrated with a pH = 700 buffer solution (Radiometer pH700) taking pH and potential difference (Δ119864 in millivolts)recordings after addition of every volume of the titrant inturn in order to correct the pH through the cell efficiency thefollowing equation was used as described by Islas-Martınezet al [19]
pHcorr = pH + 119890119891
10038161003816100381610038161003816100381610038161003816
pH minus pHcalpHcal
10038161003816100381610038161003816100381610038161003816
(8)
119890119891 is an empirical parameter that relates the inverse of thecell efficiency pHcal is the calibration pH at a point (in thiscase pHcal = 700) and pHcorr is the corrected pH from theproportional systematic error to obtain the one that shouldhave been determined for a 100 cell efficiency and 25∘CtemperatureThe parameter 119890119891 is varied up to where the slopeof the Δ119864 = 119891(pHcorr) plot becomes equal to minus5916mV Inthis work whenever the experimental pH = 119891(119881) titrationgraphs are presented it is actually the pHcorr that is beingplotted as explained in this section
3 Results and Discussion
In order to corroborate the equations above the followingare adequate model examples to predict the conductometricacid-base titration plots exactly
31 Conductometric Titrations of Aqueous Sulfuric Acid Solu-tions at Different Concentrations with NaOH This firstsystem constitutes a relatively simple case since sulfuric acidis a diprotic acid where the first dissociation is strong and theampholyte (formal) of the systemhas a relatively lowp119870119886Thestudy was carried out at two different solute concentrationsin agreement with two procedures The theory for thissystem corresponds to the first part of Section 21 becauseit corresponds to a species mixture of the same polydonorsystem
Journal of Chemistry 5
Table 1 Comparison of the p119870119886 and the limiting equivalent conductivities values from different sources at 119879 = 25∘C and zero ionic strengthwith the p119870119886 and the equivalent conductivities values used to construct the plots in Figures 1ndash7with a robustmodel to perform the estimation
Species p119870119886 at zero ionicstrengthb
p119870119886 used forthe fitting(Figure 1)
p119870119886 used forthe fitting (Figures
2 and 3)
p119870119886 used for thefitting (Figures 4
and 5)
p119870119886 used for thefitting (Figures 6
and 7)H2O
a 1400 138 138 137 138HSO4
minus 198 175 16CH3COOH 4757 46 47H3BO3 924 91 92H3PO4 2149 21H2PO4
minus 7207 71HPO4
2minus 12346 123
Ion 120582ion∘mSsdoteqminus1sdotcm2 120582ionmSsdoteqminus1sdotcm2
Figure 1120582ionmSsdoteqminus1sdotcm2
Figures 2 and 3120582ionmSsdoteqminus1sdotcm2
Figures 4 and 5120582ionmSsdoteqminus1sdotcm2
Figures 6 and 7
H+3496c3500d3501e
3501 3501 3501 3501
OHminus 1980c1992e 1950 1900 1900 1990
Na+ 5011ce 5011 500 490 500HSO4
minus 500e 500 490
SO42minus 798c
800e 860 600
CH3COOminus 409c410e 410 380
H2BO3minus mdash 220 200
H2PO4minus 369e 100
HPO42minus 570e 290
PO43minus 690e 450
aThe value of p119870119908 is reported in this linebPuigdomenech [20]cBard and Faulkner [2]dPingarron [3]eDean [4]
In order to explain better the treatment described inSection 21 (9) presents the algebra of the fractions of thesulfate species as a function of pH
119891SO42minus =[SO42minus]
[Sulfate]total=
1
1 + 10(p119870HSO4minuspH)
119891HSO4minus =[HSO4
minus]
[Sulfate]total= 119891SO42minus10
(p119870HSO4minuspH)
(9)
p119870HSO4 being the p119870119886 of the hydrogen sulfate ionEquation (10) expresses the volume of strong base added
in these titrations as a function of pH
119881119887 =
minus119881119900119862119900 [2119891SO42minus + 119891HSO4minus] minus 119881119900 ([H+] minus 119870119908 [H
+])
119862119887 + [H+] minus 119870119908 [H+]
(10)
Finally (11) expresses the conductivity as a function of pH
120581 = 120582H+ [H+] + 120582OHminus
119870119908
[H+]
+119881119900119862119900
119881119900 + 119881119887
(120582HSO4minus119891HSO4minus + 2120582SO42minus119891SO42minus)
+ 120582Na+119881119887119862119887
119881119900 + 119881119887
(11)
311 Procedure 1 2000mL of the 0024mol Lminus1 sulfuric acidaqueous solution was used to which 4300mL of deionizedwater was added (giving as a result 119881119900 = 4500mL and 119862119900 =
000107mol Lminus1) This solution was titrated with a sodiumhydroxide aqueous solution at a119862119887 = 02743mol Lminus1 concen-tration With these titration conditions and the parametersshown in Table 1 introduced in (9) and (10) it is possible toconstruct the pH-metric titration plot shown in Figure 1(a)(solid line)
6 Journal of Chemistry
01
1
10
100
1000
10000
23456789101112
0 1 2 3 4 5 6 7 8
pH
Vb (mL)
dpH
dVb(m
Lminus1)
(a)
0
005
01
015
02
00102030405060708091
0 1 2 3 4 5 6 7 8Vb (mL)
minus02
minus015
minus01
minus005
120581(m
Scmminus1)
d120581dVb(m
Scmminus4)
(b)
Figure 1 Plots obtained during titration of 2000mLH2SO40024M+4300mLdeionizedwaterwithNaOH02743M at 25∘C (a) pH-metric
plots the solid line represents the plot pH = 119891(119881119887) obtained with (10) while the segmented line represents the plot of 119889pH119889119881119887 = 1198911015840(119881119887) asymp
ΔpHΔ119881119887 (b) Conductometric plot 120581 = 119892(119881119887) The markers represent the experimental points obtained and the solid line represents theestimated plot with (11) the segmented line represents the plot 119889120581119889119881
119887= 1198921015840(119881119887) asymp Δ120581Δ119881
119887 obtained from the fitted model
01
1
10
100
1000
10000
0
2
4
6
8
10
12
14
0 1 2 3 4 5 6 7 8
pH
Vb (mL)
dpH
dVb(m
Lminus1)
(a)
012345678910
0 1 2 3 4 5 6 7 8Vb (mL)
120581(m
Scmminus1)
(b)
Figure 2 Plots obtained during titration of 2000mLH2SO4 0024M+ 200mL deionized water withNaOH02550M at 25∘C (a) pH-metricplots the solid line represents the plot pH = 119891(119881119887) obtained with (10) while the segmented line represents the plot of 119889pH119889119881119887 = 119891
1015840(119881119887) asymp
ΔpHΔ119881119887 (b) Conductometric plot 120581 = 119892(119881119887) The markers represent the experimental points obtained and the solid line represents theestimated plot with (11)
Also Figure 1(a) shows the plot of the first pH derivativeas a function of volume in a log scale (broken line obtainedapproximately) The conductometric plot estimated through(9) (10) and (11) (solid line) and the experimental one(markers) are shown in Figure 1(b) which also shows theplot of the first derivative of the conductivity as a functionof volume (broken line) The plots shown in Figure 1 are justlike those that would be obtained for the titration of a strongacid with a strong base just as if the sulfuric acid was a strongacid in both dissociations It is relevant to underline that theestimated conductometric plot (solid line in Figure 1(b)) ispractically equal to the trace of the experimental (markers)and seems to comprise two straight lines the intersection ofwhich would indicate the volume of the reaction equivalencepoint
R H+ +OHminus 999447999472 H2O with 119870R = 10138 (12)
(119870R = 10140 at zero ionic strength and 119879 = 25
∘C) which ispractically an acid-base reaction with the largest conversionin aqueous solutions because it has the greatest reactionconstant
The fitting of the model into the experimental resultspresented in Figure 2(b) used the values of the equilibriumconstants and of the equivalent conductivity for the ionsappearing in Table 1 where it can be clearly noted thatthe values used for the fitting are indeed similar to thosereported in the literature Also in Figure 2(b) the plot of theconductivity first derivative with respect to volume appearsto be formed by two straight lines crossing at the equivalencepoint just so where the derivative changes abruptly thoughin this case passing through zero
312 Procedure 2 2000mLof the 0024mol Lminus1 sulfuric acidaqueous solution was mixed with 2000mL deionized water(thus giving a 119881119900 = 400mL and a 119862119900 = 0012mol Lminus1)
Journal of Chemistry 7
This solution was titrated with an aqueous sodium hydroxidesolution at a concentration of 119862119887 = 02550mol Lminus1 Withthese titration conditions the titration pH-metric plot wasestimated this is shown in Figure 2(a) (solid line) and itsderivative is also included (broken line) whereas the con-ductometric plots estimated (solid line) and experimental(markers) are shown in Figure 2(b)
The pH-metric plot and its first derivative (Figure 2(a))are like those obtained in procedure 1 and could be inter-preted in the same form as if the sulfuric acid displayedtwo strong dissociations However Figure 2(b) is quite dif-ferent to Figure 2(a) even if the estimated line (solid line)remains practically the samewith respect to the experimental(markers) because it does not comprise two straight linesbut two curved sections that intersect at the equivalence pointvolumeThefitting of the conductometric linewas carried outwith the p119870119886 values and equivalent conductivities presentedin Table 1 that as can be noted are slightly smaller than thoseof the limiting equivalent conductivities of the species (exceptfor the hydronium ion) This can be because the sulfuric acidconcentration in procedure 2 was almost ten times greaterthan that used in procedure 1
313 Comparative Discussion of the Results Obtained withProcedures 1 and 2 The conductometric plot shown inFigure 1(b) comprises practically linear sections becausethere is very little dilution in the system in accordance withprocedure 1 since after adding 80mL to an initial 4500mLvolume the resulting overall volume only augmented 17Instead in Figure 2(b) the conductometric plot is formed bytwo curved sections because when adding 80mL to an initial4000mL volume procedure 2 the total volume increased20
However there is another explanation for the differencebetween the lines presented in Figures 1(b) and 2(b) Theinitial hydrogen sulfate ion concentration according to pro-cedure 1 in the initial 4500mL volume is 107 times 10minus3M Ifthe ionic strength parameter is taken into account 119870119886119862119900 ofthe acid [16] in this solution is obtained at a value of 1481or else log(119870119886119862119900) = 117 which implies a dissociation onlya little smaller of 80 Hence in procedure 1 the hydrogensulfate ion is a medium strength acid sufficiently dissociatedwhich tends to be strong although it becomes strongeras the titration proceeds (because of dilution) Instead inprocedure 2 the initial hydrogen sulfate ion concentrationin the starting 4000mL volume is 0012M with which the119870119886119862119900 parameter gives an approximate value of 209 orlog(119870119886119862119900) = 032 which implies a dissociation of about50 Hence in procedure 2 the hydrogen sulfate ion is amedium strength acid which is not dissociated although italso becomes stronger as the titration proceeds (because ofdilution)
Therefore in order to interpret the shape of the conduc-tometric plot from procedure 2 (which would also be strictlyvalid for procedure 1) another two titration reactions must beconsidered First the following reaction R1 contributes moreto the plot
R1 H+ +OHminus 999447999472 H2O with 119870R1 = 101380
(13)
which when approaching the first equivalence point (EP1with 119881EP 1 asymp 19mL) is not quite quantitative for the aciddissociation of the HSO4
minus ion this is why there seems to beno changes on the pH-metric plot in Figure 2(a) not evenon its first derivative in log scale but there is a curvatureof the conductometric plot that seems readily noticeableon the conductometric plot of Figure 2(b) This is becausethe pH-metric titration plots are logarithmic with respectto the hydronium ion concentration whereas the conduc-tometric ones are linear with respect to the ions concentra-tions
In the vicinity of the EP1 it can be considered that thesecond titration reaction R2 begins
R2 HSO4minus+OHminus 999447999472 SO4
2minus+H2O with
119870R2 = 10(138minus16)
= 10122
(14)
having an appreciable quantitivity Therefore the secondequivalence point (EP2 with119881EP 2 asymp 38mL) is clearly visibleon the conductometric (Figure 2(b)) and in the pH-metricplots (Figure 2(a))
With the aim of additionally proving that the robustmodel predicts correctly the conductometric titration plotsFigure 3 presents the behavior of the plot corrected bydilution 120581corr = 119891(119881119887)
Figure 3(a) shows that the correction by dilutionincreases the conductivity values with respect to theexperimental ones because they are those that would havebeen measured provided there were no dilution effectsFigure 3(b) leads us to appreciate that as expected thedilution correction induces the plot to become linearlysegmented from the vicinity of EP2 up to the excess titrantadded However from the beginning up to the vicinity of EP1the plot is not linear because the reaction is not sufficientlyquantitative although it may be fitted by linear segmentsaway from the vicinity of EP1 In fact the derivative of theconductometric plot (broken line in Figure 3(b)) shows thatbefore EP1 the plot seems to be formed by two quadraticfunctions of the volume the intersection of which marksthe 119881EP 1
The robust estimation model leads to a greater exact-ness and precision when fitting the experimental resultswithout the need to correct the conductivity because of thedilution effect The uncertainty of selecting which pointsshould be considered in the linear trend before and afterthe EP1 is still significant in this case (that could beconsidered a titration case of relatively simple interpreta-tion)
32 Conductometric Titration with NaOH of a Mixture ofAcetic and Boric Acids in Aqueous Solution The next casein complexity corresponds to a mixture of monoprotic acidsthat are titrated with sodium hydroxide Even though theyare monodonor they form a mixture of species of differentsystems like it is commented on the corresponding theory inthe second part of Section 21
8 Journal of Chemistry
012345678910
0 1 2 3 4 5 6 7 8Vb (mL)
120581(m
Scmminus1)
(a)
04
09
14
012345678910
0 1 2 3 4 5 6 7 8minus16
minus11
minus06
minus01
Vb (mL)
120581(m
Scmminus1)
d120581dVb(m
Scmminus4)
(b)
Figure 3 Plots of 120581 and 120581corr as a function of119881119887 for the titration system stated in Figure 2 (a)The conductivity plots of the system and correctedconductivity are different because of the large dilution during titration (b) Experimental plots 120581corr = ℎ(119881119887) (markers) and estimated with (11)and (3) (solid line) and its first derivative 119889120581corr119889119881119887 = ℎ
1015840(119881119887) asymp Δ120581corrΔ119881119887 (segmented line) Auxiliary thin black and red lines are added
to emphasize the linear trends in the corresponding curve
Further to facilitate the understanding when studyingthese systems the following equations correspond to thefractions of the acetates and borates as a function of pH
119891CH3COOminus =[CH3COO
minus]
[Acetate]total=
1
1 + 10(p119870CH3COOHminuspH)
119891CH3COOH =[CH3COOH]
[Acetate]total= 119891CH3COOminus10
(p119870CH3COOHminuspH)
(15)
119891H2BO3minus =[H2BO3
minus]
[Borate]total=
1
1 + 10(p119870H3BO3minuspH)
119891H3BO3 =[H3BO3][Borate]total
= 119891H2BO3minus10(p119870H3BO3minuspH)
(16)
where p119870CH3COOH is the p119870119886 of the acetic acid and p119870H3BO3the p119870119886 of the boric acid
Equation (17) expresses the volume of the strong baseadded during titration of mixtures of acetic acid and boricacid as a function of pH
119881119887 = (minus119881119900119862119900 [119891CH3COOminus] minus 1198811199001198621 [119891H2BO3minus]
minus119881119900 ([H+] minus
119870119908
[H+]))(119862119887 + [H+] minus
119870119908
[H+])
minus1
(17)
where 119862119900 is the initial concentration of acetic acid and 1198621 isthe initial concentration of boric acid in the volume119881119900 of themixture
Finally (18) presents the expression of the conductivity inthe same titrations as a function of pH
120581 = 120582H+ [H+] + 120582OHminus
119870119908
[H+]+
119881119900119862119900
119881119900 + 119881119887
120582CH3COOminus119891CH3COOminus
+1198811199001198621
119881119900 + 119881119887
120582H2BO3minus119891H2BO3minus + 120582Na+119881119887119862119887
119881119900 + 119881119887
(18)
321 Procedure 200mL (119881119900) of an aqueous solution havinga 119862119900 = 0053mol Lminus1 concentration in CH3COOH and aconcentration 1198621 = 01025mol Lminus1 in H3BO3 was titratedwith a NaOH aqueous solution at a 119862119887 = 02743mol Lminus1concentration
Figure 4 presents the pH-metric titration plot (estimatedwith (15) (16) and (17)) as well as its first derivative andthe conductometric plot (experimental and estimated) of thetitration described in the previous procedureThe data shownin Table 1 were considered in the estimates
The pH = 119891(119881119887) plot (solid line) and its first derivativewith respect to 119881119887 (broken line) shows that it is possible todetermine exactly and precisely the two equivalence pointsexisting in the titration (Figure 4(a))
As the acetic acid p119870119886 is smaller than that of the boricacid the first titration reaction (R1) is
R1 CH3COOH +OHminus 999447999472 CH3COOminus+H2O with
119870R1 = 10(140minus46)
= 1094
(19)
whereas the second (R2) is
R2 H3BO3 +OHminus 999447999472 H2BO3minus+H2O with
119870R2 = 10(140minus91)
= 1049
(20)
The robust model for estimation of the conductometricplot described in the presentwork allows an excellent fit of the
Journal of Chemistry 9
0
1
2
3
4
5
6
7
8
0
2
4
6
8
10
12
14
0 2 4 6 8 10 12 14 16 18
pH
Vb (mL)
dpH
dVb(m
Lminus1)
(a)
0
3
6
9
12
15
18
21
24
0 1 2 3 4 5 6 7 8 9 10 11 12 13 14 15 16Vb (mL)
120581(m
Scmminus1)
(b)
Figure 4 Plots obtained during titration of 2000mL of CH3COOH aqueous solution at a 0053mol Lminus1 concentration and H3BO3 at a01025mol Lminus1 concentration with NaOH aqueous solution at 02743mol Lminus1 concentration (a) Calculated pH-metric plots the solid linerepresents the plot pH = 119891(119881119887) obtained with (17) while the segmented line represents the plot of 119889pH119889119881119887=119891
1015840(119881119887) asymp ΔpHΔ119881119887 (b)
Conductometric plot 120581 = 119892(119881119887) The markers represent the experimental points obtained and the solid line represents the estimated plotwith (18)
experimental plot as can be appreciated in Figure 4(b) evenif the plot is clearly nonlinear because of the large dilutiontaking place in the system The values of p119870119886 and equivalentconductivity were used for the fitting in accordancewith (15)(16) (17) and (18) and are shown in Table 1
When performing the dilution correction to the conduc-tivity it can be observed that the 120581corr increases at everyconductivity measurement 120581 (Figure 5(a)) Further straightlines have been added over the 120581corr in Figure 5(b) thesecan be used to perform the quantitative analysis of thistype of mixture in spite of the fact that the first titrationreaction is more quantitative whereas the slope change in thecorrected conductometric plot is more difficult to appreciate(because the slopes of the straight lines before and after theEP1 are almost equal) Without the robust estimation modelit may become difficult to locate adequately the EP1 andconsequently the selection of points before and after the EP1that follow the linear trend to determine the volume of thesaid EP1 exactly and precisely by means of the intersectionof the two straight lines
However there is another contribution to the fittingof the estimation robust model that allows also obtaininga good approximation for the derivative of the correctedconductivity as a function of pH (broken line in Figure 5(b))In the EP1 region it can be observed that a constant (theslope of the straight line that appears before the EP1) changesabruptly into another constant (that is the slope of the straightline appearing just after the EP1) This representation isclearer than the search for the straight line trends in a typicalconductometric plot
33 Potentiometric and Conductometric Titrations of aBritton-Robinson Aqueous Solution (Mixture of Acetic Boricand Phosphoric Acids) with NaOH The last case consideredin this work is a more complicated system than the previousIt was decided to carry out a conductometric titration of a
similar solution to that of Britton-Robinson in agreementwith the information found in Dean [4] which impliesadding the phosphoric acid (a triprotic acid) to a mixture likethe one of the previous section
Aside from the fact that the mixture studied in thissection involves species from three different componentsthe Britton-Robinson solutions are usually used as universalbuffer systems in biologic systems and for biochemical andbiotechnological studies Hence the characterization of thesesystems turns out to be relevant
The estimates of the titration plots for Britton-Robinsonsolutions involve the fractions of the acetates (15) borates(16) and phosphates (21) systems
119891PO43minus =[PO43minus]
[Phosphate]total
= 1 (1 + 10(p119870HPO4minuspH) + 10
(p119870HPO4+p119870H2PO4minus2pH)
+10(p119870HPO4+p119870H2PO4+p119870H3PO4minus3pH))
minus1
119891HPO42minus =[HPO4
2minus]
[Phosphate]total= 119891PO43minus10
(p119870HPO4minuspH)
119891H2PO4minus =[H2PO4
minus]
[Phosphate]total= 119891PO43minus10
(p119870HPO4+p119870H2PO4minus2pH)
119891H3PO4 =[H3PO4]
[Phosphate]total
= 119891PO43minus10(p119870HPO4+p119870H2PO4+p119870H3PO4minus3pH)
(21)
where p119870HPO4 p119870H2PO4 and p119870H3PO4 are the values of p1198701198863p1198701198862 and p1198701198861 respectively of the phosphoric acid
10 Journal of Chemistry
0
3
6
9
12
15
18
21
24
0 1 2 3 4 5 6 7 8 9 10 11 12 13 14 15 16Vb (mL)
120581(m
Scmminus1)
(a)
1
15
2
25
3
35
03691215182124
0 1 2 3 4 5 6 7 8 9 10 11 12 13 14 15 16Vb (mL)
120581(m
Scmminus1)
d120581dVb(m
Scmminus4)
(b)
Figure 5 Plots of 120581 and 120581corr as a function of119881119887 for the titration system stated in Figure 4 (a)The conductivity plots of the system and correctedconductivity are different because of the large dilution during titration (b) Experimental plots 120581corr = ℎ(119881119887) (markers) and estimated with(18) and (3) (solid line) and its first derivative 119889120581corr119889119881119887 = ℎ
1015840(119881119887) asymp Δ120581corrΔ119881119887 (segmented line)
Equation (22) gives the volume of the strong base addedduring titrations of Britton-Robinson solutions as a functionof pH
119881119887 = (minus119881119900119862119900 [119891CH3COOminus] minus 1198811199001198621 [119891H2BO3minus]
minus 1198811199001198622 [3119891PO43minus + 2119891HPO42minus + 119891H2PO4minus]
minus119881119900 ([H+] minus
119870119908
[H+]))(119862119887 + [H+] minus
119870119908
[H+])
minus1
(22)where 119862119900 is the acetic acid initial concentration 1198621 is theboric acid initial concentration and1198622 is the phosphoric acidinitial concentration in the volume 119881119900 of the mixture
Finally (23) gives the expression of the conductivity as afunction of pH for the same titrations
120581 = 120582H+ [H+] + 120582OHminus
119870119908
[H+]+
119881119900119862119900
119881119900 + 119881119887
120582CH3COOminus119891CH3COOminus
+1198811199001198621
119881119900 + 119881119887
120582H2BO3minus119891H2BO3minus +1198811199001198622
119881119900 + 119881119887
sdot (120582H2PO4minus119891H2PO4minus + 2120582HPO42minus119891HPO42minus
+3120582PO43minus119891PO43minus) + 120582Na+119881119887119862119887
119881119900 + 119881119887
(23)
331 Procedure An equimolar Britton-Robinson mixture ofthe acetic boric and phosphoric acids was prepared adding30mL each at 0015mol Lminus1 nominal concentrations andthen 2600mL water was added thus obtaining a nominalconcentration of each acid in the mix of 119862119900 = 1198621 = 1198622 =
0001286mol Lminus1 The volume 119881119900 = 3500mL of the initialmix thus prepared was titrated with titrated NaOH solution(Baker) at a 119862119887 = 0050M concentration
332 Potentiometric Titration As the reactants used to pre-pare the solutions of the acids were not primary standardstheir quantitative analysis was done from the potentiometrictitration Fitting the plot was done with the robust modelfollowing (22) and with the p119870119886 values shown in Table 1the said fitting is shown in Figure 6(a) as well as its firstderivative obtained in a more approximate manner withthe data of the model (which smooths notably the plot andfacilitates the detection of the maxima with greater exactnessand precision if it were done with the experimental data)
The titration plot presented in Figure 6(a) allows estab-lishing that there are four equivalence points correspondingto the same number of reactions sufficiently quantitativeTheanalysis of the physicochemical information found in theliterature allows concluding that these four titration reactionsfollow the growing order of the p119870119886 values so that
R1 H3PO4 +OHminus 999447999472 H2PO4minus+H2O with
119870R1 = 10(140minus21)
= 10119
R2 CH3COOH +OHminus 999447999472 CH3COOminus+H2O with
119870R2 = 10(140minus47)
= 1093
R3 H2PO4minus+OHminus 999447999472 HPO4
2minus+H2O with
119870R1 = 10(140minus71)
= 1069
R4 H3BO3 +OHminus 999447999472 H2BO3minus+H2O with
119870R4 = 10(140minus92)
= 1048
(24)
Even when there is a fifth titration reaction in this systemthere is not sufficient quantitivity to be appreciated Suchreaction is
R5 HPO42minus
+OHminus 999447999472 PO43minus
+H2O with
119870R1 = 10(140minus123)
= 1017
(25)
Journal of Chemistry 11
00050101502025030350404505
23456789101112
0 10 20 30 40 50 60
pH
Vb (mL)
dpH
dVb(m
Lminus1)
(a)
0
01
02
03
04
05
2 4 6 8 10 12pH
120573dil(m
mol)
(b)
0
02
04
06
08
1
12
0 10 20 30 40 50 60
120581(m
Scmminus1)
Vb (mL)
(c)
Figure 6 Titration plots of a Britton-Robinson solution obtained aftermixing 3000mL of a CH3COOH0015mol Lminus1 aqueous solutionwith3000mL of a H3BO3 0015mol Lminus1 aqueous solution 3000mL aqueous solution of H3PO4 0015mol Lminus1 and 260mL water titrated withNaOH at 0050mol Lminus1 concentration (a) pH-metric plots the markers represent the experimental recordings obtained (corrected throughthe efficiency of the cell as indicated in Section 2) The solid line represents the plot pH = 119891(119881119887) estimated (22) whereas the segmented linerepresents the 119889pH119889119881119887 = 119891
1015840(119881119887) asymp ΔpHΔ119881119887 obtained from the fitted model (b) Plot of buffer capacity with dilution (120573dil) estimated
as 120573dil = 119862119887(119889119881119887119889pH) asymp 119862119887(Δ119881119887ΔpH) as a function of pH for the Britton-Robinson solution (c) Conductometric plot 120581 = 119892(119881119887) Themarkers represent the experimental points obtained and the solid line represents the estimated plot with (23)
In agreement with the results of the potentiometrictitration with the robust model and the maxima of the firstderivative the concentrations of each acid in themix are119862119900 =[Acetate]total = 00012M 1198621 = [Borate]total = 00013M and1198622 = [Phosphate]total = 00012M
The first derivative of the pH-metric titration 119889pH119889119881119887
also allows determining the buffer capacity with dilution ofthe systems since 120573dil = 119862119887(119889119881119887119889pH) This plot which ispresented in Figure 6(b) shows that in effect the amount ofstrong base or strong acid that the solution may spend at theminima is at least one-third of that from the maxima of theplot in the 2 to 12 intervals which is considered a universalbuffer system
333 Conductometric Titration Figure 6(c) shows the con-ductometric titration of the acidmixture in the initial volume(119881119900) of 3500mLThe robust model even in this case allows agood fit to the experimental results using (15) (16) (21) (22)and (23) in spite of the fact that the experimental behavior ismuch more complicated in these Britton-Robinson solutionsthan in the previous cases The part of the plot where the fitis not quite so good may be due to stirring problems in thecell (given that in this case the large cell was used described
in Section 2 because in this case the conductivity variationsin the solution are smaller during the course of titration)
The plot 120581corr = 119891(119881119887) of this titration should lead toexpecting four slope changes at the linear trends found indifferent regions of the plot which relate the equivalencepoints that can be noted which is why Figure 7 presents thecomparison of the dilution-corrected conductometric plotand that without correction (Figure 7(a)) while Figure 7(b)presents the dilution-corrected conductometric plots theexperimental (markers) and the estimated with the robustmodel (solid line) as well as the first derivative of theplot with the estimated data (broken line) The uncertaintyassociated with measurements makes it more difficult toselect the regions of the plot with linear tendency hence theequivalence points become easier to see in the plot of thefirst derivative in spite of the fact that there are four equiv-alence points of reactions at the quantitivity limit for theirinstrumental detection The ancillary lines (broken) havebeen included in Figure 7(b) to emphasize the usefulnessof the first derivative plot The detection of the equivalencepoints is comparable to that of the potentiometric methodprovided the plots of the derivatives are used in bothcases
12 Journal of Chemistry
0
02
04
06
08
1
12
0 10 20 30 40 50 60
120581(m
Scmminus1)
Vb (mL)
(a)
0001002003004
0
02
04
06
08
1
12
0 10 20 30 40 50 60minus005
minus004
minus003
minus002
minus001
120581(m
Scmminus1)
Vb (mL)
d120581dVb(m
Scmminus4)
(b)
Figure 7 Plots of 120581 and 120581corr as a function of 119881119887 for the titration system stated in Figure 6 (a) The plots of the systemrsquos conductivity and thecorrected conductivity are different because of a large dilution during titration (b) Plots 120581corr = ℎ(119881119887) experimental (markers) and estimatedthrough (23) and (3) (solid line) and its first derivative 119889120581corr119889119881119887 = ℎ
1015840(119881119887) asymp Δ120581corrΔ119881119887 (segmented line) The thin solid lines are added to
emphasize the linear trends in the conductivity curve while the broken lines are ancillary elements to emphasize that the slope changes mustcoincide for both graphical representations 120581corr and 119889120581corr119889119881119887
4 Conclusions
This work presented a method to estimate conductometricplots during Broslashnsted acid-base titrations with exactness andprecision applying a robust model to obtain pH-metric plotsbecause the said model allows knowing the thermodynamicequilibrium conditions of all the species comprised in agiven system which makes it possible to determine anyequilibrium property with which there is relation with itsknown composition
The study of different cases showed that the exact esti-mation of the conductometric plot is possible even duringtitrations of complicated mixtures and that the fitting to theexperimental results can be done through parameters alreadyreported in the literature
The conductometric study supported with this robustestimation method brings about information that it is notaccessible from the pH-metric study Also the estimatedconductometric one that fits adequately the experimentalresults allows estimating its first derivative plot that is avaluable tool to detect the titration equivalence points
The main advantage in having a robust model to esti-mate exactly the plots either pH-metric or conductometricallows interpreting complicated systems and distinguishingthe contributions from the different species of the systemfor example the buffer at the pH or the conductivity ofthe system whenever it is desired to characterize moleculeslike pharmaceuticals additives new materials precursorsand so forth Several problems to apply the model that maybe dealt with using the method presented here can be thecharacterization of polymers based on latex functionalizedwith acid or basic groups [5] the determination of winesacidity [7] or the characterization of the buffer capacityof universal buffers like the Britton-Robinson [4] amongstothers
Conflict of Interests
The authors declare that there is no conflict of interestsregarding the publication of this paper
Acknowledgment
Norma Rodrıguez-Laguna thanks CONACyT for the stu-dentship to pursue postgraduate studies
References
[1] I N Levine Fisicoquımica vol 2 McGraw-Hill Madrid Spain5th edition 2004
[2] A J Bard and L R Faulkner Electrochemical Methods Funda-mentals and Applications John Wiley amp Sons New York NYUSA 1980
[3] C J M Pingarron Quımica Electroanalıtica Fundamentos yAplicaciones Sıntesis Madrid Spain 2003
[4] J A Dean ldquoElectrolytes electromotive force and chemi-cal equilibriumrdquo in Langersquos Handbook of Chemistry p 8113McGraw-Hill New York NY USA 1999
[5] J Hen ldquoDetermination of surface carboxyl groups in styreneit-aconic acid copolymer latexesrdquo Journal of Colloid and InterfaceScience vol 49 no 3 pp 425ndash432 1974
[6] P Brunatti and H De Napoli ldquoTitulaciones Conductimetricasrdquo2014 httpmateriasfiubaar6305tpshtml
[7] J Darias-Martın A Socas-Hernandez and C Dıaz-RomeroldquoComparative study of methods for determination of titrableacidity in winerdquo Journal of Food Composition and Analysis vol16 no 5 pp 555ndash562 2003
[8] G M Fleck Equilibrios en Disolucion Alhambra MadridSpain 1967
[9] P Tarapcik and E Beinrohr Implementation of a UniversalAlgorithm for pH Calculation into Spreadsheet and Its Use in
Journal of Chemistry 13
Teaching in Analytical Chemistry Faculty of Chemical and FoodTechnology STU Bratislava Slovakia 2005
[10] R de Levie ldquoGeneral expressions for acid-base titrations ofarbitrarymixturesrdquoAnalytical Chemistry vol 68 no 4 pp 585ndash590 1996
[11] R Gutz httpwww2iquspbrdocentegutzCurtipot html[12] C E Efstathiou 2014 httpwwwchemuoagrAppletsAp-
pletTitrationAppl Titration2html[13] A G Asuero and TMichalowski ldquoComprehensive formulation
of titration curves for complex acid-base systems and its analyt-ical implicationsrdquo Critical Reviews in Analytical Chemistry vol41 no 2 pp 151ndash187 2011
[14] A Rojas-Hernandez N Rodrıguez-Laguna M T Ramırez-Silva and R Moya-Hernandez ldquoDistribution diagrams andgraphical methods to determine or to use the stoichiomet-ric coefficients of acid-base and complexation reactionsrdquo inStoichiometry and ResearchmdashThe Importance of Quantity inBiomedicine A Innocenti Ed chapter 13 pp 287ndash310 InTechRijeka Croatia 2012
[15] N Rodrıguez-Laguna A Rojas-Hernandez andMT Ramırez-Silva ldquoStudy and behavior of the buffer capacity of mixturesof species of a same protons poly-donor systemrdquo EducacionQuimica vol 25 no 1 pp 210ndash222 2014 (Spanish)
[16] A Rojas-Hernandez M T Ramırez-Silva A Galano J LCordova Frunz and J F Perez Arevalo ldquoCharlotrsquos equation andflood and gordus graphsrdquo Educacion quımica vol 21 no 4 pp306ndash313 2010 (Spanish)
[17] N Rodrıguez-Laguna Theoretical contributions to the buffercapacity notion considering insoluble and polynuclear species[PhD thesis] Universidad Autonoma Metropolitana-Iztapala-pa Mexico City Mexico 2015 (Spanish)
[18] D C Harris Analisis Quımico Cuantiativo Reverte BarcelonaSpain 3rd edition 2003
[19] J M Islas-Martınez D Rodrıguez-Barrientos A Galanoet al ldquoDeprotonation mechanism of new antihypertensivepiperidinylmethylphenols a Combined Experimental andThe-oretical Studyrdquo Journal of Physical Chemistry B vol 113 no 34pp 11765ndash11774 2009
[20] I PuigdomenechMaking EquilibriumDiagramsUsing Sophis-ticated Algorithms (MEDUSA) 2014 httpwwwkthseenchemedusadownloads-1386254
Submit your manuscripts athttpwwwhindawicom
Hindawi Publishing Corporationhttpwwwhindawicom Volume 2014
Inorganic ChemistryInternational Journal of
Hindawi Publishing Corporation httpwwwhindawicom Volume 2014
International Journal ofPhotoenergy
Hindawi Publishing Corporationhttpwwwhindawicom Volume 2014
Carbohydrate Chemistry
International Journal of
Hindawi Publishing Corporationhttpwwwhindawicom Volume 2014
Journal of
Chemistry
Hindawi Publishing Corporationhttpwwwhindawicom Volume 2014
Advances in
Physical Chemistry
Hindawi Publishing Corporationhttpwwwhindawicom
Analytical Methods in Chemistry
Journal of
Volume 2014
Bioinorganic Chemistry and ApplicationsHindawi Publishing Corporationhttpwwwhindawicom Volume 2014
SpectroscopyInternational Journal of
Hindawi Publishing Corporationhttpwwwhindawicom Volume 2014
The Scientific World JournalHindawi Publishing Corporation httpwwwhindawicom Volume 2014
Medicinal ChemistryInternational Journal of
Hindawi Publishing Corporationhttpwwwhindawicom Volume 2014
Chromatography Research International
Hindawi Publishing Corporationhttpwwwhindawicom Volume 2014
Applied ChemistryJournal of
Hindawi Publishing Corporationhttpwwwhindawicom Volume 2014
Hindawi Publishing Corporationhttpwwwhindawicom Volume 2014
Theoretical ChemistryJournal of
Hindawi Publishing Corporationhttpwwwhindawicom Volume 2014
Journal of
Spectroscopy
Analytical ChemistryInternational Journal of
Hindawi Publishing Corporationhttpwwwhindawicom Volume 2014
Journal of
Hindawi Publishing Corporationhttpwwwhindawicom Volume 2014
Quantum Chemistry
Hindawi Publishing Corporationhttpwwwhindawicom Volume 2014
Organic Chemistry International
ElectrochemistryInternational Journal of
Hindawi Publishing Corporation httpwwwhindawicom Volume 2014
Hindawi Publishing Corporationhttpwwwhindawicom Volume 2014
CatalystsJournal of
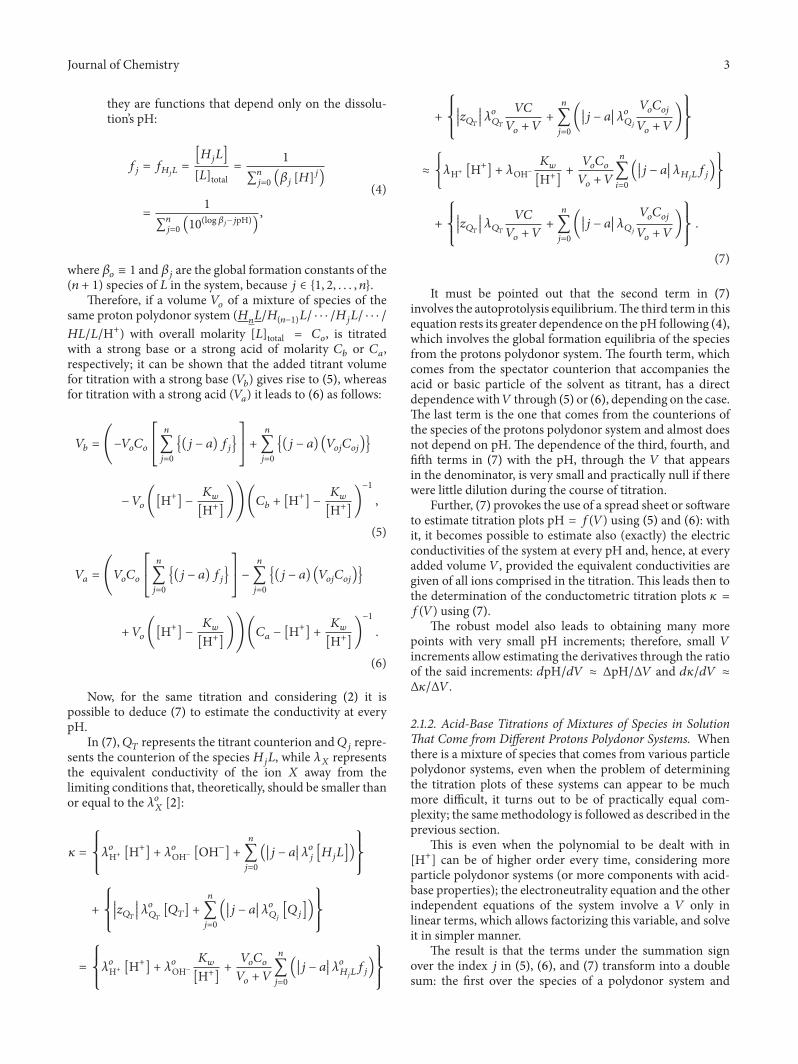
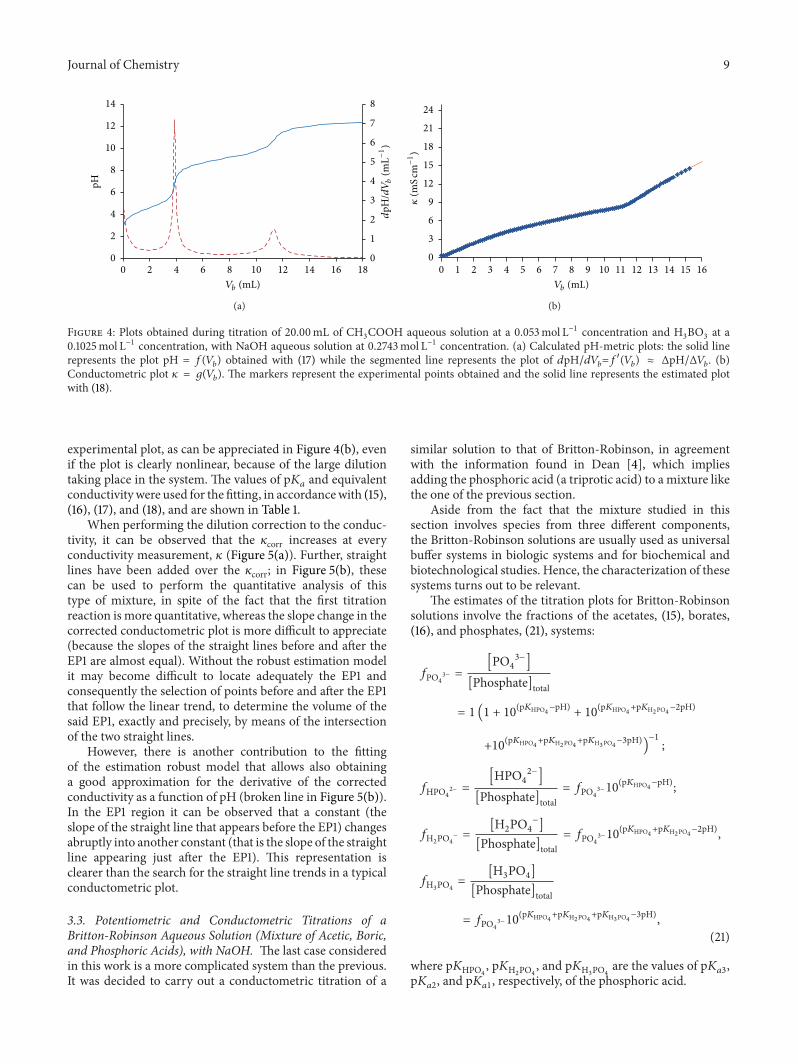
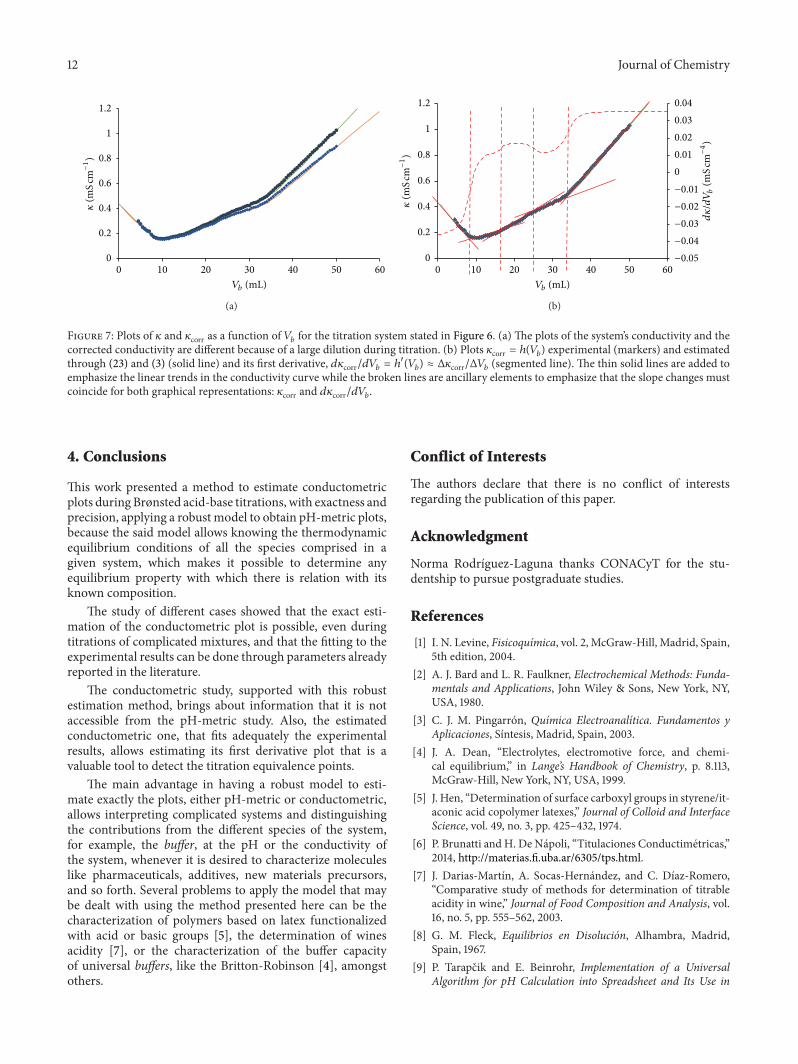