research article an on-line solid phase extraction-liquid...
TRANSCRIPT

Research ArticleAn On-Line Solid Phase Extraction-LiquidChromatography-Tandem Mass Spectrometry Method forthe Determination of Perfluoroalkyl Acids in Drinking andSurface Waters
Michela Mazzoni,1 Marianna Rusconi,1 Sara Valsecchi,1
Claudia P. B. Martins,2 and Stefano Polesello1
1 IRSA-CNR, Water Research Institute, Via Mulino 19, 20861 Brugherio, Italy2Thermo Fisher Scientific, 16 avenue du Quebec, Silic 765, Villebon-sur-Yvette, 91963 Courtaboeuf Cedex, France
Correspondence should be addressed to Stefano Polesello; [email protected]
Received 27 October 2014; Revised 21 January 2015; Accepted 12 February 2015
Academic Editor: Gregory W. Diachenko
Copyright © 2015 Michela Mazzoni et al. This is an open access article distributed under the Creative Commons AttributionLicense, which permits unrestricted use, distribution, and reproduction in any medium, provided the original work is properlycited.
An UHPLC-MS/MS multiresidue method based on an on-line solid phase extraction (SPE) procedure was developed for thesimultaneous determination of 9 perfluorinated carboxylates (from 4 to 12 carbon atoms) and 3 perfluorinated sulphonates (from4 to 8 carbon atoms). This work proposes using an on-line solid phase extraction before chromatographic separation and analysisto replace traditional methods of off-line SPE before direct injection to LC-MS/MS. Manual sample preparation was reduced tosample centrifugation and acidification, thus eliminating several procedural errors and significantly reducing time-consuming andcosts. Ionization suppression between target perfluorinated analytes and their coeluting SIL-IS were detected for homologues witha number of carbon atoms less than 9, but the quantitation was not affected. Total matrix effect corrected by SIL-IS, inclusive ofextraction efficacy, and of ionization efficiency, ranged between −34 and +39%.The percentage of recoveries, between 76 and 134%,calculated in different matrices (tap water and rivers impacted by different pollutions) was generally satisfactory. LODs and LOQsof this on-line SPE method, which also incorporate recovery losses, ranged from 0.2 to 5.0 ng/L and from 1 to 20 ng/L, respectively.Validated on-line SPE-LC/MS/MSmethod has been applied in a wide survey for the determination of perfluoroalkyl acids in Italiansurface and ground waters.
1. Introduction
In the last decade, the worldwide distribution in the differentenvironmental compartments of perfluoroalkyl substances(PFAS) became a concern for the scientific community [1–4]. This class of chemicals has been used in a wide range ofindustrial and consumer products for the past six decadesmainly to repel dirt, water, and oil [5, 6]. PFAS includethousands of chemicals, but the environmental studies havebeen concentrated mainly on two classes of perfluoroalkylacids (PFAA), that is, perfluorosulphonic acids (PFSA),which include perfluorooctanesulphonic acid (PFOS), andperfluorocarboxylic acids (PFCA), which include perfluo-rooctanoic acid (PFOA). PFSA and PFCA are low molecular
weight surfactants in which all carbons are bonded tofluorine atoms, consisting of homologous series of moleculesthat differ in carbon chain length. PFOS and PFOA havebeen demonstrated to be persistent in the environment andbioaccumulative in the trophic chain. The accumulation inthe aquatic trophic chain poses concern about the risksfor the end consumers, including humans. After a riskassessment study, the European Commission very recentlyintroduced PFOS in the list of priority hazardous substanceswhich must be monitored in the EU water bodies, settingan environmental quality standard (EQS) of 0.65 ng/L forfreshwater and maximum allowable concentrations (MAC)of 36 𝜇g/L and 7.2 𝜇g/L for inland and other surface waters,respectively [7], while the US environmental protection
Hindawi Publishing CorporationJournal of Analytical Methods in ChemistryVolume 2015, Article ID 942016, 13 pageshttp://dx.doi.org/10.1155/2015/942016

2 Journal of Analytical Methods in Chemistry
agency (EPA) proposed Provisional Health Advisories of400 ng/L and 200 ng/L, respectively, for PFOA and PFOS indrinking waters [8]. In Italy, EQSs for five PFAA in surfacewaters have been recently proposed and are currently underdiscussion: the lowest EQS is 100 ng/L for PFOA (Valsecchi,personal communication).
The introduction of regulatory restrictions in the use ofPFOS and PFOA [9, 10] induced themajor PFAS producers tofind other substitutes for these compounds especially amongthe congeners with different chain lengths.
The homologues, which have usually from 4 to 14 carbonatoms (C) for PFCA and from 6 to 10 C for PFSA, show verydifferent physicochemical behaviours which present a seriouschallenge for the simultaneous determination of PFAA inwater samples.
Solubility strongly decreases by increasing the chainlength, for example, from 100 g/L for PFHpA to 0.1 g/L forPFUnDA [11, 12], while acidity decreases as the chain lengthincreases (pKas vary from 0.1 to 3.8 in the range PFBA-PFDoDA) ([13] and references therein). The increase of thenumber of CF
2moieties also leads to a significant increase in
lipophilicity expressed as pKow; for example, from PFHxA toPFDoDApKows increase from3.68 to 9.21 ([13] and referencestherein). Generally, for a certain chain length, sulphonatesaremore lipophilic than carboxylates. All these physicochem-ical variables drastically influence recoveries with classicalextraction techniques such as liquid-liquid extraction (LLE)or solid phase extraction (SPE). According to the review ofJahnke and Berger [14], LLE worked best for PFAA withcarbon chain lengths >7 whereas SPE was best suited forPFAA with <10 carbon atoms. Major drawbacks of the SPEapproach in PFAA analysis are the sample contaminationand possible losses of the surface-active PFAA to containerwalls and other materials (tubing, connections) besides theproblems inherent in SPE such as breakthrough and cloggingof the column [14]. Moreover, SPE requires the extraction oflarge volumes of sample and solvent recovery of the adsorbedmolecules followed by solvent concentration and the wholeprocedure can take some hours.
The automation of SPE has been employed to increasesample throughput for many years [15, 16] and on-line SPEcoupled to LC-MS has been also applied to the analysisof PFAA in water samples [17–21]. The on-line SPE madethe development of faster methods by reducing the anal-ysis time and thus increasing the analytical productivitypossible [16]. The challenge of the on-line SPE methods isstill to optimize preconcentration and elution procedures toachieve a satisfactory accuracy in a single run for a classof compounds with different physicochemical variables suchas PFAA. In addition, the coupling of on-line SPE withUHPLC is not easy due to the high back pressure generatedfrom the use of high flow rates with a low particle sizecolumn (<2𝜇m). Furthermore, it is common to have releaseof PFAA (mainly PFOA) from the UHPLC hardware sincepolytetrafluoroethylene is often used in the manufacturingof tubing and fittings and seals in UHPLC systems. Anextra column can be placed before the injector to delay theelution of PFAA from the pump and distinguish betweenPFAA actually present in the sample and those released by
the system. This implies that the system may contain upto 3 columns connected in-line (trap, preconcentration, andchromatographic column).
The aim of our work is to explore the possibility of opti-mizing an on-line SPE/UHPLC-MS/MS method for PFCAand PFSA ranging, respectively, from 4 to 12 and from 4 to 8carbon atoms and to understand the factors that influence themethod accuracy. The optimized and validated method wasthen applied to a large survey of Italian surface and drinkingwaters whose preliminary results are presented in this paper.
2. Materials and Methods
2.1. Chemicals and Reagents. Perfluorobutanoic acid (PFBA),perfluoropentanoic acid (PFPeA), perfluorohexanoic acid(PFHxA), perfluoroheptanoic acid (PFHpA), perfluorooc-tanoic acid (PFOA), perfluorononanoic acid (PFNA), perflu-orodecanoic acid (PFDA), perfluoroundecanoic acid(PFUnDA), perfluorododecanoic acid (PFDoDA), tetrabu-tylammonium perfluorobutane sulphonate (PFBS), potas-sium perfluorohexane sulphonate (PFHxS), and tetrabutyl-ammonium perfluorooctane sulphonate (PFOS) were pur-chased from Sigma-Aldrich (St. Louis, MO, USA). Separatestock solutions of the analytes were prepared in methanolat a concentration of 1.0mg/mL of the anionic compound.A multicomponent standard solution containing the12 analytes at 10 𝜇g/mL was prepared by diluting thestock solutions. Aqueous standard solutions (2–200 ng/L)containing all analytes were freshly prepared by serialdilution of the methanolic mixed solution of standards inclean drinking water. Stable isotope labelled PFCA and PFSAinternal standard compounds (SIL-IS) were purchased fromWellington Laboratories (Guelph, ON, Canada) in 2𝜇g/mLsolution mixtures. SIL-IS were 13C
4-PFBA, 13C
2-PFHxA,
13C4-PFOA, 13C
5-PFNA, 13C
2-PFDA, 13C
2-PFUnDA, 13C
2-
PFDoDA, 18O2-PFHxS, and 13C
4-PFOS.The solution of SIL-
IS was diluted to a concentration of 40 ng/mLwithmethanol.All standard solutions were stored at +4∘C. All reagents wereanalytical reagent grade. Supelco-Supelclean EnviCarb, LC-MS Chromasolv methanol, LC-MS Chromasolv acetonitrile,ammonium acetate (99%), and concentrated formic acidwere purchased from Sigma-Aldrich. Water (<18MΩ cmresistivity) was produced by a Millipore Direct-QUV waterpurification system (Millipore, Bedford, MA, USA).
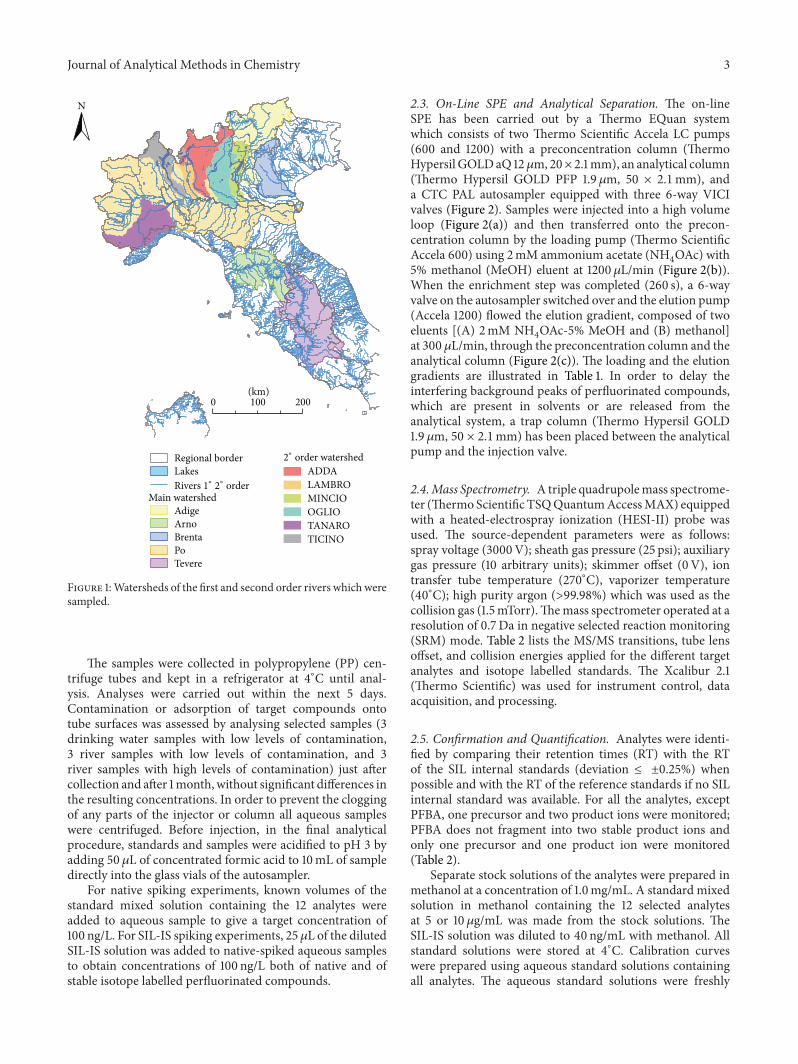
2.2. Sample Collection and Pretreatment. Samples were col-lected from Italian water bodies between 2010 and 2013. Thesurveyed river basins were rivers Po, Adige, and Brenta inNorthern Italy and rivers Arno and Tevere in Central Italy.In the river Po basin, samples were collected also from themain tributaries Bormida, Tanaro, Ticino, Lambro, Adda,Oglio, and Mincio (Figure 1). River waters were collected bymeans of a bucket at the centre of the river bed. Samples fromlake (lake Como) and transitional environments (lagoons ofVenice and Goro in the Po Delta) were directly collected inthe sampling vials by manually dipping the vial below thewater surface from a boat. Ground waters were also collectedbetween 2010 and 2012 from wells or piezometers.
Journal of Analytical Methods in Chemistry 3
0 200100(km)
N
Regional borderLakesRivers 1∘ 2∘ order
Main watershedAdigeArnoBrentaPoTevere
2∘ order watershed
ADDALAMBROMINCIOOGLIOTANAROTICINO
Figure 1:Watersheds of the first and second order rivers which weresampled.
The samples were collected in polypropylene (PP) cen-trifuge tubes and kept in a refrigerator at 4∘C until anal-ysis. Analyses were carried out within the next 5 days.Contamination or adsorption of target compounds ontotube surfaces was assessed by analysing selected samples (3drinking water samples with low levels of contamination,3 river samples with low levels of contamination, and 3river samples with high levels of contamination) just aftercollection and after 1month,without significant differences inthe resulting concentrations. In order to prevent the cloggingof any parts of the injector or column all aqueous sampleswere centrifuged. Before injection, in the final analyticalprocedure, standards and samples were acidified to pH 3 byadding 50𝜇L of concentrated formic acid to 10mL of sampledirectly into the glass vials of the autosampler.
For native spiking experiments, known volumes of thestandard mixed solution containing the 12 analytes wereadded to aqueous sample to give a target concentration of100 ng/L. For SIL-IS spiking experiments, 25 𝜇L of the dilutedSIL-IS solution was added to native-spiked aqueous samplesto obtain concentrations of 100 ng/L both of native and ofstable isotope labelled perfluorinated compounds.
2.3. On-Line SPE and Analytical Separation. The on-lineSPE has been carried out by a Thermo EQuan systemwhich consists of two Thermo Scientific Accela LC pumps(600 and 1200) with a preconcentration column (ThermoHypersil GOLDaQ 12 𝜇m, 20× 2.1mm), an analytical column(Thermo Hypersil GOLD PFP 1.9 𝜇m, 50 × 2.1mm), anda CTC PAL autosampler equipped with three 6-way VICIvalves (Figure 2). Samples were injected into a high volumeloop (Figure 2(a)) and then transferred onto the precon-centration column by the loading pump (Thermo ScientificAccela 600) using 2mM ammonium acetate (NH
4OAc) with
5% methanol (MeOH) eluent at 1200𝜇L/min (Figure 2(b)).When the enrichment step was completed (260 s), a 6-wayvalve on the autosampler switched over and the elution pump(Accela 1200) flowed the elution gradient, composed of twoeluents [(A) 2mM NH
4OAc-5% MeOH and (B) methanol]
at 300 𝜇L/min, through the preconcentration column and theanalytical column (Figure 2(c)). The loading and the elutiongradients are illustrated in Table 1. In order to delay theinterfering background peaks of perfluorinated compounds,which are present in solvents or are released from theanalytical system, a trap column (Thermo Hypersil GOLD1.9 𝜇m, 50 × 2.1mm) has been placed between the analyticalpump and the injection valve.
2.4.Mass Spectrometry. A triple quadrupolemass spectrome-ter (ThermoScientificTSQQuantumAccessMAX) equippedwith a heated-electrospray ionization (HESI-II) probe wasused. The source-dependent parameters were as follows:spray voltage (3000V); sheath gas pressure (25 psi); auxiliarygas pressure (10 arbitrary units); skimmer offset (0V), iontransfer tube temperature (270∘C), vaporizer temperature(40∘C); high purity argon (>99.98%) which was used as thecollision gas (1.5mTorr).Themass spectrometer operated at aresolution of 0.7Da in negative selected reaction monitoring(SRM) mode. Table 2 lists the MS/MS transitions, tube lensoffset, and collision energies applied for the different targetanalytes and isotope labelled standards. The Xcalibur 2.1(Thermo Scientific) was used for instrument control, dataacquisition, and processing.
2.5. Confirmation and Quantification. Analytes were identi-fied by comparing their retention times (RT) with the RTof the SIL internal standards (deviation ≤ ±0.25%) whenpossible and with the RT of the reference standards if no SILinternal standard was available. For all the analytes, exceptPFBA, one precursor and two product ions were monitored;PFBA does not fragment into two stable product ions andonly one precursor and one product ion were monitored(Table 2).
Separate stock solutions of the analytes were prepared inmethanol at a concentration of 1.0mg/mL. A standard mixedsolution in methanol containing the 12 selected analytesat 5 or 10 𝜇g/mL was made from the stock solutions. TheSIL-IS solution was diluted to 40 ng/mL with methanol. Allstandard solutions were stored at 4∘C. Calibration curveswere prepared using aqueous standard solutions containingall analytes. The aqueous standard solutions were freshly

4 Journal of Analytical Methods in Chemistry
Waste
Accela 600
Accela 1250Waste
MS
(a)
Waste
Accela 600
Accela 1250Waste
MS
(b)
Waste
Accela 600
Accela 1250Waste
MS
(c)
Figure 2: Schematic representation of the on-line SPE system used. (a) Loading of the sample into the high volume loop. (b) Transfer of thesample from the injection loop to the preconcentration column. (c) Transfer of the analytes retained in the preconcentration column to thechromatographic column.
Table 1: Elution gradients used by the loading pump and the elution pump. Elution pump flowed at 300 𝜇L/min. Loading time was 260 s.Sample volume was 5mL.
Time (min)Elution pump
(unchanged gradient)Elution pump(plug gradient)
Elution pump(early gradient) Loading pump
A% B% A% B% A% B% Flow (𝜇L/min) A% B%0 95 5 95 5 95 5 1200 100 03.00 95 53.99 95 54.00 20 804.34 95 54.50 20 80 1200 100 04.51 65 354.75 55 455.00 30 70 30 706.00 30 706.34 30 706.50 200 10 9010.00 0 10011.00 0 10011.34 0 10011.50 200 10 9013.50 0 10014.50 0 100 95 5 1200 100 014.84 0 10015.50 95 5 95 515.84 95 516.50 95 5 95 5 1200 100 0(A) 2mM ammonium acetate with 5% methanol.(B) Methanol.

Journal of Analytical Methods in Chemistry 5
Table 2: LC/MS/MS parameters for all target analytes and internal standards.
Compound Abbreviation Precursor ion Product ion(𝑚/𝑧) (𝑚/𝑧) Collision energy Tube lens offset
Target analytesPerfluorobutanoic acid PFBA 212.9 168.9 11 80
perfluoropentanoic acid PFPeA 262.9 69.0 39 85218.9 11 85
perfluorohexanoic acid PFHxA 312.9 119.1 22 86268.9 11 86
perfluoroheptanoic acid PFHpA 362.9 169.0 18 91318.9 12 91
perfluorooctanoic acid PFOA 412.9 169.0 19 96368.9 13 96
perfluorononanoic acid PFNA 462.9 218.9 18 104418.9 13 104
perfluorodecanoic acid PFDA 512.9 268.9 18 97468.9 13 97
perfluoroundecanoic acid PFUnDA 562.9 268.8 20 96518.8 14 96
perfluorododecanoic acid PFDoDA 612.9 318.8 20 107568.9 14 107
Perfluorobutane sulphonate PFBS 298.9 80.2 44 8599.1 32 85
Perfluorohexane sulphonate PFHxS 398.9 80.1 38 9199.0 34 91
Perfluorooctane sulphonate PFOS 498.9 80.3 45 10499.1 45 104
Internal standardsPerfluoro-n-[13C4] butanoic acid
13C4-PFBA 216.9 171.9 11 80Perfluoro-n-[13C2] hexanoic acid
13C2-PFHxA 314.9 269.9 11 86Perfluoro-n-[13C4] octanoic acid
13C4-PFOA 416.9 371.9 13 96Perfluoro-n-[13C5] nonanoic acid
13C5-PFNA 467.9 422.9 13 104Perfluoro-n-[13C2] decanoic acid
13C2-PFDA 514.9 469.9 13 97Perfluoro-n-[13C2] undecanoic acid
13C2-PFUnDA 564.9 519.8 14 96Perfluoro-n-[13C2] dodecanoic acid
13C2-PFDoDA 614.9 569.9 14 107Perfluoro-n-hexane [18O2] sulphonate
18O2-PFHxS 402.9 103.0 34 91Perfluoro-n-octane [13C4] sulphonate
13C4-PFOS 502.9 99.1 45 104
prepared by serial dilution of the methanol standard mixedsolution in real drinking water which was devoid of analysedcontaminants. Quantification was performed by using theisotopic dilution method and calibration curves were madebefore each analytical run. Before injection, standards andsamples were acidified to pH 3 and spiked with SIL-IS byadding 50 𝜇L of concentrated formic acid and 25 𝜇L of thediluted SIL-IS solution (40 ng/mL) to 10mL of sample.
Blank samples (clean drinking water) were injected at thebeginning and at the end of the analytical sequence and everyten samples. No carryover and contamination were detected.
Applicability to different typologies of waters, includingsaltwater and wastewater, was tested through fortifications ofthe different sample matrices. Relative recoveries were in thesame range calculated during validation procedures (75 and135%).
The performance of the on-line-SPE-UHPLC-MS/MSmethod was verified in the “PFOS and PFOA in surfacewater” proficiency test organised in 2013 by the PT-WFDnetwork (http://www.pt-wfd.eu). Analytical results were sat-isfactory with calculated 𝑧-scores of +1.43 and +1.70 andexpanded relative uncertainty of 13% and 10% for PFOS andPFOA, respectively.
3. Results and Discussion
3.1. Method Development. In an on-line SPE procedure,several experimental variables, such as sample volume andsample pH, should be optimized in order to achieve themaximum extraction efficiency of the target analytes. Gen-erally, it may be difficult to achieve comparable and reliable

6 Journal of Analytical Methods in Chemistry
efficiencies for all target compounds when the analytes havea broad range of polarity. In order to get the maximumchromatographic efficiency the trapped analytes should beeluted and refocused onto the analytical column by theanalytical elution gradient by the time the extraction col-umn is switched into the analytical flow path. Howeverin multiresidue analysis, the gradient elution for reversed-phase separations usually starts at high percentage of aqueousin the mobile phase, and the slow elution from the SPEpreconcentration column results in peak broadening, whichmay cause a decrease in efficiency and thereby in sensitivity[22, 23]. For these reasons, before carrying out the methodvalidation, the optimisation of the elution gradient and thevolume as well as the matrix modification of the injectedsample was carried out in order to achieve the best recoveryand sensitivity for the on-line SPE/UHPLC-MS/MS analysisof the perfluorinated carboxylic and sulphonic acids.
3.1.1. Optimisation of the Elution Gradient. Optimisation ofthe analytical separation was carried out by direct injectionof standard solutions with a 25 𝜇L loop. The elution gradientstarted at only 5% of mobile phase B (methanol) in orderto separate the shorter chain PFCA (PFBA and PFPeA). Aninitially faster gradient with mobile phase B raising from5 to 70% within 2min followed by a slower gradient withmobile phase B raising up to 100% within 5min allowed theseparations of all perfluoroalkyl acids and the elution of thelonger chain homologues (PFUnDA and PFDoDA) within5min. Then, an isocratic step at 100% methanol for 3.5minwas followed by a fast return to 95% of mobile phase A in1min and a conditioning step of 4min at starting compositionbefore the following analysis.
In the on-line SPE method, during the sample loadingstep, analytes are trapped in the stationary phase of the pre-concentration column. Then, elution of analytes is achievedin back-flush mode by putting in-line the preconcentrationcolumn with the eluting mobile phase.
The first approach was simply to use in the on-line proce-dure the separation gradient elution program, as optimised bydirect injection of analytes. In this case (Table 1: “unchangedgradient”) the gradient program started soon after the end ofthe loading of the sample into the preconcentration column(4.34min). Throughout the so-called loading time, a solventmixture at the initial conditions (5% methanol) isocraticallyflowed through the chromatographic column. By using thesesettings, peak broadening and distortion were observed forthe shorter chain and more polar homologues (PFBA andPFPeA), because these compounds, which show lower affinityfor the preconcentration column stationary phase, werepoorly focused on the preconcentration column.
To overcome this problem, the “solvent plug injectiontechnique” [22] was implemented. This technique provideselution bands of only a few seconds width using highpercentage solvent in order to get a rapid transfer of theanalytes from the preconcentration column to the analyticalcolumn as well as to keep them focused. Gode et al. [22]generated short plugs of high-elution strength solvent bymeans of an external loop and an additional LC-pump. We
achieved the same high-elution strength solvent plugs byusing the separation UHPLC pump which is characterisedby very low dead volumes. A step with a high percentage oforganic solvent (80% methanol) was inserted in the elutinggradient at the switching time, in order to provide narrowhigh-elution strength eluent band containing all the elutedanalytes (Table 1: “plug gradient”). The subsequent elutiongradient was modified in order to obtain a chromatographicseparation similar to the one used for direct injection of thesample (Table 1).
The effects of the different elution gradient are reported inFigure 3(a) which shows the height ratios between the analytepeaks detected with the plug gradient and those obtainedwith the unchanged gradient. Both early- and late-elutingperfluorocarboxylic acids benefited from “plug gradient” byimproving the shape of their peaks whereas no significanteffects were detected for PFSA. The peak heights improvedup to 3.7 times for the less retained PFCA. Nevertheless,the optimization of the “solvent plug injection technique”is laborious and highly time-consuming because it involvesseveral runs to find out the best high-elution strength solventand elution band width as well as the subsequent elutiongradient in order to avoid loss of retention along with severepeak distortion and artefact formation [22].
Finally, we tested a further and simpler approach: whenthe loading on preconcentration column is still on going, weanticipated the start of the gradient program in separationcolumn, and, in this way, when the mobile phase is switchedon the preconcentration column, the mobile phase had anhigher solvent percentage and thereby is able to quicklytransfer analytes onto the separation column with a focusingeffect (Table 1: “early gradient”). The optimum mobile phasecomposition at the switching time is determined by calcu-lating the composition when the first peak (PFBA) elutesin the chromatographic run obtained by direct injectionof the standard mixture without a preconcentration step.Improvements in the PFAA peak heights with respect tothe “unchanged gradient” were analogous to those obtainedby the “injection plug” technique and even better for thelonger chain PFCA (Figure 3(a)). Because of its simplicity, the“early gradient” was chosen for the rest of the optimizationprocedure.
3.1.2. Sample Volume. Sample volume effect was evaluatedcomparing the peak areas obtained by injecting 1 and 5mLof the highest standard mixture (200 ng/L). Proportionalitywas satisfactory (Figure 3(b)), with an average response ratioof 4.1 for PFSA and PFCA from6 to 12 carbon atoms, despite aslight peak broadening. Only PFBA and PFPeA did not showany proportional improvement in the response when the loopvolume increased, suggesting that the shorter homologuesin the perfluorocarboxylic acid series have smaller break-through volumes on the concentration column.
The loss in efficiency attributable to the on-line precon-centration step was evaluated by comparing the peak areasobtained in the on-line SPE (injection volume: 5mL) withthose obtained by direct injection (injection volume: 25 𝜇L)of the same analyte mass (100 pg). As shown in Figure 3(c)ratios of peak areas close to 1 (0.75–1.2) were obtained for all

Journal of Analytical Methods in Chemistry 7
4.0
3.5
3.0
2.5
2.0
1.5
1.0
0.5
2 4 6 8 10 12 14
2.0
1.5
1.0
0.5
0.0
Perfluorinated chain length
(PFC
A) p
eak
heig
ht ra
tio
(PFS
A) p
eak
heig
ht ra
tio
PFCA early gradientPFCA plug gradient
PFSA early gradientPFSA plug gradient
(a)
5
4
3
2
1
0
2 4 6 8 10 12 14
Perfluorinated chain length
Peak
area
ratio
(5m
L/1
mL)
PFCAPFSA
(b)
1.4
1.2
1.0
0.8
0.6
0.4
0.2
0.0
2 4 6 8 10 12 14
Peak
area
ratio
(o
n-lin
e SPE
/dire
ct in
ject
ion)
Perfluorinated chain length
PFCAPFSA
(c)
2 4 6 8 10 12 14
30
25
20
15
10
5
0
Peak
area
ratio
(aci
difie
d/no
t aci
difie
d)
Perfluorinated chain length
PFCAPFSA
(d)
Figure 3: Development of the on-line SPE method. (a) Effect of different elution gradients, “plug gradient” or “early gradient” comparedwith “unchanged gradient,” on the analyte peak height; injection of 5mL of acidified aqueous standard at 200 ng/L. (b) Effect of the samplevolume on the peak area; injection in “early gradient” mode of aqueous standard at 200 ng/L. (c) Extraction efficiency of the 5mL on-lineSPE injection volume; on-line SPE injection in “early gradient” mode of 5mL of aqueous standard at 200 ng/L and direct injection of 25𝜇L ofaqueous standard at 40 𝜇g/L. (d) Effect of acidification of the sample on the peak area; injection in “early gradient” mode of aqueous standardat 200 ng/L.
PFSA homologues and the PFCA with carbon chain lengthgreater than 6, indicating an efficient extraction for thosecompounds. Differently, the response of the more solublePFCA (PFBA and PFPeA) in the on-line SPE method wasmuch lower than that obtained by direct injection (0.1–0.2)because of their limited affinity for the stationary phase of thepreconcentration column.
3.1.3. Chemical Modification of the Sample before Injection.Since all target analytes are acid compounds, samples wereacidified to pH 3 by adding 50𝜇L of concentrated formicacid in order to improve their retention on the endcappedC18 phase of the preconcentration column. Acidification
significantly improved the peak areas of the less retained andmore soluble homologues (PFBA, PFPeA, PFHxA, and PFBS)whereas no effects were pointed out for the homologues witha longer carbon chain (Figure 3(d)). This can be explainedby the fact that the acidification suppresses the ionization ofthe PFCA, and thereby increases their affinity for the reversestationary phase of the preconcentration column.
The effect on the LC-MS/MS response for the PFAA wasalso examined as a function of the percentage of solvent(acetonitrile and methanol) modifier in the water samples.Addition of organic solvent (10%) to the sample before theinjection caused a decrease in the area response for shorterand longer chain perfluorocarboxylic homologues (peak area
8 Journal of Analytical Methods in Chemistry
Supp
ress
ion
(%)
Enha
cem
ent (
%) 90
60
30
0
−30
−60
−90
PFBA
PFPe
A
PFH
xA
PFH
pA
PFO
A
PFN
A
PFD
A
PFU
nA
PFD
oDA
PFBS
PFH
xS
PFO
S
TW1
TW2
TW3
RW1
RW2
RW3
RW4
(a)
Supp
ress
ion
(%)
Enha
cem
ent (
%) 90
60
30
0
−30
−60
−90
PFBA
PFPe
A
PFH
xA
PFH
pA
PFO
A
PFN
A
PFD
A
PFU
nA
PFD
oDA
PFBS
PFH
xS
PFO
S
TW1
TW2
TW3
RW1
RW2
RW3
RW4
(b)
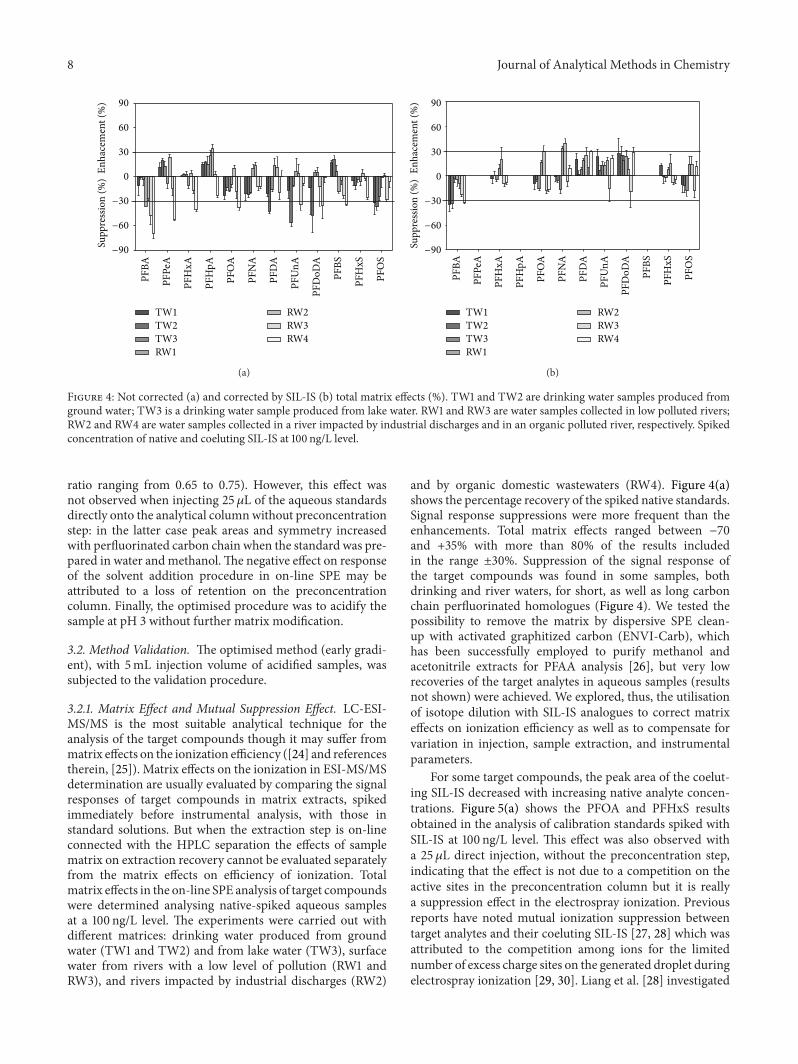
Figure 4: Not corrected (a) and corrected by SIL-IS (b) total matrix effects (%). TW1 and TW2 are drinking water samples produced fromground water; TW3 is a drinking water sample produced from lake water. RW1 and RW3 are water samples collected in low polluted rivers;RW2 and RW4 are water samples collected in a river impacted by industrial discharges and in an organic polluted river, respectively. Spikedconcentration of native and coeluting SIL-IS at 100 ng/L level.
ratio ranging from 0.65 to 0.75). However, this effect wasnot observed when injecting 25𝜇L of the aqueous standardsdirectly onto the analytical columnwithout preconcentrationstep: in the latter case peak areas and symmetry increasedwith perfluorinated carbon chain when the standard was pre-pared in water andmethanol.The negative effect on responseof the solvent addition procedure in on-line SPE may beattributed to a loss of retention on the preconcentrationcolumn. Finally, the optimised procedure was to acidify thesample at pH 3 without further matrix modification.
3.2. Method Validation. The optimised method (early gradi-ent), with 5mL injection volume of acidified samples, wassubjected to the validation procedure.
3.2.1. Matrix Effect and Mutual Suppression Effect. LC-ESI-MS/MS is the most suitable analytical technique for theanalysis of the target compounds though it may suffer frommatrix effects on the ionization efficiency ([24] and referencestherein, [25]). Matrix effects on the ionization in ESI-MS/MSdetermination are usually evaluated by comparing the signalresponses of target compounds in matrix extracts, spikedimmediately before instrumental analysis, with those instandard solutions. But when the extraction step is on-lineconnected with the HPLC separation the effects of samplematrix on extraction recovery cannot be evaluated separatelyfrom the matrix effects on efficiency of ionization. Totalmatrix effects in the on-line SPE analysis of target compoundswere determined analysing native-spiked aqueous samplesat a 100 ng/L level. The experiments were carried out withdifferent matrices: drinking water produced from groundwater (TW1 and TW2) and from lake water (TW3), surfacewater from rivers with a low level of pollution (RW1 andRW3), and rivers impacted by industrial discharges (RW2)
and by organic domestic wastewaters (RW4). Figure 4(a)shows the percentage recovery of the spiked native standards.Signal response suppressions were more frequent than theenhancements. Total matrix effects ranged between −70and +35% with more than 80% of the results includedin the range ±30%. Suppression of the signal response ofthe target compounds was found in some samples, bothdrinking and river waters, for short, as well as long carbonchain perfluorinated homologues (Figure 4). We tested thepossibility to remove the matrix by dispersive SPE clean-up with activated graphitized carbon (ENVI-Carb), whichhas been successfully employed to purify methanol andacetonitrile extracts for PFAA analysis [26], but very lowrecoveries of the target analytes in aqueous samples (resultsnot shown) were achieved. We explored, thus, the utilisationof isotope dilution with SIL-IS analogues to correct matrixeffects on ionization efficiency as well as to compensate forvariation in injection, sample extraction, and instrumentalparameters.
For some target compounds, the peak area of the coelut-ing SIL-IS decreased with increasing native analyte concen-trations. Figure 5(a) shows the PFOA and PFHxS resultsobtained in the analysis of calibration standards spiked withSIL-IS at 100 ng/L level. This effect was also observed witha 25 𝜇L direct injection, without the preconcentration step,indicating that the effect is not due to a competition on theactive sites in the preconcentration column but it is reallya suppression effect in the electrospray ionization. Previousreports have noted mutual ionization suppression betweentarget analytes and their coeluting SIL-IS [27, 28] which wasattributed to the competition among ions for the limitednumber of excess charge sites on the generated droplet duringelectrospray ionization [29, 30]. Liang et al. [28] investigated

Journal of Analytical Methods in Chemistry 9
13C 4
-PFO
A p
eak
area
18O2-P
FHxS
pea
k ar
ea
Native concentration (ng/L)
3.5
3.0
2.5
2.0
1.5
1.0
1.0
0.5
×106
×105
0
0
50 100 150 200 250
1.6
1.4
1.2
0.8
0.6
0.4
13C4-PFOA18O2-PFHxS
(a)
Perfluorinated chain length
SIL-
IS p
eak
area
s sup
pres
sion
(%)
60
50
40
30
20
10
0
2 4 6 8 10 12 14
PFCAPFSA
(b)
Figure 5: Effect of native concentration on coeluting SIL-IS peak area. (a) Injection in “early gradient” mode of 5mL of acidified aqueousstandards spiked with 100 ng/L of SIL-IS. (b) Extent of suppression of SIL-IS peak area at 100 ng/L was calculated as SIL-IS peak area of 0 ng/Lnative standard solution minus SIL-IS peak area of 200 ng/L native standard solution/SIL-IS peak area of 0 ng/L native standard solution X100.
this phenomenon for nine drugs: generally, the extent ofsuppression in each drug-SIL-IS pair was concentration-dependent and was correlated with the hydrophobicity of thecompounds.
Maximum suppression was determined for each perfluo-rinated SIL-IS at 200 ng/L native concentration (Figure 5(b)).The suppression of PFCA decreases with the increase of thenumber of carbon chain length, but the suppression of PFSAis lower for the shorter chain homologues. Quantitation,however, was not affected by the variation in the peak areaof the internal standard. Mutual suppression effects of targetanalytes and SIL-IS are equal and this ensures good linearityof peak area ratio versus analyte concentrations [27]. Resultsof Figure 4(a) were recalculated using SIL-IS calibrations(Figure 4(b)). The scattering of the results was significantlyreduced: total matrix effects ranged between −34 and +39%.SIL-IS successfully corrected the effects on the ionization aswell as any eventual losses during the on-line extraction step.
3.2.2. Linearity and Sensitivity. The linearity of the instru-mental response was assessed by injecting five levels of aque-ous standards with native analyte concentrations spanningtwo orders of magnitude (1, 5, 10, 50, and 100 ng/L forPFUnDAandPFDoDAand 2, 10, 20, 100, and 200 ng/L for theremaining compounds) spiked with SIL-IS at 100 ng/L level.Working calibration curves presented acceptable linearityrange and coefficients of determination (𝑅2) higher than0.95 for all target compounds (Table 3). Deviations from thelinearity occurred at the highest concentrationswheremutualsuppression with SIL-IS is likely to occur (see Section 3.2.1).Nevertheless, most of the measured concentrations fell intothe linear part of the calibration curves.
Limits of detection (LOD) and limits of quantification(LOQ) were estimated as threefold and tenfold, respectively,
the standard deviation of the aqueous standard solutions,prepared in real drinking waters, at the lowest injectedconcentrations (1 and 2 ng/L), according to the ISO 6107-2:2006 standard. LODs and LOQs ranged from 0.2 to 5.0 ng/Land from 1 to 20 ng/L, respectively (Table 3). It is importantto emphasize that these values refer to the whole analyticalprocedure, incorporating mutual ionization suppression andrecovery losses, while the detection limits estimated fromsolvent calibration curves usually underestimate the truevalues.
3.2.3. Accuracy. Method precision has been evaluated by 3replicate injections of standards prepared in real drinkingwaters in the 1–100 ng/L range for PFUnDA and PFDoDAand 2–200 ng/L range for the other compounds on 4 noncon-secutive days (Table 3). Repeatabilities (intraday precision)and reproducibilities (interday precision) were under 20%for carboxylic acid homologues from 7 to 9 carbon atomswhile PFBS, PFHxS, PFOS, PFBA, PFPeA, PFHxA, PFDA,PFUnDA, and PFDoDA showed RSDs from 30 to 65% atthe lower limits of the explored range which was very closeto their detection limits. Trueness is expressed as recoveriesdetermined by analysing spiked drinking and river waterssince no certified referencematerials were available for PFAAin these matrices. The recoveries were between 76 and 134%for PFCA and between 87 and 115% for PFSA (Table 3).
4. Applications to Real Samples
Thevalidated on-line SPE/LC-MS/MSmethodology has beenapplied in awide survey of the PFAA concentrations in Italiansurface and drinking waters with the aim to get a reliablepicture of PFAA contamination and sources in Italian waters.The low volumes needed for the on-line extraction allowed

10 Journal of Analytical Methods in Chemistry
Table 3: Validation parameters (injection in “early gradient” mode of 5mL of acidified standards and samples).
Linearitya Precision (RSD%)b Trueness (%)c Sensitivity (ng/L)(ng/L) 𝑅
2 Intraday Interday TW RW LOD LOQPFBA 2–200 0.955 7–27 10–33 76 83 5.0 20PFPeA∗ 2–200 0.962 10–32 10–28 115 88 2.0 4PFHxA 2–200 0.969 2–8 8–33 98 103 0.2 1PFHpA∗ 2–200 0.970 2–9 6–14 116 111 0.2 5PFOA 2–200 0.963 1–13 8–12 91 103 0.5 3PFNA 2–200 0.960 4–12 10–16 92 119 0.5 1PFDA 2–200 0.985 10–20 16–39 110 119 0.5 1PFUnDA 1–100 0.972 10–31 24–53 119 109 0.5 1PFDoDA 1–100 0.971 10–35 30–65 134 112 1.0 2PFBS∗ 2–200 0.990 6–28 11–44 115 80 1.0 10PFHxS 2–200 0.970 4–13 10–25 103 103 5.0 20PFOS 2–200 0.989 8–49 14–48 87 105 2.5 10∗Values not corrected by SIL-IS; alinearity was calculated with the analysis of five levels of aqueous standard solutions; bprecision is calculated by injectingstandards in the 1–100 ng/L range for PFUnDA and PFDoDA and 2–200 ng/L range for the other target compounds (intraday: 𝑛 = 3; interday: 𝑛 = 12); ctruenessis expressed as recoveries determined by analysing native-spiked tap waters (TW) and river waters (RW) at 100 ng/L level.
us to minimise the duration of the sampling campaigns,avoid the need for a large refrigeration system during thetravel, and thus minimise the risk of sample degradation andcontamination during the transport to the laboratory.
Data summarized in Table 4 showed that the method canbe applied to the monitoring of different typologies of waters,including complex matrices, such as saline waters of coastallagoons and discharges from industrial and urbanwastewatertreatment plants (WWTPs).
Results of monitoring of Italian surface waters have beenrecently discussed by Valsecchi et al. [31].
Monitoring data of rivers in Northern Italy, whichincludes rivers in the basins of river Po, Adige, and Brentawhich discharges into the Adriatic Sea, show that the highestconcentrations weremeasured for PFOA and PFBS, while thehighest detection frequencies were found for PFOA, PFHxA,and PFBS.The highest concentrations were measured down-stream the discharges of perfluorinated compounds andpolymers factories, but the detection frequency suggests thatthe same compounds were diffused in many rivers of theexplored territories.
Rivers in Central Italy (belonging to the basins of Tevereand Arno rivers) were less impacted and the only substancesmeasured at concentrations >100 ng/L were PFOA and PFBS.
PFHxA, PFOA, and PFOS were detected at the highestdetection frequency in groundwaters used for drinkingwaterabstraction (Table 4) and these findings reflected diffuse andhistorical pollution coming both from urban pressure andindustrial pressure on the territory. In fact, the highest con-centrations were measured for PFOS (up to 121 ng/L) whichwas much diffused since the 80s, but it is currently subject torestrictions in use [9]. Nevertheless, it should be underlinedthat all measured concentrations were significantly lowerthan the Provisional Health Advisories of 400 ng/L and200 ng/L proposed by US EPA, respectively, for PFOA andPFOS in drinking waters [8], showing a very limited risk forthe final consumer.
The validated on-line SPE-UHPLC-LC/MS/MS methodhas been successfully used also for determining PFAA indifficult matrices. We were able to determine low concen-trations of PFAA in transitional waters, characterised by arange of salinity from 23 to 31‰, collected in the lagoonsof Venice and in the Po Delta. We also analysed effluentsfrom industrial and urbanWWTPs and, after the appropriatedilution, concentrations up to 4.8mg/L of PFBS and 0.7–0.8mg/L for PFOAandPFHxAweremeasured. Sampleswereinjected in the system after centrifugation and dilution andmatrix effects were minimized by using internal isotopicallylabelled standards.
5. Conclusions
The use of on-line SPE coupled with UHPLC, with 2 𝜇m par-ticle size columns, made the development of faster method-ology by reducing the analysis time and thus increasing thesample throughput possible. However, reduction of the totalanalysis time originating from the development of ultrafastseparation and the reduced sample treatment may introducenew analytical challenges during method development, suchas increase of ionization matrix effects and loss of chromato-graphic efficiency.
In this work, we present the development and validationof a rapid analytical method for the simultaneous deter-mination of compounds with different polarities and otherphysicochemical properties such as PFCA and PFSA.Manualsample preparationwas reduced to sample centrifugation andacidification, thus eliminating several procedural errors andcontamination and significantly reducing costs and analyticaltime, which was only about 20min from extraction toanalysis.
Method development was carried out after havingunderstood the factors that can negatively impact the on-line SPE methodology. Optimization of elution gradientand acidification of the aqueous samples allowed reliable

Journal of Analytical Methods in Chemistry 11
Table4:Summaryof
PFASconcentrations
inIta
liansurfa
ceandgrou
ndwaters.
Samples
Mon
itorin
gperio
dPF
BAPF
PeA
PFHxA
PFHpA
PFOA
PFNA
PFDA
PFUnD
APF
DoD
APF
BSPF
HxS
PFOS
Riversin
NorthernIta
ly2010–2013
(num
bero
fsam
ples
=222)
Min
(ng/L)
<LO
D<LO
D<LO
D<LO
D<LO
D<LO
D<LO
D<LO
D<LO
D<LO
D<LO
D<LO
DMedian(ng/L)
<LO
D<LO
D4
228
<LO
D<LO
D<LO
D<LO
D3
<LO
D3
Max
(ng/L)
411
974
892
946
6.480
174
9958
194.328
36218
%po
sitives
ample
2848
7564
8846
4325
1665
455
Riversin
CentralIta
ly2011–
2013
(num
bero
fsam
ples
=26)
Min
(ng/L)
<LO
D<LO
D<LO
D<LO
D<LO
D<LO
D<LO
D<LO
D<LO
D<LO
D<LO
D<LO
DMedian(ng/L)
16<LO
D3
214
2<LO
D<LO
D<LO
D<LO
D<LO
D3
Max
(ng/L)
7915
4029
222
3051
114
335
<LO
D34
%po
sitives
ample
7331
5869
7369
3512
842
062
Transitionalw
aters
2011–
2013
(num
bero
fsam
ples
=14)
Min
(ng/L)
<LO
D<LO
D1
<LO
D1<LO
D<LO
D<LO
D<LO
D1
<LO
D<LO
DMedian(ng/L)
<LO
D2
2<LO
D5<LO
D1
12
5<LO
D4
Max
(ng/L)
318
41
19<LO
D1
13
10<LO
D9
%po
sitives
ample
1464
100
7100
064
7993
100
057
WWTP
effluents
2011–
2013
(num
bero
fsam
ples
=18)
Min
(ng/L)
<LO
D<LO
D<LO
D1
3<LO
D<LO
D<LO
D<LO
D<LO
D<LO
D<LO
DMedian(ng/L)
<LO
D<LO
D38
2278
1614
4<LO
D<LO
D<LO
D<LO
DMax
(ng/L)
<LO
D582.881
811.4
31171.2
31712.877
1.080
1.414
1.128
44.833.734<LO
D18.688
%po
sitives
ample
044
72100
100
9494
7839
170
28Groun
dwaters
2010–2012
(num
bero
fsam
ples
=77)
Min
(ng/L)
<LO
D<LO
D<LO
D<LO
D<LO
D<LO
D<LO
D<LO
D<LO
D<LO
D<LO
D<LO
DMedian(ng/L)
<LO
D<LO
D0.3<LO
D<LO
D<LO
D<LO
D<LO
D<LO
D<LO
D<LO
D<LO
DMax
(ng/L)
2022
3731
5313
169
1329
45121
%po
sitives
ample
6729
4840
4717
1612
1638
2245
12 Journal of Analytical Methods in Chemistry
chromatographic efficiencies for all compounds, includingshorter chain perfluorocarboxylic acids such as PFBA andPFPeA. Mutual ionization suppression between target per-fluorinated analytes and their coeluting SIL-IS was reportedfor the first time for perfluorinated compounds. Generally,the extent of suppression in each target compound-SIL-ISpair was correlated with the carbon chain length. Validatedon-line SPE-LC-MS/MS method has been applied in a widesurvey of the concentrations of PFAA in Italian surface anddrinkingwaters.Themethod is able tomeasure contaminantsat the environmental levels in urbanized and industrializedareas and attain most of the adopted quality standards exceptfor European EQS for PFOS (0.65 ng/L) which is considereda challenging limit for every LC-MS analytical method.
Conflict of Interests
The authors declare that there is no conflict of interestsregarding the publication of this paper.
Acknowledgments
The present work has been funded by the Italian Ministryfor Environment and Territory and Sea with the project“Valutazione del RischioAmbientale e Sanitario associato allacontaminazione da sostanze perfluoro-alchiliche (PFAS) nelBacino del Po e nei principali bacini fluviali italiani”. Theauthors warmly thank Gaetano Viviano (IRSA-CNR) for thefigure of the river basins and Federico Guidugli (ThermoFisher Scientific) for the EQuan figure.
References
[1] J. P. Giesy and K. Kannan, “Global distribution of perflu-orooctane sulfonate in wildlife,” Environmental Science andTechnology, vol. 35, no. 7, pp. 1339–1342, 2001.
[2] J. P. Giesy and K. Kannan, “Perfluorochemical surfactants in theenvironment,” Environmental Science and Technology, vol. 36,no. 7, pp. 146A–152A, 2002.
[3] K. Kannan, “Perfluoroalkyl and polyfluoroalkyl substances:current and future perspectives,” Environ. Chem, vol. 8, no. 4,pp. 333–338, 2011.
[4] A. B. Lindstrom,M. J. Strynar, and E. L. Libelo, “Polyfluorinatedcompounds: past, present, and future,” Environmental Scienceand Technology, vol. 45, no. 19, pp. 7954–7961, 2011.
[5] K. Prevedouros, I. T. Cousins, R. C. Buck, and S. H. Korzen-iowski, “Sources, fate and transport of perfluorocarboxylates,”Environmental Science and Technology, vol. 40, no. 1, pp. 32–44,2006.
[6] R. C. Buck, J. Franklin, U. Berger et al., “Perfluoroalkyl andpolyfluoroalkyl substances in the environment: terminology,classification, and origins,” Integrated Environmental Assessmentand Management, vol. 7, no. 4, pp. 513–541, 2011.
[7] European Commission, “Directive 2013/39/EU of the EuropeanParliament and of the Council of 12 August 2013 amendingDirectives 2000/60/EC and 2008/105/EC as regards prioritysubstances in the field of water policy,” Official Journal of theEuropean Union, 24.8, L 226/1, 2013.
[8] US Environmental Protection Agency, Provisional Health Advi-sories for Perfluorooctanoic Acid (PFOA) and Perfluorooc-tane Sulfonate (PFOS), US Environmental Protection Agency,2009, http://water.epa.gov/action/advisories/drinking/upload/2009 01 15 criteria drinking pha-PFOA PFOS.pdf.
[9] European Commission, “Directive 2006/122/EC of the Euro-pean Parliament and of the Council of 12 December 2006amending for the 30th time Council directive 76/769/EEC onthe approximation of the laws, regulations and administrativeprovisions of the Member States relating to restrictions onthe marketing and use of certain dangerous substances andpreparations (perfluorooctane sulfonates),” Official Journal ofthe European Union, 27.12, L 372/32, 2006.
[10] US Environmental Protection Agency, PFOA Stewardship Pro-gram, 2006, http://www.epa.gov/opptintr/pfoa/pubs/steward-ship/pfoastewardshipbasics.html.
[11] A. A. Jensen, P. B. Poulsen, and R. Bossi, Survey and Environ-mental/Health Assessment of Fluorinated Substances in Impreg-nated Consumer Products and Impregnating Agents, no. 99,Danish Environmental Protection Agency, 2008.
[12] US Environmental Protection Agency, Environmental andHealth Assessment of Perfluoro Sulfonic Acid and Its Salts,AR:226-602, 2003.
[13] G. Ding and W. J. G. M. Peijnenburg, “Physicochemicalproperties and aquatic toxicity of poly- and perfluorinatedcompounds,” Critical Reviews in Environmental Science andTechnology, vol. 43, no. 6, pp. 598–678, 2013.
[14] A. Jahnke and U. Berger, “Trace analysis of per- and polyfluo-rinated alkyl substances in various matrices—how do currentmethods perform?” Journal of Chromatography A, vol. 1216, no.3, pp. 410–421, 2009.
[15] M. Petrovic, M. Farre, M. L. de Alda et al., “Recent trendsin the liquid chromatography-mass spectrometry analysis oforganic contaminants in environmental samples,” Journal ofChromatography A, vol. 1217, no. 25, pp. 4004–4017, 2010.
[16] O. Nunez, H. Gallart-Ayala, C. P. B. Martins, and P. Lucci, “Newtrends in fast liquid chromatography for food and environmen-tal analysis,” Journal of Chromatography A, vol. 1228, pp. 298–323, 2012.
[17] M. Takino, S. Daishima, and T. Nakahara, “Determination ofperfluorooctane sulfonate in river water by liquid chromatogra-phy/atmospheric pressure photoionization mass spectrometryby automated on-line extraction using turbulent flow chro-matography,” Rapid Communications in Mass Spectrometry, vol.17, no. 5, pp. 383–390, 2003.
[18] S. R. Wilson, H. Malerød, A. Holm, P. Molander, E. Lundanes,and T. Greibrokk, “On-line SPE-nano-LC-nanospray-MS forrapid and sensitive determination of perfluorooctanoic acid andperfluorooctane sulfonate in river water,” Journal of Chromato-graphic Science, vol. 45, no. 3, pp. 146–152, 2007.
[19] F. Gosetti, U. Chiuminatto, D. Zampieri et al., “Determinationof perfluorochemicals in biological, environmental and foodsamples by an automated on-line solid phase extraction ultrahigh performance liquid chromatography tandem mass spec-trometry method,” Journal of Chromatography A, vol. 1217, no.50, pp. 7864–7872, 2010.
[20] R. Enevoldsen and R. K. Juhler, “Perfluorinated compounds(PFCs) in groundwater and aqueous soil extracts: using inlineSPE-LC-MS/MS for screening and sorption characterisation ofperfluorooctane sulphonate and related compounds,”Analyticaland Bioanalytical Chemistry, vol. 398, no. 3, pp. 1161–1172, 2010.

Journal of Analytical Methods in Chemistry 13
[21] M. Llorca, M. Farre, Y. Pico, J. Muller, T. P. Knepper, and D.Barcelo, “Analysis of perfluoroalkyl substances in waters fromGermany and Spain,” Science of the Total Environment, vol. 431,pp. 139–150, 2012.
[22] D. Gode, M. M. Martin, F. Steiner, C. G. Huber, and D. A.Volmer, “Rapid narrow band elution for on-line SPE using anovel solvent plug injection technique,” Analytical and Bioan-alytical Chemistry, vol. 404, no. 2, pp. 433–445, 2012.
[23] D. R. Rodier and J. W. Birks, “Dual injector solvent elutionand focussing technique for the on-line analysis of solid-phaseextraction cartridges in HPLC,” Chromatographia, vol. 39, no.1-2, pp. 45–50, 1994.
[24] S. A. Tittlemier and E. Braekevelt, “Analysis of polyfluorinatedcompounds in foods,” Analytical and Bioanalytical Chemistry,vol. 399, no. 1, pp. 221–227, 2011.
[25] J. W. Martin, K. Kannan, U. Berger et al., “Analytical challengeshamper perfluoroalkyl research,” Environmental Science andTechnology, vol. 38, no. 13, pp. 248A–255A, 2004.
[26] S. Valsecchi, M. Rusconi, and S. Polesello, “Determination ofperfluorinated compounds in aquatic organisms: a review,”Analytical and Bioanalytical Chemistry, vol. 405, no. 1, pp. 143–157, 2013.
[27] L. E. Sojo, G. Lum, and P. Chee, “Internal standard signalsuppression by co-eluting analyte in isotope dilution LC-ESI-MS,” Analyst, vol. 128, no. 1, pp. 51–54, 2003.
[28] H. R. Liang, R. L. Foltz, M. Meng, and P. Bennett, “Ionizationenhancement in atmospheric pressure chemical ionization andsuppression in electrospray ionization between target drugs andstable-isotope-labeled internal standards in quantitative liquidchromatography/tandemmass spectrometry,”Rapid Communi-cations inMass Spectrometry, vol. 17, no. 24, pp. 2815–2821, 2003.
[29] C. G. Enke, “A predictive model for matrix and analyte effectsin electrospray ionization of singly-charged ionic analytes,”Analytical Chemistry, vol. 69, no. 23, pp. 4885–4893, 1997.
[30] N. B. Cech and C. G. Enke, “Effect of affinity for dropletsurfaces on the fraction of analyte molecules charged duringelectrospray droplet fission,” Analytical Chemistry, vol. 73, no.19, pp. 4632–4639, 2001.
[31] S. Valsecchi, M. Rusconi, M. Mazzoni et al., “Occurrenceand sources of perfluoroalkyl acids in Italian river basins,”Chemosphere, 2014.

Submit your manuscripts athttp://www.hindawi.com
Hindawi Publishing Corporationhttp://www.hindawi.com Volume 2014
Inorganic ChemistryInternational Journal of
Hindawi Publishing Corporation http://www.hindawi.com Volume 2014
International Journal ofPhotoenergy
Hindawi Publishing Corporationhttp://www.hindawi.com Volume 2014
Carbohydrate Chemistry
International Journal of
Hindawi Publishing Corporationhttp://www.hindawi.com Volume 2014
Journal of
Chemistry
Hindawi Publishing Corporationhttp://www.hindawi.com Volume 2014
Advances in
Physical Chemistry
Hindawi Publishing Corporationhttp://www.hindawi.com
Analytical Methods in Chemistry
Journal of
Volume 2014
Bioinorganic Chemistry and ApplicationsHindawi Publishing Corporationhttp://www.hindawi.com Volume 2014
SpectroscopyInternational Journal of
Hindawi Publishing Corporationhttp://www.hindawi.com Volume 2014
The Scientific World JournalHindawi Publishing Corporation http://www.hindawi.com Volume 2014
Medicinal ChemistryInternational Journal of
Hindawi Publishing Corporationhttp://www.hindawi.com Volume 2014
Chromatography Research International
Hindawi Publishing Corporationhttp://www.hindawi.com Volume 2014
Applied ChemistryJournal of
Hindawi Publishing Corporationhttp://www.hindawi.com Volume 2014
Hindawi Publishing Corporationhttp://www.hindawi.com Volume 2014
Theoretical ChemistryJournal of
Hindawi Publishing Corporationhttp://www.hindawi.com Volume 2014
Journal of
Spectroscopy
Analytical ChemistryInternational Journal of
Hindawi Publishing Corporationhttp://www.hindawi.com Volume 2014
Journal of
Hindawi Publishing Corporationhttp://www.hindawi.com Volume 2014
Quantum Chemistry
Hindawi Publishing Corporationhttp://www.hindawi.com Volume 2014
Organic Chemistry International
ElectrochemistryInternational Journal of
Hindawi Publishing Corporation http://www.hindawi.com Volume 2014
Hindawi Publishing Corporationhttp://www.hindawi.com Volume 2014
CatalystsJournal of