research article - astonjournals - chemistry, business...
TRANSCRIPT

RESEARCH ARTICLE
Rapid and Sensitive Spectrophotometric Measurement
of Non-Specific Beta Blocker Propranolol Hydrochloride Using
Three Sulphonphthalein Dyes In Pure Form, Pharmaceuticals and
Human Urine
Chemical Sciences
Journal, Vol. 2012:
CSJ-80
http://astonjournals.com/csj
1 Chemical Sciences Journal, Vol. 2012: CSJ-80
Rapid and Sensitive Spectrophotometric Measurement of Non-Specific Beta Blocker Propranolol Hydrochloride Using Three
Sulphonphthalein Dyes In Pure Form, Pharmaceuticals and Human Urine
KN Prashanth, K Basavaiah*, MS Raghu
Department of Chemistry, University of Mysore, Mysore, Karnataka, India.
*Correspondence to: Kanakapura Basavaiah, [email protected]
Accepted: Nov 13, 2012; Published: Nov 24, 2012
Abstract Three sensitive, selective, rapid and easily reproducible spectrophotometric methods (A-C) have been developed for the determination of propranolol hydrochloride (PPH) as a hydrochloride free base propranolol (PPL) in bulk sample and in its dosage forms. These methods are based on ion-pair formation between propranolol as a hydrochloride and free base and three acidic (sulphonphthalein) dyes; namely bromothymol blue (BTB), bromocresol green (BCG) and bromocresol purple (BCP) which induces an instantaneous bathochromic shift of the maximum in the drug spectrum. The colored products are measured at 420 nm (PPL-BTB complex and PPL-BCP complex) and 425 nm (PPL-BCG complex). The reactions were extremely rapid at room temperature and the absorbance values remained constant for 90 min (method B), and over 24 hrs (method A and C). Conformity to Beer’s law in the range 0.4-7.0 µg ml
-1for methods A and B and 0.5-8.4 µg ml
-1for method C enabled the assay of
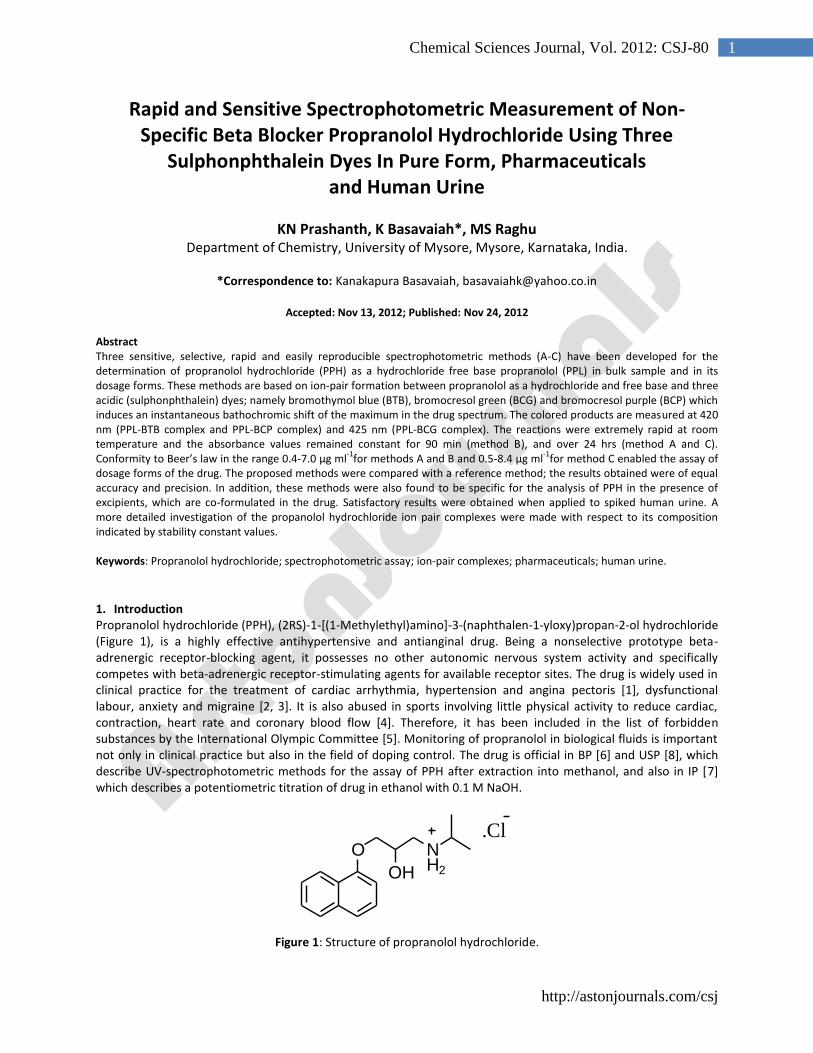
dosage forms of the drug. The proposed methods were compared with a reference method; the results obtained were of equal accuracy and precision. In addition, these methods were also found to be specific for the analysis of PPH in the presence of excipients, which are co-formulated in the drug. Satisfactory results were obtained when applied to spiked human urine. A more detailed investigation of the propanolol hydrochloride ion pair complexes were made with respect to its composition indicated by stability constant values. Keywords: Propranolol hydrochloride; spectrophotometric assay; ion-pair complexes; pharmaceuticals; human urine. 1. Introduction Propranolol hydrochloride (PPH), (2RS)-1-[(1-Methylethyl)amino]-3-(naphthalen-1-yloxy)propan-2-ol hydrochloride (Figure 1), is a highly effective antihypertensive and antianginal drug. Being a nonselective prototype beta-adrenergic receptor-blocking agent, it possesses no other autonomic nervous system activity and specifically competes with beta-adrenergic receptor-stimulating agents for available receptor sites. The drug is widely used in clinical practice for the treatment of cardiac arrhythmia, hypertension and angina pectoris [1], dysfunctional labour, anxiety and migraine [2, 3]. It is also abused in sports involving little physical activity to reduce cardiac, contraction, heart rate and coronary blood flow [4]. Therefore, it has been included in the list of forbidden substances by the International Olympic Committee [5]. Monitoring of propranolol in biological fluids is important not only in clinical practice but also in the field of doping control. The drug is official in BP [6] and USP [8], which describe UV-spectrophotometric methods for the assay of PPH after extraction into methanol, and also in IP [7]
which describes a potentiometric titration of drug in ethanol with 0.1 M NaOH.
O NH2OH
.Cl
Figure 1: Structure of propranolol hydrochloride.

http://astonjournals.com/csj
2 Research Article
Due to its therapeutical and pharmacological relevance, several methods have been reported for PPH and include thin layer chromatography [9], UV-spectrophotometry [10-13], fluorimetry [14], voltammetry [15] and chemiluminometry [16,17]. These techniques involve an expensive experimental set up and are not always easily accessible. One titrimetric [18] and a few visible spectrophotometric [19-34] methods have also been reported.
Visible spectrophotometry, because of its simplicity and cost-effectiveness, sensitivity and selectivity and fair accuracy and precision is routinely used in many industrial quality control laboratories. Several visible spectrophotometric methods based on different reaction schemes are found in the literature for PPH.
A method for the assay of PPH using diazotized 4-amino-3,5-dinitrobenzoic acid (ADBA) as the chromogenic derivatizing reagent reported by Idowu et al. [19]. Bhandari et al. [20] reported a method based on the reaction of PPH with 1-chloro-2,4-dinitrobenzene, forming a complex, which absorb maximally at 314.6 nm. In a method reported by Golcu et al. [21], PPH was reacted with copper (II) or cobalt (II) and the coloured complexes were measured at 548 or 614 nm. El-Ries et al. [22] proposed two spectrophotometric methods based on the charge-transfer complex reaction of PPH with π-acceptors, tetracyanoethylene (TCNE), or chloranilic acid (CLA) to give highly coloured complex species which are quantitated spectrophotometrically, absorbing maximally at 415 or 510 nm. Salem [23] used similar reactions for the spectrophotometric determination of PPH which are based on the reaction of PPH as n-electron donor with the sigma-acceptor iodine and π-acceptors such as 7,7,8,8-tetracyaniquinodimethane, 2,3-dichloro-5,6-dicyano-1,4-benzoquinone, tetracyanoethylene, bromanil and chloranil. The resulting CT complexes were measured at 365, 840, 420, 470, 450 and 440 nm, respectively. Hussain et al. [24] reported a method based on the redox reaction of PPH with cerium (IV) in H2SO4 medium on heating and the developed color was measured at 478 nm. El-Emam et al. [25] reported a method based on oxidative-coupling reaction in which a mixture of an acidic solution of MBTH and PPH was treated with cerium (IV) and the resulting orange colour peaking at 496 nm was measured.
In addition to direct methods described above, several indirect methods based on a variety of reaction chemistries are also found in the literature. A spectrophotometric method proposed by Basavaiah et al. [26] makes use of the reaction between chloride of PPH and mercury(II) thiocyanate in which thiocyanate ions displaced complexed with iron(III) for subsequent measurement at 460 nm. In a spectrophotometric method reported by Basavaiah et al. [27], the unreacted cerium(IV) sulphate was treated with iron(II) and the iron(III) was complexed with thiocyanate and measured at 480 nm. Similar method reported by Basavaiah et al. [28] is based on the oxidation of PPH by a known excess of CAT in acid medium followed by determination of the unreacted oxidant by reacting with metal and sulphanilic acid. The same authors reported another spectrophotometric method in which the unreacted oxidant metavanadate was determined by reacting with diphenylamine, and the absorbance measured at 560 nm [29]. A method reported by Basavaiah et al. [30] involves the addition of a known excess of bromate-bromide mixture to an acidified solution of the drug and determination of the unreacted bromine by its bleaching action on methyl orange acid color and the absorbance measured at 510 nm. El-Didamony [31] reported three methods based on oxidation-bromination reaction of PPH by bromine, generated in situ by the action of acid on a bromate-bromide mixture, followed by determination of unreacted bromine by three different reaction schemes. In one method the residual bromine was determined by indigo carmine dye. In the other two methods, the residual bromine was determined by treating with a known excess of iron(II) and the resulting iron(III) was complexed with thiocyanate or the residual iron(II) with 1,10-phenanthroline. Gowda et al. [32] reported two procedures, similar to the above, in which PPH was oxidized by a known excess of NBS in H2SO4 medium followed by the reaction of unreacted oxidant with promethazine hydrochloride (PH) or methdilazine hydrochloride (MDH) to yield red coloured products with absorption maximum at 515 or 513 nm. Two methods described by Al-Attas et al. [33] based on the oxidation of PPH by a known excess of N-bromosuccinimide (NBS), in an acidic medium followed by the reaction of excess oxidant with amaranth dye. Sastry et al. [34] devised one more method by treating PPH with a known excess of NBS in HCl medium, and after 10 min, the unreacted oxidant was determined by reacting with celestine blue and measuring the absorbance at 540 nm. The above reported methods suffer from disadvantages like heating step, slow reaction, extraction step, multi step reactions, tedious control of experimental variables and less sensitivity. The present investigation involves the development of accurate, reproducible, and adequately sensitive three spectrophotometric methods based on the formation of ion- pair complexes between hydrochloride free propranolol (PPL) with sulphonphthalein dyes namely bromothymol blue (BTB), bromocresol green (BCG) and bromocresol purple (BCP). The proposed methods were applied to the determination of PPH in pharmaceutical formulation and in human urine. No interference was observed in the assay of PPH from common excipients found in pharmaceutical

http://astonjournals.com/csj
3 Chemical Sciences Journal, Vol. 2012: CSJ-80
formulation and other biological materials present in urine. These methods are validated by the statistical data. These methods provide economic procedures, less time consuming, and more sensitive compared with other reported spectrophotometric methods (Table 1). The proposed methods are simple and suitable for routine determination of PPH in quality control laboratories.
Table 1: Comparison of the proposed and the existing visible spectrophotometric methods.
2. Methods 2.1 Instrument All the absorbance measurements were made using a Systronics model 106 digital spectrophotometer provided with 1cm matched quartz cells.
Reagent/s λmax, nm
Beer’s law range, µg ml
-1
(ε in l mol-1
cm-1
)
Remarks Ref.
4-amino-3,5-dinitrobenzoic acid
470 1.0-8.0 Heating required 19
1-chloro-2,4-dinitrobenzene 314.6 - - 20
Copper(II) or Cobalt(II) 548/614 2x10⁻⁵
-1×10⁻²
M - 21
Tetracyanoethylene, chloranilic acid
415 510
- Use of large quantity of organic solvents 22
σ and π-acceptors
-
4-120
Use large quantity of organic solvents; less sensitive
23
Cerium(IV) 478 15-350 Involves boiling for 25 min; less sensitive 24
Cerium(IV)-MBTH 496 1-10 Uses an expensive chemical 25
Mercury(II) thiocyanate-iron(III)
460 10-50 (2.63×10
3)
- 26
Cerium (IV)-iron (II) sulphate-thiacyanate
480 0.0-5.0
(3.6×10⁴)
Multi-step reaction 27
Chloramine-T-metol and sulphanilic acid
520 0.0-3.0
(7.1×10³)
Less sensitive, multi step reaction, critical pH. 28
Sodium metavanadate-diphenylamine
560 0.0-4.0 (5.33×10
4)
Multi-step reaction 29
Bromate-bromide-methyl orange
510 0.5-3.5
(6.66×10⁴)
Multi-step reaction 30
Bromate-bromide a)Indigo carmine
b)Fe(III)+thiocyanate
c)Fe(III)+1,10-phenanthroline
610
480
510
1.0-13.0
4.0-12.0
2.0-9.0
Multi-step reaction 31
a)NBS-PH
b)NBS-MDH
515
513
0.5-12.5 (1.36x10
4)
0.3-16.0 (2.55x10
4)
Multi-step reaction
32
a)N-bromosuccinimide- amaranth
0.2-6.4 Multi-step reaction 33
NBS-Celestine blue 540 0.4-3.0 Multi-step reaction 34
a) Bromo thymol blue (BTB)
b) Bromo cresol green (BCG)
c) Bromo cresol purple (BCP)
420
425
420
0.4-7.0 (ε =3.55×10
4)
0.4-7.0 (ε =3.12×10
4)
0.48-8.4 (ε =2.94×10
4)
Simple, rapid, sensitive, selective and no heating step. Use of single reagent and no
extraction step involved.
Proposed methods
http://astonjournals.com/csj
4 Research Article
2.2 Materials Pharmaceutical grade propranolol hydrochloride (PPH) was received from Cipla India Ltd., Mumbai, India, as a gift and used as received. The following formulations were obtained from commercial sources and subjected to analysis: Monoprolol-20 (Cosmo Life Sciences Ltd., India), Ciplar – 40 (Cipla Ltd., India) and Betacap-40 from (Sun Pharma Ltd., India). 2.3 Reagents and chemicals All the reagents and solvents used were of analytical-reagent grade. Bromothymol blue (BTB), bromocresol green (BCG) and bromocresol purple (BCP) (all from Loba Chemie Ltd., Mumbai, India) solutions were prepared daily as 0.1% BTB and BCP and 0.05% BCG in dichloromethane. 2.4 Standard stock solution of PPL Pure propranolol hydrochloride (11.4 mg) was dissolved in 20 ml water in a 125 ml separating funnel, 5 ml of liquid ammonia was added followed by 20 ml of dichloromethane. The content was shaken for 15 minutes. The lower organic layer was collected in a beaker containing anhydrous sodium sulphate. The water-free organic layer was transferred into a 100 ml calibrated flask and diluted to the volume with the same solvent to get 100 µg ml
-1 with
respect to PPL (hydrochloride free propranolol). This solution was diluted appropriately with dichloromethane to get working concentrations of 10 µg ml
-1 in both the methods A and B, and 12 µg ml
-1 for use in method C,
respectively. 2.5 Recommended Procedures 2.5.1 BTP method (method A) Different aliquots (0.2, 0.5, 1.0, 2.0, 3.0 and 3.5 ml) of a standard PPL (10 µg ml
-1) solution were transferred into a
series of 5 ml calibrated flasks using a micro burette and to each flask was added 1 ml of 0.1% BTB solution. The mixture was diluted to the volume with dichloromethane and mixed well. The absorbance of resulting yellow colored solution was measured at 420 nm against a reagent blank. 2.5.2 BCG method (method B) Varying aliquots (0.2, 0.5, 1.0, 2.0, 3.0 and 3.5 ml) of a standard PPL (10 µg ml
-1) solution were transferred into a
series of 5 ml calibrated flasks using a micro burette and to each flask was added 1 ml of 0.05% BCG solution. The mixture was diluted to the volume with dichloromethane and mixed well. The absorbance of resulting yellow colored solution was measured at 425 nm against a reagent blank. 2.5.3 BCP method (method C) Into a series of 5 ml calibration flasks, aliquots (0.25, 0.5, 1.0, 2.0, 3.0 and 3.5 ml) of standard PPL solution (12 µg ml
-1) equivalent to 0.6 – 8.4 µg ml
-1 PPL were accurately transferred and the total volume in each flask was brought
to 3.5 ml by adding dichloromethane. To each flask 1 ml of 0.1 % BCP solution in dichloromethane was added and mixed well. The absorbance of the yellow colored ion-pair complex was measured at 420 nm against the reagent blank. 2.5.4 Procedure for dosage forms Ten tablets or content of ten capsules were weighed accurately and ground into fine powder. An amount of the powder equivalent to 11.4 mg of PPH was weighed into a 125 ml separating funnel. The extraction procedure used for pure drug was followed for tablet/capsule powder. The resulting solution was diluted to get working concentration (10 and 12 µg ml
-1 PPL) and suitable aliquots were analyzed following the procedures described
above. 2.5.5 Procedures for selectivity study A placebo blank of the composition: talc (100 mg), starch (50 mg), acacia (50 mg), methyl cellulose (100 mg), sodium citrate (50 mg), magnesium stearate (100 mg), and sodium alginate (50 mg) was prepared and 20 mg was extracted with dichloromethane and solutions were made as described under preparation of dosage forms. A convenient aliquot of solution was subjected to analysis following the recommended procedures.
http://astonjournals.com/csj
5 Chemical Sciences Journal, Vol. 2012: CSJ-80
To the 20 mg of the placebo blank, 11.4 mg of PPH was added and homogenized. The solution of the synthetic mixture equivalent to 100 μg ml
- 1 of PPL was prepared as described earlier. The resulting solution was
assayed (n = 5) by all the three methods after appropriate dilution. 2.5.6 Procedure for spiked human urine Five ml of PPH free urine taken in a 125 ml separating funnel was spiked with 20 ml of aqueous solution containing 11.4 mg of pure PPH and to the same solution, 5ml of liquid ammonia was added followed by 20 ml of ethyl acetate. The content was shaken for 15 min. The lower aqueous layer was discarded and the upper organic layer was collected in a beaker containing anhydrous sodium sulphate. The water-free organic layer was transferred into a dried beaker and evaporated on a hot water bath. The dry residue was dissolved in dichloromethane in a 100 ml calibrated flask, and diluted to the mark with solvent. This solution was diluted appropriately with dichloromethane to get working concentrations. An aliquot of resulting solution was analyzed following the procedures described above. 2.5.7 Procedure for stoichiometric relationship Job’s method of continuous variations of equimolar solutions was employed: 5.78 × 10
-5 M each of PPL and BTB in
dichloromethane (Method A) solutions, 5.78 × 10⁻⁵
M each of PPL and BCG in dichloromethane (Method B) solutions and 1.93 × 10
-4M each of PPL and BCP in dichloromethane (Method C) solutions were prepared
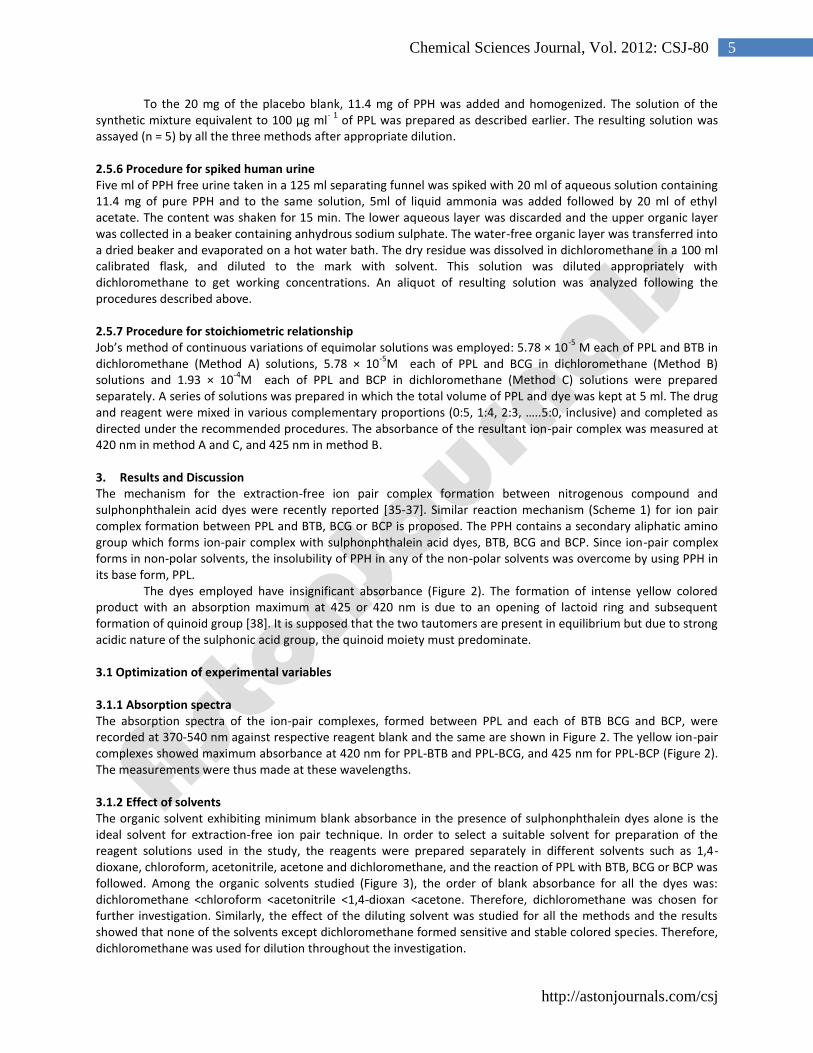
separately. A series of solutions was prepared in which the total volume of PPL and dye was kept at 5 ml. The drug and reagent were mixed in various complementary proportions (0:5, 1:4, 2:3, …..5:0, inclusive) and completed as directed under the recommended procedures. The absorbance of the resultant ion-pair complex was measured at 420 nm in method A and C, and 425 nm in method B. 3. Results and Discussion The mechanism for the extraction-free ion pair complex formation between nitrogenous compound and sulphonphthalein acid dyes were recently reported [35-37]. Similar reaction mechanism (Scheme 1) for ion pair complex formation between PPL and BTB, BCG or BCP is proposed. The PPH contains a secondary aliphatic amino group which forms ion-pair complex with sulphonphthalein acid dyes, BTB, BCG and BCP. Since ion-pair complex forms in non-polar solvents, the insolubility of PPH in any of the non-polar solvents was overcome by using PPH in its base form, PPL.
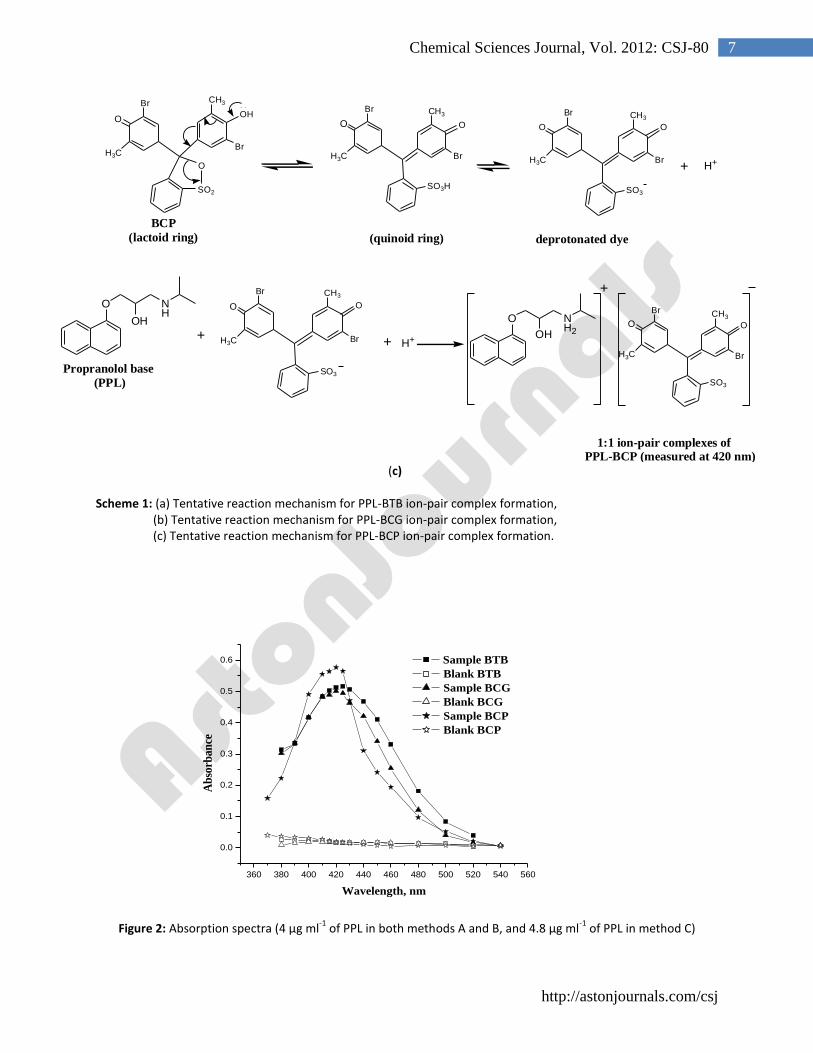
The dyes employed have insignificant absorbance (Figure 2). The formation of intense yellow colored product with an absorption maximum at 425 or 420 nm is due to an opening of lactoid ring and subsequent formation of quinoid group [38]. It is supposed that the two tautomers are present in equilibrium but due to strong acidic nature of the sulphonic acid group, the quinoid moiety must predominate. 3.1 Optimization of experimental variables 3.1.1 Absorption spectra The absorption spectra of the ion-pair complexes, formed between PPL and each of BTB BCG and BCP, were recorded at 370-540 nm against respective reagent blank and the same are shown in Figure 2. The yellow ion-pair complexes showed maximum absorbance at 420 nm for PPL-BTB and PPL-BCG, and 425 nm for PPL-BCP (Figure 2). The measurements were thus made at these wavelengths. 3.1.2 Effect of solvents The organic solvent exhibiting minimum blank absorbance in the presence of sulphonphthalein dyes alone is the ideal solvent for extraction-free ion pair technique. In order to select a suitable solvent for preparation of the reagent solutions used in the study, the reagents were prepared separately in different solvents such as 1,4-dioxane, chloroform, acetonitrile, acetone and dichloromethane, and the reaction of PPL with BTB, BCG or BCP was followed. Among the organic solvents studied (Figure 3), the order of blank absorbance for all the dyes was: dichloromethane <chloroform <acetonitrile <1,4-dioxan <acetone. Therefore, dichloromethane was chosen for further investigation. Similarly, the effect of the diluting solvent was studied for all the methods and the results showed that none of the solvents except dichloromethane formed sensitive and stable colored species. Therefore, dichloromethane was used for dilution throughout the investigation.

http://astonjournals.com/csj
6 Research Article
SO2
OHBr
H3C
HO
BrCH3
O
SO3H
OBr
H3C
HO
BrCH3 SO3
OBr
H3C
HO
BrCH3
H
SO3
OBr
H3C
HO
Br CH3
H
Propranolol base
(PPL)
O NH
OH
O NH2
OH
+
SO3
OBr
H3C
HO
Br CH3
BTB
(lactoid ring)(quinoid ring) deprotonated dye
1:1 ion-pair complexes of PPL-BTB (measured at 420 nm)
(a)
(quinoid ring) deprotonated dye
HO
Br
Br
OH
Br
Br
CH3CH3 O
SO2
BCG (lactoid ring)
HO
Br
Br
O
Br
Br
CH3CH3
SO3H
HO
Br
Br
O
Br
Br
CH3CH3
SO3
+H+
HO
Br
Br
O
Br
Br
CH3CH3
SO3
HO
Br
Br
O
Br
Br
CH3
CH3
SO3
Propranolol base (PPL)
1:1 ion-pair complexes of PPL-BCG (measured at 425 nm)
O NH
OH O NH2OH
+
+
+ H+
(b)
http://astonjournals.com/csj
7 Chemical Sciences Journal, Vol. 2012: CSJ-80
(quinoid ring) deprotonated dye
O
Br
H3C
OH
CH3
Br
O
SO2
BCP
(lactoid ring)
O
Br
H3C
O
CH3
Br
SO3H
O
Br
H3C
O
CH3
Br
SO3
+H+
O
Br
H3C
O
CH3
Br
SO3
O
Br
H3C
O
CH3
Br
SO3
Propranolol base
(PPL)
1:1 ion-pair complexes of PPL-BCP (measured at 420 nm)
O NH
OH O NH2OH
+
+
+ H+
(c) Scheme 1: (a) Tentative reaction mechanism for PPL-BTB ion-pair complex formation, (b) Tentative reaction mechanism for PPL-BCG ion-pair complex formation, (c) Tentative reaction mechanism for PPL-BCP ion-pair complex formation.
Figure 2: Absorption spectra (4 µg ml
-1 of PPL in both methods A and B, and 4.8 µg ml
-1 of PPL in method C)
360 380 400 420 440 460 480 500 520 540 560
0.0
0.1
0.2
0.3
0.4
0.5
0.6
Ab
sorb
an
ce
Wavelength, nm
Sample BTB
Blank BTB
Sample BCG
Blank BCG
Sample BCP
Blank BCP

http://astonjournals.com/csj
8 Research Article
Figure 3: Effect of solvents on the formation of PPL-BTB complex (3.2 µg ml
-1 PPL), PPL- BCG complex (4.0 µg ml
-1
PPL) and PPL-BCP complex (4.8 µg ml-1
PPL). 3.1.3 Effect of dye concentration and reaction time The effect of the dye-concentration on the intensity of the color developed at selected wavelengths was studied by measuring the absorbance of solutions containing a fixed concentration of PPL (2.4, 3.5 and 5.0 μg ml
-1 in methods
A, B and C, respectively) and different amounts (0.5 - 3.0 ml) of the respective dye of 0.1% BTB solution, 0.05% BCG solution and 0.1 % BCP solution. Maximum color intensity of the complex was achieved with 1 ml of dye solutions in all the methods and an excess dye slightly decreases the absorbance of the complex (Figure 4). The addition of the dye solution resulted in an immediate color development at room temperature for method A and B, and takes 5 min to develop color in method C. The formed ion-pairs were stable for at least 24 h in methods A and C and 90 min in method B.
Figure 4: Effect of reagent concentration on the formation PPL-BTB complex (2.4 µg ml
-1 PPL), PPL-BCG complex
(3.5 µg ml-1
PPL) and PPL-BCP complex (5.0 µg ml-1
PPL).
1,4-Dioxan Chloroform Acetonitrile Acetone Dichloromethane
0.0
0.1
0.2
0.3
0.4
0.5
0.6
Ab
sorb
an
ce
Solvents
PPL-BTB ion pair complex
PPL-BTB blank
PPL-BCG ion pair complex
PPL-BCG blank
PPL-BCP ion pair complex
PPL-BCP blank
0.5 1.0 1.5 2.0 2.5 3.0
0.00
0.05
0.10
0.15
0.20
0.25
0.30
0.35
0.40
0.45
Ab
sorb
an
ce
Volume of reagent, ml
BTB-PPL ion-pair complex
Blank
BCG-PPL ion-pair complex
Blank
BCP-PPL ion-pair complex
Blank

http://astonjournals.com/csj
9 Chemical Sciences Journal, Vol. 2012: CSJ-80
3.1.4 Study of composition of ion-pair complex and its conditional stability constant The composition and conditional stability constant of the PPL-BTB or PPL-BCG or PPL-BCP complex formed were evaluated by applying Job’s method of continuous variations [39] using equimolar concentrations of PPL (prepared by following the general procedure) and the dye. The concentration of dye used in method A and B was 5.78 × 10
-5
M, whereas concentration of PPL and dye is 1.93 × 10⁻⁴
M in method C. The experiments were performed by mixing equimolar solutions of drug and reagent by maintaining the total volume at 5.0 ml. The plots of the mole ratio between drug and reagent versus the absorbance values were prepared (Figure 5), and the results revealed that the formation of ion -pair complex between drug and reagent followed a 1:1 reaction stoichiometry. The conditional stability constant (Kf) of the ion-association complex was calculated from the continuous variation data using the following equation [40]:
n
M
n
m
mf
nCAA
AAK
)(/1
/2
where A and Am are the observed maximum absorbance and the absorbance value when all the drug present is associated, respectively. CM is the mole concentration of drug at the maximum absorbance and n is the stoichiometry which BTB/ BCG/BCP ion associates with PPL. The log Kf values were found to be 7.21, 6.96 and 7.32 for BTB method, BCG method, and BCP method, respectively.
(a) (b)
(c)
Figure 5: Job’s plots obtained for (a) 5.78 × 10⁻⁵
M PPL and BTB ion-pair complex (b) 1.93 × 10⁻⁴
M PPL and BCG ion-pair complex and (c) 5.78 × 10
-5M PPL and BCP ion-pair complex.
0.0 0.2 0.4 0.6 0.8 1.0
0.0
0.1
0.2
0.3
0.4
0.5
0.6
Ab
sorb
an
ce
Mole ratio, (VPPL
/VPPL
+VBTB
)
0.0 0.2 0.4 0.6 0.8 1.0
0.0
0.1
0.2
0.3
0.4
0.5
0.6
0.7
Ab
sorb
an
ce
Mole ratio, (VPPL
/VPPL
+VBCG
)
0.0 0.2 0.4 0.6 0.8 1.0
0.0
0.1
0.2
0.3
0.4
0.5
0.6
0.7
0.8
Ab
sorb
an
ce
Mole ratio, (VPPL
/VPPL
+VBCP
)

http://astonjournals.com/csj
10 Research Article
3.2 Method validation 3.2.1 Analytical parameters A linear relation was found to exist between absorbance and the concentration of PPL in the ranges given in Table 2. The calibration graph in each case is described by the equation:
Y = a + b X where Y = absorbance, a = intercept, b = slope and X = concentration in µg ml
-1, obtained by the method of least
squares. Correlation coefficient, intercept and slope for the calibration data are summarized in Table 2. Sensitivity parameters such as apparent molar absorptivity and Sandell’s sensitivity values, the limits of detection and quantification calculated as per the current ICH guidelines [41] are compiled in Table 2 and are indicative of the sensitivity of the methods. The limits of detection (LOD) and quantification (LOQ) were calculated according to the same guidelines using the formulae:
LOD=3.3σ/s and LOQ=10σ/s where σ is the standard deviation of five reagent blank determinations and s is the slope of the calibration curve.
Table 2: Regression and analytical parameters.
Parameter BTB Method BCG Method BCP Method
max, nm 420 425 420
Beer’s law limits (µg ml-1
) 0.4-7.0 0.4-7.0 0.6-8.4
Molar absorptivity (l mol-1
cm-1
) 3.55×10⁴ 3.12×10
4 2.94×10
4
Sandell sensitivity* (µg cm
-2) 0.0073 0.0083 0.0088
Limit of detection (µg ml-1
) 0.03 0.04 0.06
Limit of quantification (µg ml-1
) 0.10 0.12 0.18
Regression equation, Y**
; Intercept (a) -0.0160 -0.0089 0.0017
Slope (B) 0.1420 0.1276 0.1123
Correlation coefficient (r) 0.9982 0.9999 0.9991
Standard deviation of intercept (Sa) 0.01819 0.00346 0.01239
Standard deviation of slope (Sb) 0.00432 0.00082 0.00246 *Limit of determination as the weight in µg per ml of solution, which corresponds to an absorbance of A = 0.001 measured in a
cuvette of cross-sectional area 1 cm2 and l = 1 cm.
**bXaY , where Y is the absorbance, a is the intercept, b is the slope and
X is the concentration in µg ml-1
.
3.2.2 Precision and accuracy The precision of the methods was calculated in terms of intermediate precision (intra-day and inter-day). Three different concentrations of PPL were analyzed in seven replicates during the same day (intra-day precision) and five consecutive days (inter-day precision). The RSD (%) values of intra-day and inter-day studies showed that the precision was good (Table 3). The accuracy of an analytical method expresses the closeness between the reference value and the found value. Accuracy was evaluated as percentage relative error between the measured concentrations and taken concentrations for PPL (Bias %). The results obtained are compiled in Table and show that the accuracy was good. 3.2.3 Robustness and ruggedness The robustness of the all the methods was evaluated by making small incremental changes in the volume of dye (1 ± 0.2 ml) and contact time (5 ± 1 min) in method C, and the effect of the changes were studied on the absorbance of the ion-pair complex. The changes had negligible influence on the results as revealed by small intermediate precision values expressed as % RSD (≤ 1.43 %). Method ruggedness was demonstrated having the analysis done by four analysts, and also by a single analyst performing analysis using four different cuvettes. Intermediate precision values (%RSD) in both instances were in the range 0.99 - 1.74 indicating acceptable ruggedness. These results are presented in Table 4.

http://astonjournals.com/csj
11 Chemical Sciences Journal, Vol. 2012: CSJ-80
Table 3: Evaluation of intra-day and inter-day precision and accuracy.
Table 4: Robustness and ruggedness.
aIn all methods, the volume of reagent was 0.8, 1.0 and 1.2 mL. bThe reaction time was 4, 5 and 6 min for method C.
3.2.4 Effect of co-formulated substances The effect of co-formulated substances was tested by placebo blank and synthetic mixture analyses. A convenient aliquot of the placebo blank solution was subjected to analysis according to the recommended procedures. There was no interference by the inactive ingredients as indicated by the near blank absorbance in all the methods. The analyses of synthetic mixture solution yielded percent recoveries which ranged between 98.99 – 102.1 and with standard deviation of 0.78 – 1.56. The results of this study indicated that the inactive ingredients did not interfere in the assay. 3.2.5 Application to analysis of spiked urine sample and pharmaceutical formulations The proposed methods were successfully applied to the determination of PPL in spiked urine sample with mean percent recovery of 106.4 ± 1.85 (n=5), 108.1±2.12 (n=5) and 105.9 ± 0.93 (n=5), for BTB, BCG and BCP methods, respectively and the results of two representative tablet and capsule were statistically compared with those of the official method [7] by applying the Students t-test for accuracy and F-test for precision (Table 5). The reference method describes a potentiometric titration of ethanolic solution of PPH with sodium hydroxide. As can be seen from the Table 5, the calculated t-value and F-value at 95% confidence level did not exceed the tabulated values of
Method PPL taken (µg ml
-1)
Intra-day (n = 7) Inter-day (n = 5)
PPL founda
(µg ml-1
) %RSD
b %RE
c PPL found
a
(µg ml-1
) %RSD
b
%RE
c
BTB Method
2.00 1.98 0.77 1.10 2.02 1.41 1.00
4.00 4.07 1.22 1.64 4.07 0.91 1.64
6.00 6.11 1.08 1.83 6.12 0.78 2.03
BCG Method
2.00 2.02 1.66 1.26 2.03 1.54 1.32
4.00 3.98 1.67 0.38 4.02 0.73 0.53
6.00 6.02 1.86 0.38 6.04 1.57 0.70
BCP Method
2.40 2.41 0.54 0.22 2.43 0.86 1.31
4.80 4.80 0.89 0.02 4.82 0.67 0.60
7.20 7.18 0.81 0.28 7.23 1.74 0.37 a. Mean value of five determinations;
b. Relative standard deviation (%);
c. Relative error (%).
Method
PPL taken, µg ml
-1
Method robustness Method ruggedness
Parameters altered
Reagent volume, mla
RSD, % (n = 3)
Reaction timeb
RSD, % (n = 3)
Inter-analysts RSD, % (n = 4)
Inter-cuvettes RSD, % (n = 4)
BTB Method
2.00 1.06 1.74 1.38
4.00 1.24 1.39 1.32
6.00 0.93 1.18 1.09
BCG Method 2.00 1.31 1.56 1.41
4.00 0.78 1.43 1.30
6.00 1.09 1.55 1.39
BCP Method 2.40 0.91 1.01 1.16 0.99
4.80 1.42 1.29 1.47 1.35
7.20 1.37 1.43 1.29 1.12
http://astonjournals.com/csj
12 Research Article
2.78 and 6.39, respectively, for four degrees of freedom. The results indicated that there is no difference between the proposed methods and the official method with respect to accuracy and precision.
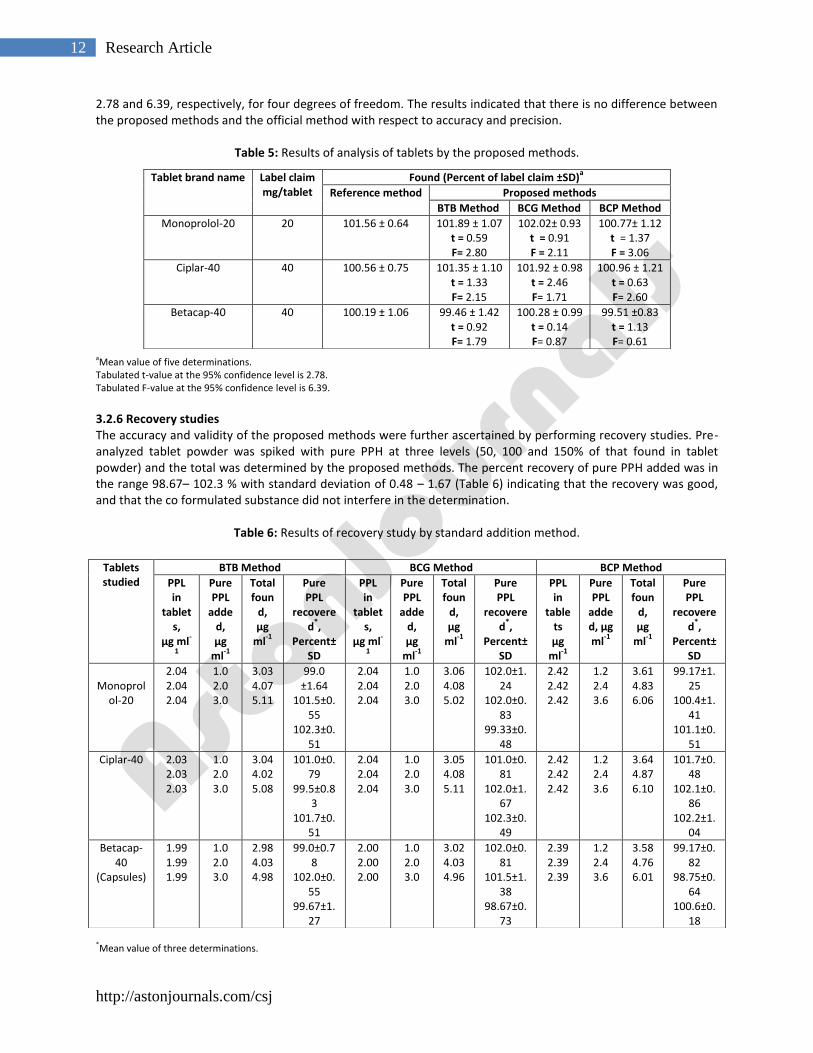
Table 5: Results of analysis of tablets by the proposed methods.
aMean value of five determinations. Tabulated t-value at the 95% confidence level is 2.78. Tabulated F-value at the 95% confidence level is 6.39. 3.2.6 Recovery studies The accuracy and validity of the proposed methods were further ascertained by performing recovery studies. Pre-analyzed tablet powder was spiked with pure PPH at three levels (50, 100 and 150% of that found in tablet powder) and the total was determined by the proposed methods. The percent recovery of pure PPH added was in the range 98.67– 102.3 % with standard deviation of 0.48 – 1.67 (Table 6) indicating that the recovery was good, and that the co formulated substance did not interfere in the determination.
Table 6: Results of recovery study by standard addition method.
*Mean value of three determinations.
Tablet brand name
Label claim mg/tablet
Found (Percent of label claim ±SD)a
Reference method Proposed methods
BTB Method BCG Method BCP Method
Monoprolol-20 20
101.56 ± 0.64 101.89 ± 1.07 t = 0.59 F= 2.80
102.02± 0.93 t = 0.91 F = 2.11
100.77± 1.12 t = 1.37 F = 3.06
Ciplar-40 40
100.56 ± 0.75 101.35 ± 1.10 t = 1.33 F= 2.15
101.92 ± 0.98 t = 2.46 F= 1.71
100.96 ± 1.21 t = 0.63 F= 2.60
Betacap-40 40
100.19 ± 1.06 99.46 ± 1.42 t = 0.92 F= 1.79
100.28 ± 0.99 t = 0.14 F= 0.87
99.51 ±0.83 t = 1.13 F= 0.61
Tablets studied
BTB Method BCG Method BCP Method
PPL in
tablets,
µg ml-
1
Pure PPL
added, µg
ml-1
Total foun
d, µg
ml-1
Pure PPL
recovered
*,
Percent±SD
PPL in
tablets,
µg ml-
1
Pure PPL
added, µg
ml-1
Total foun
d, µg
ml-1
Pure PPL
recovered
*,
Percent±SD
PPL in
tablets µg
ml-1
Pure PPL
added, µg ml
-1
Total foun
d, µg
ml-1
Pure PPL
recovered
*,
Percent±SD
Monoprol
ol-20
2.04 2.04 2.04
1.0 2.0 3.0
3.03 4.07 5.11
99.0 ±1.64
101.5±0.55
102.3±0.51
2.04 2.04 2.04
1.0 2.0 3.0
3.06 4.08 5.02
102.0±1.24
102.0±0.83
99.33±0.48
2.42 2.42 2.42
1.2 2.4 3.6
3.61 4.83 6.06
99.17±1.25
100.4±1.41
101.1±0.51
Ciplar-40 2.03 2.03 2.03
1.0 2.0 3.0
3.04 4.02 5.08
101.0±0.79
99.5±0.83
101.7±0.51
2.04 2.04 2.04
1.0 2.0 3.0
3.05 4.08 5.11
101.0±0.81
102.0±1.67
102.3±0.49
2.42 2.42 2.42
1.2 2.4 3.6
3.64 4.87 6.10
101.7±0.48
102.1±0.86
102.2±1.04
Betacap-40
(Capsules)
1.99 1.99 1.99
1.0 2.0 3.0
2.98 4.03 4.98
99.0±0.78
102.0±0.55
99.67±1.27
2.00 2.00 2.00
1.0 2.0 3.0
3.02 4.03 4.96
102.0±0.81
101.5±1.38
98.67±0.73
2.39 2.39 2.39
1.2 2.4 3.6
3.58 4.76 6.01
99.17±0.82
98.75±0.64
100.6±0.18

http://astonjournals.com/csj
13 Chemical Sciences Journal, Vol. 2012: CSJ-80
4. Conclusion Unlike the chromatographic methods, the spectrophotometric methods are simple and are not of high cost. The importance lies in the chemical reactions upon which the procedures are based rather than upon the sophistication of the instrument. This aspect of spectrophotometric analysis is of major interest in analytical pharmacy since it offers distinct possibility in the assay of a particular component in complex dosage formulations. The reagents utilized in the proposed methods are cheaper, readily available and the procedures do not involve any critical reaction conditions or tedious sample preparation. The described procedures are simple, rapid, accurate and precise in determining propranolol hydrochloride in their pharmaceutical preparations and in urine without interference from common excipients or biological matrix. The proposed methods involve single step reaction and do not involve heating or extraction step unlike many of the previously reported methods. Moreover, they do not require various elaboration treatment and tedious extraction procedures required in other traditional extractive spectrophotometric methods. These, in addition to satisfactory sensitivity and reproducibility compared to the official non-aqueous titrimetric and many other methods as well as the convenience and simplicity, make the methods applicable for routine analysis of the drug in pure form, tablets/capsules and urine. Competing Interests Authors have no competing interests. Authors’ Contributions All authors contributed equally to this work. Acknowledgement Authors thank Cipla India Ltd., Mumbai, India, for gifting pure propranolol hydrochloride. Authors are grateful to the authorities of the University of Mysore, Mysore, for permission and facilities. References 1. Boakes AJ, Prichard BNC, 1973. The effect of AH 5158, pindolol, propranolol, D-propranolol on acute exercise tolerance in
angina pectoris. British Journal of Pharmacology, 47: 673-674. 2. Mitrani A, Oettinger M, Alunader EG, et al., 1975. Use of propranolol in dysfunctional labour. British Journal of Obstetrics
and Gynaecology, 82: 651-655. 3. Granville-Grossman KL, Turner P, 1966. The effect of propranolol on anxiety. Lancet, 1: 788-790. 4. Murillo-Pulgarin JA, Alanon-Molina A, Fernandez-Lopez P, 1998. Simultaneous determination of atenolol, propranolol,
dipyridamole and amiloride by means of non-linear variable angle synchronous fluorescence spectrometry. Analytica Chimica Acta, 370: 9-18.
5. Rodriguez Bueno C, 1992. Dopaje. Interamericana-McGraw Hill, Madrid. 6. British Pharmacopoeia, Vol. II, Her Majesty’s Stationary Office, London, 5039-40, 2009. 7. Indian Pharmacopoeia, The Controller of Publication, New Delhi, 634, 2006. 8. The United States Pharmacopoeia, 12th edn., USP convention. INC, Twinbrook, NF 25, 2004. 9. Shinde VM, Desai BS, Tendulkar NM, 1994. Simultaneous determination of propranolol hydrochloride and
hydrochlorothiazide in tablets by quantitative TLC. Indian Drugs, 31: 192-196. 10. Erram SV, Tipnis HP, 1994. Simple spectrometric analysis of propranolol hydrochloride and hydrochlorothiazide from
combined pharmaceutical dosage [forms]. Indian Drugs, 31: 65-68. 11. Patil AS, Shirkhedkar AA, Surana SJ, et al., 2011. Q-Absorbance and multicomponent UV-spectrophotometric methods for
simultaneous estimation of propranolol hydrochloride and flunarizine dihydrochloride in capsules. Der Pharma Chemica, 3: 404-408.
12. Patel SA, Patel PU, Patel SM, 2011. Simultaneous spectrophotometric determination of diazepam and propranolol hydrochloride in tablets. Current Research in Pharmaceutical Sciences, 01: 25-30.
13. Golcu A, 2008. New, simple, and validated UV-spectrophotometric method for the estimation of some beta blockers in bulk and formulations. Journal of Analytical Chemistry, 63: 538–543.
14. Tabrizi AB, 2007. A simple spectrofluorimetric method for determination of piroxicam and propranolol in pharmaceutical preparations. Journal of Food and Drug Analysis, 15: 242-248.
15. Sartori ER, Medeiros RA, Rocha-Filho RC, et al., 2010. Square-wave voltammetric determination of propranolol and atenolol in pharmaceuticals using a boron-doped diamond electrode. Talanta, 81: 1418–1424.
http://astonjournals.com/csj
14 Research Article
16. Marques KL, Santos JLM, Lima JLFC, 2005. Chemiluminometric determination of propranolol in an automated multicommutated flow system. Journal of Pharmaceutical and Biomedical Analysis, 39: 886–891.
17. Qi H, Wang C, Zou R, et al., 2011. Electrogenerated chemiluminescence sensor for the determination of propranolol hydrochloride. Analytical Methods, 3: 446-451.
18. Issa YM, Amin AS, 1995. Conductometric titration of pindolol and propranolol using ammonium reineckate and potassium tetracyanonickelate. Microchimica Acta, 116: 85-91.
19. Idowu OS, Adegoke OA, Olaniyi AA, 2004. Colorimetric assay of propranolol tablets by derivatization: Novel application of diazotized 4-amino-3,5-dinitrobenzoic acid (ADBA). Journal of AOAC International, 87: 573-578.
20. Bhandari A, Kumar B, Patel R, 2008. Spectrophotometric estimation of propranolol in tablet dosage form. Asian Journal of Chemistry, 20: 802-804.
21. Golcu A, Yucesoy C, Sesin S, 2004. Spectrophotometric determination of some beta-blockers in dosage forms based on complex formation with Cu(II) and Co(II). IL Farmaco, 59: 487-492.
22. El-Ries MA, Abou-Attia FM, Ibrahim SA, 2000. AAS and spectrophotometric determination of propranolol HCl and metoprolol tartrate. Journal of Pharmaceutical and Biomedical Analysis, 24: 179-187.
23. Salem H, 2001. Spectrophotometric study of the charge transfer complexes of some beta-adrenergic blocking drugs. Journal of Pharmaceutical Sciences, 28: 319-337.
24. Hussain S, Krishnamurthy ASR, Sekar R, et al., 1995. Ceric(VI) oxidation studies of propranolol and its application to pharmaceutical preparations. Indian Drugs, 32: 574-577.
25. El-Emam AA, Belal FF, Montsufa MA, et al., 2003. Spectrophotometric determination of propranolol in formulations via oxidative coupling with 3-methylbenzothiazoline-2-one hydrazone. IL Farmaco, 58: 1179-1186.
26. Basavaiah K, Chandrashekar U, Charan VS, 2003. Application of precipitation and complexation reactions for the analysis of propranolol hydrochloride. Indian Journal of Pharmaceutical Sciences, 65: 161-166.
27. Basavaiah K, Chandrashekar U, Prameela HC, 2003. Cerimetric determination of propranolol in bulk drug form and in tablets. Turkish Journal of Chemistry, 27: 591-599.
28. Basavaiah K, Chandrashekar U, Prameela HC, et al., 2004. Titrimetric and spectrophotometric determination of propranolol hydrochloride using chloramine-T. Indian Drugs, 41: 303-305.
29. Basavaiah K, Chandrashekar U, Prameela HC, 2003. Indirect titrimetric and spectrophotometric determination of propranolol hydrochloride using sodium metavanadate. Bulgarian Chemistry and Industry, 74: 79-84.
30. Basavaiah K, Chandrashekar U, Prameela HC, et al., 2003. Quantitative determination of propranolol with bromate and methyl orange. Acta Sciencia Indica Chemistry, XXIX: 25-30.
31. El-Didamony AM, 2010. A sensitive spectrophotometric method for the determination of propranolol HCl based on oxidation bromination reactions. Drug Testing and Analysis, 2: 122-129.
32. Gowda BG, Seetharamappa J, Melwanki MB, 2002. Indirect spectrophotometric determination of propranolol hydrochloride and piroxicam in pure and pharmaceutical formulations. Analytical Sciences, 18: 671-674.
33. Al-Attas AS, 2006. Utility of redox reaction for spectrophotometric determination of propranolol and isoxsuprine hydrochlorides in pure and dosage forms. Asian Journal of Chemistry, 18: 3033-3039.
34. Sastry CSP, Srinivas KR, Krishna Prasad MM, 1996. Spectrophotometric determination of drugs in pharmaceutical formulations with N-bromosuccinimide and celestine blue. Microchimica Acta, 122: 77.
35. Vinay KB, Revannasiddappa HD, et al., 2012. Use of two sulfonthalein dyes in the extraction-free spectrophotometric assay of tramadol in dosage forms and in spiked human urine based on ion-pair reaction. Drug Testing and Analysis, 4: 116-122.
36. Vinay KB, Revannasiddappa HD, et al., 2011. Sensitive, selective and extraction-free spectrophotometric determination of lamotrigine in pharmaceuticals using two sulphonthalein dyes. Thai Journal of Pharmaceutical Sciences, 35: 65-76.
37. Sameer AMA, Basavaiah K, 2012. Spectrophotometric determination of dothiepin hydrochloride in pharmaceuticals through ion-pair complexation reaction. Chemical Industry and Chemical Engineering Quarterly, 18: 339-347.
38. Ashour S, Chehna MF, Bayram R, 2006. Spectrophotometric determination of alfuzosin HCl in pharmaceutical formulations with some sulphonephthalein dyes. International Journal of Biomedical Sciences, 2: 273-278.
39. Douglas AS, Donald MW, 1971. Principles of Instrumental Analysis. Holt, Rinhart, Winston, New York. 40. Erk N, 2003. Extractive spectrophotometric methods for the novel antidepressant drug in bulk and pharmaceutical dosage
forms by using bromthymol blue and bromcresol green. Analytical Letters, 36: 1183-1196. 41. International Conference on Harmonization of Technical Requirements for Registration of Pharmaceuticals for Human Use,
ICH Harmonised Tripartite Guideline. Validation of Analytical Procedures: Text and Methodology Q2(R 1), Complementary Guideline on Methodology, dated 06 November 1996, incorporated in November 2005, London.