research article avian distribution and life-history ... terra-firme and floodplain forests ......
TRANSCRIPT

Mongabay.com Open Access Journal - Tropical Conservation Science Vol. 9 (1): 465-502, 2016
Tropical Conservation Science | ISSN 1940-0829 | Tropicalconservationscience.org
465
Research Article
Avian distribution and life-history strategies in
Amazonian terra-firme and floodplain forests
Sil Henricus Johannes van Lieshout1*, Christopher Alexander Kirkby2 and Henk Siepel1 1 Department of Animal Ecology and Ecophysiology, Institute for Water and Wetland Research, Radboud University Nijmegen, Heyendaalseweg 135, 6525 AJ Nijmegen, The Netherlands 2 Fauna Forever, Avenida Aeropuerto KM 1, La Joya, Puerto Maldonado, Madre de Dios, Peru *Corresponding author: [email protected]
Abstract The diversity of avian populations in the Madre de Dios region of Peru is currently threatened by deforestation and other anthropogenic factors. In this study we assessed differences in bird species composition in two major types of tropical forests: floodplain and terra-firme forest. Abundance of groups of behaviourally similar species showed a higher presence of certain feeding guilds in either floodplain forests or terra-firme forest, whereas no difference in species richness was found. Analysis of the relative reproductive investment (RRI) of these tropical birds showed significant differences between habitats and among families and feeding guilds. Comparison of these families and feeding guilds to their relatives in temperate regions showed that neotropical birds have a smaller RRI, due to both smaller clutch sizes and lower egg mass, even when there are more broods per season. Quantification of RRI as used in this study can be useful to indicate bird species’ susceptibility to anthropogenic factors in various habitats. Keywords: tropical birds, Neotropical forest, avian distribution, relative reproductive investment, conservation

Mongabay.com Open Access Journal - Tropical Conservation Science Vol. 9 (1): 465-502, 2016
Tropical Conservation Science | ISSN 1940-0829 | Tropicalconservationscience.org
466
Introduction Deforestation and many other anthropogenic factors currently threaten tropical rainforests, the richest terrestrial ecosystem on the planet [1,2]. Human activities affect the ecological integrity of the forest by changing carbon storage, river flow, water balance, and even the amelioration of infectious diseases [2-4]. Tropical rainforests consist of various habitats, including terra-firme forest and floodplain forest, which are affected differently by anthropogenic factors [5-7]. Different land access and use of oligotrophic terra-firme forest has resulted in dissimilar trophic cascades and human activities compared to eutrophic floodplain forests. As rainforests are one of the most biodiverse habitats on the planet, many different species are affected by these anthropogenic factors [2]. Among these are around four thousand species of birds that play important roles in the various habitats as top predators, pollinators, and seed dispersers [8]. Species composition of avian populations is likely to differ between terra-firme forest and floodplain forest, and despite studies in both terra-firme forest and floodplain forest, the differences in avian populations between these habitats are still poorly understood. This novel research assesses some of these differences [9-12]. The terra-firme forest is rainforest that is not inundated or flooded by rivers and is characteristic of upland forests. These forests are noticeably taller and more diverse (>400 tree species/hectare in some areas) than floodplain forest. They are found only on dry, well-drained soils and are characterized by many tropical hardwood trees [13]. Moreover, the tall Amazonian terra-firme forests enhance a larger vertical stratification within the bird community, where species of the different layers are more likely to forage in their respective storeys and thus in narrower strata [14]. Floodplain forests, on the other hand, are flooded seasonally and have relatively rich soils from the annual replenishment of nutrients from white-water rivers. In the Amazon, vast areas of such rainforests can be found. Floodplain forests, especially those located on river banks and islands, are often short-lived due to the meandering nature of tropical lowland
Received: 5 January 2016; Accepted 9 February 2016; Published: 28 March 2016
Copyright: Sil Henricus Johannes van Lieshout, Christopher Alexander Kirkby and Henk Siepel. This is an open access paper. We use the Creative Commons Attribution 4.0 license http://creativecommons.org/licenses/by/3.0/us/. The license permits any user to download, print out, extract, archive, and distribute the article, so long as appropriate credit is given to the authors and source of the work. The license ensures that the published article will be as widely available as possible and that your article can be included in any scientific archive. Open Access authors retain the copyrights of their papers. Open access is a property of individual works, not necessarily journals or publishers. Cite this paper as: van Lieshout, S. H. J., Kirkby, C. A. and Siepel, H. 2016. Avian distribution and life-history strategies in Amazonian terra-firme and floodplain forests. Tropical Conservation Science Vol. 9 (1): 465-502. Available online: www.tropicalconservationscience.org Disclosure: Neither Tropical Conservation Science (TCS) or the reviewers participating in the peer review process have
an editorial influence or control over the content that is produced by the authors that publish in TCS.

Mongabay.com Open Access Journal - Tropical Conservation Science Vol. 9 (1): 465-502, 2016
Tropical Conservation Science | ISSN 1940-0829 | Tropicalconservationscience.org
467
rivers, which eat away at the forests' base. Tropical floodplain forests are one of the most productive ecosystems and harbour a great diversity of (tree)species, if lower on average than terra-firme forest. Although aboveground woody biomass is consistently lower than terra-firme forests, biomass accumulation is high due to deposition of nutrient-rich sediments [15]. These diverse abiotic conditions might enhance a diverse avian species composition in floodplain forests. Both terra-firme and floodplain forests are rapidly disappearing due to deforestation for development of agricultural lands, gold mining, and cattle ranching [2]. Avian diversity is likely to differ between these habitats as the incidence of flowering and fruiting is much lower in terra-firme forests than in other neotropical forest habitats, possibly influencing the abundance of specific species(guilds) like frugivores and nectarivores [16]. Other species might flourish in terra-firme forest, such as mixed-species flock insectivores, especially leaf-gleaning insectivores that congregate in food-rich areas [17]. Bird species that prefer specific habitats might be severely affected by increasing deforestation. Analysis of life-history traits could identify species that are more susceptible to these anthropogenic factors. To compare the reproductive investment of species in various guilds in the two forest types, we used the Relative Reproductive Investment (RRI) [18]. The latter value, which uses clutch size, egg mass, and the number of clutches per season in relation to female body mass, gives an indication of annual reproductive effort. This effort is a good proxy for adult mortality levels, which are hard to obtain in these kind of biotopes. Adult mortality determines a species’ vulnerability to human impact, because when adult mortality is low (and thus also the RRI is low), additional mortality due to human impact can have more severe consequences to population levels compared to species with high reproductive effort (and usually already higher adult mortality). In this paper, we address the following questions; (a) What is the difference in avian diversity among terra-firme forests and floodplain forests, and what are the possible causes? (b) What difference in life-history-traits, especially the RRI, exists between species in terra-firme forest and floodplain forest? (c) How do these differences in life-history traits relate to birds in temperate regions, in order to present a bigger reference for these RRI values?
Methods Study area This study was conducted within the Madre de Dios region of Peru at 18 sites of similar size: Fauna Forever House (AFF-House), Amazon Rainforest Conservation Center (ARCC), Rio Azul Ranger Station (AZUL), El Gato Homestay (BAL), Bozovitch Concession (BOZ), Chuncho Clay Lick (CHUN), Los Amigos Research Center (CICRA), Explorer’s Inn (EI), Limon Concession (LIMON), Malinowski Ranger Station (MALI), Campamento Pampa (PAMPA), Las Piedras Biodiversity Station (PIE), Reserva Amazonica Lodge (RA), Saona Lodge (SAONA), Sachavacayoc Centre (SC), Tambopata Ecolodge (TPL), Tambopata Research Center (TRC) and Wasai Lodge (WASAI). All of the sites are rainforest areas in the Amazon Basin, and six of them are located within the protected area complex of the Tambopata National Reserve and Bahuaja Sonene National Park (Fig. 1).

Mongabay.com Open Access Journal - Tropical Conservation Science Vol. 9 (1): 465-502, 2016
Tropical Conservation Science | ISSN 1940-0829 | Tropicalconservationscience.org
468
Fig. 1: Map of sampling sites in the Madre de Dios region, Peru. All of the sites are within the Amazon Basin and six are within the protected area complex of the Tambopata National Reserve and Bahuaja Sonene National Park.
Distribution of avian populations using mist-netting Eighteen sites with either floodplain or terra-firme forest were studied (Appendix 1), six of which are located within the protected area complex of the Tambopata National Reserve and Bahuaja Sonene National Park. Each site sampled with mist-nets covers a representative area of about 2,500 ha. Birds were sampled by using mist-nets, which was justified as it allows similar and simultaneous sampling of various sites. Three mist-nets (each 12 m long, 3.5 m high, 5 shelves, and mesh size 36 mm) were placed consecutively (in a straight line) to provide a total net length of 36 m per sample point. At each site, sample points were located 50-300 m (mean 200 m) apart, for a total of 3-42 points per site. Sampling was spread over a five-year period (2009-2014), with 3-73 sample days per site. Intervals when no data was collected varied among sample periods at sites, and some sites were only sampled once during the aforementioned five-year period. During a mist-net operation at a site, nets were opened at three sample points simultaneously for the first few hours after dawn for three days. Netting-days were not always consecutive, due to weather conditions (sampling did not occur on rainy or very windy days). Open mist-nets were checked at least every half hour, and all captured birds, with the exception of hummingbirds, were banded with a numbered ring. After banding, female birds (based on plumage, cloacal protuberance and brood patch) were weighed. New captures and recaptures were recorded, although recaptures on the same day were released immediately. Mist-nets focus on understory birds, but do not sample birds randomly [19-22]. As the effectiveness of mist-nets differs among different species, in this study only the capture rates of groups of behaviourally similar species were compared [19-21]. Therefore birds were

Mongabay.com Open Access Journal - Tropical Conservation Science Vol. 9 (1): 465-502, 2016
Tropical Conservation Science | ISSN 1940-0829 | Tropicalconservationscience.org
469
divided into guilds based on previous ecological classification [14,16,21,23]. Guilds included army ant followers (AA), solitary insectivores (I), solitary insectivore-frugivores (IF), mixed-species insectivore flocks (MFI), solitary frugivores (F), solitary frugivore-insectivores (FI), mixed-species insectivore-frugivore flocks (MFIF), and small vertebrates and large insects (SVLI) (Appendix 2 & 3).
Analysis Capture rates were used as an index of abundance and presented as captures/1,000 net-hours, where a net-hour refers to 12 m of net open for one hour. Recaptures of birds during the same day were excluded. Species richness of the different habitats was determined with the program EstimateS (http://viceroy.eeb.uconn.edu/estimates/), using the classic formula for Chao 1 & Chao 2. Non-parametric richness and diversity estimators (MM Means, Jackknife, Chao, Bootstrap, ICE, Shannon and Simpson) were also assessed with EstimateS. Species richness estimators based on incidence data were Chao 2 and ICE, where the latter calculated the proportion of ‘infrequent’ species that were not ‘unique’. Jackknife 1 and 2 used both incidence and abundance data: Jackknife 2 used both ‘uniques’ and ‘duplicates’ and Jackknife 1 only ‘uniques’, but in combination with observed amount of species either corrected for repeated samples in incidence data. Chao 2 only used different factors for repeated sampling compared to Jackknife 2. Chao 1 and Bootstrap used abundance data again with ‘uniques’ and ‘duplicates’, but the Bootstrap estimator is based on the frequency distribution of the species found [24]. Diversity of species was assessed through the Shannon [25] and Simpson index [26]. Chi-square test of independence was performed to determine habitat specialists in terra-firme and floodplain forest. For analysis of capture rates between terra-firme forest and floodplain forest, which occurred per feeding guild, independent t-tests were conducted in SPSS (Version 16.0). To get a comprehensive and comparable measure of reproductive investment, life-history traits like clutch size (ĉ), number of clutches per season (Nc) and egg mass (megg), divided by the female body mass (mfemale) were used to assess the Relative Reproductive Investment (RRI) according to the following formula: RRI = (ĉ*Nc*megg)/mfemale [18]. Values were assessed for every individual species, to compare differences among habitats, between feeding guilds and phylogenetically related groups. For comparison with outlier values, data of life-history traits of West-European birds were included among phylogenetically related groups and among feeding guilds as well. Mann-Whitney U tests and Independent t-tests (SPSS, Version 16.0) were conducted to assess significant differences in life-history traits between related groups.
Results Avian diversity in terra-firme and floodplain forests After a total of 11,205 mist-net hours, 188 and 118 bird species were found in floodplain and terra-firme forests respectively. The species accumulation curves for the floodplain forest and terra-firme forest are presented in Figure 2. The x-axis is scaled by the number of accumulated samples and compares species density between the forest types. The species accumulation curves for the two habitats did not approach an asymptote, but the rate of accumulation of species with increasing sample numbers is decreasing (Fig. 2).

Mongabay.com Open Access Journal - Tropical Conservation Science Vol. 9 (1): 465-502, 2016
Tropical Conservation Science | ISSN 1940-0829 | Tropicalconservationscience.org
470
The floodplain forest has fewer species at comparable levels of sample accumulation. The number of species at 64 pooled samples (the maximum sample size of terra-firme forest) was 118 and 109.4 species for terra-firme forests and floodplain forest respectively. Accordingly, the observed species accumulation curve of the floodplain forest was within the 95% confidence intervals of the corresponding species accumulation curve of terra-firme forest, indicating no significant difference in species richness between floodplain forest and terra-firme forest.
Fig. 2: Species accumulation curves. Grey line represents species richness in terra firme forest, black line in floodplain forest. Continuous lines surrounded by dashed lines represent cumulative number of species and confidence intervals of the respective habitats.
More samples were taken from floodplain forests, with more observed species than in terra-firme forest (Table 1). Non-parametric species richness estimators for incidence and abundance data estimated the species richness of the two habitats (Table 1). The differences between the highest and lowest species estimators were 71.47 for floodplain forest (n=353), 47.11 for floodplain forest (n=64) and 42.29 for terra-firme forest.
A total of 90 unique bird species were present in floodplain forest, and 20 unique species in terra-firme forest; 98 species were present in both habitats. Of course, a higher species richness in floodplain forest was found due to the greater number of samples; at the maximum sample size of terra-firme forest (n=64), species richness of almost all estimators, except for Chao 2, were higher in terra-firme forest. Diversity estimators were higher in terra-firme forest at all sample sizes (Table 1). Estimation of preference of various bird species for specific habitats occurred by comparing abundance data in floodplain and terra-firme forests. Habitat associations were detected in 60 species (Appendix 4), chi-square tests showed that 30 species preferred floodplain forest and 30 terra-firme forest. Preferences of certain feeding guilds for floodplain forest and terra-firme forest were estimated: solitary frugivore-insectivores (FP=3; TF=0) and mixed species flock insectivores (FP=7; TF=3) had more habitat specialists present in floodplain forest. Habitat specialists of solitary insectivores (FP=4; TF=17) preferred terra-firme forest.

Mongabay.com Open Access Journal - Tropical Conservation Science Vol. 9 (1): 465-502, 2016
Tropical Conservation Science | ISSN 1940-0829 | Tropicalconservationscience.org
471
Table 1: Species richness estimators. Number of samples and individuals, species observed and species richness (MM means, Chao 1, Chao 2, Jackknife 1, Jackknife 2, Bootstrap and ICE) and diversity (Shannon and Simpson) estimate values for floodplain and terra-firme forests.
Floodplain Forest Terra Firme Forest
No. of samples No. of Individuals
Sobs Unique species
353 3,285 188 90
64 711.3±0.29 79.4±1.28 19.9±0.03
64 541 118 20
Richness
MM Means Chao 1 Chao 2
Jackknife 1 Jackknife 2 Bootstrap
ICE
192.3 224.74±14.88 242.41±20.75 236.86±7.88
263.77 210.07 231.46
144.68 147.68±16.86 160.74±21.04 151.91±8.10
175.53±15.33 128.42±7.51
156.51±15.39
161.87 153.96±15.61 157.57±15.91 160.33±6.74
180.06 137.77
163.59±0.02
Diversity
Shannon Index Simpson Index
4.16 26.79
3.98±0.08 25.82±3.5
4.26 46.67
Fig. 3: Abundance per sampling effort of various feeding guilds compared between floodplain (FP) and terra-firme forest (TF). See Table 2 for abbreviations of feeding guilds. Fault bars indicate Standard Error, **= P<0.01.
0
20
40
60
80
100
120
140
160
FP TF FP TF FP TF FP TF FP TF FP TF FP TF FP TF
AA F FI I IF MFI N SVLI
Ab
un
dan
ce/1
00
0 m
ist-
ne
t h
ou
rs
**
**
Mongabay.com Open Access Journal - Tropical Conservation Science Vol. 9 (1): 465-502, 2016
Tropical Conservation Science | ISSN 1940-0829 | Tropicalconservationscience.org
472
Abundances for the various feeding guilds per 1,000 mist-net hours (Fig. 3) showed significant differences among certain guilds. Significantly more present in floodplain forests were frugivores (Independent t-test, P=0.005) and insectivore-frugivores (Independent t-test, P=0.002), and a trend was shown by army-ant followers (Independent t-test, P=0.053). An opposite trend was found with insectivores (Independent t-test, P=0.072), which were more abundant in terra-firme forests.
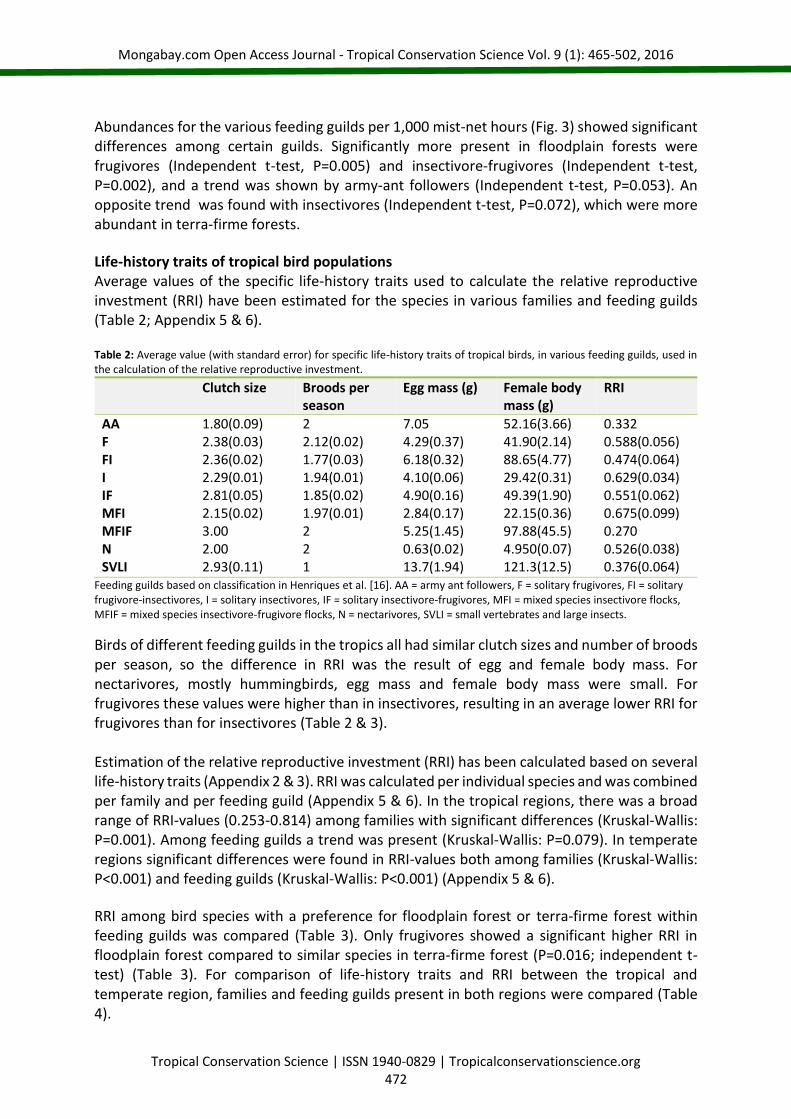
Life-history traits of tropical bird populations Average values of the specific life-history traits used to calculate the relative reproductive investment (RRI) have been estimated for the species in various families and feeding guilds (Table 2; Appendix 5 & 6). Table 2: Average value (with standard error) for specific life-history traits of tropical birds, in various feeding guilds, used in the calculation of the relative reproductive investment.
Clutch size Broods per season
Egg mass (g) Female body mass (g)
RRI
AA F FI I IF MFI MFIF N SVLI
1.80(0.09) 2.38(0.03) 2.36(0.02) 2.29(0.01) 2.81(0.05) 2.15(0.02) 3.00 2.00 2.93(0.11)
2 2.12(0.02) 1.77(0.03) 1.94(0.01) 1.85(0.02) 1.97(0.01) 2 2 1
7.05 4.29(0.37) 6.18(0.32) 4.10(0.06) 4.90(0.16) 2.84(0.17) 5.25(1.45) 0.63(0.02) 13.7(1.94)
52.16(3.66) 41.90(2.14) 88.65(4.77) 29.42(0.31) 49.39(1.90) 22.15(0.36) 97.88(45.5) 4.950(0.07) 121.3(12.5)
0.332 0.588(0.056) 0.474(0.064) 0.629(0.034) 0.551(0.062) 0.675(0.099) 0.270 0.526(0.038) 0.376(0.064)
Feeding guilds based on classification in Henriques et al. [16]. AA = army ant followers, F = solitary frugivores, FI = solitary frugivore-insectivores, I = solitary insectivores, IF = solitary insectivore-frugivores, MFI = mixed species insectivore flocks, MFIF = mixed species insectivore-frugivore flocks, N = nectarivores, SVLI = small vertebrates and large insects.
Birds of different feeding guilds in the tropics all had similar clutch sizes and number of broods per season, so the difference in RRI was the result of egg and female body mass. For nectarivores, mostly hummingbirds, egg mass and female body mass were small. For frugivores these values were higher than in insectivores, resulting in an average lower RRI for frugivores than for insectivores (Table 2 & 3). Estimation of the relative reproductive investment (RRI) has been calculated based on several life-history traits (Appendix 2 & 3). RRI was calculated per individual species and was combined per family and per feeding guild (Appendix 5 & 6). In the tropical regions, there was a broad range of RRI-values (0.253-0.814) among families with significant differences (Kruskal-Wallis: P=0.001). Among feeding guilds a trend was present (Kruskal-Wallis: P=0.079). In temperate regions significant differences were found in RRI-values both among families (Kruskal-Wallis: P<0.001) and feeding guilds (Kruskal-Wallis: P<0.001) (Appendix 5 & 6).
RRI among bird species with a preference for floodplain forest or terra-firme forest within feeding guilds was compared (Table 3). Only frugivores showed a significant higher RRI in floodplain forest compared to similar species in terra-firme forest (P=0.016; independent t-test) (Table 3). For comparison of life-history traits and RRI between the tropical and temperate region, families and feeding guilds present in both regions were compared (Table 4).

Mongabay.com Open Access Journal - Tropical Conservation Science Vol. 9 (1): 465-502, 2016
Tropical Conservation Science | ISSN 1940-0829 | Tropicalconservationscience.org
473
Table 3: Comparison of RRI from habitat specialists within feeding guilds. Average values (with Standard Error) and P-values for independent t-test and Mann Whitney U test are shown. See Table 2 for abbreviations of feeding guilds.
Floodplain forest Terra firme forest T-test Mann-Whitney
U-test
F FI I
0.724(0.074) 0.614(0.029) 0.642(0.085)
0.345(0.079) 0.633(0.044)
P=0.016 P=0.922
IF 0.457(0.015) MFI N SVLI
0.556(0.100) 0.578(0.132) 0.572(0.025)
0.401 0.509
P=0.667 P=1.000
Table 4: Comparison of relative reproductive investment between similar families and feeding guilds in the tropical and temperate regions. Average value (with Standard Error) is shown. Mann-Whitney U test and Independent T-test show significance of difference between these regions. See Table 2 for abbreviations of feeding guilds.
Family Tropical Temperate T-test Mann-Whitney
U-test
Alcedinidae Columbidae Cuculidae
0.572(0.025) 0.297(0.062) 0.814
1.435 0.290(0.096) 0.279
P=0.950
P=1.000 P=1.000
Emberizidae 0.666(0.071) 0.991(0.077) P=0.017 Falconidae Picidae Troglodytidae Turdidae
0.304(0.037) 0.270 1.099(0.074) 0.585(0.059)
0.373 0.407(0.073) 2.030 0.978(0.123)
P=0.508 P=0.012
P=1.000 P=1.000
Feeding guild Tropical Temperate T-test
F I IF MFI MFIF SVLI
0.587(0.055) 0.628(0.034) 0.550(0.061) 0.675(0.099) 0.270 0.376(0.064)
0.491(0.103) 0.810(0.070) 0.770(0.069) 1.317(0.318) 1.213(0.327) 0.412(0.041)
P=0.399 P=0.024 P=0.023 P=0.051 P=0.305 P=0.649
Life-history data in the tropical regions and in the temperate regions could be found only for the families presented in table 4. For Emberizidae and Turdidae, a significant (P<0.05; independent t-test) difference between species in the tropics and temperate regions was found. In both families, species in the temperate regions have a higher RRI than related species in the tropics (Table 4). Comparison of feeding guilds resulted in a significant difference between temperate and tropical regions for all insectivore-guilds: the RRI-value was higher in the temperate regions for insectivores, insectivore-frugivores, and mixed species flock insectivores. Other feeding guilds did not show a significant different RRI-value between these regions (Table 4). Army ant followers and nectarivores were not present in temperate regions.

Mongabay.com Open Access Journal - Tropical Conservation Science Vol. 9 (1): 465-502, 2016
Tropical Conservation Science | ISSN 1940-0829 | Tropicalconservationscience.org
474
Table 5: Average value (with SE) of life-history traits used in calculation for RRI. Average clutch size (ĉ), Number of broods per season (Nc) Egg mass in grams (megg) and Female body mass in grams (mfemale). See Table 2 for abbreviations of feeding guilds.
ĉ Nc megg mfemale
Tropical Temperate Tropical Temperate Tropical Temperate Tropical Temperate
Emberizidae Turdidae I IF MFI
2.49(0.15) 2.73(0.33) 2.29(0.11) 2.81(0.19) 2.16(0.11)
4.45(0.21) 5.17(0.21) 4.78(0.24) 5.45(0.25) 4.59(0.61)
2 2 1.94(0.03) 1.85(0.08) 1.97(0.03)
1.93(0.07) 1.77(0.19) 1.39(0.08) 1.37(0.09) 2.78(0.17)
1.94(0.27) 5.89(0.79) 4.10(0.42) 4.90(0.57) 2.84(0.57)
2.90(0.38) 3.75(0.62) 12.0(2.46) 11.4(3.32) 3.04(0.16)
16.34(2.66) 60.28(5.84) 29.42(2.79) 49.39(8.48) 22.15(2.12)
5.85(4.99) 3.58(11.2) 110(22.1) 174(59.6) 4.31(1.19)
The basic life-history traits in the significantly different RRIs for families and feeding guilds showed that in all situations temperate clutches were larger and number of clutches hardly differed in Emberizidae and Turdidae, but was lower in temperate insectivores and insectivore-frugivores and higher in mixed species flock insectivores. Egg mass was lower in the tropics in all insectivorous feeding guilds and Emberizidae, but not in Turdidae where female body masses were much higher (Table 5).
Discussion The variation in distribution of all tropical bird species in the Madre de Dios region might be due to specific abiotic factors within the floodplain and terra-firme forest. Although no significant difference was found in species richness and diversity, a trend suggested that these estimators were higher in terra-firme forest. This is in line with the idea that there is more stratification in terra-firme forest, as trees are taller, and more diversity and density of trees create more available niches for various bird species [13]. On the other hand, for most feeding guilds numbers are higher in the floodplain forest, so productivity may be higher there than in terra-firme forest (Fig. 3). Habitat associations were found for a large number of species that preferred either floodplain or terra-firme forest. Frugivore-insectivores and mixed species flock insectivores had more habitat specialists in floodplain forest, whereas insectivores had more in terra-firme forest. Comparison of total avian populations where division was based on feeding guilds showed a higher abundance of frugivores and insectivore-frugivores in floodplain forests, possibly because there is more flowering and fruiting of plants in floodplain forests [17], although for nectarivores no difference was found. Solitary insectivores, on the contrary, preferred terra-firme forests where the high diversity of trees is a source for a wide variety of insects [13]. Abundance of specific bird populations in habitats indicates an important role for different food availability in terra-firme and floodplain forest. Munn and Terborgh [17] and Henriques et al. [16] already suggested that insectivores were likely to be more abundant in terra-firme forest and frugivores more abundant in floodplain forest. This study supports those suggestions, with these specific feeding guilds being more abundant in their respective habitats. These habitats are threatened by deforestation, which increases fragmentation of areas and is detrimental to various bird species [27]. According to Gray et al. [10] insectivores and frugivores are the feeding guilds most prone to forest disturbance. As terra-firme and floodplain forests are severely reduced by deforestation in the Amazon, abundance of these feeding guilds is likely to decrease, affecting both trophic organization and ecological functioning of these areas. This ecological study was a pilot, as for certain species only trends

Mongabay.com Open Access Journal - Tropical Conservation Science Vol. 9 (1): 465-502, 2016
Tropical Conservation Science | ISSN 1940-0829 | Tropicalconservationscience.org
475
have become visible a larger scale study might more precisely determine species composition within these habitats. Such future research could also include monitoring of food availability within these habitats to define habitat-feeding guild relationships with more power. Comparison of the values for life-history traits, especially the RRI, among the various feeding guilds within the tropics showed differences, as frugivores had a relatively low relative reproductive investment compared to insectivores. Significant differences in RRI were found not only among feeding guilds but also among families, resulting in different tactics of reproduction and survival of these avian populations. Floodplain forests are fast-changing habitats for tropical birds due to flooding, biomass deposition from rivers, and secondary growth of the forest. These conditions seemed to lead to a higher RRI-value, as has been reported for frugivores, than for similar species in terra-firme forest. Other feeding guilds showed a similar trend, but due to lack of values of life-history traits for a number of species, numbers were quite low to base a conclusion on. The increased RRI in floodplain forest compared to terra-firme forest indicates a shift in the balance of reproduction and survival towards higher reproduction, made possible by the more nutrient-rich conditions in the floodplains, probably compensating for a higher risk of loss of either broods or higher juvenile and/or adult mortality due to flooding, for instance. Neotropical families of birds, especially those with low RRI, are more prone to deforestation and other environmental changes as these species do not easily compensate for increased adult mortality. Species composition of avian populations in terra-firme forests consists of birds with a relatively low relative reproductive investment, which are more susceptible to these anthropogenic impacts from, for example, deforestation. It has been long recognized that tropical birds differ fundamentally from temperate zone birds in their life-history traits. Tropical birds have high nest predation, high adult survival, and small clutch sizes [28,29]. Various other studies have questioned the validity of these differences [30,31]. This study showed that the RRI for comparable groups of behaviourally similar species is in most cases higher for species in the temperate regions than in the tropical regions. Significant differences were found between Emberizidae and Turdidae and insectivorous feeding guilds, in all of which the RRI was higher in the temperate species. As nest predation is high in tropical birds, these species invest less in offspring, resulting in a lower RRI; they may therefore have lower adult mortality and can spread the risks of failed broods over a longer time. In other words one may state that spring in the temperate regions gives the possibility of an increased investment in reproduction, due to its increased biomass production. The downside being the increased risk of either surviving winter or facing the costs and risks of migration. Tropical birds have smaller clutches than temperate zone birds, which is in line with other studies [32,33]. Larger clutch sizes have reduced food delivery, higher predation risk, and lower juvenile recruitment. In temperate regions, the food limitation hypothesis suggests that daylength in temperate regions allows these birds to gather more food to sustain larger clutches [34]. Growth rate in the tropics is slower [35] and food delivery rates are low [36]. Most tropical birds will renest after a first brood failure or have multiple broods per season, especially as in the tropics a relatively high nest predation is present as about 80% of the nests are lost to predators [29,36]. This number is so high because there is a large number and

Mongabay.com Open Access Journal - Tropical Conservation Science Vol. 9 (1): 465-502, 2016
Tropical Conservation Science | ISSN 1940-0829 | Tropicalconservationscience.org
476
diversity of nest predators in the tropics [32,37]. Tropical birds seem to invest less in their offspring, as the egg mass of tropical species is lower compared to temperate species. Female body mass as such varies extremely, without clear patterns. Because tropical birds have a lower RRI and invest less in their offspring due to higher predation risk, food limitation, and spreading the risk over the years, their naturally higher adult survival renders them extra vulnerable to increased adult mortality from anthropogenic influences.
Fig. 4: Some bird species from the Amazon Basin within the Tambopata National Reserve and Bahuaja Sonene National Park. A. Band-tailed Manakin (Pipra fasciicauda) B. American Pygmy-kingfisher (Chloroceryle aenea) C. Plumbeous antbird (Myrmeciza hyperythra) D. Green-and-gold Tanager (Tangara schrankii) (All photos by Alexis Diaz Campo).
Implications for conservation Understanding distribution differences of behaviourally similar species among tropical forest types is important for identifying bird species prone to anthropogenic factors, as these forests are currently subjected to deforestation and fragmentation. The results in this study show specific foraging groups to be more abundantly present in either terra-firme or floodplain forests (Fig. 4). The species-specific life-history traits of these birds show that the relative reproductive effort is lower in terra-firme forest species. Which means that birds here invest less in reproduction and more in adult survival, these birds cannot compensate for the high adult mortality caused by deforestation, whereas floodplain forest species invest more in reproduction and can better cope with such anthropogenic factors. These values for
A B
C D

Mongabay.com Open Access Journal - Tropical Conservation Science Vol. 9 (1): 465-502, 2016
Tropical Conservation Science | ISSN 1940-0829 | Tropicalconservationscience.org
477
distribution and relative reproductive investment are important in understanding the differences in the ability of birds to cope with environmental changes and is therefore advised to be used in conservation activities.
Acknowledgements Special thanks to A. Diaz Campo and L. Cueto for their field assistance and critically reviewing this study, and thanks to all the interns and staff at Fauna Forever and the Department of Animal Ecology and Ecophysiology for their help in our research.
References [1] Nepstad, D.C., Verissimo, A., Alencar, A., Nobre, C., Lima, E., Lefebvre, P., Schlesinger, P.,
Potter, C., Moutinho, P., Mendoza, E., Cochrane, M. and Brooks, V. 1999. Large-scale impoverishment of Amazonian rainforests by logging and fire. Nature 398:505-508.
[2] Foley, J.A., Asner, G.P., Costa, M.H., Coe, M.T., DeFries, R., Gibbs, H.K., Howard, E.A., Olson, S., Patz, J., Ramankutty, N. and Snyder, P. 2007. Amazonia revealed: forest degradation and loss of ecosystem goods and services in the Amazon Basin. Frontiers in Ecology and the Environment 5:25-32.
[3] Costa, M.H. and Foley J.A. 1997. Water balance of the Amazon Basin: Dependence on vegetation cover and canopy conductance. Journal of Geophysical Research 102:973-989.
[4] Costa, M.H. and Foley, J.A. 2000. Combined effects of deforestation and doubled atmospheric CO2 concentrations on the climate of Amazonia. Journal of Climate 13:18-34.
[5] Junk, W.J., Bayley, P.B. and Sparks, R.E. 1989. The flood pulse concept in river-floodplain systems. Canadian Journal of Fisheries and Aquatic Sciences 106:110–127.
[6] Johnson, E.I., Stouffer, P.C. and Vargas, C.F. 2011. Diversity, biomass, and trophic structure of a central Amazonian rainforest bird community. Revista Brasileira de Ornitologia 19:1-15.
[7] Nichols, E., Uriarte, M., Peres, C.A., Louzada, J., Braga, R.F., Schiffler, G., Endo, W. and Spector, S.H. 2013. Human-Induced trophic cascades along the fecal detritus pathway. PLoS Biology 8:1-10.
[8] Dirzo, R. and Raven, P.H. 2003. Global state of biodiversity and loss. Annual Review on Environment and Resources 28:137–67.
[9] Gabbe, A.P., Robinson, S.K. and Brawn, J.D. 2002. Tree-species preferences of foraging insectivorous birds: implications for floodplain forest restoration. Conservation Biology 16: 462-470.
[10] Gray, M.A., Baldauf, S.L., Mayhew, P.J. and Hill, J.K. 2007. The response of avian feeding guilds to tropical forest disturbance. Conservation Biology 21:133-141.
[11] Laranjeiras, T.O., Naka, L.N., Bechtoldt, C.L., da Costa, T.V.V., Andretti, C.B., Cerqueira, M.C., de Fatima Torres, M., Rodrigues, G.L., Santos, M.P.D., Vargas, C.F., Pacheco, A.M.F., Sardelli, C.H., Mazar-Barnett, J. and Cohn-Haft, M. 2014. The avifauna of Virua National Park, Roraima, reveals megadiversity in northern Amazonia. Revista Brasileira de Ornitologia 22:138-171.
[12] Beja, P., Santos, C.D., Santana, J., Pereira, M.J., Marques, J.T., Queiroz, H.L. and Palmeirim, J.M. 2010. Seasonal patterns of spatial variation in understory bird assemblages across a mosaic of flooded and unflooded Amazonian forests. Biodiversity and Conservation 19:129-152.

Mongabay.com Open Access Journal - Tropical Conservation Science Vol. 9 (1): 465-502, 2016
Tropical Conservation Science | ISSN 1940-0829 | Tropicalconservationscience.org
478
[13] Aleixo, A. 2004. Historical diversification of a Terra-Firme forest bird superspecies: A phylogeographic perspective on the role of different hypotheses of Amazonian diversification. Evolution 58:1303-1317.
[14] Wunderle, J.M., Willig, M.R. and Henriques, L.M.P. 2005. Avian distribution in treefall gaps and understorey of terra firme forest in the lowland Amazon. Ibis 147:109-129.
[15] Lucas, C.M., Schöngart, J., Sheikh, P., Wittmann, F., Piedade, M.T.F. and McGrath, D.G. 2014. Effects of land-use and hydroperiod on aboveground biomass and productivity of secondary Amazonian floodplain forests. Forest Ecology and Management 319:116-127.
[16] Henriques, L.M.P., Wunderle, J.M. Jr. and Willig, M.R. 2003. Birds of the Tapajós National Forest, Brazilian Amazon: a preliminary assessment. Ornitologia Neotropica 14:307–338.
[17] Munn, C.A. and Terborgh, J.W. 1979. Multi-species territoriality in Neotropical foraging flocks. The Condor 81:338–347.
[18] Van Turnhout, C.A.M., Leuven, R.S.E.W., Hendriks, A.J., Kurstjens, G., van Strien, A.J., Foppen, R.P.B. and Siepel, H. 2012. Ecological strategies successfully predict the effects of river floodplain rehabilitation on breeding birds. River Research and Applications 28:269-282.
[19] Karr, J.R. 1981. Surveying birds with mist nets. Studies in Avian Biology 6:62–67. [20] Bierregaard, R. O. Jr. 1990a. Avian communities in the understory of Amazonian forest
fragments. In: Biogeography and Ecology of Forest Bird Communities, pp. 333-343. SPB Academic Publishing, The Hague.
[21] Bierregaard, R. O. Jr. 1990b. Species composition and trophic organization of the understory bird community in a Central Amazonian terra firme forest. In: Four Neotropical Rainforests, pp. 217-236. Yale University Press, New Haven.
[22] Remsen, J.V. Jr. and Good, D.A. 1996. Misuse of data from mistnet captures to assess relative abundance in bird populations. The Auk 113:381–398.
[23] Schulenberg, T.S., Stotz, D.F., Lane, D.F., O’Neill, J.P. and Parker, T.A. 2010. Birds of Peru: revised and updated edition. Princeton University Press, Princeton.
[24] Gotelli, N.J. and Colwell, R.K. 2011. Estimating species richness. Biological diversity: Frontiers in measurement and assessment 12:39-54.
[25] Shannon, C. 1948. A mathematical theory of communication. The Bell System Technical Journal 27:379–423.
[26] Simpson, E.H. 1949. Measurement of diversity. Nature 163:688. [27] Stratford, J.A. and Stouffer, P.C. 1999. Local extinctions of terrestrial insectivorous birds
in a fragmented landscape near Manuas, Brazil. Conservation Biology 13:1416-1423. [28] Lack, D. 1947. The significance of clutch-size. Ibis 89:302-352. [29] Fogden, M.P.L. 1972. The seasonality and population dynamics of equatorial forest birds
in Sarawak. Ibis 114:307-343. [30] Karr, J.R., Nichols, J.D., Klimkiewicz, M.K. and Brawn, J.D. 1990. Survival rates of birds of
tropical and temperate forests: will the dogma survive? The American Naturalist 136:277-291.
[31] Martin, T.E. 1996. Life history evolution in tropical and south temperate birds: what do we really know? Journal of Avian Biology 27:263-272.
[32] Skutch, A.F. 1985. Clutch size, nesting success, and predation on nests of neotropical birds, reviewed. Ornithology Monographs 36:575-594.
[33] Kulesza, G. 1990. An analysis of clutch-size in New World passerine birds. Ibis 132:407-422.

Mongabay.com Open Access Journal - Tropical Conservation Science Vol. 9 (1): 465-502, 2016
Tropical Conservation Science | ISSN 1940-0829 | Tropicalconservationscience.org
479
[34] Murray, B.G. Jr. 1985. Evolution of clutch size in tropical species of birds. Ornithology Monographs 36:505-519.
[35] Ricklefs, R.E. 1977. On the evolution of reproductive strategies in birds: reproductive effort. The American Naturalist 111:453-478.
[36] Willis, E.O. 1967. The behavior of Bicolored Antbirds. University of California press, Oakland.
[37] Roper, J.J. and Goldstein, R.R. 1997. A test of the Skutch hypothesis: does activity at nests increase nest predation risk? Journal of Avian Biology 28:111-117.
[38] Jetzt, W., Sekercioglu, C.H. and Böhning-Gaese, K. 2008. The worldwide variation in avian clutch size across species and space. PLoS Biology 6:2650-2657.
[39] Del Hoyo, J., Elliot, A. and Christie, D.A. 1992. Handbook of the birds of the world (Vol. 1-16). Lynx Edicions, Barcelona.
[40] Schönwetter, M. and Meise, W. 1961. Handbuch der Oologie (Lieferung 1-43). Akademie Berlin, Berlin.

Mongabay.com Open Access Journal - Tropical Conservation Science Vol. 9 (1): 465-502, 2016
Tropical Conservation Science | ISSN 1940-0829 | Tropicalconservationscience.org
480
Appendix 1
Classification of sites with terra-firme forest or floodplain forest (X indicates presence of forest type at location).
Site Coordinates Terra-firme forest Floodplain forest
AFF-House ARCC AZUL
S 12 36 42.6, W 69 11 44.9 S 12 2 47.6, W 69 40 37.0 S 13 2 40.1, W 69 54 37.1
X
X X X
BAL S 12 51 0.3, W 69 27 27.0 X BOZ CHUN CICRA EI LIMON
MALI PAMPA PIE RA SAONA SC TPL TRC WASAI
S 11 35 12.8, W 69 38 56.9 S 12 58 18.0, W 69 30 12.1 S 12 34 8.6, W 70 6 3.4 S 12 50 13.3, W 69 17 36.4 S 12 32 20.9, W 68 51 42.1 S 12 56 2.1, W 69 31 2.2 S 12 56 59.8, W 68 54 45.8 S 12 3 23.5, W 69 31 43.4 S 12 32 26.6, W 69 3 11.1 S 12 44 45.6, W 69 14 0.1 S 12 51 12.5, W 69 22 3.4 S 12 49 27.7, W 69 24 10.7 S 13 8 3.2, W 69 36 38.9 S 12 51 2.1, W 69 28 9.3
X X X
X X
X X X X
X X X X X X X

Mongabay.com Open Access Journal - Tropical Conservation Science Vol. 9 (1): 465-502, 2016
Tropical Conservation Science | ISSN 1940-0829 | Tropicalconservationscience.org
481
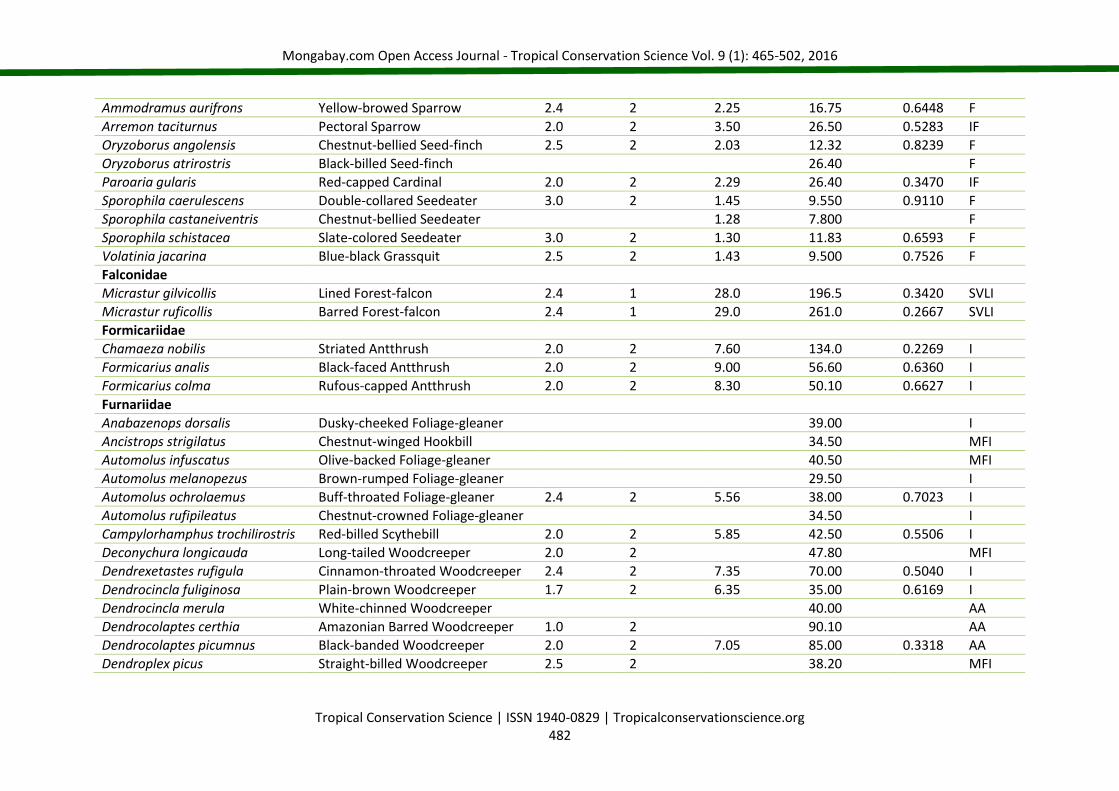
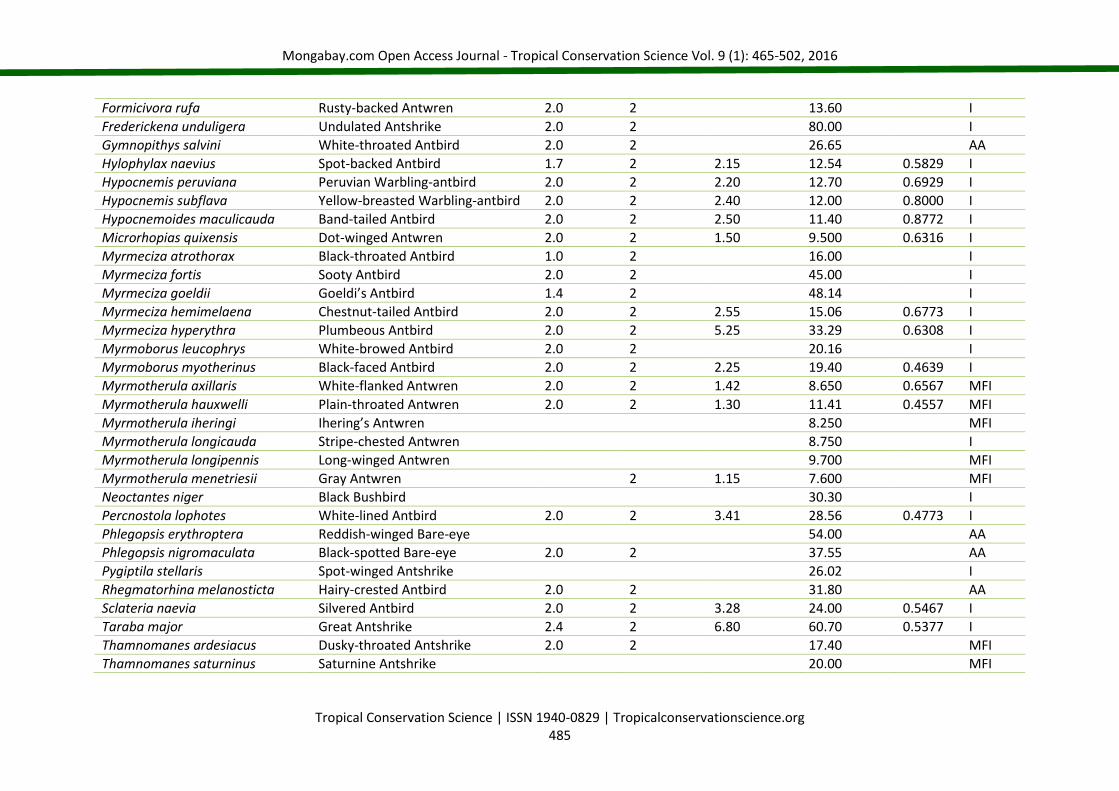
Appendix 2 Guild classification of captured bird species in Madre de Dios region, Peru based on Henriques et al. [16], Wunderle et al. [14] and Schulenberg et al. [23]. Life-history traits (average clutch size, number of broods per season, egg mass and female body mass) for estimation of the relative reproductive investment (RRI) based on Jetzt et al. [38], Del Hoyo et al. [39], Schönwetter and Meise [40] and field-data.
Species[1] English name[1] Average clutch size
Number of broods per season
Egg mass (g) Female body mass (g)
RRI Feeding guild[a]
Alcedinidae
Chloroceryle aenea American Pygmy-kingfisher 3.5 1 2.40 14.05 0.5979 SVLI
Chloroceryle inda Green-and-rufous Kingfisher 3.9 1 7.40 52.75 0.6471 SVLI
Bucconidae
Bucco macrodactylus Chestnut-capped Puffbird 25.00 I
Malacoptila semicincta Semicollared Puffbird 1 7.40 44.00 I
Monasa morphoeus White-fronted Nunbird 2.4 1 7.50 82.00 0.2195 SVLI
Monasa nigrifrons Black-fronted Nunbird 3.0 1 7.90 83.00 0.2855 SVLI
Cardinalidae
Cyanocompsa cyanoides Blue-black Grossbeak 2.0 2 27.87 FI
Saltator grossus Slate-colored Grosbeak 2.5 2 47.00 FI
Saltator maximus Buff-throated Saltator 2.0 2 5.75 49.10 0.4684 FI
Columbidae
Claravis pretiosa Blue-Ground Dove 2.0 3 3.80 93.50 0.2438 F
Columbina talpacoti Ruddy Ground-dove 2.0 3 3.60 45.27 0.4771 F
Geotrygon montana Ruddy Quail-dove 2.0 3 5.30 115.2 0.2760 F
Leptotila rufaxilla Grey-fronted Dove 1.4 3 6.80 149.0 0.1917 F
Conopophagidae
Conopophaga peruviana Ash-throated Gnateater 2.0 2 23.30 I
Cotingidae
Lipaugus vociferans Screaming Piha 82.60 FI
Cuculidae
Crotophaga ani Smooth-billed Ani 2.9 2 13.2 94.00 0.8145 I
Emberizidae
Mongabay.com Open Access Journal - Tropical Conservation Science Vol. 9 (1): 465-502, 2016
Tropical Conservation Science | ISSN 1940-0829 | Tropicalconservationscience.org
482
Ammodramus aurifrons Yellow-browed Sparrow 2.4 2 2.25 16.75 0.6448 F
Arremon taciturnus Pectoral Sparrow 2.0 2 3.50 26.50 0.5283 IF
Oryzoborus angolensis Chestnut-bellied Seed-finch 2.5 2 2.03 12.32 0.8239 F
Oryzoborus atrirostris Black-billed Seed-finch 26.40 F
Paroaria gularis Red-capped Cardinal 2.0 2 2.29 26.40 0.3470 IF
Sporophila caerulescens Double-collared Seedeater 3.0 2 1.45 9.550 0.9110 F
Sporophila castaneiventris Chestnut-bellied Seedeater 1.28 7.800 F
Sporophila schistacea Slate-colored Seedeater 3.0 2 1.30 11.83 0.6593 F
Volatinia jacarina Blue-black Grassquit 2.5 2 1.43 9.500 0.7526 F
Falconidae
Micrastur gilvicollis Lined Forest-falcon 2.4 1 28.0 196.5 0.3420 SVLI
Micrastur ruficollis Barred Forest-falcon 2.4 1 29.0 261.0 0.2667 SVLI
Formicariidae
Chamaeza nobilis Striated Antthrush 2.0 2 7.60 134.0 0.2269 I
Formicarius analis Black-faced Antthrush 2.0 2 9.00 56.60 0.6360 I
Formicarius colma Rufous-capped Antthrush 2.0 2 8.30 50.10 0.6627 I
Furnariidae
Anabazenops dorsalis Dusky-cheeked Foliage-gleaner 39.00 I
Ancistrops strigilatus Chestnut-winged Hookbill 34.50 MFI
Automolus infuscatus Olive-backed Foliage-gleaner 40.50 MFI
Automolus melanopezus Brown-rumped Foliage-gleaner 29.50 I
Automolus ochrolaemus Buff-throated Foliage-gleaner 2.4 2 5.56 38.00 0.7023 I
Automolus rufipileatus Chestnut-crowned Foliage-gleaner 34.50 I
Campylorhamphus trochilirostris Red-billed Scythebill 2.0 2 5.85 42.50 0.5506 I
Deconychura longicauda Long-tailed Woodcreeper 2.0 2 47.80 MFI
Dendrexetastes rufigula Cinnamon-throated Woodcreeper 2.4 2 7.35 70.00 0.5040 I
Dendrocincla fuliginosa Plain-brown Woodcreeper 1.7 2 6.35 35.00 0.6169 I
Dendrocincla merula White-chinned Woodcreeper 40.00 AA
Dendrocolaptes certhia Amazonian Barred Woodcreeper 1.0 2 90.10 AA
Dendrocolaptes picumnus Black-banded Woodcreeper 2.0 2 7.05 85.00 0.3318 AA
Dendroplex picus Straight-billed Woodcreeper 2.5 2 38.20 MFI

Mongabay.com Open Access Journal - Tropical Conservation Science Vol. 9 (1): 465-502, 2016
Tropical Conservation Science | ISSN 1940-0829 | Tropicalconservationscience.org
483
Furnarius leucopus Pale-legged Hornero 2.0 2 4.95 49.00 0.4041 I
Glyphorhynchus spirurus Wedge-billed Woodcreeper 1.7 2 1.75 14.82 0.4015 MFI
Hyloctistes subulatus Striped Woodhaunter 29.50 MFI
Lepidocolaptes albolineatus Lineated Woodcreeper 2 4.74 19.25 MFI
Nasica longirostris Long-billed Woodcreeper 85.00 I
Philydor erythrocercum Rufous-rumped Foliage-gleaner 2.0 2 24.50 MFI
Philydor erythropterum Chestnut-winged Foliage-gleaner 32.00 MFI
Philydor pyrrhodes Cinnamon-rumped Foliage-gleaner 29.50 MFI
Philydor ruficaudatum Rufous-tailed Foliage-gleaner 2 3.68 26.50 MFI
Sclerurus albigularis Gray-throated Leaftosser 2.0 2 5.41 40.00 0.5410 I
Sclerurus caudacutus Black-tailed Leaftosser 2.0 2 5.58 38.00 0.5874 I
Sclerurus mexicanus Tawny-throated Leaftosser 2.0 2 27.00 I
Simoxenops ucayalae Peruvian Recurvebill 51.10 I
Sittasomus griseicapillus Olivaceous Woodcreeper 3.0 2 2.35 12.00 1.1750 MFI
Synallaxis gujanensis Plain-crowned Spinetail 2.4 2 2.93 17.50 0.8037 I
Synallaxis rutilans Ruddy Spinetail 3.5 2 2.25 18.50 0.8514 MFI
Xenops minutus Plain Xenops 2.0 2 11.00 MFI
Xiphocolaptes promeropirhynchus Strong-billed Woodcreeper 2.5 2 13.3 140.0 0.4750 I
Xiphorhynchus elegans Elegant Woodcreeper 2.0 2 36.86 MFI
Xiphorhynchus guttatus Buff-throated Woodcreeper 1.7 2 7.46 56.00 0.4529 MFI
Xiphorhynchus ocellatus Ocellated Woodcreeper 2 37.00 MFI
Galbulidae
Galbula cyanescens Bluish-fronted Jacamar 2.0 2 4.30 24.00 0.7167 I
Icteridae
Clypicterus oseryi Casqued Oropendola 101.4 F
Momotidae
Baryphthengus martii Rufous Motmot 146.6 IF
Electron platyrhynchum Broad-billed Motmot 2.5 1 8.10 61.00 0.3320 IF
Momotus momota Amazonian Motmot 3.5 1 7.50 140.0 0.1875 IF
Parulidae
Dendroica petechia Yellow Warbler 4.5 1 1.35 11.70 0.5192 I

Mongabay.com Open Access Journal - Tropical Conservation Science Vol. 9 (1): 465-502, 2016
Tropical Conservation Science | ISSN 1940-0829 | Tropicalconservationscience.org
484
Phaeothlypis fulvicauda Buff-rumped Warbler 2.0 1 2.39 14.90 0.3208 I
Picidae
Celeus elegans Chestnut Woodpecker 3.0 2 7.30 162.2 0.2701 MFIF
Picumnus rufiventris Rufous-breasted Piculet 1.20 19.78 I
Pipridae
Chiroxiphia pareola Blue-backed Manakin 2.0 2 2.40 21.05 0.4561 F
Lepidothrix coronata Blue-crowned Manakin 2.0 2 10.85 F
Machaeropterus pyrocephalus Fiery-capped Manakin 2.0 2 1.58 10.60 0.5962 F
Manacus manacus White-bearded Manakin 2.0 2 2.10 14.94 0.5622 F
Neopelma sulphureiventer Sulphur-bellied Tyrant-manakin 15.00 IF
Pipra chloromeros Round-tailed Manakin 16.10 F
Pipra fasciicauda Band-tailed Manakin 2.0 2 2.75 16.73 0.6575 F
Pipra rubrocapilla Red-headed Manakin 2.0 2 1.96 14.65 0.5352 F
Piprites chloris Wing-barred Piprites 2 2.80 18.00 I
Xenopipo atronitens Black Manakin 15.25 IF
Psittacidae
Brotogeris versicolurus White-winged Parakeet 4.5 1 3.55 60.00 0.2663 F
Ramphastidae
Aulacorhynchus prasinus Emerald Toucanet 2.2 2 170.0 FI
Pteroglossus azara Ivory-billed Aracari 2.8 2 142.0 FI
Pteroglossus beauharnaesii Curl-crested Aracari 222.0 FI
Selenidera reinwardtii Red-billed Toucanet 153.5 FI
Strigidae
Megascops watsonii Tawny-bellied Screech-owl 1 160.1 SVLI
Thamnophilidae
Cercomacra nigrescens Blackish Antbird 2 3.00 20.50 I
Cercomacra serva Black Antbird 2.0 2 2.40 16.00 0.6000 I
Dichrozona cincta Banded Antbird 14.75 I
Epinecrophylla haematonota Stipple-throated Antwren 10.10 MFI
Epinecrophylla leucophthalma White-eyed Antwren 9.420 MFI
Epinecrophylla ornata Ornate Antwren 9.540 MFI
Mongabay.com Open Access Journal - Tropical Conservation Science Vol. 9 (1): 465-502, 2016
Tropical Conservation Science | ISSN 1940-0829 | Tropicalconservationscience.org
485
Formicivora rufa Rusty-backed Antwren 2.0 2 13.60 I
Frederickena unduligera Undulated Antshrike 2.0 2 80.00 I
Gymnopithys salvini White-throated Antbird 2.0 2 26.65 AA
Hylophylax naevius Spot-backed Antbird 1.7 2 2.15 12.54 0.5829 I
Hypocnemis peruviana Peruvian Warbling-antbird 2.0 2 2.20 12.70 0.6929 I
Hypocnemis subflava Yellow-breasted Warbling-antbird 2.0 2 2.40 12.00 0.8000 I
Hypocnemoides maculicauda Band-tailed Antbird 2.0 2 2.50 11.40 0.8772 I
Microrhopias quixensis Dot-winged Antwren 2.0 2 1.50 9.500 0.6316 I
Myrmeciza atrothorax Black-throated Antbird 1.0 2 16.00 I
Myrmeciza fortis Sooty Antbird 2.0 2 45.00 I
Myrmeciza goeldii Goeldi’s Antbird 1.4 2 48.14 I
Myrmeciza hemimelaena Chestnut-tailed Antbird 2.0 2 2.55 15.06 0.6773 I
Myrmeciza hyperythra Plumbeous Antbird 2.0 2 5.25 33.29 0.6308 I
Myrmoborus leucophrys White-browed Antbird 2.0 2 20.16 I
Myrmoborus myotherinus Black-faced Antbird 2.0 2 2.25 19.40 0.4639 I
Myrmotherula axillaris White-flanked Antwren 2.0 2 1.42 8.650 0.6567 MFI
Myrmotherula hauxwelli Plain-throated Antwren 2.0 2 1.30 11.41 0.4557 MFI
Myrmotherula iheringi Ihering’s Antwren 8.250 MFI
Myrmotherula longicauda Stripe-chested Antwren 8.750 I
Myrmotherula longipennis Long-winged Antwren 9.700 MFI
Myrmotherula menetriesii Gray Antwren 2 1.15 7.600 MFI
Neoctantes niger Black Bushbird 30.30 I
Percnostola lophotes White-lined Antbird 2.0 2 3.41 28.56 0.4773 I
Phlegopsis erythroptera Reddish-winged Bare-eye 54.00 AA
Phlegopsis nigromaculata Black-spotted Bare-eye 2.0 2 37.55 AA
Pygiptila stellaris Spot-winged Antshrike 26.02 I
Rhegmatorhina melanosticta Hairy-crested Antbird 2.0 2 31.80 AA
Sclateria naevia Silvered Antbird 2.0 2 3.28 24.00 0.5467 I
Taraba major Great Antshrike 2.4 2 6.80 60.70 0.5377 I
Thamnomanes ardesiacus Dusky-throated Antshrike 2.0 2 17.40 MFI
Thamnomanes saturninus Saturnine Antshrike 20.00 MFI

Mongabay.com Open Access Journal - Tropical Conservation Science Vol. 9 (1): 465-502, 2016
Tropical Conservation Science | ISSN 1940-0829 | Tropicalconservationscience.org
486
Thamnomanes schistogynus Bluish-slate Antshrike 2.0 2 19.38 MFI
Thamnophilus aethiops White-shouldered Antshrike 2.0 2 3.02 25.23 0.4788 MFI
Thamnophilus doliatus Barred Antshrike 1.7 2 3.60 29.60 0.4135 I
Thamnophilus schistaceus Plain-winged Antshrike 2.0 2 22.07 MFI
Willisornis poecilinotus Scale-backed Antbird 2.0 2 3.50 19.36 0.7231 I
Thraupidae
Euphonia chlorotica Purple-throated Euphonia 3.9 3 1.15 11.15 1.2067 F
Habia rubica Red-crowned Ant-tanager 2.5 2 4.00 31.11 0.6429 FI
Lanio versicolor White-winged Shrike-tanager 2.0 2 18.15 MFI
Ramphocelus carbo Silver-beaked Tanager 2.0 2 3.30 27.30 0.4835 IF
Tachyphonus cristatus Flame-crested Tanager 2 3.20 33.60 MFIF
Tangara schrankii Green-and-gold Tanager 2.0 2 19.67 MFI
Tinamidae
Crypturellus bartletti Bartlett’s Tinamou 3 40.0 241.0 F
Trochilidae
Amazilia lactea Sapphire-spangled Emerald 2.0 2 0.46 3.600 0.5111 N
Campylopterus largipennis Grey-breasted Sabrewing 2.0 2 7.000 N
Chlorostilbon mellisugus Blue-tailed Emerald 2.0 2 0.40 3.970 0.4030 N
Chrysuronia oenone Golden-tailed Sapphire 2.0 2 0.65 4.300 0.6047 N
Florisuga mellivora White-necked Jacobin 2.0 2 0.82 7.130 0.4600 N
Glaucis hirsutus Rufous-breasted Hermit 2.0 2 0.72 5.660 0.5088 N
Heliodoxa aurescens Gould’s Brilliant 2.0 2 6.000 N
Hylocharis cyanus White-chinned Sapphire 2.0 2 3.150 N
Phaethornis hispidus White-bearded Hermit 2.0 2 1.05 5.050 0.8317 N
Phaethornis longirostris Long-billed Hermit 2.0 2 5.250 N
Phaethornis malaris Great-billed Hermit 2.0 2 6.100 N
Phaethornis philippii Needle-billed Hermit 4.750 N
Phaethornis ruber Reddish Hermit 2.0 2 0.38 4.500 0.3378 N
Phaethornis superciliosus Long-tailed Hermit 2.0 2 0.85 5.450 0.6239 N
Phaethornis stuarti White-browed Hermit 2.500 N
Polytmus guainumbi White-tailed Goldenthroat 2.0 2 0.70 4.760 0.5882 N

Mongabay.com Open Access Journal - Tropical Conservation Science Vol. 9 (1): 465-502, 2016
Tropical Conservation Science | ISSN 1940-0829 | Tropicalconservationscience.org
487
Thalurania furcata Fork-tailed Woodnymph 2.0 2 0.54 4.200 0.5143 N
Threnetes leucurus Pale-tailed Barbthroat 2.0 2 0.56 5.730 0.3909 N
Troglodytidae
Cyphorhinus arada Musician Wren 2.0 2 26.14 I
Microcerculus marginatus Southern Nightingale-wren 2.4 2 3.74 17.50 1.0258 I
Thryothorus genibarbis Moustached Wren 2 2.00 19.50 I
Troglodytes aedon Northern House Wren 5.7 2 1.38 13.40 1.1740 I
Trogonidae
Trogon collaris Collared Trogon 2.4 1 8.50 53.22 0.3833 FI
Trogon curucui Blue-crowned Trogon 2.4 1 6.20 51.00 0.2918 FI
Trogon melanurus Black-tailed Trogon 2.4 1 70.00 FI
Turdidae
Catharus ustulatus Swainson’s Thrush 3.5 2 3.60 35.00 0.7200 IF
Turdus albicollis White-throated Thrush 2.4 2 6.45 53.00 0.5842 FI
Turdus amaurochalinus Creamy-bellied Thrush 3.0 2 6.30 62.50 0.6048 IF
Turdus hauxwelli Hauxwell’s Thrush 71.25 IF
Turdus ignobilis Black-billed Thrush 2.0 2 7.20 66.90 0.4305 IF
Turdus lawrencii Lawrence’s Thrush 2 73.00 IF
Tyrannidae
Attila bolivianus Dull-capped Attila 2.0 2 4.65 42.50 0.4376 I
Attila spadiceus Bright-rumped Attila 2.8 2 3.80 37.70 0.5645 I
Cnemotriccus fuscatus Fuscous Flycatcher 3.0 2 2.48 11.90 1.2504 I
Corythopis torquatus Ringed Antpipit 2.0 2 16.00 I
Elaenia parvirostris Small-billed Elaenia 2.4 2 2.03 13.80 0.7061 F
Elaenia spectabilis Large Elaenia 2.0 2 2.80 29.00 0.3862 F
Elaenia strepera Slaty Elaenia 2.0 2 2.88 19.00 0.6063 F
Empidonax alnorum Alder Flycatcher 3.5 2 1.82 13.00 0.9800 I
Hemitriccus flammulatus Flammulated Pygmy-tyrant 10.25 I
Hemitriccus griseipectus White-bellied Tody-tyrant 8.950 I
Inezia inornata Plain Tyrannulet 2 1.30 5.750 I
Laniocera hypopyrra Cinereous Mourner 2.0 2 40.40 IF

Mongabay.com Open Access Journal - Tropical Conservation Science Vol. 9 (1): 465-502, 2016
Tropical Conservation Science | ISSN 1940-0829 | Tropicalconservationscience.org
488
Lathrotriccus euleri Euler’s Flycatcher 2.4 2 1.77 11.00 0.7724 I
Leptopogon amaurocephalus Sepia-capped Flycatcher 2.4 2 2.17 11.20 0.9300 MFI
Lophotriccus eulophotes Long-crested Pygmy-tyrant 7.250 I
Mionectes macconnelli McConnell’s Flycatcher 3.0 2 11.00 IF
Mionectes oleagineus Ochre-bellied Flycatcher 3.2 2 13.00 IF
Mionectes olivaceus Olive-striped Flycatcher 2.4 2 1.99 12.00 0.7960 F
Myiarchus ferox Short-crested Flycatcher 2.4 2 3.38 28.75 0.5643 IF
Myiarchus tyrannulus Brown-crested Flycatcher 3.9 2 3.68 29.80 0.9632 IF
Myiophobus fasciatus Bran-colored Flycatcher 1.4 2 1.60 10.00 0.4480 I
Ochthornis littoralis Drab Water-tyrant 3.5 2 13.40 I
Onychorhynchus coronatus Royal Flycatcher 2.0 2 1.76 12.52 0.5623 I
Pachyramphus minor Pink-throated Becard 4.9 2 2.45 37.00 0.6489 I
Pitangus sulphuratus Great Kiskadee 3.9 2 5.80 60.50 0.7478 IF
Platyrinchus coronatus Golden-crowned Spadebill 2.0 2 9.200 I
Platyrinchus platyrhynchos White-crested Spadebill 12.25 I
Platyrinchus saturatus Cinnamon-crested Spadebill 10.60 I
Ramphotrigon fuscicauda Dusky-tailed Flatbill 2.0 2 19.00 I
Ramphotrigon megacephalum Large-headed Flatbill 2.0 2 2.62 14.00 0.7486 I
Ramphotrigon ruficauda Rufous-tailed Flatbill 3.0 2 19.75 I
Rhynchocyclus olivaceus Olivaceous Flatbill 2.4 2 2.45 21.00 0.5600 I
Rhytipterna simplex Greyish Mourner 35.50 I
Schiffornis turdina Thrush-like Mourner 2.0 2 4.01 31.00 0.5174 I
Terenotriccus erythrurus Ruddy-tailed Flycatcher 2.0 2 1.14 7.200 0.6333 I
Tyrannus melancholicus Tropical Kingbird 3.2 2 4.10 37.60 0.6979 IF
Vireonidae
Hylophilus hypoxanthus Dusky-capped Greenlet 17.00 MFI
Hylophilus ochraceiceps Tawny-crowned Greenlet 2.0 1 1.95 10.75 0.3628 I [1]Species and English names based on Schulenberg et al. [23] and Del Hoyo et al. [39]. [a]Feeding guild: AA= army ant follower, F= solitary frugivore, FI= solitary frugivore-insectivore, I= solitary insectivore, IF= solitary insectivore-frugivore, MFI= mixed species insectivore flocks, MFIF= mixed species insectivore-frugivore flocks, N= nectarivore, SVLI= small vertebrates and large insects.

Mongabay.com Open Access Journal - Tropical Conservation Science Vol. 9 (1): 465-502, 2016
Tropical Conservation Science | ISSN 1940-0829 | Tropicalconservationscience.org
489
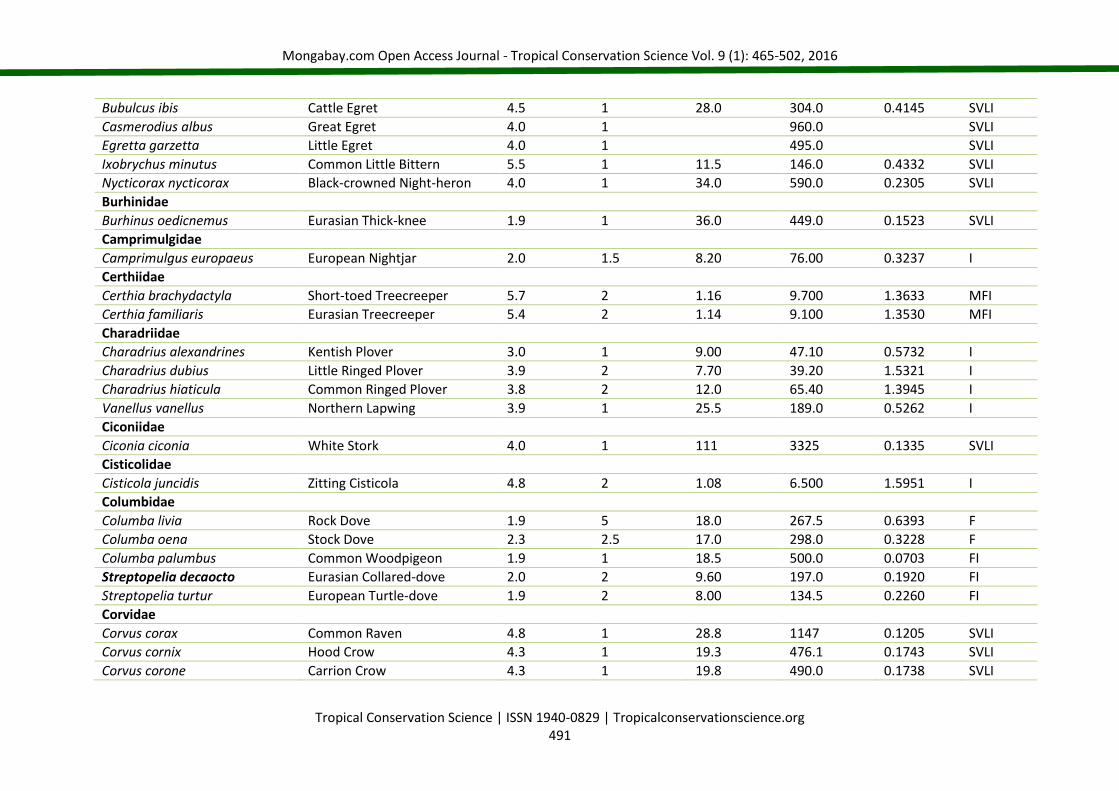
Appendix 3 Guild classification and life-history traits (average clutch size, number of broods per season, egg mass and female body mass) of West-European birds for estimation of the relative reproductive investment (RRI) based on Del Hoyo et al. [39] and field-data.
Species[1] English name[1] Average clutch size
Number of broods per season
Egg mass (g) Female body mass (g)
RRI Feeding guild[a]
Accipitridae
Accipiter gentilis Northern Goshawk 3.6 1 55.0 1206 0.1642 SVLI
Accipiter nisus Eurasian Sparrowhawk 4.9 1 23.0 264.0 0.4269 SVLI
Buteo buteo Eurasian Buzzard 2.8 1 53.2 915.0 0.1628 SVLI
Circus aeruginosus Western Marsh-harrier 4.7 1 40.0 669.0 0.2810 SVLI
Circus cyaneus Hen Harrier 4.5 1 31.0 527.0 0.2647 SVLI
Circus pygargus Montagu’s Harrier 4.2 1 25.0 370.0 0.2838 SVLI
Milvus migrans Black Kite 2.5 1 56.0 850.0 0.1647 SVLI
Milvus milvus Red Kite 2.1 1 61.0 1213 0.1056 SVLI
Pernis apivorus European Honey-buzzard 2.0 1 45.0 620.0 0.1452 SVLI
Aegithalidae
Aegithalos caudatus Long-tailed Tit 10 1 0.90 8.000 1.1363 MFI
Alaudidae
Alauda arvensis Eurasian Skylark 3.9 2.7 3.35 34.60 1.0195 I
Galerida cristata Crested Lark 4.4 2 3.24 44.10 0.6465 I
Lullula arborea Woodlark 4.0 2 3.40 32.10 0.8474 I
Alcedinidae
Alcedo atthis Common Kingfisher 6.7 2 4.20 39.20 1.4357 SVLI
Anatidae
Aix sponsa Wood Duck 10 1 45.7 672.0 0.6801 FI
Aix galericulata Mandarin Duck 10 1 44.0 512.0 0.8594 IF
Alopochen aegyptiacus Egyptian Goose 8.5 1 97.0 2040 0.4042 FI
Anas crecca Common Teal 9.5 1 29.0 324.0 0.8503 FI
Anas platyrhynchos Mallard 11 1 51.0 1096 0.5119 SVLI

Mongabay.com Open Access Journal - Tropical Conservation Science Vol. 9 (1): 465-502, 2016
Tropical Conservation Science | ISSN 1940-0829 | Tropicalconservationscience.org
490
Anas platyrhynchos domesticus Domestic Duck SVLI
Anas acuta Northern Pintail 8.0 1 43.0 735.0 0.4680 SVLI
Anas querquedula Garganey 8.5 1 28.0 351.0 0.6781 SVLI
Anas clypeata Nothern Shoveler 10 1 40.0 575.0 0.6957 I
Anser albifrons Greater White-fronted Goose 5.5 1 114 1905 0.3291 FI
Anser anser Greylag Goose 5.0 1 149 3108 0.2397 F
Anser anser domesticus Domestic Goose F
Anser indicus Bar-headed Goose 5.0 1 135 2500 0.2700 FI
Aythya ferina Common Pochard 9.0 1 65.0 832.0 0.7031 SVLI
Aythya nyroca Ferruginous Duck 9.0 1 36.0 545.0 0.5945 SVLI
Aythya fuligula Tufted Duck 9.5 1 53.0 867.0 0.5807 IF
Branta canadensis Canada Goose 5.9 1 220 4390 0.2957 FI
Branta leucopsis Barnacle Goose 4.5 1 103 1499 0.3092 F
Bucephala clangula Common Goldeneye 9.3 1 60.0 787.0 0.7090 SVLI
Cairina moschata Muscovy Duck 10 1 69.3 1285 0.5389 SVLI
Cygnus olor Mute Swan 6.0 1 345 9600 0.2156 SVLI
Cygnus atratus Black Swan 5.0 1 260 5450 0.2385 FI
Mareca penelope Eurasian Wigeon 9.0 1 42.0 700.0 0.5400 FI
Mareca strepera Gadwall 10 1 44.0 700.0 0.6286 FI
Mergus serrator Red-breasted Merganser 9.0 1 73.0 984.0 0.6677 SVLI
Netta rufina Red-crested Pochard 9.0 1 56.0 1100 0.4582 SVLI
Oxyura jamaicensis Ruddy Duck 8.0 1 76.0 510.0 1.1922 I
Somateria mollissima Common Eider 5.0 1 109 2142 0.2544 IF
Tadorna ferruginea Ruddy Shelduck 8.5 1 83.0 1213 0.5819 SVLI
Tadorna tadorna Common Shelduck 8.6 1 78.0 1043 0.6431 SVLI
Apodidae
Apus apus Common Swift 2.4 1 3.60 40.30 0.2144 I
Ardeidae
Ardea cinerea Grey Heron 4.5 1 60.0 1361 0.1984 SVLI
Ardea purpurea Purple Heron 4.2 1 50.0 830.0 0.2530 SVLI
Botaurus stellaris Eurasian Bittern 5.5 1 40.0 900.0 0.2444 SVLI
Mongabay.com Open Access Journal - Tropical Conservation Science Vol. 9 (1): 465-502, 2016
Tropical Conservation Science | ISSN 1940-0829 | Tropicalconservationscience.org
491
Bubulcus ibis Cattle Egret 4.5 1 28.0 304.0 0.4145 SVLI
Casmerodius albus Great Egret 4.0 1 960.0 SVLI
Egretta garzetta Little Egret 4.0 1 495.0 SVLI
Ixobrychus minutus Common Little Bittern 5.5 1 11.5 146.0 0.4332 SVLI
Nycticorax nycticorax Black-crowned Night-heron 4.0 1 34.0 590.0 0.2305 SVLI
Burhinidae
Burhinus oedicnemus Eurasian Thick-knee 1.9 1 36.0 449.0 0.1523 SVLI
Camprimulgidae
Camprimulgus europaeus European Nightjar 2.0 1.5 8.20 76.00 0.3237 I
Certhiidae
Certhia brachydactyla Short-toed Treecreeper 5.7 2 1.16 9.700 1.3633 MFI
Certhia familiaris Eurasian Treecreeper 5.4 2 1.14 9.100 1.3530 MFI
Charadriidae
Charadrius alexandrines Kentish Plover 3.0 1 9.00 47.10 0.5732 I
Charadrius dubius Little Ringed Plover 3.9 2 7.70 39.20 1.5321 I
Charadrius hiaticula Common Ringed Plover 3.8 2 12.0 65.40 1.3945 I
Vanellus vanellus Northern Lapwing 3.9 1 25.5 189.0 0.5262 I
Ciconiidae
Ciconia ciconia White Stork 4.0 1 111 3325 0.1335 SVLI
Cisticolidae
Cisticola juncidis Zitting Cisticola 4.8 2 1.08 6.500 1.5951 I
Columbidae
Columba livia Rock Dove 1.9 5 18.0 267.5 0.6393 F
Columba oena Stock Dove 2.3 2.5 17.0 298.0 0.3228 F
Columba palumbus Common Woodpigeon 1.9 1 18.5 500.0 0.0703 FI
Streptopelia decaocto Eurasian Collared-dove 2.0 2 9.60 197.0 0.1920 FI
Streptopelia turtur European Turtle-dove 1.9 2 8.00 134.5 0.2260 FI
Corvidae
Corvus corax Common Raven 4.8 1 28.8 1147 0.1205 SVLI
Corvus cornix Hood Crow 4.3 1 19.3 476.1 0.1743 SVLI
Corvus corone Carrion Crow 4.3 1 19.8 490.0 0.1738 SVLI

Mongabay.com Open Access Journal - Tropical Conservation Science Vol. 9 (1): 465-502, 2016
Tropical Conservation Science | ISSN 1940-0829 | Tropicalconservationscience.org
492
Corvus frugilegus Rook 3.8 1 16.0 443.3 0.1372 IF
Corvus monedula Eurasian Jackdaw 4.7 1 11.1 230.0 0.2268 FI
Corvus splendens House Crow 4.0 1 13.7 269.7 0.2032 IF
Garrulus glandarius Eurasian Jay 5.4 1 8.50 161.4 0.2844 IF
Pica pica Common Magpie 5.7 1 9.90 197.8 0.2853 SVLI
Cuculidae
Cuculus canorus Common Cuckoo 9.2 1 3.40 112.0 0.2793 I
Emberizidae
Emberiza citrinella Yellowhammer 3.9 2 3.00 26.80 0.8731 MFIF
Emberiza hortulana Ortolan Bunting 4.6 2 2.48 19.10 1.1946 IF
Emberiza schoeniclus Reed Bunting 4.9 1.7 2.19 17.90 1.0311 IF
Miliaria calandra Corn Bunting 4.4 2 3.91 39.60 0.8689 FI
Falconidae
Falco peregrinus Peregrine Falcon 3.2 1 850.0 SVLI
Falco subbuteo Eurasian Hobby 3.0 1 240.5 SVLI
Falco tinnunculus Common Kestrel 4.7 1 20.0 252.0 0.3730 SVLI
Fringillidae
Carduelis cabaret Lesser Redpoll 4.6 2 1.21 10.60 1.0502 FI
Carduelis cannabina Common Linnet 4.7 2 1.66 18.50 0.8435 F
Carduelis carduelis European Goldfinch 4.5 2 1.53 14.80 0.9304 FI
Carduelis spinus Eurasian Siskin 4.3 2 1.29 13.20 0.8405 FI
Carpodacus erythrinus Common Rosefinch 5.1 1 2.25 23.90 0.4801 FI
Chloris chloris European Greenfinch 5.0 2 2.17 25.90 0.8378 F
Coccothraustes coccothraustes Hawfinch 4.5 1 3.89 52.90 0.3309 FI
Fringilla coelebs Common Chaffinch 4.6 1 2.16 18.50 0.5371 IF
Fringilla montifringilla Brambling 5.8 1 2.14 23.60 0.5259 FI
Loxia curvirostra Red Crossbill 3.7 1 2.95 38.90 0.2806 FI
Loxia leucoptera Two-barred Crossbill 4.0 1 2.53 31.60 0.3203 FI
Loxia pytyopsittacus Parrot Crossbill 3.8 1 3.26 50.30 0.2463 F
Pyrrhula pyrrhula Eurasian Bullfinch 5.0 2 2.41 22.50 1.0711 FI
Serinus serinus European Serin 3.8 2 1.21 12.30 0.7476 FI

Mongabay.com Open Access Journal - Tropical Conservation Science Vol. 9 (1): 465-502, 2016
Tropical Conservation Science | ISSN 1940-0829 | Tropicalconservationscience.org
493
Gruidae
Grus grus Common Crane 2.0 1 183 5200 0.0704 SVLI
Haematopodidae
Haematopus ostralegus Eurasian Oystercatcher 2.8 1 47.0 632.5 0.2081 I
Hirundinidae
Delichon urbica Northern House Martin 4.3 2 1.64 19.50 0.7233 I
Hirundo rustica Barn Swallow 4.6 2 1.90 18.70 0.9348 I
Riparia riparia Collared Sand Martin 4.8 1 1.43 13.60 0.5026 I
Laniidae
Lanius collurio Red-backed Shrike 5.0 1 3.15 32.50 0.4846 SVLI
Lanius excubitor Great Grey Shrike 5.8 1 5.30 64.50 0.4766 SVLI
Laridae
Chlidonias hybridus Whiskered Tern 2.7 1 16.0 86.00 0.5023 SVLI
Chlidonias niger Black Tern 2.9 1 11.0 64.00 0.5002 SVLI
Larus argentatus European Herring Gull 2.6 1 864.0 SVLI
Larus canus Mew Gull 3.0 1 51.0 360.0 0.4250 I
Larus graellsii Lesser Black-backed Gull 3.0 1 81.0 755.0 0.3219 SVLI
Larus marinus Great Black-backed Gull 2.9 1 117 1486 0.2283 SVLI
Larus melanocephalus Mediterranean Gull 3.0 1 42.0 282.5 0.4460 I
Larus michahellis Yellow-legged Gull 1 SVLI
Larus minutus Little Gull 2.2 1 19.0 98.00 0.4207 I
Larus ridibundus Black-headed Gull 2.7 1 267.0 I
Sterna albifrons Little Tern 2.2 1 10.0 51.67 0.4258 SVLI
Sterna hirundo Common Tern 2.8 1 21.0 126.0 0.4667 SVLI
Sterna paradisaea Arctic Tern 2.0 1 19.0 107.0 0.3551 SVLI
Sterna sandvicensis Sandwich Tern 1.6 1 35.0 220.5 0.2540 SVLI
Motacillidae
Anthus campestris Tawny Pipit 4.5 1.4 2.73 28.00 0.6189 I
Anthus pratensis Meadow Pipit 5.2 2 2.06 19.50 1.0987 I
Anthus trivialis Tree Pipit 4.8 1 25.10 I
Motacilla alba White Wagtail 5.4 1 2.30 20.70 0.6000 I

Mongabay.com Open Access Journal - Tropical Conservation Science Vol. 9 (1): 465-502, 2016
Tropical Conservation Science | ISSN 1940-0829 | Tropicalconservationscience.org
494
Motacilla cinerea Grey Wagtail 5.2 2 1.91 17.20 1.1549 I
Motacilla flava Yellow Wagtail 5.2 1 1.80 14.80 0.6324 I
Motacilla flavissima Yellowish-crowned Wagtail 5.2 2 1.90 I
Motacilla yarrellii Pied Wagtail 5.4 1 2.35 20.00 0.6345 I
Muscicapidae
Ficedula hypoleuca European Pied Flycatcher 6.4 1 1.70 11.20 0.9714 I
Muscicapa striata Spotted Flycatcher 4.2 1 1.90 16.55 0.4822 MFI
Oriolidae
Oriolus oriolus Eurasian Golden Oriole 3.7 1 7.30 69.20 0.3903 IF
Paradoxornithidae
Panurus biarmicus Bearded Parrotbill 5.6 3 1.68 14.40 1.9600 I
Paridae
Parus ater Coal Tit 8.5 2 9.500 MFI
Parus caeruleus Common Blue Tit 11 1.8 1.17 10.70 2.1290 MFIF
Parus cristatus European Crested Tit 6.5 1 12.75 MFI
Parus major Great Tit 7.8 2 17.80 MFI
Parus montanus Willow Tit 8.1 1 9.800 MFI
Parus palustris Marsh Tit 7.6 1 1.28 11.90 0.8175 MFI
Passeridae
Passer domesticus House Sparrow 4.1 2.1 2.89 30.20 0.8239 FI
Passer montanus Eurasian Tree Sparrow 4.9 2 2.11 20.80 0.9941 FI
Phalacrocoracidae
Phalacrocorax carbo Great Cormorant 3.5 1 53.0 2123 0.0874 SVLI
Phasianidae
Alectoris rufa Red-legged Partridge 13 1 21.0 439.0 0.6075 FI
Coturnix coturnix Common Quail 10 1 8.00 103.0 0.7922 FI
Perdix perdix Grey Partridge 16 1 14.5 386.0 0.6010 FI
Phasianus colchicus Common Pheasant 12 1 33.0 989.0 0.3937 FI
Tetrao tetrix Black Grouse 7.9 1 35.5 945.0 0.2968 FI
Picidae
Dendrocopos major Great Spotted Woodpecker 5.5 1 4.90 72.70 0.3707 IF

Mongabay.com Open Access Journal - Tropical Conservation Science Vol. 9 (1): 465-502, 2016
Tropical Conservation Science | ISSN 1940-0829 | Tropicalconservationscience.org
495
Dendrocopos medius Middle Spotted Woodpecker 5.6 1 4.00 58.80 0.3810 IF
Dendrocopos minor Lesser Spotted Woodpecker 5.0 1 2.00 22.50 0.4444 MFIF
Dryocopus martius Black Woodpecker 4.8 1 12.4 255.0 0.2334 I
Jynx torquilla Eurasian Wryneck 8.5 1.2 2.60 35.90 0.7387 I
Picus viridis Eurasian Green Woodpecker 6.1 1 8.50 186.0 0.2788 IF
Podicipedidae
Podiceps cristatus Great Crested Grebe 3.5 1 42.0 830.0 0.1771 SVLI
Podiceps grisegena Red-necked Grebe 4.5 1 31.0 476.0 0.2931 SVLI
Podiceps nigricollis Black-necked Grebe 3.5 1 21.0 357.5 0.2056 SVLI
Tachybaptus ruficollis Little Grebe 5.0 2 14.0 187.0 0.7487 SVLI
Prunellidae
Prunella modularis Dunnock 5.1 2 2.13 21.10 1.0297 I
Psittacidae
Psittacula krameri Rose-ringed Parakeet 3.0 1 158.0 F
Rallidae
Crex crex Corncrake 8.9 1 13.0 138.0 0.8384 IF
Fulica atra Common Coot 7.2 1 38.0 688.0 0.3977 FI
Gallinula chloropus Common Moorhen 6.6 2 25.0 289.0 1.1419 IF
Porzana parva Little Crake 6.8 2 8.00 49.50 2.1980 IF
Porzana porzana Spotted Crake 10 2 6.00 87.50 1.4126 IF
Porzana pusilla Baillon’s Crake 7.4 1 6.00 46.00 0.9652 SVLI
Rallus aquaticus Western Water Rail 8.5 2 13.0 104.0 2.1250 SVLI
Recurvirostridae
Himantopus himantopus Black-winged Stilt 4.0 1 22.0 185.5 0.4744 SVLI
Recurvirostra avosetta Pied Avocet 3.9 1 32.0 325.3 0.3837 I
Regulidae
Regulus ignicapillus Common Firecrest 8.8 2 0.69 5.300 2.2980 I
Regulus regulus Goldcrest 10 2 0.77 5.600 2.7500 MFI
Remizidae
Remiz pendulinus Eurasian Penduline-tit 4.5 1 0.95 10.25 0.4171 I
Scolopacidae

Mongabay.com Open Access Journal - Tropical Conservation Science Vol. 9 (1): 465-502, 2016
Tropical Conservation Science | ISSN 1940-0829 | Tropicalconservationscience.org
496
Actitis hypoleucos Common Sandpiper 4.0 1 12.0 51.00 0.9412 I
Calidris alpina Dunlin 3.9 1 10.0 48.30 0.8075 I
Gallinago gallinago Common Snipe 3.9 1 17.0 107.0 0.6196 I
Limosa limosa Black-tailed Godwit 3.9 1 41.0 370.0 0.4322 I
Numenius arquata Eurasian Curlew 3.8 1 77.0 1127 0.2596 IF
Philomachus pugnax Ruff 3.7 1 22.0 109.0 0.7468 I
Scolopax rusticola Eurasian Woodcock 3.8 2 302.0 I
Tringa totanus Common Redshank 3.9 1 22.0 135.0 0.6356 I
Sittidae
Sitta europaea Eurasian Nuthatch 7.1 1 2.25 22.10 0.7229 I
Strigidae
Aegolius funereus Boreal Owl 5.8 1 12.5 167.0 0.4341 SVLI
Asio flammeus Short-eared Owl 6.0 1 21.0 312.0 0.4038 SVLI
Asio otus Nothern Long-eared Owl 4.4 1 22.0 278.0 0.3482 SVLI
Athene noctua Little Owl 3.9 1 176.0 SVLI
Bubo bubo Eurasian Eagle-owl 2.7 1 73.0 2438 0.0808 SVLI
Strix aluco Tawny Owl 2.9 1 40.0 486.0 0.2387 SVLI
Sturnidae
Sturnus vulgaris Common Starling 5.1 2 7.00 78.30 0.9119 IF
Sylviidae
Acrocephalus arundinaceus Great Reed-warbler 4.8 1 3.15 28.40 0.5324 IF
Acrocephalus palustris Marsh Warbler 4.5 1 1.85 11.40 0.7303 IF
Acrocephalus schoenobaenus Sedge Warbler 5.3 1 1.65 11.50 0.7604 IF
Acrocephalus scirpaceus Eurasian Reed-warbler 3.9 1 1.75 11.80 0.5784 IF
Cettia cetti Cetti’s Warbler 4.6 1 1.80 13.00 0.6369 I
Hippolais icterina Icterine Warbler 4.7 1 1.76 13.20 0.6267 IF
Hippolais polyglotta Melodious Warbler 4.3 1 1.60 11.00 0.6255 IF
Locustella fluviatilis River Warbler 5.5 1 2.36 18.70 0.6941 I
Locustella luscinioides Savi’s Warbler 4.1 1.3 17.30 I
Locustella naevia Western Grasshopper-warbler 5.2 2 1.73 15.00 1.1995 I
Phylloscopus collybita Common Chiffchaff 5.5 2 1.21 7.200 1.8486 MFIF

Mongabay.com Open Access Journal - Tropical Conservation Science Vol. 9 (1): 465-502, 2016
Tropical Conservation Science | ISSN 1940-0829 | Tropicalconservationscience.org
497
Phylloscopus sibilatrix Wood Warbler 5.9 1 1.32 10.10 0.7711 MFIF
Phylloscopus trochilus Willow Warbler 6.6 1 1.20 9.100 0.8651 IF
Sylvia atricapilla Blackcap 4.6 1 2.19 19.20 0.5247 IF
Sylvia borin Garden Warbler 4.3 1 2.38 18.90 0.5415 IF
Sylvia communis Greater Whitethroat 4.7 1 1.78 14.40 0.5810 IF
Sylvia curruca Lesser Whitethroat 4.9 1 1.40 12.40 0.5532 I
Threskiornithidae
Platalea leucorodia Eurasian Spoonbill 3.5 1 76.0 1130 0.2354 SVLI
Troglodytidae
Troglodytes troglodytes Northern Wren 6.0 2 1.32 7.800 2.0308 I
Turdidae
Erithacus rubecula European Robin 5.0 2 2.40 18.50 1.2973 IF
Luscinia luscinia Thrush Nightingale 4.8 1 3.18 25.50 0.5986 IF
Luscinia megarhynchos Common Nightingale 4.9 1 2.65 19.40 0.6693 IF
Luscinia svecica Bluethroat 6.2 1 2.02 18.60 0.6733 IF
Oenanthe oenanthe Northern Wheatear 6.0 2 2.83 23.90 1.4209 IF
Phoenicurus ochruros Black Redstart 4.9 2 2.16 16.20 1.3067 IF
Phoenicurus phoenicurus Common Redstart 6.2 2 1.90 15.00 1.5707 IF
Saxicola torquata rubicula Common Stonechat 5.2 2.5 1.97 14.80 1.7304 IF
Saxicola rubetra Whinchat 6.0 1 2.06 16.70 0.7401 IF
Turdus merula Common Blackbird 4.0 3 7.20 99.80 0.8657 IF
Turdus philomelos Song Thrush 4.8 2.5 6.00 71.50 1.0070 IF
Turdus pilaris Fieldfare 5.2 1 6.53 103.4 0.3284 IF
Turdus viscivorus Mistle Thrush 4.0 2 7.80 123.2 0.5065 IF
Tytonidae
Tyto alba Common Barn-owl 5.7 2 22.0 309.0 0.8117 SVLI
Upupidae
Upupa epops Common Hoopoe 7.0 1 4.45 67.50 0.4615 SVLI [1]Species and English names based on Del Hoyo et al. [39]. [a]Feeding guild: F= solitary frugivore, FI= solitary frugivore-insectivore, I= solitary insectivore, IF= solitary insectivore-frugivore, MFI= mixed species insectivore flocks, MFIF= mixed species insectivore-frugivore flocks, SVLI= small vertebrates and large insects.

Mongabay.com Open Access Journal - Tropical Conservation Science Vol. 9 (1): 465-502, 2016
Tropical Conservation Science | ISSN 1940-0829 | Tropicalconservationscience.org
498
Appendix 4
Species of birds captured more frequently in floodplain (FP) or terra-firme forest (TF). Test statistics and P-values are provided for Chi-square tests. Abundance data corrected per sampling effort.
No. of captures Chi-squared Feeding guild[a]
Species[1] English name[1] FP TF X12 df P(Chi2) RRI
Amazilia lactea Automolus infuscatus Chloroceryle aenea Chloroceryle inda Columbina talpacoti Dendrocincla merula Habia rubica Hylophylax naevius Hypocneomoides maculicauda Myrmeciza hyperythra Myrmotherula axillaris Myrmotherula hauxwelli Myrmotherula longipennis Oryzoborus angolinensis Percnostola lophotes Phaethornis hispidus Philydor ruficaudatum Phlegopsis nigromaculata Pipra fasciicauda Platyrinchus coronatus Pteroglossus beauharnaesii Ramphocelus carbo Sporophila caerulescens Tangara schrankii Thamnomanes ardesiacus Threnetes leucurus Turdus albicollis
Sapphire-spangled Emerald Olive-backed Foliage-gleaner American Pygmy-kingfisher Green-and-rufous Kingfisher Ruddy Ground-dove White-chinned woodcreeper Red-crowned Ant-tanager Spot-backed Antbird Band-tailed antbird Plumbeous Antbird White-flanked Antwren Plain-throated Antwren Long-winged Antwren Chestnut-bellied Seed-finch White-lined Antbird White-bearded Hermit Rufous-tailed Foliage-gleaner Black-spotted Bare-eye Band-tailed Manakin Golden-crowned Spadebill Curl-crested Aracari Silver-beaked Tanager Double-collared Seedeater Green-and-gold Tanager Dusky-throated Antshrike Pale-tailed Barbthroat White-throated Thrush
14 56 29 16 11 88 56 31 19 14 77 196 60 7 7 79 9 83 496 61 9 27 17 20 72 43 64
0 44 16 0 0 66 44 5 0 0 44 82 33 0 0 44 0 33 121 16 0 0 3 0 55 27 16
14.00 17.18 8.79 16.00 11.00 26.78 17.18 12.20 19.00 14.00 23.32 62.54 18.24 7.00 7.00 23.99 9.00 26.84 181.50 21.75 9.00 27.00 6.47 20.00 21.97 12.94 23.10
1 7 2 2 1 8 5 2 3 5 8 7 6 1 1 8 2 8 9 9 1 2 1 4 7 5 6
<0.001 0.03 0.02 <0.001 0.002 0.001 0.008 0.004 <0.001 0.03 0.005 <0.001 0.011 0.016 0.016 0.005 0.02 0.002 <0.001 0.02 0.005 <0.001 0.02 <0.001 0.005 0.047 0.002
N MFI SVLI SVLI F AA FI I I I MFI MFI MFI F I N MFI AA F I FI IF F MFI MFI N FI
0.551 0.598 0.547 0.477 0.643 0.583 0.877 0.631 0.657 0.456 0.824 0.477 0.832 0.658 0.484 0.911 0.391 0.584

Mongabay.com Open Access Journal - Tropical Conservation Science Vol. 9 (1): 465-502, 2016
Tropical Conservation Science | ISSN 1940-0829 | Tropicalconservationscience.org 499
Turdus hauxwelli Turdus ignobilis Volatinia jacarina
Hauxwell’s Thrush Black-billed Thrush Blue-black Grassquit
22 18 32
0 0 0
22.00 18.00 32.00
6 1 1
0.002 <0.001 <0.001
IF IF F
0.430 0.753
Chiroxiphia pareola Crotophaga ani Dendrocincla fuliginosa Dichrozona cincta Elaenia spectabilis Epinecrophylla leucopthalma Formicarius analis Galbula cyanescens Glaucis hirsutus Glyphorynchus spirurus Gymnopithys salvini Hemitriccus flamulatus Hylophilus ochraceiceps Hypocnemis subflava Lathrotriccus euleri Lepidothrix coronata Leptotila rufaxilla Myiophobus fasciatus Myrmeciza fortis Myrmeciza hemimelaena Myrmoborus myotherinus Myrmotherula longicauda Neopelma sulphureiventer Phaethornis malaris Phlegopsis erythroptera Pipra chloromeros Ramphotrigon fuscicauda Rhegmathorina melanosticta Willisornis poecilinotus
Blue-backed Manakin Smooth-billed Ani Plain-brown Woodcreeper Banded Antbird Large Elaenia White-eyed Antwren Black-faced Antthrush Bluish-fronted Jacamar Rufous-breasted Hermit Wedge-billed Woodcreeper White-throated Antbird Flammulated Pygmy-tyrant Tawny-crowned Greenlet Yellow-breasted Warbling-antbird Euler’s Flycatcher Blue-crowned Manakin Grey-fronted Dove Bran-colored Flycatcher Sooty Antbird Southern Chestnut-tailed Antbird Black-faced Antbird Stripe-chested Antwren Sulphur-bellied Tyrant-manakin Great-billed Hermit Reddish-winged Bare-eye Round-tailed Manakin Dusky-tailed Flatbill Hairy-crested Antbird Scale-backed Antbird
2 0 45 4 2 12 48 7 42 133 114 5 2 4 1 27 0 2 0 37 25 0 0 2 0 19 5 4 53
16 17 61 17 17 72 66 17 132 165 182 28 17 22 33 39 6 17 11 77 121 11 11 22 11 50 17 17 72
6.97 17.00 18.41 6.06 6.97 28.52 20.03 5.27 45.27 50.95 54.76 10.79 6.97 8.63 15.81 11.65 6.00 6.97 11.00 23.96 46.17 11.00 11.00 9.68 11.00 16.19 5.73 6.06 21.75
1 1 6 1 1 3 6 1 6 8 7 2 1 2 1 4 1 1 1 6 5 1 1 1 1 7 1 1 6
0.016 <0.001 0.01 0.027 0.016 <0.001 0.005 0.043 <0.001 <0.001 <0.001 0.009 0.016 0.02 <0.001 0.04 0.028 0.017 0.002 0.001 <0.001 0.001 0.002 0.004 0.002 0.046 0.033 0.027 0.002
F I I I F MFI I I N MFI AA I I I I F F I I I I I IF N AA F I AA I
0.456 0.814 0.617 0.386 0.636 0.716 0.509 0.401 0.363 0.733 0.772 0.192 0.448 0.677 0.464 0.723

Mongabay.com Open Access Journal - Tropical Conservation Science Vol. 9 (1): 465-502, 2016
Tropical Conservation Science | ISSN 1940-0829 | Tropicalconservationscience.org 500
Xiphorhynchus elegans Elegant Woodcreeper 41 72 21.69 9 0.02 MFI [1]Species and English names based on Schulenberg et al. [23] and Del Hoyo et al. [39]. [a]Feeding guild based on classification in Henriques et al. [16]. AA = army ant follower, F = solitary frugivore, FI = solitary frugivore-insectivore, I = solitary insectivore, IF = solitary insectivore-frugivore, MFI = mixed species insectivore flocks, N = nectarivore, SVLI = small vertebrates and large insects.

Mongabay.com Open Access Journal - Tropical Conservation Science Vol. 9 (1): 465-502, 2016
Tropical Conservation Science | ISSN 1940-0829 | Tropicalconservationscience.org
501
Appendix 5 Relative reproductive investments of tropical region birds per family and per feeding guild. Value of RRI with Standard Error and number of species used is shown. Tropical regions
Feeding guilds based on classification in Henriques et al. [16]. AA= army ant followers, F= solitary frugivores, FI= solitary frugivore-insectivores, I= solitary insectivores, IF= solitary insectivore-frugivores, MFI= mixed species insectivore flocks, MFIF= mixed species insectivore-frugivore flocks, N= nectarivores, SVLI= small vertebrates and large insects.
Family RRI(SE) n Family RRI(SE) n
Alcedinidae Bucconidae Cardinalidae Columbidae Conopophagidae Cotingidae Cuculidae Emberizidae Falconidae
Formicariidae Furnariidae Galbulidae Icteridae Momotidae Parulidae
0.572(0.025) 0.253(0.033) 0.468 0.297(0.062) 0.814 0.667(0.071) 0.304(0.037) 0.508(0.141) 0.600(0.059) 0.260(0.072) 0.420(0.099)
2 2 1 4 1 7 2 3 14 2 2
Picidae Pipridae Psittacidae Rhampastidae Strigidae Thamnophilidae Thraupidae Tinamidae Trochilidae
Troglodytidae Trogonidae Turdidae Tyrranidae Vireonidae
0.270 0.561(0.033) 0.266 0.601(0.034) 0.777(0.219) 0.526(0.038) 0.587(0.074)
0.337(0.045) 0.584(0.059) 0.687(0.057) 0.363
1 5 1 12 3 12 2 2 4 20 1
Feeding guild RRI(SE) n
AA F FI I IF MFI MFIF N SVLI
0.332 0.588(0.056) 0.474(0.064) 0.629(0.034) 0.551(0.062) 0.675(0.099) 0.270 0.526(0.038) 0.376(0.064)
1 20 5 38 12 8 1 12 6

Mongabay.com Open Access Journal - Tropical Conservation Science Vol. 9 (1): 465-502, 2016
Tropical Conservation Science | ISSN 1940-0829 | Tropicalconservationscience.org 502
Appendix 6 Relative reproductive investments of temperate region birds per family and per feeding guild. Value of RRI with Standard Error and number of species used is shown. Temperate regions
Feeding guilds based on classification in Henriques et al. [16]. AA= army ant followers, F= solitary frugivores, FI= solitary frugivore-insectivores, I= solitary insectivores, IF= solitary insectivore-frugivores, MFI= mixed species insectivore flocks, MFIF= mixed species insectivore-frugivore flocks, N= nectarivores, SVLI= small vertebrates and large insects.
Family RRI(SE) n Family RRI(SE) n
Accipitridae Aegithalidae Alaudidae Alcedinidae Anatidae Apodidae Ardeidae Burhinidae Camprimulgidae
Certhiidae Charadriidae Ciconiidae Cisticolidae Columbidae Corvidae Cuculidae Emberizidae Falconidae Fringilidae Gruidae Haematopodidae Hirundinidae Laniidae Laridae Motacilidae
0.222(0.033) 1.136 0.837(0.107) 1.435 0.540(0.043) 0.214 0.296(0.041) 0.152 0.323 1.358(0.005) 1.006(0.265) 0.133 1.595 0.290(0.096) 0.200(0.021) 0.279 0.991(0.077) 0.373 0.645(0.077) 0.070 0.208 0.720(0.124) 0.480(0.004) 0.395(0.028) 0.789(0.107)
9 1 3 1 28 1 6 1 1 2 4 1 1 5 8 1 4 1 14 1 1 3 2 11 6
Muscicapidae Oriolidae Paradoxornithidae Paridae Passeridae Phalacrocoracidae Phasianidae Picidae Podicipedidae
Prunellidae Psittacidae Rallidae Recurvirostridae Regulidae Remizidae Scolopacidae Sittidae Strigidae Sturnidae Sylviidae Threskiornithidae Troglodytidae Turdidae Tytonidae Upupidae
0.726(0.244) 0.390 1.960 1.473(0.656) 0.909(0.085) 0.873 0.538(0.087) 0.407(0.073) 0.356(0.133) 1.029
1.296(0.251) 0.429(0.045) 2.253(0.226) 0.417 0.634(0.087) 0.722 0.301(0.064) 0.911 0.754(0.084) 0.235 2.031 0.978(0.123) 0.811 0.461
2 1 1 2 2 1 5 6 4 1 7 2 2 1 7 1 5 1 16 1 1 13 1 1
Feeding guild RRI(SE) n
AA F FI I IF MFI MFIF N SVLI
0.491(0.103) 0.541(0.050) 0.810(0.070) 0.770(0.070) 1.317(0.318) 1.213(0.327) 0.376(0.064)
7 32 46 42 6 5 62