research article development and validation of stability...
TRANSCRIPT

Research ArticleDevelopment and Validation of Stability Indicating LC-PDAMethod for Mycophenolate Mofetil in Presence of MycophenolicAcid and Its Application for Degradation Kinetics and pHProfile Study
Vishnu P Choudhari1 and Anna Pratima G Nikalje2
1 Maharashtra Institute of Pharmacy MIT Campus Paud Road Kothrud Pune Maharashtra 411038 India2 Postgraduate Department of Pharmaceutical Chemistry YB Chavan College of Pharmacy Dr Rafiq Zakaria Campus Rauza BaghAurangabad Maharashtra 431001 India
Correspondence should be addressed to Vishnu P Choudhari viraj1404rediffmailcom
Received 30 April 2014 Revised 5 June 2014 Accepted 5 June 2014 Published 30 June 2014
Academic Editor Irene Panderi
Copyright copy 2014 V P Choudhari and A P G Nikalje This is an open access article distributed under the Creative CommonsAttribution License which permits unrestricted use distribution and reproduction in any medium provided the original work isproperly cited
Factorial design tool applied for development of isocratic reversed-phase stability-indicating HPLC method for the analysis ofmycophenolate mofetil (MMF) and its degradation products MMF stress degradation products mycophenolate acid (MPA) andDP3 (USP impurity H) were isolated and used for quantitation Separation achieved on a Symmetry C18 (250mm times 46mm 50 120583)column using a methanol acetate buffer (75 25 vv) pH 60 (adjusted with acetic acid) at 05mL flow rate column maintainedat 55∘C and data integrated at 251 nm MMF is subjected to hydrolysis oxidation heat degradation and so forth under all theseconditions degraded products are well separated The method validation characteristics included accuracy precision linearityrange specificity and sensitivity Robustness testing is conducted to evaluate the effect of minor changes to the chromatographicconditions and to establish appropriate system suitability parameters The proposed method is used to investigate kinetics of acidalkali hydrolysis and oxidation process Major degradation productsMPA andDP3 were isolated and quantitated Characterizationof MPA by NMR and LC-MSMS and other degraded products by LC-MSMS is attempted successfully The method is usedsuccessfully for the quality assessment of three MMF drug commercial formations and its acid alkali and oxidative degradationkinetics study
1 Introduction
Mycophenolate mofetil (MMF) is chemically 2-(morpholin-4-yl) ethyl (4E)-6-(4-hydroxy-6-methoxy-7-methyl-3-oxo-13-dihydroisobenzofuran-5-yl)-4-methylhex-4-enoate It isinhibitor of nucleic acid synthesis It is the ester moiety ofmycophenolic acid (MPA) It is a white or almost white crys-talline powder and is used as immunosuppressive [1] HPLCandHPTLC analyticalmethods for dissolution study ofMMFin capsules for its assay in bulk and dosage forms [2ndash6]are reported Bioanalytical and immunoassay methods areavailable for its determination individually or in presence ofMPA [7ndash9] and one UV dissolution method is reported [10]
Its degradation products in aqueous solution are studied[11] Stability-indicating HPLC and LC-MSMS methods [1213] are reported where structural elucidation of degradedproduct and separation of the stress degraded product islacking MMF is included in BP EP and USP and assayed bypotentiometry [14 15] Isocratic LCmethod was described inproposed USP monograph [16 17] for MMF tablet and cap-sule assay using mobile phase acetonitrile water containing03 triethylamine (30 20 vv) pH 53 (adjusted with phos-phoric acid) with run time of 10min Proposed isocratic RP-HPLC-PDA method has many advantages which includesmass spectrometry compatible and simple methanol andacetate buffer mixture used as mobile phase and the method
Hindawi Publishing CorporationAdvances in ChemistryVolume 2014 Article ID 719385 9 pageshttpdxdoiorg1011552014719385
2 Advances in Chemistry
O
O
O
O
OO
OO
OO
O
OO
O
O
O O
O
O
O
OH
OH OH OH
CHOOH
OH
NN
CH3
CH3
CH3
CH3
CH3
CH3CH3
OCH3
OCH3
OCH3 OCH3OCH3
CH3
CH3H3C
Mycophenolate mofetil N-oxide (USP impurity G)
Mycophenolic acid (MPA) USP impurity H (DP3) DP2
Mycophenolate mofetil (MMF)
Figure 1 Structure of MMF and its major degraded products
is stability indicating and highly sensitive Quantitation ofMMF MPA and DP3 (USP reported impurity H) is achieved(Figure 1) proposed method is capable of separating all thestress degraded products with short run time Accordinglythe aim of the present study was to establish inherent stabilityof MMF through stress studies under a variety of ICHrecommended test conditions [18] and to develop a sensitivestability-indicating assay method with MS compatible andsimple mobile phase and structural elucidation of the stressdegraded products
2 Experimental
21 Reagent and Chemicals HPLC grade methanol was pur-chased fromMerck (Mumbai India) Analytical grade aceticacid and ammonium acetate were purchased from LobaChemie Pvt Ltd Mumbai Tablet used for analysis wasMycophen 250 (manufactured by Micro Labs Ltd HosurIndia batch number MYLH0001) and capsules used wereCellcept (imported and disturbed by Taksal Pharma Pvt LtdNewDelhi batch numberm1201) andMycept (manufacturedby Panacea Biotech Ltd Solan batch number 4669502) eachcontaining 250mg of MMF Pure drug sample of MMF (purity 996) and standard MPA ( purity 998) were kindlysupplied as a gift sample by Panacea Biotech Ltd Solan andstandard hydrochlorothiazide (HTZ) ( purity 9978) wasgift by Cipla Ltd Mumbai
22 Chromatographic Conditions and Software The HPLCsystem is equipped with binary pump (model Waters 515HPLC pump) autosampler (model 717 plus) column oven(model-Waters CHM) and PDA detector (Waters 2998)Data collection and analysis were performed using Empower-version 2 software Separation was achieved on SymmetryC18 (250mm times 46mm 50120583) columns maintained at 55∘CThe column was supported withWaters symmetry C18 (39 times20mm 50120583) guard column Mobile phase composed ofmethanol acetate buffer (25mM) (75 25 vv) pH adjustedto 60 with acetic acid The flow rate was 05mLmin and the
PDA detector was set at 251 nm the injection volume was20120583L Trial version of Minitab 1512 software was used foroptimization study
23 Preparation of Standard and Sample Solutions and Cal-ibration Curve A stock solution of MMF MPA and DP3(USP impurity H) containing 1000 120583gmL was preparedseparately in methanol From these stock solutions work-ing solutions of MMF 01ndash120 MPA 008ndash16 and DP3006ndash12 120583gmL were prepared in mobile phase For prepara-tion of calibration curve mixed standard solutions of MMFMPA and DP3 from stock solutions were prepared andinjected onto the column and calibration curve was preparedby using concentration and area of chromatographic peaksSystem suitability test (SST) standard mixture containingMMF MPA and DP3 60 8 and 6 120583gmL respectivelywas prepared by mixing and diluting stock solutions withmobile phase For preparation of sample solution powderfrom twenty tabletscapsules equivalent to 100mg of MMFwas transferred to a flask containing 80mL of methanolsonicated for 5min and filtered Filter was rinsed withmethanol filtrate was transferred to flask and volume wasmade to 100mL with methanol it was diluted suitably withmobile phase to contain 60120583gmL of MMF filtered through045 120583mNylon 66-membrane filter and used for analysis
24 Method Validation The HPLC method was validated interms of precision accuracy specificity sensitivity robust-ness and linearity according to ICH guidelines Assaymethod precision (interday and intraday) was determinedusing nine-independent test solutions and precision ofrepeatability was performed by six-time injection of thesolution Assay method was evaluated with the recovery ofthe standards from excipients by spiking standards at threelevels (50 100 and 150) to preanalyzed formulationValues of limit of detection (LOD) and limit of quantification(LOQ) were calculated by using 120590 (standard deviation ofresponse) and 119887 (slope of the calibration curve) and by usingequations LOD = (33 times 120590)119887 and LOQ = (10 times 120590)119887
Advances in Chemistry 3
Calculated values of LOD and LOQ were confirmed byrepeated injections of samples containing amounts of analytein the range of LODand LOQ To determine the robustness ofthemethod the final experimental conditionswere purposelyaltered and the results were examined The flow rate wasvaried by (plusmn)5 Column temperature was varied by (plusmn)2∘Cand effect of column from different suppliers was studiedMeasurement wavelength was varied by (plusmn)1 nm injectionvolume was changed (plusmn)2 120583L organic was changed by(plusmn)5 and buffer strength was changed by (plusmn)5mM Changein one parameter was considered for study at a time Eachparameter was studied by triplicate injection of the samplecontaining HTZ MMF MPA and DP3 Robustness wasevaluated by studying the effect of parameter change on assayvalues and resolution of the analytes injected and its effect onother system suitability parameters (retention time numberof theoretical plates and peak symmetry) Long term (4∘Cfor 5 10 15 and 30 days) and autosampler stability (6 12 and24 hrs in autosampler) of the drug in solution were studied
25 Procedure for ForcedDegradation Study Forced degrada-tion of the drug product was carried out under thermolyticphotolytic acidbase hydrolytic and oxidative stress condi-tions For photolytic stress drug product in the solid statewas irradiated with UV radiation with peak intensities at 254and 366 nmThe UV dose from the lamp of peak intensity at366 nm was measured by use of a quinine monohydrochlo-ride (2 solution in water) chemical actinometer as men-tioned in the ICH guidelines [18] Minimum desired expo-sure (200Whm2) was observed after irradiation for 26 hSample solution containing 1000 120583gmL MMF was subjectedto selected stressed conditions neutralized appropriatelydiluted and injected onto column Samples except for photooxidation were protected from light For acid base and waterinduced degradation solutions containing 1000120583gmL of thedrug were prepared in 01 N HCl 005N NaOH and waterand analysed after 5 6 and 12 hrs exposure respectivelyFor oxidative degradation solution was prepared in watercontaining 10 vv of H
2O2and analysed after 8 hrs During
dry heat study sample was exposed to 60∘C for 8 hrs in ovenand analysed
26 Degradation Kinetics MMF solution containing 1000120583gmL was used for acid (01 N HCl) alkali (005N NaOH)and oxidative (10 H
2O2) degradation kinetics were studied
at 60 70 80 and 90∘C
27 Preparation and Isolation of AlkaliAcid Induced DegradedProducts MPA and DP3 MMF 1 g was dissolved in 50mLmethanol and refluxed with 100mL 05M NaOHHCl at100∘C for 15min Subsequently pH of the solution wasadjusted to 25 with 5M HCl to precipitate MPA Theprecipitate was filtered dried under vacuum and usedDegraded product DP3 is observed during acid alkali oxida-tive degradation condition which was isolated using TLCplates DP3 was isolated from chloroform extract of degradedsolution by using laboratory prepared silica gel G TLC plates
040
020
000
HTZ
(AU
)
MPAMMF
000 100 200 300 400 500 600 700 800 900 1000
DP1 DP2
DP3
IMP G (d)
(c)
(b)
(a)
(min)
Figure 2 Chromatograms of stress degraded products of MMFwith (a) HCl (b) NaOH (c) H
2
O2
and (d) system suitabilitychromatogram showing peaks of HTZ (internal standard) andanalytes MPA MMF and DP3
Mobile phase used for the TLC separation of DP3was chloro-form toluene methanol acetic acid (7 3 02 01 vv) withdevelopment time of 20min and it was eluted with 119877
11989107
Purity of isolated DP3 was confirmed by HPLC using PDAdetector
28 LC-MSMS and NMR Study The MS experiments wereperformed on LC-ESI-MS-MSMS 410 prostar binary LCwith 500 MS IT detector (Varian USA) at IIT PowaiMumbai LC unit consisted of prostar 210 binary pumps withprostar 410 autosampler Previously described chromato-graphic conditions were used MS was operated at enhancedscan mode capillary voltage was 80 and mass range was50ndash600mz Prom (version 3010100) software was used fordata acquisition and processing For 1HNMR and 13CNMRmeasurements of MMF andMPA were recorded onMercury300 NMR (Varian USA) instrument at University of PunePune and CDCl3 was used as solvent
3 Results and Discussion
31 Method Development Factorial design was used astool for optimization of the chromatographic conditions todevelop a stability-indicating method Various pilot trialswere carried out to investigate different stationary phasesfor example C18 column (Symmetry andKromasil) differentmobile phases containing organic modifiers (methanol ace-tonitrile and THF) different buffers of different pH (3ndash65)and temperature (30 to 65∘C) Our objectives were to achievea peak tailing factorlt12 retention times (119905
119877) from 4 to 9min
andMMF andMPA resolution gt2 From this experiment pH60 was selected as most appropriate because at lower pHthere is increase in baseline disturbances and peaks were notsymmetric Column was maintained at 55∘C and methanolas organic modifier was selected to be the most appropriateEffect of mobile phase flow rate and of methanol wasstudied by full factorial design (Table 1(a)) and 22 full factorialdesign experiments were carried out to study the effect on 119905Rof MMF and MPA (Table 1(b)) By using full factorial designdata linear equations obtained for MMF and MPA were 119884 =7113 minus 04343119909
1+ 10478119909
2minus 00528119909
11199092and = 61515 minus
052651199091+09135119909
2minus 0008119909
11199092 respectively From the data
4 Advances in Chemistry
O
O O
O O
O
O OO
O
OO
Mycophenolate mofetil (MMF) Mycophenolic acid
H3C H3CH3C
N+
O+
CH3 CH3 CH3
OH OH OHOH+
Impurity H (DP3)
OndashCH3 OndashCH3
(a)
O
O O
OO
O
O
O
O
OO
H
O
O
O
O OO
Mycophenolate mofetil
Mycophenolate sodium
Mycophenolic acid
HO
HO HO
HO
HO
HO
H3C
H3C
H3C
H3C
H3C
H3C
H3C
CH3
CH3 CH3
N+
N+
ONa
NaOH
NaOH
NaOH
NaOH NaOH
DP2
DP1
Impurity H (DP3)
CHO
O+
OH
OndashCH3
OndashCH3
OndashCH3
OndashCH3 OndashCH3
(b)
Impurity G
O
O
OO
OO
O
ON
OH OH
MMF
DP2
H2O2
OCH3 OCH3
CH3
CH3
CH3
CH3
CHO+
(c)
Figure 3 Proposed mechanism of (a) acid (b) alkali and (c) oxidative stress degradation of MMF
obtained (Table 1(c)) it can be concluded that there is nointeraction between the variables and flow rate does not playan important role Methanol affects 119905
119877and is considered
as main effect Target values of 119905119877for MPA (60) and MMF
(70) were fixed and weight = 1 was assigned to it to obtainoptimum conditions HPLC runs were carried out by varyingthe of methanol in mobile phase and final chromato-graphic conditions selected were Symmetry C18 (250mm times46mm 50 120583) column maintained at 55∘C using columnoven Mobile phase composed of methanol acetate buffer(pH 60) (75 25 vv) The flow rate was 05mLminutes thePDA detector was set at 251 nm and injection volume was20120583L
32 Method Validation Themethod was validated accordingto ICH guidelines The following validation characteristics
were addressed linearity range accuracy precision specific-ity sensitivity (LOQ and LOD) and robustness Among dro-taverine HTZ diclofenac sodium etoricoxib and atenololhydrochlorothiazide (HTZ) was observed as the most appro-priate internal standard (IS) with values of peak symmetrytheoretical plates and resolution well within limit Assayvalue determined for three formulations was in the range of100 plusmn 133 with RSD lt12 Specificity of the method wasdetermined by analyzing samples containing a mixture of thedrug product excipients samples containingMMFMPA andDP3 and stress degraded samples All chromatograms wereexamined to determine ifMMFMPA andDP3 coeluted witheach other or with any excipient peak Linear least squareregression and LOD and LOQ data summarized in Table 2indicate linearity and sensitivity of the method Accuracyand precision were established for MMF MPA and DP3Results for the accuracy of analytes tested in drug products by
Advances in Chemistry 5
Table 1 Results of method optimization
(a) Factors and their low (minus) high (+) and zero (0) levels
Factors Factors level(minus) (+) (0)
Methanol (1199091
) 70 80 75Flow rate (mLmin) (119909
2
) 060 070 065
(b) Obtained results for 119905119877
Factors Retention factors1199091
1199092
MMF MPAminus minus 864 767minus + 644 568+ minus 769 646+ + 570 479
(c) Effect of variables on 119905119877of MMF and MPA
Variable effect on 119905119877
ofMMF MMF
1199091
( methanol) 1394 38511199092
(flow rate) 8584 61041199091
1199092
(interaction) 022 045
100
75
50
25
0100 150 200 250 300
[M]+
MZ 302
MZ 320
M+-113 120573 cleavage to aromatic ringMZ 207
MZ 275
MZ 283
[M-COOH]+
[MZ 302-H3O]+
[M+-H2O]+
MZ
()
Figure 4 Mass fragmentation pattern of proposed impurity H(Enantiomer DP3)
the technique of standard addition ranged from 9887 to1016 Results of precision SST and recovery are sum-marized in Table 2 Robustness parameters studied were asdescribed in the method validation section During robust-ness study resolution between MMF MPA and DP3 wasgt22 and assay variability of the method for MMF MPAand DP3 was always within 100 plusmn 15 Values of othersystem suitability parameters were always within the limitsindicating robustness of the method The RSD of assayvalues of MMF and MPA during solution and autosamplerstability experiments were within 16 and no significantchanges were observed
33 NMR Study The PMR spectrum of MPA in deuteratedchloroform showed protons signals 120575H at 1804 ppm (singlet2H) 2146 ppm (singlet 3H) 2277ndash2325 ppm (triplet1H) 2378ndash2460 (quartet 2H) 3373ndash3395 (doublet 2H)3620 (singlet 1H) 3757 (singlet 3H) 5193 (singlet 3H)5228ndash5270 (triplet 2H) and 7840 (broad singlet 1H) Thesesignals were compared with 1HNMR of standard sample andfound at the same position intensity and multiplicity 13CNMR signals for MMF and MPA were observed at shiftvalue and carbon numbers are 120575C 1123(C-20) 1586(C-17)2242(C-18) 3442(C-13) 6079(C-12) 6969(C-5) 10617(C-6) 11641(C-15) 12195(C-7) 12267(C-9) 13366(C-16)14384(C-4) 15335(C-3) 16333(C-8) 17247(C-19) and17296(C-2) additional signals were observed for mofetilmoiety of MMF at 5369(C-23) 5679(C-22) 6148(C-24)and 6659(C-25)The 1HNMR and 13CNMRdata confirmedthat the isolated compound is mycophenolic acid
34 Stress Testing of MMF Under the optimized conditionsMMF and its degradation products were well separated andare shown in Figures 2(a)ndash2(d) During the initial forceddegradation experiments it was observed that the MMF isvery sensitive to alkaline stress condition and is extensivelydegraded by alkaline hydrolysis and five degraded products(MPA mycophenolate sodium DP1 DP2 and DP3) wereformed During acid hydrolysis degraded products MPA andDP3 were formed One of the oxidative stress degradationproducts of MMF which is eluted at 119905
11987745min was found to
be USP impurity G based on LC-MS data Stress degradedproducts MPA and DP3 were isolated and used for studyProposed chemical degradation schemes under acid alkaliand H
2O2stress conditions are shown in Figures 3(a)ndash3(c)
6 Advances in Chemistry
60 80 100 120 140
MZ
[M-H2O]+
MZ 114
MZ 132[M]+
MS fragmentation pattern of DP1
100
75
50
25
0
()
(a)
100 150 200 250 300
MZ
MS fragmentation pattern of MPA [M-H2O]+
[M]+
MZ 320
MZ 302
MZ 283
MZ 275
[MZ 302-H3O]+
[M-COOH]+
120573 cleavage to aromatic ring
M+-113 MZ 207
100
75
50
25
0
()
(b)
Figure 5 Mass fragmentation pattern of (a) DP1 and (b) mycophenolic acid
O
O
O
O
O
O
O
O
O O
O
OH
OH
OH
[M] + MZ = 302
DP2
MZ = 195MZ = 245MZ = 283
CH3
CH3
CH3
CH3CH3
CH3
CH2
CH3
CHO
OCH3
OCH3
OCH3
OCH3
MZ = 273 MZ = 259 MZ = 231
minusC2H4minusOHminusO2HminusCH3
minusCH2minusCO
minusCHO
Ominus
Ominus
OminusOminus
minusO
minusH3O
(a)
O
O
OO
O
O
OO
O
O
O
HOH
N
minusOLoss of
minusH2O
OCH3OCH3
OCH3
CH2
CH3CH3
CH3CH3
MZ = 285
CH3
CH3
MZ = 347Impurity G [M] + MZ = 450
minusOCH2 minus CH2
OndashH
OndashN HOHO
(b)
OO
OO O
O
O O
HOO
O
HO HOH3C H3C
MMF protonated [M] MZ = 435 MZ = 347 MZ = 285
OCH3 OCH3 OCH3CH3 CH3
CH3
CH2
Loss of
OndashNminusH2O
minusOCH2 minus CH2HO
HO
HN
(c)
Figure 6 Mass fragmentation pattern of (a) proposed impurity DP2 (b) impurity G and (c) mycophenolate mofetil
Advances in Chemistry 7
15
155
16
165
17
175
18
185
19
195
2
5 10 15 20 30 40 50 60
Time (min)
2+logCtCo
(a)
14
15
16
17
18
19
2
21
5 10 15 20 30 40 50 60
Time (min)2+logCtCo
(b)
155
16
165
17
175
18
185
19
195
2
205
5 10 15 20 30 40 50 60
Time (min)
2+logCtCo
(c)
0
001
002
003
004
005
006
007
26 3 4 5 6 7 8 9 10 11 12
pH
pH study for MMFlogk
(d)
Figure 7 Degraded kinetics plot for MMF in (a) 01 N HCL (b) 005N NaOH (c) 10 vv H2
O2
at 60∘C (⧫) 70∘C (◼) 80∘C (998771) and 90∘C(e) and (d) pH profile of MMF in Britton-Robinson buffer
respectively During various stress conditions extent ofdegradation peak purity recovery ofMMF andmass balance(always gt9858) were calculated Peak purity of stressedsamples of MMF was checked by using PDA detector Thepurity angle within the purity threshold limit obtainedin all stress degraded samples demonstrated analyte peakhomogeneity Results of stress degradation peak purity andmass balance study are presented in Table 3 MPA MMFdegradation product was isolated and identified byNMRandLC-MSMS study and by comparing 119905
119877and UV spectrum of
standard and degraded products DP3 formed under all thestress conditionswas isolated its structurewas determined byLCMS study and found to be USP impurity H and is elutedat 11990511987779 It has MS fragmentation pattern like MPA except
intensities of the MS peaks It is less polar than MPA and wasretained on C18 column formore time its proposed structureby MS-MS study is shown in Figure 4 Mass fragmentationpattern and proposed structures of MPA and DP1 are shownin Figures 5(a) and 5(b) Mass fragmentation patterns ofproposed impurity DP2 impurity G and mycophenolate
8 Advances in Chemistry
Table 2 Results of method sensitivity linearity precision system suitability and recovery of analytes
Parameteranalytes (119905119877
) MPA (59) MMF (68) DP3 (79)Method sensitivity
Limit of detection (LOD 120583gmL) 0026 0121 002Limit of detection (LOQ 120583gmL) 0078 0366 006
Concentration range (120583gmL) 008ndash16 04ndash120 006ndash12Regression equation (119884 = 119887 times Concentration plusmn 119886) data
Intercept (119886) 19750 minus22898 minus22537Slope (119887) 705832 444282 860700a119878119886
plusmnlowast
119905119878119886
(error in intercept) 4786 plusmn 92992 67896 plusmn 126286 17319 plusmn 32819b119878119887
plusmnlowast
119905119878119887
(error in slope ) 734 plusmn 14263 1183 plusmn 2864 2864 plusmn 5428Correlation coefficient (119903) 0999 0999 0999Precision data RSD
Repeatability 119899 = 6 029 015 034Intraday precision 119899 = 3 times 3 times 04 035 043Interday precision 119899 = 3 times 5 days 045 042 052
System suitability data (USP-NF 29 section 621 pp 2135)Number of theoretical plates (plusmnSD) 3450 plusmn 32 4255 plusmn 26 3865 plusmn 50USP tailing factor (plusmnSD) 101 plusmn 001 101 plusmn 001 100 plusmn 0042USP resolution 59c 22 225
Recovery study at the level ( recovery RSD) 119899 = 350 9935 077 1016 059 9956 123100 1005 073 1003 045 9887 076150 1008 089 9998 034 1002 091
lowast
119905tab = 186 1895 1943 for MMF DP1 and MPA respectively (119875 = 005 df = 8) astandard deviation (SD) of intercept bSD of slope and cresolution withrespect to IS HTZ peak
Table 3 Result of stress degradation study peak purity and mass balance 119899 = 3
Stress condition Degraded products reported at 119905119877
MMF recovery Peak puritylowast Mass balancePeak angle Peak threshold
1mL of 01 NHCl 5 h 59 (MPA) 59 (DP3) 8945 0247 0415 99961mL of 005NNaOH 6 h 461 (DP1) 59 (MPA) 59 (DP3) 8026 0278 0389 98672mL of 30 H2O2 8 h 423 (IMP G) 461 (DP1) 59 (MPA) 79 (DP3) 8689 0403 0638 9818Short UV-254 nm 26 h 59 (MPA) 79 (DP3) 9343 0189 0278 9957Long UV-366 nm 26 h 59 (MPA) 79 (DP3) 9556 0289 0356 1002Wet heat 12 h 59 (MPA) 79 (DP3) 9645 0137 0267 9978Dry heat-60∘C 8 h 59 (MPA) 79 (DP3) 9287 0265 0315 9998lowastValues of peak angle which are less than peak threshold indicate homogenous peak
mofetil are shown in Figures 6(a)ndash6(c) respectively Theformation of MPA due to thermal degradation at various pHreported in literature [11] was confirmed Peroxide catalyzedformation of MPA and N-oxide of MMF (USP impurity G)was supported by the experimental findings during proposedstudy
35 Degradation Kinetics Forced degradation of MMF byHCl NaOH and H
2O2resulted in decrease in peak area by
time and it was found to be temperature dependent Apparentfirst order degradation constant (Figure 7) and half-life ateach temperature and Arrhenius equations were calculatedApparent first order degradation constant (2 + log119862
119905119862119900plusmn
standard deviation) for HCl NaOH and H2O2degradation
at 60∘C was found to be 1799 plusmn 008455 1884 plusmn 00645and 1944 plusmn 00292 respectively Half-life (119905
12 dayminus1) for
HCl NaOH and H2O2degradation at 60∘C was found to be
07256 07117 and 07084 respectively Calculated Arrheniusequations at each of the selected conditions were Log119870 =1223 minus (1192 times 10
minus3
)119879 (for 01NHCl) Log119870 = 1300 minus(1630143times10
minus3
)119879 (for 005NNaOH) and Log119870 = 1363minus(1906 times 10
minus3
)119879 (for 10 H2O2)
4 Conclusion
A simple and efficient stability-indicating reverse-phaseHPLC method was developed and was found to be accurate
Advances in Chemistry 9
precise and linear across the analytical range and is reportedfor the first time The method is simple fast sensitive andspecific for the determination and quantification of MMFMPA and DP3 with 9min run timeThemethod can be usedto assess the quality of commercially available MMF drugproducts and to study the kinetics of the MMF and MPAunder different conditions Mobile phase used is MS compat-ible therefore method can be used for LC-MS study ofMMFandMPA and other degraded products Hydrochlorothiazidecan be used successfully as IS Stress degraded products MPAandDP3were isolated and structurally determined by 1H 13CNMR and LCMS study and quantitation of the degradedproducts was archived
Conflict of Interests
The authors declare that there is no conflict of interestsregarding the publication of this paper
Acknowledgments
Authors wish to thank SAIF IIT Powai Mumbai for provid-ing facility for LC-MSMS study The authors are grateful toMrs Fatma Rafiq Zakaria Chairman of the Maulana AzadEducation Trust Dr Maqdoom Farooqui Principal of theMaulana Azad Postgraduate and Research Centre Dr RafiqZakaria Campus Aurangabad and Principal and Manage-ment of MAEERrsquos Maharashtra Institute of Pharmacy Punefor providing necessary facility
References
[1] S BudavariTheMerck IndexMerckampCoWhitehouse StationNJ USA 14th edition 2001
[2] L Yang and D He ldquoHPLC determination of dissolution ofmycophenolate mofetil capsulesrdquo Yaowu Fenxi Zazhi vol 28no 7 pp 1177ndash1179 2008
[3] A L Rao P V Srinivas and J V L N S Rao ldquoA new validatedRP-HPLCmethod for the estimation of mycophenolate mofetilin pure and tablet dosage formrdquo Journal of PharmaceuticalResearch and Health Care vol 2 no 3 pp 266ndash269 2010
[4] P Raja Abhilash K Vasanth Kumar and V Sateesh KumarldquoDevelopment and validation of new RP-UPLC method for thequantitative analysis of mycophenolate in tablet dosage formrdquoThe British Journal of Pharmaceutical Research vol 3 no 3 pp363ndash373 2013
[5] K Rajendra Prasad and S Kathirvel ldquoDevelopment and vali-dation of RP-HPLC method for estimation of mycophenolatemofetil in bulk and pharmaceutical dosage formrdquo ResearchJournal of Pharmaceutical Dosage Form and Technology vol 5no 1 pp 43ndash46 2013
[6] S Kathirvel P K Rajendra and B K Madhu ldquoDevelopmentand validation of HPTLC method for the determination ofmycophenolate mofetil in bulk and pharmaceutical formula-tionrdquo Pharmaceutical Methods vol 3 no 2 pp 90ndash93 2012
[7] U D Renner C Thiede M Bornhauser G Ehninger and H-M Thiede ldquoDetermination of mycophenolic acid and myco-phenolate mofetil by high-performance liquid chromatographyusing postcolumn derivatizationrdquo Analytical Chemistry vol 73no 1 pp 41ndash46 2001
[8] I Tsina M Kaloostian R Lee T Tarnowski and B WongldquoHigh-performance liquid chromatographic method for thedetermination of mycophenolate mofetil in human plasmardquoJournal of Chromatography B Biomedical Applications vol 681no 2 pp 347ndash353 1996
[9] J L Beal C E Jones P J Taylor and S E Tett ldquoEvaluation ofan immunoassay (EMIT) formycophenolic acid in plasma fromrenal transplant recipients compared with a high-performanceliquid chromatography assayrdquo Therapeutic Drug Monitoringvol 20 no 6 pp 685ndash690 1998
[10] S P Verma O Alam P Mullick and N Siddiqui ValidatedldquoUltra Violet Spectroscopy method for the dissolution studyof mycophenolate mofetil immediate release 500 mg tabletsrdquoNature Precedings 2009
[11] E Hooijmaaijer M Brandl J Nelson and D Lustig ldquoDegrada-tion products of mycophenolate mofetil in aqueous solutionrdquoDrug Development and Industrial Pharmacy vol 25 no 3 pp361ndash365 1999
[12] A Protic L Zivanovıc M Zecevic and B Jocic ldquoDevelopmentof liquid chromatographic method for simultaneous determi-nation of mycophenolate mofetil and its degradation productmycophenolic acid in dosage formrdquo Journal of ChromatographicScience vol 47 no 2 pp 149ndash155 2009
[13] T V B Reddy N S Reddy R Golkonda V V Sure and RChintala ldquoDevelopment of stability indicating liquid chroma-tography-mass tandem spectrometric method for the estima-tion of mycophenolate mofetil in bulk and pharmaceuticalformulationsrdquo Journal of Pharmacy Research vol 7 pp 640ndash646 2013
[14] British Pharmacopoeia 6th edition 2009[15] European Pharmacopoeia European Directorate for the Quality
of Medicines and Health Care Council of Europe StrasbourgFrance 6th edition 2008
[16] httpwwwusporgpdfENpendingStandardsmycophenola-teMofetilCapsulespdf
[17] httpwwwusporgpdfENpendingStandardsmycophenola-teMofetilTabletspdf
[18] ICH Q2 (R1) Validation of Analytical Procedures Text andMethodology International Conference on HarmonizationGeneva Switzerland 2005
Submit your manuscripts athttpwwwhindawicom
Hindawi Publishing Corporationhttpwwwhindawicom Volume 2014
Inorganic ChemistryInternational Journal of
Hindawi Publishing Corporation httpwwwhindawicom Volume 2014
International Journal ofPhotoenergy
Hindawi Publishing Corporationhttpwwwhindawicom Volume 2014
Carbohydrate Chemistry
International Journal of
Hindawi Publishing Corporationhttpwwwhindawicom Volume 2014
Journal of
Chemistry
Hindawi Publishing Corporationhttpwwwhindawicom Volume 2014
Advances in
Physical Chemistry
Hindawi Publishing Corporationhttpwwwhindawicom
Analytical Methods in Chemistry
Journal of
Volume 2014
Bioinorganic Chemistry and ApplicationsHindawi Publishing Corporationhttpwwwhindawicom Volume 2014
SpectroscopyInternational Journal of
Hindawi Publishing Corporationhttpwwwhindawicom Volume 2014
The Scientific World JournalHindawi Publishing Corporation httpwwwhindawicom Volume 2014
Medicinal ChemistryInternational Journal of
Hindawi Publishing Corporationhttpwwwhindawicom Volume 2014
Chromatography Research International
Hindawi Publishing Corporationhttpwwwhindawicom Volume 2014
Applied ChemistryJournal of
Hindawi Publishing Corporationhttpwwwhindawicom Volume 2014
Hindawi Publishing Corporationhttpwwwhindawicom Volume 2014
Theoretical ChemistryJournal of
Hindawi Publishing Corporationhttpwwwhindawicom Volume 2014
Journal of
Spectroscopy
Analytical ChemistryInternational Journal of
Hindawi Publishing Corporationhttpwwwhindawicom Volume 2014
Journal of
Hindawi Publishing Corporationhttpwwwhindawicom Volume 2014
Quantum Chemistry
Hindawi Publishing Corporationhttpwwwhindawicom Volume 2014
Organic Chemistry International
ElectrochemistryInternational Journal of
Hindawi Publishing Corporation httpwwwhindawicom Volume 2014
Hindawi Publishing Corporationhttpwwwhindawicom Volume 2014
CatalystsJournal of
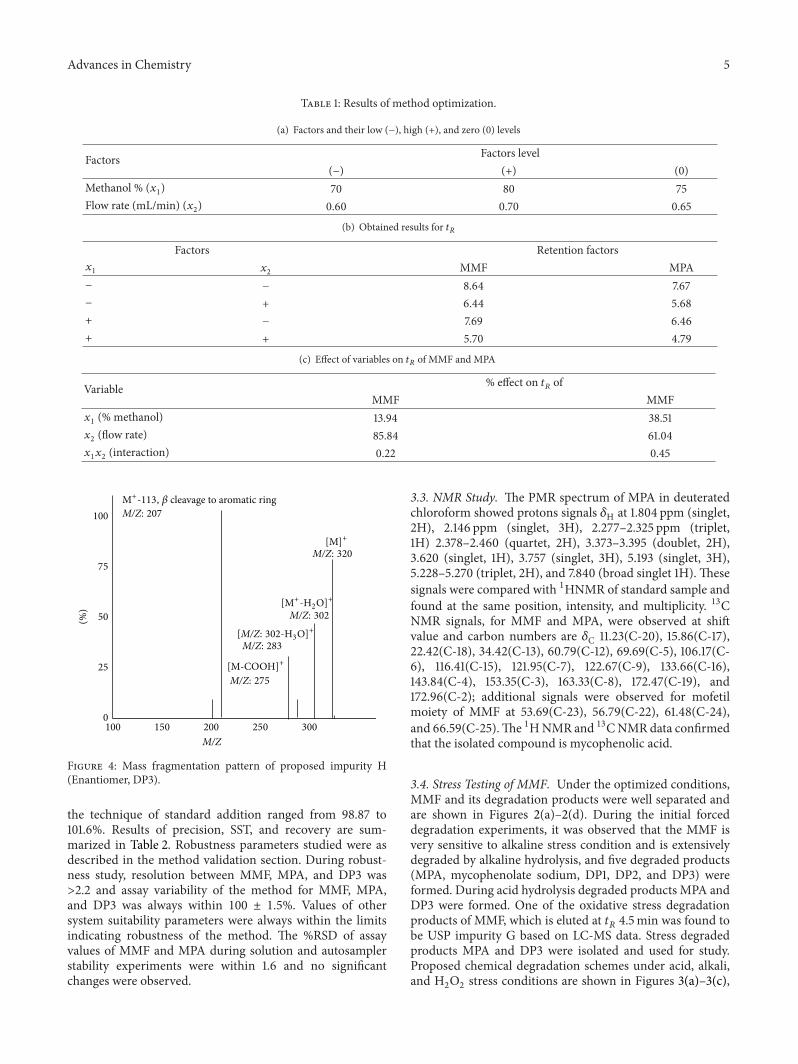