research article identification of putative ortholog gene blocks...
TRANSCRIPT

Hindawi Publishing CorporationInternational Journal of GenomicsVolume 2013 Article ID 624681 12 pageshttpdxdoiorg1011552013624681
Research ArticleIdentification of Putative Ortholog Gene Blocks Involved inGestant and Lactating Mammary Gland Development A RodentCross-Species Microarray Transcriptomics Approach
Maricela Rodriacuteguez-Cruz1 Ramoacuten M Coral-Vaacutezquez23
Gabriel Hernaacutendez-Stengele123 Rauacutel Saacutenchez1 Emmanuel Salazar4
Fausto Sanchez-Muntildeoz5 Sergio Encarnacioacuten-Guevara4 and Jorge Ramiacuterez-Salcedo6
1 Unit ofMedical Research in Nutrition Hospital de Pediatrıa CentroMedico Nacional Siglo XXI InstitutoMexicano del Seguro SocialAvenida Cuauhtemoc 330 Col Doctores Delegacion Cuauhtemoc 06725 Mexico City Mexico
2 Seccion de Estudios de Posgrado e Investigacion Escuela Superior de Medicina Instituto Politecnico NacionalPlan de San Luis y Dıaz Miron sn Col Casco de Santo Tomas Delegacion Miguel Hidalgo 11340 Mexico City Mexico
3 Subdireccion de Ensenanza e Investigacion Centro Medico Nacional 20 de Noviembre Instituto de Seguridad y Servicios Sociales delos Trabajadores del Estado San Lorenzo 502 (2 piso) Col Del Valle Delegacion Benito Juarez 03100 Mexico City Mexico
4Genomic Sciences Center Universidad Nacional Autonoma de Mexico Avenida Universidad sn Col Chamilpa62210 Cuernavaca Morelos Mexico
5 Department of Immunology Instituto Nacional de Cardiologıa Ignacio Chavez Juan Badiano No 1 Col Seccion XVI140080 Tlalpan Mexico City DF Mexico
6Microarray Unit Instituto de Fisiologıa Celular Universidad Nacional Autonoma de Mexico Circuito Exterior snCiudad Universitaria Delegacion Coyoacan 04510 Mexico City Mexico
Correspondence should be addressed to Maricela Rodrıguez-Cruz maricelarodriguezcruzgmailcomand Ramon M Coral-Vazquez rmcoralvprodigynetmx
Received 21 May 2013 Revised 3 September 2013 Accepted 4 September 2013
Academic Editor Elena Pasyukova
Copyright copy 2013 Maricela Rodrıguez-Cruz et al This is an open access article distributed under the Creative CommonsAttribution License which permits unrestricted use distribution and reproduction in any medium provided the original work isproperly cited
Themammary gland (MG) undergoes functional andmetabolic changes during the transition frompregnancy to lactation possiblyby regulation of conserved genes The objective was to elucidate orthologous genes chromosome clusters and putative conservedtranscriptionalmodules duringMGdevelopmentWe analyzed expression of 22000 transcripts usingmurinemicroarrays andRNAsamples of MG from virgin pregnant and lactating rats by cross-species hybridization We identified 521 transcripts differentiallyexpressed upregulated in early (78) and midpregnancy (89) and early lactation (64) but downregulated in mid-lactation(61) Putative orthologous genes were identified We mapped the altered genes to orthologous chromosomal locations in humanand mouse Eighteen sets of conserved genes associated with key cellular functions were revealed and conserved transcriptionfactor binding site search entailed possible coregulation among all eight block sets of genesThis study demonstrates that the use ofheterologous array hybridization for screening of orthologous gene expression from rat revealed sets of conserved genes arrangedin chromosomal order implicated in signaling pathways and functional ontology Results demonstrate the utilization power ofcomparative genomics and prove the feasibility of using rodent microarrays to identification of putative coexpressed orthologousgenes involved in the control of human mammary gland development
1 Introduction
Mammals are the only animals that secrete a complex fluidfrom an elaborated skin gland to provide both innate pro-tection and nourishment for their newborn There are more
than 4000 species of mammals with striking similaritiesin the structure and function of their mammary glandsas well as in their unique milk components such as thecaseins 120572-lactalbumin lactoferrin lactose and milk fat
2 International Journal of Genomics
Nevertheless variations are exhibited in the arrangement andnumbers ofmammary glandmilk composition and sucklingstrategies Mammary gland development begins at pubertyand ismaintained throughout pregnancy until lactationDur-ing these last stages development compromises numerousoverlapping programs such as branching morphogenesisinductive stromal-epithelial interactions programmed celldeath extracellular matrix remodeling and hormone action[1]
Current knowledge of the molecular regulation of mam-mary development and lactation has largely been derivedfrom the dissection of signaling networks in cell culture sys-tems and phenotypic characterization of genetically alteredmice as well as genomewide approaches such as microar-rays Nonetheless to date regulation of mammary glanddevelopment during pregnancy and lactation is incompletelyunderstood Lactation is regarded as one of the most remark-able products of evolution whose processes include thedevelopment of mammary tissue as well as the synthesisand secretion of milk [2] Consequently despite the factthat the development of mammary tissue and the synthesisand secretion of milk are considered as complex dynamicphysiological processes both must preserve overall commoncharacteristics among mammals
Considering the underlying assumption that importantbiological functions are often conserved across species genesexpressed across multiple species are likely to have conservedfunctions [3] Given the completion of the DNA sequenceof the human mouse and rat genomes [4] genes identi-fied in microarray studies can be readily compared acrossspecies with respect to orthologous genes [5] Therefore across-species hybridization (CSH) experiment could providesignificant information concerning probable conserved genenetworks among mammals
In a CSH experiment there is hybridization of RNAfrom one or more (target) species to a microarray thatcontainsDNA (cDNAor oligomers) fromanother (reference)species and represents a valuable tool for the identification oforthologous genesThus aCSHmicroarray analysis offers thepossibility of furthering our understanding of cross-speciescommonalities and differences that could lead to moreeffective use of animal models to understand the regulationof mammary gland development at the molecular level [6]Dissection of unique patterns of expression of orthologousclusters of genes among species throughout distinct physio-logical time points along pregnancy and lactation could proveuseful in the integrative analysis of the information availablefor discerning themolecular events underlying the regulationof mammary gland development and function that lead tomilk synthesis
In this study bioinformatics techniques were applied totranscriptomic data These data resulted from heterologousmicroarrays of target RNA samples derived from rat mam-mary gland during distinct stages of pregnancy and lactationin order to extrapolate and enhance the understanding ontranscriptional module networks or coregulated functionalgene groups conserved in rodents and in the development ofthe mammary gland in humans
2 Materials and Methods
21 Experimental Animals and Tissue Collection Fifteenfemale Sprague Dawley rats were obtained from the AnimalCare Facility of Centro Medico Nacional Siglo XXI of theMexican Institute of Social Security (IMSS) in Mexico CityAnimals were housed at 22 plusmn 2∘C with a 12 h lightdarkcycle with free access to water and a purified diet wasadministered ad libitum during pregnancy and lactationDietary composition was previously reported by our group[7] At 14 weeks of age rats were randomly assigned to fivegroups representing distinct time points in mammary glanddevelopment virgin (V) day 5 (P5) and day 14 (P14) ofpregnancy and day 1 (L1) and day 12 (L12) of lactationThree rats were included in each group Rats were matedand the same diet was administered during pregnancy andlactation The day on which sperm was identified in vaginalsmears was designated as day 1 of pregnancy and the dayof parturition was designated as day 1 of lactation Pregnantrats were housed individually Litters were adjusted to eightpups per dam No gender differentiation was made Pupsremained with their mother to stimulate milk synthesis Ratswere euthanized and whole mammary tissue was removedfrom V P5 P14 L1 and L12 rats Tissue was immediatelyfrozen in liquid nitrogen and stored at minus70∘C for subsequenttotal RNA isolation or histological analysis
22 Microarray Analysis
221 Total RNA Isolation Total RNAwas isolated from tissue(01-02 g) using TRIzol (Invitrogen Carlsbad CA USA)following the method of Chomczynski and Sacchi [8] TotalRNA frommammary tissue was isolated from three differentanimals of each physiological period (V P5 P14 L1 and L12)pooled and kept in aliquots for later determination of purityand integrity Total pooled RNA was used for microarrayanalysis and quantitative real-time PCR
Four microarray datasets generated using the custom-designedMus musculus oligonucleotide array containing 65-mer probe sets representing 22000 transcripts (Microar-ray Unit Cellular Physiology Institute UNAM MexicoCity) were analyzed Each dataset represented distinct timepoints in mammary gland development such as P5 P14L1 and L12 Histologically the mammary proliferative stageis represented by P5 the secretory differentiation stageby P14 early lactation by L1 and full lactation by L12Design of the microarray experiments is presented inTable S1 in supplementary materials available online athttpdxdoiorg1011552013624681
222 Probe Preparation and Hybridization to Arrays Ten120583g of total pooled RNA was reverse transcribed intocDNA incorporating dUTP-Cy3 or dUTP-Cy5 and using theCyScribe First-Strand cDNA labeling kit (Amersham Bio-sciences Piscataway NJ USA) Using hybridization solutionUniHyb (TeleChem International Inc Sunnyvale CA USA)equal quantities of labeled cDNA were hybridized to theM22K 01 microarray for 14 h at 42∘C Four hybridizationassays were carried out as follows (a) the fluorophore used
International Journal of Genomics 3
was dUTP-Cy3 for control nonpregnant virgin rats (V) anddUTP-Cy5 for P5 (b) dUTP-Cy3 for V and dUTP-Cy5 forP14 (c) dUTP-Cy3 for V and dUTP-Cy5 for L1 and (d)dUTP-Cy3 for V and dUTP-Cy5 for L12 Each hybridizationassay was carried out in triplicate
Data acquisition and analysis of array images were per-formed in ScanArray 4000 with its accompanying softwareScanArray 4000 from Packard BioChips
23 Data Analysis
231 Global Analysis Overview of Gene ExpressionMicroarray data analysis was performed with freesoftware genArise which was developed in the ComputingUnit of the Cellular Physiology Institute of the UNAM(httpwwwifcunammxgenarise) The goal of genAriseis to identify which genes show good evidence of beingdifferentially expressed The software identifies differentiallyexpressed genes by calculating an intensity-dependentz-score Elements with a z-score gt15 standard deviations areconsidered to be significantly and differentially expressedgenes
The complete set of raw Excel data files have beendeposited at Gene Expression Omnibus (GEO) and areavailable on the GEO website (ID GEO GSE22545)
232 Clustering Analysis for Gene Expression Gene lists weregenerated by a set ofmultiple comparisons among the distinctdevelopmental stages and intersection in Venn diagramsTwo-way hierarchical clustering with average linkage and arange of 5 to 15 K-means classifications were used to groupour time series data using open source software Cluster v30[9] Java TreeView was used to display the clustering resultsas dendogram or heat map representations We adopted theprocedure as described in [10] to code the mean expressionof a cluster at each stage as flat decreased and increased andconverted it to numerical representation
233 Determination of Orthologous Genes Putative orthol-ogous genes in rat mouse and human were identi-fied from a genome comparative search with Roundup(httprodeomedharvardedutoolsroundup) Roundup isan ortholog and phylogenetic profile retrieval tool backedby a massive repository of orthologous and associated evolu-tionary distances that were built using the reciprocal smallestdistance algorithm [11] The search was done with a stringentblast E-value threshold of 10 times 10minus5 and a divergencethreshold of 02
234 Gene Ontology Analysis The DAVID 20 FunctionalAnnotation Tool (httpdavidabccncifcrfgovsummaryjsp)was used to sort and arrange the similar redundant andheterogeneous annotation contents from a set of genes intodefined functional groups In the case of insufficient geneontology information published data on orthologous geneswas used to classify the gene into a functional category
235 PathwayAnalysis Pathwaymappingwas accomplishedusing the Kyoto Encyclopedia of Genes and Genomes
(KEGG) database of biological systems that integratesgenomic chemical and systemic functional information(httpwwwgenomejpkeggkegg2html)
236 Interaction Network Analysis Gene lists were con-verted to Human SwissProt IDs using tables from theEnsembl database release 42 [12] For each list of HumanSwissProt IDs interactions between those gene productswere obtained from Online Predicted Human InteractionDatabase (OPHID) and postprocessed using custom scriptsto determine all linkages in the network and to generatea network file This network file was then explored usingNAVIGaTOR v2015 a program for large network analysis(httpophidutorontocanavigatorindexhtml)
237 Transcription-Factor Binding-Site Prediction Tran-scription-factor-binding site (TFBS) prediction was accom-plished using CORE TF (Conserved and Over-RepresentedTranscription Factor binding sites) a web-based toolthat identifies overrepresented TFBS in promoters fromcoexpressed genes aided by the evaluation of cross-speciesconservation
238 Quantitative Real-Time PCR We utilized qRT-PCR forvalidation of microarray results We measured the relativetranscript levels of 14 target genes and five genes commonlyused as references such asGlyceraldehyde-3-phosphate dehy-drogenase (Gapdh) beta-actin (Actb) and ribosomal largeprotein P0 (Rlp0) were used as high abundance internalcontrols as well as splicing factor arginineserine-rich 1(Sfrs1) and hypoxanthine guanine phosphoribosyl transferase1 (Hprt1) as medium- and low-abundance internal controlsrespectively (Table S2)
Quantitative real-time PCR was performed in a 20120583Lreaction with 50120583L from 14 reverse transcription dilutionusing the LightCycler ProbesMastermix (RocheDiagnosticsMannheim Germany) containing 02 120583M of mRNA-specificprimers and 01 120583M corresponding UPL probe into LightCy-cler microplate wells under reduced light conditions Eachsample was run in triplicate
24 Calculations and Statistics The results are expressedas mean plusmn SEM of at least three individual experimentalobservations Data were tested for normality of distributionby the Kolmogorov-Smirnov test Statistically significantdifferences among experimental groups (between the meanvalues of each group) were determined by an unpairedStudents t-test (z-test) ANOVA or a modified Fisherrsquos exacttest Nonnormally distributed data were analyzed by theMann-Whitney U test
3 Results
31 Histological Characteristics of Pregnant and LactatingMammary Gland The rat mammary gland undergoes aseries of dramatic phenotypic changes during pregnancy andlactation In order to determine the integrity of the dissectedinguinal mammary glands a gross histological evaluation
4 International Journal of Genomics
V
(a) (b)
P5
(c) (d)
P14
(e)
Ep
Ad
(f)
L1
(g) (h)
L12
L
(i) (j)
Figure 1 Histological features of the mammary gland from ratsduring pregnancy and lactation Mammary glands were isolatedfrom Sprague Dawley rats in (a b) a nonpregnant virgin (V) stage(c d) day 5 (P5) and (e f) day 14 (P14) of pregnancy and (g h)day 1 (L1) and (i j) day 12 (L12) of lactation cryosectioned andstained with hematoxylin and eosin Scale bars in (a) (c) (e) (g)and (i) = 50 120583m whereas those in (b) (d) (f) (h) and (j) = 10120583mAdipose compartment (Ad) lobuloalveolar units (998771) epithelialcompartment (Ep) luminal structures (L) and milk globules (uarr)
of the characteristic cytomorphological features were deter-mined through hematoxylin-eosin staining (Figure 1) Fourtime points (pregnancy days 5 and 14 lactation days 1 and12) were selected to represent distinct periods in mammarygland development Histologically the mammary prolifera-tive stage is represented by P5 the secretory differentiationstage by P14 early lactation by L1 and full lactation by L12
As reported elsewhere [13] initial changes observedduring pregnancy include an increase in ductal branching
and the formation of alveolar buds (Figures 1(c) and 1(d))Thelatter half of pregnancy is characterized by the expansion ofalveolar buds to form clusters of lobuloalveolar units followedby the differentiation of these structures into presecretorystructures By day 14 of pregnancy there is a readily apparentincrease in the size of the epithelial compartment (Ep)(Figures 1(e) and 1(f)) and expansion of the epithelium(whereas the adipose compartment decreases) continuesuntil the epithelial compartment predominates by onset oflactation (Figures 1(g) and 1(h)) By day 12 of lactation inthe rat the mammary gland is producing copious amountsof milk [7] As expected examination of the histology ofthe mammary gland at this stage reveals prominent luminalstructures (L) and ducts and few adipocytes visible at thistime (Figures 1(i) and 1(j))
32 Global Analysis Overview of Gene Expression In thisstudy we analyzed expression profiles of 22000 transcriptsusingmurinemicroarrays and RNA samples ofMG from vir-gin pregnant and lactating rats by cross-species hybridiza-tion We first identified the total number of genes differen-tially expressed throughout distinct time points in mammarygland development such as P5 P14 L1 and L12
A total of 807 oligonucleotide probe sets representing 521annotated genes showed differential expression in at leastone of four physiological time points evaluated taking intoconsideration a mean z-score cutoff value of 150 standarddeviations using GenArise
During early pregnancy (day 5) 158 transcripts weredifferentially expressed Most of these transcripts (123 778)were upregulated suggesting a feasible tendency in the direc-tion of gain of function versus the virgin stage (V) Likewisein mid-pregnancy (day 14) as opposed to the virgin stagethe number of transcripts with an altered expression main-tained a similar value (133 transcripts 8926 upregulated)During early and mid-lactation (days 1 and 12) 342 and461 transcripts were differentially expressed correspondingto a percentage of 640 and 384 overexpressed respectively(Figure 2(a))
To further illustrate the differences and commonalitiesamong the four physiological time points changes in geneexpression were also interpreted with a Venn diagram Asshown in Figure 2(b) the descriptive table of the Venndiagram denotes the number of genes showing upregulation(uarr) or downregulation (darr) uniquely at pregnancy (day 5 or14) or lactation (day 1 or 12) and differential expression ata combination of stages Venn diagram analysis indicatedthat 472 (381807) of all the differentially expressed tran-scripts presented an average significant z-score fold change(z gt plusmn15) exclusively during either or both time points oflactation Interestingly among the 381 altered gene transcriptsduring lactation 648 (247381) were found downregulatedimplying as previously stated by Lemay et al (2007) [2] thatmammary epithelial cells become biofactories not by gain offunction but by a broad suppression of function to effectivelypush all cell resources towards a very few important tasks Allthe gene sets that shared spatial and temporal distributions(overlapping changes in expression) are listed in additionaldata files (Table S3)
International Journal of Genomics 5
123 133
219177
35 16
123
284
0
50
100
150
200
250
300
P5 P14 L1 L12Developmental stage
Num
ber o
f tra
nscr
ipts
vers
us co
ntro
l
(a)
Description No of genes Supplementary MaterialAdditional data files
a P5 P14 L1 L12 86 22 Table S3-Ab P5 P14 L12 9 1 Table S3-Bc P5 P14 L1 33 2 Table S3-Cd P14 L1 L12 80 11 Table S3-De P5 L1 L12 5 38 Table S3-Ef P5 P14 21 0 Table S3-Fa c e P5 L1 4 3 Table S3-Gi P5 L12 8 18 Table S3-Hg P14 L1 18 2 Table S3-Ia b d P14 L12 8 6 Table S3-Jh L1 L12 74 111 Table S3-Kj P5 31 12 Table S3-Lk P14 5 3 Table S3-Ml L1 26 15 Table S3-Nm L12 34 121 Table S3-O
P14
L1P5
L12
a
c
e h
g
i
f
m
k
lj db
uarr darr
(b)
Figure 2 Overview of gene expression during mammary development through early pregnancy to mid-lactation (a) Number of alteredtranscripts of each developmental stage versus a virgin stage (fold change (z-score) gt15) Low expression is represented by green and highexpression is represented by red (b) Venn diagram and representative table illustrating the number of significant altered gene transcripts andoverlaps among different reproductive stages
33 Clustering Analysis for Gene Expression To determineglobal alterations in gene expression across developmentalstages of the mammary gland from early pregnancy tomid-lactation we performed a complete-linkage hierarchicalclustering with an Euclidean distance similarity metric onthe expression profiles of the differentially expressed genes(annotated and EST) across all four time points The expres-sion profiles of the 807 genetic elements resulted in sixpredominant clusters on a dendogram (designated clusters1ndash6 in Figure 3) All the gene cluster sets are enumerated inTable S4
Cluster 1 (C1) represents 3735 of the total 807 geneticelements This major trend is a decline in gene expressionduring mid-pregnancy that remains low during lactationCluster 2 (C2) describes 2577 of the total data populationand is characterized by a linear decrement in gene expressiontowards mid-lactation However positive z-score values areretained with respect to the reference stage (virgin) Theremainder of the clusters (C3ndashC6) appears to explain between309 and 1784 of the data variation In C3 and C4 geneexpression rises exponentially fromearly pregnancy reachinga plateau during mid-lactation However the slope of thecurve is even steeper in C3 in comparison to C4 In cluster
5 (C5) 65 elements matched the profile outline (invertedsigmoid form) of major trend C1 although the reductiontendency was less marked In cluster 6 (C6) expression wasroughly unchanged during pregnancy and lactation Even sothe relative abundance of transcripts remained in a higherproportion than the reference virgin stage as described forC2
This transcriptional profile involved in the mammarydevelopment program identified in rat could be conservedin others mammals like mouse Consequently in order todelineate potential groups of coregulated genes final clustermembership was determined by a K-means analysis based onthe preestimated number (six) of gene clusters
K-means clustering revealed six distinct clusters (K1ndash6)that distinguished up from down early from middle andtransient from sustained changes in expression (Figure 4Table S5) Each of the six clusters was designated with itsunique trajectory expression profile signature across stages(pregnancy days 5 and 14 lactation days 1 and 12) as presentedin Figure 4
There were two major groups of 245 under- and 175overexpressed tags during lactation only (Table S5 K1 1100and K3 1122 according to the procedure of Rudolph et al[10] to code the mean expression see Section 2) Among
6 International Journal of Genomics
minus500minus450minus400minus350minus300minus250minus200minus150minus100minus50
0P5 P14 L1 L12
299 features
050
100150200250300350400450
P5 P14 L1 L12
208 features
minus100minus50
050
100150200250300
P5 P14 L1 L12
144 features
minus100minus50
050
100150200250
P5 P14 L1 L12
66 features
P5
minus180minus160minus140minus120minus100minus80minus60minus40minus20
0P14 L1 L12
65 features
010203040506070
P5 P14 L1 L12
25 features
C1 C2 C3
C4 C5 C6
Figure 3 Unsupervised hierarchical clustering of the differentially expressed gene list Gene expression profiles Gene expression data fromthe 807 tags comprising the significant altered gene transcript list (z-score gt plusmn150) were best represented by six clusters consisting of distinctup (red) and down (green) patterns of expression Developmental stage time points and fold change are indicated on the x- and y-axesrespectively The number of features (genetic elements) in each cluster is indicated A black pseudoline representing the general (average)pattern of expression has been superimposed on each cluster
the typical upregulated genes of lactation stage are themilk protein (casein alpha (Csn1s1 Csn1s2a) casein beta(Csn2) and whey acidic protein (Wap)) and biogenesis genesthat mainly concern glucose and lipid metabolism (Akr1c6Aldob Ugt2b1 Plb1 Apoe and Sult2b1) and transcriptionalregulation (Stat5a Pou2af1) [2] Among those genes foundsignificantly downregulated only during lactation severalplay an important role in the regulation of apoptosis medi-ation of metastatic behavior (epithelial-mesenchymal tran-sition) or ubiquitin-mediated protein catabolism (lysosomedegradation) in themammary gland including Igfbp5Mmp2and Ube2r2 [14 15] One hundred forty-nine genes wereupregulated exclusively during early pregnancy (K2 2111)such as Esr1 Esr2 Tshr and Oxt These participate in thetransduction of hormonal status [2 16] involved in themodulation of important physiological processes such ascarbohydrate metabolism (Creb3l4 Hk1 and Coasy) [17]glutathione metabolism (Ggt1 Mgst1 and Gstm6) [18] celldifferentiation (Foxa1 Mtap7 Gdf1 Twist2 Hey1 Dll4 andPcaf ) [19ndash23] stromal-epithelial communication (cell-celljunctions) (Cldn10 Mpp5 and Epb4) [24] and cell adhesion(Matn1 Krt71 Mpzl2 and Dscaml1) [25]
The smallest group of 24 genes were significantly upregu-lated exclusively at the onset of lactation (K4 1121) such asLpo Cd8a and Irs1 important for lactogenesis particularly inmilk production capabilities and related immunotropic con-stituents (antigen-specific CD8+ T cells) found in colostrum[26 27] One hundred nineteen genes were downregulatedfrom early pregnancy (K5 1110) For example Acta1 Flnc
and Pax7 which are either restricted to muscular tissues orinvolved in myogenic development and cellular differentia-tion [28 29] are included in this group According to thetrajectory profile signature 95 additional genes were foundupregulated at all stages evaluated (K6 2222) Interestinglymost of the overexpressed genes in this group include generaltranscription and translation (including spliceosome andprotein folding) machinery factors (Eif4a2 Eif2ak1 Etf1 Taf1Ercc2 Sart1 Ppih and Dbr1) [30 31] as well as structural(Itga5 Actg1 Add2 Cldnd2 Rptn and Triobp) [32] and basalmetabolic genes (Pank4 Agpat5 Cyp24a1 and Phyh) [33]
34 Determination of Orthologous Genes Once the geneclusters were properly defined identification of ortholo-gous gene transcripts among the time course differentiallyexpressed gene list subsetswas critical for reliable comparisonof gene function and subsequent determination of probablyconserved transcriptional modules implicated in biologi-cal processes during the development of mammary tissueAccording to genome comparative RoundUp orthologousdatabase of a total of 448 transcripts upregulated and 371downregulated 213 (upregulated) and 183 (downregulated)genes were identified as orthologous to rat andor humanThe remainder of the genes was discarded or removed fromsubsequent analysis due to lack of similarity insufficientinformation or unknown identifiers A complete list oforthologous genes from each dataset was compiled (TableS6)
International Journal of Genomics 7
minus100
0
100
200
300
400
500
P5 P14 L1 L12
175 features
minus500minus450minus400minus350minus300minus250minus200minus150minus100minus50
0P5 P14 L1 L12
245 features
0
50
100
150
200
250
300
P5 P14 L1 L12
149 features
minus250
minus200
minus150
minus100
minus50
0P5 P14 L1 L12
119 features
0
50
100
150
200
250
P5 P14 L1 L12
95 features
minus20minus10
010203040506070
P5 P14 L1 L12
24 features
K2K1
K3 K4
K5 K6
Figure 4 K-means clustering of the differentially expressed gene list with trajectory expression profile signatures Gene expression data fromthe 807 tags comprising the significant altered gene transcript list (z-scoregt plusmn150) were best represented by six K-means clusters consisting ofdistinct up (red) and down (green) patterns of expression Developmental stage time points and fold change are indicated on the x- and y-axesrespectively The numbers of tags in each cluster are indicated A black pseudoline representing the general (average) pattern of expressionhas been superimposed on each cluster
Among the upregulated orthologous genes to rat andorhuman are those encoding to milk proteins carbohydrateand lipid metabolism transcriptional factors [17 34] trans-duction of hormones [16] glutathione metabolism [18]and cell differentiation [19 20] Others are associated withstromal-epithelial communication [24] cell adhesion [25]lactogenesis [26] and general transcription and translationmachinery factors [30] as well as structural [32] and basalmetabolic genes [33ndash35]
Among those genes found significantly downregulatedseveral play an important role in the regulation of apoptosismediation of metastatic behavior (epithelial-mesenchymaltransition) or ubiquitin-mediated protein catabolism (lyso-some degradation) [14 15] Also genes restricted tomuscular
tissues or involved in myogenic development and cellulardifferentiation [28 36] are downregulated
35 Confirmation Studies Taking into consideration theirtemporal expression profile signature and the fact that theyrepresent different K-means cluster 14 genes were selectedfor real-time PCR analysis (Table S2) Results show that theexpression trends were consistent with the results from themicroarray analysis Correlation analysis showed good agree-ment between real-time RT-PCR and microarray analysisMicroarray results for all 14 genes tested were confirmed byreal-time RT-PCR with regard to direction and significanceof change (Figure 5)
8 International Journal of Genomics
Csn1s1
minus300minus200minus100
000100200300400500
P5 P14 L1 L1200020004000600080001000012000
Stat5a
minus150minus100minus050
000050100150200250
P5 P14 L1 L12000050100150200250300350
Esr1
000050100150200250
P5 P14 L1 L12000050100150200250300350400
Mmp2
minus250minus200minus150minus100minus050
000
P5 P14 L1 L12000020040060080100120140
Runx2
minus200minus160minus120minus080minus040
000
P5 P14 L1 L12000020040060080100120
Egr2
minus250minus200minus150minus100minus050
000
P5 P14 L1 L12000050100150200250300350
Tshr
000050100150200250
P5 P14 L1 L12000020040060080100
Oxt
000040080120160
P5 P14 L1 L12000
2000
4000
6000
8000Pax7
minus200minus160minus120minus080minus040
000
P5 P14 L1 L12000020040060080100120140
Taf1
minus050000050100150200250300350
P5 P14 L1 L12000020040060080100120
Flnc
minus180minus140minus100minus060minus020
P5 P14 L1 L12000020040060080
Acta1
minus250minus200minus150minus100minus050
000
P5 P14 L1 L12000010020030040050060070
Pank4
000050100150200250300
P5 P14 L1 L12000020040060080100120140
Itga5
000050100150200250300350
P5 P14 L1 L12000020040060080100120140
Microarray (z-score)qRT-PCR (average all)
Microarray (z-score)qRT-PCR (average all)
Figure 5 Validation of differentially expressed genes identified by microarray using qRT-PCR Quantitative real-time-PCR was performedas in Experimental Procedures and the calculated mean log ratio for each gene in their corresponding developmental stage was comparedwith the mean z-score from the microarray analysis during that same period A positive value indicates a greater mRNA abundance in adevelopmental stage than in the control group whereas a negative value indicates a lower mRNA abundance in a developmental stage than inthe control group Lines represent data obtained by qRT-PCR (red right axis) and microarray analysis (blue left axis) respectively whereasthe x-axis represents the physiological time point The average fold change relative to time-matched virgin controls for three animals pergroup is shown Genes are indicated by their official gene symbols Data are presented as the mean of three independent experiments eachperformed in triplicate Error bars represent the SD for the average fold change The correlation information in each analysis is indicated bySpearman rho value (119903
119904
) All 18 pairs of genes had an absolute correlation value of 119903119904
= 049 with a 119875 = 759119864 minus 06 ND not detected
4 Discussion
Structural and functional homologies of specific genes areimportant Conservation of functional blocks of genes islikely to be more important in a cross-species compari-son We found distinct blocks of significantly differentially
expressed genes within different cytogenetic regions of therat with homologous chromosomal segments in human andmouse However human mouse and rat have differentchromosomal arrangements Genes in these blocks appearin contiguous cytogenetic regions irrespective of speciesand chromosomal location This finding is not surprising
International Journal of Genomics 9
0005101520253035
P5 P14 L1 L12
Stat5a
aa
aa
0005101520253035
P5 P14 L1 L12
Pou2af1a
b
b b
0002040608101214
P5 P14 L1 L12
Creb3l4
000510152025303540
P5 P14 L1 L12
Esr1
a
a
a
b
00
05
10
15
20
P5 P14 L1 L12
Esr2
a
a
a
a
00
02
04
06
08
10
12
P5 P14 L1 L12
Runx2a
a bb b
0005101520253035
P5 P14 L1 L12
Egr2a
b
b c c
0001020304050607
P5 P14 L1 L12
Pou3f2a
b b b
00
02
04
06
08
P5 P14 L1 L12
Foxa1a
bb
b
0002040608101214
P5 P14 L1 L12
Pax7
a
b
a
a
a
b
a
a
ΔΔ
Ct (q
RT-P
CR)
ΔΔ
Ct (q
RT-P
CR)
ΔΔ
Ct (q
RT-P
CR)
ΔΔ
Ct (q
RT-P
CR)
ΔΔ
Ct (q
RT-P
CR)
ΔΔ
Ct (q
RT-P
CR)
ΔΔ
Ct (q
RT-P
CR)
ΔΔ
Ct (q
RT-P
CR)
ΔΔ
Ct (q
RT-P
CR)
ΔΔ
Ct (q
RT-P
CR)
Figure 6 Gene expression profiles of the putative transcriptional factors identified by microarray using qRT-PCR Quantitative real time-PCR was performed as in Experimental Procedures and the calculated mean log ratio for each gene in their corresponding developmentalstage was determined A positive value indicates a greater mRNA abundance in a developmental stage than in the control group whereas anegative value indicates a lower mRNA abundance in a developmental stage than in the control group Bars represent data obtained by qRT-PCR (y-axis) whereas the x-axis represents the physiological time pointThe average fold change relative to time-matched virgin controls forthree animals per group is shown Genes are indicated by their official gene symbols Data are presented as the mean of three independentexperiments each performed in triplicate Bars represent the average (plusmnSD) fold change Different letters indicate statistically significantdifferences between developmental stages (119875 lt 005) Note that the scales of the y-axis vary among genes ND not detected
10 International Journal of Genomics
considering the close evolutionary distance between thespecies where 278 orthologous segments are reported tobe shared between human and rat and 280 segments arereported to be shared between human and mouse [4] Itis proposed that these gene blocks may be significant formammary gland development andmaintenance and progres-sion of lactation across human rat and mouse For examplegenes in the blocks may be coordinately expressed to sharetranscription programs as stated in previous studies [37]The argument may be made against the feasibility of usingrodent data to draw inferences to human mammary glandgene expression However our objective in this study wasto utilize the best available sources of information such asrat gene expression data during mammary development andmapping data to develop hypotheses on putative functionalgene blocks conserved across species underlying similaritiesdespite reported differences in the architecture and hormonalcontrol of mammary glands between rats and other rodentsand between rats and humans [38 39]
In an effort to further characterize potential highlycoregulated gene blocks we combined transcription-factorbinding-site prediction [40] along the promoters of eachgene member with the detection of expression profiles ofannotated altered transcripts categorized as nucleic acidbinding protein Several families of transcription factorswere identified (Table S7) For the most part zinc fin-ger domainmotif proteins were the most widely repre-sented The presence of cis-elements found with CORE TF(httpwwwLGTCnlCORE TF) in the promoters of thegenes Slc44a4 Ppt2 and B3galt4 that compromises the con-served block D15 (Table S8) along with the cotranscription ofmRNAs that encoded for trans-regulator elements suggeststhat they are most likely modulated by transcription factorsRunx2 Creb3l4 Pou3f2 and Pou2af1 Correspondingly thegene members of block U1 may possibly be coregulated bytranscription factors Stat5a Foxa1 Creb3l4 and Pou2af1 Inthe samemanner other gene blocks (U3 U8 U9 D1 D9 andD14 Table S8)were foundmost likely co-regulated by aminornumber of transcription factors (Foxa1 Creb3l4 Pou2af1 orEgr2) Hence identification of conserved overrepresentedupstream motifs unravels putative regulatory elements fortranscription (Figure 6) in at least half of the gene blockmembers reported in this study Consequently these resultsstrongly substantiate the maintenance of comparable tran-scriptional regulation programs among the predicted coex-pressed modules
Because cotranscription of genes in conserved blocksmay allow concerted expression of gene products involvedin the same response or pathway [41] integration of thistype of analysis enables the discovery of putative evolutionaryconserved regulatory networks among mammals Thus theco-regulated clusters we proposed may indeed be conservedtranscriptional modules through evolution at least betweenrodents and primates
Heterologous hybridization experiments on anymicroar-ray are of limited use for genes that have undergone rapidevolutionary change in coding regions large rearrangementsand duplication [42] Long oligonucleotide-based microar-ray platform may be more suitable for cross-species gene
expression studies than a short oligonucleotide-based system[43] This comparative approach is based on the assumptionthat similar gene sequences in closely related species allowa reasonably reliable detection of many orthologous genesFor instance according to several independent and unrelatedstudies carried out on comparable 50 to 60-mer oligonu-cleotide microarrays cross-hybridization was observed onlywith genes with 50ndash75 overall sequence identity respec-tively [44 45] Considering that orthologous genes betweenhuman and mouse and between human and rat both have amean of sim85 sequence identity [46] validity of the resultsobtained in this studymdashdespite the problems encounteredby CSHmdashin comparison to SSH seems upholding In factthe nucleotide sequence alignment confirmed an gt753homology at least for the transcript members of the distinctgene blocks described depending on the sequence evaluatedamong primates and rodents reinforcing the notion of attain-ing valid biological results In addition similar expressiontrends for distinct probe sets for one corresponding gene(data not shown) seem to largely substantiate the certaintyand reproducibility of hybridization results obtained in thisstudy
Because of the challenges inherent toCSHdata their con-firmation by other techniques is essential [43] In addition toqRT-PCR orthologous gene expression profiles with syntenicregions of rat mouse and human chromosomes reinforceanother confirmation method that potentially substantiatesthe CSH results obtained in this study Nonetheless furthervalidation of the results must be carried out by using CSH ofhuman RNA to mouse oligonucleotide arrays
This study provides access to a prevalidated platform foranalyzing transcriptional changes in rat mammary glandThis paper will hopefully spur an increase of mammary glandCSH transcriptome analysis thus adding to our knowledgebase of this interesting evolutionary feature amongmammalsHowever although we acknowledge the multitude of aspectsthat can be elucidated by traditional SSH transcriptomeanalysis we believe the biggest potential of the presentedmicroarray lies in themultispecies-type studies describedWedemonstrated that data analysis strategies such as the com-bination of orthologous gene expression profiles and chro-mosome mapping in conjunction with directed promotertranscription-factor binding-site prediction presented herecan add strength to conclusions and help identify systemsand responses that are conserved across the mammal taxaThe possibility of studying the evolutionary depth of tran-scriptional regulation adds a new dimension to comparativetranscriptomic particularly identification of differentially co-regulated gene blocks mapped to highly conserved syntenicchromosomal regions which is important in mammarygland development using CSH experiments among mammalspecies
Conflict of Interests
All authors declare that they have no financial or personalrelationships with other persons or organizations that couldinappropriately influence this work
International Journal of Genomics 11
Acknowledgments
This study was supported by the Coordinacion de Inves-tigacion Medica en Salud Instituto Mexicano del SeguroSocial (IMSS) Mexico (Grant no FISIMSSPROT531) andConsejo Nacional de Ciencia y Tecnologıa (CONACYT)Mexico (Grant no 101012) The authors thank Dr CarlosPerez Plasencia and Dr Omar K Ruvalcaba Salazar fortheir careful reading of this paper and useful commentsthat improved the presentation Simon Guzman Leon JoseLuis Santillan Torres and Lorena Chavez Gonzalez fromthe DNA Microarray Facility for technical assistance inthe microarray determination and Gerardo Coello LinaRiego Gustavo Corral Patricia Gomez and Emmanuel Platafor GenArise software assistance The authors acknowledgeSharon Morey Scientific Communications for providingeditorial assistance
References
[1] T W Hale and P Hartmann Textbook on Human LactationHale Publishing Amarillo Tex USA 2007
[2] D G Lemay M C Neville M C Rudolph K S Pollardand J B German ldquoGene regulatory networks in lactationidentification of global principles using bioinformaticsrdquo BMCSystems Biology vol 1 article 56 2007
[3] X J Zhou and G Gibson ldquoCross-species comparison ofgenome-wide expression patternsrdquo Genome Biology vol 5 no7 article 232 2004
[4] R A Gibbs G M Weinstock M L Metzker et al ldquoGenomesequence of the Brown Norway rat yields insights into mam-malian evolutionrdquoNature vol 428 no 6982 pp 493ndash521 2004
[5] D L Wheeler T Barrett D A Benson et al ldquoDatabaseresources of the National Center for Biotechnology Informa-tionrdquo Nucleic Acids Research vol 35 no 1 pp D5ndashD12 2007
[6] H Koltai and C Weingarten-Baror ldquoSpecificity of DNAmicroarray hybridization characterization effectors andapproaches for data correctionrdquo Nucleic Acids Research vol 36no 7 pp 2395ndash2405 2008
[7] M Rodrıguez-Cruz R SanchezM Bernabe-Garcia JMaldon-ado M del Prado and M Lopez-Alarcon ldquoEffect of dietarylevels of corn oil on maternal arachidonic acid synthesis andfatty acid composition in lactating ratsrdquoNutrition vol 25 no 2pp 209ndash215 2009
[8] P Chomczynski and N Sacchi ldquoSingle-step method of RNAisolation by acid guanidinium thiocyanate-phenol-chloroformextractionrdquo Analytical Biochemistry vol 162 no 1 pp 156ndash1591987
[9] J H Kim ldquoChapter 8 biological knowledge assembly andinterpretationrdquo PLOS Computational Biology vol 8 no 12Article ID e1002858 2012
[10] M C Rudolph J L McManaman L Hunter T Phang and MC Neville ldquoFunctional development of the mammary glandUuse of expression rofiling and trajectory clustering to revealchanges in gene expression during pregnancy lactation andinvolutionrdquo Journal of Mammary Gland Biology and Neoplasiavol 8 no 3 pp 287ndash307 2003
[11] T F DeLuca I-H Wu J Pu et al ldquoRoundup a multi-genome repository of orthologs and evolutionary distancesrdquoBioinformatics vol 22 no 16 pp 2044ndash2046 2006
[12] P Flicek B L Aken K Beal et al ldquoEnsembl 2008rdquoNucleic AcidsResearch vol 36 no 1 pp D707ndashD714 2008
[13] S M Anderson M C Rudolph J L McManaman and M CNeville ldquoKey stages inmammary gland development Secretoryactivation in the mammary gland itrsquos not just about milkprotein synthesisrdquo Breast Cancer Research vol 9 no 1 article204 2007
[14] D J Flint M Boutinaud C B A Whitelaw G J Allanand A F Kolb ldquoProlactin inhibits cell loss and decreasesmatrix metalloproteinase expression in the involuting mousemammary gland but fails to prevent cell loss in the mammaryglands of mice expressing IGFBP-5 as a mammary transgenerdquoJournal of Molecular Endocrinology vol 36 no 3 pp 435ndash4482006
[15] Y Ning B Hoang A G P Schuller et al ldquoDelayed mammarygland involution in mice with mutation of the insulin-likegrowth factor binding protein 5 generdquo Endocrinology vol 148no 5 pp 2138ndash2147 2007
[16] A Morani M Warner and J-A Gustafsson ldquoBiological func-tions and clinical implications of oestrogen receptors alfa andbeta in epithelial tissuesrdquo Journal of Internal Medicine vol 264no 2 pp 128ndash142 2008
[17] S B Aicha J Lessard M Pelletier A Fournier E Calvo andC Labrie ldquoTranscriptional profiling of genes that are regu-lated by the endoplasmic reticulum-bound transcription factorAIbZIPCREB3L4 in prostate cellsrdquoPhysiological Genomics vol31 no 2 pp 295ndash305 2007
[18] J Alander J Lengqvist P J Holm et al ldquoMicrosomal glu-tathione transferase 1 exhibits one-third-of-the-sites-reactivitytowards glutathionerdquo Archives of Biochemistry and Biophysicsvol 487 no 1 pp 42ndash48 2009
[19] H Nakshatri and S Badve ldquoFOXA1 in breast cancerrdquo ExpertReviews in Molecular Medicine vol 11 p e8 2009
[20] D R Magnan D V Spacek N Ye Y-C Lu and T R KingldquoThemale sterility and histoincompatibility (mshi) mutation inmice is a natural variant of microtubule-associated protein 7(Mtap7)rdquoMolecular Genetics and Metabolism vol 97 no 2 pp155ndash162 2009
[21] C T Rankin T Bunton AM Lawler and S-J Lee ldquoRegulationof left-right patterning inmice by growthdifferentiation factor-1rdquo Nature Genetics vol 24 no 3 pp 262ndash265 2000
[22] J C Martinez M M Muller H Turley et al ldquoNuclear andmembrane expression of the angiogenesis regulator delta-likeligand 4 (DLL4) in normal and malignant human tissuesrdquoHistopathology vol 54 no 5 pp 598ndash606 2009
[23] C Zhu Y-R Qin D Xie et al ldquoCharacterization of tumor sup-pressive function of P300CBP-associated factor at frequentlydeleted region 3p24 in esophageal squamous cell carcinomardquoOncogene vol 28 no 31 pp 2821ndash2828 2009
[24] A C Zemke J C Snyder B L Brockway et al ldquoMolecularstaging of epithelial maturation using secretory cell-specificgenes as markersrdquo American Journal of Respiratory Cell andMolecular Biology vol 40 no 3 pp 340ndash348 2009
[25] C Nicolae Y-P Ko N Miosge et al ldquoAbnormal collagen fibrilsin cartilage of matrilin-1matrilin-3-deficient micerdquo Journal ofBiological Chemistry vol 282 no 30 pp 22163ndash22175 2007
[26] D L Hadsell W Olea N Lawrence et al ldquoDecreased lactationcapacity and altered milk composition in insulin receptorsubstrate null mice is associated with decreased maternalbody mass and reduced insulin-dependent phosphorylation ofmammary Aktrdquo Journal of Endocrinology vol 194 no 2 pp327ndash336 2007
12 International Journal of Genomics
[27] C J Watson ldquoImmune cell regulators in mouse mammarydevelopment and involutionrdquo Journal of Animal Science vol 87no 13 pp 35ndash42 2009
[28] I Dalkilic J Schienda T GThompson and LMKunkel ldquoLossof filaminC (FLNc) results in severe defects in myogenesis andmyotube structurerdquoMolecular and Cellular Biology vol 26 no17 pp 6522ndash6534 2006
[29] Z Luan Y Liu T J Stuhlmiller J Marquez and M I Garcıa-Castro ldquoSUMOylation of Pax7 is essential for neural crest andmuscle developmentrdquo Cellular and Molecular Life Sciences vol70 no 10 pp 1793ndash1806 2013
[30] R C Wek and D R Cavener ldquoTranslational control and theunfolded protein responserdquo Antioxidants and Redox Signalingvol 9 no 12 pp 2357ndash2371 2007
[31] M C Thomas and C M Chiang ldquoThe general transcriptionmachinery and general cofactorsrdquo Critical Reviews in Biochem-istry and Molecular Biology vol 41 no 3 pp 105ndash178 2006
[32] I A Belyantseva B J Perrin K J Sonnemann et al ldquo120574-Actinis required for cytoskeletal maintenance but not developmentrdquoProceedings of the National Academy of Sciences of the UnitedStates of America vol 106 no 24 pp 9703ndash9708 2009
[33] N Saito Y Suhara D Abe et al ldquoSynthesis of 2120572-propoxy-112057225-dihydroxyvitamin D3 and comparison of its metabolismby human CYP24A1 and rat CYP24A1rdquo Bioorganic and Medici-nal Chemistry vol 17 no 13 pp 4296ndash4301 2009
[34] C J Watson and K Neoh ldquoThe Stat family of transcriptionfactors have diverse roles in mammary gland developmentrdquoSeminars in Cell and Developmental Biology vol 19 no 4 pp401ndash406 2008
[35] Y Li Y Chang L Zhang et al ldquoHigh glucose upregulates pan-tothenate kinase 4 (PanK4) and thus affects M2-type pyruvatekinase (Pkm2)rdquo Molecular and Cellular Biochemistry vol 277no 1-2 pp 117ndash125 2005
[36] D Horst S Ustanina C Sergi et al ldquoComparative expressionanalysis of Pax3 and Pax7 during mouse myogenesisrdquo Interna-tional Journal of Developmental Biology vol 50 no 1 pp 47ndash542006
[37] H Fang W Tong R Perkins et al ldquoBioinformatics approachesfor cross-species liver cancer analysis based onmicroarray geneexpression profilingrdquo BMC Bioinformatics vol 6 no 2 articleS6 2005
[38] M D Aupperlee A A Drolet S Durairaj W Wang R CSchwartz and S Z Haslam ldquoStrain-specific differences in themechanisms of progesterone regulation of murine mammarygland developmentrdquo Endocrinology vol 150 no 3 pp 1485ndash1494 2009
[39] C J Watson and W T Khaled ldquoMammary developmentin the embryo and adult a journey of morphogenesis andcommitmentrdquo Development vol 135 no 6 pp 995ndash1003 2008
[40] M S Hestand M van Galen M P Villerius G-J B vanOmmen J T den Dunnen and P A C Hoen ldquoCORE TFa user-friendly interface to identify evolutionary conservedtranscription factor binding sites in sets of co-regulated genesrdquoBMC Bioinformatics vol 9 article 495 2008
[41] C F Singer G Hudelist W Lamm R Mueller K Czerwenkaand E Kubista ldquoExpression of tyrosine kinases in humanmalignancies as potential targets for kinase-specific inhibitorsrdquoEndocrine-Related Cancer vol 11 no 4 pp 861ndash869 2004
[42] S C P Renn N Aubin-Horth and H A Hofmann ldquoBio-logically meaningful expression profiling across species usingheterologous hybridization to a cDNA microarrayrdquo BMCGenomics vol 5 article 42 2004
[43] C Bar-Or M Bar-Eyal T Z Gal Y Kapulnik H Czosnekand H Koltai ldquoDerivation of species-specific hybridization-like knowledge out of cross-species hybridization resultsrdquo BMCGenomics vol 7 article 110 2006
[44] J Adjaye R Herwig D Herrmann et al ldquoCross-specieshybridisation of human and bovine orthologous genes on highdensity cDNA microarraysrdquo BMC Genomics vol 5 article 832004
[45] M D Kane T A Jatkoe C R Stumpf J Lu J D Thomas andS J Madore ldquoAssessment of the sensitivity and specificity ofoligonucleotide (50mer) microarraysrdquo Nucleic Acids Researchvol 28 no 22 pp 4552ndash4557 2000
[46] K A Frazer L Elnitski D M Church I Dubchak and RC Hardison ldquoCross-species sequence comparisons a review ofmethods and available resourcesrdquo Genome Research vol 13 no1 pp 1ndash12 2003
Submit your manuscripts athttpwwwhindawicom
Hindawi Publishing Corporationhttpwwwhindawicom Volume 2014
Anatomy Research International
PeptidesInternational Journal of
Hindawi Publishing Corporationhttpwwwhindawicom Volume 2014
Hindawi Publishing Corporation httpwwwhindawicom
International Journal of
Volume 2014
Zoology
Hindawi Publishing Corporationhttpwwwhindawicom Volume 2014
Molecular Biology International
GenomicsInternational Journal of
Hindawi Publishing Corporationhttpwwwhindawicom Volume 2014
The Scientific World JournalHindawi Publishing Corporation httpwwwhindawicom Volume 2014
Hindawi Publishing Corporationhttpwwwhindawicom Volume 2014
BioinformaticsAdvances in
Marine BiologyJournal of
Hindawi Publishing Corporationhttpwwwhindawicom Volume 2014
Hindawi Publishing Corporationhttpwwwhindawicom Volume 2014
Signal TransductionJournal of
Hindawi Publishing Corporationhttpwwwhindawicom Volume 2014
BioMed Research International
Evolutionary BiologyInternational Journal of
Hindawi Publishing Corporationhttpwwwhindawicom Volume 2014
Hindawi Publishing Corporationhttpwwwhindawicom Volume 2014
Biochemistry Research International
ArchaeaHindawi Publishing Corporationhttpwwwhindawicom Volume 2014
Hindawi Publishing Corporationhttpwwwhindawicom Volume 2014
Genetics Research International
Hindawi Publishing Corporationhttpwwwhindawicom Volume 2014
Advances in
Virolog y
Hindawi Publishing Corporationhttpwwwhindawicom
Nucleic AcidsJournal of
Volume 2014
Stem CellsInternational
Hindawi Publishing Corporationhttpwwwhindawicom Volume 2014
Hindawi Publishing Corporationhttpwwwhindawicom Volume 2014
Enzyme Research
Hindawi Publishing Corporationhttpwwwhindawicom Volume 2014
International Journal of
Microbiology
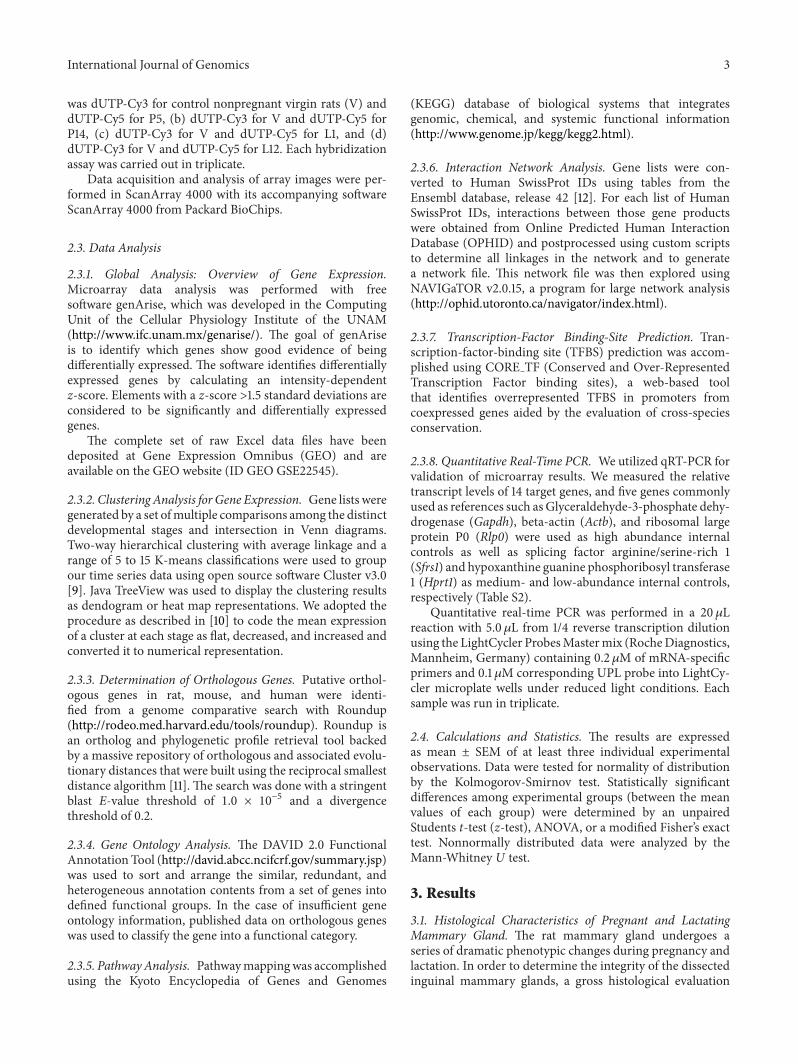
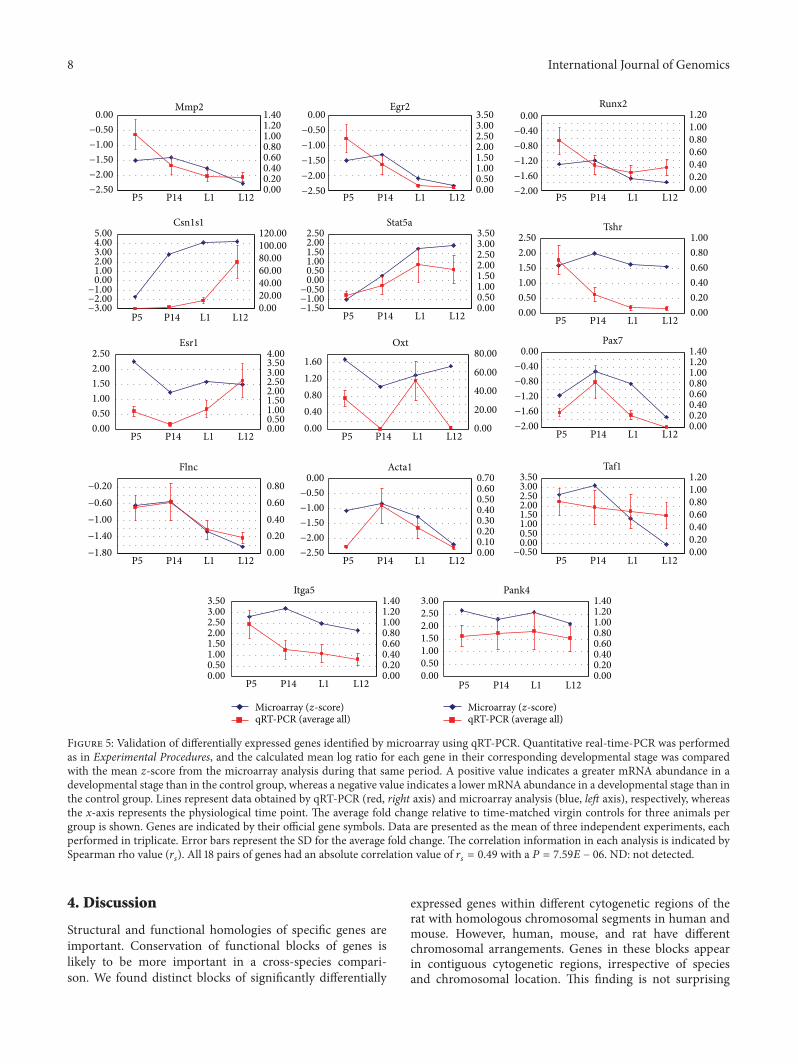