research article muscle-based pharmacokinetic modeling of...
TRANSCRIPT

Research ArticleMuscle-Based Pharmacokinetic Modeling of Marrow Perfusionfor Osteoporotic Bone in Females
Heather Ting Ma,1 James F. Griffth,2 and Ping-Chung Leung3
1 Department of Electronic and Information Engineering, Harbin Institute of Technology Shenzhen Graduate School,Room 205C, C Building, HIT Campus, Shenzhen University Town, Xili, Nanshan District, Shenzhen 518055, China
2Department of Imaging and Interventional Radiology, Prince of Wales Hospital,The Chinese University of Hong Kong, Shatin, Hong Kong
3 Jockey Club Centre for Osteoporosis Care and Control, Public Health School, Prince of Wales Hospital,The Chinese University of Hong Kong, Shatin, Hong Kong
Correspondence should be addressed to Heather Ting Ma; [email protected]
Received 27 February 2014; Revised 29 April 2014; Accepted 5 May 2014; Published 9 June 2014
Academic Editor: Xiaoling Hu
Copyright © 2014 Heather Ting Ma et al. This is an open access article distributed under the Creative Commons AttributionLicense, which permits unrestricted use, distribution, and reproduction in any medium, provided the original work is properlycited.
The pharmacokinetic model has been widely used in tissue perfusion analysis, such as bone marrow perfusion. In the modelingprocess, the arterial input function is important to guarantee the reliability of the fitting result. However, the arterial input functionis variable and hard to control, which makes it difficult to compare results across different studies. The purpose of this study was toestablish a muscle-based pharmacokinetic model for bone marrow perfusion without using arterial input function. Erector spinaemuscle around the vertebral body was selected as the reference region. The study was carried out in elderly females with differentbone mineral densities (normal, osteopenia, and osteoporosis). Quantitative parameters were extracted from the pharmacokineticmodel. ParameterK trans,BM (contrast agent extravasation rate constants for bloodperfusion of the bonemarrow) showed a significantreduction in subjects with lower bone mineral density, which is consistent with previous studies. However, muscle perfusionparameters remained unchanged among different groups. The results indicated that the muscle-based model was stable for bonemarrow perfusion modeling. Additionally, nonsignificant change in muscle parameters indicated that the diminished perfusion isonly a local rather than a systematic change in the bone marrow for osteoporosis.
1. Introduction
Osteoporosis is a commonmetabolic bone disorder in elderlyand its consequence has become one of the most increasinghealth concerns [1, 2]. When bone mineral content lossand structural deterioration proceed until bone strengthbecomes sufficiently poor, the cancellous bone increasessusceptibility to fracture. As a result, the osteoporotic statehas been reached. Studies in recent decades showed a linkbetween peripheral vascular disease and osteoporosis interms of clinics, epidemiology, and histology [3–5]. Suchassociation indicated a varied blood supply mechanism inthe osteoporotic bone. Technically, the microcirculation can
be reflected by the dynamic contrast enhanced (DCE) MRI,which provides a direct measurement of tissue perfusion in aliving system [6, 7]. Bonemarrow perfusion is a physiologicalprocess, which can be affected by multiple factors, such astissue blood flow, capillary capacitance and permeability,interstitial diffusion, interstitial space volume, and venousreturn [8, 9].
Bone perfusion by DCE-MRI can be assessed by semi-quantitativemethod [10–14] andpharmacokineticmodel [15–18].The formermethod provides a directmeasure of the boneperfusion with semiquantitative parameters derived from theperfusion curves. In comparison, the latter approach has amore complex process, including modeling and curve fitting,
Hindawi Publishing CorporationBioMed Research InternationalVolume 2014, Article ID 620925, 7 pageshttp://dx.doi.org/10.1155/2014/620925
2 BioMed Research International
but the derived model parameters directly related to inherentphysiology. Most pharmacokinetic models include the arte-rial input function (AIF) [19], such as Tofts model [9]. Theyadopt the AIF as the input of the tissue perfusion so that thevariation in the AIF will change the pharmacokinetics in thetissue. Therefore, the results from such studies depend muchon the accuracy of the AIF modeling and the experimentprotocol. Brixmodel [16] is a pharmacokineticmodel withoutusing AIF and has been introduced in the bone perfusionstudy [20]. However, it assumes that the AIF has a fixedpattern, which may not reflect the true physiological process.As a consequence, it is difficult to compare the perfusionfunction across different studies.
In order to have a more robust analysis, we introduceda new pharmacokinetic model for analyzing bone marrowperfusion, which employed a well-characterized referenceregion instead of AIF. The erector spinae muscle around thevertebral body was selected as the reference region becauseits big muscle bulk is easy to be recognized in the images andwould be able to derive the DCE-MRI signal with a goodsignal-to-noise ratio (SNR). The perfusion function of themuscle was quantified by a proposedmodel to obtain analyticresults. The purpose of this study is to characterize bonemarrow perfusion properties in subjects with different bonemineral density (BMD) by a muscle-based pharmacokineticmodel.
2. Methods
2.1. Subjects. In order to avoid gender influence, only femalesubjects were included in current study. The investigationinvolved a reassessment of DCE-MRI raw data obtained inone previous study [11]. Subjects were excluded if they had (a)clinical or imaging evidence of renal osteodystrophy or othermetabolic bone diseases other than osteoporosis or a knownmalignancy, (b) a history of lumbar spinal surgery or irradia-tion, or (c) MR imaging evidence of large intravertebral diskherniation, hemangioma, or moderate-to-severe vertebralfracture of L3. Finally, 76 subjects (age 72.5 ± 3.4 years) intotal were involved in this retrospective study. The study wasapproved by the Ethics Committee, Chinese University ofHong Kong, with all participating subjects providing writtenconsent.
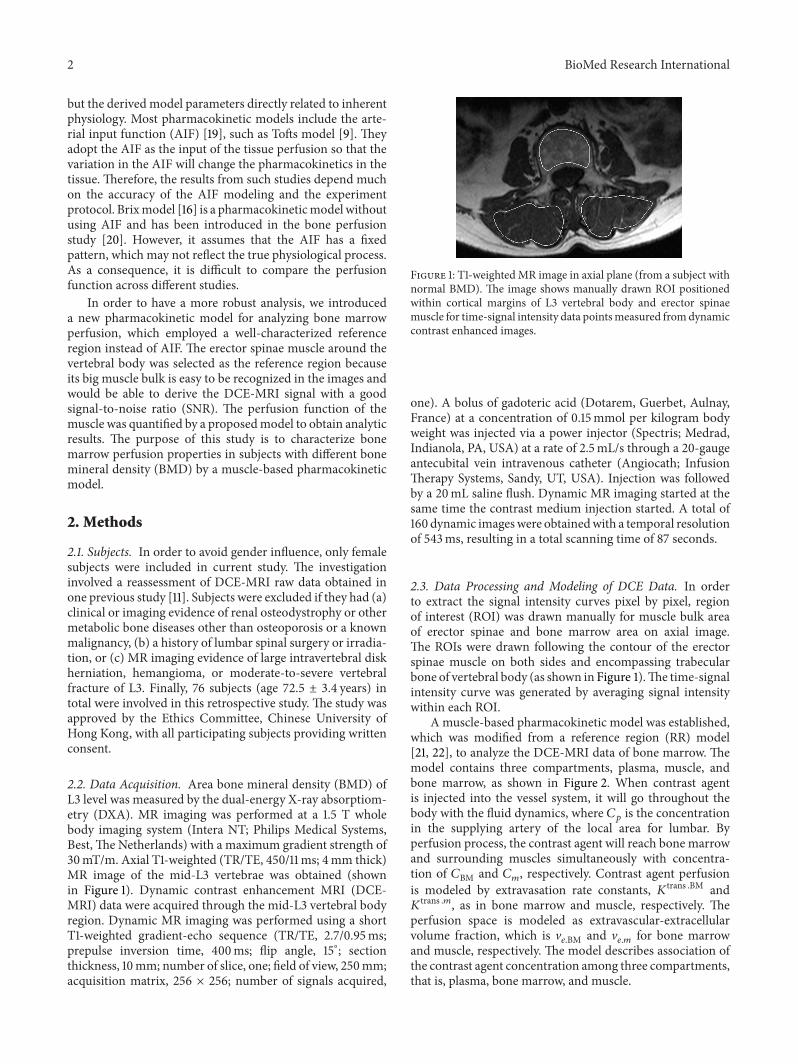
2.2. Data Acquisition. Area bone mineral density (BMD) ofL3 level was measured by the dual-energy X-ray absorptiom-etry (DXA). MR imaging was performed at a 1.5 T wholebody imaging system (Intera NT; Philips Medical Systems,Best,The Netherlands) with a maximum gradient strength of30mT/m. Axial T1-weighted (TR/TE, 450/11ms; 4mm thick)MR image of the mid-L3 vertebrae was obtained (shownin Figure 1). Dynamic contrast enhancement MRI (DCE-MRI) data were acquired through the mid-L3 vertebral bodyregion. Dynamic MR imaging was performed using a shortT1-weighted gradient-echo sequence (TR/TE, 2.7/0.95ms;prepulse inversion time, 400ms; flip angle, 15∘; sectionthickness, 10mm; number of slice, one; field of view, 250mm;acquisition matrix, 256 × 256; number of signals acquired,
Figure 1: T1-weightedMR image in axial plane (from a subject withnormal BMD). The image shows manually drawn ROI positionedwithin cortical margins of L3 vertebral body and erector spinaemuscle for time-signal intensity data pointsmeasured fromdynamiccontrast enhanced images.
one). A bolus of gadoteric acid (Dotarem, Guerbet, Aulnay,France) at a concentration of 0.15mmol per kilogram bodyweight was injected via a power injector (Spectris; Medrad,Indianola, PA, USA) at a rate of 2.5mL/s through a 20-gaugeantecubital vein intravenous catheter (Angiocath; InfusionTherapy Systems, Sandy, UT, USA). Injection was followedby a 20mL saline flush. Dynamic MR imaging started at thesame time the contrast medium injection started. A total of160 dynamic imageswere obtainedwith a temporal resolutionof 543ms, resulting in a total scanning time of 87 seconds.
2.3. Data Processing and Modeling of DCE Data. In orderto extract the signal intensity curves pixel by pixel, regionof interest (ROI) was drawn manually for muscle bulk areaof erector spinae and bone marrow area on axial image.The ROIs were drawn following the contour of the erectorspinae muscle on both sides and encompassing trabecularbone of vertebral body (as shown in Figure 1).The time-signalintensity curve was generated by averaging signal intensitywithin each ROI.
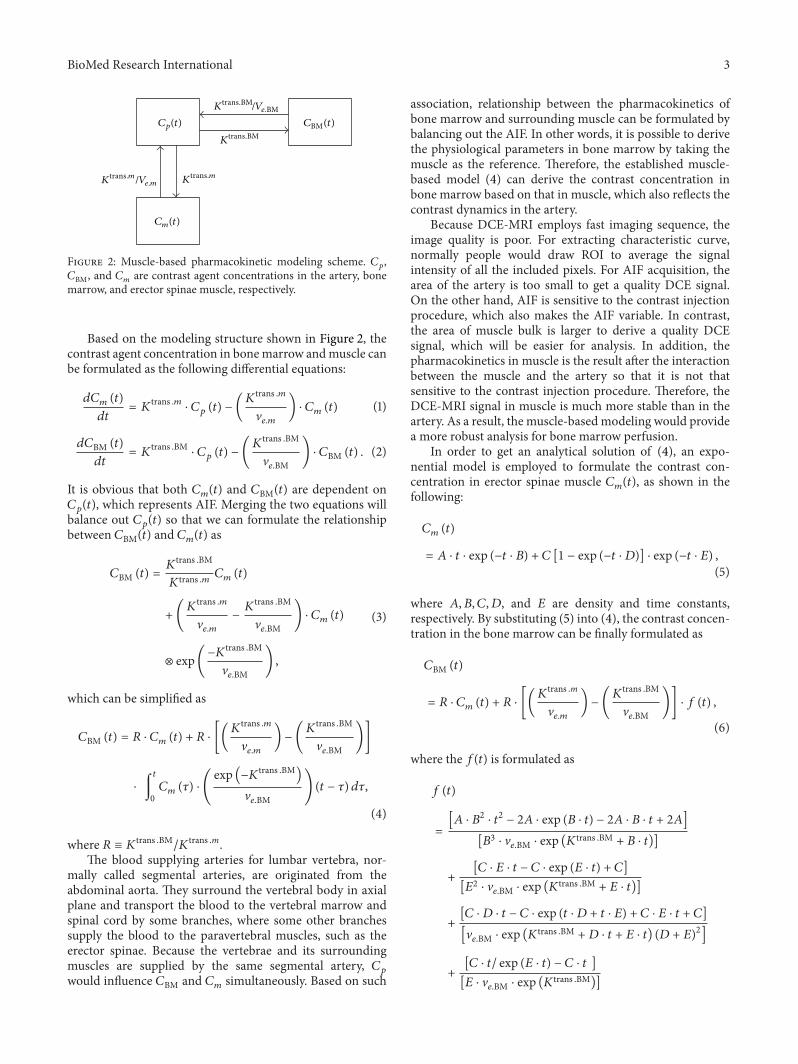
A muscle-based pharmacokinetic model was established,which was modified from a reference region (RR) model[21, 22], to analyze the DCE-MRI data of bone marrow. Themodel contains three compartments, plasma, muscle, andbone marrow, as shown in Figure 2. When contrast agentis injected into the vessel system, it will go throughout thebody with the fluid dynamics, where 𝐶
𝑝
is the concentrationin the supplying artery of the local area for lumbar. Byperfusion process, the contrast agent will reach bone marrowand surrounding muscles simultaneously with concentra-tion of 𝐶BM and 𝐶
𝑚
, respectively. Contrast agent perfusionis modeled by extravasation rate constants, 𝐾
trans .BM and𝐾
trans .𝑚, as in bone marrow and muscle, respectively. Theperfusion space is modeled as extravascular-extracellularvolume fraction, which is V
𝑒.BM and V𝑒.𝑚
for bone marrowand muscle, respectively. The model describes association ofthe contrast agent concentration among three compartments,that is, plasma, bone marrow, and muscle.
BioMed Research International 3
Cp(t)
Cm(t)
CBM(t)
Ktrans.BM/Ve.BM
Ktrans.BM
Ktrans.m/Ve.m K
trans.m
Figure 2: Muscle-based pharmacokinetic modeling scheme. 𝐶𝑝
,𝐶BM, and 𝐶
𝑚
are contrast agent concentrations in the artery, bonemarrow, and erector spinae muscle, respectively.
Based on the modeling structure shown in Figure 2, thecontrast agent concentration in bonemarrow andmuscle canbe formulated as the following differential equations:
𝑑𝐶𝑚
(𝑡)
𝑑𝑡= 𝐾
trans .𝑚⋅ 𝐶𝑝
(𝑡) − (𝐾
trans .𝑚
V𝑒.𝑚
) ⋅ 𝐶𝑚
(𝑡) (1)
𝑑𝐶BM (𝑡)
𝑑𝑡= 𝐾
trans .BM⋅ 𝐶𝑝
(𝑡) − (𝐾
trans .BM
V𝑒.BM
) ⋅ 𝐶BM (𝑡) . (2)
It is obvious that both 𝐶𝑚
(𝑡) and 𝐶BM(𝑡) are dependent on𝐶𝑝
(𝑡), which represents AIF. Merging the two equations willbalance out 𝐶
𝑝
(𝑡) so that we can formulate the relationshipbetween 𝐶BM(𝑡) and 𝐶
𝑚
(𝑡) as
𝐶BM (𝑡) =𝐾
trans .BM
𝐾trans .𝑚 𝐶
𝑚
(𝑡)
+ (𝐾
trans .𝑚
V𝑒.𝑚
−𝐾
trans .BM
V𝑒.BM
) ⋅ 𝐶𝑚
(𝑡)
⊗ exp(−𝐾
trans .BM
V𝑒.BM
) ,
(3)
which can be simplified as
𝐶BM (𝑡) = 𝑅 ⋅ 𝐶𝑚
(𝑡) + 𝑅 ⋅ [(𝐾
trans .𝑚
V𝑒.𝑚
) − (𝐾
trans .BM
V𝑒.BM
)]
⋅ ∫
𝑡
0
𝐶𝑚
(𝜏) ⋅ (
exp (−𝐾trans .BM
)
V𝑒.BM
) (𝑡 − 𝜏) 𝑑𝜏,
(4)
where 𝑅 ≡ 𝐾trans .BM
/𝐾trans .m.
The blood supplying arteries for lumbar vertebra, nor-mally called segmental arteries, are originated from theabdominal aorta. They surround the vertebral body in axialplane and transport the blood to the vertebral marrow andspinal cord by some branches, where some other branchessupply the blood to the paravertebral muscles, such as theerector spinae. Because the vertebrae and its surroundingmuscles are supplied by the same segmental artery, 𝐶
𝑝
would influence 𝐶BM and 𝐶𝑚
simultaneously. Based on such
association, relationship between the pharmacokinetics ofbone marrow and surrounding muscle can be formulated bybalancing out the AIF. In other words, it is possible to derivethe physiological parameters in bone marrow by taking themuscle as the reference. Therefore, the established muscle-based model (4) can derive the contrast concentration inbone marrow based on that in muscle, which also reflects thecontrast dynamics in the artery.
Because DCE-MRI employs fast imaging sequence, theimage quality is poor. For extracting characteristic curve,normally people would draw ROI to average the signalintensity of all the included pixels. For AIF acquisition, thearea of the artery is too small to get a quality DCE signal.On the other hand, AIF is sensitive to the contrast injectionprocedure, which also makes the AIF variable. In contrast,the area of muscle bulk is larger to derive a quality DCEsignal, which will be easier for analysis. In addition, thepharmacokinetics in muscle is the result after the interactionbetween the muscle and the artery so that it is not thatsensitive to the contrast injection procedure. Therefore, theDCE-MRI signal in muscle is much more stable than in theartery. As a result, the muscle-based modeling would providea more robust analysis for bone marrow perfusion.
In order to get an analytical solution of (4), an expo-nential model is employed to formulate the contrast con-centration in erector spinae muscle 𝐶
𝑚
(𝑡), as shown in thefollowing:
𝐶𝑚
(𝑡)
= 𝐴 ⋅ 𝑡 ⋅ exp (−𝑡 ⋅ 𝐵) + 𝐶 [1 − exp (−𝑡 ⋅ 𝐷)] ⋅ exp (−𝑡 ⋅ 𝐸) ,
(5)
where 𝐴, 𝐵, 𝐶,𝐷, and 𝐸 are density and time constants,respectively. By substituting (5) into (4), the contrast concen-tration in the bone marrow can be finally formulated as
𝐶BM (𝑡)
= 𝑅 ⋅ 𝐶𝑚
(𝑡) + 𝑅 ⋅ [(𝐾
trans .m
V𝑒.𝑚
) − (𝐾
trans .BM
V𝑒.BM
)] ⋅ 𝑓 (𝑡) ,
(6)
where the 𝑓(𝑡) is formulated as
𝑓 (𝑡)
=
[𝐴 ⋅ 𝐵2
⋅ 𝑡2
− 2𝐴 ⋅ exp (𝐵 ⋅ 𝑡) − 2𝐴 ⋅ 𝐵 ⋅ 𝑡 + 2𝐴]
[𝐵3
⋅ V𝑒.BM ⋅ exp (𝐾
trans .BM+ 𝐵 ⋅ 𝑡)]
+[𝐶 ⋅ 𝐸 ⋅ 𝑡 − 𝐶 ⋅ exp (𝐸 ⋅ 𝑡) + 𝐶]
[𝐸2
⋅ V𝑒.BM ⋅ exp (𝐾
trans .BM+ 𝐸 ⋅ 𝑡)]
+[𝐶 ⋅ 𝐷 ⋅ 𝑡 − 𝐶 ⋅ exp (𝑡 ⋅ 𝐷 + 𝑡 ⋅ 𝐸) + 𝐶 ⋅ 𝐸 ⋅ 𝑡 + 𝐶]
[V𝑒.BM ⋅ exp (𝐾
trans .BM+ 𝐷 ⋅ 𝑡 + 𝐸 ⋅ 𝑡) (𝐷 + 𝐸)
2
]
+[𝐶 ⋅ 𝑡/ exp (𝐸 ⋅ 𝑡) − 𝐶 ⋅ 𝑡 ]
[𝐸 ⋅ V𝑒.BM ⋅ exp (𝐾
trans .BM)]

4 BioMed Research International
+[𝐶 ⋅ 𝑡/ exp (𝑡 ⋅ 𝐷 + 𝑡 ⋅ 𝐸) − 𝐶 ⋅ 𝑡]
[V𝑒.BM ⋅ exp (𝐾
trans .BM) (𝐷 + 𝐸)]
−
[𝐴 ⋅ 𝐵 ⋅ 𝑡2
− 𝐴 ⋅ 𝑡 ⋅ exp (𝐵 ⋅ 𝑡) + 𝐴 ⋅ 𝑡]
[𝐵2
⋅ V𝑒.BM ⋅ exp (𝐾
trans .BM+ 𝐵 ⋅ 𝑡)]
.
(7)
For each data set, the coefficients in the muscle model (5)were first derived by fitting the DCE-MRI signal frommuscleROI with (5). Then, the fixed coefficients were substitutedinto (6) to derive the pharmacokinetic parameters,𝐾trans ⋅BM,𝐾
trans .𝑚, V𝑒.BM, and V
𝑒.𝑚
, by fitting the DCE-MRI signal ofbone marrow. The curve fitting was performed on the DCE-MRI signal with the time course from the starting point to theend of the signal. Figure 3 shows examples of the curve fittingfor the DCE-MRI signals from muscle and bone marrow,respectively. The curve fitting was conducted by using theleast square method. In total, 304 parameters of 76 subjectswere analyzed. The subjects were classified into three groupsaccording to the T-score derived from the BMD and WorldHealth Organization criteria.
2.4. Statistical Analysis . The investigated subjects were clas-sified into three groups (normal, osteopenia, and osteo-porosis) according to their BMD. The statistical descriptionsof the model parameters were derived by curve fitting foreach subject. Then, the data were compared across thethree BMD groups. Analysis of variance method (ANOVA)was employed to evaluate differences in parameters amonggroups. Statistical analysis was performed using statisticalsoftware (SPSS 13.0). A 𝑃 value of less than 0.05 wasconsidered statistically significant.
3. Results
Based on the pharmacokinetic model, the perfusion processcan be quantitatively analyzed. Table 1 shows the comparisonresults by ANOVA analysis. From Table 1, it can be observedthat𝐾trans ⋅BM reduces gradually and significantly (𝑃 = 0.009)in osteopenia and osteoporosis groups compared to the groupwith normal BMD. For V
𝑒⋅BM, the gradual reduction withthe decreasing BMD can be observed but the change doesnot reach the significant level (𝑃 = 0.637). However, forthe muscle pharmacokinetic parameters, 𝐾
trans ⋅𝑚 and V𝑒⋅𝑚
have no significant difference among three groups and nochanging trend among the groups.
It indicates that the extravasation rate is significantlyreduced during the bone loss process. In other words, thelower the BMD is, the slower the exchange rate in thefluid perfusion from the capillary to the bone marrow is.Although the extravascular-extracellular volume fraction ofbone marrow is also decreased in the subjects with lowerBMD, it is statistically nonsignificant. While it is interesting
to find out that neither extravasation rate nor extravascular-extracellular volume fraction has significant change in erectorspinaemuscle among the groups with different BMD, further,there is no changing trend of the muscle pharmacokineticparameters with the reduction of the BMD. It may imply that,with the bone loss process, the surroundingmuscle still keepsa normal perfusion function.
4. Discussions
With the development ofmedical imaging, perfusion in tissuecan be assessed byDCE-MRI, which, in recent years, has beenused to study bone perfusion in a variety of physiological anddisease conditions [13, 17, 23–26]. Further, pharmacokineticmodels have been employed to analyze bone perfusionfunction in patients with multiple myeloma, bone edema,and Paget’s disease of bone [17, 18, 23]. Bone is composed oftrabecular and cortical bone. All of the trabecular bone andthe inner two-thirds of the cortical bone receive their bloodsupply from the marrow cavity [27]. Taking advantage ofDCE-MRI, some studies have shown how perfusion param-eters are reduced in osteoporotic bone [10–12]. After a bolusinjection, tissue concentration of gadolinium is determinedby local blood flow, capillary capacitance, vessel permeability,interstitial space, and interstitial diffusion [8]. This is thefirst study to investigate bone perfusion of osteoporosis by apharmacokinetic model without directly using AIF.
Most previous work employed Tofts model to assess thebone perfusion [14, 17, 18], of which the analysis of the boneperfusion was much dependent on AIF. It is good to involvethe contrast dynamics in the artery when analyzing theperfusion in the tissue. However, because of the small area ofvessel in the image and the pulsation of the blood, AIF is quitevariable even under the same experiment protocol [21]. Somework used Brix model to assess the bone perfusion [19, 20],where AIF was not included. Such model assumes the MRsignal intensity is linearly proportional to the concentrationof contrast agent. This assumption may not hold true fordifferent experiment conditions. Therefore, establishing apharmacokinetic modeling scheme, which is reliable andstable enough but still reflects the contrast dynamics in thevessel, will provide a more precise assessment of perfusionfunction. The proposed muscle-based model achieved suchpurpose for investigating bone perfusion.
Firstly, the parameter V𝑒⋅BM was observed to be reduced
with a decreased BMD, which indicated a reduced capacityfor blood perfusion in osteoporotic bone. Increased marrowfat in osteoporotic bone may be one reason for the decreasedextravascular-extracellular volume fraction in bone marrow.A previous work reported an increasedmarrow fat content inthe osteoporosis patients by usingMR spectroscopy [28]. Ourprevious studies for osteoporosis also supported this finding[10, 20]. In osteoporotic bone, the increasedmarrow fatwouldreduce interstitial space for perfusion, which could result in adiminished extravascular-extracellular volume fraction [10–12, 28, 29]. However, the change in V
𝑒⋅BM among the threegroups was nonsignificant, indicating that the marrow fat

BioMed Research International 5
0 0.2 0.4 0.6 0.8 1 1.2 1.4−0.1
0
0.1
0.2
0.3
0.4
0.5
0.6
Time (min)
Erector spinae muscle
OriginalCurve fitStart point
(a)
OriginalCurve fitStart point
0 0.2 0.4 0.6 0.8 1 1.2 1.4−0.05
0
0.05
0.1
0.15
0.2
0.25
0.3
0.35
0.4
0.45
Time (min)
Bone marrow
(b)
Figure 3: Data processing on DCE data from a subject with normal BMD. (a) Erector spinae muscle curve fitting by muscle-based model toderive characteristic parameters; (b) bone marrow curve fitting by (1).
Table 1: Comparison among groups.
Parameter Group (𝑁) Mean SD 𝑃 value
𝐾trans .BM (min−1)
Normal (𝑛 = 11) 0.369 0.1290.009Osteopenia (𝑛 = 26) 0.334 0.110
Osteoporosis (𝑛 = 39) 0.255 0.135
𝐾trans .𝑚 (min−1)
Normal (𝑛 = 11) 0.303 0.1010.623Osteopenia (𝑛 = 26) 0.310 0.116
Osteoporosis (𝑛 = 39) 0.280 0.136
V𝑒.BM
Normal (𝑛 = 11) 0.191 0.2450.637Osteopenia (𝑛 = 26) 0.146 0.214
Osteoporosis (𝑛 = 39) 0.125 0.184
V𝑒.𝑚
Normal (𝑛 = 11) 0.186 0.2860.662Osteopenia (𝑛 = 26) 0.114 0.177
Osteoporosis (𝑛 = 39) 0.159 0.276
content change may not be the main contribution to theperfusion function degeneration in osteoporosis.
Secondly, 𝐾trans ⋅BM was also found decreased in subjectswith lower BMD, implying a degenerated blood supplyfunction. Such degeneration could also diminish the nutri-tion exchange between the bone tissue and the artery. Itappears that the exchange rate across the vessel wall isreduced as BMD decreases. Multiple factors can affect thisexchange rate, such as capillary endothelial permeability andinterstitial or intraosseous pressure. For the latter factor,higher interstitial pressures will limit diffusion of moleculesbetween the capillary bed and the interstitial space. It hasbeen revealed by a previous study [30] that increasedmarrowfat increases intraosseous pressure. The increased marrowfat content would limit exchange between the intravascular
and interstitial spaces resulting in a weakened perfusionrate. Reduction of arterial capillary density could be anotherreason for the decreased 𝐾
trans ⋅BM in the bone with lowerBMD. Patients with proximal femoral osteoporosis have beenreported with reduced density of arterial capillaries andmorefrequent arteriosclerotic vascular lesions [31]. Another studyon multiple myeloma infiltration of vertebral bodies foundthat the reduction of the blood volume during the perfusionmirrored bone marrow vessel density assessed histologically[23].
Thirdly, it is interesting that muscle perfusion indices didnot change with BMD (𝑃 > 0.6). With respect to vascu-lar inflow, previous studies have shown that the perfusionanomalies occurring in osteoporosis most likely originatewithin bone but not within adjacent muscle [11, 12]. In other

6 BioMed Research International
words, decreased perfusion function in osteoporosis is a localdegeneration of bone rather than a systematic circulatorydisturbance.
This retrospective study had one main limitation. Thedata acquisition duration was relatively short at 87 seconds,which may limit the assessment of the full wash-out phaseand thus the influence the parameter derivation. The derivedparametersmay be deviated from the true value.However, thetrend for the parameter change among different groups stillreflects the real situation and is supported by other studies.
In conclusion, a muscle-based pharmacokinetic modelwas proposed for bone marrow perfusion without usingAIF. Such model avoided the direct association with thevariable contrast agent dynamics in the artery and couldprovide a more reliable analysis. The perfusion indices, V
𝑒.BMand 𝐾
trans .BM, were both decreased in osteoporotic bone.Decreased interstitial space and reduced capillary densityare possible reasons for the degenerated perfusion function.Further, these factors should be considered in themechanisminvestigation of osteoporosis.
Conflict of Interests
The authors declare that there is no conflict of interestsregarding the publication of this paper.
Acknowledgments
This study is supported by the Research Grants Councilof the Hong Kong Special Administrative Region, China(Project no. 465111), the National Natural Science Foun-dation of China (81000647), the Basic Research Foun-dation (Outstanding Young Investigator Track) of Shen-zhen (JC201005260124A), and the High-End Talent OverseaReturnees Foundation of Shenzhen (KQC201109020052A).
References
[1] Y. Z. Bagger, L. B. Tanko, P. Alexandersen, H. B.Hansen, G.Qin,and C. Christiansen, “The long-term predictive value of bonemineral density measurements for fracture risk is independentof the site of measurement and the age at diagnosis: resultsfrom the Prospective Epidemiological Risk Factors study,”Osteoporosis International, vol. 17, no. 3, pp. 471–477, 2006.
[2] E. Dennison, M. A. Mohamed, and C. Cooper, “Epidemiologyof osteoporosis,” Rheumatic Disease Clinics of North America,vol. 32, no. 4, pp. 617–629, 2006.
[3] S. Y. S. Wong, T. Kwok, J. Woo et al., “Bone mineral density andthe risk of peripheral arterial disease inmen andwomen: resultsfrom Mr. and Ms Os, Hong Kong,” Osteoporosis International,vol. 16, no. 12, pp. 1933–1938, 2005.
[4] P. Pennisi, S. S. Signorelli, S. Riccobene et al., “Low bone densityand abnormal bone turnover in patients with atherosclerosis ofperipheral vessels,” Osteoporosis International, vol. 15, no. 5, pp.389–395, 2004.
[5] M. T. Vogt, J. A. Cauley, L. H. Kuller, and M. C. Nevitt, “Bonemineral density and blood flow to the lower extremities: thestudy of osteoporotic fractures,” Journal of Bone and MineralResearch, vol. 12, no. 2, pp. 283–289, 1997.
[6] I. C. Benjaminsen, B. A. Graff, K. G. Brurberg, and E. K. Rof-stad, “Assessment of tumor blood perfusion by high-resolutiondynamic contrast-enhance MRI: a preclinical study of humanmelanoma xenografts,”Magnetic Resonance inMedicine, vol. 52,no. 2, pp. 269–276, 2004.
[7] J. P. B. O'Connor, A. Jackson, G. J. M. Parker, and G. C.Jayson, “DCE-MRI biomarkers in the clinical evaluation ofantiangiogenic and vascular disrupting agents,” British Journalof Cancer, vol. 96, no. 2, pp. 189–195, 2007.
[8] R. Luypaert, S. Boujraf, S. Sourbron, andM.Osteaux, “Diffusionand perfusion MRI: basic physics,” European Journal of Radiol-ogy, vol. 38, no. 1, pp. 19–27, 2001.
[9] P. S. Tofts, “Modeling tracer kinetics in dynamic Gd-DTPAMRimaging,” Journal of Magnetic Resonance Imaging, vol. 7, no. 1,pp. 91–101, 1997.
[10] J. F.Griffith,D.K.W.Yeung,G. E.Antonio et al., “Vertebral bonemineral density, marrow perfusion, and fat content in healthymen and men with osteoporosis: dynamic contrast-enhancedMR imaging and MR spectroscopy,” Radiology, vol. 236, no. 3,pp. 945–951, 2005.
[11] J. F. Griffith, D. K. W. Yeung, G. E. Antonio et al., “Vertebralmarrow fat content and diffusion and perfusion indexes inwomen with varying bone density: MR evaluation,” Radiology,vol. 241, no. 3, pp. 831–838, 2006.
[12] J. F. Griffith, D. K. W. Yeung, P. H. Tsang et al., “Compromisedbone marrow perfusion in osteoporosis,” Journal of Bone andMineral Research, vol. 23, no. 7, pp. 1068–1075, 2008.
[13] N. M. Menezes, E. A. Olear, X. Li et al., “Gadolinium-enhancedMR images of the growing piglet skeleton: ionic versus nonioniccontrast agent,” Radiology, vol. 239, no. 2, pp. 406–414, 2006.
[14] V. Savvopoulou, T. G. Maris, L. Vlahos, and L. A. Moulopoulos,“Differences in perfusion parameters between upper and lowerlumbar vertebral segments with dynamic contrast-enhancedMRI (DCE MRI),” European Radiology, vol. 18, no. 9, pp. 1876–1883, 2008.
[15] G. Brix, W. Semmler, R. Port, L. R. Schad, G. Layer, andW. J. Lorenz, “Pharmacokinetic parameters in CNS Gd-DTPAenhancedMR imaging,” Journal of Computer Assisted Tomogra-phy, vol. 15, no. 4, pp. 621–628, 1991.
[16] U. Hoffmann, G. Brix, M. V. Knopp, T. Hess, and W. J. Lorenz,“Pharmacokinetic mapping of the breast: a new method fordynamicMRmammography,”Magnetic Resonance inMedicine,vol. 33, no. 4, pp. 506–514, 1995.
[17] J. H. Lee, J. P. Dyke, D. Ballon, D. M. Ciombor, G. Tung, andR. K. Aaron, “Assessment of bone perfusion with contrast-enhanced magnetic resonance imaging,” Orthopedic Clinics ofNorth America, vol. 40, no. 2, pp. 249–257, 2009.
[18] M. Libicher, C. Kasperk, M. Daniels, W. Hosch, H.-U. Kauczor,and S. Delorme, “Dynamic contrast-enhanced MRI in Paget'sdisease of bone-correlation of regional microcirculation andbone turnover,” European Radiology, vol. 18, no. 5, pp. 1005–1011,2008.
[19] H. T. Ma, J. F. Griffith, X. Zhao, H. Lv, D. K. Yeung, and P.C. Leung, “Relationship between marrow perfusion and bonemineral density: a pharmacokinetic study of DCE-MRI,” inProceedings of the Annual International Conference of the IEEEEngineering in Medicine and Biology Society (EMBC ’12), pp.377–379, IEEE, 2012.
[20] H. T. Ma, J. F. Griffith, D. K. Yeung, and P. C. Leung, “Modifiedbrix model analysis of bone perfusion in subjects of varyingbone mineral density,” Journal of Magnetic Resonance Imaging,vol. 31, no. 5, pp. 1169–1175, 2010.
BioMed Research International 7
[21] T. E. Yankeelov, J. J. Luci, M. Lepage et al., “Quantitativepharmacokinetic analysis of DCE-MRI data without an arterialinput function: a reference region model,” Magnetic ResonanceImaging, vol. 23, no. 4, pp. 519–529, 2005.
[22] T. E. Yankeelov, G. O. Cron, C. L. Addison et al., “Comparisonof a reference region model with direct measurement of anAIF in the analysis of DCE-MRI data,” Magnetic Resonance inMedicine, vol. 57, no. 2, pp. 353–361, 2007.
[23] S. Nosas-Garcia, T. Moehler, K. Wasser et al., “Dynamiccontrast-enhanced MRI for assessing the disease activity ofmultiple myeloma: a comparative study with histology andclinical markers,” Journal of Magnetic Resonance Imaging, vol.22, no. 1, pp. 154–162, 2005.
[24] T. T.-F. Shih, C.-J. Chang, C.-Y. Hsu, S.-Y. Wei, K.-C. Su, andH.-W. Chung, “Correlation of bone marrow lipid water contentwith bone mineral density on the lumbar spine,” Spine, vol. 29,no. 24, pp. 2844–2850, 2004.
[25] T. T.-F. Shih, H.-A. Hou, C.-Y. Liu et al., “Bone marrowangiogenesismagnetic resonance imaging in patientswith acutemyeloid leukemia: peak enhancement ratio is an independentpredictor for overall survival,” Blood, vol. 113, no. 14, pp. 3161–3167, 2009.
[26] H. Sheng, G. Zhang, Y.-X. Wang et al., “Functional perfusionMRI predicts later occurrence of steroid-associated osteonecro-sis: an experimental study in rabbits,” Journal of OrthopaedicResearch, vol. 27, no. 6, pp. 742–747, 2009.
[27] M. L. Knothe Tate, P. Niederer, and U. Knothe, “In vivo tracertransport through the lacunocanalicular system of rat bone inan environment devoid of mechanical loading,” Bone, vol. 22,no. 2, pp. 107–117, 1998.
[28] D. K.W. Yeung, J. F. Griffith, G. E. Antonio, F. K. H. Lee, J. Woo,and P. C. Leung, “Osteoporosis is associated with increasedmarrow fat content and decreased marrow fat unsaturation: aproton MR spectroscopy study,” Journal of Magnetic ResonanceImaging, vol. 22, no. 2, pp. 279–285, 2005.
[29] T. T.-F. Shih, H.-C. Liu, C.-J. Chang, S.-Y. Wei, L.-C. Shen, andP.-C. Yang, “Correlation of MR lumbar spine bone marrow per-fusion with bonemineral density in female subjects,” Radiology,vol. 233, no. 1, pp. 121–128, 2004.
[30] K. Miyanishi, T. Yamamoto, T. Irisa et al., “Bone marrow fatcell enlargement and a rise in intraosseous pressure in steroid-treated rabbits with osteonecrosis,” Bone, vol. 30, no. 1, pp. 185–190, 2002.
[31] M. Laroche, I. Ludot, M. Thiechart et al., “Study of theintraosseous vessels of the femoral head in patients withfractures of the femoral neck or osteoarthritis of the hip,”Osteoporosis International, vol. 5, no. 4, pp. 213–217, 1995.

Submit your manuscripts athttp://www.hindawi.com
Stem CellsInternational
Hindawi Publishing Corporationhttp://www.hindawi.com Volume 2014
Hindawi Publishing Corporationhttp://www.hindawi.com Volume 2014
MEDIATORSINFLAMMATION
of
Hindawi Publishing Corporationhttp://www.hindawi.com Volume 2014
Behavioural Neurology
EndocrinologyInternational Journal of
Hindawi Publishing Corporationhttp://www.hindawi.com Volume 2014
Hindawi Publishing Corporationhttp://www.hindawi.com Volume 2014
Disease Markers
Hindawi Publishing Corporationhttp://www.hindawi.com Volume 2014
BioMed Research International
OncologyJournal of
Hindawi Publishing Corporationhttp://www.hindawi.com Volume 2014
Hindawi Publishing Corporationhttp://www.hindawi.com Volume 2014
Oxidative Medicine and Cellular Longevity
Hindawi Publishing Corporationhttp://www.hindawi.com Volume 2014
PPAR Research
The Scientific World JournalHindawi Publishing Corporation http://www.hindawi.com Volume 2014
Immunology ResearchHindawi Publishing Corporationhttp://www.hindawi.com Volume 2014
Journal of
ObesityJournal of
Hindawi Publishing Corporationhttp://www.hindawi.com Volume 2014
Hindawi Publishing Corporationhttp://www.hindawi.com Volume 2014
Computational and Mathematical Methods in Medicine
OphthalmologyJournal of
Hindawi Publishing Corporationhttp://www.hindawi.com Volume 2014
Diabetes ResearchJournal of
Hindawi Publishing Corporationhttp://www.hindawi.com Volume 2014
Hindawi Publishing Corporationhttp://www.hindawi.com Volume 2014
Research and TreatmentAIDS
Hindawi Publishing Corporationhttp://www.hindawi.com Volume 2014
Gastroenterology Research and Practice
Hindawi Publishing Corporationhttp://www.hindawi.com Volume 2014
Parkinson’s Disease
Evidence-Based Complementary and Alternative Medicine
Volume 2014Hindawi Publishing Corporationhttp://www.hindawi.com