research article nan wang*, weidong wen and haitao cui a
TRANSCRIPT
Research Article
Nan Wang*, Weidong Wen and Haitao Cui
A continuum damage model for fatigue lifeprediction of 2.5D woven composites
https://doi.org/10.1515/secm-2021-0063received September 05, 2021; accepted November 11, 2021
Abstract: A new model based on continuum damagemechanics is proposed to predict the fatigue life of 2.5Dwoven composites. First, a full-cell model reflecting thereal microstructure of 2.5D woven composites is establishedin ANSYS. Subsequently, three independent damage vari-ables are defined in the framework of the composite micro-mechanics to establish the component constitutive relationsassociated with damage. The strain energy density releaserate and damage evolution equations for the matrix, fiber inyarns, andmatrix in yarns are derived. Finally, the proposedmodel is implemented for fatigue life prediction and damageevolution analysis of 2.5D woven composites at 20 and180°C. The results show that the numerical results are ingood agreement with the relevant experimental results.
Keywords: continuum damage mechanics, 2.5D wovencomposites, composite micromechanics, fatigue life pre-diction, damage evolution analysis
Nomenclature
Aij; Bij; Cij parameters of damage evolution equationsa; b; c parameters of weft contour curveAw; Aj cross-sectional area of weft and warp yarnskj; h parameters of warp contour curve
Lx; Ly; Lz length, width, and thickness of geometricstructure
Mw; Mj arranged density of weft and warp yarnsD ij0, initial damage variables of material
componentsDij damage variables of material componentsNij fatigue life of material componentsNn; Nn+1 fatigue lives in current cycle and next cycleNe total number of full-cell model elementsVe total volume of full-cell model elementsDij n, ; +Dij n, 1 damage variables of last cycle and current
cycleVw; Vj volume fraction of weft and warp yarnssij fT, ; sij mT, flexibility coefficients of yarns and matrixEij; Eij
D
νij fT, ; νmT Poisson’s ratio of yarns and matrixEffT ; EfmT elastic modulus of fibers and matrix in
yarnsEffT
D ; EfmTD damaged elastic modulus of components in
yarnsρj fiber densityθ inclination angle of warp yarnsTe linear density of yarnsε̄ average strain of unit cellσij fT, ; σij mT, average stress of yarns and matrixεij fT, ; εij mT, average strain of yarns and matrixNw; Nj number of weft and warp yarnsT temperatureVf aggregation density of warp yarnVw aggregation density (volume fraction) of
weft yarnη22; η12 correction coefficientsψ Helmholtz free energy densityWD average strain energy densityY strain energy density release rateα; β shear contribution factorsW1w; W2w width and height of weft yarnsW j1 ; W j2 width and height of warp yarns
xΔ kj distance between opposite planes
Yij fT, shear strengths of yarnsXij fT, tension strengths of yarnsXffT; XfmT fiber and matrix strengths of yarns
* Corresponding author: Nan Wang, Department of Strength andVibration Engineering, College of Energy and Power Engineering,Nanjing University of Aeronautics and Astronautics, Nanjing 210016,China; State Key Laboratory of Mechanics and Control of MechanicalStructures, Nanjing 210016, China, e-mail: [email protected] Wen, Haitao Cui: Department of Strength and VibrationEngineering, College of Energy and Power Engineering, NanjingUniversity of Aeronautics and Astronautics, Nanjing 210016, China;State Key Laboratory of Mechanics and Control of MechanicalStructures, Nanjing 210016, China
Science and Engineering of Composite Materials 2021; 28: 653–667
Open Access. © 2021 Nan Wang et al., published by De Gruyter. This work is licensed under the Creative Commons Attribution 4.0International License.

1 Introduction
In general, 2.5D woven composites represent a specialkind of 3D woven composites. Compared with 2D lami-nated composites, 2.5D woven composites exhibit a moreadvanced fabric plane and higher delamination resis-tance; moreover, 2.5D woven composites have a simplerstructural configuration than 3D woven composites [1].Owing to these advantages, 2.5D woven composites arewidely used in the domains of aerospace, transportation,sports equipment, civil engineering, among other fields,and present several promising opportunities [2]. Therefore,it is of significance to study the fatigue behavior of angleinterlock woven composites for engineering applications.
Many researchers have focused on the mechanicalproperties and prediction models of angle interlock wovencomposites [3–9]. Isart et al. [3] adopted three differentmodeling methods, namely, the idealized method, digitalelement method, and analytical method, to numericallyanalyze the global volume fraction and elastic propertiesof 3D woven composites. The results showed that the firstmethod was faster than the other two methods, althoughthe latter two methods were more accurate in terms ofpredicting the elastic properties. Based on the Hashinfailure criteria and MLT damage model, Warren et al. [4]established a three-dimensional progressive damagemodel toanalyze the damage initiation and propagation of 3D wovencomposites. Based on the Puck failure criteria, von Misesfailure criteria, and quadratic stress criterion for the fiber-matrix interface, Lu et al. [5] established a damage modelconsidering the fiber damage, matrix cracks, and interfacialdamage. The model clarified the progressive damage of 2.5Dwoven composites under quasi-static tension on a mesoscale.
Nevertheless, research on models related to the fatiguelife of angle interlock woven composites [10–13] is limited.Stegschuster et al. [10] studied the effect of the z-binderangle of 3D woven composites on the delamination fracturetoughness and fatigue strength. The experiments indicatedthat the fracture toughness and fatigue resistance graduallyincreasedwith increasing z-binder volume fraction. Yu et al.[11] used the time-lapse X-ray computed tomography tech-nique to identify the fatigue damage state of 3D wovencomposites with different fatigue lives. The results showedthat the transverse cracks of weft yarns appeared at theinitial stage of fatigue life, and the number of transversecracks steadily increased with increasing fatigue life. Songet al. [12] combined the full-cell model of 2.5D woven com-posites with the classical progressive damage model whichcan effectively distinguish the different failure modes ofangle interlock woven composites. The fatigue life anddamage propagation process of 2.5D woven composites at
20 and 180°C were successfully predicted. Compared withthe progressive damage model requiring a mass of experi-mental data for full material characterization, the continu-um damage mechanics model widely used to predict thefatigue life of metallic materials [14–16] needs less experi-mental data, and it applies phenomenological methods tostudy the mechanical behavior of fatigue damage. Due tothe diversity of components of angle interlock composites,the continuum damage mechanics model has not beeneffectively applied in the study of fatigue life and damageof 2.5D woven composites.
Therefore, in this study, the microstructure of 2.5Dwoven composites was examined, and a full-cell model forfatigue damage analysis was established. Based on the full-cell finite element model, the micromechanics of compositesand continuum damage mechanics were introduced, and amodel to predict the fatigue life of 2.5D woven composite onthe microscale was established. Finally, the fatigue damageprocess and fatigue life of 2.5Dwoven composites at differenttemperatures were predicted and analyzed.
2 Geometric structure and finiteelement model of 2.5D wovencomposites
2.1 Geometric structure of 2.5D wovencomposites
Layer-to-layer interlock is one of the most typical structuresof 2.5D woven composites. The microstructure of warpyarns, weft yarns, and resin matrix is shown in Figure 1.
According to the early literature, weft cross sectionsare of racetrack, rectangular, and convex lens types[17–19]. Figure 1(a) shows that under the mutual extru-sion of the warp yarn, the cross section of the weft yarnexhibits a bulge in the middle that is sharp at both ends,which conforms to the assumption of a convex lens. Awarp yarn can be divided into an enveloping weft sectionand a linear connection section. Figure 1(b) shows that theweft yarn is basically distributed in a straight orientation,and the cross section of the warp yarn is rectangular.
In addition, the micrograph shows that the outerstructure of 2.5D woven composites is considerably dif-ferent from the inner structure due to the influence of theresin transfer molding (RTM) technology. Therefore, thisarticle adopts the same geometric cross-sectional config-uration as in Guo and Song’s study [9,12], and the specificdimensions are shown in Figure 2.
654 Nan Wang et al.

The x-, y-, and z-axes of the rectangular coordinatesystem in Figure 2 represent the warp, thickness, andweft directions of the geometric structure, respectively.The red curve is the contour curve of the weft yarn, whichis described by a quadratic function:
)( = + +f x ax bx c,2 (1)
where a, b, and c are unknown parameters. The bluecurve is the contour curve of the warp yarn, which isdescribed by a piecewise function:
⎧⎨⎩
( ) ( )
( )
= ≤ < /
= + / ≤ < / −
g x f x x Wg x k x h W x L W
, 0 2,, 2 2 ,
w
j w x w
1
1 1(2)
where kj and h are unknown parameters. Owing to theinfluence of the molding technology, the outer warp yarnis flattened, and it is extruded to the inside due to thewarp restriction. Therefore, the length of the outer warpyarn should be equal to that of the inner warp yarn.
The overall size of the geometric structure in Figure 2is obtained as follows:
⎧⎨⎩
( )= − /
= /
L N ML N M
10 120 ,
x w w
y j j(3)
where Lx and Ly are the length and width of the geometricstructure (mm), respectively. Mw and Mj represent the weftand warp arranged density (tows per cm), respectively. Nw
denotes the number of weft yarns at a given height, and Njdenotes the number of warp pairs in a single layer.
The geometric dimensions of the rectangular cross sectionof the warp can be calculated, using the following equation:
⎧
⎨
⎪⎪⎪
⎩
⎪⎪⎪
=
=
=
A Tρ V
WM
WA
W
1,00010
,
je
j j
jj
jj
j
1
21
(4)
where Aj is the cross-sectional area of the warp yarn(mm2), and Te is the linear density of the yarn (g/km). ρjis the fiber density (g/cm3), and Vj is the aggregationdensity (volume fraction) of the warp yarn. W j1 and W j2represent the width and height of the cross section of thewarp yarn, respectively.
The cross-sectional geometric dimensions of the weftand unknown parameters of ( )f x and ( )g x can be calcu-lated, using the following method:
Figure 2: Geometric structure of 2.5D woven composites.
Figure 1: Sectional view of 2.5D woven composites: orientation of (a) warp yarns and (b) weft yarns.
A continuum damage model for 2.5D woven composites 655

( )=
− +
−
WL N W
N1
2,w
z h j
h2
2 (5)
where Lz is the thickness of the geometric structure (mm),Nh is the number of weft yarns in the thickness direction,and −N 2h reflects the extrusion effect of the RTM tech-nology in the composites. To obtain the cross-sectional width( )W w1 of the weft yarn, the slope kj of the linear connectionsection of the warp yarn, and the unknown parameters (a, b,and c) of ( )f x , five equations must be simultaneously solved.The simultaneous equations are as follows:
⎧
⎨
⎪⎪⎪⎪⎪⎪⎪⎪
⎩
⎪⎪⎪⎪⎪⎪⎪⎪
⎛⎝
⎞⎠
⎛⎝
⎞⎠
( ) ∣ ( )
( )∫
=
= + +
′ = = − = +
=
+ +
/ − −
= = + +
= + +
= /
/
c W
a W b W c
f x k π θ aW b
θW W W θL W W θ
A TρV
ax bx c dx
a W b W cW
2,
02 2
,
tan 22
,
tancos
2 sin,
1,0004
6 22 ,
w
w w
x Ww
j w j
x w j
we
w
W
w w w
2
12
1
21
2 2 2
1 2
0
2
2
13
12
1
w
w
1
1
(6)
where θ is the inclination angle of the warp yarn, Aw is thecross-sectional area of the weft yarn (mm2), and Vw is theaggregation density (volume fraction) of the weft yarn.
2.2 Full-cell finite element model of 2.5Dwoven composites
The full-cell finite element model is the basis of fatiguedamage analysis of 2.5D woven composites, and its ratio-nality directly affects the accuracy of prediction. In thisstudy, the UG software is used to establish the geometricmodel of 2.5D woven composites, and HyperMesh softwareis used for meshing. The periodic boundary conditions ofthe full-cell model are accomplished through the nodaldisplacement constraint equations in ANSYS software.The positions of nodes on the parallel planes of the full-
cell model have a one-to-one correspondence. To ensure thecontinuity of the stress and displacement in the structure,the contact areas of the resin matrix, warp yarns, and weftyarns have the same nodes. The finite element full-cellmodel of the 2.5D woven composites is shown in Figure 3.
Xia et al. [20] proposed an explicit unified form forperiodic boundary conditions and proved that the conti-nuity of deformation and stress can be simultaneouslysatisfied in the unit cell model. The periodic boundarycondition can be expressed as:
( )− = =+ −u u ε x i k x y z¯Δ , , , ,i
jij
kj (7)
where the superscripts j+ and j− represent the positiveand negative areas of the jth opposite units, respectively.ε̄ is the average strain of the unit cell, and xΔ k
j is thedistance between opposite planes.
For the full-cell model used in this article, it is neces-sary to ensure that the macroscopic stress in each principaldirection is the same as the external load in the fatigue lifeprediction. The macroscopic stress in each principal direc-tion is obtained, using the volume average method:
∑=
=
σV
σ V1 ,ije k
N
ijk k1
e
(8)
where Ne is the total number of full-cell model elements,σijk is the stress of the kth element in the ij direction,Vk isthe volume of the kth element, andVe is the total volumeof the full-cell model.
3 Life prediction model of 2.5Dwoven composites
3.1 Component constitutive relationsassociated with damage
Based on the full-cell model in this article, 2.5D wovencomposites can be considered to be composed of the resinmatrix and yarns with a relatively complex orientation.
Figure 3: Finite element model of 2.5D woven composites.
656 Nan Wang et al.

Fiber yarns are generally considered transversely iso-tropic materials, which are composed of matrix andfibers. The constitutive relation of the yarns at T°C canbe expressed as follows:
⎡
⎣
⎢⎢⎢⎢⎢⎢⎢
( )
⎤
⎦
⎥⎥⎥⎥⎥⎥⎥
=
−
×
εs s ss s ss s s
s ss
s
σ
0 0 00 0 00 0 0
0 0 0 2 0 00 0 0 0 00 0 0 0 0
,
ij fT
fT fT fT
fT fT fT
fT fT fT
fT fT
fT
fT
ij fT
,
11, 12, 12,
12, 22, 23,
12, 23, 22,
22, 23,
66,
66,
,
(9)⎧
⎨
⎪⎪⎪⎪⎪⎪
⎩
⎪⎪⎪⎪⎪⎪
=
=
= −
= −
=
sE
sE
sνE
sνE
sG
1 ,
1 ,
,
,
1 ,
fTfT
fTfT
fTfT
fT
fTfT
fT
fTfT
11,11,
22,22,
12.12,
11,
23,23,
22,
66,12,
(10)
where subscripts =i j, 1, 2, 3, and the 1-axis is parallel tothe fiber. The 2- and 3-axes are perpendicular to the fiber.sij fT, is the flexibility coefficient of fiber yarns at T°C. Eij fT, ,Gij fT, , and νij fT, are the elastic moduli, shear moduli, andPoisson’s ratio of the yarns at T°C, respectively. The resinmatrix is an isotropic material, and its constitutive rela-tion at T°C can be expressed as follows:
⎡
⎣
⎢⎢⎢⎢⎢⎢⎢
( )
( )
( )
⎤
⎦
⎥⎥⎥⎥⎥⎥⎥
=
−
−
−
×ε
s s ss s ss s s
s ss s
s s
σ
0 0 00 0 00 0 0
0 0 0 2 0 00 0 0 0 2 00 0 0 0 0 2
,ij mT
mT mT mT
mT mT mT
mT mT mT
mT mT
mT mT
mT mT
ij mT,
11, 12, 12,
12, 11, 12,
12, 12, 11,
11, 12,
11, 12,
11, 12,
, (11)
⎧
⎨
⎪
⎩⎪
=
= −
sE
s νE
1 ,
,
mTmT
mTmT
mT
11,
12,
(12)
where sij fT, , EmT , and νmT denote the flexibility coefficient,elastic modulus, and Poisson’s ratio of the resin matrix atT°C, respectively.
The mechanical properties, failure mechanism, andfatigue damage evolution process of the fibers and matrixin yarns, and resin matrix of 2.5D woven composites aredifferent. Therefore, the damage vector is introduced tocharacterize the damage degree of 2.5D woven compos-ites with cyclic loading:
=
−
DE E
E,ij
ij ij
ij
D(13)
where Eij and EijD denote the elastic moduli of undamaged
and damaged materials, respectively. The subscripts=ij ffT fmT mT, , represent thefibers in yarns,matrix in yarns,
and resinmatrix of 2.5Dwoven composites at T°C, respectively.According to the theory of damage mechanics and
micromechanics of composite materials, the elastic moduliof the yarns with damage in 2.5D woven composites ischaracterized by the fiber and matrix elastic modulus [21]:
( ) ( ) ( )= − + − −E D E V D E V1 1 1 ,fTD
ffT ffT f fmT fmT f11, (14)
( )( ) [ ( ) ( )( ) ]
( ) ( ) ( ) ( )= −
− + − + − −
− − + − + −
E D ED E η V D E V D ED E V D E V η D E
11 1 1 11 1 1 1
,fTD
fmT fmTffT ffT f ffT ffT f fmT fmT
ffT ffT f fmT fmT f fmT fmT22,
22, 22 22,
22, 22(15)
( )( ) [ ( ) ( )( ) ]
( ) ( ) ( ) ( )= −
− + − + − −
− − + − + −
G D GD G η V D G V D G
D G V D G V η D G1
1 1 1 11 1 1 1
,fTD
fmT fmTffT ffT f ffT ffT f fmT mT
ffT ffT f fmT mT f fmT mT12,
12, 12 12,
12, 12(16)
where Vf is the aggregation density in yarns, and η22 andη12 are correction coefficients. The elastic modulus of theresin matrix with damage in 2.5D woven composites is
( )= −E D E1 ,mTD
mT mT (17)
3.2 Damage evolution equation
Continuum damage mechanics is used to derive thedamage evolution equation of component damage vari-ables. The Helmholtz free energy density ( )ψ of
A continuum damage model for 2.5D woven composites 657

anisotropic damage materials is a convex function of itsobservable and internal variables [22], which can beexpressed as
( )= α Dψ ψ ε ε ε ε ε ε T γ, , , , , , , , , ,ij ffT ij ffTp
ij fmT ij fmTp
ij mT ij mTp
, , , , , ,
(18)where ε, εp, α, and γ denote the total strain tensor, plasticstrain tensor, back strain tensor, and damage cumulativeplastic strain of the material components, respectively. Inthis study, the yarns and resin matrix of 2.5D wovencomposites (T300/QY8911-IV) are brittle materials, andthe experimental temperature is maintained at a constantvalue. Therefore, the Helmholtz free energy density isequal to the average strain energy density ( )WD of damagedmaterials, which can be expressed as
[ ]= + +Wρ
σ ε σ ε σ ε12
,D ij ffT ij ffT ij fmT ij fmT ij mT ij mT, , , , , , (19)
where ρ is the material density. The strain energy densityrelease rate (Y) defined by the thermodynamic associatedvariable is derived from the Helmholtz free energy density:
⎧
⎨
⎪⎪⎪
⎩
⎪⎪⎪
( )
( )
( )
=
∂
∂
=
−
=
∂
∂
=
−
=
∂
∂
=
−
Y ρ WD
σ εD
Y ρ WD
σ εD
Y ρ WD
σ εD
2 1,
2 1,
2 1,
ffTD
ffT
ij ffT ij ffT
ffT
fmTD
fmT
ij fmT ij fmT
fmT
mTD
mT
ij mT ij mT
mT
, ,
, ,
, ,
(20)
The damage evolution equation can be derived fromthe dissipative potential function, which is a convexfunction of the strain energy density release rate. Theworks of literature [23,24] assume that the damage evolu-tion equation of composites is a power exponential formof Y, which is expressed as
( )=
−
DN
A YD
dd 1
,ij ij ijB
ijC
ij
ij(21)
where the subscripts =ij ffT fmT mT, , , and Aij, Bij, andCij
are the unknown parameters of the damage evolutionequation. By substituting equation (20) into equation(21), the damage evolution equation of the yarn fibers,yarn matrix, and resin matrix of 2.5D woven compositescan be obtained:
⎧
⎨
⎪⎪⎪
⎩
⎪⎪⎪
( ) ( )
( ) ( )
( ) ( )
= ⋅
−
= ⋅
−
= ⋅
−
+
+
+
DN
AE
σD
DN
AE
σD
DN
AE
σD
dd 2 1
dd 2 1
dd 2 1
.
ffT ffT
ffTB
ij ffTB
ffTB C
fmT fmT
fmTB
ij fmTB
fmTB C
mT mT
mTB
ij mTB
mTB C
,2
2
,2
2
,2
2
ffT
ffT
ffT ffT
fmT
fmT
fmT fmT
mT
mT
mT mT
(22)
Due to the randomness of fiber distribution in fiberyarns, the true stress of the fiber and matrix in yarns isdifficult to obtain. Therefore, the component equivalentstress of the yarn fibers, yarn matrix, and resin matrix of2.5Dwoven composites is defined to replace the true stress.The composite component failure criteria (Hashin failurecriteria [25]) can be used to define the component equiva-lent stress of the fiber and matrix in yarns. Due to the com-plex stress of the pure resin matrix, the von Mises failurecriteria can be used to define the component equivalentstress of the resin matrix. The specific form is as follows:
⎜ ⎟ ⎜ ⎟ ⎜ ⎟
⎜ ⎟ ⎜ ⎟ ⎜ ⎟
⎧
⎨
⎪⎪⎪⎪
⎩
⎪⎪⎪⎪
⎛
⎝
⎞
⎠
⎛
⎝
⎞
⎠
⎛
⎝
⎞
⎠
⎛
⎝
⎞
⎠
⎛
⎝
⎞
⎠
⎛
⎝
⎞
⎠
( ) ( ) ( ) ( )
= + +
=
+
+
−
+ +
= − + − + − + + +
σ XσX
ασY
ασY
σ Xσ σ
Xβ
σ σ σY
βσY
βσY
σ σ σ σ σ σ σ τ τ τ
,
,
12
12
12
3 ,
eqv ffT ffTfT
fT
fT
fT
fT
fT
eqv fmT fmTfT fT
fT
fT fT fT
fT
fT
fT
fT
fT
eqv mT mT mT mT mT mT mT mT mT mT
,11,
11,
212,
12,
213,
13,
2
,22, 33,
22,
223,
222, 32,
23,2
12,
12,
213,
13,
2
, 11, 22,2
22, 33,2
11, 33,2
12,2
13,2
23,2
(23)
where XffT and XfmT are the fiber and matrix strengths ofthe yarns, respectively. X fT11, and X fT22, are the longitu-dinal and transverse tension strengths of the yarns,respectively.Y fT12, ,Y fT13, , andY fT23, are the shear strengthsof the yarns in the material coordinate system. α and βare the shear contribution factors. By substituting equa-tion (23) into equation (22), the damage evolution equationfor the fatigue life prediction of 2.5Dwoven composites canbe obtained.
658 Nan Wang et al.
4 Identification of the parametersof the life prediction model
4.1 Process of parameter identification
Separate variable integration of the damage evolution equa-tion of 2.5D woven composites can be performed as follows:
( ) ( )∫ ∫= ⋅
−+
NEA
Dσ
d2 1
,N
D
ijB
ij
ijB C
ijB
0
1 2
eqv,2
ij
ij
ij ij ij
ij0,
(24)
where D ij0, is the initial damage variable of the materialcomponent, usually set as 0, and Nij is the fatigue life ofthe material component. By integration of equation (24)from =D 0ij0, to =D 1ij , the fatigue life prediction modelof 2.5D woven composites can be obtained:
( )
( )( )=
+ +
−+ +σ N
EA B C
D2
2 11 ,ij
Bij
ijB
ij ij ijij
B Ceqv,2
0,2 1ij
ijij ij (25)
To identify the model parameters, the residual stiffnessand fatigue life of the yarn fibers and yarn matrix should beobtained by the mechanical property experiment of theyarns. However, it is difficult to directly research the trans-verse and shear mechanical properties of the yarns, and theexperimental conditions are not fully available. Therefore,the mechanical properties of the yarns are obtained by com-posite laminates with the same fiber volume fraction.
The equation (26) is a relation between normalizedstress and logarithmic fatigue life of composite laminatesconsidering the effect of fiber volume fraction:
( ) ( )= + −
σX
k N m Vlog 1 ,ij
ijij ij ij f
neqv,10 ij (26)
where the subscripts =ij ffT fmT mT, , , and kij, mij, and nij
are unknown parameters, which are obtained by fittingthe fatigue life experimental data of composite laminateswith different fiber volume fractions. When Vf is equal tothe fiber volume fraction of the warp yarns, weft yarns,and resin matrix, the fatigue life of the material compo-nent can be calculated. Take the logarithm of both sidesof equation (25):
⎡
⎣⎢
( )
( )
⎤
⎦⎥
=
+ +
−NE
A B CB σlog log
22 1
2 log ,ijij
B
ij ij ijij ijeqv,
ij
(27)
The value of the unknown parameter Bij in equation(27) can be determined by the slope of the image curve ofthe logarithmic fatigue life vs the logarithmic componentequivalent stress. Previous studies have shown that the
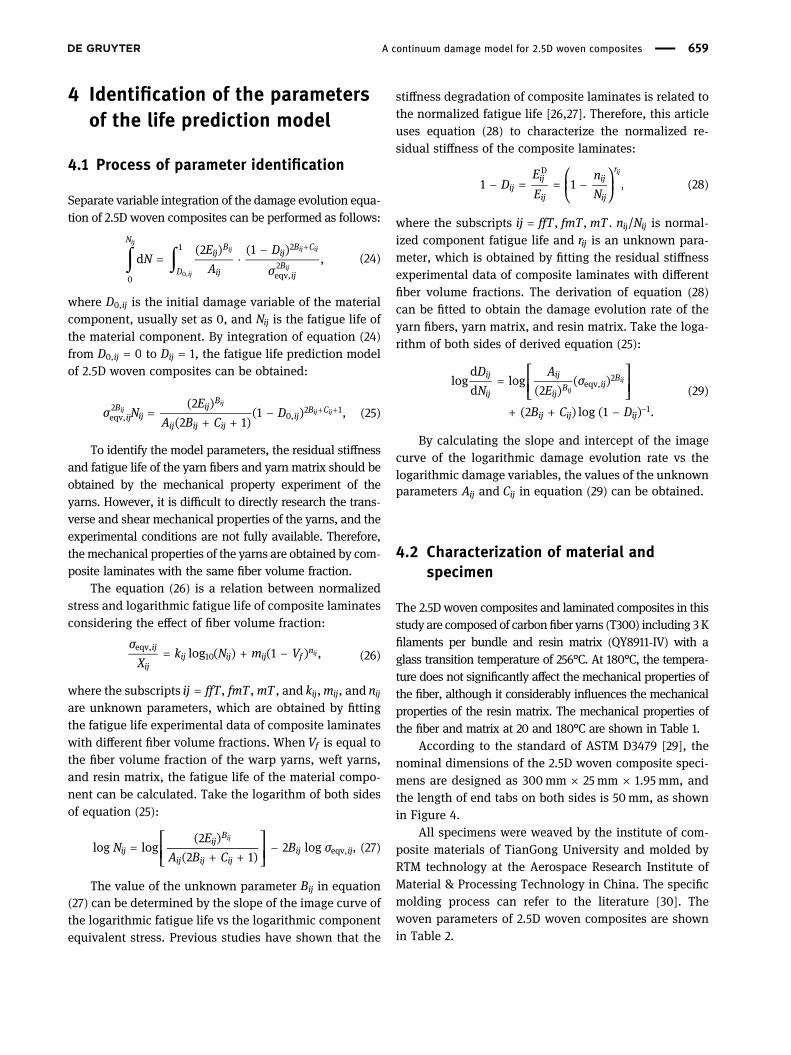
stiffness degradation of composite laminates is related tothe normalized fatigue life [26,27]. Therefore, this articleuses equation (28) to characterize the normalized re-sidual stiffness of the composite laminates:
⎜ ⎟⎛
⎝
⎞
⎠
− = = −DEE
nN
1 1 ,ijij
ij
ij
ij
rD ij
(28)
where the subscripts =ij ffT fmT mT, , . nij/Nij is normal-ized component fatigue life and rij is an unknown para-meter, which is obtained by fitting the residual stiffnessexperimental data of composite laminates with differentfiber volume fractions. The derivation of equation (28)can be fitted to obtain the damage evolution rate of theyarn fibers, yarn matrix, and resin matrix. Take the loga-rithm of both sides of derived equation (25):
⎡
⎣⎢ ( )
( ) ⎤
⎦⎥
( ) ( )
=
+ + −−
DN
AE
σ
B C D
logdd
log2
2 log 1 .
ij
ij
ij
ijB ij
B
ij ij ij
eqv,2
1
ijij
(29)
By calculating the slope and intercept of the imagecurve of the logarithmic damage evolution rate vs thelogarithmic damage variables, the values of the unknownparameters Aij and Cij in equation (29) can be obtained.
4.2 Characterization of material andspecimen
The 2.5D woven composites and laminated composites in thisstudy are composed of carbonfiber yarns (T300) including 3Kfilaments per bundle and resin matrix (QY8911-IV) with aglass transition temperature of 256°C. At 180°C, the tempera-ture does not significantly affect the mechanical properties ofthe fiber, although it considerably influences the mechanicalproperties of the resin matrix. The mechanical properties ofthe fiber and matrix at 20 and 180°C are shown in Table 1.
According to the standard of ASTM D3479 [29], thenominal dimensions of the 2.5D woven composite speci-mens are designed as 300mm × 25mm × 1.95 mm, andthe length of end tabs on both sides is 50mm, as shownin Figure 4.
All specimens were weaved by the institute of com-posite materials of TianGong University and molded byRTM technology at the Aerospace Research Institute ofMaterial & Processing Technology in China. The specificmolding process can refer to the literature [30]. Thewoven parameters of 2.5D woven composites are shownin Table 2.
A continuum damage model for 2.5D woven composites 659

Substituting the woven parameters in Table 5 intoequations (3)–(5), all unknown parameters in the geo-metric structure can be obtained, as shown in Table 3.
4.3 Identification of the parameters of theyarn fiber damage evolution equation
Since the ratio of /E EffT fmT is extremely large, the stiffnessdegradation of the [0]n unidirectional ply can be consid-ered as that of the yarn fibers. Therefore, the unknownparameters of the yarn fiber damage evolution equationare fitted, using the tension–tension fatigue experimentalresults of the [0]n unidirectional plies with fiber volumefractions of 47.20, 51.89, 62.97, and 64.32%.
The tension–tension fatigue experiment of the [0]nunidirectional ply is based on the ASTM D3479 standard[29], the loading frequency is 10 Hz, and the stress ratio is0.1. Figure 5 shows the experimental data and fittingcurves of the normalized stress vs the logarithmic fatigue
life of [0]n unidirectional plies with different fiber volumefractions at different temperatures.
The experimental data in Figure 5 are inserted intoequation (26) and fitted, using the least square method toobtain the unknown parameters kffT , mffT , and nffT . In thefigure, the fitting curves of the warp and weft fibers at20°C are wine red and purple, and those at 180°C are olivegreen and cyan blue. The experimental data and fittingcurves of the normalized residual stiffness vs the normal-ized fatigue life of [0]n unidirectional plies with differentfiber volume fractions at different temperatures are shownin Figure 6.
It can be seen from the experimental data in Figure 6that the residual stiffness of the yarn fiber is mainlyaffected by temperature, and the least square method isused to fit the unknown parameter rffT in equation (28) at20 and 180°C. The corresponding fitting curves at 20 and180°C are represented by the blue and purple in thefigure. Following the method described in Section 4.1,the unknown parameters AffT , BffT , and CffT of the yarn
Table 1: Mechanical properties of T300-3K and QY8911-IV at 20°C and 180°C [28]
Material E11,ff20(180) E22,ff20(180) G12,ff20(180) ν12,ff20(180) Xff20(180)T300-3K 230 GPa 40 GPa 17 GPa 0.3 3,360 GPa (3,261 GPa)
Em20(180) νm20(180) Xfm20(180)QY8911-IV 4.16 GPa (2.5 GPa) 0.358 68.28 GPa (31.87 GPa)
Figure 4: The specific geometric dimensions of the specimen.
Table 2: Woven parameters of 2.5D woven composites [30]
Material component Yarn arranged density(tows/cm)
Number of layers in the weftdirection
Yarn sectionalarea (mm2)
Fiber aggregation density
Warp yarns 10 5 0.16 0.7Weft yarns 3.5 6 0.147 0.765
660 Nan Wang et al.
fiber damage evolution equation can be obtained. Thespecific values are shown in Table 4.
4.4 Identification of the parameters of thematrix and yarn matrix damageevolution equation
Because the fiber strength of the composites is consider-ably greater than the strength of the matrix, the matrix ofthe composites is expected to be damaged first whenthe matrix direction is loaded. The damage of the fiberat this instant is small and can be ignored. Therefore,the unknown parameters of the matrix and yarn matrixdamage evolution equations are fitted by the tension–tension fatigue experimental results of [±45]n cross-plylaminates with fiber volume fractions of 44.4, 52.1, 56.59,and 65%, respectively.
The tension–tension fatigue experiment of [±45]ncross-ply laminates is performed with reference to theASTM D3479 standard [29]. The loading frequency is10 Hz. The stress ratio is 0.1. The experimental data andfitting results of [±45]n cross-ply laminates with differentfiber volume fractions at different temperatures are shownin Figure 7.
The experimental data in Figure 7 are substituted inequation (26), and the unknown parameters ( )kfmT mT ,
( )mfmT mT , and ( )nfmT mT are obtained, using the least squaremethod. In the figure, the fitting curves of the matrix,warp matrix, and weft matrix at 20°C are purple, winered, and olive green, and those at 180°C are orange, royalblue, and pink, respectively. The experimental data andfitting curves of the normalized residual stiffness vs thenormalized fatigue life of [±45]n cross-ply laminates withdifferent fiber volume fractions at different temperaturesare shown in Figure 7.
Considering the experimental data presented in Figure 8,the residual stiffness of the yarn matrix is mainly affected bytemperature, and the least square method is used to fit theunknown parameter ( )rfmT mT in equation (28) at 20 and180°C. The fitting curves of the matrix and yarn matrix at20 and 180°C are the orange and navy blue in the figure.Following the method described in Section 4.1, the unknown
Table 3: Unknown parameters of the geometric structure
Parameter a b c kj h
Value −0.2383 −0.0342 0.1 −0.3106 0.1801
Figure 5: The fitting curve of the normalized stress vs the logarithmic fatigue life of [0]n unidirectional plies at (a) 20°C and (b) 180°C.
Table 4: Unknown parameters of the yarn fiber damage evolution equation
Temperature (°C) Material AffT BffT CffT kffT mffT nffT rffT
20 Weft fibers 7.33 × 10⁻²¹ 10.295 19.42 −0.1005 1.368 −0.02666 0.02438Warp fibers 1.26 × 10⁻²⁰ 10.185 19.64
180 Weft fibers 8.84 × 10⁻³⁵ 23.48 −31.56 −0.0411 1.018 −0.00278 0.0610Warp fibers 1.04 × 10⁻³⁴ 23.44 −31.48
A continuum damage model for 2.5D woven composites 661

parameters ( )AfmT mT , ( )BfmT mT , and ( )CfmT mT of the yarnmatrix and matrix damage evolution equation can beobtained. The specific values are shown in Tables 5 and 6.
5 Results and discussion
5.1 Process of fatigue life prediction
The finite element analysis method is introduced in thefatigue life prediction model of 2.5D woven composites.Based on ANSYS software and APDL language, a programfor the fatigue behavior analysis of 2.5D woven compos-ites at different temperatures is developed. The compila-tion process is shown in Figure 9.
As shown in Figure 9, first the mechanical propertiesof the warp yarns, weft yarns, and resin matrix are input,and the finite element model of 2.5D woven composites isestablished with reference to the real geometric structure.After applying periodic boundary conditions, the programenters the life cycle subroutine, in which the cycle increment
step is defined as NΔ . To ensure the efficiency and accuracyof the final life prediction, the value of the cycle incrementstep in this study is =NΔ 100. The fatigue life of the currentcycle can be expressed in the following form:
= ++N N NΔ ,n n1 (30)
where Nn and +Nn 1 represent the fatigue lives in the cur-rent cycle and next cycle, respectively. A fatigue load isapplied to determine the stress state of each componentelement in the material coordinate system. In each cycleincrement step, the damage variable increment of theyarn fibers, yarn matrix, and resin matrix can be calcu-lated by equation (22), and the damage variable of thecurrent cycle can be expressed in the following form:
= +−D D DΔ ,ij n ij n ij, , 1 (31)
where Dij n, and +Dij n, 1 are the damage variables of the lastcycle and current cycle, respectively. Next the stiffnessand damage variable values of each component elementare updated based on equations (14–16) and (31), and thesteps are repeated. When the damage variable of the cur-rent cycle of the material component is approximatelyequal to 1, the material component fails. At this time,
Figure 6: The fitting curve of the normalized residual stiffness vs the normalized fatigue life of [0]n unidirectional plies at (a) 20°C and(b) 180°C.
Table 5: Unknown parameters of the yarn matrix damage evolution equation
Temperature (°C) Material AfmT BfmT CfmT kfmT mfmT nfmT rfmT
20 Weft matrix 0.1256 11.05 −6.56 −0.0841 0.9776 −0.1356 0.06046Warp matrix 0.2093 10.525 −5.51
180 Weft matrix 0.0867 3.4355 −3.706 −0.2098 0.8518 −0.405 0.2401Warp matrix 0.0464 2.6295 −2.094
662 Nan Wang et al.

it is necessary to judge whether the full-cell model iscompletely damaged. If the percentage of the longitu-dinal damage elements of the yarns accounts for morethan 50% of the total number of warp and weft ele-ments, or the longitudinal damage elements of the yarnsextend to the edge of the model, the whole structure isdestroyed. The life cycle subroutine is exited, and thecurrent cycle corresponds to the fatigue life of the 2.5Dwoven composites.
5.2 Predicted fatigue life of 2.5D wovencomposites
To study the effectiveness of the fatigue life predictionmodel based on continuum damage mechanics, the long-itudinal tension–tension fatigue life of 2.5D (T300/QY8911-IV) woven composites at 20 and 180°C is predicted, andthe results are experimentally verified. The loading fre-quency and stress ratio of 2.5D woven composites in the
Figure 8: The fitting curve of the normalized residual stiffness vs the normalized fatigue life of [±45]n cross-ply laminates at (a) 20°C and(b) 180°C.
Figure 7: The fitting curve of the normalized stress vs the logarithmic fatigue life of [±45]n cross-ply laminates at (a) 20°C and (b) 180°C.
Table 6: Unknown parameters of the matrix damage evolution equation
Material Temperature (°C) AmT BmT CmT kmT mmT nmT rmT
Matrix 20 0.8240 8.55 −1.56 −0.0841 0.9776 −0.1356 0.06046180 0.1470 1.578 0.009 −0.2098 0.8518 −0.405 0.2401
A continuum damage model for 2.5D woven composites 663

fatigue experiment are 10 Hz and 0.1, respectively. Thefatigue life experimental data of 2.5D woven compositesis referenced from Song’s study [30]. The experimental andpredicted values are compared in Table 7.
Table 7 shows that the predicted logarithmic fatigue lifeat 20 and 180°C is close to the logarithmic experimental life.The maximum ratios of the predicted life to experimentallyobtained life with stress levels of 90, 87, and 80% at 20°C are1.0427, 1.6080, and 1.6482, respectively, which are withinthe two-error band. The maximum ratios of the predictedlife to experimentally obtained life at 180°C with stress levelsof 80, 75, and 73% are 1.6789, 1.3488, and 1.1394, respec-tively, which are within the two-error band.
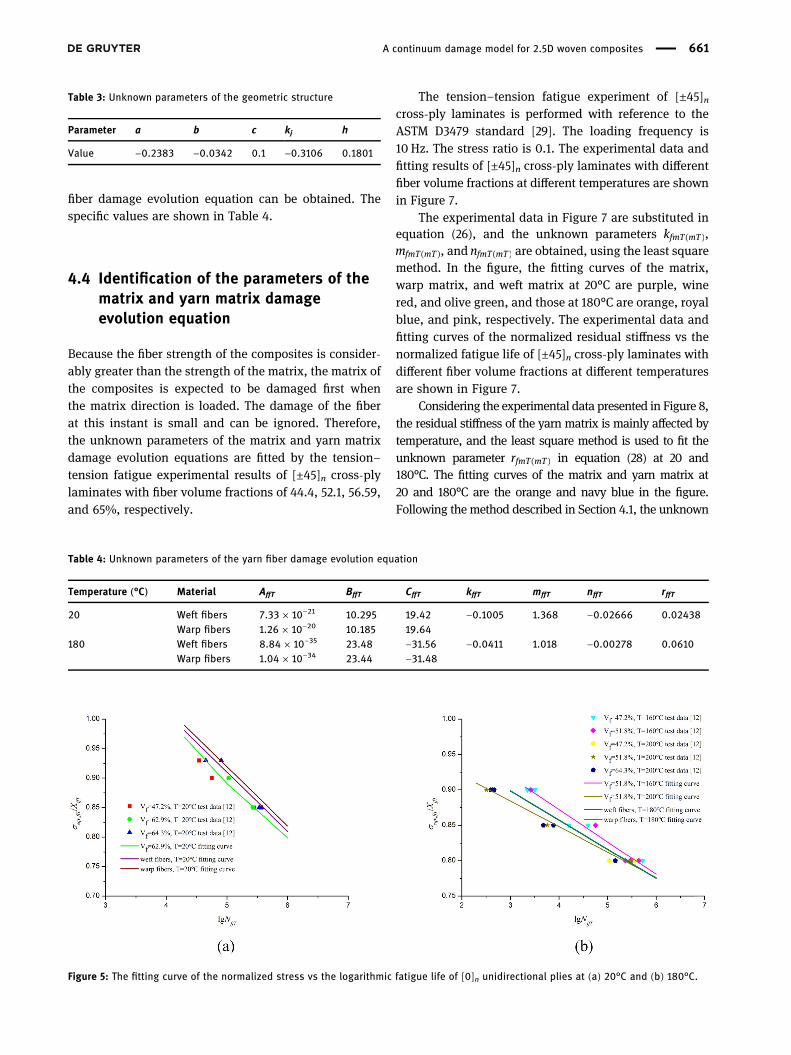
In addition, Figure 10 shows the predicted fatigue lifeof 2.5D woven composites obtained through the proposedmodel and progressive damage model at 20 and 180°C.
The figure shows that the experimental results are inagreement with the fatigue life predicted by the proposedmodel and progressive damage model. However, com-pared with the progressive damage model [12,31], theproposed model only needs the stress-fatigue life and
residual stiffness experimental data of the material com-ponents when predicting the fatigue life of 2.5D wovencomposites. Notably, the residual strength experimentaldata of the material components are not required, which
Figure 9: Flowchart for the fatigue life prediction of 2.5D woven composites.
Table 7: Comparison of the predicted and experimental values ofthe 2.5D woven composites
Temperature (°C) Stresslevel (%)
Testingvalue (lg N)
Predictionvalue (lg N)
20 90 3.9686 3.986887 4.0069 4.2355
4.441880 4.8688 4.9074
5.1244180 80 2.9689 2.9542
3.179375 3.3324 3.4624
3.426873 3.6154 3.6721
3.6352
664 Nan Wang et al.
significantly reduces the testing and time costs. In addi-tion, the progressive damage model assumes that theresidual strength is related to the fatigue damage evolu-tion of the material, and the residual stiffness is consid-ered only to update the stiffness matrix of the material.Therefore, the macroscopic stiffness modulus of thematerial does not correspond to the microscopic damagepropagation. The continuum damage mechanics modelcan solve this problem by constructing the constitutiveequation of the material components subjected to damageand establishing the phenomenological damage evolutionequation.
5.3 Damage evolution process of 2.5D wovencomposites
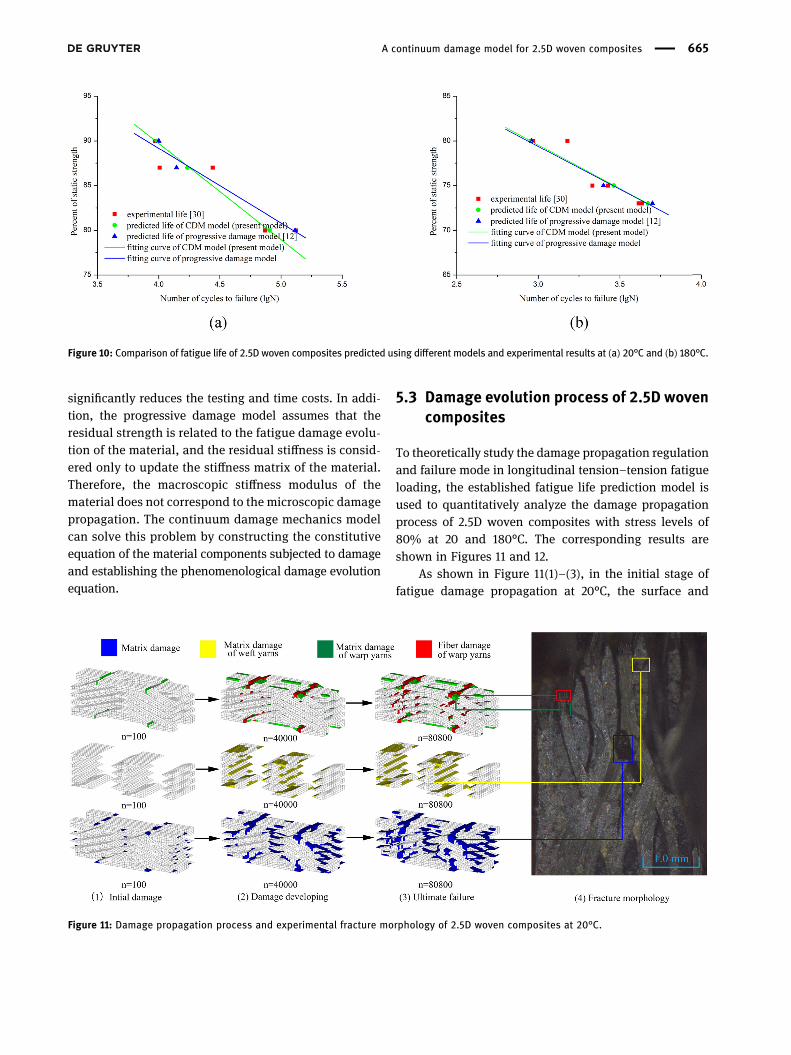
To theoretically study the damage propagation regulationand failure mode in longitudinal tension–tension fatigueloading, the established fatigue life prediction model isused to quantitatively analyze the damage propagationprocess of 2.5D woven composites with stress levels of80% at 20 and 180°C. The corresponding results areshown in Figures 11 and 12.
As shown in Figure 11(1)–(3), in the initial stage offatigue damage propagation at 20°C, the surface and
Figure 10: Comparison of fatigue life of 2.5D woven composites predicted using different models and experimental results at (a) 20°C and (b) 180°C.
Figure 11: Damage propagation process and experimental fracture morphology of 2.5D woven composites at 20°C.
A continuum damage model for 2.5D woven composites 665

interior of the 2.5D woven composites are subjected tocracking of the warp matrix and failure damage of theresin matrix. As the number of cycles increases to 40,000,a small amount of weft matrix cracking occurs inside thestructure, and a large number of fibers break in the sur-face warp yarns and expand along the interior of the 2.5Dwoven composite structure. As the number of cyclesincreases to 80,800, the fiber fracture at the intersectionof the straight and inclined sections of the warp runsthrough the entire structure. At this time, many resinmatrix failures occur, and part of the yarn matrix exhibitscracking damage around the broken warp. According toFigure 12(1)–(3), due to the influence of temperature, fiberbreakage occurs on the surface of the warp yarn after 100cycles, and the other types of damage are intensified asthe number of cycles increases. When the number ofcycles increases to 900, the fiber fracture in the warpyarn expands to the edge of the structure along the direc-tion perpendicular to the load, and the 2.5D woven com-posites fail. In addition, Figures 11(4) and 12(4) showphotographs of the tension–tension fatigue experimentalfractures at 20 and 180°C. The failure mode of the fractureindicates that the final fatigue fracture obtained by thesimulation in this study is in agreement with the experi-mental fracture.
6 Conclusion
A new model to analyze the fatigue damage of 2.5Dwoven composites is proposed by coupling continuumdamage mechanics with composite micromechanics. Bydefining three independent damage variables, different
failure modes (yarn fiber failure, yarn matrix failure,and matrix failure) of 2.5D woven composites are distin-guished. According to the fatigue experimental data of[0]n unidirectional plies and [±45]n cross-ply laminateswith different fiber volume fractions, the unknown para-meters associated with the corresponding damage evolu-tion equation are obtained by fitting. Compared with theprogressive damage model, the proposed model can pre-dict the fatigue life of 2.5D woven composites using onlythe stress-fatigue life and residual stiffness experimentaldata of the material components, thereby reducing thetesting and time costs. The fatigue behavior of 2.5D wovencomposites at 20 and 180°C is studied by performinga numerical simulation and comparing the results withexperimental data. The consistency between the simula-tion and test results demonstrates that the proposedmodelcan effectively predict the fatigue life, damage evolutionregulation, and fatigue fracture morphology of 2.5D wovencomposites.
Funding information: Thisworkwas supportedbyNationalScience and Technology Major Project (2017-IV-0007-0044) and National Natural Science Foundation of China(52175142).
Conflict of interest: The authors declare no conflict ofinterest.
References
[1] Mouritz AP, Bannister MK, Falzon PJ, Leong KH. Review ofapplications for advanced three-dimensional fibre textilecomposites. Compos A Appl S. 1999;30(12):1445–61.
Figure 12: Damage propagation process and experimental fracture morphology of 2.5D woven composites at 180°C.
666 Nan Wang et al.
[2] Mahmood A, Wang X, Zhou C. Modeling strategies of 3D wovencomposites: a review. Compos Struct. 2011;93(8):1947–63.
[3] Isart N, Said BE, Ivanov DS, Hallett SR, Mayugo JA, Blanco N.Internal geometric modelling of 3D woven composites: acomparison between different approaches. Compos Struct.2015;132:1219–30.
[4] Warren KC, Roberto AL, Senthil SV, Harun HB, Bayraktar HH.Progressive failure analysis of three-dimensional wovencarbon composites in single-bolt, double-shear bearing.Compos B Eng. 2016;84:266–76.
[5] Lu H, Guo L, Liu G, Zhong S, Zhang L, Pan S. Progressivedamage investigation of 2.5D woven composites under quasi-static tension. Acta Mech. 2019;230(4):1323–36.
[6] Green SD, Matveev MY, Long AC, Ivanov D, Hallett SR.Mechanical modelling of 3D woven composites consideringrealistic unit cell geometry. Compos Struct. 2014;118(1):284–93.
[7] Zhang D, Chen L, Wang Y, Sun Y, Jia N, Qian K. Finite elementanalysis of warp-reinforced 2.5D woven composites based ona meso-scale voxel model under compression loading. ApplCompos Mater. 2017;24(4):911–29.
[8] Tao W, Zhu P, Wang D, Zhao C, Liu Z. Progressive damagemodelling and experimental investigation of three-dimen-sional orthogonal woven composites with tilted binder. J IndText. 2020;50(1):70–97.
[9] Guo J, Wen W, Zhang H, Cui H, Song J. Mechanical propertiesprediction of 2.5D woven composites via voxel-mesh full-cellmodel. Fiber Polym. 2021;22(7):1899–914.
[10] Stegschuster G, Pingkarawat K, Wendland B, Mouritz AP.Experimental determination of the mode I delamination frac-ture and fatigue properties of thin 3D woven composites.Compos A Appl S. 2016;84:308–15.
[11] Yu B, Blanc R, Soutis C, Withers PJ. Evolution of damage duringthe fatigue of 3D woven glass-fibre reinforced compositessubjected to tension–tension loading observed by time-lapseX-ray tomography. Compos A Appl S. 2016;82:279–90.
[12] Song J, Wen W, Cui H. Fatigue life prediction model of 2.5Dwoven composites at various temperatures. Chinese JAeronaut. 2018;31(2):310–29.
[13] Sun B, Wang J, Wu L, Fang F, Gu B. Computational schemes onthe bending fatigue deformation and damage of three-dimensional orthogonal woven composite materials. ComMater Sci. 2014;91:91–101.
[14] Bhattacharya B, Bruce E. Continuum damage mechanicsanalysis of fatigue crack initiation. Int J Fatig.1998;20(9):631–9.
[15] Zhang T, McHugh PE, Leen SB. Finite element implementationof multiaxial continuum damage mechanics for plain andfretting fatigue. Int J Fatig. 2012;44:260–72.
[16] Nadeem AB, Wahab MA. Fretting fatigue damage nucleationunder out of phase loading using a continuum damage modelfor non-proportional loading. Tribol Int. 2018;121:204–13.
[17] Nehme S, Hallal A, Fardoun F, Younes R, Hagege B, Aboura Z,et al. Numerical/analytical methods to evaluate the mechan-ical behavior of interlock composites. J Compos Mater.2011;45(16):1699–716.
[18] Rao PM, Walter TR, Sankar B, Subhash G, Yen CF. Analysis offailure modes in three-dimensional woven composites sub-jected to quasi-static indentation. J Compos Mater.2014;48(20):2473–91.
[19] Dai S, Cunningham PR. Multi-scale damage modelling of 3Dwoven composites under uni-axial tension. Compos Struct.2016;142:298–312.
[20] Xia Z, Zhang Y, Ellyin F. A unified periodical boundary condi-tions for representative volume elements of composites andapplications. Int J Solids Struct. 2003;40(8):1907–21.
[21] Affdl J, Halpin C, Kardos JL. The Halpin–Tsai equations: areview. Polym Eng Sci. 1976;16(5):344–52.
[22] Chaboche JL, Lesne PM. A non-linear continuous fatiguedamage model. Fatigue Fract Eng Mater Struct.1988;11(1):1–17.
[23] Shi W, Hu W, Zhang M. A damage mechanics model for fatiguelife prediction of fiber reinforced polymer composite lamina.Acta Mech Solida Sin. 2011;24(5):399–410.
[24] Mohammadi B, Fazlali B, Majd DS. Development of a conti-nuum damage model for fatigue life prediction of laminatedcomposites. Compos A Appl S. 2017;93:163–76.
[25] Hashin Z. Failure criteria for unidirectional fiber composites.J Appl Mech. 1980;47(2):329–34.
[26] Philippidis TP, Vassilopoulos AP. Fatigue of composite lami-nates under off-axis loading. Int J Fatig. 1999;21(3):253–62.
[27] Mao H, Mahadevan S. Fatigue damage modelling of compositematerials. Compos Struct. 2002;58(4):405–10.
[28] Song J, Wen W, Cui H, Liu H, Xu Y. Effects of temperature andfiber volume fraction on mechanical properties of T300/QY8911-IV composites. J Reinf Plast Comp. 2015;34(2):157–72.
[29] Baere ID, Paepegem WV, Quaresimin M, Degrieck J. On thetension–tension fatigue behaviour of a carbon reinforcedthermoplastic part I: limitations of the ASTM D3039/D3479standard. Polym Test. 2011;30(6):625–32.
[30] Song J, Wen W, Cui H. Fatigue behaviors of 2.5D woven com-posites at ambient and un-ambient temperatures. ComposStruct. 2017;166:77–86.
[31] Shokrieh MM, Lessard LB. Progressive fatigue damagemodeling of composite materials, part II: material character-ization and model verification. J Compo Mater.2000;34(13):1081–116.
A continuum damage model for 2.5D woven composites 667