research article rapid 3d modeling and parts recognition
TRANSCRIPT
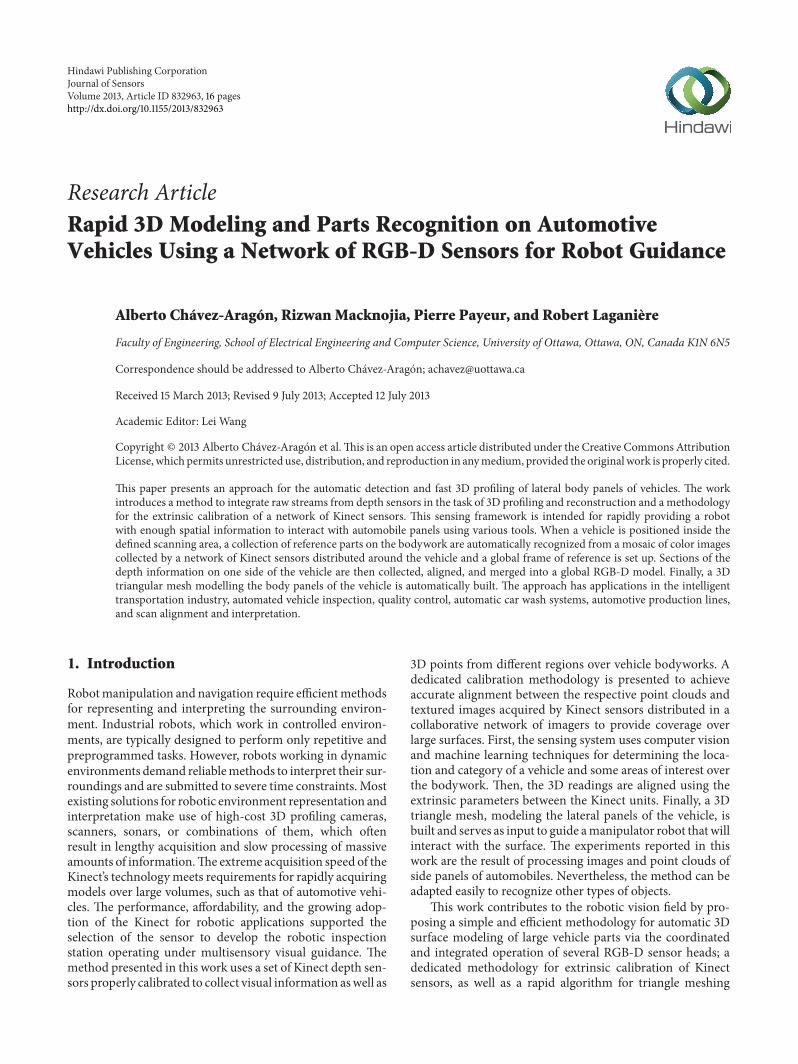
Hindawi Publishing CorporationJournal of SensorsVolume 2013 Article ID 832963 16 pageshttpdxdoiorg1011552013832963
Research ArticleRapid 3D Modeling and Parts Recognition on AutomotiveVehicles Using a Network of RGB-D Sensors for Robot Guidance
Alberto Chaacutevez-Aragoacuten Rizwan Macknojia Pierre Payeur and Robert Laganiegravere
Faculty of Engineering School of Electrical Engineering and Computer Science University of Ottawa Ottawa ON Canada K1N 6N5
Correspondence should be addressed to Alberto Chavez-Aragon achavezuottawaca
Received 15 March 2013 Revised 9 July 2013 Accepted 12 July 2013
Academic Editor Lei Wang
Copyright copy 2013 Alberto Chavez-Aragon et alThis is an open access article distributed under the Creative Commons AttributionLicense which permits unrestricted use distribution and reproduction in anymedium provided the originalwork is properly cited
This paper presents an approach for the automatic detection and fast 3D profiling of lateral body panels of vehicles The workintroduces a method to integrate raw streams from depth sensors in the task of 3D profiling and reconstruction and amethodologyfor the extrinsic calibration of a network of Kinect sensors This sensing framework is intended for rapidly providing a robotwith enough spatial information to interact with automobile panels using various tools When a vehicle is positioned inside thedefined scanning area a collection of reference parts on the bodywork are automatically recognized from a mosaic of color imagescollected by a network of Kinect sensors distributed around the vehicle and a global frame of reference is set up Sections of thedepth information on one side of the vehicle are then collected aligned and merged into a global RGB-D model Finally a 3Dtriangular mesh modelling the body panels of the vehicle is automatically built The approach has applications in the intelligenttransportation industry automated vehicle inspection quality control automatic car wash systems automotive production linesand scan alignment and interpretation
1 Introduction
Robotmanipulation and navigation require efficientmethodsfor representing and interpreting the surrounding environ-ment Industrial robots which work in controlled environ-ments are typically designed to perform only repetitive andpreprogrammed tasks However robots working in dynamicenvironments demand reliablemethods to interpret their sur-roundings and are submitted to severe time constraints Mostexisting solutions for robotic environment representation andinterpretation make use of high-cost 3D profiling camerasscanners sonars or combinations of them which oftenresult in lengthy acquisition and slow processing of massiveamounts of informationThe extreme acquisition speed of theKinectrsquos technologymeets requirements for rapidly acquiringmodels over large volumes such as that of automotive vehi-cles The performance affordability and the growing adop-tion of the Kinect for robotic applications supported theselection of the sensor to develop the robotic inspectionstation operating under multisensory visual guidance Themethod presented in this work uses a set of Kinect depth sen-sors properly calibrated to collect visual information aswell as
3D points from different regions over vehicle bodyworks Adedicated calibration methodology is presented to achieveaccurate alignment between the respective point clouds andtextured images acquired by Kinect sensors distributed in acollaborative network of imagers to provide coverage overlarge surfaces First the sensing system uses computer visionand machine learning techniques for determining the loca-tion and category of a vehicle and some areas of interest overthe bodywork Then the 3D readings are aligned using theextrinsic parameters between the Kinect units Finally a 3Dtriangle mesh modeling the lateral panels of the vehicle isbuilt and serves as input to guide amanipulator robot thatwillinteract with the surface The experiments reported in thiswork are the result of processing images and point clouds ofside panels of automobiles Nevertheless the method can beadapted easily to recognize other types of objects
This work contributes to the robotic vision field by pro-posing a simple and efficient methodology for automatic 3Dsurface modeling of large vehicle parts via the coordinatedand integrated operation of several RGB-D sensor heads adedicated methodology for extrinsic calibration of Kinectsensors as well as a rapid algorithm for triangle meshing
2 Journal of Sensors
which takes advantage of the structure of the point cloudsprovided by the Kinect sensors
2 Related Work
In the recent years the Kinect device has been widely adoptedas an indoor sensor for robotics and human-computer inter-action applications The sensor is a multiview structuredlighting system containing an RGB camera an infrared (IR)camera and an infrared laser projector equipped with amicrogrid that artificially creates a predefined IR pattern overthe imaged surface The sensor is capable of collecting depthinformation for each pixel in a color image which opens thedoor to a great variety of applications Lately two dominantstreams of research have been pursued with Kinect technol-ogy (1) the investigation of the technology behind the deviceanalysis of its properties performance and comparison withother depth sensors (2) the development of applicationsof the Kinect technology in fields such as robotics userinterfaces and medicine among others The present workaddresses both categories
Among the numerous examples of applications for theKinect technology that rapidly appeared in the literatureZhou et al [1] proposed a system capable of scanning humanbodies using multiple Kinect sensors arranged in a circularring Maimone and Fuchs [2] presented a real-time telepres-ence system with head tracking capabilities based on a set ofKinect unitsThey also contributed an algorithm for mergingdata and automatic color adjustment between multiple depthdata sources An application of Kinect in the medical field forposition tracking in CT scans was proposed by Noonan et al[3]They tracked the head of a phantom by registering Kinectdepth data to high resolutionCT template of a head phantomRakprayoon et al [4] used a Kinect sensor for obstacle detec-tion of a robotic manipulator In [5] Berger et al originallyused multiple Kinect sensors for aerodynamic studies of 3DobjectsThey captured and visualized gas flow around objectswith different properties Smisek et al [6] and Park et al [7]conducted analyses regarding Kinectrsquos depth resolutionaccuracy with stereo resolution reconstruction and cameracalibration as well as a comparison with a laser scannerFor simultaneous calibration of the Kinect sensor differentapproaches have been proposed Burrus [8] proposed to usetraditional techniques for calibrating the Kinect color cameraand manual selection of the corners of a checkerboard forcalibrating the depth sensor Gaffney [9] described a tech-nique to calibrate the depth sensor by using 3D printouts ofcuboids to generate different levels in depth imagesThe latterhowever requires an elaborate process to construct the targetBerger et al [10] used a checkerboard where black boxes werereplaced with mirroring aluminium foil therefore avoidingthe necessity of blocking the projector when calibrating thedepth camera
With regard to the depth data of the Kinect sensor itis known that it suffers from quantization noise [6 11] thatincreases as the distance to the object increases The resolu-tion also decreases with the distance [11]The depthmapmayalso contain occluded and missing depth areas mainly due
to the physical separation between the IR projector and theIR camera and to the inability to collect sufficient IR signalreflection over some types of surfaces These missing valuescan however be approximated by filtering or interpolation[2 12]
Concerning the automated detection of vehicle parts avariety of computer vision systems have been developed inthe past that aimed at detecting regions of interest in images ofvehicles Among popular applications in this field the inspec-tion of products on assembly lines stands out Some of thesesystems used methods to simultaneously locate many refer-ence points ormany regions of interest [13 14] Tomanage thesemantic information in the problem domain Kiryakov et al[15] used templates and similarity measures to evaluate thecorrect position of a template over an image For the visualdetection of features of interest in images some authors havereported the successful use of a technique proposed by Violaand Jones called cascade of boosted classifiers (CBC) [16]This technique has proven to be useful in detecting faceswheels back views of cars and license plates among others[17 18] While applications of previous research works aremainly in the area of intelligent transportation systems (ITS)these concepts can advantageously be transposed for applica-tions in robotic guidance
3 Proposed RGB-D Acquisition Framework
The work presented here aims at the integration of informa-tion frommultiple RGB-D sensors to achieve fully automatedand rapid 3D profiling of bodywork regions over automotivevehicles The approach estimates the shape over selectedregions to be reconstructed based on the detection of featuresof interest on vehicle body panels Once the location of theregions of interest is known the approach reconstructs thepanelsrsquo shape using information provided by a set of Kinectsensors placed conveniently which collect visual and 3Dinformation from the vehicle
The final goal of the system being developed is to supportthe real-time navigation of a robotic arm in proximity of thevehicle in order to perform a series of tasks (eg cleaningmaintenance inspection) while it is interacting with the vehi-cle surface The work reported in this paper focuses mainlyon the robotic vision stage
Figure 1 shows various environments used to develop andtest the proposed system In Figure 1(a) an indoor laboratoryenvironment is depicted where an actual piece of automotivebodywork was used for early development along with amockup car door model In Figure 1(b) a multilevel semiout-door parking garage is shown where real full-size vehicleswere imaged to validate the accuracy of calibration over thenetwork of RGB-D sensorsTheparking garage infrastructureprevented the direct sunlight from causing interference withthe IR image components of the Kinect units Natural lightcoming fromwindows andopenwalls aswell as electric lampslighted up the scene The experiments demonstrated thatthese sources of light did not trouble the sensorsrsquo technology
The layout of a vehicle scanning station is shown inFigure 2 Yellow lines delimit the area where the vehicle stops
Journal of Sensors 3
(a) (b)
Figure 1 Indoor and semioutdoor environments used to develop and test the proposed acquisition stage
Network of Kinect sensors
Vehicle
Robotic arm Vehicle model
Figure 2 System layout of the proposed scanning system yellowlines delimit the area where the vehicle stops while depth and colorinformation is collected
while depth and color information is collected At thebeginning the robotic arm which can be moved on rails ispositioned at the end of the track within the blind spots of thesensors Then the vehicle enters the scanning area and stopsin the designated space The Kinect sensors collect color anddepth information over the entire length of the vehicle within10 secondsThe information is then processed in order to con-struct a 3Dmodel of the bodywork panels on the vehicleThewhole scanning and modeling process is meant to be fast inorder to support high inspection cadenceThe latter criterionwas the main factor to support adoption of the Kinecttechnology in this application in spite of its limited depthresolution and sensitivity to ambient lighting conditions
Overall the scanning and 3D texturedmodeling processesare completed in 30 seconds which rapidly makes theinformation available for robot guidanceThe data processingpipeline of the sensory information provided by the Kinectdevices is shown in Figure 3 Rounded rectangles representthe differentmodules that are part of the processThosemod-ules within the dotted rectangle operate on-line while thecalibration procedure out of the dotted rectangle is executedoff-line and only once prior to inspection operation Rectan-gles represent the inputs and output of the system
31 SystemConfiguration The scanning system for collectingcolor and depth information over the whole lateral view of avehicle bodywork consists in three Kinects positioned in asingle row (sensorrsquos baseline) with their viewing axes perpen-dicular to the bodywork and two extra sensors which cover
Table 1 Parameters of the proposed scanning system
IR camera RGB camera
Horizontal field of view 57∘ 63∘
Vertical field of view 45∘ 50∘
Distance between cameras 13m 13mHeight of the sensors above theground 1m 1m
Distance between baseline camerasand vehicle 2m 2m
Horizontal overlapping areabetween two cameras 085m 115m
Coverage area for each sensor 47m times 165m 5m times 185mTotal coverage area for the baselinedepth sensors 6m times 165m 63m times 185m
partially the front and back areas rotated toward the vehiclein such a way that their viewing axes form a 65 degree anglewith respect to the sensorrsquos baseline
This configuration can be replicated on the other side ofthe vehicle for a complete 360 degree view As detailed inTable 1 the sensors are positioned at 1m above the groundand parallel to the floor The cameras were set up about 2maway from the area where the vehicle is positioned Thisconfiguration permits to meet the following requirements tocover the entire side of a car (1) a minimum coverage areaof 415 times 15m which is the typical size of a sedan vehicle (2)collection of depth readings in the range of 08 to 3mwhich isthe rangewhere Kinect performswell (3) an overlapping areain the range of 05m to 1m between contiguous sensors toensure accurate external calibration process and point cloudalignment Figure 4 depicts the acquisition system It is worthmentioning that the proposed acquisition system can be eas-ily adapted for larger vehicles by including extra sensors in thesensorrsquos baseline
32 Interference Issues Within the overlapping regionsbetween two contiguous Kinect sensors interference mighthappen between the sensors since all Kinect devices projecta pattern of infrared points at the same wavelength to createtheir respective depth map This produces small holes on thedepth maps of overlapping sensors To prevent this problemthe data is collected sequentially over different time slots Inthe first time slot sensors 119870
0and 119870
2simultaneously collect
4 Journal of Sensors
Depth
Color
Point cloudsintegration
Imagescombination
Detection ofvehicle parts
Point cloudsegmentation
Triangle meshgeneration
Kinect 1
Kinect N
3D model ofthe vehicle
panels
Kinect extrinsic calibration
Figure 3 Main components of the RGB-D scanning and modeling approach
13m 13m22m
2m
22m
15
m
15
m
K0 K1 K2
K4 K3
Figure 4 Configuration of the acquisition system Five Kinects sen-sors are used to collect color and depth information over the entireset of lateral panels of a vehicle
their respective information (see Figure 4)Then sensors1198701
1198703 and 119870
4scan the central back and front regions of the
vehicleThedelay between the shots is the time needed to shutdown the first group of devices and initialize the next oneThis process is performed by the Kinect drivers and takesfew secondsThe OpenNI framework was used to control theKinect for Xbox 360 version of the sensors this frameworkdoes not provide means to shut down only the infrared pro-jector
4 Calibration of a Network of Kinect Sensors
Kinect technology consists of a multiview system that pro-vides three outputs an RGB image an infrared image anda depth image for each sensor Arranging a group of sensorsas a collaborative network of imagers permits to enlarge theoverall field of view and to model large objects such asautomotive vehicles For an adequate operation of the net-work a precise mapping between color and infrared must beachieved For this purpose an internal calibration procedurethat estimates the intrinsic parameters of each camera withinevery device as well as the extrinsic parameters between theRGB and the IR camera inside a given Kinect is requiredalong with an external calibration process that providesaccurate estimates of the extrinsic parameters in between therespective pairs of Kinect devices A procedure dedicated toKinect sensors is proposed and detailed later
41 Internal Calibration
411 Intrinsic Parameters Estimation for Built-In KinectCameras The internal calibration procedure includes theestimation of the respective intrinsic parameters for the colorand the IR sensors which are the focal length (119891
119909 119891119910) the
principal point (119874119909 119874119910) and the lens distortion coefficients
(1198961 1198962 1199011 1199012 1198963) [19] Because the RGB and IR cameras
exhibit different color responses the proposed calibrationtechnique uses a regular chessboard target of size 9 times 7 thatis visible in both sensorsrsquo spectra During internal calibrationthe Kinectrsquos IR projector is blocked by overlapping a mask onthe projector windowThe IR projector otherwise introducesnoise over the IR image as shown in Figure 5(a) and withoutprojection the image is too dark as shown in Figure 5(b)Therefore standard external incandescent lamps are addedto illuminate the checkerboard target Figure 5(c) The colorimage is not affected by the IR projection and creates a clearpattern Figure 5(d)
The checkerboard was printed on a regular A3 size paperwhich does not reflect back the bright blobs due to the exter-nal incandescent lamps in the IR image plane To ensure thebest calibration results 100 images were collected from boththe color and the IR cameras Both images were synchronizedin each frame so that they could be used for extrinsic calibra-tion between the cameras To estimate the intrinsic parame-ters eachKinect is calibrated individually using Zhangrsquos cam-era calibration method [19] The method is applied 10 timeson 30 images randomly selected among the 100 capturedimages The reprojection error is also calculated for eachiteration which is a measure of the deviation of the cameraresponse to the ideal pinhole cameramodelThe reprojectionerror is calculated as theRMS error of all the target calibrationpoints
After calibration both the RGB and IR cameras achievereprojection error between 012 and 016 pixels which is bet-ter than the original performance given by the default man-ufacturer calibration of the Kinect sensor The reprojectionerror without calibration of the IR camera is greater than 03pixel and that of the color camera is greater than 05 pixelThefocal length of the IR camera is larger than that of the colorcamera that is the color camera has a larger field of view It isalso apparent that every Kinect sensor has slightly differentintrinsic parameters This confirms the need for a formal
Journal of Sensors 5
(a) (b)
(c) (d)
Figure 5 Views of the checkerboard in different configurations (a) IR image with IR projector (b) IR image without IR projector (c) IRimage with incandescent lighting and without projector and (d) color image
intrinsic calibration to be performed on each device to sup-port accurate data registration
412 Extrinsic Parameters Estimation for Built-In KinectCameras Therespective location of the color and IR cameraswithin each Kinect unit is determined by stereo calibrationThe camera calibration method proposed by Zhang [19] alsoprovides the location of the checkerboard target with respectto the camera coordinate system If the target remains fixedfor both cameras then the position between both cameras isdefined by (1)
119867 = 119867RGB119867minus1
IR (1)
where119867 is the homogenous transformation matrix (consistsof 3 times 3 rotationmatrix 119877 and 3 times 1 translation vector 119879) fromthe RGB camera to the IR camera 119867IR is the homogenoustransformation matrix from the IR camera to the checker-board target and 119867RGB is the homogenous transformationfrom the RGB camera to the checkerboard target Thetranslation and rotation parameters between the RGB andIR sensors are shown in Table 2 for five Kinect sensors Theinternal extrinsic calibration parameters allow to accuratelyrelate the color to depth data collected by a given Kinectdevice
413 Registration of Color and Depth Information within aGiven Kinect Device The Kinect sensor does not provide theregistered color and depth images Once the internal intrinsicand extrinsic parameters are determined for a given Kinectdevice the procedure to merge the color and depth based onthe estimated registration parameters is performed as followsThe first step is to properly relate the IR image and the depth
Table 2 Internal extrinsic calibration of embedded sensors
Translation (cm) and rotation (degree) between RGB and IRSensor 119879
119909
119879119910
119879119911
119877119909
119877119910
119877119911
1198700
250 00231 03423 00017 00018 minus000821198701
246 minus00168 minus01426 00049 00032 001121198702
241 minus00426 minus03729 00027 00065 minus000751198703
249 00153 02572 minus00046 00074 000351198704
247 00374 03120 00052 00035 00045
image The depth image is generated from the IR image butthere is a small offset between the two which is introduced asa result of the correlation performed internally during depthcalculation The offset is 5 pixels in the horizontal directionand 4 pixels in the vertical direction [6] After removing thisoffset using (2) each pixel of the depth image exactlymaps thedepth of the corresponding pixel in the IR image Thereforethe calibration parameters of the IR camera can be applied onthe depth image considered
119889119901 (119909 119910) = 119889119904 (119909 minus 5 119910 minus 4) (2)
where 119909 and 119910 are the pixel location 119889119904(119909 119910) is the offsetteddepth value affecting the Kinect depth sensor and 119889119901(119909 119910) isthe corrected depth value The second step consists in trans-forming both the color and the depth images to compensatefor radial and tangential lens distortion usingOpenCVundis-tort function [20] This function estimates the geometrictransformation on the images using the distortion parametersand provides the undistorted color image and depth image(119889119906(119909 119910)) The next step is to determine the 3D coordinates
6 Journal of Sensors
(a) (b)
Figure 6 Accurate integration of color and depth images
corresponding to each point in the undistorted depth imageusing (3)
119883IR =
(119909 minus 119874119909 IR) 119889119906 (119909 119910)
119891119909 IR
119884IR =
(119910 minus 119874119910 IR) 119889119906 (119909 119910)
119891119910 IR
119885IR = 119889119906 (119909 119910)
(3)
where (119883IR 119884IR 119885IR) are the 3D point coordinates of pixel(119909 119910) in the depth image with respect to the IR camerareference frame (119909 119910) is the pixel location (119891
119909 IR 119891119910 IR) is thefocal length of the IR camera (119874
119909 IR 119874119910 IR) is the optical cen-ter of the IR camera and 119889119906(119909 119910) is the depth of a pixel in theundistorted depth image Next the color is assigned from theRGB image to each 3D point 119875IR(119883IR 119884IR 119885IR) The color ismapped by transforming the 3D point 119875IR into the colorcamera reference frame using the internal extrinsic cameraparameters and then reprojecting that point on the imageplane of the RGB camera using the intrinsic parameters tofind the pixel location of the color in the undistorted colorimage using (4)
119875RGB (119883RGB 119884RGB 119885RGB) = 119877 sdot 119875IR + 119879
119909 = (
119883RGB119891119909 RGB119885RGB
) + 119874119909 RGB
119910 = (
119884RGB119891119910 RGB
119885RGB) + 119874
119910 RGB
(4)
where 119875RGB is the 3D point with respect to the color camerareference frame 119877 and 119879are the rotation and translationparameters from the color camera to the IR camera and (119909 119910)is the pixel location of color information in the undistortedcolor image
Figure 6(a) shows a mockup car door as imaged from thecolor camera Figure 6(b) shows the colored depth informa-tion in the interval 0ndash25m from the slightly different pointof view of the IR camera while keeping the Kinect sensorstatic with respect to the panelThe difference in position andorientation between the two cameras contained in the Kinectunit is accurately compensated by the estimated extrinsicparameters obtained from internal calibration
42 External Calibration of Kinect Sensors with a Best-FitPlane Method The last set of parameters estimated in thecalibration process is the extrinsic ones which is the relativeposition and orientation between every pair of Kinect sen-sors The external calibration is performed between pairs ofIR cameras over the network of sensors because depth infor-mation is generated with respect to these cameras The con-cept behind the proposed method named here best-fit planecalibration method is to determine for every pair of sensorsthe position and orientation of a fixed planar chessboard inreal world coordinates Knowing the orientation of the planefrom two different points of view (ie two Kinect sensors)it is possible to estimate the relative orientation and positionchange between the sensors
The procedure developed for external calibration involvespositioning a standard planar chessboard target within thevisible overlapping regions of any two Kinect sensors Unlikemost calibration techniques in the literature in this methodthere is no need to move the checkerboard to image it frommultiple views On the contrary a fixed target increasesthe performance of the method The result is a rigid bodytransformation that best aligns the data collected by a pair ofRGB-D sensors Figure 7 depicts the proposed scanning sys-tem during the calibration process
The proposed technique takes advantage of the rapid 3Dmeasurement technology embedded in the sensor and pro-vides registration accuracywithin the range of the depthmea-surements resolution available with Kinect An importantadvantage of this method is the fact that it is unnecessary to
Journal of Sensors 7
K0
K1
K2
K4
K3
Figure 7 Placement of calibration target during calibration of Kinects1198700
and 1198704
(a) (b)
Figure 8 IR image of the checkerboard target for external calibration (a) effect of the projected IR pattern (b) filtered image using a medianfilter of size 3 times 3
cover the Kinect infrared projector to perform this phase ofthe calibration which facilitates manipulations when remo-tely dealing with the network of Kinect devices
The method consists in finding a normal vector and thecenter of the checkerboard plane which define the relativeorientation and translation of the checkerboard plane Thefirst step is to compute the 3D coordinates of the cornerson the checkerboard with respect to the IR camera frameusing (3)When the checkerboard target is positioned in frontof a Kinect sensor the IR projector pattern appears on thecheckerboard target as shown in Figure 8(a)This pattern cre-ates noise and makes it difficult to extract the exact cornersSince the noise is similar to salt and pepper noise a medianfilter of size 3 times 3 provides a good reduction in the noise levelwithout blurring the image as shown in Figure 8(b)
Moreover the extracted points are not entirely mappedover a single plane because of quantization effects in theKinect depth sensor Therefore the corner points are used toestimate the three-dimensional plane (5) that minimizes theorthogonal distance between that plane and the set of 3DpointsThe equation of the plane then permits to estimate theorientation in 3D space of the target with respect to the IRcamera
119911 = 119860119909 + 119861119910 + 119862 (5)
Let the 3D coordinates of the 119899 corners of the checker-board target be 119878
1(1199091 1199101 1199111) 1198782(1199092 1199102 1199112) 119878
119899(119909119899 119910119899 119911119899)
then the systems of equations for solving the plane equation
are1198601199091+1198611199101+119862 = 119911
1 1198601199092+1198611199102+119862 = 119911
2 119860119909
119899+119861119910119899+119862 =
119911119899 These equations can be formulated into a matrix problem
[[[[
[
1199091
11991011
1199092
11991021
119909119899
119910119899
1
]]]]
]
[
[
119860
119861
119862
]
]
=
[[[[
[
1199111
1199112
119911119899
]]]]
]
(6)
This overdetermined system is solved for the values of 119860119861 and 119862 with an orthogonal distance regression approach[21] which provides the best fit plane on those points All the3D points 119878
119899 are projected on the best fit plane 119875
119899 These
points serve to define the center and the normal vector ofthe plane However projected points 119875
119899 do not represent the
exact corners of the checkerboardTherefore the center of theplane cannot be defined only by the intersection of two linespassing close to the center Figure 9(a) shows the set ofpossible pairs of symmetric corner points that generate linespassing close to the center
The closest point to all intersections between these lines isselected as a center point119874 Two points 119875
119894and 119875119895are selected
on the plane to define vectors997888997888119874119875119894and997888997888119874119875
119895The normal to the
plane is then defined by the cross product
119911 =
997888997888
119874119875119894times
997888997888
119874119875119895
100381610038161003816100381610038161003816
997888997888
119874119875119894times
997888997888
119874119875119895
100381610038161003816100381610038161003816
(7)
This normal is the unit vector of the 119911-axis of the check-erboard frame with respect to the RGB-D sensor The unit
8 Journal of Sensors
(a)
z
Pi
Pj
O
(b)
Figure 9 (a) Possible combination of lines passing through the center of the checkerboard (b) the normal vector and the center of a checker-board target
vector of the 119910-axis of the checkerboard can be found byany two vertical points in the checkerboard Let 119875
119894and 119875
119895be
the two vertical points where 119875119894is the top end and 119875
119895is the
bottom end of a vertical line119873 is the total number of possiblecombinations of vertical lines The average unit directionalvector can then be defined as
119910 =
1
119873
sum
119875119894minus 119875119895
10038161003816100381610038161003816119875119894minus 119875119895
10038161003816100381610038161003816
(8)
This vector is the unit vector of the 119910-axis of the checker-board frame with respect to the RGB-D sensor The last unitvector for the 119909-axis can be found by a cross product definedas
119909 = 119910 times 119911 (9)
All the unit vectors of the coordinate frame of the check-erboard target can be combined to define the rotation matrixbetween the RGB-D sensor and the checkerboard frame as
119877 = [
[
119909119909
119910119909
119911119909
119909119910
119910119910
119911119910
119909119911
119910119911
119911119911
]
]
(10)
The translation vector corresponds with the center of thecheckerboard frame
119879 = [119874119909
119874119910
119874119911] (11)
119877 and 119879 are the rotation and the translation matrices of thecheckerboard frame with respect to the Kinect IR sensorTheposition and orientation between two Kinect sensors can bedetermined by the following procedure Let 119867
1and 119867
2be
the homogenous transformations between Kinect 1 and thecheckerboard and between Kinect 2 and the checkerboardrespectively as shown in Figure 10 If the target remains
Kinect 1 Kinect 2
x
xx
y
yy
z
zz
H
H1 H2
Checkerboard
Figure 10 Extrinsic calibration of a pair of Kinect sensors
fixed for both Kinect sensors the geometrical transformationbetween the sensors is defined as follows
119867 = 1198672119867minus1
1
(12)
where119867 is the homogenous transformation matrix from theKinect 2 to the Kinect 1 sensor
43 Complete Calibration of All Cameras in the Network ofKinect Sensors The camera arrangement shown in Figure 4includes overlapping regions between contiguous sensorsmarked in gray During the calibration phase the checker-board target is successively placed within those areas forexternal calibration between every pair of neighbor KinectIR sensors Figure 7 shows the calibration target placed inthe overlapping region between Kinect 119870
0and 119870
4during an
experimental calibration procedure External calibration is
Journal of Sensors 9
K0 K1 K2
K4 K3
HK0larrK4 HK1larrK0
HK1larrK2
HK2larrK3
1 2 3 4
Figure 11 Calibration flow for the network of sensors
performed in pairs using the best-fit plane calibrationmethoddetailed in Section 42 The center Kinect 119870
1 is set as a base
of reference for the setup The relative calibration is thencalculated between (119870
1 1198700) (1198701 1198702) (1198702 1198703) and (119870
0 1198704)
Figure 11 shows the calibration flow for the network of Kinectsensors
Kinects 1198700and 119870
2have a direct relationship with 119870
1
immediately defined by the extrinsic calibration parametersobtained in each case but119870
4and119870
3need to be related to119870
1
through an intermediate node respectively 1198700and 119870
2 The
relations between (1198701 1198704) and (119870
1 1198703) are given by the fol-
lowing equations
1198671198701larr9978881198704
= 1198671198701larr9978881198700
1198671198700larr9978881198704
1198671198701larr9978881198703
= 1198671198701larr9978881198702
1198671198702larr9978881198703
(13)
5 Automatic Detection of CharacteristicAreas over a Vehicle
Once the network of Kinect sensors distributed around oneside of a vehicle is available and entirely calibrated theproposed system determines the location of the vehicle inthe scene and subsequently the location of a set of significantvehicle components The purpose of recognizing specificareas of interest over a large object such as a vehicle is to speedup the modeling process and also to facilitate the guidance ofthe robot arm that will eventually interact with the vehicle toperform either inspection or maintenance tasks Acquiringthe knowledge about the location of dominant features overthe vehicle reduces the amount of time spent on scanning athigher resolution to accurately drive the manipulator byfocusing the operation only over selected areas It also allowsthe robot to rapidly determine where to operate as it is veryunlikely that the robotic operation will be required over theentire vehicle for most typical inspection or maintenancetasks
To achieve efficient and reliable detection and localizationof characteristic areas over a vehicle a visual detector of vehi-cle parts (VDVP)was previously introduced in [22] to operateon an image depicting a complete view of one side of a vehicleThe VDVP receives as an input a color image of a lateral viewof the vehicle to determine the location of up to 14 vehicleparts The method works with images of different types ofvehicles such as 4-door sedan 2-door sedan 3-door hatch-back 5-door hatchback SUV and pickup-trucks Figure 12illustrates the result of applying the method over a test imageRound areas indicate features detected by the classifierssquare regions mean that the locations of the features were
Figure 12 Automatic detection of parts of interest over a side viewof a car
inferred based on other known features The VDVP methodis revisited and integrated in this work
The original method required at least a full lateral viewof the vehicle which was provided by a standard color cameralocated far enough from the vehicle to image its entire lengthTo better integrate and to increase the compactness of theacquisition setup determining the location of the car and thebodywork panels of the vehicle should be achieved by usingthe color information provided by the Kinect sensors How-ever none of the Kinect sensors can collect a full view alonedue to the limited horizontal field of view and depth of field ofKinect sensor technology Therefore it becomes necessary tomerge the color images collected in a collaborativemanner bysensors119870
011987011198702 For that purpose the assumption is made
that the image planes of the group of Kinect sensors are paral-lel and they all are contained in a larger plane Thus in orderto accurately merge the color information only the transla-tion vectors defining the relative position of the color cameraswith respect to the central Kinectrsquos color camera are requiredThese parameterswere obtained during the calibration proce-dure described in Section 4 and can be computed by combin-ing the internal and external extrinsic calibration parametersas detailed in Section 43 The resulting composite image isused to determine the segments in each color image thatcorrespond to both the vehicle and the parts of interestHere the original VDVP method is extended such that thedetection process for each part of interest is performed usingindividual images from each sensor each representing a sec-tion of the vehicle rather than on the segmented panorama
To determine the location of a car in the side viewthe VDVP method relies on the successful detection ofthe car wheels [22] To tackle this problem the algorithmmakes a decision based on the result of two techniques thatestimate the position of the wheels the Hough transformalgorithm and a classifier based on Haar-like features trainedfor detecting wheels [16] Then the car is enclosed in abounding box and segmented from the background To setthe dimension of the bounding box a statistical analysis of thelocation of significant car features over a training set of images(119905119904) was conducted The training set represents the 67 of a
collection containing one hundred and ten color imagesThe remaining 33 of the images were used for evaluationpurposes Figure 13 shows the regions where features ofinterest are expected to be located Each region of interestcorresponds from left to right respectively to rear bumperrear lamp rear wheel rear handle rear window roof centerfront handle front window windshield lateral mirror frontwheel head light and front bumper
10 Journal of Sensors
Figure 13 Regions containing the location of parts of interest forlateral views of vehicles as a result of training over a representativecollection of images of different types of automobiles
Having recovered the position of the wheels in the scenefor parts of interest detection purposes a polar coordinatesystem is established The origin is the center of the rearwheel Directions 119883 and 119884 are at right angles to each otherThe direction of the119883 axismatches with the directed line thatgoes from the origin (center of rear wheel) to the center of thefront wheel
Once the location of the wheels is known the next stepconsists in determining the location of all other remainingfeatures of interest 119862
119894 on the bodywork Any feature of
interest 119862119894 characterizing a vehicle is defined in the polar
coordinate system as follows
119862119894= (119903 120579 120575) 119903 120575 isin 119877 0 le 120579 le 120587 (14)
where 119903 and 120579 define the center of a feature of interest to belocated in polar coordinates and 120575 is the minimum radiusof a circumference enclosing the region for a given part ofinterest Let 119877
119888be the region where a feature 119862 is expected
to be located119877119888is a 2-tuple (119891
119903 119891120579) that can be represented by
probability distribution functions over the polar map super-imposed over the lateral image of the vehicle and defined as
119891119903(119903 120583119903 1205902
119903
) =
1
120590119903
radic2120587
119890minus((119903minus120583
119903)
22120590
2
119903)
119891120579(120579 120583120579 1205902
120579
) =
1
120590120579
radic2120587
119890minus((120579minus120583
120579)
22120590
2
120579)
(15)
The radial and angular standard deviations (120590119903and 120590
120579) and
expectations (120583119903and 120583120579) in (15) are calculated experimentally
from the training set 119905119904 Consequently these PDF functions
define a probable searching area for each part of interest con-sidered
To achieve rotation scale and translation invariance inthe definition of the search zones the direction of the vectorpointing toward the center of the front wheel is used as the119883axis all the vectors pointing toward features of interest werenormalized with respect to the length between the wheelsrsquocenters and the origin of the coordinate system correspondsto the position of the rear wheelrsquos center as it is shown inFigure 14(b) Up to this point a set of regions for each part ofinterest and for each image in the segmented panorama wasdefined Next for each car feature119862
119894 to be detected a search
area119877119888119894
is definedThen a set of classifiers trained for detect-ing each feature of interest 119862
119894 is usedThe detection method
is constructed as a cascade of boosted classifiers based onHaar-like features Classifiers were trained with the set of
images 119905119904 Each detection performed by a classifier is ranked
using the corresponding PDF functions (119891119903 119891120579) False detec-
tions are discarded rapidly using this method as well
51 Determining the Position of Missing Vehicle Parts Vehiclepanels are located using vehicle features on the bodyworkFigure 15 shows the classification rate for each car part Theclassifiers were evaluated using the testing set that as men-tioned previously contains the 33 of a collection of colorimages of vehicles Twelve features are detected by the learn-ing algorithms the locations of the remaining features (win-dows) as well as the location of those characteristics that werenot successfully detected by the classifiers are inferred as fol-lows
Let119872 be a geometrical model for a vehicle defined as fol-lows119872 = 119862
1 1198622 119862119899 That is119872 defines the spatial rela-
tionship among the vehicle features of interest in an image bycontaining the positions of each car part
Let 119872119888
= 1198621 1198622 119862119899minus119896
a geometrical model con-structed using the vehicle parts of interest successfullydetected with themethod proposed in the previous section 119896being the number of missing features Let119866 be the set of geo-metrical models for each image in the training set 119905
119904 A sim-
ilarity function 119871 which measures how adequate119872119888and119872
are can be defined as follows
119871 (119872119888119872) =
119896
sum
119894=1
119878 (119888119894) sdot 119865 (119888
119894) (16)
where 119878(119888119894) is the probability of the successful detection of the
classifier for a particular feature 119888119894 This probabilistic distri-
bution was determined experimentally for each car part to bedetected and is reported for dominant parts of interest in [22]119865(119888119894) defines the probability that a detected feature 119888
119894 was
found in the right place considering the model 119872 and theprobability distribution associated with 119888
119894Therefore for each
feature 119888119894 in119872
119888 the similarity function119871 is calculated using
models in 119866 This way the most likely position of 119888119894is deter-
mined by choosing the lowest value for 119871 The partial model119872119888 is upgraded with the new location of 119888
119894 This process is
repeated until the full set of features is known Finally themodel119872
119888 not only provides accurate information about the
location of the parts of interest but information about thetype of car size location and orientation of the vehicle sinceeachmodel119872 in119866 beyond containing the spatial relationshipamong the vehicle features of interest also contains semanticinformation about the type of vehicle Figure 16 shows someresults obtained after applying the proposed technique forpart detection in color images collected from three Kinectsensors over different lateral sections of a vehicle
6 3D Reconstruction of Vehicle Lateral Panels
Thepoint clouds collected by the set of Kinect sensors are firstaligned using the external calibration parameters previouslycalculatedThen a segmentation procedure is applied to sep-arate points contained within discovered regions of interestusing the VDVP method of Section 5 from the whole pointcloud For segmentation the locations of the detected parts of
Journal of Sensors 11
(a) (b)
(c)
Figure 14 (a) Unrefined segmented panorama (b) polar coordinate system centered on the rear wheel and the centers of each search zoneand (c) search zones 119877
119888
for each image
0 20 40 60 80 100Mirror
Center of carHead lightRear lamp
Rear handleWindshield
Rear bumperFront handle
RoofFront bumper
Rear wheelFront wheel
Figure 15 Classification rate according to car parts in percentage
interest in color images are mapped into the 3D point cloudThe coordinates of the rear bumper front bumper roofand wheels provide the width and height of a 3D boundingbox enclosing the desired points The bonding box depth isdefined by adding and subtracting a fixed parameter (30 cm)to the average depth of the parts This parameter was estab-lished experimentally as folds and pleats of the surface ofautomotive vehicles usually do not go beyond this thresholdNext a triangle mesh is built over the respective groups ofpoints that correspond to each region of interest detected overthe surfaceThis process results in a group of local 3D coloredmodels that represent the shape and visual appearance of thesurface of the vehicle in the specific regions of interest Amesh is a topological structure typically constructed fromunorganized points The Delaunay triangulation technique[23] is commonly used for this purpose but tends to becomputationally expensive Nevertheless the Kinect sensorsprovide depth readings in a structured way (rectangularlattice) Advantage is taken of this structured information toperform the triangulation process efficiently using the follow-ing technique
Let TR119898be the triangle mesh to be calculated for a given
point cloud 119875119871 The latter being a rectangular lattice of 3D
points under the constraint that Kinect sensors are used Let ℎbe a variable threshold that defines the surface continuity and
let119901119890119901119904119901119908119901119899be the four neighbors of a point119901119894defined asshown in Figure 17 The parameter ℎ increases in accordancewith the distance between the sensor and the surface due tothe fact that the error of the sensor increases along the 119911-axis
Now let us assume that 119901119894 119901119890 119901119904 119901119908 and 119901119899 are indicesof the point cloud vector and that a 3D point V
119894can be
accessed in this way V119894larr 119875119871(index) If there is a hole in 119875
119871
the 119911 coordinates of the missing points are set to infin Giventhis structure the triangle mesh generation is accelerated asfollows
For each point 119894 in 119875119871 two candidate triangles are evalu-
ated individually according to the continuity criteria of theirvertices The criterion for the inclusion or rejection of a tri-angle consists in comparing the threshold ℎ mentioned pre-viously to the difference of the 119911-coordinates between pairsof points If the check is passed successfully the three-sidedpolygon is added to the mesh The triangles are defined asfollows 119879
1198981
[119895] larr triangle (V1 V2 V3) and 119879
1198982
[119895] larr
triangle (V1 V4 V5) where V
1= 119875119871(119894) V2= 119875119871(119890) V3= 119875119871(119904)
V4= 119875119871(119908) and V
5= 119875119871(119899) By using this technique the tri-
angulation process is performed rapidlyThe downside of themethod is the fact that it tends to leave small holes if there aremissing points in the point cloud
7 Experimental Evaluation
This section presents a series of experiments aimed to eval-uate the proposed sensing framework The first experimentassesses the tolerance of the sensors when they capture irreg-ular shapes of car body parts over simulated uneven surfacessuch as that in semicontrolled environmentsThe frameworkprovides point clouds of the different sections of the vehiclethe information is aligned and it is used to create a trianglemesh of the surface Thus the next experiment evaluates theperformance of the proposed mesh generation algorithmThis section closes with a qualitative evaluation of full 3Dreconstructions of lateral panels of real vehicles and largeobjects
12 Journal of Sensors
(a) (b)
(c)
Figure 16 Automatic detection of fourteen parts of interest over three different RGB images which correspond to different sections of avehicle (a) view from sensor119870
0
(b) sensor 1198702
and (c) sensor1198701
i e
n
s
w
Figure 17 2D representation of a 3D point cloud the 119911-coordinateof each point was removed The solid dot is a vertex 119894 shared by thetriangles (119894 119890 119904) and (119894 119908 119899)
In order to evaluate the capability of the system toreconstruct irregular surfaces amodel of a car doorwas usedas shown in Figure 6(a) and was imaged with a single Kinectsensor The model was designed for simulating the irregularcurves of an actual vehicle surface as well as folds and pleatsas shown in Figure 18(a) A set of salient points over thesurface of the doorwas selected to evaluate the accuracy of themethod Using these points a silhouette of the panel is builtFigure 18(a) shows the salient points in both the door modeland its reconstruction Five points of the outline representtight curves over the surface Additionally three small bumpswere added over the smooth part of the surface to be usedas reference points Figure 18(b) presents the results of con-structing the silhouettes for the door model using differentpoint cloudsThe data were collected with the sensor tilted atangles of 5 10 and 15 degrees with respect to the horizontallevel The sensor was positioned at 30 cm above the bottom
of the door and 15m from the closest point of the door Theuppermost points of the outlines were selected as a commonpoint for the alignment of the silhouettes
In Figure 18(b) the black line represents the actual shapeof the model Color lines represent results from the exper-iments under three different inclinations of the sensor withrespect to the objectThe error along the 119910 and 119911 coordinatesfor most of the points remains in the interval (0 plusmn18) cmwith respect to the actual door model which proves that thescanning system achieves a good degree of tolerance to irreg-ular leveling and alignment of the sensors The image shownin Figure 19 is the 3D reconstruction and 3D mesh of themock-up door For visualization purposes in this paper theQuadric Clustering decimation algorithm [24] was appliedover the triangle mesh to reduce the number of triangles
The next experiment was conducted to measure the per-formance of the proposed algorithm for triangle mesh gen-eration The results are compared in Table 3 with thoseobtained by using the Delaunay algorithm provided by theVisualization Toolkit library (VTK) [25] Sensors 119870
0 1198701
1198702were used to create three individual triangle meshes for
their corresponding bodywork region The results shown inTable 3 were obtained after running the algorithms 10 timesover each point cloud The difference in the results can beexplained by the fact that the Delaunay algorithm is designedto work with nonstructured 3D points while the proposedtechnique from Section 6 takes advantage of the rectangularlattice of 3D points produced by the Kinect sensors
Lastly experiments were conducted using the proposedscanning system and real vehicles In this test a full recon-struction of the lateral panels of different vehicles wasachieved to evaluate the capability of Kinect sensors to
Journal of Sensors 13
(a)
0
10
20
30
40
50
60
70
80
0 5 10 15(cm)
Model5
1015
(b)
Figure 18 (a) Profile of a car door model over which a set of salient points were selected to construct the outline of the surface for evaluationpurposes and (b) silhouette reconstruction with the sensor tilted at different angles
Figure 19 Triangle mesh of a mockup door model
Table 3 Comparison of algorithms performance for triangle meshgeneration
Vehiclepanel
Averagenumber ofvertices
Delaunayalgorithmaverage time
Proposed triangle meshgeneration algorithm
average timeFront 174687 309 sec 0086 secCentral 219286 365 sec 0171 secBack 217308 363 sec 0138 sec
perform in semiconstrained environments and over largeobjects exhibiting complex surface reflectance characteristics
Figure 20 Point cloud registration of three different lateral sectionsof a 4-door sedan vehicle
The first acquisitionwas performed in a semioutdoor parkinggarage over day time Natural light was present in the scenevia peripheral openings in the garage while the sensors wereprotected from direct sunlight by means of the concreteceiling Figure 20 shows a sample of 3D reconstruction resultsobtained with the proposed methodology and a network ofthree Kinect sensors for the vehicle depicted in Figure 1(b)This acquisitionwas performed over winter season in Canadaresulting in the vehiclersquos side panels being covered with dirtand salt deposits from the road conditions which createdvarious shades of green paint gray dirty areas and specularreflection spots from the overhead lighting present in theinstallation The raw information collected by each Kinectcan be distinguished by its color for the front central andback panels Figure 21 shows the complete 3D reconstructionresults after registration and fusion based on the calibrationphase performedwith the proposedmethodology For visual-ization purposes a decimation algorithmwas applied over themesh such that triangles are large enough to be visible Thisalso impacts on the apparent smoothness of the displayedmodel The 3D reconstruction is provided in the Stanford
14 Journal of Sensors
Figure 21 Resulting mesh for a Toyota Echo vehicle
K0K1
K2
K4
K3
Figure 22 Capturing 3D data over a vehicle with the network ofKinect sensors
Triangle Format [26] which is a convenient and standardwayto represent the information of 3Dmeshes and it can be usedeasily by a robot to plan its trajectory to approach the surface
For the next experiment the acquisitionwas performed inan indoor parking garage Figure 22 shows a vehicle standingin front of the experimental setup with 5 Kinect sensorsfor the rapid 3D modeling stage that will drive the roboticinspectionThe scene was illuminated by incandescent lampsand a halogen lamp
The reconstruction for two different types of vehicles isshown in Figures 23 and 24 In this case the texture cap-tured by the Kinectsrsquo RGB cameras is added to the recon-structed scene which provides a better appreciation of thereconstruction
The windshield lateral windows and part of headlampand rear lamp are missing in the depth maps because the IRenergy generated by the Kinect devices passes through thetransparent surfaces or is deflected in other directions How-ever the rear window of the minivan which is made of tintedglass is partially captured All of themain areas of the vehiclesbody and wheels including dark rubber tires are accuratelyreconstructed and sections of the model acquired from thefive viewpoints are correctly aligned even over narrow roofsupporting beams and highly curved bumpers areas
Table 4 presents a comparison between the characteristicsof the reconstructed vehicle and their actual dimensionsTheKinect depth quantization introduces scaling errors of about1 cm in height and width and a depth error of about 25 cm at3m distance Each sensor covers the full height of the vehicleand the average error on height is under 1The estimation ofthe length of the vehicle and the wheel base (ie the distancebetween the centers of the front and back wheels) involvesall the calibration parameters estimated for the network ofKinect sensorsThe error on the length is under 25which isrelativelyminor given themediumquality of data provided by
Figure 23 Six different views of a minivan vehicle 3D reconstruc-tion
Figure 24 Six different views of a semicompact vehicle 3D recon-struction
Table 4 Reconstruction compared with ground truth
Height Length Wheel baseCar
Actual (mm) 1460 4300 2550Model (mm) 1471 4391 2603Error () 075 211 207
VanActual (mm) 1748 5093 3030Model (mm) 1764 5206 3101Error () 091 221 234
Kinect at a depth of 3m and in proportion to the large work-ing volume For further assessment of the algorithm an ICPalgorithm [27] was applied on the point clouds but it did notsignificantly improve the registration over what was achievedwith the estimated calibration parameters This confirms theaccuracy of the initial calibration described in Section 4
Finally Figure 25 shows the reconstruction of othermod-els of vehicles along with that of some garbage bins acquiredwith the exact same setup to evaluate the generalization capa-bilities of the proposed calibrated RGB-D acquisition frame-work A wide range of vehicles was covered during experi-ments in terms of colors and size The white color vehicleappearsmore integrally than the vehicleswith dark gray colorwhere missing depth data are noticed over the front part onthe right of the vehicles where the density of points in theacquisition varies to a greater extent given the significant
Journal of Sensors 15
Figure 25 Reconstruction of various vehicles and garbage bins
change of alignment between Kinects 1198702and 119870
3 The dark
green garbage bins are also correctly reconstructed withproper alignment between the piecewise RGB-D models
The algorithms presented in this paper were developed inC++ and run on a computer with an Intel core i7 CPU andWindows 7The average time that the proposedmethod takesto reconstruct the 3D surface shape captured from each view-point for a regular vehicle is 40 secWith regards to the acqui-sition time the network of sensors collects the information intwo time slots to avoid interference the initialization of eachdevice takes between 1 and 2 seconds As a result the scanningand 3D textured modeling processes for the entire vehicle arecompleted within 30 seconds It is worth to say that most ofthat time is consumed by the subsystem for the visual detec-tion of parts of interest The calibration process is performedoff-line and the triangulation algorithm is run as the sensorsare collecting the depth information
The automated selection of regions of interest detailed inSection 5 allows for rapid extraction of subsets of the gener-ated 3D model over which further processing can be per-formed including higher resolution scanning if requiredover only limited but strategically selected surfaces in orderto drive a robotic operation with higher precision over thoseregions This proves an efficient strategy given that very highresolution acquisition and 3Dmodeling over an entire objectof the size of a vehicle would be prohibitive in time andresources
8 Conclusions
In this work a rapid acquisition and reconstruction method-ology for automated 3D modeling of large objects such asautomotive vehicles is presented The approach builds on anetwork of fast Kinect sensors distributed around the objectto collect color and depth information over lateral panels ofvehicles The 3D modeling results are meant to provide arobotic arm with sufficiently accurate spatial informationabout the bodywork of a vehicle and the 3D location of up tofourteen features of interest over the surface such that it caninteract with the automobile panels for various inspection ormaintenance tasks
This technology opens the door to a great number of real-time 3D reconstruction applications using low-cost RGB-Dsensors The main contributions of this work provide a reli-able methodology to integrate multiple color and depth
streams of data in the task of 3D reconstruction of largeobjects For that purpose an efficient method for completeand accurate calibration of all intrinsic and extrinsic parame-ters of RGB-D sensor units specifically tailored to the Kinectsensors technology is presented Furthermore an approachfor automated detection and recognition of critical regions ofinterest over vehicles from amosaic of Kinectrsquos color images isdetailed Finally an accelerated triangular mesh generationalgorithm is designed that takes advantage of the intrinsicstructure of range data provided by Kinect sensors to furtherspeed up the 3D model generation The entire framework isexperimentally validated under several operating conditionsincluding a laboratory environment and semicontrolledparking garages where acquisition and 3D reconstructionare performed over objects of various sizes including largevehicles The results demonstrate the validity accuracy andrapidity of the use of Kinectrsquos RGB-D sensors in the contextof robotic guidance The addition of extra sensors to achievefull 360 degree coverage of a vehicle represents the next stepof this investigation which will further extend the currentcapabilities
Conflict of Interests
The authors declare that there is no conflict of interests withany company or organization regarding the material dis-cussed in this paper
Acknowledgments
The authors acknowledge the support from the NaturalSciences and Engineering Research Council of Canada to thisresearch via the Strategic Project Grant no STPGP 381229-09as well as the collaboration of Scintrex Trace Corp
References
[1] J Zhou J Tong L Liu Z Pan and H Yan ldquoScanning 3D fullhuman bodies using kinectsrdquo IEEE Transactions on Visualiza-tion and Computer Graphics vol 18 no 4 pp 643ndash650 2012
[2] A Maimone and H Fuchs ldquoEncumbrance-free telepresencesystem with real-time 3D capture and display using commoditydepth camerasrdquo in Proceedings of the 10th IEEE InternationalSymposium on Mixed and Augmented Reality (ISMAR rsquo11) pp137ndash146 October 2011
[3] P J Noonan T F Cootes W A Hallett and R Hinz ldquoThedesign and initial calibration of an optical tracking system usingthe microsoft kinectrdquo in Proceedings of the IEEE Nuclear ScienceSymposium and Medical Imaging Conference (NSSMIC rsquo11) pp3614ndash3617 October 2011
[4] P Rakprayoon M Ruchanurucks and A Coundoul ldquoKinect-based obstacle detection for manipulatorrdquo in Proceedings ofthe IEEEESICE International Symposium on System Integration(SII rsquo11) pp 68ndash73 2011
[5] K Berger K Ruhl M Albers et al ldquoThe capturing of tur-bulent gas flows using multiple kinectsrdquo in Proceedings of theIEEE International Conference on Computer Vision Workshops(ICCV rsquo11) pp 1108ndash1113 Barcelona Spain November 2011
[6] J Smisek M Jancosek and T Pajdla ldquo3D with kinectrdquo inProceedings of the IEEE International Conference on Computer
16 Journal of Sensors
Vision Workshops (ICCV rsquo11) pp 1154ndash1160 Barcelona SpainNovember 2011
[7] C-S Park S-W Kim D Kim and S-R Oh ldquoComparison ofplane extraction performance using laser scanner and kinectrdquoin Proceedings of the 8th International Conference on UbiquitousRobots and Ambient Intelligence (URAI rsquo11) pp 153ndash155 SeoulKorea November 2011
[8] N Burrus ldquoDemo software to visualize calibrate and processkinect cameras outputrdquo 2012 httpnicolasburrusnameindexphpResearchKinectRgbDemoV6
[9] MGaffneyldquoKinect3D scanner calibration patternrdquo2011httpwwwthingiversecomthing7793
[10] K Berger K Ruhl Y Schroeder C Brummer A Scholz andM Magnor ldquoMarkerless motion capture using multiple color-depth sensorsrdquo in Proceedings of the Vision Modeling and Visu-alization pp 317ndash324 2011
[11] K Khoshelham ldquoAccuracy analysis of kinect depth datardquo inProceedings of the ISPRSWorkshop on Laser Scanning pp 1437ndash1454 2011
[12] S Matyunin D Vatolin Y Berdnikov and M Smirnov ldquoTem-poral filtering for depth maps generated by kinect depth cam-erardquo inProceedings of the 5th 3DTVConferenceTheTrueVision-Capture Transmission andDisplay of 3DVideo (3DTV-CON rsquo11)pp 1ndash4 May 2011
[13] S-M Kim Y-C Lee and S-C Lee ldquoVision based automaticinspection system for nuts welded on the support hingerdquo in Pro-ceedings of the SICE-ICASE International Joint Conference pp1508ndash1512 October 2006
[14] S Agarwal A Awan andD Roth ldquoLearning to detect objects inimages via a sparse part-based representationrdquo IEEE Transac-tions on Pattern Analysis andMachine Intelligence vol 26 no 11pp 1475ndash1490 2004
[15] A Kiryakov B Popov I Terziev D Manov and D OgnyanoffldquoSemantic annotation indexing and retrievalrdquo Journal of WebSemantics vol 2 no 1 pp 49ndash79 2004
[16] P Viola and M Jones ldquoRapid object detection using a boostedcascade of simple featuresrdquo in Proceedings of the IEEE ComputerSociety Conference on Computer Vision and Pattern Recognition(CVPR rsquo01) pp I511ndashI518 Kauai Hawaii USA December 2001
[17] Y-F Fung H Lee and M F Ercan ldquoImage processing applica-tion in toll collectionrdquo IAENG International Journal of ComputerScience vol 32 pp 473ndash478 2006
[18] M M Trivedi T Gandhi and J McCall ldquoLooking-in andlooking-out of a vehicle computer-vision-based enhanced vehi-cle safetyrdquo IEEE Transactions on Intelligent Transportation Sys-tems vol 8 no 1 pp 108ndash120 2007
[19] Z Zhang ldquoA flexible new technique for camera calibrationrdquoIEEE Transactions on Pattern Analysis andMachine Intelligencevol 22 no 11 pp 1330ndash1334 2000
[20] Open Source Computer Vision Library httpopencvwillow-garagecomwiki
[21] Real-time Computer Graphics and Physics MathematicsGeometry Numerical Analysis and Image Analysis ldquoGeom-etrictoolsrdquo httpwwwgeometrictoolscomLibMathematicsApproximationApproximationhtml
[22] A Chavez-Aragon R Laganiere and P Payeur ldquoVision-baseddetection and labelling of multiple vehicle partsrdquo in Proceedingsof the IEEE International Conference on Intelligent Transporta-tion Systems pp 1273ndash1278 Washington DC USA 2011
[23] M De Berg O Cheong M Van Kreveld and M OvermarsldquoDelaunay triangulations height interpolationrdquo in Compu-tational Geometry Algorithms and Applications pp 191ndash218Springer 3rd edition 2008
[24] P Lindstrom ldquoOut-of-core simplification of large polygonalmodelsrdquo in Proceedigs of the 27th Annual Conference on Com-puter Graphics and Interactive Techniques (SIGGRAPH rsquo00) pp259ndash262 July 2000
[25] The Visualization Toolkit VTK httpwwwvtkorg[26] StanfordTriangle FormaPLY httpwwwcsvirginiaedusimgfx
Courses2001Advancedspring01plylibPlytxt[27] P J Besl and N D McKay ldquoA method for registration of 3-
D shapesrdquo IEEE Transactions on Pattern Analysis and MachineIntelligence vol 14 no 2 pp 239ndash256 February 1992
International Journal of
AerospaceEngineeringHindawi Publishing Corporationhttpwwwhindawicom Volume 2014
RoboticsJournal of
Hindawi Publishing Corporationhttpwwwhindawicom Volume 2014
Hindawi Publishing Corporationhttpwwwhindawicom Volume 2014
Active and Passive Electronic Components
Control Scienceand Engineering
Journal of
Hindawi Publishing Corporationhttpwwwhindawicom Volume 2014
International Journal of
RotatingMachinery
Hindawi Publishing Corporationhttpwwwhindawicom Volume 2014
Hindawi Publishing Corporation httpwwwhindawicom
Journal ofEngineeringVolume 2014
Submit your manuscripts athttpwwwhindawicom
VLSI Design
Hindawi Publishing Corporationhttpwwwhindawicom Volume 2014
Hindawi Publishing Corporationhttpwwwhindawicom Volume 2014
Shock and Vibration
Hindawi Publishing Corporationhttpwwwhindawicom Volume 2014
Civil EngineeringAdvances in
Acoustics and VibrationAdvances in
Hindawi Publishing Corporationhttpwwwhindawicom Volume 2014
Hindawi Publishing Corporationhttpwwwhindawicom Volume 2014
Electrical and Computer Engineering
Journal of
Advances inOptoElectronics
Hindawi Publishing Corporation httpwwwhindawicom
Volume 2014
The Scientific World JournalHindawi Publishing Corporation httpwwwhindawicom Volume 2014
SensorsJournal of
Hindawi Publishing Corporationhttpwwwhindawicom Volume 2014
Modelling amp Simulation in EngineeringHindawi Publishing Corporation httpwwwhindawicom Volume 2014
Hindawi Publishing Corporationhttpwwwhindawicom Volume 2014
Chemical EngineeringInternational Journal of Antennas and
Propagation
International Journal of
Hindawi Publishing Corporationhttpwwwhindawicom Volume 2014
Hindawi Publishing Corporationhttpwwwhindawicom Volume 2014
Navigation and Observation
International Journal of
Hindawi Publishing Corporationhttpwwwhindawicom Volume 2014
DistributedSensor Networks
International Journal of
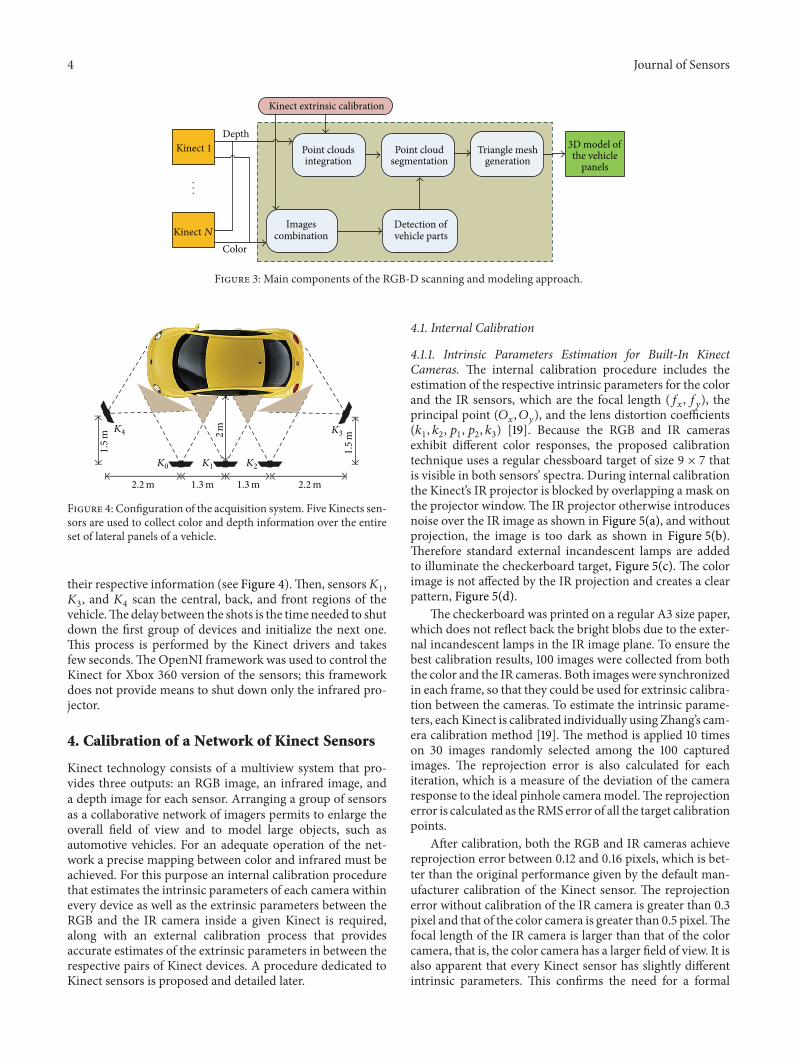
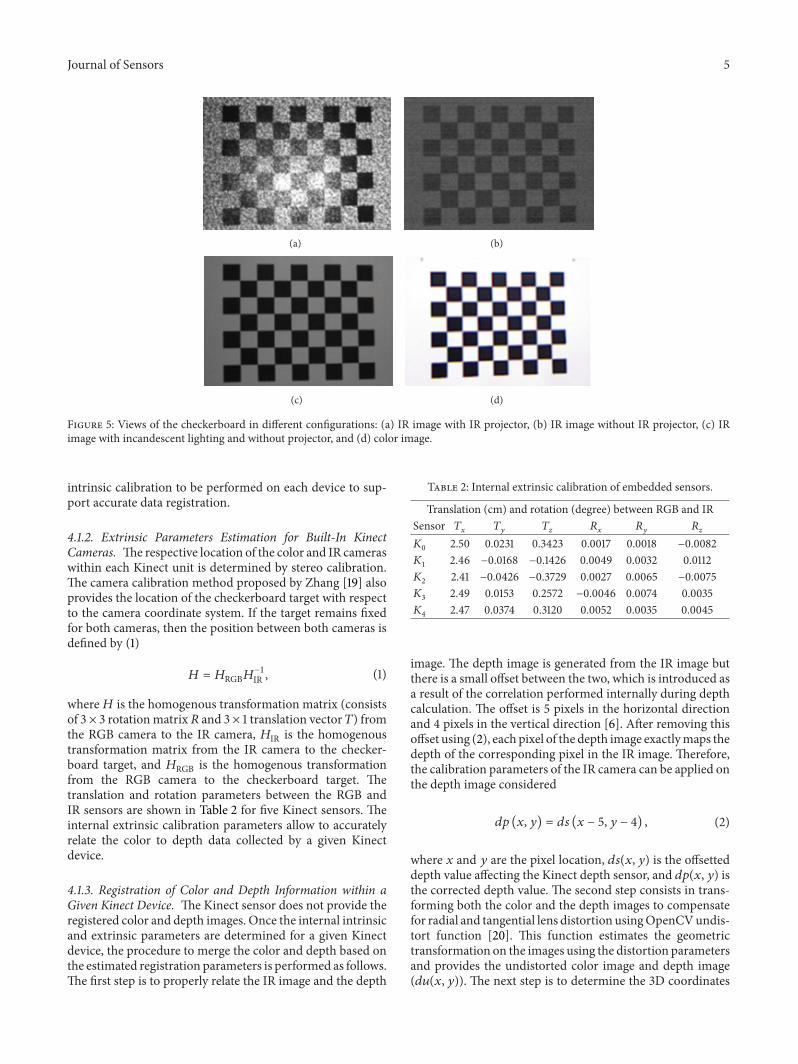
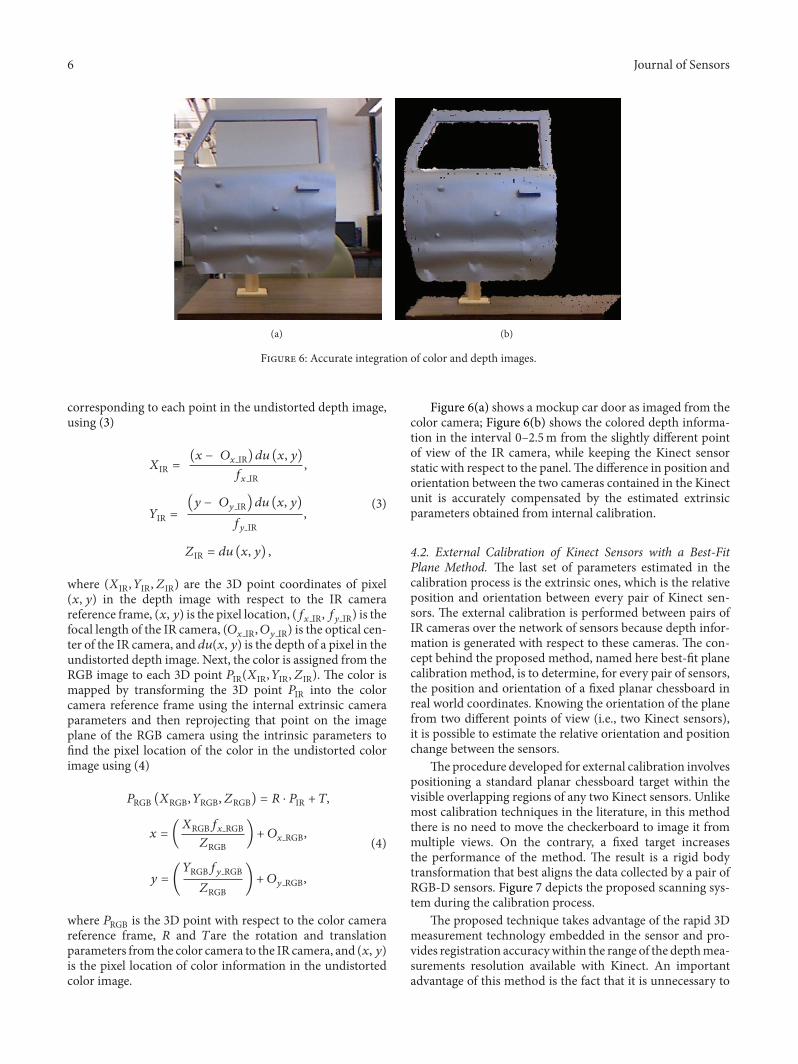
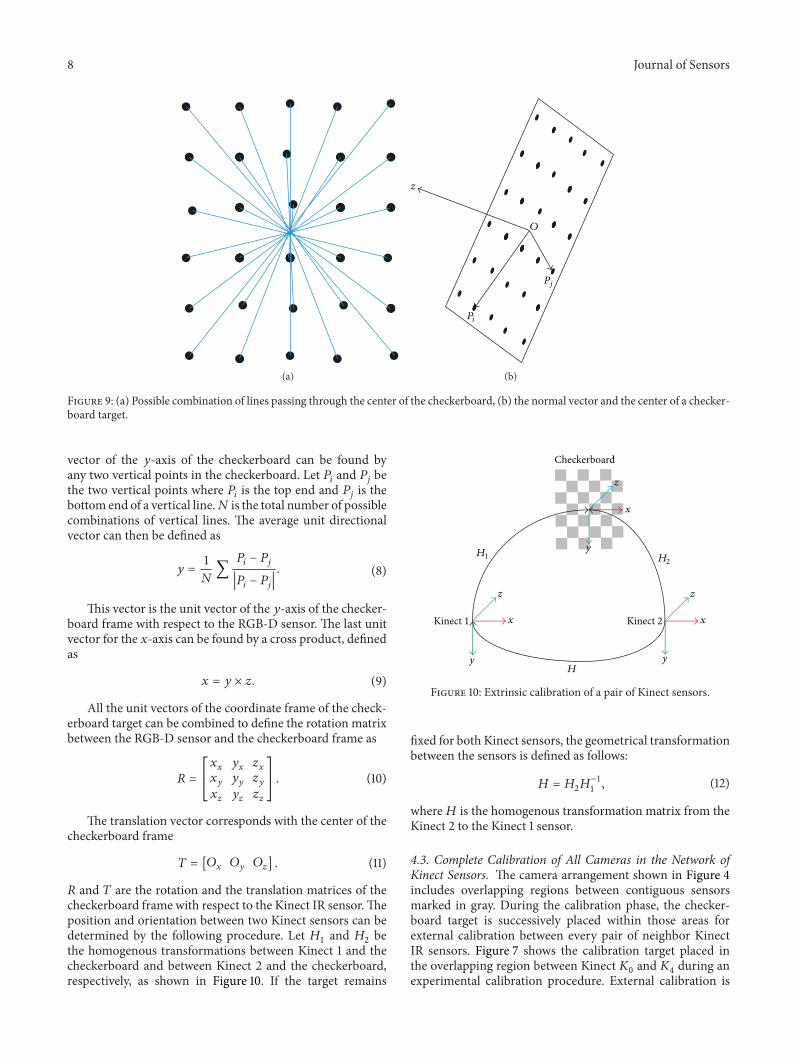
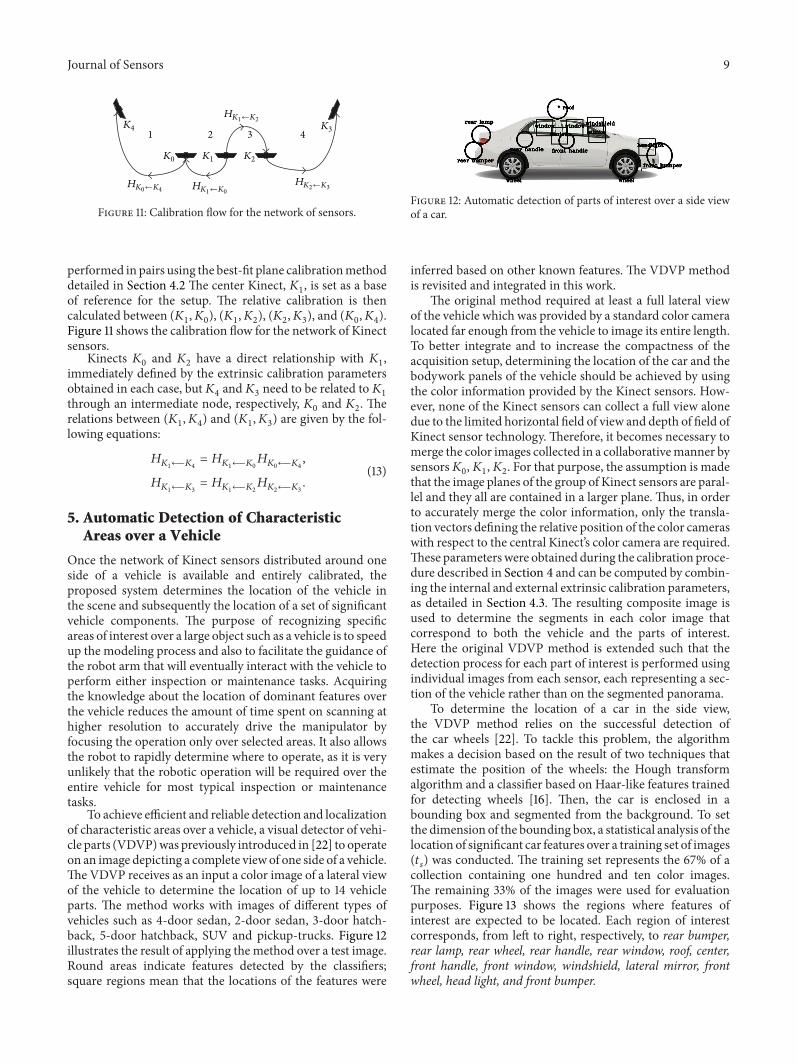
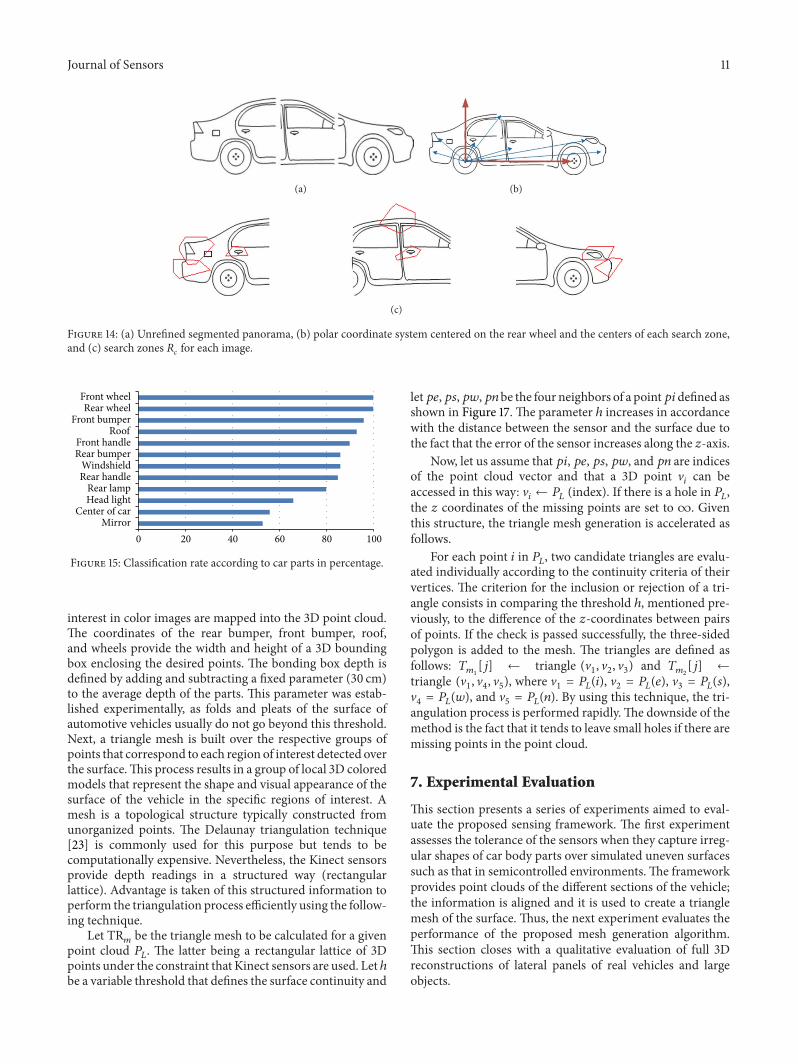
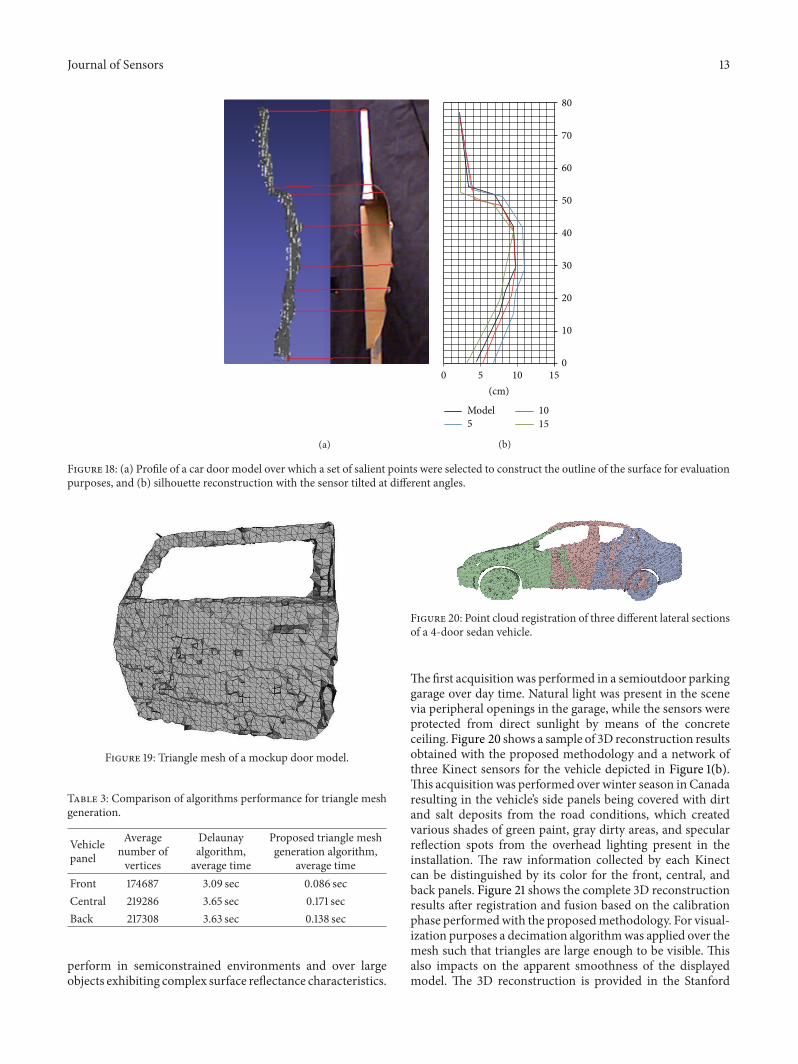
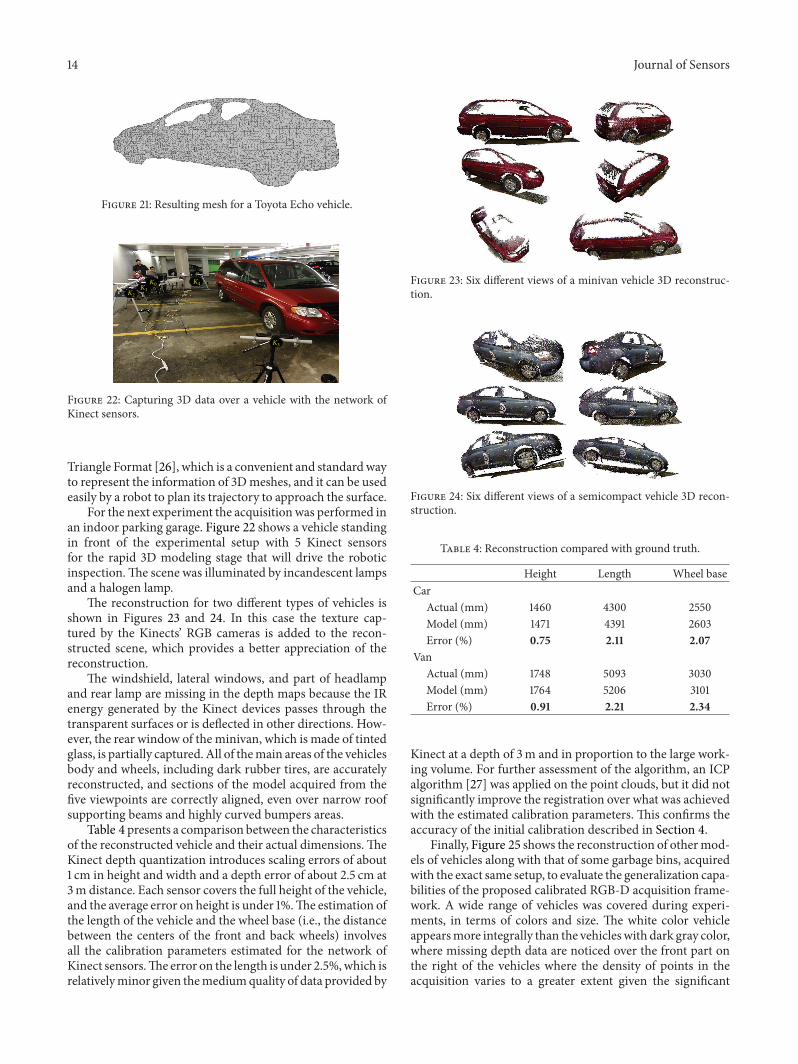

International Journal of
AerospaceEngineeringHindawi Publishing Corporationhttpwwwhindawicom Volume 2014
RoboticsJournal of
Hindawi Publishing Corporationhttpwwwhindawicom Volume 2014
Hindawi Publishing Corporationhttpwwwhindawicom Volume 2014
Active and Passive Electronic Components
Control Scienceand Engineering
Journal of
Hindawi Publishing Corporationhttpwwwhindawicom Volume 2014
International Journal of
RotatingMachinery
Hindawi Publishing Corporationhttpwwwhindawicom Volume 2014
Hindawi Publishing Corporation httpwwwhindawicom
Journal ofEngineeringVolume 2014
Submit your manuscripts athttpwwwhindawicom
VLSI Design
Hindawi Publishing Corporationhttpwwwhindawicom Volume 2014
Hindawi Publishing Corporationhttpwwwhindawicom Volume 2014
Shock and Vibration
Hindawi Publishing Corporationhttpwwwhindawicom Volume 2014
Civil EngineeringAdvances in
Acoustics and VibrationAdvances in
Hindawi Publishing Corporationhttpwwwhindawicom Volume 2014
Hindawi Publishing Corporationhttpwwwhindawicom Volume 2014
Electrical and Computer Engineering
Journal of
Advances inOptoElectronics
Hindawi Publishing Corporation httpwwwhindawicom
Volume 2014
The Scientific World JournalHindawi Publishing Corporation httpwwwhindawicom Volume 2014
SensorsJournal of
Hindawi Publishing Corporationhttpwwwhindawicom Volume 2014
Modelling amp Simulation in EngineeringHindawi Publishing Corporation httpwwwhindawicom Volume 2014
Hindawi Publishing Corporationhttpwwwhindawicom Volume 2014
Chemical EngineeringInternational Journal of Antennas and
Propagation
International Journal of
Hindawi Publishing Corporationhttpwwwhindawicom Volume 2014
Hindawi Publishing Corporationhttpwwwhindawicom Volume 2014
Navigation and Observation
International Journal of
Hindawi Publishing Corporationhttpwwwhindawicom Volume 2014
DistributedSensor Networks
International Journal of