research article the usability of volcanic rocks from
TRANSCRIPT
593
Sigma J Eng & Nat Sci 35 (4), 2017, 593-608
Research Article THE USABILITY OF VOLCANIC ROCKS FROM UPPER EUPHRATES PART IN THE EASTERN ANATOLIA REGION AS CONCRETE AGGREGATE Yavuz Selim AKSÜT*1, Şükrü YETGİN2
1Gümüshane University, Department of Civil Engineering, GÜMÜŞHANE; ORCID:0000-0002-4568-3605 2Gümüshane University, Department of Civil Engineering, GÜMÜŞHANE; ORCID:0000-0002-3641-4091 Received: 15.03.2017 Revised: 21.04.2017 Accepted: 28.06.2017 ABSTRACT In this study; the engineering properties of volcanic rocks obtained from four different quarries in the province of Erzincan region in the Upper Euphrates Part in the Eastern Anatolia Region were investigated. In laboratory studies, the experiments including bulk and aggregate tests (bulk and dense unit weight, specific mass, water absorption, Los Angeles test for resistance to wear, freezing resistance and uniaxial compressive strength) were conducted on 5 volcanic samples according to the standards (Turkish Standard, British Standard and ASTM) and in the second stage, grading of concrete tests (grading of the concrete aggregates, concrete preparation, slump test, specific density of concrete, uniaxial compressive strength, modulus of elasticity, splitting tensile strength, abrasion resistance and capillarity) were performed on the concrete samples with volcanic aggregates. For fresh concrete composition, water/cement ratio was selected as the main variable providing homogeneous mixing and the highest strength to the concrete samples with a specific granulometry. Cylindrical concrete samples were produced with a variety of water/cement ratios cured for 7 and 28 days in water and their compressive strengths were assessed in the light of their physical and mechanical properties. The results obtained from aggregates and concrete tests, which were performed in line with the standards showed that especially Yassıtepe-Doğu (YTD) sample, one of the volcanic rocks from Erzincan region can be used as concrete aggregate. It was observed that compressive strength of the concrete samples could satisfy C25/30 strength class and upper classes. In addition, it was understood that they can be used in highways, bridges, dams, buildings etc., especially as structural concrete. Keywords: Aggregate, concrete, w/c ratio, uniaxial compressive strength, volcanic rocks. 1. INTRODUCTION
This article discusses the usability of volcanic rock types from Uzumlu region in the province of Erzincan as crushed stone aggregate in concrete technology. These materials containing plagioclase, proxene, amphibole and biotite minerals are characterized as andesitic rocks in terms of their general characteristics (Wilson, 2004; Waters, 1955; Beard, 1986). This variety of rocks is equivalent to diorites, which have high mechanical properties as gabbro. Their particle density is usually in the range of 2.40 to 2.90 kg/dm3, while their compressive strength is in the range of 70 to 150 N/mm2 (Key, 1987; Tahirkheli et al., 2012; Irvine and Baragar, 1971; Cox et al., 1979).
* Corresponding Author: e-mail: [email protected], tel: (456) 233 10 00 / 1629
Sigma Journal of Engineering and Natural Sciences
Sigma Mühendislik ve Fen Bilimleri Dergisi
594
However, they also h ave varieties that exceed these limits. In this study, compressive strength, which is considered as the most important indicator of the quality of concrete and, the w/c ratio directly affecting the main indicator as well as aggregate properties were addressed.
As in all regions of Turkey, rapid development takes place in Eastern Anatolia Region and the province of Erzincan, which is located in that region. Also, considering that the province of Erzincan is in 1st degree earthquake zone, it is inevitable that existing supplies of aggregate are increased and diversified in order to produce concrete with better quality and sufficient strength and meet the growing need for structures.
In the province of Erzincan, crushed stone aggregates are supplied from several stone quarries and natural aggregates are obtained from Karasu creek, a branch of the Euphrates River. Considering that Erzincan is in an active seismic zone, the aim of this study was to contribute to quality concrete production in the region and accordingly offer an alternative to natural river aggregates and crushed stone aggregates produced from lime stone. Additionally, volcanics do not contain alkaline-earth components, making them more resistant under environmental effects.
The aim of this study was to identify superior and unsatisfactory physical and mechanical properties, primarily mineralogical and petrographic properties of rocks consisting of andesites, basaltic andesites and trachyandesites of Erzincan volcanic rocks from Uzumlu region and investigate whether these materials can be used as raw materials in concrete production. Within the scope of laboratory studies, in the first stage, aggregate tests were conducted in accordance with the standards in order to identify the properties of the aggregates and in the second stage, concrete samples with 6 different water/cement (w/c) ratios using volcanics with superior properties (YTD) were prepared. Additionally, comparisons were made according to fresh and hardened concrete test results after 7- or 28-day curing time.
The quarries from this region were selected because rubbles and andesite blocks are currently produced in these quarries and residual stones with andesite component, which cannot be utilized in block operation, can be used as aggregates. Another reason for choosing these quarries is the ease of accessibility.
2. MATERIAL AND METHOD 2.1. Aggregate Supply and Geolocation
Aggregate supply is located in the vicinity of Uzumlu county, about 30 km east of the provincial center of the province of Erzincan, in Upper Euphrates Part in the Eastern Anatolia Region. The study site, which is situated between 1/25000 scale Erzincan I43 c1-d2 sheets, is between 4392-4397 northern latitudes and 5560-5630 east longitudes and covers an area of approximately 40 km2. Volcanic rocks covered by the present study (Erzincan volcanics) are generally observed in several hills with little elevation. These hills, including Koy Tepe (KT, 1563 m), Yassı Tepe (YTD and YTB, 1326 m), Tatoglu Tepe (TT, 1334 m) and Iraduh Tepe (IT, 1549 m), are situated in different directions about 5 to 10 km away from the county center (Figure 1).
Y.S. Aksüt, Ş. Yetgin / Sigma J Eng & Nat Sci 35 (4), 593-608, 2017

595
Figure 1. 3D Satellit e images of study area (URL-1).
2.2. Experiments
This study consisted of two phases. In the first phase, volcanic rocks were obtained from stone quarries in Uzumlu county in the province of Erzincan (Figure 2) and their mineralogical-petrographic and chemical characteristics were examined. In further phases, adequate amounts of volcanic samples were collected, crushed to aggregate size and analyzed to determine their physical and mechanical properties. In the second phase, volcanic aggregate samples with superior petrographic, chemical, physical and mechanical properties were taken to prepare concrete samples with various w/c ratios, and the characteristics of the concrete samples were investigated with fresh and hardened concrete tests.
Figure 2. Simplified geological map of the Erzincan Basin showing the Quaternary volcanic domes (Karslı, 2006)
2.3. Rock Properties 2.3.1. Chemical Properties
According to chemical data reported in previous studies (Karsli, 2006; Gucer, 2008), in volcanic rocks from the quarries located in Uzumlu region, mean percentage by mass of silicon
The Usability of Volcanic Rocks from Upper … / Sigma J Eng & Nat Sci 35 (4), 593-608, 2017

596
oxide was in the range of 56.0 to 71.0%, aluminum oxide 13.5-17.50%, iron oxide 2.0-6.50% and potassium oxide 1.5-4.0%. According to the classification made by SiO2 content of the samples only, they were found to be andesite, basaltic andesite and trachyandesite. 2.3.2. Evaluation of Thin Sections
Igneous rock samples taken from the quarries in the study area were turned into thin section samples, which were then examined under a microscope in order to determine their textures and mineralogical compositions (Figure 3).
Figure 3. Thin section analysis of volcanic rocks; a) Iraduhtepe b) Köytepe c) Tatoğlutepe d) Yassıtepe west side e) Yassıtepe east side
In Nikon's Eclipse brand polarizing research microscope, as a result of petrographic
examination performed in single and double polars (under natural and polarized light) in 10x10 and 10x40 lense magnification, vitrophyric porphyritic, microlitic porphyritic and glomero porphyritic textures were observed, whereas in some andesitic volcanics, glass-like and poikilitic textures were observed. In mineralogical composition of andesites, plagioclase, amphibole, pyroxene and opaque minerals were identified and the rocks were established as andesite, basaltic andesite and trachyandesite (Table 1).
Y.S. Aksüt, Ş. Yetgin / Sigma J Eng & Nat Sci 35 (4), 593-608, 2017

597
Table 1. Petrographic characteristics of Üzümlü (ERZİNCAN) region volcanic rocks
Sample No
Sample Source
Macroscopic Properties
Texture Mineral components (% m) Volcanic name
1 Tatoğlu tepe
Dark grey massive structure
Vitrophyric porphyritic texture
Plagioclase:15-20 Opaque:1-2 Amphibole:6-7 Paste:70-75
Andesite
2 Iraduh tepe
Light grey massive structure
Microlitic porphyritic texture
Plagioclase:20-25 Opaque:1-2 Amphibole:8-10 Paste:60-65
Andesite
3 Yassı tepe West
Dark grey massive structure
Microlitic porphyritic texture
Plagioclase:8-10 Opaque:1-2 Amphibole:5-6 Paste:80-85
Trachy Andesite
4 Köy tepe
Tile red massive structure
Vitrophyric porphyritic texture
Plagioclase:8-10 Opaque:1-2 Amphibole:6-7 Paste:80-85
Andesite
5 Yassı tepe east
Dark grey massive structure
Glomero porfirik texture
Plagioclase:18-20 Opaque:1-2 Amphibole:10-12 Paste:55-60 Biotite:5-6 Pyroxene:2-3
Basaltic Andesite
2.3.3. Physical and Mechanical Properties
Physical and mechanical properties of volcanic rock samples collected from 4 individual hills (volcanic domes) were established by laboratory tests conducted according to TS 699 (2009) standard. Properties are tested on aggregates including compacted and loose bulk density, specific gravity, dry and saturated density, water absorption by mass, void ratio, surface abrasion and durability against frost effects. The results of physical and mechanical tests are given in Table 2.
Table 2. Physical and mechanical test results of the aggregates obtained from rocks
Test title Physical and Mechanical Properties of Rocks
Sample No TD YDW YDE ID KD
Dense unit mass (g/cm3) 1.51 1.61 1.63 1.54 1.41
Loose unit mass (g/cm3) 1.34 1.41 1.42 1.37 1.29
Dry unit mass (g/cm3) 2.12 2.42 2.44 2.28 1.91
Saturated unit mass (g/cm3) 2.25 2.52 2.55 2.39 2.12
Unit mass (g/cm3) 2.41 2.62 2.65 2.52 2.33
Water absorption (% m) 4.07 2.33 2.04 3.47 6.0
Porosity (% v) 8.63 5.64 4.97 7.91 11.46
Freezing loss ‘‘Na2SO4’’ (% m) 6.53 3.76 2.39 4.96 9.78
Abrasion loss (Los Angeles. % m)
33.14 26.38 21.65 30.79 38.20
Uniaxial compressive strength (Cube sample, N/mm2)
78.12 86.12 92.23 80.16 71.08
When compressive strength and porosity values of the volcanic rocks are taken into account,
these rocks were found to be included in a variety of rock classifications. Uniaxial compressive
The Usability of Volcanic Rocks from Upper … / Sigma J Eng & Nat Sci 35 (4), 593-608, 2017

598
strength tests were conducted on the samples with, 10x10x10 cm dimensions, at a loading rate of 0.1 (N/mm2)/s in accordance with TS 699. Average compressive strength values of cubic rock samples were in the range of 71.08 N/mm2 (KT) to 92.23 N/mm2 (YTD). According to these values, the samples fall into medium strength rock class (Table 3).
Table 3. Classification by uniaxial compressive strength (Deer and Miller, 1966).
Rock form Uniaxial Compressive Strength (N/mm2)
Very Low Resistive <25
Low Resistive 25-50
Mid-Resistive 50-100
High Resistive 100-200
Very High Resistive >200
2.4. Concrete Components 2.4.1. Aggregate
In this study, volcanic rocks of YTD, which have more reasonable values than the other aggregate samples taken from volcanic domes in terms of petrographic, chemical, physical and mechanical properties, were used as aggregates to produce concrete. The rocks were crushed using a crusher and sieved until their size came down to concrete aggregate size of which is Dmax=22.4 mm, as indicated in EN 12620 and TS 802 standards. Then they were classified in 3 groups in the ranges of 0-4; 4-11.2 and 11.2-22.4 mm (Figure 4).
Figure 4. Grouping according to size distrubition of the aggregate used in concrete production; a- 1.Group (0-4 mm), b- 2.Group (4-11.2 mm), c- 3.Group (11.2-22.4 mm).
The resulting particle size distribution was compared with standard curves specified in TS
802 and is graphically shown with red color in Figure 5. It is clear that the resulting particle size distribution with a fineness modulus of k=4.05, the existing particle size distribution is expected to show a satisfactory level of continuity and compactness, which are required for concrete strength.
Y.S. Aksüt, Ş. Yetgin / Sigma J Eng & Nat Sci 35 (4), 593-608, 2017

599
Figure 5. Particle size distribution of the aggregate used in concrete production
2.4.2. Cement
In this study, CEM I 42.5 R type cement in compliance with EN 197-1 (2012) was used as binding material in the production of concrete samples (Table 4) at all the stages.
Table 4. The chemical composition and mechanical properties of cement
Chemical properties Physical properties SiO2, % m 18.51 The insoluble residue, % m 0.86 Al2O3, % m 4.23 45 Micron Sieve Residue, % m 2 Fe2O3, % m 3.38 90 Micron Sieve Residue, % m 0 CaO, % m 60.46 Specific surface (Blaine, cm2/g) 3627 MgO, % m 2.79 Initial setting time (min.) 195 SO3, % m 3.11 Final setting time (min.) 240 Loss on ıgnition, % m 3.53 Specific gravity(g/cm3) 3.10 Na2O, % m 0.33 Expansion (Le Chatelier - mm) 1 K2O, % m 0.74 Standard water content, % m 30.7 Cl, % m 0.0106 Strength Total, % m 97.42 1 Day (N/mm2) 13.1 Unmeasurable, % m 2.58 2 Days (N/mm2) 28 Free lime, % m 0.68 28 Days (N/mm2) 57.8
2.4.3. Water and Admixture
In this study, tap water was used as mixing water. Normal plasticiser, which acts by preventing agglomeration of cement grains by entraining air into concrete, was used as plasticizing admixture.
2.5. Production of Concrete Samples
Mix design of concrete was made according to TS 802 (similar to ACI 613). The amounts of components in 1 m3 of compacted concrete, as specified in the respective standard, were used to
The Usability of Volcanic Rocks from Upper … / Sigma J Eng & Nat Sci 35 (4), 593-608, 2017

600
prepare the concrete samples with various w/c ratios (Table 5). Trial mixes were prepared and tested to verify the amounts of cement, mixing water, aggregates and admixtures and hence decide on whether they're satisfactory or not.
Table 5. Concrete components at different w/c ratios in 1 m3 volume (dm3/m3)
Concrete Components
w/c=35 (%)
w/c =40 (%)
w/c =45 (%)
w/c =50 (%)
w/c =55 (%)
w/c =60 (%)
Water 218 218 218 218 218 218
Cement 202 177 157 142 129 118
Air 20 20 20 20 20 20
Aggregate 560 586 604 620 633 644
0/4 274 287 296 304 310 316
4/11.2 168 176 181 186 190 193
11.2/22.4 118 123 127 130 133 135
Total 1000 1000 1000 1000 1000 1000
3. RESULTS AND DISCUSSION 3.1. Aggregates Used
Yassı Tepe Doğu (YTD) rock, one of the 5 volcanics samples collected from Uzumlu region, is a basaltic andesite rock. This rock has a compressive strength of 92.23 N/mm2, which is higher compared to others, and a water absorption percentage of 2.04%, which is smaller than the other aggregates. Thus, it has a higher freeze-thaw resistance. This material has a dry unit mass of 2.44 g/cm3 and compact structured aggregate with a porosity of 4.97% water absorption test result. Although this rock, with an abrasion loss (Los Angeles) of 21.65% (Table 2) by mass, is more resistant than other rock samples, its abrasion resistance is quite low, compared to other compact structured rock such as basalt or granite. The abrasion resistance of this material is classified as LA25 (TS EN 1097-2), its freeze-thaw resistance is 2.39% by mass, which is in MS18 class, considered a good level of resistance according to EN 1367 b1.2.
Rock source of aggregate, with a compressive strength of ≥100 N/mm2, is considered mechanically unproblematic, while with a compressive strength of ≥150 N/mm2 and a water absorption percentage of ≤ 0.5%, it's considered resistant to freeze-thaw effect (Klausen et al., 2013). Although YTD rock, which was selected as the source of aggregate for concrete experiments, does not have the preferred properties, it yielded satisfactory results in freeze-thaw test as well as concrete compressive strength test. In this context, it was established that crushed stone aggregate, with its compact structure and continuous grading, has favorable properties for concrete production. 3.2. Fresh Concrete
Two individual slump tests were performed for each concrete group with a different w/c ratio, and consistency of fresh concrete was determined with average slump values (Figure 6). In
Y.S. Aksüt, Ş. Yetgin / Sigma J Eng & Nat Sci 35 (4), 593-608, 2017

601
general, slump value increased with increasing w/c ratio. Thus, a linear slump relationship by w/c ratio was found between the concrete groups.
Figure 6. Slump values by different w/c ratios for fresh concrete (consistency).
Slump height decreased with decreasing w/c ratio in case of increasing ratios of plasticizer material. However, it would be not true to say that slump test is an accurate indicator of workability and compaction. It is known that a good degree of compaction efficiency can be achieved with a moderate level of energy application (vibration) and plasticizer in thick consistency. Indeed, fresh concrete with a unit mass of about 2291.0 kg/m3 could be achieved with the lowest w/c ratio (35%). On the other hand, decrease in unit mass, which corresponds to only 3%, was only about 70 kg/m3 at the highest w/c ratio (60%) (Table 6) This result demonstrates that a satisfactory consistency was achieved in terms of workability. A similar mass relationship is clearly present among hardened concrete samples (Table 6). Measured unit mass values of fresh concrete samples were in the range of 2221.8 to 2290.9 kg/m3.
Table 6. Fresh and hardened concrete densities
w/c Ratio (% m)
Fresh concrete density (kg/m3)
Hardened concrete density (kg/m3)
35 2290.9 2278.6
40 2270.3 2255.6
45 2248.7 2232.8
50 2237.4 2219.8
55 2230.5 2211.3
60 2221.8 2198.5 3.3. Hardened Concrete 3.3.1. Physical characteristics
Hardened unit mass values of concrete samples prepared in a variety of w/c ratios were determined on 100x200 mm standard cylinder samples, and the results are given in Table 6. Unit
y = 0.4343x - 14.629R² = 0.9941
0123456789
101112
35 40 45 50 55 60
w/c Ratio (% m)
Hei
ght o
f sl
ump
(cm
)
The Usability of Volcanic Rocks from Upper … / Sigma J Eng & Nat Sci 35 (4), 593-608, 2017

602
mass values of hardened concrete samples were in the range of 2198.5 to 2278.6 kg/m3. Saturated and dry unit mass values, water absorption and porosity values of the concrete samples are given in Table 7. In general, saturated and dry unit mass values decreased and water absorption and porosity values increased with increasing w/c ratio. This is attributed to the fact that concrete acquires a more porous structure with increasing w/c ratio. Moreover, porosity values correlated with the amount of absorbed water.
Table 7. The physical properties of hardened concrete
w/c ratio (%) 35 40 45 50 55 60
Saturated unit mass (kg/dm3)
2.32 2.31 2.26 2.22 2.16 2.15
Dry unit mass (kg/dm3)
2.23 2.21 2.14 2.09 2.06 2.01
Water absorption (% m)
4.04 4.62 5.35 6.64 6.91 6.95
Porosity (% v) 5.32 5.71 5.89 6.95 7.30 7.40
3.3.2. Compressive Strength
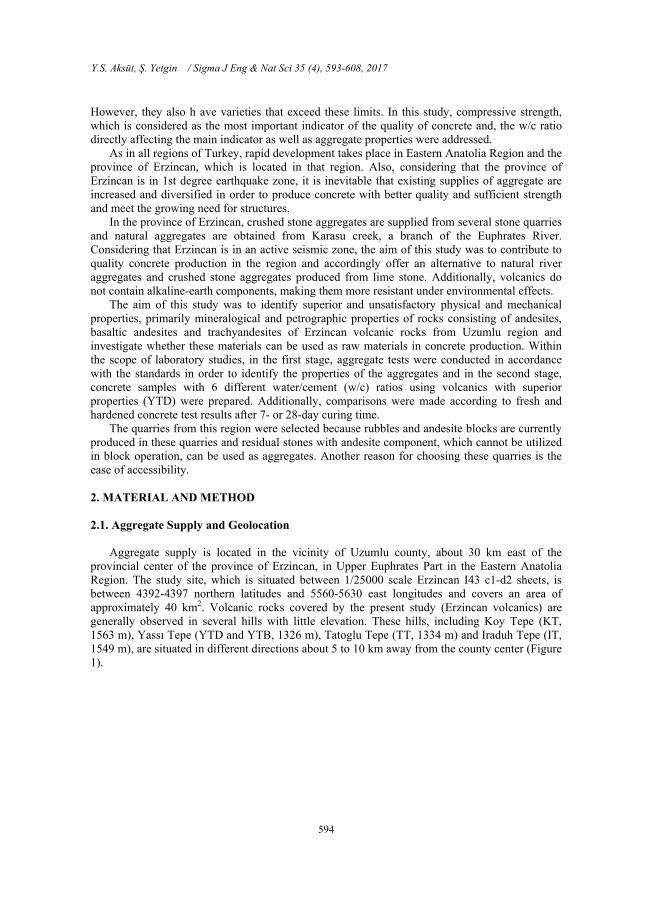
Uniaxial compressive strength test according to TS EN 12390-3 standard was employed to determine compressive strength of the concrete on 100x200 mm standard cylinder samples which are 3 specimens in each series with various w/c ratios on day 7 and day 28. The results are given in both tabulated (Table 8) and graph form (Figure 7).
Table 8. Compressive strengths of concrete specimens in 7 and 28 day
w/c ratio (% m)
Compressive Strength (N/mm2)
7 Days 28 Days
35 36.65 43.91
40 34.95 41.76
45 33.94 38.88
50 30.09 35.94
55 23.96 28.01
60 22.69 25.97
Figure 7 shows that compressive strength increased almost linearly with decreasing w/c ratio.
In general, compressive strength was maintained by a percentage above 80% between day 7 and day 28. Considering the classification of the cement used (CEM I 42.5R), it is clear that the results with varying w/c ratio were fully comparable to those of concrete with normal strength. Thus, The results of 28-day compressive strength test performed on cylinder sample were in the range of 25.0 N/mm2 to 44.0 N/mm2, which can be identified in concrete strength classifications of C20/25 to C40/50 according to the results of 28-day compressive strength test performed on cylinder sample. It's clear from compressive strength values (Figure 7) that compressive strengths
Y.S. Aksüt, Ş. Yetgin / Sigma J Eng & Nat Sci 35 (4), 593-608, 2017
603
of all concrete groups increased by curing time. In addition, concrete compressive strength values on day 7 correspond to approximately 85% of those on day 28.
Figure 7. Compressive strength of concrete specimens at 7 and 28 days 3.3.3. Modulus of Elasticity
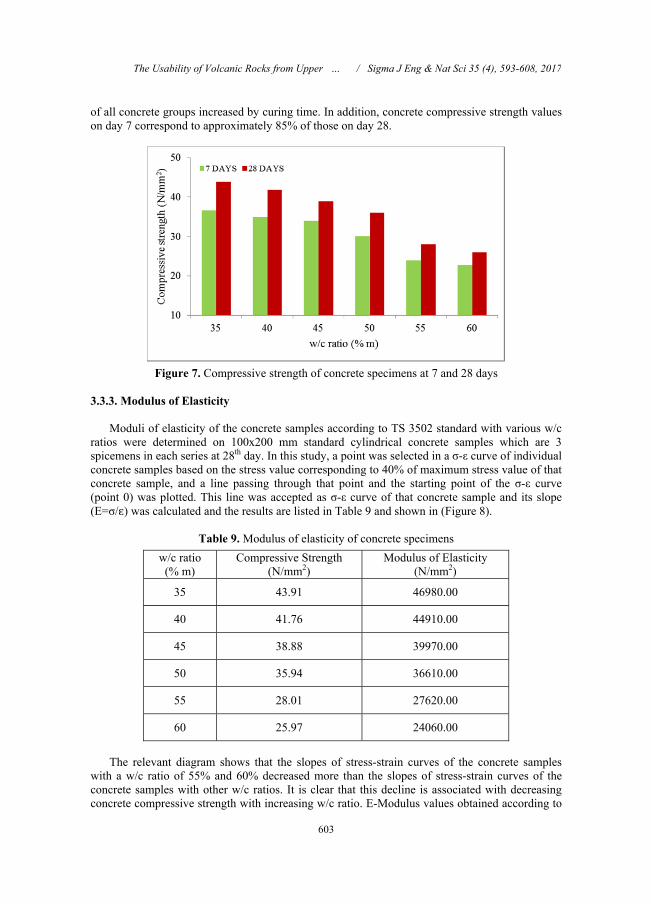
Moduli of elasticity of the concrete samples according to TS 3502 standard with various w/c ratios were determined on 100x200 mm standard cylindrical concrete samples which are 3 spicemens in each series at 28th day. In this study, a point was selected in a σ-ε curve of individual concrete samples based on the stress value corresponding to 40% of maximum stress value of that concrete sample, and a line passing through that point and the starting point of the σ-ε curve (point 0) was plotted. This line was accepted as σ-ε curve of that concrete sample and its slope (E=σ/ɛ) was calculated and the results are listed in Table 9 and shown in (Figure 8).
Table 9. Modulus of elasticity of concrete specimens
w/c ratio (% m)
Compressive Strength (N/mm2)
Modulus of Elasticity (N/mm2)
35 43.91 46980.00
40 41.76 44910.00
45 38.88 39970.00
50 35.94 36610.00
55 28.01 27620.00
60 25.97 24060.00
The relevant diagram shows that the slopes of stress-strain curves of the concrete samples
with a w/c ratio of 55% and 60% decreased more than the slopes of stress-strain curves of the concrete samples with other w/c ratios. It is clear that this decline is associated with decreasing concrete compressive strength with increasing w/c ratio. E-Modulus values obtained according to
The Usability of Volcanic Rocks from Upper … / Sigma J Eng & Nat Sci 35 (4), 593-608, 2017

604
concrete compressive strength (as given in Table 9) increased with decreasing w/c ratio and increasing compressive strength and vary in the range of 24000 N/mm2 and 47000 N/mm2.
Figure 8. Stress-strain diagram of the concrete specimens 3.3.4. Splitting Tensile Strength
Splitting tensile strength tests were conducted on 100x200 mm standard cylinder concrete samples cured for 28 days, and 28-day values of the concrete samples with various w/c ratios were compared in a graph. Figure 9 shows that there is a linear relationship between tensile splitting strengths of the concrete samples in line with w/c ratio. Tensile splitting strengths decreased with increasing w/c ratio, in other words, increasing amount of water, and decreasing compressive strength values.
Figure 9. Splitting tensile strength of concrete by different w/c ratios
y = -0.0603x + 6.4096R² = 0.984
1
1,5
2
2,5
3
3,5
4
4,5
5
35 40 45 50 55 60
w/c ratio (% m)
Spl
itti
ng T
ensi
leS
tren
gt(N
/mm
2 )
Y.S. Aksüt, Ş. Yetgin / Sigma J Eng & Nat Sci 35 (4), 593-608, 2017

605
Furthermore, compared to uniaxial tensile test, tensile-splitting test is easier to perform and generates a result which is 90% accurate (Franklin and King, 1971). So tensile-splitting test is more applicable in practice. On the other hand, previous studies in the literature (Betonkalender, 2012) reported that concretes with normal compressive strength (20-50 N/mm2) have tensile splitting values in the range of 2 to 6 N/mm2, which are higher by 10 to 20% in the case of crushed stone aggregate concretes. Similarly, mean tensile splitting value obtained in the current study was 3.5 N/mm2 with a regression value of R2 = 0.984. 3.3.5. Abrasion Resistance
Abrasion test was conducted on 100x200 mm standard cylindrical concrete samples with various w/c ratios according to ASTM C 944 (rotating-cutter method) and the results are shown in Figure 10. The graph shows that the amount of abrasion resistance decreased with increasing w/c ratio, and especially in the case of a w/c ratio of 50% and above, which is ascribed to the increased porosity ratio in line with w/c ratio. Increased unit mass and compressive strength with decreasing w/c ratio indicates a more compact concrete texture, resulting in a higher abrasion strength. The lowest mass abrasion loss (about 3.1 g) was obtained for the concrete sample with a w/c ratio of 35%, which was revealed also with a regression coefficient of R2 = 0.9444 (Figure 10).
Figure 10. Abrasion rates of concrete by different w/c ratios
3.3.6. Capillary absorption
Capillary absorption test was performed on 3 samples from concrete groups consisting of 100x200 mm standard cylinder concrete samples with 6 different w/c ratios according to ASTM C 1585. The results of the test are shown in Figure 11.
y = 0.2411x - 5.8376R² = 0.9444
0
2
4
6
8
10
35 40 45 50 55 60
w/c ratio (% m)
Abr
asio
n ra
te (
g)
The Usability of Volcanic Rocks from Upper … / Sigma J Eng & Nat Sci 35 (4), 593-608, 2017

606
Figure 11. Capillary water absorption of concrete by different w/c ratios
Water absorption values of the concrete samples initially showed a linear increase, whereas after 134 sn1/2, they showed a sudden increase, followed by a lesser increase and ended. In this test, result of movement the impregnated water into the concrete sample as a certain period of time in micro spaces and then movement toward macro spaces in a larger size to fill these gaps in a larger space is believed that the reason for the sudden increase in the graph.
The highest and the lowest amounts of water absorption were obtained for the concrete samples with w/c ratios of 60% and 35%, respectively. The high capillary absorption ratio is associated with increased ratio of capillary pores and accordingly increased number of pores in the concrete samples in line with w/c ratio. According to these results, w/c ratio dropped down below 40% and water absorpiton height remained below 0.6 mm (Figure 11). It appears that the concrete samples prepared with a w/c ratio of 35% remained at a lower water absorption height by about 80%, compared with the concrete samples prepared with a w/c ratio of 60% . 4. CONCLUSION
The results of this study are summarized below:
1) In microscopic examinations of volcanics samples from the studied area, it was identified that they are generally microlitic porphyritic and vitrophyric porphyritic, and their main components are made up of various percentages of plagioclase, amphibole phenocrystals and opaque minerals, and they consist of volcanic glass matrix. Moreover, it was found the result of the chemical analysis obtained from a previous study in region (Karslı, 2006; Gücer, 2008) that volcanics sample (YTD) used for preparing concrete samples does not contain SiO2 causing deleterious alkali-silica reactions (ASR) and polymorphic silica minerals (tridimite, opal, chalcedony, cristobalite, smectite).
2) The phenocrystals identified in volcanics are low in percentage and did not subjected an important alteration process so it was concluded that they did not affect concrete strength.
3) In the classification made in terms of chemical properties according to the amount of SiO2, the volcanics are composed of andesite in general, and according to geochemical data, volcanics (YTD) used to prepare concrete samples was found to be alkaline. Alkalinity is known to contribute to concrete strength in general.
4) Water absorption percentages of volcanic aggregates used in the study were generally in the range of 2.04% to 4.1% by volume, which is consistent with ASTM C 127 standard.
Y.S. Aksüt, Ş. Yetgin / Sigma J Eng & Nat Sci 35 (4), 593-608, 2017

607
5) The highest and lowest abrasion loss percentages of volcanics samples (Los Angeles) were 38.20 and 21.65%, respectively, and these values are within the limits specified in the standards (EN 12620, 2008).
6) Freeze-thaw loss (%mass) of agregate samples were in the range of 2.39 (YTD) to 9.78 (KT), which is in good agreement with the standards (ASTM C-33; EN 12620).
7) Uniaxial compressive strength (fc) values of the rocks were in the range of 71.08 to 92.23 MPa, which make them medium strength rocks according to ISRM (1979).
8) After determination of petrographic, mineralogical, physical and mechanical properties of agregates, it is investigated usability of these aggregate in concrete. For this objective, the aggregates shown best properties (YTD). It is seen that the concrete produced with these aggregates provides convincing results for both fresh and hard concrete properties. The concrete samples prepared using aggregates of YTD and CEM I 42.5 R type Portland cement were found to be in normal strength concrete classes between C20/25 and C40/50 according to EN 206 (2014).
9) As a result of the investigations, examinations and tests performed within the scope of the study, it was concluded that particularly the volcanic rocks of YTD from Uzumlu region were highly satisfactory as a concrete aggregate.
10) Estimated total apparent reserve of volcanic rocks spread in the region, to a larger extent in Yassı Tepe and Köy Tepe, is about 300 million tons. It is apparent that the volcanic rocks in that area would be very beneficial as an alternative to sedimentary aggregates, which are currently highly popular in concrete production. Acknowledgements
The authors are most grateful for the support of Assoc. Prof. Dr. Abdullah Kaygusuz for
allowing use the geology laboratory and Dr. Mehmet Ali Gücer for the petrographic examination of the rock samples and also I offer my gratitude to Dr. Mustafa Çullu provided me for all kinds of support throughout this study and in my master education. REFERENCES [1] ASTM C 33, 2003, Specification for Concrete Aggregates. ASTM (American Society for
Testing and Materials) Standarts, pp 11, Vol 04. 02. [2] ASTM C 127, 2009, Standard Test Method for Density, Relative Density (Specific
Gravity), and Absorption of Coarse Aggregate, 1-7. [3] ASTM C 1585 – 04, 2004, Standard Test Method for Measurement of Rate of Absorption
of Water by Hydraulic- Cement Concretes ASTM, 1-5. [4] ASTM C 944., 1999, Standard Test Method for Abrasion Resistance of Concrete or
Mortar Surfaces by the Rotating-Cutter Method, 1-4. [5] Beard, J.S., Characteristic Mineralogy of Arc-Related Cumulate Gabbros: Implications
for the Tectonic Setting of Gabbroic Plutons and for Andesite Genesis, Geology, v. 14, p. 848-851, October 1986.
[6] Betonkalender, 2012, Bd. 1, S. 365, Vovl. Ernst und Sohn, Berlin. [7] Cox, K.G., Bell, J.D., Pankhurst, R.J., 1979. The interpretation of igneous rocks. Allen
and Unwin, London. [8] Deere, D.U., and Miller, R.P., 1966, “Engineering Classification and Index Properties of
Intact Rocks.” Technical Report., Air Force Weapons Laboratory, New Mexico, No., AFNL-TR, Kirtland, 65-116.
[9] Dietmar Klausen; Rudoff Hoscheid; Peter Lieblang, 2013, “Technologie der Baustoffe”, VDE Verlag GmbH; Berlin/Offenbach.
The Usability of Volcanic Rocks from Upper … / Sigma J Eng & Nat Sci 35 (4), 593-608, 2017

608
[10] Franklin, R. E., King, T. M. J., “Relations between Compressive and Indirect-Tensile Strength of Concrete”, R.R.L, Report LR 412, Material Section, Road Research Laboratory, Crawthorne, Berkshire, 1971.
[11] Gücer, M.A., 2008, Mineralogical, Petrographical and Geochemical Investigations of Yoncayolu Metamorphites (Üzümlü-Erzincan) and Their Surrounding Rocks, Master Theses at KTÜ University. Institute of Science , Trabzon, pp. 53-54, 123.
[12] Irvine, T.N., Baragar, W.R.A., 1971. A guide to the chemical classification of the common volcanic rocks. Canadian Journal of Sciences, 8, 523-548.
[13] ISRM, 1979. Suggested Methods for Determining the Uniaxial Compressive Strength and Deformability of Rock Materials. International Journal of Rock Mechanical Mining Science And Geomechanical Abstract, pp. 16-135, 140.
[14] Karslı, O., 2006, Pre-eruptive conditions revealed by mega- and pheno-cryst compositions from the Quaternary Erzincan Volkanics, Eastern Turkey: Insights into the magma processes, Department of Geological Engineering, Karadeniz Technical University, TR-29000 Gümüşhane, Turkey.
[15] Key, C.H., Geochemistry of diorites and associated plutonic rocks of SE Jersey, Channel Islands, Mineralogical Magazine, June 1987, Vol. 51, pp. 217-229.
[16] Tahirkheli, T., Shah, M.T., Khan, M.A., and Bilqees, R., Mineralogy and geochemistry of diorites and associated hydrothermal sulfide mineralization of Gawuch Formation in Drosh area, Chitral, northern Pakistan, Journal of Himalayan Earth Sciences, January 2012, Vol. 45, pp. 31-52.
[17] TS 699, 2009, Natural Building Stones-Investigation and Laboratory Methods, Turkish Standards Institute, Ankara.
[18] EN 12620, 2008, Concrete Aggregates, Turkish Standards Institute, Ankara. [19] EN 197-1, 2012, Cement-Part 1: Overall Cements - Composition, Properties and
Conformity Criteria, Turkish Standards Institute, Ankara. [20] EN 206, 2014, Concrete- Property, Performance, Manufacturing and Conformity, Turkish
Standards Institute, Ankara. [21] EN 1008, 2003, Concrete- Mixing Water-Sampling, Experiments and Determination of
conformity Rules of the water recovered from process water in the concrete industry as a Mixed Concrete, Turkish Standards Institute, Ankara.
[22] EN 1097-3, 1999, Tests for mechanical and physical properties of aggregates Part 3: Determination of loose bulk density and voids, Turkish Standards Institute, Ankara.
[23] EN 1367, 2001, Tests for thermal and weathering properties of aggregates -Part 1: Determination of resistance to freezing and thawing, Turkish Standards Institute, Ankara.
[24] TS 802, 2009, Design Concrete Mixes, Turkish Standards Institute, 2009. p. 1-18. Ankara. [25] Waters, A.C., Volcanic Rocks and the Tectonic Cycle, Geological Society of America
Special Papers, 1955, Vol. 62, pp. 703-722. [26] Wilson, M.J., Weathering of the primary rock-forming minerals: processes, products and
rates, Clay Minerals, September 2004, Vol. 39, pp. 233-266.
Y.S. Aksüt, Ş. Yetgin / Sigma J Eng & Nat Sci 35 (4), 593-608, 2017