research article wireless monitor and control...
TRANSCRIPT

Rana H. Hussain et al, International Journal of Computer Science and Mobile Computing, Vol.2 Issue. 12, December- 2013, pg. 69-87
© 2013, IJCSMC All Rights Reserved 69
Available Online at www.ijcsmc.com
International Journal of Computer Science and Mobile Computing
A Monthly Journal of Computer Science and Information Technology
ISSN 2320–088X
IJCSMC, Vol. 2, Issue. 12, December 2013, pg.69 – 87
RESEARCH ARTICLE
Wireless Monitor and Control System for Greenhouse
Rana H. Hussain1, Dr. Ali F. Marhoon1, Dr. Mofeed T. Rashid2
1 Computer Science Department, Collage of Science, University of Basrah, Basrah, Iraq 2 Electrical Engineering Department, Engineering College, University of Basrah, Basrah, Iraq
Abstract
Parameter monitoring and control of greenhouse environment play an important role in greenhouse
production and management. This paper involve a design and implementation of an XBee based Wireless
Sensor Network (WSN) that is used to monitor and control the essential greenhouse parameters, such as,
temperature, humidity and light intensity. This implementation supports the farmers to increase the crop
production. The standalone XBee module, i.e., without microcontroller, is integrated with specific small size
sensors. All monitored parameters are transmitted through a wireless link to computer via coordinator to be
analyzed, and then initiate suitable commands to the specific devices to overcome the drifts in an
environmental parameters inside greenhouse.
Keywords – WSN; Greenhouse; XBee s2; ZigBee Technology; LM35; LDR
I. INTRODUCTION
As it is well known, greenhouse is a building where plants are grown. Greenhouses are often used for
growing flowers, vegetables, fruits, and tobacco plant. Basic factors affecting plant growth are sunlight, water
content in soil, temperature, CO2 concentration etc. These physical factors are hard to control manually inside a
greenhouse and there is a need for automated design arises. Greenhouses are very useful for following reason it
they provide an optimal temperature around plants, protect them from weather extremes, extends the growing
season, allowing you to sow plants earlier and harvest plants later and allows economic crops such as tomatoes,
cucumbers, melons and aborigines to crop more successfully [1].

Rana H. Hussain et al, International Journal of Computer Science and Mobile Computing, Vol.2 Issue. 12, December- 2013, pg. 69-87
© 2013, IJCSMC All Rights Reserved 70
WSN have many important applications, Some of them are futuristic while a large number of them are
practically useful like military application, home automation application, health application, commercial
applications, environmental application which is basis relevant to our research [2].
WSN can form a useful part of the automation system architecture in modern greenhouses. Compared to the
wired systems, the installation of WSN is fast, cheap and easy. Moreover, it is easy to relocate the measurement
points when needed by just moving sensor nodes from one location to another within a communication range of
the coordinator device. If the greenhouse's plant is high and dense, the small and light weight nodes can even be
hanged up to the plants branches [2].
Many research and projects have been done in order to improve the conditions and cultivation of crops under
greenhouse. Qian et al.[3] proposed wireless system solution for greenhouse monitoring and control. This
system consist of wireless sensors, such as temperature sensor, humidity sensor, light sensor and so on
(integrated with PIC 16F877 and ZigBee module). The data is stored and displayed on the LCD. After the data
being dealt through control algorithm, which sends control commands to the actuators and PIC 16F877. All the
wireless nodes are based on ZigBee module.
Ibrahim and Munaf [4] proposed system to control and monitoring the environment inside greenhouse. The
system consists of a number of local stations and a central station. The local stations are used to measure the
environmental parameters and to control the operation of controlled actuators to maintain climate parameters at
predefined set points. For each local station a PIC Microcontroller is used to store the instant values of the
environmental parameters, send them to the central station and receive the control signals that are required for
the operation of the actuators. The communication between the local stations and the central station is achieved
via ZigBee wireless modules.
Zhou Jianjun1 and .et al. [5] Presented system that consists of a data acquisition controller and greenhouse
remote monitoring and control software. The system ,monitor temperature ,humidity, soil water content and
concentration of carbon dioxide inside the greenhouse which then saved to a database. According to the current
indoor temperature, the target temperature and the offset temperature, PID (Proportional Integral and
Derivative) control method is used to control temperature control in greenhouse. The system is implemented
using low power wireless components, and easy to be installed.
The objective of the present work is to design and implement wireless sensor network using ZigBee devices
represented by XBee s2 kit for monitoring and control the environment parameters such as temperature,
humidity and light intensity inside greenhouse.
The article is organized as follows; Section II show system architecture of the proposed system; Section III
display system hardware description including brief overview of wireless standard, appropriate wireless
technology, description to the hardware of sensor node and the types of sensor that used; Section IV explain the
graphic user interface of the proposed system; Section V display the result of the experiment and a discussion
fore these results; and conclusions.
II. SYSTEM ARCHITECTURE
The architecture of system is shown in Fig.1 which composed of two types of physical units: three remote
sensor nodes, and a central control station. The remote sensor nodes are implemented with an XBee radio and
analog sensors. These radios support ZigBee topologies which are configured to read analog signals directly

Rana H. Hussain et al, International Journal of Computer Science and Mobile Computing, Vol.2 Issue. 12, December- 2013, pg. 69-87
© 2013, IJCSMC All Rights Reserved 71
from sensors to be transmitted with in a data packet. Each node is enabled to read temperature, humidity, and
light levels. The measured data are sent periodically to the central computer. The central control unit consists of
XBee radio kit which connected to personal computer through USB.
XBee is a device used to send and receive data wirelessly base on ZigBee/IEEE 802.15.4 network standard.
XBee could be configuring to operate in different function including the Coordinator, Router and End Device.
There are several types of XBee module, the very popular XBee is Series 1 (802.15.4), and series 2 that operate
on ZigBee protocol. Each XBee radio has the capability to directly gather and transmit sensor data if it is
configured as end device. In this work, XBee s2 is selected to be used as standalone device for gathering analog
signals from three different sensors. In addition to the ability of this XBee s2 to initiate the control signals
though it's digital output bits. Hence, there is no need to use any microcontroller to do (I/O) operation.
Eliminating the external microcontroller means saving money for sensor networks with hundreds of nodes, also
the power consumption and node size will be reduced[6][7].
III. SYSTEM HARDWARE DESCRIPTION
A. ZigBee standard
There are many types of wireless communication technologies such as ZigBee, Wi-Fi and Bluetooth. All
these types are work at similar RF frequencies, and their application sometimes overlap for example can be used
in greenhouse. In this project, ZigBee technology has been used because of the mainly advantages of this
technology over the others technologies and most suitable to this application exactly following aspects of it:
Reliable and self-configuration, Supports large number of nodes, easy to deploy, very long battery life, Secure
and Low cost. Table 1 represents a comparison between these standards [8].
Fig.1 System Architecture

Rana H. Hussain et al, International Journal of Computer Science and Mobile Computing, Vol.2 Issue. 12, December- 2013, pg. 69-87
© 2013, IJCSMC All Rights Reserved 72
Table 1 Comparison between Wireless Technologies
B. XBee Modules
XBee is the brand name from Digi International for a family of form factor compatible radio modules. The
first XBee radios were introduced under the MaxStream and were based on the 802.15.4 standard designed for
point-to-point and point-to-multipoint communications at over-the-air baud rates of 250 Kbps. Two models
were initially introduced a lower cost 1 mW XBee (S1 and S2) and the higher power 100 mW XBee-PRO.
XBee (s1, s2 and pro) have 20 pin, as shown in Fig.2. Ten from XBee pins could be configured either as digital
inputs for sensing switches and other things that operate like switches, or as digital outputs for controlling LEDs
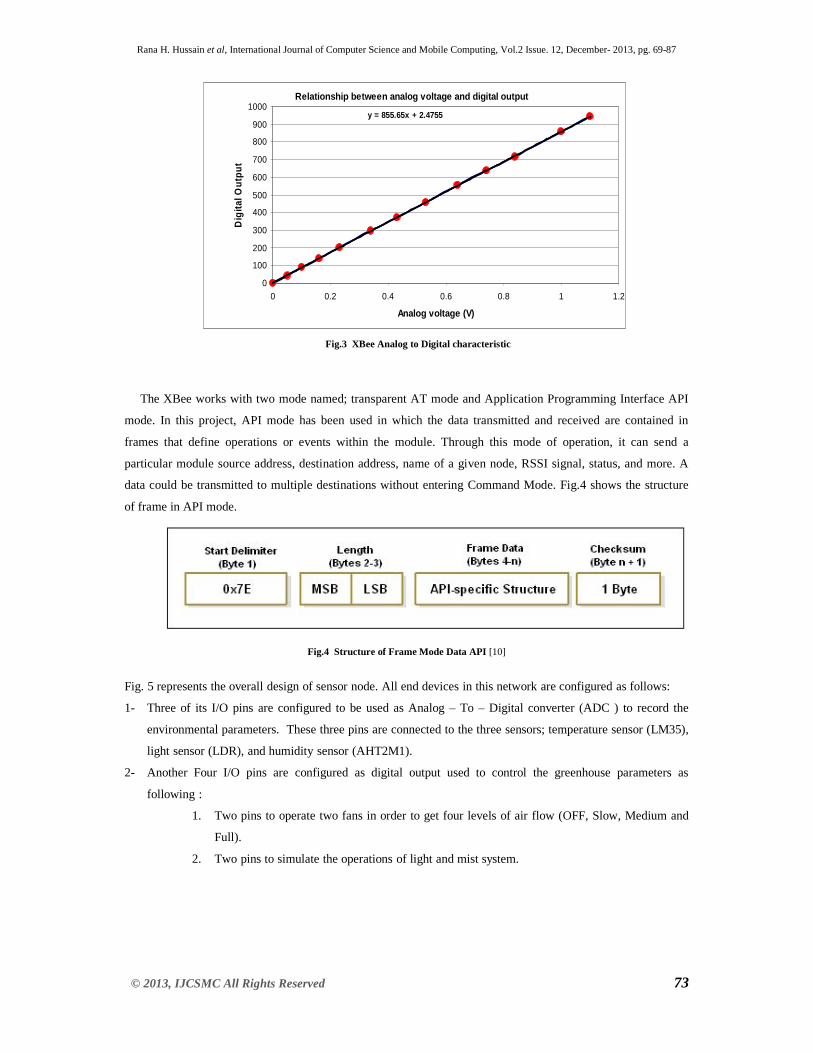
and small motors directly. Four pins could be configured as ADC input .The feature of ADC pins can read a
range from 0 volts to 1.2 volts maximum. Voltage divider circuit has been used in order to limit the maximum
voltage of sensors within the range of ADC[6]. The following equation is used to convert the A/D reading to
mV [10]:
AD(mV) = (A/D reading * 1200mV) / 1024 (1)
Fig.3 show the relation between input voltage and decimal value of ADC of XBee.
Wi-Fi Bluetooth ZigBee parameters
802.1.b 802.15.1 802.15.4 Standard
1MB 250 KB 4-32 KB Memory requirement
Hours Days years Battery live
11Mbps 1-3 Mbps 250 Kbps Data rate
100 m 10-100 m 300 m Range
Fig.2 XBee Series 2 Radio
1
10
11
20
Rana H. Hussain et al, International Journal of Computer Science and Mobile Computing, Vol.2 Issue. 12, December- 2013, pg. 69-87
© 2013, IJCSMC All Rights Reserved 73
The XBee works with two mode named; transparent AT mode and Application Programming Interface API
mode. In this project, API mode has been used in which the data transmitted and received are contained in
frames that define operations or events within the module. Through this mode of operation, it can send a
particular module source address, destination address, name of a given node, RSSI signal, status, and more. A
data could be transmitted to multiple destinations without entering Command Mode. Fig.4 shows the structure
of frame in API mode.
Fig.4 Structure of Frame Mode Data API [10]
Fig. 5 represents the overall design of sensor node. All end devices in this network are configured as follows:
1- Three of its I/O pins are configured to be used as Analog – To – Digital converter (ADC ) to record the
environmental parameters. These three pins are connected to the three sensors; temperature sensor (LM35),
light sensor (LDR), and humidity sensor (AHT2M1).
2- Another Four I/O pins are configured as digital output used to control the greenhouse parameters as
following :
1. Two pins to operate two fans in order to get four levels of air flow (OFF, Slow, Medium and
Full).
2. Two pins to simulate the operations of light and mist system.
Fig.3 XBee Analog to Digital characteristic
Relationship between analog voltage and digital output
y = 855.65x + 2.4755
0
100
200
300
400
500
600
700
800
900
1000
0 0.2 0.4 0.6 0.8 1 1.2
Analog voltage (V)
Dig
ital O
utpu
t

Rana H. Hussain et al, International Journal of Computer Science and Mobile Computing, Vol.2 Issue. 12, December- 2013, pg. 69-87
© 2013, IJCSMC All Rights Reserved 74
C. XBee Configuration
X_CTU software utility is Graphical User Interface (GUI) application that provided by Digi corporation. This
application is designed to interact with the firmware files found on Digi’s RF products and to provide a simple-
to-use graphical user interface to them. It has been used to configure XBee devices [11].
1- Programming the Coordinator (Talks to everyone in broadcast mode):
1.1- PAN ID: Make sure this value stays the same for all End Devices, and coordinator.
1.2- Set destination high address (DH) as 13A200
1.3- Select the destination low address (DL) as (FFFF) this number make the coordinator to send data
in broadcast manner.
2- Programming the End Device (Talks only to Coordinator):
2.1- PAN ID: Make sure this value stays the same for all End Devices, and Coordinator.
2.2- DH: Set destination high address as (13A200)
2.3- DL: Set destination low to be the same DL to the coordinator this will ensure that the end device
will talk only to the coordinator.
2.4 - set one or more of XBee pins to be ADC input.
2.5- set one or more of XBee pins to be digital output low.
D. Temperature Sensor
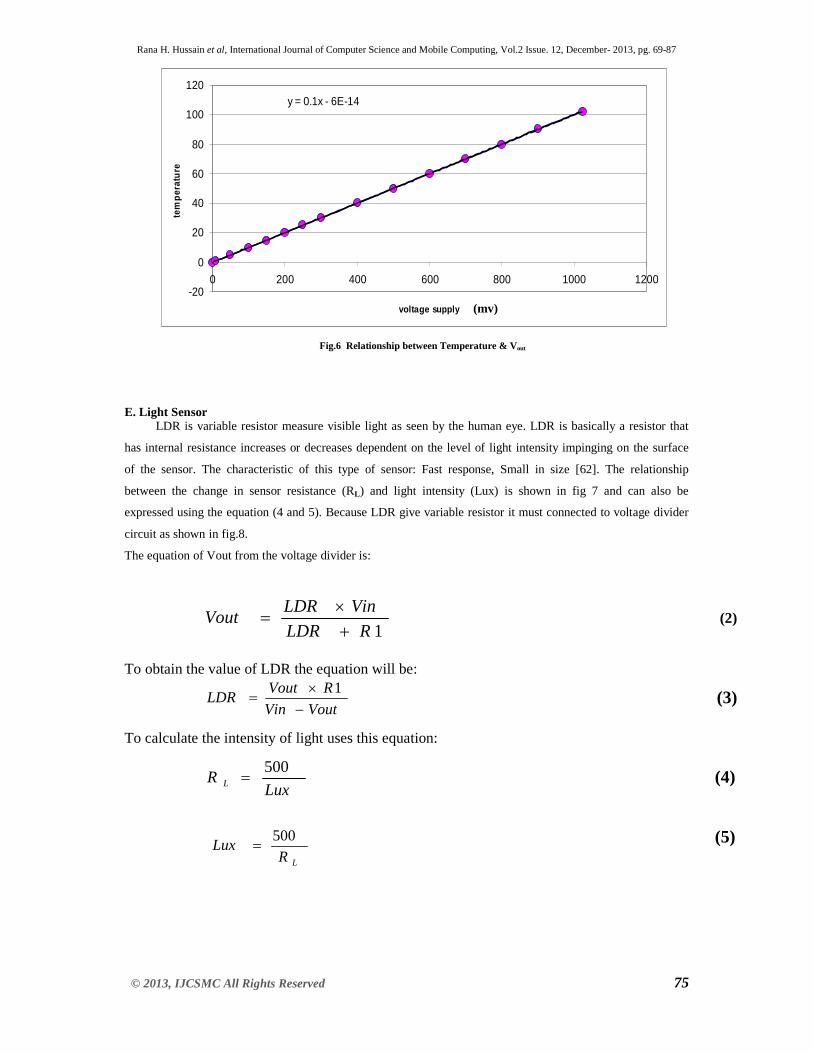
The LM35 series are precision integrated circuit temperature sensors, whose output voltage is linearly
proportional to the Celsius (Centigrade) temperature. The LM35 thus has an advantage over linear temperature
sensors calibrated in º Kelvin, as the user is not required to subtract a large constant voltage from its output to
obtain convenient Centigrade scaling. The LM35 does not require any external calibration or trimming to
provide typical accuracies of ±1⁄4°C at room temperature and ±3⁄4°C over a full -55 to +150°C temperature
range. Low cost is assured by trimming and calibration at the water level. Fig.6 represented the range of
temperature that can be reading by the ADC of XBee (0-102°C) [12].
Figure5: Remote Node Circuit Diagram
Rana H. Hussain et al, International Journal of Computer Science and Mobile Computing, Vol.2 Issue. 12, December- 2013, pg. 69-87
© 2013, IJCSMC All Rights Reserved 75
E. Light Sensor LDR is variable resistor measure visible light as seen by the human eye. LDR is basically a resistor that
has internal resistance increases or decreases dependent on the level of light intensity impinging on the surface
of the sensor. The characteristic of this type of sensor: Fast response, Small in size [62]. The relationship
between the change in sensor resistance (RL) and light intensity (Lux) is shown in fig 7 and can also be
expressed using the equation (4 and 5). Because LDR give variable resistor it must connected to voltage divider
circuit as shown in fig.8.
The equation of Vout from the voltage divider is:
To obtain the value of LDR the equation will be:
To calculate the intensity of light uses this equation:
y = 0.1x - 6E-14
-20
0
20
40
60
80
100
120
0 200 400 600 800 1000 1200
voltage supply
tem
pera
ture
Fig.6 Relationship between Temperature & Vout
mv)(
)3.3(1RLDR
VinLDRVout
(2)
)4.3(1VoutVin
RVoutLDR
(3)
LuxR L
500
)6.3(500LR
Lux
(4)
(5)

Rana H. Hussain et al, International Journal of Computer Science and Mobile Computing, Vol.2 Issue. 12, December- 2013, pg. 69-87
© 2013, IJCSMC All Rights Reserved 76
F. Humidity Sensor
The sensor that used in the project is Capacitive-type humidity sensor (CHS)called AHT2M1. This type is
widely used in industrial, commercial, and weather telemetry applications. The changes in the dielectric constant
of a CHS are nearly directly proportional to the relative humidity of the surrounding environment [14].
Technical Specification of this model was:
Power supply: 4.5-6V DC, Detecting range: humidity 0-100% RH, Storage humidity below 95% RH.
Fig.7 Resistance as Function of Illumination [13]
0.1
1000
100
10
1.0
0.1 1.0 10 100
Ft c (Lux)
Res
ista
ce(K
)
4.5 V
To XBee ADC pin
R1
520K
LDR
GND
Fig.8 Voltage Divider Circuit of LDR Sensor
Rana H. Hussain et al, International Journal of Computer Science and Mobile Computing, Vol.2 Issue. 12, December- 2013, pg. 69-87
© 2013, IJCSMC All Rights Reserved 77
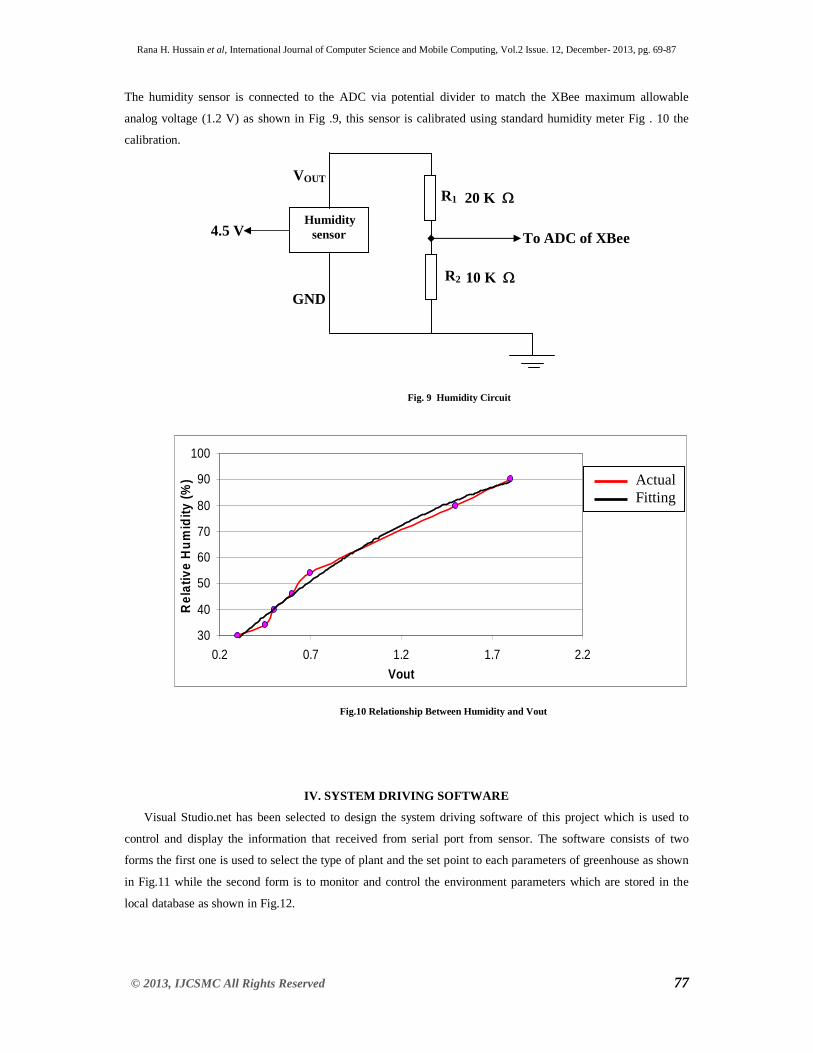
The humidity sensor is connected to the ADC via potential divider to match the XBee maximum allowable
analog voltage (1.2 V) as shown in Fig .9, this sensor is calibrated using standard humidity meter Fig . 10 the
calibration.
IV. SYSTEM DRIVING SOFTWARE
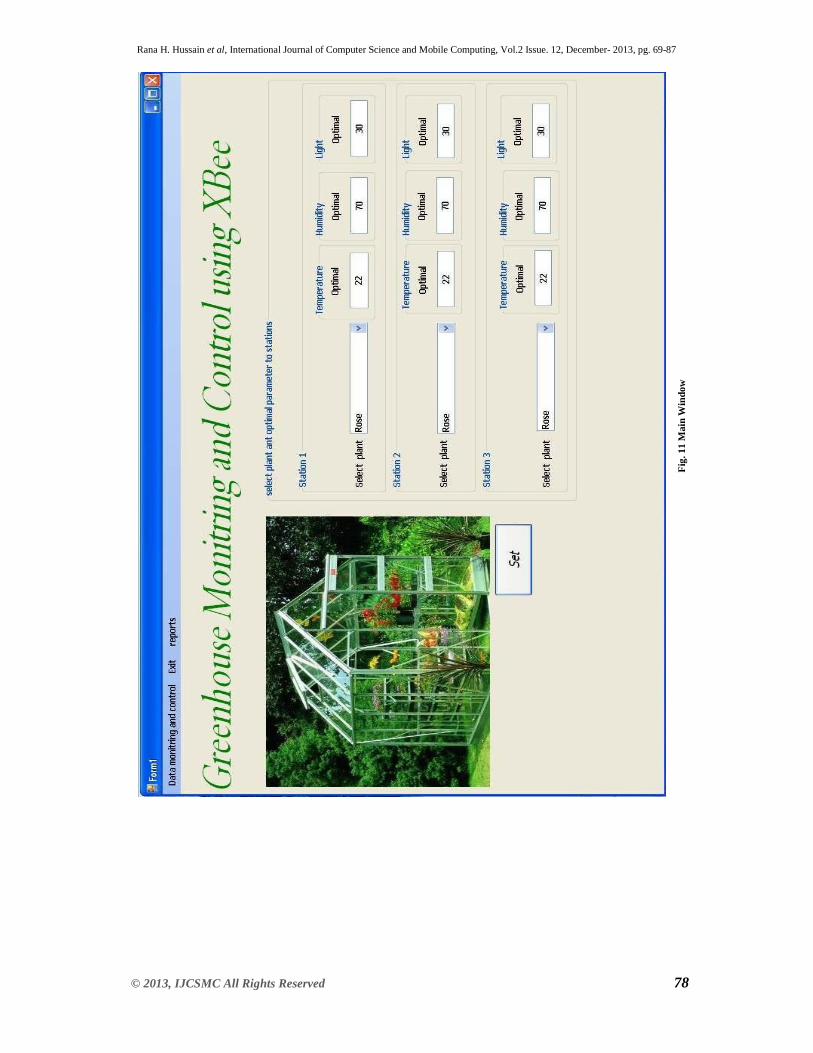
Visual Studio.net has been selected to design the system driving software of this project which is used to
control and display the information that received from serial port from sensor. The software consists of two
forms the first one is used to select the type of plant and the set point to each parameters of greenhouse as shown
in Fig.11 while the second form is to monitor and control the environment parameters which are stored in the
local database as shown in Fig.12.
R1
R2
To ADC of XBee
Fig. 9 Humidity Circuit
Humidity sensor
GND
VOUT
4.5 V
10 K
20 K
Fig.10 Relationship Between Humidity and Vout
30
40
50
60
70
80
90
100
0.2 0.7 1.2 1.7 2.2Vout
Rel
ativ
e H
umid
ity (%
) Actual Fitting
Rana H. Hussain et al, International Journal of Computer Science and Mobile Computing, Vol.2 Issue. 12, December- 2013, pg. 69-87
© 2013, IJCSMC All Rights Reserved 78
Fig.
11
Mai
n W
indo
w

Rana H. Hussain et al, International Journal of Computer Science and Mobile Computing, Vol.2 Issue. 12, December- 2013, pg. 69-87
© 2013, IJCSMC All Rights Reserved 79
Fig.
12
Mon
itori
ng a
nd C
ontr
ol W
indo
w

Rana H. Hussain et al, International Journal of Computer Science and Mobile Computing, Vol.2 Issue. 12, December- 2013, pg. 69-87
© 2013, IJCSMC All Rights Reserved 80
Fuzzy logic used to determine the error between the data that received with set value. Fig.13, Fig.14, and
Fig. 15 respectively show membership function of error of temperature, humidity error and light intensity
values. By using the rules base in tables 2 and 3 these tables are built in this form because the parameters of
greenhouse interconnected with each other. Is high, the humidity will drop down and vice versa. The absence of
light makes temperature reduce. So the system will take the decision to turn on or off the devices that represent
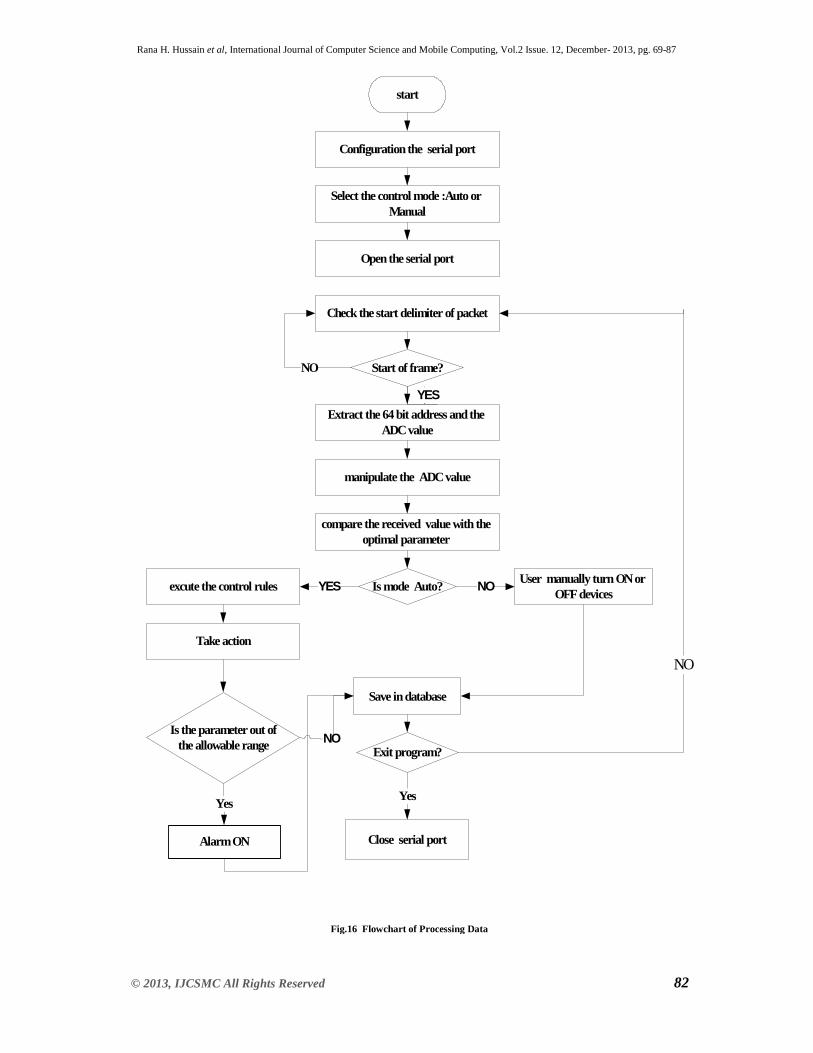
the heating, cooling or lighting systems. The Fig16 show how system driving software process the data that
received from greenhouse station.
Fig.13 Membership Function to the Temperature Error
NL NS PS Z PL
0 Co -6 Co -3 3 Co 6 Co
Fig.14 Membership function to the Humidity Error
N P Z
-10% 10% 0%
Fig.15 Membership Function to the Light Intensity Error
60 Lux 20 40
N P Z

Rana H. Hussain et al, International Journal of Computer Science and Mobile Computing, Vol.2 Issue. 12, December- 2013, pg. 69-87
© 2013, IJCSMC All Rights Reserved 81
Table 2: Control rules of Temperature and Humidity
Table 3: Control Rules of Temperature and Light
Temperature error
Hum
idity
err
or
PL PS Z NS NL
N Fan full Mist on
Fan medium Mist on
Fan off Mist on
Fan off Mist on
Fan off Mist on
Fan full Mist off
Fan medium Mist off
Fan slow Mist off
Fan off Mist off
Fan off Mist off Z
Fan full Mist off
Fan full Mist off
Fan medium Mist off
Fan slow Mist off
Fan off Mist off P
Temperature L
ight
PL PS Z NS NL
N Shading on
Shading on
Shading off
Shading off
Shading off
Shading on
Shading on
Shading on
Shading off
Shading off Z
Shading on
Shading on
Shading on
Shading on
Shading off P
Rana H. Hussain et al, International Journal of Computer Science and Mobile Computing, Vol.2 Issue. 12, December- 2013, pg. 69-87
© 2013, IJCSMC All Rights Reserved 82
start
Configuration the serial port
Select the control mode :Auto or Manual
Open the serial port
Check the start delimiter of packet
Start of frame?
Extract the 64 bit address and the ADC value
NO
YES
manipulate the ADC value
compare the received value with the optimal parameter
Is mode Auto? User manually turn ON or OFF devicesexcute the control rules YES NO
Save in database
Take action
Exit program?
Close serial port
NO
Yes
Is the parameter out of the allowable range
Alarm ON
Yes
NO
Fig.16 Flowchart of Processing Data

Rana H. Hussain et al, International Journal of Computer Science and Mobile Computing, Vol.2 Issue. 12, December- 2013, pg. 69-87
© 2013, IJCSMC All Rights Reserved 83
V. EXPERIMENTS and RESULTS
More than one experiments were carried out to test the reliability and feasibility of the system design.
An experiments were carried out at the garden of my house. The greenhouse that used in these experiments has
the following dimensions:
length = 50 cm
width = 30 cm
height = 60 cm
As shown in Fig.17,there are two small fan in addition to air filter to simulate the cooling system (fan and pad system. The prototype structure built from aluminum and class.
Fig.17 Experimental Setup
The experiments consist of two test, the first test was get the data from prototype for a period of sixteen
hours from (4 AM to 7 PM) by using the control procedure, and show how the system attempt to keep the
parameters inside the prototype smaller than the outside. The second test was get data from prototype in the
same period without using control procedure so the system will operate as monitoring system to show the affect
of the proposed controller.
Many tests are done to ensure the ability of the system work without any problems and the result show how
the system work with simple possibility to achieve proposed goals. The following graphs show the greenhouse
parameters (temperature, humidity, and light) collected from the greenhouse with and without control.

Rana H. Hussain et al, International Journal of Computer Science and Mobile Computing, Vol.2 Issue. 12, December- 2013, pg. 69-87
© 2013, IJCSMC All Rights Reserved 84
Refer to Fig.18 which show the temperature with and without control, the first line represented the
temperature change without using control. It is clear that the temperature increase proportional to the light of
sun, and reach to 50 oC or above during this period. The high temperature inside the greenhouse affect on
development and growth but can also stop process essential for life such as the structure and functioning of
enzymes. Temperature can cause changes indicative of possible changes occurring with in other environmental
factors such as relative humidity and soil moisture. The second line represented the temperature change when
applying control inside greenhouse. The affect of control is clear which is reduced by (9-10)oC using the small
fans. This reduction may increase when using suitable size of fans for cooling.
Temperature with and without control
0
10
20
30
40
50
60
4.08
4.57
5.41
6.25
7.09
7.51
8.35
9.18
10.01
10.43
11.25
12.11
12.57
13.41
14.22
15.04
15.46
16.31
17.16
17.57
18.39
19.22
Time (H)
Tem
pera
ture
(C) without control
with control
Fig.18 Temperature Collected from Greenhouse with and without Control
Humidity with and without control
0
10
20
30
40
50
60
70
4.08
4.57
5.41
6.25
7.09
7.51
8.35
9.18
10.01
10.43
11.25
12.11
12.57
13.41
14.22
15.04
15.46
16.31
17.16
17.57
18.39
19.22
Time (H)
Hum
idity
(%)
without controlwith control
Fig.19 Humidity Collected from Greenhouse with and without Control

Rana H. Hussain et al, International Journal of Computer Science and Mobile Computing, Vol.2 Issue. 12, December- 2013, pg. 69-87
© 2013, IJCSMC All Rights Reserved 85
Fig.19 represented humidity reading beginning with line that represented the reading without control it is clear
that humidity was very low and constant this because there is no air flow or any thing cause humidity. If plants
growing in a dry environment can lose humidity overtime, plants lose water constantly through their leaf pores
in transpiration process. Similarly if humidity was above 80 percent this will extend the risk of spread the
disease. In such cases the agricultural product can be affected significantly particularly the flowering and fruit
development, therefore control the humidity consider important issue. The second line represented the reading
of humidity with control and how reading of humidity was double of the reading without control this was
because used fan and pad system which provide suitable level of humidity from the water that pass through the
filter. Also using LED as indication to operate the mist system this will provide high level of humidity and also
the mist system provide simple method to irrigation.
Finally the Fig 20 which represent the value of light sensor. First line show the light intensity without control
which increase when the reading reach to the highest range in 12 PM and after this periods it will be drop to
reach to the lowest value at sunset. Light has an effect on growth processes of plants in agricultural
environments, as strong sunlight causes greater transpiration while the plants that grown in darkness are seen as
weak plants lacking chlorophyll. Therefore monitoring light plays an important issue to control greenhouse. The
second line represented the light intensity with control which was smallest comparing to first line without using
control. The white shading are used to decrease the light intensity because the white color considered less
absorption of sunlight than the other shading colors.
Fig.20 Light intensity Collected from Greenhouse with and without Control
Light intensity with and without control
0
50
100
150
200
250
300
350
400
450
4.08
4.57
5.41
6.25
7.09
7.51
8.35
9.18
10.01
10.43
11.25
12.11
12.57
13.41
14.22
15.04
15.46
16.31
17.16
17.57
18.39
19.22
Time (H)
Ligh
t int
ensi
ty (L
ux)
with controlwithout control

Rana H. Hussain et al, International Journal of Computer Science and Mobile Computing, Vol.2 Issue. 12, December- 2013, pg. 69-87
© 2013, IJCSMC All Rights Reserved 86
VI. CONCLUSION In this work, a design and implementation of greenhouse parameter monitoring and control system has been
proposed. This system is able to collect the information about the main environmental parameters such as;
Temperature, Humidity and Light inside the greenhouse. And have the ability to keep these parameters smaller
than the outside environment by using two simple fans. The analog signals of different sensors are converted
into digital values utilizing the capability of XBee via its analog to digital converters of the end devices.
These information are transmitted through wireless manner to central computer to be processed and making a
decision based on simple fuzzy controller to initiate suitable digital command signals via digital outputs of
XBee to regulated the greenhouse parameters for specific crop. Because the overall design of the wireless
sensor network has been designed by using XBee only without microcontroller, the cost and required power of
system has been reduced, also the system more simple and easy to install. The collected data and the generated
control signals are stored on database to be analyzed for enhancement of the crop growing purposes.
References
[1] D.D.Chaudhary1, S.P.Nayse2, L.M. Waghmare, “Application Of Wireless Sensor Networks
For Greenhouse Parameter Control In Precision Agriculture”, International Journal of Wireless &
Mobile Networks (IJWMN) , February 2011,Vol. 3, No.1, pages 1-3 .
[2] Andrzej Pawlowski, Jose Luis Guzman ,Francisco Rodríguez, Manuel Berenguel,José Sánchez
and Sebastián Dormido, “Simulation of Greenhouse Climate Monitoring and Control with Wireless
Sensor Network and Event-Based Control",' sensor Journal’, 2009, Vol 9, Page 2.
Figure (20): Light intensity collected from greenhouse with and without
control
Light intensity with and without control
0
50
100
150
200
250
300
350
400
450
4.08
4.57
5.41
6.25
7.09
7.51
8.35
9.18
10.01
10.43
11.25
12.11
12.57
13.41
14.22
15.04
15.46
16.31
17.16
17.57
18.39
19.22
Time (H)
Ligh
t int
ensi
ty (L
ux)
with controlwithout control

Rana H. Hussain et al, International Journal of Computer Science and Mobile Computing, Vol.2 Issue. 12, December- 2013, pg. 69-87
© 2013, IJCSMC All Rights Reserved 87
[3] ZHANG Qian, YANG Xiang-long, ZHOU Yi-ming, WANG Li-ren and GUO Xi-shan, “A
wireless solution for greenhouse monitoring and control system based on ZigBee technology" ,Journal
of Zhejiang University SCIENCE 2007 8(10): page 1-2.
[4] Ibrahim Al-Adwan and Munaf S. N. Al-D " The Use of ZigBee Wireless Network for Monitoring
and Controlling Greenhouse Climate"International Journal of Engineering and Advanced Technology
(IJEAT) ',2012 , Volume-2, page 1-5.
[5] Zhou Jianjun, Wang Xiaofang, Wang Xiu1, Zou Wei1 and Cai Jichen "Greenhouse Monitoring
and Control System Based on Zigbee" , Proceedings of the 2nd International Conference on Computer
Science and Electronics Engineering (ICCSEE 2013) ,page 1-5.
[6] Robert Faludi, “Building Wireless sensor networks ", United States of America ,O’Reilly, First
Edition, December 2010.
[7] Ning Wang , Naiqian Zhang and , Maohua Wang , “Wireless sensors in agriculture and food
industry—Recent development and future perspective",' Elsevier Journal of Computers and
Electronics in Agriculture,2006,Vol 50 ,Page 1-14 .
[8] Jin-Shyan Lee, Yu-Wei Su, and Chung-Chou Shen, “A Comparative Study of Wireless Protocols:
Bluetooth, UWB, ZigBee, and Wi-Fi ",' Proceedings of The 33rd Annual Conference of the IEEE
Industrial Electronics Society (IECON),2007, Taipei, Taiwan, page 1-5
[9] Yu Chengbo Cui Yanzhe Zhang Lian Yang Shuqiang," ZigBee Wireless Sensor Network in
Environmental Monitoring Applications ".IEEE,October ,2009,page 1-5
[10] DIGI. XBee ® / XBee – PRO ® ZB OEM RF MODULES. 2008 http://www.digi.com.
[11] Digi. X-CTU Configuration & Test Utility Software. [cited 2008 20-8]
[12] LM35 Precision Centigrade Temperature Sensors datasheet , November 2000.
[13]. Light dependent resistors datasheet, March 1997232-3816.