research data health status and health behaviors …. natl. inst. public health, 66 (2) : 2017...
TRANSCRIPT

J. Natl. Inst. Public Health, 66 (2) : 2017172
<Research Data>Health status and health behaviors of villagers during floods in the flood
prone areas of Khon Kaen, Thailand
Nagomu Konno2), Sanae Tada
3), Wongsa Laohasiriwong4), Somsak PiTaKsanuraT
4),
Youn-Hee han2), Masayuki hayashi
4, 5), Yoshinobu ishibashi 1,4)
1)Tohoku Gakuin University, Professor emeritus, Japan2)Tohoku Gakuin University, Graduate School of Engineering, Japan3)Tohoku University, Graduate School of Engineering, Japan4)Khon Kaen University, Faculty of Public Health, Thailand5)Fukushima Medical University, Professor emeritus, Japan
AbstractObjectives: A questionnaire survey was conducted to determine the health status, health behavior and medical care in evacuation centers during flood situations in three villages in the suburb of Khon Kaen City.Methods: A total of 393 respondents was randomly selected proportional to size to respond to the questionnaire.Results and discussion: As for the health status, villagers were generally covered or insured for medical care and have good health promoting practices. Athlete’s foot, tinea pedis, low prevalence of diarrhea and only 2 cases of leptospirosis were reported during flood situations. No serious illnesses were reported. Although the villagers have the tendency to use traditional treatments, there were doctors and nurses in evacuation centers and medicines were provided. Possibly because of this, serious diseases were not observed in a significant manner. In terms of health behaviors including knowledge, attitudes and practices, villagers generally have high knowledge on sanitation, but had incorrect knowledge on some sanitation aspects such as disposal of dead animals, diarrhea prevention and eye care. Villagers need to acquire knowledge on matters they did not understand correctly. Drinking water while in evacuation centers consisted of bottled water, rain water and piped water. Especially, piped water had high total coliform bacteria (TCB) and fecal coliform bacteria (FCB) content and no residual chlorine detected. Detection of TCB and FCB means possible contamination with enteric pathogens. Therefore, villagers need to be warned of the problem with water source purity. Moreover, flood water was used for washing tableware and cleaning of clothes, therefore the hygienic conditions among them were poor. The questionnaire survey revealed that the villagers’ health status during floods was generally good with only common ailments associated with flood situations seen. But certain hygienic and sanitation knowledge and practices needed improvement, together with the condition of the water supply system.
keywords: Flood, Health status, Health impact, Evacuation center, Water quality
(accepted for publication, 10th February 2017)
I. Introduction
The purpose of our original study is to describe the trend of diseases and water quality analyses and field survey findings in flood-prone areas focusing on Thailand. In addition, we considered the villagersʼ living conditions, indicating the reality of community water supply situations.
Water samples and published data for analyses were taken monthly from May to October, 2014. On the other hand, a questionnaire survey was conducted to determine the health status, health behavior and medical care in evacuation centers during flood situations in three villages in the suburb of Khon Kaen City. The questionnaire survey results provide information on preservation of health care
保健医療科学 2017 Vol.66 No.2 p.172-183
指導教官:小坂浩司(生活環境研究部)
Corresponding author: Yoshinobu ISHIBASHI
E-mail: [email protected]

J. Natl. Inst. Public Health, 66 (2) : 2017
Health status and health behaviors of villagers during floods in the flood prone areas of Khon Kaen, Thailand
173
at the time of floods in this manuscript.As the background of questionnaire survey, floods are
the most common natural disaster in both developed and developing countries. The frequency and severity of flooding in Southeast Asia has increased over the past several decades[1].
In 2011, the floods in Thailand were so severe they have been labeled the worst floods in over 60 years[2]. Floods have adversely affected community well-being and population health[3]. Floods increased water-borne diseases, morbidity, mortality and socioeconomic disruption and put stress on health services especially in rural flood areas[4]. The risk of communicable diseases particularly fecal oral disease increases in the flood area due to decline in sanitation, lack of access to safe water and consumption of contaminated foods[5]. Outbreaks of rodent–borne communicable diseases are also reported during floods and are mainly due to increased amounts of rodent excrement in flood water[6].
II. Study areas and methods
A questionnaire survey was conducted in the villages. The purpose of this study was to identify the health status, health behavior of the villagers during flooding. Structured questionnaire interview was conducted by studentʼs door to door visit in three villages (Ban Haet, Mueang and Udolratana) suburb of Khon Kaen City. A total of 393 respondents in thirties-sixties were selected from the above mentioned areas (154, 126 and 113 villagers respectively). Its details are indicated on Table 1. The answers reflect their experiences in the past five years because no flood occurred in 2014.
The questionnaire consisted of socio-demographic, socio-economic, health status, flooding experience and health services, health impact from flood, knowledge about flood, attitude on flood situation and practices, and comparison of behavior in normal time and during flooding.
III. Results
1. Demographic and socio-economic informationAmong the total, 58.5% of respondents were female
with the mean age of 51.1± 15.2 years. Most of them were married (75.3%) and completed their primary schooling (68.5%). The majority of the respondents were farmers (67.4%). Nearly 61.6% of them had a family size of 3-5 persons. The median family monthly income was 6,000 baht (Minimum 1,000 baht, Maximum 100,000 baht). About half of the respondents have been living in those areas for at least 40 years (56.0%). The median distance where they experienced flood from the respondentsʼ house to the river
or lake was 300 meters (Minimum 10 meters, Maximum 2 kilometers). (Table 1)
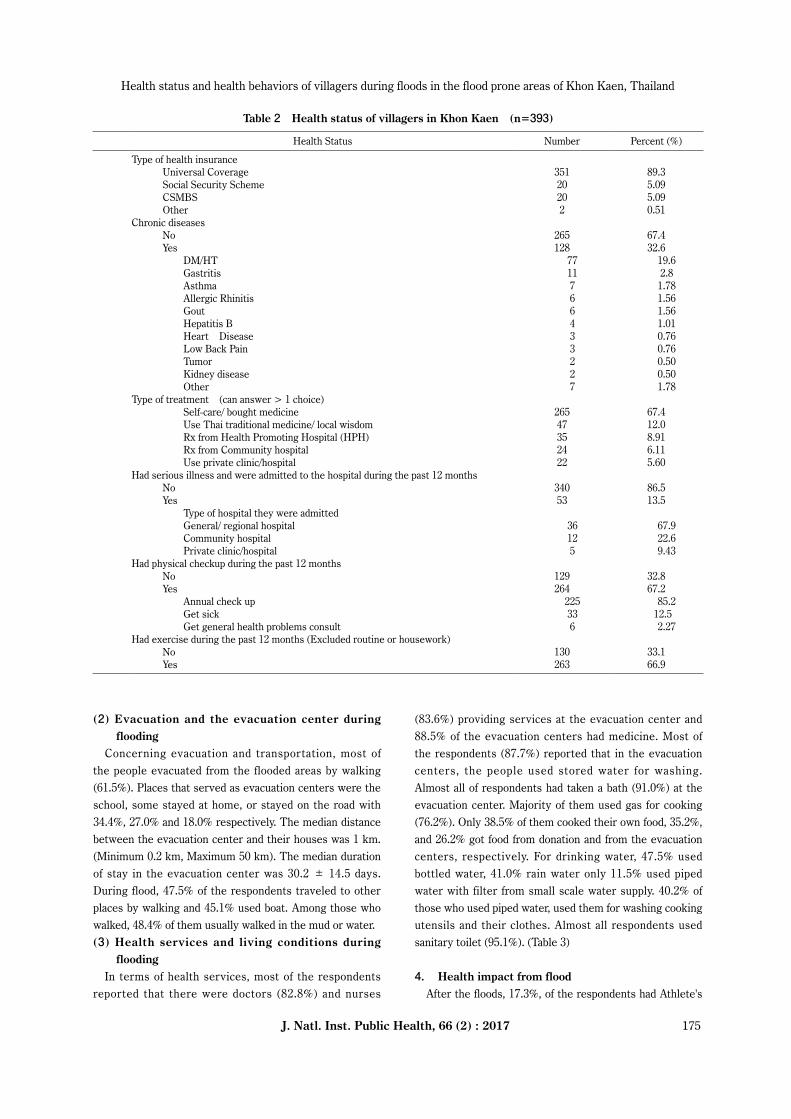
2. Health StatusTable 2 describes the coverage of health insurance
and medical history of the respondents. 89.3% of them had universal health insurance coverage. Universal Coverage is the essential health services for Thai citizens. Social Security Scheme is provided for non-work related sickness and Civil Servants take out CSMBS. Most of the respondents (67.4%) did not have any chronic diseases. However, among those who suffered from chronic diseases, 19.6% had complications of diabetes mellitus and hypertension (DM/HT). Self-care/Self medication (67.4%) was chosen as the type of treatment. Almost all of them (86.5%) had no serious disease, and only 13.5% had been admitted to the hospital during the past 12 months. Majority of the respondents (67.2%) have undergone physical examinations in the past 12 months, and among them, 85.2% sought annual checkup. Concerning health promotion, 66.9% exercised regularly (excluding routine or house work) by running, walking, bicycling and aerobic dance etc. during the past 12 months. Here, the value of each breakdown is the percentage that respondents answered "Yes" in Table 2.
3. Flooding experiences and living conditions during floods
(1) Situation and impact of floodAbout 72.5% of respondents had experienced flooding.
Most of them reported that floods usually occur every year (70.2%), with an average of 3 times in the past 5 years. Concerning the last flooding, 42.8% of the respondents reported that their houses were flooded and majority of them (57.4 %) suffered from flooding that lasted shorter than 30 days (Minimum 10 days, Maximum 120 days). The median level of water was 0.7 meters high (Minimum 0.2 meters, Maximum 2 meters). Most of the houses were destroyed by the experience of the past 3 flood (70.5%). The most common parts of the house that were destroyed by flood were the floor, whole house, and window/door (24.6%, 22.1% and 12.3% respectively). The median cost required to repair the houses was around 3,000 baht (Minimum 930 baht, Maximum 300,000 baht). During the past flooding, about 73.8% had their cultivated lands flooded with the average areas of 10 rais (3.95 acre /1.6 hectare). The median duration of flood on cultivated lands was 30 days (Minimum 3 days, Maximum 120 days). Furthermore, 66.7% of rice paddies were damaged by the flood. The median cost of damage to cultivated land was 15,000 baht (Minimum 1,000 baht, Maximum 200,000 baht).

J. Natl. Inst. Public Health, 66 (2) : 2017
Nagomu Konno, Sanae Tada, Wongsa Laohasiriwong, Somsak PiTaKsanuraT, Youn-Hee han, Masayuki hayashi, Yoshinobu ishibashi
174
Table 1 Demographic and socio-economic information of the respondents in study areas (n=393)
District (Name of Village) Number Percent (%) Ban Haet 154 39.2 Mueang 126 32.1 Ubolratana 113 28.8Gender Male 163 41.5 Female 230 58.5Age (years) Lower than 30 39 9.92 30 - 39 43 10.9 40 – 49 112 28.5 50 - 59 76 19.3 More than 59 123 31.3 Mean ± SD: 51.13± 15.18 Median (Min, Max): 50(20, 92)Marital status Married 296 75.3 Divorced 50 12.7 Single 43 10.9 Widowed 4 1.02Education attainment Non-education 11 2.80 Primary school 269 68.5 Secondary school 82 20.9 Upper secondary school 19 4.83 Diploma or equivalence 10 2.54 Bachelor degree or higher 2 0.51Main occupation Farmer 265 67.4 Worker 46 11.7 Unemployment 39 9.92 Merchant 26 6.62 Government officer 9 2.29 Fisherman 4 1.02 Student 4 1.02People in family (person) Lower than 3 31 7.89 3– 5 242 61.6 6 – 8 114 29.0 More than 8 6 1.53 Mean ± SD: 4.77 ± 1.75 Median (Min, Max): 5(1, 12)Average family monthly income (baht/month) Lower than 3,000 53 13.5 3,000 – 5,999 135 34.4 6,000 – 9,999 61 15.5 10,000 – 12,999 66 16.8 13,000 – 15,999 18 4.58 More than 15,999 60 15.3 Mean ± SD: 10,573 ± 14,166 Median (Min, Max): 6,000 (1,000, 100,000)Duration of being lived in this area (years) Lower than 10 15 3.82 10 - 19 29 7.38 20 - 29 63 16.0 30 - 39 66 16.8 ≥ 40 220 56.0 Mean ± SD: 41.26 ± 18.47 Median (Min, Max): 41(4, 92)Distance from house to the river, lake which have flooding (km) Lower than 0.1 61 15.5 0.1 – 0.4 163 41.5 0.5 – 0.9 92 23.4 ≥1 77 19.6 Mean ± SD: 0.44 ± 0.45 Median (Min, Max): 0.3(0.01, 2)
J. Natl. Inst. Public Health, 66 (2) : 2017
Health status and health behaviors of villagers during floods in the flood prone areas of Khon Kaen, Thailand
175
(2) Evacuation and the evacuation center during flooding
Concerning evacuation and transportation, most of the people evacuated from the flooded areas by walking (61.5%). Places that served as evacuation centers were the school, some stayed at home, or stayed on the road with 34.4%, 27.0% and 18.0% respectively. The median distance between the evacuation center and their houses was 1 km. (Minimum 0.2 km, Maximum 50 km). The median duration of stay in the evacuation center was 30.2 ± 14.5 days. During flood, 47.5% of the respondents traveled to other places by walking and 45.1% used boat. Among those who walked, 48.4% of them usually walked in the mud or water.(3) Health services and living conditions during
floodingIn terms of health services, most of the respondents
reported that there were doctors (82.8%) and nurses
(83.6%) providing services at the evacuation center and 88.5% of the evacuation centers had medicine. Most of the respondents (87.7%) reported that in the evacuation centers, the people used stored water for washing. Almost all of respondents had taken a bath (91.0%) at the evacuation center. Majority of them used gas for cooking (76.2%). Only 38.5% of them cooked their own food, 35.2%, and 26.2% got food from donation and from the evacuation centers, respectively. For drinking water, 47.5% used bottled water, 41.0% rain water only 11.5% used piped water with filter from small scale water supply. 40.2% of those who used piped water, used them for washing cooking utensils and their clothes. Almost all respondents used sanitary toilet (95.1%). (Table 3)
4. Health impact from floodAfter the floods, 17.3%, of the respondents had Athlete's
Table 2 Health status of villagers in Khon Kaen (n=393)
Health Status Number Percent (%)
Type of health insurance Universal Coverage 351 89.3 Social Security Scheme 20 5.09 CSMBS 20 5.09 Other 2 0.51Chronic diseases No 265 67.4 Yes 128 32.6 DM/HT 77 19.6 Gastritis 11 2.8 Asthma 7 1.78 Allergic Rhinitis 6 1.56 Gout 6 1.56 Hepatitis B 4 1.01 Heart Disease 3 0.76 Low Back Pain 3 0.76 Tumor 2 0.50 Kidney disease 2 0.50 Other 7 1.78Type of treatment (can answer > 1 choice) Self-care/ bought medicine 265 67.4 Use Thai traditional medicine/ local wisdom 47 12.0 Rx from Health Promoting Hospital (HPH) 35 8.91 Rx from Community hospital 24 6.11 Use private clinic/hospital 22 5.60Had serious illness and were admitted to the hospital during the past 12 months No 340 86.5 Yes 53 13.5 Type of hospital they were admitted General/ regional hospital 36 67.9 Community hospital 12 22.6 Private clinic/hospital 5 9.43Had physical checkup during the past 12 months No 129 32.8 Yes 264 67.2 Annual check up 225 85.2 Get sick 33 12.5 Get general health problems consult 6 2.27Had exercise during the past 12 months (Excluded routine or housework) No 130 33.1 Yes 263 66.9

J. Natl. Inst. Public Health, 66 (2) : 2017
Nagomu Konno, Sanae Tada, Wongsa Laohasiriwong, Somsak PiTaKsanuraT, Youn-Hee han, Masayuki hayashi, Yoshinobu ishibashi
176
Table 3 Flooding experiences and living conditions during floods (n=393)
Health Status Number Percent(%)
Had flooding experienceNo (skip to section 4) 108 27.5Yes 285 72.5
Annually flooded (every year) (n=285)No 85 29.8Yes 200 70.2
Number of floods experienced during the past 5 years 1 90 31.62 54 19.03 28 9.824 72 25.35 41 14.4Mean ± SD: 3.02 ± 1.48Median (Min, Max): 3(1, 5)
During the last flooding, it flooded their houseNo 163 57.2Yes 122 42.8
Duration villagers suffered from flooding (days) (n = 122)<30 70 57.430 - 45 2 1.64>45 50 41.0Mean ± SD: 38.58 ± 21.61Median (Min, Max): 30 (10, 120)
Height of water level (meters)<0.5 17 13.90.5 – 0.9 36 29.51.0 – 1.4 35 28.7>1.4 34 27.9Mean ± SD: 0.87 ± 0.56Median (Min, Max): 0.7 (0.2, 2)
House destroyed during the flood (n=122)No 36 29.5Yes 86 70.5
Parts of the house destroyed (n=86)Floor 30 34.9Whole house 27 31.3Window/Door 15 17.4Downstairs 10 11.6Stairs and Fence 4 4.65
Cost to repair the house (bahts.) (n=86)Lower than 5,000 17 19.85,000 – 10,000 31 36.0More than 10,000 38 44.2Mean ± SD: 18,980 ± 41,300Median (Min, Max): 3,000 (930, 300,000)
During the last flooding: it flooded the farm land (n=122)No 32 26.2Yes 90 73.8
The farmland areas which were flooded (rais) (n = 90)<5 16 17.85 – 9 26 28.910 – 14 21 23.315 – 19 6 6.67≥ 20 21 23.3Mean ± SD: 10.91 ± 13.64Median (Min, Max): 6(1, 70)
Duration farmland was flooded (days) (n = 90)<30 9 10.030 – 44 48 53.345 – 59 21 23.3≥60 12 13.3Mean ± SD: 26.69 ± 25.77Median (Min, Max): 30(3, 120)
Farm land areas damaged (n = 90)Rice farm 60 66.7Rice and garden or orchard 23 25.6Rice and fish pond/culture 7 7.78
Cost of damage to farm land (bahts) (n = 90)<4,000 16 17.84,000 – 9,999 27 30.0≥10,000 47 52.2Mean ± SD: 23,850 ± 32,670Median (Min, Max): 15,000 (1,000, 200,000)
Health Status Number Percent(%)
Manner of evacuation from flood (can answer > 1 choice) (n=122)
By walking 75 61.5Stay at home 59 48.4By car/ van 16 13.1
Evacuation center (n=122)School 42 34.4Stay at home 33 27.0Road 22 18.0Organization of government area 19 15.6Cousinʼs home (other district/province) 5 4.09Temple 1 0.82
Distance from evacuation center to house (kms) (n=122)<1 35 28.71 – 4.99 48 39.45.0 – 9.99 15 12.3≥10 24 19.7Mean ± SD: 6.46 ± 8.30Median (Min, Max): 1(0.2, 50)
Duration of stay at the evacuation center (days) (n = 89)<30 30 33.730 – 44 42 47.245 – 59 11 12.4≥60 6 6.74Mean ± SD: 30.22 ± 14.52Median (Min, Max): 30(2, 90)
Traveling to other places (n=122)By walking in the water 58 47.5Using boat 55 45.1By Car 5 4.10No travel 4 3.28
Doctor provided services at the evacuation center (n=122)
No 21 17.2Yes 101 82.8
Nurse provided services at the evacuation center (n=122)No 20 16.4Yes 102 83.6
Medicine stored at the evacuation center (n=122)No 14 11.5Yes 108 88.5
Water for washing stored at the evacuation center (n=122)No 15 12.3Yes 107 87.7
Take a bath at the evacuation center (n=122)No 11 9.02Yes 111 91.0
Gas used at the evacuation center (n=122)No 29 23.8Yes 93 76.2
Source of meal (n=122)Cooked by yourself 47 38.5Got from donation 43 35.2Got from the evacuation center 32 26.2
Type of drinking water (n=122)Bottled water 58 47.5Rain water 50 41.0Piped water 14 11.5
Wash your cooking utensils with (n=122)Piped water 49 40.2Flood water 33 27.0Supply water from mobile water tank 21 17.2Rain water 19 15.6
Clean your clothes (n=122)Piped water 49 40.2Flood water 44 36.1Supply water from mobile water tank 18 14.8Rain water 11 9.02
Use sanitary toilet (n=122)Yes 116 95.1No 6 4.92Direct into the water 2 1.64On the ground near the house 4 3.27

J. Natl. Inst. Public Health, 66 (2) : 2017
Health status and health behaviors of villagers during floods in the flood prone areas of Khon Kaen, Thailand
177
Table 4 Health impact from floods (n=393)
Diseases or Symptoms Number Percent (%)
Diarrhea Never 384 97.7 Sometimes 7 1.78 Often 1 0.25 Usually 1 0.25 How did you solve the problems? (n=9) Use primary care 5 55.6 Use services at hospitals 4 44.4Food Poisoning Never 392 99.8 Sometimes 1 0.25 How did you solve the problems? (n=1) Self-care/ bought medicine 1 100Cholera Never 393 100Dysentery Never 390 99.2 Sometimes 1 0.25 Often 2 0.51 How did you solve the problems? (n=3) Self-care/ bought medicine 3 100Typhoid Never 393 100Hepatitis A Never 393 100Athlete's foot Never 325 82.7 Sometimes 36 9.16 Often 18 4.58 Usually 14 3.56 How did you solve the problems? (n=68) Use Thai traditional/ local wisdom 41 60.3 Use primary care 17 25.0 Self-care/ bought medicine 8 11.8 Use hospitals 1 1.47 Use private clinic/hospital 1 1.47Leptospirosis Never 391 99.5 Sometimes 2 0.51 How did you solve the problems? (n=2) Use services at hospitals 2 100Common cold Never 375 95.4 Sometimes 16 4.07 Often 2 0.51 How did you solve the problems? (n=18) Self-care/ bought medicine 3 16.7 Use primary care 9 50.0 Use services at hospitals 5 27.8 Use services at private clinic/hospital 1 5.56Dengue hemorrhagic fever Never 393 100Influenza Never 386 98.2 Sometimes 6 1.53 Often 1 0.25 How did you solve the problems? (n=7) Use services at hospitals 7 100Tonsillitis Never 386 98.2 Sometimes 6 1.53 Often 1 0.25 How did you solve the problems? (n=7) Use services at hospitals 7 100Bronchitis Never 393 100

J. Natl. Inst. Public Health, 66 (2) : 2017
Nagomu Konno, Sanae Tada, Wongsa Laohasiriwong, Somsak PiTaKsanuraT, Youn-Hee han, Masayuki hayashi, Yoshinobu ishibashi
178
foot, 5.3% suffered from tinea pedis. The treatment for their health problems were mostly Thai traditional remedies or local wisdom for Athlete's foot (60.3%). Similarly, they recommend Thai traditional healing/ local wisdom or primary care for tinea pedis 47.6% and 47.6% respectively. These data are shown in Table 4. Here, the value of each breakdown is the percentage of “How did you solve the problem” in Table 4.
5. Knowledge on appropriate practices during floodConsidering the knowledge of respondents in flood
situation by item, almost all of them had correct knowledge that they had to wash hands with soap before cooking meals, preparing food and eating (94.2%). If they had cut wounds, 93.6% of them prevented the wound from getting wet by wearing rubber boots and washed their hands with soap and water after using the toilet (92.1%).
Diseases or Symptoms Number Percent (%)
Headache Never 385 98.0 Sometimes 8 2.04 How did you solve the problems? (n=8) Self-care/ bought medicine 5 62.5 Use primary care 2 25.0 Use services at hospitals 1 12.5Rash
Never 384 97.7 Sometimes 5 1.27 Often 4 1.02 How did you solve the problems? (n=9) Self-care/ bought medicine 4 44.4 Use primary care 2 22.2 Use services at hospitals 3 33.3Itching Never 378 96.2 Sometimes 7 1.78 Often 7 1.78 Usually 1 0.25 How did you solve the problems? (n=15) Self-care/ bought medicine 6 40.0 Use primary care 6 40.0 Use Thai traditional/ local wisdom 1 6.67 Use services at hospitals 2 13.3Fatigue Never 389 99.0 Sometimes 4 1.02 How did you solve the problems? (n=4) Self-care/ bought medicine 4 100Bites and stings Never 393 100Falling down Never 393 100Slip Never 392 99.8 Sometimes 1 0.25 How you solve the problems? (n=1) Use primary care 1 100Insomnia Never 393 100Loss of appetite Never 393 100Snake bite Never 393 100Tinea pedis Never 372 94.7 Sometimes 9 2.29 Often 1 0.25 Usually 11 2.80 How did you solve the problems? (n=21) Use Thai traditional/ local wisdom 10 47.6 Use primary care 10 47.6 Use services at hospitals 1 4.76

J. Natl. Inst. Public Health, 66 (2) : 2017
Health status and health behaviors of villagers during floods in the flood prone areas of Khon Kaen, Thailand
179
On items where respondents had incorrect knowledge, 71.0% of them were wrong in thinking that if they get diarrhea, they should take medicine to stop it to prevent spreading the disease. 61.6% did not know that it was incorrect to put a dead animal in a plastic bag, tie and then throw it into the water. 60.3% did not know that if dirty water got into their eyes, they had to use eye drops right away. The questions and answers on the recognition of what to do during floods are indicated in Table 5. In particular, questions in Table 5 with Table 6 are based on people's sense in Thailand.
6. Attitudes and practices during flood situationsWith respect to appropriate attitude on flood situation and
practices, most of them (80.7%) disagreed that water after treatment by rapid sand filtration system is drinkable since it had no germ. 78.6% disagreed that during flooding, they could stop medication by themselves without being advised by doctors and 75.8% disagreed that drinking alcohol could help reduce stress from flooding.
The respondents agreed that if they usually wash hands with soap and water, it could prevent them from getting diarrheal diseases (89.6%). In addition, eating hot food, using serving spoon, washing hands before and after eating and after using the toilet could prevent diarrheal diseases (88.6%). Furthermore, 79.1% of the people did not drink alcohol during the flood period. (Table 6)
7. Health Practices during floodingAbout half of the respondents drank both bottled water
and rain water (50.4% and 50.1%) respectively. Piped water was used for washing and shower (72.5% and 61.1%) respectively. Cooking is only 15.3%. About 84.2% used bowl latrine. In addition, Most of them cooked their own food (75.1%) whereas 28.0% ate donated food. 6.6% of respondents walked in the water with bare feet. For electrical leakage or electrocution prevention, about half of them switched off the electric power source (57.8%). The respondents chose listening to music and talking with others for stress management (70.5%). (Table 7)
Table 5 Recognition of appropriate practices during floods (n=393)
No Issue Wrong n (%) Correct n (%)
1 When any animal died, we have to put it in a plastic bag, tie it then we could throw it into the water. 242 (61.6) 151 (38.4)2 For safety of domestic animals, we should let them stay with people on the house which is not flooded. 143 (36.4) 250 (63.6)3 If we have to put feces in a plastic bag, we have to put lime and tie it before dumping into the garbage bin. 222 (56.5) 171 (43.5)4 We have to wash hand with soap before cooking meal and preparing food and eating. 23 (5.85) 370 (94.2)5 We have to wash hand with soap after using the toilet. 31 (7.89) 362 (92.1)6 Water after treatment by alum is clean and drinkable. 173 (44.0) 220 (56.0)7 Putting disinfectant in treated water could prevent illness. 215 (54.7) 178 (45.3)8 After walking in the flood water, we have to quickly wash the feet with soap and dry them quickly. 40 (10.2) 353 (89.8)9 If we have cut wound, we have to prevent it from not getting wet by wearing rubber boots. 25 (6.36) 368 (93.6)10 If dirty water gets into the eyes, we have to use eye drops medicine right away. 237 (60.3) 156 (39.7)11 If there is left over donated packed food, we should keep it to eat tomorrow. 54 (13.7) 339 (86.3)12 Before eating canned food, we should check that the can is not deformed and not expired. 42 (10.7) 351 (89.3)13 Plug off all electrical instruments and switch off the power source before the flood level reaches the plugs. 48 (12.2) 345 (87.8)14 Those who have conjunctivitis could share their personal belongings with others. 35 (8.91) 358 (91.1)15 If get diarrhea, they should take medicine to stop it in order to prevent spreading the disease. 279 (71.0) 114 (29.0)
Table 6 Attitudes during floods (n=393)
No Issue Disagree n (%) Indifferent n (%) Agree n(%)
1 If you use safe water supply, could it reduce disease? 60 (15.3) 75 (19.1) 258 (65.7)2 If you usually wash hands with soap, it could prevent you from getting diarrhea. 12 (3.05) 29 (7.38) 352 (89.6)3 Water after treatment by filtration is drinkable since it has no germ. 317 (80.7) 54 (13.7) 22 (5.60)
4 Water from a river or drainage from flood can be used to wash cups, dishes, pots and pans. 107 (27.2) 81 (20.6) 205 (52.2)
5 When flooding, you could plug in the electrical applicants since the water level is still lower than the plug. 140 (35.6) 62 (15.8) 191 (48.6)
6 Drinking alcohol could help reduce stress from flooding 298 (75.8) 52 (13.2) 43 (10.9)
7 Eating hot food, using serving spoon, washing hands before eating and after using the toilet could prevent diarrhea. 15 (3.82) 30 (7.63) 348 (88.6)
8 Throwing properly tied feces bag into flood water will not spread the disease. 248 (63.1) 43 (10.9) 102 (26.0)9 Cleaning feet and drying them could prevent skin disease in foot. 38 (9.67) 57 (14.5) 298 (75.8)10 Counseling family or close friend could reduce stress from flood problems. 0 (0) 310 (78.9) 83 (21.1)
11 During flood, you could stop medication by yourself without the advice of the doctors. 309 (78.6) 37 (9.41) 47 (12.0)
12 Open the wound, suck the venom, apply herb and drink alcohol after snake bite could reduce the spread of the venom to the heart. 223 (56.7) 75 (19.1) 95 (24.2)
13 People in the flood area should not drink alcohol. 34 (8.65) 48 (12.2) 311 (79.1)

J. Natl. Inst. Public Health, 66 (2) : 2017
Nagomu Konno, Sanae Tada, Wongsa Laohasiriwong, Somsak PiTaKsanuraT, Youn-Hee han, Masayuki hayashi, Yoshinobu ishibashi
180
IV. Discussion
Most of the villagers have universal health insurance coverage. In terms of health status, respondents always showed much concern about their health. Two thirds received physical check-up regularly, therefore, their level of health consciousness is high. One third of the villagers have chronic disease, in particular lifestyle-related diseases such as diabetes mellitus (DM) and hypertension (HT). Moreover, Thai treatment often uses self-care and
traditional medicine. Health promotion is well practiced in Thailand, thus, villagers were more likely to have regular exercise.
Respondents experienced flood on an average of three times in the past five years. About 30% of them have experienced staying in evacuation centers during flooding. Although the frequency could not definitely be ascertained, villagers reported that doctors and nurses frequently visited the evacuation centers and appropriate medicines were provided on a regular basis during flood situations.
Table 7 Health Practices during floods
No Issue Normal n (%) Flooding n (%)
1 Type of drinking water (Could answer more than 1) Bottled water 138 (35.1) 198 (50.4) Piped water 22 (5.60) 9 (2.29) Rain water 277 (70.5) 197 (50.1)
2 Use pipe water for these activities (Could answer more than 1) Cooking 87 (22.1) 60 (15.3) Washing 364 (92.6) 285 (72.5) Shower 318 (80.9) 240 (61.1)
3 Type of your toilet Sanitary bag / No toilet 0 (0.00) 6 (1.53) Pit latrine 13 (3.31) 19 (4.83) Bowl latrine 337 (85.8) 331 (84.2) Flush toilet 43 (10.9) 37 (9.41)
4 Kind of food that you eat (Could answer more than 1) Cooked by yourself 372 (94.7) 295 (75.1) Donated food 11 (2.80) 110 (28.0) Bought from markets or vendors 79 (20.1) 36 (9.16) Eat in the restaurants or shops 21 (5.38) 10 (2.54) Eat packed food including instant noodle 36 (9.16) 18 (4.58)
5 Walked in the water by Bare foot 51 (13.0) 26 (6.62) Wearing slippers 171 (43.5) 126 (32.1) Wearing boots 171 (43.5) 241(61.3)
6 Electrical leakage prevention Plug off the electrical appliances 251 (63.9) 166 (42.2) Switch off the power source 142(36.1) 227 (57.8)
7 Stress management Meditation 49 (12.5) 29 (7.38) Praying 59 (15.0) 47 (12.0) Listening to music 122 (31.0) 139 (35.4) Talking with others 124 (31.6) 138 (35.1) Counseling 39 (9.92) 40 (10.2)
8 Waste disposal management Throw into the water 4 (1.02) 7 (1.78) Throw into the garbage bin 145 (36.9) 83 (21.1) Put in a plastic bag and dump in a garbage bin 98 (24.9) 112 (28.5) Put in a plastic bag, tie it and dump in a garbage bin 146 (37.2) 191 (48.6)
9 Washing hand after using latrine Did not wash 20 (5.09) 17 (4.33) Washed with water 130 (33.1) 109 (27.7) Washed with soap or disinfectant 243 (61.8) 267 (67.9)
10 Washing hand before cooking, preparing, eating food Did not wash 16 (4.07) 13 (3.31) Washed with water 211 (53.7) 178 (45.3) Washed with soap or disinfectant 166 (42.2) 202 (51.4)
11 Washing cooking utensils Wash with piped water 195 (49.6) 346 (88.0) Wash with river, pond or flood water 198 (50.4) 47 (12.0)
12 Washing clothes Wash with piped water 382 (97.2) 361 (91.9) Wash with river, pond or flood water 11 (2.80) 32 (8.14)

J. Natl. Inst. Public Health, 66 (2) : 2017
Health status and health behaviors of villagers during floods in the flood prone areas of Khon Kaen, Thailand
181
More than 40 % of respondents drank rainwater, which is a custom from the past, when staying at the evacuation center, whereas 11.5% of them drank piped water.
The findings of this study showed that it is necessary to examine the water quality by water examination facilities because respondents used rainwater and some of the respondents used piped water as drinking water in evacuation. They also used flood water for washing cooking utensils and clothes. Total coliform bacteria and fecal coliform bacteria were present in piped water, where the residual chlorine was rarely detected, reflecting inappropriate water purification. Villagers should therefore be warned sufficiently in their choice of drinking water and should be able to recognize the difference between pure water and polluted water since flood water was also used as domestic water source.
In detail about piped water, studies revealed that, in 1990, a small scale water plant which had been constructed for each village used rapid sand filtration. However, villagers who were responsible for the plant operation and management lacked knowledge about water purification principles and management. Therefore, total coliform bacteria (TCB) and fecal coliform bacteria (FCB) were detected in most of the piped water. In an extreme instance, TCB was as high as 350 MPN/100 mL and FCB was at 170 MPN/100 mL. Moreover, residual chlorine for disinfection was not detected in most of the tap water. Whereas water disinfection is an obligation in Japan, the Ministry of Public Health in Thailand recommends disinfection in its guideline, but it is not an obligation. Detection of Escherichia coli
such as TCB and FCB indicates that the water may contain pathogenic bacteria, and this may cause an outbreak of gastrointestinal infectious diseases. Therefore, drinking water from small scale water plant in these villages is not desirable.
Additionally, about 40 % of the evacuees used piped water for washing kitchen utensils. In an extreme case, 27.1% of the evacuees used flood water for washing their cooking utensils. Even though Cryptosporidium parvum, Giardia lamblia and Entamoeba hystolytica were not found in piped water, they were mostly found in polluted surface water which was used as raw water in small scale water plants. TCB and FCB sometimes exceeded 16,000 MPN/100 mL where cattle are being raised, and it is necessary to strictly purify the piped water. Moreover, the use of outdoor toilet may cause the serious water pollution which could pose health hazards in both normal times and during flooding[7].
In our study, we found that many evacuees developed athleteʼs foot, tinea pedis after the floods. A correspondence with author Uraiwan Inmuong revealed that these skin diseases were most sensitive to flood from an investigation previously conducted in the same area (Khon Kaen)[8].
An expected high incidence of diarrheal disease was not found. The use of bottled water is listed as one of the reasons. In addition our study samples did not include children who are more prone to diarrhea. Samples which include children would be desirable in a future study. Leptospirosis is a percutaneous infection mainly, and is a disease usually associated with flood[7]. However, it was found only in two patients (Table 4). Leptospirosis was specified as a disease related to a flooding from the data of the Ministry of Public Health[9-11].
When differences in respondentsʼ living activities related to "Knowledge about flood", "Attitudes and practices during flood situation" and "Comparison of health behavior in normal time and during flooding" were considered overall, evacuees were found to be watchful of their hygiene, such as drinking of bottled water, washing hands with soap and water before and after cooking and eating, after using the toilet, and wearing long boots to prevent leptospirosis, and so on. Respondents thought that using tap water could prevent diseases, but they do not seem to understand the danger in using flood water to wash cooking utensils, and do not know the appropriate way to dispose dead bodies of animals.
V. Conclusions
A questionnaire survey was conducted to determine the health status, health behavior and medical care in evacuation centers during flood situations in three villages in the suburb of Khon Kaen City.
As for the health status, villagers were generally covered or insured for medical care and have good health promoting practices. Athleteʼs foot, tinea pedis, low prevalence of diarrhea and only 2 cases of leptospirosis were reported during flood situations. Although the villagers have the tendency to use traditional treatments, there were doctors and nurses in evacuation centers and medicines were provided. Possibly because of this, serious diseases were not observed in a significant manner.
In terms of health behaviors including knowledge, attitudes and practices, villagers generally have high knowledge on sanitation. Respondents had basic hygienic concept such as use of soap, wearing of long boots, etc. However, some had incorrect knowledge on some sanitation aspects such as disposal of dead animals, diarrhea prevention and eye care. Thus, it is important for the villagers to acquire knowledge of hygienic concepts on matters which they did not understand correctly.
Overall, the questionnaire survey revealed that the villagersʼ health status during floods was generally good with only common ailments associated with flood situations seen. But certain hygienic and sanitation knowledge and

J. Natl. Inst. Public Health, 66 (2) : 2017
Nagomu Konno, Sanae Tada, Wongsa Laohasiriwong, Somsak PiTaKsanuraT, Youn-Hee han, Masayuki hayashi, Yoshinobu ishibashi
182
practices needed improvement, together with the condition of the water supply system.
Acknowledgement
We thank students and staff of Khon Kaen University for the field survey and helpful discussions. We also thank Nina G. Gloriani (University of the Philippines Manila) for useful suggestions.
The research was supported by grants from Pfizer Health Research Foundation and Faculty of Public Health, Khon Kaen University.
References
[1] Torti J. Floods in Southeast Asia: A health priority. Journal of Global Health. 2012;2(2):0203040.
[2] Bean J. 9.5 million people experience flooding in Southeast Asia. Pacific Disaster Centre Weather Wall: World ʼs Weather and Disaster News. 18 November 2011. http://www.pdc.org/weather/index.php/2011/11/18/9-5-million-people-experience-flooding-in-southeast-asia/ (accessed 2012-11-07)
[3] Alderman K, Turner LR, Tong S. Floods and human health: A systematic review. Environment International. 2012;47:37-47.
[4] 2014 World Health Organization (WHO). FLOODS - Technical Hazard Sheet - Natural Disaster Profile. http://www.who.int/hac/techguidance/ems/floods/en/ (accessed 2014-01-07)
[5] Ahern M, Kovats RS, Wilkinson P, Few R, Matthies F. Global health impacts of floods: epidemiological evidence. Epidemiologic Reviews. 2005;27:36-46.
[6] Acuin J, Firestone R, Htay TT, Khor GL, Thabrany H, Saphonn V, et al. Southeast Asia: an emerging focus for global health. Lancet. 2011;377:534-535.
[7] Konno N, Tada S, Laohasiriwong W, Pitaksanurat S, Han YH, Hayashi M, Ishibashi Y. Trends of diseases and water quality with floods, and actual state of community water supply in Khon Kaen area, Thailand, Journal of Water and Environment Technology. (submitted)
[8] Srikuta P, Inmuong U, Inmuong Y. Health vulnerability assessment of flooded communities near Kaeng Lawa, Khon Kaen. KKU Research Journal. 2014;19(3):495-513.
[9] Tangkanakul W, Smits HL, Jatanasen S, Ashford DA. Leptospirosis: an emerging health problem in Thailand. Southeast Asian Journal of Tropical Medicine and Public Health. 2005;36(2):281-288.
[10] Ishibashi Y, Watanabe T, Uehara N. Estimation of risk of infection and contact frequency with Leptospira
during farmwork. Journal of International Health. 2010;25(3):143-153. (in Japanese)
[11] Ishibashi Y, Han YH, Morisaki H, Ishiyama K, Uehara N. Swimming and invasion force estimations for Leptospira and its adhesion potential onto skin. Journal of Water and Environment Technology. 2013;11(4):341-353.

J. Natl. Inst. Public Health, 66 (2) : 2017
Health status and health behaviors of villagers during floods in the flood prone areas of Khon Kaen, Thailand
183
<資料>タイ国コンケン地方における洪水時の保健衛生に対する意識と行動
抄録アンケート調査は,洪水時における避難所での保健衛生への意識と行動,医療,健康状況などを
知る目的に,タイ国コンケン地方の₃つの村,計393人を対象に実施した.聞き取りは2014年に行い,回答は過去₅年間の集計である.
集計,解析の結果,健康に対して,村人のほとんどは医療保険に加入し,また,健康増進に心がけていた.洪水の期間には水虫,足白癬,結膜炎,低い割合での下痢症がみられ,レプトスピラ症は₂件報告された.村人は伝統医療を重んじる傾向があるが,避難所には医師と看護師が巡回しており,医薬品も常備されていた.このような状況から重病患者はみられていない.
認識や考え方,実践を含む保健行動において,村人は一般に衛生に対して高い知識をもっていると考えられる.一方,死んだ動物の処分、下痢症の予防や眼病への備えのような概念については正しい知識を有しておらず,村人は病気に罹患する原因,知識の修得が必要である.
避難所における飲料水は,ボトルドウォーター,雨水,村落ごとにある小規模水道の水道水である.この水道水は高い割合で大腸菌群数(TCB)や糞便性大腸菌(FCB)が混入しており,残留塩素も検出されていない.TCBやFCBが検出されることは,腸内病原微生物の汚染を意味する.したがって,水源河川の汚濁の低減化に努めるとともに,村人は水道水の汚染問題を深刻に受け止める必要がある.さらに,洪水の水は食器類の洗浄,洗濯に使われており,衛生状況は劣悪である.
結論として,洪水期間中では,一般的な洪水時にみられる疾病を加味しても村人の健康状態は概ね良好であった.しかし,村落の小規模水道の浄化方法の徹底とともに,今後,衛生に関する知識と生活習慣の改善を求めていく必要性があることがアンケート調査から明らかになった.
キーワード:洪水,健康状態,健康影響,避難所,水質
今野和 2),多田早奈恵 3),Wongsa LAOHASIRIWONG 4),Somsak PITAKSANURAT 4),韓連熙 2),林正幸 4,5),石橋良信 1,4)
1)東北学院大学名誉教授2)東北学院大学大学院工学研究科3)東北大学院工学研究科4)タイ国コンケン大学公衆衛生学部5)福島県立医科大学名誉教授