research for practice - nasdse
TRANSCRIPT

RESPONSE TO
Intervention
National Association of State Directors of Special Education, Inc.
Amy-Jane Griffiths
Lorien B. Parson
Matthew K. Burns
Amanda VanDerHeyden
W. David Tilly
RESEARCH FOR PRAC T I C E

National Association of State Directors ofSpecial Education, Inc.
1800 Diagonal RoadSuite 320Alexandria,VA 22314Tel: 703/519-3800Fax: 703/519-3808www.nasdse.org
August 2007© 2007 by the National Association ofState Directors of Special Education, Inc.All rights reserved. No part of this publicationmay be reproduced in any manner whatsoeverwithout written permission of NASDSE.
This manuscript was completed for the NationalAssociation of State Directors of Special Education.Questions should be addressed to Bill [email protected].
NASDSE Board of Directors 2006-07
PresidentJacquelyn ThompsonDirector of Special EducationMichigan Department of Education
Past PresidentDoug CoxAssistant SuperintendentVirginia Department of Education
President-ElectMabreyWhetstoneDirector, Special Education ServicesAlabama Department of Education
Secretary-TreasurerMarcia HardingDirector, Special EducationArkansas Department of Education
Members at Large
MaryWatsonDirector, Exceptional Children DivisionNorth Carolina Department of Public Instruction
David StockfordPolicy Director/Team LeaderSpecial ServicesMaine Department of Education
Joanne PhillipsDeputy Associate Superintendent, Special ProjectsArizona Department of Education
Peg Brown-ClarkDirector, Special Education UnitWyoming Department of Education
Executive DirectorBill East
Deputy Executive DirectorNancy Reder

i
Foreword
For the past several years, the National Association of State Directors of Special Education (NASDSE) has had a special interest in response-to-intervention (RtI) or, as it is becoming more identified, response-to-instruction. As NASDSE’s executive director, I have been particularly interested and involved in this work. NASDSE’s signature work in this area has been the publication, Response to Intervention: Policy Considerations and Implementation with over 73,000 copies in print to date. However, this has not been the only work of the organization. NASDSE has presented several national satellite conferences on this topic and other initiatives are underway that will lead to publications that will further add to the RtI knowledge base. Since RtI as a process is new to many stakeholders in the education arena including policymakers, implementers and consumers, it is important that interested parties have available to them information that will help them understand what RtI is, as well as how to engage in the process. RtI has evolved primarily from the bottom up. For example, much of the development of programs in schools has been undertaken by practitioners who were seeking ways to understand their students’ responses to the instruction they were receiving. These practitioners learned that a student’s participation in a quality core instructional program was essential, and that making educational decisions about the student based on how he/she responds to the core was the key to success. Because these practitioners experienced success, they informed others and the movement was underway! Many believe that RtI is not being implemented fast enough. Others caution that research to validate the process and practices has not moved as fast as the implementation. All would agree that we need to learn more. Fortunately, in the past few years, there has been considerable effort to study and document RtI efforts. The literature has increased greatly, and is sure to continue as RtI programs are developed and expanded throughout the country. This publication has been undertaken to add to the knowledge base about RtI. We hope that everyone who is interested in RtI will read it. NASDSE has print copies available for those who prefer to purchase a copy; it is also available for downloading on NASDSE’s website at www.nasdse.org for those who want to read it on-line or print their own copy. Appreciation is extended to the authors, Matthew Burns, Amy-Jane Griffiths, Lorien Parson, David Tilly and Amanda VanDerHayden for their work on this project. We know that by the time it is published, many other publications on RtI will have been completed. However, this work will provide an important base to which related work can be added in the future. Bill East, Ed.D. Executive Director August 2007

ii

iii
About the Authors
Matthew K. Burns is an associate professor in Educational Psychology at the University of Minnesota where he also serves as the coordinator of the School Psychology Program. Dr. Burns is an associate editor for Assessment for Effective Intervention and is on the editorial board of Remedial and Special Education, School Psychology Review and Psychology in the School. Areas in which Dr. Burns has conducted research include: assessing the instructional level reading interventions; and facilitating problem-solving teams. In addition, he has published extensively in the area of response-to-intervention. Amy-Jane Griffiths is a doctoral student in the Counseling/Clinical/School Psychology Program at the University of California at Santa Barbara. She serves as a consultant implementing response-to-intervention in a local school district. Special areas of interest include systems change in schools and interventions to improve outcomes for children at-risk for academic and/or behavioral problems. Lorien B. Parson is a graduate student in the Educational Psychology Department’s School Psychology Ph.D. program at the University of Minnesota. She is currently the Minnesota Reading Corps coach at the St. Croix River Education District and has experience as a special education coordinator, school psychologist, reading intervention coach and grant manager. Ms. Parson’s current interests include response-to-intervention, treatment integrity, effective instruction and systems change. W. David Tilly is Director of Innovation and Accountability for the Heartland Area Education Agency (AEA) 11 in Iowa. A school psychologist by training, Dr. Tilly has worked as a school psychologist, a university trainer at Iowa State University, a state department of education consultant and an administrator. He works regularly with states, local school districts, national organizations and others on improving educational results for all children. Dr. Tilly is the author or coauthor of 24 published journal articles, book chapters or books, including NASDSE’s book, Response to Intervention: Policy Considerations and Implementation. His research and policy interests relate to supporting educational innovation in practice and improving educational results for all children. Amanda VanDerHayden is an assistant professor in Counseling and Clinical School Psychology at the University of California at Santa Barbara. Dr. VanDerHayden has authored over 40 articles and chapters and has worked as a national trainer to implement data-driven practices in schools. She is the associate editor for Journal of Behavioral Education and serves on the editorial boards for Journal of Early Intervention and School Psychology Review. Dr. VanDerHayden’s research interests include early intervention, effective screening models, curriculum-based measurement, school reform and applied behavior analysis.

iv

v
Table of Contents
Foreword i About the Authors iii Introduction 1 Chapter 1 Problems with Inaccurate and Inconsistent Identification
of Students with Disabilities in Special Education 3
Chapter 2 Problems in Identification of Learning Disabilities Using IQ-Achievement Discrepancy 13
Chapter 3 Problems with Minority Over-representation in the
Historical Special Education System 25 Chapter 4 The Need to Focus on Student Outcomes 35 Chapter 5 Major Policy Analyses Supporting Movement Toward RtI 45 Chapter 6 Accuracy of Learning Disability Identification Using RtI 53 Chapter 7 Formative Assessment 63 Chapter 8 Improving Core Instruction for All Students: Tier I Application 75
Chapter 9 Improving Instruction in Schools Using Supplemental Instruction: Tier II Application 87 Chapter 10 Intensive Instruction: Tier III Application 99 Chapter 11 Using RtI in Social-Emotional-Behavioral Areas: Tier I Application 113
Chapter 12 Using RtI in Social-Emotional-Behavioral
Areas: Tier II Application 125

vi
Chapter 13 Using RtI in Social-Emotional-Behavioral Areas: Tier III Application 139
Chapter 14 The Importance of Treatment Integrity in
RtI Implementation 153 Chapter 15 RtI Models that Have Demonstrated Effectiveness 165 Chapter 16 Scaling RtI at the Systems Level 177 Chapter 17 Using RtI with Special Populations 189 Chapter 18 Evolving Issues and Cautions about RtI 201 Annotated References 211 Glossary 221

1
Introduction
Imagine how many times each day the phrase “research says” is uttered in K-12 schools in this country. Given the recent federal mandate for evidence-based educational practices, an emphasis on research is important, but what does the research actually say regarding various educational practices? There may be published research articles about many instructional methods and curricula, but these studies may not provide sufficient evidence for the scientific basis of the practice (Ellis, 2005). Thus, it is important to examine the actual research regarding specific innovations. A recent innovation in education that has experienced great national interest, due to language included in the reauthorization of the Individuals with Disabilities Education Act (IDEA 2004), is using student response to scientifically based interventions (RtI) to diagnose learning disabilities (LD). Although research prior to the 2004 legislation supported the RtI approach (Speece & Case, 2001; Marston, Muyskens, Lau, & Canter, 2003; Torgesen et al., 2001; Vellutino et al., 1996), some have questioned the research base for RtI (Fuchs, Mock, Morgan, & Young, 2003; Hale, Naglieri, Kaufman, & Kavale, 2004; Naglieri & Crockett, 2005). Because the federal law allows for RtI, rather than requires it, local education agencies will need to decide whether to adopt RtI or continue with more traditional approaches. Thus, a thorough review of research for both approaches that is easily consumable by practitioners, parents and local administrators is needed to assist in decision making. The term ”Response to Intervention” (RtI) did not fully enter the public debate until Gresham’s 2001 presentation at the U.S. Department of Education Office of Special Education’s Learning Disabilities Summit, but relevant research has been conducted for over 30 years. Research on more traditional approaches to LD diagnosis began approximately even prior to that. This publication is a compilation of research regarding traditional LD diagnostic practices and RtI. The authors sought to identify the most important 25 articles for each topic and to provide the specific references for them. In addition, the most seminal five articles for each topic are annotated to summarize findings in an easily accessible manner. Although we attempted to provide a comprehensive resource for both traditional approaches and RtI, the primary objective was to respond to concerns about a lack of a research base for RtI. We begin by reporting studies that represent the decades of research that identify problems with the traditional LD diagnostic approaches. We then categorized RtI research into the three areas of service delivery, implementation and assessment. Finally, to advance the RtI research agenda, we identified articles that suggest areas of legitimate concern regarding RtI. At the back of the book is a Glossary to help guide readers through the often confusing terminology.

2
We sincerely hope that practitioners, policy makers, parents and administrators will find this document helpful. We, like many of our colleagues, are passionately committed to research-based practices and using these data to improve the lives of the students we serve. We hope that our summaries of these studies will assist in making important decisions, continue meaningful discussions and enhance learning outcomes for groups of children and for the individual students whose needs continuously challenge the current educational system.

3
Chapter 1
Problems with Inaccurate and Inconsistent
Identification of Students with Disabilities in Special Education
One of the common concerns about Response to Intervention (RtI) is that districts will implement very different practices in the name of diagnosing learning disabilities (LD). It is often stated that at least traditional approaches to LD diagnosis (i.e., discrepancy model) are consistently implemented and are therefore reliable. However, previous research found that traditional LD diagnostic approaches were not consistently implemented and that there were substantial differences between discrepancy models in the numbers of students identified. Children identified as LD in one state may not be diagnosed in another. Even more alarming are the inconsistencies found within one state in that a child diagnosed with LD in one district might not meet eligibility criteria in another district, even though both were in the same state. Thus, the reliability of traditional approaches to LD diagnosis is questionable. (Also see Chapter 2: Problems in Identification of Learning Disabilities Using IQ-Achievement Discrepancy, page 13.) It is possible for assessment techniques to be reliable without being valid. Thus, even if discrepancy and other diagnostic approaches lead to consistent LD classification, they may not result in valid decisions. However, it is not possible for a diagnostic process to be valid in the absence of reliability. Researchers have frequently questioned the accuracy of diagnostic practices. The lack of consistent implementation of traditional approaches suggests that the accuracy of the decisions would also be questionable. Macmann, G. M., Barnett, D. W., Lombard, T. J., Belton-Kocher, E., & Sharpe, M. N. (1989). On the actuarial classification of children: Fundamental studies of classification agreement. The Journal of Special Education, 23, 127–149. Issue of Concern Is it possible that students might be classified as LD with one test, but not another? In this study, the reliability of LD criteria is examined. Research Questions
• Is there a difference in the number of students identified as having an IQ-achievement discrepancy if: 1. Different discrepancy formulas are used? 2. Different achievement tests are used?

4
3. Using a computer simulation of various potential eligibility criteria and various reliability estimates for the measures, how consistent is classification?
Participants
• Participants included 373 students who were referred for a special education evaluation. Some of these students were classified as LD.
• An additional 5,000 “pretend” participants were included using computer-simulated data.
Methods Used to Answer the Research Questions
• The Wechsler Intelligence Scale for Children (WISC) and one or more achievement tests were administered to the students.
• Statistics were used to determine the relationship between the test scores and if the student met eligibility under the two different discrepancy formulas examined in this study.
• The second study increased the sample size to 5,000, and a statistical program was used to create hypothetical results. Various cutoff criteria were manipulated to examine the effect on classification rates.
Results
• The findings indicated many inconsistencies in eligibility determination. • The variability among the achievement tests resulted in inconsistent identification of
students. Students had a 25–50% chance of meeting the eligibility criteria, depending on the achievement test used.
• The use of different achievement tests resulted in different students being identified as having a discrepancy.
• The authors suggested that even more inconsistent IQ-achievement discrepancies would have occurred if different intellectual tests were also used.
• In many cases, students whose performances were identified as low on one achievement test were not identified as low on the other.
• Different cutoff criteria were applied to the data and the more extreme cutoff criterion resulted, “in less dependable rather than more dependable classifications of extreme performance” (p. 143).
• There was up to a 60% chance that any student would meet the eligibility criteria for LD depending on the criterion used.
Implications for Practice
• The data provides a strong argument against the use of an IQ-achievement discrepancy.
• The authors recommend that due to the inconsistency of student eligibility identification (IQ-achievement discrepancy) related to the use of different tests, which

5
occurs throughout states, and the amount of inherent error associated with testing, the discrepancy criterion is not reliable and should be changed.
• Focusing resources on treatment response as opposed to testing would be more reliable and helpful to students.
MacMillan, D. L., Gresham, F. M., & Bocian, K. M. (1998). Discrepancy between definitions of learning disabilities and school practices: An empirical investigation. Journal of Learning Disabilities, 31, 314–326. Issue of Concern
• The Learning Disabilities (LD) category of special education is growing exponentially. Research Questions
• Is the LD category in special education being used by schools to label students who have low achievement or other behaviors of concern as opposed to an actual discrepancy between ability and achievement testing results?
• How do school-based special education evaluation teams determine which students are labeled LD?
Participants
• All students who were referred to the school study team at one of the participating schools in five districts.
• One hundred fifty students were included in this study. Methods Used to Answer the Research Questions
• Students were administered a number of ability and achievement tests, and teachers completed several checklists and rating scales.
• All instruments were administered because the results could be applied to determine if scores supported eligibility in the areas of LD, Attention Deficit Hyperactivity Disorder (ADHD), Mental Retardation (MR), Emotional and Behavior Disorders (EBD), or a combination of these categories. (ADHD is not a category of special education, but is a related condition that might influence referral and ultimately eligibility under other categories).
• Researchers independently reviewed scores collected by the school’s actual assessment team and determined which students met the state’s eligibility criteria for one of these diagnoses.
• School teams also independently reviewed the student scores and independently determined which students did and did not meet criteria.
• The students that researchers determined eligible were compared to those the school teams determined eligible.
6
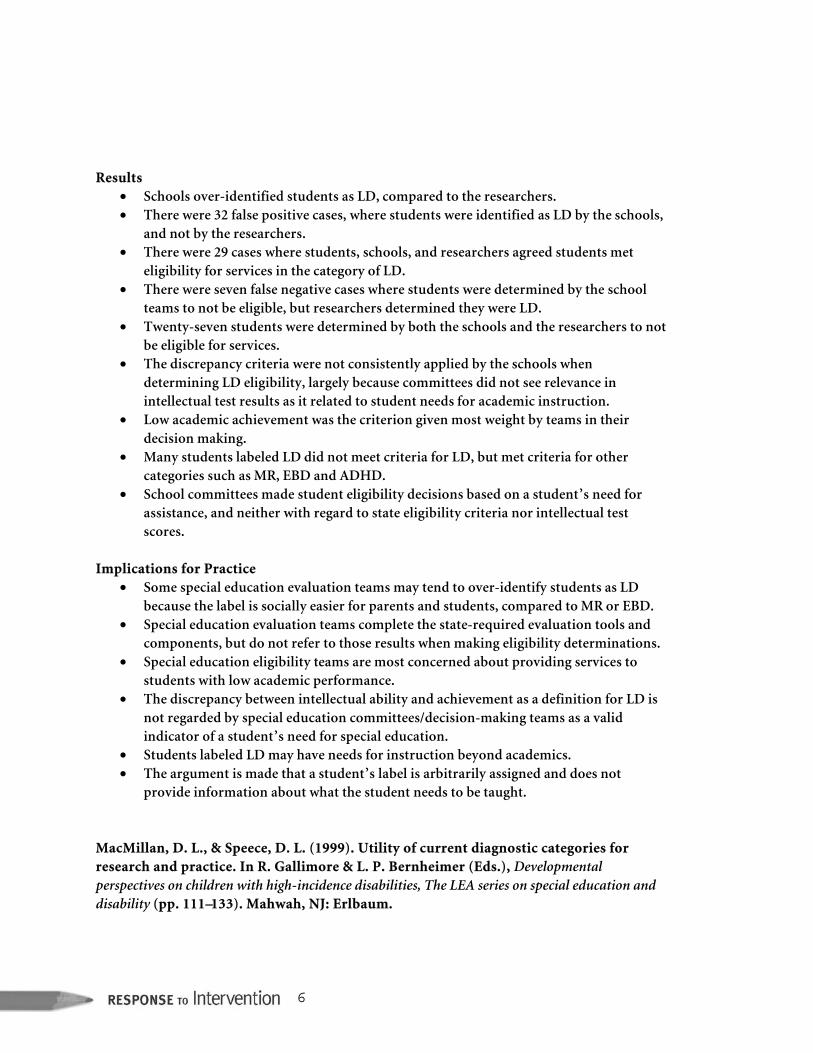
Results • Schools over-identified students as LD, compared to the researchers. • There were 32 false positive cases, where students were identified as LD by the schools,
and not by the researchers. • There were 29 cases where students, schools, and researchers agreed students met
eligibility for services in the category of LD. • There were seven false negative cases where students were determined by the school
teams to not be eligible, but researchers determined they were LD. • Twenty-seven students were determined by both the schools and the researchers to not
be eligible for services. • The discrepancy criteria were not consistently applied by the schools when
determining LD eligibility, largely because committees did not see relevance in intellectual test results as it related to student needs for academic instruction.
• Low academic achievement was the criterion given most weight by teams in their decision making.
• Many students labeled LD did not meet criteria for LD, but met criteria for other categories such as MR, EBD and ADHD.
• School committees made student eligibility decisions based on a student’s need for assistance, and neither with regard to state eligibility criteria nor intellectual test scores.
Implications for Practice
• Some special education evaluation teams may tend to over-identify students as LD because the label is socially easier for parents and students, compared to MR or EBD.
• Special education evaluation teams complete the state-required evaluation tools and components, but do not refer to those results when making eligibility determinations.
• Special education eligibility teams are most concerned about providing services to students with low academic performance.
• The discrepancy between intellectual ability and achievement as a definition for LD is not regarded by special education committees/decision-making teams as a valid indicator of a student’s need for special education.
• Students labeled LD may have needs for instruction beyond academics. • The argument is made that a student’s label is arbitrarily assigned and does not
provide information about what the student needs to be taught. MacMillan, D. L., & Speece, D. L. (1999). Utility of current diagnostic categories for research and practice. In R. Gallimore & L. P. Bernheimer (Eds.), Developmental perspectives on children with high-incidence disabilities, The LEA series on special education and disability (pp. 111–133). Mahwah, NJ: Erlbaum.

7
Purpose of Paper • The LD eligibility criterion should be based on direct assessments and intervention
response, rather than a discrepancy model. • The authors’ discussion is based on:
1. the weakness of IQ testing; 2. the need to reduce over-identification of minority students; 3. the need for consistency between school classification and state classification; 4. the lack of validity for the IQ-achievement discrepancy; and 5. conflicting paradigms.
The authors discuss the following points:
• IQ testing for MR and LD eligibility is not valid because IQ tests are not predictive of student classroom performance.
• Minority students tend to perform poorly on IQ tests, indicating potential bias in this measurement approach.
• Minority students have been over-identified for special education under the categories of LD or MR due to low IQ scores or low academic achievement resulting from poverty, language non-proficiency (i.e., English as a second language) and/or other environmental factors.
• Special education evaluation teams are not labeling students with LD based on state criteria, but rather based on low achievement. Even in the case of students who meet eligibility criteria for MR, it is easier and has been considered less stigmatizing for the teams to label students with LD.
o One study found that of 800 students labeled with LD, only 30% met the discrepancy criteria used in their state.
o It is estimated that 52–70% of students with LD do not meet state eligibility criteria.
• Several studies have found that there is not a conclusive difference between students with LD and students who are low-achieving.
• The philosophy and assessment systems need to change to focus on the observable problem, intervention and measurement of observable change.
Recommendations for Future Research
• There may be a difference between low-achieving students (with or without LD) who respond to intervention and those who do not. More research needs to be conducted to examine this possibility.
• There is significant evidence against the validity of the IQ-achievement discrepancy approach to diagnosis. Moreover, significant research has demonstrated that low-achieving students are not significantly different from IQ-discrepant students.

8
Implications for Practice • The synthesis of research is conclusive that IQ-achievement discrepancy is not a valid
diagnostic criterion for LD. Too much emphasis is placed on IQ testing for both LD and MR eligibility.
• The use of IQ tests is not valid as predictive measures of specific educational need, especially with students of minority ethnicity.
• Achievement testing and the application of treatments to determine which students respond to the treatment and which students continue to struggle, may be a more valid criterion to use for the identification of students with LD.
Vaughn, S., & Linan-Thompson, S. (2003). What is special about special education for students with learning disabilities? The Journal of Special Education, 37, 140–205. Purpose of Paper
• The authors summarize the research dispelling the myth of aptitude-by-treatment interactions. An aptitude-by-treatment interaction is the process of matching instruction or treatment to some measured aptitude.
• Research has demonstrated that when students with LD and/or students in the third tier of a three-tiered model of intervention are provided effective instruction with good treatment integrity, they can make significant and educationally important gains in their skills.
Delivery of Instruction
• The authors argue persuasively that the delivery of instruction cannot be based on the student’s label or a test score, but rather should be based on direct assessment of their academic skills. Additional points include:
• Instruction should be explicit and systematic and should target students’ weak skill areas.
• Small-group and paired instruction can be more effective than large-group instruction. • One-on-one instruction that is intense and focused on particular reading skills can be
effective. • Elementary students at risk for academic difficulties who are provided additional daily
instruction/intervention can catch-up to their peers. Three-Tier Model of Service and Instruction
• In the tiered model described in this article, students move between different tiers based on progress monitoring results and mastery of skills taught. The three tiers described are as follows.
o Tier I is defined as primary instruction in the general education classroom. (Also see Chapter 8: Improving Core Instruction for All Students: Tier I Application, page 75.)

9
o Tier II is defined as intervention in or out of the general education classroom, conducted 5 times per week for 20–40 minute sessions. (Also see Chapter 9: Improving Instruction in Schools Using Supplemental Instruction: Tier II Application, page 87.)
o Tier III is defined as tertiary intervention for special education students or students who did not respond to 20 weeks of Tier II intervention. This is the most intense level of instruction. Instruction is changed promptly based on progress monitoring data to ensure effectiveness of instruction. (Also see Chapter 10: Intensive Instruction: Tier III Application, page 99.)
Advantages of the Three-Tier Model
• All students are monitored, and those at risk can receive instructional services as needed.
• The progress of students with LD is monitored systematically and changes are made to their instruction depending on their learning needs.
• The model can be used at both elementary and secondary levels. To insure treatment integrity occurs when instructing students with needs at Tier II and Tier III levels, teachers need to be trained.
• Training programs need to ensure that teachers are taught reliable and valid intervention techniques and the importance of treatment integrity as it applies to improving the performance of students being instructed at Tiers II and III.
• Special education teachers in particular should be trained in the three-tier model to understand their role in service delivery at Tier III (monitoring student progress, changing instruction as needed, delivering interventions with integrity and providing intensive instruction).
• (Also see Chapter 14: The Importance of Treatment Integrity in RtI Implementation, page 153.)
Implications for Practice
• LD “services” are intended to be different from general education in that they are a more intense implementation of effective instructional practices.
• The three-tier model is an effective way to provide services to all students.

10
References
Algozzine, B., & Korinek, L. (1985). Where is special education for students with high prevalence handicaps going? Exceptional Children, 51, 388–394.
Algozzine, B., & Ysseldyke, J. (1982). Classification decisions in learning disabilities.
Educational and Psychological Research, 2, 117–129. Algozzine, B., & Ysseldyke, J. (1983). Learning disabilities as a subset of school failure: The over
sophistication of a concept. Exceptional Children, 50, 242–246. Bocian, K. M., Beebe, M. E., MacMillan, D. L., & Gresham, F. M. (1999). Competing paradigms in
learning disabilities classification by schools and the variations in meaning of discrepant achievement. Learning Disabilities Research and Practice, 14, 1–14.
Dean, V. J., & Burns, M. K. (2002). Inclusion of intrinsic processing difficulties in LD diagnostic
models: A critical review. Learning Disabilities Quarterly, 25, 170–176. Forness, S. R., Keogh, B. K., & MacMillan, D. L. (1998). What is so special about IQ? The limited
explanatory power of cognitive abilities in the real world of special education. Remedial and Special Education, 19, 315–322.
Forness, S. R., Bennett, L., & Tose, J. (1983). Academic deficits in emotionally disturbed children
revisited. Journal of American Academy of Child Psychiatry, 22, 140–144. Fuchs, D. (1996). Educational intervention and students with learning disabilities. Learning
Disabilities: A Multidisciplinary Journal, 7, 63–67. Gersten, R., Vaughn, S., Deshler, D., & Schiller, E. (1997). What we know about using research
findings: Implications for improving special education practice. Journal of Learning Disabilities, 30, 466–476.
Haight, S.L., Patricia, L.A., & Burns, M.K. (2001). A statewide analysis of the eligibility criteria
and procedures for determining learning disabilities. Learning Disabilities: A Multidisciplinary Journal, 11, 39-46.
Hammill, D.D. (1990). On defining learning disabilities: An emerging consensus. Journal of
Learning Disabilities, 23, 74-84.

11
Lester, G., & Kelman, M. (1997). State disparities in diagnosis and placement of pupils with learning disabilities. Journal of Learning Disabilities, 30, 599–607.
Lopez, M. F., Forness, S. R., & MacMillan, D. L. (1996). Children with attention deficit
hyperactivity disorder and emotional or behavioral disorders in primary grades: Inappropriate placement in the learning disability category. Education and Treatment of Children, 19, 286–299.
Macmann, G. M., & Barnett, D. W. (1999). Diagnostic decision making in school psychology:
Understanding and coping with uncertainty. In C. R. Reynolds & T. B. Gutkin (Eds.), The handbook of school psychology (3rd ed., pp. 519–548). New York: Wiley.
Macmann, G. M., Barnett, D. W., Lombard, T. J., Belton-Kocher, E., & Sharpe, M. N. (1989). On
the actuarial classification of children: Fundamental studies of classification agreement. The Journal of Special Education, 23, 127–149.
MacMillan, D. L., Gresham, F. M., & Bocian, K. M. (1997). The role of assessment in qualifying
students as eligible for special education: What is and what’s supposed to be. Focus on Exceptional Children, 30, 1–18.
MacMillan, D. L., Gresham, F. M., & Bocian, K. M. (1998). Discrepancy between definitions of
learning disabilities and school practices: An empirical investigation. Journal of Learning Disabilities, 31, 314–326.
MacMillan, D. L., & Speece, D. L. (1999). Utility of current diagnostic categories for research
and practice. In R. Gallimore & L. P. Bernheimer (Eds.), Developmental perspectives on children with high-incidence disabilities, The LEA series on special education and disability (pp. 111–133). Mahwah, NJ: Erlbaum.
Reschly, D. J. (2002). Change dynamics in special education assessment: Historical and
contemporary patterns. Peabody Journal of Education, 77, 117–136. Reschly, D. J., & Hosp, J. L. (2004). State SLD identification policies and practices. Learning
Disability Quarterly, 27, 197–213. Reynolds, C. R. (1984). Critical measurement issues in learning disabilities. Journal of Special
Education, 18, 451–476. San Miguel, S. K., Forness, S. R., & Kavale, K. A. (1996). Social skills deficits and learning
disabilities: The psychiatric comorbidity hypothesis. Learning Disability Quarterly, 19, 252–261.

12
Singer, J., Palfrey, J., Butler, J., & Walker, D. (1989). Variation in special education classification across school districts: How does where you live affect what you are labeled? American Educational Research Journal, 26, 261–281.
Speece, D. L., & Case, L. P. (2001). Classification in context: An alternative approach to
identifying early reading disability: Journal of Educational Psychology, 93, 735–749. Speece, D. L., & Cooper, D. H. (1990). Ontogeny of school failure: Classification of first grade
children. American Educational Research Journal, 27, 119–140. Vaughn, S., & Linan-Thompson, S. (2003). What is special about special education for students
with learning disabilities? The Journal of Special Education, 37, 140–205. Warner, T. D., Dede, D. E., Garvan, C. W., & Conway, T. W. (2002). One size does not fit all in
specific learning disability assessment across ethnic groups. Journal of Learning Disabilities, 35, 500–508.

13
Chapter 2
Problems in Identification of Learning Disabilities
Using IQ-Achievement Discrepancy The term “learning disability” (LD) was coined by Samuel Kirk in 1963, but was not operationally defined in federal regulations until 1977. The diagnostic approaches varied quite a bit in the almost 15 years between the two events, including clinical judgment and measures of psycholinguistic ability, with no particular approach being overwhelmingly adopted or supported by research. Thus, when the federal regulations for P.L. 94-142 were written, there was no agreed-upon diagnostic approach and the discrepancy model was born through a compromise. The discrepancy model states that a child is diagnosed with an LD if his/her academic achievement skills score significantly below average for the child’s age group and significantly below his/her intelligence. Research in the 30 years since then has questioned the validity of the discrepancy model, but it has persisted in practice. Specifically researchers consistently found that the discrepancy model did not differentiate so-called students with LD from low-achieving poor readers, was not consistently implemented, lacked adequate psychometric properties and did not inform instruction. Therefore, a new approach to diagnosing LD was needed. Aaron, P. G. (1997). The impending demise of the discrepancy formula. Review of Educational Research, 67, 461–502. Purpose of the Paper The author questioned if extensive research existed indicating how students with LD learn differently, or did not learn, compared to students without LD.
• The author cited research that demonstrates students with and without LD are not fundamentally different. In addition, no sound research was found that supported theoretical differences between these two groups.
• It is suggested that if students with and without LD were different learners, then there would be clear evidence of students with LD responding to certain forms of instruction and students without LD responding to another form of instruction. However, such a difference in learning between students with and without LD has not been found.
• In fact, both students with and without LD improve their reading skills when a reading problem is clearly identified and explicit instruction is provided to remediate the problem.

14
Implications for Practice • The IQ/achievement discrepancy is not an appropriate eligibility criterion for learning
disabilities. • An LD label based on the IQ/achievement discrepancy does not provide teachers with
any instructionally useful information. • An evaluation process focused on determining what reading-related skill the student is
lacking, implementing the needed instruction and checking if the instruction improves the student’s learning, is more beneficial to teachers and students.
Fletcher, J. M., Francis, D., Shaywitz, S., Lyon, G. R., Foorman, B., Stuebing, K., & Shaywitz, B. A (1998). Intelligent testing and the discrepancy model for children with learning disabilities. Learning Disabilities Research & Practice, 13, 186–203.
Purpose of the Paper This article offers a critique of the IQ-achievement discrepancy criteria by addressing the weaknesses in historical research and suggests different eligibility criteria. The authors begin their analysis by noting the following:
• Reading difficulties are attributed to theoretical organic causes such as brain injuries or problems with the central nervous system. The term “dyslexia” is created, yet no direct evidence of the condition is provided.
• Neurological experts and writings supporting the existence of an organic reason for learning problems, based on a discrepancy model, have not been documented.
• The category of Specific Learning Disability (SLD) was created in 1975, using a discrepancy model as part of the eligibility criteria.
• The Isle of Wight studies were epidemiological studies published in the 1960s. Regression procedures were used to label two groups of students (i.e., students with LD and students without LD) with reading problems that were proposed to be different from each other in important ways. These results were never replicated by other researchers due to many technical and experimental design weaknesses in the original two studies.
Several points are made regarding the weakness of the IQ-achievement discrepancy model. Some of these points include:
• Reading interventions have been shown to effectively improve the reading achievement of young children without LD and those diagnosed with LD.
• Low-achieving students and students with LD have more similar characteristics with regard to their reading difficulties, than differences.
• When compared on cognitive measures, IQ-discrepant, IQ-consistent (low-achieving) and low IQ score students do not differ in their cognitive performance.

15
The authors suggest that LD may be diagnosed more appropriately by focusing on reading achievement rather than a discrepancy between estimated IQ and achievement. Implications for Practice
• Historically, LD has been thought to have organic origins. These conclusions were not based on valid and reliable research.
• Numerous research studies have found that IQ testing in isolation and the IQ-achievement discrepancy model are not valid for identifying students with reading problems or with LD.
• Academic achievement tests are better evaluation tools for identifying low-achieving students and developing intervention plans than are IQ tests.
• By focusing on achievement testing and specific skill domains, a more direct connection can be made between assessment and intervention.
Gresham, F. M., & Witt, J. C. (1997). Utility of intelligence tests for treatment planning, classification and placement decisions: Recent empirical findings and future directions. School Psychology Quarterly, 12, 249–267.
Purpose of the Paper The authors of this paper make a number of general arguments against the use of IQ tests in educational diagnosis and treatment planning. These arguments include the following points:
1. Aptitude by Treatment Interaction (ATI) research has failed to find links between intellectual test results, or aptitudes, and treatments. ATI logic contends that certain measured aptitudes (measured internal characteristics of children) can be logically matched with certain instructional approaches to produce differential benefit or learning with the student. Example points made in the paper to substantiate this claim include:
• The authors suggest that if an ATI exists, then a student believed to be a verbal learner should learn more quickly when a verbal instructional mode is used. This has not been demonstrated in the research literature.
• It is a myth among special educators, school psychologists and the neuropsychological field, that modality matching is effective and can improve student learning.
• There is no neuropsychological research that has proven that ATIs exist. • Many research studies (11 cited by Gresham and Witt) have demonstrated that
ATIs do not exist. The absence of an empirical base for ATI logic led Cohen (who originally defined ATIs) to conclude that ATIs were a hallway of mirrors that should be summarily abandoned.
o On a measure of simultaneous processing, students who were supposedly “simultaneous” learners, scored lower than “sequential” learners on simultaneous processing tasks.

16
o IQ tests lack treatment validity or instructional utility. The results from IQ testing cannot be used to reliably suggest effective treatments.
o There is no empirical support demonstrating that intelligence test results have led to treatments that have improved students’ skills.
2. IQ test results do not differentiate between diagnoses. Arguments made are as follows.
• We cannot differentiate LD from low-achieving students using several psycho-educational measurement tools.
• There are more similarities between students with LD and low-achieving students than there are differences.
• Comparison of various measures looking at students’ cognitive skills, social skills, behavioral problems and attention problems have not found differences between IQ-discrepant (LD) and IQ-consistent students.
• IQ tests cannot accurately predict a student’s reading skills. 3. IQ tests are administered by school psychologists to comply with federal law, but
results are not used when determining eligibility for different categories of special education.
• School professionals are more likely to use the LD label for students who are low-achieving, regardless if there is an IQ-achievement discrepancy, or if students have low IQ scores that may make them eligible for services under the category of Mental Retardation (MR).
4. School psychologist services would be more beneficial if used for direct assessment
rather than for IQ testing. • Rather than administering IQ tests, school psychologists can use performance
assessment to identify a student’s academic strengths, weaknesses and potential intervention needs.
• Instead of administering IQ tests, school psychologists can use curriculum materials to determine if a student exhibits a skill deficit (i.e., a performance problem that requires a skill-building intervention) or performance deficit (i.e., a performance problem that requires a motivation-building intervention), thereby gathering information directly related to the student’s instructional needs.
Implications for Practice
• Special education staff should not assume that IQ tests can be used to validly plan effective interventions.
• Students with LD are not different from low-achieving students in their instructional needs.

17
• While IQ tests are administered frequently by educational teams, the results often are not used accurately when making differential diagnoses, such as LD versus MR.
• IQ testing does not produce beneficial outcomes for students or teachers in providing useful, instructionally relevant information.
• Direct assessment would be a better use of a school psychologist’s training and time than giving and interpreting IQ tests.
Vaughn, S., Gersten, R., & Chard, D. J. (2000). The underlying message in LD intervention research: Findings from research syntheses. Exceptional Children, 67, 99–114.
Purpose of the Paper The authors reviewed research in the skill areas commonly reported to be challenging for students with LD: reading comprehension, higher-order processing and writing. They synthesized the findings regarding techniques found to be most effective with students labeled LD.
• Effective interventions used with LD students were also found to be equally effective with non-LD students with average to above average academic achievement.
• Effective techniques described and employed with LD students should be used as class-wide interventions to improve learning for all students.
Specifically, the authors cited research that they found the following strategies effective.
• Instruction should be made visible with examples, and explicit to students such as employing the use of step strategies.
• Interactive dialogue between students and students and between teachers is helpful in providing critical feedback to the learner as well as providing the learner with practice in synthesizing and relaying information to others.
• Instruction should focus on mastery of basic skills as well as advanced skills, but not should overlook the importance of mastering fundamentals.
• Small groups and pairs of students working together can be effective for improving reading and writing skills because students engage in dialogue about concepts.
• It is important to ensure that the level of task difficulty is appropriate, that students understand the relevance of the task, and that they spend sufficient time practicing skills.
Implications for Practice
• There are several research-based effective instruction and intervention strategies that can be used by teachers to improve student learning, regardless if students have a special education label.

18
• Teachers and administrators could use this list in a practical way, as a framework for determining which of these techniques are currently being employed, and those that could be added/revised to improve outcomes for students.
Siegel, L. S. (1988). Evidence that IQ scores are irrelevant to the definition and analysis of reading disability. Canadian Journal of Psychology, 42, 201–215.
Purpose of the Paper The purpose of this paper was to identify the weaknesses of the four assumptions related to intellectual testing and LD identification. The four assumptions are:
1. IQ tests measure intelligence. 2. Intelligence and achievement are independent and LD will not affect IQ scores. 3. IQ tests predict academic performance. 4. Students with reading disabilities differ systematically by IQ.
These assumptions are challenged by citing research studies, and reviewing intellectual tests. Findings from the studies are as follows.
• IQ tests do not measure intelligence. Intelligence is defined by the author as problem-solving, adapting to the environment and logical reasoning. However, examination of intelligence tests shows that they actually measure: expressive language, memory, fine motor, factual knowledge, mental arithmetic, speed of processing and responding.
• LD does affect IQ scores. When IQ subtests require application of reading-related skills such as vocabulary, students with LD score lower on such subtests. Research has shown that students with lower IQ scores can increase their scores when provided instruction and practice related to the tasks on the subtest. Many students with LD may struggle with these types of tasks due to poor reading or academic skills, resulting in a lower score. Also, lower IQ scores by LD students do not mean that they have lower intelligence.
• IQ tests do not predict reading performance. The author cites research that demonstrates that students of all estimated IQ levels are able to learn various reading skills.
• The performance of students with reading disabilities does not differ by estimated IQ. o Regardless of estimated IQ, all students with reading disabilities performed much
poorer on phonological tasks and decoding nonsense words compared to their peers without LD.
• Furthermore, some students with LD with lower estimated IQs performed poorly, but performed better on the phonological tasks than students with LD with higher estimated IQs.
Implications for Practice
• IQ testing is not predictive of student academic performance. • IQ testing does not determine a student’s actual intelligence. • IQ test performance does not predict specific academic instructional need and is not useful for
teachers in determining students’ instructional needs.

19
• Students with reading disabilities perform similarly on phonological tasks irrespective of estimated IQ.
Stuebing, K., Fletcher, J., LeDoux, J., Lyon, G. R., Shaywitz, S., & Shaywitz, B. (2002). Validity of IQ-discrepancy classifications of reading disabilities: A meta-analysis. American Educational Research Journal, 39, 469–518.
Issue of Concern The IQ-achievement discrepancy model as a valid criterion for determining if students are eligible for special education has been repeatedly challenged. Research Questions
• What is the validity of IQ-discrepancy classifications of reading disabilities? • Is there a difference between IQ-discrepant and IQ-consistent groups on reading-
related skills? Participants A meta-analysis of performance across many studies was conducted.
• Forty-six studies addressing the validity of the IQ-achievement discrepancy as a classification for low-performing readers were reviewed.
Methods Used to Answer the Research Questions
Aggregated effect sizes were determined across research studies. Inclusion criteria were: • Studies had to clearly define students as IQ-discrepant or IQ-consistent, as opposed to
simply LD or non-LD. • Studies that looked at other factors, such as cognition and behavior as well as
academics, were included to see if these other factors predicted differences in student performances.
Results
• First, the IQ-achievement discrepancy as an eligibility criterion for a reading disability was found to not be valid.
• Second, the IQ-discrepant and IQ-consistent groups did not differ with regard to academic performance or behavior and differed only slightly in cognitive ability.
• Third, researchers found that low-performing readers, with and without discrepancies, did not show meaningful differences in the following reading constructs: phonological awareness, rapid naming, verbal short-term memory and vocabulary skills.

20
Implications for Practice • The current study was a meta-analysis. Results from several studies were aggregated to
determine if there was a difference between low-performing readers who did and did not have a discrepancy between their academic achievement and their estimated cognitive ability.
• This meta-analysis synthesized many related studies and determined that there is a substantial amount of evidence against the IQ-achievement discrepancy model as a valid criterion for LD.
• Findings suggested that some criteria other than the IQ-achievement discrepancy, such as the use of reading-related skills tests, should be used as part of the process in identifying students who may need special education services.
References
Aaron, P. G. (1997). The impending demise of the discrepancy formula. Review of Educational
Research, 67, 461–502. Case, L. P., Speece, D. L., & Molloy, D. E. (2003). The validity of a response-to-instruction
paradigm to identify reading disabilities: A longitudinal analysis of individual differences and contextual factors. School Psychology Review, 32, 557–582.
Fletcher, J. M., Francis, D., Shaywitz, S., Lyon, G. R., Foorman, B., Stuebing, K., et. al. (1998).
Intelligent testing and the discrepancy model for children with learning disabilities. Learning Disabilities Research & Practice, 13, 186–203.
Fletcher J. M., Shaywitz, S. E., Shankweiler, D. P., Katz, L., Liberman, I. Y., Stuebing, K. K.,
Francis, D. J., Fowler, A. E., & Shaywitz, B. A. (1994). Cognitive profiles of reading disability: Comparisons of discrepancy and low achievement definitions. Journal of Educational Psychology, 86, 6–23.
Foorman, B. R. (Ed.), (2003). Preventing and Remediating Reading Difficulties: Bringing Science to
Scale, pp. 73–120. Baltimore, MD: York Press. Francis, D. J., Shaywitz, S. E., Steubing, K. K., & Shaywitz, B. A. (1996). Developmental lag
versus deficit models of reading disability: A longitudinal, individual growth curve analysis. Journal of Educational Psychology, 88, 3–17.
Fuchs, L., & Fuchs, D. (1997) Use of curriculum-based measurement in identifying students with learning disabilities. Focus on Exceptional Children, 30, 1–16.

21
Gresham, F. K. (2002). Reponsiveness to intervention: An alterative approach to the identification of Learning disabilities. In R. Bradley, L. Danielson, D. Hallahan (Eds.), Identification of Learning Disabilities: Research to Practice, pp. 467–419. Mahwah, NJ: Erlbaum.
Gresham, F. M., & Witt, J. C. (1997). Utility of intelligence tests for treatment planning, classification, and placement decisions: Recent empirical findings and future directions. School Psychology Quarterly, 12, 249–267.
Iversen, S., & Tunmer, W. (1993). Phonological processing skills and the reading recovery program. Journal of Educational Psychology, 85, 112–126.
National Reading Panel (2000). Teaching children to read: An evidence based assessment of the scientific research literature on reading and its implications for reading instruction. Washington, DC: National Institute of Child Health and Human Development.
Neisworth, J. T., & Bagnato, S. J. (1992). The case against intelligence testing in early intervention. Topics in Early Childhood Special Education, 12, 1–20.
Pinnell, G. S. (1989). Reading recovery: Helping at risk children learn to read. Elementary School Journal, 90, 161–184.
Scanlon, D. M., & Vellutino, F. R. (1996). Prerequisite skills, early instruction, and success in first grade reading: Selected results from a longitudinal study. Mental Retardation and Development Disabilities, 2, 54–63.
Scanlon, D. M., & Vellutino, F. R. (1997). A comparison of the instructional backgrounds and cognitive profiles of poor, average, and good readers who were initially identified as at risk for reading failure. Scientific Studies of Reading, 1, 191–215.
Scanlon, D. M., Vellutino, F. R., Small, S. G., & Fanuele, D. P. (April, 2000). Severe reading difficulties: Can they be prevented? A comparison of prevention and intervention approaches. Paper presented at the annual conference of the American Educational Research Association, New Orleans, LA.
Scanlon, D. M., Vellutino, F. R., Small, S. G., Fanuele, D. P., & Sweeney, J. (June, 2003). The short and long term effects of different types of early literacy intervention on reading comprehension. Paper presented at the annual conference of the Society for the Scientific Study of Reading, Boulder, CO.

22
Shaywitz, B., Fletcher, J., Holahan, J., & Shaywitz, S. (1992). Discrepancy compared to low achievement definitions of reading disability: Results from the Connecticut Longitudinal Study. Journal of the American Medical Association, 264, 998–1002.
Shaywitz, S. E., Escobar, M. D., Shaywitz, B. A., Fletcher, J. M., & Makuch, R. W. (1992). Evidence that dyslexia may represent the lower tail of a normal distribution of reading ability. New England Journal of Medicine, 326, 145–150.
Siegel, L. S. (1988). Evidence that IQ scores are irrelevant to the definition and analysis of reading disability. Canadian Journal of Psychology, 42, 201–215.
Siegel, L. S. (1989). IQ is irrelevant to the definition of learning disabilities. Journal of Learning Disabilities, 22, 469–478.
Speece, D. L., & Case, L. P. (2001). Classification in context: An alternative approach to identifying early reading disability. Journal of Educational Psychology, 93, 735–749.
Stanovich, K. E. (1986). Matthew effects in reading: Some consequences of individual differences in the acquisition of literacy. Reading Research Quarterly, 21, 360–407.
Stanovich, K. E., & Siegel, L. S. (1994). Phenotypic performance profile of children with reading disabilities: A regression-based test of the phonological-core variable-difference model. Journal of Educational Psychology, 86, 24–53.
Stuebing, K., Fletcher, J., LeDoux, J., Lyon, G. R., Shaywitz, S., & Shaywitz, B. (2002). Validity of IQ-discrepancy classifications of reading disabilities: A meta-analysis. American Educational Research Journal, 39, 469–518.
Torgesen, J. K. (2000). Individual differences in response to early interventions in reading: The lingering problem of treatment resisters. Learning Disabilities Research and Practice, 15, 55–64.
Torgesen, J. K., & Wagner, R. K. (1998). Alternative diagnostic approaches for specific developmental reading disabilities. Learning Disabilities Research and Practice, 13, 220–232.
Vaughn, S., Gersten, R., & Chard, D. J. (2000). The underlying message in LD intervention research: Findings from research syntheses. Exceptional Children, 67, 99–114.

23
Vellutino, F. R., Fletcher, J. M., Snowling, M. J., & Scanlon, D. M. (in press). Specific reading disability (dyslexia): What have we learned in the past four decades? Journal of Child Psychology and Psychiatry.
Vellutino, F. R., Steger, B. M., Moyer, S. C., Harding, C. J., & Niles, J. A. (1997). Has the perceptual deficit hypothesis led us astray? Journal of Learning Disabilities 10, 375–385.
Vellutino, E., Scanlon, D. M., Sipay, E., Small, S., Pratt, A., Chen, R., & Denckla, M. (1996). Cognitive profiles of difficult-to-remediate and readily remediated poor readers: Early intervention as a vehicle for distinguishing between cognitive and experiential deficits as basic causes of specific reading disability. Journal of Educational Psychology, 88, 601–638.

24

25
Chapter 3
Problems with Minority Overrepresentation in the Historical Special Education System
In 1984, the Larry P. v. Riles case in the U.S. Court of Appeals concluded that minority students were over-represented in special education in California, and the use of IQ tests to diagnose mental retardation was directly linked to this problem. This finding started a lengthy debate about the role and validity of aptitude testing among children from minority groups. Moreover, research has consistently pointed out that children from minority groups continue to be over-represented in special education. Therefore, one of the fundamental tenets of any alternative diagnostic model for learning disabilities would have to be fair treatment of children from minority groups. Not only has research suggested that response to intervention (RtI) does not lead to gender and ethnic biases, using this approach to diagnosing LD can actually reduce existing disproportionate representation of ethnic minorities in special education. (Also see Chapter 16: Using RtI with Special Populations, page 177.) Perhaps more important than representation in special education is the amount of actual learning experienced by children from minority groups. In a seminal study by Hosp and Reschly (2004), academic achievement was found to predict the diagnosis of LD even among ethnic minorities. Thus, the important variable is a lack of learning rather than inclusion in a minority group. RtI must address low achievement levels among at-risk and minority children as well. Bahr, M. W., & Fuchs, D. (1991). Are teachers’ perceptions of difficult-to-teach students racially biased? School Psychology Review, 20, 599–608. Issue of Concern Over-representation of minority students in special education has been a topic of concern, and several sources of bias have been identified. Teacher referral is the first step in the process of special education identification and therefore should be evaluated for bias. Research Question
• Are teachers racially biased in referring students for special education? Participants
• 20 Caucasian teachers and 20 African-American teachers

26
Methods Used to Answer the Research Question • Every teacher identified one student as “difficult-to-teach,” that being the child in their
class most likely to be referred to and placed in special education. • Various evaluation tools were administered. Students were administered two subtests
from an academic achievement test. Teachers completed behavior rating forms. In addition, classroom observations and teacher interviews were conducted.
o Teacher interviews were conducted to determine what concerns the teacher had about his/her nominated students. Teacher interview responses were coded as negative, positive or neutral.
o Teachers completed the Revised Behavior Problem Checklist, which is a standardized behavior rating scale. Teachers also completed a rating scale developed by the researcher regarding the severity of the student’s behaviors and how they perceived the child’s appropriateness for referral.
o Classroom observations were conducted to determine the frequency of the problem behavior compared to classroom peers.
o The data were analyzed using analyses of variance. Results
• African-American and Caucasian teachers did not perceive a difference in behavior between their African-American and Caucasian students.
• African-American students were more often referred by both African-American and Caucasian teachers, possibly because African-American students had lower academic skills than Caucasian students.
o The authors cite the following two related reasons for this occurrence. o Teachers reported more concerns about student academic work issues
than behavior issues for both African-American and Caucasian students.
o Second, African-American students’ test scores on the achievement subtests were significantly lower compared to the Caucasian students.
Implications for Practice Poor student academic achievement may be the reason for over-identification of minority students in special education, rather than teacher racial bias.
• Focusing intervention and prevention efforts on low-performing students in early grades could reduce the number of low-performing students of minority ethnicity and thereby reduce the over-identification of minority students for special education.

27
Hosp, J. L., & Reschly, D. J. (2004). Disproportionate representation of minority students in special education. Exceptional Children, 70, 185–199. Issue of Concern There is a need to determine the role that academic achievement plays in over-representation of minority students.
• Research has consistently determined that over-representation of certain groups of students in special education is related to poverty and ethnicity, variables that are not under the control of schools.
• The role that academic achievement may play in over-representation of poor minority students in special education has not been researched.
Research Questions
• What proportion of the variance in ratios of representation rates (of minorities) is accounted for by blocks of academic, demographic and economic variables both independently and incrementally?
• Does academic achievement account for significant proportions of that variance? Participants
• Existing data were used from 16 states. Methods Used to Answer the Research Questions
• School district/state-wide data included student academic achievement data, as well as student demographic and economic data. As there is no national achievement test, district-level achievement data were collected from each state individually.
• Using state data (academic achievement) and census data, “blocks” of variables were defined and analyses were performed to determine the degree to which these variables predicted special education placement.
Results
• Academic achievement was found to be an important variable when predicting relationships between economic, demographic and special education identification.
• Academic achievement was the strongest factor in predicting the diagnosis of LD. Implications for Practice
• This study was the first of its kind, focusing on the predictive validity of academic achievement as a strong reason for high percentages of minority students in special education.
• Academic achievement is a factor (as opposed to demographic and economic factors) that is under the control of schools and therefore should receive significant focus from school personnel and administration.

28
• Academic prevention and intervention programming should be implemented with all students, particularly those at risk for academic failure.
MacMillan, D. L., Gresham, F. M., & Lopez, M. F. (1996). Comparison of students nominated for pre-referral interventions by ethnicity and gender. Journal of Special Education, 30, 133–151. Issue of Concern Over-identification of minorities and males in special education has been a historical problem.
• Prereferral is where the process begins, and because it is the first step, should be carefully scrutinized.
Research Question
• Do African-American, Caucasian or Hispanic children recommended for pre-referral interventions differ as a function of ethnicity or gender factors?
Participants
• Participants included 150 children in second, third and fourth grade who were recommended for pre-referral interventions.
Methods Used to Answer the Research Question
• Student test scores in the areas of academics, intellectual functioning and behavior were analyzed.
Results
Ethnicity • All three ethnic groups (African-American, Caucasian, Hispanic) showed low academic
achievement. • Caucasian children showed higher reading achievement and estimated verbal IQs
relative to the other two groups. • African-American children showed higher incidences of behavior problems relative to
Hispanic children.
Gender • There were more problem behaviors reported for males than for females. • There were no differences in cognitive and academic achievement measures between
males and females. However, teachers rated females higher in academic achievement than males.
Implications for Practice

29
• There is not a significant relationship between a particular ethnic group and gender that would lead to a conclusion of discriminatory practices against a particular gender or ethnic group, in this particular study with this particular sample.
• Objective measures of performance did not indicate a difference in achievement between males and females, but teachers perceived females to be higher achieving than males. Hence, teachers’ perceptions of student achievement may have been biased by gender in this particular sample.
Reschly, D. J., Kicklighter, R., & McKee, P. (1988a). Recent placement litigation: I. Regular education grouping: Comparison of Marshall (1984, 1985) and Hobson (1967, 1969). School Psychology Review, 17, 9–21. Purpose of Paper Two cases, Hobson versus Hansen and Marshall versus Georgia, involved the use of different criteria to group students, which resulted in disproportionately higher numbers of African-American students placed in lower-level classes and fewer African-American students placed in higher-level classes. Hobson (1967, 1969)
• The case involved a school district’s use of IQ test results to place the students into classes. As a result, there were a disproportionate number of African-American students in lower-level classes.
o The student selection decisions were based on the assumption that IQ tests measure one’s learning ability.
o Furthermore, students were placed in lower-level classes based on the notion that the ability to learn cannot be changed through instruction.
• Students were not grouped according to academic achievement or curriculum performance, nor were they moved from their groups if their classroom performances changed.
Marshall (1984, 1985)
• This case involved a school district’s use of achievement, curriculum performance and teacher judgment as grouping criteria for classes. The grouping resulted in a disproportionately high number of African-American students in lower achievement groups and very few in higher achievement groups.
• The school district grouped all the students (i.e., Caucasian and students of minority ethnicity) according to achievement, as described below.
o The model was applied to students in kindergarten through sixth grade. o Grouping was accomplished using academic performance in a basal
curriculum, achievement test results and teacher judgment. o No intellectual tests were used for grouping the students.

30
o Flexible placement decisions were made for students involved. That is, students were moved to different classes based on their learning performance and rate of growth.
o More resources were allocated to these lower classes, smaller student-to-teacher ratios were used, the curriculum was more individualized and higher-quality instruction was provided.
o According to Georgia state test results, low-performing Caucasian students and students of minority ethnicity showed stronger and faster learning under this model than previous models.
o Data presented at the trial proved that socioeconomic status (SES) was a stronger predictor of student achievement than was race, and therefore supported the higher numbers of children of minority ethnicity being served in the lower classes.
Results
• Hobson: The judge ruled against the school district for making classroom placement decisions based on IQ tests. The use of IQ tests in classroom placement was not beneficial to the students.
• Marshall: The judge ruled in favor of the school district for making classroom placement decisions based on achievement tests. The use of achievement/academic information in class placement decisions was beneficial to the students. The case went to the appellate court, and again, the judge upheld the ruling of the lower court.
Implications for Practice
• The historical significance of these court decisions must be acknowledged. Hobson was determined in 1967 and 1969. Marshall was determined in 1984 and 1985.
• The southern states involved in the lawsuits had just begun to truly integrate the public schools when the Hobson case was ruled.
• The Marshall case was pivotal because it found that if done properly, grouping by achievement could greatly improve student performance outcomes for students who were considered victims of segregation.
• It is critical for schools to understand the distinction between ability and achievement grouping and to not say “ability” grouping, when the term “achievement” is intended.
• “Achievement” grouping is extremely common and, when used appropriately, provides better learning opportunities for students of all levels. Students can receive instruction that meets their needs (i.e., remediation or acceleration).
Reschly, D. J., Kicklighter, R., & McKee, P. (1988b). Recent placement litigation: III. Analysis of differences in Larry P., Marshall and S-1 and implications for future practices. School Psychology Review, 17, 39–50.

31
Purpose of Paper This paper reviews the historical court cases addressing issues of minority over-representation in special education programming. Some of the main points are as follows:
• The use of IQ tests resulting in over-identification of students of minority ethnicities as having mental retardation was a serious concern.
• The lack of predictive validity of IQ tests was determined by the courts. • The use of IQ tests for grouping students was found not to be valid. • The use of achievement information, basal curriculum performance and teacher
opinion can be used to determine student course placements. • Achievement grouping that is flexible, that provides more individualization for
students and that produces strong student gains is legal and effective for students. • Accurate reporting of numbers and percentages of minority students in districts,
schools, and special programming were also critical factors in determining over-identification.
• Experts in assessment were asked to testify at these trials, and lessons were learned about how to effectively and ineffectively communicate assessment and research topics to attorneys, judges and juries.
The results of these cases are as follows:
• IQ tests were not considered valid tools to use for course placement and did not accurately predict student academic performance.
• Poverty and underachievement were determined to be the stronger factors explaining why there are large numbers of minorities in low-level courses or identified as mildly mentally retarded or educably mentally retarded (MMR or EMR).
• Programming provided in these lower-level courses resulted in improved academic performance for the students served there.
• It was demonstrated that effective lower-level courses provided additional resources to meet the needs of students.
• The accuracy of reporting percentages of minorities at all levels is critical. To do this, schools must: o accurately report student enrollment data by group and o report the percentage of minority students receiving all levels of programming
(e.g., general education, Chapter 1, Compensatory Education, resource services by subtype).
• Experts testifying in court about assessment issues should use evidence such as video samples and empirical support to make arguments via examples.
Implications for Practice
• IQ tests lack predictive validity and should not be used as primary decision-making tools.

32
• Accurate reporting of percentages of students of minority ethnicity in the district, schools and all levels of programming is critical.
• Academic achievement may be used to determine student course placement. • It is important to ensure that “achievement” grouping is used appropriately, as it can
greatly benefit students. Caution must be exercised to prevent flexible skill grouping from becoming “ability” grouping.
• Flexible skill grouping requires sensitive and technically adequate progress monitoring measures to routinely (i.e., several times each year) estimate student instructional need and adjust programming accordingly.
References Abbott, M., Walton, C., Tapia, Y., & Greenwood, C. R. (1999). Research to practice: A “blueprint” for
closing the gap in local schools. Exceptional Children, 65, 339–352. Arnold, M., & Lassmann, M. E. (2003). Overrepresentation of minority students in special
education. Education, 124, 230–236. Artiles, A. J., & Trent, S. C. (1994). Overrepresentation of minority students in special
education: A continuing debate. Journal of Special Education, 27, 410–438. Bahr, M. W., & Fuchs, D. (1991). Are teachers’ perceptions of difficult-to-teach students
racially biased? School Psychology Review, 20, 599–608. Cloud, N. (1993). Language, culture, and disability: Implications for instruction and teacher
preparation. Teacher Education and Special Education, 16, 60–72. Cummins, J. (1986). Psychological assessment of minority students: Out of context, out of
focus, out of control. Journal of Reading, Writing, and Learning Disabilities International, 2, 9–18.
Duffey, J. B., Salvia, J., Tucker, J., & Ysseldyke, J. (1981). Nonbiased assessment: a need for
operationalism. Exceptional Children, 47, 427–434. Eads, P., Arnold, M., & Tyler, J. L. (1995). Special education legislation affecting classroom
teachers and administrators. Reading Improvement, 32, 9–12. Fuchs, D., & Fuchs, L. S. (1989). Effects of examiner familiarity on black, Caucasian, and
Hispanic children: A meta-analysis. Exceptional Children, 55, 303–308.

33
Gerber, M. M., & Semmel, M. I. (1984). Teacher as imperfect test: Reconceptualizing the referral process. Educational Psychologist, 19, 137–148.
Gresham, F. M., Reschly, D. J., & Carey, M. P. (1987). Teachers as “tests”: Classification
accuracy and concurrent validation in the identification of learning disabled children. School Psychology Review, 16, 543–653.
Harrison, L., Arnold, M., & Henderson, D. (1995). Strategies for improving African-American
parental participation in the special education process. Instructional Psychology, 22, 230–233.
Hosp, J. L., & Reschly, D. J. (2004). Disproportionate representation of minority students in
special education. Exceptional Children, 70, 185–199. Klingner, J. K., & Edwards, P. A. (2006). Cultural considerations with response to intervention
models. Reading Research Quarterly, 41, 108–117. Lietz, J. J., & Gregory, M. K. (1978). Pupil race and sex determinants of office and exceptional
educational referrals. Educational Research Quarterly, 3, 63–66. MacMillan, D. L., Gresham, F. M., & Lopez, M. F. (1996). Comparison of students nominated
for pre-referral interventions by ethnicity and gender. Journal of Special Education, 30, 133–151.
MacMillan, D. L., Hendrick, I. G., & Watkins, A. V. (1988). Impact of Diana, Larry P., and PL
94-142 on minority students. Exceptional Children, 54, 426–432. MacMillan, D. L., & Reschly, D. J. (1998). Overrepresentation of minority students: The case for
greater specificity or reconsideration of the variables examined. Journal of Special Education, 32, 15–25.
Maheady, L., Algozzine, B., & Ysseldyke, J. E. (1984). Minority overrepresentation in special
education: A functional assessment perspective. Special Services in the Schools, 1, 5–19. Messick, S. (1984). Assessment in context: Appraising student performance in relation to
instructional quality. Educational Researcher, 13, 3–8. Murdick, N., Gartin, B., & Arnold, M. (1994). A method for the reduction of bias in educational
assessment. The Journal of Instructional Psychology, 21, 83–89. Prieto, A. G., & Zucker, S. H. (1981). Teacher perception of race as a factor in the placement of
behaviorally disordered children. Behavioral Disorders, 7, 34–38.

34
Reschly, D. J. (1984). Beyond IQ test bias: The national academy panel’s analysis of minority EMR overrepresentation. Educational Researcher, 13, 15–19.
Reschly, D. (1997). Disproportionate minority representation in general and special education
programs: Patterns, issues, and alternatives. Des Moines, IA: Mountain Plains Regional Resource Center.
Reschly, D. J., Kicklighter, R., & McKee, P. (1988a). Recent placement litigation: I. Regular
education grouping: Comparison of Marshall (1984, 1985) and Hobson (1967, 1969). School Psychology Review, 17, 9–21.
Reschly, D. J., Kicklighter, R., & McKee, P. (1988b). Recent placement litigation: III. Analysis of
differences in Larry P., Marshall and S-1 and implications for future practices. School Psychology Review, 17, 39–50.
Reschly, D., & Ysseldyke, J. E. (1995). Social psychology paradigm shift. In A. Thomas & J.
Grimes (Eds.), Best practices in school psychology III (pp. 17–33). Bethesda, MD: National Association of School Psychologists.
Russo, C. J., & Talbert-Johnson, C. (1997). The overrepresentation of African American children in special education, the resegregation of educational programming? Education and Urban Society, 29, 136–148.
Serwatka, T., Deering, S., & Grant, P. (1995). Disproportionate representation of African
Americans in emotionally handicapped classes. Journal of Black Studies, 25, 492–506. Shinn, M. R., Tindal, G. A., & Spira, D. A. (1987). Special education referrals as an index of
teacher tolerance: Are teachers imperfect tests? Exceptional Children, 54, 32–40. Smith, G. (1983). Desegreation and assignment of children to classes for the mildly retarded
and learning disabled. Integrated Education, 21, 208–211. Tobias, S., Zibrin, M., & Menell, C. (1983). Special education referrals: Failure to replicate
student-teacher ethnicity interaction. Journal of Education Psychology, 75, 72–76. Wehmeyer, M. L. (2001). Disproportionate representation of males in special education
services: biology, behavior, or bias? Education and Treatment of Children, 24, 28–45. Wright, W., & Santa Cruz, R. (1983). Ethnic composition of special education programs in
California. Learning Disabilities Quarterly, 6, 387–394. Zucker, S. H., & Rrieto, A. G. (1977). Ethnicity and teacher bias in educational decisions.
Instructional Psychology, 4, 2–4.

35
Chapter 4
The Need to Focus on Student Outcomes The President’s Commission on Excellence in Special Education (2002) found special education in this country operates under a “culture of compliance” (p. 4) and recommended that special educators stop focusing on process and start emphasizing outcomes. Response to Intervention (RtI) allows for a more direct link between individualized instruction and student outcomes because the outcomes precisely inform the instruction and the utility of instruction is determined by its very effect on student learning outcomes. The traditional approach to special education has relied on high-inference decisions where data were collected and high-level inferences were made regarding within-student causes of academic deficits. These inferences most often provided very little information about a student’s instructional needs. An RtI model takes a different approach. In RtI, practitioners make low-level inferences about the etiology of student learning problems. The most likely reasons for student learning problems are examined first (e.g., lack of quality instruction) and decisions about instruction are made based on observed student performance on school-based tasks. As education has evolved toward an outcome-oriented enterprise, attention has been paid to the effectiveness of all educational programs, including special education. Research syntheses of the effectiveness of special education are often discouraging. These studies typically conclude that historical special education has been modestly effective at best. In contrast, RtI research frequently finds significant positive effects for both individual students and groups of students, perhaps because the use of RtI shifts our focus from high-inference to low-inference assessments, from internal causes of problems to environmental causes of problems (such as curriculum and instruction) and from process to results. National Commission on Excellence in Education (NCEE). (1983). A nation at risk: The imperative for educational reform. Washington, DC: U.S. Government Printing Office. Purpose of Paper
• In 1981, the paper “A Nation at Risk” was written by the National Commission on Excellence, per request by the Secretary of Education, T. H. Bell. He requested that the commission focus on secondary education through college level.
• The main findings were that American students were not demonstrating academic skills that were competitive in the global market.
Examples cited included the following:

36
• An international comparison of student achievement, conducted 10 years ago, found that American students were never first or second on 19 academic tests. When compared to other industrialized nations, American students ranked last seven times.
• Between 1975 and 1980, there was a 72% increase in remedial mathematics courses in public 4-year colleges. Now these remedial courses constitute one-quarter of all mathematics courses taught in those institutions.
• On most standardized tests, the average achievement of high school students is lower now than it was 26 years ago.
• If students do not have high-level skills, they will not be able to compete internationally in the areas of science, technology and computer science.
• The commission reported worrisome findings in the areas of curriculum content, performance expectations, time allocated to teaching and teaching methods. Some of these concerns included the following.
o In other countries, from sixth grade up, math and science courses are required. o American students compared to students in other first-world countries have
less homework, attend fewer school days, and do not receive enough actual instruction during the allocated school day’s time.
o Students are not explicitly taught how to study and then experience failure in college.
o It is difficult to recruit high-quality teachers. There are teacher shortages in math, science and physics specifically.
• The commission concluded that there was a need to improve excellence in education for all students.
Recommendations were made, based on the findings and with input from experts. Recommendations included the following.
• Establish rigorous standards for content areas as well as continue to improve curricula. Specific recommendations included:
o Require rigorous content in science, social studies, English, computer science and foreign language courses.
o Curriculum materials should reflect a high level of rigor, and publishers should be required to provide empirical evidence of their effectiveness.
o Curriculum should be current and reflect recent advances in technology and science.
Recommendations for time, teaching, leadership and fiscal support included the following.
• Students should have more homework and be taught study skills. The school day and the school year should be extended. • Teachers should improve the allocated time they have with classes by increasing the
percentage of time spent actively engaged with students. • Attendance policies should include incentives and be strictly enforced.

37
• Placement, grouping and promotion of students should all be based on instructional needs rather than age.
• Salaries and standards for acquiring a teacher’s license should be increased. o Top college graduates in science and math should be encouraged to attain a
teaching certificate by grants, loans or other incentives. • School administrators and their boards should encourage rigorous graduation
standards and requirements for instruction. • The government should provide funding to support these initiatives as well as offer
college scholarships to students who demonstrate academic excellence. Implications for Practice
• The need to demonstrate and ensure that U.S. schools produce measurable and improved student outcomes is critical.
• Maintaining the same educational programming course as the 1970s will not produce students who can succeed in college or compete in the global workforce.
• We need to increase the rigor in U.S. classes, no matter the instructional level of the students and the requirements for graduation.
• We need to increase the amount of homework given to students, because increased practice through homework improves achievement.
• Teachers need to make sure that their entire class hour is academically engaging for students, and precious time isn’t wasted on classroom management or non-instructional tasks.
• Schools need to provide interventions to students in need to improve the outcomes for all students.
Fuchs, L. S., & Fuchs, D. (1998). Treatment validity: A unifying concept for reconceptualizing the identification of learning disabilities. Learning Disabilities Research and Practice, 13, 204–219. Purpose of the Paper The authors proposed an LD eligibility model called treatment validity as an alternative to the classic discrepancy model for LD eligibility. This paper was one of the first attempts to move special education identification practices away from a process-oriented approach to an outcome-oriented approach.
• Under this model, students are provided interventions and their performance is monitored.
• The decision-making approach introduced is called “dual discrepancy.” Students are dually discrepant if they have both low skill performance levels and have slow growth rates.

38
Treatment validity is the unifying concept The authors used curriculum-based measurement as the constant measure to determine student growth across interventions. They conceptualized treatment validity as a four-phase process. Phase I
• Analyze the average growth rate in the class and determine if the average growth rate is acceptable.
Phase II • Compare the individual student’s level and growth rate to that of the level and rate of
other students in the classroom. Phase III
• The teacher implements two interventions with the student, if the student’s scores improve on level and rate, interventions continue and the student is considered to be “responding to the intervention.”
• If the student does not respond, move to Phase IV. Phase IV
• A special education teacher attempts interventions with the student. Students who demonstrate improvement with special education services are made eligible to continue to receive those services. Students who do not show improvement return to Phase III instruction under the logic that the more restrictive placement of special education should be demonstrated to benefit the child (i.e., have treatment validity) for the child to be made eligible to receive services there.
Curriculum-based measurement (CBM) is the tool used for the treatment validity model for several reasons.
• CBM scores have been demonstrated to meet necessary psychometric criteria: (a) validity, (b) reliability, (c) the availability of multiple parallel forms and (d) sensitivity to instruction or utility for progress monitoring.
• CBM is quick to administer, quick to score and is inexpensive. • CBM is useful in planning instruction for students. • CBM is helpful to instructors because it can be used to measure student academic
growth/response to instruction or interventions. The Dual Discrepancy model is viewed as practical.
• Application of the dual discrepancy model to existing study data indicated that it has potential as a reliable and valid method for identifying students not responding to instruction.
• CBM student data must be available for dual discrepancy to be applied. o All students should be measured approximately three times throughout the
school year to determine progress and identify students who are not

39
progressing at Phase I. More frequent monitoring should occur in subsequent phases.
o Software exists to enter student data and generate graphs displaying class-wide student performance scores, as well as individual student graphs used for documenting the effects of interventions.
o Training people to administer and score CBM is easy and inexpensive. It is already being used. When this article was published in 1989, the Minneapolis school district was mentioned as applying the dual discrepancy model to determine LD eligibility, via a waiver granted from the State Department of Education in Minnesota. Minneapolis was applying the first three phases of the model. Implications for Practice
• The four-phase model of determining LD eligibility strives to directly connect the pre-referral phase to the special education eligibility process.
• For the dual discrepancy model to be useful, students would need to be discrepant on level and slope in comparison to their peers. Additionally, they would need to demonstrate lack of response to educational interventions provided in the general classroom environment.
• The eligibility process would not involve the use of intellectual testing or standardized achievement testing.
Glass, G. (1983). Effectiveness of special education. Policy Studies Review, 2, 65–78.
Purpose of Paper Glass reviews the statistics reported in meta-analyses of special education instructional effectiveness.
• A meta-analysis was conducted by Carlberg in 1979. • Fifty studies were included, reporting 322 effect sizes for students who received
approximately two years of special education programming. • An effect size documents in standard units the practical difference between
performance under the effects of treatment and control conditions. • This meta-analysis examined the effect sizes reported in studies examining special
education. In general, effect sizes in the social sciences of .3 are considered small, .5 is considered moderate, and .8 is considered large (Cohen, 1988).
• Effect sizes that are negative mean not only that the treatment was not effective, but that it was actually harmful, causing students to get worse over time.

40
Results
• At a general level, student scores in academic achievement and social skills decreased once they were placed in special education.
For academic achievement, 127 effect sizes were analyzed, resulting in an average negative effect of –.15.
For social-emotional-behavioral outcomes, 161 effect sizes were analyzed, resulting in an average negative effect of –.11.
The data were also analyzed by disability label. • Students with mild mental retardation experienced an average negative effect of –.14 if
they were served in special education. • So-called “slow learner” students (this definition is not explained further)
demonstrated an effect size of –.34. • Students with LD or EBD had an average effect size of .29 (very slight). • Glass summarized the results, “Special education placement showed no tangible
benefits whatsoever for the pupils. Either someone thinks otherwise or special placements continue to be made for reasons other than benefits to pupils” (p. 69).
• A meta-analysis of 34 studies that applied differential diagnosis-prescriptive teaching, training students in the aptitudes presented in the Illinois Test of Psycholinguistic Abilities (ITPA) proved ineffective. Effect sizes were zero, negative, or so marginal that they were not significant.
Why was special education not effective?
• Teachers were being trained in differential diagnosis-prescriptive teaching, or modality matching, the technique proven ineffective by the meta-analyses cited by the author.
• The author makes the plea for teacher training programs to stop training their students in techniques that have not been proven effective.
• He suggests that teachers simply teach to the problem that is observable, “one teaches math so that pupils will learn math” (p. 74).
• He also suggests that teacher expectations not be lowered because of a student’s label, but rather that special education and general education teachers demonstrate equally high standards with their students.
Implications for Practice
• There is a history of special education being ineffective. • Constant attention should be paid by special education administrators to review the
effectiveness of special education instruction in their buildings and programs by measuring student outcomes.
• There are special education teachers who were trained and, unfortunately, continue to be trained, in applying the modality-matching theory to their instruction with students.

41
• Training programs need to teach empirically supported or evidence-based practices to teachers.
• Special education administrators should ensure that all special education teachers use academic performance data such as CBM to guide instruction, and not aptitude or aptitude treatment interaction (ATI) data.
• Special education teachers should have high expectations for all students, and convey these expectations to their students.
Gresham, F. (2001, August). Responsiveness to intervention: An alternative approach to the identification of learning disabilities. In R. Bradley, L. Danielson, & D. P. Hallahan (Eds.). Identification of learning disabilities: Research in practice (pp. 467–519). Mahwah, NJ: Erlbaum.
Purpose of Paper The authors discuss the weaknesses surrounding the classic intellectual-achievement discrepancy criteria for LD, and propose that an RtI model may be more appropriate.
• Key terms are introduced in the paper to familiarize readers with the vocabulary used in response to intervention.
o Response to Intervention is a change in behavior (academic or social) that is the result of an intervention.
o Resistance to Intervention is a change in behavior that does NOT occur as a result of an intervention that is implemented with integrity.
o Treatment Validity is the degree to which assessment results lead to treatment that improves student learning or behavior outcomes.
Three models of RtI were introduced:
1. The predictor-criterion model is applying interventions that are most likely to result in improved student reading achievement, and seeing if the student makes progress as a result of the intervention(s).
• Research was cited that supports this model, but more work needs to be done as to the amount of time that interventions should be provided to students.
2. The dual discrepancy model is said to have occurred when a student has been provided effective classroom interventions and adaptations, continues to perform below his or her peers and fails to show adequate growth. Furthermore, the student improves when provided with an intervention by special education staff.
• Research was cited that demonstrated this criterion to be reliable and valid at accurately identifying students who required special education intervention to show improved learning outcomes.

42
3. The applied behavior analytic model analyzes antecedents, the behavior of concern and consequences to determine intervention selection for an individual student.
• Research supports this model as effective in improving outcomes for students, but the criteria can only be applied in a single case design format.
• (Also see Chapter 13: Using RtI in Social-Emotional-Behavioral Areas: Tier III Application, page 139.)
Implications for Practice
• RtI has substantial research to support it as an alternative eligibility criterion for LD. • More work needs to be done to address the following topics: treatment integrity,
selection of the “best” RtI models and applications, determining the amount of time that interventions should be applied, establishing criteria for defining responsiveness and non-responsiveness and examination of cost/benefit issues.
References
Burns, M. K., Tilly, D. W., III, Gresham, F. M., Telzrow, C. F., Shapiro, E. S., & Kovaleski, J. F. (2006).
Response-to-intervention debate: Using data over dogma. Communiqu é, 34, 5–6. Case, L. P., Speece, D. L., & Molloy, D. E. (2003). The validity of a response to instruction paradigm to
identify reading disabilities: A longitudinal analysis of individual differences and contextual factors. School Psychology Review, 32, 557–582.
Deno, S. L., & Fuchs, L. S. (1987). Developing curriculum-based measurement systems for data-based
special education problem solving. Focus on Exceptional Children, 19 (8), 1–16. Fuchs, D., & Fuchs, L. S. (1992). Limitations of a “feel-good” approach to consultation. Journal of
Educational and Psychological Consultation, 3, 93–97. Fuchs, L. S., & Fuchs, D. (1998). Treatment validity: A unifying concept for reconceptualizing the
identification of learning disabilities. Learning Disabilities Research and Practice, 13, 204–219. Fuchs, D., & Fuchs, L. S. (2006). Introduction to Response to Intervention: What, why, and how valid
is it? Reading Research Quarterly, 41, 93–99. Fuchs, L. S. (1993). Enhancing instructional programming and student achievement with
curriculum-based measurement. In J. J. Kramer (Ed.), Curriculum-based assessment (pp. 65–104). Lincoln, NE: Buros Institute of Mental Measurement, University of Nebraska.

43
Fuchs, L. S. (2003). Assessing intervention responsiveness: Conceptual and technical issues. Learning Disabilities Research & Practice, 81, 172–186.
Fuchs, L. S. & Fuchs, D. (1998). Treatment validity: A unifying concept for reconceptualizing
the identification of learning disabilities. Learning Disabilities Research and Practice, 13, 204–219.
Fuchs, L. S. & Fuchs, D. (1992). Identifying a measure of monitoring student reading progress. School
Psychology Review, 21, 45–58. Fuchs, L. S., Fuchs, D., & Hamlett, C. L. (1989b). Effects of instrumental use of curriculum-based
measurement to enhance instructional programs. Remedial and Special Education, 10, 43–52. Fuchs, L. S., Fuchs, D., & Hamlett, C. L. (1994). Strengthening the connection between assessment
and instructional planning with expert systems. Exceptional Children, 61, 138–146. Fuchs, L. S., Fuchs, D., Hamlett, C. L., & Allinder, R. M. (1998). The reliability and validity of skills
analysis within curriculum-based measurement. Diagnostique, 14, 203–221. Fuchs, L. S., Deno, S. L., & Mirkin, P. K. (1984). The effects of frequent curriculum-based
measurement and evaluation on student achievement, pedagogy and student awareness of learning. American Educational Research Journal, 21, 449–460.
Gersten, R., Vaughn, S., Deshler, D., & Schiller, E. (1997). What we know about using research
findings: Implications for improving special education practice. Journal of Learning Disabilities, 30, 466–476.
Gersten, R., & Edomono, J. A. (2006). RtI (Response to Intervention): Rethinking special education
for students with reading difficulties (yet again). Reading Research Quarterly, 41, 99–108. Glass, G. (1983). Effectiveness of special education. Policy Studies Review, 2, 65–78.
Good, R. H., III, Simmons, D. C., & Kameenui, E. J. (2001). The importance and decision-
making utility of a continuum of fluency-based indicators of foundational reading skills for third grade high-stakes outcomes. Scientific Studies of Reading, 5, 257–288.
Kavale, K. A., & Forness, S. R. (1999). Effectiveness of special education. In C. R. Reynolds & T.
B. Gutkin (Eds.), The handbook of school psychology (3rd ed., pp. 984–1024). New York: Wiley.
Marston, D. (1987–1988). The effectiveness of special education: A time-series analysis of
reading performance in regular and special education settings. Journal of Special Education, 21, 13–26.

44
Marston, D., Fuchs, L. S., & Deno, S. L. (1986). Measuring pupil progress: A comparison of
standardized achievement tests and curriculum-related measures. Diagnostique, 11, 71–90.
Marston, D., & Magnusson, D. (1988). Curriculum-based assessment: District-level
implementation. In J. Graden, J. Zins, & M. Curtis (Eds.), Alternative educational delivery systems: Enhancing instructional options for all students (pp. 137–172). Washington, DC: National Association of School Psychologists.
Schatschneider, C., Fletcher, J. M., Francis, D. J., Carlson, C. D., & Foorman, B. R. (2004).
Kindergarten prediction of reading skills: A longitudinal comparative analysis. Journal of Educational Psychology, 96, 265–282.
Vaughn, S., Linan-Thompson, S., & Hickman, P. (2003). Response to instruction as a means of
identifying students with reading/learning disabilities. Exceptional children, 69, 391–409. Wesson, C. L., King, R., & Deno, S. L. (1984). Direct and frequent measurement: If it’s so good for us,
why don’t we use it? Learning Disability Quarterly, 7, 45–48. Wesson, C. L., Skiba, R., Sevik, B., King, R., & Deno, S. L. (1984). The effects of technically adequate
instructional data on achievement. Remedial and Special Education, 5, 17–22.

45
Chapter 5
Major Policy Analyses Supporting Movement Toward RtI
In recent decades, a number of agencies and panels have examined current educational practices, as well as recent educational research, to make recommendations for improvement of the current system. Many policy documents based on the review of current empirical evidence have been produced, and authors have provided policy recommendations. Overall, experts suggest that traditional referral and identification practices are inadequate methods and should no longer be used. (Also, see Chapters 1 and 2: Problems with Inaccurate and Inconsistent Identification of Students with Disabilities in Special Education, page 3 and Problems in Identification of Learning Disabilities Using IQ-Achievement Discrepancy, page 13.) Despite these recommendations, IQ-achievement discrepancy models are still widely used. These models require a student to “fail” before they are provided with support. Because of this requirement, services are often delayed beyond the time when they can be most effective. Many policy analyses have suggested that implementing primary prevention strategies may prevent students from developing severe deficits and are much more effective than remedial programs. Many authors of the policy documents have stated that a multi-tiered RtI) model consistent with current federal regulations (IDEA, 2004; NCLB, 2001) should be implemented to address student learning challenges and prevent the over-identification of students with disabilities. A multi-tiered approach can be used to link the student’s needs with instructional resources in a school. The implementation of RtI models has been shown to be effective in linking student needs to intervention and enhancing student outcomes. Lyon, G. R., Fletcher, J. M., Shaywitz, S. E., Shaywitz, B. A., Torgesen, J. K., Wood, F. B. et al. (2001). Rethinking learning disabilities. In C. E. Finn, Jr., R. A. J. Rotherham, & C. R. Hokanson, Jr. (Eds.), Rethinking special education for a new century (pp. 259–287). Washington, DC: Thomas B. Fordham Foundation and Progressive Policy Institute. The authors propose that continued use of discrepancy analysis to identify students with specific learning disabilities (SLD) is inadequate and irresponsible. In addition, the authors assert that the traditional IQ-achievement discrepancy model may harm students more then it helps them because it delays treatment to students beyond the time when these treatments can be most effective. Prevention programs are more effective than remediation and will significantly lower the number of older children identified with SLD. The investigators estimate that the number of students identified and found eligible for special education will be reduced up to 70% through early identification and prevention programs.

46
Special education and remedial programs may be re-tooled to offer effective prevention services. Prevention services provided through general education will ultimately be more cost-efficient since limited funds can be used to provide intervention instead of conducting a costly special education eligibility determination and providing these services through special education. Implementation integrity or fidelity is a cornerstone of this prevention model. Intended outcomes will not be attained if the key ingredients are not correctly implemented. Based on current research, significant changes in teacher preparation, education policies and practices, and the implementation of early intervention and remediation programs must be put in place to improve the educational opportunities for all students. National Association of State Directors of Special Education (2005). Response to Intervention Policy Considerations and Implementation. RtI is described as practices that provide students with high-quality instruction and interventions based on students’ academic or behavioral needs. Student progress is systematically and frequently monitored to make instructional decisions and develop goals. Student data are evaluated to make important educational decisions. RtI can be used and applied when making decisions for students across general education and special education. Child outcome data should be used to make accurate decisions about intervention and instruction effectiveness. These data may also be used to identify students with academic and behavioral problems, to determine eligibility or resource allocation, to develop effective interventions and to evaluate programs. Applying an RtI model and using child outcome data can prevent over-identification of students with disabilities. The authors recommend a multi-tiered problem-solving model that is consistent with the Individuals with Disabilities Education Improvement Act (IDEA, 2004) and the No Child Left Behind Act (NCLB, 2002). As the student moves through each tier of the process, the intensity of services is increased to meet the needs of the individual student. The student’s response to the intervention provided at each tier is monitored, and the data are used to make decisions about the effectiveness of the interventions implemented. RtI has now been included in numerous federal law and policy documents. Analyses of these policies have unanimously recommended that changes in the current delivery systems should be implemented and must be consistent with RtI practices. RtI is described as an integrated approach that delivers services across general education and special education. These areas of the educational system may be unified and integrated though RtI and the use of specific decision-making processes that are based on child outcomes. Strong leadership and collaborative planning are essential to ensure effective implementation. Leaders in the educational system should identify resources from various sources to fund the successful implementation of an RtI model.

47
National Council of Teachers of Mathematics. Executive Summary of Principles and Standards for School Mathematics. http://www.nctm.org/standards/12752_exec_pssm.pdf The authors propose that all students must be provided the opportunities and support required to understand and learn mathematics. This policy proposal has broad relevance to RtI because RtI is grounded in the effective instruction and intervention literature. The National Council of Teachers of Mathematics (NCTM) executive summary identifies key components of effective instruction that may be generalized to other topic areas. Six principles are delineated in the executive summary. All students have the ability to learn mathematics if they are provided the opportunity to learn it through high-quality individualized instruction. Appropriate accommodations should be provided, and appropriately challenging content should be presented to students. A mathematics curriculum should be structured so that it focuses on important concepts and allows students to learn increasingly more sophisticated mathematical ideas as their skills develop. Effective math teachers must know and understand the math concepts they are teaching. Math may be taught by aligning facts with procedural proficiency and mathematical concepts to allow students to learn more effectively. Data must be collected to monitor student learning and guide instruction. Students may use assessment to set goals and assume responsibility for their learning, and thereby become more independent learners. Finally, it is suggested that using technology can aid students in the development of understanding mathematics. National Reading Panel (2000). Report of the national reading panel. Teaching children to read: An evidence-based assessment of the scientific research literature on reading and its implications for reading instruction. (NIH Publication No. 00-4769). Washington, DC: U.S. Government Printing Office. The National Reading Panel (NRP) undertook a systematic and comprehensive review of how students best learn to read and reached conclusions with implications for policies governing reading instruction in the United States. The NRP found that teaching children to manipulate phonemes in words was highly effective. Phonological awareness training led to improvements in student’s phonological awareness, reading and spelling but was not sufficient as a comprehensive instructional program for reading. The effect of phonological awareness training maintained beyond the end of training and was effective for students identified with disabilities as well as non-identified peers. Systematic phonics instruction produced significant benefits for children in the primary grades. Fluency was described as one of the critical factors necessary for reading comprehension. The NRP concluded that repeated and guided oral reading fluency building procedures had a significant positive effect on comprehension, fluency, and word recognition across a variety of grade levels. The NRP did not find research indicating a positive relationship between silent reading programs and reading achievement.

48
The NRP found that vocabulary instruction led to gains in comprehension if the instructional method was appropriate for the age and ability of the student. The use of technology, specifically computers, was found to be more effective than some traditional methods of vocabulary instruction. The NRP found that teachers may need formal training in comprehension instruction techniques to teach comprehension effectively. Furthermore, the NRP concluded that teacher training and support was related to teacher use of effective instructional strategies in reading and therefore higher student achievement in reading. Hence, effective professional development programs to support the use of effective instructional strategies in reading were highlighted as a vital factor to improve reading achievement. This report showcased and summarized a great deal of research and knowledge that can be applied in the classroom to enhance reading achievement, as well as providing areas that require more research and understanding. (Also, see Chapters 8–10: Improving Core Instruction for All Students: Tier I Application, page 75; Improving Instruction in Schools Using Supplemental Instruction: Tier II Application, page 87; Intensive Instruction: Tier III Application, page 99.) Donovan, M. S., & Cross, C. T. (2002). Minority Students in Special and Gifted Education. Washington, DC: National Academy Press. This report found (as did its predecessor report from Heller, Holtzman, & Messick, 1982) that greater proportions of minority students were represented in high-incidence special education categories, including mild mental retardation, emotional disturbance and learning disabilities. Lack of effective instruction or classroom management prior to eligibility consideration has contributed to this problem. At the time that this document was written, there were no components in place to ensure that research-based instruction and management were used before identifying a student with a disability. Furthermore, the committee stated that there was a great deal of evidence to support the use of early identification and intervention to effectively combat both behavior and achievement issues as opposed to later identification and intervention. The committee criticized special education as a “wait to fail” model that waited to identify students until they were too far behind to “catch up” to their peers. The committee advocated for the use of universal screening procedures to identify students at risk early in their schooling and implementation of interventions proactively and preventatively. The committee challenged policymakers to alter the federal guidelines to better integrate special education and general education programs. Specifically, the committee advocated that (1) eligibility for special education services should only occur once students demonstrate that they are performing significantly lower than typical levels of performance and do not respond sufficiently to research-based interventions; (2) states adopt universal screening procedures as a component of a multi-tiered intervention approach in general education; (3) pilot RtI models

49
be initiated in collaboration with universities and researchers to empirically evaluate their utility; and (4) teachers be provided with rigorous training and preparation to adequately serve a variety of students. (Also see Chapter 16: Using RtI with Special Populations, page 177.) President’ s Commission on Excellence in Special Education. A new era: Revitalizing special education for children and their families. Retrieved August 2, 2002 from http://www.ed.gov/inits/commissionsboards/whspecialeducation/reports.html This report emerged during the same year as the Donovan and Cross report and made several recommendations to revise eligibility determination processes. The commission recommended that students with academic and behavioral difficulties be identified early via a universal screening process and provided with early intervention programs that are implemented with integrity. A key recommendation of the commission was their advancement of the notion that assessment and screening tools should be selected because of their demonstrated ability to inform instruction and improve outcomes. The commission noted the disproportionate increase in rates of high-incidence disabilities and identified potential causes. The commission recommended that RtI be incorporated into school systems as a component of the identification and assessment process. Data obtained throughout this process should be used to provide students with necessary services. Early screening and intervention programs may be funded if states are given the flexibility to use their IDEA funds to support such early intervention programs. The tools used for accountability and progress assessment should be designed to include modifications and accommodations for students with disabilities. Rand Reading Study Group. (2002). Reading for understanding. Santa Monica, CA: RAND. The Rand Reading Study Group (RRSG) was asked to develop a research agenda for the most important issues in literacy. It was decided that the research proposal should focus on reading comprehension. Current research programs on reading comprehension have been helpful, but have not been well-funded, systematic or applied on a large scale. Research has indicated that those students who can read at their grade level in the lower grades (i.e., third grade) may not necessarily be able to comprehend proficiently in later grades. It is important that teachers explicitly instruct students on comprehension techniques starting at a young age. Teachers must be trained specifically in the use of comprehension instruction techniques through preservice and inservice professional development programs. Student progress must be monitored, and child outcome data must be used at every stage of learning to ensure improved reading comprehension.

50
Similar to each of the panel reports described in this document, the RRSG proposed three areas in educational systems to be addressed: instruction, teacher preparation and assessment. The group identified three components of reading comprehension: the reader, the text and the activity or purpose for reading. It was emphasized that the reader brings a set of individual characteristics including: cognitive abilities, experiences, motivation and knowledge. These characteristics are related to how a student comprehends, but there is not adequate research on improving these characteristics. Additionally, it is not well understood how English language learners can develop their limited vocabulary or linguistic knowledge. If research is developed in comprehension instruction, practitioners will be able to implement strategies that have a long-term positive effect on reading comprehension and allow readers to learn about numerous content areas. Furthermore, future research must take sociocultural differences into account when researching and understanding reading comprehension. Research conducted should be applicable to practitioners in the classroom and in guiding policy. The panel made the following recommendations.
• High-quality research should be conducted that builds on previous findings, is longitudinal in nature and identifies cumulative effects.
• Effective comprehension and reading instruction must be researched and fully understood.
• Teacher preparation and professional development programs should be researched and improved to provide students with state-of-the-art instruction.
• Better instruments for comprehension assessment should be developed. • Research-based benchmarks for adequate grade-level reading should be developed. • The assessments used should be closely tied to the curricula to identify students in
need of more intensive instruction and to inform instructional decisions. • Finally, the RRSG propose an increase in resources allocated to reading research to
fund the proposed research.
References Allington, R. L., & Woodside-Jiron, H. (1999). The politics of literacy teaching: How “research”
shaped educational policy. Educational Researcher, 28, 4–13. Donovan, M. S., & Cross, C. T. (2002). Minority Students in Special and Gifted Education.
Washington, DC: National Academy Press. Grimes, J., & Tilly, W. D., III (1996). Policy and process: Means to lasting educational change.
School Psychology Review, 25, 465–476. Heller, K. A., Holtzman, W. H., & Messick, S. (Eds.)(1982). Placing children in special education:
A strategy for equity. Washington, DC: National Academy Press.

51
Lyon, G. R., Fletcher, J. M., Shaywitz, S. E., Shaywitz, B. A., Torgesen, J. K., Wood, F. B. et al.
(2001). Rethinking learning disabilities. In C. E. Finn, Jr., R. A. J. Rotherham & C. R. Hokanson, Jr. (Eds.), Rethinking special education for a new century (pp. 259–287). Washington, DC: Thomas B. Fordham Foundation and Progressive Policy Institute.
National Association of School Psychologists. (2002). Learning disabilities criteria:
Recommendations for change in IDEA reauthorization. NASP Communiqu é, 39, insert. National Association of State Directors of Special Education. (2005). Response to Intervention
Policy Considerations and Implementation. National Council of Teachers of Mathematics. Executive Summary of Principles and Standards
for School Mathematics. http://www.nctm.org/standards/12752_exec_pssm.pdf National Reading Panel. (2000). Report of the national reading panel: Teaching students to read: An
evidence-based assessment of the scientific research literature on reading and its implications for reading instruction: Reports of the subgroups. Bethesda, MD: National Institute of Child Health and Human Development, National Institutes of Health.
President’s Commission on Excellence in Special Education. A new era: Revitalizing special
education for children and their families. Rand Reading Study Group. (2002). Reading for understanding. Santa Monica, CA: RAND.

52

53
Chapter 6
Accuracy of Learning Disability Identification Using RtI
Response to Intervention (RtI) has been defined as “(1) providing high-quality instruction/intervention matched to student needs and (2) using learning rate over time and level of performance to (3) make important educational decisions” (NASDSE, 2006, pp. 5–6). RtI has been recognized as a research-based process which, when applied properly, can improve learning outcomes for all children and generate data to help identify children who may have disabilities. A number of methods have been described for conducting RtI and determining whether a response has been adequate or inadequate. As described in the articles below, universal screening and frequent progress monitoring yield data about student level of performance and growth over time that are more accurate and efficient than teacher referral. Within an RtI framework, the use of frequent progress monitoring allows professionals to make accurate decisions about students’ academic development. (Also see Chapter 7: Formative Assessment, page 63.) This model leads to early identification of students who are struggling and allows for the appropriate early intervention services to the students in need of them. Fuchs, L. S. (2003). Assessing intervention responsiveness: Conceptual and technical issues. Learning Disabilities: Research & Practice, 18, 172–186. Purpose of Paper When using RtI to identify learning disabilities, one must use a specified assessment process. Literature exploring assessment issues is reviewed, and the implementation of intervention responsiveness assessment (IRA) is discussed.
• The following three components should be considered when examining IRA. 1. The timing of the measurements. 2. A criterion must be established to differentiate “responders” from “non-
responders.” Students who do not meet the criterion for an adequate RtI are then identified as learning disabled (LD).
3. The nature of the intervention. • The author describes three approaches for measuring adequate response:
1. Final status: students are measured at the end of the intervention. 2. Growth model: monitored periodically throughout the intervention, and decisions
are made on amount of learning, not considering if they reached a level of performance.
3. Dual discrepancy: measures both performance level and growth rate, and can be applied anytime (not only at the end of the intervention).

54
• A standard must be applied to the scores to determine a cut point so that non-responders and responders may be identified. Example standards include:
o Normative sample: compared to all students in the distribution (i.e., they fall in the 25th percentile when compared to all students).
Limited norm: if the group is limited to a subset of students in the school.
o Benchmark: a standard that has been correlated to successful outcomes (i.e., a first-grade student should read 40 words read correctly per minute at the end of the year, and learn 1.5 words per work during intervention).
• Intervention delivery should be specified: o Within general education:
Adapting instruction in minor ways o Outside of general education:
More intensive problem solving, standard protocol interventions, usually in small groups.
• To illustrate the above differences in assessment, examples from the literature were reviewed. It was noted that all the studies combined the three IRA components.
Implications for Practice
• When using IRAs, a number of decisions must be made in all of the above areas. • Some of the studies indicated that IRAs, can improve consequential and construct
validity of identification decisions. • Due to the difference in methods used in IRA, the prevalence rates of LD will not be
consistent across sites. LD will mean different things in different areas and students identified may substantially vary.
• The general education model used may have some advantages over intensive models of treatment, as the model provides a full normative framework that can be used to make comparisons and therefore provides some conceptual and measurement advantages.
Case, L. P., Speece, D. L., & Molloy, D. E. (2003). The validity of a response-to-instruction paradigm to identify reading disabilities: A longitudinal analysis of individual differences and contextual factors. School Psychology Review, 32, 557–582. Issue of Concern Investigators tested an RtI model, taking into account individual student differences and environmental factors affecting the student.
• The model used was based on the first three phases of the Fuchs and Fuchs (1998) proposed model. These phases are as follows.
1. The overall rate of responsiveness in the classroom is assessed to determine if the instructional environment is adequate.

55
2. If the instructional environment of the classroom is found to be sufficient, then individual student decisions can be made. Students are identified as dually discrepant (DD) in a sound instructional environment when the student’s level and rate of performance (slope) is below the slope of the student’s peers.
3. Assessment results are used to enhance instruction and develop appropriate interventions in the general education setting.
Using this categorization leads to some empirical questions. Research Questions
• To determine if frequently dually discrepant (FDD) students demonstrated more severe reading, phonological and behavioral issues than other at-risk children.
• To compare the at-risk students on instructional environments (teacher quality, classroom activities and peers with lower skills).
• To gain a qualitative understanding of individual differences and environmental factors that may distinguish at-risk students from their peers.
Participants
• The elementary school served 680 students and was located in a suburban area in the mid-Atlantic states.
• Two groups of students in first and second grade were selected based on screening results.
Methods Used to Answer the Research Questions
• The students were screened with curriculum-based measurement (CBM) to identify “at-risk” and comparison samples. Children were categorized as “at-risk” if their scores fell below the 25th percentile in their respective classrooms. The comparison sample scored above the 30th percentile on the CBM screening measures.
• During the investigation, data were collected using child measures (e.g., CBM, Woodcock Johnson-Reading) and context measures (e.g., observations, interviews).
• Groups were formed based on the frequency of the student being identified as DD. • Those students identified as DD were provided with an intervention in the general
education classroom. Interventions were designed and developed during consultation meetings attended by the researchers, teachers and other appropriate school personnel.
• Based primarily on research-validated practices, one-third of the interventions involved phonological awareness and phonics instruction, one-third used partner reading activities and the remaining interventions focused on motivational and behavioral issues and reinforcement of these skills through computer programs.
• The general education teachers implemented each intervention for 8 weeks (the time spent on the intervention was not specified).

56
• Researchers observed and met with the teacher to provide support and determine that the intervention was carried out with fidelity (the first and last week). Also, two unannounced fidelity checks were made during the course of the intervention.
Results
• Quantitative and qualitative analyses were conducted. • The FDD students had significantly lower scores on all measures compared to students
that were at risk but were not identified as DD. • Results did not indicate that the FDD students received poorer instruction nor had
lower-skilled peers than students in the other groups. • Use of FDD as a criterion for identification under RtI shows promise. • The qualitative analysis demonstrated that the FDD students did not have equal access
to learning as the other students because the child’s temperament or “persona” and the instructional environment did not match (i.e., they responded well to some teacher personalities or classroom environments more than others).
Implications for Practice
• The results of this study indicate that the RtI model allowed the investigators to accurately identify a group of students in need of more intensive services (i.e., special education).
• These children consistently differed from the other at-risk groups of students on a number of measures.
Burns, M. K., & Senesac, B. K. (2005). Comparison of dual discrepancy criteria to assess response to intervention. Journal of School Psychology, 43, 393–406. Issue of Concern Investigators examined the DD method within an RtI framework to identify students in need of more intensive intervention.
• To be identified as DD, students must earn scores on performance and growth measures that are below their peers’ scores on these measures.
• No studies have compared the definitions within the DD method of identifying students using a dual discrepancy.
Research Questions
• Four definitions of DD were compared: o Student growth below the 25th percentile o Student growth below the 33rd percentile o Student growth below the 50th percentile o Student growth less than one standard deviation below the mean
• Which method of defining DD would best differentiate student reading ability as measured by a norm-referenced test of reading?

57
Participants
• Participants included 146 general education students in first through second grade from nine schools in Michigan. Students were nominated as experiencing reading difficulties by the students’ classroom teacher.
• All scored at or below the 25th percentile on a district-wide group assessment on reading.
Methods Used to Answer the Research Questions
• Once the students were identified, they participated in one of two different reading interventions: the Help One to Succeed Program (HOSTS, Blunt & Gordon, 1998), or received Title I support (interventions varied).
• Students’ RtIs were evaluated using DIBELS passages. Data reflecting reading skills growth and a measure following intervention were obtained.
• The Gray Oral Reading Test (GORT-4, Wiederhold & Bryant, 2001) was the standardized norm-referenced test used to determine student level of reading proficiency
• Students whose end-of-the-year Dynamic Indicators of Basic Early Literacy Skills (DIBELS) score fell within the at-risk criterion (fell below grade-appropriate benchmark goals) and whose fluency change score fell at or below the criterion for nonresponders (25th, 33rd, or 50th percentile, and one standard deviation) were categorized as DD.
• Once students were categorized in the DD group or not, the GORT-4 scores were compared between students.
Results
• All percentile rank models significantly differentiated the DD students from other students based on their reading score, but the standard deviation approach did not. Using DD is a superior method to the use of individual criteria; this superiority was stronger for the 25th and 33rd percentile rank groupings criterion.
• No ethnic or gender bias was observed. Implications for Practice
• The results of the study suggest that using the 25th and 33rd percentile criteria within the DD model may provide valid estimates of students requiring more intense intervention.
VanDerHeyden, A. M., Witt, J. C., & Naquin, G. (2003). Development of validation of a process for screening referrals to special education. School Psychology Review, 32, 204–227.

58
Issue of Concern Investigators examined accuracy of identification using a problem-solving model called problem validation screening (PVS).
• Accuracy was examined relative to other sources of identification, especially teacher referral.
• A decision-making model was used to measure the predictive power of RtI as a special education eligibility and identification tool.
Research Questions
• To quantify the psychometric adequacy of the PVS process (an RtI-based screening process). The study specifically examined the accuracy of decision rules applied to determine if children needed further assessment or intervention.
• To compare the PVS model to other screening measures specifically related to the identification of students needing special education services.
Participants
• One hundred and eighty-two students in first- and second-grade were given four universal screening measures. Seventy-three students were identified by one of the measures as having a potential learning problem.
Methods Used to Answer the Research Questions
• PVS included screening every child in the sample with CBM of reading and math; conducting a follow-up assessment of the effect of incentives on child performance for an identified risk group (about 15% of the original sample); conducting a single instructional session for an identified risk group (about 11% of the original sample).
• Students who scored below the 16th percentile and in the frustrational range (Deno & Mirkin, 1977) on CBM probes during school-wide screening were identified to participate in additional assessment and intervention.
• Screening resulted in the identification of a final risk group of about 5% of the screened sample.
• Screening measures: All children in first and second grades were screened in reading and math performance using four measures (PVS, teacher referral, Brigance screening tests in reading and math and a state-mandated running record assessment called the Developmental Reading Assessment).
• Criterion measures: All second graders in the sample were administered the Iowa Test of Basic Skills. Any of the children failing any of the screenings were provided with a set of criterion measures including a curriculum-based assessment and protocol-based intervention monitored for integrity and the Woodcock Johnson, Revised.
• These procedures permitted an analysis of the accuracy of each screening measure, most importantly teacher referral and the RtI screening model (PVS).

59
Results • Results indicated that teachers tended to over-identify students as students with
learning problems. Only 19% of the students identified by their teachers were found to have a valid problem on the criterion measures. They also failed to identify a substantial number of students who demonstrated specific skill deficits on direct measures of student learning. Teachers failed to identify 11% of the students who had a validated problem (i.e., false negative errors).
• The use of PVS resulted in students being correctly identified in 87% of the cases, compared to 66% agreement for teacher referral. Importantly, for a screening device, nearly all of the errors made were false positive errors (students who did not have a validated problem were identified). Hence, the use of PVS was supported as a highly accurate approach to identifying students in need of intervention.
Implications for Practice
• Provides empirical support for the use of universal screening procedures including direct tests for motivation deficits and brief instructional trials to identify children in need of eligibility assessment.
• Provides empirical support for RtI as an effective identification source for disabilities in math and reading.
• Provides empirical support to discontinue the use of teacher referral as an identification source.
• The RtI-based screening was an efficient method of screening, requiring only 45 minutes to screen an entire class and 5 minutes for each follow-up assessment.
Vaughn, S., Linan-Thompson, S., & Hickman, P. (2003). Response to instruction as a means of identifying students with reading/learning disabilities. Exceptional Children, 69, 391–409. Issue of Concern Investigators examined an RtI model as a means of identifying students with reading/learning disabilities (LD).
• Using such a model would require educators to provide early intervention to students, determine the student’s instructional level, and monitor student progress to make eligibility decisions.
• This study provided 10-week increments of supplemental reading instruction to those students identified as at risk for having a reading-related LD.
Research Questions
• In an at-risk sample of students being provided with supplemental instruction, what percentage of students would have an adequate RtI after 10, 20 and 30 weeks of intervention?

60
• Would students who met intervention success criteria continue to maintain growth in the general education setting?
• Can a school district use RtI to identify students with LD? Participants
• A group of 45 second-grade students who were identified by their teachers as at risk for a reading disability and attended one of three Title I schools.
Methods Used to Answer the Research Questions • A two-tier system to identify second-grade students at risk for reading disabilities was
used. o In the first tier, the classroom teachers nominated students for the
intervention, and students were informally ranked in the second quartile or below in terms of reading ability, as compared to their class peers.
o In the second tier, all nominated students were assessed using the Texas Primary Reading Inventory (TPRI).
• The authors created a pre-established criterion that a student must meet to exit the intervention specifically:
o After 10 weeks of intervention, the students must obtain: (a) a passing score on the TPRI; (b) a median score on the Test of Oral Reading Fluency (TORF) above 55, with fewer than five errors; and (c) a score of 50 correct words per minute (WCPM) on fluency progress monitoring sessions for at least 3 consecutive weeks.
• Students who did not meet the criteria were then reassigned to new groups of three and continued to receive the intervention for an additional 10 weeks.
• Students were placed in categories based on when they exited the intervention, if the students met exit criteria following the first 10 weeks they were classified as “early exit,” if they exited after the second 10-week period they were “mid exit” and if they met criteria after the third 10-week period they were “late exit.” If the student did not meet the criteria by the end of the 30th week, they were classified as “no exit” or “nonresponders.”
Results
• An approximately equal number of students were in each exit group. Ten at-risk students were in the early exit group, 14 students were in the mid exit group, 10 students were in the late exit group and 11 students were in the no exit group (fewer than 25% of the at-risk readers).
• Those students who met exit criteria obtained significantly higher scores at pretest than students in the no exit group on the fluency, passage comprehension and rapid naming measures.
• The results indicated that 70% of the students in the early exit group continued to “thrive” in the general education setting, but only 9 of the 14 students in the mid exit group continued on an acceptable trajectory for reading fluency.

61
Implications for Practice
• The results of the study indicate that a RtI model should be pursued as an option for identifying students with LD. Using such a model, the investigators were able to identify a group of students in need of intensive intervention and support (the non-responders).
• Supplemental instruction was provided to a number of students at risk for reading disabilities, and the frequent progress monitoring of the student’s progress allowed the investigators to make data-based decisions regarding the student’s academic abilities.
• (Also see Chapter 10: Intensive Instruction, Tier III Application, page 99.)
References Bateman, B. D. (1994). Toward a better identification of learning disabilities. Learning
Disabilities: A Multidisciplinary Journal, 5, 95–99. Burns, M. K., & Senesac, B. K. (2005). Comparison of dual discrepancy criteria to assess
response to intervention. Journal of School Psychology, 43, 393–406. Case, L. P., Speece, D. L., & Molloy, D. E. (2003). The validity of a response-to-instruction
paradigm to identify reading disabilities: A longitudinal analysis of individual differences and contextual factors. School Psychology Review, 32, 557–582.
Deno, S. L., Marston, D., & Tindal, G. (1986). Direct and frequent curriculum-based
measurement: An alternative for educational decision making. Special Services in the Schools, 2, 5–27.
Epps, S., Ysseldyke, J. E., & McGue, M. (1984). “I know one when I see one”: Differentiating LD
and non-LD students. Learning Disability Quarterly, 7, 89–101. Fletcher, J. M., Shaywitz, S. E., Shankweiler, D. P., Katz, L., Liberman, I. Y., Stuebing, K. K.,
Francis, D. J., Fowler, A. E., & Shaywitz, B. A. (1994). Cognitive profiles of reading disability: Comparisons of discrepancy and low achievement definitions. Journal of Educational Psychology, 86, 6–23.
Fuchs, L. S. (2003). Assessing intervention responsiveness: Conceptual and technical issues.
Learning Disabilities: Research & Practice, 18, 172–186. Fuchs, L. S., & Fuchs, D. (1998). Treatment validity: A unifying concept for reconceptualizing
the identification of learning disabilities. Learning Disabilities Research and Practice, 13, 204–219.

62
Marston, D. (2005). Tiers of intervention in responsiveness to intervention: Prevention
outcomes and learning disabilities identification patterns. Journal of Learning Disabilities, 38, 539–544.
Torgesen, J. K., & Wagner, R. K. (1998). Alternative diagnostic approaches for specific
developmental reading disabilities. Learning Disabilities Research and Practice, 13, 220–232.
Speece, D. L., Case, L. P., & Molloy, D. E. (2003). Responsiveness to general education
instruction as the first gate to learning disabilities identification. Learning Disabilities Research and Practice, 18, 147–156.
VanDerHeyden, A.M., Witt, J. C., & Barnett, D. W. (2005). The emergence and possible futures
of Response to Intervention. Journal of Psychoeducational Assessment, 23, 339–361. VanDerHeyden, A. M., Witt, J. C., & Naquin, G. (2003). Development of validation of a process
for screening referrals to special education. School Psychology Review, 32, 204–227. Vaughn, S., & Fuchs, L. S. (2003). Redefining learning disabilities as inadequate response to
instruction: The promise and potential problems. Learning Disabilities Research and Practice, 18, 137–146.
Vaughn, S., Linan-Thompson, S., & Hickman, P. (2003). Response to instruction as a means of
identifying students with reading/learning disabilities. Exceptional Children, 69, 391–409.
Vellutino, F. R., Scanlon, D. M., & Lyon, G. R. (2000). Differentiating between difficult-to-
remediate and readily remediated poor readers: More evidence against the IQ-achievement discrepancy definition of reading disability. Journal of Learning Disabilities, 33, 223–238.
Vellutino, F., Scanlon, D., Sipay, E., Small, S., Pratt, A., Chen, R., et al. (1996). Cognitive
profiles of difficult-to-remediate and readily remediated poor readers: Early intervention as a vehicle for distinguishing between cognitive and experiential deficits as basic causes of specific reading disability. Journal of Educational Psychology, 88, 601–638.
Ysseldyke, J. E., Vanderwood, M. L., & Shriner, J. (1997). Changes over the past decade in
special education referral to placement probability: An incredibly reliable practice. Diagnostique, 23, 193–201.

63
Chapter 7
Formative Assessment A key component within Response to Intervention (RtI) is the use of formative assessment. Effectiveness of an individual intervention cannot be determined prior to its implementation. Therefore, intervention effect must be monitored and kept or modified based on student performance improvement over time. Formative assessment refers to the collection of student performance data across time to inform teaching and to allow teachers to alter instruction to improve learning. Formative assessment also can be used to identify individuals in need of additional help and to pinpoint specific learning gaps or deficits. Curriculum-based measurement (CBM) or curriculum-based assessment (CBA) is used to assess a child’s level of performance as well as their progress toward a specific goal. School-wide applications of formative assessment are particularly promising when all children in a school are screened with CBM and school-wide progress or progress of at-risk groups toward identified goals is monitored. The key to the effectiveness of formative assessment is the degree to which performance data are effectively linked to instructional changes in an iterative, continuous cycle until learning is improved. Formative assessment data can ultimately be used to determine whether a child’s RtI was adequate. The use of formative assessment in and of itself has been shown to enhance learning. Barnett, D. W., Daly, E. J., III, Jones, K. M., & Lentz, F. E., Jr. (2004). Response to intervention: Empirically-based special service decisions from increasing and decreasing intensity single case designs. The Journal of Special Education, 38, 66–79. Purpose of Paper The paper provides a model for using single-case designs to aid in the eligibility decision-making process.
• Within an RtI model, single-case designs that focus on the intensity of the intervention and the student’s RtI should be used.
• The following two types of variables must be measured as part of this assessment: o A meaningful outcome variable that can be measured frequently across time.
(Also see Chapter 4: The Need to Focus on Student Outcomes, page 35.) o We must be able to assess the intensity of the intervention.
We can look at the times per day the intervention occurs and the length of the intervention.
If intervention was contingency-based, the percentage of times the behavior occurred can be calculated (e.g., the number of times a teacher praised a student for appropriate behavior).

64
25 2824
3540 43
55 5665
5055
60
0
10
20
30
40
50
60
70
1 2 3 4 5 6 7 8 9
wor
ds r
ead
corr
ectly
per
min
ute
BaselineCR, RRCR
• Interventions are considered more intensive if they require more adult supervision or an increased amount of modifications to the curriculum.
• Intervention components can be added or subtracted to find the most effective, but least intrusive intervention.
• There are two designs. o Increasing intensity designs: intensity of treatments can be increased by
extending, adding or altering procedures. The least intrusive intervention is used, and components are added (as needed) until the objective of the intervention is accomplished.
o Decreasing intensity designs: can be used when students are engaging in high-risk behaviors, or when a student with intensive services is being reintroduced into general education. It begins with a multifaceted effective intervention, and facets of the intervention are systematically removed to see if the intervention effect is maintained.
Increasing Intensity Design Example
In this design, the student (represented by the squares) is performing below the peer norm (represented by the triangle). When contingency reinforcement was added, his/her scores increased, but they still did not meet the peer norms. In the final phase, contingency reinforcement and repeated readings were used to teach reading, following three sessions of this intervention the student exceeded the peer norm. The intervention was an appropriate intensity to yield the desired outcome.

65
Decreasing Intensity Design Example
In this design, the student (represented by the squares) has high rates of disruptive behavior and low teacher contacts (represented by the triangle). All components of the intervention are included, and the disruptive behavior decreases. In the next session, notes to home are removed and the disruptive behavior remains at low levels. In the following session, reinforcement was removed and consequently disruptive behavior increased. When reinforcement was reintroduced, the student’s behavior returned to low levels. Implications
• Describes a science-based model for identifying effective interventions within an RtI model.
• Through this step-by-step scientifically based process, the least restrictive intervention plan can be identified.
• Interventions that are evidence-based should be used, and control conditions should be applied (getting baseline information, or briefly withdrawing the intervention and documenting the effects).
Burns, M. K. (in press). Reading at the instructional level with children identified as learning disabled: Potential implications for response-to-intervention. School Psychology Quarterly.
80 85 88
3019 18
12 15 13
6576 78
20 15 1620 185
60 62 65
38 4232 34 33
60 55 5040
0102030405060708090
100
1 2 3 4 5 6 7 8 9 10 11 12 13 14 15
% in
terv
als
Baselinedaily schedule, reinforcment, notes to home
daily schedule
daily schedule, reinforcment
daily schedule, reinforcment

66
Issues of Concern • This study examined the effect of preteaching words to children identified as LD within
the context of an RtI model. • The study details how data collected through CBA can be used when developing
interventions. • Previewing reading material before reading has been related to better reading fluency
and comprehension among children with and without disabilities. Research Questions
• Does preteaching unknown words to children identified with LD in reading result in growth rates that meet or exceed pre-established standards and a comparison group?
• Does preteaching unknown words lead to more passages being read at the instructional level when compared to the control group?
• Will more students involved in the prereading group be identified as “responders” to the intervention as compared to the comparison group?
Participants
• Twenty-nine pairs of students in the third grade identified with a basic reading skills LD using the traditional IQ-achievement discrepancy model.
• One student in the pair was randomly selected to get the reading intervention, and one student was placed in the control group that does not receive the intervention.
Methods Used to Answer the Research Questions
• For all participants in the study, reading was assessed using weekly CBM probes from the general education third-grade reading basal.
• The first three CBM probes were used as a baseline (administered prior to intervention), and 12 probes were administered throughout the intervention phase.
• Research assistants conducted 10 to 15 minutes of a prereading intervention outlined by Gravois and Gickling (2002) over a 12-week period.
• Student progress was measured by plotting median fluency scores of the three weekly probes, and growth rate was computed using ordinary least squares (OLS) regression. Student slopes represented the weekly increase in average number of words read correctly per minute (WCPM).The mean slopes of the two groups were then compared.
• Statistical tests were applied to the data obtained to answer the research questions. Results
• The results of the study revealed that the growth rate for reading fluency for those students in the intervention group was four times greater than the rate of those within the control group. As hypothesized, preteaching unknown words resulted in the students exhibiting growth rates that exceeded the control group.
• The results did not support the second hypothesis that the intervention would result in more passages being read at the instructional level as compared to the control group.

67
Although further analysis revealed that more children receiving intervention were reading at the instructional level during the second through fifth treatment intervals.
• More children in the treatment group (66%) were classified as having had an adequate RtI than in the comparison group (28%).
Implications for Practice
• This study has demonstrated an effective intervention that can be used with students with LD.
• Furthermore, it provides a framework in which one can measure student progress and the outcomes of interventions implemented.
Fuchs, L. S., & Fuchs, D. (1986). Effects of systematic formative evaluation: A meta-analysis. Exceptional Children, 53, 199–208. Issues of Concern
• It is assumed that individualized instruction leads to higher achievement in students. • It has been suggested that the current method for developing individualized programs
(aptitude treatment interaction, ATI) is insufficient. • ATI relies on specific learner characteristics, and instructional programs are chosen
based on these characteristics. This approach relies solely on the initial diagnosis of the child. There are a number of problems associated with this process, and research does not support its use.
• Systematic formative evaluation may be an alternative to ATI as it uses ongoing evaluation and modification of programs in place.
• Systematic formative evaluation was defined as the collection of CBM data at least twice a week and the use of these data to inform instructional decisions on an individual student basis.
Research Questions
• Is individualized instruction effective? • Is the use of formative evaluation beneficial enough that it warrants the additional time
and cost that it takes to implement such a procedure?
Methods Used to Answer the Research Questions • A meta analysis was conducted reviewing studies that analyzed the effects of formative
evaluation on academic achievement. • A literature search was conducted using three online databases. Studies were included
if they reviewed the effects of providing systematic formative evaluation data to teachers regarding the academic performance of their students. Twenty-three references were compared.

68
• To compare the studies, the results of each study were transformed into an effect size and then into an unbiased effect size (UES).
• Three components of each study were coded: by publication type (i.e., journal, dissertation), by year published and by quality of the study (i.e., poor, fair or good).
• The articles were also coded based on substantive components: behavior modification, data display (i.e., graphing data), data evaluation, grade level, disability status, measurement frequency and treatment duration.
Results
• The study found that the use of systematic formative evaluation procedures used with the majority of students with mild disabilities was related to a significant increase in school achievement (weighted mean effect size of .70).
• Publication type was associated with a statistically significant difference, as the effect sizes from the journal publications were significantly higher than those from unpublished manuscripts.
• The systematic formative evaluation process had similar effects across student age, treatment duration, measurement frequency and disability status.
• If behavior modification was used with formative evaluation, higher effect sizes were produced, suggesting that using reinforcement during progress monitoring may lead to higher levels of achievement.
• When teachers had to apply decision rules to their data, effect sizes were larger than if they used judgment.
• When data were graphed, there were greater effects than if data were only recorded. Implications for Practice
• Formative evaluation procedures have significant positive effects on student achievement and may be used to plan and modify individualized intervention programs.
• Use of formative evaluation is enhanced when contingencies are included for improved performance, teachers are given and required to use decision rules to interpret data and make instructional programming changes and student performance data are graphed.
• This study illustrates the importance of (a) frequent progress monitoring, (b) use of structured decision rules, (c) use of contingencies for improved performance and (d) use of graphs for student data.
Thurber, R. S., Shinn, M. R., & Smolkowski, K. (2002). What is measured in mathematics tests? Construct validity of curriculum-based mathematics measures. School Psychology Review, 31, 498–513.

69
Issues of Concern Investigators studied what math constructs mathematics curriculum-based measurement (M-CBM) measures within the context of other math assessments.
• Most math assessment is composed of computation and applications. • (M-CBM) has been developed to monitor student progress, inform instruction and
thereby improve student achievement. • There are fewer technical adequacy data available for M-CBM as compared to reading
CBM. Research Question
• What is the relationship between M-CBM and constructs of general mathematics achievement, computation and application?
Participants
• Participants included 206 fourth-grade students in general education classrooms from four elementary schools.
Methods Used to Answer the Research Question
• Participants were administered 12 mathematics measures to provide numerous measures of the constructs outlined (achievement, computation and application).
• Three mixed-operation M-CBM probes; two basic math facts worksheets; a computation and application subtest of Stanford Diagnostic Mathematics Test; math computation, math concepts and application subtests of the California Achievement Tests; application items on the National Assessment of Educational Progress; and three maze tests of a Reading Maze Test.
• All tests were administered to students in their classrooms, and testing was completed in three days of 45-minute sessions in a prescribed order.
• Three models were tested using confirmatory factor analysis: o Model 1: M-CBM measures a general math construct, including applications
and computations. o Model 2: A two-factor model, computation and application are separate
constructs, where M-CBM measures computation. o Model 3: A two-factor model, computation and application are separate
constructs, where M-CBM is a measure of applications. Results
• When examining correlations, M-CBM was highly correlated with other measures of basic facts computation (median r = .82) and modestly correlated with commercial measures of math computation (median r = .61). M-CBM was correlated less with tests intended to measure applications (median r = .42)

70
• The best model that fit the data specified a two-factor model of mathematics assessment where computation and applications were separate but highly related constructs, where M-CBM measured computation.
• Reading skill on the CBM maze was highly related to both computation and application constructs.
Implications for Practice
• This study begins to investigate the use of M-CBM for progress monitoring in mathematics.
• More studies will allow schools implementing RtI models to be aware of the technical properties of the tools used to monitor student progress in mathematics.
• Data suggest that students who perform well in reading also tend to perform well in mathematics
Ardoin, S. P., Witt, J. C., Suldo, S. M., Connell, J. E., Koenig, J. L., Resetar, J. L., et al. (2004). Examining the incremental benefits of administering a maze and three versus one curriculum-based measurement reading probes when conducting universal screening. School Psychology Review, 33, 218–233. Issue of Concern A study was conducted to determine which assessments were most useful in identifying students that may be at risk for reading deficits. Research Questions
• Is reading curriculum-based measurement (R-CBM) a valid measure to use when conducting universal screenings?
• Can we use one R-CBM probe, rather than three, to get an accurate assessment of the student’s reading ability?
• How does R-CBM versus norm-referenced achievement tests compare when accurately predicting reading ability?
Participants
• The sample of participants included 35 female and 42 male third-grade students enrolled in one of four general education classrooms in a Southeast elementary school.
Methods Used to Answer the Research Questions
• All students were individually administered the standard reading subtests of the Woodcock Johnson-III (WJ-III, Woodcock et al., 2001).
• All passages for the following assessments were drawn from the Silver, Burdett, and Ginn basal reading series (1991). The passage difficulty was evaluated using the Spache

71
(1953) readability formula. Passages of similar difficulty as those students would be exposed to in the first semester of third grade were selected.
• Within five days of being administered the WJ-III, the maze was administered. The maze is a third-grade reading passage with every seventh word replaced by a blank, beneath the blank are three words (with one being correct) that the student can choose from.
• Participants were also administered a single CBM passage to obtain a single score (CBM-SP), and three additional CBM passages to be used in the calculation of an average/median CBM score (CBM-Mdn).
• Ten weeks after the CBM probes were administered, subtests of the Iowa Test of Basic Skills (ITBS, Hoover et al., 1996) were administered by the classroom teachers to obtain a total reading score.
• Statistical analyses were conducted to determine the relationships among variables and to understand which assessments were the best predictors of reading ability.
Results
• Results indicated that using a single trial of R-CBM probe is an effective way of identifying students who need reading intervention.
• CBM was a predictor of total reading achievement, but the ITBS total reading score was a better indicator of comprehension skills.
• When conducting universal screenings, the maze did not provide significantly more information regarding students’ reading ability beyond the information provided by R-CBM.
• Results suggested that CBM was a better predictor of overall student achievement than some group-administered norm-referenced achievement tests. R-CBM explained more of the variance in the subtests that make up the Broad Reading Scale of the Woodcock-Johnson III Achievement test than did the Iowa Test of Basic Skills total reading score.
• The Iowa Test of Basic Skills Reading comprehension tests were better predictors of students reading comprehension skills.
• Overall, results suggest that a single probe was sufficient for use in universal screenings.
• These data replicate findings in VanDerHeyden, Witt and Naquin (2003) that single trial CBM was adequate for universal screening and correlated with ITBS scores.
Implications for Practice
• Using a single R-CBM probe when conducting universal screenings will decrease the amount of time needed to conduct such assessments.
• School professionals must first decide the purpose of universal screenings and then make decisions about which measures would be appropriate.

72
References Ardoin, S. P., Witt, J. C., Suldo, S. M., Connell, J. E., Koenig, J. L., Resetar, J. L., et al. (2004).
Examining the incremental benefits of administering a maze and three versus one curriculum-based measurement reading probes when conducting universal screening. School Psychology Review, 33, 218–233.
Barnett, D. W., Daly, E. J., III, Jones, K. M., & Lentz, F. E., Jr. (2004). Response to intervention:
Empirically-based special service decisions from increasing and decreasing intensity single case designs. The Journal of Special Education, 38, 66–79.
Burns, M. K. (in press). Reading at the instructional level with children identified as learning
disabled: Potential implications for response to intervention. School Psychology Quarterly. Burns, M. K., VanDerHeyden, A. M., & Jiban, C. (2006). Assessing the instructional level for
mathematics: A comparison of methods. School Psychology Review, 35, 401–418. Deno, S. L. (1985). Curriculum-based measurement: The emerging alternative. Exceptional
Children, 52, 219–232. Deno, S. L. (1986). Formative evaluation of individual student programs: A new role for school
psychologists. School Psychology Review, 15, 358–374. Deno, S. L. (1992). The nature and development of curriculum-based measurement. Preventing
School Failure, 36, 5–10. Deno, S. L., Fuchs, L. S., Marston, D., & Shin, Y. (2001). Using curriculum-based measurement
to establish growth standards for students with learning disabilities. School Psychology Review, 30, 507–523.
Fuchs, L., & Deno, S. L. (1991). Paradigmatic distinctions between instructionally relevant
measurement models. Exceptional Children, 57, 488–500. Fuchs, L. S., Deno, S. L., & Mirkin, P. K. (1984). The effects of frequent curriculum-based
measurement and evaluation on pedagogy, student achievement, and student awareness of learning. American Education Research Journal, 21, 449–460.
Fuchs, D., & Fuchs, L. (1994). Classwide curriculum-based measurement: Helping general
educators meet the challenge of student diversity. Exceptional Children, 60, 518–537. Fuchs, L. S., & Fuchs, D. (1986). Effects of systematic formative evaluation: A meta-analysis.
Exceptional Children, 53, 199–208.

73
Fuchs, L. S., & Fuchs, D. (2002). Curriculum-based measurement: Describing competence,
enhancing outcomes, evaluating treatment effects, and identifying treatment non-responders. Peabody Journal of Education, 77, 64–84.
Fuchs, L. S., Fuchs, D., & Hamlett, C. L. (1990). Curriculum-based measurement: A
standardized, long term goal approach to monitoring student progress. Academic Therapy, 25, 615–632.
Fuchs, L. S., Fuchs, D., Hamlett, C. L., Walz, L., & Germann, G. (1993). Formative evaluation of
academic progress: How much growth can we expect? School Psychology Review, 22, 27–48.
Hintze, J. M., Christ, T. J., & Keller, L. A. (2002). The generalizability of CBM survey-level
mathematics assessments: Just how many samples do we need? School Psychology Review, 31, 514–528.
Marston, D., & Deno, S. L. (1987). Tests of reading fluency: Measures for screening and progress
monitoring in reading. Minneapolis, MN: Children’s Educational Services. Marston, D., & Magnusson, D. (1988). Curriculum-based measurement: District level
implementation. In J. Graden, J. Zins, & M. Curtis (Eds.), Alternative educational delivery systems: Enhancing instructional options for all students (pp. 137–172). Washington, DC: National Association of School Psychologists.
Marston, D. B. (1989). A curriculum-based measurement approach to assessing academic
performance: What it is and why do it. In M. R. Shinn (Ed.), Curriculum-based measurement: Assessing special children (pp. 17–78). New York: Guilford.
Shapiro, E. S., & Ager, C. (1992). Assessment of special education students in regular education
programs: Linking assessment to instruction. Elementary School Journal, 92, 283–296. Shinn, M. R. (Ed.). (1989). Curriculum-based measurement: Assessing special children. New York:
Guilford. Shinn, M. R., & Hubbard, D. D. (1992). Curriculum-based measurement and problem-solving
assessment: Basic procedures and outcomes. Focus on Exceptional Children, 24, 1–20. Silberglitt, B. & Hintze, J. (2005). Formative assessment using CBM-R cut scores to track
progress toward success on state-mandated achievement tests: A comparison of methods. Journal of Psychoeducational Assessment, 23, 304–325.

74
Tilly, W. D., III, & Grimes, J. (1998). Curriculum-based measurement: One vehicle for systematic educational reform. In M. R. Shinn (Ed.), Advanced applications of curriculum-based measurement (pp. 32–60). New York: Guilford.
Thurber, R. S., Shinn, M. R., & Smolkowski, K. (2002). What is measured in mathematics tests?
Construct validity of curriculum-based mathematics measures. School Psychology Review, 31, 498–513.
McNamara, K. (1998). Adoption of intervention-based assessment for special education. School
Psychology International, 19, 251–266. McNamara, K., & Hollinger, C. (1997). Intervention-based assessment: Rates of
evaluation and eligibility for specific learning disability classification. Psychological Reports, 81, 620–622.
VanDerHeyden, A. M., & Burns, M. K. (2005). Using curriculum-based assessment and
curriculum-based measurement to guide elementary mathematics instruction: Effect on individual and group accountability scores. Assessment for Effective Intervention, 30, 15–31.

75
Chapter 8
Improving Core Instruction for All Students: Tier I Application
Although Response to Intervention (RtI) was made optimal in special education legislation, it was developed in general education. Thus, RtI should best be conceptualized as a general education initiative with direct implications for children with disabilities. The first step in the RtI process, or Tier I, is implementing a research-based core curriculum. Fortunately, there is an extensive research base regarding quality reading instruction. Moreover, instructional methodology has been linked directly to student progress in reading skill development. We now know that explicit instruction in phonics, phonemic awareness, fluency, vocabulary and comprehension are essential aspects of a core curriculum, and including these components leads to improved student learning. Analogous research findings exist in other topographical areas of instruction and learning (e.g., math) and also in a literature base that describes general effective instructional practices. (Also see Chapter 5: Major Policy Analyses Supporting Movement toward RtI, page 45.) Given the well-established research base for general education reading instruction, a solid research base exists for Tier I instruction within RtI. Moreover, this research provides the foundation for interventions in Tiers II and III, and establishes confidence in decisions made about student progress. In other words, using a quality core curriculum and effective instructional practices can essentially rule out poor instruction as a cause for student difficulties. American Institutes for Research. (1999). An educator’s guide to schoolwide reform. Arlington, VA: Educational Research Service. Purpose of Paper The American Association of School Administrators, American Federal of Teachers, National Association of Elementary School Principals, National Association of Secondary School Principals and National Education Association contracted with the American Institute for Research to conduct this review.
• Twenty-four comprehensive curricula and schoolwide reform programs were reviewed.
• A common, objective methodology was used to critique the programs and assist administrators and educators in learning which programs were most effective.
• Specifically, criteria included: (a) evidence of positive effects on student achievement; (b) year introduced in the schools; (c) number of schools; (d) support developer

76
provides schools; (e) first-year costs and (f) first-year costs with current staff reassigned.
• The following approaches had the highest ratings of strong evidence of positive effects on student achievement:
o Direct Instruction K-6 o High Schools that Work (9-12) o Success for All (preK-6)
• The following approaches had promising evidence of positive effects on student achievement: Community for Learning K-12 and Core Knowledge K-8, Different Ways of Knowing K-7, Expeditionary Learning Outward Bound K-12, and School Development Program K-12.
• The following programs had marginal support for positive effects on student achievement: Roots and Wings PreK-6, Talent Development High School 9-12, Onward to Excellence K-12, League of Professional Schools K-12, High/Scope K-3 and Accelerated Schools K-8.
• The Coalition of Essential Schools K-12 was the only program rated as having weak evidence of positive effects on student achievement.
• Eight programs had not had rigorous studies conducted evaluating their effectiveness on student achievement and thus were not categorized into an evidence category.
• Brief summaries of all 24 programs were included in the report with publisher contact information included.
Implications for Practice
• To ensure high-quality instruction, choosing a program that has strong evidence of effectiveness is important.
• If a program is truly effective, then it will save the school money in the long run by reducing the number of students who will require supplemental instruction or assistance to succeed.
• The need to select a curriculum and program of instruction that has been shown to accelerate learning is an even more critical need in schools where many students are at risk for academic failure.
• If core instruction is being delivered effectively, the largest possible percentage of students will make progress in the classroom and there will be fewer students requiring additional instruction.
Crawford, D., & Snider, V. E. (2000). Effective mathematics instruction: The importance of curriculum. Education and Treatment of Children, 23, 122–142. Issue of Concern This article compared the effectiveness of three different mathematics curricula for fourth-grade students.

77
• Curriculum selection by schools, teachers or administrators is rarely a research-based decision.
• Differences between curricula include: teaching to mastery, use of review, checking for student understanding, remediation suggestions, field testing of the curriculum’s effectiveness and explicit versus implicit instructional presentation format.
• Two curricula were evaluated: an explicit/direct instruction math curriculum called Connecting Math Concepts (Science Research Associates) and an implicit curriculum called Invitation to Mathematics (Scott Foresman).
Research Question
• What is the difference in effectiveness between an explicit math curriculum and an implicit math curriculum in two fourth-grade classrooms?
Participants
• Participants included fourth-grade students, randomly assigned to two different heterogeneous fourth-grade math classes.
• In the first year, 23 students were in each class. • In the second year, 19 students were in each class. • Teacher A: A female teacher with 14 years of experience, three of those years in fourth
grade. • Teacher B: A male teacher with 11 years of experience, all in fourth grade.
Methods Used to Answer the Research Question
• Two fourth-grade math classes were compared, each using a different curriculum. • In year 1, the Connecting Math Concepts (explicit curriculum) class began the year at
the 43rd percentile on the National Achievement Test. The Scott Foresman curriculum (implicit curriculum) class began the year at the 44th percentile on National Achievement Test.
• In year 1, Teacher A taught the explicit curriculum: Connecting Math Concepts, a Direct Instruction program, by Science Research Associates. Teacher A was provided 4 hours of training in August, and 3 more hours of on-going training during the year by the author.
• In year 1, Teacher B taught the implicit curriculum: Invitation to Mathematics by Scott Foresman.
• In year 2, Teacher B taught the explicit curriculum: Connecting Math Concepts. • Neither teacher was able to complete the entire curriculum within the school year.
Results • In year 1, students receiving the explicit curriculum scored higher on: the computation
subtest of the National Achievement Test, curriculum-based tests and a multiplication fact test compared to students receiving the implicit curriculum.

78
• In year 2, Teacher B also implemented the explicit curriculum and students made more gains than the previous cohort he had taught with the implicit curriculum; however, Teacher B did not follow all aspects of the explicit curriculum as written.
Implications for Practice
• In this small study, it was demonstrated that curriculum can make a difference in student performance.
• Teachers A and B may have had even better student gains if they had followed the Connecting Math Concepts curriculum as written in the first year of implementation.
• Districts would be advised to “test” curriculum effectiveness and research the empirical support behind different curricula. The curriculum that showed stronger effects in this study (i.e., Connecting Math Concepts) had previously published research support for effectiveness, whereas the unsuccessful curriculum (i.e., Invitation to Mathematics) did not.
Foorman, B. R., Francis, D. J., & Fletcher, J. M. (1998). The role of instruction in learning to read: Preventing reading failure in at-risk children. Journal of Educational Psychology, 90, 37–55. Issue of Concern When providing reading instruction to students at risk for reading failure, it is extremely important that the instruction be delivered in a thoughtful and explicit manner that integrates early literacy research and learning principles. Research Question
• Which of three instructional strategies (i.e., direct, embedded or implicit) results in the greatest and most rapid student gains in reading?
Participants
• Participants included 285 first- and second-grade students at risk for reading failure. Methods Used to Answer the Research Question
• Students received one of three different instructional interventions, and their growth was measured.
• The three interventions varied in the explicitness with which the instruction was provided to the students. 1. Direct instruction explicitly taught the target skill of decoding phonemes in
decodable text. The letter–sound association was explicitly trained. 2. Embedded instruction taught the skill of decoding phonemes by providing
instruction on sound–spelling relationships in connected text. The letter–sound association was less explicitly taught by embedding the association to be trained within a more naturalistic task in the classroom.

79
3. Implicit instruction taught the skill of decoding phonemes by providing instruction in the alphabetic code while reading connected text. In this condition, the letter–sound association was not explicitly taught and students would be required to generalize training knowledge to successfully make the association.
Results Students who received direct instruction of letter-sounds in decodable text increased their word-reading skills significantly more rapidly than children taught with the other two strategies.
• Only 16% of the students who received direct instruction failed to demonstrate growth in reading, indicating that a large majority of the students exposed to this intervention benefited from this intervention.
• Forty-four percent of the students who received embedded instruction exhibited no growth, demonstrating that the intervention was not effective for this group of children at risk for reading failure.
• Forty-six percent of the students who received implicit instruction did not demonstrate growth, demonstrating that this intervention was not effective for this group of children at risk for reading failure.
Implications for Practice
• When selecting reading interventions for students at risk for reading failure, direct instruction is more effective than embedded or implicit instruction.
• Reading interventions and instruction should be delivered in an explicit and highly structured manner to promote learning for students who are at risk for poor learning outcomes.
• Reading interventions for at-risk students should be designed using direct instruction, and implementation of interventions should be observed by staff to ensure treatment integrity. (Also see Chapter 14: The Importance of Treatment Integrity in RtI Implementation, page 153.)
National Institute of Child Health and Human Development. (2000). Report to the National reading panel, teaching children to read: An evidence-based assessment of the scientific research and its implications for reading instruction. Washington, DC: author. Purpose of the Paper The National Research Council Committee produced a report in 1998 about reading research and instruction.
• The National Reading Panel (NRP), funded by the National Institute of Child Health and Development, included experts and researchers in reading.
• The NRP conducted meta-analyses of published peer-reviewed research articles on the teaching of reading to students.

80
• The following areas of reading instruction were reviewed: alphabet code, fluency, comprehension, teacher education and reading, and computer technology and reading.
Phonemic awareness (PA) is defined as being able to recognize and manipulate the 41 phonemes in English via words. Most words are a blend of phonemes. Some of the main findings regarding the effective teaching of phonemic awareness instruction are as follows.
• PA is a skill that can be taught by teachers to students. • PA is one of the key skills to be taught, but not the only skill. • PA should be assessed before starting PA instruction and continuously assessed during
instruction to evaluate instruction. Nationally normed, published tests are not necessary.
• PA can be and should be taught because it helps students learn to read. • Approximately 5–18 hours of PA instruction, averaging 25 minutes per session, has
been effective in improving student phonemic awareness skills. Researchers caution that there are individual differences in the amount of time required for students to make gains in PA skills. Ongoing assessment of student progress is essential to ensure that learning is occurring, and the amount of time required for students can vary.
• PA skills need to be taught explicitly (i.e., not implicitly). • PA needs to be taught in preschool and kindergarten. Larger gains in student
performance were reported when PA skills were taught in these grade levels versus first grade or later.
• Socioeconomic status (SES) did not affect student improvement. All students benefited from explicit PA training.
• Effects were greater when only one or two skills were taught at a time, rather than three or more at a time.
• Small-group instruction was more effective than one-on-one, or whole-group instruction, but only if used for short durations.
• Using letters, beginning with lower case, and using a select few at a time, was more effective than instruction without letters (e.g., graphic symbols).
• Teaching blending and segmenting of letter sounds and words was an effective practice. • PA instruction was especially beneficial to children at risk for reading failure. • PA skills better transferred to spelling skills when letters were used when teaching PA.
Implications for Practice • The NRP’s report is written in an easy-to-read style, making it a useful reference for
practitioners. • Students need to be explicitly taught PA skills early, ideally in preschool and
kindergarten. • PA skills are essential to successful reading performance, so if children were not
instructed at kindergarten, explicit instruction should be provided at first grade. • PA skills can be taught and are important to a child’s future ability to read.

81
• PA skills should be taught in small groups for daily sessions, and progress of all students should be monitored to determine which students need more or less instruction.
National Institute of Child Health and Human Development. (2000). Report to the National reading panel, teaching children to read: An evidence-based assessment of the scientific research and its implications for reading instruction. Washington, DC: author. Purpose of Paper Vocabulary development is linked to reading skill development.
• The most effective methods for teaching vocabulary to improve reading continue to be an area in need of research. The National Reading Panel (NRP) recommended that more research be conducted in this area.
• The vocabulary instruction research is presented in single paragraph summaries of research study results and organized by various categories.
In summarizing the existing research on vocabulary, the following findings were reported.
• Vocabulary instruction is part of reading instruction and should be incorporated thoughtfully and repetitively.
• Vocabulary instruction needs to be provided in both direct and indirect modes. • The strategy TOAST (test, organize, anchor, say, test) is more effective in the short- and
long-term retention of words, than student self-directed methods of learning vocabulary.
• Repetition is important. Teaching words in isolation without repetition is not effective to ensure student retention and generalization.
• Vocabulary instruction needs to involve high rates of academic engagement to be effective.
• Students who made errors, were corrected by teachers and then had to orally repeat the correction, learned faster than students who did not have to orally repeat the correction.
• Providing vocabulary instruction in one manner is not as effective as using multiple sources and manners of vocabulary instruction.
• Instruction can be affected by how vocabulary is evaluated. It is best to use curriculum-related vocabulary measures to make a clear connection between instruction and student progress.
• Students learn vocabulary both through instruction and incidentally. • Preteaching of vocabulary, before students read passages, is very effective.
Implications for Practice
• Explicit vocabulary instruction that has high rates of repetition is effective in improving student skills.

82
• Preteaching vocabulary before students read selections/passages is effective in improving their reading and vocabulary.
• Having students actively engaged when learning vocabulary is an effective strategy. For example, having students orally repeat a word, after a teacher has provided a correction, is effective in improving vocabulary.
References American Institutes for Research. (1999). An educator’s guide to schoolwide
reform. Arlington, VA: Educational Research Service. Ball, E., & Blachman, B. (1991). Does phoneme awareness training in kindergarten make a difference
in early word recognition and developmental spelling? Reading Research Quarterly, 26, 49–66. Barker, T., & Torgesen, J. (1995). An evaluation of computer-assisted instruction in phonological
awareness with below average readers. Journal of Educational Computing Research, 13, 89–103. Biemiller, A., & Boote, C. (2006). An effective method for building meaning vocabulary in primary
grades. Journal of Educational Psychology, 98, 44–62. Brady, S., Fowler, A., Stone, B., & Winbury, N. (1994). Training phonological awareness: A study
with inner-city kindergarten children. Annals of Dyslexia, 55, 26–59. Brennan, F., & Ireson, J. (1997). Training phonological awareness: A study to evaluate the effects of a
program of metalinguistic games in kindergarten. Reading and Writing: An Interdisciplinary Journal, 9, 241–263.
Castle, J. M., Riach, J., & Nicholson, T. (1994). Getting off to a better start in reading and
spelling: The effects of phonemic awareness instruction within a whole language program. Journal of Educational Psychology, 86, 350–359.
Crawford, D., & Snider, V. E. (2000). Effective mathematics instruction: The importance of
curriculum. Education and Treatment of Children, 23, 122–142. Davidson, J., Elcock, J., & Noyes, P. (1996). A preliminary study of the effect of computer-
assisted practice on reading attainment. Journal of Research in Reading, 19, 102–110. Englemann, S., Becker, W. C., Carnine, D. W., & Gersten, R. (1988). The direct instruction
follow-through model: Design and outcomes. Education & Treatment of Children, 11, 303–317.

83
Foorman, B. R., Francis, D. J., & Fletcher, J. M. (1998). The role of instruction in learning to read: Preventing reading failure in at-risk children. Journal of Educational Psychology, 90, 37–55.
Foorman, B. R., Francis, D. J., Fletcher, J. M., Schatschneider, C., & Mehta, P. (1998). The role
of instruction in learning to read: Preventing reading failure in at-risk children, Journal of Educational Psychology, 90, 37–55.
Fuchs, D., Fuchs, L. S., Mathes, P., & Simmons, D. (1997). Peer-assisted learning strategies: Making classrooms more responsible to student diversity. American Educational Research Journal, 34, 174–206.
Fuchs, L. S., Fuchs, D., & Hamlett, C. L. (1994). Strengthening the connection between assessment
and instructional planning with expert systems. Exceptional Children, 61, 138–146. Fuchs, L. S., Fuchs, D., Hamlett, C. L., Phillips, N. B., & Bentz, J. (1994). Classwide curriculum-based
measurement: Helping general educators meet the challenge of student diversity. Exceptional Children, 60, 518–537.
Fuchs, L. S., Fuchs, D., Prentice, K., Hamlett, C. L., Finelli, R., & Courey, S. J. (2004). Enhancing
mathematical problem solving among third-grade students with schema-based instruction. Journal of Educational Psychology, 96, 635–647.
Fuchs, L. S., Fuchs, D., Prentice, K., Burch, M., Hamlett, C., Owen, R., Hosp, M., & Jancek, D. (2003).
Explicitly teaching for transfer: Effects on third-grade students’ mathematical problem solving. Journal of Educational Psychology, 95, 293–304.
Good, R., & Kaminski, R. (1996). Assessment for instructional decisions: Toward a
proactive/prevention model of decision-making for early literacy skills. School Psychology Quarterly, 11, 326–336.
Griffith, P. (1991). Phonemic awareness helps first graders invent spellings and third graders
remember correct spellings. Journal of Reading Behavior, 23, 215–233. Gross, J., & Garnett, J. (1994). Preventing reading difficulties: Rhyme and alliteration in the real
world. Educational Psychology in Practice, 9, 235–240. Klingner, J. K., Vaughn, S., Hughes, M. T., & Arguelles, M. E. (1999). Sustaining research-based
practices in reading: A 3-year follow-up. Remedial and Special Education, 20, 263–274, 287. Lenz, K. B. (2006). Creating school-wide conditions for high-quality learning strategy classroom
instruction. Intervention in School and Clinic, 41, 261–266.

84
Levin, J., Johnson, D., Pittelman, S., Levin, K., Shriberg, J., Toms-Bronowski, S., & Hayes, B. (1984). A comparison of semantic and mnemonic-based vocabulary learning strategies. Reading Psychology, 5, 1–15.
Nagy, W., Berninger, V., & Abbott, R. D. (2006). Contributions of morphology beyond phonology to
literacy outcomes of upper elementary and middle-school students. Journal of Educational Psychology, 98, 134–147.
National Institute of Child Health and Human Development. (2000). Report to the National reading panel, teaching children to read: An evidence-based assessment of the scientific research and its implications for reading instruction. Washington, DC: author.
Pressley, M. (2002). Effective beginning reading instruction. Journal of Literacy Research, 34, 165–188. Reutzel, D. R., Hollingsworth, P. M., & Daines, D. (1988). The effect of a direct instruction paradigm
using dictated texts on beginning readers’ main idea comprehension. Reading Research & Instruction, 27, 25–46.
Roberts, T. A. (2003). Effects of alphabet-letter instruction on young children’s word recognition.
Journal of Educational Psychology, 95, 41–51. Saddler, B., & Graham, S. (2005). The effects of peer-assisted sentence-combining instruction on the
writing performance of more or less skilled young writers. Journal of Educational Psychology, 97, 43–54.
Scanlon, D. M., & Vellutino, F. R. (1996). Prerequisite skills, early instruction, and success in first-
grade reading: Selected results from a longitudinal study. Mental Retardation and Developmental Disabilities, 2, 54–63.
Schatschneider, C., Francis, D., Foorman, B., Fletcher, J., & Mehta, P. (1999). The dimensionality of
phonological awareness: An application of item response theory. Journal of Educational Psychology, 91, 439–449.
Snow, C., Burns, M., & Griffin, P. (Eds.). (1998). Preventing reading difficulties in young children.
Washington, DC: National Academy Press. Stahl, S., & Murray, B. (1994). Defining phonological awareness and its relationship to early reading.
Journal of Educational Psychology, 86, 221–234. Taylor, B. M., Pearson, P. D., Clark, K., & Walpole, S. (2000). Effective schools and accomplished
teachers: Lessons about primary-grade reading instruction in low-income schools. Elementary School Journal, 101, 121–165.

85
Torgesen, J., Morgan, S., & Davis, C. (1992). Effects of two types of phonological awareness training on word learning in kindergarten children. Journal of Educational Psychology, 84, 364–379.
Williams, J. P., Hall, K. M., Lauer, K. D., Stafford, K. B., DeSisto, L. A., deCani, J. S. (2005). Expository
Text Comprehension in the Primary Grade Classroom. Journal of Educational Psychology, 97, 538–550.
Wolery, M., Ault, M. J., Doyle, P. M., & Gast, D. L. (1992). Choral and individual responding
during small group instruction: Identification of interactional effects. Education & Treatment of Children, 15, 289–309.

86

87
Chapter 9
Improving Instruction in Schools Using Supplemental Instruction: Tier II Application
Students who do not make adequate progress in general education despite quality instruction and curricula receive additional instruction in Tier II. Approximately 15% to 20% of the student population may not make adequate progress in reading based on core instruction alone. Those students may benefit from participation in small-group interventions during 20- to 30-minute tutoring sessions at least three times each week. Tier II interventions are the most researched aspect of the Response to Intervention (RtI) model. For example, several studies have shown that participating in small-group remedial instruction led to increased student learning and prevented further reading difficulties from developing. Moreover, assessing response to interventions delivered in Tier II and modifying instruction based on progress monitoring data is an effective method for raising the achievement of students with at-risk characteristics. (Also see Chapter 7: Formative Assessment, page 63.)
Fuchs, L. S., Fuchs, D., Hamlett, C. L., Hope, S. K., Hollenbeck, K. N., Capizzi, A. M., Craddock, C. F., & Brothers, R. L. (2006). Extending responsiveness-to-intervention to math problem-solving at third grade. Teaching Exceptional Children, 38, 59–63.
Issue of Concern Research regarding RtI often emphasizes reading, but RtI and math has not received much attention. Research Question
• What are the results of applying RtI to third-grade math instruction? Participants
• Participants included third-grade students at-risk and not at-risk for math difficulties. • A total of 13 schools participated as either control or experimental classrooms for all
conditions. • An experimental design was utilized to answer the research questions.

88
Methods Used to Answer the Research Question • Instructional methods and supports included: scripted lessons, posters with steps to
follow to solve certain problems, peer practice time, independent practice time and student self-monitoring using graphs.
• Students in group A and identified at Tier II received tutoring in groups of two to four students, three times per week in 25–40-minute sessions, for 13 weeks.
• Students in group B and identified at Tier II received whole-group instruction as often as two to three times per week in 25–40-minute sessions, for 16 weeks.
• Students in group C and identified at Tier II received both whole-group sessions and tutoring sessions (as described above). Group C received a combination of the conditions provided to Groups A and B.
Results
• Students who received the experimental instructional program (i.e., Hot Math) for both whole-group instruction and tutoring made the greatest gains.
• Students who received Hot Math for only whole group or only tutoring did not make as much improvement.
Implications for Practice
• Increasing the amount of instructional time with an effective curriculum (i.e., core instructional time plus tutoring time) can significantly improve the skills of students receiving Tier II instruction.
• Using effective curricula in whole group or in supplemental interventions only, will not result in as much growth for students receiving Tier II instruction.
• Instructional changes made to the core program of instruction will enhance effects at Tier II.
Lennon, J. E., & Slesinski, C. (1999). Early intervention in reading: Results of a screening and intervention program for kindergarten students. School Psychology Review, 28, 353–364.
Issue of Concern Preventing special education placement by intervening in reading with kindergarten students. Research Question
• Can special education placement be prevented by identifying at-risk students via a letter-naming task and intervening using a ratio of one teacher to two students in a tutoring model with kindergarten students?
Participants and Demographics
• Participants included 330 kindergarten students.

89
• Five elementary schools in one school district participated. Forty percent of the students received Title I support.
• Schools were located in small cities, rural and suburban areas. • All students had not been identified for special education services.
Methods Used to Answer the Research Question
• A letter-naming task was used as the measure to identify students at risk for reading difficulties. Students identified as at-risk received the tutoring intervention. Student skills were categorized as:
o Low-performing (n = 80) median score of 15 letter names correct in 1 minute. o Middle-performing (n = 56) median score of 39 letter sounds correct in 1 minute. o High-performing (n = 40) median score of 47 letter sounds correct in 1 minute.
• Randomly selected subgroups of students from the low- and middle-scoring groups received the intervention for 10 weeks, and remaining students who were similarly performing but not randomly selected for intervention served as a “wait list” control group.
• Students who comprised the control group did not receive the intervention during the first 10 weeks, but received the intervention during the second 10-week session.
• Kindergarten students were given several assessment measures that yielded scores including: number of correctly named letters, number of correctly produced sounds, number of words correctly separated into phonemes, number of words correctly decoded, number of words correctly read from a list of high-frequency words and the Concepts of Print Test, which measures the student’s general understanding of print and reading.
• Participants were selected for tutoring services based on their letter-naming performance. • All kindergarten students were assessed using all the measures at the beginning of the study,
after 10 weeks, and again after 20 weeks. • Tutors met weekly as a group, with the author, to review program goals and tutoring
techniques such as procedures for progressing from recognition to recall to production in each learning activity.
• Tutors were observed frequently by the author. • Classroom teachers were also provided training in research-based reading instructional
techniques at the onset of the study and on a monthly basis. However, fidelity of teacher implementation of techniques was never measured.
• Pairs of students were assigned, but pairs were changed when one participant was making more progress than the other.
• Tutors worked with two students at a time for 30 minutes per day during the classroom teacher’s allocated reading instruction time. Tutors and students worked in a part of the classroom away from the location where the classroom teacher was providing instruction to remaining students, or in a room adjacent to the student’s classroom.
• Tutors conducted the daily 30-minute tutoring sessions with students for 10 weeks. • The reading instructional techniques were based on phonics and whole language and included:
instruction in letter names and sounds, phonemic awareness, decoding words, learning site words in isolation and then embedded within stories and reading connected text.

90
• Tutors also modeled writing and had students complete writing practice tasks. Results
• Statistical analyses determined that the letter-naming assessment had high construct validity as a tool used for selecting at-risk kindergarten students.
• Students who received the tutoring grew faster than control group students. Middle-performing students who received tutoring grew faster than low-performing students who received tutoring.
• In many cases, middle-performing students performed the same as high-performing students by the end of the intervention sessions at the 10-week assessment period.
• No follow-up achievement data for the kindergarten cohort existed, making it impossible to know the long-term impact of the tutoring.
• A two-year follow-up of the tutored cohort determined lower special education placement rates compared to previous cohorts.
Implications for Practice
• Daily 30-minute sessions of tutoring (with a teacher-to-student ratio of 1:2) focusing on reading and writing instruction with at-risk kindergarten students, can produce significant measurable student gains in beginning reading skills.
• This form of a tutoring intervention may contribute to fewer students being referred for special education for reading difficulties.
McMaster, K. L., Fuchs, D., Fuchs, L. S., & Compton, D. L. (2005). Responding to nonresponders: An experimental field trial of identification and intervention methods. Exceptional Children, 71, 445–463.
Issue of Concern Improving the reading performance of first-grade students not responding to a class-wide reading intervention. Research Questions
• Which of three interventions is most effective for improving reading performance of students who are not responding to a class-wide intervention: (1) additional peer-assisted learning strategies (PALS); (2) modified PALS or (3) tutoring?
• Can a dual-discrepancy model accurately identify students who are “non-responders”? (Also see Chapter 6: Accuracy of Learning Disability Identification Using RtI, page 53.)
Participants

91
• Research participants were 323 first-grade students receiving a class-wide reading intervention called Peer Assisted Learning Strategies (PALS.
• Fifty-six of the 323 students comprised a subgroup of students who were not responding to the class-wide intervention.
Methods Used to Answer the Research Questions
• In this study, 323 first-grade students received PALS in their classroom. • All students were pre- and post-tested using a variety of reliable and valid reading measures
including subtests from the Woodcock Johnson Tests of Achievement, curriculum-based measurement and others.
• Teachers used PALS one time per week, for 35-minute sessions, for 7 weeks with the first-grade students.
• First-grade students identified as at-risk and those that were typically performing were given weekly tests including PALS chapter tests of words and sounds, and two curriculum-based measures (CBMs), Nonsense Word Fluency and Dolch word probes.
• The 56 students that did not respond (“non-responders”) were identified from the at-risk group according to poor PALS chapter test performance and by calculating their mean levels and slopes using CBM scores (after 7 weeks of progress monitoring). Students were then determined to be .5 standard deviations below the mean levels and slopes of the average students.
• Students classified as non-responders received one of three interventions: (1) PALS; (2) modified PALS (3) or tutoring by an adult.
• Modified PALS had the same components as PALS, but involved the introduction of fewer words and sounds per session, modeling of sounds and words by the Coach in the pair before the Reader independently read and more modeling and practice of decoding during the “Sound it Out” activity portion of PALS.
• Students in the tutored group did not receive PALS at all. Tutoring occurred in 35-minute sessions three times per week, focusing on letter sounds, sight words, decoding and reading, and was intended to be similar to a special education service delivery model.
• Both the students classified as non-responders receiving an intervention and a control group were given multiple weekly reading measures to monitor progress toward acquiring basic reading skills.
Results
• There was no statistically significant difference between the effectiveness of the three different interventions on reading performance and growth of the students who did not respond.
• Overall, 70% of the students who were at risk and nonresponsive remained persistent nonresponders following intervention (22% of the total at-risk group).
• Word-level CBM measures were effective and reliable in monitoring student progress and then accurately identifying students that do not respond to intervention according to performance that was low on level and slope.

92
Implications for Practice • Tutoring for students who are not responding to class-wide interventions is probably the most
effective intervention compared to providing the student with other in-class interventions. Although results were not statistically significant for this intervention, results were stronger compared to the other interventions implemented with students classified as non-responders.
• Lack of response to classwide instruction can be most reliably and validly identified using CBM tools, versus other measures of reading achievement.
Torgesen, J. K. (2002). The prevention of reading difficulties. Journal of School Psychology, 40, 7–26. Purpose of the Paper This article reviews the research findings about what is required to read well, describes common reading difficulties and provides an overview of effective prevention of reading problems. What is required to read well?
• To read with comprehension, students must have language comprehension and accurate, rapid understanding of words.
Common reading difficulties
• One common reading difficulty is students with levels of sight-word recognition of grade-level words that are much lower in number than typical peers.
• Another common reading problem is students’ difficulties applying phonemic decoding skills to unknown words.
Causes of reading difficulties
• One cause of reading difficulty is a student’s lack of phonemic awareness or ear training. An example would be not being able to recognize that two words start with the same sound.
• Another cause of reading difficulty is lack of spoken vocabulary/oral language, or existing knowledge about words.
Effective instruction that focuses on preventing reading difficulties (the author cites the suggestions from the National Reading Panel). A number of effective instructional practices were identified, including the following.
• Instruction focused on explicit teaching, phonemic awareness, phonemic decoding, fluency in reading and comprehension, oral vocabulary, spelling and writing.

93
Intensive instruction for students at risk for academic difficulties • Intensive instruction provides more daily academic engaged time focused on reading
instruction and practice for students who are at-risk. o Peer strategies such as classwide peer tutoring and peer-assisted learning
strategies have been found to improve the reading skills of students who are at-risk.
o Small-group and individual instruction provided in addition to core reading instruction time, and in an intensive manner, has been found effective in improving the skills of at-risk students.
Instruction provided incrementally with guidance
• The learner should be instructed slowly and deliberately with support from the teacher.
• In this context, the teacher guides an interaction and the student responds frequently and is assisted by the teacher in creating his/her answer.
Effective prevention of reading problems
• Schools that provide effective core reading instruction as well as additional intensive instruction to at-risk students have seen significant growth in student achievement.
• Torgesen reviews the results from a school in Florida where, over the course of five years, they reduced the number of students performing below the 25th percentile in reading on a nationally standardized test of word reading ability, by implementing effective core reading instruction.
o For example, initially, 31.8% of the first-grade students performed below the 25th percentile on the reading test. After five years of implementation, 3.7% of first-grade students performed below the 25th percentile.
Implications for Practice
• School-based teams can easily and rapidly identify students who are at risk for reading failure by assessing phonics, letter–sound understanding and vocabulary. (Also see Chapter 7: Formative Assessment, page 63.)
• Students who earn low scores should be provided with intensive instruction in addition to their core reading instruction. (Also see Chapter 10: Intensive Instruction, Tier III Application, page 99.)
• Schools should routinely assess their kindergarten through third-grade students three times per year in reading skills, moving from a focus on beginning phonics and vocabulary to connected text.
• By measuring student progress frequently, students who are at-risk can be identified early and provided intensive instruction.

94
Vellutino, F. R., Scanlon, D. M., & Lyon, G. R. (2000). Differentiating between difficult-to-remediate and readily remediated poor readers: More evidence against the IQ-achievement discrepancy definition of reading disability. Journal of Learning Disabilities, 33, 223–238.
Issue of Concern Early, reliable identification of children at risk for reading failure. Research Questions
• Can the use of early intensive intervention enhance the validity of a reading disability diagnosis?
• Is it possible to distinguish the cause of a student’s reading difficulty as being cognitive or instructionally related?
Participants
• Participants included 1,284 kindergarten students who were followed through fourth grade.
Methods Used to Answer the Research Questions
• A series of assessment measures were administered to all participants in kindergarten in the areas of reading, language and cognitive performance.
• At the middle of first grade, students were again assessed and identified as students with reading problems or typical readers.
o Students with reading problems were initially identified by teachers and also scored below the 15th percentile on a reading test.
o Typical readers were also selected by teachers and in addition scored at or above the 40th percentile on a reading test.
• All students scored at or above a standard score of 90 on either the Verbal or Performance portions of the Wechsler Intelligence Scale for Children (WISC); therefore, all the students could be characterized as having “average intelligence.”
• All students were assessed in reading through the spring of fourth grade. • Other measures of reading comprehension and reading-related cognitive abilities
were administered in first and third grades. • Seventy-six randomly selected students with reading problems received 30 minutes per
day of individual tutoring for one to two semesters, beginning in the middle of first grade. The other students with reading problems did not receive tutoring.
• Results from the first semester of tutoring (middle to end of first grade) were used to classify students into one of four categories: (1) very limited growth; (2) Limited growth; (3) good growth and (4) very good growth.

95
Results • IQ scores (in this sample where all IQ scores were greater than 90) were not found to be
a meaningful predictor of struggling and average readers. IQ scores were not predictive of reading performance in this sample.
• IQ scores were not found to be a valid measure of the difference between intervention “responders” and “non-responders.”
• Students made slight or dramatic gains in their reading performances as a result of the tutoring in reading skills. WISC scores did not predict gains.
• Students varied in the amount of gains they made and the pace at which they improved their reading skills.
• Reading tests focusing on phonics skills were found to discriminate between students whose skills were easy to remediate and those whose skills were more difficult to remediate.
Implications for Practice
• WISC scores (given a sample of students showing varying reading performances but scoring in all cases greater than 90 standard score on the WISC) did not determine one’s ability to be taught to read.
• The best way to discriminate between students who will and will not successfully respond to intervention is to use progress monitoring embedded within an RtI model.
• Assessing a student’s reading skills and determining intervention effectiveness is a better use of staff time than conducting intellectual assessments.
References
Blachman, B., Schatschneider, C., Fletcher, J. M., Francis, D. J., Clonan, S. M., Shaywitz, B. A., & Schaywitz, S. E. (2004). Effects of intensive reading remediation for second and third graders and a 1-Year follow-up. Journal of Educational Psychology, 96, 444–461.
Compton, D. L, Fuchs, D., Fuchs, L. S., & Byrant, J. D. (2006). Selecting at-risk readers in first grade for early intervention: A two-year longitudinal study of decision rules and procedures. Journal of Educational Psychology, 98, 394–409.
Dickson, S. V., & Bursuck, W. D. (1999). Implementing a model for preventing reading failure: A report from the field. Learning Disabilities Research and Practice, 14, 191–202.
Elbaum, B. E., Vaughn, S., Hughes, M. T., & Moody, S. W. (2000). How effective are one-to-one tutoring programs in reading for elementary students at risk for reading failure? Journal of Educational Psychology, 92, 605–619.

96
Elbro, C., & Petersen, D. K. (2004). Long-term effects of phoneme awareness and letter sound training: An intervention study with children at risk for dyslexia. Journal of Educational Psychology, 96, 660–670.
Fuchs, L. S., Compton, D. L., Fuchs, D., Paulsen, K., Bryant, J. D., & Hamlett, C. L. (2005). The prevention, identification, and cognitive determinants of math difficulty. Journal of Educational Psychology, 97, 493–513.
Fuchs, L. S., Fuchs, D., Hamlett, C. L., Hope, S. K., Hollenbeck, K. N., Capizzi, A. M., Craddock, C. F., & Brothers, R. L. (2006). Extending responsiveness-to-intervention to math problem-solving at third grade. Teaching Exceptional Children, 38, 59–63.
Green, S. K., Alderman, G., & Liechty, A. (2004). Peer tutoring, individualized intervention, and progress monitoring with at-risk second-grade readers. Preventing School Failure, 49, 11–17.
Hindson, B., Bryne, B., Fielding-Barnsley, R., Newman, C., Hine, D. W., & Shankweiler, D. (2005). Assessment and early instruction of preschool children at risk for reading disability. Journal of Educational Psychology, 97, 687–704.
Kamps, D. M., & Greenwood, C. R. (2005). Formulating secondary-level reading interventions. Journal of Learning Disabilities, 38, 500–509.
Lennon, J. E., & Slesinski, C. (1999). Early intervention in reading: Results of a screening and intervention program for kindergarten students. School Psychology Review, 28, 353–364.
Mason, L. H. (2004). Explicit self-regulated strategy development versus reciprocal questioning: effects on expository reading comprehension among struggling readers. Journal of Educational Psychology, 96, 283–296.
McCarthy, P., Newby, R. F., & Recht, D. R. (1995). An early intervention program for first grade children at-risk for reading disability. Reading Research and Instruction, 34, 273–294.
McMaster, K. L., Fuchs, D., Fuchs, L. S., & Compton, D. L. (2005). Responding to nonresponders: An experimental field trial of identification and intervention methods. Exceptional Children, 71, 445–463.
Morris, D. (2006). Using noncertified tutors to work with at-risk readers: An evidence-based model. The Elementary School Journal, 106, 351–362.
Morris, D., Shaw, B., & Penney, J. (1990). Helping low readers in Grades 2 and 3: An after-school volunteer tutoring program. The Elementary School Journal, 91, 133–150.

97
Pinnell, G. S., Lyons, C. A., DeFord, D. E., Bryk, A. S., & Seltzer, M. (1994). Comparing instructional models for the literacy education of high-risk first graders. Reading Research Quarterly, 29, 9–39.
Simos, P. G., Fletcher, J. M., Bergman, E., Breier, J. I., Foorman, B. R., Castillo, E. M., Davis, R. N., Fitzgerald, M., & Papanicolaou, A. C. (2001). Dyslexia-specific brain activation profile becomes normal following successful remedial training. Neurology, 58, 1203–1213.
Slavin, R. E., & Madden, N. A. (1989). What works for students at risk: A research synthesis.
Educational Leadership, 46, 4–13.
Torgesen, J. K. (2002). The prevention of reading difficulties. Journal of School Psychology, 40, 7–26.
Torgesen, J., Alexander, A., Wagner, R., Rashotte, C., Voeller, K., & Conway, T. (2001). Intensive remedial instruction for children with severe reading disabilities: Immediate and long-term outcomes from two instructional approaches. Journal of Learning Disabilities, 34, 33–58.
Torgesen, J. K., Rose, E., Lindamood, P., Conway, T., & Garvan C. (1999). Preventing reading failure in young children with phonological processing disabilities: Group and individual responses to instruction. Journal of Educational Psychology, 91, 579–594.
Vadasy, P. F., Jenkins, J. R., Antil, L. R., Wayne, S. K., & O’Connor, R. E. (1997). The effectiveness of one-to-one tutoring by community tutors for at-risk beginning readers. Learning Disability Quarterly, 20, 126–139.
Vellutino, F. R. (1987). Dyslexia. Scientific American, 256, 34–41.
Vellutino, F. R. (2002). On the role of intervention in identifying learning disabilities. In R. Bradley, L. Danielson, & D. Hallahan (Eds.), Identification of learning disabilities: Research to practice (pp. 555–564). Mahwah, NJ: Erlbaum.
Vellutino, F. R., & Scanlon, D. M. (2002). The Interactive Strategies approach to reading intervention. Contemporary Educational Psychology, 27, 573–635.
Vellutino, F. R., Scanlon, D. M., & Jaccard, J. (2003). Toward distinguishing between cognitive and experiential deficits as primary sources of difficulty in learning to read: A two year follow-up of difficult to remediate and readily remediated poor readers. In B. R. Foorman (Ed.), Preventing and remediating reading difficulties: Bringing science to scale (pp. 73–120). Baltimore, MD: York Press.

98
Vellutino, F. R., Scanlon, D. M., & Lyon, G. R. (2000). Differentiating between difficult-to-remediate and readily remediated poor readers: More evidence against the IQ-achievement discrepancy definition of reading disability. Journal of Learning Disabilities, 33, 223–238.
Vellutino, F. R., Scanlon, D. M., Sipay, E. R., Small, S. G., Pratt, A., Chen, R. S., & Denckla, M. B. (1996). Cognitive profiles of difficult to remediate and readily remediated poor readers: Early intervention as a vehicle for distinguishing between cognitive and experiential deficits as basic causes of specific reading disability. Journal of Educational Psychology, 88, 601–638.
Vellutino, F. R., Scanlon, D. M., & Tanzman, M. S. (1998). The case for early intervention in diagnosing specific reading disability. Journal of School Psychology, 36, 367–397
Wasik, B. A., & Slavin, R. R. (1993). Preventing early reading failure with one-to- one tutoring: A review of five programs. Reading Research Quarterly, 28, 179–200.

99
Chapter 10
Intensive Instruction: Tier III Application After steps have been made to ensure that the instructional environment is sound, and it has been determined that a student still does not meet academic expectations as compared to his/her peers, more intensive intervention may be required. Once the problem is identified and validated, professionals explore various intervention options and evaluate the interventions’ effect on the students’ learning. If the “causes” of the behaviors are identified (i.e., the task is too difficult), an intervention can be linked to this identified cause. Throughout this process, formative assessment can be used to identify and guide possible interventions. In other words, assessment will inform the intervention and each plan will be based on the data obtained during assessment. Instructional or environmental variables also may be altered to promote the success of the student. For example, the intervention could require that the teacher provide more corrective feedback or praise during instruction. To ensure positive outcomes, research-validated interventions should be used. Furthermore, schools should have a variety of interventions available to address the full range of performance problems that are typically presented by students. If the student requires more intensive intervention than can be provided in the general education setting, professionals may consider eligibility for special education services. Good, R. H., & Kaminski, R. A. (1996). Assessment for instructional decisions: Toward a proactive/prevention model of decision-making for early literacy skills. School Psychology Quarterly, 11, 326–336. Issue of Concern A successful model used to make educational decisions for students is the problem-solving model of assessment first written about by Deno (1989) and Shinn (1989). The problem is identified and validated, solutions are explored and evaluated and a problem solution is obtained.
• In problem-solving assessment, a problem is identified when the target students do not meet the academic expectations met by their typical peers.
• This description may not apply to students in kindergarten and first grade for numerous reasons including the following.
o Expectations for reading skills are very low for these grades. o If one waits until a reading deficit is apparent in level of performance, then
prevention of the deficit may not occur. In other words, learning trajectories or growth rates may be used to identify children at risk of not hitting the desired levels of performance and provide them with intervention.

100
Research Questions • When focusing on kindergarten and first-grade students, can this model provide useful
information with regard to which students to target, the skills to address in intervention and the effectiveness of the intervention?
• A case study is used to describe a form of the problem-solving model that can be used with kindergarten and first-grade students.
Participants
• A kindergarten child named “Randy” from a public school in Michigan served as a case study for this project.
Methods Used to Answer the Research Questions
• The four phases of the problem-solving model are implemented using measures from Dynamic Indicators of Basic Early Literacy Skills (DIBELS).
• All kindergarten children were screened by the school psychologist using the oral reading fluency (ORF) measure, and a local normative criterion was used to identify at-risk children. (Also see Chapter 7: Formative Assessment, page 63.)
• Randy’s score was consistent with his peers and a problem was not identified. In a 2-month follow-up assessment, Randy’s score fell below that of his peers and further assessment of his skills was performed.
• In the problem validation phase, four repeated assessments over a 2-month period indicated that he was not making adequate progress with regard to phonological awareness skills.
• A phonological awareness intervention was implemented, and Randy’s progress was monitored. Randy made gains on the ORF measure and surpassed the median of his class. When Randy and his class had reached the ceiling on the ORF, the measure was switched to phoneme segmentation fluency (PSF), measuring more difficult skills.
• After the intervention was discontinued, Randy made little progress and a discrepancy between current and expected skills increased. After a second intervention was implemented, his scores again increased and his progress was monitored.
• The solutions were evaluated, and the data gathered provided information on the effectiveness of the intervention for Randy (see results). As in this study, solutions should be evaluated on an individual, case-by-case basis.
Results • The assessment results and decisions will vary based on each individual student’s
scores. • Practitioners were able to proactively target reading problems for the students
identified with major difficulty in basic early literacy and reading skills. • At the end of first grade, Randy was in the upper 25% of his class in reading, and in
second grade he was in the average range when compared to his peers.

101
Implications for Practice • Illustrates the use of the problem-solving model of educational decision making for
students in kindergarten. (Also see Chapter 15: RtI Models That Have Demonstrated Their Effectiveness, page 165.)
• Repeated measures of the DIBELS measures of phonological awareness may be used for this age group to evaluate the effectiveness of intervention and student progress.
• Skills assessed by DIBELS measures are not the only skills that should be evaluated and taught.
• The assessment does not necessarily inform instruction, and interventions should be based on research-validated methods.
Lentz, F. E., & Shapiro, E. S. (1986). Functional assessment of the academic environment. School Psychology Review, 15, 346–357. Purpose of the Paper This document provides a model to assess environmental variables in the classroom that may affect academic performance. Assessment results may be used to inform intervention planning.
• Common procedures frequently used by school psychologists ignore the effect of the interaction between the student and environment when assessing academic difficulties.
• Classroom variables (academic ecology) are of extreme importance when assessing academic issues.
• The link between assessment and intervention requires knowledge of the academic ecology in which the student is learning.
• Three general procedures are used to assess the environment and should be applied in a consultative framework including:
1. teacher interviews 2. direct observations 3. permanent products

102
Procedure Purpose Steps Teacher Interviews (4 types) Problem identification Problem analysis Plan implementation Plan evaluation
Clear definition of presenting problem and related environmental issues. Analysis of the resources available to plan interventions. Assess if the intervention has been implemented with integrity. How has the ecology changed? Did the intervention work?
Focus on operational definitions of the behavior (observable antecedents and consequences of the behavior, the frequencies of the behavior and the setting events). After collection of data by the consultant, work with teacher to determine what is available. Conduct integrity checks, analyze data. Track student progress, alter plan if necessary.
Direct observational procedures To collect objective data, to determine if environment has altered and effects on student performance.
Conducted after problem identification, continued following implementation of intervention, should be standardized, three observations of an academic period.
Permanent products To identify target skill areas and to validate less direct measures of engagement.
During initial interviews collect past products of work (i.e., worksheets, homework, tests); examine work completed during observations. Assess the amount produced and the quality of response opportunities.

103
Implications for Practice • The problem analysis discussed above can be used to develop interventions linked to
the classroom ecology. For example, the problem identification, analysis and observations may demonstrate that a student is not engaged during independent seat work and group instruction. Some of the interventions will be designed to alter this environmental variable. The teacher may ask for responses frequently, provide error correction and praise student for accuracy.
• Each student’s intervention plan will vary based on the data obtained from the assessment procedure.
• This model can be useful in determining the classroom and instructional variables that affect a student’s academic success.
Daly, E. J., III, Witt, J. C., Martens, B. K., & Dool, E. J. (1997). A model for conducting a functional analysis of academic performance problems. School Psychology Review, 26, 554–574. Purpose of Paper This document provides a model for directly testing possible causes of poor academic performance for individual children in classrooms.
• Functional analysis is performed to test common causes of poor academic performance for individual children.
• Common causes of poor performance that can be directly tested include the following. o Students have not had enough practice to perform the skill correctly. o Students are not sufficiently motivated to perform the skill correctly. o Students have not had enough help to correctly perform the skill. o Students have never been asked to perform the skill in that way before, or the
task is too hard. • Each possible cause is linked to an intervention that makes sense (e.g., if the child has
not had enough practice performing the skill, provide extra practice). • Each of these possible causes of poor performance is tested by providing the
intervention and measuring the child’s response.

104
As demonstrated in this graph, the target student is reading 88 words correct per minute (wc/min) before intervention. For the first intervention, she was offered a reward to meet the criterion score, and scored 74 wc/min (i.e., her performance was not improved with incentives, so lack of motivation as a likely cause for poor performance is considered and ruled out). The Repeated Readings session is designed to test the hypothesis that the student has not had enough practice to correctly perform the skill. Given extra practice, the student read 130 wc/min (above the criterion). The baseline condition was repeated, in which the student received no intervention, followed by the repeated reading intervention to confirm the functional relationship between strong reading performance and the extra practice intervention. Based on these data, it appears that the student will benefit from additional practice with the material (i.e., repeated readings of the passage). It will be important to note that the test conditions will vary across students, and the level at which proficient students perform will be different across grade levels.
8874
130
90
123
0
20
40
60
80
100
120
140
wor
ds re
ad c
orre
ctly
per
min
ute
Baseline Baselinecontingentreinforcement
repeated reading
repeated reading

105
Some suggested interventions to be used are summarized in the table below. Possible Causes Proposed Interventions Student is not motivated. Provide incentives, use naturalistic instructional
strategies as much as possible when teaching the skill (i.e., conduct training in context where performance “matters” to the student), provide the student choices in activities.
Student is not actively responding. Estimate current rate and increase student responding by using structured tasks, quickly paced instruction, allocating enough time for instruction, intervening at the correct task difficulty level so that the student can respond successfully and gradually increase task difficulty as student skill improves, providing immediate feedback, and setting criteria and reinforcing faster and more accurate (i.e., fluent) performances.
There is not enough prompting and feedback active responding.
Use response cards, choral responding, flashcards with praise/correction, peer tutoring.
Student shows poor accuracy in skill. Increase modeling and error corrections (read to student, practice with error correction, use cover-copy-compare).
Student shows poor fluency in skill. Increase practice and provide incentives for the student “beating his/her score.”
Student does not generalize the skill. Teach multiple examples, teach skill in natural setting, self-monitoring, use natural incentives.
Materials do not match curricular objective. State objective and identify related lessons that promote the use of the skill in natural context.
Skill is too hard for the student. Identify student accuracy and fluency and use materials that encourage a high rate of responding.
Implications for Practice • Describes a science-based model for identifying effective intervention for struggling
students. • Based on the functional analysis literature (Iwata, Dorsey, Slifer, Bauman, & Richman,
1982, Horner, 1994; Iwata, Pace et al., 1994; Mace, 1994) and the brief experimental analysis literature (Eckert, Ardoin, Daly, Martens, 2002; Daly, Martens, Hamler, Dool, & Eckert, 1999), this model of assessment has been subsequently validated through empirical studies.

106
Marston, D., Muyskens, P., Lau, M., & Canter, A. (2003). Problem-solving model for decision making with high-incidence disabilities: The Minneapolis experience. Learning Disabilities Research & Practice, 18, 187–200. Purpose of Paper The problem-solving model (PSM) in the Minneapolis Public Schools is discussed. (Also see Chapter 15: RtI Models That Have Demonstrated Their Effectiveness, page 165.)
• The PSM was designed as a three-stage model to evaluate an individual student’s academic needs, plan interventions and measure response to intervention (RtI) to make special education eligibility decisions based on data obtained.
• The data gained during the process is used to guide decisions regarding: o interventions in general education; o special education referrals; o evaluation for special education eligibility.
• In each stage, this model links assessment data to intervention decisions and requires the student to pass through multiple gates before being considered for special education.

107
Stage Steps Data Collected/Information
Documented Stage 1: Classroom interventions
Using district- and school-wide screening data students are targeted for Stage 1: Teachers make instructional modifications for individual student.
Monitor student progress; collect information on cultural and economic variables that influence performance; document specific concerns, levels of performance, student strengths, health info, parent info, staff info, screening data, student interviews, types of interventions tried and results.
Stage 2: Problem-solving team interventions
If the teacher determines intervention is unsuccessful in Stage 1, student will move to Stage 2: Multidisciplinary team refines intervention and progress monitoring, considers other variables, and reviews student progress periodically, and makes instructional changes. Interventions continue within general education.
Define target issues, document levels of performance, determine realistic goals, generate interventions, select and describe intervention plan, monitor student progress and track results.
Stage 3: Special education referral and due process procedures
If Stage 2 yields an inadequate response as determined by student progress data, the student moves to Stage 3: Parent consent is obtained, results are reviewed from stages 1 and 2, testing procedures are selected (cognitive, achievement tests), direct observations are conducted, parent information is obtained and instructional plans are continued/modified from Stage 2.
Parent consent is documented, school psychologists gain information from numerous sources of data via: review of intervention data, measures of behavior, observation, direct interaction with student, etc.
Implications for Practice
• Through the implementation of the PSM model, the need to differentiate instruction has been emphasized. Schools must create a variety of intervention options for students at various academic levels.
• Overall academic and behavioral interventions for students will be improved, and training for staff will need to increase.
• The PSM emphasizes a collaborative model across general education and special education lines and will require training in progress monitoring and collaborative teamwork.

108
• As such models continue to be implemented across the country, the roles of school psychologists, administrators and teachers will shift.
o Teachers will need to be trained in the implementation of PSMs and data collection.
o Special education teachers may share instructional knowledge with teachers during stage 1 and provide assistance during stage 2.
o School psychologists may participate as instructional consultants and allies within the general education setting.
o Administrators may need to allocate resources to the general education teachers and allocate time to work with the multidisciplinary teams.
• As these roles shift, all disciplines must work collaboratively to use the model effectively.
Speece, D. L., Case, L. P., & Molloy, D. E. (2003). Responsiveness to general education instruction as the first gate to learning disabilities identification. Learning Disabilities Research and Practice, 18, 147–156. Issue of Concern
• Three studies are reviewed that explored the use of the treatment validity model in the context of evaluating the student’s RtI within the general education setting.
• RtI was measured by assessing the student’s level and rate of performance (slope) as compared to peers, and subsequently identifying a “dual discrepancy” in slope and level of performance.
• Students with dual discrepancies (DD) are provided with modified general education instruction:
o For those students who show improvement and no longer demonstrate a dual discrepancy, the instructional placement in general education is deemed appropriate.
o If the student continues to maintain a dual discrepancy, the placement is not valid and a trial placement in a more instructionally intensive setting may be used to determine response to intensive interventions.
Research Questions
• Do students identified as DD differ from children who have IQ-reading achievement discrepancies or those with low reading achievement?
• Do the DD students who have an inadequate response to the general education interventions experience more reading and behavioral issues, as compared to DD students who have an adequate RtI?
• Does the use of the treatment validity model produce better academic and behavioral outcomes for DD children who participate in the model as compared to those who do not?

109
Participants
• Three suburban schools from one school district in a mid-Atlantic state participated. • Based on the universal screening using CBM, two groups of first-grade children and
one group of second-grade children were identified as the at-risk sample (AR). • Each year, a sample of students from each classroom was used to identify class slope
and level. Methods Used to Answer the Research Questions
• A 3-year longitudinal study was conducted to assess various aspects of the treatment validity model to identify learning disabilities (LD).
• Participants were administered various screening measures. All students were administered three reading subtests and an abbreviated IQ scale. Students at risk for reading difficulties received additional phonological processing, word reading efficiency tasks and a teacher rating of their classroom behavior.
• In the first study, the children’s scores were compared across groups based on the data obtained.
• In the second study, general education instruction was modified for DD students, plans were implemented for 8 weeks and progress was monitored. Again, the students were compared based on data obtained.
• Students who received modified instruction were compared with those students who did not.
Results
• Results indicated that DD students had more academic and behavioral issues than children with IQ-achievement discrepancies or low achievement.
• Students who were non-responsive across all three years were significantly different than the other students at risk on reading and behavioral measures.
• Students at risk for reading difficulties who received general education interventions within the treatment validity model had better results than at-risk students who did not receive the intervention.
Implications for Practice
• The results of these studies indicate that RtI models can be useful in identifying students with academic difficulties and that use of RtI-guided intervention was associated with improved student outcomes. (Also see Chapter 4: The Need to Focus on Student Outcomes, page 35.)
• These studies demonstrate that schools have the ability to identify students at risk for academic problems and provide a mechanism for linking assessment data to intervention.

110
References Allyon, T., & Roberts, M. D. (1974). Eliminating discipline problems by strengthening
academic performance. Journal of Applied Behavior Analysis, 7, 71–76. Belfiore, P. J., Skinner, C. H., & Ferkis, M. (1995). Effects of response and trial repetition on
sight-word training for students with learning disabilities. Journal of Applied Behavior Analysis, 28, 347–348.
Daly, E. J., III, Lentz, F. E., & Boyer, J. (1996). The instructional hierarchy: A conceptual model
for understanding the effective components of reading interventions. School Psychology Quarterly, 11, 369–386.
Daly, E. J., III, & Martens, B. K. (1994). A comparison of three interventions for increasing oral
reading performance: Application of the instructional hierarchy. Journal of Applied Behavior Analysis, 27, 459–469.
Daly, E. J., III, Martens, B. K., Kilmer, A., & Massie, D. (1996). The effects of instructional
match and content overlap on generalized reading performance. Journal of Applied Behavior Analysis, 29, 507–518.
Daly, E. J., III, Witt, J. C., Martens, B. K., & Dool, E. J. (1997). A model for conducting a
functional analysis of academic performance problems. School Psychology Review, 26, 554–574.
Gardner, R., III, Heward, W. L., & Grossi, T. A. (1994). Effects of response cards on student
participation and academic achievement: A systematic replication with inner-city students during whole-class science instruction. Journal of Applied Behavior Analysis, 27, 63–72.
Good, R. H., & Kaminski, R. A. (1996). Assessment for instructional decisions: Toward a
proactive/prevention model of decision-making for early literacy skills. School Psychology Quarterly, 11, 326–336.
Harris, W., & Sherman, J. (1973). Effects of peer tutoring and consequences on the math
performance of elementary classroom students. Journal of Applied Behavior Analysis, 6, 585–593.
Juel, C. (1996). What makes literacy tutoring effective? Reading Research Quarterly, 31, 268–289.

111
Kame’enui, E. J., & Simmons, D. C. (1990). Designing instructional strategies: The prevention of academic learning problems. Columbus, OH: Merrill.
Kaminski, R. A., & Good, R. H. (1996). Towards a technology for assessing basic early literacy
skills. School Psychology Review, 25, 215–227. Lentz, F. E., & Shapiro, E. S. (1986). Functional assessment of the academic environment. School
Psychology Review, 15, 346–357. Lovett, M. W., & Steinbach, K. A. (1997). The effectiveness of remedial programs for reading
disabled children of different ages: Does the benefit decrease for older children? Learning Disability Quarterly, 20, 189–210.
Lundberg, I., Frost, J., & Peterson, O. P. (1988). Effects of an extensive program for stimulating
phonological awareness in preschool children. Reading Research Quarterly, 23, 263–284. Marston, D., Muyskens, P., Lau, M., & Canter, A. (2003). Problem-solving model for decision
making with high-incidence disabilities: The Minneapolis experience. Learning Disabilities Research & Practice, 18, 187–200.
Mastropieri, M. A., & Scruggs, T. E. (1997). Best practices in promoting reading comprehension
in students with learning disabilities: 1976–1996. Remedial and Special Education, 18, 197–213.
McComas, J. J., Wacker, D. P., Cooper, S. J., Asmus, J. M., Richman, D., & Stoner, B. (1996).
Brief experimental analysis of stimulus prompts for accurate responding on academic tasks in an outpatient clinic. Journal of Applied Behavior Analysis, 29, 397–401.
Munson Doyle, P., Gast, D. L., Wolery, M., Jones Ault, M., & Meyer, S. (1992). Teaching discrete
skills to students with moderate mental retardation in small-group instructional arrangements. Exceptionality, 3, 233–253.
Narayan, J. S., Heward, W. L., Gardner, R., III, Courson, F. H., & Omness, C. K. (1990). Using
response cards to increase student participation in an elementary classroom. Journal of Applied Behavior Analysis, 23, 483–490.
Speece, D. L., Case, L. P., & Molloy, D. E. (2003). Responsiveness to general education instruction as the first gate to learning disabilities identification. Learning Disabilities Research and Practice, 18, 147–156.
Swanson, H. L. (1999). Reading research for students with LD: A meta-analysis of intervention
outcomes. Journal of Learning Disabilities, 32, 504–532.
112
Torgesen, J. K., Alexander, A. W., Wagner, R. K., Rashotte, C. A., Voeller, K. K. S., & Conway, T. (2001). Intensive remedial instruction for children with severe reading disabilities: Immediate and long-term outcomes from two instructional approaches. Journal of Learning Disabilities, 34, 33–58.
Torgesen, J. K., Morgan, S. T., & Davis, C. (1992). Effects of two types of phonological
awareness training on word earning in kindergarten children. Journal of Educational Psychology, 84, 364–370.
Torgesen, J. K., Wagner, R. K., Rashotte, C. A., Alexander, A. W., & Conway, T. (1997).
Preventive and remedial interventions for children with severe reading disabilities. Learning Disabilities: An Interdisciplinary Journal, 8, 51–62.

113
Chapter 11
Using RtI in Social-Emotional-Behavioral Areas: Tier I Application
Support of social-emotional learning in American schools is as important as supporting academic learning. Response to intervention (RtI) approaches have been equally effective in working with social-emotional and behavioral learning as they have been in academics. To support behavioral learning in school settings, administrators and educators can be most effective if they act proactively and implement school-wide prevention and intervention programs. To this end, RtI systems have been developed that help schools to clearly define behavioral expectations in schools, to teach those expectations, to put in place encouragement systems and to put in place corrective strategies. These proactive strategies can be viewed as an example of Tier I (core) instruction in social-emotional behavioral areas. As described below, numerous studies have been conducted to evaluate the effect of school-wide behavior interventions on students’ behavioral learning and have demonstrated promising results for the use of proactive strategies.
Colvin, G., Sugai, G., Good, R. H., III, & Young-Yon, L. (1997). Using active supervision and precorrection to improve transition behaviors in an Elementary School. School Psychology Quarterly, 12, 344–363. Issue of Concern A study was conducted to examine the effect of a school-wide intervention program on the behavior of students in transition settings (e.g., hallways and cafeterias).
• Investigators discussed the consultative role of the school psychologist in helping prevent problem behaviors during transitions.
• By changing the environment in which many problem behaviors occur, professionals can reduce some students’ need for special education services.
• About 50% of problem behaviors reported occur in non-classroom settings (e.g., hallways, playgrounds). Transitions are common times for problem behaviors.
• Two school-wide strategies were used: o Active supervision: specific and overt behaviors used by adults to prevent
problem behavior. Scanning, escorting and interacting with students are examples of this intervention. Staff must move around, look around and interact with the students.
o Precorrections: students are instructed before a behavior is likely to occur and include verbal reminders of the rules, behavioral rehearsals of appropriate behaviors and demonstration of appropriate behaviors.

114
Research Question
• What are the effects of active supervision and precorrection on student problem behavior during three transitions?
o entering school at the beginning of the day; o leaving class to go to the cafeteria; o leaving class and school at the end of the day.
Participants
• The study was conducted in an elementary school with 475 students from kindergarten through fifth grade.
Methods Used to Answer the Research Question
• Problem behaviors were identified by a school-based team. • Baseline data were collected at each of the three transition areas, and then supervisory
staff were trained to use precorrection strategies and active supervision across the three settings.
• Data were collected in three areas: o Setting characteristics: number of staff present and number of students present
was recorded. o Supervisor behavior: scanning, escorting and interacting were observed and
tallied. o Student behavior: the frequency of problem behaviors was recorded (i.e.,
running, shouting, sliding, throwing and other). • A multiple baseline design was used, meaning the intervention strategies were
implemented in the various areas in a time-lagged manner to examine the effect of the intervention. Once stable patterns of behavior were obtained in the first setting, the intervention was initiated in the next setting.
• Results were analyzed in three ways: 1. reviewing graphs to identify significant changes in behavior patterns; 2. calculating correlations to determine if relationships existed between
supervisor behavior and student problem behavior; 3. hierarchical linear modeling to determine the degree to which these
interventions contributed to the reduction in student problem behavior. Results
• By reviewing the graphs, it was determined that problem behaviors were reduced when the interventions were implemented.
• The activeness of the supervisor (moving around, scanning the area and talking to students) was more important in effecting behavior change than the number of supervisors on duty.

115
• Results indicated that problem behaviors were substantially reduced with active supervision and precorrection in place.
Implications for Practice
• The intervention strategies were efficient and required little training time. • Two simple interventions may be implemented in a school setting and result in positive
effects on student problem behavior. • Proactive strategies, as described above, can lead to reductions in problem behavior
and decrease the need for students to have intensive behavioral interventions. Gettinger, M. (1988). Methods of proactive classroom management. School Psychology Review, 17, 227–242. Purpose of Paper Provides a set of procedures that when used collectively can be seen as proactive classroom management.
• Proactive classroom management occurs when a productive learning environment for students is established and consistently maintained.
• With classroom management in place, the opportunities for problem behavior (and therefore its occurrence) decrease.
• The ability of the teacher to effectively manage the classroom is related to student involvement and student achievement.
• There are the following three factors that distinguish proactive classroom management from other strategies.
1. It is proactive, rather than reactive. 2. Behavioral management methods are integrated with effective instruction
procedures. 3. Focus is on group dimensions of the classroom, rather than individual
student behavior. • Three specific clusters of behavior differentiate effective from less effective teachers.
These include:

116
Effective Teacher Behavior
Description Teacher Behaviors
Manage information flow Teachers’ ability to communicate an awareness of classroom occurrences and to show a commitment to work.
Includes two subcategories: (1) Convey purposefulness. (2) Teach appropriate behaviors.
Convey purposefulness Show concern that students learn the content and use time to teach students.
Students are held accountable for completing work on time, time is spent each day reviewing completed work, required participation by all, feedback is provided systematically regarding performance.
Teach students appropriate behaviors
Teachers communicate to students how to behave in appropriate ways and follow up on expectations set.
Remind students of task procedures, provide additional instruction and practice when procedures are not followed, consequences are applied consistently, respond to behavior with corrective feedback not criticism, consistent class monitoring and comment frequently on events.
Beginning-of-year activities
First days of the year are critical for establishing classroom order and should have consequences for management efficacy throughout the year.
Focus on setting expectations for appropriate behavior, monitor for compliance, “set the climate” of the classroom.
Institute classroom rules and procedures
Rules regulate behavior, whereas procedures are made up of routines.
Present in a clear and thorough way, monitor compliance, enforce rules, break routines into discrete steps and anticipate problem areas. Rules can be practiced and provided in written form, establish classroom routines.

117
Implications for Practice • Studies conducted by Emmer, Evertson and colleagues have found that proactive
classroom management training is successful and cost-efficient, and school psychologists may serve as classroom consultants.
• Evertson (1985) demonstrated that teachers trained in proactive classroom management were more likely to have students who were less disruptive and more academically engaged.
• Implementing such classroom strategies can act as a Tier I intervention in schools to minimize occurrences of misbehavior and discipline concerns. Consequently, fewer students may be identified for more intensive behavioral intervention.
Mayer, G. R. (1995). Preventing antisocial behavior in the schools. Journal of Applied Behavior Analysis, 28, 467–478. Purpose of Paper This paper reviews possible setting events that may lead to antisocial behaviors in schools and provides a model for the prevention of antisocial behavior within the school context.
• School, home and community factors are very influential on the development of antisocial youth.
• Poor parenting practices are associated with antisocial behavior. Some characteristics of these parents include: infrequent monitoring of their child, use of coercive behavior management, inconsistent use of rules and rule enforcement, poor communications, lack of problem-solving skills, low levels of affection, use of harsh consequences and presence of personal problems that interfere with their lives.
• Community and peer factors may increase antisocial behaviors, specifically if students spend time with antisocial peers and do not have anything to do after school.
• Setting events are antecedents that occur before the behavior and affect behavior. Within the school, setting events can affect instruction and may have occurred in the classroom, in a preceding or different class period, or even at home prior to coming to school.
• The three factors in schools that are related to antisocial behavior include: 1. Unclear rules and policies: not clearly communicated, not following the rules
leading to punitive actions (i.e., comment from teacher). 2. Inconsistent staff: lack of staff agreement on policies, inconsistent with rules,
staff do not support one another. 3. Lack of allowances for individual differences: academic and social skills of students
vary, the selection of reinforcers and punishers is not individualized.

118
• The constructive discipline approach addresses these factors:
Factor Intervention Unclear rules and policies Jointly establish rules with teacher and
student, apply differential consequences for complying or not complying with the rules, rules stress how to behave, keep it short, post the rules.
Inconsistent staff Improve staff morale and communication, make positive comments and show appreciation for colleagues, principal may send congratulatory messages to staff with successful programs in the class. Example programs: “hot messages” or “secret pals.”
No allowance for individual differences Match student performance level with appropriate work, use peer tutoring to increase skills, increase praise, maximize reinforcers for individual child, use modeling and social skills training, use functional assessment to reduce the misuse of punishers (i.e., using time out when escape is reinforcing), and create less punitive and more positive classroom.
Implications for Practice
• Academic programs that successfully manage behavior adjust their programs to the student’s level of functioning and build skills in deficit areas. This adjustment allows the student to be successful and work in a positive environment.
• When curriculum is individualized and the environment is more positive and reinforcing, student behaviors and school performances improve (Gold & Mann, 1982).
• Implementing these strategies has been associated with a decrease in drop-out rates and suspensions (Los Angeles County Office of Education, 1990).
Oswald, K., Safran, S., & Johanson, G. (2005). Preventing trouble: Making schools safer places using positive behavior supports. Education and Treatment of Children, 28, 265–278.

119
Issue of Concern Investigators emphasize the importance of preventative interventions in the schools, specifically in highly problematic areas such as non-classroom settings (e.g., hallways, playgrounds).
• These areas often lack established routines, school rules and expectations. • Schools often use punitive strategies to deal with this behavior despite these strategies
lack of effectiveness. • A multicomponent positive behavior support (PBS) approach to problem behaviors
has been demonstrated to be effective in non-classroom settings (Nelson, Colvin, & Smith, 1996; Kartub, Taylor-Green, March, & Horner, 2000).
• Various efforts have been made to improve behavior in non-classroom areas, as they frequently have high rates of problematic behavior.
Research Question
• Will the implementation of a PBS program prove to be effective in improving student behavior in the hallways of a middle school?
Participants
• The study was conducted in a rural middle school in Ohio with 950 sixth- through eighth-grade students.
Methods Used to Answer the Research Question
• Workshops in a school-wide PBS system were delivered to staff by university consultants.
• After a needs survey was conducted, it was determined that non-classroom areas should be targeted.
• School-wide rules were developed with the staff, and behavioral expectations were developed and framed in brief positive statements.
• A PBS team was developed including teachers, the principal and school psychologist. • The team developed a plan to teach hallway behavior (i.e., reinforcing positive
behaviors, sharing expectations with students during homeroom, teaching the rules using poster contests and role play of behaviors).
• During the treatment phase, staff used reminders, corrections, incentive techniques and active supervision (i.e., teachers interact with students, scanning and watching students, being visible in hallways).
• Frequency data were collected over a 4-day observation period. Each behavior was defined, coded and recorded. Baseline data were collected for 4 days, followed by 5 weeks of program implementation and post-intervention observations.

120
Results • The intervention phase led to a large reduction in problem behavior between baseline
and treatment phases of the PBS program. Negative behaviors were reduced by 42% across 950 students.
• Results after program implementation demonstrated a large effect size and improvement in behavior for students in the middle school.
Implications for Practice
• Using school-wide programs can impact the lives of a large number of students, rather than a limited number of individuals identified with behavioral concerns.
• These programs can lead to safer schools, which in turn lead to more positive climates for students and promote academic success.
Walker, H. M., Stiller, B., Serverson, H. H., Feil, E. G., & Golly, A. (1998). First step to success: Intervening at the point of school entry to prevent antisocial behavior patterns. Psychology in the Schools, 35, 259–269. Purpose of Paper This paper provides an overview of the First Step to Success early intervention program.
• The program is intended to prevent young at-risk children from developing antisocial behaviors.
• Many children begin school with signs of antisocial behaviors due to the risk factors to which they have been exposed.
• The risk factors and family conditions associated with antisocial behaviors in children include: child abuse, parent alcohol abuse, family conflict and poverty.
• Early intervention can successfully alter these students’ long-term trajectories (i.e., prevent drop out, drug use, incarceration).
• The program has three important components that address the various risk factors associated with antisocial behavior.
• The components are described below.

121
Program Components Brief Description Universal screening Four options:
Teacher nominations of children whose behavior match the antisocial behavior definition and ranked. Ranking and rating: teachers nominate and rank order children in relation to the definition, rate the highest ranked children on an aggressive behavior scale. Brief rating procedure: teachers rate all children on a set of behavioral criteria using the student risk screening scale; scores of 15+ are considered candidates. Early screening project: multi-gated screening procedure.
School intervention An adapted version of the CLASS program (Hops & Walker, 1988). Divided into three phases: Consultant, Teacher, and Maintenance. Phase 1: Consultant implements and runs the program. Phase 2: Teacher begins implementation on day six. Teacher awards points for student performance, supervises group activity and communicates with parents about performance of students. Phase 3: Maintenance phase. Fade the student’s need for the program. The student’s behavior is now reinforced primarily with praise from the teacher and parents. The student’s dependence on the program is reduced by reducing the amount of daily feedback and providing occasional rewards based on outstanding performance. Most students who complete the teacher phase are able to sustain improved behavior during this phase, but strategies are provided for those students who do not.
Parent Training Consists of six lessons and allows parents to build child competencies in areas: communication and sharing, cooperation, limit setting, problem-solving, friendship-making and confidence development. Consultant comes to the home weekly to conduct the lesson, leaves the materials with the parents, parents review with their child 10–15 minutes daily. Takes approximately six weeks.
Implications for Practice
• Early intervention is crucial when working with students at risk for antisocial behaviors.
• School-wide universal behavior screenings represent a proactive approach to identifying students at risk for these behaviors and providing them with effective interventions.

122
• Studies conducted on this program have indicated that the program has positive treatment effects for young at-risk children (Golly, Stiller, & Walker, 1998).
References
Broden, M., Bruce, C., Mitchell, N., Carter, B., & Hall, R. (1970). Effects of teacher attention
and a token reinforcement system in a junior high school special education class. Exceptional Children, 36, 341–349.
Colvin, G., Kameenui, E., & Sugai, G. (1993). Reconceptualizing behavior management and
school wide discipline in general education. Education and Treatment of Children, 16, 361–381.
Colvin, G., Sugai, G., Good, R. H., III, & Young-Yon, L. (1997). Using active supervision and
precorrection to improve transition behaviors in an Elementary School. School Psychology Quarterly, 12, 344–363.
Colvin, G., Sugai, G., & Patching, W. (1993). Precorrection: An instructional approach for
managing predictable problem behaviors. Intervention in School and Clinic, 28, 143–150. Colvin, G., Wilbanks, D., Borg, J., Dickey, C., Duncan, M., Gilmore, M., Henery, J., & Shaw, S.
(1996). Establishing and effective school-wide discipline plan: Getting all staff on board. Monograph of the 1993 Oregon Conference. Eugene, OR: University of Oregon (pp. 81–94).
Englemann, S., Granzin, A., & Severson, H. (1979). Diagnosing instruction. Journal of Special
Education, 13, 355–363. Gettinger, M. (1988). Methods of proactive classroom management. School Psychology Review,
17, 227–242. Knoff, H. M., & Batsche, G. M. (1995). Project ACHIEVE: Analyzing a school reform process for
at-risk and underachieving students. School Psychology Review, 24, 579–603. Larson, J. (1994). Violence prevention in the schools: A review of selected programs and
procedures. School Psychology Review, 23, 151–164. Mayer, G. R. (1995). Preventing antisocial behavior in the schools. Journal of Applied Behavior
Analysis, 28, 467–478.

123
Morrison, G. M., Furlong, M. J., & Morrison, R. L. (1994). School violence to school safety: Reframing the issues for school psychologists. School Psychology Review, 23, 236–256.
Morrison, G. M., Robertson, D., & Harding, M. (1998). Resilience factors that support the
classroom functioning of acting out and aggressive students. Psychology in the Schools, 35, 217–227.
Nelson, R., Smith, D., & Colvin, G. (1995). The effects of a peer mediated self-evaluation procedure on the recess behavior of students with behavioral problems. Remedial and Special Education, 16, 117–126.
Oswald, K., Safran, S., & Johanson, G. (2005). Preventing trouble: Making schools safer places
using positive behavior supports. Education and Treatment of Children, 28, 265–278. Simeonsson, R. (1991). Primary, secondary, and tertiary prevention in early intervention.
Journal of Early Intervention, 15, 124–134. Shinn, M. R., & McConnell, S. (1994). Improving general education instruction: Relevance to
school psychologists. School Psychology Review, 23, 351–371. Solomon, R., & Wahler, R. (1973). Peer reinforcement control of classroom problem behavior.
Journal of Applied Behavioral Analysis, 6, 49–56. Stephens, R. D. (1994). Planning for safer and better schools: School violence prevention and
intervention strategies. School Psychology Review, 23, 204–215. Taylor-Greene, S., Brown, D., Nelson, L., Longton, J., Gassman, T., Cohen, J., Swarz, J., Horner,
R. H., Sugai, G., & Hall, S. (1997). School-wide behavioral support: Starting the year off right. Journal of Behavioral Education, 7, 99–112.
Walker, H. M., Horner, R. H., Sugai, G., Bullis, M., Sprague, J. R., Bricker, D., & Kaufman, M. J.
(1996). Integrated approaches to preventing antisocial behavior patterns among school-age children and youth. Journal of Emotional and Behavioral Disorders, 4, 193–256.
Walker, H. M., Severson, H. H., Stiller, B., Williams, G., Haring, N., Shinn, M., & Todis, B.
(1988). Systematic screening of pupils in the elementary age range at risk for behavior disorders: Development and trial testing of a multiple gating model. Remedial and Special Education, 9, 8–14.
Walker, H. M., Shinn, M. R., O’Neill, R. E., & Ramsey, E. (1987). A longitudinal assessment of
the development of antisocial behavior in boys: Rationale, methodology, and first-year results. Remedial and Special Education, 8, 7–16.

124
Walker, H. M., Stieber, S., O’Neill, R. E. (1990). Middle school behavioral profiles of antisocial
and at-risk control boys: Descriptive and predictive outcomes. Exceptionality, 1, 61–77. Walker, H. M., Stiller, B., Serverson, H. H., Feil, E. G., & Golly, A. (1998). First step to success:
Intervening at the point of school entry to prevent antisocial behavior patterns. Psychology in the Schools, 35, 259–269.
Zigler, E., Taussig, C., & Black, Y. (1992). Early childhood intervention: A promising preventative for juvenile delinquency. American Psychologist, 47, 997–1006.

125
Chapter 12
Using RtI in Social-Emotional-Behavioral Areas: Tier II Application
Once the school has established and implemented a proactive strategy to prevent problem behaviors school-wide, classroom teachers need to be provided with specific support to handle problem behaviors in the classroom. These group strategies can be considered to be Tier II interventions within a three-tier Response to Intervention (RtI) context. Consultants may work with teachers to develop class-wide strategies that are time-efficient and easy to implement. Peers can act as change agents and can lead to positive social, behavioral and academic outcomes. Interventions can be used to reduce problem behavior in class and encourage students to enhance their academic skills. Investigators have demonstrated that using interdependent and dependent group contingencies can be effective in reducing disruptive behaviors and increasing appropriate behaviors. It is more efficient for teachers to reward the class as a group rather than focusing on individual behaviors. Furthermore, studies have demonstrated that strategically adjusting various components of a class-wide intervention program can increase appropriate behavior (i.e., randomize the prize, adjust criterion for earning rewards). Using appropriate techniques, the number of rewards provided to the class can be reduced, allowing the teacher to save resources and maintain the effectiveness of the rewards. Use of these class-wide programs can increase appropriate behavior, improve student learning, reduce inappropriate behavior and encourage positive social interactions among peers.
Kelshaw-Levering, K., Sterling-Turner, H. E., Henry, J. R., & Skinner, C. H. (2000). Randomized interdependent group contingencies: Group reinforcement with a twist. Psychology in the Schools, 37, 523–533.
Issue of Concern
Investigators examined the effects of randomizing different steps of an interdependent group contingency system.
• An interdependent group contingency system is when the same behavior requirements are set for all students in the class, and the entire class earns the reward if the overall level of group performance exceeds the criterion.
• Contingency-management systems are used to reduce inappropriate behavior and include reinforcement to increase appropriate behaviors and punishment to decrease inappropriate behaviors.

126
• With interdependent group contingencies the same behavior requirements are established for all students in the class, and reinforcement is contingent on the overall level of group performance.
• With interdependent group contingencies, students are less likely to punish and socially reject their peers.
• Randomizing the reinforcer (using a “mystery motivator”) may be useful for group programs, as it may be difficult to identify something that is reinforcing to all students.
• Randomizing the criterion that students need to meet to get the reinforcer is useful because students won’t know if they met their goal and will continue to work for the prize, rather than reacting badly if they know they have not met the criterion.
Research Question
• Does randomizing several steps of the group contingency intervention cause a greater decrease in appropriate behaviors when compared to a group contingency intervention that only randomizes reinforcers?
Participants
• Twelve students in a second-grade elementary school classroom participated. A teacher with 27 years of experience implemented the intervention in her classroom.
Methods Used to Answer the Research Question
• The teacher wanted to focus on four disruptive behaviors including: off task, inappropriate vocalizations, out-of-area and noncompliance.
• A sample of the class (four students) was observed at random times across days for a period of 15 minutes.
• For the first phase, a baseline level of performance was obtained, where no contingencies were applied and the frequency of the entire class’ disruptive behavior was recorded.
• The day was divided into three 1-hour and 15-minute intervals in which the teacher would record the behaviors.
• In the next phase, the reinforcers were randomized. The teacher told the class the rules and posted them. She told the students that they needed to demonstrate specific appropriate behaviors to earn the “treat.” The teacher collected the data using a checklist of behaviors and a collective goal for the class of 36 or fewer checks during the interval. The students were reminded that they were working to earn a reward at the end of the period. If the class met the criteria they could draw out a prize from a jar (5 minutes extra recess, 3 minutes free time, 5 minutes free time, special snack, etc).

127
Look at Behavior z
Did students have 36 or fewer problem behavior check marks?
If yes, pick a prize from jar. If no, tell the students they did not meet the criteria.
Jar 1: Behavior type, # of times it can occur (criteria)
Jar 2: Group behavior Jar 2: Individual’s behavior
Did they meet the criteria?
Jar 4: If yes, pick a prize.
Jar 3: Pick a name out of jar.
Did that person meet the criteria?
Jar 4:If yes, pick a prize.
• Randomized reinforcers chart:
• In the next phase, the rules were taken down and more baseline information was
gathered. • Then the interdependent group contingency phase with all steps randomized was
implemented. Four jars were placed in the classroom. The first jar told the teacher what behavior to assess on the completed checklist and how many times that behavior could occur in order for the students to win a prize. The second jar told the teacher if group behavior or an individual student’s behavior would be used. See chart below for details.

128
Results • The total number of times disruptive behavior occurred for the class at each phase was
compared. • The results indicated that there was a decrease in disruptive behavior when the
randomized reinforcers intervention was introduced (from a mean of 37% to 14%). When this intervention was stopped and baseline data were collected, problems behaviors again increased (mean of 42%).
• After the second baseline phase, when all steps were randomized, there was an immediate decrease in problem behaviors (mean of 11%). When the randomized reinforcers were reintroduced, there was a slight increase in disruptive behavior (mean of 16%) and again a decrease when all steps were randomized (mean of 4%).
Implications for Practice
• The results demonstrated that the randomization of multiple steps was at least as effective, if not more effective as only randomizing the reinforcers.
• Randomizing the contingencies will prevent problem behaviors if students realize they did not meet the criteria for the prize.
• These interventions could be used when encouraging appropriate academic skills. (Also see Chapters 8–10: Improving Core Instruction for All Students: Tier I Application, page 75; Improving Instruction in Schools Using Supplemental Instruction: Tier II Application, page 87; Intensive Instruction: Tier III Application, page 99.)
Gresham, F. M., & Gresham, G. N. (1982). Interdependent, dependent, and independent group contingencies for controlling disruptive behavior. The Journal of Special Education, 16, 101–110. Issue of Concern Investigators compared two types of classroom management systems using group reinforcers/consequences to control disruptive behaviors in the classroom.
• The use of group contingencies can save time for the teacher as it is more efficient to reinforce and punish group behavior rather than deal with it on an individual basis. Furthermore, group contingency plans are more effective in managing group behavior as opposed to individually focused interventions.
• There are three types of group-oriented contingency systems. o Interdependent: The same behavior requirements are set for all students in the
class, and reinforcement is contingent on the overall level of group performance.
o Dependent: Reinforcement of the whole class is contingent on the performance of a select few students.
o Independent: Reinforcement is contingent on each individual’s behavior and is not reliant on the behavior of the other students in the class.

129
Research Question
• The investigators compared the effectiveness of interdependent, dependent and independent group contingency systems to reduce disruptive classroom behavior.
Participants
• Twelve students with mental retardation enrolled in the same classroom served as participants. The students ranged in age from 6 to 10 years old.
Methods Used to Answer the Research Question
• Observations were collected during non-instructional class time. The number of times the disruptive behaviors occurred was tallied for an hour each day (30 minutes in the morning and 30 minutes in the afternoon).
• The contingency systems were evaluated over an 8-week period. For the first week, baseline data were collected. During baseline, no contingencies were applied and the frequency of the entire class’ disruptive behavior was recorded.
• In the second phase, the interdependent system was implemented. The class was divided into two teams, and the team that got the fewest marks for disruptive behavior earned a reward for that day (i.e., free time, pencils).
• In the next phase, two team captains (the two most disruptive students) were assigned to each of the teams. The captain with the fewest disruptive behaviors earned a reward for his/her team (dependent contingency).
• The independent contingency was then implemented for another 5 days. In this phase, each individual student was competing against every other child. The child with the fewest number of disruptive behaviors for the day earned the reward (if there was a tie, both children received the reward).
• Finally, the same four phases were repeated including baseline, interdependent, dependent and independent.
Results
• The total number of times disruptive behavior occurred for the class at each phase was compared.
• Results indicated that lower rates of class disruptive behavior occurred during the interdependent and dependent group phases.
Implications for Practice
• This study indicated that group contingencies were effective in reducing class levels of disruptive behavior.
• The interdependent and dependent contingencies may have been more effective because these strategies increased group cooperation among peers in the classroom.

130
• Children on each of the teams encouraged, cued and praised their respective teammates. They also verbally reprimanded their peers when disruptive behavior occurred.
• One advantage of using these strategies was that each team could be reinforced as a unit and enabled peers to act as change agents.
Witt, J. C., & Elliott, S. N. (1982). The response cost lottery: A time efficient and effective classroom intervention. The Journal of School Psychology, 20, 155–161. Issue of Concern Investigators combined a response cost procedure with a lottery system in a classroom to reduce disruptive behavior of students. Response cost is a strategy where a specific amount of a reinforcer (e.g., points) is taken away contingent on misbehavior.
• The intervention was designed to be used by busy teachers so that they can be efficient and use few resources.
Research Question
• What is the effect of a response cost lottery intervention on the occurrence of on-task behaviors and accuracy of academic work for fourth-grade students?
Participants
• Three male students were selected from a class of fourth-grade students. • The students were nominated by their teacher for having the most severe behavior
problems in class. • All three participants had been referred for potential placement in a classroom for
children with behavior disorders. Methods Used to Answer the Research Question
• Definitions of inappropriate behaviors were taken from Madsen, Becker and Thomas (1968) and included the following behaviors: object noise, gross motor, disturbance of others’ property, contact, verbalization, turning around, mouthing objects and other inappropriate behavior.
• Children were observed for 30 minutes daily (except Thursdays) at the same time period (the time period the teacher identified as most disruptive).
• The investigators used an ABAB single-subject withdrawal design. • During the four days of the baseline phase, on- and off-task behaviors were recorded. • During the response cost lottery phase, the teacher carried out the intervention and the
student’s inappropriate behaviors were observed and recorded. • The procedure was explained to students and the reinforcers were displayed. Rewards
were activities and prizes that were readily available in the school and at no cost to the teacher (such as extra recess time, pencils). Four slips of paper were placed on each

131
student’s desk, and students were told that each time they did not follow the classroom rules a slip of paper would be taken away.
• The teacher explained the classroom rules prior to each intervention period and told students that each of the slips of paper that remained on their desk at 1:30 pm could be entered into a lottery drawing. The drawing was held at the end of the week.
• The first treatment phase was held for two weeks, and the second treatment phase was implemented for a week.
Results
• During baseline, students were on task for an average of 10% of the intervals. When the teacher implemented the response cost lottery, on-task behavior increased to 68% of the intervals.
• In the withdrawal phase when the response cost lottery intervention was removed, on-task behavior decreased to a mean of 43%. When the response cost lottery intervention was reinstated, on-task behavior increased to a mean of 73%. These rates were compared to the behaviors of the typical students in the class. Typical students (i.e., students without an identified disability enrolled in the same class) had a mean of 80% of appropriate behaviors.
Implications for Practice
• This study indicated that a response cost lottery system was effective for students with behavioral difficulties.
• Students did not demonstrate exceptionally negative behaviors when a slip was removed or when they did not win the lottery.
• The program was effective even though the teacher did not take slips away for every rule violation. The teacher only removed slips for very obvious rule infractions, reducing the amount of teacher time required.
• This system required minimal amounts of teacher time to prepare. The system was described to the teacher in less than 15 minutes. It took 5 minutes to prepare the slips, 10 minutes to explain the program to the students and 5 minutes once a week to conduct the lottery.
Freeland, J. T., & Noell, G. H. (1999). Maintaining accurate math response in elementary school students: The effects of delayed intermittent reinforcement and programming common stimuli. Journal of Applied Behavior Analysis, 32, 211–215. Issue of Concern Investigators examined the effect of making the reinforcement contingency difficult to discriminate for students.
• The use of programmed rewards has been shown to increase academic responding. Yet, the use of programmed rewards can be difficult in instructional settings where

132
children are asked to complete multiple tasks in a relatively short time period and may grow tired of the rewards. This study examined a strategy to increase the utility of a reinforcement procedure for academic tasks. Specifically, students were told that the researcher did not know which academic task would be scored and what the criterion would be to earn the reward.
Research Questions
• What is the effect of delayed reinforcement on digits completed by students? • What is the effect of programming stimuli common to reinforcement conditions on
the maintenance of their performance?
Participants • Four general education students in fourth grade participated. These students were
referred by educational professionals for mathematics deficits. Methods Used to Answer the Research Questions
• The participants met with the investigator twice a day, and at each meeting two 5-minute sessions were conducted.
• An instructional task for each student was assigned based on a curriculum-based assessment. Target skills included addition with regrouping for three of the students and multiplication of single digits for the final participant.
• In each session participants were provided with worksheets containing 100 problems related to their target skill.
• Digits correct per 5-minute session were used to assess student progress. Performance was evaluated in a reversal design (the treatment was applied, removed, then applied again, etc.), followed by a generalization probe (to determine if student performance was maintained over time.
• In a baseline phase, participants worked on their worksheets for 5 minutes, and could attempt as many or as few problems as they wanted. No consequences or feedback were provided during this time.
• In the reinforcement phase, a number was written on top of the worksheet and the student was told if they beat that score they would be able to choose a reward from a goody box. The goal was based on the median score on the last three worksheets completed during previous sessions.
• In delay intermittent reinforcement sessions (i.e., delays 2 and 4), participants were asked to complete the worksheets but no description of rewards/rules for reinforcement were provided. After the student completed two sessions, a worksheet was selected randomly and graded, the reinforcement was applied to the worksheet selected. In the delay 4 phase, this procedure occurred after four sessions.
• During the maintenance condition, components that were absent in the baseline phase but present in the delay conditions were used. A goal was recorded on the worksheet,

133
and the directions were identical to the delay conditions. During this time, no rewards or feedback were provided.
Results
• All students maintained responding at or above reinforced levels during the delay 2 phase. When students returned to baseline, responding fell to or below initial baseline levels.
• When delay 2 conditions were re-instituted, high levels of responding resumed. • High levels of responding maintained when components of the delay phase were
included (white paper, score on top of the worksheet). Implications for Practice
• This study demonstrated delayed reinforcement of randomly selected response opportunities maintained students responding at levels similar to those obtained under continuous reinforcement.
• This delayed intermittent reinforcement may be useful in school settings because it allows for reinforcers to be provided on a lean schedule (i.e., saving time and preserving the power of the reinforcers by avoiding satiation).
Skinner, C. H., Williams, R. L., & Neddenriep, C. E. (2004). Using interdependent group-oriented reinforcement to enhance academic performance in general education classrooms. School Psychology Review, 33, 384–397. Purpose of the Paper Investigators describe how professionals can use interdependent group-oriented reward procedures to enhance academic performance and learning.
• An interdependent group contingency system is when the same behavior requirements are set for all students in the class, and the entire class earns the reward if the overall level of group performance exceeds the criterion.
• Educators have various options for reinforcing academic performance in their classrooms, including individual or group-oriented reinforcement.
• General concerns with providing rewards for performance are provided:
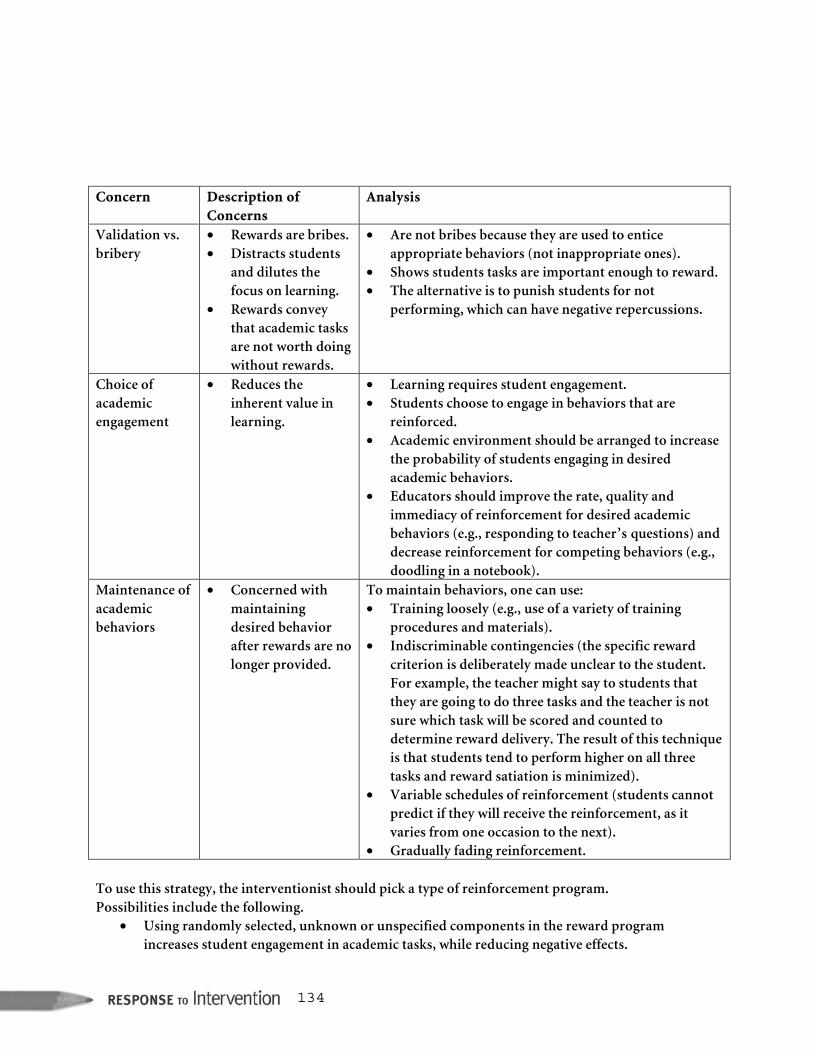
134
Concern Description of
Concerns Analysis
Validation vs. bribery
• Rewards are bribes. • Distracts students
and dilutes the focus on learning.
• Rewards convey that academic tasks are not worth doing without rewards.
• Are not bribes because they are used to entice appropriate behaviors (not inappropriate ones).
• Shows students tasks are important enough to reward. • The alternative is to punish students for not
performing, which can have negative repercussions.
Choice of academic engagement
• Reduces the inherent value in learning.
• Learning requires student engagement. • Students choose to engage in behaviors that are
reinforced. • Academic environment should be arranged to increase
the probability of students engaging in desired academic behaviors.
• Educators should improve the rate, quality and immediacy of reinforcement for desired academic behaviors (e.g., responding to teacher’s questions) and decrease reinforcement for competing behaviors (e.g., doodling in a notebook).
Maintenance of academic behaviors
• Concerned with maintaining desired behavior after rewards are no longer provided.
To maintain behaviors, one can use: • Training loosely (e.g., use of a variety of training
procedures and materials). • Indiscriminable contingencies (the specific reward
criterion is deliberately made unclear to the student. For example, the teacher might say to students that they are going to do three tasks and the teacher is not sure which task will be scored and counted to determine reward delivery. The result of this technique is that students tend to perform higher on all three tasks and reward satiation is minimized).
• Variable schedules of reinforcement (students cannot predict if they will receive the reinforcement, as it varies from one occasion to the next).
• Gradually fading reinforcement. To use this strategy, the interventionist should pick a type of reinforcement program. Possibilities include the following.
• Using randomly selected, unknown or unspecified components in the reward program increases student engagement in academic tasks, while reducing negative effects.

135
• If the overall reward is reinforcing for some students and punishing for others, a token economy or “goody bag” can allow students to choose their own reward.
• The target behavior should be randomly selected so that students do not just work for the reward (work hard on math but not on language arts tasks). At the end of the day the teacher randomly selects a task completed that day and provides a reward if the students meet the criterion.
• Individual contingencies for academic behavior: An individual student receives a reward if he or she meets the criterion. The components of the system are tailored to the individual student.
• Group-oriented contingencies: o Three major types:
1. Independent group-oriented contingencies: Target behaviors, criteria and rewards are the same for all students, but each student receives the rewards based on his or her own behaviors.
2. Dependent group-oriented contingencies: The students’ access to rewards is based on an individual student’s or a select group’s behaviors. All or none of the class receives the reward depending on the academic behavior of their selected classmates.
3. Interdependent group-oriented rewards: The group has access to the reward if the whole class meets the criterion. Students receive rewards based on their own performance and the performance of their classmates.
These programs have been shown to: increase the chance students will engage in the task; increase learning rates; decrease inappropriate behaviors across students and learning
objectives; decrease students being singled out if they did not earn the reward and
making fun of who that did not earn a reward; increase social reinforcement as classmates celebrate their
achievements. • The interventionists must set a criterion for reinforcement delivery. Possibilities
include: o Individualized criteria: Each student works toward a criterion created for him
or her. Necessary for special education students. Can be time consuming. o Class average as a criterion: Students are not sure how well they need to
perform to earn reward so they tend to do their best. o Randomly selected class criterion: Teacher can make up slips of paper with
various class criteria written on them (70%, 80%, 85%, 90%, 95%, and 100%). At the end of the day, the teacher randomly picks a criterion and rewards students if criterion was met.

136
o Cumulative group criterion: Each desired behavior adds up until the students meet the criterion to earn the reward (e.g., the class must complete 200 assignments collectively before earning a reward).
• Reinforcement should be faded. Possibilities include:
o Fading immediacy: Vary how quickly the rewards are delivered after the students earn them, have fewer immediate reinforcers which will encourage students to perform well even after the reward program is withdrawn.
o Fading reinforcer quality: By randomly selecting the rewards, the quality of the reward will vary, which will increase the maintenance. Gradually remove the higher-quality reinforcers and replace them with lower quality.
o Fading rate of reinforcer: Offer reinforcement less frequently, such as once a day instead of once a week. Teachers may also replace lower criteria with higher criteria.
o Increasing effort to earn reinforcement: Gradually increase the amount of work needed to gain the reward.
Implications for Practice
• A foundational meta-analysis has shown that group reinforcement strategies have the largest effect size of interventions used to decrease inappropriate behaviors (see Stage & Quiroz, 1997).
• Using randomly selected, unknown and indiscriminable components in a reward program may seem inconsistent, but in fact recommends that teachers consistently use reward systems that reinforce positive academic behaviors.
References
Akin-Little, K. A., Eckert, T. L., Lovett, B. J., & Little, S. G. (2004). Extrinsic reinforcement in
the classroom: Bribery or best practice. School Psychology Review, 33, 344–362. Axelrod, S. (1973). Comparison of individual and group contingencies in two special classes.
Behavior Therapy, 4, 83–90. Billington, E. J., & Skinner, C. H. (2002). Getting students to choose to do more work: Evidence
of the effectiveness of the interspersal procedure. Journal of Behavioral Education, 11, 105–116.
Cashwell, C. S., Skinner, C. H., Dunn, M., & Lewis, J. (1998). Group reward programs: A
humanistic approach. Humanistic Education and Development, 37, 47–53.

137
Drabman, R., Spitalnik, R., & Spitalnik, K. (1974). Sociometric and disruptive behavior as a function of four types of token reinforcement programs. Journal of Applied Behavior Analysis, 7, 93–101.
Freeland, J. T., & Noell, G. H. (1999). Maintaining accurate math response in elementary school
students: The effects of delayed intermittent reinforcement and programming common stimuli. Journal of Applied Behavior Analysis, 32, 211–215.
Gamble, A., & Strain, P. S. (1979). The effects of dependent and interdependent group
contingencies on socially appropriate responses in classes for emotionally handicapped children. Psychology in the Schools, 16, 253–260.
Gresham, F. M., & Gresham, G. N. (1982). Interdependent, dependent, and independent group
contingencies for controlling disruptive behavior. The Journal of Special Education, 16, 101–110.
Jenson, W. R., Rhode, G., & Reavis, H. K. (1994) The Tough Kid Tool Box. Longmont, CO:
Sopris West. Kelshaw-Levering, K., Sterling-Turner, H. E., Henry, J. R., & Skinner, C. H. (2000). Randomized
interdependent group contingencies: Group reinforcement with a twist. Psychology in the Schools, 37, 523–533.
Mayer, G. R., Mitchell, L., Clementi, T., Clement-Roberston, E., Myatt, R., & Bullara, D. T.
(1993). A drop out prevention program for at-risk high school students: Emphasizing consulting to promote positive classroom climates. Education and Treatment of Children, 16, 135–146.
Moore, L. A., Waguespack, A. M., Wickstrom, K. F., Witte, J. C., & Gaydos, G. R. (1994). Mystery motivator: An effective and time efficient intervention, School Psychology Review, 23, 106–118.
Munk, D. D., & Repp, A. C. (1994). The relationship between instructional variables and
problem behavior: A review. Exceptional Children, 60, 390–401. Popkin, J., & Skinner, C. H. (2003). Enhancing academic performance in a classroom serving
students with serious emotional disturbance: Interdependent group contingencies with randomly selected components. School Psychology Review, 32, 271–284.
Shapiro, E. S., & Goldberg, R. (1986). A comparison of group contingencies for increasing
spelling performance among sixth grade students. School Psychology Review, 15, 546–557.

138
Sharp, S. R., & Skinner, C. H. (2004). Using interdependent group contingencies with randomly selected criteria and paired reading to enhance class-wide reading performance. Journal of Applied School Psychology, 20, 29–45.
Skinner, C. H., Cashwell, T. H., & Skinner, A. L. (2000). Increasing tootling: The effects of peer
monitored interdependent group contingency program on students’ reports of peers’ prosocial behaviors. Psychology in the Schools, 37, 263–270.
Skinner, C. H., & Watson, T. S. (1997). Lotteries in the classroom. Behavioral School Psychology
Digest, 1, 11–12. Skinner, C. H., Williams, R. L., & Neddenriep, C. E. (2004). Using interdependent group-
oriented reinforcement to enhance academic performance in general education classrooms. School Psychology Review, 33, 384–397.
Slavin, R. E. (1987). Cooperative learning: Where behavioral and humanistic approaches to
classroom management meet. Elementary School Journal, 88, 29–37. Truchlicka, M., McLaughlin, T. F., & Swain, J. C. (1998). Effects of token reinforcement and
response cost on accuracy of spelling performance with middle-school special education students with behavior disorders. Behavioral Interventions, 13, 1–10.
Turco, T. L., & Elliott, S. N. (1990). Acceptability and effectiveness of group contingencies for
improving spelling achievement. Journal of School Psychology, 28, 27–37. Winett, R. A., & Vachon, E. M. (1974). Group feedback and group contingencies in modifying
behavior of fifth graders. Psychological Reports, 34, 1283–1292.
Witt, J. C., & Elliott, S. N. (1982). The response cost lottery: A time efficient and effective classroom intervention. The Journal of School Psychology, 20, 155–161.

139
Chapter 13
Using RtI in Social-Emotional-Behavioral Areas: Tier III Application
In the face of successfully implemented school-wide prevention strategies and class-wide intervention strategies, some students will require further intervention. If a student consistently exhibits more severe problem behaviors as compared to peers, and the first two tiers have been addressed, individualized intervention should be initiated to increase desired behaviors and decrease inappropriate behaviors. These services, referred to as “intensive interventions or supports” can be equated with Tier III in the three-tier Response to Intervention (RtI) model. Interventions are developed in collaboration with the student’s teachers using strategies that are acceptable for the teachers to implement. To find a solution, analyses of antecedents and consequences for the problem behaviors must be conducted. In recent years, investigators have demonstrated the ability of teachers (with proper consultant support) to conduct these analyses in the classroom setting (see summaries for further details). Once teachers are trained to collect data and successfully do so, the environment can then be manipulated to identify those events that have the largest effect on the individual student’s behavior. These data link directly to an intervention designed to address the root cause of the problem behavior in the classroom. Interventions are selected based on empirically validated methods, and data collected over time guide intervention decisions. In the studies described in this section, the teachers have found the outlined procedures to be easy to do, time-efficient and acceptable. Professionals should be cautioned that training, continued support, practice and performance feedback is necessary for adequate implementation and effective outcomes. Sasso, G. M., Reimers, T. M., Cooper, L. J., Wacker, D., Berg, W., Steege, M., Kelly, L., & Allaire, A. (1992). Use of descriptive and experimental analyses to identify the functional properties of aberrant behavior in school settings. Journal of Applied Behavior Analysis, 25, 809–821. Issue of Concern Investigators conducted descriptive and experimental analyses of disruptive behavior in school settings.
• The analyses were conducted to determine what events led to the negative behaviors and what was motivating the student to act out in negative ways.
• The student was observed, and the conditions or events preceding the behavior and following the behavior were recorded.
• In research, most analyses have been conducted in highly controlled settings, rather than analyzing the child in a natural setting like the classroom. More recently,

140
investigators have applied these analyses in school settings (see, for example, Lalli, Browder, Mace, & Brown, 1993; McComa, Wacker, & Cooper, 1996; and VanDerHeyden, Witt, & Gatti, 2001).
Research Questions
• Can the events that maintain the behaviors be identified using descriptive and experimental analysis conducted in the classroom? Can these data be used to develop effective interventions?
• Can these analyses and planned interventions be conducted effectively by teachers in the classroom?
Participants
• Two children diagnosed with autism. Molly was 7.5 years old and demonstrated behaviors including aggression, non-compliance and loud vocalizations. Tim was 13 years old and demonstrated high-intensity aggression, including hitting, scratching, kicking and pinching.
• Two teachers participated who were both assigned to a self-contained classroom for children with autism.
Methods Used to Answer the Research Questions
• The study was conducted in two phases. In the first phase, a sequence of five conditions of 10 minutes each was implemented daily for 4 days. Two investigators observed the sessions while one implemented the session.
• For Molly, in the first condition, her aggressive behaviors were ignored. In the second condition, she was given attention when aggressive behavior occurred. In the third condition, Molly was allowed to escape the task (it was removed) when she displayed aggression. In the fourth condition, Molly was given a favorite toy when demonstrating aggression. The final session was the control condition, and Molly was allowed to play with toys, she was provided with periodic praise for appropriate behavior and inappropriate behavior was ignored.
• The teacher then conducted a classroom analysis where she recorded when the target behavior occurred, the events that preceded the behavior and events that occurred after the behavior.
• The teacher then conducted an experimental analysis in the classroom. She conducted four 10-minute sessions using the same conditions described above, except that the conditions were conducted by the teacher in the classroom using activities that are part of the daily classroom routine.
• This process was replicated with the second student, Tim. • The results of the assessment were used to develop interventions for the students. • For Molly, the assessment showed that she exhibited aggression when she wanted to
escape a task or to get something tangible (i.e., favorite toy). Tim exhibited aggression to escape the task.

141
• In Molly’s intervention, she was allowed to engage in a game or activity that she enjoyed if she completed tasks that the teacher asked her to do. If she demonstrated aggression, she was not removed from the task (i.e., she was not allowed to escape the task) and she was required to complete an additional task before she could play the game. Further, if Molly asked for a break rather than being aggressive she was allowed to take a break from the task and briefly engage in a game or activity during the break.
• Tim’s aggressive behavior served as an escape function, to avoid adult contact rather than the tasks. His treatment consisted of a verbal prompt from the teacher; if he complied, the teacher would leave his area. If Tim did not comply, the teacher prompted him again and physically assisted him.
• Trained observers recorded the behaviors. Results
• After the intervention was implemented, Molly’s aggression decreased by seven fold (from a mean of 8% occurrence to a mean of 1%) with an increase in on-task behavior (from 33% to 89%). A 1-month follow-up indicated that the student continued to exhibit these positive behaviors.
• Data for Tim revealed that his aggressive behaviors decreased from 25% to 1% and his on-task behaviors increased from 25% to 34% when asked to complete the first vocational task (i.e., towel folding). When he was asked to complete the second task (i.e., sorting), Tim’s aggression decreased from 16% to 5% and his on-task behavior increased from 26% to 42%.
• The three methods of assessment yielded comparable findings and demonstrate that experimental analyses in these settings can be valid.
Implications for Practice
• This investigation illustrates the point that experimental analyses can be conducted in school settings and that teachers can be trained to conduct these analyses within the classroom.
• The interventions based on the assessment data were highly effective in decreasing the student’s aggressive behaviors and, even more importantly, increasing desired adaptive behaviors.
• The interventions were developed in collaboration with the classroom teacher and teachers rated this type of analyses as acceptable to use in their classroom.
• The teachers carried out the interventions according to plan and followed the procedures outlined by the investigators. (Also see Chapter 14: The Importance of Treatment Integrity in RtI Implementation, page 153.)

142
Moore, D. W., Anderson, A., & Kumar, K. (2005). Instructional adaptation in the management of escape-maintained behavior in a classroom. Journal of Positive Behavior Interventions, 7, 216–223. Issue of Concern Investigators examined the effects of reducing task duration on off-task behavior within a classroom setting.
• Curricular expectation can be seen as events that may lead to problem behaviors. If the task is either too difficult or too easy for the child, disruptive behaviors are more likely to occur.
• Task difficulty may be manipulated to lower amounts of problem behavior, but this modification may not always be appropriate or desirable. In other words, reducing the task difficulty may eliminate or reduce problem behavior, but eventually, task difficulty must increase so that students can continue to learn new material.
• Escape-maintained disruptive behaviors may also be a result of other factors including: task duration, task sequencing, student preference, reinforcement rate and competing activities.
Research Question
• Can the combination of curriculum-based assessment and functional behavior assessment be used to determine the function of a problem behavior and lead to the development of an effective intervention?
Participant
• A six-year old male student in a first-grade general education classroom. This student was nominated by his teacher due to high levels of inappropriate behaviors and mathematics skill deficits.
Methods Used to Answer the Research Question
• Data were collected four times a week for a total of 20 minutes each day (10 minutes of independent seat work and 10 minutes of whole-class work). The events that occurred before the behavior (antecedent events) and those that occurred after the behavior (consequences) were recorded.
• Off-task behavior (looking around for more than 5 seconds) was the main problem behavior observed.
• Other behaviors included noncompliance, inappropriate vocalizations, out of seat, inappropriate material use and disruptive behavior.
• Three 2-minute curriculum-based assessment (CBA) probes were used to ensure instructional materials were appropriately matched to the student’s skill level. (Also see Chapter 7: Formative Assessment, page 63.)
• A functional behavioral assessment (FBA) was conducted to create hypotheses regarding why the problem behaviors occur. This assessment included a teacher

143
interview and, a review of student’s work products and baseline observations. It was determined that the function of his/her behavior was to escape the task.
• An alternating treatment design was used. On one day the student received intervention, the following he or she did not and so forth. Student behavior between treatment conditions and baseline was compared.
• Based on the FBA, a reduction in task duration was chosen as an intervention. In the experimental intervention condition, the tasks were broken up into smaller steps and the teacher provided instructions after each step. The student was still required to complete the same work as his peers.
Results
• During baseline, the participant’s off-task behavior occurred an average of 46% of the time and on the days the intervention was implemented, off-task behavior occurred an average of 15% of the time.
• The level of escape-maintained off-task behavior was significantly reduced during the treatment days and was maintained during the optimal treatment only phase (intervention was implemented consecutively for 5 days) with an average of 15% occurrence.
Implications for Practice
• Using FBA allowed the professionals to determine what variables were maintaining a student’s off-task behavior.
• CBA was used to assure an instructional match with student skill level. Both the FBA and CBA led to the hypothesis that task duration was a critical issue in the student’s behavior problems. The combination of these tools can be effective in determining the function of a behavior and consequently an effective intervention.
• The teacher found the intervention to be acceptable, easy to implement and time-efficient.
Gresham, F. M. (2005). Response to intervention: An alternative means of identifying students as emotionally disturbed. Education and Treatment of Children, 28, 328–344. Purpose of Paper The author provides a conceptual model for the use of RtI to identify children with emotional or behavioral disabilities.
• This population of students is often underserved in today’s educational system. • The federal definition of emotional disturbance (ED) is vague and does not lead to the
accurate identification of students with ED. • An RtI model of identification is suggested as it is based on the premise that if a
research-based intervention is implemented with integrity and a student’s behavioral

144
issues continue at unacceptable levels, then the student may be made eligible for services.
• This RtI model allows professionals to focus on solving the problem rather than focusing on the problem itself.
• In the first stage, universal interventions are applied to everyone in the school or district (around 80–90% of students will respond to this intervention).
• For those students who do not respond to the universal interventions, selected interventions are applied.
• Finally, for those students at risk for severe behavior issues who do not respond to either of these procedures, an intensive intervention will be implemented. These intensive services may require support from multiple agencies such as the juvenile justice system or mental health.
• A number of factors that indicate a “response” to a school-based intervention are explained:
o Severity of behavior: frequency/rate, duration, intensity and permanent products. Behaviors with high frequencies, durations and intensities are usually more difficult to change.
o Treatment effectiveness: if the behavior pattern does not respond to the intervention and behaviors have not been lowered to acceptable levels, then the student may be found eligible for services.
• There are four possible approaches to determining adequate responsiveness to intervention:
1. Visual inspection of data: if an intervention had a meaningful effect, it will be obvious when inspecting a graph and comparing baseline to treatment data.
2. Reliable changes in behavior: can be calculated using five metrics including: absolute change indices, reliable change indices, percent no overlapping data points, percent change from baseline and effect size estimates.
3. Changes on social impact measures: effective intervention would change their standing on one or more of these measures (measures include: dropout, arrest rates, days absent, suspensions, office referrals).
4. Social validation: assessing if the intervention goals are important, if the intervention procedures are socially acceptable and the social importance of the intervention effects.
Implications for Practice • The definition of ED should be changed and be made consistent with a problem-solving
based RtI approach. • A student may be considered for intensive services/special education eligibility if he or she
does not respond adequately to a research-based intervention. • To determine an “adequate” response, one may use the decision rules discussed in this
paper.

145
Stichter, J. P., Sasso, G. M., & Jolivette, K. (2004). Structural analysis and intervention in a school setting: Effects on problem behavior for a student with an emotional/behavioral disorder. Journal of Positive Behavior Interventions, 6, 166–177. Issue of Concern Investigators have worked to identify the most prominent factors that are related to problem behaviors in the school setting with the use of structural analyses (analyzing these factors).
• The purpose of using these analyses is to identify events in the general education setting that are associated with problem behaviors.
• The identification of these events can be used to understand the problem behaviors and in the development of preventative interventions.
Research Questions
• Using the results from the experimental and descriptive analyses, can the events that maintain the behaviors be identified? Can the resulting data be used to create interventions?
• Can these analyses and planned interventions be conducted effectively by teachers in the classroom?
Participants
• Two children participated in the study, one 7-year-old boy (“John”) identified with an Emotional Behavior Disorder (EBD) and a 7.5-year-old peer who did not have a disability. The peer served as an intervention agent (see Odom & Strain, 1986; Stokes & Baer, 1977; and Shores, 1987 for examples of behavior interventions using peer confederates).
Methods Used to Answer the Research Questions
• The study consisted of the four following phases. 1. First phase: The teacher suggested factors that led to negative and positive behaviors,
direct observations were conducted to verify these factors and identify other potentially influencing factors. The environment was then manipulated to identify the different events that had the most influence on Josh’s behaviors.
2. Second phase: Based on the information obtained in the first phase, two packages were developed that were created by manipulating the factors identified in different ways. One combination was designed to use the variables that increased prosocial behavior, and the other combined variables that lead to the negative behaviors. These two combinations were compared using an ABA design. In this design, the two treatment phases were alternated and the effects of the different treatments were observed on the student’s behavior.

146
3. Third phase: The combinations of variables were compared and contrasted to determine the events that contributed to the desirable behaviors (high structure, high noise and low social interactions with teacher proximity).
4. Fourth phase: the variables identified as having a positive effect on Josh’s behavior were implemented in the general education classroom with his typical peer serving as the intervener. The teacher identified times in the classroom that most closely matched these variables, and Josh was then integrated during such times.
Results
• During the first phase of the study, the results indicated that problem and off-task behaviors reached rates as high as 85% and 93%, respectively.
• A package of factors that contributed to the participant’s display of desirable behaviors was identified and systematically confirmed. When this package was implemented, much lower rates of problem and off-task behaviors occurred (i.e., problem behaviors ranged from 2.5 to 2.78% and off-task behaviors ranged from 0% to 11.11%).
• Josh continued to demonstrate low percentages of these behaviors when he was integrated into the general education classroom.
Implications for Practice
• This study showed how environmental events associated with problem behaviors can be identified within school settings.
• The peer without a disability was able to successfully implement these conditions. VanAcker, R., Boreson, L., Gable, R. A., & Potterton, T. (2005). Are we on the right course? Lessons learned about current FBA/BIP practices in schools. Journal of Behavioral Education, 14, 35–56. Issue of Concern Investigators evaluated FBAs and behavior intervention plans (BIPs) in Wisconsin to determine if teams were following “best practices” in this area.
• In 1997, the federal government included legal mandates in IDEA that requires FBAs be conducted and used in the development of BIPs to better serve special education students with problem behaviors.
• Most schools were not prepared to implement these procedures and struggled to adequately train all relevant personnel.
Research Questions
• Are the FBAs and BIPs created and submitted by school teams technically adequate? • How effective was training in promoting the technical adequacy of the FBA/BIP?

147
Participants • Over three years, various school personnel were provided with inservice training
seminars focusing on FBAs and BIPs (one-day training, with a two day follow up seminar). Personnel included: special education teachers, behavior specialists, school psychologists, school social workers and administrators.
Methods Used to Answer the Research Questions
• Schools across Wisconsin were encouraged to send completed FBAs and BIPs for review (whether they had participated in the training or not).
• Seventy-one FBA/BIPs were submitted by 70 schools from 21 school districts. • A rating scale was developed and used to analyze each artifact submitted. • Based on the best practices literature, the scale focused on the following variables:
o make-up and training of individual education plan (IEP) team developing FBA/BIP;
o identification of target behaviors; o identification of the hypothesized behavioral function; o data collection procedures; o examination of contextual variables; o verification of the function; o connection of the BIP to the FBA; o use of positive behavioral supports; and o monitoring of implementation and BIP effectiveness.
• Two authors rated each FBA and BIP submitted. Results
• The results indicated that many of the FBAs had major flaws. The most common flaw was that the teams did not clearly identify and operationally define the target behavior. Approximately 18% of the FBAs did not specify a target behavior, and another 52% included behaviors that were rated as less than adequate.
• Most of the reviews indicated that team members did not verify if their hypothesized function of the behavior was correct before beginning intervention. Sixty-one percent of the FBAs included no information that would indicate the team had verified the proposed hypothesis.
• Many of the teams did not take the function of the behavior into account when developing a BIP. Only 35% of BIPs demonstrated the use of the information obtained in the FBA.
• About 46% of materials submitted proposed only aversive consequences, which is particularly problematic since punishment is not a function-based intervention.
• Those teams with members that had attended two or more days for these trainings produced better FBAs and BIPS.
• Around 40% of the plans were developed by an IEP team, which is mandated in the State of Wisconsin.

148
Implications for Practice • It did appear that training was somewhat helpful in the development of FBAs and BIPs,
although many of the teams with trained individuals were not able to clearly identify the problem behavior.
• More training and education in these areas is required in order for FBAs and BIPs to be adequately developed. Personnel must be given ample practice with performance feedback to improve. (Also see Chapter 14: The Importance of Treatment Integrity in RtI Implementation, page 153.)
• A checklist may be used by teams to produce an effective plan and insure that they have met the requirements.
Witt, J. C., VanDerHeyden, A. M., & Gilbertson, D. (2004). Troubleshooting behavioral interventions: A systematic process for finding and eliminating problems. School Psychology Review, 33, 363–383. Purpose of Paper The authors describe a systematic approach to troubleshooting behavioral interventions in the school system.
• The crucial components of instruction, classroom management and intervention design must be intact to effectively implement behavioral interventions.
• A behavior management pyramid is described. If the requirements in each level are met but the behavior persists, the next level should be assessed.
o Level 1: Academic skills must be taught properly. (Also see Chapter 8: Improving Core Instruction for All Students: Tier I Application, page 75.)
o Level 2: Positive behavioral expectations are implemented and taught in the classroom, rules are followed and the majority of the time is spent on academic activities. (Also see Chapter 12: Using RtI in Social-Emotional-Behavioral Areas: Tier II Application, page 125.)
o Level 3: Teacher responds to inappropriate behavior consistently and accurately.
o Level 4: A functional assessment is conducted.

149
There are four levels in the troubleshooting process:
Level Important Factors Signs that Factors Interfere Level 1: Troubleshoot problem definition and data system
• Well-defined target problem. • Baseline assessment data. • Quantifiable goals. • Progress monitoring tools.
If these factors are not present, the intervention will be fatally flawed.
Level 2: Troubleshoot classroom
• Use of antecedent strategies improves learning.
• Managing antecedent conditions is more effective than using consequences.
• Professional development to assist teachers in classroom management.
• Train and allow children to practice in expected behavior performance.
• Provide students with a reason to behave.
• Randomly selected students demonstrate on-task behavior less than 30% of the time.
• Transition times between activities are longer than 4 minutes.
Level 3: Troubleshoot intervention integrity
• Data are more useful than teacher report.
• Directly teach and support intervention skills in the classroom.
• Use graphs to review integrity data. • Use performance feedback.
• Cannot determine intervention effectiveness without data on implementation and progress monitoring.
• Intervention is rarely implemented with integrity but no training is provided.
• Teacher is strongly supported but intervention is not implemented with integrity.
Level 4: Troubleshoot intervention design
• Components in the environment that reinforce the problem behavior are identified and adjusted.
• For all problem behaviors reduced, replacement behaviors should be identified.
• Function of behavior may change depending on what is reinforced.
• Teach the child the appropriate behavior. Do not assume they know it.
• Student gains little reinforcement when using an appropriate behavior rather than an inappropriate behavior.
• Student uses replacement behavior but problem behavior remains effective for the student.
• Problem behavior decreased but replacement behavior is used infrequently and in few settings.
• Effectiveness of intervention has diminished over time.

150
Implications for Practice • Provides a model for implementing RtI for behavior. • Consultants should proceed in a linear fashion through each level to ensure that the
behavioral interventions are implemented in a context where they can be successful. If fundamental components from lower levels have not been checked and found intact, then assessment and intervention efforts that are more individualized and intensive (higher-level activities) will not be successful.
• This model can be applied in the school setting to troubleshoot behavioral interventions that are not working or to use when creating and implementing interventions.
References
Broussard, C. D., & Northup, J. (1995). An approach to functional assessment and analysis of
disruptive behavior in regular education classrooms. School Psychology Quarterly, 10, 151–164.
Cooper, L. J., Wacker, D. P., Thursby, D., Plagmann, L. A., Harding, J., Millard, T., & Derby, M.
(1992). Analysis of the effects of task preferences, task demands, and adult attention on child behavior in outpatient and classroom settings. Journal of Applied Behavior Analysis, 25, 823–840.
Derby, K. M., Wacker, D. P., Sasso, G., Steege, M., Northup, J., Cigrand, K., & Asmus, J. (1992).
Brief functional assessment techniques to evaluate aberrant behavior in an outpatient setting: A summary of 79 cases. Journal of Applied Behavior Analysis, 25, 713–721.
Dunlap, G., DePerczel, M., Clarke, S., Wilson, D., Wright, St., White, R., & Gomez, A. (1994).
Choice making to promote adaptive behavior for students with emotional and behavioral challenges. Journal of Applied Behavioral Analysis, 27, 505–518.
Dunlap, G., Kern, L., dePerczel, M., Clarke, S., Wilson, D., Childs, K. E., White, R., & Falk, G. D.
(1993). Functional analysis of classroom variables for students with emotional and behavioral disorders. Behavioral Disorders, 18, 275–291.
DuPaul, G. J., & Ervin, R. A. (1996). Functional assessment of behaviors related to attention-
deficit/hyperactivity disorder: Linking assessment to intervention design. Behavior Therapy, 27, 601–622.
Gickling, E. E., & Armstrong, D. L. (1978). Levels of instructional difficulty as related to on-task
behavior, task completion, and comprehension. Journal of Learning Disabilities, 11, 32–39.

151
Gresham, F. M. (2005). Response to intervention: An alternative means of identifying students
as emotionally disturbed. Education and Treatment of Children, 28, 328–344. Gresham, F. M., Gansle, K. A., Noell, G. H., Cohen, S., & Rosenblum, S. (1993). Treatment
integrity of school-based interventions. School Psychology Review, 22, 254–272. Harding, J., Wacker, D. P., Cooper, L. J., Millard, T., & Jensen-Kovalan, P. (1994). Brief
hierarchical assessment of potential treatment components with children in an outpatient clinic, Journal of Applied Behavior Analysis, 27, 291–300.
Horner, R. H. (1994). Functional assessment: Contributions and future directions. Journal of
Applied Behavior Analysis, 27, 401–404. Iwata, B. A., Dorsey, M. G., Slifer, K. J., Bauman, K. E., & Richman, G. S. (1982). Toward a
functional analysis of self injury. Analysis and intervention in developmental disabilities, 2, 3–20. Reprinted in Journal of Applied Behavior Analysis, 1994, 27, 197–209.
Kern, L., Childs, K. E., Dunlap, G., Clarke, S., & Falk, G. D. (1994). Using assessment-based
curricular intervention to improve the classroom behavior of a student with emotional and behavioral challenges. Journal of Applied Behavioral Analysis, 27, 7–19.
Moore, D. W., Anderson, A., & Kumar, K. (2005). Instructional adaptation in the management
of escape-maintained behavior in a classroom. Journal of Positive Behavior Interventions, 7, 216–223.
Neef, N. A., & Iwata, B. A. (1994). Current research on functional analysis methodologies: An
introduction. Journal of Applied Behavior Analysis, 27, 211–214. Northup, J., Broussard, C., Jones, K., George, T., Vollmer, T. R., & Herring, M. (1995). The
differential effects of teacher and peer attention on the disruptive classroom behavior of three children with a diagnosis of attention deficit hyperactivity disorder. Journal of Applied Behavior Analysis, 28, 227–228.
O’Neill, R. E., Horner, R. H., Albin, R. W., Sprague, J. R., Storey, K., & Newton, J. S. (1997).
Functional assessment and program development for behavior problems. Pacific Grove, CA: Brooks/Cole.
Reimers, T. M., Wacker, D. P., & Koeppl, G. (1987). Acceptability of behavioral interventions: A
review of the literature. School Psychology Review, 6, 212–227. Repp, A. C., & Horner, R. H. (Eds.). (1999). Functional analysis of problem behavior. Belmont,
CA: Wadsworth.

152
Sasso, G. M., Reimers, T. M., Cooper, L. J., Wacker, D., Berg, W., Steege, M., Kelly, L., & Allaire,
A. (1992). Use of descriptive and experimental analyses to identify the functional properties of aberrant behavior in school settings. Journal of Applied Behavior Analysis, 25, 809–821.
Seybert, S., Dunlap, G., & Ferro, J. (1996). The effects of choice making on the problem
behaviors of high school students with intellectual disabilities. Journal of Behavioral Education, 6, 49–65.
Stichter, J., Hudson, D., & Sasso, G. (2005). The use of structural analysis to identify setting
events in applied settings for emotional/behavioral disorders. Behavioral Disorders, 30, 403–420.
Stichter, J. P., Sasso, G. M., & Jolivette, K. (2004). Structural analysis and intervention in a school setting: Effects on problem behavior for a student with an emotional/behavioral disorder. Journal of Positive Behavior Interventions, 6, 166–177.
Sulzer-Azaroff, B., & Mayer, G. R. (1991). Behavior analysis for lasting change. New York: Holt,
Rinehart, Winston. Tilly, W. D., III, Knoster, T. P., Kovaleski, J., Bambara, L., Dunlap, G., & Kincaid, D. (1998).
Functional behavioral assessment: Policy development in light of emerging research and practice. Alexandria, VA: National Association of State Directors of Special Education.
VanAcker, R., Boreson, L., Gable, R. A., & Potterton, T. (2005). Are we on the right course?
Lessons learned about current FBA/BIP practices in schools. Journal of Behavioral Education, 14, 35–56.
Vollmer, T. R., Marcus, B. A., Ringdahl, J. E., & Roane, J. S., (1995). Progressing from brief
assessments to extended experimental analyses in the evaluation of aberrant behavior. Journal of Applied Behavior Analysis, 28, 561–576.
Witt, J. C., VanDerHeyden, A. M., & Gilbertson, D. (2004). Troubleshooting behavioral
interventions: A systematic process for finding and eliminating problems. School Psychology Review, 33, 363–383.

153
Chapter 14
The Importance of Treatment Integrity in RtI Implementation
Perhaps the most serious threat to attaining the effects that are possible with use of Response to Intervention (RtI) is the degree to which implementation correctly occurs. There is a long history of poor implementation integrity in school systems for intervention, and this is likely to be a persistent challenge to RtI. Further, RtI requires implementation integrity for a series of activities, not just intervention. For RtI to result in meaningful educational decision making, children in need of intervention must be accurately identified, system-level problems must be accurately defined, interventions must be appropriately selected, sequenced and implemented, and at each stage, decisions must be made that correspond to the data collected. Several scholars have suggested that implementation integrity of RtI will be the major obstacle to overcome because data will be needed to show that the interventions were implemented as designed AND the process with which they were developed and students identified was implemented as intended. Fortunately, empirical data provide useful guidelines about how to best ensure RtI integrity and, therefore, RtI outcomes.
Gresham, F. M. (1989). Assessment of treatment integrity in school consultation and prereferral intervention. School Psychology Review, 18, 37–50.
Purpose of Paper Treatment Integrity is the degree to which interventions have been correctly implemented as planned. This article was a keystone article that enumerated serious concerns about treatment integrity for children who were being referred for eligibility evaluations and most frequently subsequently diagnosed with specific learning disabilities (SLD).
• If treatment integrity is not adequate, then children are at risk of being falsely identified, subjected to more restrictive treatments and suffering worse learning outcomes.
• Accurate educational decision-making depends in part upon adequate treatment integrity.
• This article followed two empirical studies conducted by Gresham and colleagues and questioned the conventional practice of monitoring only dependent variables (outcomes) in research and practice when the independent variable (usually intervention) was ignored.
• Gresham was one of the first to emphasize the importance of treatment integrity and identify factors that can weaken and strengthen it.

154
Five factors that weaken treatment integrity are: 1. Treatments that are too complex. The number of steps in an intervention and the
complexity of each step should be minimized to enhance treatment integrity. 2. Treatments that require too much time. One survey found that 87% of school
psychologists cited lack of time as the primary reason for not implementing a treatment plan; hence, the time required to implement should be minimized.
3. Treatments that require materials that are not easily accessible. All intervention materials required to run the intervention should be provided to the implementer.
4. Treatments that are not perceived to be effective by those who must implement the treatment. School-based consultants should describe that the specific recommended intervention procedures will lead to particular desired outcomes and include a monitoring system to ensure treatment success.
5. Intervention implementer is not motivated to use the treatment. Consultants must consider how to manage environmental contingencies to support correct intervention implementation.
Three issues that affect the measurement of treatment integrity include:
1. clarity and specificity of the intervention steps; 2. the individual implementing the intervention deviates from the intervention plan; 3. psychometric properties such as: content validity, percentage of time that the
treatment is reliably administered and reliability of the scoring instrument used to evaluate the effectiveness of the treatment.
Need for Treatment Integrity
• It is important to directly monitor treatment integrity. Treatment integrity needs to be assessed to know if behavior change is a result of the intervention.
• A prevalent mistake on the part of decision-makers is to conclude that an intervention has not been successful in the absence of treatment integrity data and then to prescribe a more complicated or intensive intervention to replace the first intervention. Treatment integrity should always be measured prior to concluding that an intervention has not been successful.
• Integrity observations are mandatory and can be done using checklists or rating forms during a treatment session. It remains unclear how to best implement integrity checks to ensure reliable intervention delivery. Several questions remain (and set the stage for future research in this area) about the best way to measure and ensure treatment integrity including the following.
o What is the number of observations needed to correctly measure treatment integrity?
o How many observations should be conducted without the interventionist’s prior knowledge to ensure reliable implementation during non-observed sessions?

155
o How frequently and for how long should observations be conducted? Two to three times per week for 20–30 minutes is recommended, but could more or less time affect accuracy of integrity estimates?
o How reliable are indirect assessments such as self-report forms? Implications for Practice
• A written treatment plan describing each step of the intervention in replicable or observable terms should be given to the interventionist and used by the observer to assess integrity.
• Consultants should review: o intervention implementation data; o intervention effects with interventionists on a frequent basis.
• Direct observations of the treatment plan must be conducted. Self-report data concerning treatment integrity have not been determined to be reliable nor sensitive indicators of actual treatment integrity at this time. In fact, several follow-up studies have found that classroom teachers tend to overestimate the integrity with which they have implemented interventions.
Mortenson, B. P., & Witt, J. C. (1998). The use of weekly performance feedback to increase teacher implementation of a prereferral academic intervention. School Psychology Review, 27, 613–628. Issue of Concern Treatment integrity is critical to prereferral intervention effectiveness, but also challenging to ensure.
• Previous research has demonstrated the effectiveness of performance feedback when provided on a daily basis. Performance feedback is defined as systematically measuring the percentage of correctly implemented intervention steps in a protocol and providing information to the teacher (usually verbally via the consultant) about the degree to which the intervention was correctly implemented as planned.
• In addition, troubleshooting correct implementation is used to ensure adequate integrity (e.g., re-training the teacher, providing new materials).
• Performance feedback is delivered in a collegial and supportive manner or tone, but the content of the feedback is specific and determined by direct measurement (i.e., the content of the feedback always consists of the two variables described above—percentage of steps correctly implemented and troubleshooting to enhance integrity for the following day or week).
Research Question
• What is the effect of performance feedback on teacher implementation of interventions when it is delivered on a weekly basis?

156
Participants
• Four pairs of teachers and students in second through fifth grade participated. • Students were selected if they demonstrated an academic work completion problem. • All participating students were screened and determined to have a performance deficit
or a “won’t do” problem, rather than a skill deficit or a “can’t do” problem. That is, participants in this study included only students who were capable of correctly performing the required task in class, but were not sufficiently motivated to do so. Therefore, all interventions consisted of monitoring work completion and accuracy and delivering prescribed rewards for correct performance.
Methods Used to Answer the Research Question
• Student performance and treatment integrity were measured daily. • Student performance was calculated by recording the percentage of assignment items
completed by the student in the subject area of concern. o During baseline, most students completed between 54–71% of the assigned
task. o Students chose the reward they would like to earn. o All students had goals to complete 80% of the items assigned. o Teachers scored student performance on worksheets, and consultants checked
their scoring. • Treatment integrity was defined as the percentage of correctly completed intervention
steps each day. Permanent products were used to estimate integrity.1 • Treatment integrity was determined by:
o scored worksheets; o The percentage of the 14 intervention steps completed by the teacher.
• Teachers were given all necessary materials such as student graphs, supplemental worksheets for the student to complete (if they had completed all other assigned work) and reward slips to be given by the teacher to the student.
• Teacher training was as follows. o All the steps of the intervention were reviewed with the teacher. o The trainer was present to correct the teacher as needed while explaining all the
steps to the student.
1Permanent product refers to a by-product or “footprint” of the intervention that occurs when an intervention is correctly utilized. Common examples of permanent products include worksheets and behavior charts. Permanent products have been found to be a reliable indicator of treatment integrity, are more efficient to collect and less intrusive to the classroom environment. The consultant can simply collect the “intervention folder” each week and compute the percentage treatment integrity based on the products contained in the folder (e.g., a correctly scored reading passage and reward chart indicates that the child received the reading intervention, the score was correctly computed and the reward was or was not delivered as prescribed).

157
o The trainer observed the teacher implementing the intervention and provided correction until the teacher could correctly and independently implement 100% of the intervention steps.
o The teacher, trainer and student signed a letter to the student’s parents explaining the intervention steps.
o All needed materials were provided to the teacher in an “intervention kit” including an intervention protocol specifying each step of the intervention.
• The intervention involved having the student cue his/her teacher when he/she had completed an assignment. The student was then to record his/her assignment score on a graph. The student earned rewards for scores of 80% or better. The teacher submitted a daily report to the consultant using a fax machine on campus.
• Weekly performance feedback sessions conducted by the consultant (5–7 minutes) began when treatment integrity fell below 70% and student performance fell below 70% correct work completion.
Results
• 75% of the teachers required performance feedback and made improvements in treatment integrity as a result of performance feedback.
• For teacher 1, 48% integrity occurred without consultant sessions, but increased to 80% with performance feedback, and after, maintained at 72%.
• For teacher 2, 61% integrity improved to 71% after performance feedback, and then the student no longer attended the school, so the intervention stopped.
• For teacher 3, 61% integrity improved to 79% integrity with weekly performance feedback and was maintained at 84% after performance feedback was stopped.
• Teacher 4 did not perform below 70% and maintained at 86% without consultant assistance.
Implications for Practice
• Performance feedback is necessary for most teachers to ensure correct implementation of interventions and to improve student learning and performance outcomes.
• Administrators should ensure teachers provide, and consultants collect, treatment integrity information.
• Performance feedback may be provided to teachers implementing interventions by consultants on a weekly basis, rather than on a daily basis. This modification increases the efficiency of performance feedback and makes it feasible for consultants who are only on-site one day per week.

158
Noell, G. H., Witt, J. C., Slider, N. J., Connell, J. E., Gatti, S. L., Williams, K. L., Koenig, J. L., Resetar, J. L., & Duhon, G. J. (2005). Treatment implementation following behavioral consultation in schools: A comparison of three follow-up strategies. School Psychology Review, 34, 87–106.
Issue of Concern It is important to empirically identify the most effective method for providing follow-up during consultation to ensure treatment integrity. Research Questions
• Does the use of social influencing messages, performance feedback or weekly follow-up by consultants improve intervention implementation by teachers?
• Does the follow-up strategy and level of treatment integrity translate to changes in student behavior?
• Would the consultant follow-up methodology affect teachers’ attitudes towards intervention effectiveness and acceptability?
• Is there a relationship between student behavior change, teacher opinion of student concerns, treatment acceptability and treatment integrity?
Participants
• Forty-five students and 45 teachers participated in this study. • Students were enrolled in general education classrooms grades K through 5 in one of
six urban elementary schools. Methods Used to Answer the Research Questions
• Teachers worked with consultants to develop and implement an intervention plan for a student.
• Teachers referred students who had academic challenges, behavior concerns, poor work completion or a combination of academic and behavior concerns.
• Trained consultants completed Problem Identification Interviews with teachers and conducted performance assessments (using curriculum-based measurement, CBM) or classroom observations to further define the behavior of concern as either a performance or skill deficit.
• Classroom observation and/or CBM data were collected by the consultants prior to treatment and at the end of the 3 weeks of intervention to calculate student behavior and/or academic change.
• Intervention plans were tailored for the student based on the individual concern, but all intervention plans contained the same elements: measuring/counting the target behaviors, providing students with a reward if they reached a goal. All interventions produced permanent products used to determine treatment integrity, and consultants created permanent product checklists.

159
• Following a training phase to ensure that teachers could correctly implement the interventions without consultant assistance, interventions were implemented daily for 3 weeks by the teachers.
• Permanent products were scored daily by consultants. A percentage score was calculated by dividing the number of products completed accurately by the total number of possible products.
• Teachers completed the intervention rating profile -15 (IRP-15) prior to the beginning of the intervention and at the end of the intervention to estimate intervention acceptability.
• Teachers completed the consultant rating profile (CRP), a brief rating scale developed by the author for this study. The CRP was used to evaluate the consultation process and how the different follow-up methodologies may have influenced teacher intervention implementation.
• Teachers were randomly assigned to three different consultation follow-up conditions: weekly, commitment emphasis and performance feedback.
o The weekly condition group of teachers participated in weekly brief interviews based on the plan evaluation interview (commonly used in behavioral consultation) between the consultant and the teacher. No student performance data or treatment integrity data were reviewed unless requested by the teacher.
o The commitment emphasis group of teachers received weekly follow-up as described above, but had an additional component. Teachers in this condition met with their consultants prior to the start of the intervention and discussed five aspects of treatment implementation. Some topics included the consistency of implementation and its effect on the student’s progress and the importance of the commitment made to the parents to deliver the intervention.
o The performance feedback (PFB) group of teachers met with their consultants and reviewed student performance graphs, the students’ permanent products and a graph of their treatment integrity scores. Teachers received consultation daily until the intervention was delivered with 100% integrity. The frequency of consultation was faded from daily to weekly feedback once treatment integrity was adequately established.
Results
• The PFB group demonstrated the best results. Differences were statistically and clinically significant.
o The PFB group of teachers had higher treatment implementation (i.e., 75%) compared to the other two groups (insert those percentages).
o The PFB group of teachers had better student behavioral outcomes compared to the other two groups.
o The teachers in the PFB group had weekly follow-up meetings that were longer than the other two groups. PFB meetings required about 30 minutes in duration.

160
• There was not a statistically significant difference between the weekly group and the commitment emphasis group in treatment integrity.
• Teachers in the weekly group had weekly follow-up meetings of 19 minutes, and had very low treatment integrity (i.e., 23% by the end of the third week). These results indicate that just talking about an intervention does not ensure implementation or student benefit.
• Teachers in the commitment emphasis group had weekly follow-up meetings of 11 minutes in duration and low treatment integrity (i.e., 46% by the end of the third week). The authors noted that commitment emphasis did not appear to be effective in improving treatment integrity compared to PFB.
• All three groups of teachers reported satisfaction with the consultation process, perceived the interventions to be acceptable and perceived the consultants to be effective.
• There was a moderate correlation between treatment integrity and student outcomes. Implications for Practice
• Weekly meetings between teachers and consultants that do not include specific data about student performance and treatment integrity are not sufficient to establish adequate treatment integrity, and this translates to lower student performance.
• Even if teachers approve of the consultation process and an intervention, it does not mean that the intervention will be implemented effectively, and consequently, that the child’s behavior will improve.
• PFB is effective when conducted in the following manner. o PFB must occur daily at the onset until teachers implement the treatment with
100% integrity. PFB can then be faded to one time per week. o Treatment integrity should be monitored using permanent products, and these
data should be graphically displayed and shared with the teacher during the consultation session.
o Student performance graphs should also be shared and discussed during consultation sessions.
Witt, J. C., Noell, G. H., LaFleur, L. H., & Mortenson, B. P. (1997). Teacher usage of interventions in general education: Measurement and analysis of the independent variable. Journal of Applied Behavior Analysis, 30, 693–696.
Issue of concern The facilitation of high treatment integrity by teachers via the use of direct monitoring and performance feedback was the concern considered.

161
Research Question • Can treatment integrity and student performance be improved by providing teachers
with performance feedback? Participants
• Four elementary school general education teachers and four students participated in this study.
Methods Used to Answer the Research Question
• Students were referred to a school-based intervention consultation team by their teachers who requested help planning an intervention to remediate student performance problems. These students and their teachers participated in this study.
• Consultants systematically determined if students had a skill deficit or performance deficit using CBM with and without incentives for improved performance. Students who correctly performed the task to earn an incentive were determined to exhibit a performance deficit and were selected to participate in this study.
• Four teacher-student pairs participated. • Permanent products were used to estimate treatment integrity. Permanent products
resulting from correct use of the treatment included items such as correctly scored worksheets and reward slips provided to students if they met the reward criterion each day.
• The permanent products were scored daily by the consultants. • A treatment integrity score was determined by dividing the number of correct
permanent products by the total number of possible treatment steps to yield a percent correct implementation score.
• Students selected the reward they would earn for correctly completing the assigned task from a reward menu containing items approved for use in the classroom by the teacher.
• A multiple baseline research design was employed, meaning that the same phases of the treatment were initiated at different time points across the different teachers as indicated on the graphs included in the article.
Results
• The training phase for the teachers included direct observation and assistance by the consultant on the first day of implementation. During this phase, 98% treatment integrity was reported.
• After training, the teacher independently implemented the intervention, without performance feedback from the consultant. Treatment integrity declined for all teachers. None of the teachers performed above 80% for more than two days.
• Next, consultants provided performance feedback. In this phase, consultants met daily with teachers to review both the students’ performance graphs and the teachers’

162
treatment integrity graphs. Performance feedback was delivered with 96% integrity on average for all teachers in this phase.
• In the last phase, teachers again implemented the intervention independently, without performance feedback. Teachers maintained treatment integrity at 81%.
• All students improved their academic performance and experienced additional improvements when performance feedback was provided to teachers.
Implications for Practice
• Treatment consultation with teachers at the start of an intervention is not sufficient to ensure treatment integrity over time.
• Performance feedback by consultants is essential for guaranteeing teacher treatment integrity, and in turn, improved student performance.
• Permanent products were important in providing a data-based record of treatment integrity and a mechanism used by consultants for providing performance feedback.
References Gresham, F. M. (1989). Assessment of treatment integrity in school consultation and prereferral
intervention. School Psychology Review, 18, 37–50 Gresham, F. M., & Kendell, G. K. (1987). School consultation research: Methodological critique and
future research directions. School Psychology Review, 16, 306–316. Gresham, F. M., Gansle, K. A., Noell, G. H., Cohen, S., & Rosenblum, S. (1993). Treatment integrity of
school-based behavioral intervention studies: 1980–1990. School Psychology Review, 22, 254–272. Gresham, F. M., MacMillan, D. L., Beebe-Frankenberger, M. E., & Bocian, K. M. (2000). Treatment
integrity in learning disabilities intervention research: Do we really know how treatments are implemented? Learning Disabilities Research & Practice, 15, 198–205.
Happe, D. (1982). Behavioral intervention: It doesn’t do you any good in your briefcase. In J. Grimes
(Ed.), Psychological approaches to problems of children and adolescents (pp. 15–41). Des Moines, IA: Iowa Department of Public Instruction.
Jones, K. M., Wickstrom, K. F., & Friman, P. C. (1997). The effects of observational feedback on
treatment integrity in school-based behavioral consultation. School Psychology Quarterly, 12, 316–326.
Kratochwill, T. R., Elliott, S. N., & Rotto, P. C. (1995). Best practices in school-based behavioral
consultation. In A. Thomas & J. Grimes (Eds.), Best practices in school psychology III (pp. 519–535). Washington, DC: The National Association of School Psychologists.

163
McGimsey, J. F., Greene, B. F., & Lutzker, J. R. (1995). Competence in aspects of behavioral treatment and consultation: Implications for service delivery and graduate training. Journal of Applied Behavior Analysis, 28, 301–315.
Meadows, N. B., Neel. R. S., Scott, C. M., & Parker, G. (1994). Academic performance, social
competence, and mainstream accommodations: A look at mainstreamed and nonmainstreamed students with serious behavioral disorders. Behavioral Disorders, 19, 170–180.
Moore, J. W., Schaut, J., & Fritzges, C. (1978). Evaluation and effects of feedback associated with a
problem-solving approach to instruction on teacher and student behavior. Journal of Educational Psychology, 70, 200–208.
Mortenson, B. P., & Witt, J. C. (1998). The use of weekly performance feedback to increase teacher
implementation of a prereferral academic intervention. School Psychology Review, 27, 613–628. Nastasi, B. K., Varjas, K., Schensul, S. L., Silva, K. T., Schensul, J. J., & Tarnayake, P. (2000). The
participatory intervention model: A framework for conceptualizing and promoting intervention acceptability. School Psychology Quarterly, 15, 207–232.
Noell, G. H., Duhon, G. J., Gatti, S. L., & Connell, J. E. (2002). Consultation, follow-up, and behavior
management intervention implementation in general education. School Psychology Review, 31, 217–234.
Noell, G. H., Gresham, F. M., & Gansle, K. A. (2002). Does treatment integrity matter? A preliminary
investigation of instructional implementation and mathematics performance. Journal of Behavioral Education, 11, 51–67.
Noell, G. H., Witt, J. C., Gilbertson, D. N., Ranier, D. D., & Freeland, J. T. (1997). Increasing teacher
intervention implementation in general education settings through consultation and performance feedback. School Psychology Quarterly, 12, 77–88.
Noell, G. H., Witt, J. C., LaFleur, L. H., Mortenson, B. P., Ranier, D. D., & LeVelle, J. (2000). A
comparison of two follow-up strategies to increase teacher intervention implementation in general education following consultation. Journal of Applied Behavior Analysis, 33, 271–284.
Noell, G. H., Witt, J. C., Slider, N. J., Connell, J. E., Gatti, S. L., Williams, K. L., Koenig, J. L., Resetar, J.
L., & Duhon, G. J. (2005). Treatment implementation following behavioral consultation in schools: A comparison of three follow-up strategies. School Psychology Review, 34, 87–106.

164
Power, T., Blom-Hoffman, J., Clarke, A. T., Riley-Tillman, T. C., Kelleher, C., Manz, P. (2005). Reconceptualizing intervention integrity: A partnership-based framework for linking research with practice. Psychology in the Schools, 42, 495–507.
Sheridan, S., Welch, M., & Orme, S. (1996). Is consultation effective? A review of outcome research.
Remedial and Special Education, 17, 341–354. Shores, R. E., Jack, S. L., Gunter, P. L., Ellis, D. N., DeBriere, T. J., & Wehby, J. H. (1993). Classroom
interactions of children with behavior disorders. Journal of Emotional and Behavioral Disorders, 1, 27–39.
Sterling-Turner, H. E., Watson, T. S., Wildmon, M., Watkins, C., & Little, E. (2001). Investigating the
relationship between training type and treatment integrity. School Psychology Quarterly, 16, 56–67.
Sutherland, K. S., Copeland, S., & Wehby, J. H. (2001). Catch them while you can: Monitoring and
increasing the use of effective praise. Beyond Behavior, 11, 46–49. Tilly, W., & Flugum, K. R. (1995). Ensuring quality interventions. In A. Thomas & J. Grimes (Eds.), Best
practices in school psychology III (pp. 485–5000). Washington, DC: National Association of School Psychologists.
Witt, J. C., Gresham, F. M., & Noell, G. H. (1996). What’s behavioral about behavioral consultation? Journal of Educational and Psychological Consultation, 7, 327–344.
Witt, J. C., Noell, G. H., LaFleur, L. H., & Mortenson, B. P. (1997). Teacher usage of interventions in
general education: Measurement and analysis of the independent variable. Journal of Applied Behavior Analysis, 30, 693–696.

165
Chapter 15
RtI Models that Have Demonstrated Effectiveness A number of educational agencies nationwide have implemented a Response to Intervention (RtI) model on a large scale in their schools. Some of the agencies include: Heartland Agency (Iowa) Model, Ohio’s Intervention-Based Assessment Model, Pennsylvania’s Instructional Support Teams and Minneapolis Public School’s Problem-Solving Model. In these models, consultants work in collaboration with teachers to identify and implement interventions with students. Many of the agencies described below have demonstrated that more students are served by their school-based teams using RtI and special education referral rates were not increased. In some cases, marked decreases in special education referrals have been reported. In addition, a greater percentage of children who were referred for evaluation based on RtI data actually qualified for services relative to baseline years (indicating an improved diagnostic hit rate). One study demonstrated a decrease in rates of grade retention with such a model in place. Moreover, agencies report that general and special education teachers have been able to use the data obtained during this process to create individual education plan (IEP) goals and guide interventions (Lau, Sieler, Muyskens, Canter, Vankeuren, & Marston, 2006). Whereas several studies have demonstrated positive results, there is still much work to be done in refining the application of these models in schools. Veterans of this process have indicated that some issues of concern include the need for: more staff development and “hands-on” training, resource allocation to implementation and maintenance and dissemination of precise operational guidelines in place. A primary concern is that RtI procedures be implemented with fidelity. (Also see Chapter 14: The Importance of Treatment Integrity in RtI Implementation, page 153.) If RtI is not appropriately implemented, educational professionals will fail to meet the needs of students for whom they are responsible.
Ikeda, M. J., Tilly, W. D., Stumme, J., Volmer, L., & Allison, R. (1996). Agency-wide implementation of problem solving consultation: Foundation, current implementation, and future directions. School Psychology Quarterly, 11, 228–243. Purpose of Paper This paper described the Heartland agency’s implementation of problem-solving consultation. The steps in implementing a large-scale problem-solving model are provided.
• Four foundational components of problem-solving consultation include:

166
Foundational Component Points Included in Training Collaboration (Staff and programs need to work together.)
• Teachers are directly taught to collaborate.
• Results in teacher working more effectively with support staff, other teachers, and administrators working better with teachers.
Building assistance teams (BATs) (a structure for systematically intervening with all types of problems)
• The process is continual. • Many problems can be treated in general
education. • Once a child is eligible for special
education, roles of staff do not change. • Problem definition, coming up with
solutions, evaluating outcomes, and group process skills.
Systematic progress monitoring (Formative evaluation of students can lead to positive student performance gains.)
• Determine precise problem definition, identifying problematic dimension of behavior, select measurement strategy, gather information, use information to make intervention decisions.
• Use of data will result in better intervention decisions made by teachers.
Ongoing staff development • Critically review what areas need to be covered in training.
• Collect data and use it to identify problems with the process.
• Update training with empirically validated and better technologies while keeping the problem-solving model in place.
Examples of how this process works in various areas of education are as follows.
• Consultants can work directly with teachers to address learning challenges faced by individual or groups of students. For example, a teacher asked how she could develop a system for monitoring her class-wide interventions, and the consultant provided her with the information and support she needed to carry out these assessments and use the data to inform her instruction.
• In special education, consultant teams with specialized training and skills may be called out to assist special education teachers. In Heartland, a team of consultants with expertise in autism may be called out to work with a particular child and teacher to develop interventions to improve child success.

167
Implications for Practice
• A survey of 1000 teachers, principals and superintendents indicated that 75% of these professionals perceived that their district obtained satisfactory to excellent support from Heartland in numerous areas (functional assessment, merging of services, collaborative training, BATS and more meaningful parental involvement).
• According to the survey results, some areas that may need additional support include: merging special education and general education and site-based management (BATS).
• Some areas for improvement suggested by the authors include: o providing resources for long-term measurement strategies; o lowering staff-to-student ratios; o gaining state-level support and leadership in this arena; o increasing collaboration between schools and community agencies; and o providing training to bring research to practice.
Kovaleski, J. F., Tucker, J. A., & Stevens, L. J. (1996). Bridging special and regular education: The Pennsylvania initiative. Educational Leadership, 53, 44–47. Purpose of Paper In 1990, schools in Pennsylvania developed instructional support teams (ISTs) to guide prereferral interventions. This paper describes the program.
• These groups link school resources to students in need of additional supports for academic, social-emotional or behavioral problems.
• Services provided focus on identifying instructional needs of students as opposed to internal characteristics or deficits of the child and include:
o support and problem-solving assistance for teachers; o initial screening for students who may require an evaluation; o helping teachers with students who have special needs within the classroom.
Prereferral intervention • Team membership varies but all are comprised of: the principal, the student’s general
education teacher and a support teacher. The parents are encouraged to participate in the meetings. Some other professionals on the team may include: school psychologists, reading and mathematics specialists, counselors, speech therapists and/or school nurses.
• Team members work with students not yet identified for special education. • Parents or teachers can request support through this process. • Support teachers are vital in this process and help the classroom teacher implement the
interventions. Support teachers can spend a maximum of 60 days on each case.

168
Instructional support training • The Department of Education provides training for the IST members. • Consultants work on-site to conduct training for the community, staff members and
parents, and to help schools develop plans. • All team members are required to receive special training with five components:
1. Collaboration and team building: team building, problem solving, team maintenance;
2. Instructional assessment: how to use assessments to measure intervention effectiveness and plan interventions;
3. Instructional adaptation: how to help students progress in general education with adapted instructional materials (e.g., modifying tests by simplifying response levels);
4. Student discipline: learning about effective classroom discipline techniques for increasing positive interactions between adults and students (with a focus on supportive, non-punitive techniques);
5. Student assistance strategies: addresses behavior concerns by teaching school staff techniques to aid in the development of student decision making, problem solving and socialization strategies.
Evaluation of this process • An evaluation team went out to the schools with ISTs and interviewed those involved,
observed classrooms and meetings and reviewed student records. They evaluated how students were assessed and how interventions were designed, as well as other components of the program.
• The evaluation team results are used to determine what teams need additional training and in what areas. According to the authors, 98% of the schools reviewed by the teams met the requirements of the model.
Implications for Practice
• The longer the process was in place, the more students were served by the IST, from 7% of students in the first year to 11% in the third year. This may indicate that teachers are more likely to use the process after it has been in place for a longer period of time.
• Schools using the IST approach demonstrated special education referral rates that are one-half to one-third of the rates demonstrated by schools that did not use ISTs.
• Rates of grade retention over the 3-year period were reduced by as much as 67%. These lowered retention rates may be associated with lower drop out rates when the students got into high school.

169
Lau, M. Y., Sieler, J. D., Muyskens, P., Canter, A., Vankeuren, B., & Marston, D. (2006). Perspectives on the use of the Problem-Solving Model from the viewpoint of a school psychologist, administrator, and teacher from a large Midwest urban school district. Psychology in the Schools, 43, 117–127. Purpose of Paper In the Minneapolis Public School System (MPSS), the problem-solving model (PSM) was implemented for the entire district for over 10 years and steps of the process were described.
• This model can expand the role of school psychologists to become instructional consultants, provide mental health services, and act as system-change agents, as well as home-school liaisons.
• Unlike the traditional model of refer-test-place, PSM provides appropriate interventions and instructional adjustments to reduce the need for special education for at-risk students.
• The steps of problem solving are as follows. 1. Define and analyze the problem, taking into account contextual variables including
environment and instructional match. 2. Develop a hypothesis of the problem and establish which interventions can be used
to meet the student’s needs. 3. Monitor student progress on an ongoing basis and evaluate the effectiveness of the
interventions. 4. If needed, continue to follow these steps, making adjustments as appropriate.
A case study of this model is presented.
• Simon, a second-grade student. • First, a district-wide screening identified students at risk for academic failure. Simon
was below the 25th percentile (district norm) on the reading fluency probe and performed below expectations in letter–sound correspondence and work completion.

170
Implications for Practice
• Within the aforementioned district, identification of SLD has remained stable and has not increased (7% for the past 10 years).
• School psychologist o Works in assisting teachers, parents, students and staff with academic and
behavioral challenges. o Number of school psychologists employed in the district has increased (from
24 to 43 full time).
Stage 1 • data, conducted parent, teacher and student interviews and reviewed records. • Classroom teacher implemented interventions for 4 to 6 weeks, documenting RtI. • If an at-risk student does not respond adequately to the classroom interventions, he or
she moves to stage 2. Simon moved to stage 2. Stage 2 “Team Intervention Phase”
• A team comprised of various professionals including: general education teachers, social worker, school psychologists, special education teachers and speech and language pathologist.
• The students’ presenting concerns are further refined and more intensive levels of support are planned.
• Realistic goals are planned and an individualized intervention plan is developed. • Intervention is implemented for 6 to 8 weeks. Simon’s intervention included small-
group reading instruction for 45 minutes a day, a modified spelling program and individualized attention and praise for his efforts.
• Simon’s progress was monitored using CBM and based on his RtI data, the next step was determined. Some options include: recommend continuing intervention because data indicate the intervention is working, change or modify the intervention, refer the student for special education evaluation (if the student has not adequately responded to the interventions).
Stage 3 • Review stages 1 and 2 intervention data, plan and conduct a special education
evaluation incorporating all relevant data and addressing the student’s cognitive, adaptive and academic functioning.
• Cognitive, adaptive and academic functioning of a child can be determined by the school psychologist using records review, observation, work samples, interview and direct interactions with the student.
• Based on the data obtained, it was determined that Simon had a discrepancy between expected ability level and his academic skills, and his need for intervention could not be provided in the general education setting.

171
o The focus of services is on how the problem can be solved or minimized within the context rather than “how we can get the student into special education.”
• Principal o Acts as change agent. o Staff must understand that this model is a long-term commitment and not the
latest trend. o Investment of principal time is crucial.
• Special education teacher o Data are available to help create interventions for students and IEP goals for
students in special education. o Teams benefit from collaboration with special education teacher.
• Challenges were identified, and these included staff development and intervention implementation integrity (Also see Chapter 14: The Importance of Treatment Integrity in RtI Implementation, page 153.)
Simmons, D. C., Kuykendall, K., King, K., Cornachione, C., & Kameenui, E. J. (2000). Implementation of a schoolwide reading improvement model: “No one ever told us it would be this hard!” Learning Disabilities Research and Practice, 15, 92–100. Purpose of Paper A school-wide reading improvement model and its stages were discussed.
• The model is based on the following assumptions. o A multidimensional intervention is required. The intervention should be based
on research and include curriculum, instruction and assessment. o It must be built within the conditions and context of the school it is
implemented in and customized for that particular environment.

172
Stage Goals How can it be done? Stage 1: Analyze contexts and assess student performance
Determine what intervention is currently in place (materials used, organizational strategies). Assess all students’ reading performance to determine overall reading needs of school
• Conduct an internal audit of the school, looking at: goals and objectives, assessment, curriculum and instruction, administration, organization, and communication and staff development.
• Screen using CBM and DIBELS, looking at phonemic awareness, alphabetic understanding, automaticity in reading decoding.
Stage 2: Analyze individual performance and determine instructional groups
Determine student’s current level of performance and categorize students with similar performance profiles.
• Use normative information from measures and determine those at risk of reading delay, those with some risk, and those making adequate progress.
• Intensive intervention: those at greatest risk. • Strategic instruction: some risk. • Benchmark instruction: not considered at-risk.
Stage 3: Design instructional interventions for the full range of learners
Focus on the host environment and the instructional fit of the interventions. Involve all faculty members in the decisions.
• Use available research-based programs and alter variables (group size, time, etc.) to customize interventions.
• Define and establish reading goals based on research based criterion (will differ by grade).
• Monitor and document student reading performance using a centralized system.
Stage 4: Set instructional goals and monitor
Establish four weekly and long-term goals using student performance data.
• For students getting benchmark instruction, assess their reading skills quarterly.
• For those with intensive intervention, monitor progress weekly.
• With strategic intervention monitor monthly. • Weekly objectives can be obtained by
subtracting current performance from the long-term goal and dividing it by the number of weeks of instruction.
Stage 5: Evaluate effectiveness of interventions and make adjustments
Using performance on CBM and DIBELS measures, determine student rate of progress and adjust interventions based on the data.
Teachers or grade-level representatives can meet and use the data to develop more powerful interventions. A number of variables can be changed including: reducing group size, providing more intervention time, changing the materials, etc.

173
Implications for Practice • Permits school program evaluation. All students’ performances are measured, goals
are created, and interventions are established and monitored for effectiveness. (Also see Chapters 8–10: Improving Core Instruction for All Students: Tier I Application, page 75; Improving Instruction in Schools Using Supplemental Instruction: Tier II Application, page 87; Intensive Instruction: Tier III Application, page 99.)
• School administrators provided the following four lessons. 1. Implementation requires a systematic process with a well-designed reading
curriculum and ownership by all staff. 2. Resources are required to buy materials, provide training and provide ongoing
support. 3. The model must rely on student performance data to demonstrate program
effectiveness. 4. Focus and leadership are necessary. Leaders must have a strong presence and
identify some strong staff members to assume leadership roles. (Also see Chapter 15: Scaling RtI at the Systems Level, page 167.)
Telzrow, C. F., McNamara, K., & Hollinger, C. L. (2000). Fidelity of problem-solving implementation and relationship to student performance. The School Psychology Review, 29, 443–461. Issue of Concern This study reviewed the implementation of a problem-solving model called intervention-based assessment (IBA).
• The model was implemented by multidisciplinary teams (MDTs). Research Questions
• Was the model implemented correctly (what degree of fidelity)? • Did the students meet their goals? • How is the fidelity of implementation related to student outcomes?
Participants
• Data were collected in the context of a state-wide initiative. • Data were analyzed for 227 MDTs.
Methods Used to Answer the Research Questions
• Two instruments were used: o The work products submitted by the MDTs to document their problem
solving: A Problem-Solving Worksheet: behavioral description of problem,
baseline data, goals, possible reason for the problem, intervention plan,

174
treatment integrity evidence, RtI data, comparison of student data with baseline (available in Telzrow, 1995).
Evaluation Team Report Form: description and analysis of concerns affecting learning, description of interventions implemented and how they were monitored and progress monitoring data.
o The forms used by researchers to evaluate the student case information. Where each component of the model was rated on a Likert scale and a
scoring rubric. • The MDTs were asked to submit their “best” case documentation for one student to
“standardize” the cases submitted and examine the effects of IBA under the conditions judged by MDTs as the most complete implementation of the model.
• The case documentation was rated using the Likert scale and scoring rubric. Results
• Components of IBA with the highest fidelity scores were: (a) stating a behavioral definition of the problem and (b) stating a clear goal.
• “Hypothesized reason for the problem” and “treatment integrity” had the lowest mean fidelity scores.
• There was overall improvement in student performance for the 291 academic or behavioral goals set by the MDTs.
• Implementation of six of the eight components was associated with student outcomes. The two unrelated components were the ones with the lowest fidelity scores (reason for the problem, treatment integrity). Researchers agree that these two components are important (Lentz, Allen, Ehrhardt, 1996; Taylor & Miller, 1997). A possible explanation for student outcome being unrelated to these components in this study may be that the low levels of implementation fidelity were insufficient to produce a significant effect on student outcome.
• Documentation of treatment integrity was not complete, baseline measures were not properly obtained, and goals often did not have target dates. With these problems in mind, the implementation of this model fell below the desired standards. (Also see Chapter 14: The Importance of Treatment Integrity in RtI Implementation, page 153.)
Implications for Practice
• MDTs’ documentation and actions were inconsistent and had low levels of fidelity. • Precise and specific guidelines should be provided to gain more consistency across and
within sites, and teams should be adequately trained. • A standard training protocol may be used to ensure consistent training, and direct
coaching and feedback should be incorporated.

175
References
Bolt, S. E. (2005). Reflections on practice within the Heartland problem-solving model: The perceived value of direct assessment of students. The California School Psychologist, 10, 65–79.
Burns, M. & Ysseldyke, J. E. (2005). Comparison of existing response-to-intervention models to
identify and answer implementation questions. The California School Psychologist, 10, 9–20.
Deno, S., Grimes, J., Reschly, D., & Schrag, J. (2001). PSM Review Team Report: Minneapolis:
Minneapolis Public Schools. Hartman, W., & Fay, T. (1996). Cost-effectiveness of instructional support teams in Pennsylvania
(Policy Paper No. 9). Palo Alto, CA: American Institutes for Research in the Behavioral Sciences, Center for Special Education Finance.
Heartland Area Education Agency 11. (1991). Renewed service delivery system: Trial site plan,
year two. Johnston, IA: author. Heartland Area Education Agency 11. (2002). Improving children’s educational results
through data-based decision making. Johnston, IA: author. Ikeda, M. J., Grimes, J., Tilly, W. D., Allison, R., Kurns, S., & Stumme, J. (2002). Implementing
an intervention based approach to service delivery: A case example. In M. Shinn, H. Walker, & G. Stoner (Eds.), Interventions for academic and behavior problems II: Preventive and remedial approaches (pp. 53–70). Bethesda, MD: National Association of School Psychologists.
Ikeda, M. J., & Gustafson, J. K. (2002). Heartland AEA 11’s problem solving process: Impact on
issues related to special education. Research report no. 2002-01. Johnston, IA: Heartland Area Education Agency 11.
Ikeda, M. J., Tilly, W. D., Stumme, J., Volmer, L., & Allison, R. (1996). Agency-wide
implementation of problem solving consultation: Foundation, current implementation, and future directions. School Psychology Quarterly, 11, 228–243.
Kame’enui, E. J., & Simmons, D. C. (1998). Beyond effective practice to schools as host
environments: Building and sustaining a schoolwide intervention model in reading. OSSC Bulletin, 41, 3–24.

176
Kovaleski, J. F., Tucker, J. A., & Stevens, L. J. (1996). Bridging special and regular education: The Pennsylvania initiative. Educational Leadership, 53, 44–47.
Kovaleski, J. F., Tucker, J. A., & Stevens, L .J. (1996). School reform through instructional
support: The Pennsylvania Initiative (Part I). NASP Communiqué , 23, (insert). Lau, M. Y., Sieler, J. D., Muyskens, P., Canter, A., Vankeuren, B., & Marston, D. (2006).
Perspectives on the use of the Problem-Solving Model from the viewpoint of a school psychologist, administrator, and teacher from a large Midwest urban school district. Psychology in the Schools, 43, 117–127.
Marston, D., Canter, A., Lau, M., & Muyskens, P. (2002). Problem solving: Implementation and
evaluation in Minneapolis Schools. NASP Communiqu é, 30, 15–17. Marston, D., Muyskes, P., Lau, M., & Canter, A. (2003). Problem-solving model for decision
making with high incidence disabilities: The Minneapolis experience. Learning Disabilities Research and Practice, 18, 187–200.
Reschly, D. J., & Starkweather, A. R. (1997). Evaluation of an alternative special education
assessment and classification program in the Minneapolis Public Schools. Ames, IA: Iowa State University. (Study funded by the Minnesota Department of Children, Families and Learning).
Simmons, D. K., Kame’enui, E. J., & Good, R. H. (2002). Building, implementing, and
sustaining a beginning reading improvement model: Lesson learned school by school. In M. Shinn, H. Walker, & G. Stoner (Eds.), Interventions for academic and behavior problems II: Preventive and remedial approaches (pp. 537–570). Bethesda, MD: National Association of School Psychologists.
Simmons, D. C., Kuykendall, K., King, K., Cornachione, C., & Kameenui, E. J. (2000).
Implementation of a schoolwide reading improvement model: “No one ever told us it would be this hard!” Learning Disabilities Research and Practice, 15, 92–100.
Telzrow, C. F., McNamara, K., & Hollinger, C. L. (2000). Fidelity of problem-solving
implementation and relationship to student performance. The School Psychology Review, 29, 443–461.
Tilly, W. D., III, Grimes, J., & Reschly, D. (1993). Special education system reform: The Iowa
story. NASP Communiqué , 22 (1–4).

177
Chapter 16
Scaling RtI at the Systems Level As Response to Intervention (RtI) is relatively new to most schools, many educators are concerned that studies conducted by researchers at large research institutions may not be practically applicable to implementation in schools. Despite these concerns, a number of educational agencies have successfully implemented RtI on a large scale, and some have made state-wide implementation possible. (See Chapter 15: RtI Models that have Demonstrated their Effectiveness, page 165 for examples.) It is important that RtI as studied in research settings be applicable to school systems. Those professionals bridging the gap between research and practice must thoroughly understand these systems and the demands placed on them. In other words, research-validated methods must be adapted to the environment in order for them to be successful. Large-scale implementation of RtI models have been associated with reductions in special education referrals, improved student outcomes and improved system outcomes (see article summaries below). To gain significant positive outcomes, it will be important to address issues such as: the integrity with which procedures are implemented, consistency of implementation and the establishment of decision rules. Research in scaling up RtI to systems should be supported so that we can fully understand the needs of agencies when implementing RtI. For schools to successfully use RtI models, the professionals involved need to “buy in” to the process and believe that it will have a positive effect on the students and the school as a whole. It has been demonstrated that with strong leadership, support provided to the staff and adequate professional development, large-scale implementation of RtI is possible. VanDerHeyden, A. M., Witt, J. C., & Gilbertson, D. (in press). Journal of School Psychology. Issue of Concern Investigators studied the effect of the implementation of an RtI model on district-wide special education evaluation and eligibility determinations.
• An RtI model called Screening to Enhance Equitable Placement (STEEP) was examined in a district-wide field trial.
• Students moved through three tiers of intervention of increasing intensity. Students moved into the more intensive intervention tier if they did not respond adequately to the intervention in the previous tier.
• Those students who did not respond to interventions provided in the general education arena may be found eligible for more intensive interventions within special education.
• Student progress was monitored using curriculum-based measurement (CBM) and curriculum-based assessment (CBA) throughout the process, and the data were used to
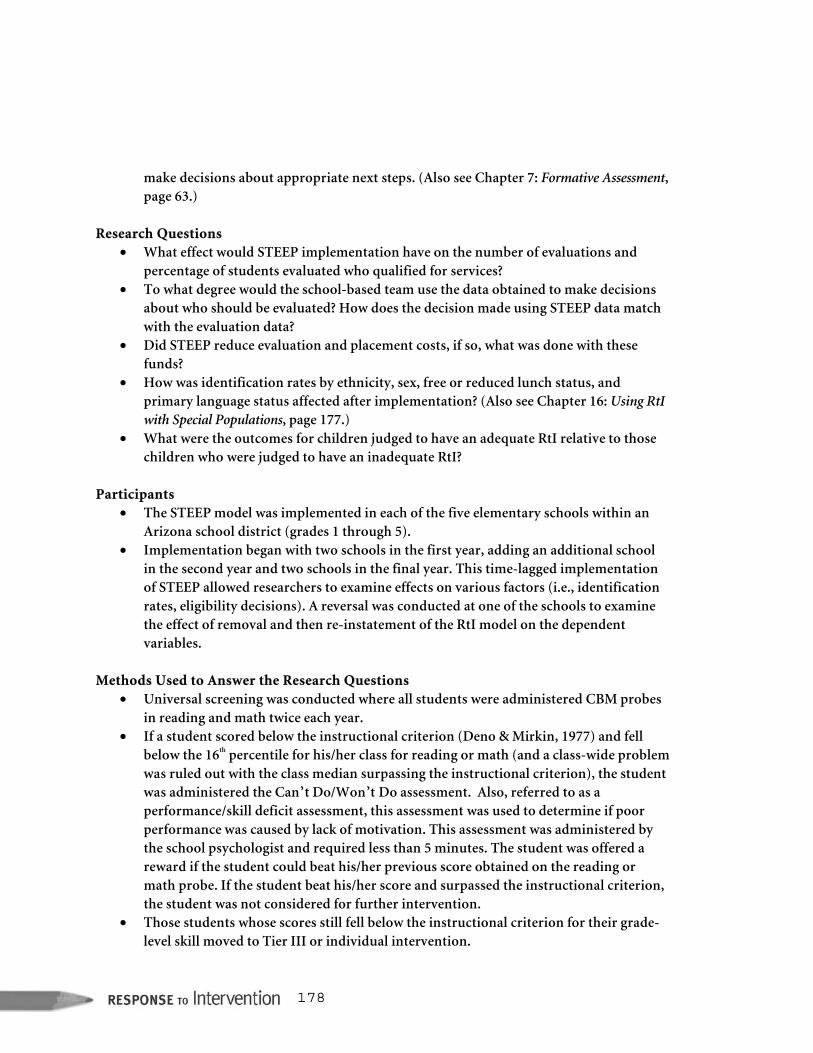
178
make decisions about appropriate next steps. (Also see Chapter 7: Formative Assessment, page 63.)
Research Questions
• What effect would STEEP implementation have on the number of evaluations and percentage of students evaluated who qualified for services?
• To what degree would the school-based team use the data obtained to make decisions about who should be evaluated? How does the decision made using STEEP data match with the evaluation data?
• Did STEEP reduce evaluation and placement costs, if so, what was done with these funds?
• How was identification rates by ethnicity, sex, free or reduced lunch status, and primary language status affected after implementation? (Also see Chapter 16: Using RtI with Special Populations, page 177.)
• What were the outcomes for children judged to have an adequate RtI relative to those children who were judged to have an inadequate RtI?
Participants
• The STEEP model was implemented in each of the five elementary schools within an Arizona school district (grades 1 through 5).
• Implementation began with two schools in the first year, adding an additional school in the second year and two schools in the final year. This time-lagged implementation of STEEP allowed researchers to examine effects on various factors (i.e., identification rates, eligibility decisions). A reversal was conducted at one of the schools to examine the effect of removal and then re-instatement of the RtI model on the dependent variables.
Methods Used to Answer the Research Questions
• Universal screening was conducted where all students were administered CBM probes in reading and math twice each year.
• If a student scored below the instructional criterion (Deno & Mirkin, 1977) and fell below the 16th percentile for his/her class for reading or math (and a class-wide problem was ruled out with the class median surpassing the instructional criterion), the student was administered the Can’t Do/Won’t Do assessment. Also, referred to as a performance/skill deficit assessment, this assessment was used to determine if poor performance was caused by lack of motivation. This assessment was administered by the school psychologist and required less than 5 minutes. The student was offered a reward if the student could beat his/her previous score obtained on the reading or math probe. If the student beat his/her score and surpassed the instructional criterion, the student was not considered for further intervention.
• Those students whose scores still fell below the instructional criterion for their grade-level skill moved to Tier III or individual intervention.

179
• The school psychologist conducted survey-level assessment to identify the student’s instructional level for the skill.
o A standard-protocol intervention was used for an instructional-level task. • The intervention required approximately 10 minutes a day for 10 to 15 days. It was
implemented in the classroom by the teacher or a peer tutor, and was monitored for integrity.
• Each week the school psychologist collected individual intervention data, entered it into the database and generated graphs for the teacher, school psychologist and principal.
• If the intervention was not implemented correctly, the school psychologist provided performance feedback (with graphs) to the teacher. The student’s progress and growth data were tracked throughout the process.
• The purpose of individual intervention was to measure the student’s RtI. The intervention was considered successful if the student scored in the instructional range for the screening probe selected for his/her grade level and made progress comparable to that of his/her classroom peers.
• The school psychologist presented the RtI data to the multidisciplinary team to determine whether or not a child should be referred for an eligibility evaluation. The team determined what additional data were needed to conduct an eligibility evaluation, which typically consisted of IQ and performance measures.
Results
• The number of special education evaluations decreased by 40 to 70% after the implementation of STEEP.
• The number of children identified as SLD in the district decreased from 6% to 3.5% in one year, and this reduction maintained over the following two years.
• In schools 1 through 3, the diagnostic hit rate was improved with the use of RtI (in other words, RtI informed referral decisions resulted in improved percent qualify numbers relative to baseline percent qualify). (Also see Chapter 6: Accuracy of Learning Disability Identification Using RtI, page 53.)
• Across three schools, the school-based team used the RtI data to make decisions about student eligibility approximately 62% of the time in the first year. In most cases where the teams did not follow the RtI data, an adequate RtI had occurred but the team decided to refer for evaluation anyway. When RtI was adequate and the team referred anyway, the percentage of qualifying cases returned to baseline levels. In the second year of implementation, team decisions corresponded to the RtI data much more frequently (better than 90%).
• Implementation of RtI positively affected over-representation of males evaluated and identified for special education.

180
Implications for Practice • Implementing an RtI model was associated with improved student outcomes. (Also see
Chapter 4: The Need to Focus on Student Outcomes, page 35.) • Results suggest that using RtI decreased the number of children identified with LD and
reduced the numbers of students referred to special education. Placement costs savings were re-allocated to intervention services.
• This study provides evidence that research-based RtI procedures may be implemented in school districts with success. (Also see Chapter 15: RtI Models that have Demonstrated their Effectiveness, page 165.)
Burns, M., Appleton, J. J., & Stehouwer, J. D. (2005). Meta-analytic review of responsiveness-to-intervention research: Examining field-based and research -implemented models. Journal of Psychoeducational Assessment, 23, 381–394. Issue of Concern Investigators reviewed articles detailing four large-scale RtI models and compared them to other models implemented for research using statistical analyses.
• Outcomes of models can be reviewed in a number of ways including: o Systematic outcomes: reviewing number of referrals for testing, students placed
in special education and students retained; and o Student outcomes: academic skills assessments, time on task and growth on a
particular skill. Research Questions
• Review research on RtI and four large-scale models to understand the following. o How effective are the large-scales models as compared to those implemented
for research purposes? o Does RtI lead to improved systematic outcomes and student outcomes? o What percentage of the students was identified with a disability using an RtI
model? Methods Used to Answer the Research Questions
• A meta-analysis was conducted. Articles on implemented RtI models were obtained and categorized as large-scale models already in practice or models implemented for research. (Also see Chapter 15: RtI Models that have Demonstrated their Effectiveness, page 165.)
• Studies were also classified under student outcomes or systematic outcomes depending on what was reported in the study.
• The effect size and the measures of central tendencies were calculated and an unbiased estimate of effect (UEE) was computed.

181
Results • Both types of models (large-scale and research-implemented) had strong effects on
student and system outcomes. • The field-based models tended to have stronger effects for systematic outcomes than
the research-implemented models. This may be due to the fact that most large-scale models have been implemented over longer periods of time. Also, schools that chose to implement these models may be more committed to this type of process.
• Results indicated that sites with RtI had improved systematic and student outcomes. Research-implemented models had slightly more improved student outcomes. Large-scale models demonstrated improvements in systematic outcomes three times larger than the research-implemented models. These results could also be related to length of implementation.
• Fewer than 2% of students were identified with LD among studies reviewing large-scale models, which are fewer students than the nation currently reports (around 5 to 5.7%). The definition of unresponsiveness and subsequent LD identification could have varied across studies.
Implications for Practice
• The implementation of RtI can be associated with improved student learning and other systemic variables.
• Results suggest that using RtI would not increase those identified with LD and reduce the numbers of students referred to special education. (Also see Chapter 1: Problems with Inaccurate and Inconsistent Identification of Students with Disabilities in Special Education, page 3.)
• It will be important to compare the research-implemented models and the large-scale models to determine the differences and their effects on outcomes (i.e., duration of implementation).
• Large-scale implementation models should address issues such as implementation integrity, implementation consistency and the use of decision rules to make equitable decisions across students and schools. If these components are not standardized, student outcomes will be variable.
Denton, C. A., Vaughn, S., & Fletcher, J. M. (2003). Bringing research-based practice in reading intervention to scale. Learning Disabilities, 18, 201–211. Purpose of the Paper Investigators discussed the large-scale implementation of effective educational innovations based on empirically validated interventions.
• Factors involved in bringing research to the schools are summarized. • The overview of effective reading practices show that the following areas should be
addressed:

182
o have an effective and knowledgeable teacher; o integrate key instructional components; o differentiate instruction for struggling readers; o use explicit instruction; o (Also see Chapters 8–10: Improving Core Instruction for All Students: Tier I
Application, page 75; Improving Instruction in Schools Using Supplemental Instruction: Tier II Application, page 87; Intensive Instruction: Tier III Application, page 99.)
• In order for the interventions to be used, the following suggestions are offered.
o Better links between researchers and teachers are needed. o Educational research and development should be supported. o Clear documentation of research-based practices should be accessible to
teachers. o (Also see Chapter 5: Major Policy Analyses Supporting Movement Toward RtI,
page 45.)
• There are some obstacles to implementing research-based practices in schools including the following.
o There is a lack of information about effective instructional practices and techniques for implementing them.
o Educators do not believe that research-based practices will work for their students. Specifically:
Some educators do not believe in conforming to research reports. Some educators do not believe that research-based practices are better
than practices currently used (Allington, 2002).
• What can be done to change this? o More effective professional development with teachers can be used to prepare
them to meet the needs of students with disabilities, particularly the following. Researchers, teachers and administrators should collaborate. Programs should more comprehensively prepare teachers. Ongoing professional development programs should better meet the
needs of practicing teachers. Implications for Practice
• School personnel and administrators must agree to follow the procedures of research-based programs with integrity. (Also see Chapter 14: The Importance of Treatment Integrity in RtI Implementation, page 153.)
• Trainers/facilitators should provide ongoing mentoring and support after the initial training and implementation.
• Practices will more likely be sustained if they are neither too vague nor too specific.

183
• There should be “buy-in” by all staff at the school and district. • The federal agencies involved in education should work together to provide research-
based services to all students. Heartland (2005). Heartland AEA 11 annual progress report. Retrieved on 7/01/06 from www.aea11.k12.ia.us/downloads/2005apr.pdf.
• The Heartland Area Education Agency 11 in Iowa has been successfully implementing an RtI model in their schools for a number of years.
• Each year the agency reports annual progress and goals for the following years. This document provides support for such a model on a large-scale basis. The Heartland Area serves 55 public school districts and 32 accredited non-public schools for a total of 320 school buildings.
• The following goals are delineated for students in Heartland. o All children will become more proficient readers. o All children’s social and emotional skills will be improved. o All schools will show continuous improvement in student achievement. o All children will become more proficient in mathematics. o All children will become more proficient in science.
• For each of the goals outlined, specific targets are set to be reached by 2009. For example, in goal l: one specific target is that 85% of kindergarten students will be proficient in phonemic awareness.
• Student progress is consistently monitored throughout the year. • Projected goals are placed on a graph along with the achieved outcomes for each year. • For each goal, data is provided in the report, achieved and predicted outcomes are
compared: o For example: Goal 1 in the 2003–2004 year:
Kindergarten students proficient in phonemic awareness, the percentage of students who earned achieved status (86%) in this area exceeded the projected goal (80.76).
For Spring Oral Reading Fluency, the percentage of first-grade students who earned achieved status (73%) was slightly lower than the projected goal (75%).
The percentage of students proficient or advanced on the ITBS measure of reading comprehension in fourth grade (79%) exceeds the projected goal (78%). In eighth grade, the projected goal was not met (achieved: 71%, projected: 76%).
In 11th grade, the students who were proficient or advanced on ITED content area reading (79%) did not meet the projected goal (81%).
• This consistent use of data enables the agency to make decisions to inform student intervention and eligibility decisions. (Also see Chapter 7: Formative Assessment, page 63.)

184
McNamara, K., & Hollinger, C. (2003). Intervention-based assessment: Evaluation rates and eligibility findings. Exceptional Children, 69, 181–194. Issues of Concern
• After an intervention-based assessment (IBA) program was implemented state-wide in Ohio, numerous variables were evaluated and compared to the previous prereferral intervention method using intervention assistance teams (IATs).
• Problem-solving assessment models, such as IBA, have been associated with an increase in services in general education and reduction in referrals (outcomes consistent with special education reform goals).
• When teachers have concerns about particular students, they make referrals to the school-based multidisciplinary teams (MDTs). Under the IBA model, these teams are required to use effective intervention, document interventions and their results, as well as continue assessment and intervention efforts until an effective intervention is found for the particular referred student.
Research Questions
• A number of variables were examined and compared to previous practices including what were:
o the proportion of students referred who were undergoing the eligibility determination process;
o the proportion of students who underwent the determination process found eligible for special education services; and
o the proportion of student who were removed from their general education environments to receive intervention services?
Participants
• Eighty schools were selected for participation in the study. • Participants all had used IAT the year preceding implementation of the IBA problem-
solving model. Methods Used to Answer the Research Questions
• Schools with IBA in place were required to participate in a state-funded evaluation of the program.
• The schools submitted information from the year prior to the implementation of IBA and the current year with IBA implementation.
• Student data forms were submitted by the MDTs. These forms included information about the number of students who had a suspected disability, those who underwent evaluation, and those students who were found eligible or ineligible for special education services. In addition, the number of students whose interventions were conducted outside of the general education setting for part of the day was reported.

185
Results • Results indicated that fewer students were discussed by the MDTs for initial problem
solving, as compared to the preceding year when the IAT was in place. These reductions may have been related to the improved validity of referrals (those students referred have been exposed to numerous interventions and still have not shown adequate progress, indicating a higher likelihood of qualifying). On the other hand, these lower rates may be attributed to the time-consuming nature of the model’s implementation, especially in the first year.
• When compared to IAT, the IBA model was associated with more referrals, leading to eligibility decisions and a lower rate of students referred who were found to be ineligible.
• Results indicated that the IBA model did not increase the number of interventions conducted within the general education setting.
Implications for Practice
• This study demonstrates the state-wide implementation of a problem-solving model and the possible outcomes after the first year.
• It is important to note that this more structured state-wide model (IBA) was compared to an earlier problem-solving type model (IAT), and not the traditional IQ-achievement discrepancy model to which others have been compared.
• It will be important to have access to effective interventions that can be conducted in the general education setting.
References Burns, M., Appleton, J. J., & Stehouwer, J. D. (2005). Meta-analytic review of responsiveness-to-
intervention research: Examining field-based and research -implemented models. Journal of Psychoeducational Assessment, 23, 381–394.
Deno, S., Grimes, J., Reschly, D., & Schrag, J. (2001). PSM Review Team Report: Minneapolis:
Minneapolis Public Schools. Denton, C. A., Vaughn, S., & Fletcher, J. M. (2003). Bringing research-based practice in reading
intervention to scale. Learning Disabilities, 18, 201–211. Hartman, W., & Fay, T. (1996). Cost-effectiveness of instructional support teams in Pennsylvania
(Policy Paper No. 9). Palo Alto, CA: American Institutes for Research in the Behavioral Sciences, Center for Special Education Finance.
Heartland Area Education Agency 11. (1991). Renewed service delivery system: Trial site plan,
year two. Johnston, IA: author.

186
Heartland Area Education Agency 11. (2002). Improving children’s educational results
through data-based decision making. Johnston, IA: author. Heartland. (2005). Heartland AEA 11 annual progress report. Retrieved on 7/01/06 from
www.aea11.k12.ia.us/downloads/2005apr.pdf. Ikeda, M. J., Grimes, J., Tilly, W. D., Allison, R., Kurns, S., & Stumme, J. (2002). Implementing
an intervention based approach to service delivery: A case example. In M. Shinn, H. Walker, & G. Stoner (Eds.), Interventions for academic and behavior problems II: Preventive and remedial approaches (pp. 53–70). Bethesda, MD: National Association of School Psychologists.
Ikeda, M. J., & Gustafson, J. K. (2002). Heartland AEA 11’s problem solving process: Impact on
issues related to special education. Research report no. 2002-01. Johnston, IA: Heartland Area Education Agency 11.
Kame’enui, E. J., & Simmons, D. C. (1998). Beyond effective practice to schools as host
environments: Building and sustaining a schoolwide intervention model in reading. OSSC Bulletin, 41, 3–24.
Kovaleski, J. F., Tucker, J. A., & Stevens, L. J. (1996). School reform through instructional
support: The Pennsylvania Initiative (Part I). NASP Communiqué , 23, (insert). Marston, D., Canter, A., Lau, M., & Muyskens, P. (2002, June). Problem solving:
Implementation and evaluation in Minneapolis Schools. NASP Communiqu é , 30 (8). Marston, D., Muyskes, P., Lau, M., & Canter, A. (2003). Problem-solving model for decision
making with high incidence disabilities: The Minneapolis experience. Learning Disabilities Research and Practice, 18, 187–200.
McNamara, K., & Hollinger, C. (2003). Intervention-based assessment: Evaluation rates and
eligibility findings. Exceptional Children, 69, 181–194. Reschly, D. J., & Starkweather, A. R. (1997). Evaluation of an alternative special education
assessment and classification program in the Minneapolis Public Schools. Ames, IA: Iowa State University. (Study funded by the Minnesota Department of Children, Families and Learning.)
Simmons, D. K., Kame’enui, E. J., & Good, R. H. (2002). Building, implementing, and
sustaining a beginning reading improvement model: Lesson learned school by school. In M. Shinn, H. Walker, & G. Stoner (Eds.), Interventions for academic and behavior

187
problems II: Preventive and remedial approaches (pp. 537–570). Bethesda, MD: National Association of School Psychologists.
Telzrow, C., McNamara, K., & Hollinger, C. L. (2000). Fidelity of problem-solving
implementation and relationship to student performance. School Psychology Review, 29, 443–461.
Tilly, W. D., III, Grimes, J., & Reschly, D. (1993, September–December). Special education
system reform: The Iowa story. NASP Communiqué , 22 (1–4). VanDerHeyden, A. M., Witt, J. C., & Gilbertson, D. (in press). Journal of School Psychology.

188

189
Chapter 17
Using RtI with Special Populations When making referrals and determining eligibility for special education, many professionals are concerned with outcomes associated with minority groups. Traditional practices of identification have led to the disproportionate identification of minority, male and English language (EL) learner students. (Also see Chapter 3: Problems with Minority Overrepresentation in the Historical Special Education System, page 25.) A further complication is that many ethnic minorities are learning English as their second language and it may be difficult to differentiate the student’s ability to learn and issues related to the acquisition of a new language. EL learners have limited exposure to the English language, and their language deficits can be confused with disability. With the implementation of a Response to Intervention (RtI) model including universal screening and a multi-tiered intervention approach, rates of referral and disproportionate qualification for special education may be reduced. Another concern is that most of the available research has been focused on developing interventions for monolingual students, while little work has been done on interventions for EL learners. Recently, investigators have turned their attention to providing such students with effective empirically based interventions. Based on the current research, there is an overall consensus that supplemental instruction is helpful for these students to make academic gains. Healy, K., Vanderwood, M., & Edelston, D. (2005). Early literacy interventions for English language learners: Support for an RtI model. The California School Psychologist, 10, 55–63. Issue of Concern The use of an RtI model with EL learners was examined.
• An assumption of RtI is that the majority of students served can benefit from intensive intervention. (Also see Chapter 10: Intensive Instruction: Tier III Application, page 99).
• Phonological awareness interventions have been shown to have a positive effect on reading performance, specifically for minority students (Morris, Tyner, & Perney, 2000).
• Phonological awareness is related to word recognition and comprehension, and these skills may transfer across languages. For example, if a Spanish-speaking child has high levels of phonological awareness in Spanish, these skills may be associated with a higher English reading ability (Lindsey, Manis, & Bailey, 2003).
Research Questions
• Can EL learners identified as at-risk readers benefit from a phonological awareness intervention delivered in English?

190
• Can monitoring the students’ RtI identify those students most in need? Participants
• All first-grade students in an urban setting were screened using a school-wide reading assessment.
• Forty-five students who were below the mastery range on the measures were given a phoneme segmentation fluency (PSF) task and a nonsense word fluency (NWF) task.
• Of those students who obtained scores below the 25th percentile and qualified for the study, 15 EL learners participated.
Methods Used to Answer the Research Questions
• A phonological awareness curriculum was used: Sounds and Letters for Readers and Spellers (Greene, 1997).
• The intervention was delivered in English in small groups with no more than five students per group. Graduate students administered the intervention twice a week for 30 minutes per session.
• Before each intervention session, each student was assessed using the PSF and NWF measures.
• After 12 sessions, those students who had met the criterion of 45 correctly segmented sounds on PSF and 50 correct letter sounds on NWF and whose trend line had exceeded the goal line, no longer received intervention and were exited from the program. Six students met the criteria, whereas nine students continued until the 25th session.
• A goal line was established for each participant by using the baseline data and the exit criteria on both measures. Trend lines for each student were calculated to compare the student’s growth each week to the growth necessary to reach the goal. (Also see Chapter 7: Formative Assessment, page 63.)
Results
• Results indicated that 12 of the 15 students met their goals on the PSF and NWF. Based on an RtI approach this would signify that the students do not have a disability and would not be eligible for additional services.
• The authors suggest the following three options for those students who did not meet their goals. 1. Continue the current intervention without changing it. 2. Try a different intervention. 3. Provide the students with a more intensive intervention.
(Also see Chapters 8–10: Improving Core Instruction for All Students: Tier I Application, page 75; Improving Instruction in Schools Using Supplemental Instruction: Tier II Application, page 87; Intensive Instruction: Tier III Application, page 99.)

191
Implications for Practice • This study supports the theory that phonological awareness interventions alone can be
beneficial for EL learners, as the students in this study significantly improved their skills.
• Furthermore, it provides preliminary evidence that interventions provided in English are helpful for EL Learners.
Vaughn, S., Mathes, P. G., Linan-Thompson, S., & Francis, D. J. (2005). Teaching English language learners at risk for reading disabilities to read: Putting research into practice. Learning Disabilities Research & Practice, 20, 58–67. Purpose of Paper Empirically validated interventions that can be used with first-grade EL learners who are at risk for reading disabilities are provided and organized.
• The authors suggest that these interventions described may be used within an RtI framework to identify EL learners who may require additional services for learning disabilities.
• The interventions described were developed in four phases.

192
Phase Description Content Strands Covered Phase 1: English intervention for at-risk students
Proactive Reading (Mathes et al., 1999) was used; daily instruction delivered in small groups, 40 minutes a day.
Phonemic awareness, letter knowledge, word recognition, connected text fluency and comprehension.
Phase 2: Language support for English intervention for EL learners
Language support activities interspersed through the Proactive Reading intervention to be sure EL learners would benefit from the curriculum. Each day, students were able to have contact with the vocabulary, language and literacy concepts in the lessons.
Activities were provided in manuals. Three types of words were targeted: words used in the directions, words use in phonemic awareness and phonics lessons. Vocabulary words in the connected text were defined.
Phase 3: Development of Spanish intervention for at-risk EL learners
The curriculum was changed in terms of sequence and focus of content but similar in instructional design and delivery.
Letter knowledge, phonemic awareness (with less emphasis), speeded syllable reading (newly added), word recognition, fluency and comprehension strategies were woven together. Presenting letter–sound correspondences represented those letters used most often in Spanish.
Phase 4: Oracy component for English and Spanish
Children for reading difficulties were also provided with an intervention that aided in language and vocabulary development, students got 50 minutes per week in small groups (3 hours per month).
Small group read aloud activity with preteaching of vocabulary, a few words were taught each day, students retold the story using the vocabulary and answered comprehension question.
• The developed interventions were implemented in numerous schools within three school districts in Texas. Two intervention studies were conducted (English and Spanish). Four hundred twenty-six bilingual students learning to read in Spanish and 216 bilingual students learning to read in English were screened for reading difficulties. The interventions lasted for 7 months in the schools.
• The critical findings were summarized in this paper and will be discussed in more details in future articles published by the author.
• For the students receiving the Spanish intervention, significant improvements on the Spanish outcome measures were noted, but these improvements were not evident on the EL learners’ outcome measures.
• When comparing the groups of students receiving intervention, consistently greater gains were obtained for students in the English intervention group relative to the

193
Spanish intervention group. Smaller differences were observed between the intervention group and the comparison group on the Spanish outcome measures.
Implications for Practice
• Interventions found to be effective with monolingual at-risk readers has proved to be beneficial for EL learners. The order in which sounds were taught and the speed of reading differed across English and Spanish interventions.
• Best practices in teaching strategies that have been shown to work with English primary children also work with EL learners. Hence, strategies such as repetitive language, routines, modeling, time to practice and discussing information with students should be incorporated into interventions with EL learners. (Also see Chapters 8–10: Improving Core Instruction for All Students: Tier I Application, page 75; Improving Instruction in Schools Using Supplemental Instruction: Tier II Application, page 87; Intensive Instruction: Tier III Application, page 99).
Gerber, M., Jimenez, T., Leafstedt, J., Villaruz, J., Richards, C., & English, J. (2004). English reading effects of small-group intensive intervention in Spanish for K-1 English learners. Learning Disabilities Research & Practice, 19, 239–251. Issues of Concern
• The core intervention model (CIM) constructed by the authors incorporated components of direct instruction and explicit error correction procedures.
• Direct instruction is used to divide skills into steps. Each step is taught until the student meets the mastery criterion. This method includes rapid pacing, individual and group response opportunities, frequent and immediate corrective feedback and contingencies to maintain motivation to respond.
Research Questions
• For students who performed most poorly on bilingual measures of phonological processing skills, will the CIM brief intervention improve student performance on English word reading tasks?
• Will these at-risk EL students catch up to their not-at-risk peers after receiving the intervention?
Participants
• This study was part of an ongoing longitudinal study. • Results were reported for 43 students for whom complete data were available for
kindergarten and first-grade years. • The students were divided into two groups with 28 students in the intervention group
and 15 in the no-intervention group. • Students in the intervention group received ten 30-minute intervention sessions.

194
• Interventions were monitored by senior researchers, who provided feedback to the tutors. Desired intervention steps were encouraged.
Methods Used to Answer the Research Questions
• All students were assessed twice a year by fluent bilingual undergraduate students. Both groups were assessed before and after the interventions each year for a total of four assessments.
• Three tasks were used: rime, onset detection and phoneme segmentation were used in both English and Spanish to measure phonological awareness in kindergarten and first grade. Based on research regarding the developmental relationship of these tasks (Christenson, 1997), two composite measures were created:
1. Early Phonological Awareness (EPA): from rime and onset measures 2. Late Phonological Awareness (LPA): a combination of both language measures
of segmentation. • English Word Attack and Letter-Word Identification subtests from the Woodcock
Johnson Tests of Achievement III (2000) were used in addition to the phonological assessments.
• In kindergarten, the intervention was presented in Spanish as they had no previous experience with English. In first grade, the intervention was provided in the language of instruction (mainly English).
Results
• At the end of kindergarten, the students in intervention had closed the performance gap with higher-performing peers by a substantial amount, and had closed the gap on many measures by the end of first grade.
• Despite significant performance differences between groups, the students with intervention caught up to their peers on all measures except for the English onset measure.
Implications for Practice
• This study indicated that supplemental interventions can be effective in supporting at-risk EL learners’ academic skills.
• The brief intensive interventions based on direct instruction are beneficial for supplementing the general education curriculum.
(Also see Chapters 8–10: Improving Core Instruction for All Students: Tier I Application, page 75; Improving Instruction in Schools Using Supplemental Instruction: Tier II Application, page 87; Intensive Instruction: Tier III Application, page 99.)
VanDerHeyden, A. M. & Witt, J. C. (2005). Quantifying context in assessment: Capturing the effect of base rates on teacher referral and a problem-solving model of identification. School Psychology Review, 34, 161–183.

195
Issue of Concern The base rate occurrence of race, sex and student achievement and its effects on the accuracy of an RtI-based identification method were examined.
• Teacher referral for eligibility determination can be problematic and can lead to inaccuracies in identification.
• Historically, once a teacher has nominated a child for referral, placement is a probable outcome.
• The problem validation screening (PVS) model is a universal screening method that uses data to make decisions about the need for intervention and eligibility determination for special education.
Research Questions
• To what degree did the proportion of high- and low-performing students, minority and male students affect the accuracy of teacher referral and PVS?
• To what degree does each screening method improve upon identification accuracy expected by chance alone?
Participants
• All students in first and second grade at an elementary school participated in the study. Methods Used to Answer the Research Questions
• All students were exposed to four screening measures: problem validation screening, teacher referral, Brigance screening tests in reading and math and a state-mandated running record assessment called the Developmental Reading Assessment.
• Those students who performed poorly on one of the screening measures received additional assessment and intervention.
• The predictive accuracy of teacher referral and the RtI-based screening model were examined.
• Criterion measures included curriculum-based assessment (CBA) with intervention, Woodcock Johnson-Revised (WJ-R, Woodcock & Johnson, 1990) and the Iowa Test of Basic Skills (ITBS, Hoover et al., 1996).
Results
• Under all circumstances (by race, sex and classroom achievement) teacher referral was less accurate than the RtI-type screening device.
• The RtI-type screening device more accurately identified referrals by sex than did teacher referral. Teachers over-referred males for evaluation.
• Teacher referral rates were a lot more variable than PVS, and teachers became less accurate when referring students for evaluation from high-achieving classrooms.

196
• Teacher referral did not maximize the number of “hits” or correct screening decisions in the sample, whereas the RtI-type screening did. Hence, the RtI-based screening device was a useful screening device and teacher referral was not.
• In this study, teachers did not disproportionately refer by race; but the RtI-based screening model was more accurate by race than was teacher referral.
Implications for Practice
• RtI-type screenings that include decision rules for universal screening and brief direct follow-up assessments to test for the influence of incentives and brief instruction on performance should be conducted to identify students in need of further intervention/assessment.
• When universal screening was combined with intervention, disproportionality was reduced.
• These results provide empirical support for the use of universal screening and multi-tiered intervention to reduce disproportionality in identification.
Gravois, T. A., & Rosenfield, S. A. (2006). Impact of instructional consultation teams on the disproportionate referral and placement of minority students in special education. Remedial and Special Education, 27, 42– 51. Issue of Concern Evaluating the effect of implementing Instructional Consultation Teams (IC Teams) on the disproportionate placement of minority students in special Education was of concern.
• Placement patterns were evaluated using three indices: o Risk indexes: Describes the percentage of a particular group that receives
special education services. To get this index, divide the number of students in a group identified in a specific category by the total enrollment of that group within the school.
Example: A risk index of 3.5 means that 3.5% of African-American students were categorized with mental retardation.
o Odds ratios: Compares the relative likelihood of referral for one group compared to another. To get this ratio, divide the risk index of one group (e.g., Mexican-American) with the risk index of another (e.g., Caucasian).
Example: An odds ratio of 1.5 means that the particular group of students is 1.5 times more likely to be evaluated for special education than the other group.
o Composition indices: Describes the percentage of special education evaluations represented by a particular subgroup. To get this ratio, divide the number of students in a given group (e.g., Mexican-American) within a category by the total number of students in that category.

197
Example: A composition index of 45% means that 45% of special education evaluations are minority students and can be understood in the context of the general population (the percentage of minority enrollment).
• The study focused on the proportion of minorities referred and placed in special education.
Research Question
• What are the patterns of referral and special education placement of minority students served by IC teams over a two-year period?
Participants
• A total of 22 schools located in five school districts served as the sample. Thirteen schools implemented IC teams during a two-year training period. The nine remaining schools served as the control group.
• The majority of students in the district were categorized as Caucasian or African-American.
Methods Used to Answer the Research Question
• Student population and referral data were collected. • Baseline data were collected before project implementation. Data were also collected
once each year during project implementation. • The data collected included:
o student population information by race; o referrals for special education evaluation by race; o number of students who qualify for special education each year by race.
• The data were divided into two categories: minority and non-minority. • Training and technical support were provided in order to develop the IC Teams at the
IC Team schools. A four-day initial training was provided, as well as an online course on instructional consulting, seven on-site training sessions, technical assistance, follow-up and program evaluation.
• IC team members received training in the following areas: o collaborative and reflective communication skills; o systematic problem-solving skills; o curriculum-based assessment; o collection, charting and analysis of classroom data.
• No specific training was provided with regard to minority students; rather the training was focused on helping all students to learn.
• Data were analyzed using the indices mentioned above (risk indices, odds ratios and composition indices).
• Data were compared within the IC Team Schools and between IC Team Schools and the control schools.

198
Results
• The risk index indicated that the evaluation of minority students decreased after two years of project implementation (but was not a significant decrease).
• After two years of project implementation, IC team schools demonstrated a significantly lower risk of referring and placing minority students in special education compared to the control schools.
• After two years of project implementation, in the IC team schools the odds ratio index demonstrated that the odds for minority students being placed in special education were half of those found in the comparison schools.
• When comparing the odds ratio index at baseline and two years after implementation, IC team schools reduced the ratio of minority referral and placement by more than half.
• Similar decreases were found when reviewing the composition indexes. Implications for Practice
• IC teams can be useful in reducing rates of minorities referred for evaluation and placed in special education.
• The various forms of reporting minority identification can lead to different interpretations of the data.
• Investigators suggest that until a standard method is established, all three forms of reporting minority identification should be reported.
References Artiles, A. J., Rueda, R., Jose Salazar, J., & Higareda, I. (2005). Within-group diversity in
minority disproportionate representation: English language learners in urban school districts. Exceptional Children, 71 (3), 283–300.
Bahr, M. W., Fuchs, D., Stecker, P. M., & Fuchs, L. S. (1991). Are teachers perceptions of
difficult-to-teach students racially biased? School Psychology Review, 20, 599–608. Berrera, M. (2006). Roles of definitional and assessment models in the identification of new or
second language learners of English for special education. Journal of Learning Disabilities, 39, 142–156.
Coutinho, M. J., Oswald, D. P., & Best, A. M. (2002). The influence of sociodemographics and
gender on the disproportionate identification of minority students as having learning disabilities. Remedial and Special Education, 23, 49–59.

199
Gerber, M., Jimenez, T., Leafstedt, J., Villaruz, J., Richards, C., & English, J. (2004). English reading effects of small-group intensive intervention in Spanish for K-1 English learners. Learning Disabilities Research & Practice, 19, 239–251.
Gravois, T. A., & Rosenfield, S. A. (2006). Impact of instructional consultation teams on the
disproportionate referral and placement of minority students in special education. Remedial and Special Education, 27, 42–51.
Healy, K., Vanderwood, M., & Edelston, D. (2005). Early literacy interventions for English
language learners: Support for an RtI model. The California School Psychologist, 10, 55–63.
Hosp, J. L., & Reschly, D. J. (2004). Disproportionate representation of minority students in
special education: Academic, demographic, and economic predictors. Exceptional Children, 70, 185–199.
Klingner, J. (2006). Cultural considerations with response to intervention models. Reading
Research Quarterly, 41, 108–117. MacMillan, D. L., Gresham, F. M., Lopez, M. F., & Bocian, K. M. (1996). Comparison of
students nominated for pre-referral interventions by ethnicity and gender. The Journal of Special Education, 30, 133–151.
Moore-Brown, B., Montgomery, J. K., Bielinksi, J., & Shubin, J. (2005). Responsiveness to Intervention: Teaching before testing helps avoid labeling. Topics in Language Disorders, 25, 148–167.
Robinson, D. R., Ward Schofield, J., & Steers-Wentzell, K. L. (2005). Peer and cross-age tutoring in math: Outcomes and their design implications. Educational Psychology Review, 17, 327–362.
Rueda, R., & Windmueller, M. P. (2006). English language learners, LD, and
overrepresentation: A multiple level analysis. Journal of Learning Disabilities, 39, 99–107. Shinn, M. R., Collins, V. L., & Gallagher, S. (1998). Curriculum-based measurement and its use
in a problem solving model with students from minority backgrounds. In S. N. Elliot & J. C. Witt (Series Eds.) & M. R. Shinn (Volume Ed.), Advanced applications of curriculum-based measurement (pp. 143–174). New York: Guilford Press.

200
Vaughn, S., Linan-Thompson, P. G., Mathees, P. T., Cirino, P. T., Carlson, C. D., Pollard-Durodola, S. D., Cardenas-Hagan, E., & Francis, D. J. (2006). Effectiveness of Spanish intervention for first-grade English language learners at risk for reading difficulties. Journal of Learning Disabilities, 39, 56–74.
Vaughn, S., Mathes, P. G., Linan-Thompson, S., & Francis, D. J. (2005). Teaching English
language learners at risk for reading disabilities to read: Putting research into practice. Learning Disabilities Research & Practice, 20, 58–67.
VanDerHeyden, A. M., & Witt, J. C. (2005). Quantifying context in assessment: Capturing the effect of base rates on teacher referral and a problem-solving model of identification. School Psychology Review, 34, 161–183.

201
Chapter 18
Evolving Issues and Cautions About RtI In 1977, the federal special education regulations defined learning disability (LD) using a discrepancy model. Shortly thereafter, the federal Office of Special Education Programs funded five Institutes for Research on Learning Disabilities (IRLD) to study various issues related to learning disabilities. The IRLD at the University of Minnesota was funded to study the diagnostic practices related to LD. It is probably accurate to say that the federal definition of LD was in place before significant research had been conducted to validate the definition. And despite the subsequent findings from the Minnesota IRLD that were critical of the discrepancy model that remained in place for almost 30 years. It is important to ensure that Response to Intervention (RtI) models do not follow a similar path. Careful, diligent and deliberate implementation is needed to ensure that the benefits of RtI implementation will be realized. As RtI implementation ensues, a scientific approach to investigation needs to be adopted. It will be important to clearly define what RtI is and how it should be implemented. Research has consistently suggested that RtI can improve student learning, but inconsistent implementation represents a significant obstacle to successful performance of RtI models. RtI’s reliance on data-based instructional decision making is scientific in nature, so it makes sense to turn the science on to the model itself and answer unresolved questions through empirical inquiry. Doing so will clarify components of the RtI model that are most critical and will increase the probability that RtI will enhance learning for all children. Burns, M. K., Vanderwood, M. L., & Ruby, S. (2005). Evaluating the readiness of prereferral intervention teams for use in a problem-solving model: Review of the three levels of research. School Psychology Quarterly, 20, 89–105. Purpose of the Paper
• New educational initiatives are valid if they have a theoretical base and have demonstrated effectiveness on both a small and large scale. (Also see Chapter 15: RtI Models That Have Demonstrated Their Effectiveness, page 165.)
Theoretical basis for prereferral intervention teams (PITs)
• Collaborative problem solving between general and special education staff can be used to serve students with disabilities and students at risk for academic difficulties.
• The team shares the belief that all children can learn. • The team’s focus is on solving the problem (not making excuses for the problem).

202
• The team uses data to identify and gauge problem-solving effectiveness. (Also see Chapter 7: Formative Assessment, page 63.)
Demonstrating effectiveness
• Measures used to demonstrate effectiveness of prereferral models include: o a measurable reduction in referral rates once the model is implemented; o measurable improvements in individual student progress as a result of
interventions. Effectiveness of systematic implementation
• PITs are not mandated by all the states. • States where PITs are mandated do not provide required procedures for
implementation. • Factors that impact PIT effectiveness include:
o the format of the team with regard to membership and assignment of roles, for specialists, special education staff, school psychologists, administrators, etc., and
o training of the PITs, focusing on academic and behavioral assessment, interventions and how to apply and follow the steps in the process.
Implications for Practice
• There is a solid theoretical foundation for the use of PITs. • Inconsistencies in their effectiveness can be attributed to design and implementation
issues, since university-guided teams were more effective than field-based teams. (Also see Chapter 14: The Importance of Treatment Integrity in RtI Implementation, page 153.)
• Inconsistent implementation could represent a significant obstacle to implementing RtI on a national level.
• Team membership, format and training are critical elements that need to be considered when implementing an effective team process.
Compton, D. L. (2006). How should “unresponsiveness” to secondary intervention be operationalized? It is all about the nudge. Journal of Learning Disabilities, 39, 170–173. Purpose of the Paper Compton summarizes presentations by Good, Torgesen, and Vellutino, at the Response-to-Intervention Symposium in 2003, entitled, “How should unresponsiveness to secondary intervention be operationlized?”
• Students learn to read, but require varying degrees of nudges. • Some children require only a slight nudge; others require continuous and intensive
nudging. • Questions that remain unanswered by RtI research include the following.

203
o Who should get the nudge? o What should the nudge be? o When should the nudge be given? o Who should provide the nudge? o And how long do they keep nudging?
Roland Good, nudge issues Measurement of early literacy skills is critical to provide the school with information so they can determine which students are at-risk and begin working with them intensively. (Also see Chapter 10: Intensive Instruction: Tier III Application, page 99.) Issues identified by Good include the following:
• Dynamic Indicators of Basic Early Literacy Skills (DIBELS) is a curriculum-based assessment recommended for easily assessing all students.
• Schools must establish benchmark scores to determine school-wide student progress. For example, a spring benchmark might be that first-grade students read 40 words correctly per minute on a first-grade-level passage.
• Using benchmarks allows the schools to gauge when students are at-risk or on track. For example, a student scoring below 20 words read correctly per minute in the spring of first grade needs more intensive reading instruction.
Good advocates for a three-tier model of services within schools, such that: • Tier I is universal (i.e., serves all children). At Tier 1, 80% of the students receive
mainstream instruction and make adequate progress. Instruction is intensive. • Tier II serves the 20% of children who did not make adequate progress at Tier I.
Instruction is more intensive, and 15% of children show an adequate response at Tier II.
• Tier III serves the 5% of students who require significantly more than mainstream instruction to make progress. Instruction is significantly more intensive than Tiers II or I. (Also see Chapters 8–10: Improving Core Instruction for All Students: Tier I Application, page 75; Improving Instruction in Schools Using Supplemental Instruction: Tier II Application, page 87; Intensive Instruction: Tier III Application, page 99.)
Frank Vellutino’s nudges Vellutino proposes that one measure could be given to kindergarten students in the fall to identify which students are at risk for reading difficulties. He recommends that the letter-naming task, the number of letter names the student reads in one minute, should be administered. Kindergarten students with the lowest letter-naming scores (those in the lowest 30%) could be identified as at-risk.
• The at-risk group of kindergarten students should receive 30 minutes of small-group intensive instruction twice per week in addition to their regular reading instruction.
• Half of the at-risk kindergarten group should enter first grade receiving daily one-on-one tutoring as a continuation of prevention services for these students.

204
Joe Torgesen’s nudges More research is needed as to how to apply RtI to older students. Issues identified by Torgesen include the following.
• Older at-risk students tend to have decoding skills, but lack comprehension skills. • A measure of reading comprehension skills must be developed that can be
administered in early grades to intervene with students. • There is a need for a standard treatment protocol to apply to language and
comprehension problems. • Intensive intervention focused on comprehension does not produce such dramatic
gains as programs focused on phonemic decoding. Implications for Practice
• In the fall of kindergarten, identifying which children need intensive instruction should be a priority.
• If we provide interventions to students through first grade, we can prevent reading difficulties from developing for many children.
• We must use a measurement tool to identify students in need of intensive intervention early, in the fall of kindergarten. Both DIBELS and letter naming were mentioned as possible tools.
• The three-tier model was recommended as a way to differentiate intensity of intervention services within a school.
• More research is needed regarding intensive reading interventions for older students. Kovaleski, J. F., Gickling, E. E., Morrow, H., & Swank, P. R. (1999). High versus low implementation of instructional support teams. Remedial and Special Education, 20, 170–183. Issue of Concern Instructional support teams (ISTs) are prereferral teams used in many schools.
• There is great variability in models and team effectiveness in improving student performance and thereby preventing students from requiring special education.
Research Question
• What are the outcomes for students referred to ISTs with high integrity of implementation versus low integrity of implementation?
Participants
• Participants included 75 students from Phase 1 schools in their first year of implementing the ISTs.
• In addition, 225 students from Phase 2 schools were included in their second year of implementing ISTs.

205
• Control students were selected as “matches” from non-IST schools and matched to all students from Phase 1 and Phase 2 schools.
• Typically performing students were selected, for every IST and non-IST student, in the same classroom, two typical students for Phase 1 schools, one typical student for Phase 2 schools.
Methods Used to Answer the Research Question
• Student observations were conducted at the point of student identification before the intervention started, during the intervention (45 days after the first observation) and after interventions were implemented by their teachers (80 days after the first identification).
• Interventions focused on reading and math concerns and only marginally on behavioral concerns.
• Academic learning time was measured as the outcome and defined as time-on-task, task completion and task comprehension.
• Observers were blind as to which of the two students was typically performing versus the at-risk student.
• IST schools were evaluated by an outside team and determined to be implementing the program at either a low or high level.
• Academic learning time was then measured and compared for all the groups, High IST Phase 1, Low IST Phase 1, High IST Phase 2 and Low IST Phase 2, Non-IST.
Results
• IST schools that implemented the program at a high level of integrity demonstrated greater student gains on the academic learning time measures compared to low-implementation IST schools and a school not implementing IST.
• Students served in low-implementation IST schools did not make any greater gains than students in schools without ISTs.
• School-based teams at the high-implementation IST schools witnessed the students identified as at-risk improve performance to approximate their peers’ performance on measures of academic learning time.
• High-implementation IST schools had strong principal leadership, collected data continuously throughout the process, using it to guide their decisions and had a strong supportive teacher who provided the intervention suggestions.
Implications for Practice The fidelity with which prereferral/IST teams are implemented has significant impact on whether or not students make progress as a result of prereferral interventions. (Also see Chapter 14: The Importance of Treatment Integrity in RtI Implementation, page 153.)
• The characteristics of the high-implementation ISTs, principal leadership, data collection and the roles that teachers play in assisting with interventions should be thoughtfully considered as critical components to prereferral team effectiveness.

206
• More research needs to be done on this topic to confirm the exact qualities that make teams effective in improving student outcomes.
• This study illustrates that integrity by outcome analyses will be important directions for future research.
Nelson, R., Smith, D. J., Taylor, L., Dodd, J. M., & Reavis, K. (1991). Pre-referral intervention: A review of the research. Education and Treatment of Children, 14, 242–253. Purpose of the Paper A review of the literature was conducted regarding prereferral intervention teams, prereferral interventions and their effectiveness in the context of three questions.
1. What is the impact of prereferral intervention teams on special education student services? 2. What is the performance of students who receive prereferral services? 3. What are the skills and attitudes of teachers that participate in the prereferral process?
Prereferral teams and their impact on special education services
• As a result of implementing prereferral teams, there were reductions in special education assessments in schools using prereferral intervention. For example:
o Sixty-three percent of students receiving prereferral intervention were not referred for special education eligibility evaluations.
o There was a 50% reduction in eligibility evaluations when prereferral intervention was implemented.
o Four in six schools in one district reduced special education evaluations and placements with the use of prereferral teams.
o There was a 40% decrease in the rate of referrals for special education evaluations in participating schools.
o At the high school level, where there are traditionally lower referral rates, there was a statistically significant decrease in referrals to special education from an average of 15 referrals per year prior to implementing the team, to 6.8 referrals in one year while implementing the team. A second high school reported a change from 13.8 referrals prior to team implementation to 5.8 referrals with team implementation.
Prereferral teams and their effect on student performance
• A series of case studies are cited reporting a reduction in the frequency of disruptive behaviors.
• The authors attribute conflicting results from other studies looking at teacher and student perceptions of improved student performance to weak research design and inadequate measurement of outcomes.

207
Prereferral teams and their effect on teacher skills and attitudes have had mixed results. • Across several studies, teachers reported that prereferral consultation was helpful. • General education teachers reported changes in targeted behaviors as a result of
mainstream consultation addressing inclusion of students with special needs (no data were provided).
• A survey (no further information about the survey was provided in the article) of state education officials reported that they knew of the prereferral requirement, but did not know the effectiveness of the prereferral intervention teams operating in the schools within their state.
• A survey of 41 general education teachers found that only 5% reported that prereferral teams gave them new intervention suggestions. However, 42% of respondents reported that they did not implement the interventions recommended, and 74% of respondents wanted the prereferral team maintained.
• Teachers in schools with low classification rates (fewer children receiving special education services) perceived system-wide (classroom, school, district) interventions to be most effective.
• Results indicated that teachers spoke with staff and parents before making a referral for a special education evaluation. It is not clear if teachers spoke with staff and parents in an effort to collaboratively develop a prereferral intervention plan.
• When teachers were given behavioral student information in the form of a written scenario, and choices for how they could respond, teachers reported that they would recommend a special education evaluation as their first choice rather than prereferral interventions.
• Teachers reported highest referral rates for behavioral concerns.
More research is needed to address specific aspects of the prereferral process. • The implementation of treatment fidelity in schools needs to be studied. • The long-term impact of preferrral interventions on student performance over time
should be addressed. • Factors influencing prereferral intervention integrity in schools should be further
researched. • Comparison of prereferral team models and training across settings and states should
be conducted. Implications for Practice
• The findings and recommendations from this article are still relevant today. • Well-trained prereferral teams can reduce the numbers of students assessed for special
education. • Prereferral teams should collect data regarding the numbers of students that are
brought to the team, but not assessed to determine their success rate and areas for improvement.

208
• Teachers may report prereferral teams as effective, but that does not mean that these teams and teachers actually implemented interventions as prescribed.
• Treatment fidelity issues can be addressed at a local level by conducting regular observations of interventions and providing teachers with feedback regarding intervention implementation. (Also see Chapter 14: The Importance of Treatment Integrity in RtI Implementation, page 153.)
• More high-quality research is needed to conclusively determine the effectiveness of prereferral teams on student outcomes.
References
Burns, M. K., Vanderwood, M. L., & Ruby, S. (2005). Evaluating the readiness of prereferral intervention teams for use in a problem-solving model: Review of the three levels of research. School Psychology Quarterly, 20, 89–105.
Compton, D. L. (2006). How should “unresponsiveness” to secondary intervention be
operationalized? It is all about the nudge. Journal of Learning Disabilities, 39, 170–173. Deno, S. L., Fuchs, L. S., Marston, D., & Shin, J. (2001). Using curriculum-based
measurement to establish growth standards for students with learning disabilities. School Psychology Review Special Issue: Mini-series: Issues in data-based decision making in special education, 30, 507–524.
Fuchs, D., & Fuchs, L. S. (1989). Exploring effective and efficient pre-referral
interventions: A component analysis of behavioral consultation. School Psychology Review, 18, 260–283.
Fuchs, D., Moch, D., Morgan, P. L., & Young, C. L. (2003). Responsiveness-to-
intervention: Definitions, evidence and implications for the learning disabilities construct. Learning Disabilities Research and Practice, 18, 157–171.
Fuchs, L. S. (2003). Assessing intervention responsiveness: Conceptual and technical
issues. Learning Disabilities: Research and Practice, 18, 172–186. Fuchs, L. S., & Fuchs, D. (1998). Treatment validity: A unifying concept for
reconceptualizing the identification of learning disabilities. Learning Disabilities Research & Practice, 13, 204–219.
Fuchs, L. S., Fuchs, D., & Prentice, K. (2004). Responsiveness to mathematical and
problem-solving instruction: Comparing students at risk of mathematics disability with and without risk of reading disability. Journal of Learning Disabilities, 37, 293–306.

209
Flugum, K. R., & Reschly, D. J. (1994). Prereferral interventions: Quality indices and
outcomes. Journal of School Psychology, 32, 1–14. Good, R. H., Simmons, D., & Kame-enui, E. (2001). The importance and decision-
making utility of a continuum of fluency-based indicators of foundational reading skills for third-grade high-stakes outcomes. Scientific Studies of Reading, 5, 257–288.
Good, R. H., Simmons, D., Kame’enui, E., & Chard, D. (December, 2003).
Operationalizing response to intervention in eligibility decisions. Paper presented at the National Research Center on Learning Disabilities Responsiveness-to-Intervention Symposium, Kansas City, MO.
Hartman, W. T., & Fay, T. A. (1996). Cost-effectiveness of instruction support teams in
Pennsylvania. Journal of Educational Finance, 21, 555–580. Kovaleski, J. F., Gickling, E. E., Morrow, H., & Swank, P. R. (1999). High versus low
implementation of instructional support teams. Remedial and Special Education, 20, 170–183.
Nelson, R., Smith, D. J., Taylor, L., Dodd, J. M., & Reavis, K. (1991). Pre-referral intervention:
A review of the research. Education and Treatment of Children, 14, 242–253. Pasternack, R. (June, 2002). Learning disabilities and early intervention strategies:
How to reform the special education referral and identification process. Testimony presented to the United States House of Representatives’ Subcommittee on Education Reform Committee on Education and the Work Force, Washington, DC.
Rock, M. L., & Zigmond, N. (2001). Intervention assistance: Is it substance or
symbolism. Preventing School Failure, 45, 153–161. Speece, D. L., & Case, L. P. (2001). Classification in context: An alternative approach to
identifying early reading disability. Journal of Educational Psychology, 93, 735–749. Speece, D. L., Case, L. P., & Molloy, D. E. (2003). Responsiveness to general education
instruction as the first gate to learning disabilities identification. Learning Disabilities Research & Practice, 18, 147–156.
Telzrow, C. F., McNamara, K., & Hollinger, C. L. (2000). Fidelity of problem-solving
implementation and relationship to student performance. School Psychology Review, 29, 443–461.

210
Tomasi, S. F., & Weinberg, S. L. (1999). Classifying children as LD: An analysis of current practice in an urban setting. Learning Disability Quarterly, 22, 31–41.
Torgesen, J. K., Alexander, A. W., Wagner, R. K., Rashotte, C. A., Voeller, K. K. S., &
Conway, T. (2001). Intensive remedial instruction for children with severe reading disabilities: Immediate and long-term outcomes for two instructional approaches. Journal of Learning Disabilities, 34, 33–58.
Torgesen, J. K., Wagner, R. K., Rashotte, C. A., Rose, E., Lindamood, P., Conway, T., & Garban,
C. (1999). Preventing reading failure in young children with phonological processing disabilities: Group and individual responses to instruction. Journal of Educational Psychology, 91, 579–593.
Vaughn, S., & Fuchs, L. S. (2003). Redefining learning disabilities as inadequate
response to instruction: The promise and potential problems. Learning Disabilities Research & Practice, 18, 137–146.
Vaughn, S., Linan-Thompson, S., & Hickman, P. (2003). Response to instruction as a
means of identifying students with reading/learning disabilities. Exceptional children, 69, 391–409.
Vellutino, F. R., Scanlon, D. M., & Sipay, E. R. (1996). Cognitive profiles of difficult to
remediate and readily remediated poor readers: Early intervention as a vehicle for distinguishing between cognitive and experimental deficits as basic causes of specific reading disability. Journal of Educational Psychology, 88, 601–638.

211
Annotated References
Chapter 1: Problems With Inaccurate And
Inconsistent Identification of Students With Disabilities In Special Education
Macmann, G. M., Barnett, D. W., Lombard, T. J., Belton-Kocher, E., & Sharpe, M. N. (1989). On
the actuarial classification of children: Fundamental studies of classification agreement. The Journal of Special Education, 23, 127–149.
MacMillan, D. L., Gresham, F. M., & Bocian, K. M. (1998). Discrepancy between definitions of
learning disabilities and school practices: An empirical investigation. Journal of Learning Disabilities, 31, 314–326.
MacMillan, D. L., & Speece, D. L. (1999). Utility of current diagnostic categories for research
and practice. In R. Gallimore & L. P. Bernheimer (Eds.), Developmental perspectives on children with high-incidence disabilities, The LEA series on special education and disability (pp. 111–133). Mahwah, NJ: Erlbaum.
Vaughn, S., & Linan-Thompson, S. (2003). What is special about special education for students
with learning disabilities? The Journal of Special Education, 37, 140–205. Chapter 2: Problems in Identification of Learning
Disabilities Using IQ-Achievement Discrepancy Aaron, P. G. (1997). The impending demise of the discrepancy formula. Review of Educational
Research, 67, 461–502.
Fletcher, J. M., Francis, D., Shaywitz, S., Lyon, G. R., Foorman, B., Stuebing, K., & Shaywitz, B. A. (1998). Intelligent testing and the discrepancy model for children with learning disabilities. Learning Disabilities Research & Practice, 13, 186–203.
Gresham, F. M., & Witt, J. C. (1997). Utility of intelligence tests for treatment planning, classification, and placement decisions: Recent empirical findings and future directions. School Psychology Quarterly, 12, 249–267.

212
Vaughn, S., Gersten, R., & Chard, D. J. (2000). The underlying message in LD intervention research: Findings from research syntheses. Exceptional Children, 67, 99–114.
Siegel, L. S. (1988). Evidence that IQ scores are irrelevant to the definition and analysis of reading disability. Canadian Journal of Psychology, 42, 201–215.
Stuebing, K., Fletcher, J., LeDoux, J., Lyon, G. R., Shaywitz, S., & Shaywitz, B. (2002). Validity of IQ-discrepancy classifications of reading disabilities: A meta-analysis. American Educational Research Journal, 39, 469–518.
Chapter 3: Problems with Minority Over-
representation in the Historical Special Education System
Bahr, M. W., & Fuchs, D., (1991). Are teachers’ perceptions of difficult-to-teach students
racially biased? School Psychology Review, 20, 599–608. Hosp, J. L., & Reschly, D. J. (2004). Disproportionate representation of minority students in
special education. Exceptional Children, 70, 185–199. MacMillan, D. L., Gresham, F. M., & Lopez, M. F. (1996). Comparison of students nominated
for pre-referral interventions by ethnicity and gender. Journal of Special Education, 30, 133–151.
Reschly, D. J., Kicklighter, R., & McKee, P. (1988a). Recent placement litigation: I. Regular
education grouping: Comparison of Marshall (1984, 1985) and Hobson (1967, 1969). School Psychology Review, 17, 9–21.
Reschly, D. J., Kicklighter, R., & McKee, P. (1988b). Recent placement litigation: III. Analysis of
differences in Larry P., Marshall and S-1 and implications for future practices. School Psychology Review, 17, 39–50.
Chapter 4: The Need to Focus on Student Outcomes National Commission on Excellence in Education (NCEE). (1983). A nation at risk: The imperative for educational reform. Washington, DC: U.S. Government Printing Office.

213
Fuchs, L. S., & Fuchs, D. (1998). Treatment validity: A unifying concept for reconceptualizing the identification of learning disabilities. Learning Disabilities Research and Practice, 13, 204–219.
Glass, G. (1983). Effectiveness of special education. Policy Studies Review, 2, 65–78. Gresham, F. (2001, August). Responsiveness to intervention: An alternative approach to the
identification of learning disabilities. In R. Bradley, L. Danielson, & D. P. Hllahan (Eds.), Identification of learning disabilities: Research in practice (pp.467–519). Mahwah, NJ: Erlbaum.
Chapter 5: Major Policy Analyses Supporting
Movement Toward RtI Lyon, G. R., Fletcher, J. M., Shaywitz, S. E., Shaywitz, B. A., Torgesen, J. K., Wood, F. B., et al.
(2001). Rethinking learning disabilities. In C. E. Finn, Jr., R. A. J. Rotherham, & C. R. Hokanson, Jr. (Eds.), Rethinking special education for a new century (pp. 259–287). Washington, DC: Thomas B. Fordham Foundation and Progressive Policy Institute.
National Association of State Directors of Special Education. (2005). Response to Intervention
Policy Considerations and Implementation. National Council of Teachers of Mathematics. Executive Summary of Principles and Standards
for School Mathematics. http://www.nctm.org/standards/12752_exec_pssm.pdf National Reading Panel. (2000). Report of the national reading panel: Teaching students to read: An
evidence-based assessment of the scientific research literature on reading and its implications for reading instruction: Reports of the subgroups. Bethesda, MD: National Institute of Child Health and Human Development, National Institutes of Health
Donovan, M. S., & Cross, C. T. (2002). Minority Students in Special and Gifted Education.
Washington, DC: National Academy Press. President’s Commission on Excellence in Special Education. A new era: Revitalizing special
education for children and their families. Rand Reading Study Group. (2002). Reading for understanding. Santa Monica, CA: RAND.

214
Chapter 6: Accuracy of Learning Disability Identification Using RtI
Fuchs, L. S. (2003). Assessing intervention responsiveness: Conceptual and technical issues.
Learning Disabilities: Research & Practice, 18, 172–186. Case, L. P., Speece, D. L., & Molloy, D. E. (2003). The validity of a response-to-instruction
paradigm to identify reading disabilities: A longitudinal analysis of individual differences and contextual factors. School Psychology Review, 32, 557–582.
Burns, M. K., & Senesac, B. K. (2005). Comparison of dual discrepancy criteria to assess
response to intervention. Journal of School Psychology, 43, 393–406. VanDerHeyden, A. M., Witt, J. C., & Naquin, G. (2003). Development of validation of a process
for screening referrals to special education. School Psychology Review, 32, 204–227. Vaughn, S., Linan-Thompson, S., & Hickman, P. (2003). Response to instruction as a means of
identifying students with reading/learning disabilities. Exceptional Children, 69, 391–409.
Chapter 7: Formative Assessment Barnett, D. W., Daly, E. J., III, Jones, K. M., & Lentz, F. E., Jr. (2004). Response to intervention:
Empirically-based special service decisions from increasing and decreasing intensity single case designs. The Journal of Special Education, 38, 66–79.
Burns, M. K. (in press). Reading at the instructional level with children identified as learning
disabled: Potential implications for response–to-intervention. School Psychology Quarterly.
Fuchs, L. S., & Fuchs, D. (1986). Effects of systematic formative evaluation: A meta-analysis.
Exceptional Children, 53, 199–208. Thurber, R. S., Shinn, M. R., & Smolkowski, K. (2002). What is measured in mathematics tests?
Construct validity of curriculum-based mathematics measures. School Psychology Review, 31, 498–513.
Ardoin, S. P., Witt, J. C., Suldo, S. M., Connell, J. E., Koenig, J. L., Resetar, J. L., et al. (2004).
Examining the incremental benefits of administering a maze and three versus one curriculum-based measurement reading probes when conducting universal screening. School Psychology Review, 33, 218–233.

215
Chapter 8: Improving Core Instruction for All
Students: Tier I Application American Institutes for Research. (1999). An educator’s guide to schoolwide reform. Arlington,
VA: Educational Research Service. Crawford, D., & Snider, V. E. (2000). Effective mathematics instruction: The importance of
curriculum. Education and Treatment of Children, 23, 122–142. Foorman, B. R., Francis, D. J., & Fletcher, J. M. (1998). The role of instruction in learning to
read: Preventing reading failure in at-risk children. Journal of Educational Psychology, 90, 37–55.
National Institute of Child Health and Human Development. (2000). Report to the National
reading panel, teaching children to read: An evidence-based assessment of the scientific research and its implications for reading instruction. Washington, DC: author.
Chapter 9: Improving Instruction in Schools Using
Supplemental Instruction: Tier II Application Fuchs, L. S., Fuchs, D., Hamlett, C. L., Hope, S. K., Hollenbeck, K. N., Capizzi, A. M., Craddock,
C. F., & Brothers, R. L. (2006). Extending responsiveness-to-intervention to math problem-solving at third grade. Teaching Exceptional Children, 38, 59–63.
Lennon, J. E., & Slesinski, C. (1999). Early intervention in reading: Results of a screening and
intervention program for kindergarten students. School Psychology Review, 28, 353–364.
McMaster, K. L., Fuchs, D., Fuchs, L. S., & Compton, D. L. (2005). Responding to nonresponders: An experimental field trial of identification and intervention methods. Exceptional Children, 71, 445–463.
Torgesen, J. K. (2002). The prevention of reading difficulties. Journal of School Psychology, 40, 7–
26. Vellutino, F. R., Scanlon, D. M., & Lyon, G. R. (2000). Differentiating between difficult-to-
remediate and readily remediated poor readers: More evidence against the IQ-achievement discrepancy definition of reading disability. Journal of Learning Disabilities, 33, 223–238.

216
Chapter 10: Intensive Instruction: Tier III
Application Good, R. H., & Kaminski, R. A. (1996). Assessment for instructional decisions: Toward a
proactive/prevention model of decision-making for early literacy skills. School Psychology Quarterly, 11, 326–336.
Lentz, F. E., & Shapiro, E. S. (1986). Functional assessment of the academic environment. School
Psychology Review, 15, 346–357. Daly, E. J., III, Witt, J. C., Martens, B. K., & Dool, E. J. (1997). A model for conducting a
functional analysis of academic performance problems. School Psychology Review, 26, 554–574.
Marston, D., Muyskens, P., Lau, M., & Canter, A. (2003). Problem-solving model for decision
making with high-incidence disabilities: The Minneapolis experience. Learning Disabilities Research & Practice, 18, 187–200.
Speece, D. L., Case, L. P., & Molloy, D. E. (2003). Responsiveness to general education
instruction as the first gate to learning disabilities identification. Learning Disabilities Research and Practice, 18, 147–156.
Chapter 11: Using RtI in Social-Emotional-
Behavioral Areas: Tier I Application Colvin, G., Sugai, G., Good, R. H., III, & Young-Yon, L. (1997). Using active supervision and
precorrection to improve transition behaviors in an Elementary School. School Psychology Quarterly, 12, 344–363.
Gettinger, M. (1988). Methods of proactive classroom management. School Psychology Review,
17, 227–242. Mayer, G. R. (1995). Preventing antisocial behavior in the schools. Journal of Applied Behavior
Analysis, 28, 467–478. Oswald, K., Safran, S., & Johanson, G. (2005). Preventing trouble: Making schools safer places
using positive behavior supports. Education and Treatment of Children, 28, 265–278.

217
Walker, H. M., Stiller, B., Serverson, H. H., Feil, E. G., & Golly, A. (1998). First step to success: Intervening at the point of school entry to prevent antisocial behavior patterns. Psychology in the Schools, 35, 259–269.
Chapter 12: Using RtI in Social-Emotional-
Behavioral Areas: Tier II Application Kelshaw-Levering, K., Sterling-Turner, H. E., Henry, J. R., & Skinner, C. H. (2000). Randomized
interdependent group contingencies: Group reinforcement with a twist. Psychology in the Schools, 37, 523–533.
Gresham, F. M., & Gresham, G. N. (1982). Interdependent, dependent, and independent group
contingencies for controlling disruptive behavior. The Journal of Special Education, 16, 101–110.
Witt, J. C., & Elliott, S. N. (1982). The response cost lottery: A time efficient and effective
classroom intervention. The Journal of School Psychology, 20, 155–161. Freeland, J. T., & Noell, G. H. (1999). Maintaining accurate math response in elementary school
students: The effects of delayed intermittent reinforcement and programming common stimuli. Journal of Applied Behavior Analysis, 32, 211–215.
Skinner, C. H., Williams, R. L., & Neddenriep, C. E. (2004). Using interdependent group-
oriented reinforcement to enhance academic performance in general education classrooms. School Psychology Review, 33, 384–397.
Chapter 13: Using RtI in Social-Emotional-
Behavioral Areas: Tier III Application Sasso, G. M., Reimers, T. M., Cooper, L. J., Wacker, D., Berg, W., Steege, M., Kelly, L., & Allaire,
A. (1992). Use of descriptive and experimental analyses to identify the functional properties of aberrant behavior in school settings. Journal of Applied Behavior Analysis, 25, 809–821.
Moore, D. W., Anderson, A., & Kumar, K. (2005). Instructional adaptation in the management
of escape-maintained behavior in a classroom. Journal of Positive Behavior Interventions, 7, 216–223.
Gresham, F. M. (2005). Response to intervention: An alternative means of identifying students
as emotionally disturbed. Education and Treatment of Children, 28, 328–344.

218
Stichter, J. P., Sasso, G. M., & Jolivette, K. (2004). Structural analysis and intervention in a school setting: Effects on problem behavior for a student with an emotional/behavioral disorder. Journal of Positive Behavior Interventions, 6, 166–177.
VanAcker, R., Boreson, L., Gable, R. A., & Potterton, T. (2005). Are we on the right course?
Lessons learned about current FBA/BIP practices in schools. Journal of Behavioral Education, 14, 35–56.
Witt, J. C., VanDerHeyden, A. M., & Gilbertson, D. (2004). Troubleshooting behavioral
interventions: A systematic process for finding and eliminating problems. School Psychology Review, 33, 363–383.
Chapter 14: The Importance of Treatment Integrity
in RtI Implementation Gresham, F. M. (1989). Assessment of treatment integrity in school consultation and
prereferral intervention. School Psychology Review, 18, 37–50.
Mortenson, B. P., & Witt, J. C. (1998). The use of weekly performance feedback to increase teacher implementation of a prereferral academic intervention. School Psychology
Review, 27, 613–628. Noell, G. H., Witt, J. C., Slider, N. J., Connell, J. E., Gatti, S. L., Williams, K. L., Koenig, J. L.,
Resetar, J. L., & Duhon, G. J. (2005). Treatment implementation following behavioral consultation in schools: A comparison of three follow-up strategies. School Psychology Review, 34, 87–106.
Witt, J. C., Noell, G. H., LaFleur, L. H., & Mortenson, B. P. (1997). Teacher usage of interventions in general education: Measurement and analysis of the independent variable. Journal of Applied Behavior Analysis, 30, 693–696.
Chapter 15: RtI Models That Have Demonstrated
Effectiveness Ikeda, M. J., Tilly, W. D., Stumme, J., Volmer, L., & Allison, R. (1996). Agency-wide
implementation of problem solving consultation: Foundation, current implementation, and future directions. School Psychology Quarterly, 11, 228–243.
Kovaleski, J. F., Tucker, J. A., & Stevens, L. J. (1996). Bridging special and regular education: The
Pennsylvania initiative. Educational Leadership, 53, 44–47.

219
Lau, M. Y., Sieler, J. D., Muyskens, P., Canter, A., Vankeuren, B., & Marston, D. (2006).
Perspectives on the use of the Problem-Solving Model from the viewpoint of a school psychologist, administrator, and teacher from a large Midwest urban school district. Psychology in the Schools, 43, 117–127.
Simmons, D. C., Kuykendall, K., King, K., Cornachione, C., & Kameenui, E. J. (2000).
Implementation of a schoolwide reading improvement model: “No one ever told us it would be this hard!” Learning Disabilities Research and Practice, 15, 92–100.
Telzrow, C. F., McNamara, K., & Hollinger, C. L. (2000). Fidelity of problem-solving
implementation and relationship to student performance. The School Psychology Review, 29, 443–461.
Chapter 16: Scaling RtI at the Systems Level VanDerHeyden, A. M., Witt, J. C., & Gilbertson, D. (in press). Journal of School Psychology. Burns, M., Appleton, J. J., & Stehouwer, J. D. (2005). Meta-analytic review of responsiveness-to-
intervention research: Examining field-based and research-implemented models. Journal of Psychoeducational Assessment, 23, 381–394.
Denton, C. A., Vaughn, S., & Fletcher, J. M. (2003). Bringing research-based practice in reading
intervention to scale. Learning Disabilities, 18, 201–211. Heartland (2005). Heartland AEA 11 annual progress report. Retrieved on 7/01/06 from
www.aea11.k12.ia.us/downloads/2005apr.pdf. McNamara, K., & Hollinger, C. (2003). Intervention-based assessment: Evaluation rates and
eligibility findings. Exceptional Children, 69, 181–194. Chapter 17: Using RtI with Special Populations Healy, K., Vanderwood, M., & Edelston, D. (2005). Early literacy interventions for English
language learners: Support for an RtI model. The California School Psychologist, 10, 55–63.
Vaughn, S., Mathes, P. G., Linan-Thompson, S., & Francis, D. J. (2005). Teaching English
language learners at risk for reading disabilities to read: Putting research into practice. Learning Disabilities Research & Practice, 20, 58–67.

220
Gerber, M., Jimenez, T., Leafstedt, J., Villaruz, J., Richards, C., & English, J. (2004). English
reading effects of small-group intensive intervention in Spanish for K-1 English learners. Learning Disabilities Research & Practice, 19, 239–251.
VanDerHeyden, A. M., & Witt, J. C. (2005). Quantifying context in assessment: Capturing the
effect of base rates on teacher referral and a problem-solving model of identification. School Psychology Review, 34, 161–183.
Gravois, T. A., & Rosenfield, S. A. (2006). Impact of instructional consultation teams on the
disproportionate referral and placement of minority students in special education. Remedial and Special Education, 27, 42– 51.
Chapter 18: Evolving Issues and Cautions about RtI Burns, M. K., Vanderwood, M. L., & Ruby, S. (2005). Evaluating the readiness of prereferral
intervention teams for use in a problem-solving model: Review of the three levels of research. School Psychology Quarterly, 20, 89–105.
Compton, D. L. (2006). How should “unresponsiveness” to secondary intervention be
operationalized? It is all about the nudge. Journal of Learning Disabilities, 39, 170–173. Kovaleski, J. F., Gickling, E. E., Morrow, H., & Swank, P. R. (1999). High versus low
implementation of instructional support teams. Remedial and Special Education, 20, 170–183.
Nelson, R., Smith, D. J., Taylor, L., Dodd, J. M., & Reavis, K. (1991). Pre-referral intervention: A
review of the research. Education and Treatment of Children, 14, 242–253.

221
Glossary
Analysis of Variance: A statistical procedure that allows researchers to compare means (averages) of different groups and determine that the means are not equal according to some level of chance (conventionally p < .05 or p < .01). Aptitude by Treatment Interactions (ATI): ATI logic contends that certain measured aptitudes (measured internal characteristics of children) can be logically matched with certain instructional approaches to produce superior learning for the student. Empirical data have failed to support this popular and logically appealing idea.
Benchmark: A standard that has been correlated to successful outcomes (e.g., 40 words read correctly per minute at the end of first grade is a performance that is correlated with later reading success; hence, it is often used as a benchmark to identify struggling readers).
Can’ t Do/Won’ t Do Assessment: This refers to as a performance/skill deficit assessment. This assessment is used to determine if poor performance is caused by lack of motivation. This assessment can be administered by the school psychologist and requires less than five minutes. The student is offered a reward if he or she can beat his/her previous score obtained on a reading or math probe. If the student beats his/her score and surpasses the instructional criterion the student will not be considered for further intervention.
Construct Validity: The degree to which the measured construct reflects the hypothetical construct. Contingencies: The environmental conditions that set the occasion for, and maintain the occurrence of, appropriate and inappropriate behaviors. Curriculum-Based Measurement (CBM): Refers to the process of brief, timed measurement of child performance using materials that either come from, or are similar to, materials used during the child’s regular instruction. CBM is used to assess a student’s level of performance as well as his/her progress toward a specific goal. CBM is standardized, may be criterion- and norm-referenced and is frequently used within most Response to Intervention (RtI) models to provide the data upon which decisions are made concerning the need for intervention, referral for evaluation and eligibility. Direct Instruction: An instructional method grounded in applied behavior analysis. Direct instruction divides skills into component skills and focuses on building fluency on each component skill in a hierarchical manner until the target skill is established. This method includes rapid pacing, individual and group response opportunities, frequent and immediate corrective feedback and contingencies to maintain motivation to respond.

222
Dual Discrepancy: Measures both performance level and growth rate and can be applied anytime (not only at the end of the intervention) to determine which students are at risk. Effect Size: Documents in standard units the practical difference between observed performance during (or effects of) treatment and control conditions. Explicit Instruction: The specific skill required is directly taught. Direct instruction is a form of explicit instruction (see Direct Instruction). Functional Behavioral Assessment (FBA): This type of assessment relies on techniques and strategies to identify the reinforcing variables that maintain problematic behaviors and to help school-based teams select interventions that alter a child’s need or motivation to engage in problematic behaviors. Function-based interventions typically include: (a) blocking access to reinforcing events contingent on display of the problem behavior; (b) providing training and support for students to display appropriate replacement behaviors; and (c) reinforcing the occurrence of the replacement behaviors with the identified reinforcer. Intensive Intervention: Interventions are considered more intensive if they require more adult supervision, an increased amount of modifications to the curriculum and many resources to conduct. IQ-Achievement Discrepancy: Historically, the means by which a student is diagnosed with a learning disability. If the student’s academic achievement scores is significantly below average for his/her age group and significantly below expected achievement based upon his/her estimated intelligence. Performance Deficit: A performance problem defined as performance lower than that expected based on the student’s capability (sometimes referred to as a motivational deficit or a “won’t do” problem). This type of learning problem requires a motivation-building intervention. Performance Feedback: Systematically measures the percentage of correctly implemented intervention steps in a protocol and provides information to the teacher (usually verbally via the consultant) about the degree to which the intervention was correctly implemented as planned along with student performance data. Performance feedback has been shown to effectively establish and maintain correct intervention implementation even when it occurs only once per week. Permanent Product: Refers to a by-product or “footprint” of the intervention that occurs when an intervention is correctly utilized. Common examples of permanent products include worksheets and behavior charts. Permanent products have been found to be a reliable indicator of treatment integrity, are more efficient to collect and less intrusive to the classroom

223
environment. The consultant can simply collect the “intervention folder” each week and compute the percentage treatment integrity based on the products contained in the folder (e.g., a correctly scored reading passage and reward chart indicates that the student received the reading intervention, the score was correctly computed and the reward was, or was not, delivered as prescribed). Predictive Validity: The degree to which the assessment or model accurately predicts student or system outcomes. Qualitative Analyses: Refers to understanding behavior in a natural setting. Methods such as interviewing, observation, ethnography, participant observation and focus groups are used. Conclusions are not arrived at by statistical methods, but the data are used to develop a theory or greater understanding of the data. Quantitative Analyses: Using data to perform statistical analyses to make inferences/estimations about a given population. Reading Maze: A reading passage with every seventh word replaced by a blank, beneath the blank are three words (with one being correct). Students are asked to read the maze passage for a set period of time (usually two minutes) and to select the correct answers as they read. At the end of the timed reading, the numbers of correctly circled responses are computed to yield a score of responses correct per two minutes. Maze performance has been found to be an accurate indicator of general reading competence and may be more powerful than oral reading fluency for children in grades 4 and up. Skill Deficit: Poor performance that is caused by lack of skill (as opposed to lack of motivation, sometimes called a “can’t do” problem). Skill deficits require skill-building interventions. Treatment Integrity: The degree to which interventions have been correctly implemented as planned. Treatment Validity or Treatment Utility: The degree to which assessment results lead to treatments that improve student learning or behavior outcomes.

224