research from genome to function: the arabidopsis
TRANSCRIPT

http://genomebiology.com/2001/3/1/research/0001.1
com
ment
reviews
reports
deposited research
interactions
inform
ation
refereed research
ResearchFrom genome to function: the Arabidopsis aquaporinsFrancoise Quigley*†, Joshua M Rosenberg‡, Yair Shachar-Hill‡ and Hans J Bohnert*§
Addresses: *Department of Biochemistry and Molecular Biophysics, University of Arizona, Tucson, AZ 85721, USA. ‡Department ofChemistry and Biochemistry, New Mexico State University, Las Cruces, NM 88011, USA.
Permanent addresses: †Laboratoire de Génetique Moléculaire des Plantes, UMR CNRS 5575, Université Joseph Fourier, 38041 Grenoble,France. §Department of Plant Biology, University of Illinois, Urbana, IL 61801, USA.
Correspondence: Hans J Bohnert. E-mail: [email protected]
Abstract
Background: In the post-genomic era newly sequenced genomes can be used to deduceorganismal functions from our knowledge of other systems. Here we apply this approach toanalyzing the aquaporin gene family in Arabidopsis thaliana. The aquaporins are intrinsic membraneproteins that have been characterized as facilitators of water flux. Originally termed major intrinsicproteins (MIPs), they are now also known as water channels, glycerol facilitators and aqua-glyceroporins, yet recent data suggest that they facilitate the movement of other low-molecular-weight metabolites as well.
Results: The Arabidopsis genome contains 38 sequences with homology to aquaporin in foursubfamilies, termed PIP, TIP, NIP and SIP. We have analyzed aquaporin family structure andexpression using the A. thaliana genome sequence, and introduce a new NMR approach for thepurpose of analyzing water movement in plant roots in vivo.
Conclusions: Our preliminary data indicate a strongly transcellular component for the flux of waterin roots.
Published: 7 December 2001
Genome Biology 2001, 3(1):research0001.1–0001.17
The electronic version of this article is the complete one and can befound online at http://genomebiology.com/2001/3/1/research/0001
© 2001 Quigley et al., licensee BioMed Central Ltd (Print ISSN 1465-6906; Online ISSN 1465-6914)
Received: 21 May 2001Revised: 3 September 2001Accepted: 8 October 2001
BackgroundThe most obvious plant characteristic - photosynthesis -
depends on terrestrial plants acquiring, transporting and
transpiring water to maintain the functional integrity of
their photosynthetic apparatus, sustain water-splitting
activity and carry out carbon dioxide fixation. There is no
growth without water movement through cells and into and
out of the plant vascular system, and most plants are
severely damaged by even a few hours of water deficit.
Evaporation is hormonally regulated through stomata,
which adjust in response to an imbalance between water
flux in the vascular system and the rate of transpiration.
Apart from the macroeconomy of water supply and alloca-
tion, we know little about how water movement is regulated
within the cell and between cells in different tissues. Until
recently, we were ignorant of the existence of proteins facil-
itating water movement [1,2], although the existence of pro-
teinaceous water channels in plants had been suggested
long ago, and received strong experimental support a
decade ago [3,4]. The discovery of a family of genes encod-
ing these protein channels, now known as aquaporins
(AQPs), had been anticipated in principle by the earlier
studies because water permeability, at least in some tissues
and cells, has characteristics that cannot be explained if the
2 Genome Biology Vol 3 No 1 Quigley et al.
lipid membrane is the sole barrier to water exchange (for
reviews see [5-8]).
In macroscopic terms, water movement through plants had
long been thought of as a biophysical problem, as a topic of
capillary resistance in pressurized pipes terminating in
‘sprinkler’ systems - the stomata - whose apertures adjust
when responding to changes in hydraulic pressure. A com-
bined pathway for water through the apoplastic (cell wall)
space and through cells, either transcellularly across the cell
wall, or through the symplast via plasmodesmata, placed
little emphasis on membrane barriers impeding such move-
ment. Reports of an energy-dependent metabolic component
to water flux and the poisoning of water flux by mercurials,
however, pointed to additional complexity. Nevertheless, the
existence of water channels does present a real puzzle, con-
sidering that water movement through simple lipid bilayers
is significant and the AQPs increase conductance by a factor
of maybe 10 (range 0 to 30) [6,8]. Model experiments with
Xenopus oocytes injected with AQP cRNA have amply con-
firmed that many AQPs do facilitate water movement. Most
important, AQP functions have been demonstrated in vivo
in plants [9-12].
Aquaporins belong to a group of often abundant membrane
proteins of molecular mass 26-35 kDa. They have six trans-
membrane � helices (TM) and two additional membrane-
embedded domains. Their amino and carboxyl termini are
located on the cytoplasmic surface of the membrane. The
amino- and carboxy-terminal halves of the polypeptide show
sequence similarity to each other and are arranged as a
tandem repeat, which apparently originated from the dupli-
cation of a half-sized gene encoding three transmembrane
domains. Each half bears one hydrophobic loop which
includes a highly, though not absolutely, conserved Asn-Pro-
Ala (NPA) motif [13,14]. The loops containing the NPA
motif, located to the carboxy-terminal side of TM2 and TM5,
respectively, overlap in the middle of the lipid bilayer (‘hour-
glass’ model) and form two hemipores that generate a
narrow channel [15-17]. Erythrocyte CHIP28 (human AQP1)
was the first AQP shown to form water-selective channels
[18]. AQP1 forms tetramers [16,17,19] but monomers alone
can facilitate water flow [20,21].
Two high-resolution X-ray structures are now available, one
for human AQP1 (HsAQP1, CHIP28) and one for the
Escherichia coli aqua-glyceroporin GLP-F [22-24], which
transports glycerol. The model for HsAQP1 outlines the pore
geometry and suggests a single-file passage of water mole-
cules while the passage of protons is prevented. The two
asparagine residues (76 and 192, both in NPA motifs) form
hydrogen bonds with a single water molecule, interrupt the
hydrogen-bonded file of water molecules in the pore, and
thus control water passage. The GLP-F structure [23]
describes a channel whose selectivity filter and pore are dif-
ferent, forming an amphipathic channel. The alkyl backbone
of the transported glycerol is adjacent to the hydrophobic
surface and the hydroxyl groups form hydrogen bonds with
the hydrophilic surfaces [23,24]. This bacterial GLP-F is
most similar to the NIP/SIP group of plant AQPs, whereas
the PIP and TIP plant AQPs are more similar to the animal
AQPs (see below). GLP-F transports ribitol and xylitol at a
rate lower than that of glycerol, adding an interesting feature
to GLP-F’s possible physiological functions. The GLP-F
structure model is consistent with a string of glycerol (or
polyol) molecules following a path that involves successive
hydrogen bonding along the channel and through the pore.
Also, induced conformation changes may determine which
metabolites (possibly including ions) pass through, provid-
ing additional flexibility and diversity. The GLP-F structure
also suggests that the center of the tetrameric complex might
constitute a different channel on its own [23]. As more struc-
ture models become available, AQP diversity is becoming
obvious because, irrespective of overall sequence homology,
the surface topographies of different AQPs as seen by atomic
force microscopy seem to vary widely [25,26]. On the basis
of deduced amino-acid sequences and one crystallographic
model [27], plant AQPs seem to include the same general
structural motifs that have been detected in mammalian and
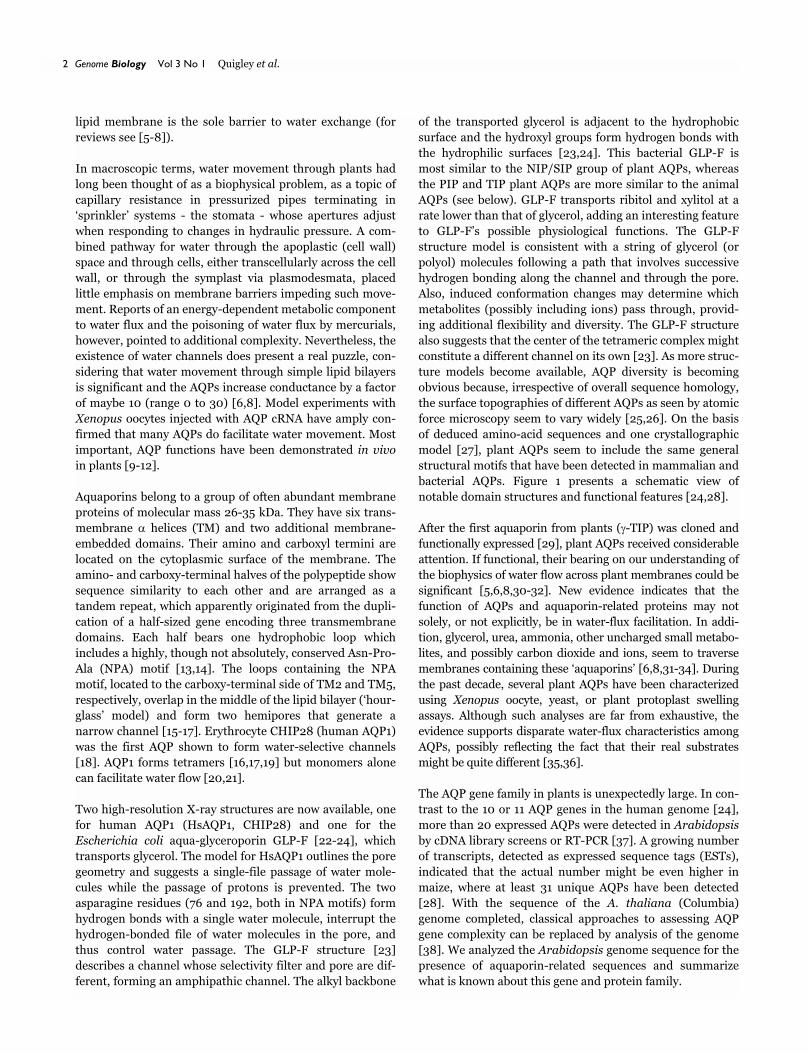
bacterial AQPs. Figure 1 presents a schematic view of
notable domain structures and functional features [24,28].
After the first aquaporin from plants (�-TIP) was cloned and
functionally expressed [29], plant AQPs received considerable
attention. If functional, their bearing on our understanding of
the biophysics of water flow across plant membranes could be
significant [5,6,8,30-32]. New evidence indicates that the
function of AQPs and aquaporin-related proteins may not
solely, or not explicitly, be in water-flux facilitation. In addi-
tion, glycerol, urea, ammonia, other uncharged small metabo-
lites, and possibly carbon dioxide and ions, seem to traverse
membranes containing these ‘aquaporins’ [6,8,31-34]. During
the past decade, several plant AQPs have been characterized
using Xenopus oocyte, yeast, or plant protoplast swelling
assays. Although such analyses are far from exhaustive, the
evidence supports disparate water-flux characteristics among
AQPs, possibly reflecting the fact that their real substrates
might be quite different [35,36].
The AQP gene family in plants is unexpectedly large. In con-
trast to the 10 or 11 AQP genes in the human genome [24],
more than 20 expressed AQPs were detected in Arabidopsis
by cDNA library screens or RT-PCR [37]. A growing number
of transcripts, detected as expressed sequence tags (ESTs),
indicated that the actual number might be even higher in
maize, where at least 31 unique AQPs have been detected
[28]. With the sequence of the A. thaliana (Columbia)
genome completed, classical approaches to assessing AQP
gene complexity can be replaced by analysis of the genome
[38]. We analyzed the Arabidopsis genome sequence for the
presence of aquaporin-related sequences and summarize
what is known about this gene and protein family.
com
ment
reviews
reports
deposited research
interactions
inform
ation
refereed research
http://genomebiology.com/2001/3/1/research/0001.3
ResultsThe Arabidopsis AQP gene familyThirty-eight AQPs and AQP-like sequences were found in
the Arabidopsis genome, ranging in size from 2 to 3 kb.
Their positions on chromosomes, accession numbers and
names are given in Table 1. The nomenclature of these genes
has been chosen such that established names are maintained
to a degree, and we label unnamed putative PIPs (for plasma
membrane intrinsic protein) as PIP, all putative TIPs (tono-
plast intrinsic protein) as TIP, and the various NLMs (for
nodulin-26-like membrane protein), whose functions are
largely unknown, are put into two subfamilies termed NIPs
and SIPs, respectively [39]. When aligned and compared by
the Clustal-X/TreeView programs [40,41], the deduced
protein sequences separated into the four major branches
(PIP, TIP, NIP and SIP; Figure 2) that fit with a preliminary
consensus on nomenclature that is developing among
workers in this field [39,42]. Included in Figure 2 are
HsAQP1 and the bacterial GLP-F protein sequences (GLP-F
E. coli) for comparison. Location of the TIP subfamily of 11
sequences in vacuole membranes has often been docu-
mented, whereas PIP location is less certain and may be
variable, depending on the conditions [32,43-45]. The group
for which the least information is available includes 14
sequences in two subfamilies - NIP (11) and SIP (3). NIP/SIP
family members show higher similarity to bacterial glycerol
facilitators than the genes in the two other groups.
HomologiesOf the four groups of Arabidopsis AQPs, identity between the
13 homologs of the PIP subfamily at the deduced amino-acid
sequence level was found to be highest, ranging from 71.8 to
97.2%. Thus, the PIP cluster is quite distinct and separate
from all other AQPs (Figure 2). The TIP subfamily was found
to have 11 members, with intra-group identities ranging from
44.1 to 93.1%. The NIP group includes 11 genes with even
lower intra-group identity scores, between 38.9 and 84.7%. In
the fourth subfamily, the three SIP genes are 28.1-71.2% iden-
tical to each other. The percent identity between sequences of
different AQP subfamilies is approximately as low as the iden-
tity between all Arabidopsis AQPs and the human AQP1 and
bacterial GLP-F. The range there is 22.1 to 33.1%. Homology
analysis showed that PIPs are 32.5-37.6% identical with TIPs,
26.8-29.3% with NIPs and 21.8-25.5% with SIPs. These find-
ings underscore the overall sequence diversity, and could indi-
cate significant functional differences.
Distribution of AQPs on the chromosomesFigure 3 shows the distribution of the 38 AQP-like sequences
on the five chromosomes of Arabidopsis [38]. AQP genes are
Figure 1Aquaporin structure. A schematic of the three-dimensional structure of AQP based on structural studies of human AQP1 and E. coli GLP-F [15,22-25,27].Transmembrane domains were determined according to [87]. The highly conserved NPA motif located in the middle of the pore is shown in blue withwhite lettering, as is the corresponding NPG motif. The charged residues Asp (D), Glu (E), Lys (K) and Arg (R) are shown in red, and Ser (S) and Thr (T)residues in blue. The latter are potential phosphorylation sites. The four Cys (C) residues are in green and His (H) in yellow.
IA H
G
Q
SG
T
G
E
F G
I
K
LP R
S
T V
A
ISG
NG
GN
R EEV
VM
NLKD
EVEQ
Q
D I H NP
RPLK KQ
DS
LL
SVS VP
I
T YL
V
N
M
Q
ND
N
V
LK F
VV
TL
A
IG
L
M
I
Y
GH
IS
N
IV
A
F
S
C
GR
PL
KQ
A
A
V
IS
T
AA
L
RF
G
D
H
D
VC S
G
K
H
D V F
I
G
S
SP
V
GS
DL
AtNIP1;1
QAT
MI
VF
Y
F
IS
G
T
D
NR A
I G
E
S
A
SS
LA
LG
LG
SV
LV
L A
A
G
R
GP
V
Y
G C Y
K
II
YLA
PL
GAA
GW
VN
T
Y
R TK
SLKTVR
IG S T
VOut
In
M
GV P
I T
P
FF L
F
F
A
V GI
W
T
V
S Q
G
L A
T
LL
A V
I
LM
T
EF
F
A
I
T
N
P
SL
A
E
V
L
A
V
L N
L
P
L
I
V
L
V
T
I
A
Y
W
PY
S
EME
H
V
A
DM
Y
D
C

4 Genome Biology Vol 3 No 1 Quigley et al.
Table 1
Metabolite facilitators (MIP, AQP, WCH) in the genome of Arabidopsis thaliana (Columbia)
Name* Synonyms† Chromo- BAC/TAC Initiation Protein Sequence cDNA§
some /P1‡ codon acession no. deduced from
PIP PIP1;1 PIP1a 3 F2A19 27798 CAB71073 Genomic P43285 (PIP1a)
PIP1;2 PIP1b, TMPA 2 F4I18 87924 AAC28529 Genomic Q06611(TMPA), CAB37860 (PIP1b)
PIP1;3 PIP1c, TMPB 1 F22L4 63093 AAF811320 Genomic S44083 (PIP1c), AAK15545 (TMPB)
PIP1;4 TMPC 4 F5I10 85662 AAF02782 Genomic BAA05654 (TMPC)
PIP1;5 4 F16G20 32842 T05378 Genomic
PIP2:1 PIP2a 3 F4P12 46124 CAB67649 Genomic P43286 (PIP2a)
PIP2;2, TMB2b/PIP2b 2 T2N18 57871 AAD18142 Genomic PIP2b (P43287), AAD18142(TMP2B)
PIP2;3 TMP2C, RD28 2 T2N18 62026 AAD18141 Genomic P30302 (TMP2C), BAA02520 (RD28)
PIP2;4 5 MUP24 18875 BAB09839 Genomic
PIP2;5 3 F28P10 83540 T06738 Genomic
PIP2;6 2 T7F6 64373 AAC79629 Genomic
PIP2;7 PIP3, SIMIP 4 M4E13 64485 CAA17774 Genomic AAB36949 (PIP3), AAB65787 (SIMIP)
PIP2;8 2 F12A24 8855 AAC64216 Genomic
TIP TIP1;1 �-TIP, RB7 2 T1J8 4486 AAD31569 Genomic P25818, CAA51171 (�-TIP), P21652 (RB7)
TIP1;2 SITIP, �-TIP2 3 MFE16 15364 BAB01832 Genomic AAB62692 (SITIP), AAC62397 (��TIP2)
TIP1;3 4 F11O4 55162 T01947 Genomic
TIP2;1 �-TIP 3 MYA6 18398 BAB01264 cDNA AAC49281 (�-TIP)
TIP2;2 4 FCA contig 8 64089 F71442 Genomic
TIP2;3 5 MNJ7 6453 BAB09071 Genomic
TIP2;x 1 F9I5 12301 AAF29403 Genomicpseudo
TIP3;1 �-TIP 1 T18K17 44536 AAF18716 cDNA P26587 (�-TIP)
TIP3;2 �-TIP 1 F2H15 11220 AAF97261 Genomic
TIP4;1 2 F17H15 38691 AAC42249 Genomic
TIP5;1 3 T21L8 81475 T12999 Genomic
NIP NIP1;1 NLM1 4 F13C5 88127 CAA16760 cDNA CAA68906 (NLM1)
NIP1;2 NLM2 4 F13C5 31021 T05028 Genomic CAC14597 (NLM2)
NIP2;1 2 T31E10 4448 T02327 Genomic
NIP2;1 2 F6K5 83258 AAC35214 Genomicpseudo
NIP3;1 1 F5M6 37156 AAG31308 Genomic
NIP3;1 2 F7O24 20942 AAD29814 Genomicpseudo
NIP4;1 5 K22F20 46984 BAB10360 Genomic
NIP4;2 5 K22F20 52013 BAB10361 Genomic
NIP5;1 4 F24G24 77092 T04053 Genomic
NIP6;1 1 F23A5 34623 AAF14664 Genomic
NIP7;1 3 F28L1 7581 AAF30303 Genomic
SIP SIP1;1 3 T6K12 86673 AAF26804 Genomic
SIP1;2 5 MRG7 79913 BAB09487 Genomic
SIP2;1 3 F24I3 7654 CAB72165 Genomic
GLPF E. coli G11514194
CHIP28 human AQP1 XM004861
*Name used in alignments (see Figure 1). †Other names in use; some sequences are from ecotypes other than Columbia. ‡BAC/TAC/P1 clone accessionnumbers. §Deduced from genome sequence.

not obviously clustered, but two regions, which resulted from a
duplication of segments in chromosomes 2 and 3, respectively,
contain a higher than normal density. In total, nine AQP
sequences were located in these two regions (PIP1;1, PIP1;2,
PIP2;1, PIP2;3, PIP2;5, PIP2;6, SIP2;1, PIP2;8 and TIP1;1).
The duplication of a segment within chromosome 1 includes
an AQP in each copy, the closely related TIP3;1 and TIP3;2.
Yet another duplication, on chromosomes 3 and 5, harbors
SIP1;2 and SIP1;1, respectively. Three AQP genes are located
within a few BAC clones from the ends of chromosomes.
PIP1;3 and NIP6;1 occupy either end of chromosome 1. PIP1;4
is located close to end of the short arm of chromosome 4. For
four genes, duplications within a short range are obvious; in-
tandem arrangements are found, namely NIP1;1 and NIP1;2
(chromosome 4), and NIP4;1 and N1P4;2 (chromosome 5),
respectively. Whereas the duplications and translocations
outline mechanisms that have contributed to the evolution of
the large AQP gene family, the large number of genes and the
transcription patterns we found in the EST database (see
below) seems to argue for specific functions in plants.
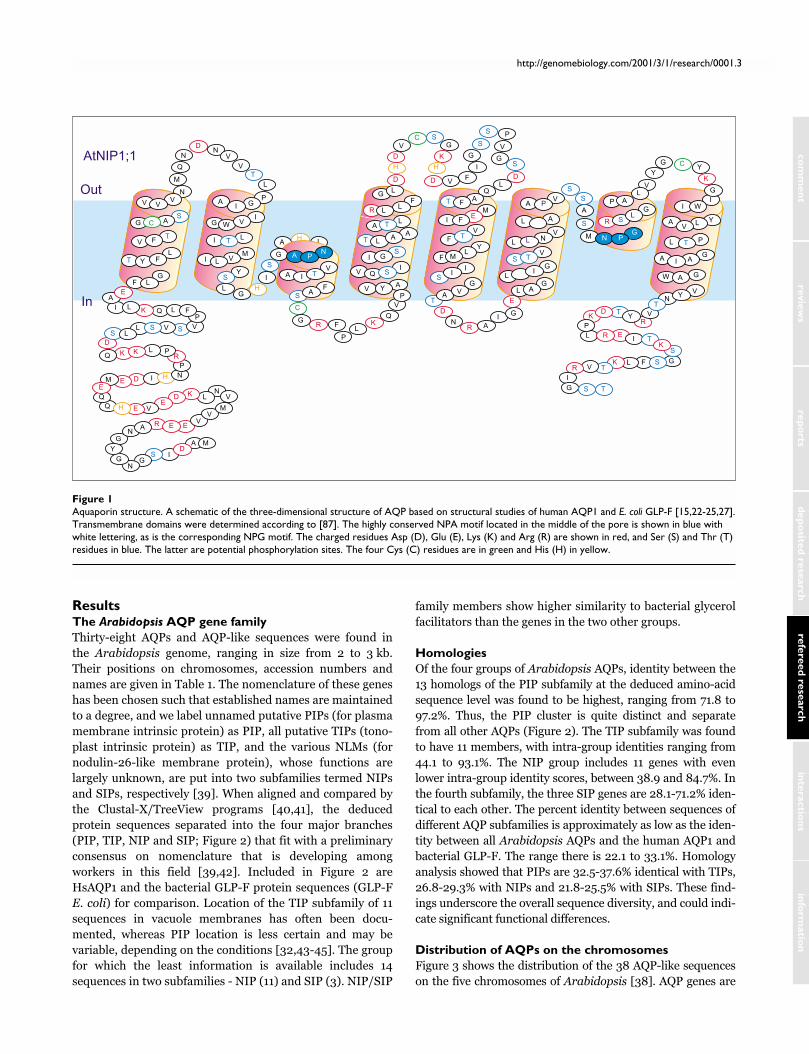
Exon-intron structureThe 38 sequences were also analyzed for distribution of
introns and exons; the results are shown in Figure 4 and
com
ment
reviews
reports
deposited research
interactions
inform
ation
refereed research
http://genomebiology.com/2001/3/1/research/0001.5
Figure 2Sequence relationships of 35 deduced A. thaliana AQP protein sequences. The tree was constructed using the Clustal-X/TreeView programs [40,41].Four subfamilies can be identified; HsAQP1 (human AQP1) and E. coli GLP-F (a glycerol facilitator protein) are included in black as outgroups. The lengthof each branch is proportional to the divergence of that protein sequence from other members of the family. The distance scale represents theevolutionary distance, expressed as the number of substitutions per amino acid. Thus each PIP is more similar to the other members of this subgroupthan are the TIPs and NIPs/SIPs.
0.1
GlpF E.coli
AtNIP7;1
AtNIP3;1
AtNIP2;1
AtNIP1;1
AtNIP1;2
AtNIP4;2
AtNIP4;1AtNIP5;1AtNIP6;1
AtSIP2;1
AtSIP1;1
AtSIP1;2
AtTIP5;1
AtTIP4;1
AtTIP2;1
AtTIP2;2
AtTIP2;3
AtTIP1;3
AtTIP1;2
AtTIP1;1AtTIP3;1
AtTIP3;2
HsAQP1
AtPIP1;5AtPIP1;3
AtPIP1;4AtPIP1;2
AtPIP1;1
AtPIP2;8AtPIP2;7
AtPIP2;5AtPIP2;6
AtPIP2;4
AtPIP2;1AtPIP2;2AtPIP2;3
PIP
TIP
NIP
SIP

Table 1. The division into four subfamilies inferred from
comparison of the deduced protein sequences (see above) is
mirrored in the intron-exon structures. PIPs invariably
include three introns. For the TIPs, two introns is usual, but
several of the genes (TIP2;3, TIP1;2, TIP2;2, TIP2;x-pseudo
and TIP1;1) have lost intron one. TIP1;3 has no introns at all
and no cDNAs or ESTs have been reported for this gene.
TIP2;x-pseudo with one intron seems to be a pseudogene
(see below). The NIP group is characterized by four introns.
NIP2;1 and NIP5;1 in this group lack intron 2, and intron 3
is missing from NIP3;1. The genes in the SIP group are char-
acterized by two introns. The intron insertion positions are
different between the four sub-groups but are conserved
within a sub-family, with the exception of PIP2;4 where
intron 2 is located at approximately the same position as the
introns 2 in TIPs. Intron length varies widely in the range of
80 to 300 nucleotides with two exceptions. Introns in
NIP4;1 are between approximately 500 and 700 nucleotides
in length and NIP5;1 is characterized by a first intron of
1,726 nucleotides. We take the number and largely con-
served location of the introns as a strong support for classi-
fying four sub-families. This grouping is also consistent with
the relative similarity of deduced amino-acid sequences and
our analysis of transcript abundance (below).
Genes and pseudogenesOur sequence analyses indicate that certain modifications of
AQP annotations should be made in the genome sequence
and also that 3 of the 38 sequences are pseudogenes. For
NIP3;1 the computer prediction omitted exon 1 and intron 1.
A methionine in exon 2 was taken instead for the start
codon. The proposed change adds 44 (exon 1) and 10 (exon
2) residues to this annotation (AAG31308). For NIP1;1, 17
residues at the amino terminus were not included in the
published deduced protein sequence (T05028 [37]). They
have been added on the basis of our examination of the
6 Genome Biology Vol 3 No 1 Quigley et al.
Figure 3Location of 38 AQP-like sequences on Arabidopsis chromosomes. In this schematic diagram of the Arabidopsis genome, chromosomes are shown asyellow bars and identified by number. The centromeric regions are indicated by numbered yellow circles including the distance from the end of the leftchromosome arm in megabases (Mb). Pairs of duplicated chromosomal regions that contain AQP genes are identified by horizontally striped coloredzones. The genes are color-coded according to their respective subfamilies: PIPs, blue; TIPs, green; NIPs, light brown; SIPs, pink. The scale at the topshows distance in Mb.
PIP2;2
Chromosome-1
PIP1;3 TIP3;2 NIP3;1 TIP2;x-pseudo TIP3;1 NIP6;1
Chromosome-5
SIP1;2 NIP4;1 NIP4;2 TIP2;3 PIP2;4
5 10 20 30Mb
Chromosome-4
PIP1;4 TIP1;3 NIP5;1 TIP2;2 NIP1;1 NIP1;2 PIP1;5
Chromosome-3
TIP1;2TIP2;1NIP7;1SIP1;1 TIP5;1
PIP1;1
PIP2;1
PIP2;5
SIP2;1
Chromosome-2
PIP1;2TIP4;1 NIP2;1-pseudoNIP3;1-pseudo NIP2;1
TIP1;1
PIP2;6
PIP2;3
PIP2;8
PIP2;7
(15)
(4)
(14)
(3)
(12)
- Duplicated regions that include AQPs
rDNA
homology of these residues with those of the closely related
NIP1;2. The genome annotation has already accommodated
this change (CAA16760). Also, we suggest a different splice
site for PIP1;4 at the carboxy-terminal end of exon 2
(AAF02782). Removing eight amino-acid residues from the
genome-deduced protein renders the sequence more like
other proteins in this group. This suggestion is supported by
cDNA sequences for PIP1;4 (TMPC; BAA05654).
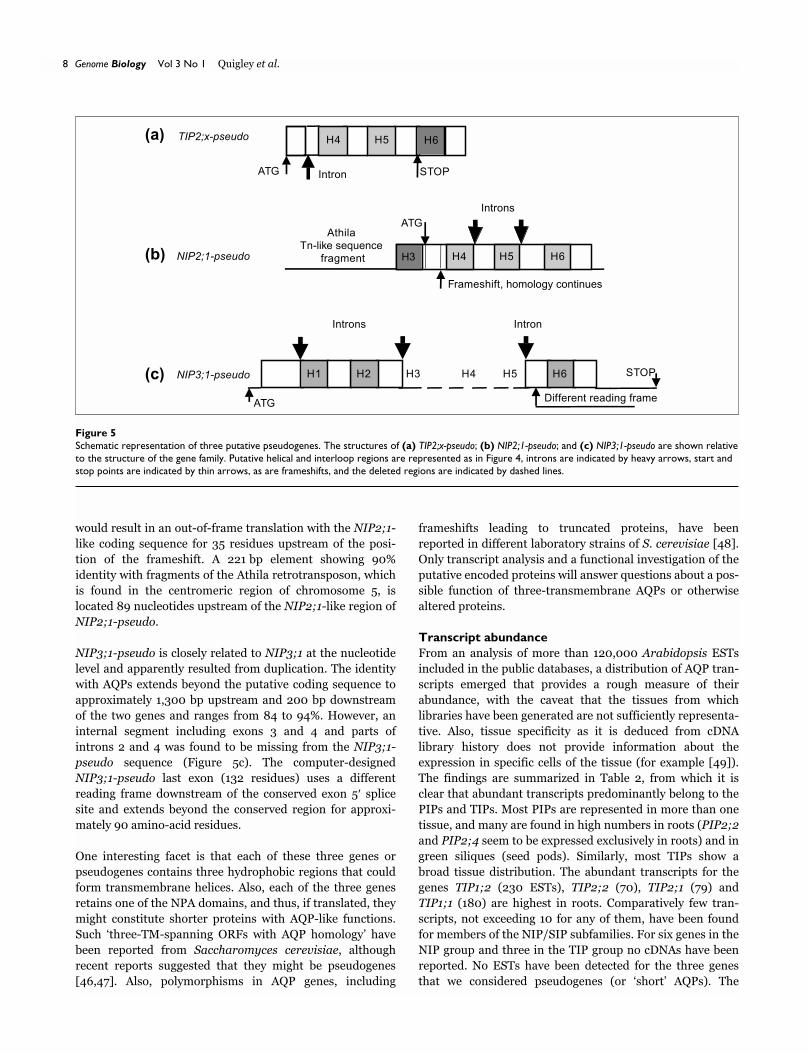
Upon close inspection, we consider three sequences as
genuine pseudogenes: NIP3;1-pseudo, NIP2;1-pseudo, and
TIP2;x-pseudo (Table 2; Figure 5a-c). ESTs or cDNA
sequences for these three genes have not been reported.
TIP2;x-pseudo seems to encode a truncated TIP-like protein
(Figure 5a). The computer-designed first exon encoding 36
residues does not show any significant homology with corre-
sponding sequences in other TIPs. The last exon is truncated
shortly before TM6 owing to an in-frame point mutation,
which introduces a stop codon at that position. Homology
with other family members continues beyond this stop
codon in a different reading frame for another 32 amino-
acid residues.
NIP2;1-pseudo seems to be a partial duplication of NIP2;1.
The predicted sequence of NIP2;1-pseudo corresponds to a
740 bp segment of NIP2;1, which includes the second half of
that gene starting at residue 4 of exon 3 and extending 60 bp
into the 3� untranslated region (3�-UTR) (Figure 5b). The
percentage identity between the duplicated segments was
found to be 96%. A single nucleotide deletion at position 105
of the homologous region results in a frameshift and the
computer-deduced amino-acid sequence uses a start codon
located 12 residues upstream from that point mutation. This
com
ment
reviews
reports
deposited research
interactions
inform
ation
refereed research
http://genomebiology.com/2001/3/1/research/0001.7
Figure 4Schematic representation of the predicted exon-intron structures of theArabidopsis AQP genes. The general layout of the coding regions of anAQP gene is shown, with the six transmembrane domains denotedH1-H6, and the interhelical loops in white. LB and LE identifyhydrophobic, pore-forming loops that include an NPA motif. The locationof the introns for each AQP subfamily is shown by colored arrows: PIPs,blue; TIPs, green; NIPs, gold; and SIPs, red. Each subfamily is characterizedby the number of introns and the locations of their insertion in the codingregions. Exceptions are indicated by the following symbols. *, Intronabsent from TIP2;2, TIP2;3, TIP1;1, TIP1;2 and TIP1;3. **, Intron absentfrom TIP1;3. +, Sliding intron in PIP2;4 (appears where intron 2 in TIPs istypically found.). ++, Intron absent from NIP2;1 and NIP5;1. #, Intronabsent from NIP3;1.
TIP
H1 H2 H3 H4 H5 H6
NPA NPA
PIP
NIP
SIP
* **
#++
LBLE
++
Table 2
Abundance of aquaporin transcripts from Arabidopsis thaliana
Name Number Gene Number Tissue of ESTs* structure of specificity†
(ecotype intronsColumbia)
PIP1;1 50 Full-length 3 R, AG, FB
PIP1;2 >100 Full-length 3 R, AG
PIP1;3 60 Full-length 3 GS, FB, AG, R, ripening fruitPIP1;4 50 Full-length 3 R, GS, FB, AG
PIP1;5 30 Full-length 3 GS, R, FB, AG
PIP2;1 ~120 Full-length 3 R, GS, FB, AG
PIP2;2 20 Full-length 3 R
PIP2;3 15 Full-length 3 R, GS
PIP2;4 26 Full-length 3 R
PIP2;5 4 Partial 3 GS
PIP2;6 25 Full-length 3 FB, AG
PIP2;7 90 Full-length 3 R, FB, GS, AG
PIP2;8 8 Partial 3 R, FB
TIP1;1 >180 Full-length 1 R, other vegetative organs
TIP1;2 >230 Full-length 1 R, AG, GS
TIP1;3 0 No cDNAs 0 -
TIP2;1 79 Full-length 2 R, FB, AG
TIP2;2 70 Full-length 1 R, AG
TIP2;3 24 Full-length 1 Whole plant‡TIP2;x-pseudo 0 No cDNAs 1 small** -
TIP3;1 9 Full-length 2 DS, GS, developing embryo
TIP3;2 10 Full-length 2 DS, rosette leaves
TIP4;1 9 Full-length 2 R
TIP5;1 0 No cDNAs 2 -
NIP1;1 8 Full-length 4 R
NIP1;2 1 Full-length 4 DS
NIP2;1 0 No cDNAs 3 -‡NIP2;1pseudo 0 No cDNAs 4 small§ -
NIP3;1 0 No cDNAs 3 -‡NIP3;1pseudo 0 No cDNAs 4 -
NIP4;1 0 No cDNAs 4 -
NIP4;2 0 No cDNAs 4 -
NIP5;1 1 Partial 4 rosette leaves
NIP5;1 1 Partial 3 R
NIP7;1 1 Partial 4 FB
SIP1;1 2 Partial 2 R, AG
SIP1;2 3 Full-length 2 R, AG
SIP2;1 9 Full-length 2 R
*Numbers of ESTs (January 2001), rounded for the most abundant ESTs,have been reported from different ecotypes. †For the ESTs, tissues usedfor cDNA library preparation are listed. R, roots; GS, green siliques; AG,above ground; FB, flower bud; DS, developing seeds. Bold letters indicatethe tissues from which ESTs encoding a particular AQP werepredominantly isolated. ‡Possible pseudogenes. §TIP2;x-pseudo and NIP2;1-pseudo include only three predicted transmembrane segments.
would result in an out-of-frame translation with the NIP2;1-
like coding sequence for 35 residues upstream of the posi-
tion of the frameshift. A 221 bp element showing 90%
identity with fragments of the Athila retrotransposon, which
is found in the centromeric region of chromosome 5, is
located 89 nucleotides upstream of the NIP2;1-like region of
NIP2;1-pseudo.
NIP3;1-pseudo is closely related to NIP3;1 at the nucleotide
level and apparently resulted from duplication. The identity
with AQPs extends beyond the putative coding sequence to
approximately 1,300 bp upstream and 200 bp downstream
of the two genes and ranges from 84 to 94%. However, an
internal segment including exons 3 and 4 and parts of
introns 2 and 4 was found to be missing from the NIP3;1-
pseudo sequence (Figure 5c). The computer-designed
NIP3;1-pseudo last exon (132 residues) uses a different
reading frame downstream of the conserved exon 5� splice
site and extends beyond the conserved region for approxi-
mately 90 amino-acid residues.
One interesting facet is that each of these three genes or
pseudogenes contains three hydrophobic regions that could
form transmembrane helices. Also, each of the three genes
retains one of the NPA domains, and thus, if translated, they
might constitute shorter proteins with AQP-like functions.
Such ‘three-TM-spanning ORFs with AQP homology’ have
been reported from Saccharomyces cerevisiae, although
recent reports suggested that they might be pseudogenes
[46,47]. Also, polymorphisms in AQP genes, including
frameshifts leading to truncated proteins, have been
reported in different laboratory strains of S. cerevisiae [48].
Only transcript analysis and a functional investigation of the
putative encoded proteins will answer questions about a pos-
sible function of three-transmembrane AQPs or otherwise
altered proteins.
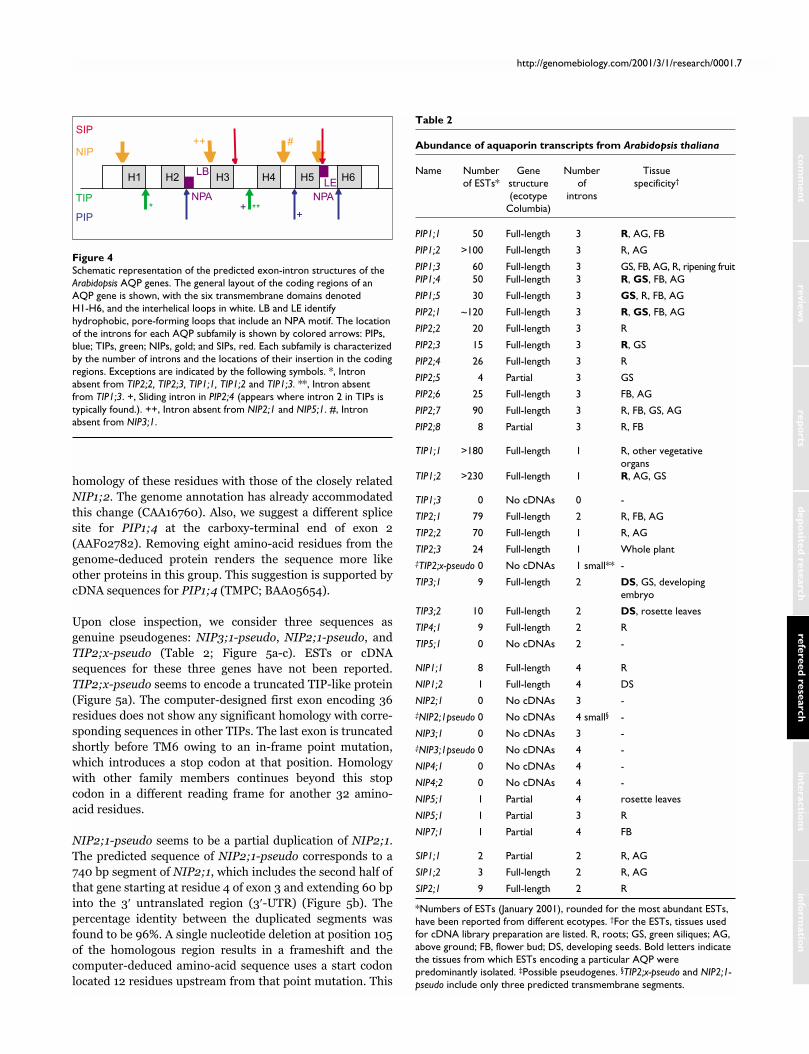
Transcript abundanceFrom an analysis of more than 120,000 Arabidopsis ESTs
included in the public databases, a distribution of AQP tran-
scripts emerged that provides a rough measure of their
abundance, with the caveat that the tissues from which
libraries have been generated are not sufficiently representa-
tive. Also, tissue specificity as it is deduced from cDNA
library history does not provide information about the
expression in specific cells of the tissue (for example [49]).
The findings are summarized in Table 2, from which it is
clear that abundant transcripts predominantly belong to the
PIPs and TIPs. Most PIPs are represented in more than one
tissue, and many are found in high numbers in roots (PIP2;2
and PIP2;4 seem to be expressed exclusively in roots) and in
green siliques (seed pods). Similarly, most TIPs show a
broad tissue distribution. The abundant transcripts for the
genes TIP1;2 (230 ESTs), TIP2;2 (70), TIP2;1 (79) and
TIP1;1 (180) are highest in roots. Comparatively few tran-
scripts, not exceeding 10 for any of them, have been found
for members of the NIP/SIP subfamilies. For six genes in the
NIP group and three in the TIP group no cDNAs have been
reported. No ESTs have been detected for the three genes
that we considered pseudogenes (or ‘short’ AQPs). The
8 Genome Biology Vol 3 No 1 Quigley et al.
Figure 5Schematic representation of three putative pseudogenes. The structures of (a) TIP2;x-pseudo; (b) NIP2;1-pseudo; and (c) NIP3;1-pseudo are shown relativeto the structure of the gene family. Putative helical and interloop regions are represented as in Figure 4, introns are indicated by heavy arrows, start andstop points are indicated by thin arrows, as are frameshifts, and the deleted regions are indicated by dashed lines.
H4 H6TIP2;x-pseudo H5
STOPATG Intron
NIP2;1-pseudo
AthilaTn-like sequence
fragment
ATG
H5 H6H4H3
Frameshift, homology continues
Introns
NIP3;1-pseudo H5
ATG
H1 H2 H6H3 STOPH4
Introns Intron
Different reading frame
(a)
(b)
(c)

pattern of transcription inferred from numbers of ESTs does
not conform to any simple functional assignment. It seems
that some AQPs carry out functions that are common to
many tissues. Others seem to be reserved for more special-
ized tasks, and the function of yet others, represented by rare
transcripts, could be required only under specific conditions
or in very few cells, which might not have been sampled by
the available cDNA libraries.
Promoter regionsIn the absence of systematic studies targeting AQP regula-
tory elements, our knowledge of the expression characteris-
tics of the AQP promoters comes almost exclusively from the
representation of transcripts in cDNA libraries (Table 2).
The regulation of transcripts in response to light or tempera-
ture, osmotic stress, high salinity, or water deficit, or in
expanding cells in and adjacent to meristems, in developing
siliques, during embryo and seed formation or in flower
structures, requires further investigation. We carried out an
in silico analysis of the Arabidopsis regions (1.5 kb)
upstream of the coding regions, and found a few putative cis-
regulatory elements. If any of these elements are functional,
they seem to be for the control of circadian and/or diurnal
rhythmicity, light-regulated expression and the binding of
Myb-type transcription factors. In fact, diurnal expression
changes in root aquaporin expression have been reported
[50]. Similar elements are also present in Mesembryanthe-
mum AQP gene promoters (J. Bennett, F.Q. and H.J.B.,
unpublished results). The literature on AQP expression - on
over 90 AQPs in more than 20 species - supports tissue-spe-
cific expression, the presence of AQPs in cells and tissues
strongly involved in water conduction, and control by hor-
monal signals [31,36,51]. ABA, auxin, light and circadian
rhythms have been shown to affect expression of individual
or groups of AQPs [6,36,52,53].
Our sequence analysis also revealed a mutator-like DNA
element [54] 178 bp upstream of the protein initiation codon
of the Arabidopsis TIP1;2 (Figure 6). TIP1;2 is the most
highly expressed AQP among the Arabidopsis ESTs. As the
MudrA transposase sequence of this element, which is adja-
cent to the TIP1;2 sequence, is transcribed from the opposite
strand, it seems that the TIP1;2 basal promoter is either
extremely compact or that intra-transposon sequences serve
a regulatory function.
We note that there has been insufficient experimental work
to allow a thorough comparison of AQP promoter sequences
in different plant families. The protein encoded by AtPip2;2
is most closely related to McMipB from M. crystallinum (the
ice plant). In this plant, McMIPB is highly expressed in the
root vasculature although not in the primary meristem of the
root [55]. When the promoter of McMipB is transferred into
either tobacco (to drive �-glucuronidase (GUS) expression)
or Arabidopsis (to drive green fluorescent protein (GFP)
expression), this expression pattern is largely conserved
([56], and S. Luan, H.J.B. and D.W. Galbraith, unpublished
results). There is, however, no recognizable sequence con-
servation between the ice plant McMipB and the Arabidop-
sis AtPIP1;5 promoters. Similar high protein homology
exists between AtTIP1;3 and ice plant McMIPI without rec-
ognizable homology in their respective 5� regulatory regions.
Deduced proteinsFrom our examination of the genomic sequence, Arabidopsis
AQPs are predicted to be between 240 (SIP1;1) and 323
(NIP3;1) amino acids long (Table 3). This range compares to
269 amino acids for HsAQP1 and 281 amino acids for E. coli
GLP-F. Of exceptional length are the yeast Fps1p (NP013057)
and the Drosophila BiB (AAF52844), containing 669 and
696 residues, respectively, in which the amino-terminal por-
tions show homology with AQPs. In the deduced amino-acid
sequences we found little variation in the length of loops
between the six TMs, variations are largely restricted to the
amino terminus of the proteins (Table 3; see also [57]). The
PIPs were observed to have two different amino-terminal
extensions, one approximately 50, the second approximately
30 amino-acid residues longer than the AQPs with the short-
est amino terminus (SIP1;2, SIP2;1). Amino termini of the
TIPs are predicted to be 10-15 residues long. Sequence
analysis showed a higher variability in the NIP/SIP classes.
Among the SIPs there is no extension, the putative start of
TM1 is about five residues downstream of the amino termi-
nus. In the NIP class, NIP5;1 has approximately 70 addi-
tional amino acids at the amino terminus and shorter
com
ment
reviews
reports
deposited research
interactions
inform
ation
refereed research
http://genomebiology.com/2001/3/1/research/0001.9
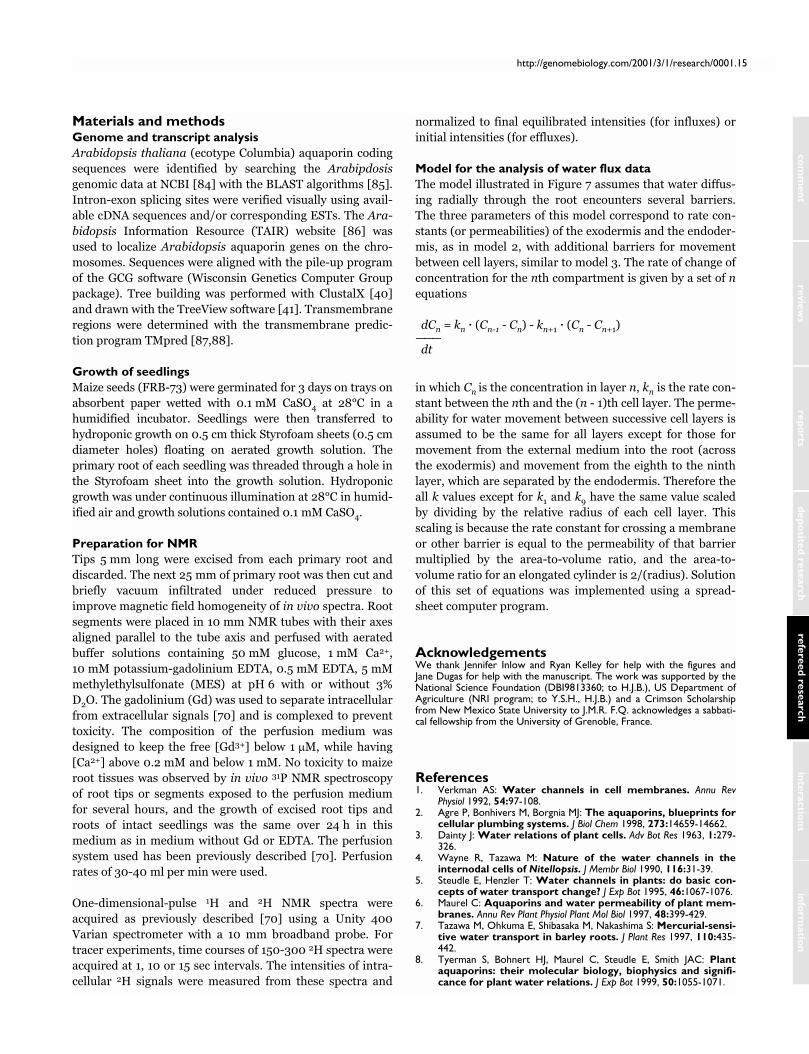
Figure 6An in vivo NMR spectrum of maize root segments. The two 1H signals arefrom water inside and outside the cells. The extracellular signal includesboth the perfusing medium and the apoplast. Separation is achieved by theuse of nontoxic paramagnetic complexes (here Gd-EDTA) such as thoseused for MRI in humans. The spectrum is recorded in less than 1 sec andallows accurate volume measurement for following osmotic shrinkage andswelling in vivo or for magnetic labeling experiments [70] that allowexchange rates in and out of cells to be determined. The same type ofspectrum can be recorded to show the distribution of any small moleculethat gives an NMR signal (that is, almost all biologically important ions andmetabolites). By adding tracer quantities of D2O and recording 2H NMRspectra, the flux of water into the root cells can be followed.
In vivo deuterium NMR spectrum of maize roots
Extracellular signal
Intracellular signal
3 2 1 0 –1 –2 –3 ppm
extensions of around 40 residues characterize others in this
group. Among those, the amino terminus of NIP6;1 has
some characteristics of a mitochondrial signal peptide
sequence - a series of positive charges separated by two to
four amino acids. This segment could form an amphipathic
helix, but no studies have been carried out on the function of
this sequence.
An analysis of the amino- and carboxy-terminal regions and
of loops that connect the putative TM helices did not reveal
any obvious domains. One characteristic specific for the PIP
group seems to be that the amino-terminal region of 20-30
residues is invariably terminated by a string of three proline
residues. It is highly probable that this would affect the orien-
tation of the amino terminus with respect to the rest of the
protein but a function, if any, for such a domain is not known.
Inferences about functionally important AQP residuesThe characteristics of a water channel and residues that dis-
tinguish a true water facilitator from a glycerol facilitator
have previously been analyzed by comparing sequences of
AQPs with known functions [58]. That comparison resulted
in the identification of a few invariant or nearly invariant
residues in AQPs and glycerol facilitators on the basis of 153
sequences ranging from bacteria to humans but including
only a few plant AQPs. We applied this analysis to the entire
Arabidopsis AQP gene family, and the results are shown in
Table 4. The PIP and TIP classes were found to fall clearly in
the ‘AQP-type’ family group (Table 4). Recently, another
indicator residue has been pointed out in TM6 - the conser-
vation of a (Y/F)(L/I/W) pair in this helix [31]. All TIPs and
PIPs were found to show the pair YW and FW. Like the TIPs,
the SIP group was found to contain YW residues in this posi-
tion, but only further experiments can show whether these
residues are sufficient to locate the protein to the tonoplast or
whether they might be determinants of substrate specificity.
In NIP7;1 the pair is YM, whereas the remainder of sequences
in the NIP group include (Y)(L/I) in this position, which
might assign them to the plasma membrane. In the case of
the NIP subfamily characters emerge that are a composite of
the AQP and GLP groupings, and the subfamily SIP shows
even stronger similarities to both GLP and AQP types. We
found that the pore-defining NPA motifs [23] are absolutely
conserved among the predicted amino-acid sequences of PIPs
and TIPs but vary in the NIPs and SIPs. This may also be sig-
nificant in determining substrate selectivity.
Phosphorylation sites have been identified in several AQPs
by Johansson et al. [31]. They identified conserved residues
(indicated in bold type below) in a loop following the first
NPA motif (R-K-X-S-X-X-R/K) and close to the carboxyl
terminus (K-K/X-X-X-S-X-R/K-S). We analyzed the pre-
dicted amino-acid sequences of the Arabidopsis AQPs for
such motifs. A site with the sequence R-K-X-S-X-X-R is
present at the internal loop in most PIPs. The exceptions are
AtPIP2;7 (GKXSXXR) and AtPIP2;6 (SKXSXXK). Seven
out of 11 PIPs were found to contain the predicted sequence
KXXXSXRS at the carboxyl terminus. Four TIPs (TIP3;1,
3;2, 4;1, 5;1) include a sequence reminiscent of the consen-
sus at the putative internal phosphorylation site (G/R-
K/R/H-X-S/T-X-X-R/T) but all TIPs lack such a site at
their carboxyl terminus. No such internal site is found
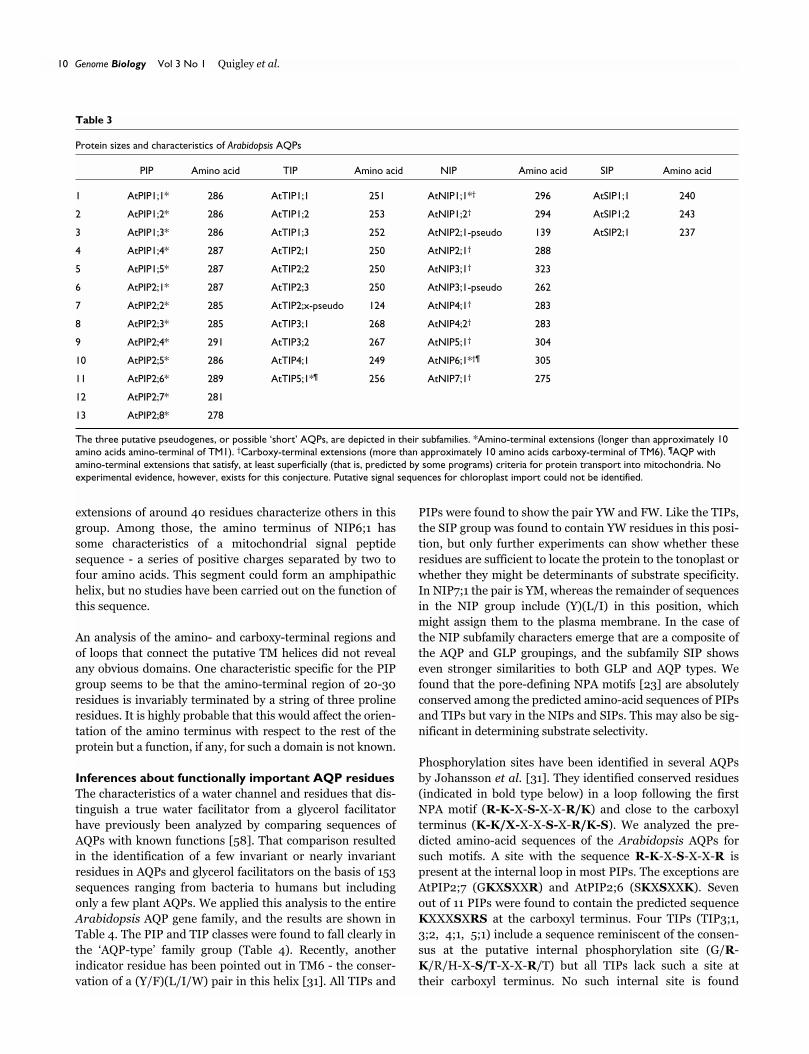
10 Genome Biology Vol 3 No 1 Quigley et al.
Table 3
Protein sizes and characteristics of Arabidopsis AQPs
PIP Amino acid TIP Amino acid NIP Amino acid SIP Amino acid
1 AtPIP1;1* 286 AtTIP1;1 251 AtNIP1;1*† 296 AtSIP1;1 240
2 AtPIP1;2* 286 AtTIP1;2 253 AtNIP1;2† 294 AtSIP1;2 243
3 AtPIP1;3* 286 AtTIP1;3 252 AtNIP2;1-pseudo 139 AtSIP2;1 237
4 AtPIP1;4* 287 AtTIP2;1 250 AtNIP2;1† 288
5 AtPIP1;5* 287 AtTIP2;2 250 AtNIP3;1† 323
6 AtPIP2;1* 287 AtTIP2;3 250 AtNIP3;1-pseudo 262
7 AtPIP2;2* 285 AtTIP2;x-pseudo 124 AtNIP4;1† 283
8 AtPIP2;3* 285 AtTIP3;1 268 AtNIP4;2† 283
9 AtPIP2;4* 291 AtTIP3;2 267 AtNIP5;1† 304
10 AtPIP2;5* 286 AtTIP4;1 249 AtNIP6;1*†¶ 305
11 AtPIP2;6* 289 AtTIP5;1*¶ 256 AtNIP7;1† 275
12 AtPIP2;7* 281
13 AtPIP2;8* 278
The three putative pseudogenes, or possible ‘short’ AQPs, are depicted in their subfamilies. *Amino-terminal extensions (longer than approximately 10amino acids amino-terminal of TM1). †Carboxy-terminal extensions (more than approximately 10 amino acids carboxy-terminal of TM6). ¶AQP withamino-terminal extensions that satisfy, at least superficially (that is, predicted by some programs) criteria for protein transport into mitochondria. Noexperimental evidence, however, exists for this conjecture. Putative signal sequences for chloroplast import could not be identified.
among the NIP/SIP groups, but five NIPS (NIP1;1, 1;2, 2;1,
4;1 and 4;2) contain the carboxy-terminal sequence K-X-X-
S-X-X-K/R-S/T/R/A.
Sensitivity to mercurials is characteristic of some AQPs. In
HsAQP1, the cysteine residue that confers sensitivity is
C189, adjacent to the second NPA motif, but no plant AQP
shows a cysteine in this position although effects of mercury
have been documented in plants in many studies. The cys-
teines responsible for mercury poisoning of water flux in
AtTIP2;1 (C116) and AtTIP1;1 (C118) [59] were found in the
predicted sequences of all Arabidopsis TIPs. This residue is
located in TM4, downstream of the first NPA motif. A cys-
teine was found in all PIPs at a similar position along the
deduced protein sequences. It does, however, not occupy a
similar three-dimensional position (assuming that the TIP
and PIP TM are similar); this means that the cysteine in PIPs
would point in a different direction from that in TIPs. In
fact, other studies have shown that some PIPs are mercury-
insensitive [59,60].
A combined NMR and modeling approach toanalyzing water movement through plant tissuesTypically, AQP water-channel activity is tested by the oocyte
swelling assay [18], in which Xenopus oocytes expressing
AQPs are exposed to hypo-osmotic shock and the subse-
quent water influx is measured. Apart from the caveats men-
tioned above, the level of expression of AQPs, that is, the
number of active AQPs in the oocyte plasma membrane, is
often not known and some AQP might even not be targeted
to this membrane in oocytes. These limitations can,
however, be addressed by measurements of membrane local-
ization and oligomerization state [61,62]. TIPs have been
reported to be more ‘active’ in these experiments, which sug-
gests that they might have a higher conductance in vivo
and/or that their structure is more compatible with the
oocyte expression or targeting machinery. Other techniques
use artificial membranes into which AQPs are embedded,
yeast cells in which AQP is overexpressed [63] or isolated
plant protoplasts [12].
Important advances in studying water movement at the cell
and tissue level include the use of pressure probes for roots
and for individual cells [64]. The effects of a single AQP have
been addressed by antisense experiments that measured
changes in xylem pressure and compared water permeability
of protoplasts from control and transgenic antisense
AtPIP1;2 (PIP1b) plants [12]. Because the movement of
water through plants and plant tissues involves several bar-
riers, including apoplastic, symplastic and transcellular
ones, a single set of measures of overall hydraulic conductiv-
ity, although useful, is not sufficient for determining how
particular AQPs function in planta.
Although informative, the results of pressure-probe experi-
ments require careful interpretation, and independent non-
destructive ways of measuring water fluxes are desirable.
Such methods are available but have been little used so far
for analyzing AQP functions. Nuclear magnetic resonance
(NMR) imaging (MRI) allows the distribution of tissue water
to be quantified, and also allows the mapping of flow and of
diffusion [65-69]. The potential for directly discriminating
intracellular and extracellular water signals in plant cells
and root tissues has been shown [70] and this opens the
door to spectroscopic and imaging-based measurements of
water flow in vivo ([70,71] and J. Rosenberg, Y.S-H.,
H. Wang and H.J.B., unpublished results).
The separation of intracellular from extracellular water
NMR signals is restricted to roots or other tissues, such as
some stems, which have elongated cells oriented in parallel
[70] and is illustrated in Figure 6 for maize roots. The
com
ment
reviews
reports
deposited research
interactions
inform
ation
refereed research
http://genomebiology.com/2001/3/1/research/0001.11
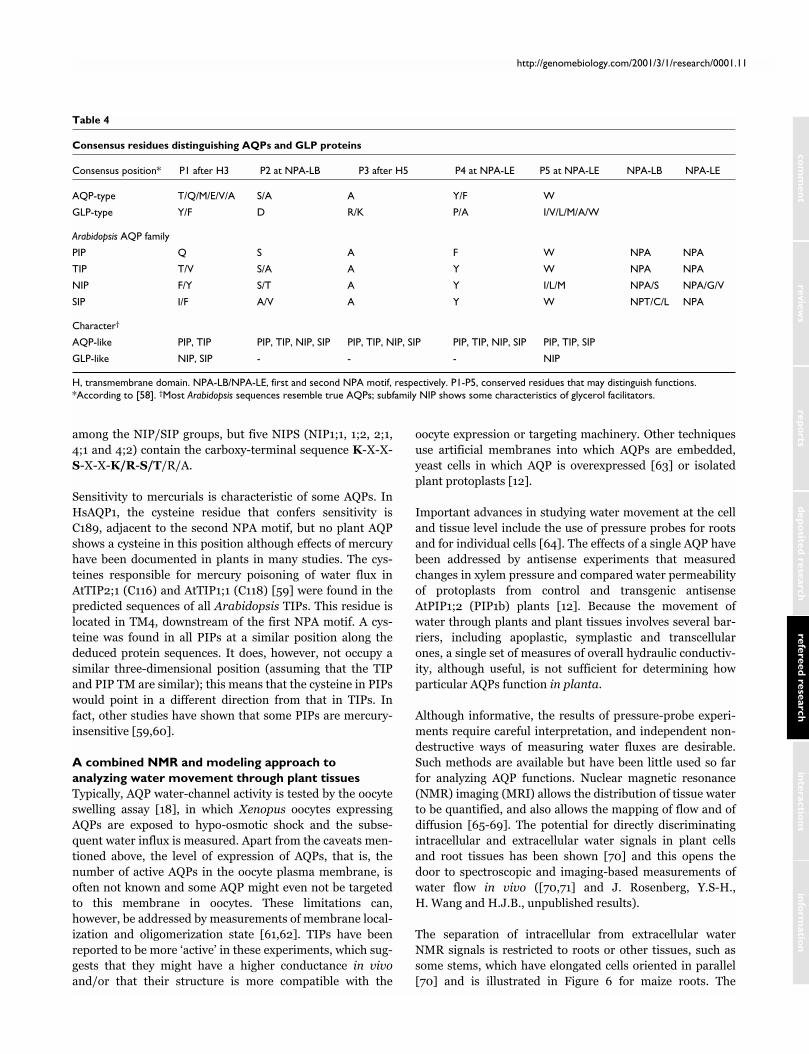
Table 4
Consensus residues distinguishing AQPs and GLP proteins
Consensus position* P1 after H3 P2 at NPA-LB P3 after H5 P4 at NPA-LE P5 at NPA-LE NPA-LB NPA-LE
AQP-type T/Q/M/E/V/A S/A A Y/F W
GLP-type Y/F D R/K P/A I/V/L/M/A/W
Arabidopsis AQP family
PIP Q S A F W NPA NPA
TIP T/V S/A A Y W NPA NPA
NIP F/Y S/T A Y I/L/M NPA/S NPA/G/V
SIP I/F A/V A Y W NPT/C/L NPA
Character†
AQP-like PIP, TIP PIP, TIP, NIP, SIP PIP, TIP, NIP, SIP PIP, TIP, NIP, SIP PIP, TIP, SIP
GLP-like NIP, SIP - - - NIP
H, transmembrane domain. NPA-LB/NPA-LE, first and second NPA motif, respectively. P1-P5, conserved residues that may distinguish functions.*According to [58]. †Most Arabidopsis sequences resemble true AQPs; subfamily NIP shows some characteristics of glycerol facilitators.
assignment of the two signals to represent the total intracel-
lular water and the total extracellular water, including the
apoplast, has been confirmed by the selective imaging of
intracellular and extracellular water using this approach
[71]. NMR spectroscopic applications enable the rates of
osmotic shrinkage and swelling to be measured in situ and
also enable measurement of transport of small molecules
and ions in vivo [70].
We found that the total intracellular water signal (see
Figure 6) shrinks in response to osmotically driven efflux
when the tissue is exposed to hypertonic solutions (with salt
or sucrose in the perfusate spectra; data not shown). The
advantage here is twofold: the isolation of the intracellular
signal removes apoplastic tracer from the data; and, in con-
trast to other NMR methods using shift reagents, the move-
ment of any small molecule that gives an NMR signal can be
followed (this includes any molecule containing carbon,
nitrogen or nonlabile hydrogen atoms).
It has also been reported that the method illustrated in
Figure 6 allows diffusional water fluxes to be measured by
isotopic or magnetic labeling [70]. Diffusional gradients are
not the ones that drive water movement in plants, but diffu-
sional measurements, especially in combination with
hydraulic ones can be very informative about the barriers
responsible for regulating water fluxes. The in vivo NMR
isotope flux data available from this approach were obtained
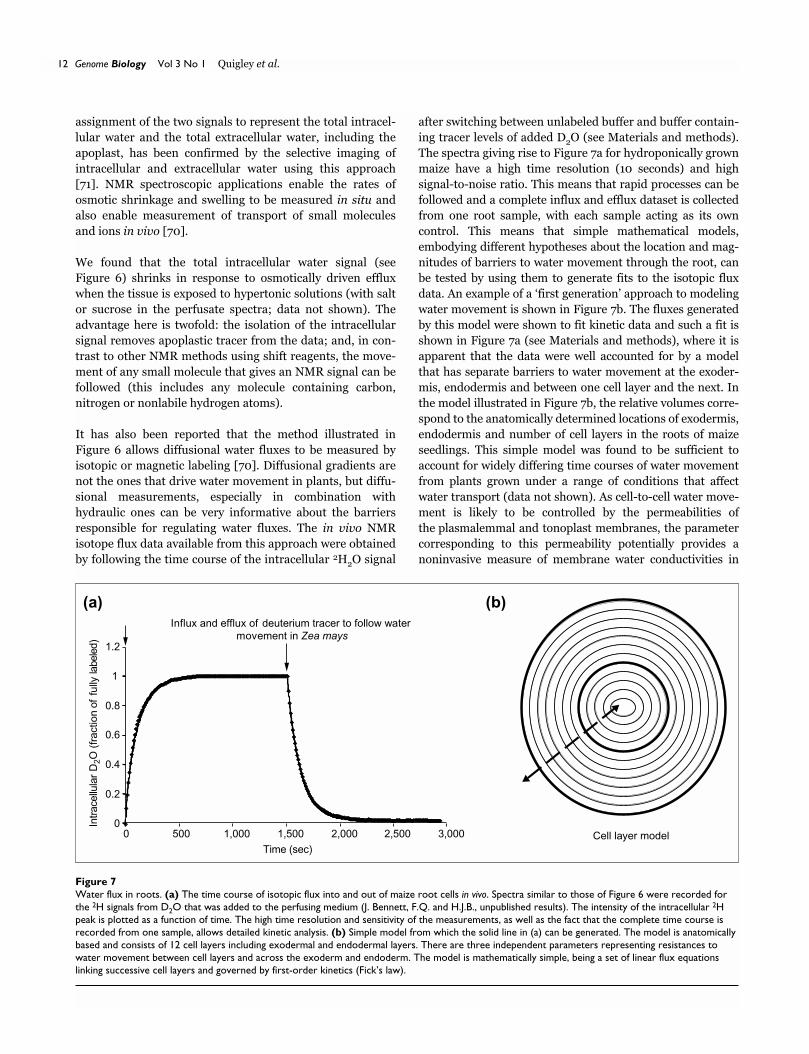
by following the time course of the intracellular 2H2O signal
after switching between unlabeled buffer and buffer contain-
ing tracer levels of added D2O (see Materials and methods).
The spectra giving rise to Figure 7a for hydroponically grown
maize have a high time resolution (10 seconds) and high
signal-to-noise ratio. This means that rapid processes can be
followed and a complete influx and efflux dataset is collected
from one root sample, with each sample acting as its own
control. This means that simple mathematical models,
embodying different hypotheses about the location and mag-
nitudes of barriers to water movement through the root, can
be tested by using them to generate fits to the isotopic flux
data. An example of a ‘first generation’ approach to modeling
water movement is shown in Figure 7b. The fluxes generated
by this model were shown to fit kinetic data and such a fit is
shown in Figure 7a (see Materials and methods), where it is
apparent that the data were well accounted for by a model
that has separate barriers to water movement at the exoder-
mis, endodermis and between one cell layer and the next. In
the model illustrated in Figure 7b, the relative volumes corre-
spond to the anatomically determined locations of exodermis,
endodermis and number of cell layers in the roots of maize
seedlings. This simple model was found to be sufficient to
account for widely differing time courses of water movement
from plants grown under a range of conditions that affect
water transport (data not shown). As cell-to-cell water move-
ment is likely to be controlled by the permeabilities of
the plasmalemmal and tonoplast membranes, the parameter
corresponding to this permeability potentially provides a
noninvasive measure of membrane water conductivities in
12 Genome Biology Vol 3 No 1 Quigley et al.
Figure 7Water flux in roots. (a) The time course of isotopic flux into and out of maize root cells in vivo. Spectra similar to those of Figure 6 were recorded forthe 2H signals from D2O that was added to the perfusing medium (J. Bennett, F.Q. and H.J.B., unpublished results). The intensity of the intracellular 2Hpeak is plotted as a function of time. The high time resolution and sensitivity of the measurements, as well as the fact that the complete time course isrecorded from one sample, allows detailed kinetic analysis. (b) Simple model from which the solid line in (a) can be generated. The model is anatomicallybased and consists of 12 cell layers including exodermal and endodermal layers. There are three independent parameters representing resistances towater movement between cell layers and across the exoderm and endoderm. The model is mathematically simple, being a set of linear flux equationslinking successive cell layers and governed by first-order kinetics (Fick’s law).
Influx and efflux of deuterium tracer to follow water movement in Zea mays
0
0.2
0.4
0.6
0.8
1
1.2
0 500 1,000 1,500 2,000 2,500 3,000
Intr
acel
lula
r D
2O (
frac
tion
of fu
lly la
bele
d)
Cell layer model Time (sec)
(a) (b)

intact tissue. In combination with transcript and protein
expression data, which also monitor cell specificity, NMR
therefore has the potential to test ideas about aquaporin
function in planta by combining localization information
with modeling of flux measurements from control and
knockout plants and with plants grown under conditions
that alter both water conductivity and AQP expression.
DiscussionIntracellular locations of AQPsThe original definition of the PIP and TIP subfamilies was
their assumed location in the plasma membrane and tono-
plast, respectively. When antibodies were used to locate pro-
teins of the TIP group, the signal was always confined to
tonoplast membrane fractions [72]. PIP localization seems
less well defined. Daniels et al. [73] located a PIP-family
protein to the plasma membrane in Arabidopsis. For
M. crystallinum, Barkla et al. [43] detected PIPs to a small
extent in the plasma membrane but mostly in a vacuolar
fraction in continuous sucrose gradients or, more likely, in a
membrane fraction with a density similar to tonoplasts. This
is not surprising considering that mammalian AQPs have
been documented as cycling between the plasma membrane
and internal vesicles, a process that seems to be under hor-
monal control [74,75]. Such mobility may also be at the
basis of the distribution of different TIPs in distinct plant
vacuoles [61,76,77]
Functions of AQPWe have outlined how the genome of Arabidopsis can
provide new information, taking the aquaporin gene and
protein family as an example. There are, however, limits on
what can at present be deduced from gene sequences alone.
The fundamental questions of whether the primary role of all
or most AQPs is in increasing water conductivities, and what
physiological functions such water permeability increases
may serve in plant function, are not settled. They can only be
addressed by functional measurements. The straightforward
view that most aquaporins in plants are there to regulate
water flow, and a subset may facilitate the movement of glyc-
erol or other small molecules, is the most widespread general
interpretation of the physiological and functional assays out-
lined at the start of this article. This dogma is expounded
more thoroughly elsewhere [6,30-32,36]. This view, in fact,
conceals a number of quite different roles for water-channel
activity, involving the regulation of water flux and homeosta-
sis at the subcellular, transcellular, tissue and whole-plant
levels. Therefore, there are two levels at which functional
questions must be addressed for each AQP. One is whether
each AQP functions as a water channel, and it seems that a
significant number of PIPs, for example, do not in fact
greatly increase the water conductivity of the cell mem-
branes in which they reside (at least not in oocytes; see for
example [55,78]). In reality we are ignorant about the
natural substrates for most AQPs.
The second level of question that requires nongenomic
information is: if water-channel activity is significant for a
particular AQP, what is the role of this activity in a whole-
plant context. A simple example concerns the location of
gene expression. The simple statement that a particular
gene is expressed in roots, for example, conveys insufficient
functional information, as different AQPs have different
distributions within one tissue [44,72]. An AQP expressed
in the epidermis is unlikely to function in vascular flux.
Although our understanding of promoter and protein
domains that determine expression and localization is
growing, our ability to deduce from genomic sequences
which cell types are likely to express a particular gene and
where the product will reside under what conditions is still
rudimentary. Thus direct determination of the location of
each AQP within tissues is still required to understand its
function in the plant.
The water-channel view of AQP function requires us to
believe that there may be something about some PIPs that
prevents them displaying their normal water-channel func-
tion in oocytes. This and other considerations arising from
the imperfections of oocyte expression systems [79] call for
functional measures of AQPs to be made primarily in plant
cells or tissues. Assays on plant protoplasts, roots and whole
plants are obviously important, and here the question is how
the contribution of an AQP is to be determined. Such mea-
surements generally rely on mercurials to perturb AQP func-
tion, but mercurials can act in a nonspecific way on
membranes and proteins, and not all AQPs are mercury-
sensitive, so this is not sufficient.
A path forward: reverse genetics and biophysicalinvestigationsThe use of gene knockout and/or antisense technologies is
particularly appealing for plant AQPs. In animals, this
approach has been used to reveal which AQPs and combina-
tions thereof are, and are not, crucial for water fluxes in vivo
in mice lacking the genes for AQP1 and AQP3 [80]. In the
one case where it has been applied, lowering AQP expres-
sion by AtPIP1;2 (AtPIP1b) antisense expression resulted in
plants with root systems that were larger but pressure probe
measurements indicated the same overall xylem pressure
as the smaller root systems of wild-type plants [52].
Protoplasts from these antisense plants showed lower water
permeabilities [12].
We believe that applying a combination of biophysical mea-
sures of conductivity to transgenics involving each of the
AQPs, and combinations of several AQPs, represents the
most promising approach to the fundamental unanswered
questions about general and individual AQP functions. By
including whole-plant water relations and also metabolite
measurements, the use of transgenic plants, preferably of
the ‘gene knockout’ type, will yield a greater understanding
and prevent errors of interpretation that could arise from
com
ment
reviews
reports
deposited research
interactions
inform
ation
refereed research
http://genomebiology.com/2001/3/1/research/0001.13
simply correlating single-gene knockouts with changes in
hydraulic conductivity parameters.
Only by addressing in a systematic way the functions of each
AQP in planta will it be possible to understand such simple
but puzzling issues as the reason behind the large number of
AQP genes in plants. The number of AQPs in the Arabidop-
sis genome - 35 - compares with the presence of, for
example, 15 potassium channels and 15 proton/metal
antiport systems in the Arabidopsis genome. More detailed
comparison with animal systems only increases the puzzle.
In humans only AQP1 appears to be widely distributed in
different tissues (although several other AQPs are expressed
as rare transcripts in various tissues), whereas the data in
Table 2 show that, in plants, most AQPs are expressed at sig-
nificant levels in multiple tissue types. We suggest that the
reason for the large number of plant AQPs will turn out to be
that multiple genes represent multiple functions, of which
water permeability is only one. Thus we postulate that plant
genomes evolved more AQPs than animals because in plants
they serve functions that are either not required or are met
by other systems in animals.
Such functions may include metabolite permeation. As with
the water permeability of most AQPs, permeability to a par-
ticular metabolite does not mean that this is a meaningful
function in planta. Thus the permeability of an AQP to
ribitol and xylitol, as found for a bacterial glycerol facilitator
[23], cannot be significant in cells where these metabolites
are not present. Indeed permeability in one species may
have a very different role in another. Thus there is good evi-
dence that glycerol permeability is important in yeast cells
[81,82] in the secretion of this polyol under stress condi-
tions, but in higher plants that do not accumulate glycerol as
an osmoprotectant nor excrete it in large quantities, there is
no apparent function for increasing glycerol permeability.
One might speculate that by increasing membrane perme-
ability to polyols and/or other metabolites, some plant AQPs
could be involved in long-distance apoplastic transport or
signaling rather than in the bulk secretion of, for example,
glycerol. The discovery of such possible functions will
require in planta examination of transgenic plants and an
extension of analyses beyond highly selective water and
small-molecule permeability assays in heterologous systems
and protoplasts.
Biophysical measures of water movement in planta -
whether based on pressure probes, NMR or other methods
- as well as methods for determining localization and expres-
sion and for generating transgenics are available. A relatively
neglected area is the development of quantitative anatomical
models of water movement for interpreting flux measure-
ments [83]. Such models are needed for testing the potential
contribution of AQPs to regulating water content and trans-
port, and indeed for determining which of the range of plau-
sible but untested ideas about AQP function may or may not
apply to different membranes, cells, tissues, plants and envi-
ronmental conditions. The combination of localization of
AQP proteins and using anatomically-based models, has the
potential to allow function to be assigned to individual AQPs
using mutants and transgenics in which expression of AQPs
(singly or in combination) is reduced or eliminated.
ConclusionsStudying genome sequences yields unique and useful infor-
mation about unstudied and understudied genes. The aqua-
porin gene family in Arabidopsis is an interesting example
of the current and potential limitations of this approach. Full
sequence comparisons allow the assignment of the AQPs
into subfamilies to be placed on a firm footing, and have
functional implications for previously unknown genes. While
we know about AQP sequences, structure, expression, post-
translational modification, permeability properties and sub-
cellular location from some case studies, our ability to
extrapolate from gene sequence to functional properties for
unstudied members of the same family is still limited. One
limitation is that we cannot yet extrapolate reliably from
sequence via three-dimensional structural features to con-
ductivity, selectivity and other protein properties. This
inability extends to regulatory regions that determine place,
time and extent of transcript expression, and to protein
characteristics that determine half-life, intracellular localiza-
tion and membrane trafficking. This type of limitation will
decrease as our understanding of sequence-structure and
structure-function relationships improves and as our knowl-
edge of expression and cellular targeting in plants expands.
This means that genomic information will become more
useful in the coming years and analyses such as the one pre-
sented here are likely to become common and more useful.
Irrespective of our steadily improving predictive tools for in
silico analyses, fundamental questions of the physiological
roles of individual genes will continue to require detailed
functional assays. Here too, genomic information is impor-
tant because, as we have argued above, assigning physiologi-
cal function via transgenic reduction or removal of gene
expression requires sequence information for precise target-
ing. Here, the AQP family provides an ideal opportunity.
This is a set of genes whose functions are intuitively per-
ceived as important, much isolated information has been
accumulated, yet their function is far from being under-
stood. Also, AQPs pose challenges because the family is
likely to contain genes with divergent and unique biological
roles in the plant. Indeed it is likely that in many cases indi-
vidual members of the family have different roles, depending
on when and where they are present in the plant. Clearly,
this level of understanding will require a combination of bio-
physical measurements - which we think must be nonde-
structive, real-time and experimentally flexible - transgenic
technology, knockout or precision antisense experiments,
and modeling of plant function.
14 Genome Biology Vol 3 No 1 Quigley et al.
Materials and methodsGenome and transcript analysisArabidopsis thaliana (ecotype Columbia) aquaporin coding
sequences were identified by searching the Arabipdosis
genomic data at NCBI [84] with the BLAST algorithms [85].
Intron-exon splicing sites were verified visually using avail-
able cDNA sequences and/or corresponding ESTs. The Ara-
bidopsis Information Resource (TAIR) website [86] was
used to localize Arabidopsis aquaporin genes on the chro-
mosomes. Sequences were aligned with the pile-up program
of the GCG software (Wisconsin Genetics Computer Group
package). Tree building was performed with ClustalX [40]
and drawn with the TreeView software [41]. Transmembrane
regions were determined with the transmembrane predic-
tion program TMpred [87,88].
Growth of seedlingsMaize seeds (FRB-73) were germinated for 3 days on trays on
absorbent paper wetted with 0.1 mM CaSO4 at 28°C in a
humidified incubator. Seedlings were then transferred to
hydroponic growth on 0.5 cm thick Styrofoam sheets (0.5 cm
diameter holes) floating on aerated growth solution. The
primary root of each seedling was threaded through a hole in
the Styrofoam sheet into the growth solution. Hydroponic
growth was under continuous illumination at 28°C in humid-
ified air and growth solutions contained 0.1 mM CaSO4.
Preparation for NMRTips 5 mm long were excised from each primary root and
discarded. The next 25 mm of primary root was then cut and
briefly vacuum infiltrated under reduced pressure to
improve magnetic field homogeneity of in vivo spectra. Root
segments were placed in 10 mm NMR tubes with their axes
aligned parallel to the tube axis and perfused with aerated
buffer solutions containing 50 mM glucose, 1 mM Ca2+,
10 mM potassium-gadolinium EDTA, 0.5 mM EDTA, 5 mM
methylethylsulfonate (MES) at pH 6 with or without 3%
D2O. The gadolinium (Gd) was used to separate intracellular
from extracellular signals [70] and is complexed to prevent
toxicity. The composition of the perfusion medium was
designed to keep the free [Gd3+] below 1 �M, while having
[Ca2+] above 0.2 mM and below 1 mM. No toxicity to maize
root tissues was observed by in vivo 31P NMR spectroscopy
of root tips or segments exposed to the perfusion medium
for several hours, and the growth of excised root tips and
roots of intact seedlings was the same over 24 h in this
medium as in medium without Gd or EDTA. The perfusion
system used has been previously described [70]. Perfusion
rates of 30-40 ml per min were used.
One-dimensional-pulse 1H and 2H NMR spectra were
acquired as previously described [70] using a Unity 400
Varian spectrometer with a 10 mm broadband probe. For
tracer experiments, time courses of 150-300 2H spectra were
acquired at 1, 10 or 15 sec intervals. The intensities of intra-
cellular 2H signals were measured from these spectra and
normalized to final equilibrated intensities (for influxes) or
initial intensities (for effluxes).
Model for the analysis of water flux dataThe model illustrated in Figure 7 assumes that water diffus-
ing radially through the root encounters several barriers.
The three parameters of this model correspond to rate con-
stants (or permeabilities) of the exodermis and the endoder-
mis, as in model 2, with additional barriers for movement
between cell layers, similar to model 3. The rate of change of
concentration for the nth compartment is given by a set of n
equations
dCn = kn · (Cn-1 - Cn) - kn+1 · (Cn - Cn+1)———
dt
in which Cn is the concentration in layer n, kn is the rate con-
stant between the nth and the (n - 1)th cell layer. The perme-
ability for water movement between successive cell layers is
assumed to be the same for all layers except for those for
movement from the external medium into the root (across
the exodermis) and movement from the eighth to the ninth
layer, which are separated by the endodermis. Therefore the
all k values except for k1 and k9 have the same value scaled
by dividing by the relative radius of each cell layer. This
scaling is because the rate constant for crossing a membrane
or other barrier is equal to the permeability of that barrier
multiplied by the area-to-volume ratio, and the area-to-
volume ratio for an elongated cylinder is 2/(radius). Solution
of this set of equations was implemented using a spread-
sheet computer program.
AcknowledgementsWe thank Jennifer Inlow and Ryan Kelley for help with the figures andJane Dugas for help with the manuscript. The work was supported by theNational Science Foundation (DBI9813360; to H.J.B.), US Department ofAgriculture (NRI program; to Y.S.H., H.J.B.) and a Crimson Scholarshipfrom New Mexico State University to J.M.R. F.Q. acknowledges a sabbati-cal fellowship from the University of Grenoble, France.
References1. Verkman AS: Water channels in cell membranes. Annu Rev
Physiol 1992, 54:97-108.2. Agre P, Bonhivers M, Borgnia MJ: The aquaporins, blueprints for
cellular plumbing systems. J Biol Chem 1998, 273:14659-14662.3. Dainty J: Water relations of plant cells. Adv Bot Res 1963, 1:279-
326.4. Wayne R, Tazawa M: Nature of the water channels in the
internodal cells of Nitellopsis. J Membr Biol 1990, 116:31-39.5. Steudle E, Henzler T: Water channels in plants: do basic con-
cepts of water transport change? J Exp Bot 1995, 46:1067-1076.6. Maurel C: Aquaporins and water permeability of plant mem-
branes. Annu Rev Plant Physiol Plant Mol Biol 1997, 48:399-429.7. Tazawa M, Ohkuma E, Shibasaka M, Nakashima S: Mercurial-sensi-
tive water transport in barley roots. J Plant Res 1997, 110:435-442.
8. Tyerman S, Bohnert HJ, Maurel C, Steudle E, Smith JAC: Plantaquaporins: their molecular biology, biophysics and signifi-cance for plant water relations. J Exp Bot 1999, 50:1055-1071.
com
ment
reviews
reports
deposited research
interactions
inform
ation
refereed research
http://genomebiology.com/2001/3/1/research/0001.15
9. Maggio A, Joly RJ: Effects of mercuric chloride on the hydraulicconductivity of tomato root systems. Evidence for a channel-mediated water pathway. Plant Physiol 1995, 109:331-335.
10. Carvajal M, Cooke, DT, Clarkson DT: Responses of wheat plantsto nutrient deprivation may involve the regulation of water-channel function. Planta 1996, 199:372-381.
11. Carvajal M, Martinez V, Alcaraz C: Physiological function ofwater channels as affected by salinity in roots of paprikapepper. Physiol Plant 1999, 105:95-101.
12. Kaldenhoff R, Grote K, Zhu J-J, Zimmermann U: Significance ofplasmalemma aquaporins for water-transport in Arabidopsisthaliana. Plant J 1998, 14:121-128.
13. Reizer J, Reizer A, Saier MH Jr: The MIP family of integral mem-brane channel proteins: sequence comparisons, evolution-ary relationships, reconstructed pathway evolution, andproposed functional differentiation of the two repeatedhalves of the proteins. Crit Rev Biochem Mol Biol 1993, 28:235-257.
14. Park JH, Saier MH Jr: Phylogenetic characterization of the MIPfamily of transmembrane channel proteins. J Membr Biol 1996,153:171-180.
15. Jung JS, Preston GM, Smith BL, Guggino WB, Agre P: Molecularstructure of the water channel through aquaporin CHIP.The hourglass model. J Biol Chem 1994, 269:14648-14654.
16. Cheng A, van Hoek AN, Yeager M, Verkman AS, Mitra AK: Three-dimensional organization of a human water channel. Nature1997, 387:627-630.
17. Walz T, Hirai T, Murata K, Heymann JB, Mitsuoka K, Fujiyoshi Y,Smith BL, Agre P, Engel A: The three-dimensional structure ofaquaporin-1. Nature 1997, 387:624-627.
18. Preston GM, Carroll TP, Guggino WB, Agre P: Appearance ofwater channels in Xenopus oocytes expressing red cellCHIP28 protein. Science 1992, 256:385-387.
19. Eskandari S, Wright EM, Kreman M, Starace DM, Zamphigi GA:Structural analysis of cloned plasma membrane proteins byfreeze-fracture electron microscopy. Proc Natl Acad Sci USA1998, 95:11235-11240.
20. Shi LB, Skach WR, Verkman AS: Functional independence ofmonomeric CHIP28 water channels revealed by expressionof wild type-mutant heterodimers. J Biol Chem 1994,269:10417-10422.
21. Verkman AS, van Hoek AN, Ma T, Frigeri A, Skach WR, Mitra A,Tamarappoo BK, Farinas J: Water transport across mammaliancell membranes. Am J Physiol 1996, 270:C12-C30.
22. Murata K, Mitsuoka K, Hirai T, Walz T, Agre P, Heymann JB, EngelA, Fujiyoshi Y: Structural determinants of water permeationthrough aquaporin-1. Nature 2000, 407:599-605.
23. Fu D, Libson A, Miercke LJW, Weitzman C, Nollert P, Krucinski J,Stroud RM: Structure of a glycerol-conducting channel andthe basis for its selectivity. Science 2000, 290:481-486.
24. Zeuthen T: How water molecules pass through aquaporins.Trends Biochem Sci 2001, 26:77-79.
25. Engel A, Fujiyoshi Y, Agre P: The importance of aquaporinwater channel protein structures. EMBO J 2000, 19:800-806.
26. Fotiadis D, Jenö P, Mini T, Wirtz S, Müller SA, Fraysse L, Kjellbom P,Engel A: Structural characterization of two aquaporins iso-lated from native spinach leaf plasma membranes. J Biol Chem2001, 276:1707-1714.
27. Daniels MJ, Chrispeels MJ, Yeager M: Projection structure of aplant vacuole membrane aquaporin by electron cryo-crys-tallography. J Mol Biol 1999, 294:1337-1349.
28. Chaumont F, Barrieu F, Wojcik E, Chrispeels MJ, Jung R: Aquapor-ins constitute a large and highly divergent protein family inmaize. Plant Physiol 2001, 125:1206-1215.
29. Maurel C, Reizer J, Schroeder JI, Chrispeels MJ: The vacuolarmembrane protein ��-TIP creates water-specific channels inXenopus oocytes. EMBO J 1993, 12:2241-2247.
30. Schäffner AR: Aquaporin function, structure, and expression:are there more surprises to surface in water relations? Planta1998, 204:131-139.
31. Johansson I, Karlsson M Johanson U, Larsson C, Kjellbom P: Therole of aquaporins in cellular whole plant water balance.Biochim Biophys Acta 2000, 1465:324-342.
32. Maurel C, Chrispeels JM: Aquaporins: A molecular entry intoplant water relations. Plant Physiol 2001, 125:135-138.
33. Kjellbom P, Larsson C, Johansson I, Karlsson M, Johanson U: Aqua-porins and water homeostasis in plants. Trends Plant Sci 1999,4:308-314.
34. Niemetz CM, Tyerman SD: Channel-mediated permeation ofammonia gas through the peribacteroid membrane ofsoybean nodules. FEBS Lett 2000, 465:110-114.
35. Henzler T, Steudle E: Transport and metabolic degradation ofhydrogen peroxide in Chara corallina: model calculations andmeasurements with the pressure probe suggest transport ofH2O2 across water channels. J Exp Bot 2000, 51:2053-2066.
36. Santoni V, Gerbeau P, Javot H, Maurel C: The high diversity ofaquaporins reveals novel facets of plant membrane func-tions. Curr Opin Plant Biol 2000, 3:476-481.
37. Weig A, Deswarte C, Chrispeels MJ: The major intrinsic proteinfamily of Arabidopsis has 23 members that form three dis-tinct groups with functional aquaporins in each group. PlantPhysiol 1997, 114:1347-1357.
38. The Arabidopsis Genome Initiative: Analysis of the genomesequence of the flowering plant Arabidopsis thaliana. Nature2000, 408:796-815.
39. Johanson U, Karlsson M, Johansson I, Gustavsson S, Sjovall S, FraysseL, Weig AR, Kjellbom P: The complete set of genes encodingmajor intrinsic proteins in Arabidopsis provides a frameworkfor a new nomenclature for major intrinsic proteins inplants. Plant Physiol 2001, 126:1358-1369.
40. Jeanmougin F, Thompson JD, Gouy M, Higgins DG, Gibson TJ: Mul-tiple sequence alignment with Clustal X. Trends Biochem Sci1998, 23:403-405.
41. Page RDM: TreeView: an application to display phylogenetictrees on personal computers. Comp Appl Biosci 1996, 12:357-358.
42. CPGN Aquaporin Web[http://mbclserver.rutgers.edu/CPGN/AquaporinWeb]
43. Barkla BJ, Vera-Estrella R, Kirch H-H, Pantoja O, Bohnert HJ: Aqua-porin localization - how valid are the TIP and PIP labels?Trends Plant Sci 1999, 4:86-88.
44. Kirch H-H, Vera-Estrella R, Golldack D, Barkla B, Quigley F,Michalowski CB, Bohnert HJ: Expression of water channel pro-teins in Mesembryanthemum crystallinum. Plant Physiol 2000,123:111-124.
45. Chrispeels MJ, Agre P: Aquaporins: water channel proteins ofplant and animal cells. Trends Biochem Sci 1994, 19:421-425.
46. Khan SA, Zhang N, Ismail T, El-Moghazy AN, Butt A, Wu J, MerlottiC, Hayes A, Gardner DCJ, Oliver SG: Functional analysis ofeight ORFs on chromosomes XII and XIV of Saccharomycescerevisiae. Yeast 2000, 16:1457-1468.
47. Carbrey JM, Bonhivers M, Boeke JD, Agre P: Aquaporins in Sac-charomyces: characterization of a second functional waterchannel protein. Proc Natl Acad Sci USA 2001, 98:1000-1005.
48. Laizé V, Tacnet F, Ripoche P, Hohmann S: Polymorphism of Sac-charomyces cerevisiae aquaporins. Yeast 2000, 16:897-903.
49. Barrieu F, Chaumont F, Chrispeels MJ: High expression of thetonoplast aquaporin ZmTIP1 in epidermal and conductingtissues of maize. Plant Physiol 1998, 117:1153-1163.
50. Clarkson DT, Carvajal M, Henzler T, Waterhouse RN, Smyth AJ,Cooke DT, Steudle E: Root hydraulic conductance: diurnalaquaporin expression and the effects of nutrient stress. J ExpBot 2000, 51:61-70.
51. Fukuhara T, Kirch H-H, Bohnert HJ: Expression of Vp1 andwater channel proteins during seed germination. Plant CellEnviron 1999, 22:417-424.
52. Kaldenhoff R, Kolling A, Richter G: Regulation of the Arabidopsisthaliana aquaporin gene AtH2 (PIP1b). J Photochem Photobiol B1996, 36:351-354.
53. Harmer SL, Hogenesch JB, Straume M, Chang HS, Han B, Zhu T,Wang X, Kreps JA, Kay SA: Orchestrated transcription of keypathways in Arabidopsis by the circadian clock. Science 2000,290: 2110-2114.
54. Yu Z, Wright SI, Bureau TE: Mutator-like elements in Arabidop-sis thaliana. Structure, diversity and evolution. Genetics 2000,156:2019-2031.
55. Yamada S, Katsuhara M, Kelly W, Michalowski CB, Bohnert HJ: Afamily of transcripts encoding water channel proteins:Tissue specific expression in the common ice plant. Plant Cell1995, 7:1129-1142.
56. Yamada S, Nelson D, Ley E, Marquez S, Bohnert HJ: The expres-sion of an aquaporin promoter from Mesembryanthemumcrystallinum in tobacco. Plant Cell Physiol 1997, 38:1326-1332.
57. Stress-genomics [http://www.stress-genomics.org]58. Froger A, Tallur B, Thomas D, Delamarche C: Prediction of func-
tional residues in water channels and related proteins. ProteinSci 2000, 7:1458-1468.
16 Genome Biology Vol 3 No 1 Quigley et al.

59. Daniels MJ, Chaumont F, Muirkiv TE, Chrispeels MJ: Characteriza-tion of a new vacuolar membrane aquaporin sensitive tomercury at a unique site. Plant Cell 1996, 8:586-599.
60. Otto B, Kaldenhoff R: Cell-specific expression of the mercury-insensitive plasma-membrane aquaporin NtAQP1 fromNicotiana tabacum. Planta 2000, 211:167-172.
61. Jauh GY, Phillips TE, Rogers JC: Tonoplast intrinsic protein iso-forms as markers for vacuolar functions. Plant Cell 1999,11:1867-1882.
62. Bron P, Lagree V, Froger A, Rolland JP, Hubert JF, Delamarche C,Deschamps S, Pellerin I, Thomas D, Haase W: Oligomerizationstate of MIP proteins expressed in Xenopus oocytes asrevealed by freeze-fracture electron-microscopy analysis. JStruct Biol 1999, 128:287-296.
63. Weig AR, Jakob C: Functional identification of the glycerolpermease activity of Arabidopsis thaliana NLM1 and NLM2proteins by heterologous expression in Saccharomyces cere-visiae. FEBS Lett 2000, 481:293-298.
64. Tomos AD, Leigh RA: The pressure probe: a versatile tool inplant cell physiology. Annu Rev Plant Physiol Plant Mol Biol 1999,50:447-472.
65. Kockenberger W, Pope JM, Xia Y, Jeffrey KR, Komor E, CallaghanPT: A non-invasive measurement of phloem and xylemwater flow in castor bean seedlings by nuclear magnetic res-onance microimaging. Planta 1997, 201:53-63.
66. Ishida N, Koizumi M, Kano H: The NMR microscope: a uniqueand promising tool for plant science. Annals Botany 2000,86:259-278.
67. Scheenen TWJ, van Dusschoten D, de Jager PA, Van As H: Quan-tification of water transport in plants with NMR imaging. JExp Bot 2000, 51:1751-1759.
68. Van der Toorn A, Zemah H, Van As H, Bendel P, Kamenetsky R:Developmental changes and water status in tulip bulbsduring storage: visualization by NMR imaging. J Exp Bot 2000,51:1277-1287.
69. Wistuba N, Reich R, Wagner HJ, Zhu JJ, Schneider H, Bentrup FW,Haase A, Zimmermann U: Xylem flow and its driving forces in atropical liana: concomitant flow-sensitive NMR imaging andpressure probe measurements. Plant Biol 2000, 2:579-582.
70. Shachar-Hill Y, Pfeffer PE, Ratcliffe RG: Measuring nitrate in plantcells by in vivo NMR using Gd3+ as a shift reagent. J MagnetReson B 1997, 111:9-14.
71. Zhong K, Li X, Shachar-Hill Y, Picart F, Wishnia A, Springer CS:Magnetic susceptibility shift selected imaging (MESSI) andlocalized 1H2O spectroscopy in living plant tissues. NMRBiomed 2000, 13:392-397.
72. Chaumont F, Barrieu F, Herman EM, Chrispeels MJ: Characteriza-tion of a maize tonoplast aquaporin expressed in zones ofcell division and elongation. Plant Physiol 1998, 117:1143-1152.
73. Daniels MJ, Mirkov TE, Chrispeels MJ: The plasma membrane ofArabidopsis thaliana contains a mercury-insensitive aqua-porin that is a homolog of the tonoplast water channelprotein TIP. Plant Physiol 1994, 106:1325-1333.
74. Gustafson CE, Katsura T, McKee M, Bouley R, Casanova JE, BrownD: Recycling of AQP2 occurs through a temperature- andbafilomycin-sensitive trans-Golgi-associated compartment.Am J Physiol Renal Physiol 2000, 278:F317-326.
75. Klussmann E, Maric K, Rosenthal W: The mechanisms of aqua-porin control in the renal collecting duct. Rev Physiol BiochemPharmacol 2000, 141:33-95.
76. Paris N, Stanley CM, Jones RL, Rogers JC: Plant cells contain twofunctionally distinct vacuolar compartments. Cell 1996,85:563-572.
77. Jiang L, Rogers JC: Integral membrane protein sorting to vac-uoles in plant cells: evidence for two pathways. J Cell Biol 1998,143:1183-1199.
78. Chaumont F, Barrieu F, Jung R, Chrispeels MJ: Plasma membraneintrinsic proteins from maize cluster in two sequence sub-groups with differential aquaporin activity. Plant Physiol 2000,122:1025-1034.
79. Miller AJ, Zhou JJ: Xenopus oocytes as an expression systemfor plant transporters. Biochim Biophys Acta 2000, 1465:343-358.
80. Yang B, Ma T, Verkman AS: Erythrocyte water permeabilityand renal function in double knockout mice lacking aqua-porin-1 and aquaporin-3. J Biol Chem 2001, 276:624-628.
81. Nevoigt E, Stahl U: Osmoregulation and glycerol metabolismin the yeast S. cerevisiae. FEMS Microbiol Rev 1997, 21:231-241.
82. Shen B, Hohmann S, Jensen RG, Bohnert HJ: Roles of sugar alco-hols in osmotic stress adaptation - Replacement of glycerolin yeast by mannitol and sorbitol. Plant Physiol 1999, 121:45-52.
83. Steudle E, Peterson CA: How does water get through roots?J Exp Bot 1998, 49:775-788.
84. National Center for Biotechnology Information[http://www.ncbi.nlm.nih.gov]
85. Altschul SF, Madden TL, Schaffer AA, Zhang J, Zhang Z, Miller W,Lipman DJ: Gapped BLAST and PSI-BLAST: a new genera-tion of protein database search programs. Nucleic Acids Res1997, 25:3389-3402.
86. The Arabidopsis Information Resource [http://www.Arabidopsis.org/]
87. Hofmann K, Stoffel W: TMbase - A database of membrane-spanning protein segments. Biol Chem 1993, 347:166.
88. TMpred [http://www.ch.embnet.org]
com
ment
reviews
reports
deposited research
interactions
inform
ation
refereed research
http://genomebiology.com/2001/3/1/research/0001.17