research instruments, validity dan...
TRANSCRIPT
Research Instruments, Validity dan Reliability
Trisasi Lestari - 2016

Research Instruments
Instrument is the generic term that researchers use for a measurement device (survey, test, questionnaire, etc.).
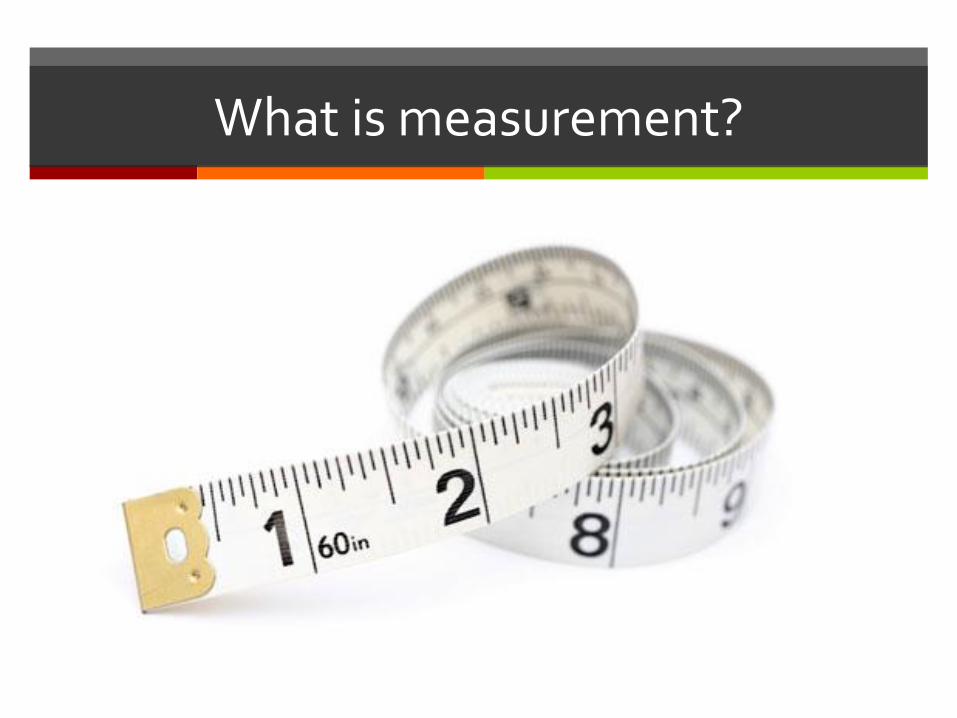
What is measurement?
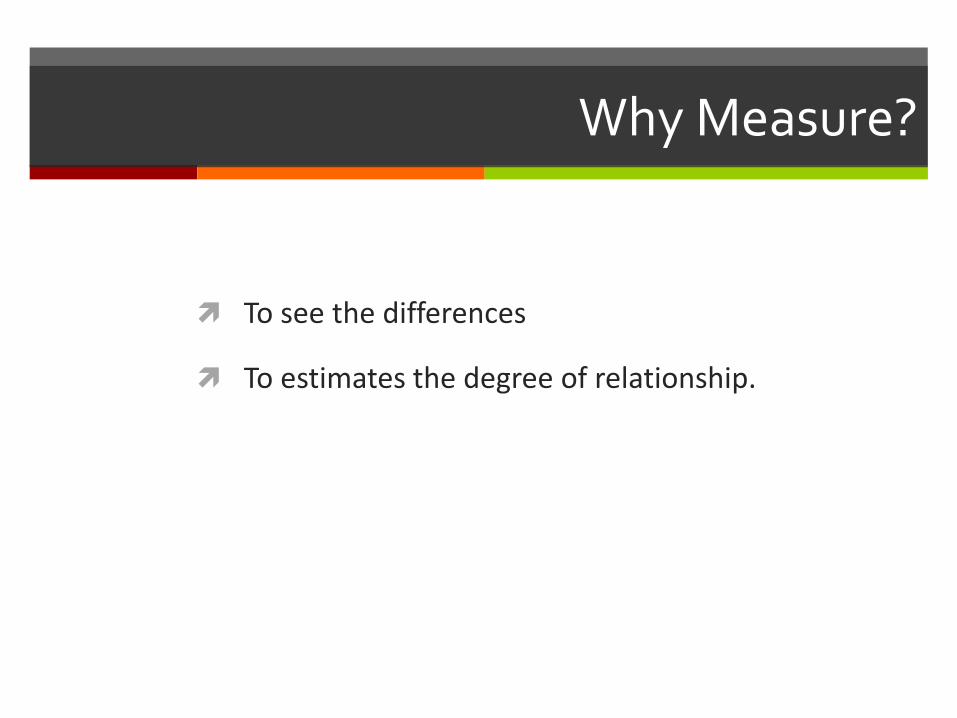
Why Measure?
To see the differences
To estimates the degree of relationship.

Objective assessment
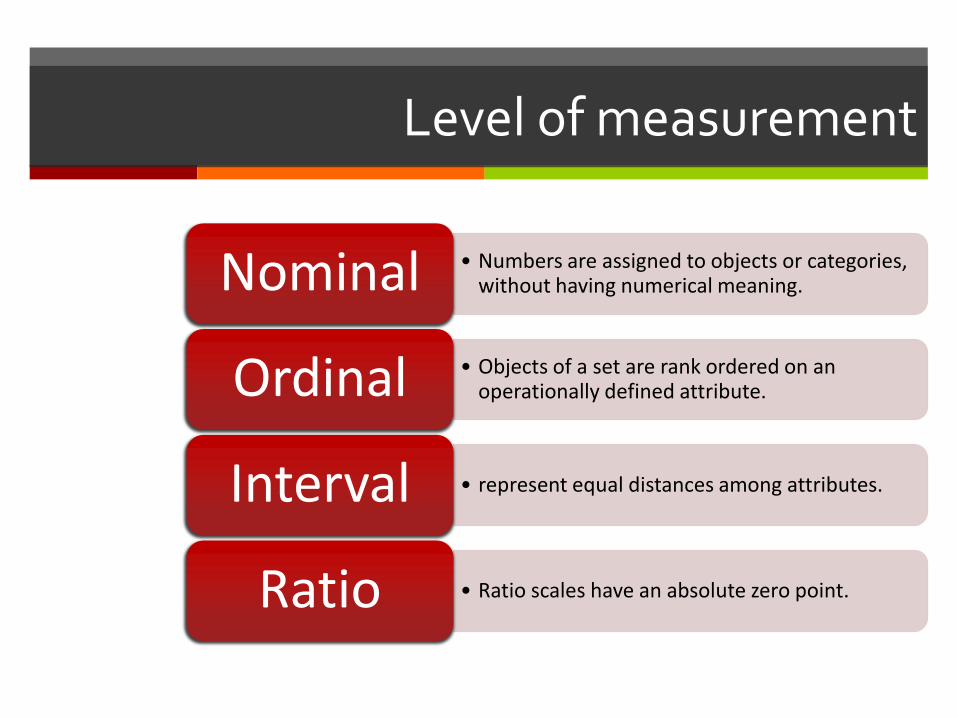
Level of measurement
• Numbers are assigned to objects or categories, without having numerical meaning.Nominal
• Objects of a set are rank ordered on an operationally defined attribute.Ordinal
• represent equal distances among attributes.Interval
• Ratio scales have an absolute zero point.Ratio
Subjective assessment
How to measure?
How to measure

Operationalization
defining a concept in terms of criteria that specify how to observe, describe and measure the concept.
the process whereby concepts can be applied on an empirical level so that they can be transformed into variables or indicators
Variables: symbols to which we can assign numerals or values based on measurements of the concept’s properties.
Indicators: indirect measures of concepts

Measurement Criterias
Validity Reliability
Generalizability

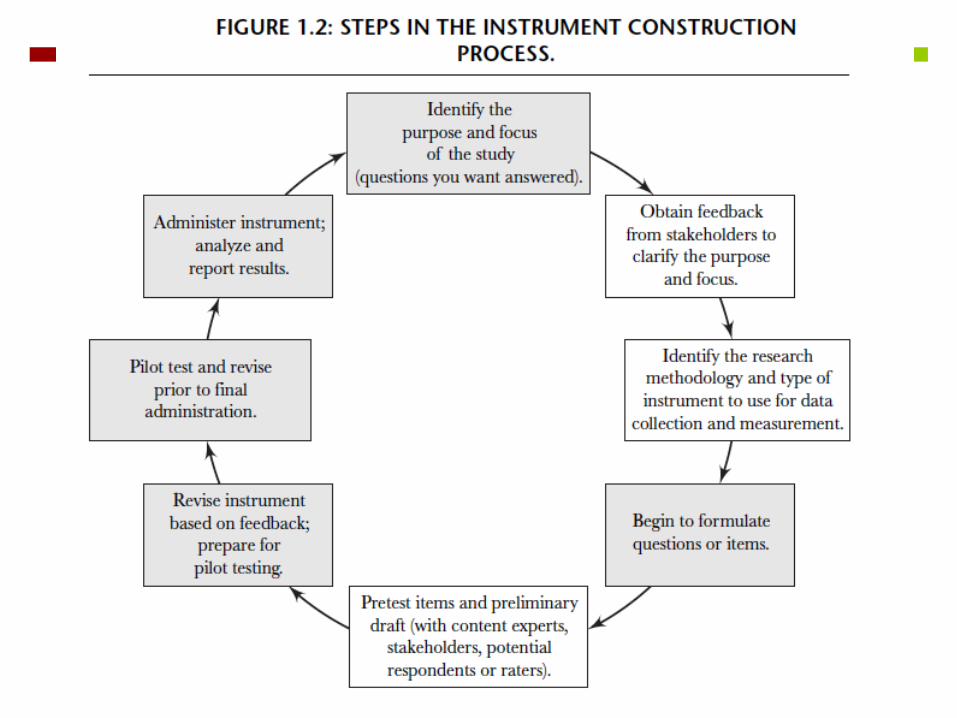
Designing Research Instruments
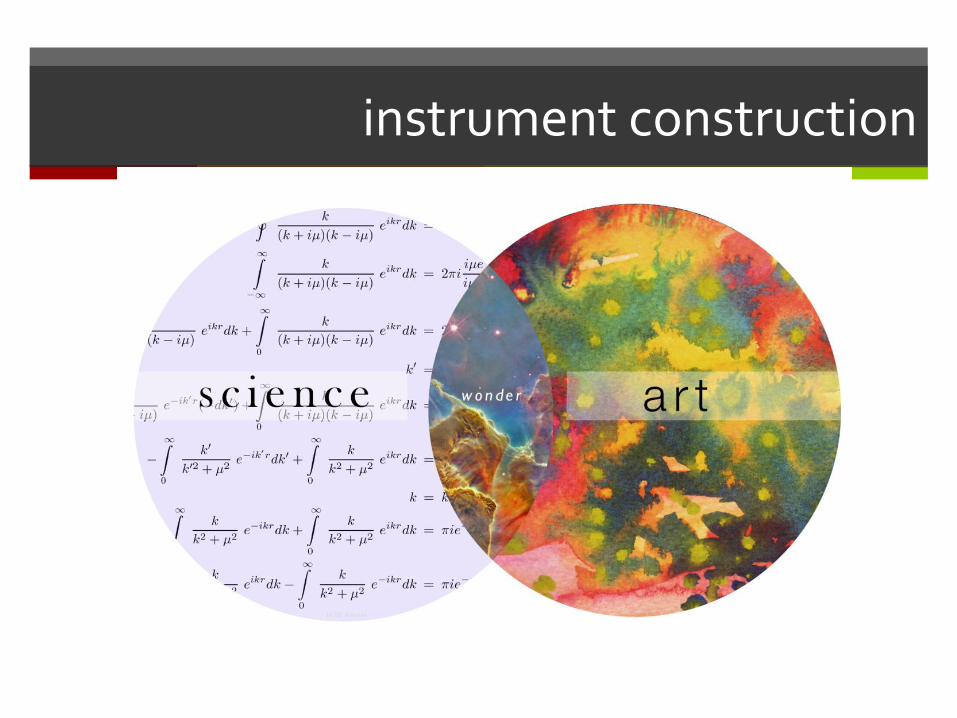
instrument construction

An instrument is a mechanism for measuringphenomena, which is used
to gather and recordinformation for
assessment, decision making, and ultimately
understanding
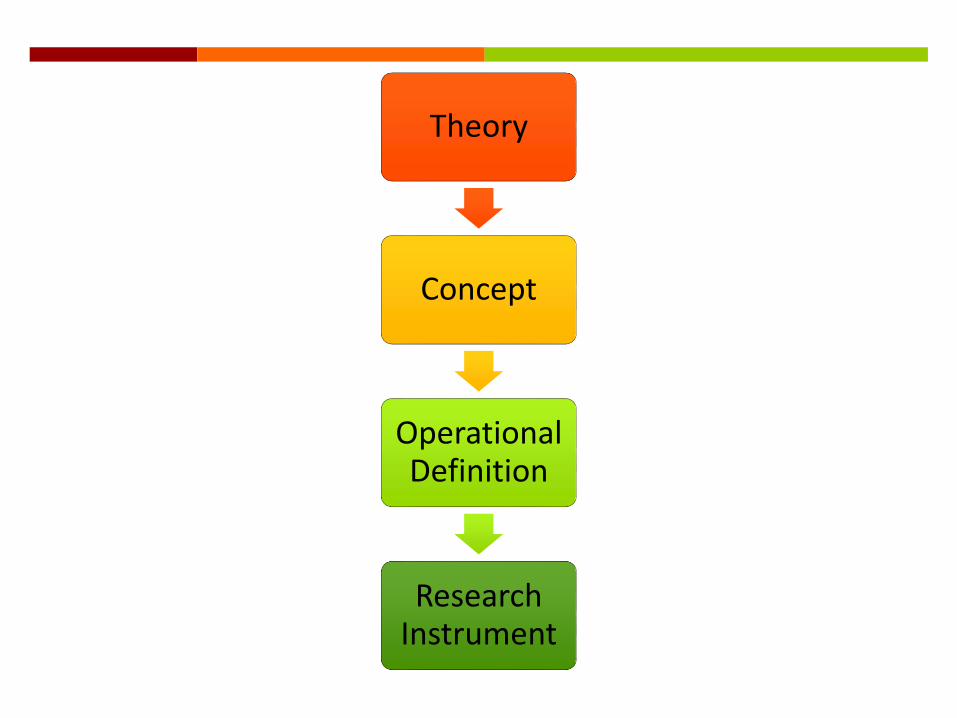
Theory
Concept
Operational Definition
Research Instrument
Description
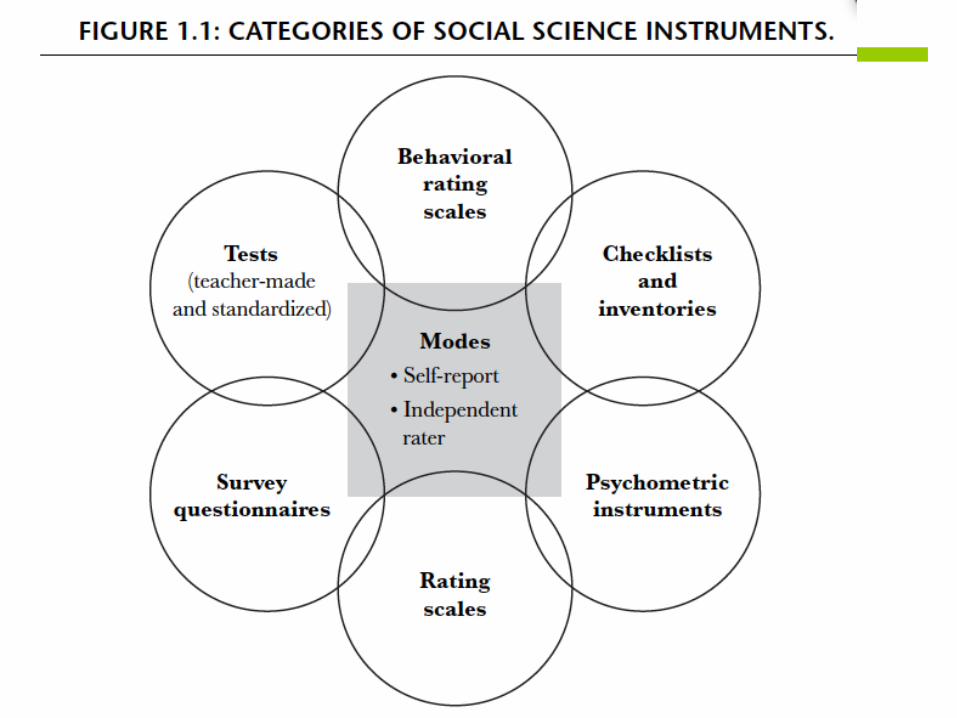
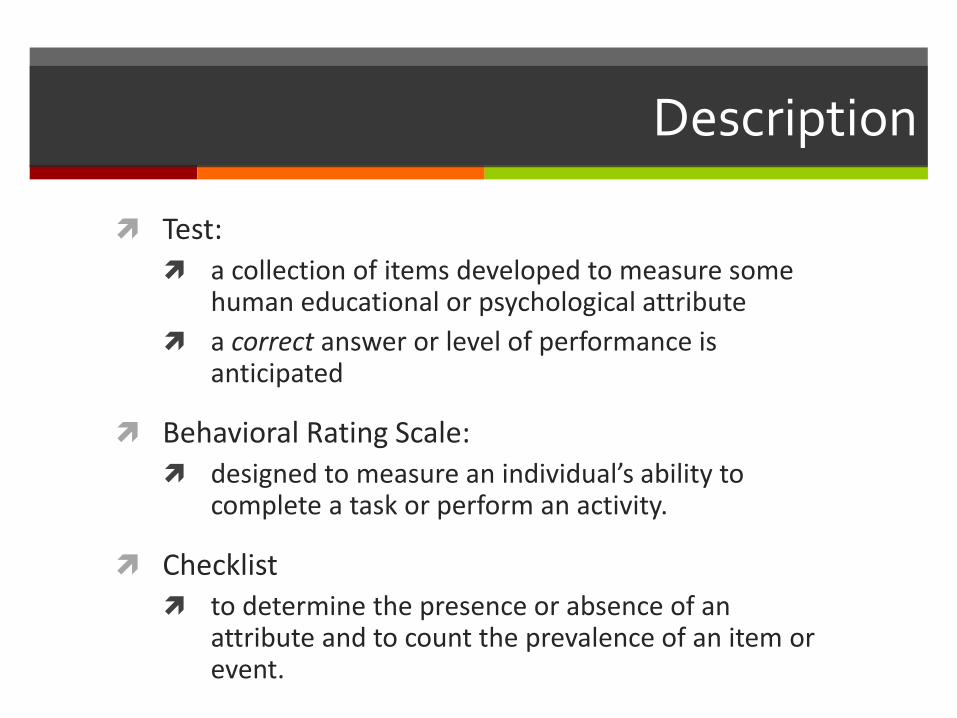
Test:
a collection of items developed to measure some human educational or psychological attribute
a correct answer or level of performance is anticipated
Behavioral Rating Scale:
designed to measure an individual’s ability to complete a task or perform an activity.
Checklist
to determine the presence or absence of an attribute and to count the prevalence of an item or event.

Inventory
a list of objects, goods, or attributes.
Psychometric instruments
Instruments designed to assess cognitive, affective, and physical functioning and personality traits.
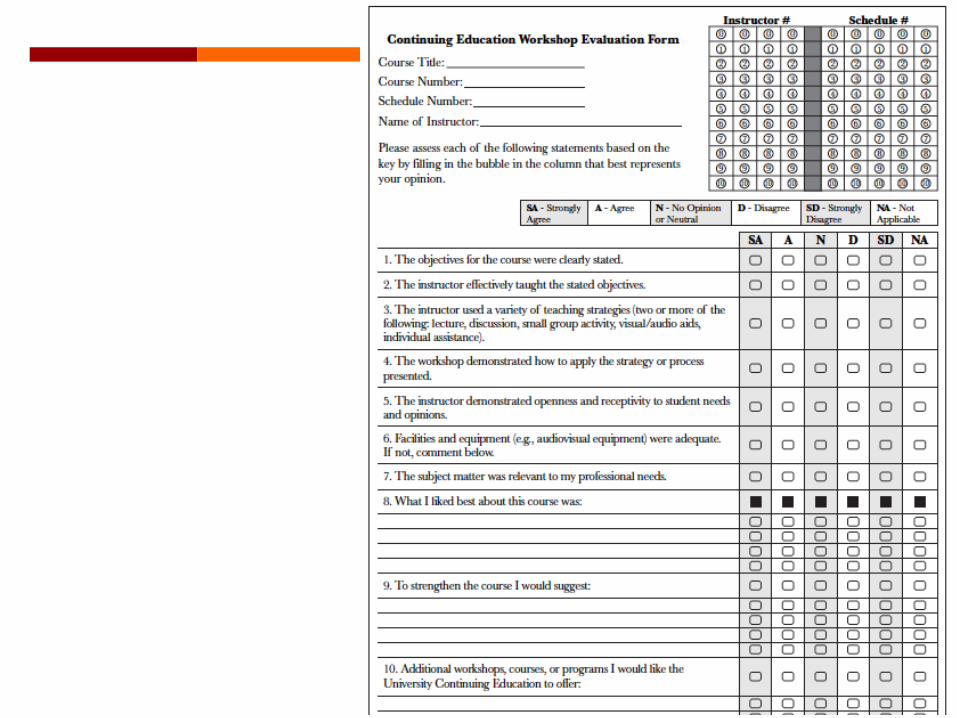
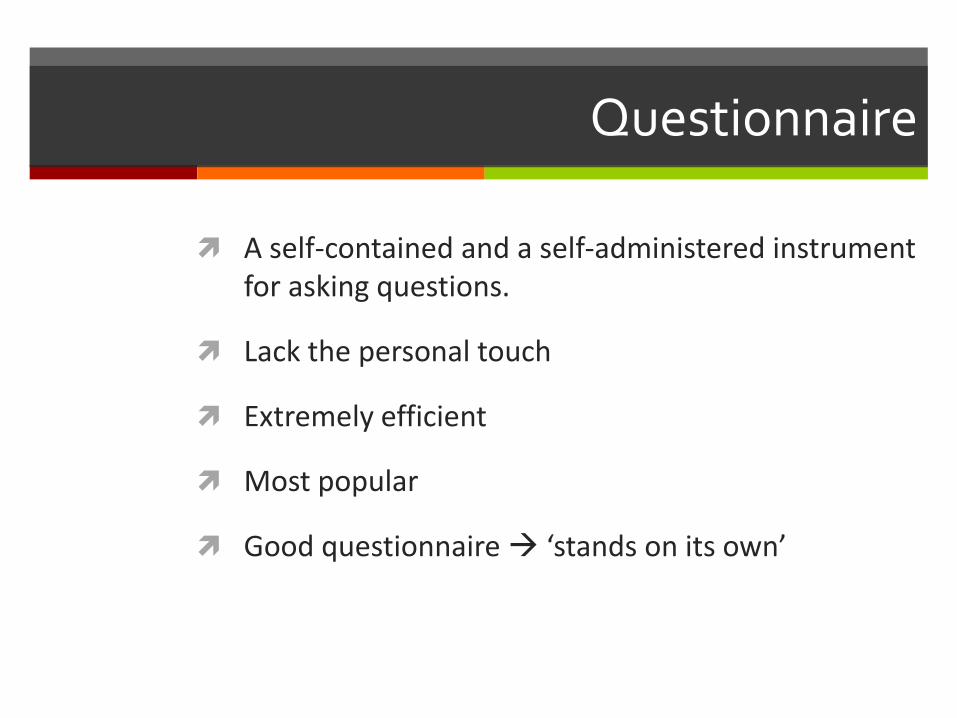
Questionnaire
designed to obtain factual information and to assess beliefs, opinions, and attitudes.
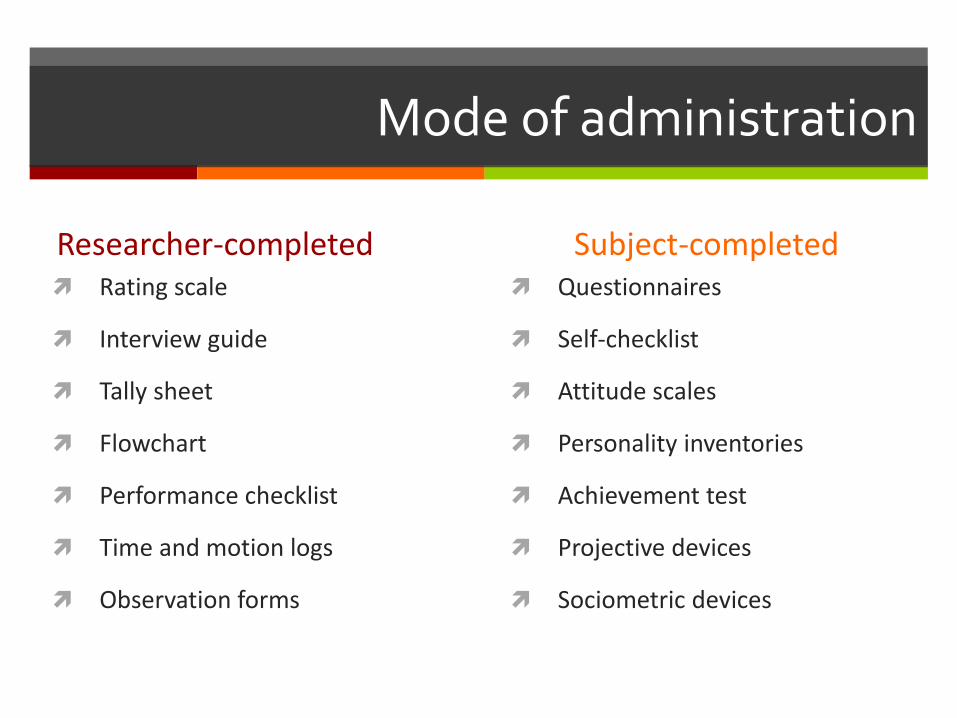
Mode of administration
Researcher-completed Rating scale
Interview guide
Tally sheet
Flowchart
Performance checklist
Time and motion logs
Observation forms
Subject-completed Questionnaires
Self-checklist
Attitude scales
Personality inventories
Achievement test
Projective devices
Sociometric devices
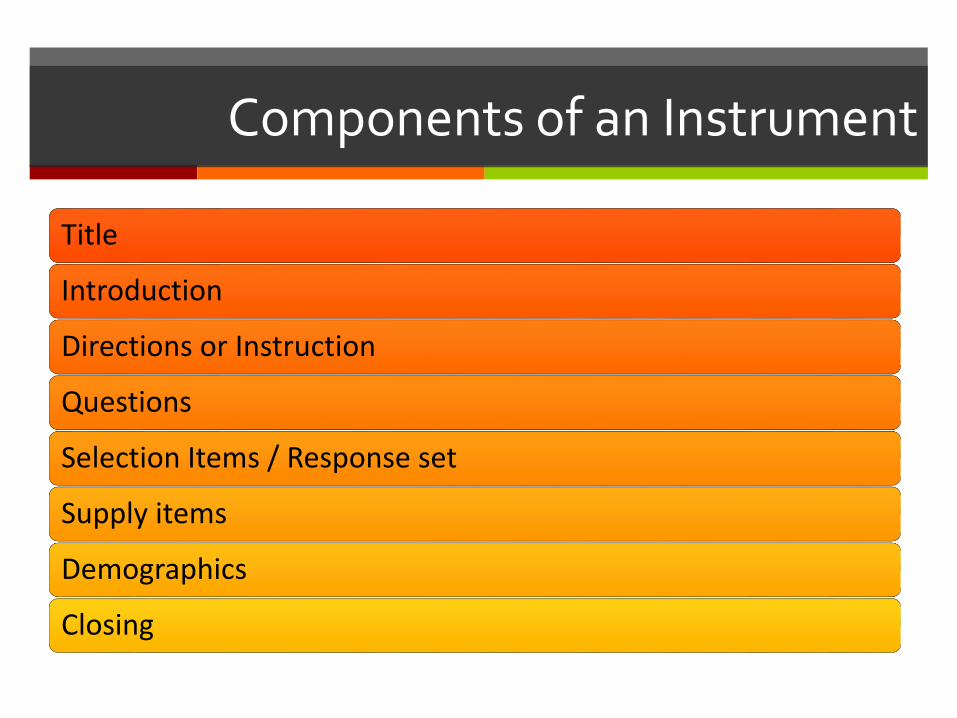
Components of an Instrument
Title
Introduction
Directions or Instruction
Questions
Selection Items / Response set
Supply items
Demographics
Closing

Selecting an Instrument
• The purpose of the study
• The research design
• Object of measurement
• Data Collection Methodology
• Resources
• Characteristics of population (potential response rate)
• Access to subjects
Consider:
Questionnaire
A self-contained and a self-administered instrument for asking questions.
Lack the personal touch
Extremely efficient
Most popular
Good questionnaire ‘stands on its own’
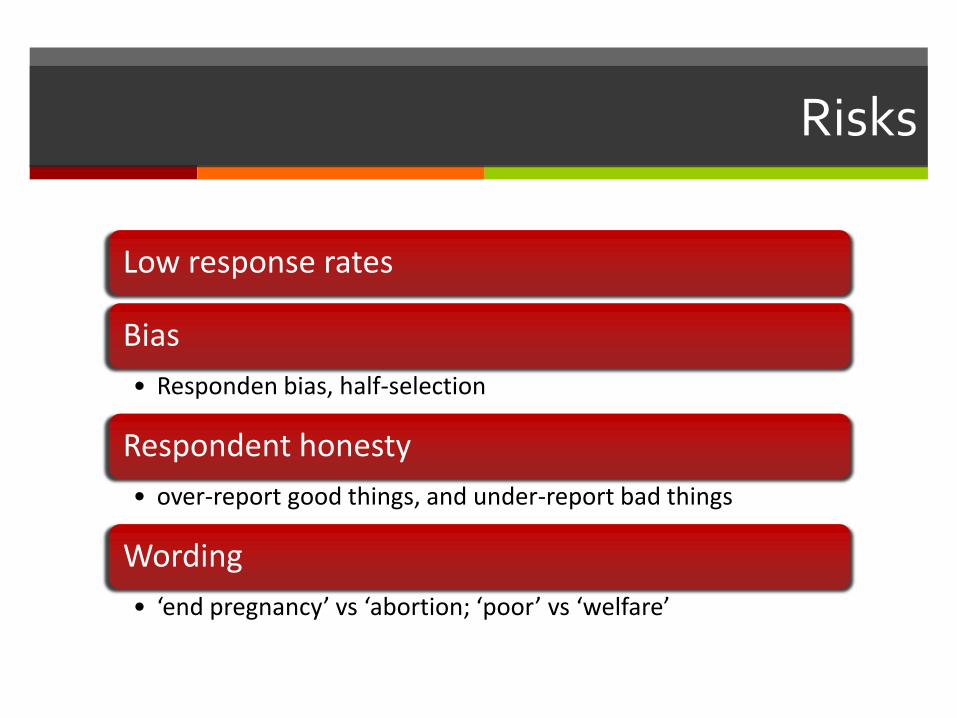
Risks
Low response rates
Bias
• Responden bias, half-selection
Respondent honesty
• over-report good things, and under-report bad things
Wording
• ‘end pregnancy’ vs ‘abortion; ‘poor’ vs ‘welfare’

Question Rules and bad examples
Clear in meaning and free of ambiguity
• “Do you do sport regularly?”
• “What is your total wealth?”
Use common everyday language, avoid jargons, abbreviations, or acronyms
• MDGs, Strategic Plan,
Use neutral language, avoid emotional, leading language
• “What do you find offensive about flag burning?”
• “Why do you think hitting children is wrong?”
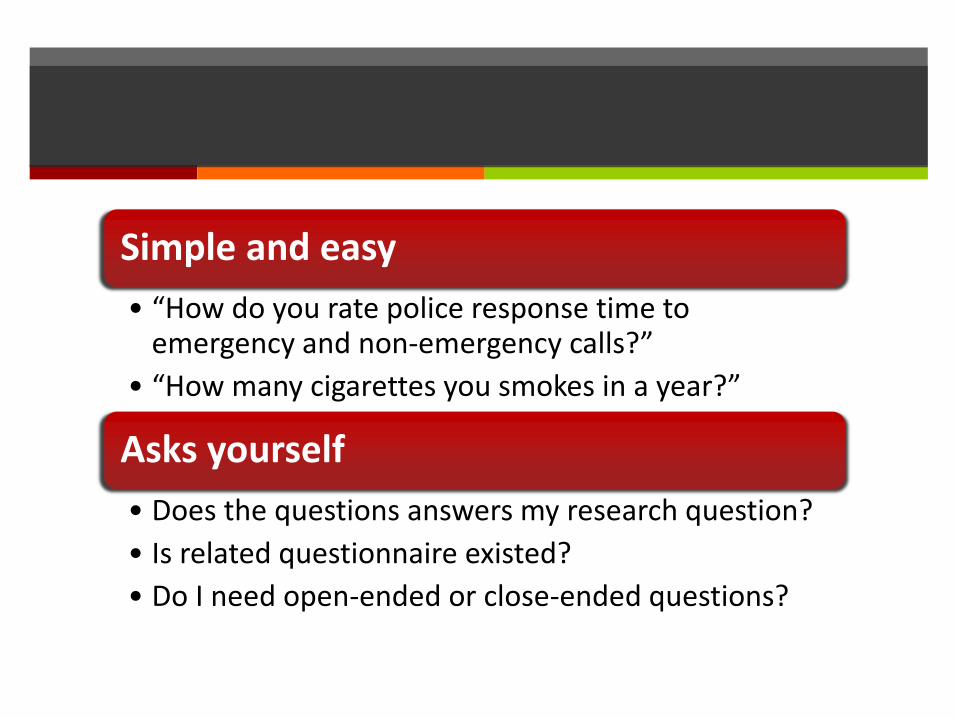
Simple and easy
• “How do you rate police response time to emergency and non-emergency calls?”
• “How many cigarettes you smokes in a year?”
Asks yourself
• Does the questions answers my research question?
• Is related questionnaire existed?
• Do I need open-ended or close-ended questions?
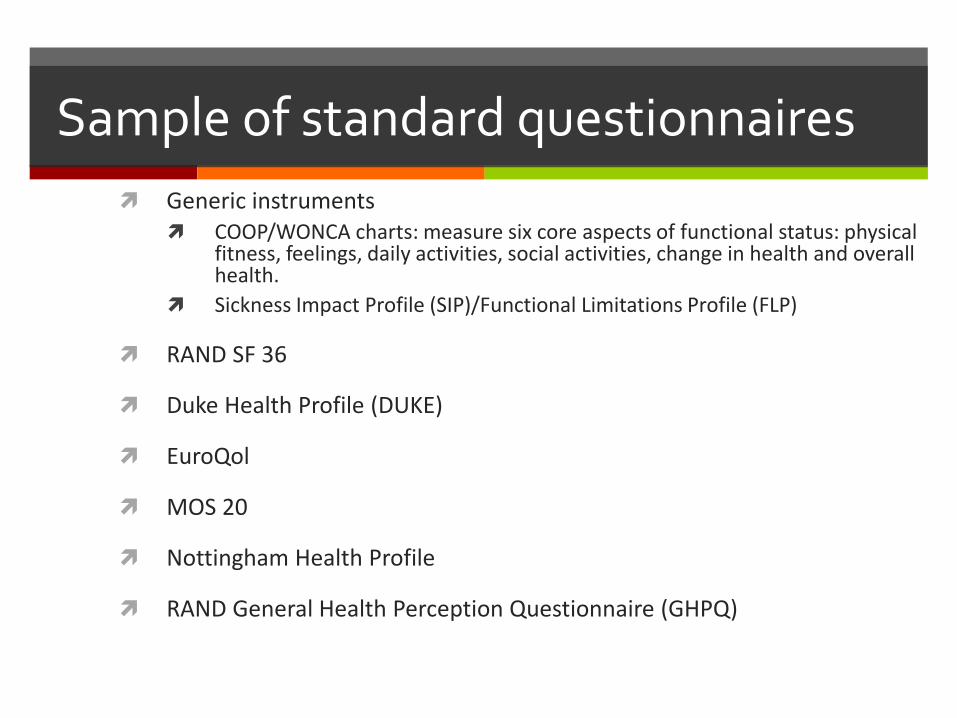
Sample of standard questionnaires
Generic instruments COOP/WONCA charts: measure six core aspects of functional status: physical
fitness, feelings, daily activities, social activities, change in health and overall health.
Sickness Impact Profile (SIP)/Functional Limitations Profile (FLP)
RAND SF 36
Duke Health Profile (DUKE)
EuroQol
MOS 20
Nottingham Health Profile
RAND General Health Perception Questionnaire (GHPQ)
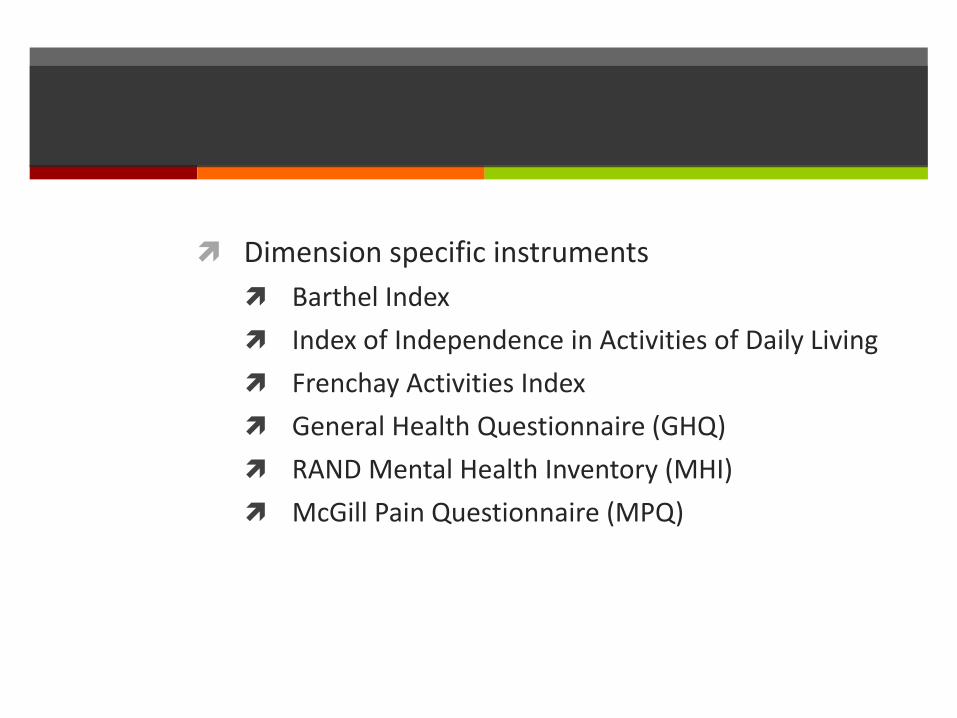
Dimension specific instruments
Barthel Index
Index of Independence in Activities of Daily Living
Frenchay Activities Index
General Health Questionnaire (GHQ)
RAND Mental Health Inventory (MHI)
McGill Pain Questionnaire (MPQ)

Disease/condition specific instruments
State-Trait Anxiety Inventory (STAI)
Center for Epidemiologic Studies Depression Scale (CES-D)
Arthritis Impact Measurement Scale (AIMS)
Living with Asthma (AQ)
Chronic Respiratory Disease Questionnaire (CRDQ)
Asthma Quality of Life Questionnaire (AQLQ)
Diabetes Health Profile IDDM (DHP 1) and NIDDM (DHP2)
Diabetes Quality-of-Life measure (DQOL)
EORTC Quality of Life Questionnaire

Techniques to create content of questionaire
Literature review
Use available questionnaire
Brainstorming
Nominal Group Technique
Group 5-6 people
Facilitator explain the purpose and problems
All participants write and share ideas
Other participant may ask for clarification
Repeat the brainstorming process until all ideas are collected.
All participant review all ideas
Develop a priority ranking

Creating content of questionnaire
Snowballing / Pyramiding
2 2+2 4+4 dst
Delphi technique
Researcher create the first draft
Collect input from experts through email/letter.
Experts give comments independently.
Creating content of questionnaire
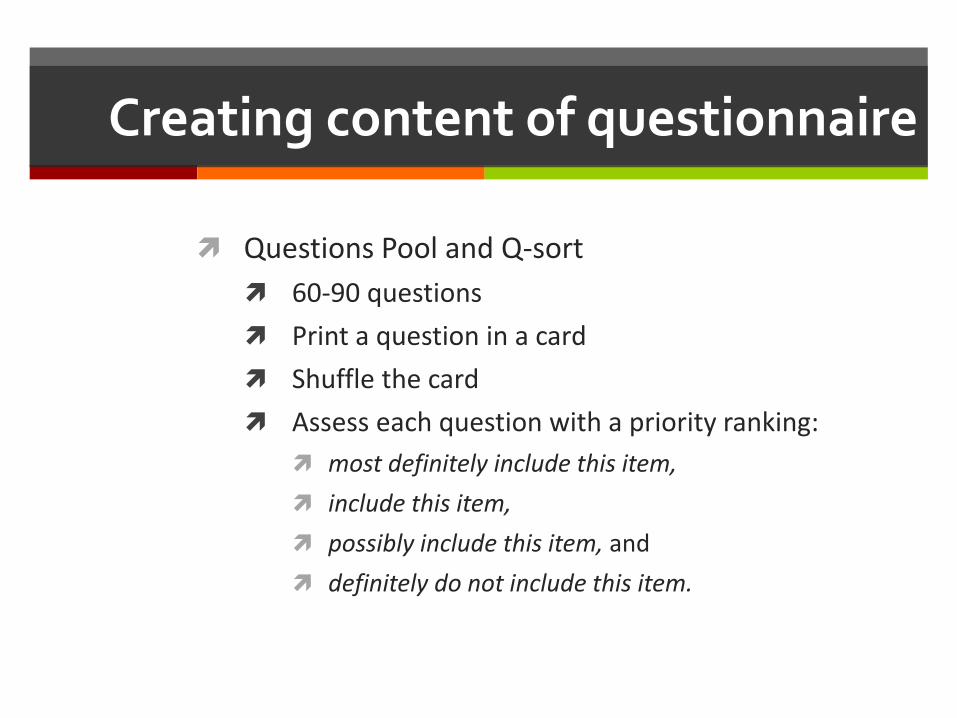
Questions Pool and Q-sort
60-90 questions
Print a question in a card
Shuffle the card
Assess each question with a priority ranking:
most definitely include this item,
include this item,
possibly include this item, and
definitely do not include this item.
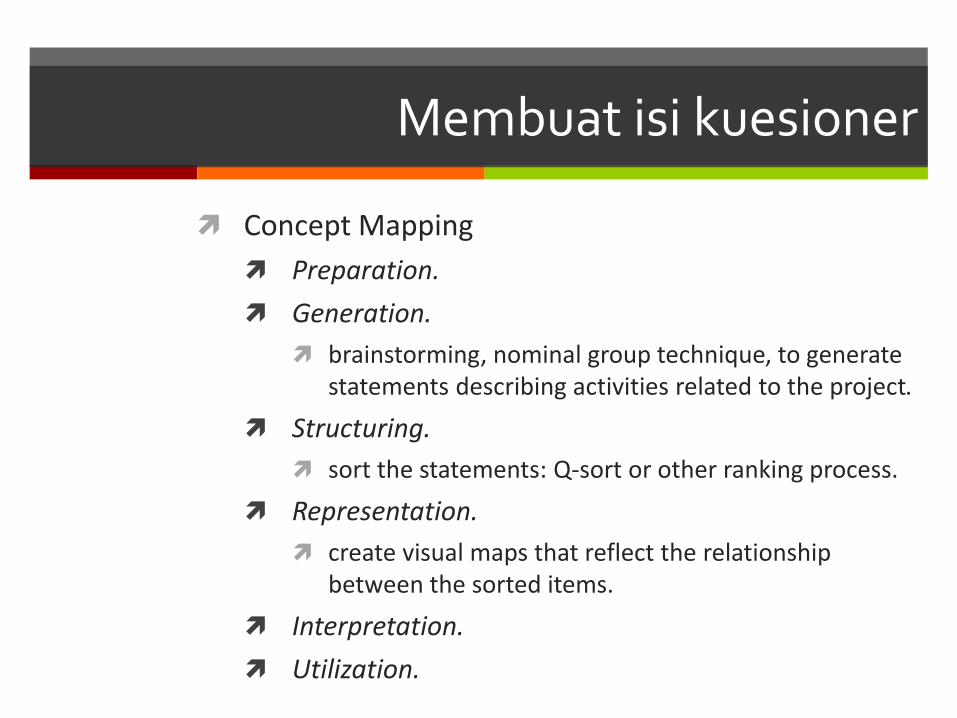
Membuat isi kuesioner
Concept Mapping
Preparation.
Generation.
brainstorming, nominal group technique, to generate statements describing activities related to the project.
Structuring.
sort the statements: Q-sort or other ranking process.
Representation.
create visual maps that reflect the relationship between the sorted items.
Interpretation.
Utilization.
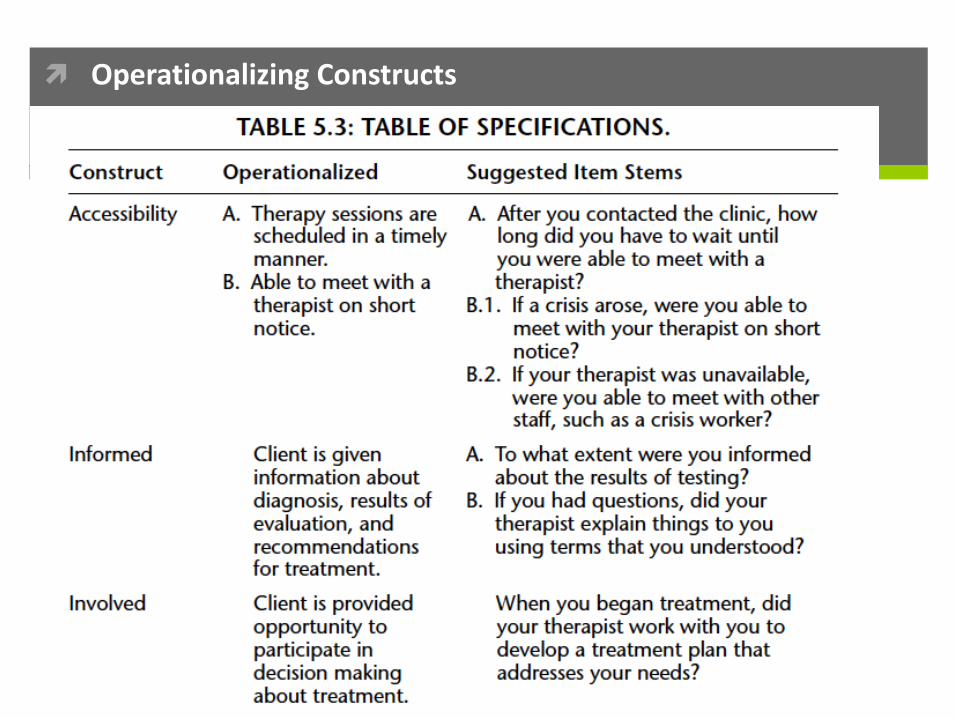
Operationalizing Constructs
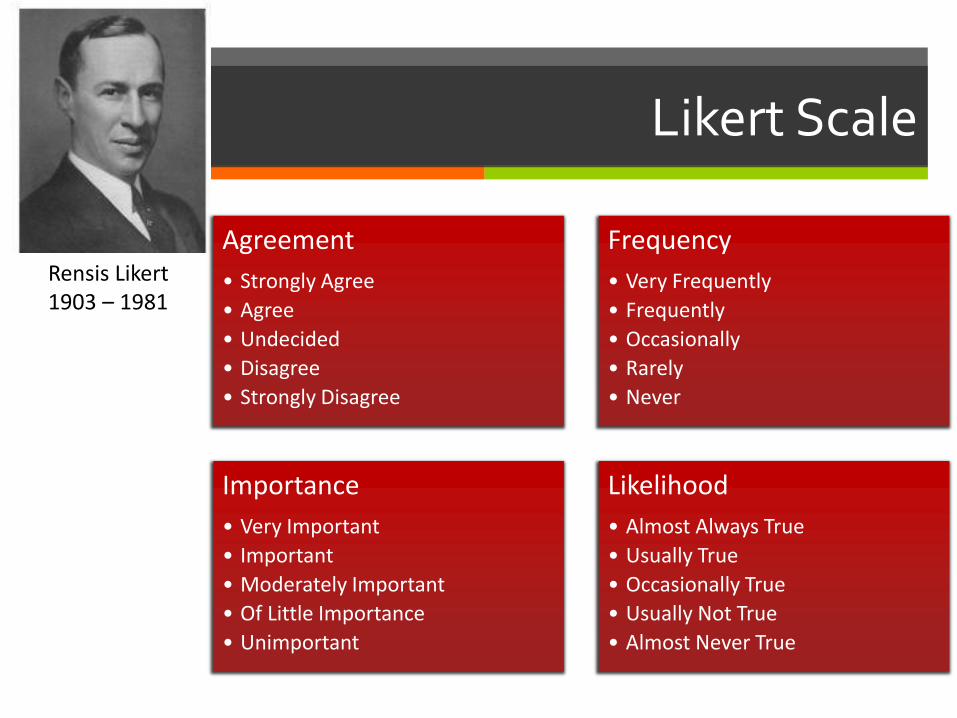
Likert Scale
Rensis Likert1903 – 1981
Agreement
• Strongly Agree
• Agree
• Undecided
• Disagree
• Strongly Disagree
Frequency
• Very Frequently
• Frequently
• Occasionally
• Rarely
• Never
Importance
• Very Important
• Important
• Moderately Important
• Of Little Importance
• Unimportant
Likelihood
• Almost Always True
• Usually True
• Occasionally True
• Usually Not True
• Almost Never True
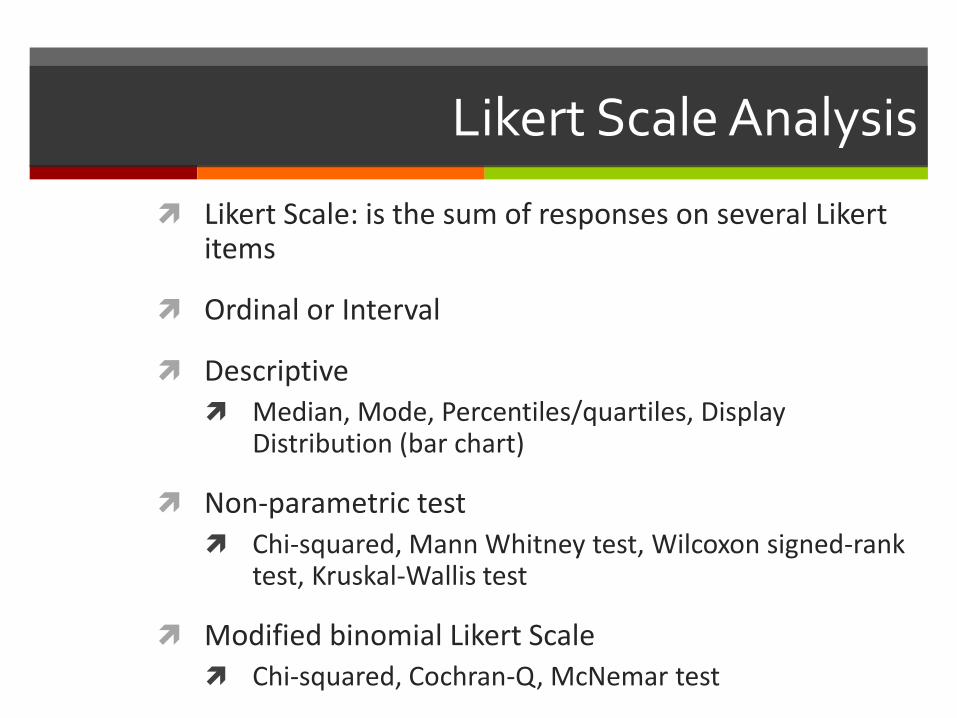
Likert Scale Analysis
Likert Scale: is the sum of responses on several Likertitems
Ordinal or Interval
Descriptive
Median, Mode, Percentiles/quartiles, Display Distribution (bar chart)
Non-parametric test
Chi-squared, Mann Whitney test, Wilcoxon signed-rank test, Kruskal-Wallis test
Modified binomial Likert Scale
Chi-squared, Cochran-Q, McNemar test

Observation Checklist
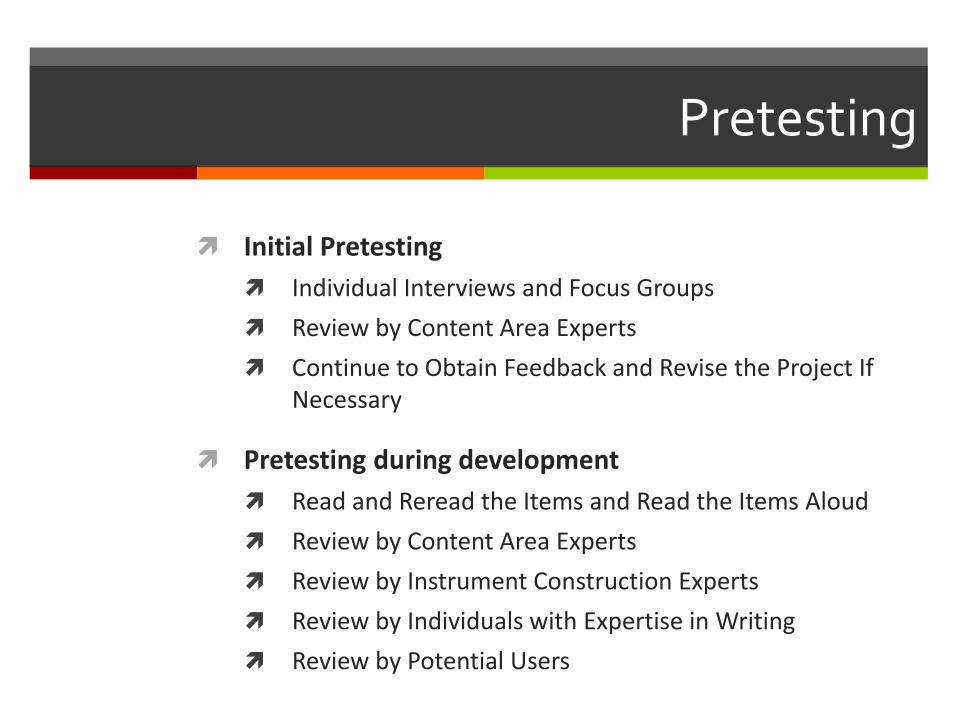
Pretesting
Initial Pretesting
Individual Interviews and Focus Groups
Review by Content Area Experts
Continue to Obtain Feedback and Revise the Project If Necessary
Pretesting during development
Read and Reread the Items and Read the Items Aloud
Review by Content Area Experts
Review by Instrument Construction Experts
Review by Individuals with Expertise in Writing
Review by Potential Users
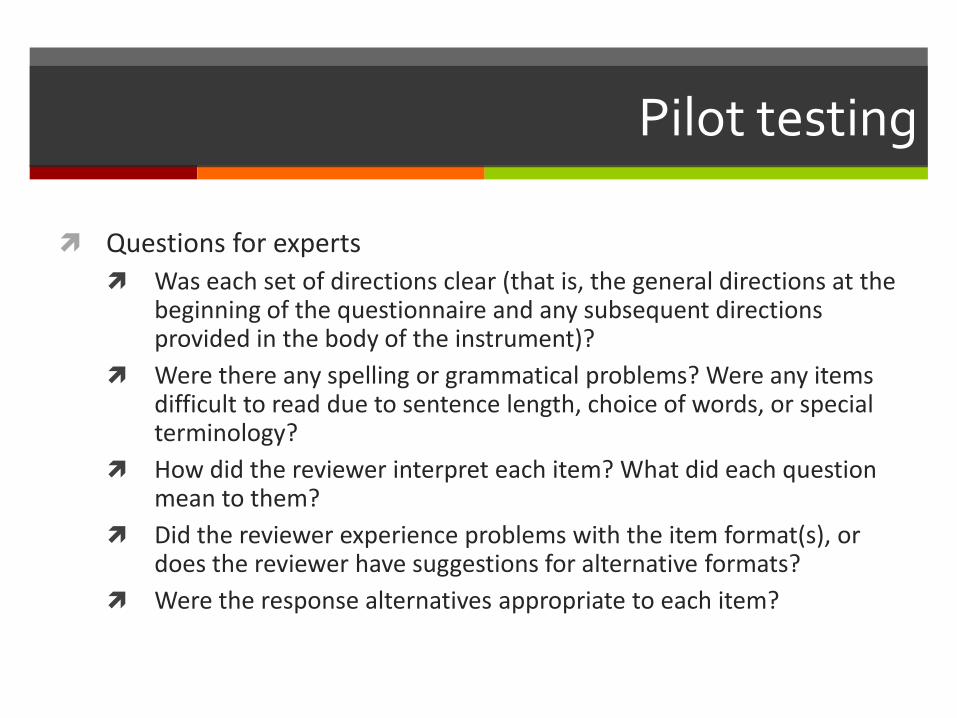
Pilot testing
Questions for experts
Was each set of directions clear (that is, the general directions at the beginning of the questionnaire and any subsequent directions provided in the body of the instrument)?
Were there any spelling or grammatical problems? Were any items difficult to read due to sentence length, choice of words, or special terminology?
How did the reviewer interpret each item? What did each question mean to them?
Did the reviewer experience problems with the item format(s), or does the reviewer have suggestions for alternative formats?
Were the response alternatives appropriate to each item?
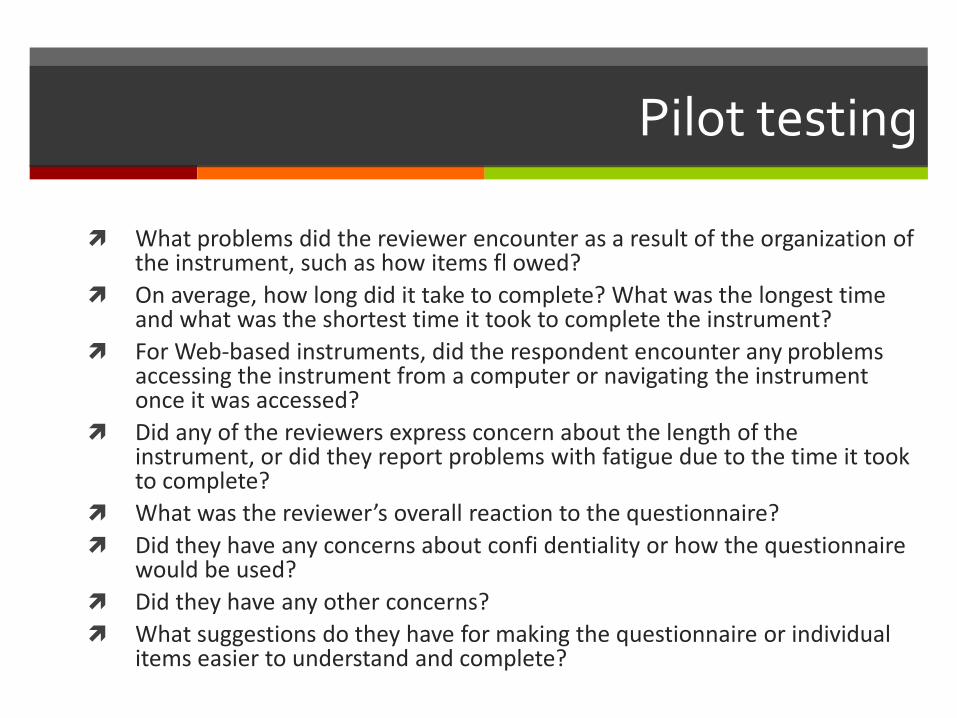
Pilot testing
What problems did the reviewer encounter as a result of the organization of the instrument, such as how items fl owed?
On average, how long did it take to complete? What was the longest time and what was the shortest time it took to complete the instrument?
For Web-based instruments, did the respondent encounter any problems accessing the instrument from a computer or navigating the instrument once it was accessed?
Did any of the reviewers express concern about the length of the instrument, or did they report problems with fatigue due to the time it took to complete?
What was the reviewer’s overall reaction to the questionnaire?
Did they have any concerns about confi dentiality or how the questionnaire would be used?
Did they have any other concerns?
What suggestions do they have for making the questionnaire or individual items easier to understand and complete?
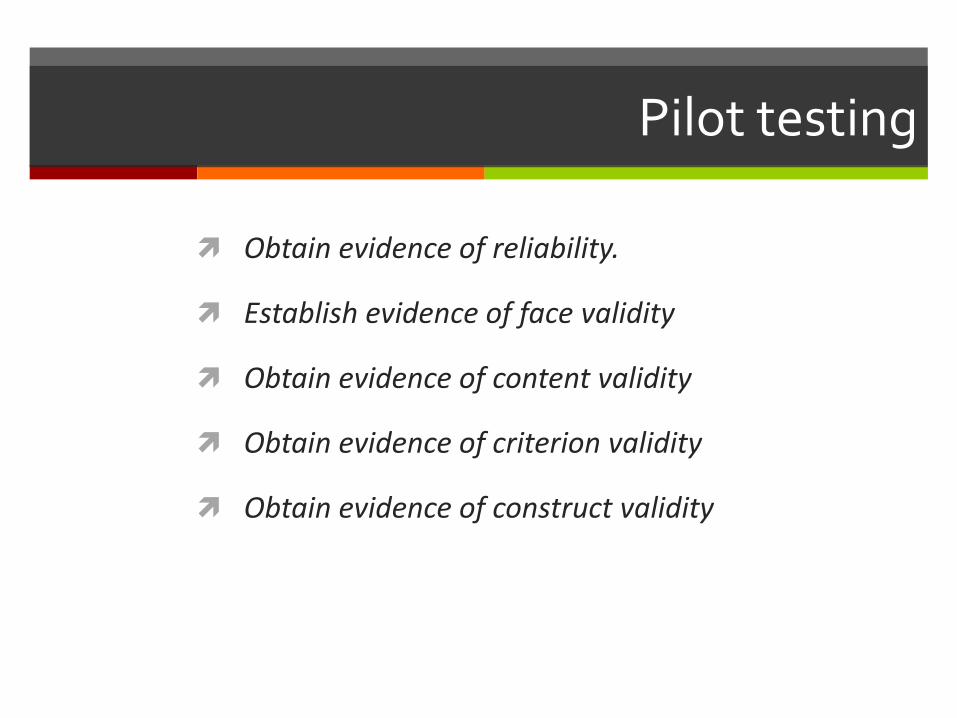
Pilot testing
Obtain evidence of reliability.
Establish evidence of face validity
Obtain evidence of content validity
Obtain evidence of criterion validity
Obtain evidence of construct validity

Data Collection Methodology
Self-administered
Individual, Letter
Group
Pooling
Email/internet
Observation
Checklist
Combination of format and approach
Practice+ Emotion
Checklist+ fill the blank+rating scales


Measurement
Validity
Reliability
Generalisibility

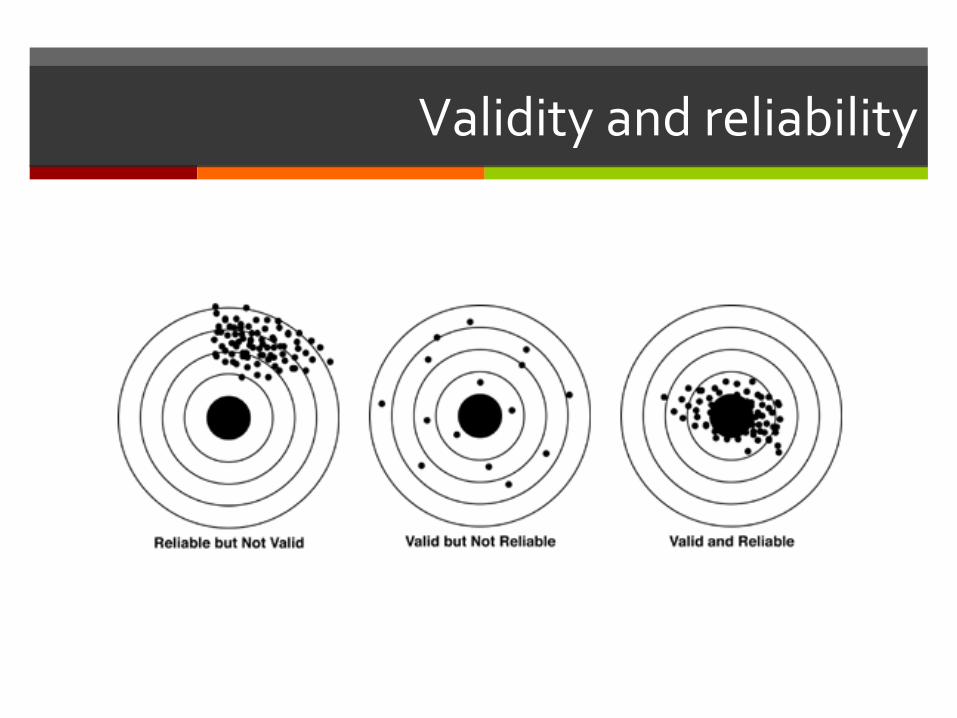
Validity and reliability

Validity
Apakah kita mengukur apa yang ingin kita ukur?
Konsep seringkali sulit diukur
Misalnya:
Konsep : Pengetahuan.
Latent & Manifest Variable
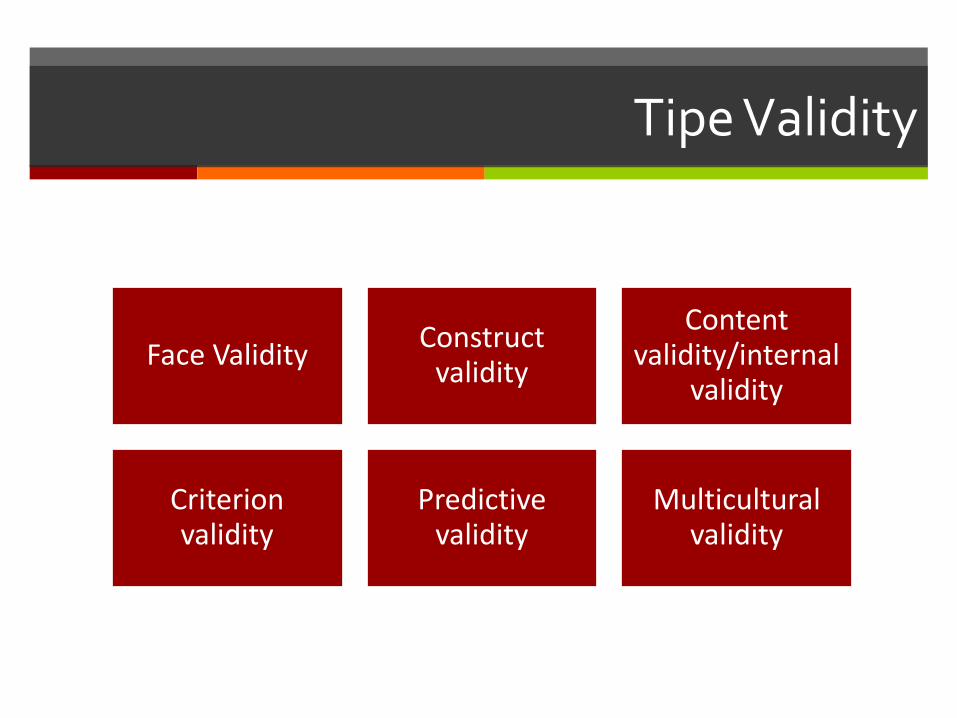
Tipe Validity
Face ValidityConstruct
validity
Content validity/internal
validity
Criterion validity
Predictive validity
Multicultural validity
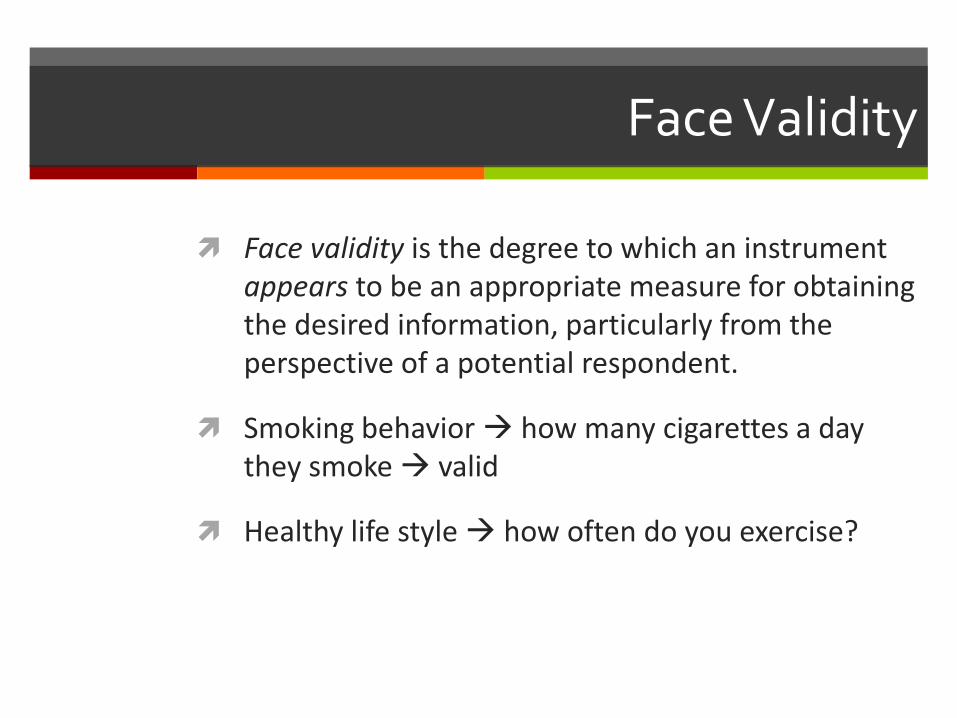
Face Validity
Face validity is the degree to which an instrument appears to be an appropriate measure for obtaining the desired information, particularly from the perspective of a potential respondent.
Smoking behavior how many cigarettes a day they smoke valid
Healthy life style how often do you exercise?
Construct Validity
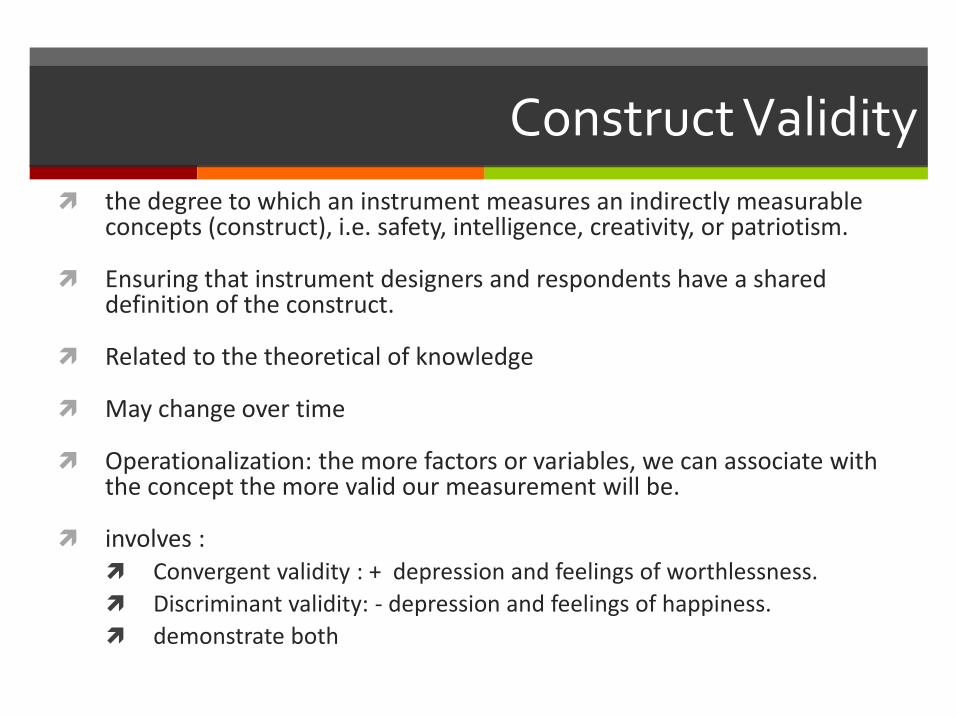
the degree to which an instrument measures an indirectly measurable concepts (construct), i.e. safety, intelligence, creativity, or patriotism.
Ensuring that instrument designers and respondents have a shared definition of the construct.
Related to the theoretical of knowledge
May change over time
Operationalization: the more factors or variables, we can associate with the concept the more valid our measurement will be.
involves : Convergent validity : + depression and feelings of worthlessness.
Discriminant validity: - depression and feelings of happiness.
demonstrate both
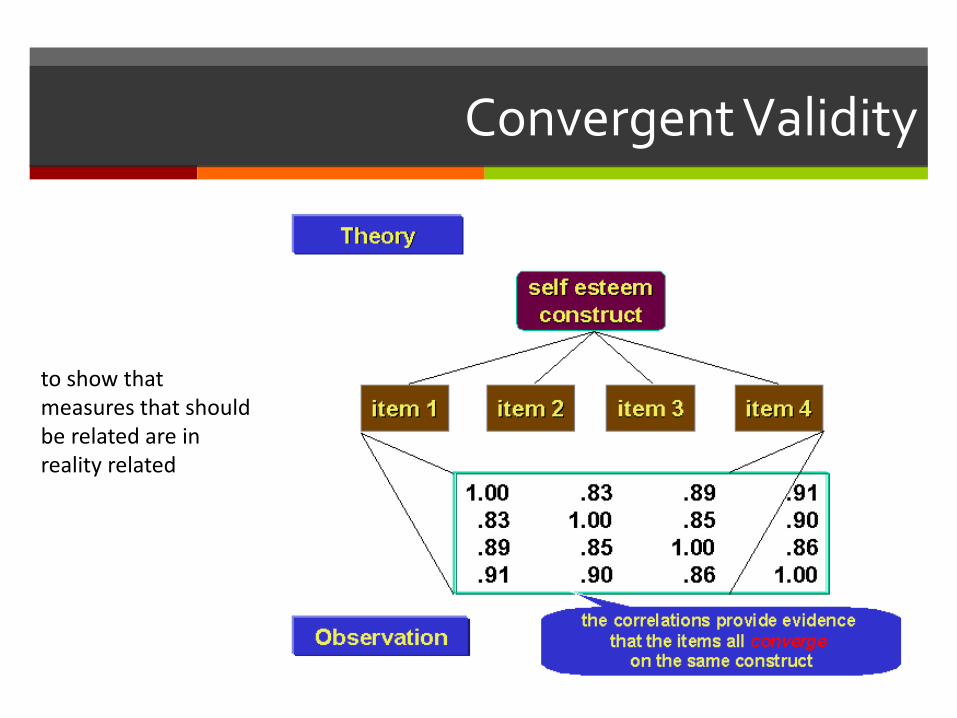
Convergent Validity
to show that measures that should be related are in reality related
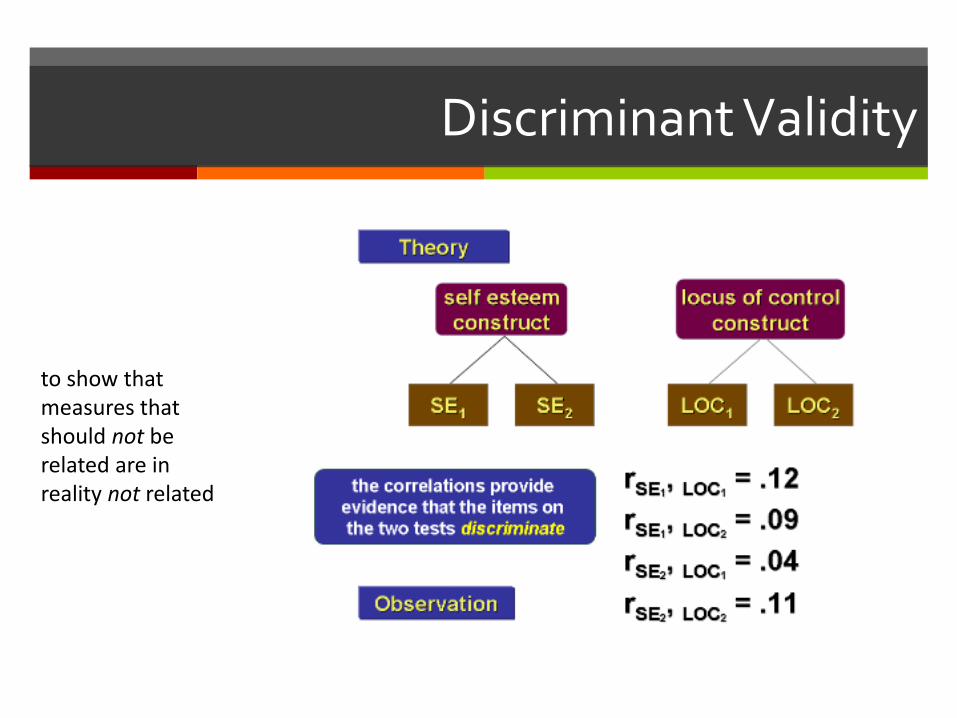
Discriminant Validity
to show that measures that should not be related are in reality not related
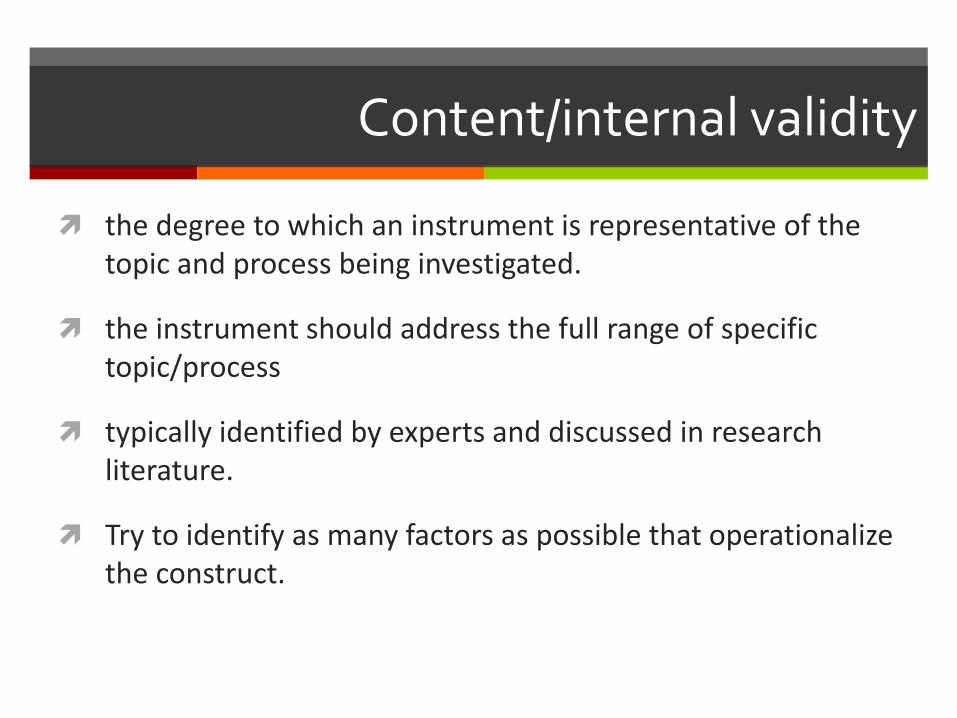
Content/internal validity
the degree to which an instrument is representative of the topic and process being investigated.
the instrument should address the full range of specific topic/process
typically identified by experts and discussed in research literature.
Try to identify as many factors as possible that operationalize the construct.
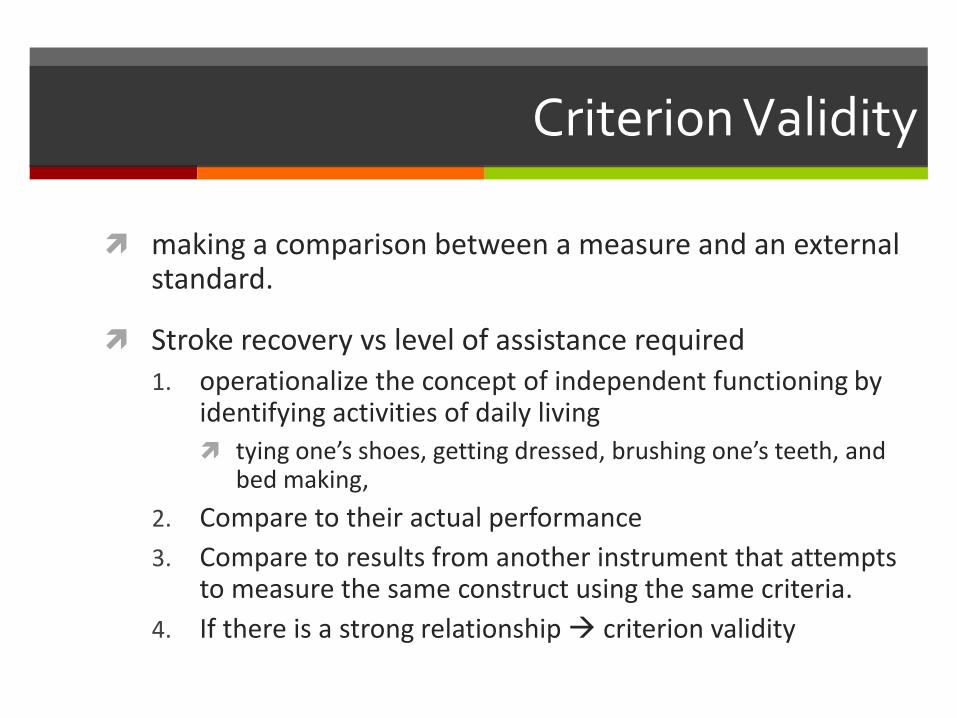
Criterion Validity
making a comparison between a measure and an external standard.
Stroke recovery vs level of assistance required
1. operationalize the concept of independent functioning byidentifying activities of daily living
tying one’s shoes, getting dressed, brushing one’s teeth, and bed making,
2. Compare to their actual performance
3. Compare to results from another instrument that attempts to measure the same construct using the same criteria.
4. If there is a strong relationship criterion validity
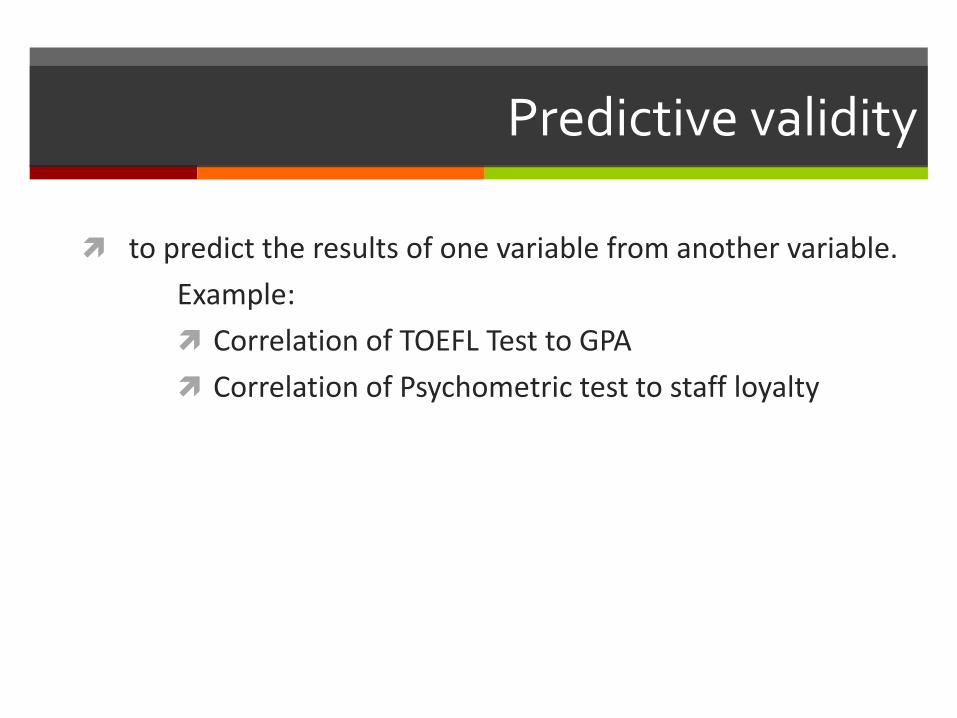
Predictive validity
to predict the results of one variable from another variable.
Example:
Correlation of TOEFL Test to GPA
Correlation of Psychometric test to staff loyalty

Multicultural validity
an instrument measures what it purports to measure as understood by an audience of a particular culture
a multiculturally valid instrument will use language appropriate to its intended audience.
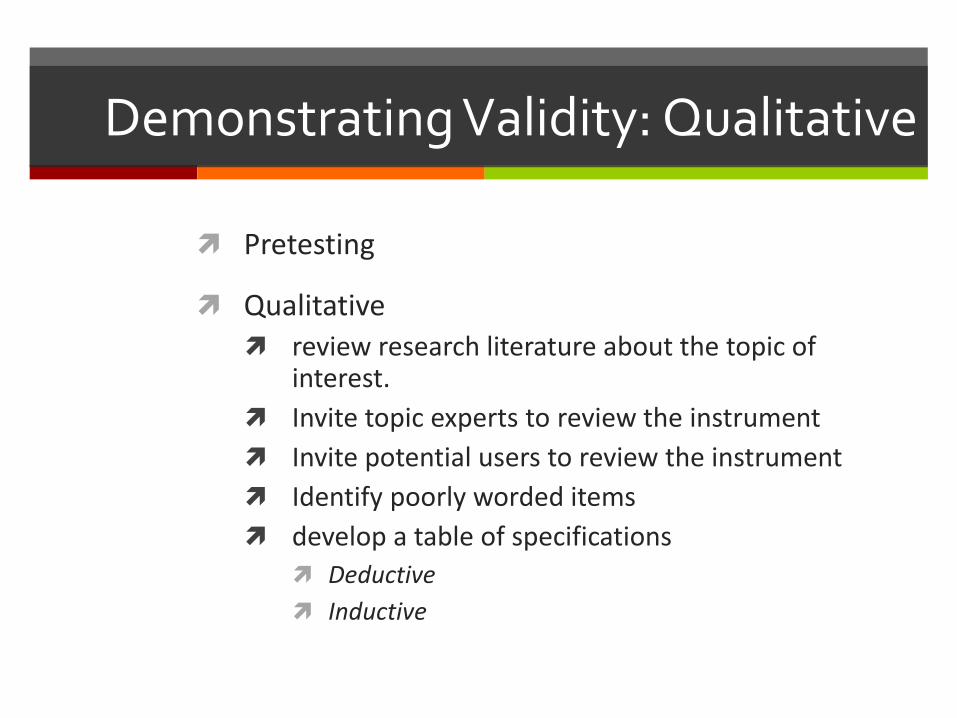
Demonstrating Validity: Qualitative
Pretesting
Qualitative
review research literature about the topic of interest.
Invite topic experts to review the instrument
Invite potential users to review the instrument
Identify poorly worded items
develop a table of specifications
Deductive
Inductive
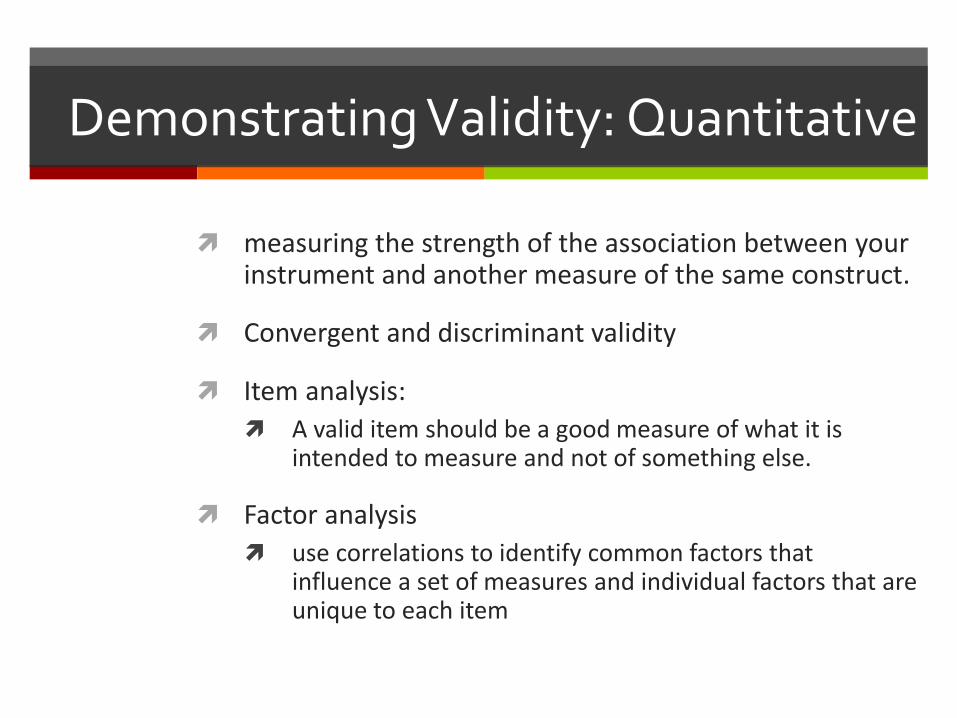
Demonstrating Validity: Quantitative
measuring the strength of the association between your instrument and another measure of the same construct.
Convergent and discriminant validity
Item analysis:
A valid item should be a good measure of what it is intended to measure and not of something else.
Factor analysis
use correlations to identify common factors that influence a set of measures and individual factors that are unique to each item

Item Analysis
Item analysis
To demonstrate a relationship between individual items
Internal consistency reliability
1-2, 1-3, 1-4, 1-5, …
2-3, 2-4, 2-5, 2-6, …

Exploratory Factor Analysis
To identify the nature of constructs underlying responses in a specific content area
To determine what sets of items ‘hang together’ in a questionnaire, and
To demonstrate the dimensionality of a measurement scale [where] researchers wish to develop scales that respond to a single characteristic

Difficulty & Discrimination index
Choose 10 top scorer and 10 lowest scorer Select randomly if there are more than 10 top/lowest
scorer
Count how many subject in the top scorer group and lowest scorer group answer question 1 correctly, question 2, and so on..
Difficulty index: correct answers/total participants (RU+RL)/20
Discrimination index: (RU-RL)/10 >0 : positive discrimination
<0 : negative discrimination

Name Item 1
1 1 Difficulty Index: (8+4)/20 = 0.6
2 1 Discrimination index (8-4)/10= 0.4
3 1 Compare to the maximum discriminating index
4 0 Near maximum: very discriminating
5 1 Half the maximum: moderately discriminating
6 1 A quarter the maximum: weak item
7 0 Near zero : non-discriminating
8 1 Negative: bad item
9 1
10 1 RU=8
…….
31 0
32 0
33 1
34 1
35 1
36 0
37 0
38 1
39 0
40 0 RL=4

Reliability
True ScoreSystematic
Error
Random Error
SCORE
the extent to which an instrument produces the same information at a given time or over a period of time.
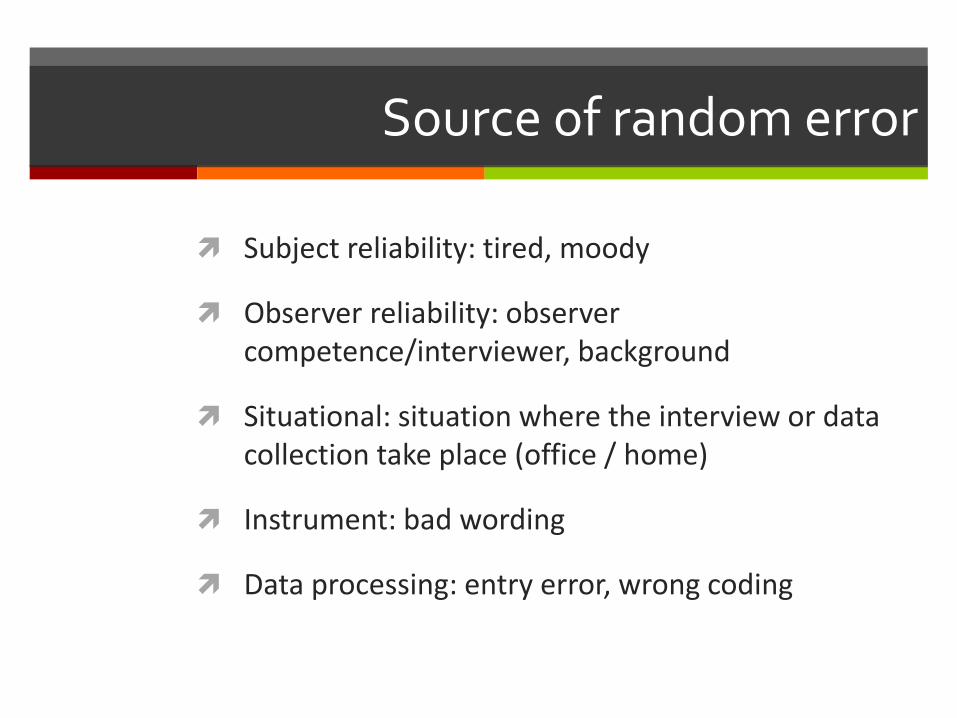
Source of random error
Subject reliability: tired, moody
Observer reliability: observer competence/interviewer, background
Situational: situation where the interview or data collection take place (office / home)
Instrument: bad wording
Data processing: entry error, wrong coding
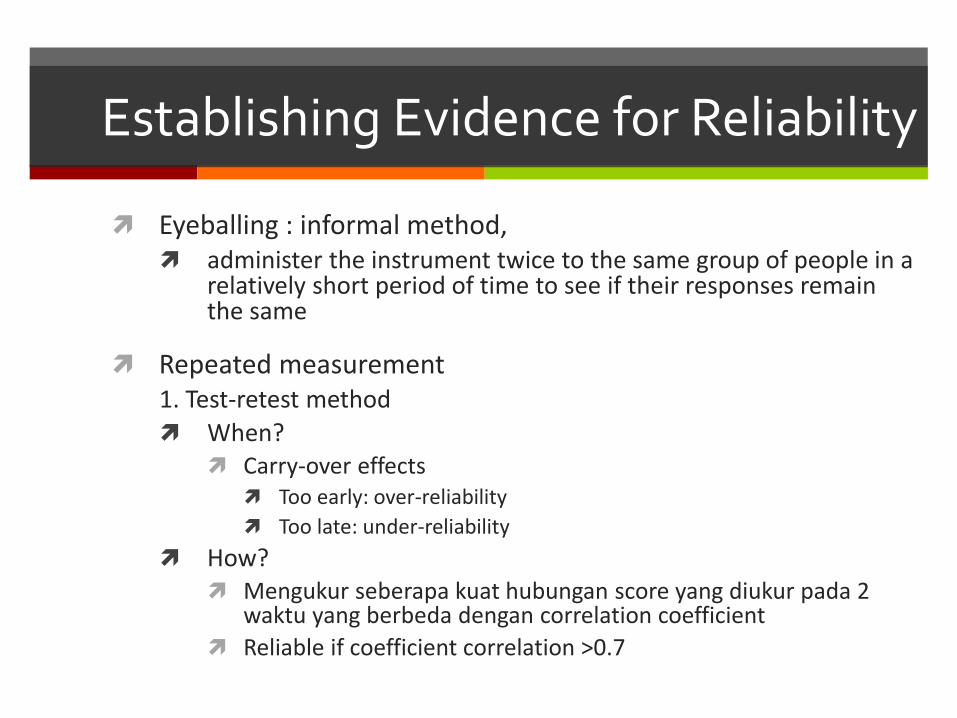
Establishing Evidence for Reliability
Eyeballing : informal method, administer the instrument twice to the same group of people in a
relatively short period of time to see if their responses remain the same
Repeated measurement1. Test-retest method
When? Carry-over effects
Too early: over-reliability
Too late: under-reliability
How? Mengukur seberapa kuat hubungan score yang diukur pada 2
waktu yang berbeda dengan correlation coefficient
Reliable if coefficient correlation >0.7
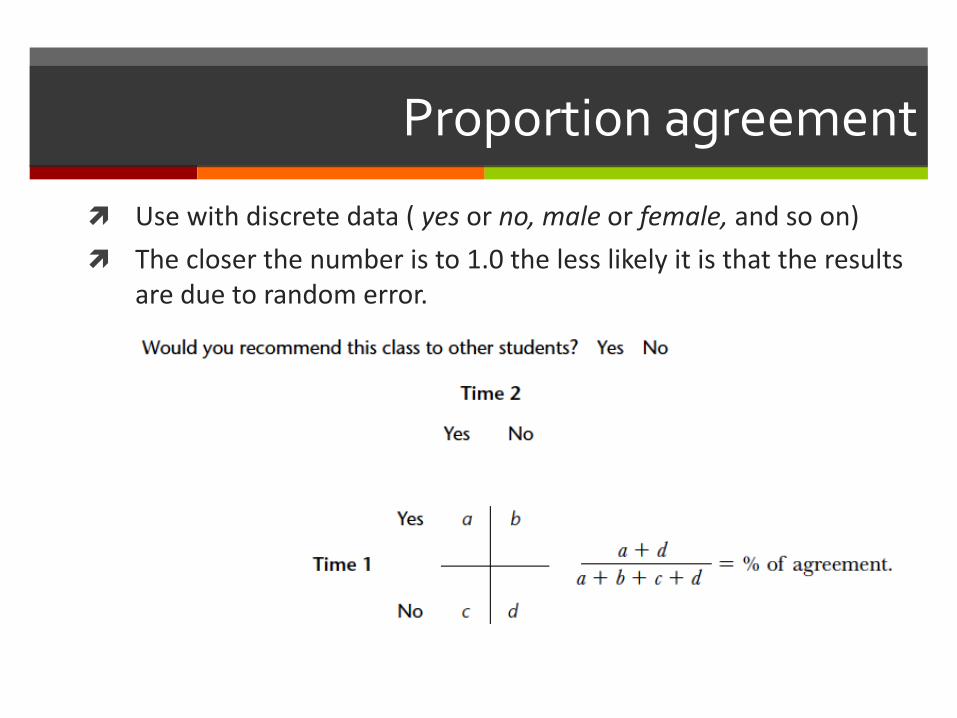
Proportion agreement
Use with discrete data ( yes or no, male or female, and so on)
The closer the number is to 1.0 the less likely it is that the results are due to random error.


Measure of association
Pearson product moment correlation coefficient
>0.80 strong correlations stable
Coefficient of determination: squared value of the correlation coefficient
r: 0.80
r2: 0.64 64% due to variable of interest, 36% due to other factors

Inter-rater and Intra-rater Reliability
Inter –rater: >1 rater
Intra-rater :1 rater
Calculate with Cohen’s Kappa

k =OA - EA
1- EA
-1 <K<1
Kappa Statistic (Cohen, 1960)
OA =A+D
N
OA: Kesepakatan yang terjadiEA: Kesepakatan yg tidak disengaja
EA =
N1 ´N3
N+N2 ´N4
N
é
ëêù
ûú
N

Observer 1
Yes No Total
Observer 2
Yes 140 52 192
No 69 725 794
Total 209 777 986
Agreement between observer 1 and 2
chance agreement between Yes - Yes=
chance agreement between No - No=
total expected change agreement=
Kappa=
Observed agreement=
140 + 725
986= 0.877
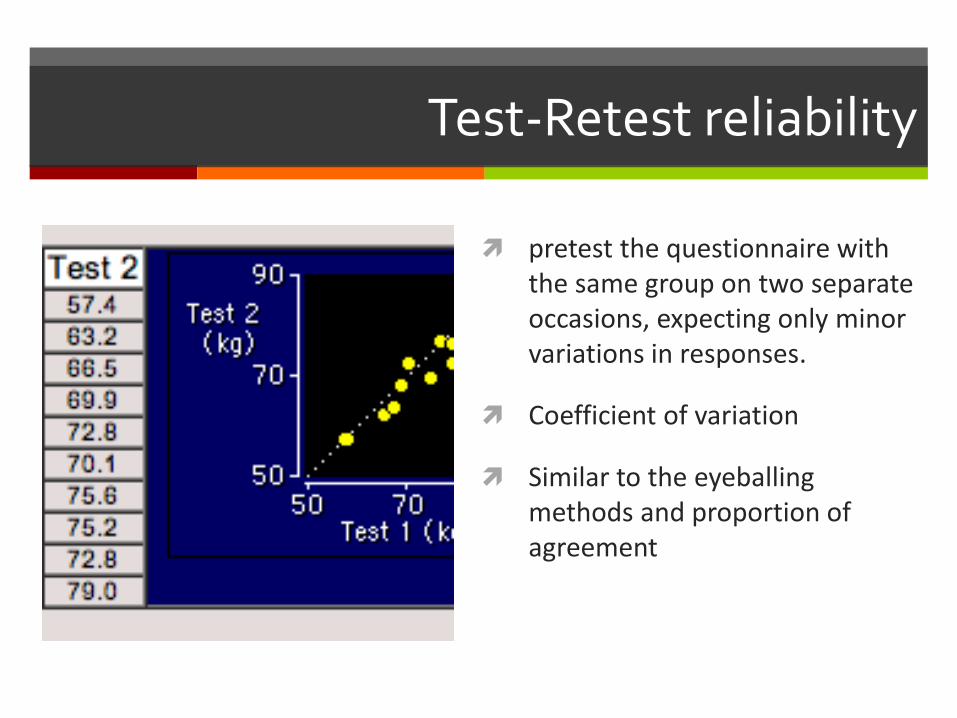
Test-Retest reliability
pretest the questionnaire with the same group on two separate occasions, expecting only minor variations in responses.
Coefficient of variation
Similar to the eyeballing methods and proportion of agreement

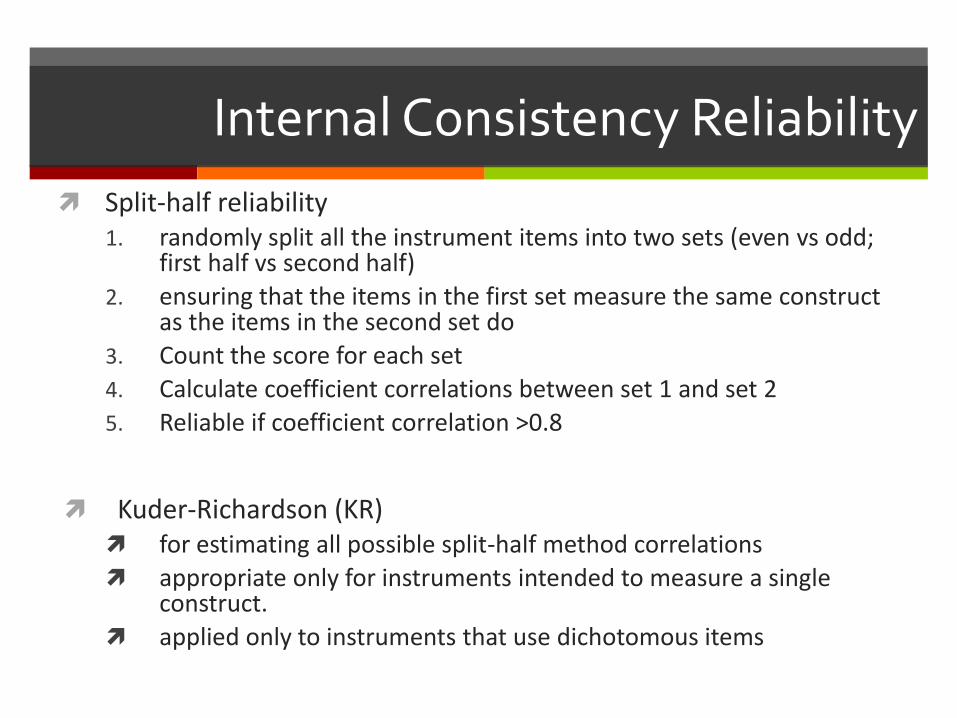
Internal Consistency Reliability
To compare results across and among items within a single instrument and to do so with only one administration.
For multi-item scales
Seberapa homogen item-item pertanyaan dalam 1 tes
Seberapa baik item-item pertanyaan itu mengukur satu construct
techniques Average inter-item and average item-total correlation
split half reliability
coefficient alpha
Kuder Richardson
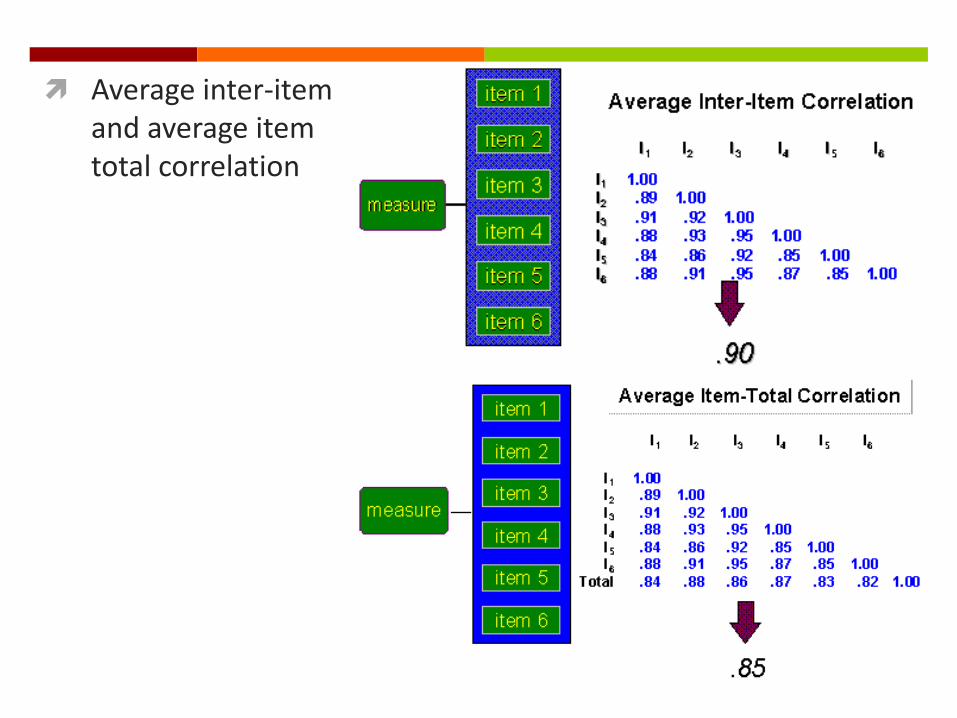
Average inter-item and average item total correlation
Internal Consistency Reliability
Split-half reliability1. randomly split all the instrument items into two sets (even vs odd;
first half vs second half)
2. ensuring that the items in the first set measure the same construct as the items in the second set do
3. Count the score for each set
4. Calculate coefficient correlations between set 1 and set 2
5. Reliable if coefficient correlation >0.8
Kuder-Richardson (KR) for estimating all possible split-half method correlations
appropriate only for instruments intended to measure a single construct.
applied only to instruments that use dichotomous items
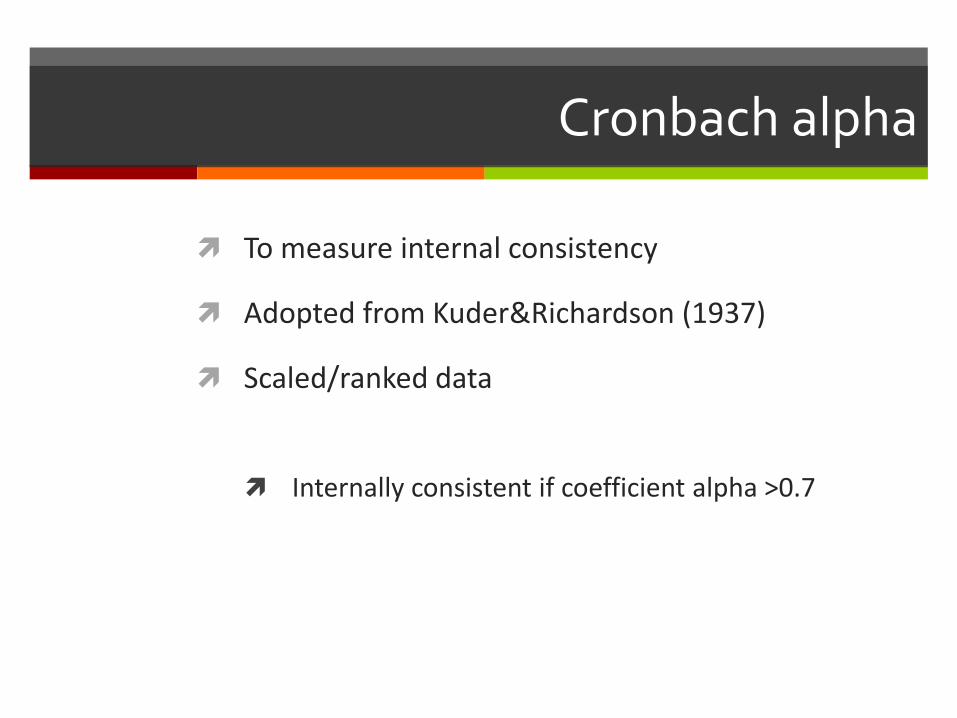
Cronbach alpha
To measure internal consistency
Adopted from Kuder&Richardson (1937)
Scaled/ranked data
Internally consistent if coefficient alpha >0.7

Cronbach’s alpha
randomly split the items into two sets compute the correlation between these sets Put all the items back randomly split them into two sets again repeat for all possible split half correlations calculate the average of all the correlations.
Vtest
Vi
n
n1
1
n = number of questionsVi = variance score for each questionsVtest = total variance from total score (not %’s) on the entire test
– Large Vtest Small Ratio ΣVi/Vtest high alpha
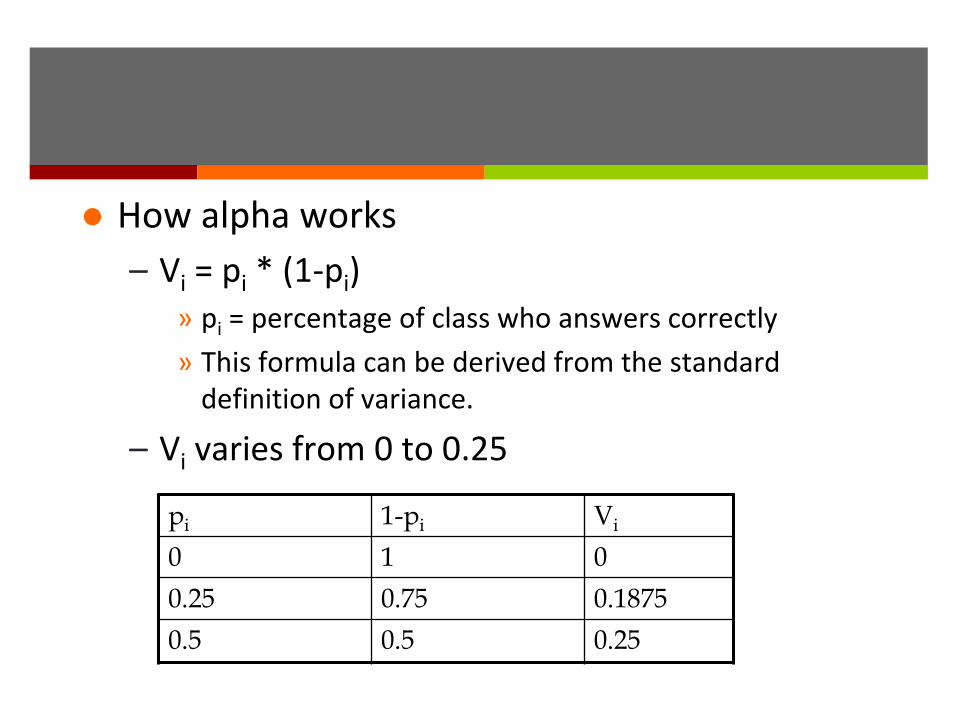
How alpha works
– Vi = pi * (1-pi) » pi = percentage of class who answers correctly
» This formula can be derived from the standard definition of variance.
– Vi varies from 0 to 0.25
pi 1-pi Vi
0 1 0
0.25 0.75 0.1875
0.5 0.5 0.25
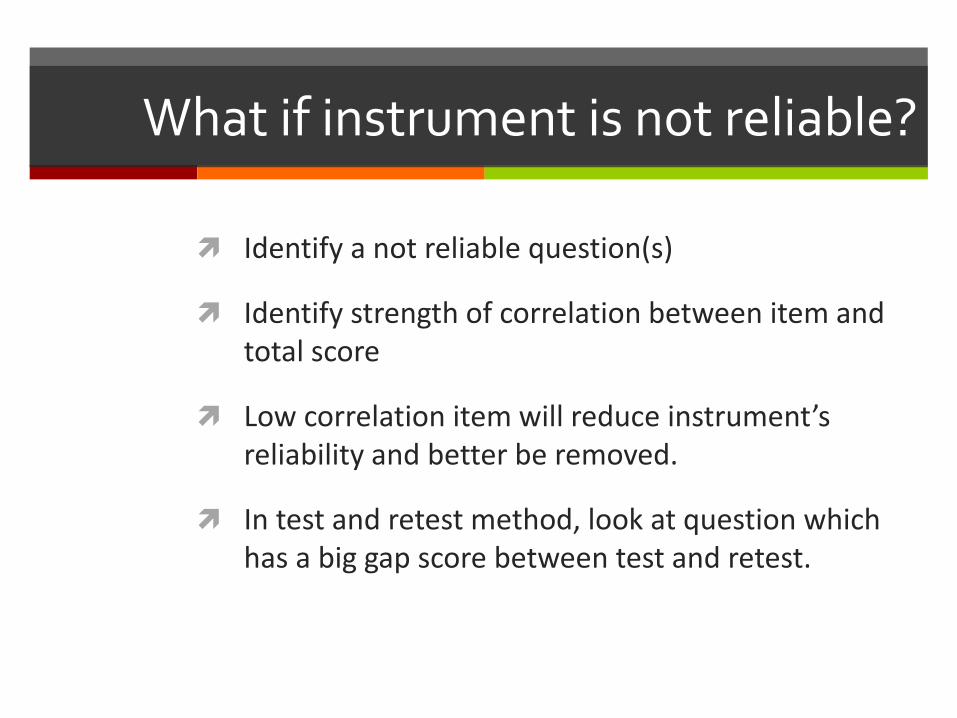
What if instrument is not reliable?
Identify a not reliable question(s)
Identify strength of correlation between item and total score
Low correlation item will reduce instrument’s reliability and better be removed.
In test and retest method, look at question which has a big gap score between test and retest.
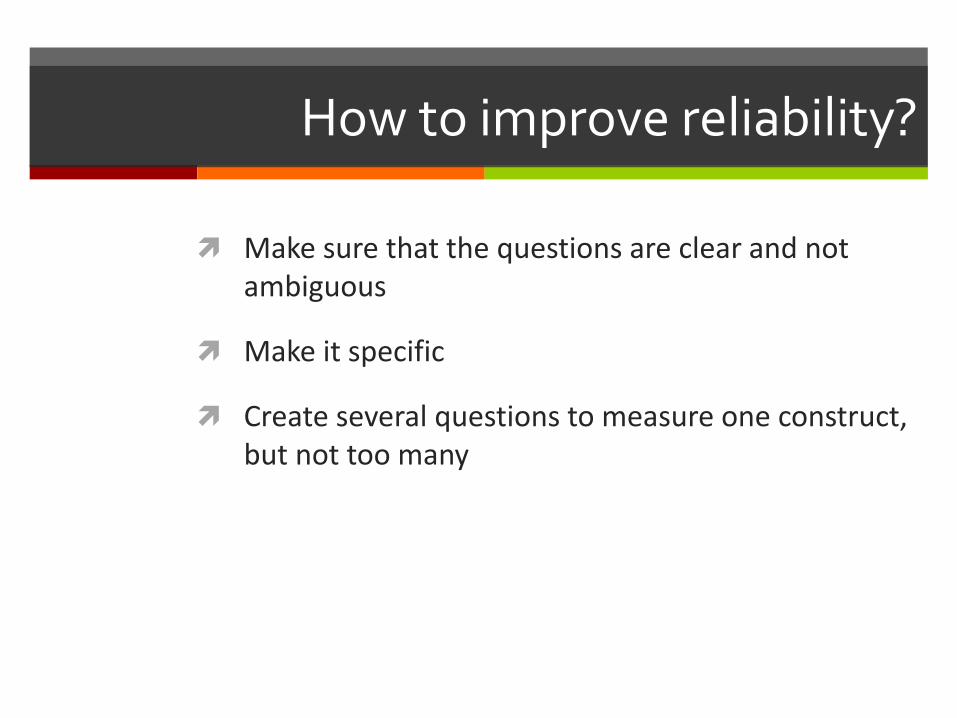
How to improve reliability?
Make sure that the questions are clear and not ambiguous
Make it specific
Create several questions to measure one construct, but not too many

Generalisability
From sample to population
Sample: true exist or just a coincidence

Hypothesis Result Reality Interpretation
Null hypothesis (H0): No relationship between clean lifestyle and healthy school program.
There is a relationship
between clean lifestyle and healthy
school program.
There is a relationship between clean lifestyle and healthy school program.
Null hypothesisrejected
Alternative hypothesis (H1)There is a relationship between clean lifestyle and healthy school program.
No relationship between clean lifestyle and healthy school program.
Type 1 error
Implication: more healthy school program
Is there a relationship between student’s healthy lifestyle and healthy school program?
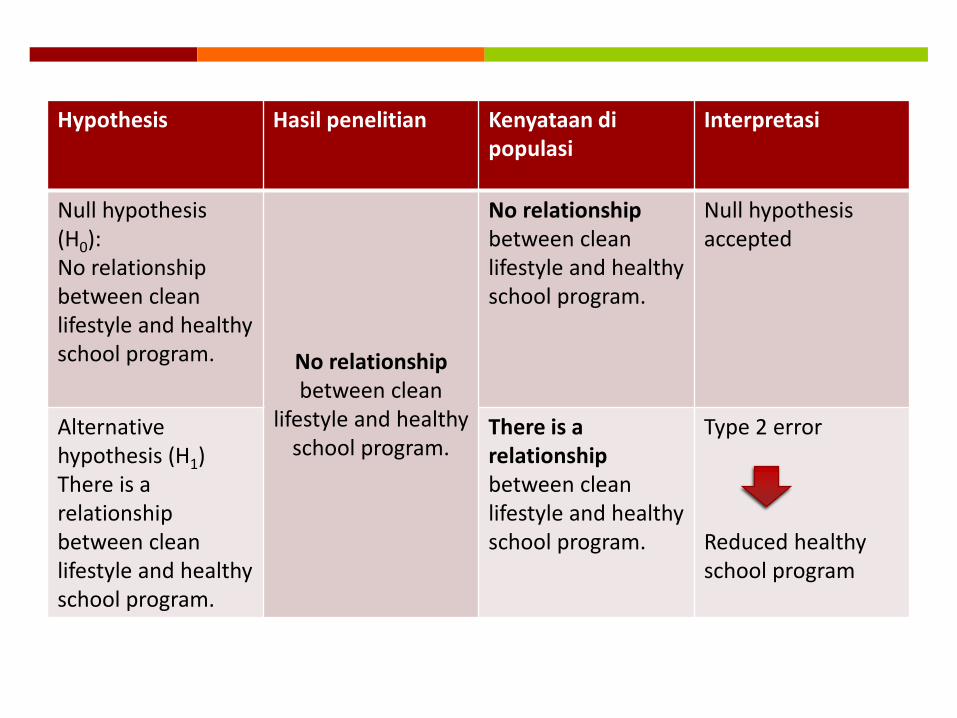
Hypothesis Hasil penelitian Kenyataan dipopulasi
Interpretasi
Null hypothesis (H0): No relationship between clean lifestyle and healthy school program. No relationship
between clean lifestyle and healthy
school program.
No relationship between clean lifestyle and healthy school program.
Null hypothesisaccepted
Alternative hypothesis (H1)There is a relationship between clean lifestyle and healthy school program.
There is a relationship between clean lifestyle and healthy school program.
Type 2 error
Reduced healthy school program
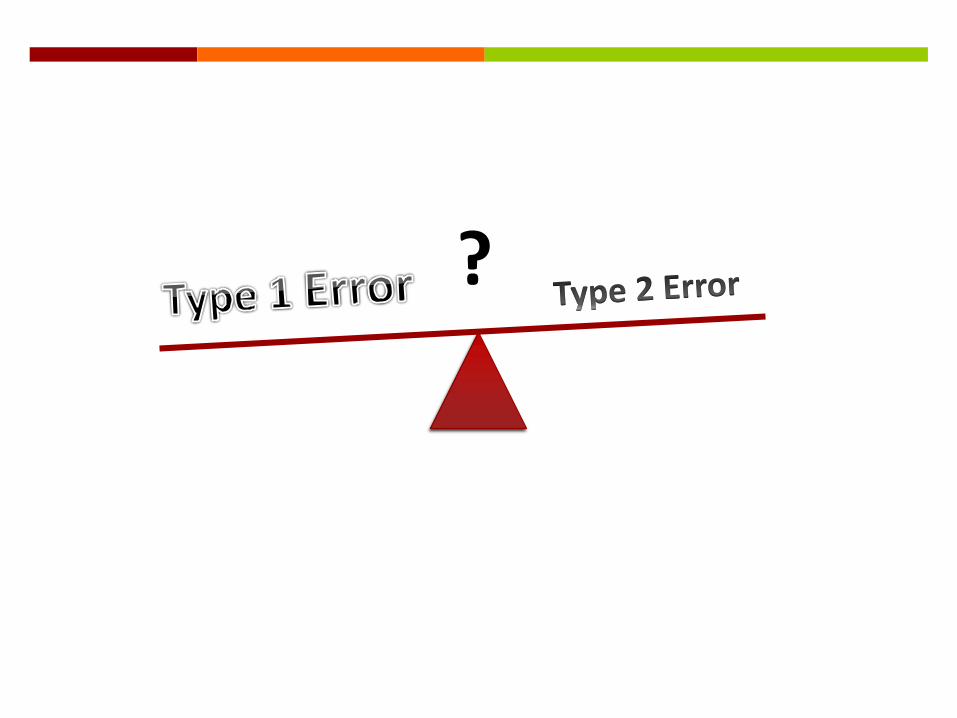
?
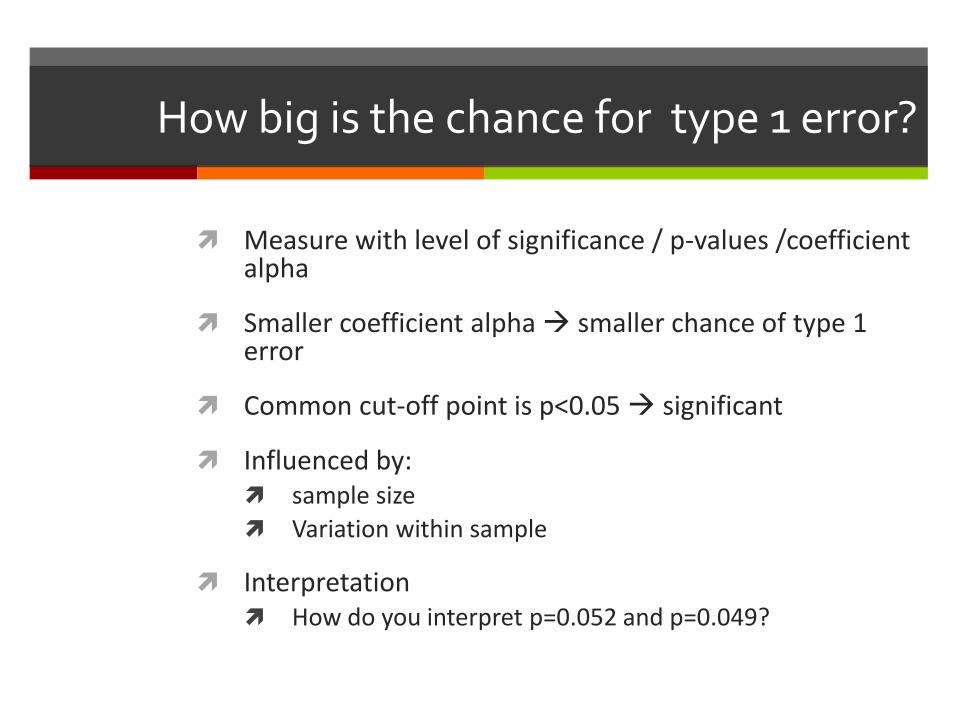
How big is the chance for type 1 error?
Measure with level of significance / p-values /coefficient alpha
Smaller coefficient alpha smaller chance of type 1 error
Common cut-off point is p<0.05 significant
Influenced by: sample size
Variation within sample
Interpretation How do you interpret p=0.052 and p=0.049?
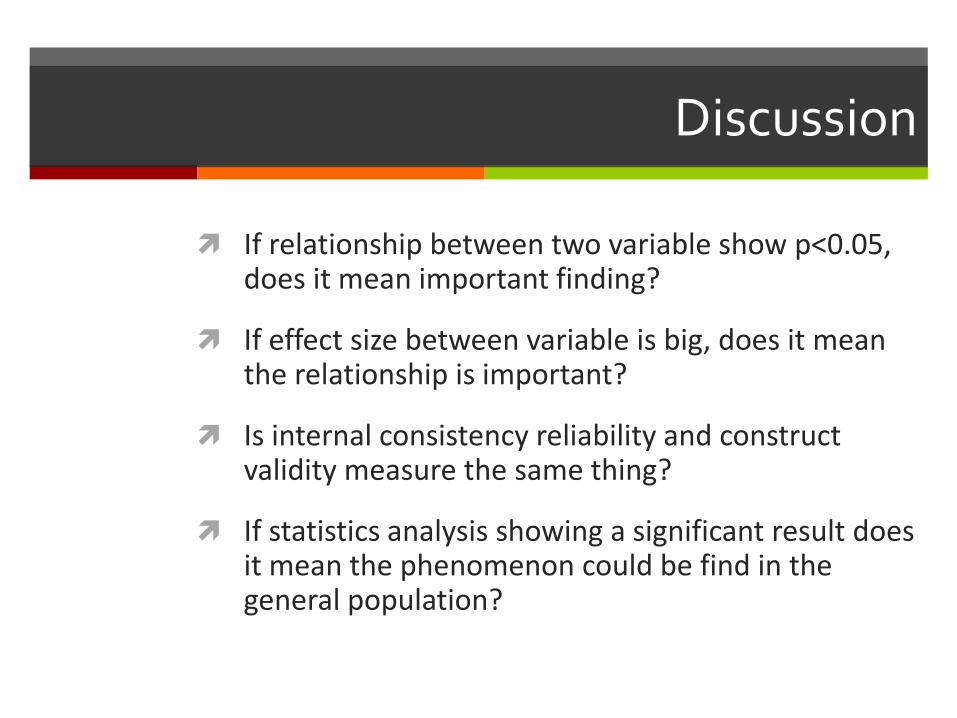
Discussion
If relationship between two variable show p<0.05, does it mean important finding?
If effect size between variable is big, does it mean the relationship is important?
Is internal consistency reliability and construct validity measure the same thing?
If statistics analysis showing a significant result does it mean the phenomenon could be find in the general population?
Validity and Reliability in Qualitative Research

Quality in Qualitative Data
Accurate
• recall, transcription, interpretation,
Contexted
• setting, social context, body language, tone, feeling,
Thick description
Useful
Reflexive
• it’s you and your data
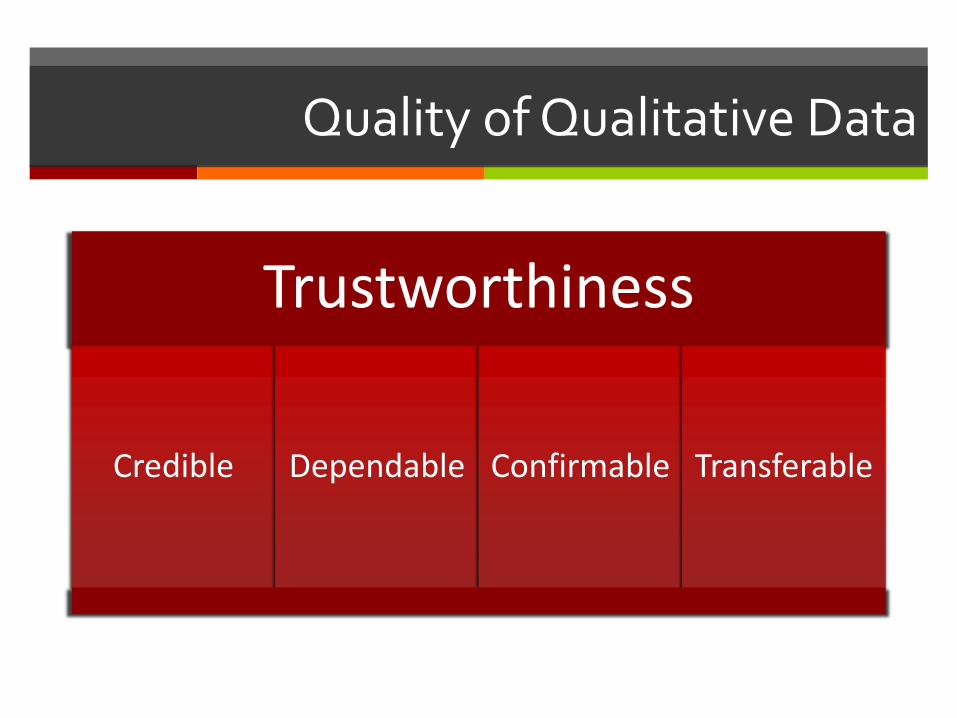
Quality of Qualitative Data
Trustworthiness
Credible Dependable Confirmable Transferable
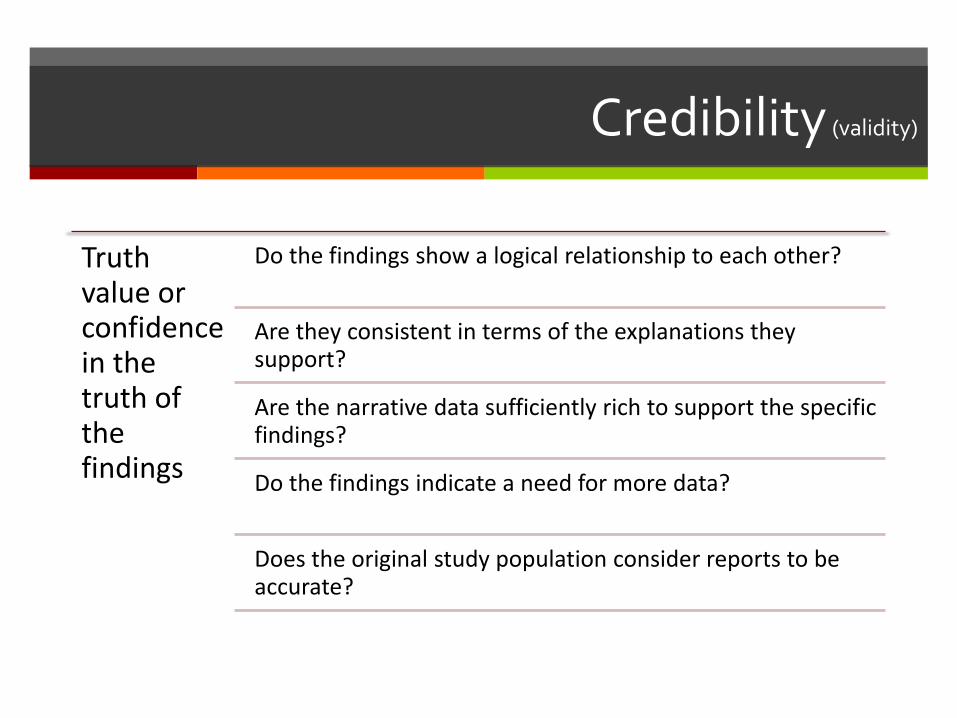
Credibility (validity)
Truth value or confidence in the truth of the findings
Do the findings show a logical relationship to each other?
Are they consistent in terms of the explanations they support?
Are the narrative data sufficiently rich to support the specific findings?
Do the findings indicate a need for more data?
Does the original study population consider reports to be accurate?

Dependability (reliability)
The research process is consistent and carried out with careful attention to the rules and conventions of
qualitative methodology.
• Are the research questions clear and logically connected to the research purpose and design?
• Are there parallels across data sources?
• Do multiple field-workers have comparable data collection protocols?
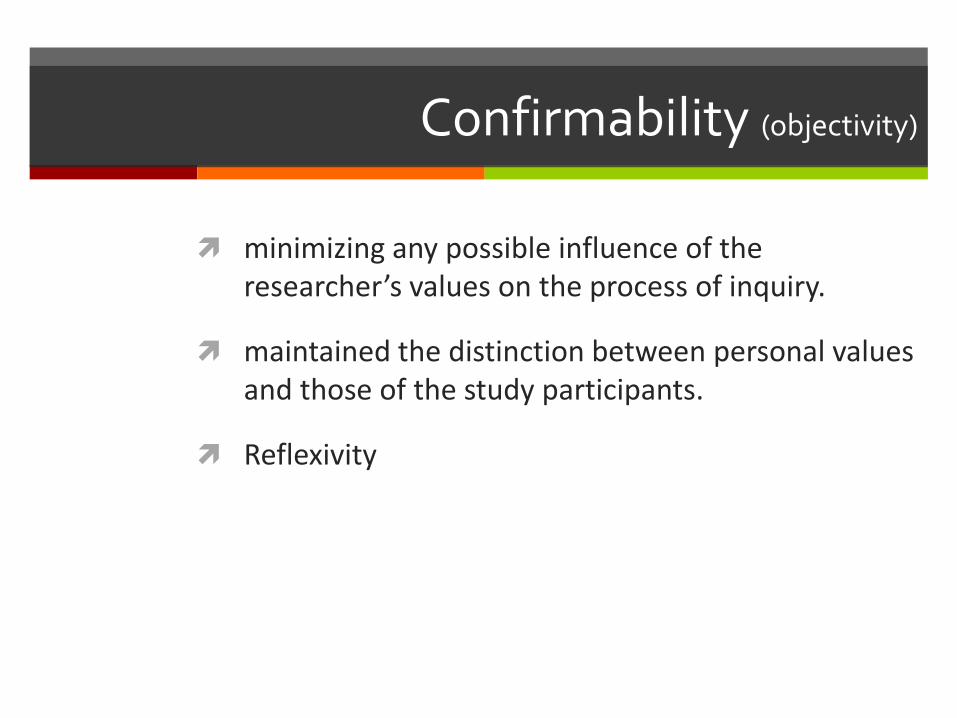
Confirmability (objectivity)
minimizing any possible influence of the researcher’s values on the process of inquiry.
maintained the distinction between personal values and those of the study participants.
Reflexivity

Transferability (generalizability)
whether the conclusions of a study are transferable to other contexts
The researcher must account for contextual factors when transferring data from one situation to another.
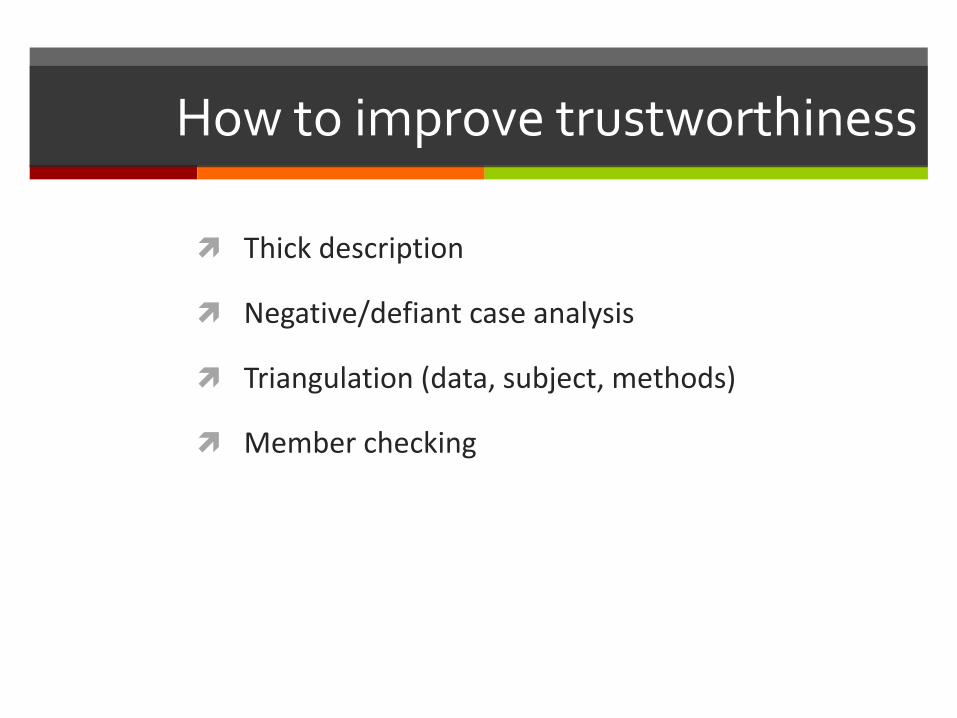
How to improve trustworthiness
Thick description
Negative/defiant case analysis
Triangulation (data, subject, methods)
Member checking