research method illustrations - universiteit twente · 2017-02-07 · research method illustrations...
TRANSCRIPT

Research Method Illustrations
Prof. Dr. Roel WieringaUniversity of Twente, The Netherlands
www.cs.utwente.nl/~roelw
31‐1‐2017 1© R.J. Wieringa
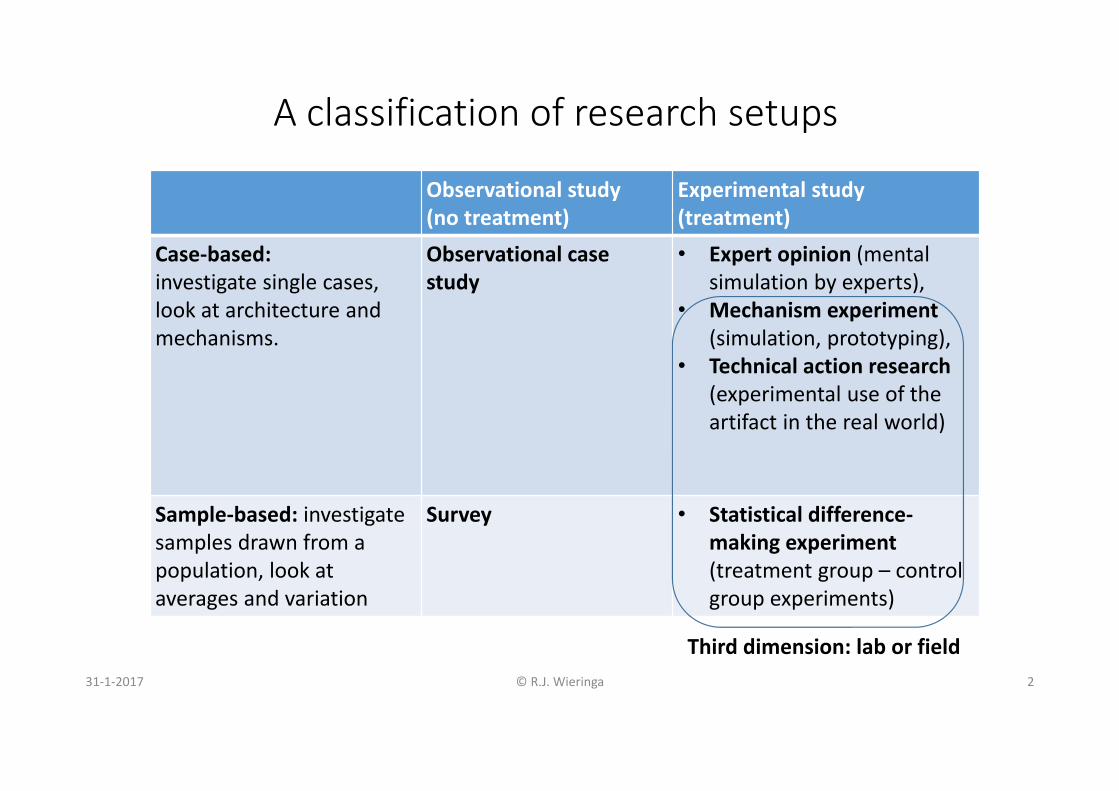
A classification of research setups
31‐1‐2017 © R.J. Wieringa 2
Observational study(no treatment)
Experimental study(treatment)
Case‐based: investigate single cases, look at architecture and mechanisms.
Observational case study
• Expert opinion (mentalsimulation by experts),
• Mechanism experiment (simulation, prototyping),
• Technical action research (experimental use of the artifact in the real world)
Sample‐based: investigatesamples drawn from a population, look at averages and variation
Survey • Statistical difference‐making experiment (treatment group – control group experiments)
Third dimension: lab or field
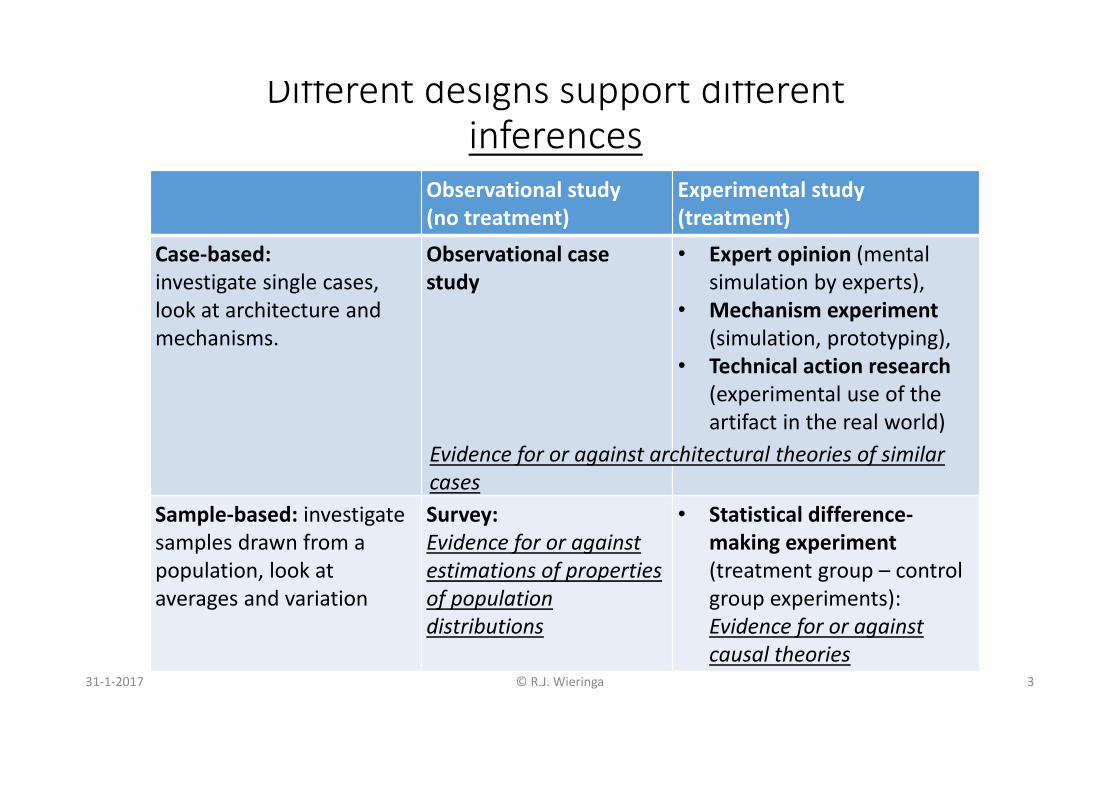
Different designs support different inferences
31‐1‐2017 © R.J. Wieringa 3
Observational study(no treatment)
Experimental study(treatment)
Case‐based: investigate single cases, look at architecture and mechanisms.
Observational case study
• Expert opinion (mentalsimulation by experts),
• Mechanism experiment (simulation, prototyping),
• Technical action research (experimental use of the artifact in the real world)
Sample‐based: investigatesamples drawn from a population, look at averages and variation
Survey: Evidence for or against estimations of properties of population distributions
• Statistical difference‐making experiment (treatment group – control group experiments): Evidence for or against causal theories
Evidence for or against architectural theories of similar cases
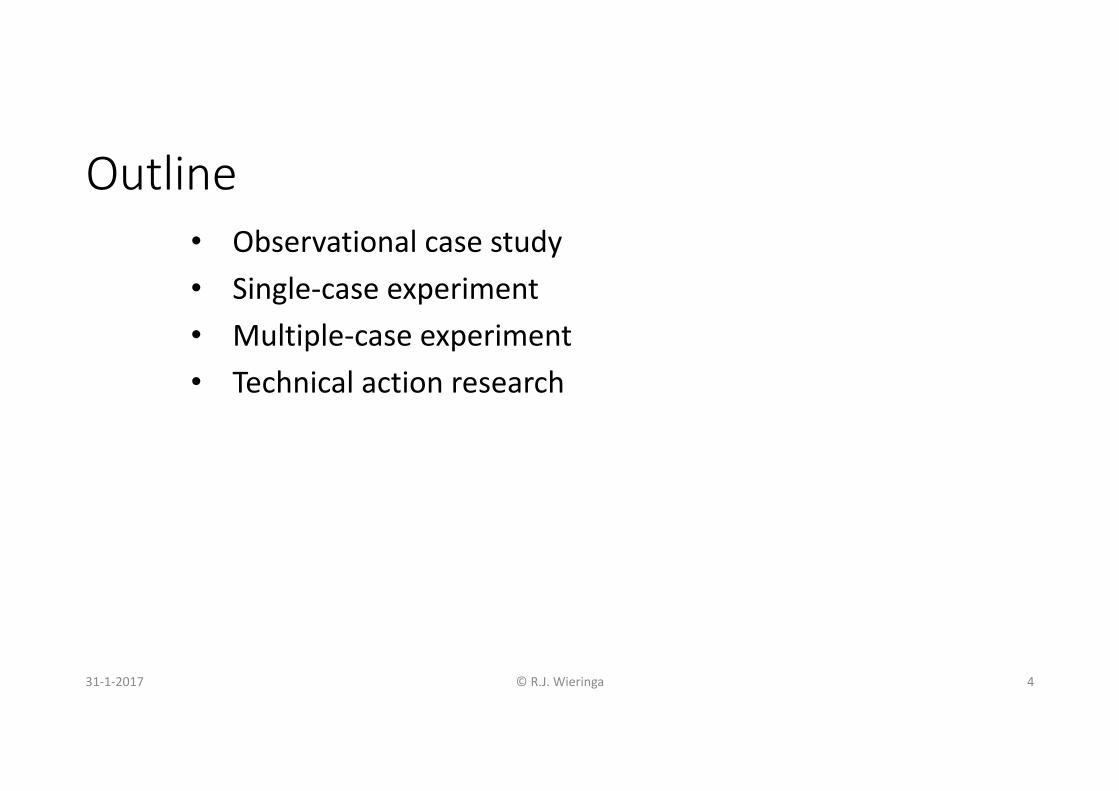
Outline• Observational case study• Single‐case experiment• Multiple‐case experiment• Technical action research
31‐1‐2017 © R.J. Wieringa 4

Observational case study
31‐1‐2017 © R.J. Wieringa 5
An Empirical Study of the Complex Relationships between Requirements Engineering Processes and Other Processes that Lead to Payoffs in Productivity, Quality, and Risk
Management
Daniela Damian and James ChisanTSE 32(7) July 2006
31‐1‐2017 © R.J. Wieringa 6

1. Observational case study of the effects of introducing of requirements engineering in a distributed software development organization. Implementation evaluation.
2. There was no stated improvement goal
3. Current literature most often discusses the impact of RE on developer productivity, software quality, and risk mitigation.
31‐1‐2017 © R.J. Wieringa 7
1. Knowledge goal?2. Improvement goal?3. Current knowledge?
Design cycle Empirical cycle
17. Contribution to knowledge goal?18. Contribution to improvement goal?
4. … ….16. …
31‐1‐2017 © R.J. Wieringa 8
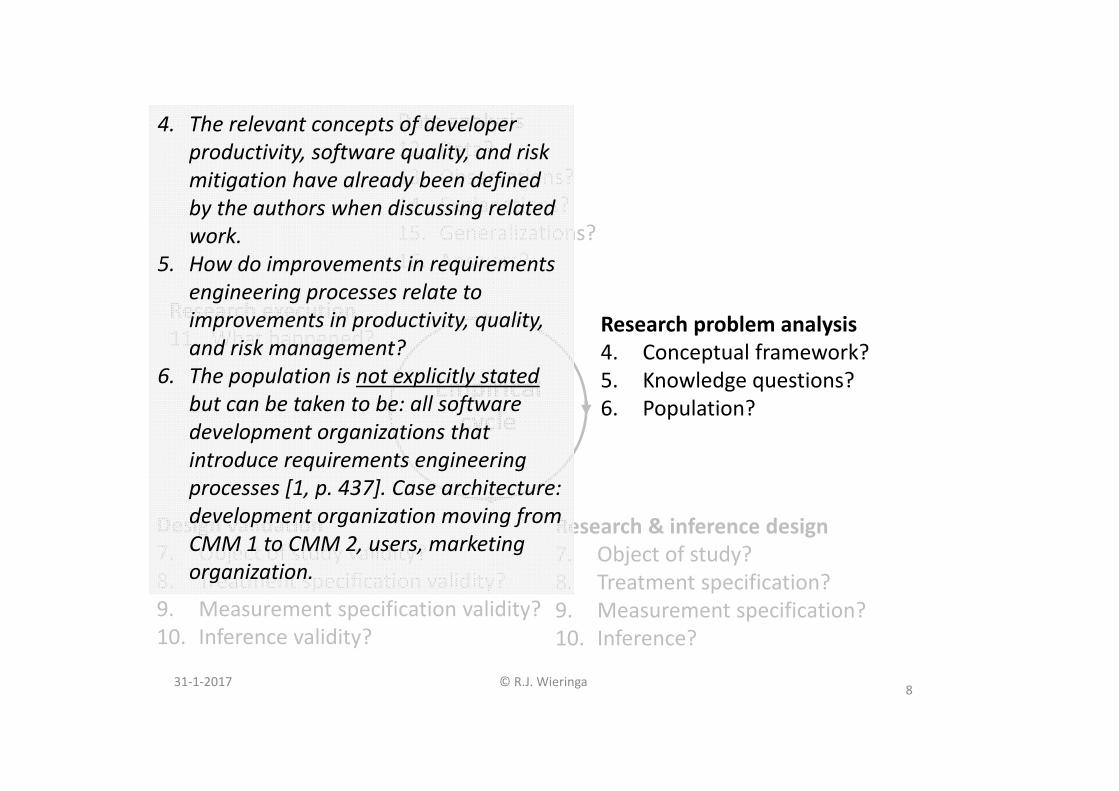
Research problem analysis4. Conceptual framework?5. Knowledge questions?6. Population?
Research execution11. What happened?
Research & inference design7. Object of study?8. Treatment specification?9. Measurement specification?10. Inference?
Data analysis12. Data?13. Observations?14. Explanations?15. Generalizations?16. Answers?
Empirical cycle
Design validation7. Object of study validity?8. Treatment specification validity?9. Measurement specification validity?10. Inference validity?
4. The relevant concepts of developer productivity, software quality, and risk mitigation have already been defined by the authors when discussing related work.
5. How do improvements in requirements engineering processes relate to improvements in productivity, quality, and risk management?
6. The population is not explicitly stated but can be taken to be: all software development organizations that introduce requirements engineering processes [1, p. 437]. Case architecture: development organization moving from CMM 1 to CMM 2, users, marketing organization.

31‐1‐2017 © R.J. Wieringa 9
Research problem analysis4. Conceptual framework?5. Knowledge questions?6. Population?
Research execution11. What happened?
Research & inference design7. Object of study?8. Treatment specification?9. Measurement specification?10. Inference?
Data analysis12. Descriptions?13. Statistical conclusions?14. Explanations?15. Generalizations?16. Answers?
Empirical cycle
Design validation7. Object of study validity?8. Treatment specification validity?9. Measurement specification validity?10. Inference validity?
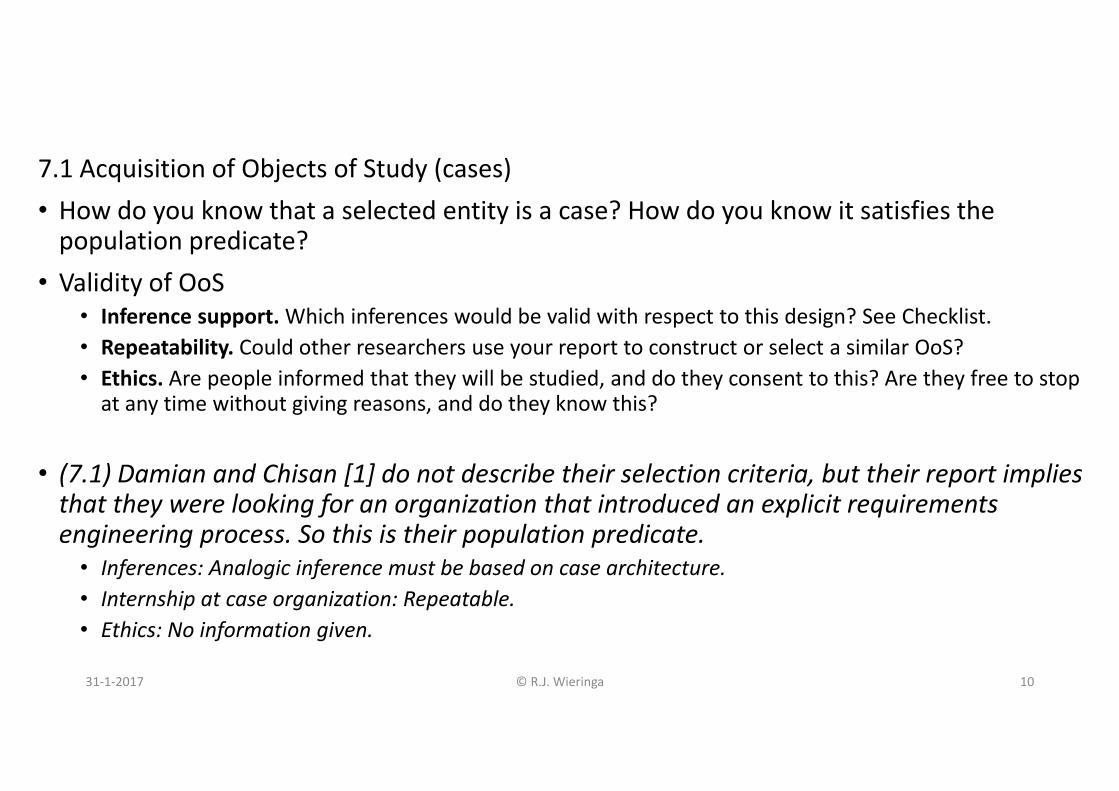
7.1 Acquisition of Objects of Study (cases)• How do you know that a selected entity is a case? How do you know it satisfies the population predicate?
• Validity of OoS• Inference support. Which inferences would be valid with respect to this design? See Checklist.• Repeatability. Could other researchers use your report to construct or select a similar OoS?• Ethics. Are people informed that they will be studied, and do they consent to this? Are they free to stop at any time without giving reasons, and do they know this?
• (7.1) Damian and Chisan [1] do not describe their selection criteria, but their report implies that they were looking for an organization that introduced an explicit requirements engineering process. So this is their population predicate.
• Inferences: Analogic inference must be based on case architecture.• Internship at case organization: Repeatable.• Ethics: No information given.
31‐1‐2017 © R.J. Wieringa 10

7.2 Construction of a sample• What is the analytical induction strategy? Confirming cases, disconfirming cases, extreme cases?
• Validity of sampling procedure• Inference support. • Repeatability. • Ethics. No new issues.
• (7.2) Danian & Chisan: Only one case study (took 30 months, with 3 publications).
31‐1‐2017 © R.J. Wieringa 11

31‐1‐2017 © R.J. Wieringa 12
Research problem analysis4. Conceptual framework?5. Knowledge questions?6. Population?
Research execution11. What happened?
Research & inference design7. Object of study?8. Treatment specification?9. Measurement specification?10. Inference?
Data analysis12. Descriptions?13. Statistical conclusions?14. Explanations?15. Generalizations?16. Answers?
Empirical cycle
Design validation7. Object of study validity?8. Treatment specification validity?9. Measurement specification validity?10. Inference validity?
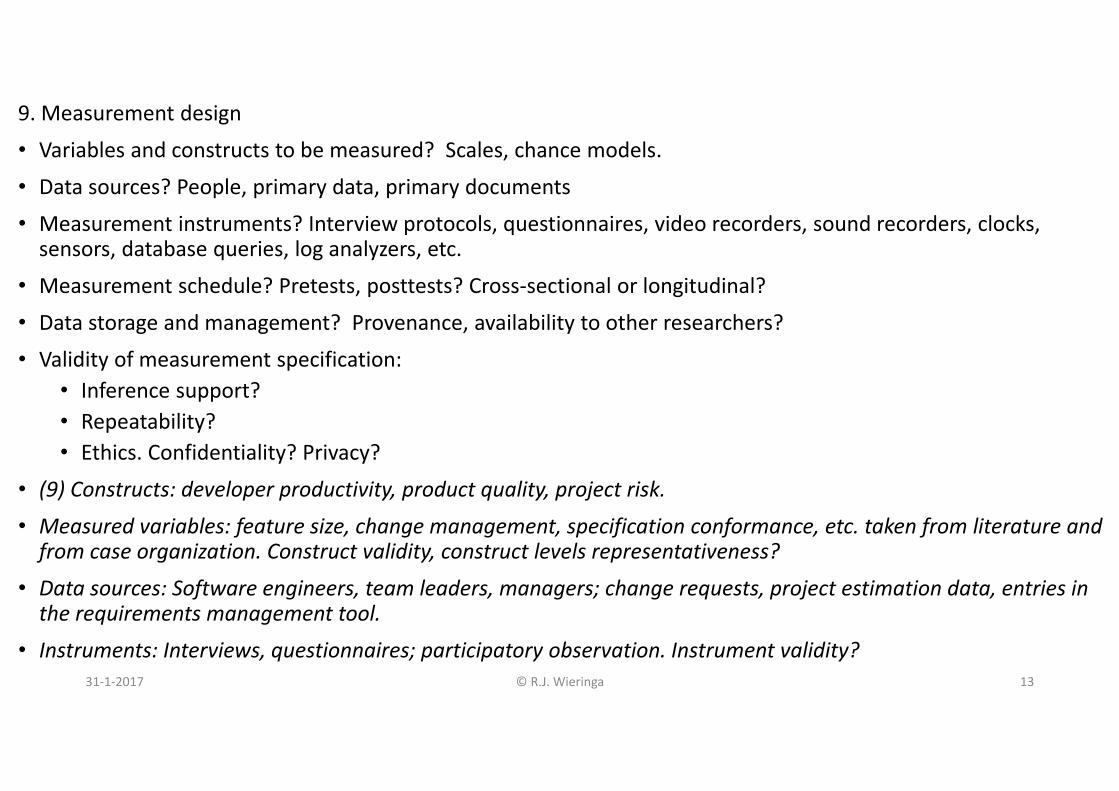
9. Measurement design
• Variables and constructs to be measured? Scales, chance models.
• Data sources? People, primary data, primary documents
• Measurement instruments? Interview protocols, questionnaires, video recorders, sound recorders, clocks, sensors, database queries, log analyzers, etc.
• Measurement schedule? Pretests, posttests? Cross‐sectional or longitudinal?
• Data storage and management? Provenance, availability to other researchers?
• Validity of measurement specification:• Inference support?• Repeatability?• Ethics. Confidentiality? Privacy?
• (9) Constructs: developer productivity, product quality, project risk.
• Measured variables: feature size, change management, specification conformance, etc. taken from literature and from case organization. Construct validity, construct levels representativeness?
• Data sources: Software engineers, team leaders, managers; change requests, project estimation data, entries in the requirements management tool.
• Instruments: Interviews, questionnaires; participatory observation. Instrument validity?31‐1‐2017 © R.J. Wieringa 13

31‐1‐2017 © R.J. Wieringa 14
Research problem analysis4. Conceptual framework?5. Knowledge questions?6. Population?
Research execution11. What happened?
Research & inference design7. Object of study?8. Treatment specification?9. Measurement specification?10. Inference?
Data analysis12. Descriptions?13. Statistical conclusions?14. Explanations?15. Generalizations?16. Answers?
Empirical cycle
Design validation7. Object of study validity?8. Treatment specification validity?9. Measurement specification validity?10. Inference validity?

• Using the checklist in research design:• Decide how to do descriptive inference• Hypothesize possible, alternative architectural explanations for your observations• Consider generalizability of this to population
31‐1‐2017 © R.J. Wieringa 15

31‐1‐2017 © R.J. Wieringa 16
Research problem analysis4. Conceptual framework?5. Knowledge questions?6. Population?
Research execution11. What happened?
Research & inference design7. Object of study?8. Treatment specification?9. Measurement specification?10. Inference?
Data analysis12. Descriptions?13. Statistical conclusions?14. Explanations?15. Generalizations?16. Answers?
Empirical cycle
Design validation7. Object of study validity?8. Treatment specification validity?9. Measurement specification validity?10. Inference validity?

11. What has happened?
• What has happened during selection? Did the cases eventually selected have the architecture that was planned during research design? Have there been any unexpected events during the study?
• What has happened during analytical induction (i.e. sampling)? Could you study the kinds of cases that you originally planned?
• What has happened during measurements? Data sources actually used, response rates?
• (11) Acquired a medium‐sized software development organization (130 employees) responsible for a software product that has been on the market for about 20 years. Located in Australia, part of a multinational company receiving its requirements from a marketing department in Canada. Moving from CMM1 to CMM 2. Data sources & response rates are reported.
31‐1‐2017 © R.J. Wieringa 17

31‐1‐2017 © R.J. Wieringa 18
Research problem analysis4. Conceptual framework?5. Knowledge questions?6. Population?
Research execution11. What happened?
Research & inference design7. Object of study?8. Treatment specification?9. Measurement specification?10. Inference?
Data analysis12. Descriptions?13. Statistical conclusions?14. Explanations?15. Generalizations?16. Answers?
Empirical cycle
Design validation7. Object of study validity?8. Treatment specification validity?9. Measurement specification validity?10. Inference validity?

12. Descriptions• Data preparations applied? Data transformations, missing values, removal of outliers? Data management, data availability.
• Data interpretations? Coding procedures, interpretation methods?• Descriptive statistics. Demographics? Graphics, tables.• Validity of the descriptions: See checklist for the validity of descriptive inference.(13. Statistical conclusions)14. Explanations• What explanations (causal, architectural, rational) exist for the observations?• Internal validity: See checklist for the validity of abductive inference.15. Generalizations• Would the explanations be valid in similar cases or populations too?• External validity: See checklist for the validity of analogic inference16. Answers• What are the answers to the knowledge questions? Summary of conclusions, support for and limitations of conclusions.
31‐1‐2017 © R.J. Wieringa 19

(12) Descriptions• Damian and Chisan [1] provide descriptions of the requirements engineering practices in their case organization and give some descriptive statistics of the results of the interviews and questionnaires filled in during their third case study.
31‐1‐2017 © R.J. Wieringa 20
(14) Explanations• The case study did not start with any particular theory about requirements engineering improvement.
• Sum of all observations explained by a causal theory (next slide).
31‐1‐2017 © R.J. Wieringa 21

Damian & Chisan. RE introduction in a development company. TSE July2006.
31‐1‐2017 © R.J. Wieringa 22
The causal model presented in the paper.
Practioners’ opinions!
Theory embedded in practice.

Damian & Chisan. RE introduction in a development company. TSE July 2006.
31‐1‐2017 © R.J. Wieringa 23
An architecturalmodel constructedfrom the paper.
Mechanisms thatexplain improvedproductivity, quality, risk mgmt:
C‐F team • improves shared
feature understanding,
• reduces rework•C‐C board • prevents
requirementcreep

Damian & Chisan. RE introduction in a development company. TSE July2006.
31‐1‐2017 © R.J. Wieringa 24
The variables characterize theway of working of a cross‐functionalteam, and itseffects
Propertiesand activitiesof a cross‐functional
team
Capabilities
C‐F teamcapability
C‐C boardcapability
Effects
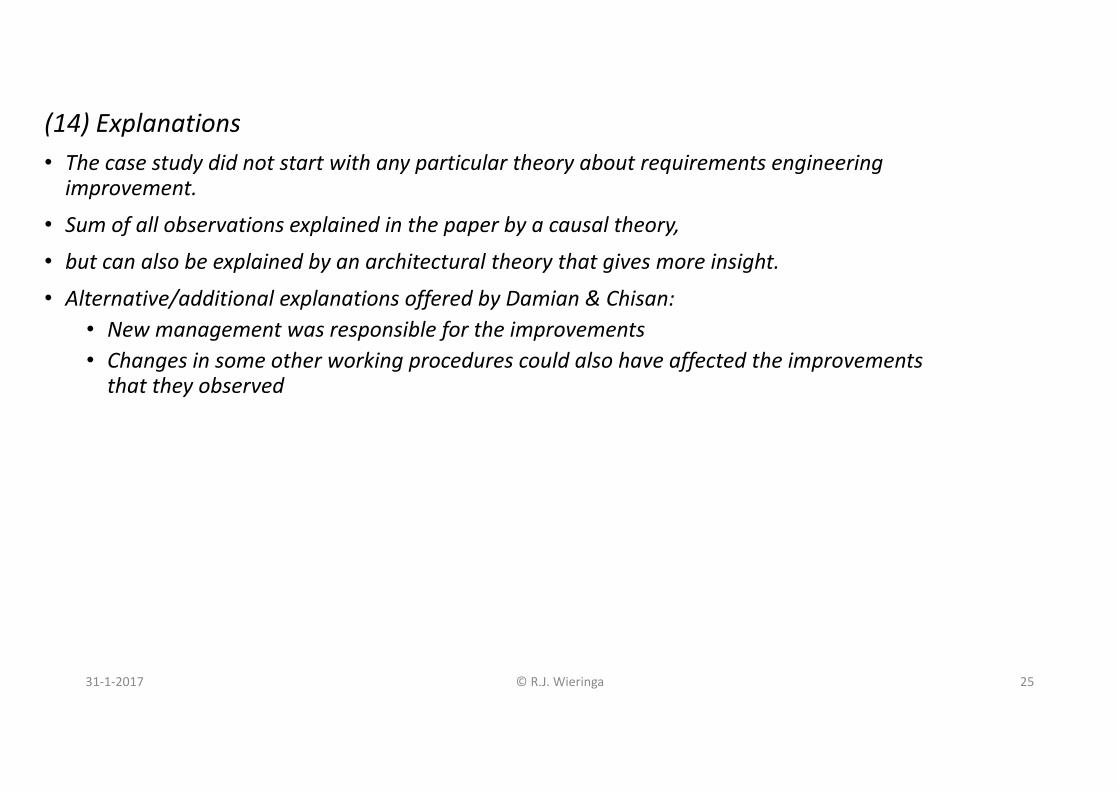
(14) Explanations• The case study did not start with any particular theory about requirements engineering improvement.
• Sum of all observations explained in the paper by a causal theory,
• but can also be explained by an architectural theory that gives more insight.
• Alternative/additional explanations offered by Damian & Chisan: • New management was responsible for the improvements• Changes in some other working procedures could also have affected the improvements that they observed
31‐1‐2017 © R.J. Wieringa 25

(15) Analogic generalization• Original population predicate: Organizations that have introduced requirements engineering. So this is the original scope of generalization.
• After the case study: scope narrowed down to • organizations that introduced requirements engineering,• as part of a move in software engineering maturity from CMM 1 to CMM 2 and that • have a similar architecture: development organization, users who interact with the development organization, a marketing department who provides requirements
• Generalization: for these organizations, introduction of Change Control Board and Cross‐Functional teams will have similar effects.
31‐1‐2017 © R.J. Wieringa 26
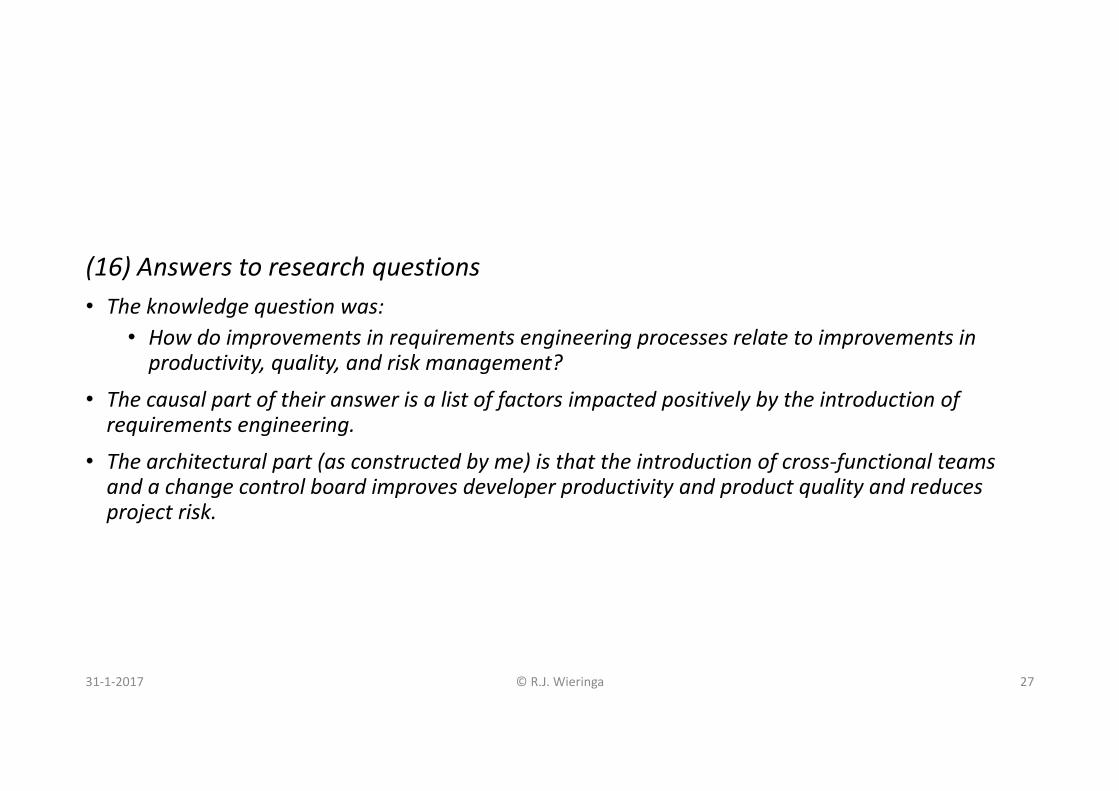
(16) Answers to research questions• The knowledge question was:
• How do improvements in requirements engineering processes relate to improvements in productivity, quality, and risk management?
• The causal part of their answer is a list of factors impacted positively by the introduction of requirements engineering.
• The architectural part (as constructed by me) is that the introduction of cross‐functional teams and a change control board improves developer productivity and product quality and reduces project risk.
31‐1‐2017 © R.J. Wieringa 27

(17) Contribution to knowledge: New knowledge about the costs and benefits of requirements engineering in practice. Collaboration between developers is an important subject for further research.
(18) Contribution to practice: Identified practices that can increase the benefits of requirements engineering, such as cross‐functional teams and change management.
31‐1‐2017 © R.J. Wieringa 28
1. Knowledge goal?2. Improvement goal?3. Current knowledge?
Design cycle Empirical cycle
17. Contribution to knowledge goal?18. Contribution to improvement goal?
4. … ….16. …

Outline• Introduction
• The design cycle• Theories• The research setup
• Scientific inference• Description• Explanation• Generalization• Prediction
• Empirical research• Checklist • Example research methods
• Observational case study• Mechanism experiment• Technical action research
31‐1‐2017 © R.J. Wieringa 29

Case‐based experimentSingle‐case experiment
31‐1‐2017 © R.J. Wieringa 30

A. Kumar, P.S. Ow, M.J. PrietulaOrganizational simulation and information systems design:
an operational level example.
Management Science 39(2), 218–240 (1993)
31‐1‐2017 © R.J. Wieringa 31

1. To investigate which of four mechanisms would produce the best patient flow (time taken by the medical tests) and tardiness (time after due date that test result becomes available). Validation research goal.
2. Utility driven.
3. Scheduling knowledge in general, and in hospitals in particular.
31‐1‐2017 © R.J. Wieringa 32
1. Knowledge goal?2. Improvement goal?3. Current knowledge?
Design cycle Empirical cycle
17. Contribution to knowledge goal?18. Contribution to improvement goal?
4. … ….16. …

31‐1‐2017 © R.J. Wieringa 33
Research problem analysis4. Conceptual framework?5. Knowledge questions?6. Population?
Research execution11. What happened?
Research & inference design7. Object of study?8. Treatment specification?9. Measurement specification?10. Inference?
Data analysis12. Data?13. Observations?14. Explanations?15. Generalizations?16. Answers?
Empirical cycle
Design validation7. Object of study validity?8. Treatment specification validity?9. Measurement specification validity?10. Inference validity?
4. Scheduling concepts taken from the operations research literature, such as earliest due date, tardiness (how late a test is completed after its due date), patient flow time (time taken by the medical tests), etc.
5. What are the tardiness and flow time of patient test scheduling for each coordination mechanism? Why? (Effect and trade‐off questions.)
6. Population not specified explicitly. Implicitly: the set of all hospitals. Case architecture: medical care units, such as cardiology, and ancillaries, such as the blood laboratory, which perform tests on patients as ordered by the care units.

31‐1‐2017 © R.J. Wieringa 34
Research problem analysis4. Conceptual framework?5. Knowledge questions?6. Population?
Research execution11. What happened?
Research & inference design7. Object of study?8. Treatment specification?9. Measurement specification?10. Inference?
Data analysis12. Descriptions?13. Statistical conclusions?14. Explanations?15. Generalizations?16. Answers?
Empirical cycle
Design validation7. Object of study validity?8. Treatment specification validity?9. Measurement specification validity?10. Inference validity?

7.1 Acquisition of Objects of Study (cases)
• How do you know that a selected entity is a case? How do you know it satisfies the population predicate?
7.1 The artifacts validated were coordination mechanisms between medical units and ancillaries to schedule patient tests:
• In a decentralized mechanism, each ancillary schedules patient tests independently.
• In a balanced coordination mechanism, the requesting medical unit imposes a patient flow due date.
• In a centralized mechanism, ancillaries additionally coordinate their schedules among each other.
• In a totally centralized mechanism, all coordination is done by a single scheduler.
These four artifacts were tested in a simulation of a hospital with three units, four ancillaries, and 30 patients.
31‐1‐2017 © R.J. Wieringa 35

7.1 Acquisition of Objects of Study (cases) Continued
• Validity of OoS• Inference support. Which inferences would be valid with respect to this design? See Checklist.• Repeatability. Could other researchers use your report to construct or select a similar OoS?• Ethics. Are people informed that they will be studied, and do they consent to this? Are they free to stop at any time without giving reasons, and do they know this?
7.1 Continued
• Inferences• Limitations in external validity: the simulation components are idealizations, e.g. always behave as specified; real‐world care units and ancillaries may resist change; there may be interfering mechanisms.
• Repeatability• Any researcher can build similar simulations.
• Ethics• Not applicable, since no people involved.
31‐1‐2017 © R.J. Wieringa 36

7.2 Construction of a sample• What is the analytical induction strategy? Confirming cases, disconfirming cases, extreme cases?
• Validity of sampling procedure• Inference support. • Repeatability. • Ethics. No new issues.
• (7.2) Only one simulation performed.
31‐1‐2017 © R.J. Wieringa 37

31‐1‐2017 © R.J. Wieringa 38
Research problem analysis4. Conceptual framework?5. Knowledge questions?6. Population?
Research execution11. What happened?
Research & inference design7. Object of study?8. Treatment specification?9. Measurement specification?10. Inference?
Data analysis12. Descriptions?13. Statistical conclusions?14. Explanations?15. Generalizations?16. Answers?
Empirical cycle
Design validation7. Object of study validity?8. Treatment specification validity?9. Measurement specification validity?10. Inference validity?
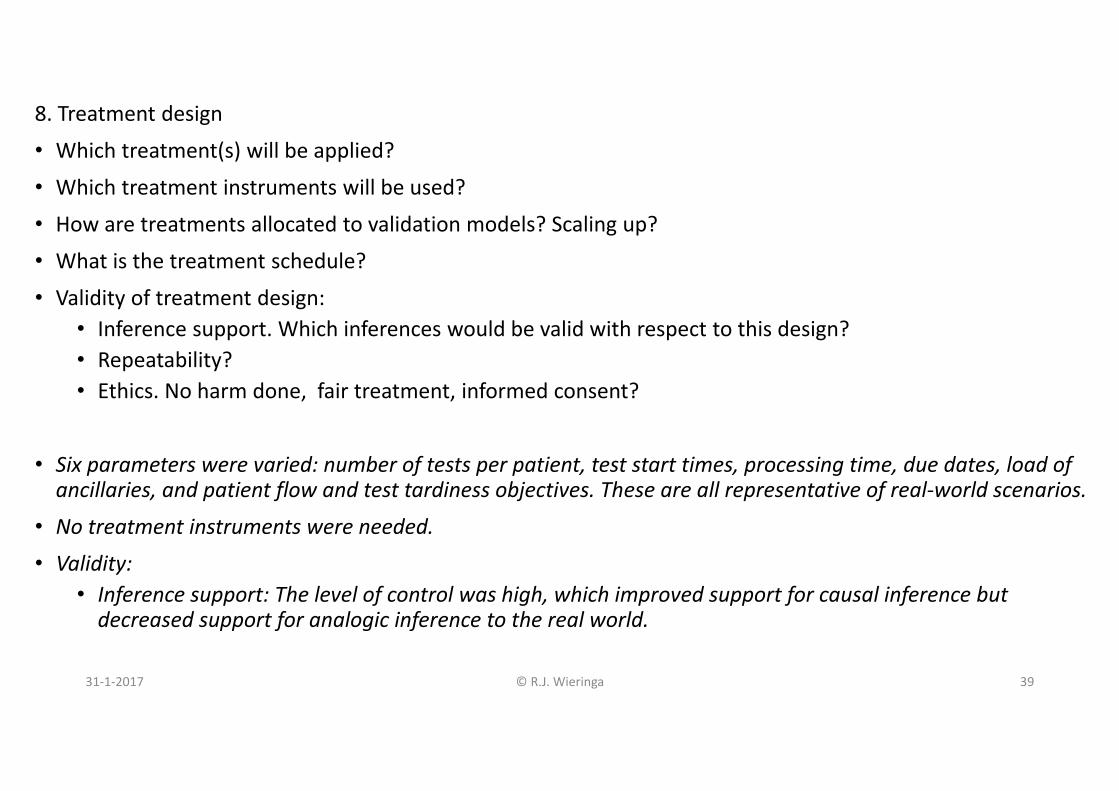
8. Treatment design
• Which treatment(s) will be applied?
• Which treatment instruments will be used?
• How are treatments allocated to validation models? Scaling up?
• What is the treatment schedule?
• Validity of treatment design:• Inference support. Which inferences would be valid with respect to this design?• Repeatability?• Ethics. No harm done, fair treatment, informed consent?
• Six parameters were varied: number of tests per patient, test start times, processing time, due dates, load of ancillaries, and patient flow and test tardiness objectives. These are all representative of real‐world scenarios.
• No treatment instruments were needed.
• Validity: • Inference support: The level of control was high, which improved support for causal inference but decreased support for analogic inference to the real world.
31‐1‐2017 © R.J. Wieringa 39
31‐1‐2017 © R.J. Wieringa 40
Research problem analysis4. Conceptual framework?5. Knowledge questions?6. Population?
Research execution11. What happened?
Research & inference design7. Object of study?8. Treatment specification?9. Measurement specification?10. Inference?
Data analysis12. Descriptions?13. Statistical conclusions?14. Explanations?15. Generalizations?16. Answers?
Empirical cycle
Design validation7. Object of study validity?8. Treatment specification validity?9. Measurement specification validity?10. Inference validity?

9. Measurement design• Variables and constructs to be measured? Scales, chance models.• Data sources? People, primary data, primary documents • Measurement instruments? Interview protocols, questionnaires, video recorders, sound recorders, clocks, sensors, database queries, log analyzers, etc.
• Measurement schedule? Pretests, posttests? Cross‐sectional or longitudinal?• Data storage and management? Provenance, availability to other researchers?• Validity of measurement specification:
• Inference support?• Repeatability?• Ethics. Confidentiality? Privacy?
(9) • Measured variables: patient blocked time, test processing time, etc., defined in their conceptual research framework. Construct validity argued there.
• The simulation software is the source of data, and is the measurement instrument.• Data storage and management not reported.• Validity: Parameters of the simulation were set to values for a small hospital. This introduces a construct level validity threat.
31‐1‐2017 © R.J. Wieringa 41

31‐1‐2017 © R.J. Wieringa 42
Research problem analysis4. Conceptual framework?5. Knowledge questions?6. Population?
Research execution11. What happened?
Research & inference design7. Object of study?8. Treatment specification?9. Measurement specification?10. Inference?
Data analysis12. Descriptions?13. Statistical conclusions?14. Explanations?15. Generalizations?16. Answers?
Empirical cycle
Design validation7. Object of study validity?8. Treatment specification validity?9. Measurement specification validity?10. Inference validity?

• Using the checklist in research design:• Decide how to do descriptive inference• Hypothesize possible, alternative architectural explanations for your observations• Consider generalizability of this to population
31‐1‐2017 © R.J. Wieringa 43

31‐1‐2017 © R.J. Wieringa 44
Research problem analysis4. Conceptual framework?5. Knowledge questions?6. Population?
Research execution11. What happened?
Research & inference design7. Object of study?8. Treatment specification?9. Measurement specification?10. Inference?
Data analysis12. Descriptions?13. Statistical conclusions?14. Explanations?15. Generalizations?16. Answers?
Empirical cycle
Design validation7. Object of study validity?8. Treatment specification validity?9. Measurement specification validity?10. Inference validity?

11. What has happened?
• What has happened during selection? Did the cases eventually selected have the architecture that was planned during research design? Have there been any unexpected events during the study?
• What has happened during analytical induction (i.e. sampling)? Could you study the kinds of cases that you originally planned?
• What has happened during measurements? Data sources actually used, response rates?
(11) no information about the construction of their simulation or about the events during simulation.
31‐1‐2017 © R.J. Wieringa 45

31‐1‐2017 © R.J. Wieringa 46
Research problem analysis4. Conceptual framework?5. Knowledge questions?6. Population?
Research execution11. What happened?
Research & inference design7. Object of study?8. Treatment specification?9. Measurement specification?10. Inference?
Data analysis12. Descriptions?13. Statistical conclusions?14. Explanations?15. Generalizations?16. Answers?
Empirical cycle
Design validation7. Object of study validity?8. Treatment specification validity?9. Measurement specification validity?10. Inference validity?
12. Descriptions• Data preparations applied? Data transformations, missing values, removal of
outliers? Data management, data availability.• Data interpretations? Coding procedures, interpretation methods?• Descriptive statistics. Demographics? Graphics, tables.• Validity of the descriptions: See checklist for the validity of descriptive inference.
(13. Statistical conclusions)14. Explanations• What explanations (causal, architectural, rational) exist for the observations?• Internal validity: See checklist for the validity of abductive inference.
15. Generalizations• Would the explanations be valid in similar cases or populations too?• External validity: See checklist for the validity of analogic inference
16. Answers• What are the answers to the knowledge questions? Summary of conclusions,
support for and limitations of conclusions.
31‐1‐2017 © R.J. Wieringa 47

(12) Descriptions• Kumar et al. [1] reported the percentage improvement (reduction) in tardiness of the different mechanisms over the base configuration of decentralized ancillaries.
• All improvement data are given in an appendix, and the paper contains numerous graphs visualizing the improvement trend for different settings of the parameters.
31‐1‐2017 © R.J. Wieringa 48

(14) Explanations• The data showed that the totally centralized solution improved on the centralized ancillary solution, which improved on the balanced solution, which improved on the decentralized ancillary solution.
• The authors explain this by the fact that each of these mechanisms includes those that follow it in this list.
• Note that the quantitative amount of the observed improvements cannot be explained, but their ordering can.
31‐1‐2017 © R.J. Wieringa 49

(15) Analogic generalization• The simulations by Kumar et al. can probably be replicated by other researchers, in which case they are generalizable, by architectural analogy, to other simulations.
• Generalization to real hospitals is less well supported. The simulation ignores uncertainty about inputs and resistance to change. There are many architectural capabilities, limitations, and mechanisms in a real hospital that may interfere with the simulated coordination mechanisms in a way that makes the results unreproducible in the real world.
• To learn more about this, real‐world case studies should be done. If a hospital decides to implement one of these coordination mechanisms, then we may be able to study the resulting mechanisms in detail in this case. This would be an evaluation study.
31‐1‐2017 © R.J. Wieringa 50

(16) Answers to research questions• Question: What are the tardiness and flow time of patient test scheduling for each coordinationmechanism? Why?
• Answer: In the absence of disturbing mechanisms and for a simulation of a small hospital, the four coordination mechanisms increasingly reduce tardiness, where total centralization gave the best results.
• Without further research, this cannot be generalized to real hospitals.
31‐1‐2017 © R.J. Wieringa 51

(17) Kumar et al. [1] were the first to apply their centralized and decentralized coordination mechanisms to patient test scheduling. So this was the first knowledge about these artifacts in this context.
(18) Their research was motivated by one particular hospital, and each of their mechanisms improved patient test scheduling performance compared to current performance in the hospital. The paper does not report if one of these mechanisms was actually adopted by the hospital.
31‐1‐2017 © R.J. Wieringa 52
1. Knowledge goal?2. Improvement goal?3. Current knowledge?
Design cycle Empirical cycle
17. Contribution to knowledge goal?18. Contribution to improvement goal?
4. … ….16. …

Case‐based experimentMultiple‐case mechanism experiment
31‐1‐2017 © R.J. Wieringa 53

Vriezekolk, E. and Etalle, S. and Wieringa, R.J. (2015) Experimental Validation of a Risk Assessment Method.
In: 21st International Working Conference on Requirements Engineering: Foundation for Software Quality, REFSQ 2015, 23‐26 Mar 2015, Essen, Germany. pp. 1‐16. Lecture Notes in Computer Science 9013. Springer.
31‐1‐2017 © R.J. Wieringa 54

1. To investigate which of four mechanisms would produce the best patient flow (time taken by the medical tests) and tardiness (time after due date that test result becomes available). Validation research goal.
2. Utility driven.
3. Scheduling knowledge in general, and in hospitals in particular.
31‐1‐2017 © R.J. Wieringa 55
1. Knowledge goal?2. Improvement goal?3. Current knowledge?
Design cycle Empirical cycle
17. Contribution to knowledge goal?18. Contribution to improvement goal?
4. … ….16. …
31‐1‐2017 © R.J. Wieringa 56
Research problem analysis4. Conceptual framework?5. Knowledge questions?6. Population?
Research execution11. What happened?
Research & inference design7. Object of study?8. Treatment specification?9. Measurement specification?10. Inference?
Data analysis12. Data?13. Observations?14. Explanations?15. Generalizations?16. Answers?
Empirical cycle
Design validation7. Object of study validity?8. Treatment specification validity?9. Measurement specification validity?10. Inference validity?
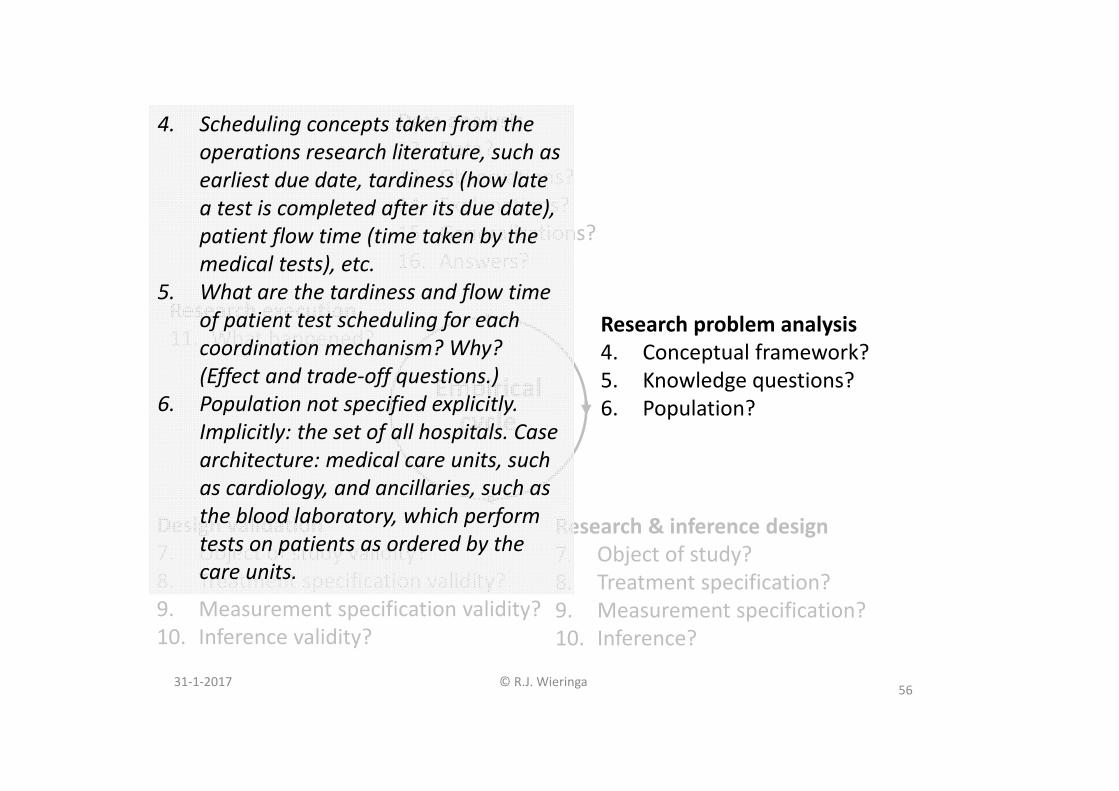
4. Scheduling concepts taken from the operations research literature, such as earliest due date, tardiness (how late a test is completed after its due date), patient flow time (time taken by the medical tests), etc.
5. What are the tardiness and flow time of patient test scheduling for each coordination mechanism? Why? (Effect and trade‐off questions.)
6. Population not specified explicitly. Implicitly: the set of all hospitals. Case architecture: medical care units, such as cardiology, and ancillaries, such as the blood laboratory, which perform tests on patients as ordered by the care units.

31‐1‐2017 © R.J. Wieringa 57
Research problem analysis4. Conceptual framework?5. Knowledge questions?6. Population?
Research execution11. What happened?
Research & inference design7. Object of study?8. Treatment specification?9. Measurement specification?10. Inference?
Data analysis12. Descriptions?13. Statistical conclusions?14. Explanations?15. Generalizations?16. Answers?
Empirical cycle
Design validation7. Object of study validity?8. Treatment specification validity?9. Measurement specification validity?10. Inference validity?

7.1 Acquisition of Objects of Study (cases)
• How do you know that a selected entity is a case? How do you know it satisfies the population predicate?
7.1 The artifacts validated were coordination mechanisms between medical units and ancillaries to schedule patient tests:
• In a decentralized mechanism, each ancillary schedules patient tests independently.
• In a balanced coordination mechanism, the requesting medical unit imposes a patient flow due date.
• In a centralized mechanism, ancillaries additionally coordinate their schedules among each other.
• In a totally centralized mechanism, all coordination is done by a single scheduler.
These four artifacts were tested in a simulation of a hospital with three units, four ancillaries, and 30 patients.
31‐1‐2017 © R.J. Wieringa 58

7.1 Acquisition of Objects of Study (cases) Continued
• Validity of OoS• Inference support. Which inferences would be valid with respect to this design? See Checklist.• Repeatability. Could other researchers use your report to construct or select a similar OoS?• Ethics. Are people informed that they will be studied, and do they consent to this? Are they free to stop at any time without giving reasons, and do they know this?
7.1 Continued
• Inferences• Limitations in external validity: the simulation components are idealizations, e.g. always behave as specified; real‐world care units and ancillaries may resist change; there may be interfering mechanisms.
• Repeatability• Any researcher can build similar simulations.
• Ethics• Not applicable, since no people involved.
31‐1‐2017 © R.J. Wieringa 59

7.2 Construction of a sample• What is the analytical induction strategy? Confirming cases, disconfirming cases, extreme cases?
• Validity of sampling procedure• Inference support. • Repeatability. • Ethics. No new issues.
• (7.2) Only one simulation performed.
31‐1‐2017 © R.J. Wieringa 60

31‐1‐2017 © R.J. Wieringa 61
Research problem analysis4. Conceptual framework?5. Knowledge questions?6. Population?
Research execution11. What happened?
Research & inference design7. Object of study?8. Treatment specification?9. Measurement specification?10. Inference?
Data analysis12. Descriptions?13. Statistical conclusions?14. Explanations?15. Generalizations?16. Answers?
Empirical cycle
Design validation7. Object of study validity?8. Treatment specification validity?9. Measurement specification validity?10. Inference validity?
8. Treatment design
• Which treatment(s) will be applied?
• Which treatment instruments will be used?
• How are treatments allocated to validation models? Scaling up?
• What is the treatment schedule?
• Validity of treatment design:• Inference support. Which inferences would be valid with respect to this design?• Repeatability?• Ethics. No harm done, fair treatment, informed consent?
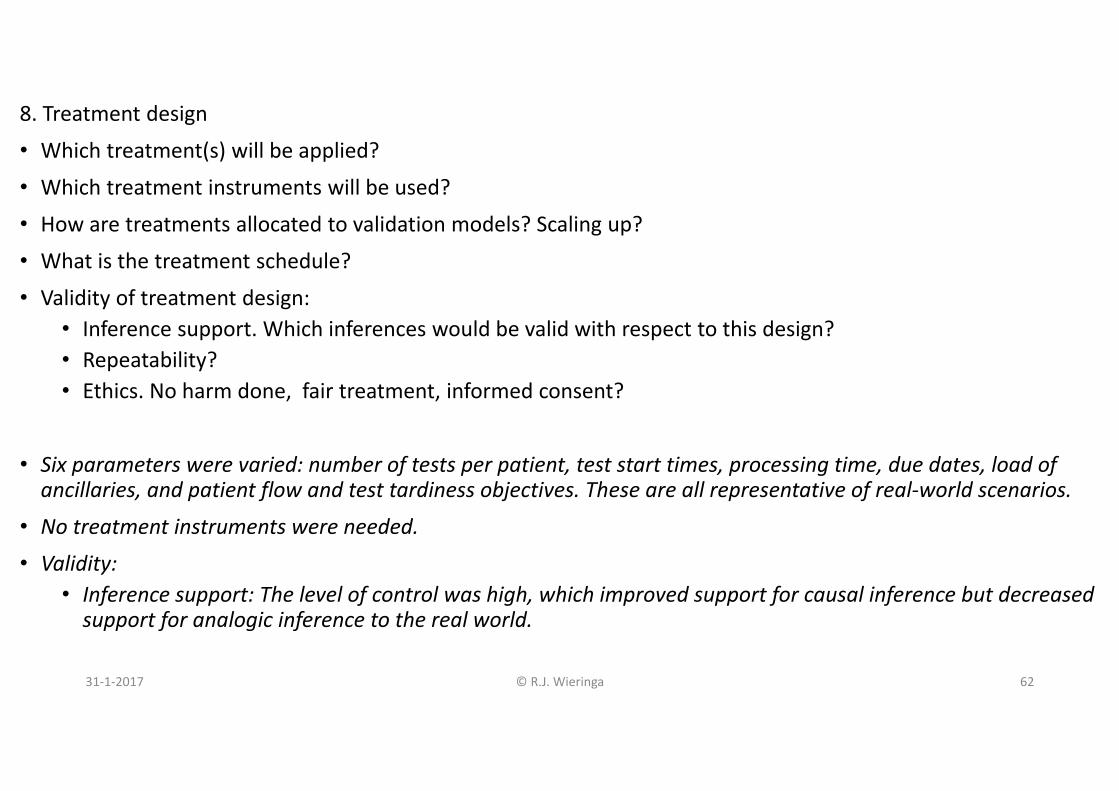
• Six parameters were varied: number of tests per patient, test start times, processing time, due dates, load of ancillaries, and patient flow and test tardiness objectives. These are all representative of real‐world scenarios.
• No treatment instruments were needed.
• Validity: • Inference support: The level of control was high, which improved support for causal inference but decreased support for analogic inference to the real world.
31‐1‐2017 © R.J. Wieringa 62

31‐1‐2017 © R.J. Wieringa 63
Research problem analysis4. Conceptual framework?5. Knowledge questions?6. Population?
Research execution11. What happened?
Research & inference design7. Object of study?8. Treatment specification?9. Measurement specification?10. Inference?
Data analysis12. Descriptions?13. Statistical conclusions?14. Explanations?15. Generalizations?16. Answers?
Empirical cycle
Design validation7. Object of study validity?8. Treatment specification validity?9. Measurement specification validity?10. Inference validity?
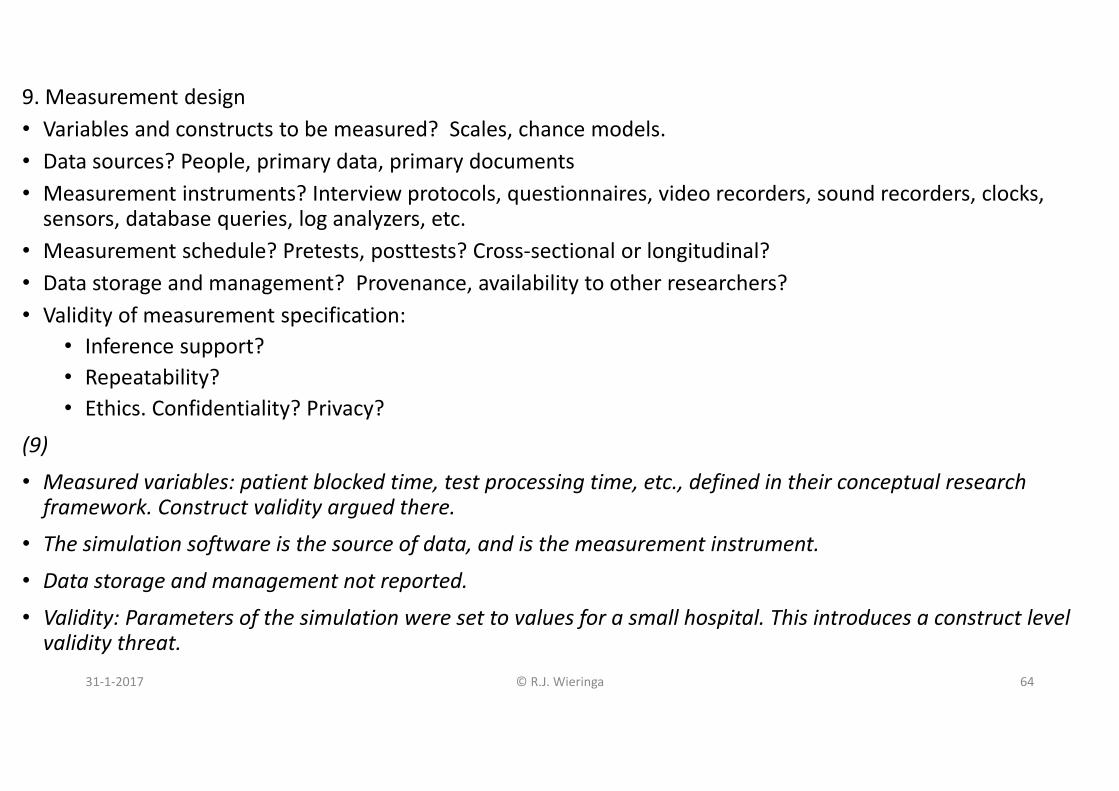
9. Measurement design• Variables and constructs to be measured? Scales, chance models.• Data sources? People, primary data, primary documents • Measurement instruments? Interview protocols, questionnaires, video recorders, sound recorders, clocks, sensors, database queries, log analyzers, etc.
• Measurement schedule? Pretests, posttests? Cross‐sectional or longitudinal?• Data storage and management? Provenance, availability to other researchers?• Validity of measurement specification:
• Inference support?• Repeatability?• Ethics. Confidentiality? Privacy?
(9)
• Measured variables: patient blocked time, test processing time, etc., defined in their conceptual research framework. Construct validity argued there.
• The simulation software is the source of data, and is the measurement instrument.
• Data storage and management not reported.
• Validity: Parameters of the simulation were set to values for a small hospital. This introduces a construct level validity threat.
31‐1‐2017 © R.J. Wieringa 64

31‐1‐2017 © R.J. Wieringa 65
Research problem analysis4. Conceptual framework?5. Knowledge questions?6. Population?
Research execution11. What happened?
Research & inference design7. Object of study?8. Treatment specification?9. Measurement specification?10. Inference?
Data analysis12. Descriptions?13. Statistical conclusions?14. Explanations?15. Generalizations?16. Answers?
Empirical cycle
Design validation7. Object of study validity?8. Treatment specification validity?9. Measurement specification validity?10. Inference validity?

• Using the checklist in research design:• Decide how to do descriptive inference• Hypothesize possible, alternative architectural explanations for your observations• Consider generalizability of this to population
31‐1‐2017 © R.J. Wieringa 66

31‐1‐2017 © R.J. Wieringa 67
Research problem analysis4. Conceptual framework?5. Knowledge questions?6. Population?
Research execution11. What happened?
Research & inference design7. Object of study?8. Treatment specification?9. Measurement specification?10. Inference?
Data analysis12. Descriptions?13. Statistical conclusions?14. Explanations?15. Generalizations?16. Answers?
Empirical cycle
Design validation7. Object of study validity?8. Treatment specification validity?9. Measurement specification validity?10. Inference validity?
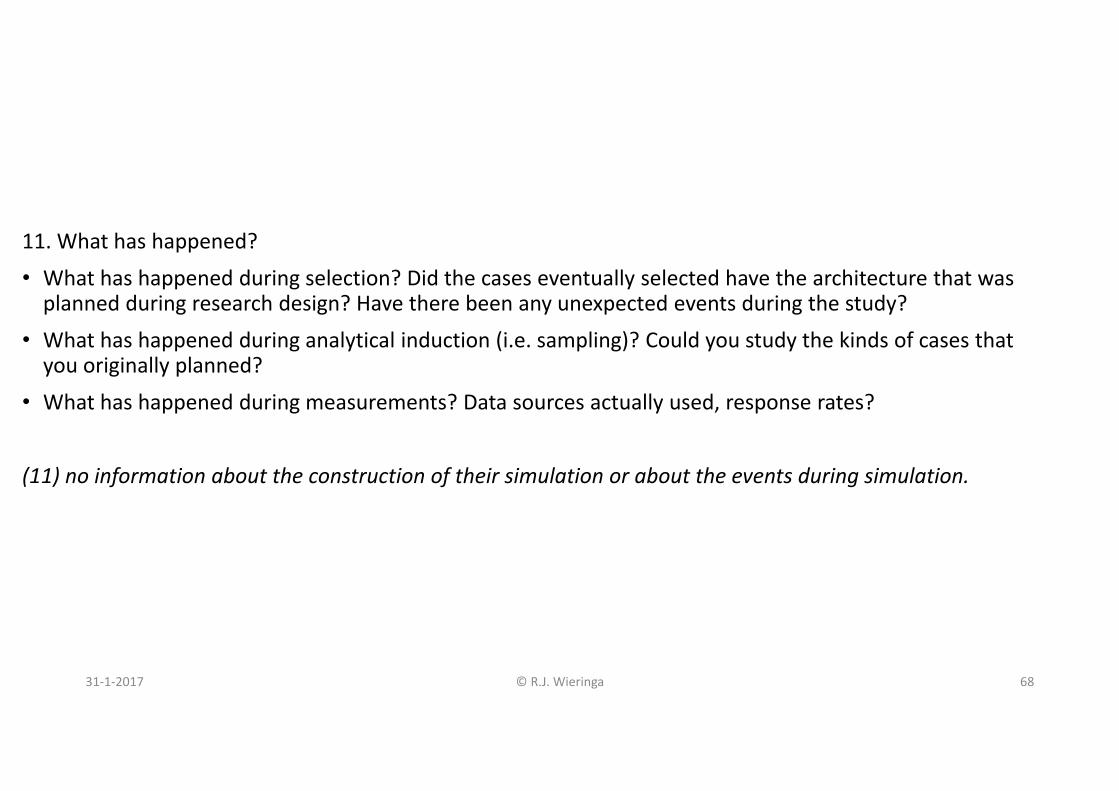
11. What has happened?
• What has happened during selection? Did the cases eventually selected have the architecture that was planned during research design? Have there been any unexpected events during the study?
• What has happened during analytical induction (i.e. sampling)? Could you study the kinds of cases that you originally planned?
• What has happened during measurements? Data sources actually used, response rates?
(11) no information about the construction of their simulation or about the events during simulation.
31‐1‐2017 © R.J. Wieringa 68

31‐1‐2017 © R.J. Wieringa 69
Research problem analysis4. Conceptual framework?5. Knowledge questions?6. Population?
Research execution11. What happened?
Research & inference design7. Object of study?8. Treatment specification?9. Measurement specification?10. Inference?
Data analysis12. Descriptions?13. Statistical conclusions?14. Explanations?15. Generalizations?16. Answers?
Empirical cycle
Design validation7. Object of study validity?8. Treatment specification validity?9. Measurement specification validity?10. Inference validity?

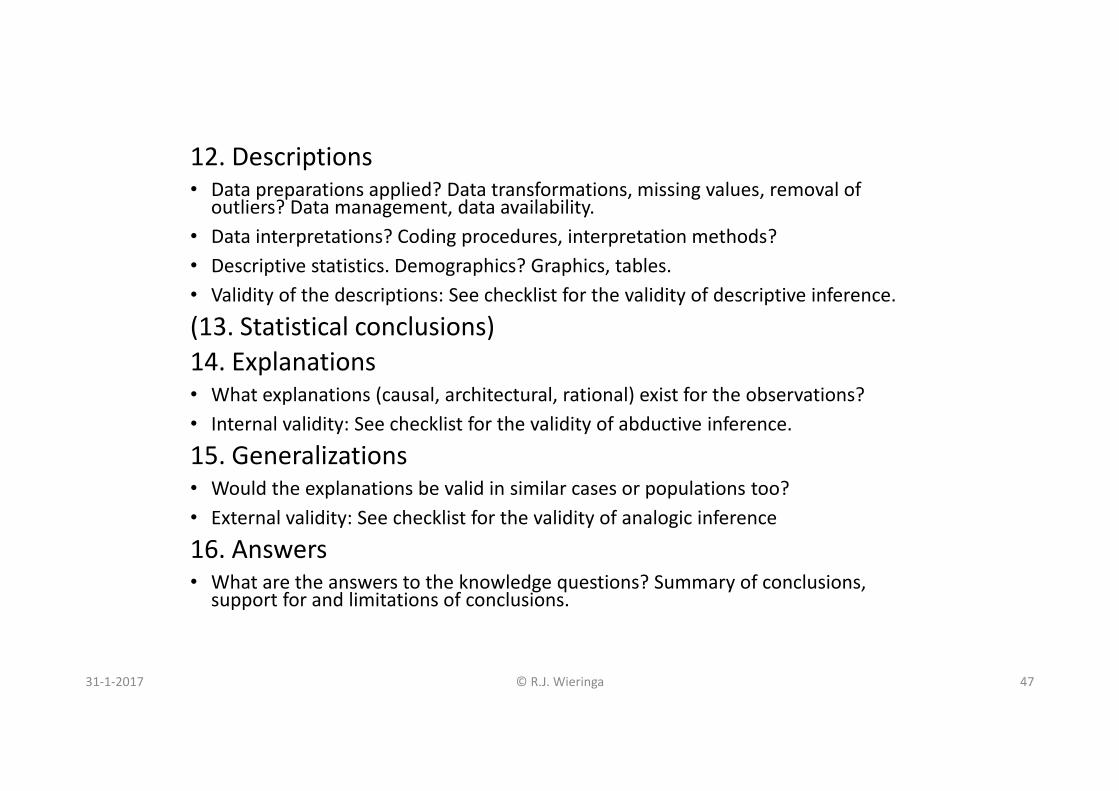
12. Descriptions• Data preparations applied? Data transformations, missing values, removal of outliers? Data management, data availability.
• Data interpretations? Coding procedures, interpretation methods?• Descriptive statistics. Demographics? Graphics, tables.• Validity of the descriptions: See checklist for the validity of descriptive inference.(13. Statistical conclusions)14. Explanations• What explanations (causal, architectural, rational) exist for the observations?• Internal validity: See checklist for the validity of abductive inference.15. Generalizations• Would the explanations be valid in similar cases or populations too?• External validity: See checklist for the validity of analogic inference16. Answers• What are the answers to the knowledge questions? Summary of conclusions, support for and limitations of conclusions.
31‐1‐2017 © R.J. Wieringa 70
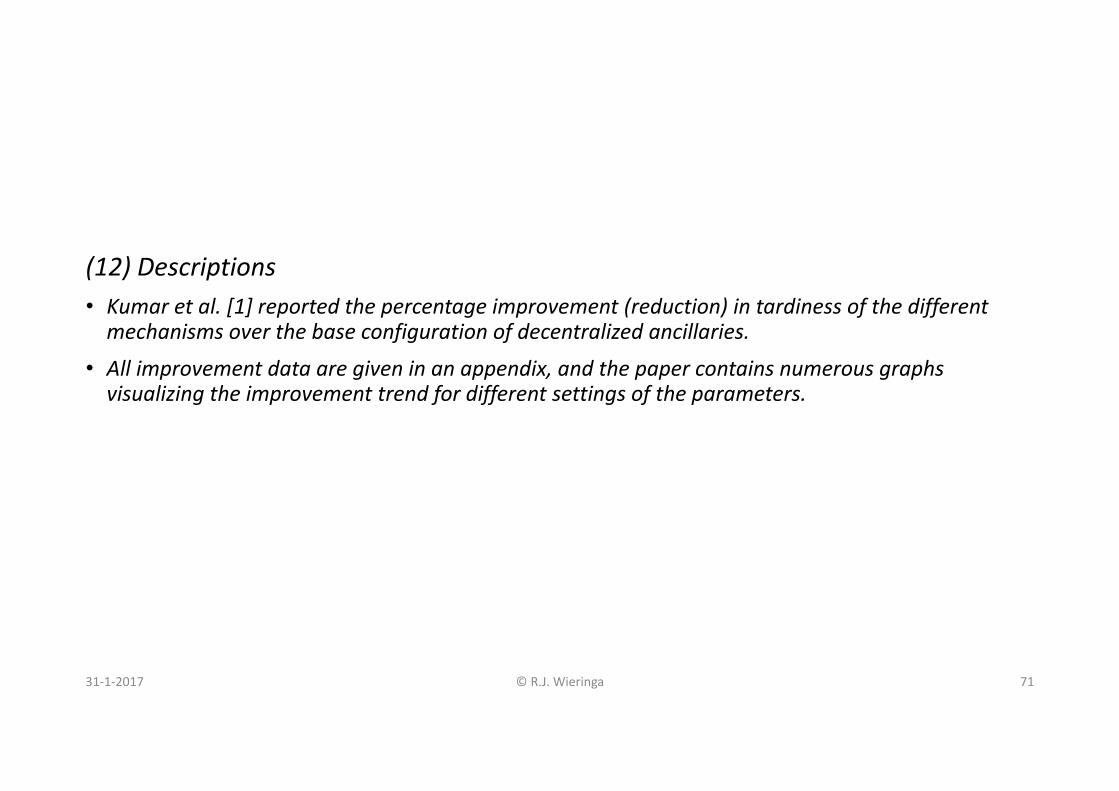
(12) Descriptions• Kumar et al. [1] reported the percentage improvement (reduction) in tardiness of the different mechanisms over the base configuration of decentralized ancillaries.
• All improvement data are given in an appendix, and the paper contains numerous graphs visualizing the improvement trend for different settings of the parameters.
31‐1‐2017 © R.J. Wieringa 71

(14) Explanations• The data showed that the totally centralized solution improved on the centralized ancillary solution, which improved on the balanced solution, which improved on the decentralized ancillary solution.
• The authors explain this by the fact that each of these mechanisms includes those that follow it in this list.
• Note that the quantitative amount of the observed improvements cannot be explained, but their ordering can.
31‐1‐2017 © R.J. Wieringa 72
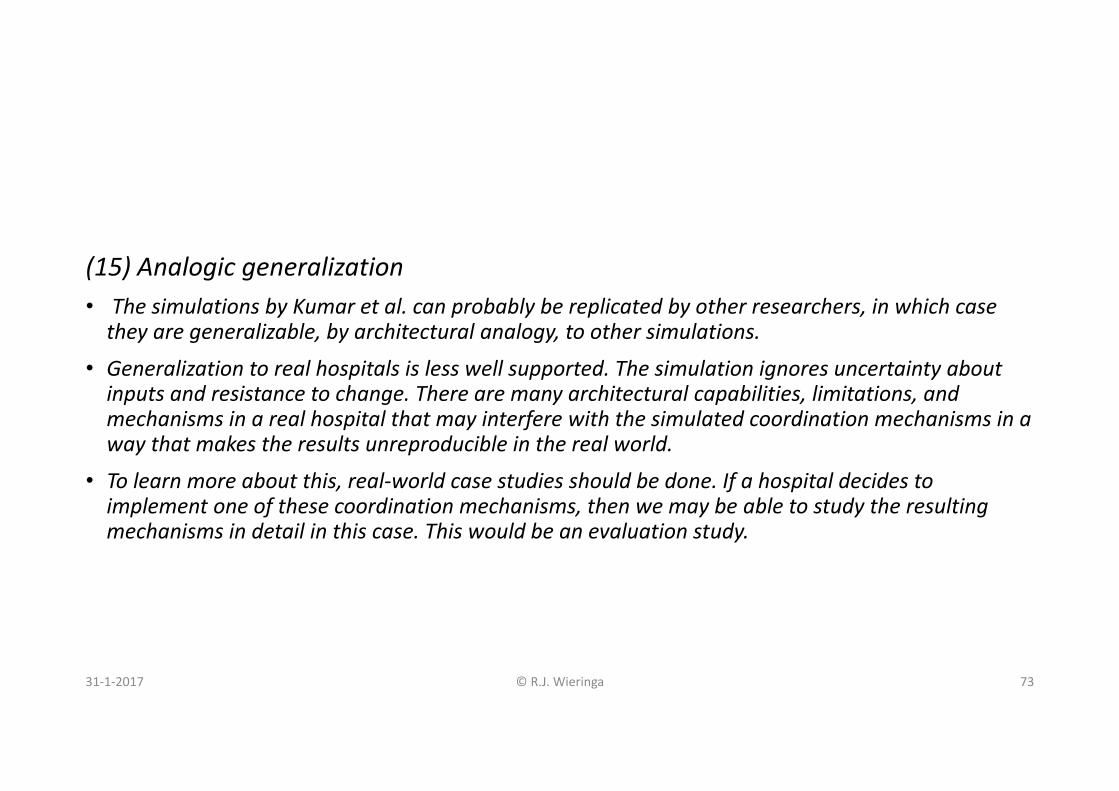
(15) Analogic generalization• The simulations by Kumar et al. can probably be replicated by other researchers, in which case they are generalizable, by architectural analogy, to other simulations.
• Generalization to real hospitals is less well supported. The simulation ignores uncertainty about inputs and resistance to change. There are many architectural capabilities, limitations, and mechanisms in a real hospital that may interfere with the simulated coordination mechanisms in a way that makes the results unreproducible in the real world.
• To learn more about this, real‐world case studies should be done. If a hospital decides to implement one of these coordination mechanisms, then we may be able to study the resulting mechanisms in detail in this case. This would be an evaluation study.
31‐1‐2017 © R.J. Wieringa 73

(16) Answers to research questions• Question: What are the tardiness and flow time of patient test scheduling for each coordinationmechanism? Why?
• Answer: In the absence of disturbing mechanisms and for a simulation of a small hospital, the four coordination mechanisms increasingly reduce tardiness, where total centralization gave the best results.
• Without further research, this cannot be generalized to real hospitals.
31‐1‐2017 © R.J. Wieringa 74

(17) Kumar et al. [1] were the first to apply their centralized and decentralized coordination mechanisms to patient test scheduling. So this was the first knowledge about these artifacts in this context.
(18) Their research was motivated by one particular hospital, and each of their mechanisms improved patient test scheduling performance compared to current performance in the hospital. The paper does not report if one of these mechanisms was actually adopted by the hospital.
31‐1‐2017 © R.J. Wieringa 75
1. Knowledge goal?2. Improvement goal?3. Current knowledge?
Design cycle Empirical cycle
17. Contribution to knowledge goal?18. Contribution to improvement goal?
4. … ….16. …

Technical action research
31‐1‐2017 © R.J. Wieringa 76

Example Technical Action Research (TAR) study
Morali, A. and Wieringa, R.J. (2010) Risk-Based Confidentiality Requirements Specification for Outsourced IT Systems. In: Proceedings of the 18th IEEE International
Requirements Engineering Conference (RE 2010), 27 Sept - 1 Oct 2010, Sydney, Australia. IEEE Computer Society.
31‐1‐2017 © R.J. Wieringa 77

1. To learn about usability and usefulness of the CRAC++ method
2. The improvement goal of the CRAC++ method is to allow a company to assess and manage confidentiality risks when data management has been outsourced, so that they can show to their auditors that they are in control of their information assets.
3. CRAC++ is based on methods that compute quantitative risks, which have been tested independently. CRAC++ itself has only been used on a toy example. This is the first real‐world application.
31‐1‐2017 © R.J. Wieringa 78
1. Knowledge goal?2. Improvement goal?3. Current knowledge?
Design cycle Empirical cycle
17. Contribution to knowledge goal?18. Contribution to improvement goal?
4. … ….16. …

31‐1‐2017 © R.J. Wieringa 79
Research problem analysis4. Conceptual framework?5. Knowledge questions?6. Population?
Research execution11. What happened?
Research & inference design7. Object of study?8. Treatment specification?9. Measurement specification?10. Inference?
Data analysis12. Data?13. Observations?14. Explanations?15. Generalizations?16. Answers?
Empirical cycle
Design validation7. Object of study validity?8. Treatment specification validity?9. Measurement specification validity?10. Inference validity?
4. “Outsourcing client” and “outsourcing provider” are problem concepts. The conceptual framework of CRAC++ contains standard risk assessment concepts such as threat agent, asset, etc. These are solution concepts.
5. Q1 Is the method easy to use?Q2 Does it deliver the same results when used by different persons?Q3 Does it contribute to the client’s understanding of confidentiality risks on an outsourcing relation?
6. any company that has outsourced some of its data management and is subject to external auditing.
31‐1‐2017 © R.J. Wieringa 80
Research problem analysis4. Conceptual framework?5. Knowledge questions?6. Population?
Research execution11. What happened?
Research & inference design7. Object of study?8. Treatment specification?9. Measurement specification?10. Inference?
Data analysis12. Descriptions?13. Statistical conclusions?14. Explanations?15. Generalizations?16. Answers?
Empirical cycle
Design validation7. Object of study validity?8. Treatment specification validity?9. Measurement specification validity?10. Inference validity?

7.1 Acquisition of Objects of Study (artifact x client)
• How do you know that a selected entity is a case? How do you know it satisfies the population predicate?
(7.1)
• The CRAC++ method was applied in a manufacturing company with the required outsourcing architecture. It had an unknown number of other processes and components that we assumed would not influence the use of the CRAC++ method.
• The company was part of the advisory board of the research project in which CRAC++ and other risk assessment methods were developed. This allowed us to build up a trust relationship by which we were reasonably aware of the goals and motivations of the important stakeholders in the client organization.
• The CRAC++ method needed a minor adaptation to the client company. CRAC++ requires the helper to estimate frequencies and impact of successful attacks on the outsourcing architecture, and we adapted the scales to the kind of data we could acquire from the client, and we developed a lightweight tool to manage the large amount of data collected.
31‐1‐2017 © R.J. Wieringa 81

7.1 Acquisition of Objects of Study (artifact x client) Continued
• Validity of OoS• Inference support. Which inferences would be valid with respect to this design? See Checklist.• Repeatability. Could other researchers use your report to construct or select a similar OoS?• Ethics. Are people informed that they will be studied, and do they consent to this? Are they free to stop at any time without giving reasons, and do they know this?
7.1 Continued
• InferencesGeneralizability is an issue. Because it was the researcher herself who applied the method, we could not rule out the possibility that we were studying an instance of CRAC++ as used by its developer rather than an instance of CRAC++.
• Repeatability• We applied CRAC++ at two companies in the same way using the same tool. Other researchers would need instruction in CRAC++ in order to repeat this.
• Ethics• There was informed consent and the right to withdraw any time (not mentioned in the publication …)
31‐1‐2017 © R.J. Wieringa 82

7.2 Construction of a sample• What is the analytical induction strategy? Confirming cases, disconfirming cases, extreme cases?
• Validity of sampling procedure• Inference support. • Repeatability. • Ethics. No new issues.
• (7.2) Two cycles were performed, at two companies. In TAR the selection of negative cases is not possible.
31‐1‐2017 © R.J. Wieringa 83

31‐1‐2017 © R.J. Wieringa 84
Research problem analysis4. Conceptual framework?5. Knowledge questions?6. Population?
Research execution11. What happened?
Research & inference design7. Object of study?8. Treatment specification?9. Measurement specification?10. Inference?
Data analysis12. Descriptions?13. Statistical conclusions?14. Explanations?15. Generalizations?16. Answers?
Empirical cycle
Design validation7. Object of study validity?8. Treatment specification validity?9. Measurement specification validity?10. Inference validity?

8. Treatment design• Which treatment(s) will be applied?• Which treatment instruments will be used? • How are treatments allocated to validation models? Scaling up?• What is the treatment schedule?• Validity of treatment design:
• Inference support. Which inferences would be valid with respect to this design?• Repeatability?• Ethics. No harm done, fair treatment, informed consent?
(8)• The researcher agreed with the client company to do a risk assessment in two calendar weeks, using documents about the architecture of the systems managed by the outsourcing provider.
• Interview with an enterprise architect to ask clarifications about architecture; appointments with the CSO to clarify points regarding sensitivity of data and risk of data loss.
• No control over conditions in the company during the assessment. • CRAC++ applied twice in different clients, which increases support for external validity. • Debriefing with the CSO in which the results would be reported and the advice to the company would be explained. This debriefing would be part of the client evaluation.
31‐1‐2017 © R.J. Wieringa 85

31‐1‐2017 © R.J. Wieringa 86
Research problem analysis4. Conceptual framework?5. Knowledge questions?6. Population?
Research execution11. What happened?
Research & inference design7. Object of study?8. Treatment specification?9. Measurement specification?10. Inference?
Data analysis12. Descriptions?13. Statistical conclusions?14. Explanations?15. Generalizations?16. Answers?
Empirical cycle
Design validation7. Object of study validity?8. Treatment specification validity?9. Measurement specification validity?10. Inference validity?

9. Measurement design• Variables and constructs to be measured? Scales, chance models.• Data sources? People, primary data, primary documents • Measurement instruments? Interview protocols, questionnaires, video recorders, sound recorders, clocks, sensors, database queries, log analyzers, etc.
• Measurement schedule? Pretests, posttests? Cross‐sectional or longitudinal?• Data storage and management? Provenance, availability to other researchers?• Validity of measurement specification:
• Inference support?• Repeatability?• Ethics. Confidentiality? Privacy?
(9) • Objectivity of the risk assessment (asked about in Q2) was operationalized by counting the number of concepts in CRAC++ that needed subjective interpretation to be applied, compared with similar count in other methods.
• Data sources: Primary documents, an enterprise architect interviewed, the CSO, the researcher’s diary to collect data about the outsourcing architecture. The researcher kept a diary too [6].
• Validity: The interview with the CSO was but also how they used the results. This reduced the threat of socially desirable answers.
• Ethics: For one of the projects, all data could be published after anonymization. Data from the other project had to remain confidential.
31‐1‐2017 © R.J. Wieringa 87

31‐1‐2017 © R.J. Wieringa 88
Research problem analysis4. Conceptual framework?5. Knowledge questions?6. Population?
Research execution11. What happened?
Research & inference design7. Object of study?8. Treatment specification?9. Measurement specification?10. Inference?
Data analysis12. Descriptions?13. Statistical conclusions?14. Explanations?15. Generalizations?16. Answers?
Empirical cycle
Design validation7. Object of study validity?8. Treatment specification validity?9. Measurement specification validity?10. Inference validity?

• Using the checklist in research design:• Decide how to do descriptive inference• Hypothesize possible, alternative architectural explanations for your observations• Consider generalizability of this to population
31‐1‐2017 © R.J. Wieringa 89

31‐1‐2017 © R.J. Wieringa 90
Research problem analysis4. Conceptual framework?5. Knowledge questions?6. Population?
Research execution11. What happened?
Research & inference design7. Object of study?8. Treatment specification?9. Measurement specification?10. Inference?
Data analysis12. Descriptions?13. Statistical conclusions?14. Explanations?15. Generalizations?16. Answers?
Empirical cycle
Design validation7. Object of study validity?8. Treatment specification validity?9. Measurement specification validity?10. Inference validity?

11. What has happened?
• What has happened during selection? Did the cases eventually selected have the architecture that was planned during research design? Have there been any unexpected events during the study?
• What has happened during analytical induction (i.e. sampling)? Could you study the kinds of cases that you originally planned?
• What has happened during measurements? Data sources actually used, response rates?
(11) Diary of the researcher was confidential, not published.
31‐1‐2017 © R.J. Wieringa 91

31‐1‐2017 © R.J. Wieringa 92
Research problem analysis4. Conceptual framework?5. Knowledge questions?6. Population?
Research execution11. What happened?
Research & inference design7. Object of study?8. Treatment specification?9. Measurement specification?10. Inference?
Data analysis12. Descriptions?13. Statistical conclusions?14. Explanations?15. Generalizations?16. Answers?
Empirical cycle
Design validation7. Object of study validity?8. Treatment specification validity?9. Measurement specification validity?10. Inference validity?

12. Descriptions• Data preparations applied? Data transformations, missing values, removal of outliers? Data management, data availability.
• Data interpretations? Coding procedures, interpretation methods?
• Descriptive statistics. Demographics? Graphics, tables.
• Validity of the descriptions: See checklist for the validity of descriptive inference.
(13. Statistical conclusions)14. Explanations• What explanations (causal, architectural, rational) exist for the observations?
• Internal validity: See checklist for the validity of abductive inference.
15. Generalizations• Would the explanations be valid in similar cases or populations too?
• External validity: See checklist for the validity of analogic inference
16. Answers• What are the answers to the knowledge questions? Summary of conclusions, support for and limitations of conclusions.31‐1‐2017 © R.J. Wieringa 93

(12) Descriptions• The CRAC++ report [6] contains the key work products of one of the client cases. Since these are work products, they have been verified with the client stakeholders.
• The major observation is that according to the CSOs of the clients, the CRAC++ assessment produced more insight into the confidentiality risk position and trade‐offs than their current, checklist‐based method. We judged this not to be socially desirable statement, as the clients actually did use the CRAC++ risk assessment to renegotiate their service level agreements with their outsourcing provider. So we accept it as a fact.
31‐1‐2017 © R.J. Wieringa 94

(14) Explanations• Our earlier discussion of the validity of our research design, together with the events recorded in the researcher’s diary, provides support for the belief that the effects were produced by CRAC++ and not by something else.
• We concluded from this that the CRAC++ method “worked” in the two client cycles that we performed. In other words, in the two client cycles, the CRAC++ method was a mechanism for increasing insight in confidentiality risks.
31‐1‐2017 © R.J. Wieringa 95

(15) Analogic generalization• The two client organizations where CRAC++ was applied are manufacturing organizations, which are very cost‐aware, have outsourced data management, and yet must comply with auditing standards. The tentative generalization is therefore that similar effects will be obtained by CRAC++ in similar organizations.
31‐1‐2017 © R.J. Wieringa 96

(16) Answers to research questionsQ1 Is the method was easy to use?
• The researcher found the method not so easy to use without a more sophisticated tool, because the method requires a lot of data to be maintained, structured, (re)organized, and graphically presented. This gives a negative answer to Q1.
Q2 Does it deliver the same results when used by different persons?
• The measurements should provide less room for subjective estimates in CRAC++ than in the current methods, suggesting a positive answer to Q2 about repeatability of the results.
Q3 Does it contribute to the client’s understanding of confidentiality risks on an outsourcing relation?
• As indicated earlier, the response of the clients also suggests a positive answer to Q3 about contribution to understanding.
31‐1‐2017 © R.J. Wieringa 97

(17) The CRAC++ projects contributed to the goal of learning about the usability and utility of CRAC++.
(18) The major improvement need was that tool support would be required to make the method usable. On the other hand, the client companies found the method useful but not to the extent that they would invest in a tool to use this method on a regular basis.
31‐1‐2017 © R.J. Wieringa 98
1. Knowledge goal?2. Improvement goal?3. Current knowledge?
Design cycle Empirical cycle
17. Contribution to knowledge goal?18. Contribution to improvement goal?
4. … ….16. …