research methodology - lpu distance education...
TRANSCRIPT

DCOM408/DMGT404
Research Methodology
RESEARCH METHODOLOGY

Copyright © 2012 U. BhojannaAll rights reserved
Produced & Printed byEXCEL BOOKS PRIVATE LIMITED
A-45, Naraina, Phase-I,New Delhi-110028
forLovely Professional University
Phagwara
SYLLABUS
Research MethodologyObjectives: The general objective of this course is to introduce students to methods of research. The specific objectives are: Todevelop understanding of the fundamental theoretical ideas and logic of research; To develop understanding of the issuesinvolved in planning, designing, executing, evaluating and reporting research; To introduce students to many of the technicalaspects of how to do empirical research using some of the main data collection and analysis techniques.
Sr. No. Description
1 An Introduction to Research: Meaning, Process, Defining, Research Problem:
Selection, Understanding, Necessity of defined problem, Research Design , need and
types of Research Design
2 Sampling Design: Steps of Sampling design, Characteristics of good Sampling
Design, Different types of Sampling Design.
3 Measurement and Scaling Technique: Tools of Sound Measurement, Techniques
Of Developing Measurement Tools, Scaling meaning and Important Scaling
Techniques
4 Data Collection: Primary ( Interview, Observation and Questionnaire and
Collection of Secondary Data
5 Data Analysis-1: Measure for Central Tendency, Dispersion
6 Data Analysis-2: Correlation And Regression Analysis , Time series and index
number
7 Hypothesis Testing: Hypothesis Definition and Formulation, t test , z test , ANOVA
8 Multivariate Analysis-1: Classification, Important Methods of Factor analysis,
factor analysis , rotation in Factor Analysis, overview of cluster analysis
9 Multivariate Analysis-2: Discriminant analysis, multi-dimensional scaling, conjoint
analysis
10 Report Writing: Technique and Precaution of Interpretation, Significance of Report
Writing, Layout and Types of Report
DCOM408 RESEARCH METHODOLOGY
Sr. No.
1. An Introduction to Research: Meaning, Process, Defining, Research Problem: Selection,
Understanding, Necessity of defined problem, Research Design , need and types of Research Design. 2. Sampling Design: Steps of Sampling design, Characteristics of good Sampling Design, Different types
of Sampling Design. 3. Measurement and Scaling Technique: Tools of Sound Measurement, Techniques Of Developing
Measurement Tools, Scaling meaning and Important Scaling Techniques 4. Data Collection: Primary ( Interview, Observation and Questionnaire and Collection of Secondary
Data. 5. Data Analysis: Measure for Central Tendency, Dispersion, Correlation And Regression Analysis
6. Hypothesis Testing: Hypothesis Definition and Formulation, t test , z test , ANOVA 7. Multivariate Analysis: Classification, Important Methods of Factor analysis, factor analysis , rotation
in Factor Analysis, overview of cluster analysis, discriminant analysis, multi dimensional scaling ,
conjoint analysis. 8. Report Writing: Technique and Precaution of Interpretation, Significance of Report Writing, Layout
and Types of Report.
9. Time series
10 Index number
DMGT404 RESEARCH METHODOLOGY
Description
CONTENTS
Unit 1: Introduction to Research 1
Unit 2: Research Problem 17
Unit 3: Research Design 25
Unit 4: Sampling Design 56
Unit 5: Measurement and Scaling Techniques 81
Unit 6: Primary Data and Questionnaire 102
Unit 7: Secondary Data 125
Unit 8: Descriptive Statistics 135
Unit 9: Correlation and Regression 164
Unit 10: Time Series 201
Unit 11: Index Numbers 231
Unit 12: Hypothesis Testing 254
Unit 13: Multivariate Analysis 280
Unit 14: Report Writing 302
Statistical Tables 319

LOVELY PROFESSIONAL UNIVERSITY 1
Unit 1: Introduction to Research
NotesUnit 1: Introduction to Research
CONTENTS
Objectives
Introduction
1.1 Meaning of Business Research
1.1.1 Research Objectives
1.1.2 Marketing Research
1.2 Defining Research
1.3 Research Process
1.3.1 Problem Formulation
1.3.2 Evaluate the Cost of Research
1.3.3 Preparing a List of Needed Information
1.3.4 Decision on Research Design
1.3.5 Select the Sample Types
1.3.6 Determine the Sample Size
1.3.7 Organize the Fieldwork
1.3.8 Analyze the Data and Report Preparation
1.4 Types of Research
1.4.1 Exploratory Research
1.4.2 Descriptive Research
1.4.3 Applied Research
1.4.4 Pure/Fundamental Research or Basic Research
1.4.5 Conceptual Research
1.4.6 Causal Research
1.4.7 Historical Research
1.4.8 Ex-post Facto Research
1.4.9 Action Research
1.4.10 Evaluation Research
1.4.11 Library Research
1.5 Summary
1.6 Keywords
1.7 Review Questions
1.8 Further Readings
2 LOVELY PROFESSIONAL UNIVERSITY
Research Methodology
Notes Objectives
After studying this unit, you will be able to:
Recognize the meaning and objectives of research
Define research in the expression of different authors
Generalize the Process of research
Differentiate between different types of research
Introduction
Research means technical and organized search for relevant information on a particular topic. Itis defined as an academic activity that involves identifying the research problem, formulating ahypothesis, collecting and analyzing data and reaching specific conclusions in the form ofsolutions or general theories. The primary objective of research is to find solutions for problemsin a methodical and systematic way. A research depends on the field in which the research workis performed. Various types of researches can be done for different fields, like fundamentalresearch for identifying the important principles of the research field and applied research forsolving an immediate problem. However, all these researches primarily follow two approaches,quantitative and qualitative. The quantitative approach focuses on the quantity of the dataobtained from the research, while the qualitative approach is concerned with the quality of theobtained data.
1.1 Meaning of Business Research
Business research is a systematic and objective process of gathering, recording and analyzingdata for aid in making business decisions. Business research comes within the purview of socialscience research. Social science research refers to research conducted by social scientists (primarilywithin sociology and social psychology), but also within other disciplines such as social policy,human geography, political science, social anthropology and education. Sociologists and othersocial scientists study diverse things: from census data on hundreds of thousands of humanbeings, through the in-depth analysis of the life of a single important person to monitoringwhat is happening on a street today-or what was happening a few hundred years ago.
Social scientists use many different methods in order to describe, explore and understand sociallife. Social methods can generally be subdivided into two broad categories. Quantitative methodsare concerned with attempts to quantify social phenomena and collect and analyze numericaldata, and focus on the links among a smaller number of attributes across many cases. Qualitativemethods, on the other hand, emphasize personal experiences and interpretation overquantification, are more concerned with understanding the meaning of social phenomena andfocus on links among a larger number of attributes across relatively few cases. While verydifferent in many aspects, both qualitative and quantitative approaches involve a systematicinteraction between theories and data.
1.1.1 Research Objectives
Research in common man's language refers to "search for Knowledge".
Research is an art of scientific investigation. It is also a systematic design, collection, analysisand reporting the findings & solutions for the marketing problem of a company. Research isrequired because of the following reasons:
LOVELY PROFESSIONAL UNIVERSITY 3
Unit 1: Introduction to Research
Notes1. To identify and find solutions to the problems
2. To help making decisions
3. To develop new concepts
4. To find alternate strategies
1. To Identify and Find Solutions to the Problem: To understand the problem in depth
Example: "Why is that demand for a product is falling"? "Why is there a business fluctuationonce in three years"? By identifying the problem as above, it is easy to collect the relevant datato solve the problem.
2. To Help making Decisions:
Example: Should we maintain the advertising budget same as last year? Research willanswer this question.
3. To Find Alternative Strategies: Should we follow pull strategy or push strategy to promotethe product.
4. To Develop New Concepts:
Example: CRM, Horizontal Marketing, MLM, etc.
1.1.2 Marketing Research
Marketing research is an important part of overall business research. Systematic collection andanalysis of data relating to sale and distribution of financial products and services is calledmarketing research. Market research is an early step in the marketing process, and includes ananalysis of market demand for a new product, or for existing products, as well as appropriatemethods of distributing those products. Techniques in market research include telephone pollingand focus group interviews to determine customer attitudes, pricing sensitivity, and willingnessto use delivery alternatives. Marketing research, or market research, is a form of businessresearch and is generally divided into two categories: consumer market research and business-to-business (B2B) market research, which was previously known as industrial marketing research.Consumer marketing research studies the buying habits of individual people while business-to-business marketing research investigates the markets for products sold by one business toanother.
Did u know? Most large banks have their own market research departments that evaluatenot only products, but their Brick and Mortar branch banking networks through whichmost banking products are sold.
Self Assessment
Fill in the blanks:
1. Business research comes within the purview of ...................... research.
2. ...................... Market research, which was previously known as industrial marketingresearch.
4 LOVELY PROFESSIONAL UNIVERSITY
Research Methodology
Notes 3. ...................... methods are concerned with attempts to quantify social phenomena andcollect and analyse numerical data.
1.2 Defining Research
Various authors and management gurus have defined research in different ways. Usually aresearch is said to begin with a question or a problem. The purpose of research is to findsolutions through the application of systematic and scientific methods. Thus, research is asystematic approach to purposeful investigation. Some of the proposed definitions of researchare:
According to Redman and Mory, research is a systematised effort to gain new knowledge.
According to Clifford Woody, research comprises defining and redefining problems, formulatinghypotheses or suggesting solutions; collecting, organising and evaluating data; making deductionsand reaching conclusions; and at last carefully testing the conclusions to determine whetherthey agree with the formulated hypothesis or not.
D. Slesinger and M. Stephenson in the Encyclopedia of Social Sciences define research as: 'themanipulation of things, concepts or symbols for the purpose of generalising to extend, corrector verify knowledge, whether that knowledge aids in construction of theory or in the practice ofan art.'
Self Assessment
Fill in the blanks:
4. The purpose of research is to find solutions through the application of ...................... and...................... methods.
5. Research is a systematised effort to gain ......................
6. Research is a systematic approach to ...................... investigation.
1.3 Research Process
Until the sixteenth century, human inquiry was primarily based on introspection. The way toknow things was to turn inward and use logic to seek the truth. This paradigm had endured fora millennium and was a well-established conceptual framework for understanding the world.The seeker of knowledge was an integral part of the inquiry process. A profound change occurredduring the sixteenth and seventeenth centuries. The Scientific Revolution was born. Objectivitybecame a critical component of the new scientific method. The investigator was an observer,rather than a participant in the inquiry process. A mechanistic view of the universe evolved. Webelieved that we could understand the whole by performing an examination of the individualparts. Experimentation and deduction became the tools of the scholar. For two hundred years,the new paradigm slowly evolved to become part of the reality framework of society.
The research process is a step-by-step process of developing a research paper. As you progressfrom one step to the next, it is commonly necessary to backup, revise, add additional material oreven change your topic completely. This will depend on what you discover during your research.There are many reasons for adjusting your plan. For example, you may find that your topic istoo broad and needs to be narrowed, sufficient information resources may not be available,what you learn may not support your thesis, or the size of the project does not fit the requirements.
LOVELY PROFESSIONAL UNIVERSITY 5
Unit 1: Introduction to Research
Notes
Notes The research process itself involves identifying, locating, assessing, analyzing, andthen developing and expressing your ideas. These are the same skills you will needoutside the academic world when you write a report or proposal for your boss.
There are nine steps in the research process, that can be followed while designing a researchproject. They are as follows:
1. Formulate the problem
2. Evaluate the cost of research
3. Prepare the list of information
4. Research design decision
5. Data collection
6. Select the sample type
7. Determine the sample size
8. Organize the field work
9. Analyze the data and report preparation
Defining the research problem and formulation of hypothesis are the hardest steps in the researchprocess.
1.3.1 Problem Formulation
Problem formulation is the key to research process. For a researcher, problem formulationmeans converting the management problem to a research problem. In order to attain clarity, theMR manager and researcher must articulate clearly so that perfect understanding of each othersis achieved.
While problem is being formulated, the following should be taken into account:
1. Determine the objective of the study
2. Consider various environment factors
3. Nature of the problem
4. State the alternative
1. Determine the objective: Objective may be general or specific. General - Would like toknow, how effective was the advertising campaign.
The above looks like a statement with objective. In reality, it is far from it. There are twoways of finding out the objectives precisely. (a) The researcher should clarify with the MRmanager "What effective means". Does effective mean, awareness or does it refer to salesincrease or does it mean, it has improved the knowledge of the audience, or the perceptionof audience about the product. In each of the above circumstances, the questions to beasked from audience varies (b) Another way to find objectives is to find out from the MRManager, "What action will be taken, given the specified outcome of the study.”
6 LOVELY PROFESSIONAL UNIVERSITY
Research Methodology
NotesExample: If research finding is that, the previous advertisement by the company was indeed
ineffective, what course of action the company intends to take (a) Increase the budget for the nextAd (b) Use different appeal (c) Change the media (d) Go to a new agency.
Caution: If objectives are proper, research questions will be precise. However we shouldremember that objectives, do undergo a change.
2. Consider environmental factors: Environmental factors influence the outcome of theresearch and the decision. Therefore, the researcher must help the client to identify theenvironmental factors that are relevant.
Example: Assume that the company wants to introduce a new product like Iced tea orfrozen green peas or ready to eat chapathis.
The following are the environmental factors to be considered:
(a) Purchasing habit of consumers.
(b) Presently, who are the other competitors in the market with same or similar product.
(c) What is the perception of the people about the other products of the company, withrespect to price, image of the company.
(d) Size of the market and target audience.
All the above factors could influence the decision. Therefore researcher must work veryclosely with his client.
3. Nature of the problem: By understanding the nature of the problem, the researcher cancollect relevant data and help suggesting a suitable solution. Every problem is related toeither one or more variable. Before starting the data collection, a preliminary investigationof the problem is necessary, for better understanding of the problem. Initial investigationcould be, by using focus group of consumers or sales representatives.
If focus group is carried out with consumers, some of the following question will help theresearcher to understand the problem better:
(a) Did the customer ever included this company's product in his mental map?
(b) If the customer is not buying the companies product, the reasons for the same.
(c) Why did the customer go to the competitor?
(d) Is the researcher contacting the right target audience?
4. State the alternatives: It is better for the researcher to generate as many alternatives aspossible during problem formulation hypothesis.
Example: Whether to introduce a Sachet form of packaging with a view to increase sales. Thehypothesis will state that, acceptance of the sachet by the customer will increase the sales by20%. Thereafter, the test marketing will be conducted before deciding whether to introducesachet or not. Therefore for every alternative, a hypothesis is to be developed.
1.3.2 Evaluate the Cost of Research
There are several methods to establish the value of research. Some of them are (1) Bayesianapproach (2) Simple saving method (3) Return on investment (4) Cost benefit approach etc.
LOVELY PROFESSIONAL UNIVERSITY 7
Unit 1: Introduction to Research
NotesExample: Company 'X' wants to launch a product. The company's intuitive feeling is that,
the product failure possibilities is 35%. However, if research is conducted and appropriate datais gathered, the chances of failure can be reduced to 30%. Company also has calculated, that theloss would be 3,00,000 if product fails. The company has received a quote from MR agency. Thecost of research is 75,000. The question is "Should the company spend this money to conductresearch?"
Solution:
Loss without research = 3,00,000 × 0.35
= 1,05,000
Loss with research = 3,00,000 × 0.30
= 90,000
Value of research information = 1,05,000 – 90,000
= 15,000
Since the value of information namely 15000 is lower than the cost of research 75,000,conducting research is not recommended.
1.3.3 Preparing a List of Needed Information
Assume that company 'X' wants to introduce a new product (Tea powder). Before introducing it,the product has to be test marketed. The company needs to know the extent of competition, priceand quality acceptance from the market. In this context, following are the list of informationrequired.
1. Total demand and company sales:
Example: What is the overall industry demand? What is the share of the competitor? Theabove information will help the management to estimate overall share and its own shares, inthe market.
2. Distribution coverage:
Example:
(a) Availability of products at different outlets.
(b) Effect of shelf display on sales.
3. Market awareness, attitude and usage:
Example: "What percentage of target population are aware of firm's product"? "Do customersknow about the product"? "What is the customers' attitude towards the product"? "What percentageof customers repurchased the product"?
4. Marketing expenditure:
Example: "What has been the marketing expenditure"? "How much was spent on promotion"?
8 LOVELY PROFESSIONAL UNIVERSITY
Research Methodology
Notes 5. Competitors marketing expenditure:
Example: "How much competitor spent, to market a similar product"?
1.3.4 Decision on Research Design
1. Should the research be exploratory or conclusive?
Exploratory research:
Example: "Causes for decline in sales of a specific company's product in a specific territoryunder a specific salesman".
The researcher may explore all possibilities why sales in falling?
(a) Faulty product planning
(b) Higher price
(c) Less discount
(d) Less availability
(e) Inefficient advertising/salesmanship
(f) Poor quality of salesmanship
(g) less awareness
Not all factors are responsible for decline in sales.
Conclusive research: Narrow down the option. Only one or two factors are responsiblefor decline in sales. Therefore zero down, and use judgment and past experience.
2. Who should be interviewed for collecting data?
If the study is undertaken to determine whether, children influence the brand, for ready -to eat cereal (corn flakes) purchased by their parents. The researcher must decide, if onlyadults are to be studied or children are also to be included. The researcher must decide ifdata is to be collected by observation method or by interviewing. If interviewed, "Is it apersonal interview or telephonic interview or questionnaire?"
3. Should a few cases be studied or choose a large sample?
The researcher may feel that, there are some cases available which are identical andsimilar in nature. He may decide to use these cases for formulating the initial hypothesis.If suitable cases are not available, then the researcher may decide to choose a large sample.
4. How to incorporate experiment in research?
If it is an experiment, "Where and when measurement should take place?", should bedecided.
Example: In a test of advertising copy, the respondents can first be interviewed to measuretheir present awareness, and their attitudes towards certain brands. Then, they can be shown apilot version of the proposed advertisement copy, following this, their attitude also is to bemeasured once again, to see if the proposed copy had any effect on them.
If it is a questionnaire, (a) What are the contents of the questionnaire? (b) What type of questionsto be asked? Like pointed questions, general questions etc. (c) In what sequence should it be
LOVELY PROFESSIONAL UNIVERSITY 9
Unit 1: Introduction to Research
Notesasked? (d) Should there be a fixed set of alternatives or should it be open ended. (e) Should thepurpose be made clear to the respondents or should it be disguised are to be determined well inadvance.
Task Prepare a questionnaire to find if the consumers appreciate your new product ascompared to the older ones or not.
1.3.5 Select the Sample Types
The first task is to carefully select "What groups of people or stores are to be sampled". Forexample, collecting the data from a fast food chain. Here, it is necessary to define what is meantby fast food chain. Also precise geographical location should be mentioned.
Next step is to decide whether to choose probability sampling or non-probability sampling.Probability sampling is one, in which each element has a known chance of being selected.
Notes A non-probability sampling can be convenience or judgment sampling.
1.3.6 Determine the Sample Size
Smaller the sample size, larger the error, vice versa.
Sample size depends up on (a) Accuracy required (b) Time available (c) Cost involved.
Sample size depends on the size of the sample frame/universe. Example: Survey on the attitudestowards the use of shampoo with reference to a specific brand, where husbands, wives orcombination of all of them are to be surveyed or a specific segment is to be surveyed.
!Caution While selecting the sample, the sample unit has to be clearly specified
1.3.7 Organize the Fieldwork
This includes selection, training and evaluating the field sales force to collect the data
(a) How to analyzing the field work?
(b) What type of questionnaire - structured/unstructured to use?
(c) How to approach the respondents?
(d) Week, day and time to meet the specific respondents etc., are to be decided.
1.3.8 Analyze the Data and Report Preparation
This involves (a) Editing, (b) Tabulating, (c) Codifying etc.
1. The data collected should be scanned, to make sure that it is complete and all the instructionsare followed. This process is called editing. Once these forms have been edited, they mustbe coded.
2. Coding means, assigning numbers to each of the answers, so that they can be analyzed.
10 LOVELY PROFESSIONAL UNIVERSITY
Research Methodology
Notes 3. The final step is called as data tabulation. It is the orderly arrangement of the data in atabular form. Also at the time of analyzing the data, the statistical tests to be used must befinalized such as T-Test, Z-test, Chi-square Test, ANOVA, etc.
Self Assessment
Fill in the blanks:
7. ............................. is the orderly arrangement of the data in a tabular form.
8. While selecting the sample, the ............................. has to be clearly specified.
9. A ............................. sampling can be convenience or judgment sampling.
10. The ............................. must decide if data is to be collected by observation method or byinterviewing.
11. It is better for the researcher to generate as many alternatives as possible during problem.............................
12. There are ............................. steps in the research process.
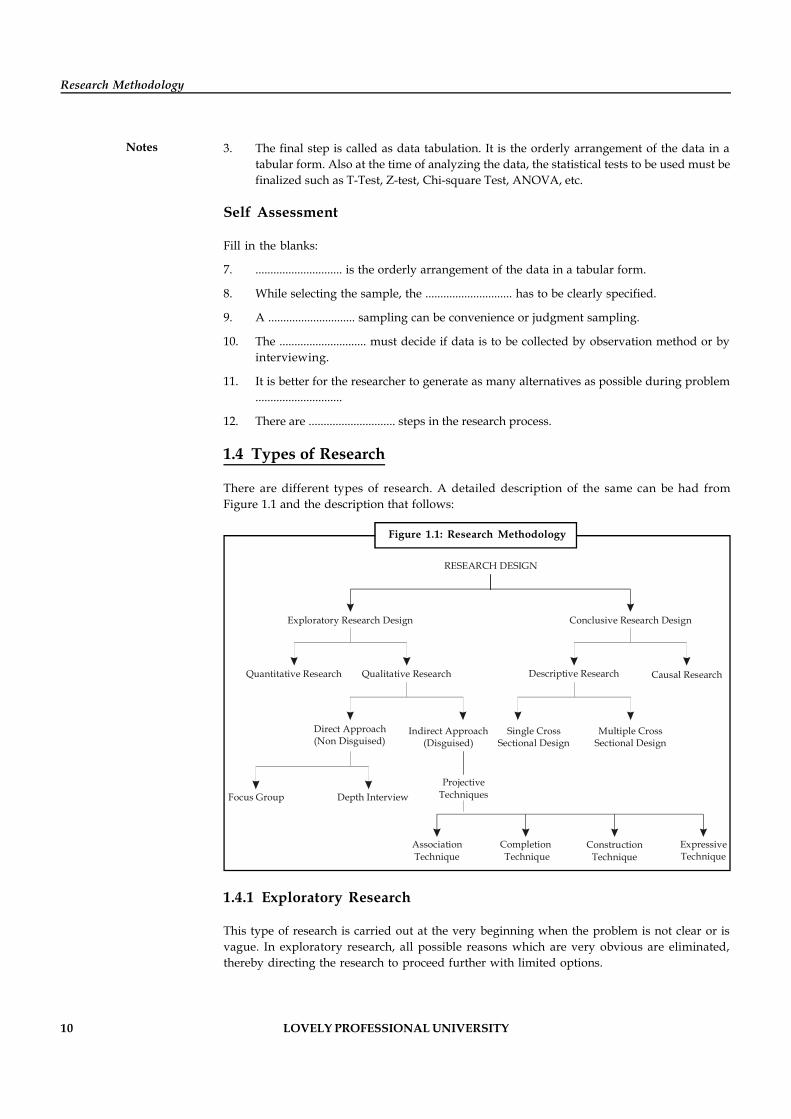
1.4 Types of Research
There are different types of research. A detailed description of the same can be had fromFigure 1.1 and the description that follows:
Figure 1.1: Research Methodology
RESEARCH DESIGN
Exploratory Research Design Conclusive Research Design
Quantitative Research Qualitative Research Descriptive Research Causal Research
Direct Approach(Non Disguised)
Indirect Approach(Disguised)
Depth Interview
Single Cross Sectional Design
Multiple Cross Sectional Design
ProjectiveTechniques
Completion Technique
ConstructionTechnique
Focus Group
ExpressiveTechnique
AssociationTechnique
1.4.1 Exploratory Research
This type of research is carried out at the very beginning when the problem is not clear or isvague. In exploratory research, all possible reasons which are very obvious are eliminated,thereby directing the research to proceed further with limited options.
LOVELY PROFESSIONAL UNIVERSITY 11
Unit 1: Introduction to Research
NotesSales decline in a company may be due to:
1. Inefficient service
2. Improper price
3. Inefficient sales force
4. Ineffective promotion
5. Improper quality
The research executives must examine such questions to identify the most useful avenues forfurther research. Preliminary investigation of this type is called exploratory research. Expertsurveys, focus groups, case studies and observation methods are used to conduct the exploratorysurvey.
1.4.2 Descriptive Research
The main purpose of descriptive research is to describe the state of view as it exists at present.Simply stated, it is a fact finding investigation. In descriptive research, definite conclusions canbe arrived at, but it does not establish a cause and effect relationship. This type of research triesto describe the characteristics of the respondent in relation to a particular product.
1. Descriptive research deals with demographic characteristics of the consumer. For example,trends in the consumption of soft drink with respect to socio-economic characteristics suchas age, family, income, education level etc. Another example can be the degree of viewingTV channels, its variation with age, income level, profession of respondent as well as timeof viewing. Hence, the degree of use of TV to different types of respondents will be ofimportance to the researcher. There are three types of players who will decide the usage ofTV: (i) Television manufacturers, (ii) Broadcasting agency of the programme, (iii) Viewers.Therefore, research pertaining to any one of the following can be conducted:
(a) The manufacturer can come out with facilities which will make the television moreuser-friendly. Some of the facilities are – (i) Remote control, (ii) Child lock,(iii) Different models for different income groups, (iv) Internet compatibility etc.,(v) Wall mounting etc.
(b) Similarly, broadcasting agencies can come out with programmes, which can suitdifferent age groups and income.
(c) Ultimately, the viewers who use the TV must be aware of the programmes appearingin different channels and can plan their viewing schedule accordingly.
2. Descriptive research deals with specific predictions, for example, sales of a company'sproduct during the next three years, i.e., forecasting.
3. Descriptive research is also used to estimate the proportion of population who behave ina certain way.
Example: "Why do middle income groups go to Food World to buy their products?"
A study can be commissioned by a manufacturing company to find out various facilities that canbe provided in television sets based on the above discussion.
Similarly, studies can be conducted by broadcasting stations to find out the degree of utility ofTV programmes.
12 LOVELY PROFESSIONAL UNIVERSITY
Research Methodology
Notes Example: The following hypothesis may be formulated about the programmes:
1. The programmes in various channels are useful by way of entertainment to the viewers.
2. Viewers feel that TV is a boon for their children in improving their knowledge- especially,fiction and cartoon programmes.
1.4.3 Applied Research
Applied research aims at finding a solution for an immediate problem faced by any businessorganization. This research deals with real life situations.
Example: "Why have sales decreased during the last quarter"? Market research is an exampleof applied research. Applied research has a practical problem-solving emphasis. It brings outmany new facts.
1. Use of fibre glass body for cars instead of metal.
2. To develop a new market for the product.
1.4.4 Pure/Fundamental Research or Basic Research
Gathering knowledge for knowledge's sake is known as basic research. It is not directly involvedwith practical problems. It does not have any commercial potential. There is no intention toapply this research in practice. Tata Institute of Fundamental Research conducts such studies.
Example:Theory of Relativity (by Einstein).
1.4.5 Conceptual Research
This is generally used by philosophers. In this type of research, the researcher should collect thedata to prove or disapprove his hypothesis. The various ideologies or 'isms' are examples ofconceptual research.
Did u know? Conceptual Research is related to some abstract idea or theory.
1.4.6 Causal Research
Causal research is conducted to determine the cause and effect relationship between the twovariables.
Example: Effect of advertisement on sales.
1.4.7 Historical Research
The name itself indicates the meaning of the research. Historical study is a study of past recordsand data in order to understand the future trends and development of the organisation ormarket. There is no direct observation. The research has to depend on the conclusions orinferences drawn in the past.
LOVELY PROFESSIONAL UNIVERSITY 13
Unit 1: Introduction to Research
NotesExample: Investors in the share market study the past records or prices of shares which
he/she intends to buy. Studying the share prices of a particular company enables the investor totake decision whether to invest in the shares of a company.
Crime branch police/CBI officers study the past records or the history of the criminals andterrorists in order to arrive at some conclusions.
The main objective of this study is to derive explanation and generalization from the past trendsin order to understand the present and anticipate the future.
There are however, certain shortcomings of historical research:
1. Reliability and adequacy information is subjective and open to question
2. Accuracy of measurement of events is doubtful.
3. Verification of records are difficult.
Task List the records to be considered while conducting a historical research in analyzingthe sales aspect of a television brand
1.4.8 Ex-post Facto Research
In this type of research, an examination of relationship that exists between independent anddependent variable is studied. We may call this empirical research. In this method, the researcherhas no control over an independent variable. Ex-post facto literally means "from what is doneafterwards". In this research, a variable "A" is observed. Thereafter, the researcher tries to find acausal variable "B" which caused "A". It is quite possible that "B" might not have been caused "A".In this type of analysis, there is no scope for the researcher to manipulate the variable. Theresearcher can only report "what has happened" and "what is happening".
1.4.9 Action Research
This type of research is undertaken by direct action. Action research is conducted to solve aproblem. For example, test marketing a product is an example of action research. Initially, thegeographical location is identified. A target sample is selected from among the population.Samples are distributed to selected samples and feedback is obtained from the respondent. Thismethod is most common for industrial products, where a trial is a must before regular usage ofthe product.
1.4.10 Evaluation Research
This is an example of applied research. This research is conducted to find out how well a plannedprogramme is implemented. Therefore, evaluation research deals with evaluating theperformance or assessment of a project.
Example: "Rural Employment Programme Evaluation" or "Success of Midday MealProgramme".
14 LOVELY PROFESSIONAL UNIVERSITY
Research Methodology
Notes 1.4.11 Library Research
This is done to gather secondary data. This includes notes from the past data or review of thereports already conducted. This is a convenient method whereby both manpower and time aresaved.
Self Assessment
Fill in the blanks:
13. ................... is conducted to solve a problem.
14. In ................... research, an examination of relationship that exists between independentand dependent variable is studied.
15. ................... research is generally used by philosophers.
16. Descriptive research deals with ................... characteristics of the consumer
17. Evaluation research is an example of ................... research
18. ................... research is done to gather secondary data.
19. Gathering knowledge for knowledge's sake is known as ................... research.
20. In exploratory research, all possible reasons which are ................... are eliminated
1.5 Summary
Research originates in a decision process.
Usually a research is said to begin with a question or a problem.
In research process, management problem is converted into a research problem which isthe major objective of the study.
Research question is further subdivided, covering various facets of the problem that needto be solved.
The role and scope of research has greatly increased in the field of business and economyas a whole.
The study of research methods provides you with knowledge and skills you need to solvethe problems and meet the challenges of today is modern pace of development.
1.6 Keywords
Ad Tracking: It is periodic or continuous in-market research to monitor a brand's performanceusing measures such as brand awareness, brand preference, and product usage.
Advertising Research: It is a specialized form of marketing research conducted to improve theefficacy of advertising.
Concept Testing: To test the acceptance of a concept by target consumers.
Copy Testing: It predicts in-market performance of an ad before it airs by analyzing audiencelevels of attention, brand linkage, motivation, entertainment, and communication, as well asbreaking down the ad's flow of attention and flow of emotion.
LOVELY PROFESSIONAL UNIVERSITY 15
Unit 1: Introduction to Research
NotesExploratory Research: Exploratory research provides insights into and comprehension of anissue or situation.
Marketing Research: Marketing research is about researching the whole of a company'smarketing process.
Mystery Shopping: An employee or representative of the market research firm anonymouslycontacts a salesperson and indicates he or she is shopping for a product. The shopper thenrecords the entire experience.
Product Research: This looks at what products can be produced with available technology, andwhat new product innovations near-future technology can develop.
1.7 Review Questions
1. An Indian company dealing in pesticides hires a qualified business management graduateto expand its marketing activities. Most of the current employees of the company arequalified chemists with science background. During their first review meeting themanagement graduate says that the "company should be involved in market research toget a better perspective of the problem on hand". On hearing this, one of the sciencegraduate laughs and says "There is no such thing as marketing or business research,research is combined to science alone." What would be your response?
2. What would be the instances in which you might take causal research in your organization?
3. It is said that action research is conducted to solve a problem. Why are the other researchesconducted then?
4. What type of research would you undertake in order find why middle income groups goto a particular retail store to buy their products?
5. Which research would you undertake if you have got a practical problem?
6. Which type of research would you conduct when the problem is not clear and all thepossible reasons are eliminated? Why?
7. How does a research help the managers to determine the pattern of consumption?
8. Do you think that a market research helps the marketer to identify brand loyalty andestablish it with further strength? Why/why not?
9. When records exist in all authenticated form, why is it so that their verification remains abig issue?
10. Is there any difference in pure research and ex-post facto research? Support you answerwith suitable reasons.
Answers: Self Assessment
1. Social science 2. Business to Business (B2B)
3. Quantitative 4. Systematic, scientific
5. New knowledge 6. Purposeful
7. Data tabulation 8. sample unit
9. non-probability 10. researcher
16 LOVELY PROFESSIONAL UNIVERSITY
Research Methodology
Notes 11. formulation hypothesis 12. nine
13. Action research 14. Ex-post Facto
15. Conceptual 16. demographic
17. applied 18. Library
19. basic 20. very obvious
1.8 Further Readings
Books Abrams, M.A., Social Surveys and Social Action, London: Heinemann, 1951.
Arthur, Maurice, Philosophy of Scientific Investigation , Baltimore: John HopkinsUniversity Press, 1943.
Bernal, J.D., The Social Function of Science, London: George Routledge and Sons,1939.
Chase, Stuart, The Proper Study of Mankind: An inquiry into the Science of HumanRelations, New York, Harper and Row Publishers, 1958.
S. N. Murthy and U. Bhojanna, Business Research Methods, Excel Books.
LOVELY PROFESSIONAL UNIVERSITY 17
Unit 2: Research Problem
NotesUnit 2: Research Problem
CONTENTS
Objectives
Introduction
2.1 Research Problem
2.2 Selection of the Problem
2.3 Understanding the Problem
2.4 Necessity of Defined Problem
2.5 Self Questioning by Researcher while Defining the Problem
2.6 Summary
2.7 Keywords
2.8 Review Questions
2.9 Further Readings
Objectives
After studying this unit, you will be able to:
Formulate a research problem
Identify the selection of the problem
Report the understanding of problem
State about necessity of defined problem
Demonstrate the Self Questioning by researcher while defining the problem
Introduction
In all organizations, some kind of research is required to support decision-making, for example,examination of circulation records to determine if fund allocations should be changed. A managerexists in three time dimensions: past, present and future. The past specifies an accurate sense ofwhat was achieved and what was not, while the present specifies what is being achieved. On theother hand, the future time dimension specifies what a manager should achieve.
Research is used to provide facts on the first two, which supports the decisions that will have animpact on the future. These decisions are made on the basis of collected data or facts. Theimportance of the decisions and their impact on the organization will determine the importanceof research.
There is a famous saying that "problem well-defined is half solved". This statement is strikinglytrue in market research, because if the problem is not stated properly, the objectives will not beclear. If the objective is not clearly defined, the data collection becomes meaningless.
Research problem is a condition that causes a researcher to feel anxious, uneasy and confused. Itinvolves the complete analysis of the problem area involving who, what, where, when and whyof the problem situation.
18 LOVELY PROFESSIONAL UNIVERSITY
Research Methodology
Notes 2.1 Research Problem
A research problem refers to some difficulty which an organisation faces and wishes to obtain asolution for the same.
While doing research, defining the problem is very important because "problem clearly statedis half-solved". This shows how important it is to "define the problem correctly". While definingthe problem, it should be noted that definition should be unambiguous. If the problem definingis ambiguous, then the researcher will not know "what data is to be collected" or "what techniqueis to be used" etc.
Example of an ambiguous definition: "Find out by how much sales has declined recently". Let ussuppose that the research problem is defined in a broad and general way as follows:
"Why is the productivity in Korea much higher than that in India"? In this type of question, anumber of ambiguities are there, such as:
1. What sort of productivity is to be specified; is it men, machine, materials?
2. To which type of industry is the productivity related to?
3. In which time-frame are we analysing the productivity?
Example of an unambiguous definition: On the contrary, a problem will be as follows:
"What are the factors responsible for increased labour productivity in Korean textilemanufacturing industries during 1996-07 relative to Indian textile industries?"
Notes Problem formulation is the key to research process. For a researcher, problemformulation means converting the management problem to a research problem. In orderto attain clarity, the M.R. manager and researcher must articulate clearly so that perfectunderstanding of each others is achieved.
In research process, the first and foremost step happens to be that of selecting and properlydefining a research problem. A researcher must find the problem and formulate it so that itbecomes susceptible to research. To define a problem correctly, a researcher must know: what aproblem is?
Did u know? Like a medical doctor, a researcher must examine all the symptoms (presentedto him or observed by him) concerning a problem before he can diagnose correctly.
Self Assessment
Fill in the blanks:
1. In order to attain clarity, the manager and researcher must ...................... clearly.
2. Problem ......................... is the key to research process.
3. To define a problem correctly, a researcher must know: ...................................
LOVELY PROFESSIONAL UNIVERSITY 19
Unit 2: Research Problem
Notes2.2 Selection of the Problem
The research problem undertaken for study must be carefully selected. The task is a difficult one,although it may not appear to be so. Help may be taken from a research guide in this connection.Nevertheless, every researcher must find out his own salvation for research problems cannot beborrowed. A problem must spring from the researcher's mind like a plant springing from itsown seed. If our eyes need glasses, it is not the optician alone who decides about the number ofthe lens we require. We have to see ourself and enable him to prescribe for us the right numberby cooperating with him. Thus, a research guide can at the most only help a researcher choose asubject.
Inevitably, selecting a problem is somewhat arbitrary, idiosyncratic, and personal. Avoidselecting the first problem that you encounter. Try to select the most interesting and personallysatisfying choice from among two or three possibilities. The problem selection should matter toyou. You should be eager and enthusiastic.
A good topic should be small enough for a conclusive investigation and large enough to yieldinteresting results.
!Caution Remember that research must yield a publication for it to have meaning.
You may wish to query likely periodical editors to see if they might be interested in an articleon your research topic.
In some cases, as with a thesis or a dissertation, some sort of preliminary study may be neededto see if the problem and the study are feasible and to identify snags. Such a PILOT STUDY canbe quite valuable.
Task Analyse what problems you might encounter while selecting a problem?
Selection Criteria
1. Your genuine enthusiasm for the problem.
2. Controversial subject should not become the choice of an average researcher.
3. The degree to which research on this problem benefits the profession and society.
4. The degree to which research on this problem will assist your professional goals andcareer objectives.
5. Too narrow or too vague problems should be avoided.
6. The degree to which this research will interest superiors and other leaders in the field.
7. The degree to which the research builds on your experience and knowledge.
8. Ease of access to the population to be studied and the likelihood that they will be cooperativeAffordability.
20 LOVELY PROFESSIONAL UNIVERSITY
Research Methodology
Notes 9. Likelihood of publication.
10. Relationship to theories or accepted generalizations in the field.
11. Degree to which ethical problems are involved.
12. Degree to which research is unique or fills a notable gap in the literature.
13. Degree to which the research builds on and extends existing knowledge before the finalselection of a problem is done, a researcher must ask himself the following questions:
(a) Whether he is well equipped in terms of his background to carry out the research?
(b) Whether the study falls within the budget he can afford?
(c) Whether the necessary cooperation can be obtained from those who must participatein research as subjects?
Self Assessment
Fill in the blanks:
4. A good topic should be small enough for a .......................... investigation.
5. A ......................... should always avoid selecting the first problem that he encounters.
6. The research problem undertaken for study must be ....................... selected.
2.3 Understanding the Problem
Once the problem has been selected, the same has to be understood thoroughly and then thesame has to be reframed into meaningful terms from an analytical point of view. The first stepin research is to formulate the problem. A company manufacturing television sets might thinkthat it is losing sales to a foreign company. A brief illustration aptly demonstrates how suchproblem can be ill-conceived. The management of a company felt, a drop in sales was because ofthe poor quality of product. Subsequently, research was undertaken with a view to improve thequality of the product. But despite an improvement in quality, sales did not pick up. In this case,we may say that the problem is ill-defined. The actual reason was ineffective sales promotion.The problem thus needs to be carefully identified.
Did u know? Marketing problem which needs research can be classified into two categories:
1. Difficulty related problems
2. Opportunity related problems, while the first category produces negative resultssuch as, decline in market share or sales, the second category provides benefits.
Problem definition might refer to either a real-life situation or it may also refer to a set ofopportunities. Market research problems or opportunities will arise under the followingcircumstances: (1) Unanticipated change (2) Planned change. Many factors in the environmentcan create problems or opportunities. Thus, change in the demographics, technological andlegal changes affect the marketing function. Now the question is how the company responds tonew technology, or product introduced by the competitor or how to cope with the changes inlife-styles. It may be a problem and at the same time, it can also be viewed as an opportunity. Inorder to conduct research, the problem must be defined accurately.
LOVELY PROFESSIONAL UNIVERSITY 21
Unit 2: Research Problem
NotesWhile formulating the problem, clearly define:
1. Who is the focus?
2. What is the subject-matter of research?
3. To which geographical territory/area the problem refers to?
4. To which period does the study pertains to?
Example: "Why does the upper-middle class of Bangalore shop at Life-style during theDiwali season"?
Here all the above four aspects are covered. We may be interested in a number of variables dueto which shopping is done at a particular place. The characteristic of interest to the researchermay be (1) Variety offered at life-style (2) Discount offered by way of promotion (3) Ambienceat the life-style and (4) Personalised service offered. In some cases, the cause of the problem isobvious whereas in others the cause is not so obvious. The obvious causes are the products beingon the decline. Not so obvious causes could be a bad first experience for the customer.
Self Assessment
Fill in the blanks:
7. Changes in the demographics, technological and legal changes affect the .......................function.
8. Opportunity related problems produce ........................... results.
9. The first step in research is to formulate the ………………..
2.4 Necessity of Defined Problem
Defining a research problem properly is a prerequisite for any study and is a step of the highestimportance. A problem well defined is half solved. Defining the problem is often more essentialthan its solution because when the problem is formulated, an appropriate technique can beapplied to generate alternative solutions. This statement signifies the need for defining a researchproblem. The problem to be investigated must be defined unambiguously for that will help todiscriminate relevant data from the irrelevant ones. When you define a research problem youare trying to reduce the outcome of an answer. The question of course when you speak about"marketing research" is how I can target more customers that I can sell my product to. You arelooking for specific answers such as: "What type of soda do all foreign born males between theages of 25-35 drink?" This is defining the problem. What do you consider foreign born males?What constitutes soda? etc. This is important because companies and sales organization attemptto "target" their market instead of taking a shotgun approach. The process is to first make sureany information you obtain is credible and from a reputable organization. Then break downyour problem and pick apart any inconsistencies you may see within you research project.Problem formulation is the key to research process. For a researcher, problem formulationmeans converting the management problem to a research problem. In order to attain clarity, themanager and researcher must articulate clearly so that perfect understanding of each others isachieved.
22 LOVELY PROFESSIONAL UNIVERSITY
Research Methodology
Notes
Notes A proper definition of research problem will enable the researcher to be on thetrack whereas an ill-defined problem may create hurdles.
What are the sources of problem identification?
Research students can adopt the following ways to identify the problems:
1. Research reports already published may be referred to define a specific problem.
2. Assistance of any research organisation, which handles a number of projects of thecompanies, can be sought to identify the problem.
3. Professors working in reputed academic institution can act as guides in problemidentification.
4. Company employees and competitors can assist in identifying the problems.
5. Cultural and technological changes can act as a source for research problem identification.
6. Seminars/symposiums/focus groups can act as a useful source.
Self Assessment
Fill in the blanks:
10. ........................ and ...................... changes can act as a source for research problemidentification.
11. Research reports already published may be referred to define a ...........................
12. When you define a research problem you are trying to ...................... the outcome of ananswer.
13. A problem well ..................... is half solved.
2.5 Self Questioning by Researcher while Defining the Problem
1. Is the research problem correctly defined?
2. Is the research problem solvable?
3. Can relevant data be gathered through the process of marketing research?
4. Is the research problem significant?
5. Can the research be conducted within the available resources?
6. Is the time given to complete the project sufficient?
7. What exactly will be the difficulties in conducting the study, and hurdles to be overcome?
8. Am I competent, to carry the study out?
Managers often want the results of research in accordance with their expectation. This satisfiesthem immensely. If one were to closely look at the questionnaire, it is found that in most cases,there are stereotyped answers given by the respondents.
LOVELY PROFESSIONAL UNIVERSITY 23
Unit 2: Research Problem
Notes
!Caution Creativity aspect is fundamentally to be included by a researcher to look atproblems in a different perspective.
Self Assessment
Fill in the blanks:
14. Managers often want the results of research in accordance with their ........................
15. Assistance of any research organisation, which handles a number of projects of thecompanies, can be sought to ........................... the problem.
2.6 Summary
Proper problem formulation is the key to success in research.
It is vital and any error in defining the problem incorrectly can result in wastage of timeand money.
Several elements of introspection will help in defining the problem correctly.
The task of defining a research problem, very often, follows a sequential pattern.
The problem is stated in a general way, the ambiguities are resolved, thinking andrethinking process results in a more specific formulation of the problem.
It is done so that it may be a realistic one in terms of the available data and resources andis also analytically meaningful.
All this results in a well defined research problem that is not only meaningful from anoperational point of view.
But is equally capable of paving the way for the development of working hypotheses andfor means of solving the problem itself.
2.7 Keywords
Marketing Research Problem: It is a situation where your company intends to sell a product orservice that fills a specific gap.
Objective of Research: It means to what the researcher aims to achieve.
Pilot Study: A small scale preliminary study conducted before the main research in order tocheck the feasibility or to improve the design of the research.
Problem Definition: The process in order to clear understanding (explanation) of what theproblem is.
Research Problem: It focuses on the relevance of the present research.
2.8 Review Questions
1. The objective of research problem should be clearly defined; otherwise the data collectionbecomes meaningless. Discuss with suitable examples.
24 LOVELY PROFESSIONAL UNIVERSITY
Research Methodology
Notes 2. Cultural and technological changes can act as a source for research problem identification.Why/why not?
3. Defining a research problem properly is a prerequisite for any study. Why?
4. What precautions should be taken while formulating a problem?
5. If you are appointed to do a research for some problem with the client, what would youtake as the sources for problem identification?
6. It may be a problem and at the same time, it can also be viewed as an opportunity. Why/why not?
7. In some cases, some sort of preliminary study may be needed. Which cases are beingreferred to and why?
8. A problem well defined is half solved. Comment.
9. While you define a research problem what do you try to do?
10. What do you think as the reason behind specialists suggesting to avoid selecting the firstproblem that you encounter?
Answers: Self Assessment
1. articulate 2. formulation
3. what a problem is 4. conclusive
5. researcher 6. carefully
7. marketing 8. negative
9. problem 10. Cultural, technological
11. specific problem 12. reduce
13. defined 14. expectation
15. identify
2.9 Further Readings
Books C R Kotari, Research Methodology, Vishwa Prakashan.
Cooper and Schinder, Business Research Methods, TMH.
David Luck and Ronald Rubin, Marketing Research, PHI.
Naresh Amphora, Marketing Research, Pearson Education.
S. N. Murthy and U. Bhojanna, Business Research Methods, 3rd Edition, Excel Books.
LOVELY PROFESSIONAL UNIVERSITY 25
Unit 3: Research Design
NotesUnit 3: Research Design
CONTENTS
Objectives
Introduction
3.1 An Overview
3.1.1 Need for Research Design
3.1.2 Types of Research Design
3.2 Exploratory Research
3.2.1 Characteristics of Exploratory Stage
3.2.2 Hypothesis Development at Exploratory Research Stage
3.2.3 Formulation of Hypothesis in Exploratory Research
3.2.4 Secondary Data
3.2.5 Qualitative Research
3.3 Descriptive Research Design
3.3.1 When to use Descriptive Study?
3.3.2 Types of Descriptive Studies
3.3.3 Survey
3.3.4 Observation Studies
3.4 Difference between Exploratory Research and Descriptive Research
3.5 Causal Research Design
3.6 Experimentation
3.6.1 Experimental Designs
3.7 Summary
3.8 Keywords
3.9 Review Questions
3.10 Further Readings
Objectives
After studying this unit, you will be able to:
Define research design
Describe the need of research design
Explain the different types of research design
Identify the Secondary data and qualitative research
Recognize the Descriptive research design
Label the causal research design
26 LOVELY PROFESSIONAL UNIVERSITY
Research Methodology
Notes Introduction
Research design is simply a plan for a study. This is used as a guide in collecting and analyzingthe data. It can be called a blue print to carry out the study. It is like a plan made by an architectto build the house, if a research is conducted without a blue print, the result is likely to bedifferent from what is expected at the start. The blue print includes (1) interviews to be conducted,observations to be made, experiments to be conducted data analysis to be made. (2) Tools usedto collect the data such as questionnaire (3) what is the sampling methods used.
3.1 An Overview
Research design can be thought of as the structure of research - it is the "glue" that holds all of theelements in a research project together. A successful design stems from a collaborative processinvolving good planning and communication.
Research Design is mainly of three types namely, exploratory, descriptive and causal research.
Exploratory research is used to seek insights into general nature of the problem. It provides therelevant variable that need to be considered. In this type of research, there is no previousknowledge; research methods are flexible, qualitative and unstructured.
Notes The researcher in this method does not know "what he will find".
Descriptive research is a type of research, very widely used in marketing research. Generally indescriptive study there will be a hypothesis, with respect to this hypothesis, we ask questionslike size, distribution, etc.
Causal research, this type of research is concerned with finding cause and effect relationship.Normally experiments are conducted in this type of research.
3.1.1 Need for Research Design
Before starting the research process, efficient and appropriate research design should be prepared.A research design is needed because of the following benefits it provides:
It helps in smooth functioning of various research operations.
It requires less effort, time and money.
It helps to plan in advance the methods and techniques to be used for collecting andanalysing data.
It helps in obtaining the objectives of the research with the availability of staff, time andmoney.
The researcher should consider the following factors before creating a research design:
The method for obtaining information source
Skills of the researcher and the co-ordinating staff
Problem objectives
Nature of the problem
Time and money available for the research work.
LOVELY PROFESSIONAL UNIVERSITY 27
Unit 3: Research Design
Notes3.1.2 Types of Research Design
Exploratory, descriptive and causal research are some of the major types. Exploratory researchis used to seek insights into general nature of the problem. It provides the relevant variable thatneed to be considered. In this type of research, there is no previous knowledge, research methodsare flexible, qualitative and unstructured. The researcher in this method does not know "what hewill find".
Descriptive research is a type of research, very widely used in marketing research. Generally indescriptive study there will be a hypothesis, with respect to this hypothesis, we ask questionslike size, distribution, etc.
Causal research, this type of research is concerned with finding cause and effect relationship.Normally experiments are conducted in this type of research.
Self Assessment
Fill in the blanks:
1. ........................... research is used to seek insights into general nature of the problem.
2. Research design helps to plan in advance the methods and techniques to be used forcollecting and ………………..data.
3.2 Exploratory Research
The major emphasis in exploratory research is on converting broad, vague problem statementsinto small, precise sub-problem statements, which is done in order to formulate specifichypothesis. The hypothesis is a statement that specifies, "how two or more variables are related?"
In the early stages of research, we usually lack from sufficient understanding of the problem toformulate a specific hypothesis. Further, there are often several tentative explanations.
Example: "Sales are down because our prices are too high",
"our dealers or sales representatives are not doing a good job",
"our advertisement is weak" and so on.
In this scenario, very little information is available to point out, what is the actual cause of theproblem. We can say that the major purpose of exploratory research is to identify the problemmore specifically. Therefore, exploratory study is used in the initial stages of research.
Under what circumstances is exploratory study ideal?
The following are the circumstances in which exploratory study would be ideally suited:
1. To gain an insight into the problem
2. To generate new product ideas
3. To list all possibilities. Among the several possibilities, we need to prioritize thepossibilities which seem likely
4. To develop hypothesis occasionally
Did u know? Exploratory study is also used to increase the analyst's familiarity with theproblem. This is particularly true, when the analyst is new to the problem area.
28 LOVELY PROFESSIONAL UNIVERSITY
Research Methodology
Notes Example: A market researcher working for (new entrant) a company for the first time.
5. To establish priorities so that further research can be conducted.
6. Exploratory studies may be used to clarify concepts and help in formulating preciseproblems.
Example: The management is considering a change in the contract policy, which it hopes,will result in improved satisfaction for channel members.
An exploratory study can be used to clarify the present state of channel members' satisfactionand to develop a method by which satisfaction level of channel members is measured
7. To pre-test a draft questionnaire
8. In general, exploratory research is appropriate to any problem about which very little isknown. This research is the foundation for any future study.
3.2.1 Characteristics of Exploratory Stage
1. Exploratory research is flexible and very versatile.
2. For data collection structured forms are not used.
3. Experimentation is not a requirement.
4. Cost incurred to conduct study is low.
5. This type of research allows very wide exploration of views.
6. Research is interactive in nature and also it is open ended.
3.2.2 Hypothesis Development at Exploratory Research Stage
1. Sometimes, it may not be possible to develop any hypothesis at all, if the situation isbeing investigated for the first time. This is because no previous data is available.
2. Sometimes, some information may be available and it may be possible to formulate atentative hypothesis.
3. In other cases, most of the data is available and it may be possible to provide answers tothe problem.
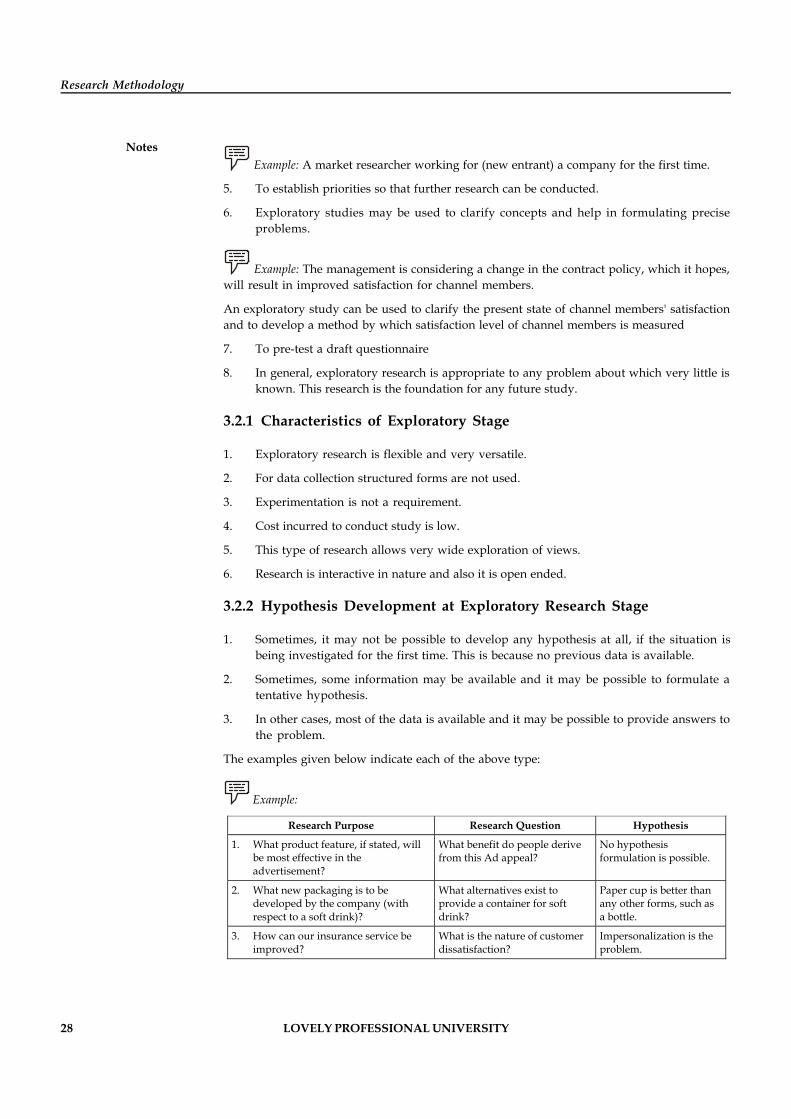
The examples given below indicate each of the above type:
Example:
Research Purpose Research Question Hypothesis
1. What product feature, if stated, will be most effective in the advertisement?
What benefit do people derive from this Ad appeal?
No hypothesis formulation is possible.
2. What new packaging is to be developed by the company (with respect to a soft drink)?
What alternatives exist to provide a container for soft drink?
Paper cup is better than any other forms, such as a bottle.
3. How can our insurance service be improved?
What is the nature of customer dissatisfaction?
Impersonalization is the problem.
LOVELY PROFESSIONAL UNIVERSITY 29
Unit 3: Research Design
NotesIn example 1: The research question is posed to determine "What benefit do people seek from theAd?" Since no previous research is done on consumer benefit for this product, it is not possibleto form any hypothesis.
In example 2: Some information is currently available about packaging for a soft drink. Here itis possible to formulate a hypothesis which is purely tentative. The hypothesis formulated heremay be only one of the several alternatives available.
In example 3: The root cause of customer dissatisfaction is known, i.e. lack of personalisedservice. In this case, it is possible to verify whether this is a cause or not.
3.2.3 Formulation of Hypothesis in Exploratory Research
The quickest and the cheapest way to formulate a hypothesis in exploratory research is by usingany of the four methods:
1. Literature Search: This refers to "referring to a literature to develop a new hypothesis".The literature referred are – trade journals, professional journals, market research findingpublications, statistical publications etc. For example, suppose a problem is "Why aresales down?" This can quickly be analysed with the help of published data which shouldindicate, "whether the problem" is an "industry problem" or a "firm problem". Threepossibilities exist to formulate the hypothesis.
(a) The company's market share has declined but industry's figures are normal.
(b) The industry is declining and hence the company's market share is also declining.
(c) The industry's share is going up but the company's share is declining.
If we accept the situation that our company's sales are down despite the market showingan upward trend, then we need to analyse the marketing mix variables.
Example:
(a) A TV manufacturing company feels that its market share is declining whereas the overalltelevision industry is doing very well.
(b) Due to a trade embargo imposed by a country, textiles exports are down and hence salesof a company making garment for exports is on the decline.
The above information may be used to pinpoint the reason for declining sales.
2. Experience Survey: In experience surveys, it is desirable to talk to persons who are wellinformed in the area being investigated. These people may be company executives orpersons outside the organisation. Here, no questionnaire is required. The approach adoptedin an experience survey should be highly unstructured, so that the respondent can givedivergent views.
!Caution Since the idea of using experience survey is to undertake problem formulation,and not conclusion, probability sample need not be used. Those who cannot speak freelyshould be excluded from the sample.
30 LOVELY PROFESSIONAL UNIVERSITY
Research Methodology
Notes Example:
(a) A group of housewives may be approached for their choice for a "ready to cook product".
(b) A publisher might want to find out the reason for poor circulation of newspaper introducedrecently. He might meet (i) Newspaper sellers (ii) Public reading room (iii) Generalpublic (iv) Business community, etc.
These are experienced persons whose knowledge researcher can use.
3. Focus Group: Another widely used technique in exploratory research is the focus group.In a focus group, a small number of individuals are brought together to study and talkabout some topic of interest. The discussion is co-ordinated by a moderator. The groupusually is of 8-12 persons. While selecting these persons, care has to be taken to see thatthey should have a common background and have similar experiences in buying. This isrequired because there should not be a conflict among the group members on the commonissues that are being discussed. During the discussion, future buying attitudes, presentbuying opinion, etc., are gathered.
Most of the companies conducting the focus groups first screen the candidates to determinewho will compose the particular group. Firms also take care to avoid groups, in whichsome of the participants have their friends and relatives, because this leads to a biaseddiscussion. Normally, a number of such groups are constituted and the final conclusion ofvarious groups are taken for formulating the hypothesis. Therefore a key factor in focusgroup is to have similar groups. Normally there are 4-5 groups. Some of them may evenhave 6-8 groups. The guiding criteria is to see whether the latter groups are generatingadditional ideas or repeating the same with respect to the subject under study. When thisshows a diminishing return from the group, the discussions stopped. The typical focusgroup lasts for 1-30 hours to 2 hours. The moderator under the focus group has a key role.His job is to guide the group to proceed in the right direction.
The following should be the characteristics of a moderator/facilitator:
(a) Listening: He must have a good listening ability. The moderator must not miss theparticipant's comment, due to lack of attention.
(b) Permissive: The moderator must be permissive, yet alert to the signs that the groupis disintegrating.
(c) Memory: He must have a good memory. The moderator must be able to rememberthe comments of the participants. Example: A discussion is centered around a newadvertisement by a telecom company. The participant may make a statement earlyand make another statement later, which is opposite to what was said earlier.Example: The participant may say that s(he) never subscribed to the views expressedin the advertisement by the competitor, but subsequently may say that the "currentadvertisement of competitor is excellent".
(d) Encouragement: The moderator must encourage unresponsive members to participate.
(e) Learning: He should be a quick learner.
(f) Sensitivity: The moderator must be sensitive enough to guide the group discussion.
(g) Intelligence: He must be a person whose intelligence is above the average.
(h) Kind/firm: He must combine detachment with empathy.
LOVELY PROFESSIONAL UNIVERSITY 31
Unit 3: Research Design
Notes
Notes Variation of Focus Group
1. Respondent moderator group: Under this method, the moderator will select one of theparticipants to act as a temporary moderator.
2. Dualing moderator group: In this method, there are two moderators. They purposelytake opposing positions on a given topic. This will help the researcher to obtain theviews of both groups.
3. Two way focus group: Under this method one group will listen to the other group.Later, the second group will react to the views of the first group.
4. Dual moderator group: Here, there are two moderators. One moderator will makesure that the discussion moves smoothly. The second moderator will ask a specificquestion.
4. Case Studies: Analysing a selected case sometimes gives an insight into the problemwhich is being researched. Case histories of companies which have undergone a similarsituation may be available. These case studies are well suited to carry out exploratoryresearch. However, the result of investigation of case histories are always consideredsuggestive, rather than conclusive. In case of preference to "ready to eat food", many casehistories may be available in the form of previous studies made by competitors. We mustcarefully examine the already published case studies with regard to other variables suchas price, advertisement, changes in the taste, etc.
3.2.4 Secondary Data
Secondary data is information gathered for purposes other than the completion of a researchproject. A variety of secondary information sources is available to the researcher gathering dataon an industry, potential product applications and the market place. Secondary data is also usedto gain initial insight into the research problem.
Secondary data analysis saves time that would otherwise be spent collecting data and, particularlyin the case of quantitative data, provides larger and higher-quality databases than would beunfeasible for any individual researcher to collect on their own. In addition to that, analysts ofsocial and economic change consider secondary data essential, since it is impossible to conducta new survey that can adequately capture past change and/or developments.
Secondary data can be obtained from two different research strands:
1. Quantitative: Census, housing, social security as well as electoral statistics and otherrelated databases.
2. Qualitative: Semi-structured and structured interviews, focus groups transcripts, fieldnotes, observation records and other personal, research-related documents.
Notes Secondary data can also be helpful in the research design of subsequent primaryresearch and can provide a baseline with which the collected primary data results can becompared to. Therefore, it is always wise to begin any research activity with a review ofthe secondary data.
32 LOVELY PROFESSIONAL UNIVERSITY
Research Methodology
Notes Secondary data is classified in terms of its source - either internal or external. Internal, or in-house data, is secondary information acquired within the organization where research is beingcarried out. External secondary data is obtained from outside sources.
Internal Data Sources
Internal secondary data is usually an inexpensive information source for the company conductingresearch, and is the place to start for existing operations. Internally generated sales and pricingdata can be used as a research source. The use of this data is to define the competitive position ofthe firm, an evaluation of a marketing strategy the firm has used in the past, or gaining a betterunderstanding of the company's best customers.
There are three main sources of internal data. These are:
1. Sales and marketing reports: These can include such things as:
(a) Type of product/service purchased
(b) Type of end-user/industry segment
(c) Method of payment
(d) Product or product line
(e) Sales territory
(f) Salesperson
(g) Date of purchase
(h) Amount of purchase
(i) Price
(j) Application by product
(k) Location of end-user
2. Accounting and financial records: These are often an overlooked source of internalsecondary information and can be invaluable in the identification, clarification andprediction of certain problems. Accounting records can be used to evaluate the success ofvarious marketing strategies such as revenues from a direct marketing campaign.
There are several problems in using accounting and financial data. One is the timelinessfactor – it is often several months before accounting statements are available. Another isthe structure of the records themselves. Most firms do not adequately setup their accountsto provide the types of answers to research questions that they need. For example, theaccount systems should capture project/product costs in order to identify the company'smost profitable (and least profitable) activities.
Companies should also consider establishing performance indicators based on financialdata. These can be industry standards or unique ones designed to measure key performancefactors that will enable the firm to monitor its performance over a period of time andcompare it to its competitors. Some example may be sales per employee, sales per squarefoot, expenses per employee (salesperson, etc.).
3. Miscellaneous reports: These can include such things as inventory reports, service calls,number (qualifications and compensation) of staff, production and R&D reports. Also thecompany's business plan and customer calls (complaints) log can be useful sources ofinformation.
LOVELY PROFESSIONAL UNIVERSITY 33
Unit 3: Research Design
NotesExternal Data Sources
There is a wealth of statistical and research data available today. Some sources are:
1. Federal government
2. Provincial/state governments
3. Statistics agencies
4. Trade associations
5. General business publications
6. Magazine and newspaper articles
7. Annual reports
8. Academic publications
9. Library sources
10. Computerized bibliographies
11. Syndicated services.
The two major advantages of using secondary data in market research are time and cost savings.
1. The secondary research process can be completed rapidly - generally in 2 to 3 week.Substantial useful secondary data can be collected in a matter of days by a skillfulanalyst.
2. When secondary data is available, the researcher need only locate the source of the dataand extract the required information.
3. Secondary research is generally less expensive than primary research. The bulk ofsecondary research data gathering does not require the use of expensive, specialized,highly trained personnel.
4. Secondary research expenses are incurred by the originator of the information.
There are also a number of disadvantages of using secondary data. These include:
1. Secondary information pertinent to the research topic is either not available, or is onlyavailable in insufficient quantities.
2. Some secondary data may be of questionable accuracy and reliability. Even governmentpublications and trade magazines statistics can be misleading.
3. Data may be in a different format or units than is required by the researcher.
4. Much secondary data is several years old and may not reflect the current market conditions.Trade journals and other publications often accept articles six months before appear inprint. The research may have been done months or even years earlier.
Did u know? Many trade magazines survey their members to derive estimates of marketsize, market growth rate and purchasing patterns, then average out these results. Oftenthese statistics are merely average opinions based on less than 10% of their members.
34 LOVELY PROFESSIONAL UNIVERSITY
Research Methodology
Notes 3.2.5 Qualitative Research
Qualitative research seeks out the 'why', not the 'how' of its topic through the analysis ofunstructured information – things like interview transcripts, e-mails, notes, feedback forms,photos and videos. It doesn't just rely on statistics or numbers, which are the domain ofquantitative researchers.
Qualitative research is used to gain insight into people's attitudes, behaviours, value systems,concerns, motivations, aspirations, culture or life-styles. It's used to inform business decisions,policy formation, communication and research. Focus groups, in-depth interviews, contentanalysis and semiotics are among the many formal approaches that are used, but qualitativeresearch also involves the analysis of any unstructured material, including customer feedbackforms, reports or media clips.
Qualitative research is used to help us understand how people feel and why they feel as they do.It is concerned with collecting in-depth information asking questions such as why do you saythat?. Samples tend to be smaller compared with quantitative projects that include much largersamples. Depth interviews or group discussions are two common methods used for collectingqualitative information.
Thus we can say that Qualitative research is a type of scientific research. In general terms,scientific research consists of an investigation that:
1. seeks answers to a question
2. systematically uses a predefined set of procedures to answer the question
3. collects evidence
4. produces findings that were not determined in advance
5. produces findings that are applicable beyond the immediate boundaries of the study
Qualitative research shares these characteristics. Additionally, it seeks to understand a givenresearch problem or topic from the perspectives of the local population it involves. Qualitativeresearch is especially effective in obtaining culturally specific information about the values,opinions, behaviors, and social contexts of particular populations.
The strength of qualitative research is its ability to provide complex textual descriptions of howpeople experience a given research issue. It provides information about the "human" side of anissue - that is, the often contradictory behaviors, beliefs, opinions, emotions, and relationshipsof individuals. Qualitative methods are also effective in identifying intangible factors, such associal norms, socioeconomic status, gender roles, ethnicity, and religion, whose role in theresearch issue may not be readily apparent. When used along with quantitative methods,qualitative research can help us to interpret and better understand the complex reality of a givensituation and the implications of quantitative data. Although findings from qualitative data canoften be extended to people with characteristics similar to those in the study population, gaininga rich and complex understanding of a specific social context or phenomenon typically takesprecedence over eliciting data that can be generalized to other geographical areas or populations.In this sense, qualitative research differs slightly from scientific research in general.
The three most common qualitative methods, explained in detail in their respective modules,are participant observation, in-depth interviews, and focus groups. Each method is particularlysuited for obtaining a specific type of data.
1. Participant observation is appropriate for collecting data on naturally occurring behaviorsin their usual contexts.
LOVELY PROFESSIONAL UNIVERSITY 35
Unit 3: Research Design
Notes2. In-depth interviews are optimal for collecting data on individuals' personal histories,perspectives, and experiences, particularly when sensitive topics are being explored.
3. Focus groups are effective in eliciting data on the cultural norms of a group and ingenerating broad overviews of issues of concern to the cultural groups or subgroupsrepresented.
Task Enlist the basic differences between quantitative and qualitative research methods.
Self Assessment
Fill in the blanks:
3. The major emphasis in exploratory research is on converting ........................., vague problemstatements into ............... and .............................. sub-problem statements.
4. Exploratory research is ........................ and very .......................
5. In experience surveys, it is desirable to talk to persons who are well informed in the areabeing .............................
6. Most of the companies conducting the ........................... groups first screen the candidates todetermine who will compose the particular group.
7. The moderator must not miss the ............................. comment.
8. The moderator must encourage ........................ members to participate.
3.3 Descriptive Research Design
The name itself reveals that, it is essentially a research to describe something. For example, itcan describe the characteristics of a group such as – customers, organisations, markets, etc.Descriptive research provides "association between two variables" like income and place ofshopping, age and preferences.
Descriptive inform us about the proportions of high and low income customers in a particularterritory. What descriptive research cannot indicate is that it cannot establish a cause and effectrelationship between the characteristics of interest. This is the distinct disadvantage of descriptiveresearch.
Descriptive study requires a clear specification of "Who, what, when, where, why and how" ofthe research. For example, consider a situation of convenience stores (food world) planning toopen a new outlet. The company wants to determine, "How people come to patronize a newoutlet?" Some of the questions that need to be answered before data collection for this descriptivestudy are as follows:
1. Who? Who is regarded as a shopper responsible for the success of the shop, whosedemographic profile is required by the retailer?
2. What? What characteristics of the shopper should be measured?
3. Is it the age of the shopper, sex, income or residential address?
4. When? When shall we measure?
5. Should the measurement be made while the shopper is shopping or at a later time?
36 LOVELY PROFESSIONAL UNIVERSITY
Research Methodology
Notes 6. Where? Where shall we measure the shoppers?
7. Should it be outside the stores, soon after they visit or should we contact them at theirresidence?
8. Why? Why do you want to measure them?
9. What is the purpose of measurement? Based on the information, are there any strategieswhich will help the retailer to boost the sales? Does the retailer want to predict future salesbased on the data obtained?
10. Answer to some of the above questions will help us in formulating the hypothesis.
11. How to measure? Is it a 'structured' questionnaire, 'disguised' or 'undisguised'questionnaire?
3.3.1 When to use Descriptive Study?
1. To determine the characteristics of market such as:
(a) Size of the market
(b) Buying power of the consumer
(c) Product usage pattern
(d) To find out the market share for the product
(e) To track the performance of a brand.
2. To determine the association of the two variables such as Ad and sales.
3. To make a prediction. We might be interested in sales forecasting for the next three years,so that we can plan for training of new sales representatives.
4. To estimate the proportion of people in a specific population, who behave in a particularway?
Example: What percentage of population in a particular geographical location would beshopping in a particular shop?
Hypothesis study at the descriptive research stage (to demonstrate the characteristics of thegroup).
Management problem Research problem Hypothesis
How should a new product be distributed?
Where do customers buy a similar product right now?
Upper class buyers use ‘Shopper’s Stop’ and middle class buyers buy from local departmental stores
What will be the target segment?
What kind of people buy our product now?
Senior citizens buy our products. Young and married buy our competitors products.
3.3.2 Types of Descriptive Studies
There are two types of descriptive research:
1. Longitudinal study
2. Cross-sectional study
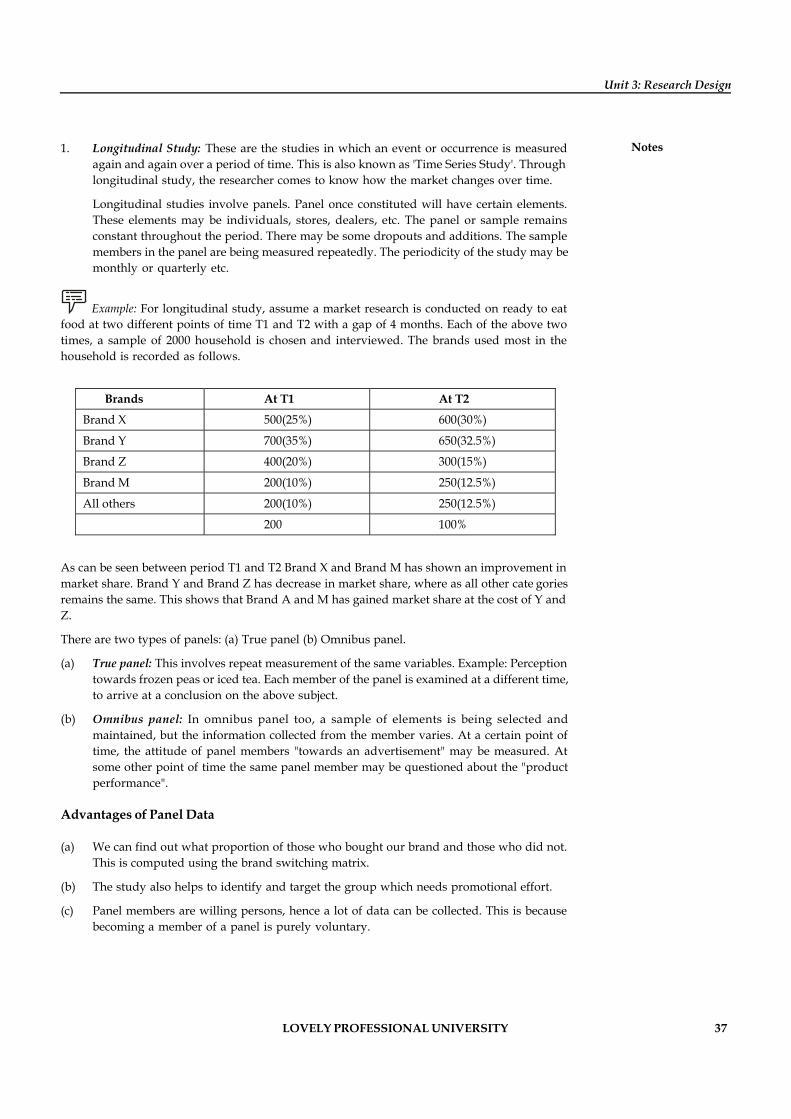
LOVELY PROFESSIONAL UNIVERSITY 37
Unit 3: Research Design
Notes1. Longitudinal Study: These are the studies in which an event or occurrence is measuredagain and again over a period of time. This is also known as 'Time Series Study'. Throughlongitudinal study, the researcher comes to know how the market changes over time.
Longitudinal studies involve panels. Panel once constituted will have certain elements.These elements may be individuals, stores, dealers, etc. The panel or sample remainsconstant throughout the period. There may be some dropouts and additions. The samplemembers in the panel are being measured repeatedly. The periodicity of the study may bemonthly or quarterly etc.
Example: For longitudinal study, assume a market research is conducted on ready to eatfood at two different points of time T1 and T2 with a gap of 4 months. Each of the above twotimes, a sample of 2000 household is chosen and interviewed. The brands used most in thehousehold is recorded as follows.
Brands At T1 At T2
Brand X 500(25%) 600(30%)
Brand Y 700(35%) 650(32.5%)
Brand Z 400(20%) 300(15%)
Brand M 200(10%) 250(12.5%)
All others 200(10%) 250(12.5%)
200 100%
As can be seen between period T1 and T2 Brand X and Brand M has shown an improvement inmarket share. Brand Y and Brand Z has decrease in market share, where as all other cate goriesremains the same. This shows that Brand A and M has gained market share at the cost of Y andZ.
There are two types of panels: (a) True panel (b) Omnibus panel.
(a) True panel: This involves repeat measurement of the same variables. Example: Perceptiontowards frozen peas or iced tea. Each member of the panel is examined at a different time,to arrive at a conclusion on the above subject.
(b) Omnibus panel: In omnibus panel too, a sample of elements is being selected andmaintained, but the information collected from the member varies. At a certain point oftime, the attitude of panel members "towards an advertisement" may be measured. Atsome other point of time the same panel member may be questioned about the "productperformance".
Advantages of Panel Data
(a) We can find out what proportion of those who bought our brand and those who did not.This is computed using the brand switching matrix.
(b) The study also helps to identify and target the group which needs promotional effort.
(c) Panel members are willing persons, hence a lot of data can be collected. This is becausebecoming a member of a panel is purely voluntary.
38 LOVELY PROFESSIONAL UNIVERSITY
Research Methodology
Notes (d) The greatest advantage of panel data is that it is analytical in nature.
(e) Panel data is more accurate than cross-sectional data because it is free from the errorassociated with reporting past behaviour. Errors occur in past behaviour because oftime that has elapsed or forgetfulness.
Disadvantages of Panel Data
(a) The sample may not be representative. This is because sometimes, panels may be selectedon account of convenience.
(b) The panel members who provide the data, may not be interested to continue as panelmembers. There could be dropouts, migration, etc. Members who replace them may differvastly from the original member.
(c) Remuneration given to panel members may not be attractive. Therefore, people may notlike to be panel members.
(d) Sometimes the panel members may show disinterest and non-committed.
(e) A lengthy period of membership in the panel may cause respondents to start imaginingthemselves to be experts and professionals. They may start responding like experts andconsultants and not like respondents. To avoid this, no one should be retained as a memberfor more than 6 months.
2. Cross-sectional Study: Cross-sectional study is one of the most important types ofdescriptive research, it can be done in two ways:
(a) Field study: This includes a depth study. Field study involves an in-depth study of aproblem, such as reaction of young men and women towards a product.
Example: Reaction of Indian men towards branded ready-to-wear suit. Field study is carriedout in real world environment settings. Test marketing is an example of field study.
(b) Field survey: Large samples are a feature of the study. The biggest limitations of thissurvey are cost and time. Also, if the respondent is cautious, then he might answerthe questions in a different manner. Finally, field survey requires good knowledgelike constructing a questionnaire, sampling techniques used, etc.
Example: Suppose the management believes that geographical factor is an importantattribute in determining the consumption of a product, like sales of a woolen wear in a particularlocation. Suppose that the proposition to be examined is that, the urban population is morelikely to use the product than the semi-urban population. This hypothesis can be examined in across-sectional study. Measurement can be taken from a representative sample of the populationin both geographical locations with respect to the occupation and use of the products. In case oftabulation, researcher can count the number of cases that fall into each of the following classes:
(i) Urban population which uses the product - Category I
(ii) Semi-urban population which uses the product - Category II
(iii) Urban population which does not use the product - Category III
(iv) Semi-urban population which does not use the product - Category IV.
Here, we should know that the hypothesis need to be supported and tested by the sample datai.e., the proportion of urbanities using the product should exceed the semi-urban populationusing the product.
LOVELY PROFESSIONAL UNIVERSITY 39
Unit 3: Research Design
Notes3.3.3 Survey
The survey is a research technique in which data are gathered by asking questions of respondents.Survey research is one of the most important areas of measurement in applied social research.The broad area of survey research encompasses any measurement procedures that involveasking questions of respondents. A "survey" can be anything form a short paper-and-pencilfeedback form to an intensive one-on-one in-depth interview.
Types of Surveys
Surveys can be divided into two broad categories: the questionnaire and the interview.Questionnaires are usually paper-and-pencil instruments that the respondent completes.Interviews are completed by the interviewer based on the respondent says. Sometimes, it's hardto tell the difference between a questionnaire and an interview. For instance, some people thinkthat questionnaires always ask short closed-ended questions while interviews always ask broadopen-ended ones. But you will see questionnaires with open-ended questions (although they dotend to be shorter than in interviews) and there will often be a series of closed-ended questionsasked in an interview.
Survey research has changed dramatically in the last ten years. We have automated telephonesurveys that use random dialing methods. There are computerized kiosks in public places thatallows people to ask for input. A whole new variation of group interview has evolved as focusgroup methodology. Increasingly, survey research is tightly integrated with the delivery ofservice. Your hotel room has a survey on the desk. Your waiter presents a short customersatisfaction survey with your check. You get a call for an interview several days after your lastcall to a computer company for technical assistance. You're asked to complete a short surveywhen you visit a web site.
Selecting the Survey Method
Selecting the type of survey you are going to use is one of the most critical decisions in manysocial research contexts. You'll see that there are very few simple rules that will make thedecision for you – you have to use your judgment to balance the advantages and disadvantagesof different survey types. Here, all I want to do is give you a number of questions you might askthat can help guide your decision.
Population Issues
He first set of considerations have to do with the population and its accessibility.
1. Can the population be enumerated?
For some populations, you have a complete listing of the units that will be sampled. Forothers, such a list is difficult or impossible to compile. For instance, there are completelistings of registered voters or person with active drivers licenses. But no one keeps acomplete list of homeless people. If you are doing a study that requires input from homelesspersons, you are very likely going to need to go and find the respondents personally. Insuch contexts, you can pretty much rule out the idea of mail surveys or telephone interviews.
2. Is the population literate?
Questionnaires require that your respondents can read. While this might seem initiallylike a reasonable assumption for many adult populations, we know from recent researchthat the instance of adult illiteracy is alarmingly high. And, even if your respondents can
40 LOVELY PROFESSIONAL UNIVERSITY
Research Methodology
Notes read to some degree, your questionnaire may contain difficult or technical vocabulary.Clearly, there are some populations that you would expect to be illiterate. Young childrenwould not be good targets for questionnaires.
3. Are there language issues?
We live in a multilingual world. Virtually every society has members who speak otherthan the predominant language. Some countries (like Canada) are officially multilingual.And, our increasingly global economy requires us to do research that spans countries andlanguage groups. Can you produce multiple versions of your questionnaire? For mailinstruments, can you know in advance the language your respondent speaks, or do yousend multiple translations of your instrument? Can you be confident that importantconnotations in your instrument are not culturally specific? Could some of the importantnuances get lost in the process of translating your questions?
4. Will the population cooperate?
People who do research on immigration issues have a difficult methodological problem.They often need to speak with undocumented immigrants or people who may be able toidentify others who are. Why would we expect those respondents to cooperate? Althoughthe researcher may mean no harm, the respondents are at considerable risk legally ifinformation they divulge should get into the hand of the authorities. The same can be saidfor any target group that is engaging in illegal or unpopular activities.
5. What are the geographic restrictions?
Is your population of interest dispersed over too broad a geographic range for you tostudy feasibly with a personal interview? It may be possible for you to send a mailinstrument to a nationwide sample. You may be able to conduct phone interviews withthem. But it will almost certainly be less feasible to do research that requires interviewersto visit directly with respondents if they are widely dispersed.
Sampling Issues
The sample is the actual group you will have to contact in some way. There are several importantsampling issues you need to consider when doing survey research.
1. What data is available?: What information do you have about your sample? Do youknow their current addresses? Their current phone numbers? Are your contact lists up todate?
2. Can respondents be found?: Can your respondents be located? Some people are very busy.Some travel a lot. Some work the night shift. Even if you have an accurate phone oraddress, you may not be able to locate or make contact with your sample.
3. Who is the respondent?: Who is the respondent in your study? Let's say you draw a sampleof households in a small city. A household is not a respondent. Do you want to interviewa specific individual? Do you want to talk only to the "head of household" (and how is thatperson defined)? Are you willing to talk to any member of the household? Do you statethat you will speak to the first adult member of the household who opens the door? Whatif that person is unwilling to be interviewed but someone else in the house is willing?How do you deal with multi-family households? Similar problems arise when you samplegroups, agencies, or companies. Can you survey any member of the organization? Or, doyou only want to speak to the Director of Human Resources? What if the person youwould like to interview is unwilling or unable to participate? Do you use another memberof the organization?
LOVELY PROFESSIONAL UNIVERSITY 41
Unit 3: Research Design
Notes4. Can all members of population be sampled?: If you have an incomplete list of the population(i.e., sampling frame) you may not be able to sample every member of the population.Lists of various groups are extremely hard to keep up to date. People move or change theirnames. Even though they are on your sampling frame listing, you may not be able to getto them. And, it's possible they are not even on the list.
5. Are response rates likely to be a problem?: Even if you are able to solve all of the otherpopulation and sampling problems, you still have to deal with the issue of response rates.Some members of your sample will simply refuse to respond. Others have the best ofintentions, but can't seem to find the time to send in your questionnaire by the due date.Still others misplace the instrument or forget about the appointment for an interview.Low response rates are among the most difficult of problems in survey research. They canruin an otherwise well-designed survey effort.
Question Issues
Sometimes the nature of what you want to ask respondents will determine the type of surveyyou select.
1. What types of questions can be asked?
Are you going to be asking personal questions? Are you going to need to get lots of detailin the responses? Can you anticipate the most frequent or important types of responsesand develop reasonable closed-ended questions?
2. How complex will the questions be?
Sometimes you are dealing with a complex subject or topic. The questions you want to askare going to have multiple parts. You may need to branch to sub-questions.
3. Will screening questions be needed?
A screening question may be needed to determine whether the respondent is qualified toanswer your question of interest. For instance, you wouldn't want to ask someone theiropinions about a specific computer program without first "screening" them to find outwhether they have any experience using the program. Sometimes you have to screen onseveral variables (e.g., age, gender, experience). The more complicated the screening, theless likely it is that you can rely on paper-and-pencil instruments without confusing therespondent.
4. Can question sequence be controlled?
Is your survey one where you can construct in advance a reasonable sequence of questions?Or, are you doing an initial exploratory study where you may need to ask lots of follow-up questions that you can't easily anticipate?
5. Will lengthy questions be asked?
If your subject matter is complicated, you may need to give the respondent some detailedbackground for a question. Can you reasonably expect your respondent to sit still longenough in a phone interview to ask your question?
6. Will long response scales be used?
If you are asking people about the different computer equipment they use, you may haveto have a lengthy response list (CD-ROM drive, floppy drive, mouse, touch pad, modem,network connection, external speakers, etc.). Clearly, it may be difficult to ask about eachof these in a short phone interview.
42 LOVELY PROFESSIONAL UNIVERSITY
Research Methodology
Notes Content Issues
The content of your study can also pose challenges for the different survey types you mightutilize.
1. Can the respondents be expected to know about the issue?
If the respondent does not keep up with the news (e.g., by reading the newspaper, watchingtelevision news, or talking with others), they may not even know about the news issueyou want to ask them about. Or, if you want to do a study of family finances and you aretalking to the spouse who doesn't pay the bills on a regular basis, they may not have theinformation to answer your questions.
2. Will respondent need to consult records?
Even if the respondent understands what you're asking about, you may need to allowthem to consult their records in order to get an accurate answer. For instance, if you askthem how much money they spent on food in the past month, they may need to look uptheir personal check and credit card records. In this case, you don't want to be involved inan interview where they would have to go look things up while they keep you waiting(they wouldn't be comfortable with that).
Bias Issues
People come to the research endeavor with their own sets of biases and prejudices. Sometimes,these biases will be less of a problem with certain types of survey approaches.
1. Can social desirability be avoided?
Respondents generally want to "look good" in the eyes of others. None of us likes to looklike we don't know an answer. We don't want to say anything that would be embarrassing.If you ask people about information that may put them in this kind of position, they maynot tell you the truth, or they may "spin" the response so that it makes them look better.This may be more of a problem in an interview situation where they are face-to face or onthe phone with a live interviewer.
2. Can interviewer distortion and subversion be controlled?
Interviewers may distort an interview as well. They may not ask questions that makethem uncomfortable. They may not listen carefully to respondents on topics for whichthey have strong opinions. They may make the judgment that they already know what therespondent would say to a question based on their prior responses, even though that maynot be true.
3. Can false respondents be avoided?
With mail surveys it may be difficult to know who actually responded. Did the head ofhousehold complete the survey or someone else? Did the CEO actually give the responsesor instead pass the task off to a subordinate? Is the person you're speaking with on thephone actually who they say they are? At least with personal interviews, you have areasonable chance of knowing who you are speaking with. In mail surveys or phoneinterviews, this may not be the case.
Administrative Issues
Last, but certainly not least, you have to consider the feasibility of the survey method for yourstudy.
LOVELY PROFESSIONAL UNIVERSITY 43
Unit 3: Research Design
Notes1. Costs: Cost is often the major determining factor in selecting survey type. You mightprefer to do personal interviews, but can't justify the high cost of training and paying forthe interviewers. You may prefer to send out an extensive mailing but can't afford thepostage to do so.
2. Facilities: Do you have the facilities (or access to them) to process and manage your study?In phone interviews, do you have well-equipped phone surveying facilities? For focusgroups, do you have a comfortable and accessible room to host the group? Do you havethe equipment needed to record and transcribe responses?
3. Time: Some types of surveys take longer than others. Do you need responses immediately(as in an overnight public opinion poll)? Have you budgeted enough time for your studyto send out mail surveys and follow-up reminders, and to get the responses back by mail?Have you allowed for enough time to get enough personal interviews to justify thatapproach?
4. Personnel: Different types of surveys make different demands of personnel. Interviewsrequire interviewers who are motivated and well-trained. Group administered surveysrequire people who are trained in group facilitation. Some studies may be in a technicalarea that requires some degree of expertise in the interviewer.
Clearly, there are lots of issues to consider when you are selecting which type of survey youwish to use in your study. And there is no clear and easy way to make this decision in manycontexts. There may not be one approach which is clearly the best. You may have to maketradeoffs of advantages and disadvantages. There is judgment involved. Two expert researchersmay, or the very same problem or issue, select entirely different survey methods. But, if youselect a method that isn't appropriate or doesn't fit the context, you can doom a study before youeven begin designing the instruments or questions themselves.
3.3.4 Observation Studies
An observational study draws inferences about the possible effect of a treatment on subjects,where the assignment of subjects into a treated group versus a control group is outside thecontrol of the investigator. This is in contrast with controlled experiments, such as randomizedcontrolled trials, where each subject is randomly assigned to a treated group or a control groupbefore the start of the treatment.
Observational studies are sometimes referred to as natural experiments or as quasi-experiments.These differences in terminology reflect certain differences in emphasis, but a shared theme isthat the early stages of planning or designing an observational study attempt to reproduce, asnearly as possible, some of the strengths of an experiment.
Self Assessment
Fill in the blanks:
9. ................................. studies are the studies in which an event or occurrence is measuredagain and again over a period of time.
10. Longitudinal study is also known as ...................................
11. True panel involves .......................... measurement of the same variables.
12. The biggest limitations of field survey are ...................... and ............................
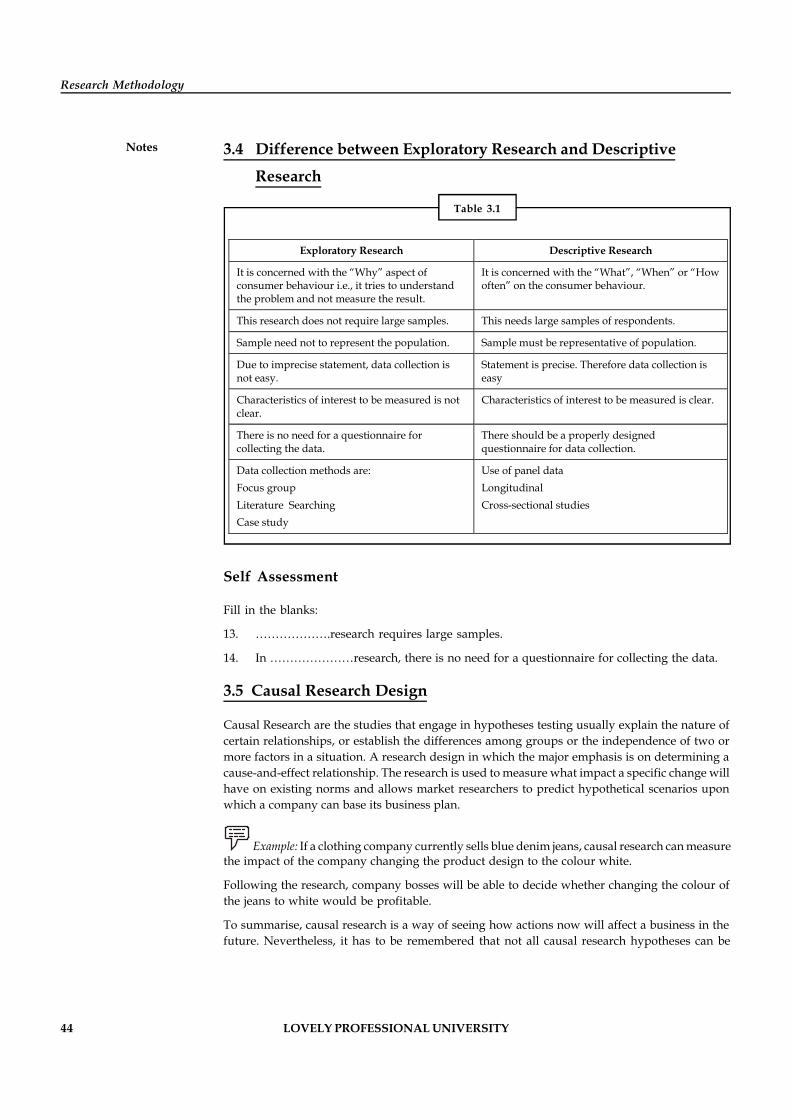
44 LOVELY PROFESSIONAL UNIVERSITY
Research Methodology
Notes 3.4 Difference between Exploratory Research and Descriptive
Research
Table 3.1
Exploratory Research Descriptive Research
It is concerned with the “Why” aspect of consumer behaviour i.e., it tries to understand the problem and not measure the result.
It is concerned with the “What”, “When” or “How often” on the consumer behaviour.
This research does not require large samples. This needs large samples of respondents.
Sample need not to represent the population. Sample must be representative of population.
Due to imprecise statement, data collection is not easy.
Statement is precise. Therefore data collection is easy
Characteristics of interest to be measured is not clear.
Characteristics of interest to be measured is clear.
There is no need for a questionnaire for collecting the data.
There should be a properly designed questionnaire for data collection.
Data collection methods are: Focus group Literature Searching Case study
Use of panel data Longitudinal Cross-sectional studies
Self Assessment
Fill in the blanks:
13. ……………….research requires large samples.
14. In …………………research, there is no need for a questionnaire for collecting the data.
3.5 Causal Research Design
Causal Research are the studies that engage in hypotheses testing usually explain the nature ofcertain relationships, or establish the differences among groups or the independence of two ormore factors in a situation. A research design in which the major emphasis is on determining acause-and-effect relationship. The research is used to measure what impact a specific change willhave on existing norms and allows market researchers to predict hypothetical scenarios uponwhich a company can base its business plan.
Example: If a clothing company currently sells blue denim jeans, causal research can measurethe impact of the company changing the product design to the colour white.
Following the research, company bosses will be able to decide whether changing the colour ofthe jeans to white would be profitable.
To summarise, causal research is a way of seeing how actions now will affect a business in thefuture. Nevertheless, it has to be remembered that not all causal research hypotheses can be
LOVELY PROFESSIONAL UNIVERSITY 45
Unit 3: Research Design
Notesstudied. There are many reasons for this, one of them being that true random assignment is notpossible in many cases. The three main reasons why you can't test everything deal with:
1. Technology, or the impossibility by today's technology to be able to do certain tasks, suchas assign gender.
2. Ethics, because we can't randomly assign that some people receive a virus to test itseffects, or that some participants have to act as slaves and others as masters to test ahypothesis, and
3. Resources, if a researcher does not have the money or the equipment needed to perform astudy, then it won't be done.
Causal design is the study of cause and effect relationships between two or more variables.
William J. Goode & Paul K. Hatt in Methods in Social Research define cause and effect relationshipas:
"when two or more cases of given phenomenon have one and only one condition in common, that conditionmay be regarded as the cause and effect of that phenomenon."
The set of causes generated to predict their effects, can be deterministic or probabilistic innature. The deterministic cause is the one which is essential and adequate for stimulating theoccurrence of another event. While the probabilistic is the one that is essential, but is not theonly one responsible for the stimulation of the occurrence of another event.
The objective is to determine which variable might be causing certain behaviour i.e., whetherthere is a cause and effect relationship between variables, causal research must be undertaken.This type of research is very complex and the researcher can never be completely certain thatthere are not other factors influencing the causal relationship, especially when dealing withpeople's attitudes and motivations. There are often much deeper psychological considerationsthat even the respondent may not be aware of.
In marketing decision making, all the conditions allowing the most accurate casual statementsare not usually present but in these circumstances, casual inference will still be made by marketingmanagers. Because in doing so they would want to be able to make casual statements about theeffects of their actions.
Example: The new advertising campaign a company developed has resulted in percentageincrease in sales or the sales discount strategy a company followed has resulted in percentageincrease in sales. In both of these examples, marketing managers are making a casual statement.
However, the scientific concept of casuality is complex and differs substantiality from the oneheld by the common person on the street. The common sense view holds that a single event (thecause) always results in another event (the effect) occurring. In science, we recognize that anevent has a number of determining conditions or causes which act together to make the eventprobable. Note that the common sense notion of casuality is that the effect always follows thecause. This is deterministic causation in contrast to scientific notion which specifies the effectonly as being probable. This is termed as probabilistic causation. The scientific notion holds thatwe can only infer casuality and never really prove it. That is the chance of an incorrect inferenceis always thought to exist. The world of marketing fits the scientific view of casuality. Marketingeffects are probabilistically caused by multiple factors and we can only infer a casual relationship.The condition under which we can make casual inference are:
(a) Time and order of occurrence of variables.
(b) Concomitant variation
(c) Elimination of other possible causal factors.
46 LOVELY PROFESSIONAL UNIVERSITY
Research Methodology
Notes Causal research design are used to provide a stronger basis for the existence of causal relationshipbetween variables. The researcher is able to control the influence of one or more extraneousvariables on the dependent variable. If it is not possible to control the influence of an extraneousvariable on the dependent variable, that variable is called confounded variable.
!Caution Gender cannot be randomly assigned, and therefore already you cannot test allcausal hypotheses.
How to Prepare a Synopsis
Synopsis is an abstract form of research which underlines the research procedure followed andis presented before the guide for evaluating its potentiality. In one sentence it may be describedas a condensation of the final report. The structure of synopsis varies and also depends on theguides' choice. However, for our understanding a common structure may be framed as under:
1. Defining the Problem: In defining the problem of the research objective, definition of keyterms, general background information, limitations of the study and order of presentationshould be mentioned in brief.
2. Review of Existing Literature: In this head, researcher should study the summary of differentpoints of view on the subject matter as found in books, periodicals and approach to befollowed at the time of writing.
3. Conceptual Framework and Methodology: Under this head the researcher should firstmake a statement of the hypothesis. Discussion on the research methodology used, dulypointing out the relationship between the hypothesis and objective of the study andfinally discussions about the sources and means of obtaining data should also be made. Inthis head the researcher should also point out the limitations of methodology, if any, andthe natural crises from which the research is bound to suffer for such obvious limitations.
4. Analysis of Data: Analysis of the data involves testing of hypothesis from data collectedand key conclusions thus arrived.
5. General Conclusions: In general conclusions, the researcher should make a restatement ofobjectives. Conclusion with respect to the acceptance or rejection of hypothesis, conclusionwith respect to the stated objectives, suggested areas of further research and final discussionof possible implications of the study for a model, group, theory and discipline.
Finally the researcher should mention about the bibliographies and appendices. The aboveformat is drawn after a standard framework followed internationally in preparation of a synopsis.However, in our country, keeping in view the object of research, style and structure of synopsisvaries and quite often it is found that the research guide exercises his own discretion in synopsispreparation than following some acceptable international norms. A standard format forpreparation of synopsis commonly used in management and commerce research in India maybe drawn as follows:
1. Introduction: This includes definition of the problem and its review from a historicalperspective.
2. Objective of the Study: It defines the research purpose and its speciality from the existingavailable research in the related field.
3. Literature Review: It includes among other things, different sources from which the requiredabstract is drawn.
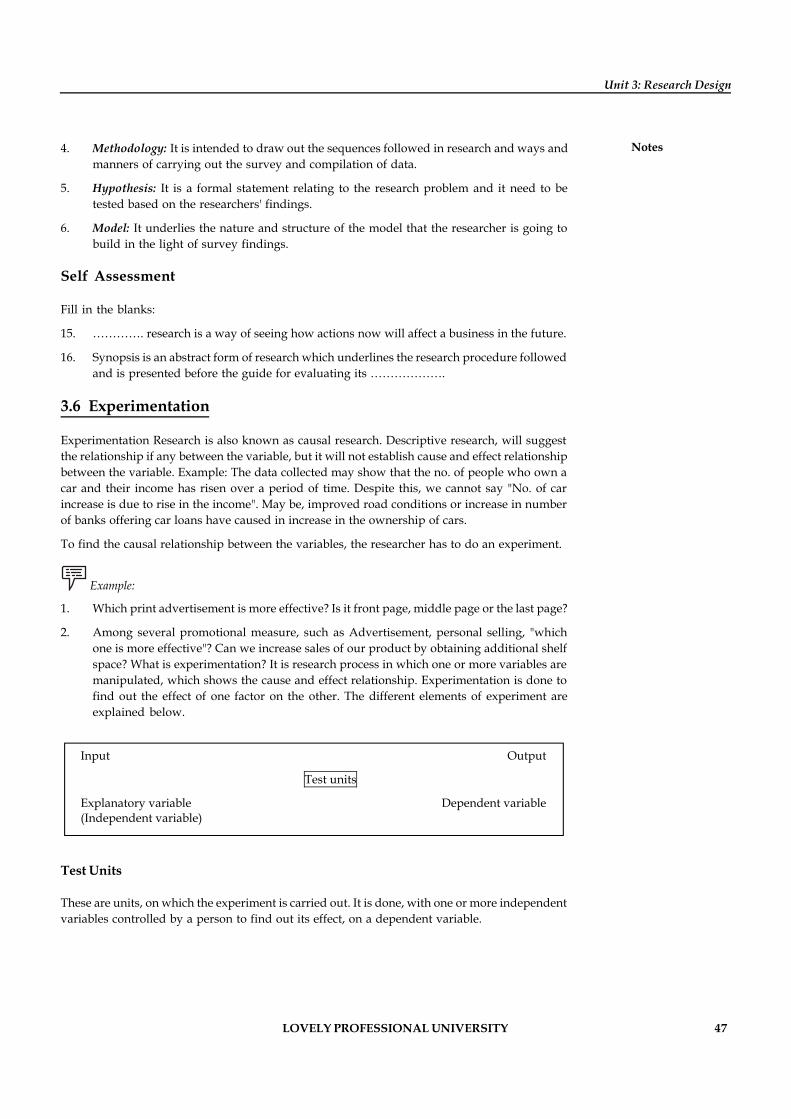
LOVELY PROFESSIONAL UNIVERSITY 47
Unit 3: Research Design
Notes4. Methodology: It is intended to draw out the sequences followed in research and ways andmanners of carrying out the survey and compilation of data.
5. Hypothesis: It is a formal statement relating to the research problem and it need to betested based on the researchers' findings.
6. Model: It underlies the nature and structure of the model that the researcher is going tobuild in the light of survey findings.
Self Assessment
Fill in the blanks:
15. …………. research is a way of seeing how actions now will affect a business in the future.
16. Synopsis is an abstract form of research which underlines the research procedure followedand is presented before the guide for evaluating its ……………….
3.6 Experimentation
Experimentation Research is also known as causal research. Descriptive research, will suggestthe relationship if any between the variable, but it will not establish cause and effect relationshipbetween the variable. Example: The data collected may show that the no. of people who own acar and their income has risen over a period of time. Despite this, we cannot say "No. of carincrease is due to rise in the income". May be, improved road conditions or increase in numberof banks offering car loans have caused in increase in the ownership of cars.
To find the causal relationship between the variables, the researcher has to do an experiment.
Example:
1. Which print advertisement is more effective? Is it front page, middle page or the last page?
2. Among several promotional measure, such as Advertisement, personal selling, "whichone is more effective"? Can we increase sales of our product by obtaining additional shelfspace? What is experimentation? It is research process in which one or more variables aremanipulated, which shows the cause and effect relationship. Experimentation is done tofind out the effect of one factor on the other. The different elements of experiment areexplained below.
Input Output
Test units
Explanatory variable Dependent variable (Independent variable)
Test Units
These are units, on which the experiment is carried out. It is done, with one or more independentvariables controlled by a person to find out its effect, on a dependent variable.
48 LOVELY PROFESSIONAL UNIVERSITY
Research Methodology
Notes Explanatory Variable
These are the variables whose effects, researcher wishes to examine. For example, explanatoryvariables may be advertising, pricing, packaging etc.
Dependent Variable
This is a variable which is under study. For example, sales, consumer attitude, brand loyalty etc.
Example: Suppose a particular colour TV manufacturer reduces the price of the TV by 20%.Assume that his reduction is passed on to the consumer and expect the sales will go up by 15%in next 1 year. This types of experiments are done by leading TV companies during festivalseason.
The causal research finds out, whether the price reduction causes an increase in sales.
Extraneous Variables
These are also called as blocking variables Extraneous variables affects, the result of theexperiments.
Example:
1. Suppose a toffee manufacturing company is making an attempt to measure the responseof the buyers, on two different types of packaging, at two different locations. Themanufacturer needs to keep all other aspects the same, for each buyers group. If themanufacturer allows the extraneous variable namely the "Price", to vary between the twobuyer groups, then he will not be sure, as to which particular packaging is preferred by theconsumers. Here prices change is an extraneous factor.
There are two possible courses of action with respect to extraneous variables.
Extraneous variables may be physically controlled. Example: Price in the above example.
In the second category, extraneous variables may be totally out of control of the researcher.In this case, we say that the experiment has been confounded i.e., it is not possible to makeany conclusions with regard to that experiment. Such a variable is called as "Confoundingvariables".
2. Company introduces a product in two different cities. They would like to know the impactof their advertising on sales. Simultaneously competitors product in one of the cities is notavailable during this period due to strike in the factory. Now researcher cannot concludethat sales of their product in that city has increased due to advertisement. Therefore thisexperiment is confounded. In this case, strike is the confounding variable.
Types of Extraneous Variables
The following are the various types:
1. History
2. Maturation
3. Testing
4. Instrument variation
LOVELY PROFESSIONAL UNIVERSITY 49
Unit 3: Research Design
Notes5. Selection bias
6. Experimental mortality
1. History: History refers to those events, external to the experiment, but occurs at the sametime, as the experiment is being conducted. This may affect the result. Example: Let us saythat, a manufacture makes a 20% cut in the price of a product and monitors sales in thecoming weeks. The purpose of the research, is to find the impact of price on sales. Meanwhile if the production of the product declines due to shortage of raw materials, then thesales will not increase. Therefore, we cannot conclude that the price cut, did not have anyinfluence on sales because the history of external events have occurred during the periodand we cannot control the event. The event can only be identified.
2. Maturation: Maturation is similar to history. Maturation specifically refers to changesoccurring within the test units and not due to the effect of experiment. Maturation takesplace due to passage of time. Maturation refers to the effect of people growing older.People may be using a product. They may discontinue the product usage or switch over toalternate product.
Example:
(a) Pepsi is consumed when young. Due to passage of time the consumer becoming older,might prefer to consume Diet pepsi or even avoid it.
(b) Assume that training programme is conducted for sales man, the company wants to measurethe impact of sales programme. If the company finds that, the sales have improved, it maynot be due to training programme. It may be because, sales man have more experiencenow and know the customer better. Better understanding between sales man and customermay be the cause for increased sales.
Maturation effect is not just limited to test unit, composed of people alone. Organizations alsochanges, dealers grow, become more successful, diversify, etc.
3. Testing: Pre-testing effect occurs, when the same respondents are measured more thanonce. Responses given at a later part will have a direct bearing on the responses givenduring earlier measurement.
Example: Consider a respondent, who is given an initial questionnaire, intended to measurebrand awareness. After exposing him, if a second questionnaire similar to the initial questionnaireis given to the respondent, he will respond quiet differently, because of respondent's familiaritywith the earlier questionnaire.
Pretest suffers from internal validity. This can be understood through an example. Assumethat a respondent's opinion is measured before and after the exposure to a TV commercialof Hyundai car with Shahrukh Khan as brand ambassador. When the respondent is replyingthe second time, He may remember, how he rated Hyundai during the first measurement.He may give the same rating to prove that, he is consistent. In that case, the differencebetween the two measurements will reveal nothing about the real impact.
Alternately some of respondents might give a different rating during second measurement.This may not be due to the fact that the respondent has changed his opinion about Hyundaiand the brand ambassador. He has given different rating because, he does not want to beidentified as a person with no change of opinion to the said commercial.
In both the cases of above, internal validity suffers.
50 LOVELY PROFESSIONAL UNIVERSITY
Research Methodology
Notes 4. Instrument Variation: Instrument variation effect is a threat to internal validity whenhuman respondents are involved. For example, an equipment such as a vacuum cleaner isleft behind, for the customer to use for two weeks. After two weeks the respondents aregiven a questionnaire to answer. The reply may be quite different from what was given bythe respondent before the trail of the product. This may be because of two reasons:
(a) Some of the questions have been changed
(b) Change in the interviewer for pre-testing and post testing are different
The measurement in experiments will depend upon the instrument used to measure. Alsoresults may vary due to application of instruments, where there are several interviewers.Thus, it is very difficult to ensure that all the interviewers will ask the same questions withthe same tone and develop the same rapport. There may be difference in response, becauseeach interviewer conducts the interview differently.
5. Selection Bias: Selection bias occurs because 2 groups selected for experiment may not beidentical. If the 2 groups are asked various questions, they will respond differently. Ifmultiple groups are participating, this error will occur. There are two promotionaladvertisement A & B for "Ready to eat food". The idea is to find effectiveness of the twoadvertisements. Assume that the respondent exposed to 'A' are dominant users of theproduct. Now suppose 50% of those who saw 'Advertisement A' bought the product andonly 10% of those who saw 'Advertisement B' bought the product. From the above, oneshould not conclude that advertisement 'A' is more effective than advertisement 'B'. Themain difference may be due to food preference habits between the groups, even in thiscase, internal validity might suffer but to a lesser degree.
6. Experimental Mortality: Some members may leave the original group and some newmembers join the old group. This is because some members might migrate to anothergeographical area. This change in the members will alter the composition of the group.
Example: Assume that a vacuum cleaner manufacturer wants to introduce a new version. Heinterviews hundred respondents who are currently using the older version. Let us assume that,these 100 respondents have rated the existing vacuum cleaner on a 10 point scale (1 for lowestand 10 for highest). Let the mean rating of the respondents be 7.
Now the newer version is demonstrated to the same hundred respondents and equipment is leftwith them for 2 months. At the end of two months only 80 participant respond, since theremaining 20 refused to answer. Now if the mean score of 80 respondents is 8 on the same 10point scale. From this can we conclude that the new vacuum cleaner is better?
The answer to the above question depends on the composition of 20 respondents who droppedout. Suppose the 20 respondents who dropped out had negative reaction to the product, then themean score would not have been 8. It may even be lower than 7. The difference in mean ratingdoes not give true picture. It does not indicate that the new product is better than the old product.
One might wonder, why not we leave the 20 respondent from the original group and calculatethe mean rating of the remaining 80 and compare. But this method also will not solve themortality effect. Mortality effect will occur in an experiment irrespective of whether the humanbeings or involved or not.
Concomitant Variable
Concomitant variable is the extent to which a cause "X" and the effect "Y" vary together in apredicted manner.
LOVELY PROFESSIONAL UNIVERSITY 51
Unit 3: Research Design
Notes Example:
1. Electrical car is new to India. People may or may not hold positive attitude about electricalcars. Assume that, the company has undertaken a new advertising campaign "To changethe attitude of the people towards this car", so that the sale of this car can increase. Suppose,in testing the result of this campaign, the company finds that both aims have been achievedi.e., the attitude of the people towards electrical car has become positive and also the saleshave increased. Then we can say that there is a concomitant variation between attitude andsales. Both variables move in the same direction.
2. Assume that an education institute introduces a new elective which it claims is Job oriented.The college authorities advertise this course in leading news paper. They would like toknow the perception of students to this course, and how many are willing to enroll. Nowif on testing, it is found the perception towards this course is positive and majority of therespondent are willing to enroll, then we can say that, there is a concomitant variationbetween perception and enrolment. Both variables move in the same direction.
3.6.1 Experimental Designs
The various experimental designs are as follows:
1. After only design
2. Before-after design
3. Factorial design
4. Latin square design
5. Ex-post facto design
After only Design
In this design, dependent variable is measured, after exposing the test units to the experimentalvariable. This can be understood with the help of following example.
Assume M/s Hindustan Lever Ltd. wants to conduct an experiment on "Impact of free sample onthe sale of toilet soaps". A small sample of toilet soap is mailed to a selected set of customers ina locality. After one month, 25 paise off on one cake of soap coupon is mailed to each of thecustomers to whom free sample has been sent earlier. An equal number of these coupons arealso mailed, to people in another similar locality in the neighborhood. The coupons are coded,to keep an account of the number of coupons redeemed from each locality. Suppose, 400 couponswere redeemed from the experimental group and 250 coupons are redeemed from the controlgroup. The difference of 150 is supposed to be the effect of the free samples. In this methodconclusion can be drawn only after conducting the experiment.
Before-after Design
In this method, measurements are made before as well as after.
Example: Let us say that, an experiment is conducted to test an advertisement which isaimed at reducing the alcoholism.
52 LOVELY PROFESSIONAL UNIVERSITY
Research Methodology
Notes Attitude and perception towards consuming liquor is measured before exposure to Ad. Thegroup is exposed to an advertisement, which tells them the consequences, and attitude is againmeasured after several days. The difference, if any, shows the effectiveness of advertisement.
The above example of "Before-after" suffers from validity threat due to the following:
1. Before measure effect: It alerts the respondents to the fact that they are being studied. Therespondents may discuss the topics with friends and relatives and change their behaviour.
2. Instrumentation effect: This can be due to two different instruments being used, onebefore and one after, change in the interviewers before and after, results in instrumentationeffect.
Factorial Design
Factorial design permits the researcher to test two or more variables at the same time. Factorialdesign helps to determine the effect of each of the variables and also measure the interactingeffect of the several variables.
Example: A departmental store wants to study the impact of price reduction for a product.Given that, there is also promotion (POP) being carried out in the stores (a) near the entrance(b) at usual place, at the same time. Now assume that there are two price levels namely regularprice A1 and reduced price A2. Let there be three types of POP namely B1, B2, & B3. There are 3 ×2 = 6 combinations possible. The combinations possible are B1A1, B1A2, B2A1, B2A2, B3A1, B3A2.Which of these combinations is best suited is what the researcher is interested. Suppose there are60 departmental stores of the chain divided into groups of 10 stores. Now, randomly assign theabove combination to each of these 10 stores as follows:
Combinations Sales
B1A1 S1
B1A2 S2
B2A1 S3
B2A2 S4
B3A1 S5
B3A2 S6
S1 TO S6 represents the sales resulting out of each variable. The data gathered will providedetails on product sales on account of two independent variables.
The two questions that will be answered are:
1. Is the reduced price more effective than regular price?
2. Is the display at the entrance more effective than the display at usual location? Also theresearch will tell us about the interaction effect of the two variables.
Out come of the experiment on sales is as follows:
1. Price reduction with display at the entrance.
2. Price reduction with display at usual place.
3. No display and regular price applicable
4. Display at the entrance with regular price applicable.
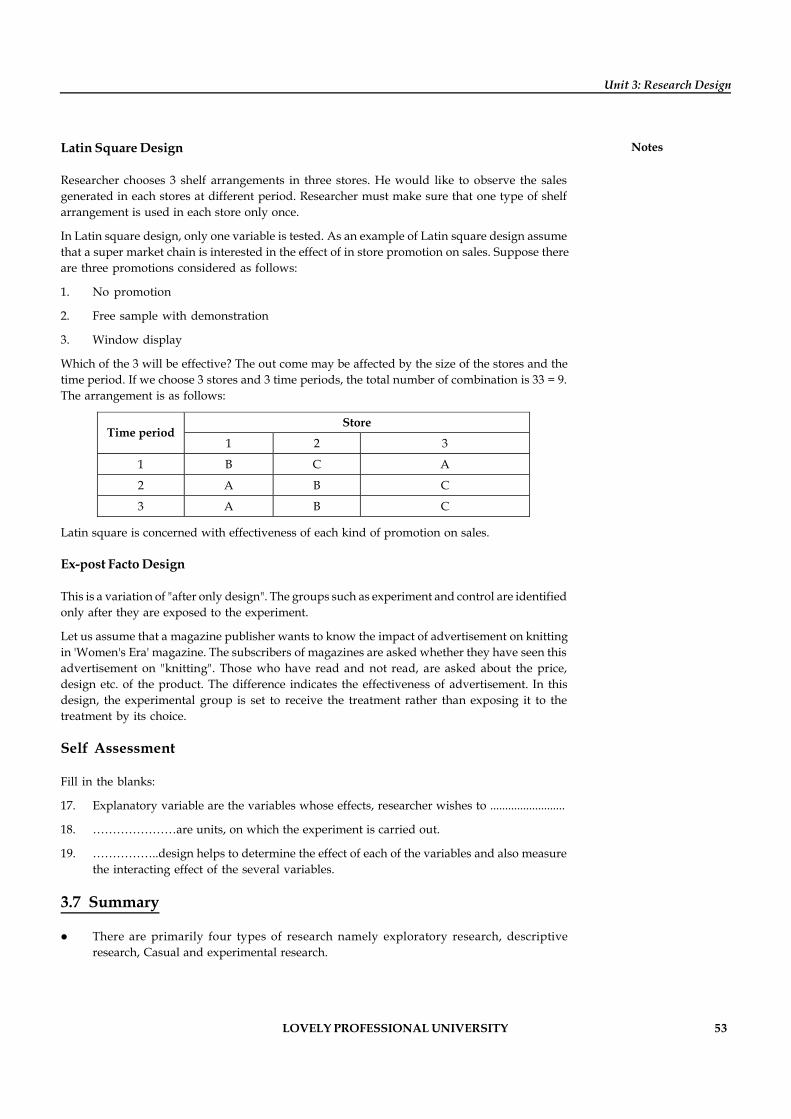
LOVELY PROFESSIONAL UNIVERSITY 53
Unit 3: Research Design
NotesLatin Square Design
Researcher chooses 3 shelf arrangements in three stores. He would like to observe the salesgenerated in each stores at different period. Researcher must make sure that one type of shelfarrangement is used in each store only once.
In Latin square design, only one variable is tested. As an example of Latin square design assumethat a super market chain is interested in the effect of in store promotion on sales. Suppose thereare three promotions considered as follows:
1. No promotion
2. Free sample with demonstration
3. Window display
Which of the 3 will be effective? The out come may be affected by the size of the stores and thetime period. If we choose 3 stores and 3 time periods, the total number of combination is 33 = 9.The arrangement is as follows:
Store Time period
1 2 3
1 B C A
2 A B C
3 A B C Latin square is concerned with effectiveness of each kind of promotion on sales.
Ex-post Facto Design
This is a variation of "after only design". The groups such as experiment and control are identifiedonly after they are exposed to the experiment.
Let us assume that a magazine publisher wants to know the impact of advertisement on knittingin 'Women's Era' magazine. The subscribers of magazines are asked whether they have seen thisadvertisement on "knitting". Those who have read and not read, are asked about the price,design etc. of the product. The difference indicates the effectiveness of advertisement. In thisdesign, the experimental group is set to receive the treatment rather than exposing it to thetreatment by its choice.
Self Assessment
Fill in the blanks:
17. Explanatory variable are the variables whose effects, researcher wishes to .........................
18. …………………are units, on which the experiment is carried out.
19. ……………..design helps to determine the effect of each of the variables and also measurethe interacting effect of the several variables.
3.7 Summary
There are primarily four types of research namely exploratory research, descriptiveresearch, Casual and experimental research.
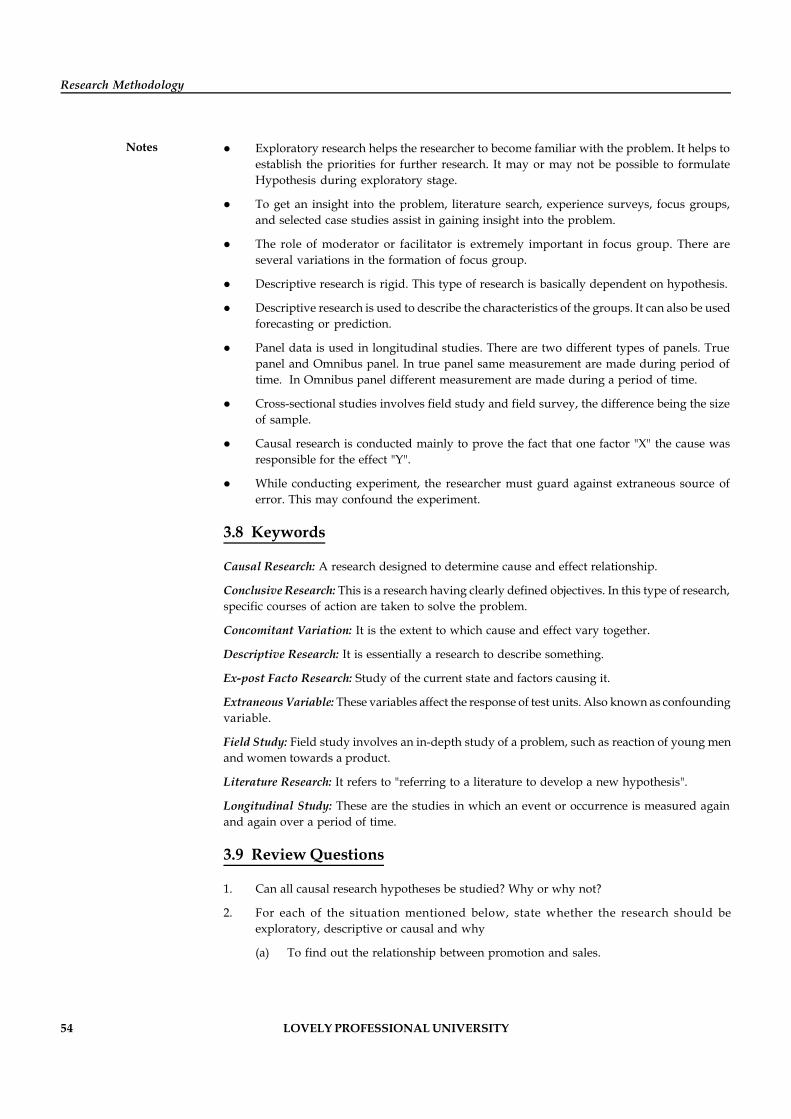
54 LOVELY PROFESSIONAL UNIVERSITY
Research Methodology
Notes Exploratory research helps the researcher to become familiar with the problem. It helps toestablish the priorities for further research. It may or may not be possible to formulateHypothesis during exploratory stage.
To get an insight into the problem, literature search, experience surveys, focus groups,and selected case studies assist in gaining insight into the problem.
The role of moderator or facilitator is extremely important in focus group. There areseveral variations in the formation of focus group.
Descriptive research is rigid. This type of research is basically dependent on hypothesis.
Descriptive research is used to describe the characteristics of the groups. It can also be usedforecasting or prediction.
Panel data is used in longitudinal studies. There are two different types of panels. Truepanel and Omnibus panel. In true panel same measurement are made during period oftime. In Omnibus panel different measurement are made during a period of time.
Cross-sectional studies involves field study and field survey, the difference being the sizeof sample.
Causal research is conducted mainly to prove the fact that one factor "X" the cause wasresponsible for the effect "Y".
While conducting experiment, the researcher must guard against extraneous source oferror. This may confound the experiment.
3.8 Keywords
Causal Research: A research designed to determine cause and effect relationship.
Conclusive Research: This is a research having clearly defined objectives. In this type of research,specific courses of action are taken to solve the problem.
Concomitant Variation: It is the extent to which cause and effect vary together.
Descriptive Research: It is essentially a research to describe something.
Ex-post Facto Research: Study of the current state and factors causing it.
Extraneous Variable: These variables affect the response of test units. Also known as confoundingvariable.
Field Study: Field study involves an in-depth study of a problem, such as reaction of young menand women towards a product.
Literature Research: It refers to "referring to a literature to develop a new hypothesis".
Longitudinal Study: These are the studies in which an event or occurrence is measured againand again over a period of time.
3.9 Review Questions
1. Can all causal research hypotheses be studied? Why or why not?
2. For each of the situation mentioned below, state whether the research should beexploratory, descriptive or causal and why
(a) To find out the relationship between promotion and sales.
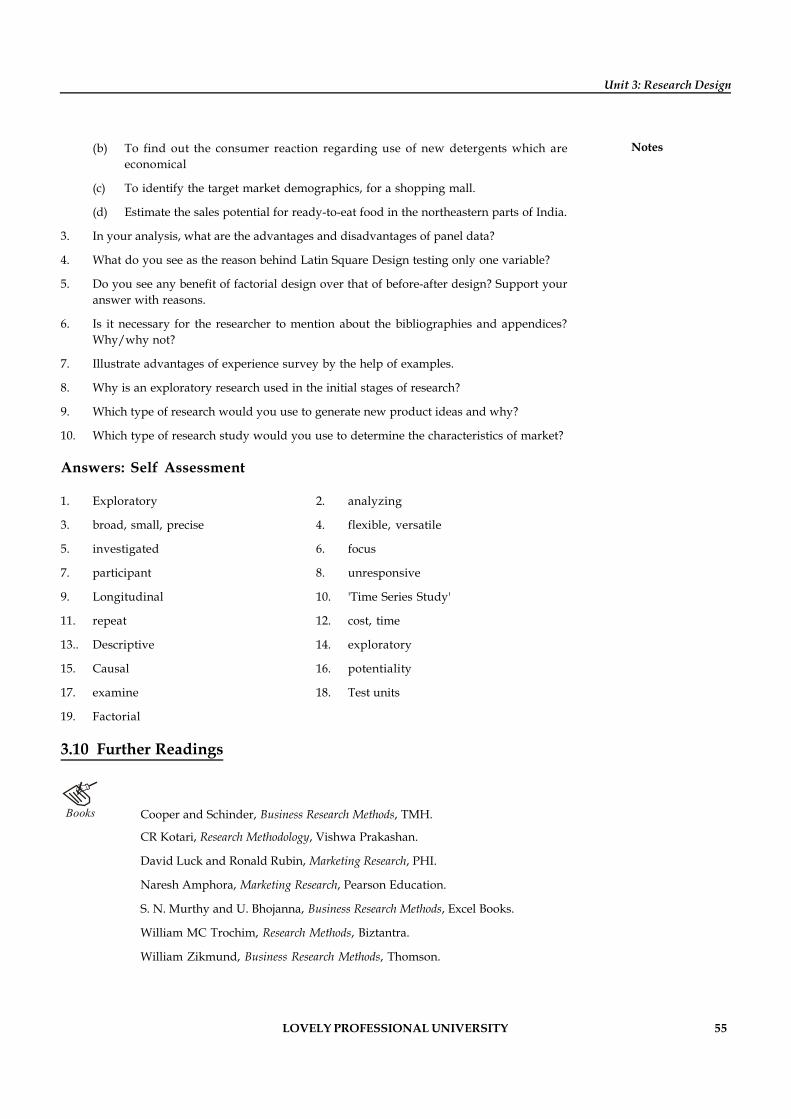
LOVELY PROFESSIONAL UNIVERSITY 55
Unit 3: Research Design
Notes(b) To find out the consumer reaction regarding use of new detergents which areeconomical
(c) To identify the target market demographics, for a shopping mall.
(d) Estimate the sales potential for ready-to-eat food in the northeastern parts of India.
3. In your analysis, what are the advantages and disadvantages of panel data?
4. What do you see as the reason behind Latin Square Design testing only one variable?
5. Do you see any benefit of factorial design over that of before-after design? Support youranswer with reasons.
6. Is it necessary for the researcher to mention about the bibliographies and appendices?Why/why not?
7. Illustrate advantages of experience survey by the help of examples.
8. Why is an exploratory research used in the initial stages of research?
9. Which type of research would you use to generate new product ideas and why?
10. Which type of research study would you use to determine the characteristics of market?
Answers: Self Assessment
1. Exploratory 2. analyzing
3. broad, small, precise 4. flexible, versatile
5. investigated 6. focus
7. participant 8. unresponsive
9. Longitudinal 10. 'Time Series Study'
11. repeat 12. cost, time
13.. Descriptive 14. exploratory
15. Causal 16. potentiality
17. examine 18. Test units
19. Factorial
3.10 Further Readings
Books Cooper and Schinder, Business Research Methods, TMH.
CR Kotari, Research Methodology, Vishwa Prakashan.
David Luck and Ronald Rubin, Marketing Research, PHI.
Naresh Amphora, Marketing Research, Pearson Education.
S. N. Murthy and U. Bhojanna, Business Research Methods, Excel Books.
William MC Trochim, Research Methods, Biztantra.
William Zikmund, Business Research Methods, Thomson.
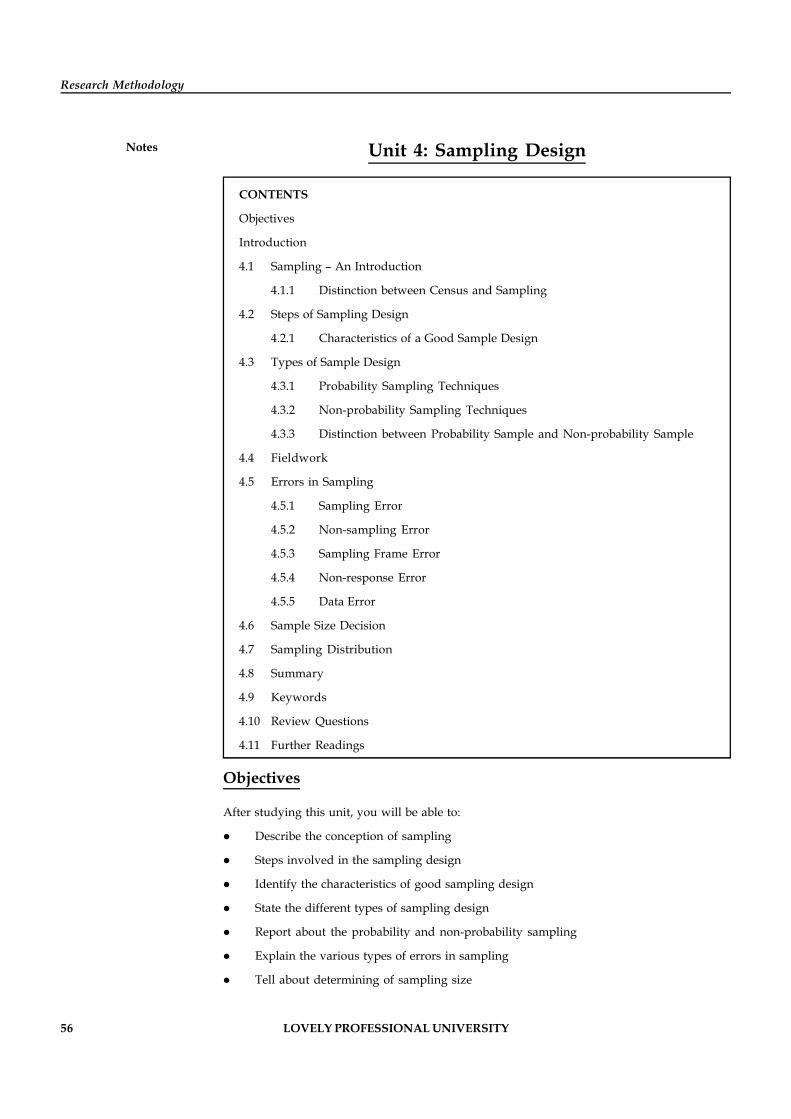
56 LOVELY PROFESSIONAL UNIVERSITY
Research Methodology
Notes Unit 4: Sampling Design
CONTENTS
Objectives
Introduction
4.1 Sampling – An Introduction
4.1.1 Distinction between Census and Sampling
4.2 Steps of Sampling Design
4.2.1 Characteristics of a Good Sample Design
4.3 Types of Sample Design
4.3.1 Probability Sampling Techniques
4.3.2 Non-probability Sampling Techniques
4.3.3 Distinction between Probability Sample and Non-probability Sample
4.4 Fieldwork
4.5 Errors in Sampling
4.5.1 Sampling Error
4.5.2 Non-sampling Error
4.5.3 Sampling Frame Error
4.5.4 Non-response Error
4.5.5 Data Error
4.6 Sample Size Decision
4.7 Sampling Distribution
4.8 Summary
4.9 Keywords
4.10 Review Questions
4.11 Further Readings
Objectives
After studying this unit, you will be able to:
Describe the conception of sampling
Steps involved in the sampling design
Identify the characteristics of good sampling design
State the different types of sampling design
Report about the probability and non-probability sampling
Explain the various types of errors in sampling
Tell about determining of sampling size
LOVELY PROFESSIONAL UNIVERSITY 57
Unit 4: Sampling Design
NotesIntroduction
Sampling is the process of selecting units (e.g., people, organizations) from a population ofinterest so that by studying the sample we may fairly generalize our results back to the populationfrom which they were chosen. Each observation measures one or more properties (weight,location, etc.) of an observable entity enumerated to distinguish objects or individuals. Surveyweights often need to be applied to the data to adjust for the sample design. Results fromprobability theory and statistical theory are employed to guide practice.
4.1 Sampling – An Introduction
A sample is a part of a target population, which is carefully selected to represent the population.Sampling frame is the list of elements from which the sample is actually drawn. Actually,sampling frame is nothing but the correct list of population.
Example: Telephone directory, Product finder, Yellow pages.
The sampling process comprises several stages:
1. Defining the population of concern
2. Specifying a sampling frame, a set of items or events possible to measure
3. Specifying a sampling method for selecting items or events from the frame
4. Determining the sample size
5. Implementing the sampling plan
6. Sampling and data collecting
7. Reviewing the sampling process
4.1.1 Distinction between Census and Sampling
Census refers to complete inclusion of all elements in the population. A sample is a sub-groupof the population.
When is a Census Appropriate?
1. A census is appropriate if the size of population is small.
Example: A researcher may be interested in contacting firms in iron and steel or petroleum
products industry. These industries are limited in number, so a census will be suitable.
2. Sometimes, the researcher is interested in gathering information from every individual.
Example: Quality of food served in a mess.
When is Sample Appropriate?
1. When the size of population is large.
2. When time and cost are the main considerations in research.
3. If the population is homogeneous.
58 LOVELY PROFESSIONAL UNIVERSITY
Research Methodology
Notes 4. Also, there are circumstances when a census is not possible.
Example: Reactions to global advertising by a company.
Self Assessment
Fill in the blanks:
1. A sample is a part of a .................... population.
2. Sampling .................... is the list of elements from which the sample is actually drawn.
3. A sample is appropriate when the size of population is .................... and .....................
4. A census is appropriate if the size of population is .....................
4.2 Steps of Sampling Design
Sampling process consists of seven steps. They are:
1. Define the population
2. Identify the sampling frame
3. Specify the sampling unit
4. Selection of sampling method
5. Determination of sample size
6. Specify sampling plan
7. Selection of sample
1. Define the population: Population is defined in terms of:
(a) Elements
(b) Sampling units
(c) Extent
(d) Time.
Example: If we are monitoring the sale of a new product recently introduced by a company,
say (shampoo sachet) the population will be:
(a) Element - Company's product
(b) Sampling unit - Retail outlet, super market
(c) Extent - Hyderabad and Secunderabad
(d) Time - April 10 to May 10, 2006
2. Identify the sampling frame: Sampling frame could be
(a) Telephone Directory
(b) Localities of a city using the municipal corporation listing
(c) Any other list consisting of all sampling units.
LOVELY PROFESSIONAL UNIVERSITY 59
Unit 4: Sampling Design
Notes Example: You want to learn about scooter owners in a city. The RTO will be the frame,
which provides you names, addresses and the types of vehicles possessed.
3. Specify the sampling unit: Individuals who are to be contacted are the sampling units. Ifretailers are to be contacted in a locality, they are the sampling units.
Sampling unit may be husband or wife in a family. The selection of sampling unit is veryimportant. If interviews are to be held during office timings, when the heads of familiesand other employed persons are away, interviewing would under-represent employedpersons, and over-represent elderly persons, housewives and the unemployed.
4. Selection of sampling method: This refers to whether
(a) probability or
(b) non-probability methods are used.
5. Determine the sample size: This means we need to decide "how many elements of thetarget population are to be chosen?" The sample size depends upon the type of study thatis being conducted. For example: If it is an exploratory research, the sample size will begenerally small. For conclusive research, such as descriptive research, the sample size willbe large.
The sample size also depends upon the resources available with the company.
Did u know? Sample size depends on the accuracy required in the study and the permissibleerrors allowed.
6. Specify the sampling plan: A sampling plan should clearly specify the target population.Improper defining would lead to wrong data collection.
Example: This means that, if a survey of a household is to be conducted, a sampling planshould define a "household" i.e., "Does the household consist of husband or wife or both",minors etc., "Who should be included or excluded." Instructions to the interviewer should include"How he should obtain a systematic sample of households, probability sampling non-probabilitysampling". Advise him on what he should do to the household, if no one is available.
7. Select the sample: This is the final step in the sampling process.
4.2.1 Characteristics of a Good Sample Design
A good sample design requires the judicious balancing of four broad criteria - goal orientation,measurability, practicality and economy.
1. Goal orientation: This suggests that a sample design "should be oriented to the researchobjectives, tailored to the survey design, and fitted to the survey conditions". If this isdone, it should influence the choice of the population, the measurement as also theprocedure of choosing a sample.
2. Measurability: A sample design should enable the computation of valid estimates of itssampling variability. Normally, this variability is expressed in the form of standarderrors in surveys. However, this is possible only in the case of probability sampling. Innon-probability samples, such a quota sample, it is not possible to know the degree ofprecision of the survey results.
60 LOVELY PROFESSIONAL UNIVERSITY
Research Methodology
Notes 3. Practicality: This implies that the sample design can be followed properly in the survey,as envisaged earlier. It is necessary that complete, correct, practical, and clear instructionsshould be given to the interviewer so that no mistakes are made in the selection ofsampling units and the final selection in the field is not different from the original sampledesign. Practicality also refers to simplicity of the design, i.e. it should be capable of beingunderstood and followed in actual operation of the field work.
4. Economy: Finally, economy implies that the objectives of the survey should be achievedwith minimum cost and effort. Survey objectives are generally spelt out in terms ofprecision, i.e. the inverse of the variance of survey estimates. For a given degree of precision,the sample design should give the minimum cost. Alternatively, for a given per unit cost,the sample design should achieve maximum precision (minimum variance).
It may be pointed out that these four criteria come into conflict with each other in most of thecases,
!Caution The researcher should carefully balance the conflicting criteria so that he is able toselect a really good sample design.
Self Assessment
Fill in the blanks:
5. A sampling plan should clearly specify the .................... population.
6. The sample size depends upon the .................... available with the company.
4.3 Types of Sample Design
Sampling is divided into two types:
Probability sampling: In a probability sample, every unit in the population has equal chancesfor being selected as a sample unit.
Non-probability sampling: In the non-probability sampling, the units in the population haveunequal or negligible, almost no chances for being selected as a sample unit.
4.3.1 Probability Sampling Techniques
1. Random sampling.
2. Systematic random sampling.
3. Stratified random sampling.
4. Cluster sampling.
5. Multistage sampling.
Random Sampling
Simple random sample is a process in which every item of the population has an equal probabilityof being chosen.
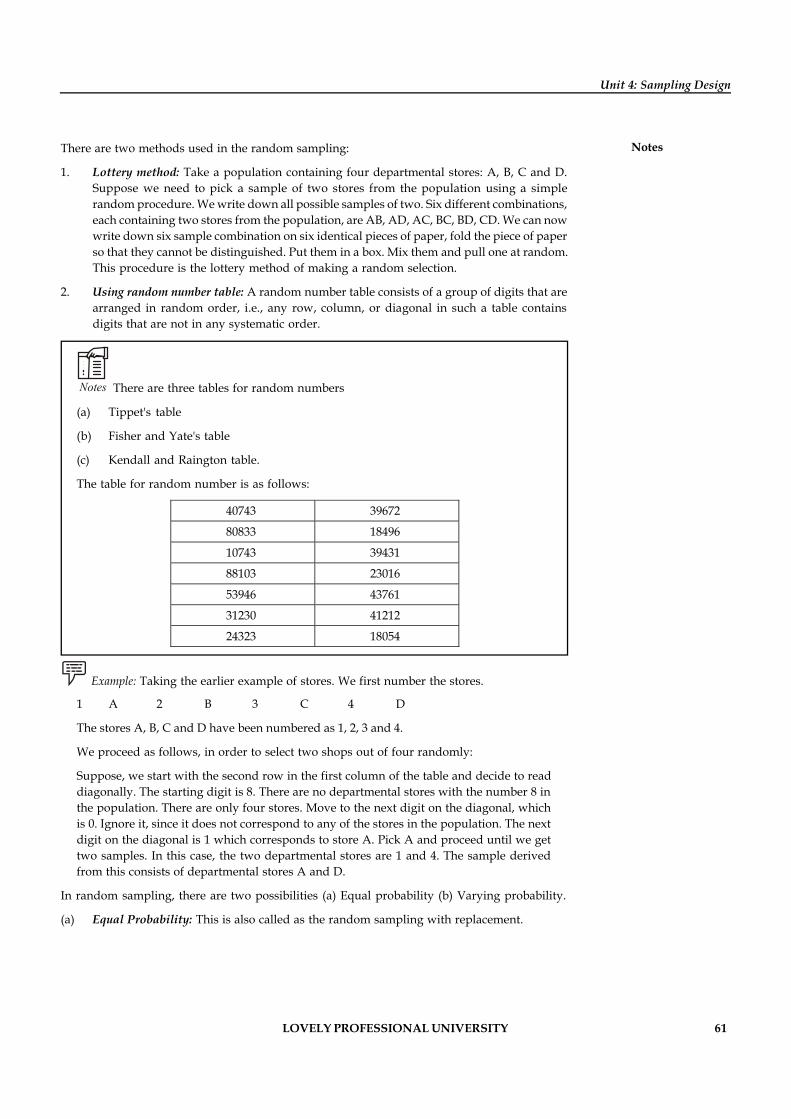
LOVELY PROFESSIONAL UNIVERSITY 61
Unit 4: Sampling Design
NotesThere are two methods used in the random sampling:
1. Lottery method: Take a population containing four departmental stores: A, B, C and D.Suppose we need to pick a sample of two stores from the population using a simplerandom procedure. We write down all possible samples of two. Six different combinations,each containing two stores from the population, are AB, AD, AC, BC, BD, CD. We can nowwrite down six sample combination on six identical pieces of paper, fold the piece of paperso that they cannot be distinguished. Put them in a box. Mix them and pull one at random.This procedure is the lottery method of making a random selection.
2. Using random number table: A random number table consists of a group of digits that arearranged in random order, i.e., any row, column, or diagonal in such a table containsdigits that are not in any systematic order.
Notes There are three tables for random numbers
(a) Tippet's table
(b) Fisher and Yate's table
(c) Kendall and Raington table.
The table for random number is as follows:
40743 39672
80833 18496
10743 39431
88103 23016
53946 43761
31230 41212
24323 18054
Example: Taking the earlier example of stores. We first number the stores.
1 A 2 B 3 C 4 D
The stores A, B, C and D have been numbered as 1, 2, 3 and 4.
We proceed as follows, in order to select two shops out of four randomly:
Suppose, we start with the second row in the first column of the table and decide to readdiagonally. The starting digit is 8. There are no departmental stores with the number 8 inthe population. There are only four stores. Move to the next digit on the diagonal, whichis 0. Ignore it, since it does not correspond to any of the stores in the population. The nextdigit on the diagonal is 1 which corresponds to store A. Pick A and proceed until we gettwo samples. In this case, the two departmental stores are 1 and 4. The sample derivedfrom this consists of departmental stores A and D.
In random sampling, there are two possibilities (a) Equal probability (b) Varying probability.
(a) Equal Probability: This is also called as the random sampling with replacement.
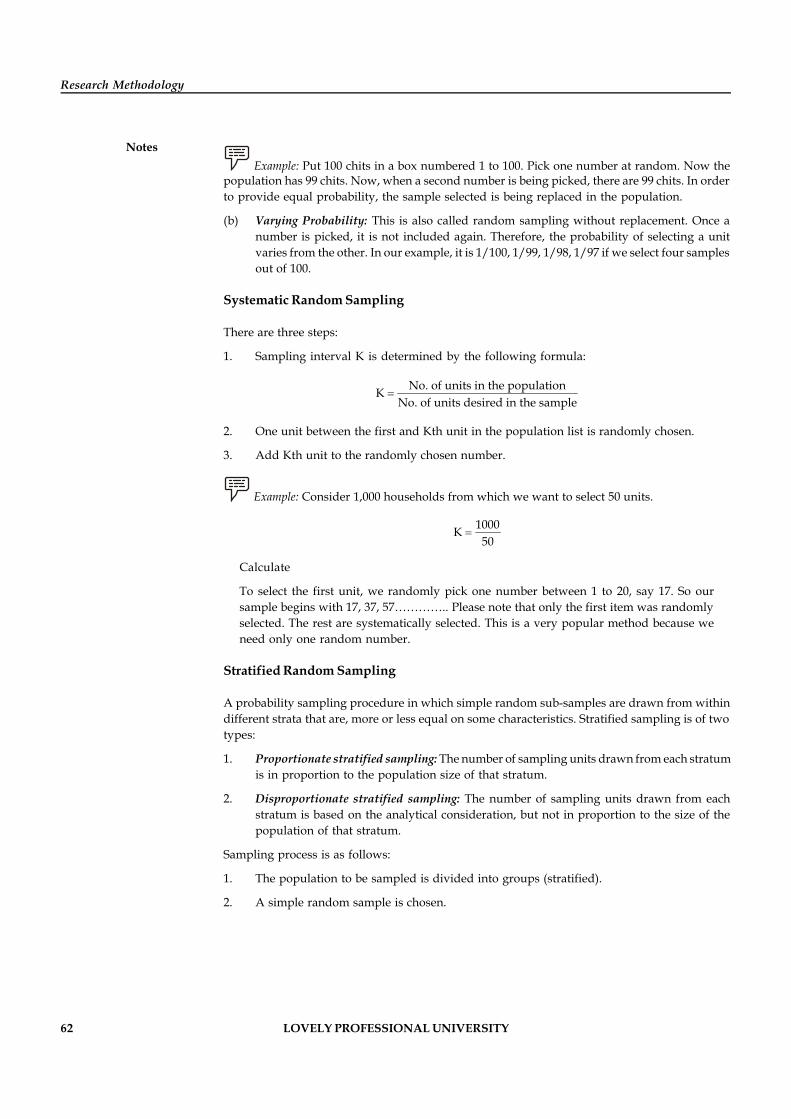
62 LOVELY PROFESSIONAL UNIVERSITY
Research Methodology
Notes Example: Put 100 chits in a box numbered 1 to 100. Pick one number at random. Now the
population has 99 chits. Now, when a second number is being picked, there are 99 chits. In orderto provide equal probability, the sample selected is being replaced in the population.
(b) Varying Probability: This is also called random sampling without replacement. Once anumber is picked, it is not included again. Therefore, the probability of selecting a unitvaries from the other. In our example, it is 1/100, 1/99, 1/98, 1/97 if we select four samplesout of 100.
Systematic Random Sampling
There are three steps:
1. Sampling interval K is determined by the following formula:
No. of units in the populationK
No. of units desired in the sample
2. One unit between the first and Kth unit in the population list is randomly chosen.
3. Add Kth unit to the randomly chosen number.
Example: Consider 1,000 households from which we want to select 50 units.
1000K
50
Calculate
To select the first unit, we randomly pick one number between 1 to 20, say 17. So oursample begins with 17, 37, 57………….. Please note that only the first item was randomlyselected. The rest are systematically selected. This is a very popular method because weneed only one random number.
Stratified Random Sampling
A probability sampling procedure in which simple random sub-samples are drawn from withindifferent strata that are, more or less equal on some characteristics. Stratified sampling is of twotypes:
1. Proportionate stratified sampling: The number of sampling units drawn from each stratumis in proportion to the population size of that stratum.
2. Disproportionate stratified sampling: The number of sampling units drawn from eachstratum is based on the analytical consideration, but not in proportion to the size of thepopulation of that stratum.
Sampling process is as follows:
1. The population to be sampled is divided into groups (stratified).
2. A simple random sample is chosen.
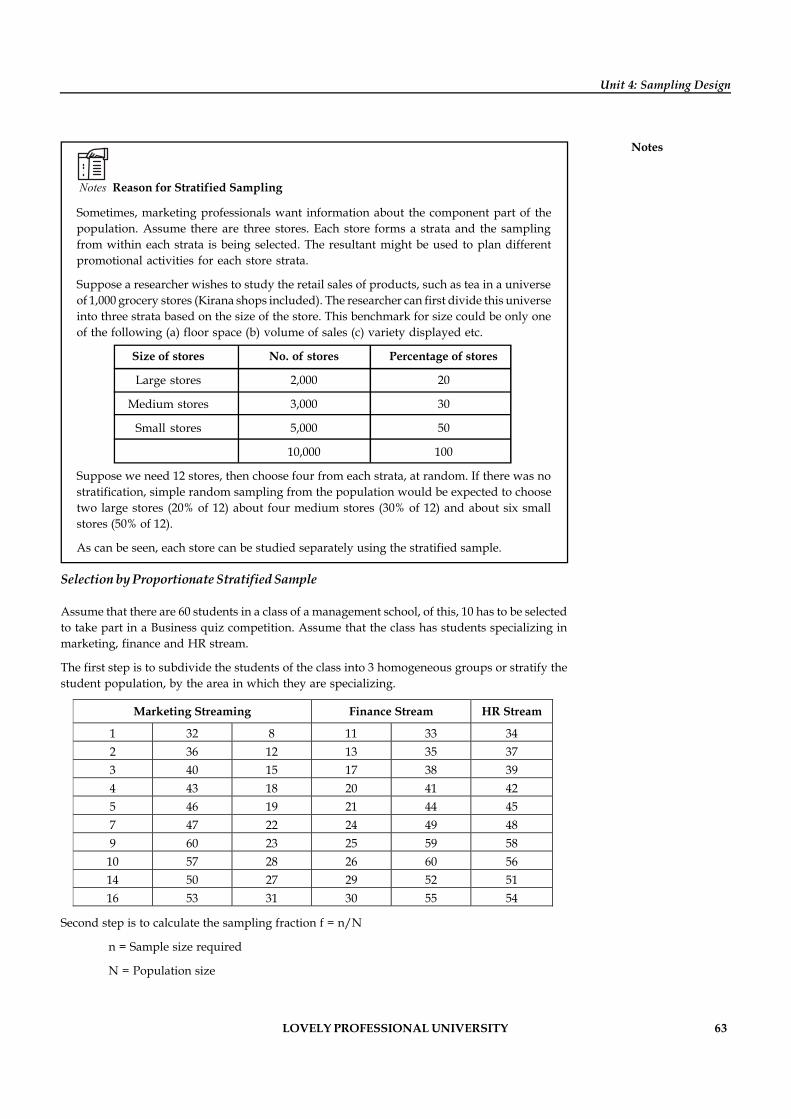
LOVELY PROFESSIONAL UNIVERSITY 63
Unit 4: Sampling Design
Notes
Notes Reason for Stratified Sampling
Sometimes, marketing professionals want information about the component part of thepopulation. Assume there are three stores. Each store forms a strata and the samplingfrom within each strata is being selected. The resultant might be used to plan differentpromotional activities for each store strata.
Suppose a researcher wishes to study the retail sales of products, such as tea in a universeof 1,000 grocery stores (Kirana shops included). The researcher can first divide this universeinto three strata based on the size of the store. This benchmark for size could be only oneof the following (a) floor space (b) volume of sales (c) variety displayed etc.
Size of stores No. of stores Percentage of stores
Large stores 2,000 20
Medium stores 3,000 30
Small stores 5,000 50
10,000 100
Suppose we need 12 stores, then choose four from each strata, at random. If there was nostratification, simple random sampling from the population would be expected to choosetwo large stores (20% of 12) about four medium stores (30% of 12) and about six smallstores (50% of 12).
As can be seen, each store can be studied separately using the stratified sample.
Selection by Proportionate Stratified Sample
Assume that there are 60 students in a class of a management school, of this, 10 has to be selectedto take part in a Business quiz competition. Assume that the class has students specializing inmarketing, finance and HR stream.
The first step is to subdivide the students of the class into 3 homogeneous groups or stratify thestudent population, by the area in which they are specializing.
Marketing Streaming Finance Stream HR Stream
1 32 8 11 33 34 2 36 12 13 35 37 3 40 15 17 38 39 4 43 18 20 41 42 5 46 19 21 44 45 7 47 22 24 49 48 9 60 23 25 59 58
10 57 28 26 60 56 14 50 27 29 52 51 16 53 31 30 55 54
Second step is to calculate the sampling fraction f = n/N
n = Sample size required
N = Population size
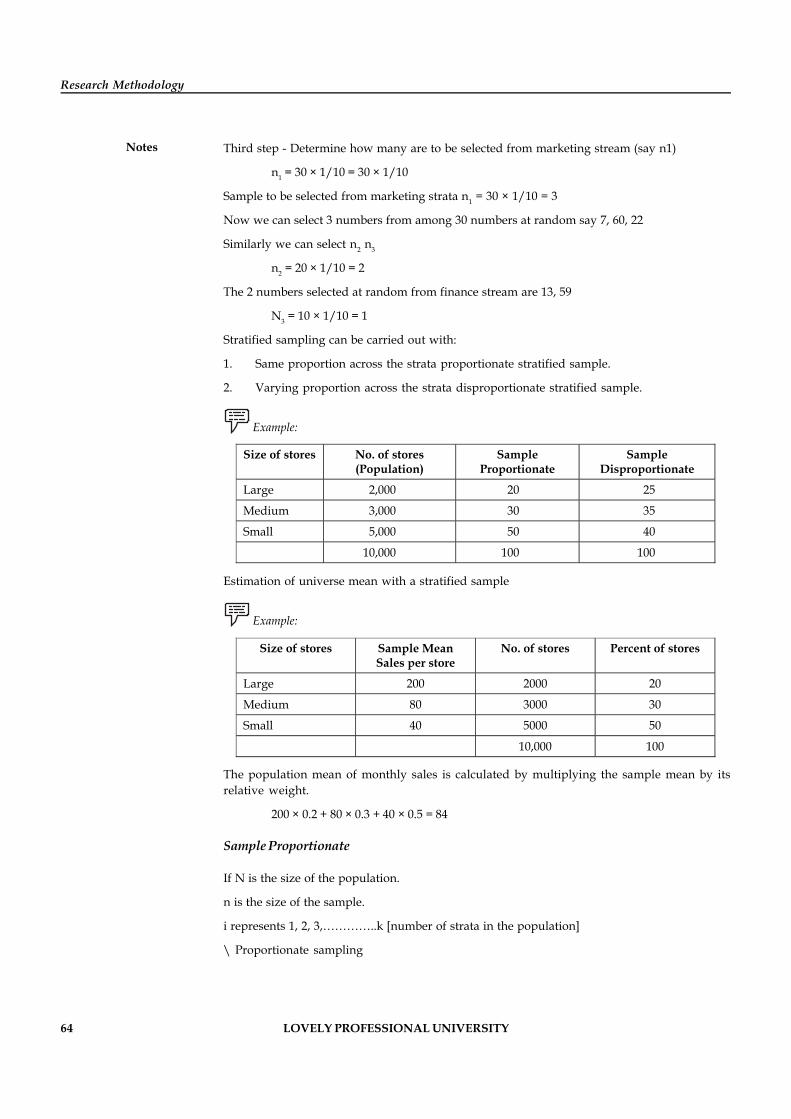
64 LOVELY PROFESSIONAL UNIVERSITY
Research Methodology
Notes Third step - Determine how many are to be selected from marketing stream (say n1)
n1 = 30 × 1/10 = 30 × 1/10
Sample to be selected from marketing strata n1 = 30 × 1/10 = 3
Now we can select 3 numbers from among 30 numbers at random say 7, 60, 22
Similarly we can select n2 n3
n2 = 20 × 1/10 = 2
The 2 numbers selected at random from finance stream are 13, 59
N3 = 10 × 1/10 = 1
Stratified sampling can be carried out with:
1. Same proportion across the strata proportionate stratified sample.
2. Varying proportion across the strata disproportionate stratified sample.
Example:
Size of stores No. of stores (Population)
Sample Proportionate
Sample Disproportionate
Large 2,000 20 25
Medium 3,000 30 35
Small 5,000 50 40
10,000 100 100
Estimation of universe mean with a stratified sample
Example:
Size of stores Sample Mean Sales per store
No. of stores Percent of stores
Large 200 2000 20
Medium 80 3000 30
Small 40 5000 50
10,000 100
The population mean of monthly sales is calculated by multiplying the sample mean by itsrelative weight.
200 × 0.2 + 80 × 0.3 + 40 × 0.5 = 84
Sample Proportionate
If N is the size of the population.
n is the size of the sample.
i represents 1, 2, 3,…………..k [number of strata in the population]
\ Proportionate sampling
LOVELY PROFESSIONAL UNIVERSITY 65
Unit 4: Sampling Design
Notes
P =1 2
1 2
................ k
k
n n n nN N N N
= = = =
= 11 1
1
n n nn nN N N and so on
N1 is the sample size to be drawn from stratum 1
n1 + n2 +………… nk = n [Total sample size of the all strata]
Example: A survey is planned to analyse the perception of people towards their ownreligious practices. The population consists of various religions, viz., Hindu, Muslim, Christian,Sikh, Jain, assuming a total of 10,000. Hindu, Muslim, Christian, Sikh and Jains consists of 6,000,2,000, 1,000, 500 and 500 respectively. Determine the sample size of each stratum by applyingproportionate stratified sampling, if the sample size required is 200.
Solution:
Total population, N = 10,000
Population in the strata of Hindus N1 = 6,000
Population in the strata of Muslims N2 = 2,000
Population in the strata of Christians N3 = 1,000
Population in the strata of Sikhs N4 = 500
Population in the strata of Jains N5 = 500
Proportionate Stratified Sampling
P =
1 2 3 4 5
1 2 3 4 5
n n n n n nN N N N N N
= = = = =
Let us determine the sample size of strata N1
1
1
nN = d
= 20 × 6
= 120
n2 = 2n 2000n 2,000N 10,000
= 40
n3 = 3n 200N 1,000N 10,000
= 20
n4 = 4n 200N 500N 10,000
= 10
66 LOVELY PROFESSIONAL UNIVERSITY
Research Methodology
Notesn5 = 5
n N 10N
n = n1 + n2 + n3 + n4 + n5
= 120 + 40 + 20 + 10 + 10
= 200.
Sample Disproportion
Let is the variance of the stratum i,
where i = 1, 2, 3……….k.
The formula to compute the sample size of the stratum i is the variance of the stratum i,
where size of stratum i
ri = Sample size of stratum i
ri = iNN
r = Ratio of the size of the stratum i with that of the population.
Ni = Population of stratum i
N = Total population.
Example: The Government of India wants to study the performance of women self helpgroups (WSHGs) in three regions viz. North, South and West. The total number of WSHGs is1,500. The number of groups in North, South and West are 600, 500 and 400 respectively. TheGovernment found more variation between WSHGs in the North, South and West regions. Thevariance of performance of WSHGs in these regions are 64, 25 and 16 respectively. If thedisappropriate stratified sampling is to be used with the sample size of 100, determine thenumber of sampling units for each region.
Solution:
Total Population N = 1,500
Size of the stratum 1, N1 = 600
Size of the stratum 2, N2 = 500
Size of the stratum 3, N3 = 400
Variance of stratum 1, 2 = 82 = 64
Variance of stratum 2, 2 = 52 = 25
Variance of stratum 3, 2 = 42 = 16
Sample size n = 100
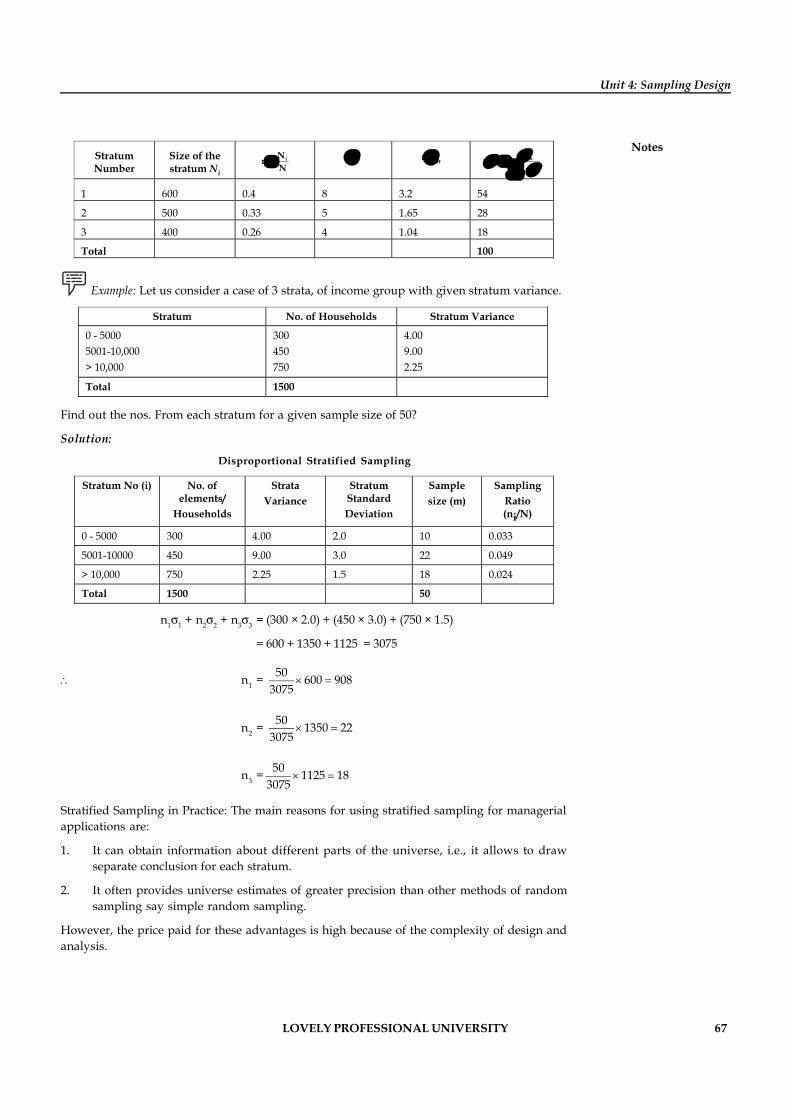
LOVELY PROFESSIONAL UNIVERSITY 67
Unit 4: Sampling Design
NotesStratum Number
Size of the stratum Ni
ii
NrN
=
i riin i ini in 3
1
rr =å i ir
1 600 0.4 8 3.2 54
2 500 0.33 5 1.65 28
3 400 0.26 4 1.04 18
Total 100
Example: Let us consider a case of 3 strata, of income group with given stratum variance.
Stratum No. of Households Stratum Variance
0 - 5000 5001-10,000 > 10,000
300 450 750
4.00 9.00 2.25
Total 1500
Find out the nos. From each stratum for a given sample size of 50?
Solution:
Disproportional Stratified Sampling
Stratum No (i) No. of elements/
Households
Strata Variance
Stratum Standard Deviation
Sample size (m)
Sampling Ratio (ni/N)
0 - 5000 300 4.00 2.0 10 0.033
5001-10000 450 9.00 3.0 22 0.049
> 10,000 750 2.25 1.5 18 0.024
Total 1500 50
n11 + n22 + n33 = (300 × 2.0) + (450 × 3.0) + (750 × 1.5)
= 600 + 1350 + 1125 = 3075
n1 = 50 600 9083075
n2 = 50 1350 223075
n3 = 50 1125 183075
Stratified Sampling in Practice: The main reasons for using stratified sampling for managerialapplications are:
1. It can obtain information about different parts of the universe, i.e., it allows to drawseparate conclusion for each stratum.
2. It often provides universe estimates of greater precision than other methods of randomsampling say simple random sampling.
However, the price paid for these advantages is high because of the complexity of design andanalysis.
68 LOVELY PROFESSIONAL UNIVERSITY
Research Methodology
Notes Cluster Sampling
The following steps are followed:
1. The population is divided into clusters.
2. A simple random sample of few clusters is selected.
3. All the units in the selected cluster are studied.
Step 1: The above mentioned cluster sampling is similar to the first step of stratified randomsampling. But the two sampling methods are different. The key to cluster sampling is decided byhow homogeneous or heterogeneous the clusters are.
A major advantage of simple cluster sampling is the case of sample selection. Suppose, we havea population of 20,000 units from which we wish to select 500 units. Choosing a sample of thatsize is a very time-consuming process, if we use Random Numbers table. Suppose, the entirepopulation is divided into 80 clusters of 250 units each, we can choose two sample clusters(2 × 250 = 500) easily by using cluster sampling. The most difficult job is to form clusters. Inmarketing, the researcher forms clusters so that he can deal with each cluster differently.
Example: Assume there are 20 households in a locality.
Cross Houses
1 X1 X2 X3 X4
2 X5 X6 X7 X8
3 X9 X10 X11 X12
4 X13 X14 X15 X16
We need to select eight houses. We can choose eight houses at random. Alternatively, twoclusters, each containing four houses can be chosen. In this method, every possible sample ofeight houses would have a known probability of being chosen – i.e. chance of one in two. Wemust remember that in the cluster, each house has the same characteristics. With cluster sampling,it is impossible for certain random sample to be selected. For example, in the cluster samplingprocess described above, the following combination of houses could not occur: X1 X2 X5 X6 X9 X10
X13 X14. This is because the original universe of 16 houses have been redefined as a universe offour clusters. So only clusters can be chosen as a sample.
Example: Suppose, we want to have 7500 households from all over the country. In such acase, from the first stage, District, say 30 districts out of 600 are selected from all over thecountry.
I Stage - Cities: Suppose 5 cities are selected out of each 30 districts; and
II Stage - Wards/Localities: say 10 wards/localities are selected from each city
III Stage - Households: 50 households are selected from each ward/locality.
In stage I, we can employ stratified sampling
In stage II, we can use cluster sampling
In stage III, we can have simple random sampling.
LOVELY PROFESSIONAL UNIVERSITY 69
Unit 4: Sampling Design
Notes
!Caution The use of various methods shall give individually contribute towards accuracy,cost, time, etc. This leads us to conclude that multistage sampling leads to saving of time,labour and money. Apart from this wherever an appropriate frame is not available, theuse of multistage sampling has universal appeal.
Multistage Sampling
The name implies that sampling is done in several stages. This is used with stratified/clusterdesigns.
An illustration of double sampling is as follows.
The management of a newly-opened club is solicits new membership. During the first rounds,all corporates were sent details so that those who are interested may enroll. Having enrolled,the second round concentrates on how many are interested to enroll for various entertainmentactivities that club offers such as billiards, indoor sports, swimming, gym etc. After obtainingthis information, you might stratify the interested respondents. This will also tell you thereaction of new members to various activities. This technique is considered to be scientific, sincethere is no possibility of ignoring the characteristics of the universe.
Task What are the advantages and disadvantages of multistage sampling? Enlist.
Area Sampling
This is a probability sampling, a special form of cluster sampling.
Example: If someone wants to measure the sales of toffee in retail stores, one might choosea city locality and then audit toffee sales in retail outlets in those localities.
The main problem in area sampling is the non-availability of lists of shops selling toffee in aparticular area. Therefore, it would be impossible to choose a probability sample from theseoutlets directly. Thus, the first job is to choose a geographical area and then list out outletsselling toffee. Then follows the probability sample for shops among the list prepared.
Example: You may like to choose shops which sell the brand-Cadbury dairy milk. Thedisadvantage of the area sampling is that it is expensive and time-consuming.
4.3.2 Non-probability Sampling Techniques
1. Deliberate sampling
2. Shopping mall intercept sampling
3. Sequential sampling
4. Quota sampling
5. Snowball sampling
6. Panel samples
70 LOVELY PROFESSIONAL UNIVERSITY
Research Methodology
Notes Deliberate or Purposive Sampling
This is also known as the judgment sampling. The investigator uses his discretion in selectingsample observations from the universe. As a result, there is an element of bias in the selection.From the point of view of the investigator, the sample thus chosen may be a true representativeof the universe. However, the units in the universe do not enjoy an equal chance of gettingincluded in the sample. Therefore, it cannot be considered a probability sampling.
Example: Test market cities are being selected, based on the judgment sampling, becausethese cities are viewed as typical cities matching with certain demographical characteristics.Judgment sample is also frequently used to select stores for the purpose of introducing a newdisplay.
Shopping Mall Intercept Sampling
This is a non-probability sampling method. In this method the respondents are recruited forindividual interviews at fixed locations in shopping malls.
Example: Shopper's Shoppe, Food World, Sunday to Monday.
This type of study would include several malls, each serving different socio-economic population.
Example: The researcher may wish to compare the responses of two or more TV commercialsfor two or more products. Mall samples can be informative for this kind of studies. Mall samplesshould not be used under following circumstances i.e., if the difference in effectiveness of twocommercials varies with the frequency of mall shopping, change in the demographic characteristicof mall shoppers, or any other characteristic. The success of this method depends on "How wellthe sample is chosen".
Sequential Sampling
This is a method in which the sample is formed on the basis of a series of successive decisions.They aim at answering the research question on the basis of accumulated evidence. Sometimes,a researcher may want to take a modest sample and look at the results. Thereafter, s(he) willdecide if more information is required for which larger samples are considered. If the evidenceis not conclusive after a small sample, more samples are required. If the position is stillinconclusive, still larger samples are taken. At each stage, a decision is made about whethermore information should be collected or the evidence is now sufficient to permit a conclusion.
Example: Assume that a product needs to be evaluated.
A small probability sample is taken from among the current user. Suppose it is found thataverage annual usage is between 200 to 300 units. It is known that the product is economicallyviable only if the average consumption is 400 units. This information is sufficient to take adecision to drop the product. On the other hand, if the initial sample shows a consumption levelof 450 to 600 units, additional samples are needed for further study.
Quota Sampling
Quota sampling is quite frequently used in marketing research. It involves the fixation ofcertain quotas, which are to be fulfilled by the interviewers.
LOVELY PROFESSIONAL UNIVERSITY 71
Unit 4: Sampling Design
NotesSuppose, 2,00,000 students are appearing for a competitive examination. We need to select 1% ofthem based on quota sampling. The classification of quota may be as follows:
Example: Classification of Samples
Category Quota
General merit 1,000
Sport 600
NRI 100
SC/ST 300
Total 2,000
Quota sampling involves the following steps:
1. The population is divided into segments on the basis of certain characteristics. Here, thesegments are termed as cells.
2. A quota of unit is selected from each cell.
Snowball Sampling
This is a non-probability sampling. In this method, the initial group of respondents are selectedrandomly. Subsequent respondents are being selected based on the opinion or referrals providedby the initial respondents. Further referrals will lead to more referrals, thus leading to a snowballsampling. The referrals will have demographic and psychographic characteristics that arerelatively similar to the person referring them.
Example: College students bring in more students on the consumption of Pepsi. The majoradvantage of snowball sampling is that it monitors the desired characteristics in the population.
Panel Samples
Panel samples are frequently used in marketing research. To give an example, suppose that oneis interested in knowing the change in the consumption pattern of households. A sample ofhouseholds is drawn. These households are contacted to gather information on the pattern ofconsumption. Subsequently, say after a period of six months, the same households are approachedonce again and the necessary information on their consumption is collected.
4.3.3 Distinction between Probability Sample and Non-probability Sample
Probability Sample
1. Here, each member of a universe has a known chance of being selected and included in thesample.
2. Any personal bias is avoided. The researcher cannot exercise his discretion in the selectionof sample items.
Example: Random sample and cluster sample.
72 LOVELY PROFESSIONAL UNIVERSITY
Research Methodology
Notes Non-probability Sample
In this case, the likelihood of choosing a particular universe element is unknown. The samplechosen in this method is based on aspects like convenience, quota etc.
Example: Quota sampling and Judgment sampling.
Difference between Cluster Sampling and Stratified Random Sampling
The major difference between cluster sampling and stratified sampling lies with the inclusion ofthe cluster or strata. In stratified random sampling, all the strata of the population is sampledwhile in cluster sampling, the researcher merely randomly selects a number of clusters from thecollection of clusters of the entire population. Thus, only a number of clusters are sampled, allthe other clusters are left unrepresented.
The other notable differences between Cluster and Stratified random sampling are as follows:
When natural groupings are clear in a statistical population, cluster sampling technique isused. While Stratified sampling is a method where in, the member of a group are groupedinto relatively homogeneous groups.
Cluster sampling can be chosen if the group consists of homogeneous members. On theother hand, for heterogeneous members in the groups, stratified sampling is a goodoption.
The benefit of cluster sampling over other sampling methods is, it is cheaper as comparedto the other methods. While the benefits of stratified sampling are, this method ignoresthe irrelevant ones and focuses on the vital sub populations. Another advantage is, withstratified random sampling method is that for different sub populations, the researchercan opt for different sampling techniques. The stratified sampling method as well helps inimproving the efficiency and accuracy of the estimation and facilitates greater balancingof statistical power of tests.
The major disadvantage of cluster sampling is, it initiates higher sampling error. Thissampling error may be represented as design effect. The disadvantages of stratified randomsampling method are, it calls for choice of relevant stratification variables which can betough at times. When there are homogeneous subgroups, random sampling method is notmuch useful. The implementation of random sampling method is expensive and If notprovided with correct information about the population, then an error may be introduced.
All strata are represented in the sample; but only a subset of clusters are in the sample.
Self Assessment
Fill in the blanks:
7. Sampling is divided into two types, viz. ...................... and ......................
8. There are ...................... methods used in the random sampling.
9. ...................... is also called as the random sampling with replacement.
10. ...................... is also called random sampling without replacement.
11. Stratified sampling can be carried out with ...................... proportion across the strataproportionate stratified sample.
LOVELY PROFESSIONAL UNIVERSITY 73
Unit 4: Sampling Design
Notes4.4 Fieldwork
The fieldwork consists of informal conversations as well as formal standardized interviews,including projectives or questionnaires. Initially, a single person conducted the research. Changesin society have shifted research for the most part into teamwork. However, a single person canstill conduct effective research. Traditionally, educational researchers began their research witha set of hypothesis, whereas the fieldworker's hypothesis emerges through the fieldwork.
Fieldwork in its inception may seem to be disorganized. The notes may be scattered, informationis coming from all over the place. That is because the hypothesis has not yet emerged. Eventhough, at times the hypothesis may become very clear rapidly. Once the hypothesis becameevident the fieldworker maintains an open mind thus allowing other hypothesis to emerge.
Another important difference between the types of research is the "nature of the propositionsought: his propositions are rarely of the A causes B type, the usual casual interrelationshipsbetween two or more variables dealt with in an experimental research".
Much of the naturalistic data is collected by using raw materials: notes stating the actual responsegiven. In order to be accurate recorders are often used. Experienced researchers create their owntechniques and develop the ability to remember the information that needs to be recorded.
Did u know? How does a fieldworker know when the Enquiry should finish?
The fieldworker knows when the inquiry should finish by analyzing the data as it is gathered.The end arrives when the fieldworker sees patterns and no new significant changes.
Three important points that must be included are:
1. The data can be subjective to quantitative analysis
2. Most practitioners of the method probably consider its products to have full status asactual studies
3. Can be credible regardless of abstraction.
Self Assessment
Fill in the blanks:
12. Fieldwork in its inception may seem to be ......................
13. ...................... researchers create their own techniques and develop the ability to rememberthe information that needs to be recorded.
4.5 Errors in Sampling
4.5.1 Sampling Error
The only way to guarantee the minimization of sampling error is to choose the appropriatesample size. As the sample keeps on increasing, the sampling error decreases. Sampling error isthe gap between the sample mean and population mean.
Example: If a study is done amongst Maruti car-owners in a city to find the average monthlyexpenditure on the maintenance of car, it can be done by including all Maruti car-owners. It can
74 LOVELY PROFESSIONAL UNIVERSITY
Research Methodology
Notes also be done by choosing a sample without covering the entire population. There will be adifference between the two methods with regard to monthly expenditure.
4.5.2 Non-sampling Error
One way of distinguishing between the sampling and the non-sampling error is that, whilesampling error relates to random variations which can be found out in the form of standarderror, non-sampling error occurs in some systematic way which is difficult to estimate.
4.5.3 Sampling Frame Error
A sampling frame is a specific list of population units, from which the sample for a study beingchosen.
Example:
1. An MNC bank wants to pick up a sample among the credit card holders. They can readilyget a complete list of credit card holders, which forms their data bank. From this frame,the desired individuals can be chosen. In this example, sample frame is identical to idealpopulation namely all credit card holders. There is no sampling error in this case.
2. Assume that a bank wants to contact the people belonging to a particular profession overphone (doctors, lawyers) to market a home loan product. The sampling frame in this caseis the telephone directory. This sampling frame may pose several problems: (1) Peoplemight have migrated. (2) Numbers have changed. (3) Many numbers were not yet listed.The question is "Are the residents who are included in the directory likely to differ fromthose who are not included"? The answer is yes. Thus in this case, there will be a samplingerror.
4.5.4 Non-response Error
This occurs, because the planned sample and final sample vary significantly.
Example: Marketers want to know about the television viewing habits across the country.They choose 500 households and mail the questionnaire. Assume that only 200 respondentsreply. This does not show a non-response error, which depends upon the discrepancy. If those200 who replied did not differ from the chosen 500, there is no non-response error.
Consider an alternative. The people who responded are those who had plenty of leisure time.Therefore, it is implied that non-respondents do not have adequate leisure time. In this case, thefinal sample and the planned sample differ. If it was assumed that all the 500 chosen have leisuretime, but in the final analysis only 200 have leisure time and not others. Therefore, a samplewith respect to leisure time leads to response error.
Guidelines to Increase the Response Rate
Every researcher likes to get maximum possible response from the respondents, and will bemost delighted if cent percent respondent unfortunately, this does not happen. The non-responseerror can be reduced by increasing the response rate. Higher the response rate, more accurateand reliable is the data. In order to achieve this, some useful hints could be as follows:
LOVELY PROFESSIONAL UNIVERSITY 75
Unit 4: Sampling Design
Notes1. Intimate the respondents in advance through a letter. This will improve the preparedness.
2. Personalized questionnaire should be accompanied by a covering letter.
3. Ensure/Assure that confidentiality will be maintained
4. Questionnaire length is to be restricted
5. Increase of personal interview, I.D. card is essential to prove the bona fide.
6. Monetary incentives are gifts will act as motivator
7. Reminder/Revisits would help.
8. Send self addressed/stamped envelope to return the completed questionnaire.
4.5.5 Data Error
This occurs during the data collection, analysis of data or interpretation. Respondents sometimesgive distorted answers unintentionally for questions which are difficult, or if the question isexceptionally long and the respondent may not have answer. Data errors can also occur dependingon the physical and social characteristics of the interviewer and the respondent. Things such asthe tone and voice can affect the responses. Therefore, we can say that the characteristics of theinterviewer can also result in data error. Also, cheating on the part of the interviewer leads todata error. Data errors can also occur when answers to open-ended questions are beingimproperly recorded.
Failure of the Interviewer to Follow Instructions
The respondent must be briefed before beginning the interview, "What is expected"? "To whatextent he should answer"? Also, the interviewer must make sure that respondent is familiar withthe subject. If these are not made clear by the interviewer, errors will occur.
Editing mistakes made by the editors in transferring the data from questionnaire to computersare other causes for errors.
The respondent could terminate his/her participation in data gathering, because it may be feltthat the questionnaire is too long and tedious.
Self Assessment
Fill in the blanks:
14. The only way to guarantee the minimization of sampling error is to choose the appropriate...............................
15. A ............................... is a specific list of population units, from which the sample for a studybeing chosen.
16. The ............................... error can be reduced by increasing the response rate.
4.6 Sample Size Decision
1. The first factor that must be considered in estimating sample size, is the error permissible.
2. Greater the desired precision, larger will be the sample size.
3. Higher the confidence level in the estimate, the larger the sample must be. There is a tradeoff between the degree of confidence and the degree of precision with a sample of fixed size.
76 LOVELY PROFESSIONAL UNIVERSITY
Research Methodology
Notes 4. The greater the number of sub-groups of interest within the sample, the greater its sizemust be.
5. Cost is a factor that determines the size of the sample.
6. The issue of response rate: The issue to be considered in deciding the necessary samplesize is the actual number of questionnaires that must be sent out. Calculation-wise, wemay send questionnaires to the required number of people, but we may not receive theresponse. For example, we may like to obtain the family income level from a mail survey,but the researcher may not receive response from everyone. If the researcher feels theresponse rate is 40%, then he needs to despatch that many extra questionnaires. A lowpercentage of response can cause serious problems to the researcher. This is known as thenon-response error.
Non-response error may be due to (1) failure to locate, (2) flat refusal.
Failure to locate: People move to new destinations. However, if the sample frames used are ofrecent origin, this problem can be overcome.
Flat refusal: We do not know if those who did not respond hold different views or opinionsfrom those who responded.
This implies that those who don't respond should be motivated. It can be done in any one of thefollowing ways:
1. An advance letter informing the respondents that they will receive a questionnaire andrequesting their cooperation. This will generally increase the rate of response.
2. Monetary incentive or gift given to respondents will yield a larger response rate.
3. Proper follow up is necessary after the potential respondent received the questionnaire.
Example: Determine the sample size if standard deviation of the population is 3.9, populationmean is 36 and sample mean is 33 and the desired degree of precision is 99%.
Solution:
Given, = 3.9, = 36, x and z = 1% (99% precision implies 1% level of significance)
i.e. z = 2.576 (at 1% l.o.s) (Table value)
We know that sample size n can be obtained using the relation
n = 2z
d
where d X
n = 22.576 3.9 11.21 11
36 33
Example: Determine the sample size if the standard deviation of population is 12 and thestandard error (standard deviation of the sampling distribution) is 3.69.
Solution:
Given the standard deviation of population
= 12
LOVELY PROFESSIONAL UNIVERSITY 77
Unit 4: Sampling Design
NotesStandard error = X = 3.69
We know that
X = n
X2 = 2
n
n = 22
2
12X 3.69
n = 10.57 11
Example: Determine the sample size, if sample proportion p = 0.4 and standard error ofproportion is 0.043.
Solution:
Given that p = 0.4 1 q = 0.6 p = 0.043
We know that p = pqn
2p =
pqn
n = 2 2p
pq 0.4 0.6(0.043)
= 129.79 130
Example: Determine the sample size if the standard deviation of population is 8.66, samplemean is 45, population mean 43 and the desired degree of precision is 95%.
Solution:
Given that = 43, X 45
= 8.66 z = 5% l.o.s
z = 1.96
We know that sample size n can be obtained using the relation
n = 2z
d
where d = X
n =21.96 8.66 72.03 72
43 45
78 LOVELY PROFESSIONAL UNIVERSITY
Research Methodology
Notes Self Assessment
Fill in the blanks:
17. Greater the desired precision, __________will be the sample size
18. There is a trade off between the degree of confidence and the degree of ____________witha sample of fixed size.
4.7 Sampling Distribution
A sampling distribution is the probability distribution of a given statistic based on a randomsample of certain size n. It may be considered as the distribution of the statistic for all possiblesamples of a given size. The sampling distribution depends on the underlying distribution ofthe population, the statistic being considered, and the sample size used. The sampling distributionis frequently opposed to the asymptotic distribution, which corresponds to the limit case.
Example: Consider a normal population with mean and variance. Assume we repeatedlytake samples of a given size from this population and calculate the arithmetic mean for eachsample – this statistic is called the sample mean. Each sample will have its own average value,and the distribution of these averages will be called the "sampling distribution of the samplemean". This distribution will be normal N(m, s2/n) since the underlying population is normal.
The standard deviation of the sampling distribution of the statistic is referred to as the standarderror of that quantity. For the case where the statistic is the sample mean, the standard error is:
z n
where is the standard deviation of the population distribution of that quantity and n is the size(number of items) in the sample.
Self Assessment
Fill in the blanks:
19. Sampling distribution depends on the underlying distribution of the ...............................,the statistic being considered, and the sample size used.
20. The standard deviation of the sampling distribution of the statistic is referred to as the............................... of that quantity
4.8 Summary
Sample is a representative of population while Census represents cent percent ofpopulation.
The most important factors distinguishing whether to choose sample or census is cost andtime. There are seven steps involved in selecting the sample.
There are two types of sample, namely, Probability sampling and Non-probability sample.
Probability sampling includes random sampling, stratified random sampling systematicsampling, cluster sampling, Multistage sampling.
LOVELY PROFESSIONAL UNIVERSITY 79
Unit 4: Sampling Design
Notes Random sampling can be chosen by Lottery method or using random number table.
Samples can be chosen either with equal probability or varying probability.
Random sampling can be systematic or stratified.
In systematic random sampling, only the first number is randomly selected. Then byadding a constant "K" remaining numbers are generated.
In stratified sampling, random samples are drawn from several strata, which has more orless same characteristics.
In multistage sampling, sampling is drawn in several stages.
4.9 Keywords
Census: It refers to complete inclusion of all elements in the population. A sample is a sub-groupof the population.
Deliberate Sampling: The investigator uses his discretion in selecting sample observations fromthe universe. As a result, there is an element of bias in the selection.
Multistage Sampling: The name implies that sampling is done in several stages
Quota Sampling: Quota sampling is quite frequently used in marketing research. It involves thefixation of certain quotas, which are to be fulfilled by the interviewers.
Random Sampling: Simple random sample is a process in which every item of the populationhas an equal probability of being chosen.
Sample Frame: Sampling frame is the list of elements from which the sample is actually drawn.
Stratified Random Sampling: A probability sampling procedure in which simple random sub-samples are drawn from within different strata, that are, more or less equal on some characteristics.
4.10 Review Questions
1. What do you analyse as the advantages and disadvantages of probability sampling?
2. Which method of sampling would you use in studies, where the level of accuracy can varyfrom the prescribed norms and why?
3. Shopping Mall Intercept Sampling is not considered a scientific approach. Why?
4. Quota sampling does not require prior knowledge about the cell to which each populationunit belongs. Does this attribute serve as an advantage or disadvantage for QuotaSampling?
5. What suggestions would you give to reduce non sampling error?
6. One mobile phone user is asked to recruit another mobile phone user. What samplingmethod is this known as and why?
7. Sampling is a part of the population. True/False? Why/why not?
8. Determine the sample size if the standard deviation of population is 20 and the standarderror is 4.1.
9. What do see as the reason behind purposive sampling being known as judgementsampling?
80 LOVELY PROFESSIONAL UNIVERSITY
Research Methodology
Notes 10. Suppose, the population consists of 45,000 households, divided into five (5) strata on thebasis of monthly income. This can be illustrating as below:
0 - 1000
1001 - 5000
5001 - 7500
7501 - 10,000
Above 10,000
Then
(a) Find out the number of units from each strata if the sample constitutes 1% of thepopulation.
(b) If selection is for 150 items selecting equally from each strata, find out the number ofsample units from each strata.
Answers: Self Assessment
1. target 2. frame
3. large, homogeneous 4. small
5. target 6. resources
7. probability, non-probability 8. two
9. Equal Probability 10. Varying Probability
11. same 12. disorganized
13. Experienced 14. sample size
15. sampling frame 16. non response
17. larger 18. precision
19. population 20. standard error
4.11 Further Readings
Books Cooper and Schinder, Business Research Methods, TMH.
CR Kotari, Research Methodology, Vishwa Prakashan.
David Luck and Ronald Rubin, Marketing Research, PHI.
Naresh Amphora, Marketing Research, Pearson Education.
S.N. Murthy & U. Bhojanna, Business Research Methods, 3rd Edition, Excel Books.
William Zikmund, Business Research Methods, Thomson.
LOVELY PROFESSIONAL UNIVERSITY 81
Unit 5: Measurement and Scaling Techniques
NotesUnit 5: Measurement and Scaling Techniques
CONTENTS
Objectives
Introduction
5.1 Measurement Scales: Tools of Sound Measurement
5.1.1 Nominal Scale
5.1.2 Ordinal Scale (Ranking Scale)
5.1.3 Interval Scale
5.1.4 Ratio Scale
5.2 Techniques of Developing Measurement Tools
5.3 Scaling – Meaning
5.4 Comparative and Non-comparative Scaling Techniques
5.4.1 Comparative Scaling Techniques
5.4.2 Non-comparative Scale
5.5 Criteria for the Good Test
5.5.1 Reliability Analysis
5.5.2 Validity Analysis
5.6 Summary
5.7 Keywords
5.8 Review Questions
5.9 Further Readings
Objectives
After studying this unit, you will be able to:
Recognize the tools of sound measurement
Explain the techniques of developing measurement tools
Describe the meaning and techniques of scaling
Differentiate among Comparative and non-comparative scales
Describe the Multi-dimensional scaling techniques
Introduction
Measurement is assigning numbers or other symbols to characteristics of objects being measured,according to predetermined rules. Concept (or Construct) is a generalized idea about a class ofobjects, attributes, occurrences, or processes.
Relatively concrete constructs comprises of aspects such as Age, gender, number of children,education, income. Relatively abstract constructs take into accounts the aspects such as Brandloyalty, personality, channel power, satisfaction.
82 LOVELY PROFESSIONAL UNIVERSITY
Research Methodology
Notes Scaling is the generation of a continuum upon which measured objects are located.
Scale is a quantifying measure – a combination of items that is progressively arranged accordingto value or magnitude. The purpose is to quantitatively represent an item's, person's, or event'splace in the scaling continuum.
5.1 Measurement Scales: Tools of Sound Measurement
These are of four kinds of scales, namely:
1. Nominal scale
2. Ordinal scale
3. Interval scale
4. Ratio scale
5.1.1 Nominal Scale
In this scale, numbers are used to identify the objects. For example, University Registrationnumbers assigned to students, numbers on their jerseys.
The purpose of marking numbers, symbols, labels etc. in this type of scaling is not to establishan order but it is to simply put labels in order to identify events and count the objects andsubjects. This measurement scale is used to classify individuals, companies, products, brands orother entities into categories where no order is implied. Indeed, it is often referred to as acategorical scale. It is a system of classification and does not place the entity along a continuum.It involves a simple count of the frequency of the cases assigned to the various categories, and ifdesired numbers can be nominally assigned to label each category.
Characteristics
1. It has no arithmetic origin.
2. It shows no order or distance relationship.
3. It distinguishes things by putting them into various groups.
Use: This scale is generally used in conducting in surveys and ex-post-facto research.
Example: Have you ever visited Bangalore?
Yes-1
No-2
'Yes' is coded as 'One' and 'No' is coded as 'Two'. The numeric attached to the answers has nomeaning, and is a mere identification. If numbers are interchanged as one for 'No' and two for'Yes', it won't affect the answers given by respondents. The numbers used in nominal scalesserve only the purpose of counting.
The telephone numbers are an example of nominal scale, where one number is assigned to onesubscriber. The idea of using nominal scale is to make sure that no two persons or objects receivethe same number. Similarly, bus route numbers are the example of nominal scale.
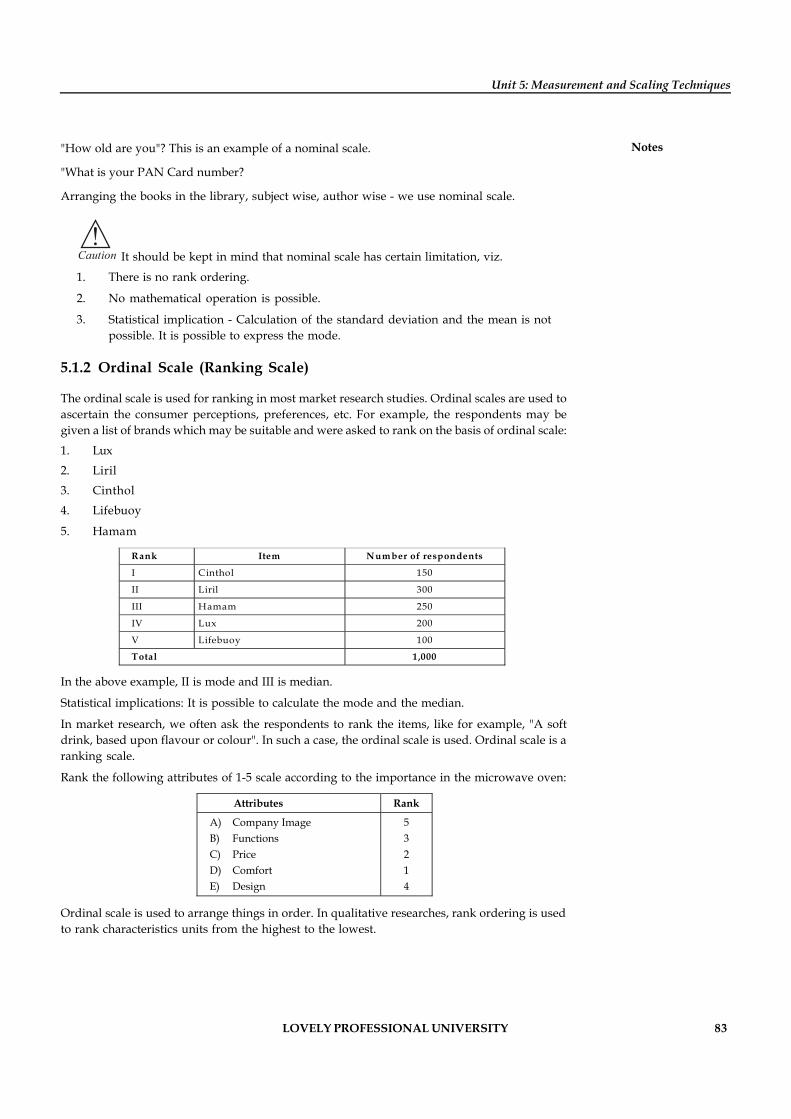
LOVELY PROFESSIONAL UNIVERSITY 83
Unit 5: Measurement and Scaling Techniques
Notes"How old are you"? This is an example of a nominal scale.
"What is your PAN Card number?
Arranging the books in the library, subject wise, author wise - we use nominal scale.
!Caution It should be kept in mind that nominal scale has certain limitation, viz.
1. There is no rank ordering.
2. No mathematical operation is possible.
3. Statistical implication - Calculation of the standard deviation and the mean is notpossible. It is possible to express the mode.
5.1.2 Ordinal Scale (Ranking Scale)
The ordinal scale is used for ranking in most market research studies. Ordinal scales are used toascertain the consumer perceptions, preferences, etc. For example, the respondents may begiven a list of brands which may be suitable and were asked to rank on the basis of ordinal scale:
1. Lux2. Liril3. Cinthol4. Lifebuoy
5. Hamam
Rank Item N umber of respondents
I Cinthol 150
II Liril 300
III Hamam 250
IV Lux 200
V Lifebuoy 100
Total 1,000
In the above example, II is mode and III is median.
Statistical implications: It is possible to calculate the mode and the median.
In market research, we often ask the respondents to rank the items, like for example, "A softdrink, based upon flavour or colour". In such a case, the ordinal scale is used. Ordinal scale is aranking scale.
Rank the following attributes of 1-5 scale according to the importance in the microwave oven:
Attributes Rank
A) Company Image B) Functions C) Price D) Comfort E) Design
5 3 2 1 4
Ordinal scale is used to arrange things in order. In qualitative researches, rank ordering is usedto rank characteristics units from the highest to the lowest.
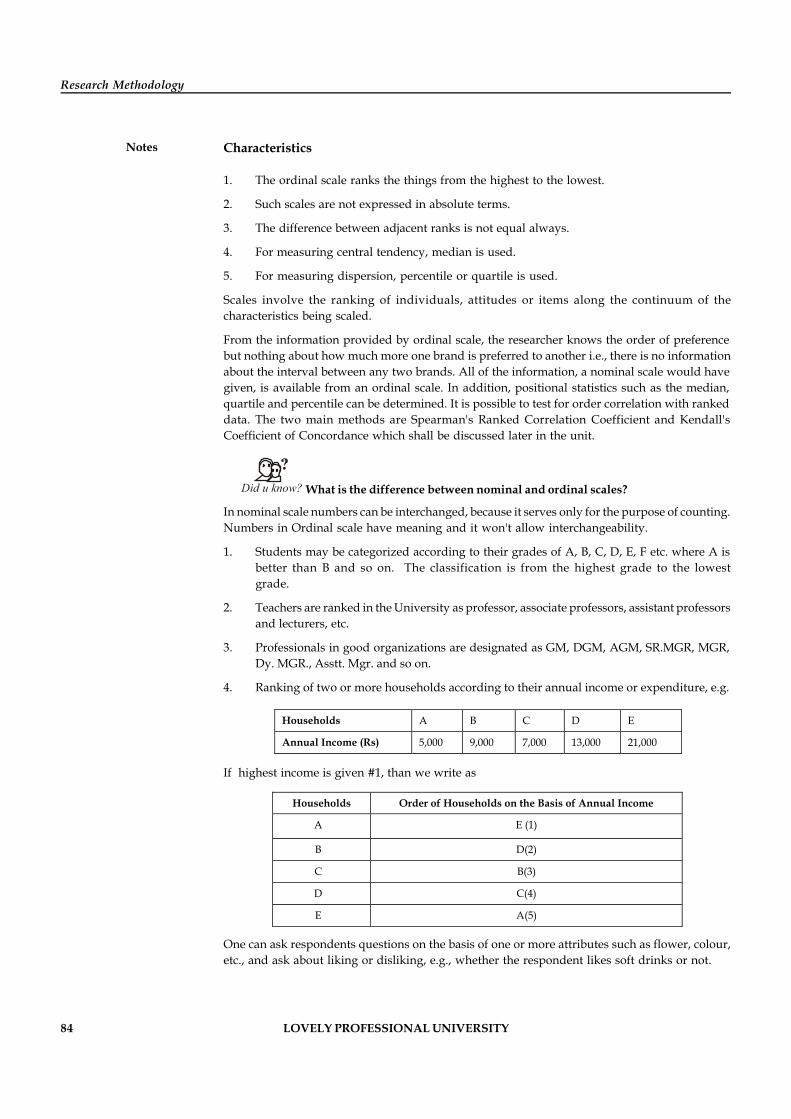
84 LOVELY PROFESSIONAL UNIVERSITY
Research Methodology
Notes Characteristics
1. The ordinal scale ranks the things from the highest to the lowest.
2. Such scales are not expressed in absolute terms.
3. The difference between adjacent ranks is not equal always.
4. For measuring central tendency, median is used.
5. For measuring dispersion, percentile or quartile is used.
Scales involve the ranking of individuals, attitudes or items along the continuum of thecharacteristics being scaled.
From the information provided by ordinal scale, the researcher knows the order of preferencebut nothing about how much more one brand is preferred to another i.e., there is no informationabout the interval between any two brands. All of the information, a nominal scale would havegiven, is available from an ordinal scale. In addition, positional statistics such as the median,quartile and percentile can be determined. It is possible to test for order correlation with rankeddata. The two main methods are Spearman's Ranked Correlation Coefficient and Kendall'sCoefficient of Concordance which shall be discussed later in the unit.
Did u know? What is the difference between nominal and ordinal scales?
In nominal scale numbers can be interchanged, because it serves only for the purpose of counting.Numbers in Ordinal scale have meaning and it won't allow interchangeability.
1. Students may be categorized according to their grades of A, B, C, D, E, F etc. where A isbetter than B and so on. The classification is from the highest grade to the lowestgrade.
2. Teachers are ranked in the University as professor, associate professors, assistant professorsand lecturers, etc.
3. Professionals in good organizations are designated as GM, DGM, AGM, SR.MGR, MGR,Dy. MGR., Asstt. Mgr. and so on.
4. Ranking of two or more households according to their annual income or expenditure, e.g.
Households A B C D E
Annual Income (Rs) 5,000 9,000 7,000 13,000 21,000
If highest income is given #1, than we write as
Households Order of Households on the Basis of Annual Income
A E (1)
B D(2)
C B(3)
D C(4)
E A(5)
One can ask respondents questions on the basis of one or more attributes such as flower, colour,etc., and ask about liking or disliking, e.g., whether the respondent likes soft drinks or not.
LOVELY PROFESSIONAL UNIVERSITY 85
Unit 5: Measurement and Scaling Techniques
NotesI strongly like it +2
I like it +1
I am indifferent 0
I dislike it -1
I strongly dislike it -2
In this manner, ranking can be obtained by asking the respondent their level of acceptability.One can then combine the individual ranking and get a collective ranking of the group.
Interval scale uses the principle of "equality of interval" i.e., the intervals are used as the basis formaking the units equal assuming that intervals are equal.
It is only with an interval scaled data that researchers can justify the use of the arithmetic meanas the measure of average. The interval or cardinal scale has equal units of measurement thus,making it possible to interpret not only the order of scale scores but also the distance betweenthem. However, it must be recognized that the zero point on an interval scale is arbitrary and isnot a true zero. This, of course, has implications for the type of data manipulation and analysiswe can carry out on data collected in this form. It is possible to add or subtract a constant to allof the scale values without affecting the form of the scale but one cannot multiply or divide thevalues. It can be said that two respondents with scale positions 1 and 2 are as far apart as tworespondents with scale positions 4 and 5, but not that a person with score 10 feels twice asstrongly as one with score 5. Temperature is interval scaled, being measured either in Centigradeor Fahrenheit. We cannot speak of 50°F being twice as hot as 25°F since the correspondingtemperatures on the centigrade scale, 100°C and -3.9°C, are not in the ratio 2:1.
Interval scales may be either numeric or semantic.
Characteristics
1. Interval scales have no absolute zero. It is set arbitrarily.
2. For measuring central tendency, mean is used.
3. For measuring dispersion, standard deviation is used.
4. For test of significance, t-test and f-test are used.
5. Scale is based on the equality of intervals.
Use: Most of the common statistical methods of analysis require only interval scales in orderthat they might be used. These are not recounted here because they are so common and can befound in virtually all basic texts on statistics.
5.1.3 Interval Scale
Interval scale is more powerful than the nominal and ordinal scales. The distance given on thescale represents equal distance on the property being measured. Interval scale may tell us "Howfar the objects are apart with respect to an attribute?" This means that the difference can becompared. The difference between "1" and "2" is equal to the difference between "2" and "3".
Interval scale uses the principle of "equality of interval" i.e., the intervals are used as the basis formaking the units equal assuming that intervals are equal.
It is only with an interval scaled data that researchers can justify the use of the arithmetic meanas the measure of average. The interval or cardinal scale has equal units of measurement thus,making it possible to interpret not only the order of scale scores but also the distance between
86 LOVELY PROFESSIONAL UNIVERSITY
Research Methodology
Notes them. However, it must be recognized that the zero point on an interval scale is arbitrary and isnot a true zero. This, of course, has implications for the type of data manipulation and analysiswe can carry out on data collected in this form. It is possible to add or subtract a constant to allof the scale values without affecting the form of the scale but one cannot multiply or divide thevalues. It can be said that two respondents with scale positions 1 and 2 are as far apart as tworespondents with scale positions 4 and 5, but not that a person with score 10 feels twice asstrongly as one with score 5. Temperature is interval scaled, being measured either in Centigradeor Fahrenheit. We cannot speak of 50°F being twice as hot as 25°F since the correspondingtemperatures on the centigrade scale, 100°C and -3.9°C, are not in the ratio 2:1.
Interval scales may be either numeric or semantic.
Characteristics
1. Interval scales have no absolute zero. It is set arbitrarily.
2. For measuring central tendency, mean is used.
3. For measuring dispersion, standard deviation is used.
4. For test of significance, t-test and f-test are used.
5. Scale is based on the equality of intervals.
Use: Most of the common statistical methods of analysis require only interval scales in orderthat they might be used. These are not recounted here because they are so common and can befound in virtually all basic texts on statistics.
Example:
1. Suppose we want to measure the rating of a refrigerator using interval scale. It will appearas follows:
(a) Brand name Poor …………………… Good
(b) Price High …………………….. Low
(c) Service after-sales Poor …………………… Good
(d) Utility Poor …………………….Good
The researcher cannot conclude that the respondent who gives a rating of 6 is 3 times morefavourable towards a product under study than another respondent who awards the ratingof 2.
2. How many hours you spend to do class assignment every day?
(a) < 30 min.
(b) 30 min. to 1 hr.
(c) 1 hr. to 1½ hrs.
(d) > 1½ hrs.
Statistical implications: We can compute the range, mean, median, etc.
Task Analyse the difference between interval and ordinal scales.
LOVELY PROFESSIONAL UNIVERSITY 87
Unit 5: Measurement and Scaling Techniques
Notes5.1.4 Ratio Scale
Ratio scale is a special kind of internal scale that has a meaningful zero point. With this scale,length, weight or distance can be measured. In this scale, it is possible to say, how many timesgreater or smaller one object is being compared to the other.
These scales are used to measure actual variables. The highest level of measurement is a ratioscale. This has the properties of an interval scale together with a fixed origin or zero point.Examples of variables which are ratio scaled include weights, lengths and times. Ratio scalespermit the researcher to compare both differences in scores and in the relative magnitude ofscores. For instance, the difference between 5 and 10 minutes is the same as that between 10 and15 minutes, and 10 minutes is twice as long as 5 minutes.
Given that sociological and management research seldom aspires beyond the interval level ofmeasurement, it is not proposed that particular attention be given to this level of analysis.Suffice it, to say that virtually all statistical operations can be performed on ratio scales.
Characteristics
1. This scale has an absolute zero measurement.
2. For measuring central tendency, geometric and harmonic means are used.
Use: Ratio scale can be used in all statistical techniques.
Example: Sales this year for product A are twice the sales of the same product last year.
Statistical implications: All statistical operations can be performed on this scale.
Self Assessment
Fill in the blanks:
1. ....................... scale may tell us "How far the objects are apart with respect to an attribute?"
2. Ratio scale is a special kind of internal scale that has a meaningful .................................
5.2 Techniques of Developing Measurement Tools
The scale construction techniques are used for measuring the attitude of a group or an individual.In other words, scale construction technique helps in estimate the interest or behaviour of anindividual or a group towards others or another's environment rather than oneself. Whileperforming a scale construction technique, you need to consider various decisions related to theattitude of the individual or group. A few of these decisions are:
Determining the level of the involved data; identifying whether it is nominal, ordinal,interval or ratio.
Identifying the useful statistical analysis for the scale construction.
Identifying the scale construction technique to be used.
Selecting the physical layout of the scales.
Determining the scale categories that need to be used.
There are two primary scale construction techniques, comparative and non-comparative. Thecomparative technique is used to determine the scale values of multiple items by performing
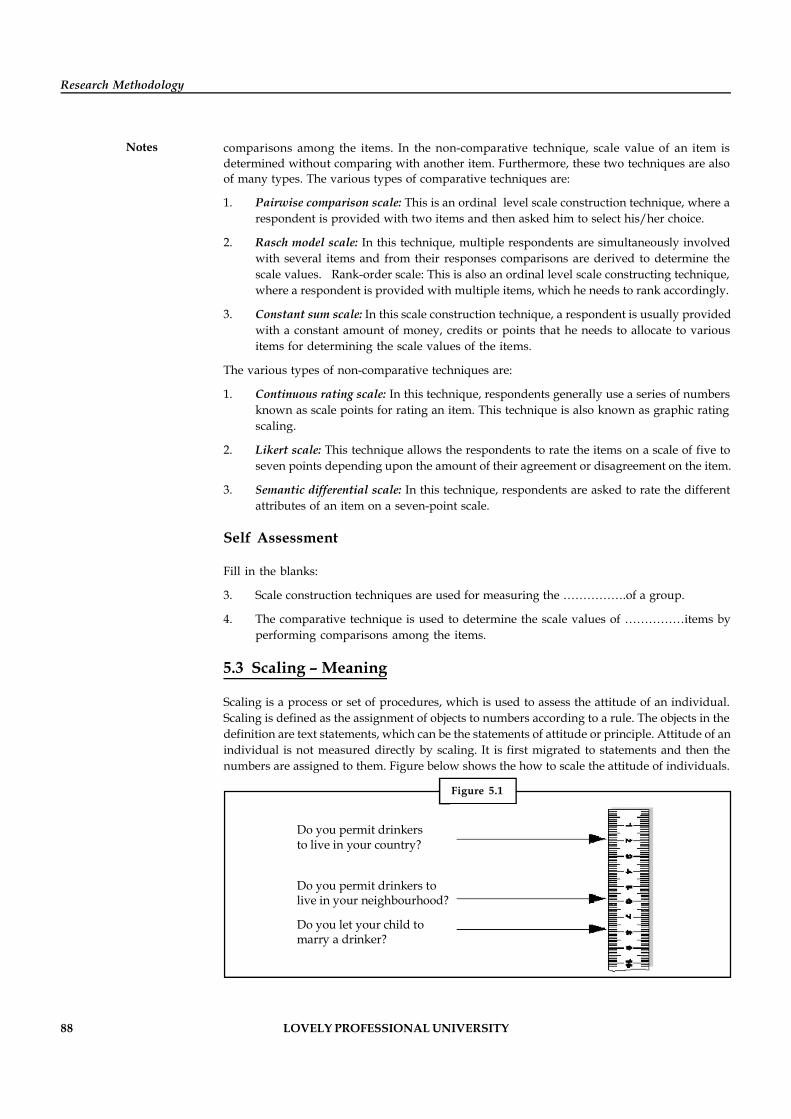
88 LOVELY PROFESSIONAL UNIVERSITY
Research Methodology
Notes comparisons among the items. In the non-comparative technique, scale value of an item isdetermined without comparing with another item. Furthermore, these two techniques are alsoof many types. The various types of comparative techniques are:
1. Pairwise comparison scale: This is an ordinal level scale construction technique, where arespondent is provided with two items and then asked him to select his/her choice.
2. Rasch model scale: In this technique, multiple respondents are simultaneously involvedwith several items and from their responses comparisons are derived to determine thescale values. Rank-order scale: This is also an ordinal level scale constructing technique,where a respondent is provided with multiple items, which he needs to rank accordingly.
3. Constant sum scale: In this scale construction technique, a respondent is usually providedwith a constant amount of money, credits or points that he needs to allocate to variousitems for determining the scale values of the items.
The various types of non-comparative techniques are:
1. Continuous rating scale: In this technique, respondents generally use a series of numbersknown as scale points for rating an item. This technique is also known as graphic ratingscaling.
2. Likert scale: This technique allows the respondents to rate the items on a scale of five toseven points depending upon the amount of their agreement or disagreement on the item.
3. Semantic differential scale: In this technique, respondents are asked to rate the differentattributes of an item on a seven-point scale.
Self Assessment
Fill in the blanks:
3. Scale construction techniques are used for measuring the …………….of a group.
4. The comparative technique is used to determine the scale values of ……………items byperforming comparisons among the items.
5.3 Scaling – Meaning
Scaling is a process or set of procedures, which is used to assess the attitude of an individual.Scaling is defined as the assignment of objects to numbers according to a rule. The objects in thedefinition are text statements, which can be the statements of attitude or principle. Attitude of anindividual is not measured directly by scaling. It is first migrated to statements and then thenumbers are assigned to them. Figure below shows the how to scale the attitude of individuals.
Figure 5.1
Do you permit drinkersto live in your country?
Do you permit drinkers to live in your neighbourhood?
Do you let your child tomarry a drinker?
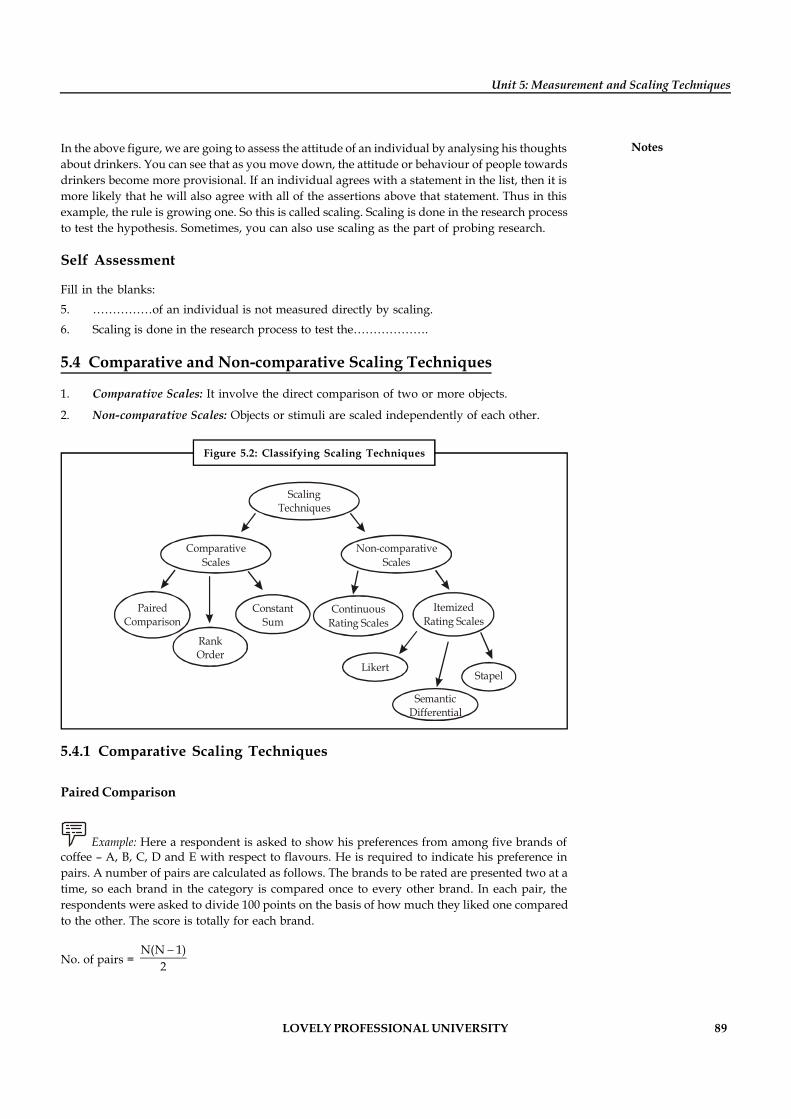
LOVELY PROFESSIONAL UNIVERSITY 89
Unit 5: Measurement and Scaling Techniques
NotesIn the above figure, we are going to assess the attitude of an individual by analysing his thoughtsabout drinkers. You can see that as you move down, the attitude or behaviour of people towardsdrinkers become more provisional. If an individual agrees with a statement in the list, then it ismore likely that he will also agree with all of the assertions above that statement. Thus in thisexample, the rule is growing one. So this is called scaling. Scaling is done in the research processto test the hypothesis. Sometimes, you can also use scaling as the part of probing research.
Self Assessment
Fill in the blanks:5. ……………of an individual is not measured directly by scaling.6. Scaling is done in the research process to test the……………….
5.4 Comparative and Non-comparative Scaling Techniques
1. Comparative Scales: It involve the direct comparison of two or more objects.
2. Non-comparative Scales: Objects or stimuli are scaled independently of each other.
Figure 5.2: Classifying Scaling Techniques
ScalingTechniques
ComparativeScales
Non-comparativeScales
PairedComparison
RankOrder
ConstantSum
ContinuousRating Scales
ItemizedRating Scales
Stapel
SemanticDifferential
Likert
5.4.1 Comparative Scaling Techniques
Paired Comparison
Example: Here a respondent is asked to show his preferences from among five brands ofcoffee – A, B, C, D and E with respect to flavours. He is required to indicate his preference inpairs. A number of pairs are calculated as follows. The brands to be rated are presented two at atime, so each brand in the category is compared once to every other brand. In each pair, therespondents were asked to divide 100 points on the basis of how much they liked one comparedto the other. The score is totally for each brand.
No. of pairs = N(N 1)
2
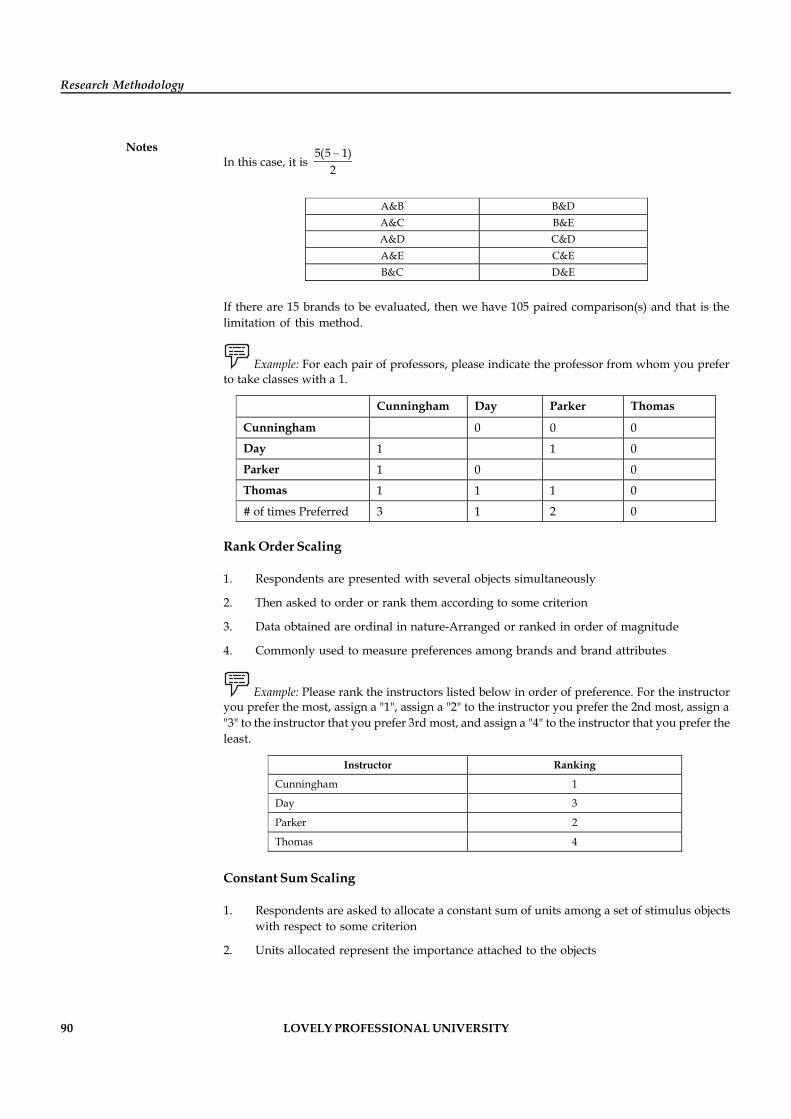
90 LOVELY PROFESSIONAL UNIVERSITY
Research Methodology
NotesIn this case, it is
5(5 1)2
A&B B&D A&C B&E A&D C&D A&E C&E B&C D&E
If there are 15 brands to be evaluated, then we have 105 paired comparison(s) and that is thelimitation of this method.
Example: For each pair of professors, please indicate the professor from whom you preferto take classes with a 1.
Cunningham Day Parker Thomas
Cunningham 0 0 0
Day 1 1 0
Parker 1 0 0
Thomas 1 1 1 0
# of times Preferred 3 1 2 0
Rank Order Scaling
1. Respondents are presented with several objects simultaneously
2. Then asked to order or rank them according to some criterion
3. Data obtained are ordinal in nature-Arranged or ranked in order of magnitude
4. Commonly used to measure preferences among brands and brand attributes
Example: Please rank the instructors listed below in order of preference. For the instructoryou prefer the most, assign a "1", assign a "2" to the instructor you prefer the 2nd most, assign a"3" to the instructor that you prefer 3rd most, and assign a "4" to the instructor that you prefer theleast.
Instructor Ranking
Cunningham 1
Day 3
Parker 2
Thomas 4
Constant Sum Scaling
1. Respondents are asked to allocate a constant sum of units among a set of stimulus objectswith respect to some criterion
2. Units allocated represent the importance attached to the objects
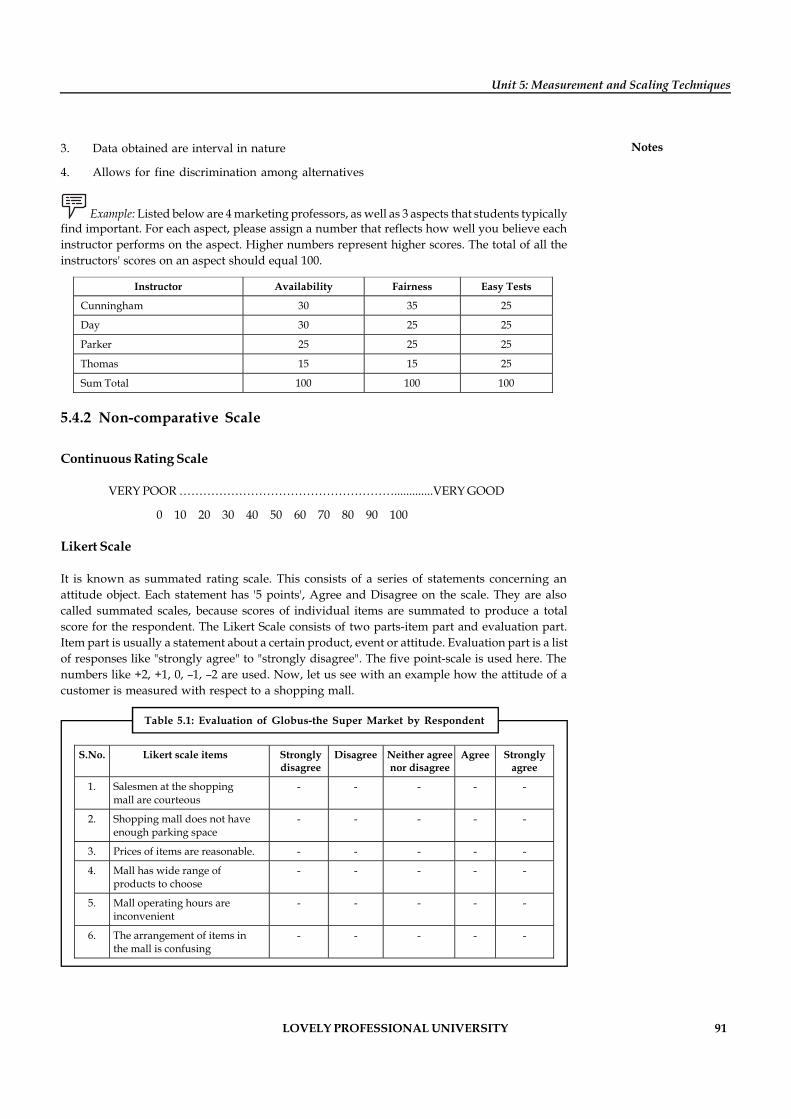
LOVELY PROFESSIONAL UNIVERSITY 91
Unit 5: Measurement and Scaling Techniques
Notes3. Data obtained are interval in nature
4. Allows for fine discrimination among alternatives
Example: Listed below are 4 marketing professors, as well as 3 aspects that students typicallyfind important. For each aspect, please assign a number that reflects how well you believe eachinstructor performs on the aspect. Higher numbers represent higher scores. The total of all theinstructors' scores on an aspect should equal 100.
Instructor Availability Fairness Easy Tests
Cunningham 30 35 25
Day 30 25 25
Parker 25 25 25
Thomas 15 15 25
Sum Total 100 100 100
5.4.2 Non-comparative Scale
Continuous Rating Scale
VERY POOR ……………………………………………….............VERY GOOD
0 10 20 30 40 50 60 70 80 90 100
Likert Scale
It is known as summated rating scale. This consists of a series of statements concerning anattitude object. Each statement has '5 points', Agree and Disagree on the scale. They are alsocalled summated scales, because scores of individual items are summated to produce a totalscore for the respondent. The Likert Scale consists of two parts-item part and evaluation part.Item part is usually a statement about a certain product, event or attitude. Evaluation part is a listof responses like "strongly agree" to "strongly disagree". The five point-scale is used here. Thenumbers like +2, +1, 0, –1, –2 are used. Now, let us see with an example how the attitude of acustomer is measured with respect to a shopping mall.
Table 5.1: Evaluation of Globus-the Super Market by Respondent
S.No. Likert scale items Strongly disagree
Disagree Neither agree nor disagree
Agree Strongly agree
1. Salesmen at the shopping mall are courteous
- - - - -
2. Shopping mall does not have enough parking space
- - - - -
3. Prices of items are reasonable. - - - - -
4. Mall has wide range of products to choose
- - - - -
5. Mall operating hours are inconvenient
- - - - -
6. The arrangement of items in the mall is confusing
- - - - -
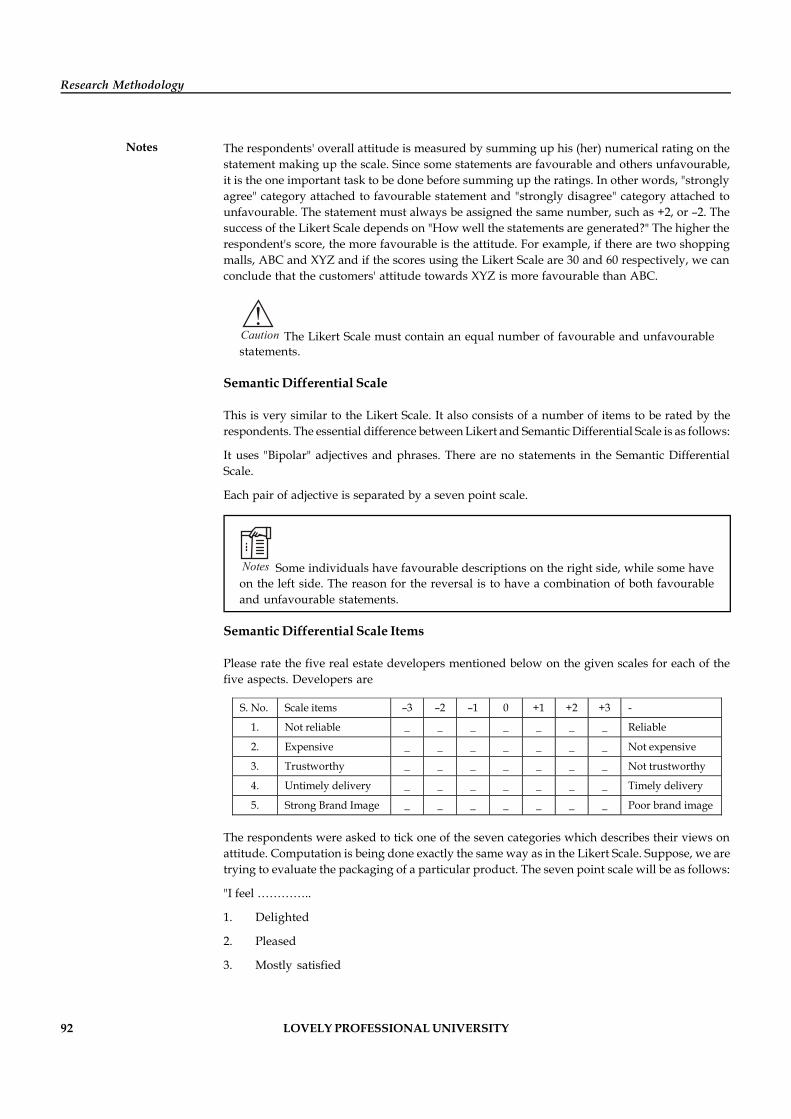
92 LOVELY PROFESSIONAL UNIVERSITY
Research Methodology
Notes The respondents' overall attitude is measured by summing up his (her) numerical rating on thestatement making up the scale. Since some statements are favourable and others unfavourable,it is the one important task to be done before summing up the ratings. In other words, "stronglyagree" category attached to favourable statement and "strongly disagree" category attached tounfavourable. The statement must always be assigned the same number, such as +2, or –2. Thesuccess of the Likert Scale depends on "How well the statements are generated?" The higher therespondent's score, the more favourable is the attitude. For example, if there are two shoppingmalls, ABC and XYZ and if the scores using the Likert Scale are 30 and 60 respectively, we canconclude that the customers' attitude towards XYZ is more favourable than ABC.
!Caution The Likert Scale must contain an equal number of favourable and unfavourablestatements.
Semantic Differential Scale
This is very similar to the Likert Scale. It also consists of a number of items to be rated by therespondents. The essential difference between Likert and Semantic Differential Scale is as follows:
It uses "Bipolar" adjectives and phrases. There are no statements in the Semantic DifferentialScale.
Each pair of adjective is separated by a seven point scale.
Notes Some individuals have favourable descriptions on the right side, while some haveon the left side. The reason for the reversal is to have a combination of both favourableand unfavourable statements.
Semantic Differential Scale Items
Please rate the five real estate developers mentioned below on the given scales for each of thefive aspects. Developers are
S. No. Scale items –3 –2 –1 0 +1 +2 +3 -
1. Not reliable _ _ _ _ _ _ _ Reliable
2. Expensive _ _ _ _ _ _ _ Not expensive
3. Trustworthy _ _ _ _ _ _ _ Not trustworthy
4. Untimely delivery _ _ _ _ _ _ _ Timely delivery
5. Strong Brand Image _ _ _ _ _ _ _ Poor brand image
The respondents were asked to tick one of the seven categories which describes their views onattitude. Computation is being done exactly the same way as in the Likert Scale. Suppose, we aretrying to evaluate the packaging of a particular product. The seven point scale will be as follows:
"I feel …………..
1. Delighted
2. Pleased
3. Mostly satisfied
LOVELY PROFESSIONAL UNIVERSITY 93
Unit 5: Measurement and Scaling Techniques
Notes4. Equally satisfied and dissatisfied
5. Mostly dissatisfied
6. Unhappy
7. Terrible.
Thurstone Scale
This is also known as an equal appearing interval scale. The following are the steps to constructa Thurstone Scale:
Step 1: To generate a large number of statements, relating to the attitude to be measured.
Step 2: These statements (75 to 100) are given to a group of judges, say 20 to 30, who were askedto classify them according to the degree of favourableness and unfavourableness.
Step 3: 11 piles are to be made by the judges. The piles vary from "most unfavourable" in pile 1to neutral in pile 6 and most favourable statement in pile 11.
Step 4: Study the frequency distribution of ratings for each statement and eliminate thosestatements, which different judges have given widely scattered ratings.
Step 5: Select one or two statements from each of the 11 piles for the final scale. List the selectedstatements in random order to form the scale.
Step 6: The respondents whose attitudes are to be scaled were given the list of statements andasked to indicate their agreement or disagreement with each statement. Some may agree withone statement while some may agree with more than one statement.
Example:
1. Crime and violence in movies:
(a) All movies with crime and violence should be prohibited by law.
(b) Watching crime and violence in movies is a waste of time.
(c) Most movies with crime are bad and harmful.
(d) The direction and theme in most crime movies are monotonous.
(e) Watching a movie with crime and violence does not interfere with my routine life.
(f) I have no opinion one way or the other, about watching movies with crime andviolence.
(g) I like to watch movies with crime and violence.
(h) Most movies with crime and violence are interesting and absorbing.
(i) Crime movies act as a knowledge bank gained by the audience.
(j) People learn "how to be safe and protect oneself" by seeing a movie on crime.
(k) Watching crime in a movie does not harm our life-style.
Conclusion: A respondent might agree with statements 8, 9 and 10. Such agreementrepresents a favourable attitude towards crime and violence. On the contrary, if items 1, 3,4 are chosen by respondents, it shows that respondents are unfavourably disposed towardscrime in movies. If the respondent chooses 1, 5 and 11, it could be interpreted to indicatethat s(he) is not consistent in his(her) attitude about the subject.
94 LOVELY PROFESSIONAL UNIVERSITY
Research Methodology
Notes 2. Suppose, we are interested in the attitude of certain socio-economic class of respondentstowards savings and investments. The final list of statements would be as follows:
(a) One should live for the present and not the future. So, savings are absolutely notrequired.
(b) There are many attractions to spend the money saved.
(c) It is better to spend savings than risk them in investments.
(d) Investments are unsafe as the money is also blocked.
(e) You earn to spend and not to invest.
(f) It is not possible to save these days.
(g) A certain amount of income should be saved and invested.
(h) The future is uncertain and investments will protect us.
(i) Some amount of savings and investments are a must for every individual.
(j) One should try to save more so that most of it could be invested.
(k) All savings should be invested for the future.
Conclusion: A respondent agreeing to statements 8, 9 and 11 would be considered having afavourable attitude towards savings and investments. The person agreeing with statements2, 3 and 4 is an individual with an unfavourable attitude. Also, if a respondent choosesstatements 1, 3, 7 or 9, his attitude is not considered consistent.
Multidimensional Scaling
This is used to study consumer attitudes, particularly with respect to perceptions and preferences.These techniques help identify the product attributes that are important to the customers and tomeasure their relative importance. Multi-Dimensional Scaling is useful in studying the following:
1. (a) What are the major attributes considered while choosing a product (soft drinks, modesof transportation)? (b) Which attributes do customers compare to evaluate different brandsof the product? Is it price, quality, availability etc.?
2. Which is the ideal combination of attributes according to the customer? (i.e., which two ormore attributes consumer will consider before deciding to buy.)
3. Which advertising messages are compatible with the consumer's brand perceptions?
Notes The multidimensional scaling is used to describe similarity and preference of brands.The respondents were asked to indicate their perception, or the similarity between variousobjects (products, brands, etc.) and preference among objects. This scaling is also known asperceptual mapping.
There are two ways of collecting the input data to plot perceptual mapping:
1. Non-attribute method: Here, the researcher asks the respondent to make a judgmentabout the objects directly. In this method, the criteria for comparing the objects is decidedby the respondent himself.
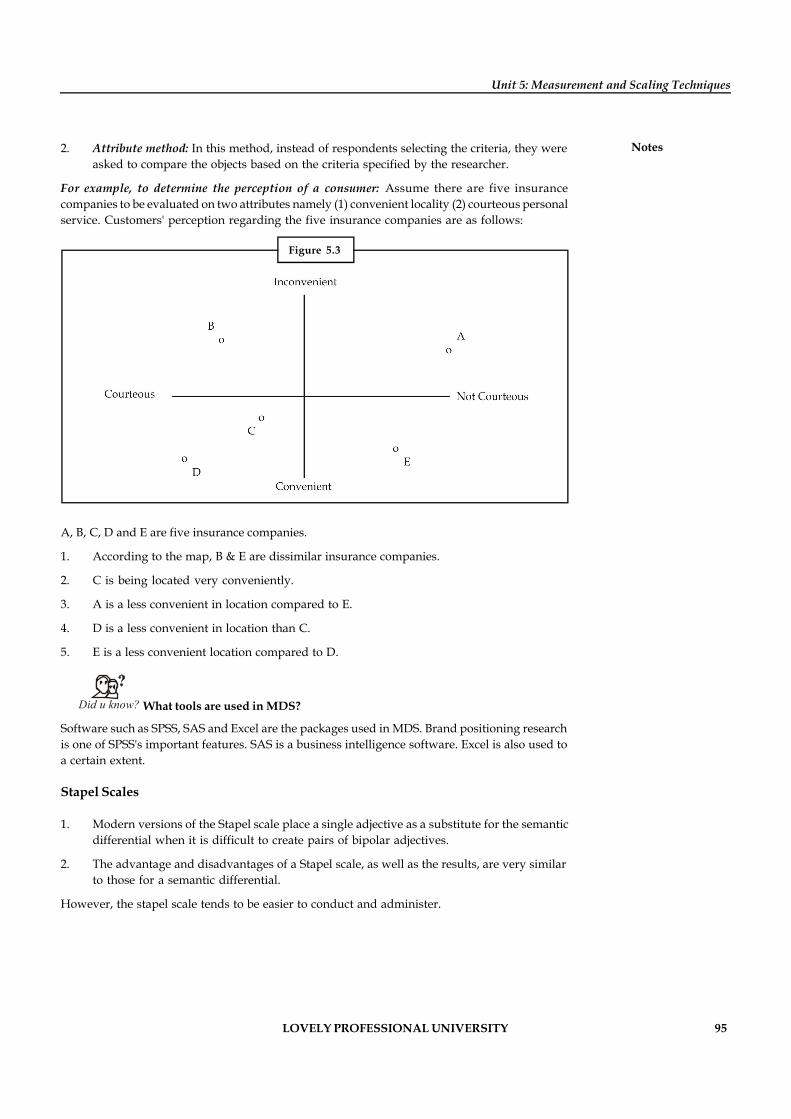
LOVELY PROFESSIONAL UNIVERSITY 95
Unit 5: Measurement and Scaling Techniques
Notes2. Attribute method: In this method, instead of respondents selecting the criteria, they wereasked to compare the objects based on the criteria specified by the researcher.
For example, to determine the perception of a consumer: Assume there are five insurancecompanies to be evaluated on two attributes namely (1) convenient locality (2) courteous personalservice. Customers' perception regarding the five insurance companies are as follows:
Figure 5.3
A, B, C, D and E are five insurance companies.
1. According to the map, B & E are dissimilar insurance companies.
2. C is being located very conveniently.
3. A is a less convenient in location compared to E.
4. D is a less convenient in location than C.
5. E is a less convenient location compared to D.
Did u know? What tools are used in MDS?
Software such as SPSS, SAS and Excel are the packages used in MDS. Brand positioning researchis one of SPSS's important features. SAS is a business intelligence software. Excel is also used toa certain extent.
Stapel Scales
1. Modern versions of the Stapel scale place a single adjective as a substitute for the semanticdifferential when it is difficult to create pairs of bipolar adjectives.
2. The advantage and disadvantages of a Stapel scale, as well as the results, are very similarto those for a semantic differential.
However, the stapel scale tends to be easier to conduct and administer.
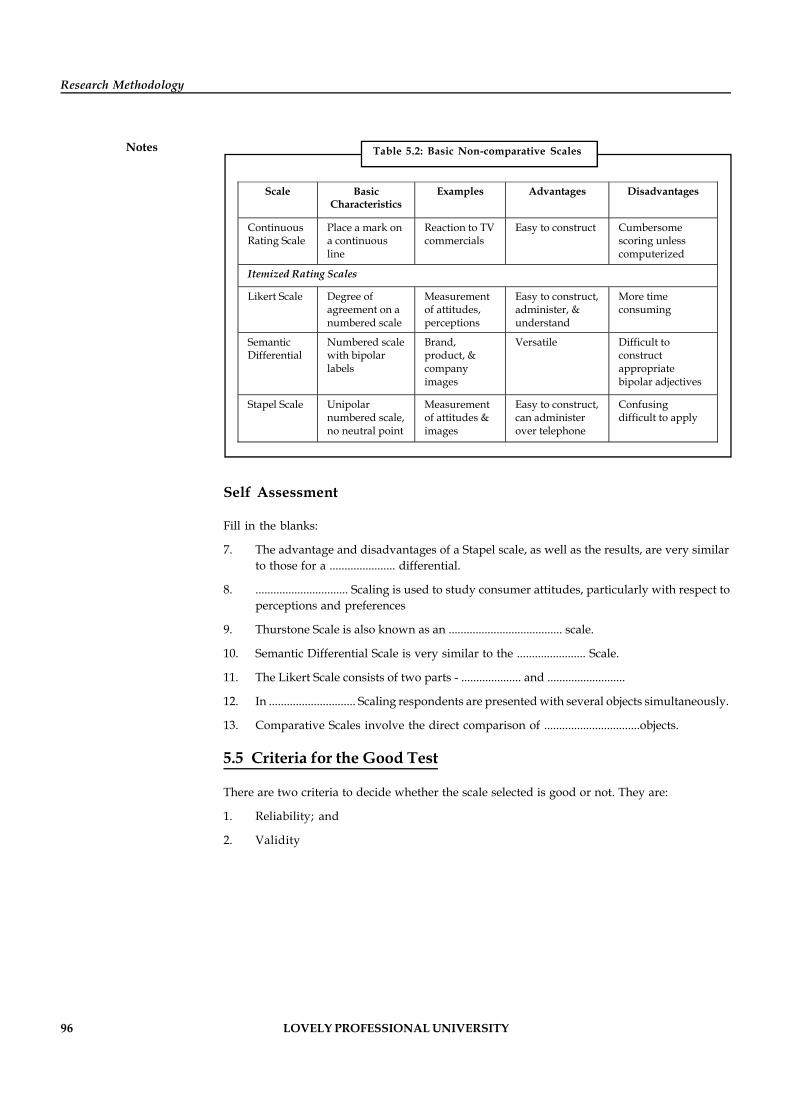
96 LOVELY PROFESSIONAL UNIVERSITY
Research Methodology
Notes Table 5.2: Basic Non-comparative Scales
Scale Basic Characteristics
Examples Advantages Disadvantages
Continuous Rating Scale
Place a mark on a continuous line
Reaction to TV commercials
Easy to construct Cumbersome scoring unless computerized
Itemized Rating Scales
Likert Scale Degree of agreement on a numbered scale
Measurement of attitudes, perceptions
Easy to construct, administer, & understand
More time consuming
Semantic Differential
Numbered scale with bipolar labels
Brand, product, & company images
Versatile Difficult to construct appropriate bipolar adjectives
Stapel Scale Unipolar numbered scale, no neutral point
Measurement of attitudes & images
Easy to construct, can administer over telephone
Confusing difficult to apply
Self Assessment
Fill in the blanks:
7. The advantage and disadvantages of a Stapel scale, as well as the results, are very similarto those for a ...................... differential.
8. ............................... Scaling is used to study consumer attitudes, particularly with respect toperceptions and preferences
9. Thurstone Scale is also known as an ...................................... scale.
10. Semantic Differential Scale is very similar to the ....................... Scale.
11. The Likert Scale consists of two parts - .................... and ..........................
12. In ............................. Scaling respondents are presented with several objects simultaneously.
13. Comparative Scales involve the direct comparison of ................................objects.
5.5 Criteria for the Good Test
There are two criteria to decide whether the scale selected is good or not. They are:
1. Reliability; and
2. Validity
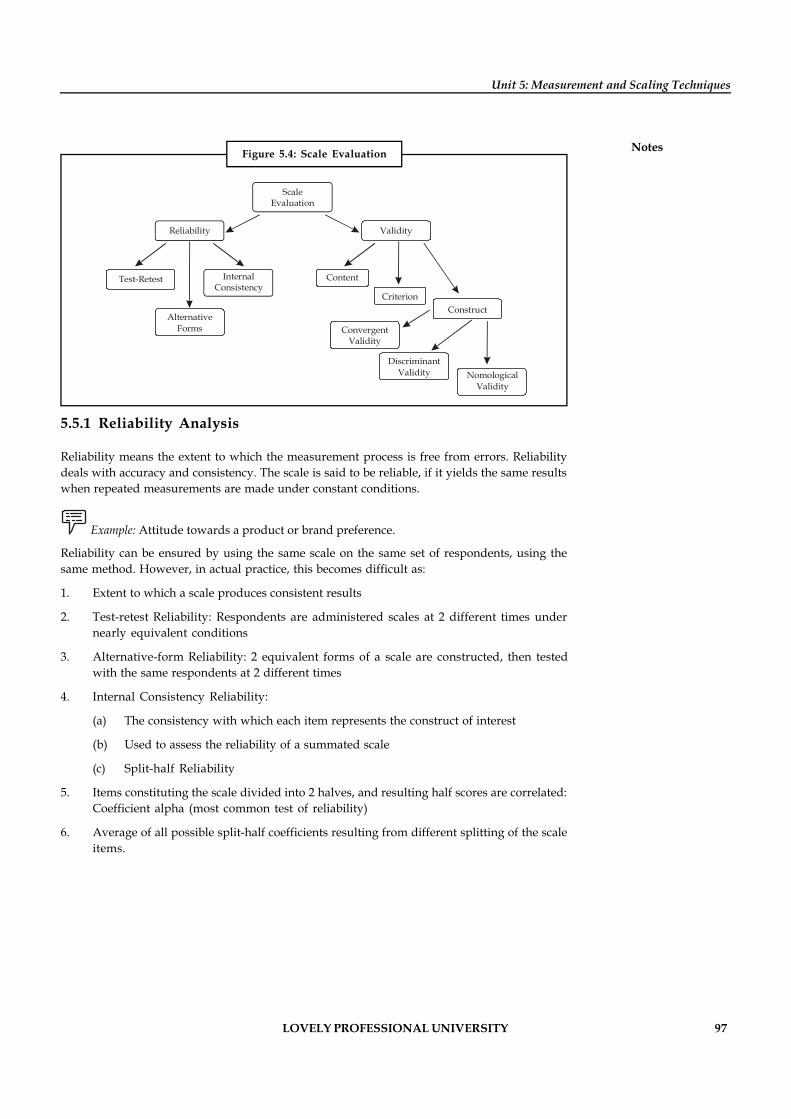
LOVELY PROFESSIONAL UNIVERSITY 97
Unit 5: Measurement and Scaling Techniques
NotesFigure 5.4: Scale Evaluation
ScaleEvaluation
Reliability Validity
Test-Retest InternalConsistency
AlternativeForms
Content
CriterionConstruct
ConvergentValidity
DiscriminantValidity Nomological
Validity
5.5.1 Reliability Analysis
Reliability means the extent to which the measurement process is free from errors. Reliabilitydeals with accuracy and consistency. The scale is said to be reliable, if it yields the same resultswhen repeated measurements are made under constant conditions.
Example: Attitude towards a product or brand preference.
Reliability can be ensured by using the same scale on the same set of respondents, using thesame method. However, in actual practice, this becomes difficult as:
1. Extent to which a scale produces consistent results
2. Test-retest Reliability: Respondents are administered scales at 2 different times undernearly equivalent conditions
3. Alternative-form Reliability: 2 equivalent forms of a scale are constructed, then testedwith the same respondents at 2 different times
4. Internal Consistency Reliability:
(a) The consistency with which each item represents the construct of interest
(b) Used to assess the reliability of a summated scale
(c) Split-half Reliability
5. Items constituting the scale divided into 2 halves, and resulting half scores are correlated:Coefficient alpha (most common test of reliability)
6. Average of all possible split-half coefficients resulting from different splitting of the scaleitems.
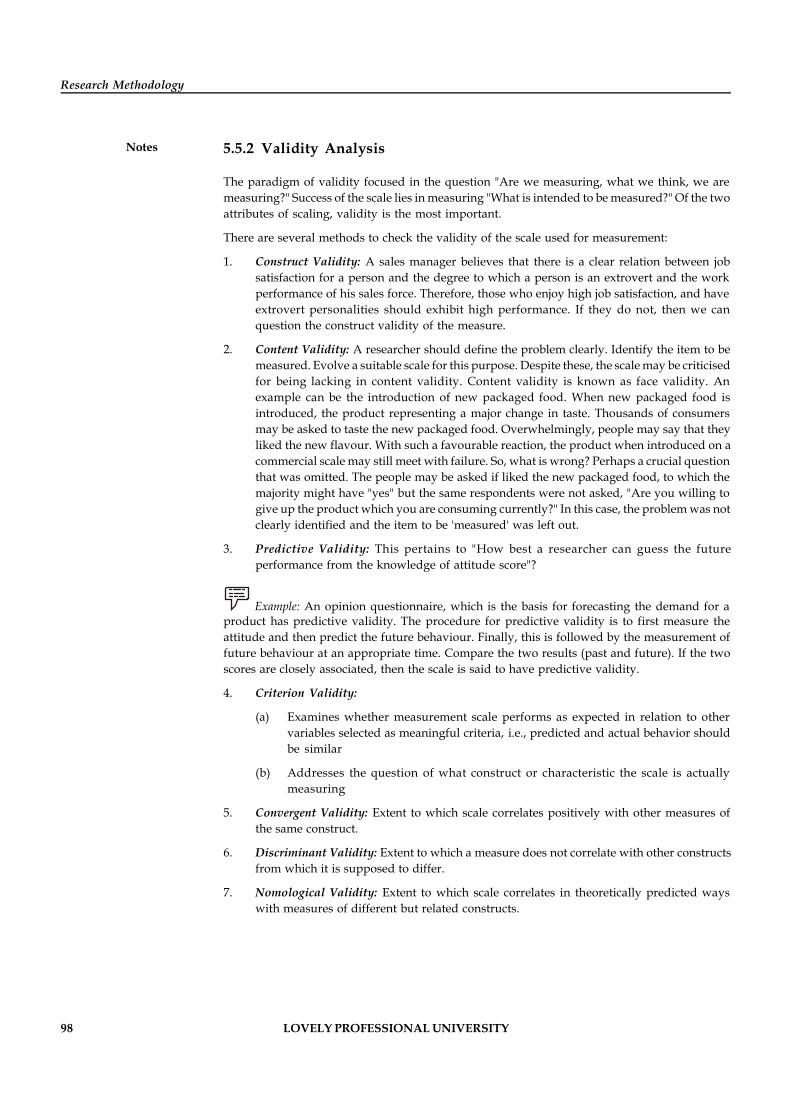
98 LOVELY PROFESSIONAL UNIVERSITY
Research Methodology
Notes 5.5.2 Validity Analysis
The paradigm of validity focused in the question "Are we measuring, what we think, we aremeasuring?" Success of the scale lies in measuring "What is intended to be measured?" Of the twoattributes of scaling, validity is the most important.
There are several methods to check the validity of the scale used for measurement:
1. Construct Validity: A sales manager believes that there is a clear relation between jobsatisfaction for a person and the degree to which a person is an extrovert and the workperformance of his sales force. Therefore, those who enjoy high job satisfaction, and haveextrovert personalities should exhibit high performance. If they do not, then we canquestion the construct validity of the measure.
2. Content Validity: A researcher should define the problem clearly. Identify the item to bemeasured. Evolve a suitable scale for this purpose. Despite these, the scale may be criticisedfor being lacking in content validity. Content validity is known as face validity. Anexample can be the introduction of new packaged food. When new packaged food isintroduced, the product representing a major change in taste. Thousands of consumersmay be asked to taste the new packaged food. Overwhelmingly, people may say that theyliked the new flavour. With such a favourable reaction, the product when introduced on acommercial scale may still meet with failure. So, what is wrong? Perhaps a crucial questionthat was omitted. The people may be asked if liked the new packaged food, to which themajority might have "yes" but the same respondents were not asked, "Are you willing togive up the product which you are consuming currently?" In this case, the problem was notclearly identified and the item to be 'measured' was left out.
3. Predictive Validity: This pertains to "How best a researcher can guess the futureperformance from the knowledge of attitude score"?
Example: An opinion questionnaire, which is the basis for forecasting the demand for aproduct has predictive validity. The procedure for predictive validity is to first measure theattitude and then predict the future behaviour. Finally, this is followed by the measurement offuture behaviour at an appropriate time. Compare the two results (past and future). If the twoscores are closely associated, then the scale is said to have predictive validity.
4. Criterion Validity:
(a) Examines whether measurement scale performs as expected in relation to othervariables selected as meaningful criteria, i.e., predicted and actual behavior shouldbe similar
(b) Addresses the question of what construct or characteristic the scale is actuallymeasuring
5. Convergent Validity: Extent to which scale correlates positively with other measures ofthe same construct.
6. Discriminant Validity: Extent to which a measure does not correlate with other constructsfrom which it is supposed to differ.
7. Nomological Validity: Extent to which scale correlates in theoretically predicted wayswith measures of different but related constructs.
LOVELY PROFESSIONAL UNIVERSITY 99
Unit 5: Measurement and Scaling Techniques
NotesFigure 5.5: Reliability and Validity on Target
Old Rifle
Low Reliability(Target A)
New RifleHigh Reliabillity
(Target B)
New Rifle SunglareReliable but Not Valid
(Target B)
Self Assessment
Fill in the blanks:
14. An ....................... questionnaire, which is the basis for forecasting the demand for a producthas predictive validity.
15. Those who enjoy high job satisfaction, and have extrovert personalities should exhibit.................... performance.
16. Reliability deals with ...................... and .........................
17. There are two criteria to decide whether the scale selected is good or not, viz. .......................and ....................
5.6 Summary
Measurement can be made using nominal, ordinal, interval or ratio scale.
The scales show the extent of likes/dislikes, agreement disagreement or belief towards anobject.
Each of the scale has certain statistical implications.
There are four types of scales used in market research namely paired comparison, Likert,semantic differential and thurstone scale.
Likert is a five point scale whereas semantic differential scale is a seven point scale.
Bipolar adjectives are used in semantic differential scale.
Thurstone scale is used to assess attitude of the respondents group regarding any issue ofpublic interest.
Validity and reliability of the scale is verified before the scale is used for measurement.
Validity refers to "Does the scale measure what it intends to measure".
There are three methods to check the validity which type of validity is required dependson "What is being measured".
100 LOVELY PROFESSIONAL UNIVERSITY
Research Methodology
Notes 5.7 Keywords
Interval Scale: Interval scale may tell us "How far the objects are apart with respect to anattribute?"
Likert Scale: This consists of a series of statements concerning an attitude object. Each statementhas '5 points', Agree and Disagree on the scale.
Ordinal Scale: The ordinal scale is used for ranking in most market research studies.
Ratio Scale: Ratio scale is a special kind of internal scale that has a meaningful zero point.
Reliability: It means the extent to which the measurement process is free from errors.
5.8 Review Questions
1. What do you analyse as the merits of Thurstone Scale?
2. What might be the limitations of Thurstone Scale?
3. Which do you find to be more favorable of the attribute and non-attribute method ofperceptual mapping and why?
4. In your opinion, what might be the uses of multi dimensional scaling?
5. One of the limitations of MDS can be that it keeps changing from time to time. What elsethan this do you see as the major drawbacks it has?
6. What can be the reasons for which you think that maintaining reliability can becomedifficult?
7. Does measurement scale always perform as expected in relation to other variables selectedas meaningful criteria? Why/why not?
8. On an average, how many cups of tea do you drink in a day and why? Reply technically.
9. Explain the construction of
(a) Likert scale
(b) Semantic differential scale
(c) Thurstone scale
10. Despite reliability, a scale may not have content validity. Comment.
11. Identify the type of scale, you will use in each of the following (ordinal, nominal, internal,ratio). Justify your answer.
Answers: Self Assessment
1. Interval 2. zero point
3. attitude 4. multiple
5 Attitude 6. hypothesis
7. semantic 8. Multidimensional
9. equal appearing interval 10. Likert
11. item part, evaluation part 12. Rank Order
LOVELY PROFESSIONAL UNIVERSITY 101
Unit 5: Measurement and Scaling Techniques
Notes13. two or more 14. opinion
15. high 16. accuracy, consistency
17. reliability, validity
5.9 Further Readings
Books A Parasuraman, Marketing Research, Dhruv Grewal, Biztantra.
Cisnal Peter, Marketing Research, MCGE.
CR Kotari, Research Methodology, Vishwa Prakashan.
David Luck and Ronald Rubin, Marketing Research, PHI.
GC Beri, Marketing Research, TMH.
Hague & Morgan, Marketing Research in Practice, Kogan page.
Paneerselvam, R, Research Methods, PHI.
S.N. Murthy & U. Bhojanna, Business Research Methods, 3rd Edition, Excel Books.
Tull and Donalds, Marketing Research, MMIL.
102 LOVELY PROFESSIONAL UNIVERSITY
Research Methodology
Notes Unit 6: Primary Data and Questionnaire
CONTENTS
Objectives
Introduction
6.1 Methodology for Collection of Primary Data
6.2 Observation Method
6.2.1 Types of Observation Methods
6.2.2 Advantages of Observation Method
6.2.3 Limitations of Observation Method
6.3 Survey Research Design
6.3.1 Steps Involved in Designing Survey Method
6.3.2 Characteristics of Survey
6.3.3 Purpose of Survey
6.3.4 Advantages of Survey
6.3.5 Disadvantages of Survey
6.4 Survey Methods
6.4.1 Personal Interviews
6.4.2 Telephone Surveys
6.4.3 Computer Direct Interviews
6.4.4 E-mail Surveys
6.4.5 Internet/Intranet (Web Page) Survey
6.4.6 Mail Questionnaire
6.5 Questionnaire
6.5.1 Process of Questionnaire Designing
6.6 Summary
6.7 Keywords
6.8 Review Questions
6.9 Further Readings
Objectives
After studying this unit, you will be able to:
Recognize the methodology of collecting primary data
Define a questionnaire and its characteristics
Generalize the steps involved in questionnaire designing
Identify to design survey research
LOVELY PROFESSIONAL UNIVERSITY 103
Unit 6: Primary Data and Questionnaire
NotesIntroduction
The data directly collected by the researcher, with respect to the problem under study, is knownas primary data. Primary data is also the firsthand data collected by the researcher for theimmediate purpose of the study.
Primary data is the data that is collected by the researchers for the purpose of investigation. Thisdata is original in character and generated by surveys. Primary data is the information collectedduring the course of experiment in an experimental research. It can also be obtained throughobservations or through direct communication with the persons associated with the selectedsubject by performing surveys or descriptive research.
6.1 Methodology for Collection of Primary Data
Many times due to inadequacy of data or stale information, the need arises for collecting a freshfirst hand information. In marketing research, there are broadly two ways by which primaryinformation can be gathered namely, observation and communication.
Benefits & Limitations of Primary data
Benefits of Primary data cannot be neglected. A research can be conducted without secondarydata but a research based on only secondary data is least reliable and may have biases becausesecondary data has already been manipulated by human beings. In statistical surveys it isnecessary to get information from primary sources and work on primary data: for example, thestatistical records of female population in a country cannot be based on newspaper, magazineand other printed sources. One such source is old and secondly they contain limited informationas well as they can be misleading and biased.
1. Validity: Validity is one of the major concerns in a research. Validity is the quality of aresearch that makes it trustworthy and scientific. Validity is the use of scientific methodsin research to make it logical and acceptable. Using primary data in research can improvesthe validity of research. First hand information obtained from a sample that isrepresentative of the target population will yield data that will be valid for the entiretarget population.
2. Authenticity: Authenticity is the genuineness of the research. Authenticity can be at stakeif the researcher invests personal biases or uses misleading information in the research.Primary research tools and data can become more authentic if the methods chosen toanalyze and interpret data are valid and reasonably suitable for the data type. Primarysources are more authentic because the facts have not been overdone. Primary source canbe less authentic if the source hides information or alters facts due to some personalreasons. There are methods that can be employed to ensure factual yielding of data fromthe source.
3. Reliability: Reliability is the certainty that the research is enough true to be trusted on.For example, if a research study concludes that junk food consumption does not increasethe risk of cancer and heart diseases. This conclusion should have to be drawn from asample whose size, sampling technique and variability is not questionable. Reliabilityimproves with using primary data. In the similar research mentioned above if the researcheruses experimental method and questionnaires the results will be highly reliable. On theother hand, if he relies on the data available in books and on internet he will collectinformation that does not represent the real facts.
104 LOVELY PROFESSIONAL UNIVERSITY
Research Methodology
Notes One limitation of primary data collection is that it consumes a lot of time. The researchers willneed to make certain preparations in order to handle the different demands of the processes andat the same time, manage time effectively. Besides time consumption, the researchers willcollect large volumes of data when they collect primary data. Since they will interact withdifferent people, they will end up with large volumes of data, which they will need to gothrough when analyzing and evaluating their findings. The primary data also require the greaterproportion of workforce to be engaged in the collection of information and analysis, whichenhances complexity of operations. There is requirement of large amount of resources to collectprimary data.
There are several methods of collecting the primary data, which are as follows:
Observation Method
Interview Method
Through Questionnaires
Through Schedules
Other methods such as warranty cards, distributor audits, pantry audits, consumer panels, usingmechanical devices, through projective techniques, depth interviews and content analysis.
Observation and questioning are two broad approaches available for primary data collection.The major difference between the two approaches is that in the questioning process, therespondents play an active role because of their interaction with the researcher.
Self Assessment
Fill in the blanks:
1. ………………..and …………………are two broad approaches available for primary datacollection.
2. The major difference between the observation and questioning approaches is that in the………………….process
6.2 Observation Method
In the observation method, only present/current behaviour can be studied. Therefore, manyresearchers feel that this is a great disadvantage. A causal observation could enlighten theresearcher to identify the problem. Such as the length of the queue in front of a food chain, priceand advertising activity of the competitor etc. Observation is the least expensive mode of datacollection.
Example: Suppose a Road Safety Week is observed in a city and the public is made aware ofadvance precautions while walking on the road. After one week, an observer can stand at a streetcorner and observe the number of people walking on the footpath and those walking on theroad during a given period of time. This will tell him whether the campaign on safety issuccessful or unsuccessful.
Sometimes, observation will be the only method available to the researcher.
Example: Behaviour or attitude of the children, and also of those who are inarticulate.
LOVELY PROFESSIONAL UNIVERSITY 105
Unit 6: Primary Data and Questionnaire
Notes6.2.1 Types of Observation Methods
There are several methods of observation of which any one or a combination of some of them,could be used by the observer. Some of these are:
Structured or unstructured method
Disguised or undisguised method
Direct-indirect observation
Human-mechanical observation
Structured-Unstructured Observation
Whether the observation should be structured or unstructured depends on the data needed.
Example: A manager of a hotel wants to know "how many of his customers visit the hotelwith their families and how many come as single customers. Here, the observation is structured,since it is clear "what is to be observed". He may instruct his waiters to record this. This informationis required to decide requirements of the chairs and tables and also the ambience.
Suppose, the manager wants to know how single customers and those with families behave andwhat their attitudes are like. This study is vague, and it needs a non-structured observation.
Example: To distinguish between structured and unstructured observations, consider astudy, investigating the amount of search that goes into the purchase of a soap. On the one hand,the observers could be instructed to stand at one end of a supermarket and record each samplecustomer's search. This may be observed and recorded as follows: "The purchaser first pausedafter looking at HLL brand. He looked at the price on of the product, kept the product back onthe shelf, then picked up a soap cake of HLL and glanced at the picture on the pack and its list ofingredients, and kept it back. He then checked the label and price for P&G product, kept thatback down again, and after a slight pause, picked up a different flavour soap of M/s GodrejCompany and placed it in his trolley and moved down the aisle". On the other hand, observersmight simply be told to record the "first soap cake examined", by checking the appropriate boxesin the observation form. The 'second situation' represents more structured than the first.
Did u know? The observation method is the only method applicable to study the growth ofplants and crops.
!Caution To use a more structured approach, it would be necessary to decide precisely whatis to be observed and the specific categories and units that would be used to record theobservations.
Disguised-Undisguised Observation
In disguised observation, the respondents do not know that they are being observed. In non-disguised observation, the respondents are well aware that they are being observed. In disguisedobservation, observers often pose as shoppers. They are known as "mystery shoppers". They arepaid by research organisations. The main strength of disguised observation is that it allows forregistering the true of the individuals.
106 LOVELY PROFESSIONAL UNIVERSITY
Research Methodology
Notes In the undisguised method, observations may be restrained due to induced error by the objectsof observation. The ethical aspect of disguised observations is still open to question and debate.
Direct-Indirect Observation
In direct observation, the actual behaviour or phenomenon of interest is observed. In indirectobservation, the results of the consequences of the phenomenon are observed. Suppose, aresearcher is interested in knowing about the soft drinks consumption of a student in a hostelroom. He may like to observe empty soft drink bottles dropped into the bin. Similarly, theobserver may seek the permission of the hotel owner to visit the kitchen or stores. He may carryout a kitchen/stores audit, to find out the consumption of various brands of spice items beingused by the hotel. It may be noted that the success of an indirect observation largely depends on"how best the observer is able to identify physical evidence of the problem under study".
Human-Mechanical Observation
Most of the studies in marketing research are based on human observation, wherein trainedobservers are required to observe and record their observation. In some cases, mechanicaldevices such as eye cameras are used for observation. One of the major advantages of electrical/mechanical devices is that their recordings are free from any subjective bias.
Did u know? It is easier to record structured observation than non-structured observation.
6.2.2 Advantages of Observation Method
1. The original data can be collected at the time of occurrence of the event.
2. Observation is done in natural surroundings. Therefore, the facts emerge more clearly,whereas in a questionnaire, experiments have environmental as well as time constraints.
3. Sometimes, the respondents may not like to part with some of the information. Suchinformation can be obtained by the researcher through observation.
4. Observation can also be done on those who cannot articulate.
5. Any bias on the part of the researcher is greatly reduced in the observation method.
6.2.3 Limitations of Observation Method
1. The observer might wait for longer period at the point of observation. And yet the desiredevent may not take place. Observation is required over a long period of time and hencemay not occur.
2. For observation, an extensive training of observers is required.
3. This is an expensive method.
4. External observation provides only superficial indications. To delve beneath the surface isvery difficult. Only overt behaviour can be observed.
5. Two observers may observe the same event, but may draw different inferences.
6. It is very difficult to gather information on (1) Opinions (2) Intentions.
LOVELY PROFESSIONAL UNIVERSITY 107
Unit 6: Primary Data and Questionnaire
Notes
Tasks What observation technique would you use to gather the following information?
1. What kind of influence do children have on the purchase behaviour of their parents?
2. How do discounts influence the purchase behaviour of customers buying colourTV?
3. A study to find out the potential location for a snack bar in a city.
Self Assessment
Fill in the blanks:
3. A causal observation could enlighten the researcher to …………….the problem.
4. In …………observation, the actual behaviour or phenomenon of interest is observed.
5. ………………observation provides only superficial indications.
6.3 Survey Research Design
Survey is used most often to describe a method of gathering information from samples ofindividuals. For example, sample of voters are questioned before elections to determine howthe public perceives the candidate and the party. A manufacturer does a survey of the potentialmarket before introducing a new product. Government commissions conduct a survey to gatherthe factual information, it needs to evaluate existing legislation, etc.
6.3.1 Steps Involved in Designing Survey Method
1. Select and formulate research problem.
2. Select an appropriate survey method.
3. Design the survey method/research design.
4. Conduct survey and collect data.
5. Analyze and report.
Notes Cover Note
Researcher needs to send a polite short cover note, especially with mailed questionnairesand it should include the following:
Introduction to the researcher.
What the research is all about?
Why is he conducting the study?
What will happen with the results?
Who to contact if respondent has any queries?
How to return the questionnaire to the researcher?
108 LOVELY PROFESSIONAL UNIVERSITY
Research Methodology
Notes 6.3.2 Characteristics of Survey
1. Survey is conducted in a natural setting.
2. Survey seeks responses directly form the respondents.
3. Survey is widely used in non-experimental social science research.
4. Often use questionnaire or interview method for data collection.
5. Survey involves real world samples.
6. Often it is quantitative method, but can also be qualitative.
7. It is systematic, follows specific set of rules, a formal and orderly logic of sequence.
8. It is impartial, select sample units without any prejudice and preference.
6.3.3 Purpose of Survey
There are two purposes of survey, they are as follows:
1. Information gathering: It collects information for a specific purpose. For example, pools,census, customer satisfaction, attitude, etc.
2. Theory testing and building: Surveys are also used for the purpose of testing and buildingtheory. For example, personality and social psychology theories.
6.3.4 Advantages of Survey
Access to wide range of participants.
Collection of large amount of data.
May be more ethical than experimental designs.
6.3.5 Disadvantages of Survey
Lack of control.
Data may be superficial.
Costly to obtain representative data.
Self Assessment
Fill in the blanks:
6. Survey is widely used in ……………………social science research
7. Survey seeks responses ………………form the respondents.
8. A manufacturer does a survey of the …………….market before introducing a new product.
6.4 Survey Methods
6.4.1 Personal InterviewsAn interview is called personal when the Interviewer asks the questions face-to-face with theInterviewee. Personal interviews can take place at home, at a shopping mall, on the street, andso on.
LOVELY PROFESSIONAL UNIVERSITY 109
Unit 6: Primary Data and Questionnaire
NotesAdvantages
The ability to let the Interviewee see, feel and/or taste a product.
The ability to find the target population. For example, you can find people who have seena film much more easily outside a theater in which it is playing than by calling phonenumbers at random.
Longer interviews are sometimes tolerated. Particularly with in-home interviews thathave been arranged in advance. People may be willing to talk longer face-to-face than tosomeone on the phone.
Disadvantages
Personal interviews usually cost more per interview than other methods.
Change in the characteristics of the population might make sample non-representative.
6.4.2 Telephone Surveys
It is a process of collecting information from sample respondents by calling them over telephone.Surveying by telephone is the most popular interviewing method.
Advantages
People can usually be contacted faster over the telephone than with other methods.
You can dial random telephone numbers when you do not have the actual telephonenumbers of potential respondents.
Skilled interviewers can often invite longer or more complete answers than people willgive on their own to mail, e-mail surveys.
Disadvantages
Many telemarketers have given legitimate research a bad name by claiming to be doingresearch when they start a sales call.
The growing number of working women often means that no one is at home during theday. This limits calling time to a "window" of about 6-9 p.m. (when you can be sure tointerrupt dinner or a favorite TV program).
You cannot show sample products by phone.
6.4.3 Computer Direct Interviews
These are methods in which the respondents key in (enter) their answers directly into a computer.
Advantages
It eliminates data entry and editing costs.
Answers are more accurate to sensitive questions through a computer than to a person orpaper questionnaire.
Interviewer bias is eliminated. Different interviewers can ask questions in different ways,leading to different results. The computer asks the questions the same way every time.
110 LOVELY PROFESSIONAL UNIVERSITY
Research Methodology
Notes Ensuring skip patterns are accurately followed. The Survey System can ensure people arenot asked questions they should skip based on their earlier answers. These automaticskips are more accurate than relying on an Interviewer reading a paper questionnaire.
Response rates are usually higher as it looks novel and interesting to some people.
Disadvantages
The interviewees must have access to a computer or it must be provided for them.
As with mail surveys, computer direct interviews may have serious response rate problemsin populations due to literacy levels being low.
6.4.4 E-mail Surveys
Email Questionnaire is a new type of questionnaire system that revolutionizes the way on-linequestionnaires are conducted. Unlike other on-line questionnaire systems that need a webserver to construct, distribute and manage results, Email Questionnaire is totally email based. Itworks with the existing email system making on-line questionnaire surveys available to anyonewith an Internet connection.
Advantages
Speed: An email questionnaire can gather several thousand responses within a day or two.
There is practically no cost involved once the set up has been completed.
Pictures and sound files can be attached.
The novelty element of an email survey often stimulates higher response levels thanordinary mail surveys.
Disadvantages
Researcher must possess or purchase a list of email addresses.
Some people will respond several times or pass questionnaires along to friends to answer.
Many people dislike unsolicited email even more than unsolicited regular mail.
Findings cannot be generalised with email surveys. People who have email are differentfrom those who do not, even when matched on demographic characteristics, such as ageand gender.
Email surveys cannot automatically skip questions or randomize question.
6.4.5 Internet/Intranet (Web Page) Survey
Web surveys are rapidly gaining popularity. They have major speed, cost, and flexibilityadvantages, but also significant sampling limitations. These limitations restrict the groups thatcan be studied using this technique.
!Caution Software selection is especially important in internet survey so it should be selectedwith proper care and after analyzing through feasibility studies
LOVELY PROFESSIONAL UNIVERSITY 111
Unit 6: Primary Data and Questionnaire
NotesAdvantages
Web page surveys are extremely fast. A questionnaire posted on a popular Web site cangather several thousand responses within a few hours. Many people who will respond toan email invitation to take a Web survey will do so the first day, and most will do sowithin a few days.
There is practically no cost involved once the set up has been completed.
Pictures can be shown. Some Web survey software can also show video and play sound.
Web page questionnaires can use complex question skipping logic, randomizations andother features which is not possible with paper questionnaires. These features can assurebetter data.
Web page questionnaires can use colors, fonts and other formatting options not possiblein most email surveys.
A significant number of people will give more honest answers to questions about sensitivetopics, such as drug use or sex, when giving their answers to a computer, instead of to aperson or on paper.
On an average, people give longer answers to open-ended questions on Web pagequestionnaires than they do on other kinds of self-administered surveys.
Disadvantages
Current use of the Internet is far from universal. Internet surveys do not reflect thepopulation as a whole. This is true even if a sample of Internet users is selected to matchthe general population in terms of age, gender and other demographics.
People can easily quit in the middle of a questionnaire. They are not as likely to completea long questionnaire on the Web as they would be if talking with a good interviewer.
Depending on your software, there is often no control over people responding multipletimes to bias the results.
6.4.6 Mail Questionnaire
Mail questionnaire is a paper questionnaire, which is sent to selected respondents to fill and postfilled questionnaire back to the researcher.
Advantages
1. Easier to reach a larger number of respondents throughout the country.
2. Since the interviewer is not present face to face, the influence of interviewer on therespondent is eliminated.
3. This is the only kind of survey you can do if you have the names and addresses of thetarget population, but not their telephone numbers.
4. Mail surveys allow the respondent to answer at their leisure, rather than at the ofteninconvenient moment they are contacted for a phone or personal interview. For thisreason, they are not considered as intrusive as other kinds of interviews.
5. Where the questions asked are such that they cannot be answered immediately, and needssome thinking on the part of the respondent, the respondent can think over leisurely andgive the answer.
112 LOVELY PROFESSIONAL UNIVERSITY
Research Methodology
Notes 6. Saves cost (cheaper than interview).
7. No need to train interviewers.
8. Personal and sensitive questions are well answered in this method.
9. The questionnaire can include pictures - something that is not possible over the phone.
Limitations
1. It is not suitable when questions are difficult and complicated. Example, Do you believe invalue price relationship?
2. When the researcher is interested in a spontaneous response, this method is unsuitable.Because thinking time allowed to the respondent will influence the answer.
Example, "Tell me spontaneously, what comes to your mind if I ask you about cigarettesmoking".
3. In case of a mail questionnaire, it is not possible to verify whether the respondent himself/herself has filled the questionnaire. If the questionnaire is directed towards the housewife,say, to know her expenditure on kitchen items, she alone is supposed to answer it. Instead,if her husband answers the questionnaire, the answer may not be correct.
4. Any clarification required by the respondent regarding questions is not possible.
Example: Prorated discount, product profile, marginal rate, etc., may not be understoodby the respondents.
5. If the answers are not correct, the researcher cannot probe further.
6. Poor response (30%) - Not all will reply.
7. In populations of lower educational and literacy levels, response rates to mail surveys areoften too small to be useful.
Additional Consideration for the Preparation of Mail Questionnaire
1. It should be shorter than the questionnaire used for a personal interview.
2. The wording should be extremely simple.
3. If a lengthy questionnaire has to be made, first write a letter requesting the co-operationof the respondents.
4. Provide clear guidance, wherever necessary.
5. Send a pre-addressed and stamped envelope to receive the reply.
Self Assessment
Fill in the blanks:
9. Telephone Surveys is a process of collecting information from ………….respondents bycalling them over telephone.
10. In case of a mail questionnaire, it is not possible to ………….whether the respondenthimself/herself has filled the questionnaire.
11. ………………………are methods in which the respondents enter their answers directlyinto a computer
LOVELY PROFESSIONAL UNIVERSITY 113
Unit 6: Primary Data and Questionnaire
Notes6.5 Questionnaire
What is Questionnaire?
A questionnaire is a research instrument consisting of a series of questions and other promptsfor the purpose of gathering information from respondents. The questionnaire was invented bySir Francis Galton.
Notes Importance and Limitations of Questionnaire in MR
Questionnaires have advantages over some other types of data collection. Questionnairesare cheap, do not require as much effort from the questioner as verbal or telephonesurveys, and often have standardized answers that make it simple to compile data. However,such standardized answers may frustrate users. Questionnaires are also sharply limitedby the fact that respondents must be able to read the questions and respond to them. Thus,for some demographic groups conducting a survey by questionnaire may not be practical.
Characteristics of Questionnaire
1. It must be simple. The respondents should be able to understand the questions.
2. It must generate replies that can be easily be recorded by the interviewer.
3. It should be specific, so as to allow the interviewer to keep the interview to the point.
4. It should be well arranged, to facilitate analysis and interpretation.
5. It must keep the respondent interested throughout.
6.5.1 Process of Questionnaire Designing
The following are the seven steps involved in designing a questionnaire:
Step 1: Determine What Information is Required
The first question to be asked by the market researcher is "what type of information does heneed from the survey?" This is valid because if he omits some information on relevant and vitalaspects, his research is not likely to be successful. On the other hand, if he collects informationwhich is not relevant, he is wasting his time and money.
At this stage, information required, and the scope of research should be clear. Therefore, thesteps to be followed at the planning stage are:
1. Decide on the topic for research.
2. Get additional information on the research issue, from secondary data and exploratoryresearch. The exploratory research will suggest "what are the relevant variables?"
3. Gather what has been the experience with similar study.
4. The type of information required. There are several types of information such as
(a) awareness, (b) facts, (c) opinions, (d) attitudes, (e) future plans, (f) reasons.
Facts are usually sought out in marketing research.
114 LOVELY PROFESSIONAL UNIVERSITY
Research Methodology
Notes Example: Which television programme did you see last Saturday? This requires a reasonably
good memory and the respondent may not remember. This is known as recall loss. Therefore,questioning the distant past should be avoided. Memory of events depends on (1) Importance ofthe events, and (2) Whether it is necessary for the respondent to remember. In the above case,both the factors are not fulfilled. Therefore, the respondent does not remember. On the contrary,a birthday or wedding anniversary of individuals is remembered without effort since the eventis important. Therefore, the researcher should be careful while asking questions about the past.First, he must make sure that the respondent has the answer.
Example: Do you go to the club? He may answer 'yes', though it is untrue. This may bebecause the respondent wants to impress upon the interviewer that he belongs to a well-to-dofamily and can afford to spend money on clubs. To obtain facts, the respondents must beconditioned (by good support) to part with the correct facts.
Mode of Collecting the Data
The questionnaire can be used to collect information either through personal interview, mail ortelephone. The method chosen depends on the information required and also the type ofrespondent. If the information is to be collected from illiterate individuals, a questionnairewould be the wrong choice.
Step 2: Different Types of Questionnaire
1. Structured and Non-disguised
2. Structured and Disguised
3. Non-structured and Disguised
4. Non-structured and Non-disguised
1. Structured and Non-disguised Questionnaire: Here, questions are structured so as to obtainthe facts. The interviewer will ask the questions strictly in accordance with the prearrangedorder. For example, what are the strengths of soap A in comparison with soap B?
(a) Cost is less
(b) Lasts longer
(c) Better fragrance
(d) Produces more lather
(d) Available in more convenient sizes
Structured and non-disguised questionnaire is widely used in market research. Questionsare presented with exactly the same wording and same order to all respondents. Thereason for standardizing the question is to ensure that all respondents reply the samequestion. The purpose of the question is clear. The researcher wants the respondent tochoose one of the five options given above. This type of questionnaire is easy to administer.The respondents have no difficulty in answering, because it is structured, the frame ofreference is obvious.
In a non-disguised type, the purpose of the questionnaire is known to the respondent.
LOVELY PROFESSIONAL UNIVERSITY 115
Unit 6: Primary Data and Questionnaire
NotesExample: "Subjects attitude towards Cyber laws and the need for government legislation
to regulate it".
Certainly, not needed at present
Certainly not needed
I can't say
Very urgently needed
Not urgently needed
2. Structured and disguised Questionnaire: This type of questionnaire is least used in marketingresearch. This type of questionnaire is used to know the peoples' attitude, when a directundisguised question produces a bias. In this type of questionnaire, what comes out is"what does the respondent know" rather than what he feels. Therefore, the endeavour inthis method is to know the respondent's attitude.
Currently, the "Office of Profit" Bill is:
(a) In the Lok Sabha for approval.
(b) Approved by the Lok Sabha and pending in the Rajya Sabha.
(c) Passed by both the Houses, pending the presidential approval.
(d) The bill is being passed by the President.
Depending on which answer the respondent chooses, his knowledge on the subject isclassified.
In a disguised type, the respondent is not informed of the purpose of the questionnaire.Here the purpose is to hide "what is expected from the respondent?"
Example: "Tell me your opinion about Mr. Ben's healing effect show conducted atBangalore?"
"What do you think about the Babri Masjid demolition?"
3. Non-Structured and Disguised Questionnaire: The main objective is to conceal the topic ofenquiry by using a disguised stimulus. Though the stimulus is standardized by theresearcher, the respondent is allowed to answer in an unstructured manner. The assumptionmade here is that individual's reaction is an indication of respondent's basic perception.Projective techniques are examples of non-structured disguised technique. The techniquesinvolve the use of a vague stimulus, which an individual is asked to expand or describe orbuild a story, three common types under this category are (a) Word association (b) Sentencecompletion (c) Story telling.
4. Non structured and Non disguised Questionnaire: Here the purpose of the study is clear,but the responses to the question are open-ended. Example: "How do you feel about theCyber law currently in practice and its need for further modification"? The initial part ofthe question is consistent. After presenting the initial question, the interview becomesvery unstructured as the interviewer probes more deeply. Subsequent answers by therespondents determine the direction the interviewer takes next. The question asked by theinterviewer varies from person to person. This method is called "the depth interview". Themajor advantage of this method is the freedom permitted to the interviewer. By notrestricting the respondents to a set of replies, the experienced interviewers will be above
116 LOVELY PROFESSIONAL UNIVERSITY
Research Methodology
Notes to get the information from the respondent fairly and accurately. The main disadvantageof this method of interviewing is that it takes time, and the respondents may not cooperate.Another disadvantage is that coding of open-ended questions may pose a challenge. Forexample: When a researcher asks the respondent "Tell me something about your experiencein this hospital". The answer may be "Well, the nurses are slow to attend and the doctor isrude. 'Slow' and 'rude' are different qualities needing separate coding. This type ofinterviewing is extremely helpful in exploratory studies.
Step 3: Type of Questions
Open-ended Questions
These are questions where respondents are free to answer in their own words. Example: "Whatfactor do you consider while buying a suit"? If multiple choices are given, it could be colour,price, style, brand, etc., but some respondents may mention attributes which may not occur tothe researcher.
Therefore, open-ended questions are useful in exploratory research, where all possible alternativesare explored. The greatest disadvantage of open-ended questions is that the researcher has tonote down the answer of the respondents verbatim. Therefore, there is a likelihood of theresearcher failing to record some information.
Another problem with open-ended question is that the respondents may not use the same frameof reference.
Example: "What is the most important attribute in a job?"
Ans: Pay
The respondent may have meant "basic pay" but interviewer may think that the respondent istalking about "total pay including dearness allowance and incentive". Since both of them refer topay, it is impossible to separate two different frames.
Dichotomous Question
These questions have only two answers, 'Yes' or 'no', 'true' or 'false' 'use' or 'don't use'.
Do you use toothpaste? Yes ……….. No …………
There is no third answer. However sometimes, there can be a third answer:
Example: "Do you like to watch movies?"
Ans: Neither like nor dislike.
Dichotomous questions are most convenient and easy to answer. A major disadvantage ofdichotomous question is that it limits the respondent's response. This may lead to measurementerror.
Close-Ended Questions
There are two basic formats in this type:
Make one or more choices among the alternatives.
Rate the alternatives.
LOVELY PROFESSIONAL UNIVERSITY 117
Unit 6: Primary Data and Questionnaire
NotesChoice Among Alternatives
Which of the following words or phrases best describes the kind of person you feel would bemost likely to use this product, based on what you have seen in the commercial?
1. Young ………… old …………….
Single ………… Married ………..
Modern ………… Old fashioned ……………...
2. Rating Scale
(i) Please tell us your overall reaction to this commercial?
(a) A great commercial; would like to see again.
(b) Just so-so, like other commercials.
(c) Another bad commercial.
(d) Pretty good commercial.
(ii) Based on what you saw in the commercial, how interested do you feel, you would bebuying the products?
(a) Definitely
(b) Probably I would buy
(c) I may or may not buy
(d) Probably I would not buy
(e) Definitely I would not buy.
Closed-ended questionnaires are easy to answer. It requires less effort on the part of theinterviewer. Tabulation and analysis is easier. There are lesser errors, since the same questionsare asked to everyone. The time taken to respond is lesser. We can compare the answer of onerespondent to another respondent.
Notes One basic criticism of closed-ended questionnaires is that middle alternatives arenot included in this, such as "don't know". This will force the respondents to choose amongthe given alternative.
Step 4: Wordings of Questions
Wordings of particular questions could have a large impact on how the respondent interpretsthem. Even a small shift in the wording could alter the respondent's answer.
Example: "Don't you think that Brazil played poorly in the FIFA cup?" The answer will be'yes'. Many of them, who do not have any idea about the game, will also most likely say 'yes'. Ifthe question is worded in a slightly different manner, the response will be different.
Example: "Do you think that, Brazil played poorly in the FIFA cup?" This is a straightforwardquestion. The answer could be 'yes', 'no' or 'don't know' depending on the knowledge therespondents have about the game.
118 LOVELY PROFESSIONAL UNIVERSITY
Research Methodology
Notes Example: "Do you think anything should be done to make it easier for people to pay their
phone bill, electricity bill and water bill under one roof"?
Example: "Don't you think something might be done to make it easier for people to paytheir phone bill, electricity bill, water bill under one roof"?
A change of just one word as above, can generate different responses by respondents.
Guidelines towards the use of correct wording:
Is the vocabulary simple and familiar to the respondents?
Example: Instead of using the word 'reasonably', 'usually', 'occasionally', 'generally', 'onthe whole'.
Example: "How often do you go to a movie?" "Often, may be once a week, once a month,once in two months or even more."
Avoid Double-Barreled Questions
These are questions, in which the respondent can agree with one part of the question, but notagree with the other or cannot answer without making a particular assumption.
Example: "Do you feel that firms today are employee-oriented and customer-oriented?"There are two separate issues here - [yes] [no]
Example: "Are you happy with the price and quality of branded shampoo?" [yes] [no]
Avoid Leading and Loading Questions
1. Leading Questions: A leading question is one that suggests the answer to the respondent.The question itself will influence the answer, when respondents get an idea that the datais being collected by a company. The respondents have a tendency to respond positively.
Example: "How do you like the programme on 'Radio Mirchy'? The answer is likely tobe 'yes'. The unbiased way of asking is "which is your favorite F.M. Radio station? Theanswer could be any one of the four stations namely (1) Radio City (2) Mirchy (3) Rainbow(4) Radio-One.
Example: Do you think that offshore drilling for oil is environmentally unsound? The mostprobable response is 'yes'. The same question can be modified to eliminate the leading factor.
What is your feeling about the environmental impact of offshore drilling for oil? Give choicesas follows:
(a) Offshore drilling is environmentally sound.
(b) Offshore drilling is environmentally unsound.
(c) No opinion.
LOVELY PROFESSIONAL UNIVERSITY 119
Unit 6: Primary Data and Questionnaire
Notes2. Loaded Questions: A leading question is also known as a loaded question. In a loadedquestion, special emphasis is given to a word or a phrase, which acts as a lead to respondent.
Example: "Do you own a Kelvinator refrigerator." A better question would be "what brandof refrigerator do you own?" "Don't you think the civic body is 'incompetent'?" Here the wordincompetent is 'loaded'.
(a) Are the Questions Confusing? If there is a question unclear or is confusing, then therespondent becomes more biased rather that getting enlightened. Example: "Do you thinkthat the government publications are distributed effectively"? This is not the correct way,since respondent does not know what is the meaning of the word effective distribution.This is confusing. The correct way of asking questions is "Do you think that the governmentpublications are readily available when you want to buy?" Example: "Do you think whethervalue price equation is attractive"? Here, respondents may not know the meaning of valueprice equation.
(b) Applicability: "Is the question applicable to all respondents?" Respondents may try to answera question even though they don't qualify to do so or may lack from any meaningfulopinion.
Example:
1. "What is your present education level"
2. "Where are you working" (assuming he is employed)?
3. "From which bank have you taken a housing loan" (assuming he has taken a loan).
Avoid Implicit Assumptions
An implicit alternative is one that is not expressed in the options. Consider following twoquestions:
1. Would you like to have a job, if available?
2. Would you prefer to have a job, or do you prefer to do just domestic work?
Even though, we may say that these two questions look similar, they vary widely. The differenceis that Q-2 makes explicit the alternative implied in Q-1.
Split Ballot Technique
This is a procedure used wherein (1) The question is split into two halves and (2) Differentsequencing of questions is administered to each half. There are occasions when a singleversion of questions may not derive the correct answer and the choice is not obvious to therespondent.
Example: "Why do you use Ayurvedic soap"? One respondent might say "Ayurvedic soap isbetter for skin care". Another may say "Because the dermatologist has recommended". A thirdmight say "It is a soap used by my entire family for several years". The first respondent answersthe reason for using it at present. The second respondent answers how he started using. The thirdrespondent "the family tradition for using". As can be seen, different reference frames are used.The question may be balanced and rephrased.
120 LOVELY PROFESSIONAL UNIVERSITY
Research Methodology
Notes Complex Questions?
In which of the following do you like to park your liquid funds?
i. Debenture
ii. Preferential share
iii. Equity linked MF
iv. IPO
v. Fixed deposit
If this question is posed to the general public, they may not know the meaning of liquid fund.Most of the respondents will guess and tick one of them.
Are the Questions Too Long? Generally as a thumb rule, it is advisable to keep the number ofwords in a question not exceeding 20. The question given below is too long for the respondentto comprehend, leave alone answer.
Example: Do you accept that the people whom you know, and associate yourself have beenreceiving ESI and P.F. benefits from the government accept a reduction in those benefits, with aview to cut down government expenditure, to provide more resources for infrastructuraldevelopment?
Yes................... No................... Can't say...................
Participation at the Expense of Accuracy
Sometimes the respondent may not have the information that is needed by the researcher.
Example: The husband is asked a question "How much does your family spend ongroceries in a week"? Unless the respondent does the grocery shopping himself, he will notknow how much has been spent. In a situation like this, it will be helpful to ask a 'filteredquestion'. An example of a filtered question can be, "Who buys the groceries in your family"?
Example: "Do you have the information of Mr. Ben's visit to Bangalore"? Not onlyshould the individual have the information but also s(he) should remember the same. Theinability to remember the information is known as "recall loss".
Task Give one example for each of the following type of the questions:
1. Leading question
2. Double-barreled question
3. Close-ended question
4. Fixed alternative question
5. Split-ballot question
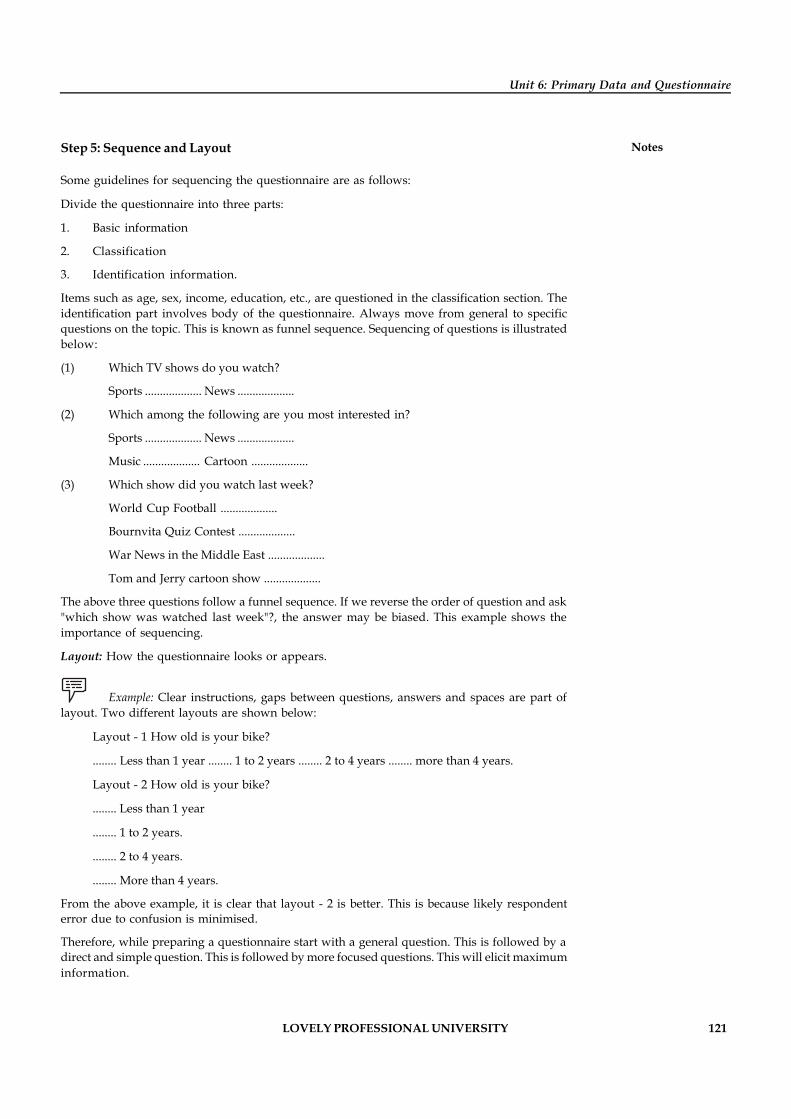
LOVELY PROFESSIONAL UNIVERSITY 121
Unit 6: Primary Data and Questionnaire
NotesStep 5: Sequence and Layout
Some guidelines for sequencing the questionnaire are as follows:
Divide the questionnaire into three parts:
1. Basic information
2. Classification
3. Identification information.
Items such as age, sex, income, education, etc., are questioned in the classification section. Theidentification part involves body of the questionnaire. Always move from general to specificquestions on the topic. This is known as funnel sequence. Sequencing of questions is illustratedbelow:
(1) Which TV shows do you watch?
Sports ................... News ...................
(2) Which among the following are you most interested in?
Sports ................... News ...................
Music ................... Cartoon ...................
(3) Which show did you watch last week?
World Cup Football ...................
Bournvita Quiz Contest ...................
War News in the Middle East ...................
Tom and Jerry cartoon show ...................
The above three questions follow a funnel sequence. If we reverse the order of question and ask"which show was watched last week"?, the answer may be biased. This example shows theimportance of sequencing.
Layout: How the questionnaire looks or appears.
Example: Clear instructions, gaps between questions, answers and spaces are part oflayout. Two different layouts are shown below:
Layout - 1 How old is your bike?
........ Less than 1 year ........ 1 to 2 years ........ 2 to 4 years ........ more than 4 years.
Layout - 2 How old is your bike?
........ Less than 1 year
........ 1 to 2 years.
........ 2 to 4 years.
........ More than 4 years.
From the above example, it is clear that layout - 2 is better. This is because likely respondenterror due to confusion is minimised.
Therefore, while preparing a questionnaire start with a general question. This is followed by adirect and simple question. This is followed by more focused questions. This will elicit maximuminformation.
122 LOVELY PROFESSIONAL UNIVERSITY
Research Methodology
Notes Forced and Unforced Scales
Suppose the questionnaire is not provided with 'don't know' or 'no option', then the respondentis forced to choose one side or the other. A 'don't know' is not a neutral response. This may bedue to genuine lack of knowledge.
Balanced and Unbalanced Scales
In a balanced scale, the number of favourable responses are equal to the number of unfavorableresponses. If the researcher knows that there is a possibility of a favourable response, it is bestto use unbalanced scale.
Use Funnel Approach
Funnel sequencing gets the name from its shape, starting with broad questions and progressivelynarrowing down the scope. Move from general to specific examples.
1. How do you think this country is getting along in its relations with other countries?
2. How do you think we are doing in our relations with the US?
3. Do you think we ought to be dealing with US?
4. If yes, what should be done differently?
5. Some say we are very weak on the nuclear deal with the US, while, some say we are OK.What do you feel ?
The first question introduces the general subject. In the next question, a specific country ismentioned. The third and fourth questions are asked to seek views. The fifth question is to seeka specific opinion.
Step 6: Pretesting of Questionnaire
Pretesting of a questionnaire is done to detect any flaws that might be present. For example, theword used by researcher must convey the same meaning to the respondents. Are instructionsclear skip questions clear? One of the prime conditions for pretesting is that the sample chosenfor pretesting should be similar to the respondents who are ultimately going to participate. Justbecause a few chosen respondents fill in all the questions going does not mean that thequestionnaire is sound.
How Many Questions to be Asked? The questionnaire should not be too long as the responsewill be poor. There is no rule to decide this. However, the researcher should consider that if hewere the respondent, how would he react to a lengthy questionnaire. One way of deciding thelength of the questionnaire is to calculate the time taken to complete the questionnaire. He cangive the questionnaire to a few known people to seek their opinion.
Step 7: Revise and Preparation of Final Questionnaire
Final questionnaire may be prepared after pretesting the questionnaire with the small group ofrespondents. Questionnaire should be revised for the following:
i. To correct the spellings.
ii. To place the questions in proper order to avoid the contextual bias.
iii. To remove the words which are not familiar to respondents.
LOVELY PROFESSIONAL UNIVERSITY 123
Unit 6: Primary Data and Questionnaire
Notesiv. To add or remove questions arise in the process of pretest, if any.
v. To purge the words with double meaning, etc.
Self Assessment Questions
Fill in the blanks:
12. Generally as a thumb rule, it is advisable to keep the number of words in a question notexceeding ……….
13. In a ………………..scale, the number of favourable responses are equal to the number ofunfavorable responses.
14. A major disadvantage of dichotomous question is that it ------------the respondent's response..
15. Open-ended questions are useful in ………………research, where all possible alternativesare explored.
6.6 Summary
Primary data may pertain to life style, income, awareness or any other attribute ofindividuals or groups.
There are mainly two ways of collecting primary data namely: (a) Observation (b) Byquestioning the appropriate sample.
Observation method has a limitation i.e., certain attitudes, knowledge, motivation, etc.cannot be measured by this method. For this reason, researcher needs to communicate.
Communication method is classified based on whether it is structured or disguised.
Structured questionnaire is easy to administer. This type is most suited for descriptiveresearch. If the researcher wants to do exploratory sturdy, unstructured method is better.
In unstructured method questions will have to be framed based on the answer by therespondent. Questionnaire can be administered either in person or online or Mailquestionnaire. Each of these methods have advantages and disadvantages.
Questions in a questionnaire may be classified into (a) Open question (b) Close endedquestions (c) Dichotomous questions, etc.
While formulating questions, care has to be taken with respect to question wording,vocabulary, leading, loading and confusing questions should be avoided. Further it isdesirable that questions should not be complex, nor too long.
It is also implied that proper sequencing will enable the respondent to answer the questioneasily. The researcher must maintain a balanced scale and must use a funnel approach.
Pretesting of the questionnaire is preferred before introducing to a large population.
6.7 Keywords
Computer Direct Interview: This is the method in which the respondents key in (enter) theiranswers directly into a computer.
Dichotomous Question: These questions have only two answers, like 'Yes' or 'no'
Disguised Observation: The observation under which the respondents do not know that they arebeing observed.
124 LOVELY PROFESSIONAL UNIVERSITY
Research Methodology
Notes Loaded Question: A question in which special emphasis is given to a word or a phrase, whichacts as a lead to respondent.
Non-disguised Observation: The observation in which the respondents are well aware that theyare being observed.
6.8 Review Questions
1. What is primary data?
2. What are the various methods available for collecting primary data?
3. What are the advantages and disadvantages of a structured questionnaire?
4. What are the several methods used to collect data by observation method?
5. What are the advantages and limitations of collecting data by observation method?
6. What are the various methods of survey research?
7. What is a questionnaire? What are its importance and characteristics?
8. Explain the steps involved in designing a questionnaire.
9. Explain Open ended and Closed ended questions in a questionnaire.
10. One method of sequencing the question in a questionnaire is to proceed from general tospecific. What is the logical reason behind this?
Answers: Self Assessment
1. Observation, questioning 2. questioning
3. identify 4. direct
5. External 6. non-experimental
7. directly 8. potential
9. sample 10. verify
11. Computer Direct Interviews 12. 20
13. balanced 14. limits
15. exploratory
6.9 Further Readings
Books Abrams, M.A., Social Surveys and Social Action, London: Heinemann, 1951.
Arthur, Maurice, Philosophy of Scientific Investigation , Baltimore: John HopkinsUniversity Press, 1943.
Bernal, J.D., The Social Function of Science, London: George Routledge and Sons,1939.
Chase, Stuart, The Proper Study of Mankind: An inquiry into the Science of HumanRelations, New York, Harper and Row Publishers, 1958.
S. N. Murthy and U. Bhojanna, Business Research Methods, Excel Books.
LOVELY PROFESSIONAL UNIVERSITY 125
Unit 7: Secondary Data
NotesUnit 7: Secondary Data
CONTENTS
Objectives
Introduction
7.1 Secondary Data
7.1.1 Internal Secondary Data
7.1.2 External Secondary Data
7.1.3 Benefits and Limitations of Secondary Data
7.2 Special Techniques of Market Research or Syndicated Data
7.2.1 Consumer Purchase Data or Panel Type Data
7.2.2 Retail and Wholesale Data
7.2.3 Advertising Data
7.3 Advantages and Disadvantages of Secondary Data
7.4 Summary
7.5 Keywords
7.6 Review Questions
7.7 Further Readings
Objectives
After studying this unit, you will be able to:
Recognize the notion of secondary data
Differentiate the various types of secondary data.
Identify the special techniques of secondary data
Generalize the advantages and disadvantages of secondary data
Introduction
In research, secondary data is collecting and possibly processed by people other than the researcherin question. Common sources of secondary data for social science include censuses, large surveys,and organizational records. In sociology primary data is data you have collected yourself andsecondary data is data you have gathered from primary sources to create new research. In termsof historical research, these two terms have different meanings. A primary source is a book orset of archival records. A secondary source is a summary of a book or set of records.
7.1 Secondary Data
Secondary data are statistics that already exist. They have been gathered not for immediate use.This may be described as "those data that have been compiled by some agency other than theuser". Secondary data can be classified as:
126 LOVELY PROFESSIONAL UNIVERSITY
Research Methodology
Notes 1. Internal secondary data
2. External secondary data
7.1.1 Internal Secondary Data
Internal secondary data is a part of the company's record, for which research is already conducted.Internal data are those that are found within the organisation.
Example: Sales in units, credit outstanding, call reports of sales persons, daily productionreport, monthly collection report, etc.
7.1.2 External Secondary Data
The data collected by the researcher from outside the company. This can be divided into fourparts:
1. Census data
2. Individual project report being published
3. Data collected for sale on a commercial basis called syndicated data
4. Miscellaneous data
Did u know? Census data is the most important data among the sources of data.
The following are some of the data that can obtained by census records:
Census of the wholesale trade
Census of the retail trade
Population Census
Census of manufacturing industries
Individual project report being published
Encyclopedia of business information sources
Product finder
Thomas registers etc.
7.1.3 Benefits and Limitations of Secondary Data
Benefits
It is far cheaper to collect secondary data than to obtain primary data. For the same level ofresearch budget a thorough examination of secondary sources can yield a great deal of informationthan can be had through a primary data collection exercise.
The time involved in searching secondary sources is much less than that needed to completeprimary data collection.
Secondary sources of information can yield more accurate data than that obtained throughprimary research. This is not always true but where a government or international agency has
LOVELY PROFESSIONAL UNIVERSITY 127
Unit 7: Secondary Data
Notesundertaken a large scale survey, or even a census, this is likely to yield far more accurate resultsthan custom designed and executed surveys when these are based on relatively small samplesizes.
It should not be forgotten that secondary data can play a substantial role in the exploratoryphase of the research when the task at hand is to define the research problem and to generatehypotheses. The assembly and analysis of secondary data almost invariably improve theresearcher's understanding of the marketing problem, the various lines of inquiry that could orshould be followed and the alternative courses of actions which might be pursued.
Secondary sources help define the population. Secondary data can be extremely useful both indefining the population and in structuring the sample to be taken. For instance, governmentstatistics on a country's agriculture will help decide how to stratify a sample and, once sampleestimates have been calculated, these can be used to project those estimates to the population.
Limitations
1. Definition: The researcher, when making use of secondary data, may misinterpret thedefinitions used by those responsible for its preparation and draw erroneous conclusions
2. Measurement error: When a researcher conducts fieldwork she/he is possibly able toestimate inaccuracies in measurement through the standard deviation and standard error,but these are sometimes not published in secondary sources. The problem is sometimesnot so much 'error' but differences in the levels of accuracy required by decision makers.
3. Source bias: Researchers face the problem of vested interests when they consult secondarysources. Those responsible for their compilation may have reasons for wishing to presenta more optimistic or pessimistic set of results for their organization i.e., exaggeratedfigures or inflated estimates may be stated.
4. Reliability: The reliability of published statistics may vary over time. Because the systemsof collecting data or geographical or administrative boundaries may be changed, or thebasis for stratifying a sample may have altered. Other aspects of research methodologythat affect the reliability of secondary data is the sample size, response rate, questionnairedesign and modes of analysis without any indication of this to the reader of publishedstatistics.
5. Time scale: The time period during which secondary data was first compiled may have asubstantial effect upon the nature of the data for example: Most censuses take place at ten-year intervals, so data from this and other published sources may be out-of-date at thetime the researcher wants to make use of the statistics.
Self Assessment
Fill in the blanks:
1. Secondary data can be classified as ………….and ………………secondary data
2. Those data that have been compiled by some agency other than the user are known as………………..data.
3. Internal secondary data is a part of the ………………record
4. External Secondary Data can be divided into …………parts.
5. ……………….Secondary Data is the data collected by the researcher from outside thecompany.
128 LOVELY PROFESSIONAL UNIVERSITY
Research Methodology
Notes 7.2 Special Techniques of Market Research or Syndicated Data
These techniques involve data collection on a commercial basis i.e., data collected by this methodis sold to interested clients on payment.
Example: Examples of organizations involved in collecting syndicated data are A.C.Nielson, ORG Marg, IMRB, etc. They provide business relationship survey called BRS whichestimates the following:
1. Rating
2. Profile of the company etc.
3. These people also provide TRP rating namely television rating points on a regular basis.This provides:
(i) Viewership figures
(ii) Duplication between programmes, etc. Some of the interesting studies made byIMRB are SNAP- Study of Nations Attitude and Awareness Programme. In thisstudy, the various groups of India's population and their lifestyles, attitudes ofIndian housewives were detailed.
Notes Organizations involved in collecting syndicated data provide NRS called NationalReadership Survey to the sponsors and advertising agencies.
There is also a study called FSRP which covers children in the age group of 10-19 years. Besidetheir demographics and psychographics, the study covers areas such as:
Children as decision-makers
Role models of Indian children
Pocket money and its usage
Media reviews
Favoured personalities and characteristics
Brand awareness and advertising recall.
Syndicated sources consist of market research firms offering syndicated services. These marketresearch organisations collect and update information on a continuous basis. Since data issyndicated, its cost is spread over a number of client organisations and hence is cheaper.
Example: A client firm can give certain specific question to be included in the questionnaire,which are used routinely to collect syndicated data. The client will have to pay extra charges forthese. The data generated from additional questions and analysis will be revealed only to thefirms submitting the questions.
Therefore we can say that the customization of secondary data is possible. Some areas ofsyndicated services are newspapers, periodical readership, popularity of TV channels, etc. Datafrom syndicated sources are available on a weekly or monthly basis.
LOVELY PROFESSIONAL UNIVERSITY 129
Unit 7: Secondary Data
NotesSyndicated data may be classified as:
(a) Consumer purchase data
(b) Retailer and wholesaler data
(c) Advertising data.
Most of these data collection methods as mentioned above are also known as syndicated data.Syndicated data can be classified into:
7.2.1 Consumer Purchase Data or Panel Type Data
This is one type of syndicated data. In this method there are consumer panels. Members of thispanel will be representative of the entire population. Panel members keep diaries in which theyrecord all purchases made by them. Products purchased range from packaged food to personalcare products. Members submit the dairies every month to the organisations for which they arepaid. This panel data can be used to find out the sales of the product. These panel data alsoprovides an insight into repeat purchases, effect of free samples, coupon redemption etc.
The consumer panel data also provides profile of the target audience. Nowadays, diaries arereplaced by hand-held scanners.
Notes Panels provide data on consumer buying habits on petrol, auto parts, sports goodsetc.
Limitations
Low-income groups are not represented
Some people do not want to take the trouble of keeping records of their purchases.Therefore, relevant data is not available.
Advantages
Use of scanner tied to the central computer helps the panel members to record theirpurchases early (almost immediately).
It also provides reliability and speed.
Panel can consist only of senior citizens or only children.
We also have the Consumer Mail Panel (CMP). This consists of members who are willing toanswer mail questionnaires. A large number of such households are kept on the panel. Thisserves as a universe through which panels are selected.
7.2.2 Retail and Wholesale Data
Marketing research is done in a retail store. These are organisations that provide continuousdata on grocery products. The procedure does not involve questioning people and also does notrely on their memory. This requires cooperation from the retailer to allow auditing to becarried out. Generally, retail audit involves counting of stocks between two consecutive visits.
130 LOVELY PROFESSIONAL UNIVERSITY
Research Methodology
Notes It involves inspection of goods delivered between visits. If the stock of any product in the shopis accurately counted during both the visits and data on deliveries are accurately taken from therecords, the collection of sales of a product over that period can be determined accurately asfollows:
Initial stock + Deliveries between successive visits - Second time stock = Sales
If this information is obtained from different shops from the representative sample of shops,then the accurate estimates of sales of the product can be made. To do this, some shops can betaken as a "Panel of shops" representing the universe.
Advantages
It provides information between audits on consumer purchase over the counter in specificunits. For example, KGs, bottles, No's, etc.
It provides data on shop purchases i.e., the purchases made by the retailer between audits.
It is a very reliable method.
Disadvantages
Experience is needed by the market researcher.
Cooperation is required from the retail shop.
It is time consuming.
Did u know? With the help of wholesale and retail data, the manufacturer comes to knowhow competitor is doing.
7.2.3 Advertising Data
Since a large amount of money is being spent on advertising, data needs to be collected onadvertising. One way of recording is by using passive meter. This is attached to a TV set recordswhen the set was 'On'. It will record "How long a channel is viewed". By this method, dataregarding audience interest in a channel can be ascertained. One thing to be noticed from theabove is that it only tells you that someone is viewing television at home. But it does not tell you"who is viewing at home". To find out "who is viewing" a new instrument called 'People's Meter'is introduced. This is a remote-controlled instrument buttons. Each household is given a specificbutton. When that button is pressed, it signals the control box that a specific person is viewing.This information is recorded electronically and sent to a computer that stores this informationwhich is subsequently analysed.
Miscellaneous Secondary Data
This data includes trade associations such as FICCI, CEI, Institution of Engineers, Chamber ofCommerce, libraries such as public library, university libraries, etc., literature, state and centralgovernment publications, private sources such as All India Management Association (AIMA),Financial Express and financial dailies, world bodies and international organizations such asIMF, ADB, etc.
LOVELY PROFESSIONAL UNIVERSITY 131
Unit 7: Secondary Data
Notes
Task List some major secondary sources of information for the following:
(a) Market research manager of a tea manufacturing company has to prepare acomprehensive report on the tea industry as a whole.
(b) M.T.R. has several product ideas on ready-to-eat products. It wishes to convert ideasinto products and enter the market. Before entering, the company needs to findnecessary information to assess the market potential.
(c) An MNC wishes to open a showroom in a Metro. The first step that the companywould like to take is to collect the information about suitability.
Self Assessment
Fill in the blanks:
6. Syndicated sources consist of ……………….firms offering syndicated services
7. Retail and Wholesale data provides information between ………….on consumer purchaseover the counter in specific units.
8. The consumer panel data provides profile of the ……………audience.
9. Data from syndicated sources are available on a …………..or ……………..basis.
10. The cost of syndicated data is ………since it is spread over a number of client organisations
7.3 Advantages and Disadvantages of Secondary Data
Advantages
It is economical, without the need to hire field staff.
It saves time (normally 2 to 3 months). If data is available on hand it can be tabulated inminutes.
They provide information, which retailers may not be willing to reveal to researcher.
No training is required to collect this data, unlike primary data.
Disadvantages
Because secondary data has been collected for some other projects, it may not fit in with theproblem that is being defined. In some cases, the feed is so poor that the data becomes completelyinappropriate. It may be ill-suited because of the following three reasons:
Unit of measurement
Definition of a class
Recency
Unit of Measurement
It is common for secondary data to be expressed in units.
132 LOVELY PROFESSIONAL UNIVERSITY
Research Methodology
Notes Example: Size of the retail establishments, for instance, can be expressed in terms of gross
sales, profits, square feet area and number of employees. Consumer incomes can be expressed invariables the individual, family, household etc. Secondary data available may not fit in easily.
Assume that the class intervals are quite different from those which are needed.
Example: Data available with respect to age group is as follows:
<18 year
18-24 years
25-34 years
35-44 years
Suppose the company needs a classification less than 20, 20-30 and 30-40, the above classificationof secondary data cannot be used.
Problem of Accuracy
The accuracy of secondary data available is highly questionable. A number of errors are possiblein the collection and analysis of the data. Accuracy of secondary data depends upon:
(a) Who has collected the data?
(b) How is the data collected?
(a) Who has collected the data: The reliability of the source determines the accuracy of thedata. Assume that a publisher of a private periodical conducts a survey of his readers. Themain aim of the survey is to find out the opinion of readers about advertisements appearingin it. This survey is done by the publisher in the hope that other firms will buy this databefore inserting advertisements.
Assume that a professional MR agency has conducted a similar survey and has sold itssyndicated data on many periodicals.
If you are an individual who wants information on a particular periodical you buy thedata from MR agency rather from the periodical's publisher. The reason for this is trust ofthe MR agency. The reasons for trusting the MR agency are as follows:
1. Being an independent agency there is no bias. The MR agency is likely to provide anunbiased data.
2. The data quality of MR agency will be good since they are professionals.
(b) How the data collected?
1. What instruments were used?
2. What type of sampling was done?
3. How large was the sample?
4. What was the time period of data collection? Example: days of the week, time of theday.
LOVELY PROFESSIONAL UNIVERSITY 133
Unit 7: Secondary Data
Notes
!Caution Before using the secondary data, the source of data must be verified in order toensure accuracy and reliability of data.
Recency
This pertains to "how old was the information?" If it is five years old, it may be useless. Therefore,the publication lag is a problem.
Self Assessment
Fill in the blanks:
11. There is no need to hire ………………for the purpose of secondary data.
12. Secondary data may be ill-suited because of the three reasons which are………………..,Definition of a class and Recency
13. The reliability of the source determines the ……………….of the data.
14. It is common for secondary data to be expressed in…………..
15. ………………pertains to "how old was the information?"
7.4 Summary
Secondary data are statistics that already exists.
Secondary data may not be readily used because these data are collected for some otherpurpose.
Secondary data has its own advantages and disadvantages.
There are two types of secondary data (1) Internal and (2) External secondary data.
Census is the most important among secondary data.
Syndicated data is an important form of secondary data
Syndicated data may be classified into (a) Consumer purchase data (b) Retailer andwholesale data (c) Advertising data. Each has advantages and disadvantages.
7.5 Keywords
External Data: The data collected by the researcher from outside the company.
Internal Data: Internal data are those that are found within the organisation.
Panel Type Data: This is one type of syndicated data in which there are consumer panels.
Secondary Data: Secondary data is collecting and possibly processed by people other than theresearcher in question.
Syndicated Data: Data collected by this method is sold to interested clients on payment.
134 LOVELY PROFESSIONAL UNIVERSITY
Research Methodology
Notes 7.6 Review Questions
1. What is meant by secondary data?
2. Differentiate between internal and external secondary data.
3. What are the sources of secondary data?
4. What are the types of secondary data?
5. What are the special techniques of secondary data?
6. What is the classification of syndicated data?
7. What are the advantages and limitations of syndicated data?
8. What are the advantages and disadvantages of secondary data?
9. Discuss the sources of secondary data for the study on "consumer purchasing a whitegood".
10. What is Omnibus Survey?
Answers: Self Assessment
1. Internal, External 2. secondary
3. company's 4. four
5. External 6. market research
7. audits 8. target
9. weekly, monthly 10. cheaper
11. field staff 12. Unit of measurement
13. accuracy 14. units
15. Recency
7.7 Further Readings
Books A Parasuraman, Dhruv Grewal, Marketing Research, Biztantra.
Cooper and Schinder, Business Research Methods, TMH.
CR Kotari, Research Methodology, Vishwa Prakashan.
David Luck and Ronald Rubin, Marketing Research, PHI.
GA Churchil, Marketing Research, Iacobucci, Thomson.
Naresh Amphora, Marketing Research, Pearson Education.
OR Krishna Swamy, Methodology of Research in Social Sciences, HPH.
S.N Murthy and U. Bhojanna, Business Research Methods, Excel Books, 3rd Edition.
William MC Trochim, Research Methods, Biztantra.
William Zikmund, Business Research Methods, Thomson.
LOVELY PROFESSIONAL UNIVERSITY 135
Unit 8: Descriptive Statistics
NotesUnit 8: Descriptive Statistics
CONTENTS
Objectives
Introduction
8.1 Measure of Central Tendency
8.2 Various Measures of Average
8.2.1 Arithmetic Mean
8.2.2 Weighted Arithmetic Mean
8.2.3 Median
8.2.4 Other Partition or Positional Measures
8.2.5 Mode
8.2.6 Relation between Mean, Median and Mode
8.3 Measures of Dispersion
8.4 Summary
8.5 Keywords
8.6 Review Questions
8.7 Further Readings
Objectives
After studying this unit, you will be able to:
Recognize the Meaning and Characteristics various measures of Central Tendency
Define the Arithmetic Mean
Describe the Median
State the impression of Mode
Explain the Measures of dispersion
Introduction
Let’s take a look at the most basic form of statistics, known as descriptive statistics. This branchof statistics lays the foundation for all statistical knowledge. Descriptive Statistics are used todescribe the basic features of the data gathered from an experimental study in various ways. Adescriptive statistics is distinguished from inductive statistics. They provide simple summariesabout the sample and the measures. Together with simple graphics analysis, they form the basisof virtually every quantitative analysis of data. It is necessary to be familiar with primarymethods of describing data in order to understand phenomena and make intelligent decisions.There may be two objectives for formulating a summary statistic: (1) to choose a statistic thatshows how different units seem similar. Statistical textbooks call one solution to this objective,a measure of central tendency and (2) to choose another statistic that shows how they differ. Thiskind of statistic is often called measure dispersion.
136 LOVELY PROFESSIONAL UNIVERSITY
Research Methodology
Notes 8.1 Measure of Central Tendency
Summarisation of the data is a necessary function of any statistical analysis. As a first step in thisdirection, the huge mass of unwieldy data are summarised in the form of tables and frequencydistributions. In order to bring the characteristics of the data into sharp focus, these tables andfrequency distributions need to be summarised further. A measure of central tendency or anaverage is very essential and an important summary measure in any statistical analysis.
Notes An average is a single value which can be taken as representative of the wholedistribution.
Functions of an Average
1. To present huge mass of data in a summarised form: It is very difficult for human mind tograsp a large body of numerical figures. A measure of average is used to summarise suchdata into a single figure which makes it easier to understand and remember.
2. To facilitate comparison: Different sets of data can be compared by comparing theiraverages. For example, the level of wages of workers in two factories can be compared bymean (or average) wages of workers in each of them.
3. To help in decision-making: Most of the decisions to be taken in research, planning, etc.,are based on the average value of certain variables.
Example: If the average monthly sales of a company are falling, the sales manager may haveto take certain decisions to improve it.
Characteristics of a Good Average
A good measure of average must posses the following characteristics:
1. It should be rigidly defined, preferably by an algebraic formula, so that different personsobtain the same value for a given set of data.
2. It should be easy to compute.
3. It should be easy to understand.
4. It should be based on all the observations.
5. It should be capable of further algebraic treatment.
6. It should not be unduly affected by extreme observations.
7. It should not be much affected by the fluctuations of sampling.
Self Assessment
Fill in the blanks:
1. ................................ of the data is a necessary function of any statistical analysis.
2. Different sets of data can be compared by comparing their ................................
LOVELY PROFESSIONAL UNIVERSITY 137
Unit 8: Descriptive Statistics
Notes8.2 Various Measures of Average
Various measures of average can be classified into the following three categories:
1. Mathematical Averages:
(a) Arithmetic Mean or Mean
(b) Geometric Mean
(c) Harmonic Mean
(d) Quadratic Mean
2. Positional Averages:
(a) Median
(b) Mode
3. Commercial Average:
(a) Moving Average
(b) Progressive Average
(c) Composite Average
The above measures of central tendency will be discussed in the order to their popularity. Out ofthese, the Arithmetic Mean, Median and Mode, being most popular, are discussed in that order.
8.2.1 Arithmetic Mean
Before the discussion of arithmetic mean, we shall introduce certain notations. It will be assumedthat there are n observations whose values are denoted by X1, X2, ..... Xn, respectively. The sum ofthese observations X1 + X2 + ..... + Xn will be denoted in abbreviated form as,
1
n
ii
X
where S (called sigma) denotes summation sign. The subscript of X, i.e., ‘i’ is a positive integer,which indicates the serial number of the observation. Since there are n observations, variationin i will be from 1 to n. This is indicated by writing it below and above S, as written earlier. Whenthere is no ambiguity in range of summation, this indication can be skipped and we may simplywrite X1 + X2 +..... + Xn = SXi.
Arithmetic Mean is defined as the sum of observations divided by the number of observations.It can be computed in two ways:
1. Simple arithmetic mean and
2. Weighted arithmetic mean
In case of simple arithmetic mean, equal importance is given to all the observations while inweighted arithmetic mean, the importance given to various observations is not same.
Calculation of simple arithmetic mean can be done in following ways:
1. When Individual Observations are Given
Let there be n observations X1, X2 ..... Xn. Their arithmetic mean can be calculated either bydirect method or by short cut method. The arithmetic mean of these observations will bedenoted by X .
(a) Direct Method: Under this method, X is obtained by dividing sum of observations bynumber of observations, i.e.,
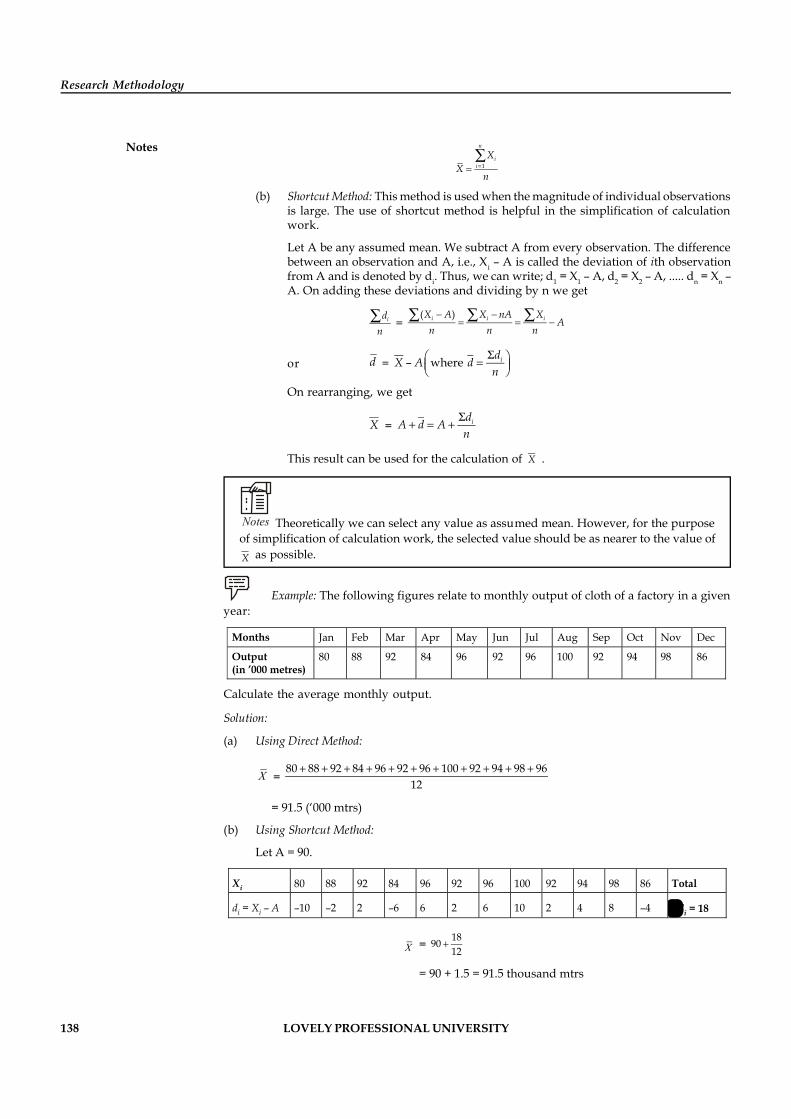
138 LOVELY PROFESSIONAL UNIVERSITY
Research Methodology
Notes1
n
ii
XX
n
(b) Shortcut Method: This method is used when the magnitude of individual observationsis large. The use of shortcut method is helpful in the simplification of calculationwork.
Let A be any assumed mean. We subtract A from every observation. The differencebetween an observation and A, i.e., Xi – A is called the deviation of ith observationfrom A and is denoted by di. Thus, we can write; d1 = X1 – A, d2 = X2 – A, ..... dn = Xn –A. On adding these deviations and dividing by n we get
idn =
( )i i iX A X nA XA
n n n
or d = – where idX A dn
On rearranging, we get
X = idA d An
This result can be used for the calculation of X .
Notes Theoretically we can select any value as assumed mean. However, for the purposeof simplification of calculation work, the selected value should be as nearer to the value ofX as possible.
Example: The following figures relate to monthly output of cloth of a factory in a givenyear:
Months Jan Feb Mar Apr May Jun Jul Aug Sep Oct Nov Dec
Output (in ’000 metres)
80 88 92 84 96 92 96 100 92 94 98 86
Calculate the average monthly output.
Solution:
(a) Using Direct Method:
X = 80 88 92 84 96 92 96 100 92 94 98 96
12
= 91.5 (‘000 mtrs)
(b) Using Shortcut Method:
Let A = 90.
Xi 80 88 92 84 96 92 96 100 92 94 98 86 Total
di = Xi – A –10 –2 2 –6 6 2 6 10 2 4 8 –4 di = 18
X = 189012
= 90 + 1.5 = 91.5 thousand mtrs
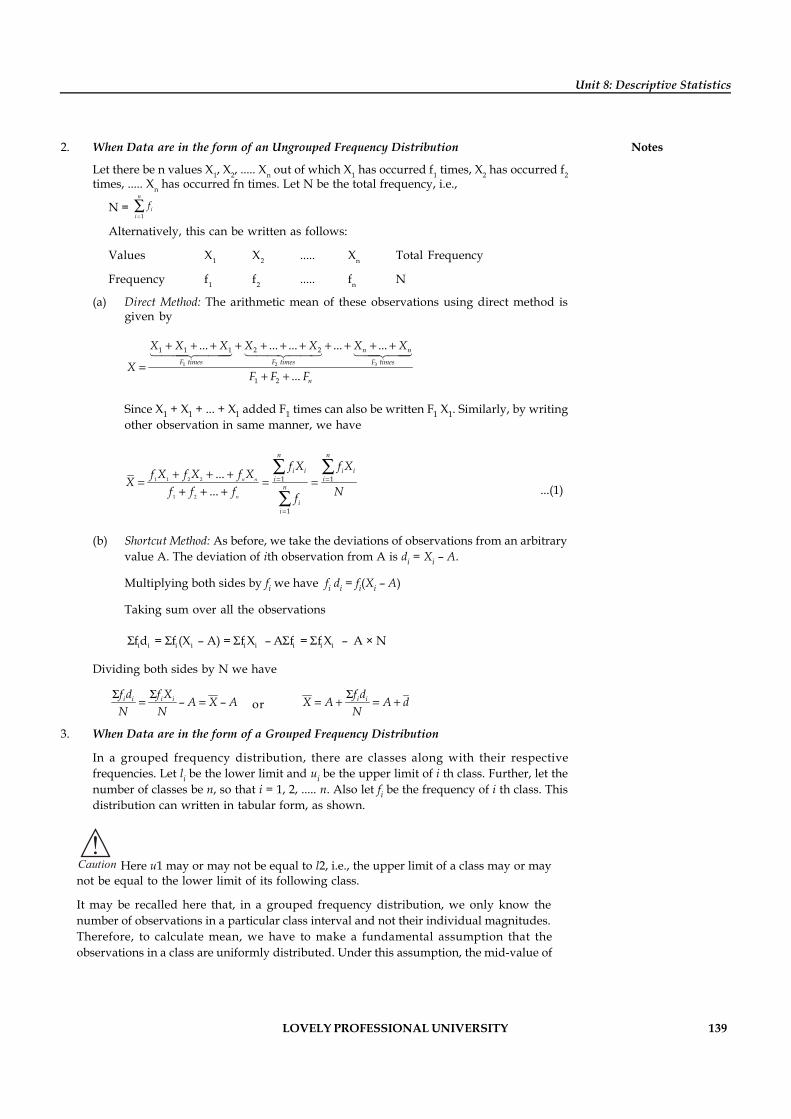
LOVELY PROFESSIONAL UNIVERSITY 139
Unit 8: Descriptive Statistics
Notes2. When Data are in the form of an Ungrouped Frequency Distribution
Let there be n values X1, X2, ..... Xn out of which X1 has occurred f1 times, X2 has occurred f2times, ..... Xn has occurred fn times. Let N be the total frequency, i.e.,
N = 1
n
ii
f
Alternatively, this can be written as follows:
Values X1 X2 ..... Xn Total Frequency
Frequency f1 f2 ..... fn N
(a) Direct Method: The arithmetic mean of these observations using direct method isgiven by
1 2 3
1 1 1 2 2
1 2
... ... ... ... ...
...
n n
F times F times F times
n
X X X X X X X
XF F F
Since X1 + X1 + ... + X1 added F1 times can also be written F1 X1. Similarly, by writingother observation in same manner, we have
1 1 2 2
1 2
1 1
1
......
n n
n
n n
i i i ii i
n
ii
f X f Xf X f X f XX
f f f Nf
...(1)
(b) Shortcut Method: As before, we take the deviations of observations from an arbitraryvalue A. The deviation of ith observation from A is di = Xi – A.
Multiplying both sides by fi we have fi di = fi(Xi – A)
Taking sum over all the observations
i i i i i i i i if d = f (X – A) = f X – A f = f X – A × N
Dividing both sides by N we have
– –i i i if d f X A X AN N
or i if dX A A dN
3. When Data are in the form of a Grouped Frequency Distribution
In a grouped frequency distribution, there are classes along with their respectivefrequencies. Let li be the lower limit and ui be the upper limit of i th class. Further, let thenumber of classes be n, so that i = 1, 2, ..... n. Also let fi be the frequency of i th class. Thisdistribution can written in tabular form, as shown.
!Caution Here u1 may or may not be equal to l2, i.e., the upper limit of a class may or maynot be equal to the lower limit of its following class.
It may be recalled here that, in a grouped frequency distribution, we only know thenumber of observations in a particular class interval and not their individual magnitudes.Therefore, to calculate mean, we have to make a fundamental assumption that theobservations in a class are uniformly distributed. Under this assumption, the mid-value of
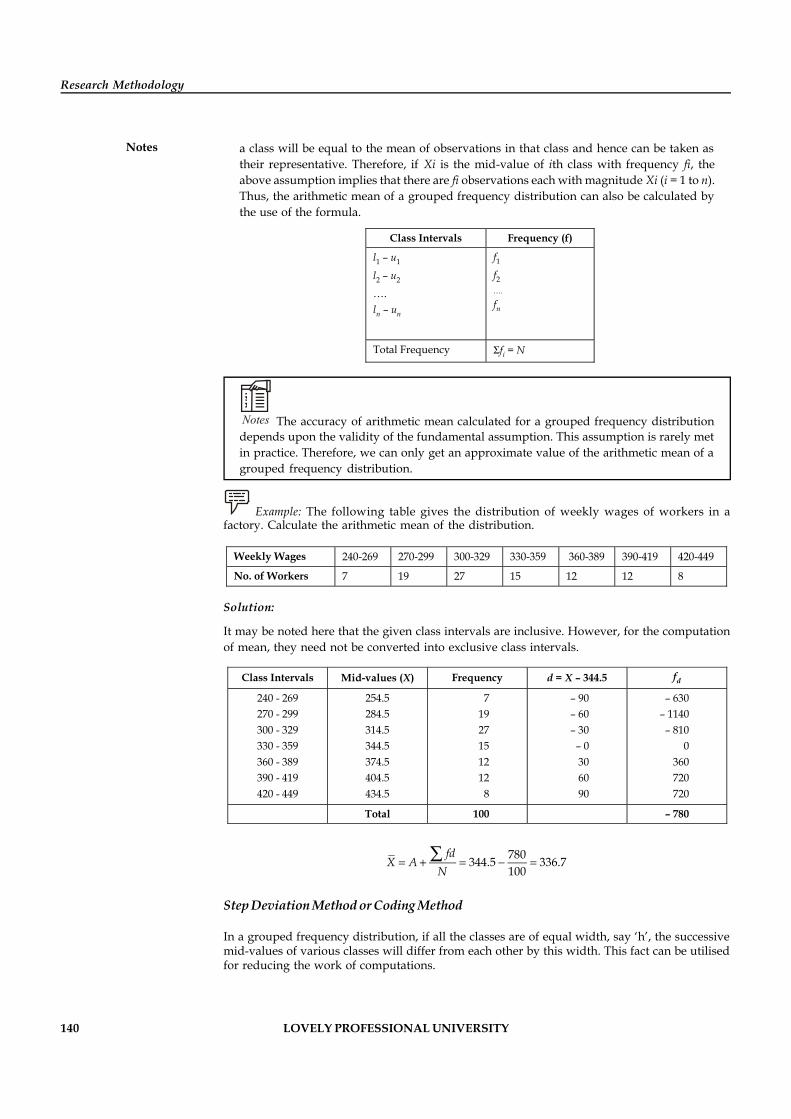
140 LOVELY PROFESSIONAL UNIVERSITY
Research Methodology
Notes a class will be equal to the mean of observations in that class and hence can be taken astheir representative. Therefore, if Xi is the mid-value of ith class with frequency fi, theabove assumption implies that there are fi observations each with magnitude Xi (i = 1 to n).Thus, the arithmetic mean of a grouped frequency distribution can also be calculated bythe use of the formula.
Class Intervals Frequency (f)
l1 – u1
l2 – u2
…. ln – un
f1
f2 …. fn
Total Frequency fi = N
Notes The accuracy of arithmetic mean calculated for a grouped frequency distributiondepends upon the validity of the fundamental assumption. This assumption is rarely metin practice. Therefore, we can only get an approximate value of the arithmetic mean of agrouped frequency distribution.
Example: The following table gives the distribution of weekly wages of workers in afactory. Calculate the arithmetic mean of the distribution.
Weekly Wages 240-269 270-299 300-329 330-359 360-389 390-419 420-449
No. of Workers 7 19 27 15 12 12 8
Solution:
It may be noted here that the given class intervals are inclusive. However, for the computationof mean, they need not be converted into exclusive class intervals.
Class Intervals Mid-values (X) Frequency d = X – 344.5 fd
240 - 269 270 - 299 300 - 329 330 - 359 360 - 389 390 - 419 420 - 449
254.5 284.5 314.5 344.5 374.5 404.5 434.5
7 19 27 15 12 12
8
– 90 – 60 – 30
– 0 30 60 90
– 630 – 1140 – 810
0 360 720 720
Total 100 – 780
780344.5 336.7100
fdX A
N
Step Deviation Method or Coding Method
In a grouped frequency distribution, if all the classes are of equal width, say ‘h’, the successivemid-values of various classes will differ from each other by this width. This fact can be utilisedfor reducing the work of computations.
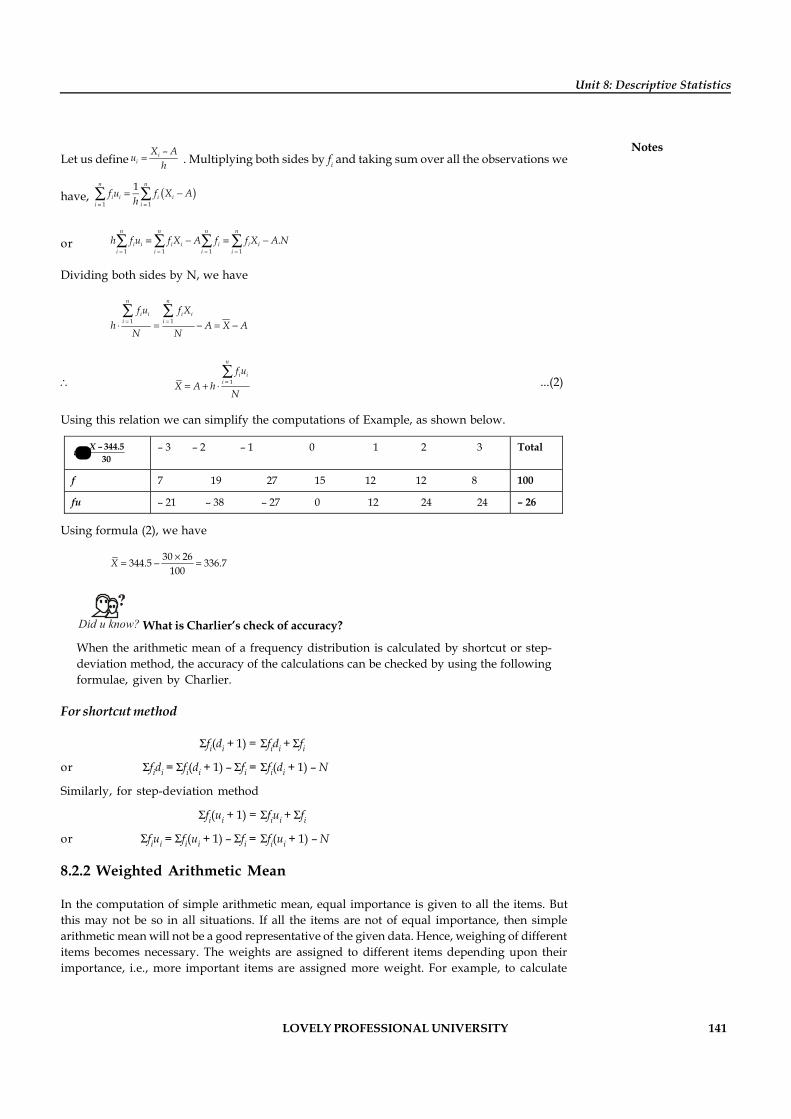
LOVELY PROFESSIONAL UNIVERSITY 141
Unit 8: Descriptive Statistics
NotesLet us define
–ii
X Auh
. Multiplying both sides by fi and taking sum over all the observations we
have, 1 1
1n n
i i i ii i
f u f X Ah
or1 1 1 1
.n n n n
i i i i i i ii i i ih f u f X A f f X AN
Dividing both sides by N, we have
1 1
n n
i i i ii i
f u f Xh A X A
N N
1
n
i ii
f uX A h
N
...(2)
Using this relation we can simplify the computations of Example, as shown below.
– 344.530
Xu
– 3 – 2 – 1 0 1 2 3 Total
f 7 19 27 15 12 12 8 100
fu – 21 – 38 – 27 0 12 24 24 – 26
Using formula (2), we have
30 26344.5 336.7100
X
Did u know? What is Charlier’s check of accuracy?
When the arithmetic mean of a frequency distribution is calculated by shortcut or step-deviation method, the accuracy of the calculations can be checked by using the followingformulae, given by Charlier.
For shortcut method
fi(di + 1) = fidi + fior fidi = fi(di + 1) – fi = fi(di + 1) – N
Similarly, for step-deviation method
fi(ui + 1) = fiui + fior fiui = fi(ui + 1) – fi = fi(ui + 1) – N
8.2.2 Weighted Arithmetic Mean
In the computation of simple arithmetic mean, equal importance is given to all the items. Butthis may not be so in all situations. If all the items are not of equal importance, then simplearithmetic mean will not be a good representative of the given data. Hence, weighing of differentitems becomes necessary. The weights are assigned to different items depending upon theirimportance, i.e., more important items are assigned more weight. For example, to calculate
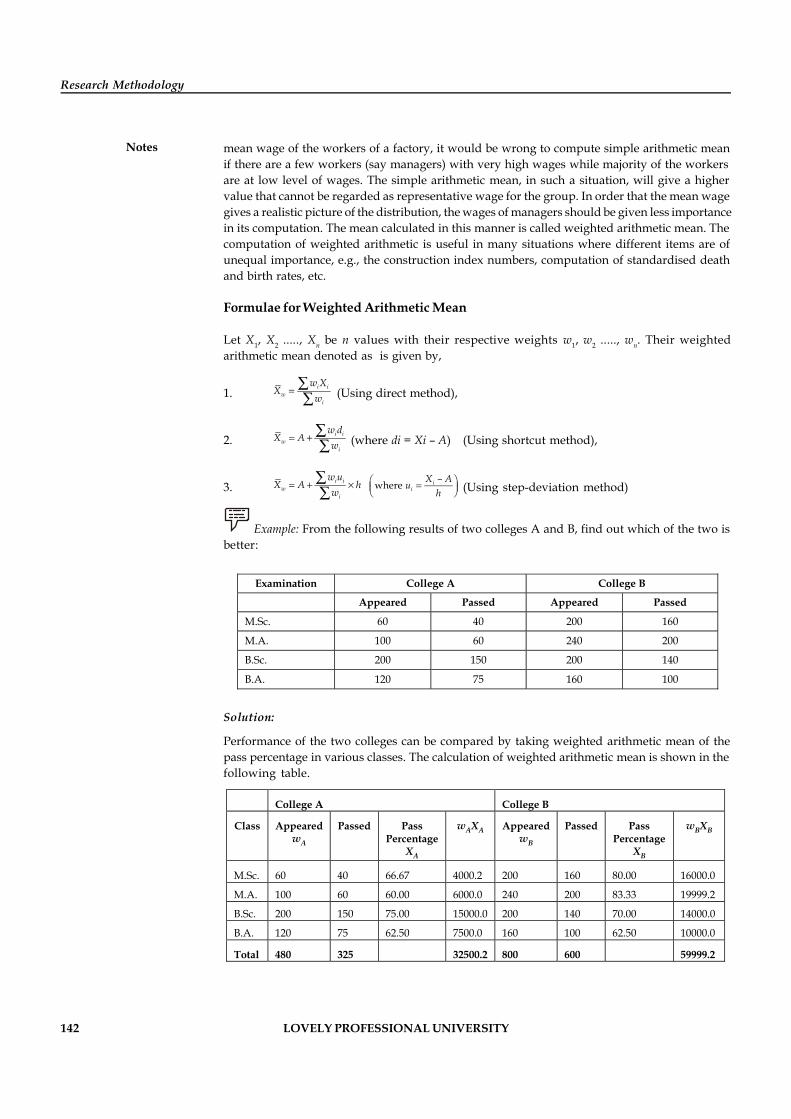
142 LOVELY PROFESSIONAL UNIVERSITY
Research Methodology
Notes mean wage of the workers of a factory, it would be wrong to compute simple arithmetic meanif there are a few workers (say managers) with very high wages while majority of the workersare at low level of wages. The simple arithmetic mean, in such a situation, will give a highervalue that cannot be regarded as representative wage for the group. In order that the mean wagegives a realistic picture of the distribution, the wages of managers should be given less importancein its computation. The mean calculated in this manner is called weighted arithmetic mean. Thecomputation of weighted arithmetic is useful in many situations where different items are ofunequal importance, e.g., the construction index numbers, computation of standardised deathand birth rates, etc.
Formulae for Weighted Arithmetic Mean
Let X1, X2 ....., Xn be n values with their respective weights w1, w2 ....., wn. Their weightedarithmetic mean denoted as is given by,
1.i i
wi
w XX
w (Using direct method),
2.i i
wi
w dX A
w
(where di = Xi – A) (Using shortcut method),
3.i i
wi
w uX A h
w
–where i
iX Au
h (Using step-deviation method)
Example: From the following results of two colleges A and B, find out which of the two isbetter:
Examination College A College B
Appeared Passed Appeared Passed
M.Sc. 60 40 200 160
M.A. 100 60 240 200
B.Sc. 200 150 200 140
B.A. 120 75 160 100
Solution:
Performance of the two colleges can be compared by taking weighted arithmetic mean of thepass percentage in various classes. The calculation of weighted arithmetic mean is shown in thefollowing table.
College A College B
Class Appeared wA
Passed Pass Percentage
XA
wAXA Appeared wB
Passed Pass Percentage
XB
wBXB
M.Sc. 60 40 66.67 4000.2 200 160 80.00 16000.0
M.A. 100 60 60.00 6000.0 240 200 83.33 19999.2
B.Sc. 200 150 75.00 15000.0 200 140 70.00 14000.0
B.A. 120 75 62.50 7500.0 160 100 62.50 10000.0
Total 480 325 32500.2 800 600 59999.2
LOVELY PROFESSIONAL UNIVERSITY 143
Unit 8: Descriptive Statistics
NotesA A
A
32500.2for College A 480w
w XX
w = 67.71%
B B
B
59999.2for College B 800w
w XX
w = 75%
Since the weighted average of pass percentage is higher for college B, hence college B is better.
Notes If X denotes simple mean and wX denotes the weighted mean of the same data, then
1. wX X , when equal weights are assigned to all the items.
2. wX X , when items of small magnitude are assigned greater weights and items oflarge magnitude are assigned lesser weights.
3. wX X , when items of small magnitude are assigned lesser weights and items oflarge magnitude are assigned greater weights.
Task Analyse the properties of Arithmetic Mean.
8.2.3 Median
Median of distribution is that value of the variate which divides it into two equal parts. In termsof frequency curve, the ordinate drawn at median divides the area under the curve into twoequal parts. Median is a positional average because its value depends upon the position of anitem and not on its magnitude.
Median can be determined under various situations like:
When Individual Observations are Given
The following steps are involved in the determination of median:
1. The given observations are arranged in either ascending or descending order of magnitude.
2. Given that there are n observations, the median is given by:
(a) The size of 12
n th observations, when n is odd.
(b) The mean of the sizes of 2n th and 1
2n th observations, when n is even.
Example: Find median of the following observations:
20, 15, 25, 28, 18, 16, 30.
Solution:
Writing the observations in ascending order, we get 15, 16, 18, 20, 25, 28, 30.
144 LOVELY PROFESSIONAL UNIVERSITY
Research Methodology
NotesSince n = 7, i.e., odd, the median is the size of 7 1
2
, i.e., 4th observation.
Hence, median, denoted by Md = 20.
Notes The same value of Md will be obtained by arranging the observations in descendingorder of magnitude.
Task Find median of data: 245, 230, 265, 236, 220, 250.
When Ungrouped Frequency Distribution is Given
In this case, the data are already arranged in the order of magnitude. Here, cumulative frequencyis computed and the median is determined in a manner similar to that of individual observations.
Example: Locate median of the following frequency distribution:
X 0 1 2 3 4 5 6 7
f 7 14 18 36 51 54 52 20
Solution:
X 0 1 2 3 4 5 6 7
f 7 14 18 36 51 54 52 20
c.f. 7 21 39 75 126 180 232 252
Here N = 252, i.e., even.
Now 252 126
2 2N
and 1 127.2N
Therefore, Median is the mean of the size of 126th and 127th observation. From the table we notethat 126th observation is 4 and 127th observation is 5.
4 5 4.52dM
Alternative Method: Looking at the frequency distribution we note that there are 126 observationswhich are less than or equal to 4 and there are 252 – 75 = 177 observations which are greater than
or equal to 4. Similarly, observation 5 also satisfies this criterion. Therefore, median = 4 5 4.5.
2
When Grouped Frequency Distribution is Given (Interpolation formula)
The determination of median, in this case, will be explained with the help of the followingexample.
Example: Suppose we wish to find the median of the following frequency distribution.
Class Intervals 0 - 10 10 - 20 20 - 30 30 - 40 40 - 50 50 - 60
Frequency 5 12 14 18 13 8
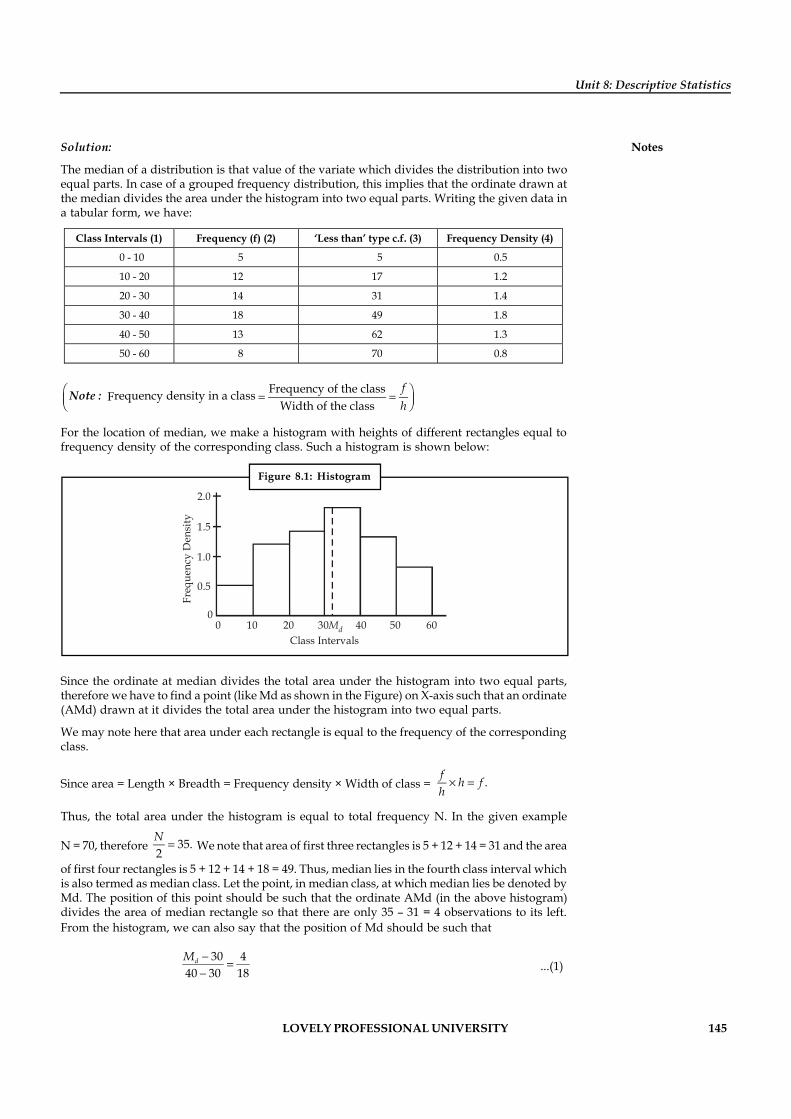
LOVELY PROFESSIONAL UNIVERSITY 145
Unit 8: Descriptive Statistics
NotesSolution:
The median of a distribution is that value of the variate which divides the distribution into twoequal parts. In case of a grouped frequency distribution, this implies that the ordinate drawn atthe median divides the area under the histogram into two equal parts. Writing the given data ina tabular form, we have:
Class Intervals (1) Frequency (f) (2) ‘Less than’ type c.f. (3) Frequency Density (4)
0 - 10 5 5 0.5
10 - 20 12 17 1.2
20 - 30 14 31 1.4
30 - 40 18 49 1.8
40 - 50 13 62 1.3
50 - 60 8 70 0.8
Frequency of the class requency density in a classF
Width of the classfh
Note :
For the location of median, we make a histogram with heights of different rectangles equal tofrequency density of the corresponding class. Such a histogram is shown below:
Figure 8.1: Histogram
0 10 20 30Md 40 50 60
2.0
1.5
1.0
0.5
0
Freq
uenc
y D
ensi
ty
Class Intervals
Since the ordinate at median divides the total area under the histogram into two equal parts,therefore we have to find a point (like Md as shown in the Figure) on X-axis such that an ordinate(AMd) drawn at it divides the total area under the histogram into two equal parts.
We may note here that area under each rectangle is equal to the frequency of the correspondingclass.
Since area = Length × Breadth = Frequency density × Width of class = .f h fh
Thus, the total area under the histogram is equal to total frequency N. In the given example
N = 70, therefore 35.2N
We note that area of first three rectangles is 5 + 12 + 14 = 31 and the area
of first four rectangles is 5 + 12 + 14 + 18 = 49. Thus, median lies in the fourth class interval whichis also termed as median class. Let the point, in median class, at which median lies be denoted byMd. The position of this point should be such that the ordinate AMd (in the above histogram)divides the area of median rectangle so that there are only 35 – 31 = 4 observations to its left.From the histogram, we can also say that the position of Md should be such that
30 440 30 18
dM
...(1)
146 LOVELY PROFESSIONAL UNIVERSITY
Research Methodology
NotesThus,
40 30 32.218dM
Writing the above equation in general notations, we have
2d m
m
N CM Lh f
or 2d m
m
N CM L h
f
...(2)
Where, Lm is lower limit, h is the width and fm is frequency of the median class and C is thecumulative frequency of classes preceding median class. Equation (2) gives the required formulafor the computation of median.
Remarks:
1. Since the variable, in a grouped frequency distribution, is assumed to be continuous wealways take exact value of including figures after decimals, when N is odd.
2. The above formula is also applicable when classes are of unequal width.
3. Median can be computed even if there are open end classes because here we need to knowonly the frequencies of classes preceding or following the median class.
Determination of Median When ‘greater than’ type Cumulative Frequencies are G
By looking at the histogram, we note that one has to find a point denoted by Md such that areato the right of the ordinate at Md is 35. The area of the last two rectangles is 13 + 8 = 21. Therefore,we have to get 35 – 21 = 14 units of area from the median rectangle towards right of the ordinate.Let Um be the upper limit of the median class. Then the formula for median in this case can bewritten as
2m d
m
N CU Mh f
or 2d m
m
N CM U h
f
...(3)
Note that C denotes the ‘greater than type’ cumulative frequency of classes following the medianclass. Applying this formula to the above example, we get
35 2140 – 10 32.218dM
Example: The following table gives the distribution of marks by 500 students in an
examination. Obtain median of the given data.
Marks 0 - 9 10 - 19 20 - 29 30 - 39 40 - 49 50 - 59 60 - 69 70 - 79
No. of Students 30 40 50 48 24 162 132 14
Solution:
Since the class intervals are inclusive, therefore, it is necessary to convert them into classboundaries.
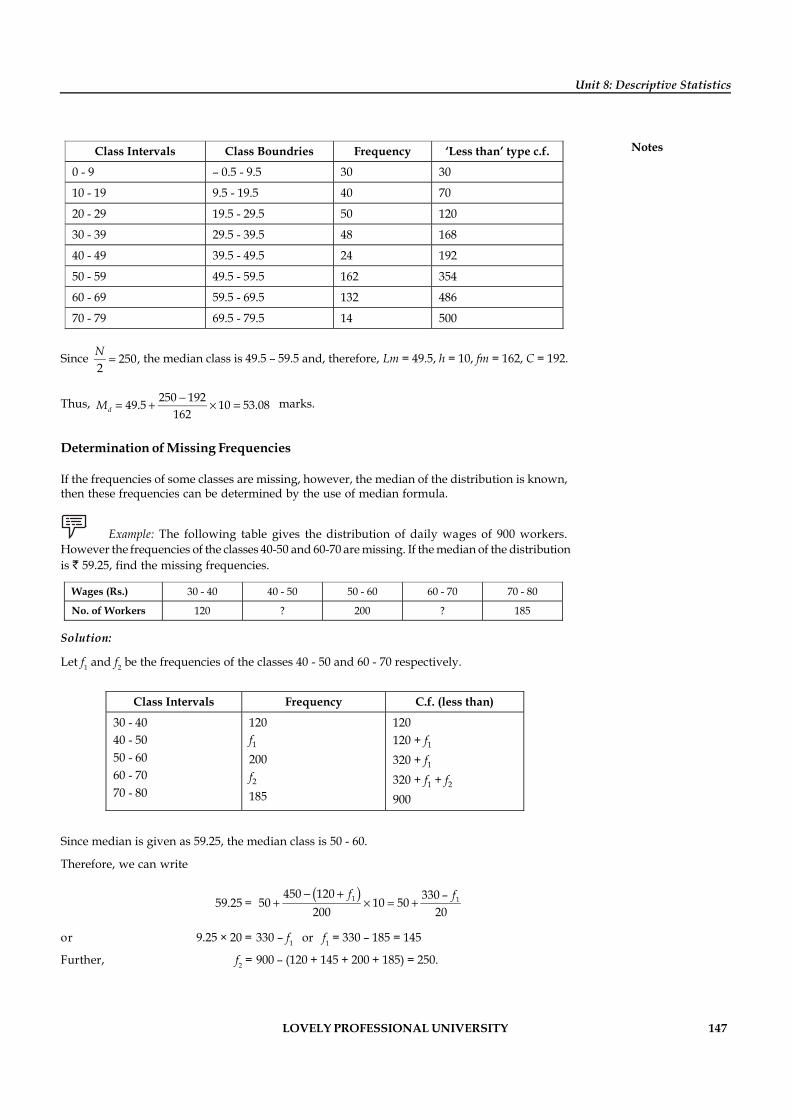
LOVELY PROFESSIONAL UNIVERSITY 147
Unit 8: Descriptive Statistics
Notes
Class Intervals Class Boundries Frequency ‘Less than’ type c.f.
0 - 9 – 0.5 - 9.5 30 30
10 - 19 9.5 - 19.5 40 70
20 - 29 19.5 - 29.5 50 120
30 - 39 29.5 - 39.5 48 168
40 - 49 39.5 - 49.5 24 192
50 - 59 49.5 - 59.5 162 354
60 - 69 59.5 - 69.5 132 486
70 - 79 69.5 - 79.5 14 500
Since 250,2N
the median class is 49.5 – 59.5 and, therefore, Lm = 49.5, h = 10, fm = 162, C = 192.
Thus, 250 19249.5 10 53.08162dM
marks.
Determination of Missing Frequencies
If the frequencies of some classes are missing, however, the median of the distribution is known,then these frequencies can be determined by the use of median formula.
Example: The following table gives the distribution of daily wages of 900 workers.However the frequencies of the classes 40-50 and 60-70 are missing. If the median of the distributionis 59.25, find the missing frequencies.
Wages (Rs.) 30 - 40 40 - 50 50 - 60 60 - 70 70 - 80
No. of Workers 120 ? 200 ? 185
Solution:
Let f1 and f2 be the frequencies of the classes 40 - 50 and 60 - 70 respectively.
Class Intervals Frequency C.f. (less than)
30 - 40 40 - 50 50 - 60 60 - 70 70 - 80
120 f1 200 f2 185
120 120 + f1 320 + f1 320 + f1 + f2 900
Since median is given as 59.25, the median class is 50 - 60.
Therefore, we can write
59.25 = 1 1450 120 330 –50 10 50200 20
f f
or 9.25 × 20 = 330 – f1 or f1 = 330 – 185 = 145
Further, f2 = 900 – (120 + 145 + 200 + 185) = 250.
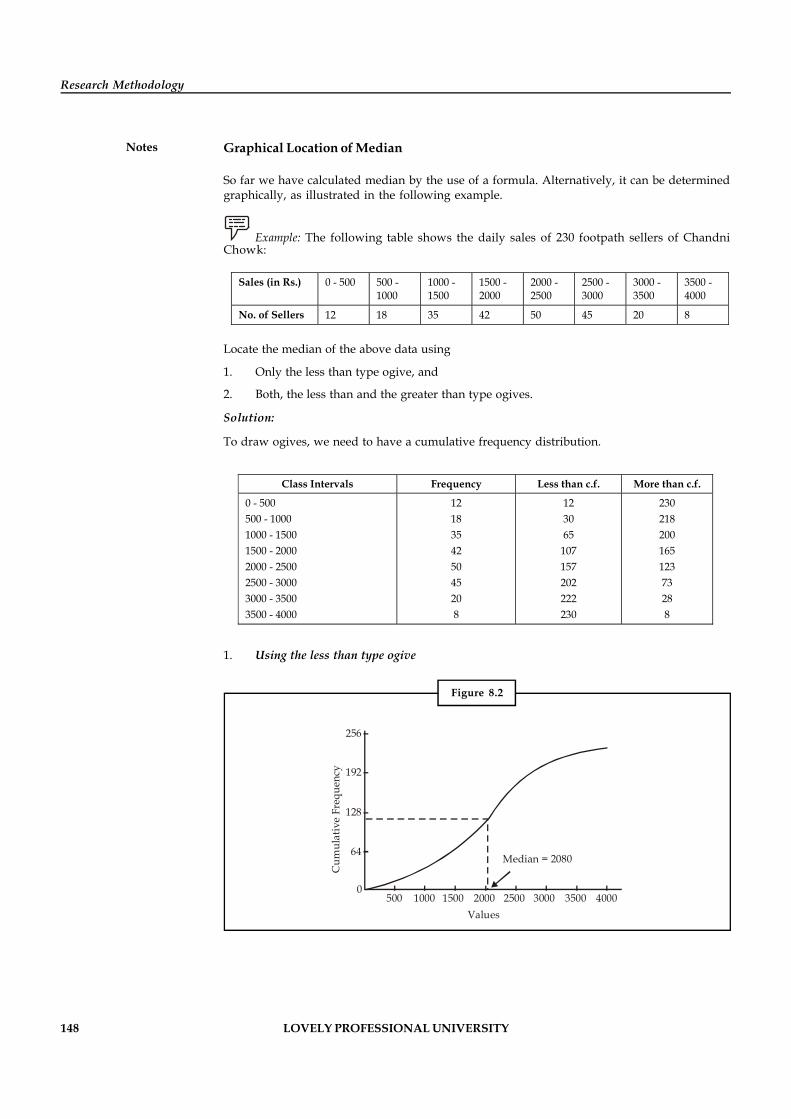
148 LOVELY PROFESSIONAL UNIVERSITY
Research Methodology
Notes Graphical Location of Median
So far we have calculated median by the use of a formula. Alternatively, it can be determinedgraphically, as illustrated in the following example.
Example: The following table shows the daily sales of 230 footpath sellers of ChandniChowk:
Sales (in Rs.) 0 - 500 500 - 1000
1000 - 1500
1500 - 2000
2000 - 2500
2500 - 3000
3000 - 3500
3500 - 4000
No. of Sellers 12 18 35 42 50 45 20 8
Locate the median of the above data using
1. Only the less than type ogive, and
2. Both, the less than and the greater than type ogives.
Solution:
To draw ogives, we need to have a cumulative frequency distribution.
Class Intervals Frequency Less than c.f. More than c.f.
0 - 500 500 - 1000 1000 - 1500 1500 - 2000 2000 - 2500 2500 - 3000 3000 - 3500 3500 - 4000
12 18 35 42 50 45 20 8
12 30 65
107 157 202 222 230
230 218 200 165 123 73 28 8
1. Using the less than type ogive
Figure 8.2
256
192
128
64
0500 1000 1500 2000 2500 3000 3500 4000
Values
Median = 2080
Cum
ulat
ive
Freq
uenc
y
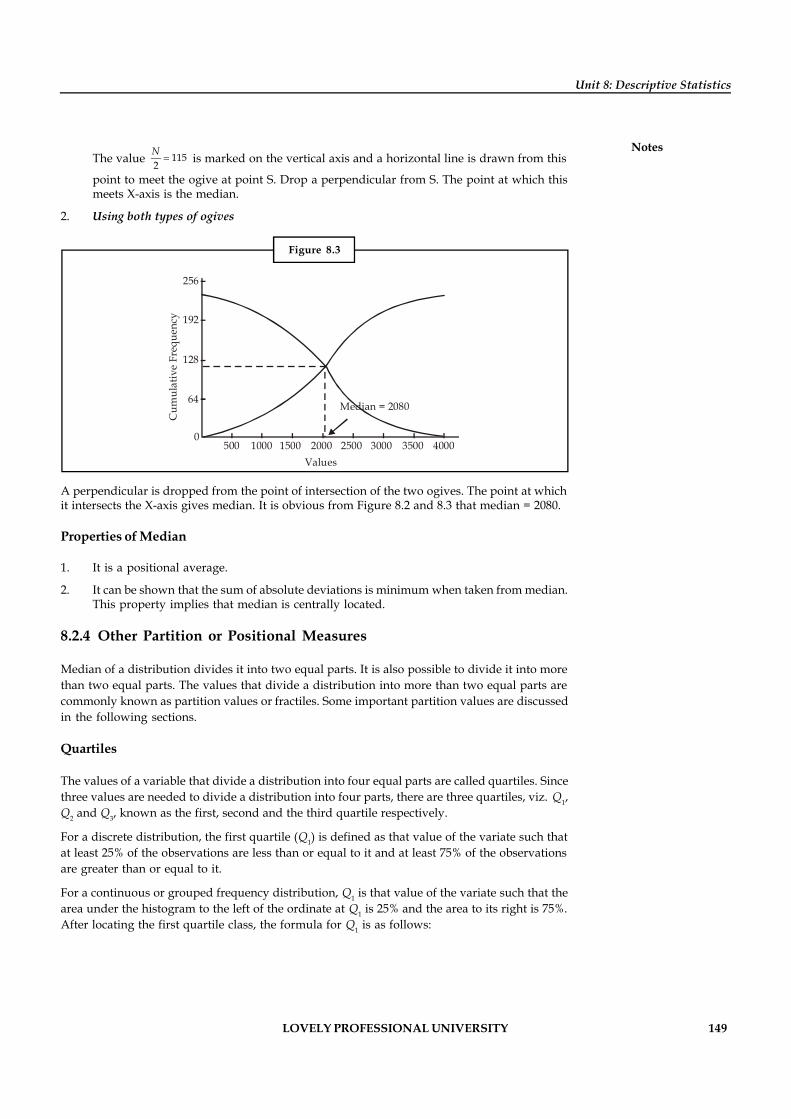
LOVELY PROFESSIONAL UNIVERSITY 149
Unit 8: Descriptive Statistics
NotesThe value 115
2N
is marked on the vertical axis and a horizontal line is drawn from this
point to meet the ogive at point S. Drop a perpendicular from S. The point at which thismeets X-axis is the median.
2. Using both types of ogives
Figure 8.3
256
192
128
64
0500 1000 1500 2000 2500 3000 3500 4000
Values
Median = 2080
Cum
ulat
ive
Freq
uenc
y
A perpendicular is dropped from the point of intersection of the two ogives. The point at whichit intersects the X-axis gives median. It is obvious from Figure 8.2 and 8.3 that median = 2080.
Properties of Median
1. It is a positional average.
2. It can be shown that the sum of absolute deviations is minimum when taken from median.This property implies that median is centrally located.
8.2.4 Other Partition or Positional Measures
Median of a distribution divides it into two equal parts. It is also possible to divide it into morethan two equal parts. The values that divide a distribution into more than two equal parts arecommonly known as partition values or fractiles. Some important partition values are discussedin the following sections.
Quartiles
The values of a variable that divide a distribution into four equal parts are called quartiles. Sincethree values are needed to divide a distribution into four parts, there are three quartiles, viz. Q1,Q2 and Q3, known as the first, second and the third quartile respectively.
For a discrete distribution, the first quartile (Q1) is defined as that value of the variate such thatat least 25% of the observations are less than or equal to it and at least 75% of the observationsare greater than or equal to it.
For a continuous or grouped frequency distribution, Q1 is that value of the variate such that thearea under the histogram to the left of the ordinate at Q1 is 25% and the area to its right is 75%.After locating the first quartile class, the formula for Q1 is as follows:
150 LOVELY PROFESSIONAL UNIVERSITY
Research Methodology
Notes
1
1
14
N CQ L h
f
Here, 1QL is lower limit of the first quartile class, h is its width,
1Qf is its frequency and C iscumulative frequency of classes preceding the first quartile class.
By definition, the second quartile is median of the distribution. The third quartile (Q3) of adistribution can also be defined in a similar manner.
For a discrete distribution, Q3 is that value of the variate such that at least 75% of the observationsare less than or equal to it and at least 25% of the observations are greater than or equal to it.
For a grouped frequency distribution, Q3 is that value of the variate such that area under thehistogram to the left of the ordinate at Q3 is 75% and the area to its right is 25%. The formula forcomputation of Q3 can be written as
3
3
3
34 ,
N CQ L h
f where the symbols have their usual meaning.
Deciles
Deciles divide a distribution into 10 equal parts and there are, in all, 9 deciles denoted as D1, D2,...... D9 respectively.
For a discrete distribution, the ith decile Di is that value of the variate such that at least (10i)% ofthe observation are less than or equal to it and at least (100 – 10i)% of the observations are greaterthan or equal to it (i = 1, 2, ...... 9).
For a continuous or grouped frequency distribution, Di is that value of the variate such that thearea under the histogram to the left of the ordinate at Di is (10i)% and the area to its right is(100 - 10i)%. The formula for the ith decile can be written as
10
i
i
i DD
iN CD L h
f(i = 1, 2, ...... 9)
Percentiles
Percentiles divide a distribution into 100 equal parts and there are, in all, 99 percentiles denotedas P1, P2, ...... P25, ...... P40, ...... P60, ...... P99, respectively.
For a discrete distribution, the kth percentile Pk is that value of the variate such that at least k%of the observations are less than or equal to it and at least (100 – k)% of the observations aregreater than or equal to it.
For a grouped frequency distribution, Pk is that value of the variate such that the area under thehistogram to the left of the ordinate at Pk is k% and the area to its right is (100 – k)%. The formulafor the kth percentile can be written as
100 ,
k
k
k PP
kN CP L h
f (k = 1, 2, ...... 99)
LOVELY PROFESSIONAL UNIVERSITY 151
Unit 8: Descriptive Statistics
NotesRemarks:
1. We may note here that P25 = Q1, P50 = D5 = Q2 = Md, P75 = Q3, P10 = D1, P20 = D2, etc.
2. In continuation of the above, the partition values are known as Quintiles (Octiles) if adistribution is divided in to 5 (8) equal parts.
3. The formulae for various partition values of a grouped frequency distribution, given sofar, are based on ‘less than’ type cumulative frequencies. The corresponding formulaebased on ‘greater than’ type cumulative frequencies can be written in a similar manner, asgiven below:
1
1
1
34
N CQ U h
f
3
3
34
N CQ U h
f
10
i
i
i DD
iNN CD U h
f 100
K
k
k PP
kNN CP U h
f
Here1Q
U , 3Q
U ,iD
U , KP
U are the upper limits of the corresponding classes and C denotes thegreater than type cumulative frequencies.
8.2.5 Mode
Mode is that value of the variate which occurs maximum number of times in a distribution andaround which other items are densely distributed. In the words of Croxton and Cowden, “Themode of a distribution is the value at the point around which the items tend to be most heavilyconcentrated. It may be regarded the most typical of a series of values.” Further, according toA.M. Tuttle, “Mode is the value which has the greatest frequency density in its immediateneighbourhood.”
If the frequency distribution is regular, then mode is determined by the value corresponding tomaximum frequency. There may be a situation where concentration of observations around avalue having maximum frequency is less than the concentration of observations around someother value. In such a situation, mode cannot be determined by the use of maximum frequencycriterion. Further, there may be concentration of observations around more than one value ofthe variable and, accordingly, the distribution is said to be bimodal or multi-modal dependingupon whether it is around two or more than two values.
The concept of mode, as a measure of central tendency, is preferable to mean and median whenit is desired to know the most typical value, e.g., the most common size of shoes, the mostcommon size of a ready-made garment, the most common size of income, the most commonsize of pocket expenditure of a college student, the most common size of a family in a locality,the most common duration of cure of viral-fever, the most popular candidate in an election, etc.
Mode can be determined under following situations like:
When Data are either in the form of Individual Observations or in the form of UngroupedFrequency Distribution
Given individual observations, these are first transformed into an ungrouped frequencydistribution. The mode of an ungrouped frequency distribution can be determined in two ways,as given below:
1. By inspection or
2. By method of grouping.
152 LOVELY PROFESSIONAL UNIVERSITY
Research Methodology
Notes 1. By inspection: When a frequency distribution is fairly regular, then mode is oftendetermined by inspection. It is that value of the variate for which frequency is maximum.By a fairly regular frequency distribution we mean that as the values of the variableincrease the corresponding frequencies of these values first increase in a gradual mannerand reach a peak at certain value and, finally, start declining gradually in, approximately,the same manner as in case of increase.
Example: Compute mode of the following data:
3, 4, 5, 10, 15, 3, 6, 7, 9, 12, 10, 16, 18,
20, 10, 9, 8, 19, 11, 14, 10, 13, 17, 9, 11
Solution:
Writing this in the form of a frequency distribution, we get
Values 3 4 5 6 7 8 9 10 11 12 13 14 15 16 17 18 19 20
Frequency 2 1 1 1 1 1 3 4 2 1 1 1 1 1 1 1 1 1
Mode = 10
Notes
1. If the frequency of each possible value of the variable is same, there is no mode.
2. If there are two values having maximum frequency, the distribution is said to bebimodal.
Example: Determine the mode of the following distribution:
X 10 11 12 13 14 15 16 17 18 19
f 8 15 20 100 98 95 90 75 50 30
Solution:
This distribution is not regular because there is sudden increase in frequency from 20 to 100.Therefore, mode cannot be located by inspection and hence the method of grouping is used.Various steps involved in this method are as follows:
1. Prepare a table consisting of 6 columns in addition to a column for various values of X.
2. In the first column, write the frequencies against various values of X as given in thequestion.
3. In second column, the sum of frequencies, starting from the top and grouped in twos, arewritten.
4. In third column, the sum of frequencies, starting from the second and grouped in twos, arewritten.
5. In fourth column, the sum of frequencies, starting from the top and grouped in threes arewritten.
6. In fifth column, the sum of frequencies, starting from the second and grouped in threes arewritten.
7. In the sixth column, the sum of frequencies, starting from the third and grouped in threesare written.
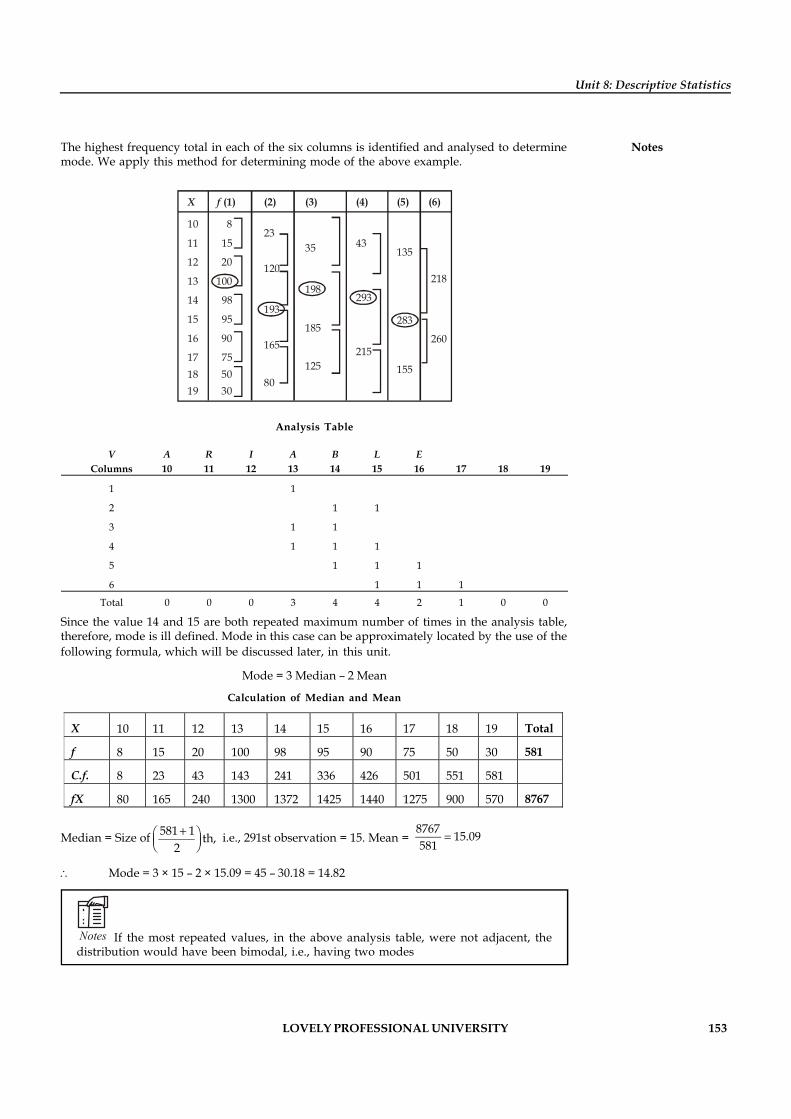
LOVELY PROFESSIONAL UNIVERSITY 153
Unit 8: Descriptive Statistics
NotesThe highest frequency total in each of the six columns is identified and analysed to determinemode. We apply this method for determining mode of the above example.
X f (1) (2) (3) (4) (5) (6)
10
11
12
13
14
15
16
17
8
15
20
100
98
95
90
75
23
120
193
165
80
35 43135
1819
5030
125
198
185
293
215
283
155
218
260
Analysis Table
V A R I A B L E Columns 10 11 12 13 14 15 16 17 18 19
1 1
2 1 1
3 1 1
4 1 1 1
5 1 1 1
6 1 1 1
Total 0 0 0 3 4 4 2 1 0 0
Since the value 14 and 15 are both repeated maximum number of times in the analysis table,therefore, mode is ill defined. Mode in this case can be approximately located by the use of thefollowing formula, which will be discussed later, in this unit.
Mode = 3 Median – 2 Mean
Calculation of Median and Mean
X 10 11 12 13 14 15 16 17 18 19 Total
f 8 15 20 100 98 95 90 75 50 30 581
C.f. 8 23 43 143 241 336 426 501 551 581
fX 80 165 240 1300 1372 1425 1440 1275 900 570 8767
Median = Size of 581 1 th,2+æ ö
ç ÷è ø i.e., 291st observation = 15. Mean = 8767 15.09581
=
Mode = 3 × 15 – 2 × 15.09 = 45 – 30.18 = 14.82
Notes If the most repeated values, in the above analysis table, were not adjacent, thedistribution would have been bimodal, i.e., having two modes
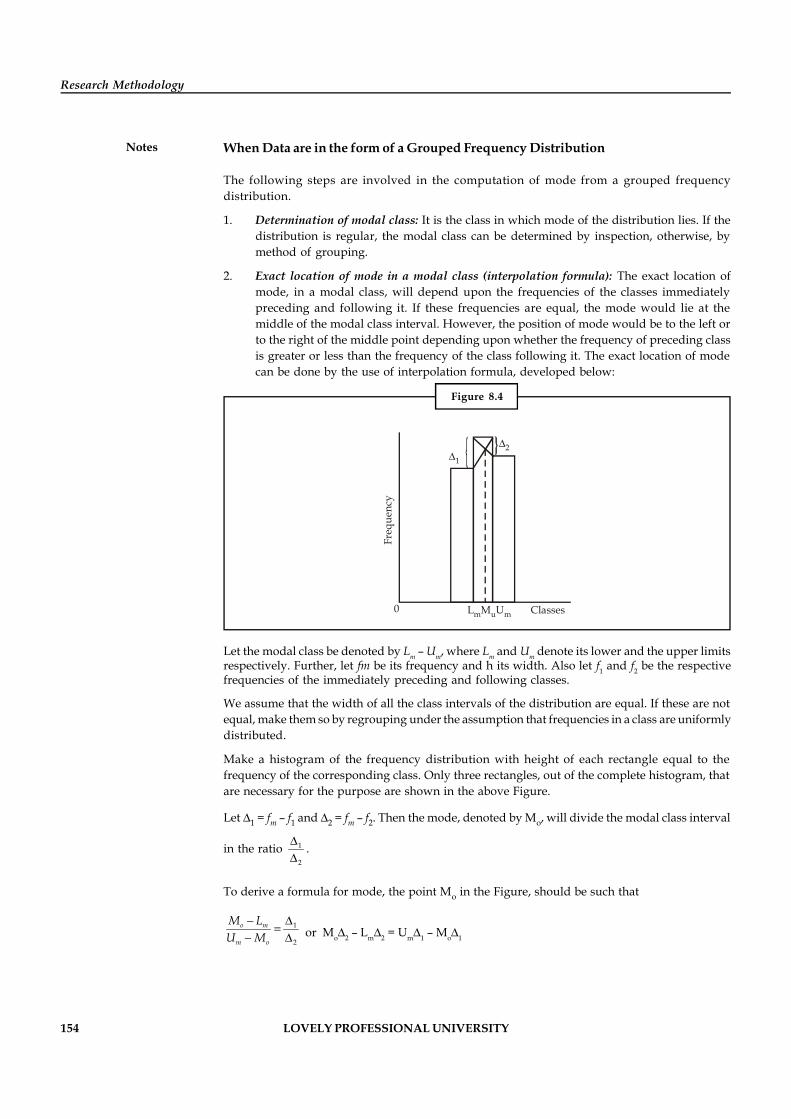
154 LOVELY PROFESSIONAL UNIVERSITY
Research Methodology
Notes When Data are in the form of a Grouped Frequency Distribution
The following steps are involved in the computation of mode from a grouped frequencydistribution.
1. Determination of modal class: It is the class in which mode of the distribution lies. If thedistribution is regular, the modal class can be determined by inspection, otherwise, bymethod of grouping.
2. Exact location of mode in a modal class (interpolation formula): The exact location ofmode, in a modal class, will depend upon the frequencies of the classes immediatelypreceding and following it. If these frequencies are equal, the mode would lie at themiddle of the modal class interval. However, the position of mode would be to the left orto the right of the middle point depending upon whether the frequency of preceding classis greater or less than the frequency of the class following it. The exact location of modecan be done by the use of interpolation formula, developed below:
Figure 8.4
1
2
0 L M Um u m Classes
Freq
uenc
y
Let the modal class be denoted by Lm – Um, where Lm and Um denote its lower and the upper limitsrespectively. Further, let fm be its frequency and h its width. Also let f1 and f2 be the respectivefrequencies of the immediately preceding and following classes.
We assume that the width of all the class intervals of the distribution are equal. If these are notequal, make them so by regrouping under the assumption that frequencies in a class are uniformlydistributed.
Make a histogram of the frequency distribution with height of each rectangle equal to thefrequency of the corresponding class. Only three rectangles, out of the complete histogram, thatare necessary for the purpose are shown in the above Figure.
Let 1 = fm – f1 and 2 = fm – f2. Then the mode, denoted by Mo, will divide the modal class interval
in the ratio 1
2
.
To derive a formula for mode, the point Mo in the Figure, should be such that
1
2
o m
m o
M LU M
- =
- or Mo2 – Lm2 = Um1 – Mo1
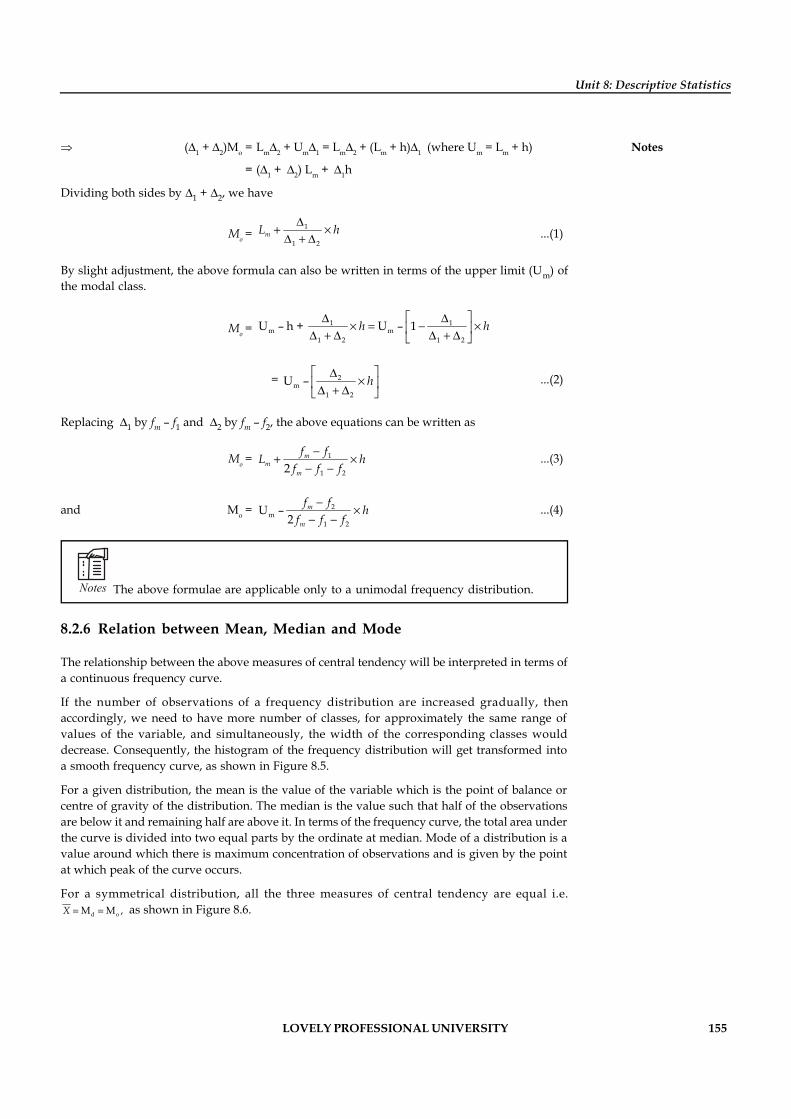
LOVELY PROFESSIONAL UNIVERSITY 155
Unit 8: Descriptive Statistics
Notes (1 + 2)Mo = Lm2 + Um1 = Lm2 + (Lm + h)1 (where Um = Lm + h)
= (1 + 2) Lm + 1h
Dividing both sides by 1 + 2, we have
Mo =1
1 2mL h+ ´ + ...(1)
By slight adjustment, the above formula can also be written in terms of the upper limit (Um) ofthe modal class.
Mo =1 1
m m1 2 1 2
U – h + U – 1h hé ù
´ = - ´ê ú + + ë û
= 2m
1 2
U – hé ù
´ê ú + ë û...(2)
Replacing 1 by fm – f1 and 2 by fm – f2, the above equations can be written as
Mo =1
1 22m
mm
f fL hf f f
-+ ´
- -...(3)
and Mo =2
m1 2
U –2
m
m
f f hf f f
-´
- -...(4)
Notes The above formulae are applicable only to a unimodal frequency distribution.
8.2.6 Relation between Mean, Median and Mode
The relationship between the above measures of central tendency will be interpreted in terms ofa continuous frequency curve.
If the number of observations of a frequency distribution are increased gradually, thenaccordingly, we need to have more number of classes, for approximately the same range ofvalues of the variable, and simultaneously, the width of the corresponding classes woulddecrease. Consequently, the histogram of the frequency distribution will get transformed intoa smooth frequency curve, as shown in Figure 8.5.
For a given distribution, the mean is the value of the variable which is the point of balance orcentre of gravity of the distribution. The median is the value such that half of the observationsare below it and remaining half are above it. In terms of the frequency curve, the total area underthe curve is divided into two equal parts by the ordinate at median. Mode of a distribution is avalue around which there is maximum concentration of observations and is given by the pointat which peak of the curve occurs.
For a symmetrical distribution, all the three measures of central tendency are equal i.e.d oM M ,X = = as shown in Figure 8.6.
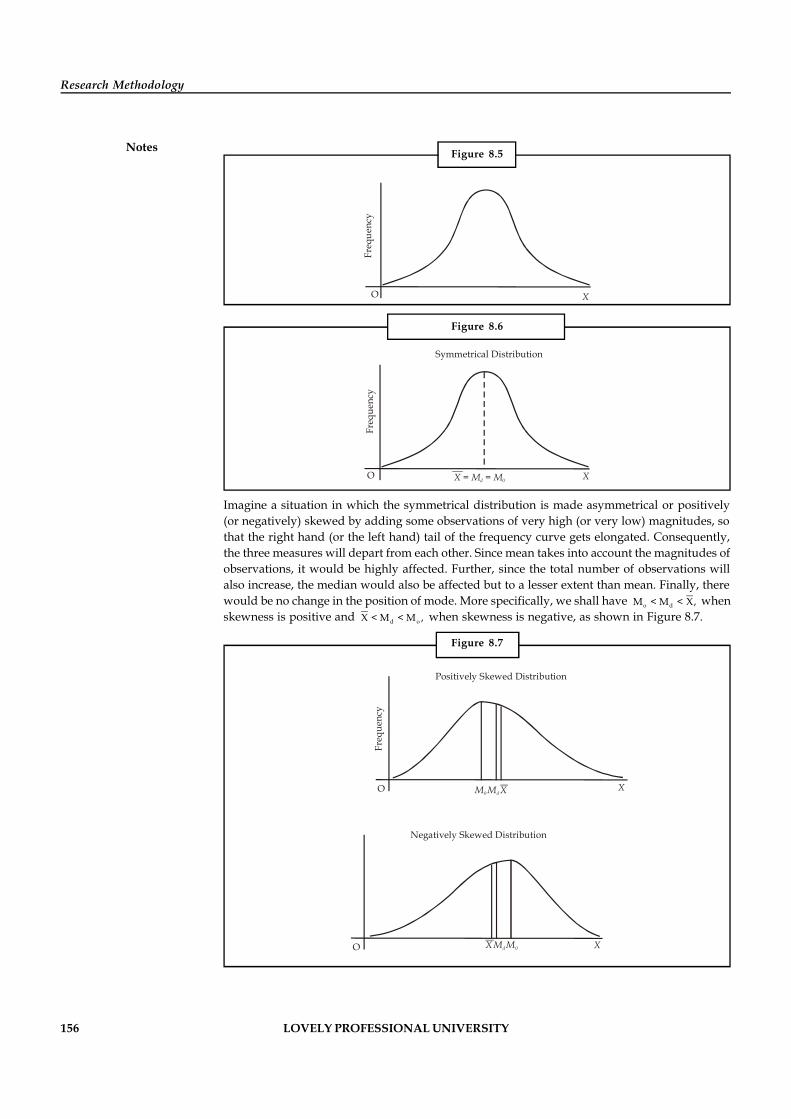
156 LOVELY PROFESSIONAL UNIVERSITY
Research Methodology
Notes Figure 8.5
Freq
uenc
y
O X
Figure 8.6
Freq
uenc
y
O XX = M = Md 0
Symmetrical Distribution
Imagine a situation in which the symmetrical distribution is made asymmetrical or positively(or negatively) skewed by adding some observations of very high (or very low) magnitudes, sothat the right hand (or the left hand) tail of the frequency curve gets elongated. Consequently,the three measures will depart from each other. Since mean takes into account the magnitudes ofobservations, it would be highly affected. Further, since the total number of observations willalso increase, the median would also be affected but to a lesser extent than mean. Finally, therewould be no change in the position of mode. More specifically, we shall have o dM < M < X, whenskewness is positive and d oX < M < M , when skewness is negative, as shown in Figure 8.7.
Figure 8.7
Freq
uenc
y
O XM M X 0 d
Positively Skewed Distribution
O XX M M d 0
Negatively Skewed Distribution
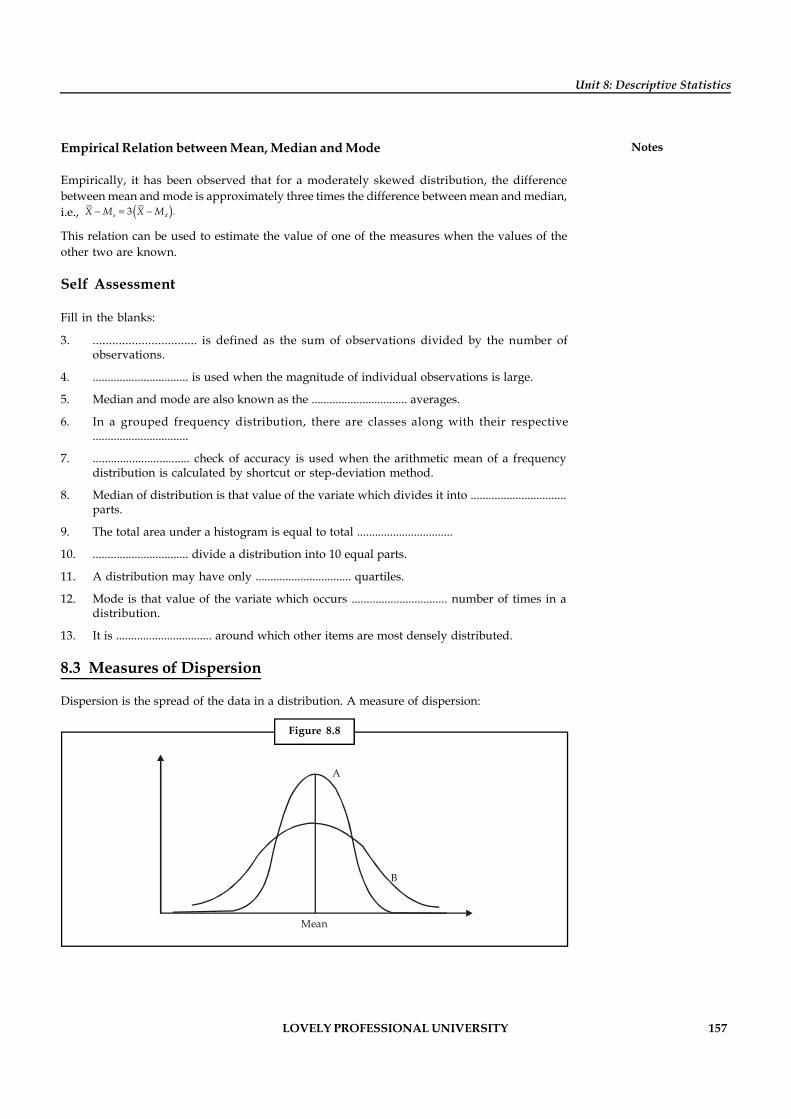
LOVELY PROFESSIONAL UNIVERSITY 157
Unit 8: Descriptive Statistics
NotesEmpirical Relation between Mean, Median and Mode
Empirically, it has been observed that for a moderately skewed distribution, the differencebetween mean and mode is approximately three times the difference between mean and median,i.e., 3 .o dX M X M
This relation can be used to estimate the value of one of the measures when the values of theother two are known.
Self Assessment
Fill in the blanks:
3. ................................ is defined as the sum of observations divided by the number ofobservations.
4. ................................ is used when the magnitude of individual observations is large.
5. Median and mode are also known as the ................................ averages.
6. In a grouped frequency distribution, there are classes along with their respective................................
7. ................................ check of accuracy is used when the arithmetic mean of a frequencydistribution is calculated by shortcut or step-deviation method.
8. Median of distribution is that value of the variate which divides it into ................................parts.
9. The total area under a histogram is equal to total ................................
10. ................................ divide a distribution into 10 equal parts.
11. A distribution may have only ................................ quartiles.
12. Mode is that value of the variate which occurs ................................ number of times in adistribution.
13. It is ................................ around which other items are most densely distributed.
8.3 Measures of Dispersion
Dispersion is the spread of the data in a distribution. A measure of dispersion:
Figure 8.8
A
B
Mean
158 LOVELY PROFESSIONAL UNIVERSITY
Research Methodology
Notes Indicates the degrees of the scatteredness of the observations. Let curves A and B represent twofrequency distributions. Observe that A and B have the same mean. But curve A has less variabilitythan B.
If we measure only the mean of these two distributions, we will miss an important differencebetween A and B. To increase our understanding of the pattern of the data, we must also measureits dispersion.
Let us understand various measures of dispersion:
1. Range: It is the difference between the highest and lowest observed values.
i.e. range = H – L, H = Highest, L = Lowest.
Notes
1. Range is the crudest measure of dispersion.
2. H – LH + L
is called the coefficient of range.
2. Semi-inter Quartile Range (Quartile deviation): Semi-inter quartile range Q.
Q is given by 3 1Q – QQ = 2
Notes
1. 3 1
3 1
Q – QQ Q
is called the coefficient of quartile deviation.
2. Quartile deviation is not a true measure of dispersion but only a distance of scale.
3. Mean Deviation (MD): If A is any average then mean deviation about A is given by:
MD(A) = i if |x – A|N
Notes
1. Mean deviation about mean | |MD(x)= i if x xN
2. Of all the mean deviations taken about different averages mean derivation aboutthe median is the least.
3.MD(A)
A is called the coefficient of mean deviation.
LOVELY PROFESSIONAL UNIVERSITY 159
Unit 8: Descriptive Statistics
Notes4. Variance and Standard Deviation:
Variance (2): A measure of the average squared distance between the mean and each termin the population.
2 = 21 ( )i if x xNS -
Standard deviation () is the positive square root of the variance:
= 21 ( – )i if x xNS
2 = 2 21 ( ( )i if x xNS -
Notes Combined variance of two sets of data of N1 and N2 items with means x1 and x2
and standard deviations 1 and 2 respectively is obtained by:
2 =2 2 2 2
1 1 2 2 1 1 1 2
1 2
N N N d N dN N
+ + ++
Where 21d = (x – x1)2 and 2
2d = (x – x2)2
and x = 1 1 2 2
1 2
N x N xN N
++
Sample variance (2) : Let x1, x2, x3,……… xn, represent a sample with mean x.
Then sample variance 2 is given by:
2 =2( – )
1x xn -
å
=2 2n(x)–1 1x
n n- -å
Notes = 2 2 2( ) ( )
1 1 1x x x n xn n n-
= -- - -
å å is called the sample standard deviation.
5. Coefficient of Variation (C.V): It is a relative measure of dispersion that enables us tocompare two distributions. It relates the standard deviation and the mean by expressingthe standard deviation as a percentage of the mean.
C.V. = 100x
Notes 1. Coefficient of variation is independent of the unit of the observation.
2. This measure cannot be used when x is zero or close to zero.
160 LOVELY PROFESSIONAL UNIVERSITY
Research Methodology
NotesExample: For the data 103, 50, 68, 110, 105, 108, 174, 103, 150, 200, 225, 350, 103 find the
range, coefficient of range and coefficient of quartile deviation.
Solution:
Range = H – L = 350 – 50 = 300
Coefficient of range 300 0.7350 50
H LH L
To find Q1 and Q3 we arrange the data in ascending order:
50, 68, 103, 103, 103, 103, 105, 108, 110, 150, 174, 200, 225, 350,
1 14 3.5,4 4
n
3( 1) 10.54
n
Q1 = 103 + 0.5 (103 – 103) = 103
Q3 = 174 + 0.5 (200 – 174) = 187
Coefficient of QD =84 0.2896290
Self Assessment
Fill in the blanks:
14. ................................ is the spread of the data in a distribution.
15. ................................ is a measure of the average squared distance between the mean andeach term in the population.
8.4 Summary
Descriptive statistics are used to describe the basic features of the data in a study.
They provide simple summaries about the sample and the measures.
Together with simple graphics analysis, they form the basis of virtually every quantitativeanalysis of data.
Descriptive Statistics are used to present quantitative descriptions in a manageable form.In a research study we may have lots of measures.
When summarizing a quantity like length or weight or age, it is common to answer thefirst question with the arithmetic mean, the median, or, in case of a unimodal distribution,the mode.
Sometimes, we choose specific values from the cumulative distribution function calledquantiles.
The most common measures of variability for quantitative data are the variance; its squareroot, the standard deviation; the range; interquartile range; and the average absolutedeviation (average deviation).
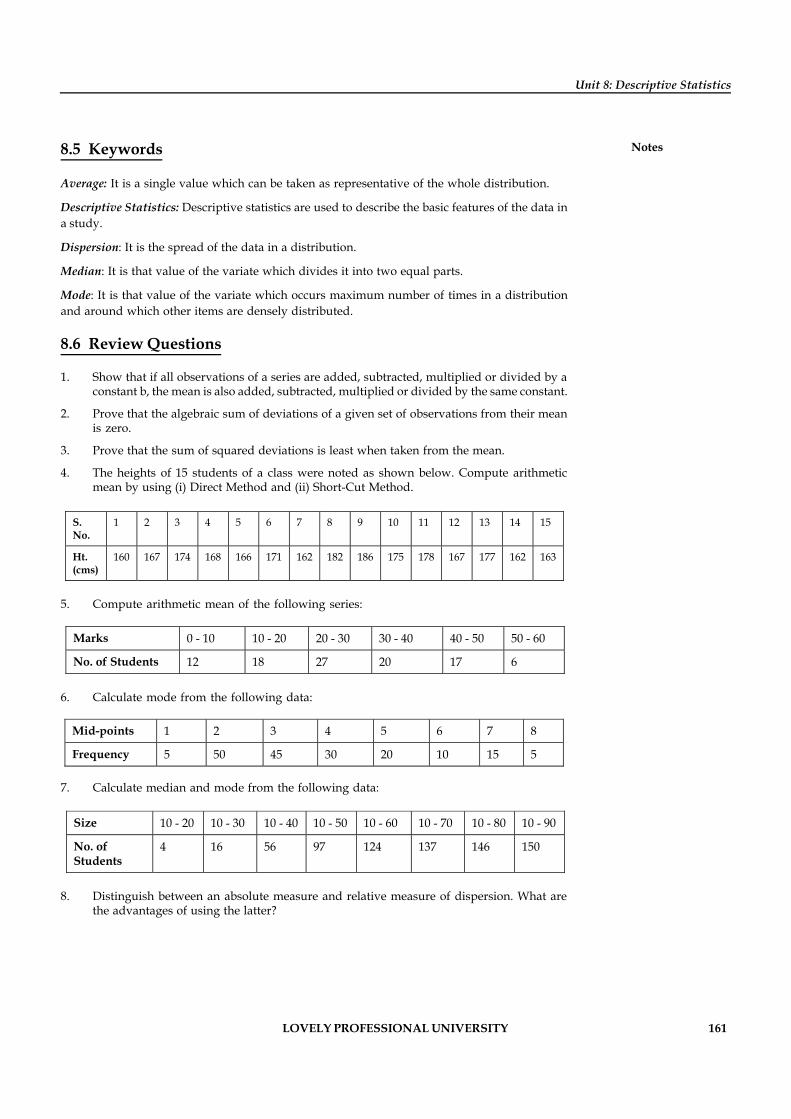
LOVELY PROFESSIONAL UNIVERSITY 161
Unit 8: Descriptive Statistics
Notes8.5 Keywords
Average: It is a single value which can be taken as representative of the whole distribution.
Descriptive Statistics: Descriptive statistics are used to describe the basic features of the data ina study.
Dispersion: It is the spread of the data in a distribution.
Median: It is that value of the variate which divides it into two equal parts.
Mode: It is that value of the variate which occurs maximum number of times in a distributionand around which other items are densely distributed.
8.6 Review Questions
1. Show that if all observations of a series are added, subtracted, multiplied or divided by aconstant b, the mean is also added, subtracted, multiplied or divided by the same constant.
2. Prove that the algebraic sum of deviations of a given set of observations from their meanis zero.
3. Prove that the sum of squared deviations is least when taken from the mean.
4. The heights of 15 students of a class were noted as shown below. Compute arithmeticmean by using (i) Direct Method and (ii) Short-Cut Method.
S. No.
1 2 3 4 5 6 7 8 9 10 11 12 13 14 15
Ht. (cms)
160 167 174 168 166 171 162 182 186 175 178 167 177 162 163
5. Compute arithmetic mean of the following series:
Marks 0 - 10 10 - 20 20 - 30 30 - 40 40 - 50 50 - 60
No. of Students 12 18 27 20 17 6
6. Calculate mode from the following data:
Mid-points 1 2 3 4 5 6 7 8
Frequency 5 50 45 30 20 10 15 5
7. Calculate median and mode from the following data:
Size 10 - 20 10 - 30 10 - 40 10 - 50 10 - 60 10 - 70 10 - 80 10 - 90
No. of Students
4 16 56 97 124 137 146 150
8. Distinguish between an absolute measure and relative measure of dispersion. What are
the advantages of using the latter?
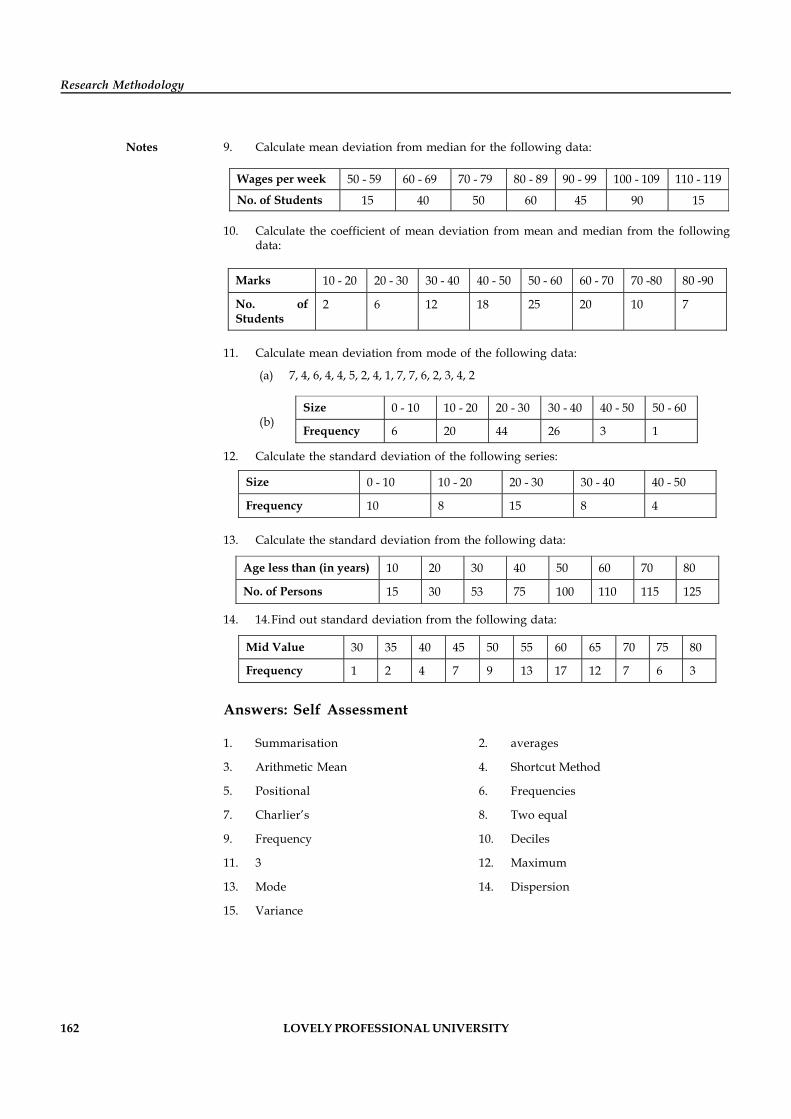
162 LOVELY PROFESSIONAL UNIVERSITY
Research Methodology
Notes 9. Calculate mean deviation from median for the following data:
Wages per week 50 - 59 60 - 69 70 - 79 80 - 89 90 - 99 100 - 109 110 - 119
No. of Students 15 40 50 60 45 90 15
10. Calculate the coefficient of mean deviation from mean and median from the followingdata:
Marks 10 - 20 20 - 30 30 - 40 40 - 50 50 - 60 60 - 70 70 -80 80 -90
No. of Students
2 6 12 18 25 20 10 7
11. Calculate mean deviation from mode of the following data:
(a) 7, 4, 6, 4, 4, 5, 2, 4, 1, 7, 7, 6, 2, 3, 4, 2
(b)Size 0 - 10 10 - 20 20 - 30 30 - 40 40 - 50 50 - 60
Frequency 6 20 44 26 3 1 12. Calculate the standard deviation of the following series:
Size 0 - 10 10 - 20 20 - 30 30 - 40 40 - 50
Frequency 10 8 15 8 4
13. Calculate the standard deviation from the following data:
Age less than (in years) 10 20 30 40 50 60 70 80
No. of Persons 15 30 53 75 100 110 115 125 14. 14.Find out standard deviation from the following data:
Mid Value 30 35 40 45 50 55 60 65 70 75 80
Frequency 1 2 4 7 9 13 17 12 7 6 3
Answers: Self Assessment
1. Summarisation 2. averages
3. Arithmetic Mean 4. Shortcut Method
5. Positional 6. Frequencies
7. Charlier’s 8. Two equal
9. Frequency 10. Deciles
11. 3 12. Maximum
13. Mode 14. Dispersion
15. Variance

LOVELY PROFESSIONAL UNIVERSITY 163
Unit 8: Descriptive Statistics
Notes8.7 Further Readings
Books Abrams, M.A, Social Surveys and Social Action, London: Heinemann, 1951.
Arthur, Maurice, Philosophy of Scientific Investigation , Baltimore: John HopkinsUniversity Press, 1943.
R.S. Bhardwaj, Business Statistics, Excel Books, New Delhi, 2008.
S.N. Murthy and U. Bhojanna, Business Research Methods, Excel Books, 2007.
164 LOVELY PROFESSIONAL UNIVERSITY
Research Methodology
Notes Unit 9: Correlation and Regression
CONTENTS
Objectives
Introduction
9.1 Correlation
9.1.1 Scatter Diagram
9.1.2 Karl Pearson’s Coefficient of Linear Correlation
9.1.3 Properties of Coefficient of Correlation
9.1.4 Merits and Limitations of Coefficient of Correlation
9.1.5 Probable Error of r
9.1.6 Correlation in a Bivariate Frequency Distribution
9.1.7 Spearman’s Rank Correlation
9.1.8 Case of Tied Ranks
9.1.9 Limits of Rank Correlation
9.1.10 Coefficient of Correlation by Concurrent Deviation Method
9.2 Multiple Correlation
9.3 Partial Correlation
9.4 Regression Analysis
9.4.1 Simple Regression
9.4.2 Correlation Coefficient and the two Regression Coefficients
9.4.3 Non-parametric Regression
9.5 Summary
9.6 Keywords
9.7 Review Questions
9.8 Further Readings
Objectives
After studying this unit, you will be able to:
Explain the Concept of correlation
Judge the Scope of correlation analysis
Define the Rank Correlation
Discuss the Regression analysis
Describe the Simple Regression
LOVELY PROFESSIONAL UNIVERSITY 165
Unit 9: Correlation and Regression
NotesIntroduction
Once best estimates are chosen, both from a statistical and epidemiologic perspective, hypothesesabout the estimated association between a single mean, proportion, or rate and a fixed value,typically standard or goal, or about the estimated association between two or more means,proportions, or rates can be tested.
The measures of association refer to a wide variety of coefficients that measure the strength ofthe relationship that has been described in several ways. The word ‘association’ in measures ofassociation measures the strength of association in which there is at least one of the variablesthat is dichotomous in nature, generally nominal or ordinal. The measures of association definethe strength of the linear relationship in terms of the degree of monotonicity. This degree ofmonotonicity used by the measures of association is based on the counting of various types ofpairs in a relationship.
9.1 Correlation
Various experts have defined correlation in their own words and their definitions, broadlyspeaking, imply that correlation is the degree of association between two or more variables.Some important definitions of correlation are given below:
1. “If two or more quantities vary in sympathy so that movements in one tend to beaccompanied by corresponding movements in other(s) then they are said to be correlated.”
— L.R. Connor
2. “Correlation is an analysis of covariation between two or more variables.”
— A.M. Tuttle
3. “When the relationship is of a quantitative nature, the appropriate statistical tool fordiscovering and measuring the relationship and expressing it in a brief formula is knownas correlation.”
— Croxton and Cowden
4. “Correlation analysis attempts to determine the ‘degree of relationship’ between variables”.
— Ya Lun Chou
Correlation Coefficient: It is a numerical measure of the degree of association between two ormore variables.
The Scope of Correlation Analysis
The existence of correlation between two (or more) variables only implies that these variables(i) either tend to increase or decrease together or (ii) an increase (or decrease) in one is accompaniedby the corresponding decrease (or increase) in the other. The questions of the type, whetherchanges in a variable are due to changes in the other, i.e., whether a cause and effect typerelationship exists between them, are not answered by the study of correlation analysis. If thereis a correlation between two variables, it may be due to any of the following situations:
1. One of the variable may be affecting the other: A correlation coefficient calculated fromthe data on quantity demanded and corresponding price of tea would only reveal that thedegree of association between them is very high. It will not give us any idea aboutwhether price is affecting demand of tea or vice-versa. In order to know this, we need to
166 LOVELY PROFESSIONAL UNIVERSITY
Research Methodology
Notes have some additional information apart from the study of correlation. For example if, onthe basis of some additional information, we say that the price of tea affects its demand,then price will be the cause and quantity will be the effect. The causal variable isalso termed as independent variable while the other variable is termed as dependentvariable.
2. The two variables may act upon each other: Cause and effect relation exists in this casealso but it may be very difficult to find out which of the two variables is independent.
Example: If we have data on price of wheat and its cost of production, the correlationbetween them may be very high because higher price of wheat may attract farmers to producemore wheat and more production of wheat may mean higher cost of production, assuming thatit is an increasing cost industry. Further, the higher cost of production may in turn raise the priceof wheat.
For the purpose of determining a relationship between the two variables in such situations,we can take any one of them as independent variable.
3. The two variables may be acted upon by the outside influences: In this case we might get ahigh value of correlation between the two variables, however, apparently no cause andeffect type relation seems to exist between them.
Example: The demands of the two commodities, say X and Y, may be positively correlatedbecause the incomes of the consumers are rising. Coefficient of correlation obtained in such asituation is called a spurious or nonsense correlation.
4. A high value of the correlation coefficient may be obtained due to sheer coincidence (orpure chance): This is another situation of spurious correlation. Given the data on any twovariables, one may obtain a high value of correlation coefficient when in fact they do nothave any relationship.
Example: A high value of correlation coefficient may be obtained between the size of shoeand the income of persons of a locality.
9.1.1 Scatter Diagram
Let the bivariate data be denoted by (Xi, Yi), where i = 1, 2 ...... n. In order to have some idea aboutthe extent of association between variables X and Y, each pair (Xi, Yi), i = 1, 2......n, is plotted ona graph. The diagram, thus obtained, is called a Scatter Diagram.
Each pair of values (Xi, Yi) is denoted by a point on the graph. The set of such points may clusteraround a straight line or a curve or may not show any tendency of association. Various possiblesituations are shown with the help of following diagrams:
Did u know? What the sets of point in generally known?
The sets of points in scatter diagram are known as dots of the diagram
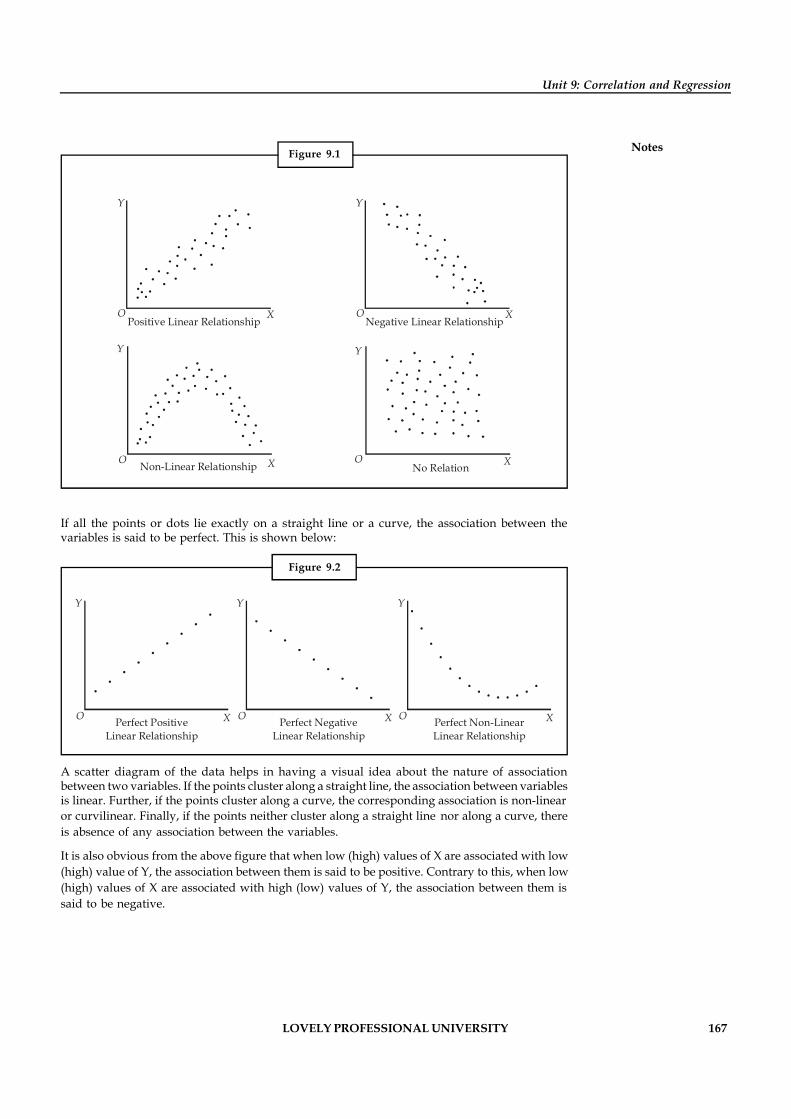
LOVELY PROFESSIONAL UNIVERSITY 167
Unit 9: Correlation and Regression
NotesFigure 9.1
Positive Linear RelationshipXO
Y
XO
Y
Negative Linear Relationship
O X
Y
Non-Linear RelationshipO X
Y
No Relation
If all the points or dots lie exactly on a straight line or a curve, the association between thevariables is said to be perfect. This is shown below:
Figure 9.2
O X
Y
O X
Y
O X
Y
Perfect PositiveLinear Relationship
Perfect NegativeLinear Relationship
Perfect Non-LinearLinear Relationship
A scatter diagram of the data helps in having a visual idea about the nature of associationbetween two variables. If the points cluster along a straight line, the association between variablesis linear. Further, if the points cluster along a curve, the corresponding association is non-linearor curvilinear. Finally, if the points neither cluster along a straight line nor along a curve, thereis absence of any association between the variables.
It is also obvious from the above figure that when low (high) values of X are associated with low(high) value of Y, the association between them is said to be positive. Contrary to this, when low(high) values of X are associated with high (low) values of Y, the association between them issaid to be negative.
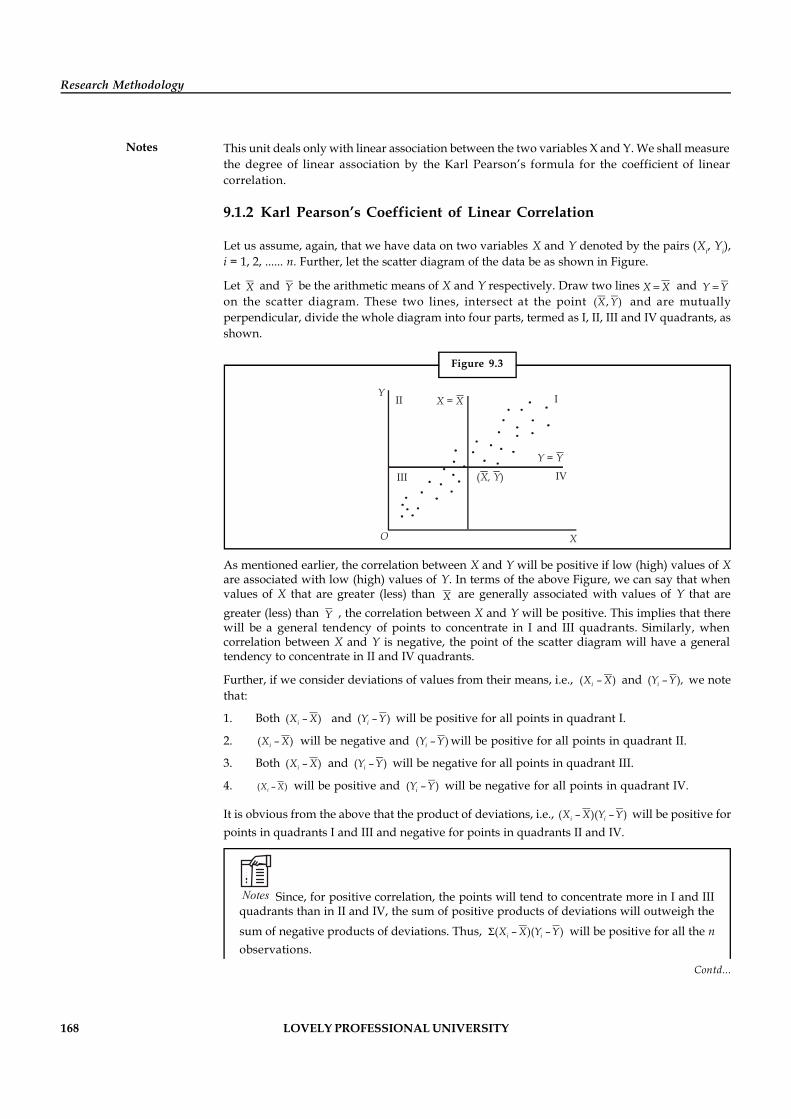
168 LOVELY PROFESSIONAL UNIVERSITY
Research Methodology
Notes This unit deals only with linear association between the two variables X and Y. We shall measurethe degree of linear association by the Karl Pearson’s formula for the coefficient of linearcorrelation.
9.1.2 Karl Pearson’s Coefficient of Linear Correlation
Let us assume, again, that we have data on two variables X and Y denoted by the pairs (Xi, Yi),i = 1, 2, ...... n. Further, let the scatter diagram of the data be as shown in Figure.
Let X and Y be the arithmetic means of X and Y respectively. Draw two lines X X and Y Yon the scatter diagram. These two lines, intersect at the point ( , )X Y and are mutuallyperpendicular, divide the whole diagram into four parts, termed as I, II, III and IV quadrants, asshown.
Figure 9.3
O X
IVIII
II X X = I
Y Y =
( )X, Y
Y
As mentioned earlier, the correlation between X and Y will be positive if low (high) values of Xare associated with low (high) values of Y. In terms of the above Figure, we can say that whenvalues of X that are greater (less) than X are generally associated with values of Y that aregreater (less) than Y , the correlation between X and Y will be positive. This implies that therewill be a general tendency of points to concentrate in I and III quadrants. Similarly, whencorrelation between X and Y is negative, the point of the scatter diagram will have a generaltendency to concentrate in II and IV quadrants.
Further, if we consider deviations of values from their means, i.e., ( – )iX X and ( – ),iY Y we notethat:
1. Both ( – )iX X and ( – )iY Y will be positive for all points in quadrant I.
2. ( – )iX X will be negative and ( – )iY Y will be positive for all points in quadrant II.
3. Both ( – )iX X and ( – )iY Y will be negative for all points in quadrant III.
4. ( – )iX X will be positive and ( – )iY Y will be negative for all points in quadrant IV.
It is obvious from the above that the product of deviations, i.e., ( – )( – )i iX X Y Y will be positive forpoints in quadrants I and III and negative for points in quadrants II and IV.
Notes Since, for positive correlation, the points will tend to concentrate more in I and IIIquadrants than in II and IV, the sum of positive products of deviations will outweigh thesum of negative products of deviations. Thus, ( – )( – )i iX X Y Y will be positive for all the nobservations.
Contd...
LOVELY PROFESSIONAL UNIVERSITY 169
Unit 9: Correlation and Regression
NotesSimilarly, when correlation is negative, the points will tend to concentrate more in II andIV quadrants than in I and III. Thus, the sum of negative products of deviations willoutweigh the sum of positive products and hence ( – )( – )i iX X Y Y will be negative for allthe n observations.
Further, if there is no correlation, the sum of positive products of deviations will be equalto the sum of negative products of deviations such that ( – )( – )i iX X Y Y will be equal tozero.
On the basis of the above, we can consider ( – )( – )i iX X Y Y as an absolute measure of correlation.This measure, like other absolute measures of dispersion, skewness, etc., will depend upon (i)the number of observations and (ii) the units of measurements of the variables.
In order to avoid its dependence on the number of observations, we take its average, i.e.,1 ( – )( – )i iX X Y Yn . This term is called covariance in statistics and is denoted as Cov(X, Y).
To eliminate the effect of units of measurement of the variables, the covariance term is dividedby the product of the standard deviation of X and the standard deviation of Y. The resultingexpression is known as the Karl Pearson’s coefficient of linear correlation or the product momentcorrelation coefficient or simply the coefficient of correlation, between X and Y.
rXY =( ),
X Y
Cov X Ys s ...(1)
or rXY =( )( )
( ) ( )22
1
1 1
i i
i i
X X Y Yn
X X Y Yn n
- -
- -
å
å å...(2)
Cancelling 1n from the numerator and the denominator, we get
rXY =( )( )
( ) ( )22
i i
i i
X X Y Y
X X Y Y
- -
- -
åå å
...(3)
Consider ( )( ) ( ) ( )i i i i iX X Y Y X X Y Y X X- - - - -å å å
= i i iX Y X Y - (second term is zero)
= ( )i i iX Y nXY Y nY- å å
Similarly we can write ( )2 2 2i iX X X nX- -å å
and ( )2 2 2i iY Y Y nY- -å å
Substituting these values in equation (3), we have
rXY =2 2 2 2
i i
i i
X Y nXY
X nX Y nY
-
é ù é ù- -ë û ë û
åå å
...(4)
170 LOVELY PROFESSIONAL UNIVERSITY
Research Methodology
Notes
rXY = 2 2
2 2
i ii i
i ii i
X YX Y n
n nX Y
X n Y nn n
- × ´
æ ö æ ö- -ç ÷ ç ÷è ø è ø
å ååå åå å
=
( )( )
( ) ( )2 2
2 2
i ii i
i ii i
X YX Y
nX Y
X Yn n
-
- -
å ååå åå å
...(5)
On multiplication of numerator and denominator by n, we can write
rXY =( )( )
( ) ( )2 22 2
i i i i
i i i i
n X Y X Y
n X X n Y Y
-
- -
å å åå å å å
...(6)
Further, if we assume i ix X X - and i iy Y Y - , equation (2), given above, can be written as
or rXY =2 21 1
i i
i i
x y
x yn n
åå å
...(7)
or rXY =2 2
i i
i i
X Y
X Yå
å å...(8)
or rXY = 1 i i
x y
x yn
...(9)
Equations (5) or (6) are often used for the calculation of correlation from raw data, while the useof the remaining equations depends upon the forms in which the data are available. For example,if standard deviations of X and Y are given, equation (9) may be appropriate.
Example: Calculate the Karl Pearson’s coefficient of correlation from the following pairs ofvalues:
Values of Xi 12 9 8 10 11 13 7
Values of Yi 14 8 6 9 11 12 3
Solution:
The formula for Karl Pearson’s coefficient of correlation is
( )( )( ) ( )2 22 2
i i i i
i i i i
n X Y X Y
n X X n Y Y
-
- -
å å åå å å å
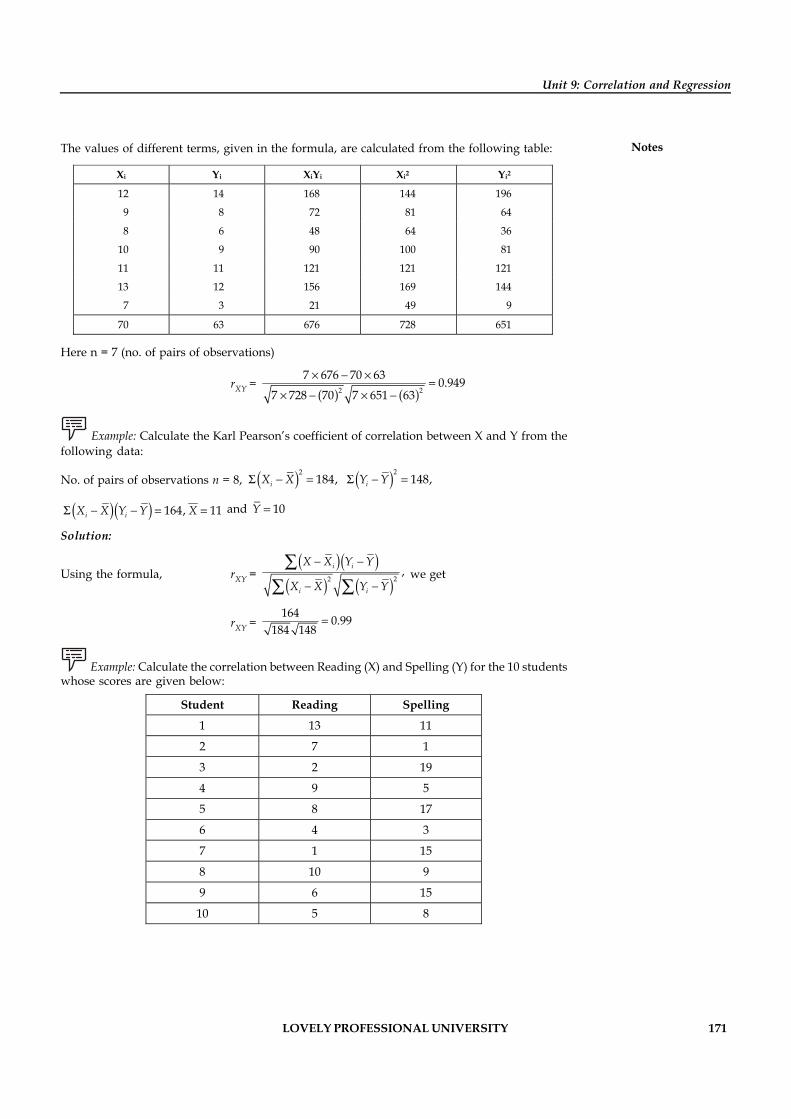
LOVELY PROFESSIONAL UNIVERSITY 171
Unit 9: Correlation and Regression
NotesThe values of different terms, given in the formula, are calculated from the following table:
Xi Yi XiYi Xi2 Yi2
12 14 168 144 196
9 8 72 81 64
8 6 48 64 36
10 9 90 100 81
11 11 121 121 121
13 12 156 169 144
7 3 21 49 9
70 63 676 728 651
Here n = 7 (no. of pairs of observations)
rXY =( ) ( )2 2
7 676 70 63 0.9497 728 70 7 651 63
´ - ´
´ - ´ -
Example: Calculate the Karl Pearson’s coefficient of correlation between X and Y from thefollowing data:
No. of pairs of observations n = 8, ( )2184,iX X - ( )2
148,iY Y -
( )( ) 164, 11i iX X Y Y X - - and 10Y
Solution:
Using the formula, rXY =( )( )
( ) ( )22,i i
i i
X X Y Y
X X Y Y
- -
- -
åå å
we get
rXY =164 0.99
184 148
Example: Calculate the correlation between Reading (X) and Spelling (Y) for the 10 studentswhose scores are given below:
Student Reading Spelling
1 13 11
2 7 1
3 2 19
4 9 5
5 8 17
6 4 3
7 1 15
8 10 9
9 6 15
10 5 8
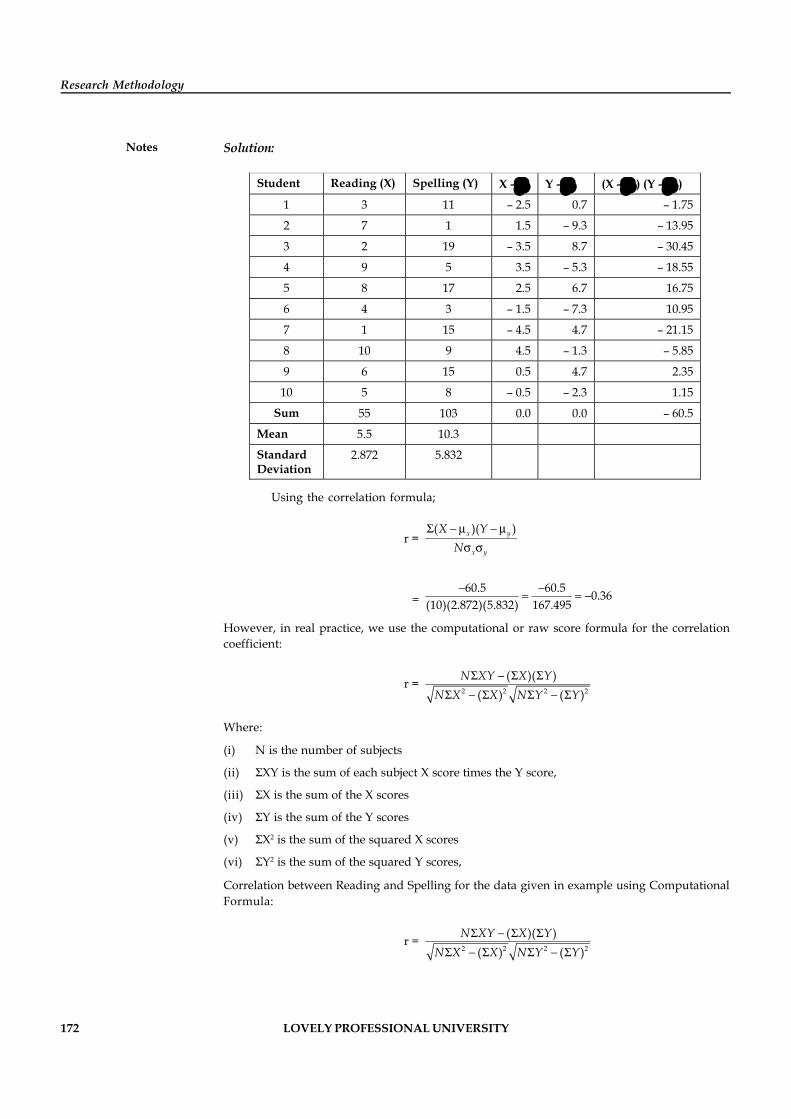
172 LOVELY PROFESSIONAL UNIVERSITY
Research Methodology
Notes Solution:
Student Reading (X) Spelling (Y) X – x Y – y (X –x) (Y – y)
1 3 11 – 2.5 0.7 – 1.75
2 7 1 1.5 – 9.3 – 13.95
3 2 19 – 3.5 8.7 – 30.45
4 9 5 3.5 – 5.3 – 18.55
5 8 17 2.5 6.7 16.75
6 4 3 – 1.5 – 7.3 10.95
7 1 15 – 4.5 4.7 – 21.15
8 10 9 4.5 – 1.3 – 5.85
9 6 15 0.5 4.7 2.35
10 5 8 – 0.5 – 2.3 1.15
Sum 55 103 0.0 0.0 – 60.5
Mean 5.5 10.3
Standard Deviation
2.872 5.832
Using the correlation formula;
r =( )( )x y
x y
X YN
S - m - ms s
=60.5 60.5 0.36
(10)(2.872)(5.832) 167.495- -
= = -
However, in real practice, we use the computational or raw score formula for the correlationcoefficient:
r =2 2 2 2
( )( )( ) ( )
N XY X YN X X N Y Y
S - S SS - S S - S
Where:
(i) N is the number of subjects
(ii) SXY is the sum of each subject X score times the Y score,
(iii) SX is the sum of the X scores
(iv) SY is the sum of the Y scores
(v) SX2 is the sum of the squared X scores
(vi) SY2 is the sum of the squared Y scores,
Correlation between Reading and Spelling for the data given in example using ComputationalFormula:
r =2 2 2 2
( )( )( ) ( )
N XY X YN X X N Y Y
S - S SS - S S - S
LOVELY PROFESSIONAL UNIVERSITY 173
Unit 9: Correlation and Regression
Notes=
2 2
(10)(506) (55)(103)(10)(385) (55) (10)(1401) (103)
-- -
=(5060 5665 605
3850 3205 14010 10609 825 3401- -
- -
=605 605 0.36
(28.723)(58.318) 1675.0679- -
-
Thus, the correlation is –.36, indicating that there is a small negative correlation between readingand spelling. The correlation coefficient is a number that can range from 1 (perfect negativecorrelation) through 0 (no correlation) to 1 (perfect positive correlation).
Task
1. The covariance between the length and weight of five items is 6 and their standarddeviations are 2.45 and 2.61 respectively. Find the coefficient of correlation betweenlength and weight.
2. The Karl Pearson's coefficient of correlation and covariance between two variablesX and Y is –0.85 and –15 respectively. If variance of Y is 9, find the standard deviationof X.
9.1.3 Properties of Coefficient of Correlation
1. The coefficient of correlation is independent of the change of origin and scale ofmeasurements.
In order to prove this property, we change origin and scale of both the variables X and Y.
Let ii
X Auh-
and ,ii
Y Bvk-
where the constants A and B refer to change of origin and
the constants h and k refer to change of scale. We can write
,i iX A hu X A hu + \ +
Thus, we have ( )i i iX X A hu A hu h u u- + - - -
Similarly, ,i iY B kv Y B kv + \ +
Thus, ( )i i iY Y B kv B kv k v v- + - - -
The formula for the coefficient of correlation between X and Y is
rXY =( )( )
( ) ( )22
i i
i i
X X Y Y
X X Y Y
- -
- -
åå å
Substituting the values of ( )iX X- and ( )iY Y- , we get
rXY =( ) ( )
( ) ( )( )( )
( ) ( )2 2 2 22 2
i i i i
i i i i
h u u k v v u u v v
h u u k v v u u v v
- - - -
- - - -
å åå å å å
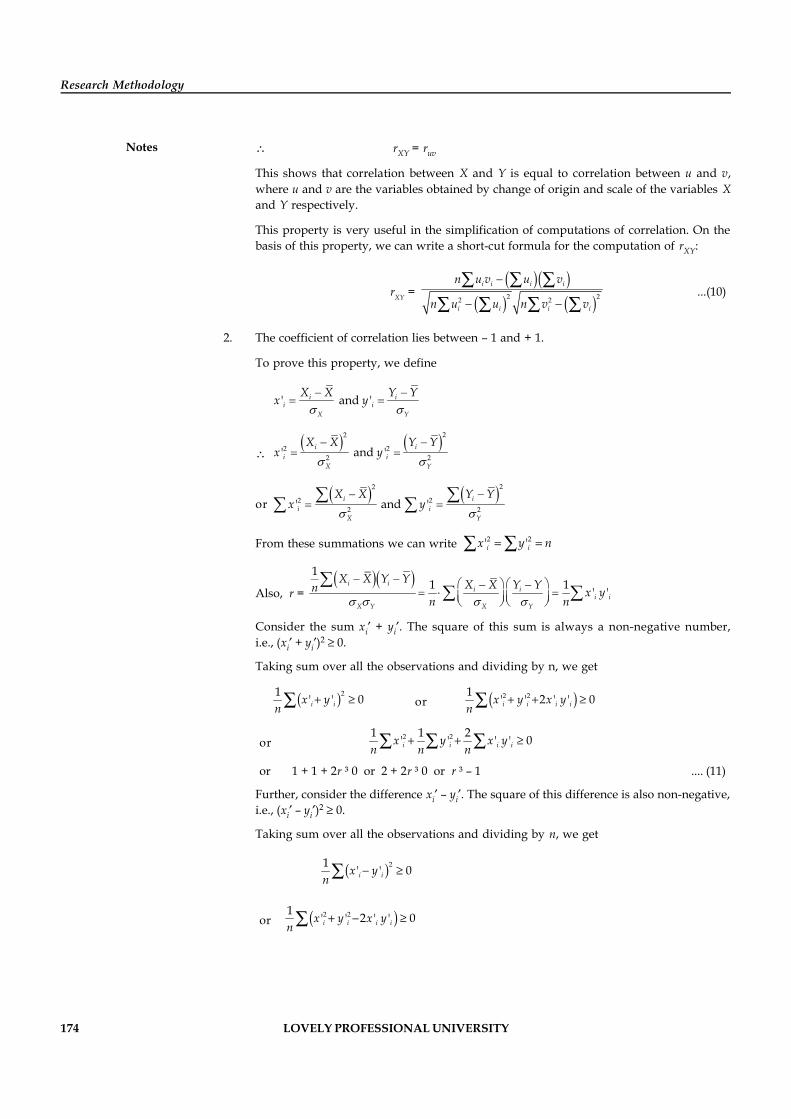
174 LOVELY PROFESSIONAL UNIVERSITY
Research Methodology
Notes \ rXY = ruv
This shows that correlation between X and Y is equal to correlation between u and v,where u and v are the variables obtained by change of origin and scale of the variables Xand Y respectively.
This property is very useful in the simplification of computations of correlation. On thebasis of this property, we can write a short-cut formula for the computation of rXY:
rXY =( )( )
( ) ( )2 22 2
i i i i
i i i i
n u v u v
n u u n v v
-
- -
å å åå å å å
...(10)
2. The coefficient of correlation lies between – 1 and + 1.
To prove this property, we define
' and ' i i
i iX Y
X X Y Yx y
\
22
2 22 2' and '
iii i
X Y
Y YX Xx y
or
22
2 22 2' and '
iii i
X Y
Y YX Xx y
From these summations we can write 2 2' 'i ix y n å å
Also, r =
11 1 ' '
i ii i
i iX Y X Y
X X Y Y X X Y Yn x yn n
Consider the sum xi + yi. The square of this sum is always a non-negative number,i.e., (xi + yi)2 0.
Taking sum over all the observations and dividing by n, we get
( )21 ' ' 0i ix yn
+ å or ( )2 21 ' ' 2 ' ' 0i i i ix y x yn
+ + å
or 2 21 1 2' ' ' ' 0i i i ix y x yn n n
+ + å å åor 1 + 1 + 2r ³ 0 or 2 + 2r ³ 0 or r ³ – 1 .... (11)
Further, consider the difference xi – yi. The square of this difference is also non-negative,i.e., (xi – yi)2 0.
Taking sum over all the observations and dividing by n, we get
( )21 ' ' 0i ix yn
- å
or ( )2 21 ' ' 2 ' ' 0i i i ix y x yn
+ - å
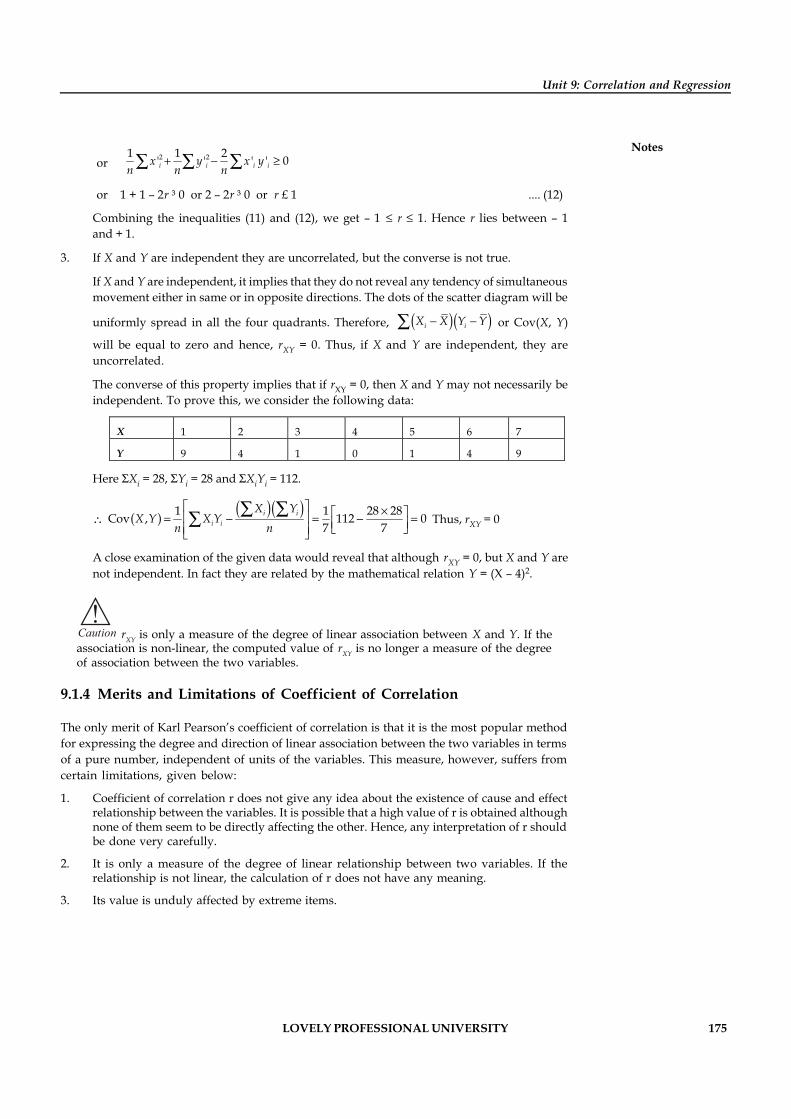
LOVELY PROFESSIONAL UNIVERSITY 175
Unit 9: Correlation and Regression
Notesor 2 21 1 2' ' ' ' 0i i i ix y x y
n n n+ - ³å å å
or 1 + 1 – 2r ³ 0 or 2 – 2r ³ 0 or r £ 1 .... (12)
Combining the inequalities (11) and (12), we get – 1 r 1. Hence r lies between – 1and + 1.
3. If X and Y are independent they are uncorrelated, but the converse is not true.
If X and Y are independent, it implies that they do not reveal any tendency of simultaneousmovement either in same or in opposite directions. The dots of the scatter diagram will be
uniformly spread in all the four quadrants. Therefore, ( )( )i iX X Y Y- -å or Cov(X, Y)
will be equal to zero and hence, rXY = 0. Thus, if X and Y are independent, they areuncorrelated.
The converse of this property implies that if rXY = 0, then X and Y may not necessarily beindependent. To prove this, we consider the following data:
X 1 2 3 4 5 6 7
Y 9 4 1 0 1 4 9
Here Xi = 28, Yi = 28 and XiYi = 112.
( ) ( )( )1 1 28 28Cov , 112 07 7
i ii i
X YX Y XY
n n
é ù ´é ùê ú= - = - =ê úë ûê úë û
å åå Thus, rXY = 0
A close examination of the given data would reveal that although rXY = 0, but X and Y arenot independent. In fact they are related by the mathematical relation Y = (X – 4)2.
!Caution rXY is only a measure of the degree of linear association between X and Y. If theassociation is non-linear, the computed value of rXY is no longer a measure of the degreeof association between the two variables.
9.1.4 Merits and Limitations of Coefficient of Correlation
The only merit of Karl Pearson’s coefficient of correlation is that it is the most popular methodfor expressing the degree and direction of linear association between the two variables in termsof a pure number, independent of units of the variables. This measure, however, suffers fromcertain limitations, given below:
1. Coefficient of correlation r does not give any idea about the existence of cause and effectrelationship between the variables. It is possible that a high value of r is obtained althoughnone of them seem to be directly affecting the other. Hence, any interpretation of r shouldbe done very carefully.
2. It is only a measure of the degree of linear relationship between two variables. If therelationship is not linear, the calculation of r does not have any meaning.
3. Its value is unduly affected by extreme items.
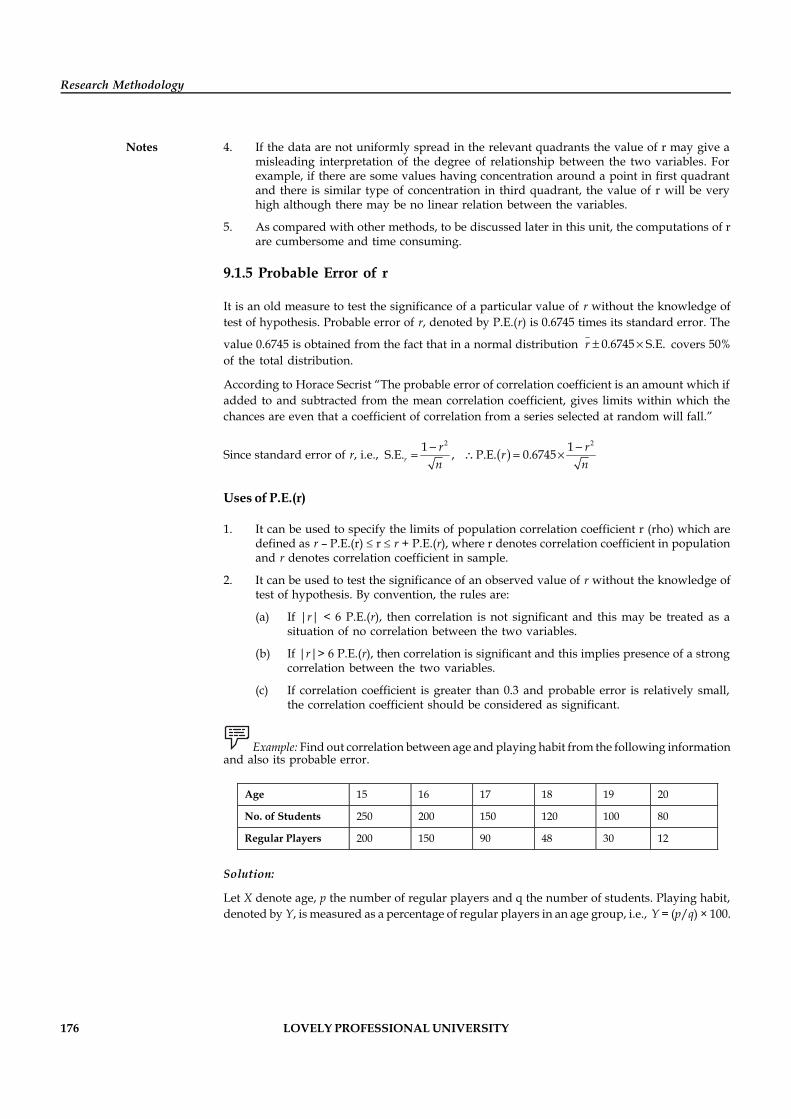
176 LOVELY PROFESSIONAL UNIVERSITY
Research Methodology
Notes 4. If the data are not uniformly spread in the relevant quadrants the value of r may give amisleading interpretation of the degree of relationship between the two variables. Forexample, if there are some values having concentration around a point in first quadrantand there is similar type of concentration in third quadrant, the value of r will be veryhigh although there may be no linear relation between the variables.
5. As compared with other methods, to be discussed later in this unit, the computations of rare cumbersome and time consuming.
9.1.5 Probable Error of r
It is an old measure to test the significance of a particular value of r without the knowledge oftest of hypothesis. Probable error of r, denoted by P.E.(r) is 0.6745 times its standard error. The
value 0.6745 is obtained from the fact that in a normal distribution 0.6745 S.E.r covers 50%of the total distribution.
According to Horace Secrist “The probable error of correlation coefficient is an amount which ifadded to and subtracted from the mean correlation coefficient, gives limits within which thechances are even that a coefficient of correlation from a series selected at random will fall.”
Since standard error of r, i.e., ( )2 21 1S.E. , P.E. 0.6745r
r rrn n- -
= \ =
Uses of P.E.(r)
1. It can be used to specify the limits of population correlation coefficient r (rho) which aredefined as r – P.E.(r) r r + P.E.(r), where r denotes correlation coefficient in populationand r denotes correlation coefficient in sample.
2. It can be used to test the significance of an observed value of r without the knowledge oftest of hypothesis. By convention, the rules are:
(a) If |r| < 6 P.E.(r), then correlation is not significant and this may be treated as asituation of no correlation between the two variables.
(b) If |r|> 6 P.E.(r), then correlation is significant and this implies presence of a strongcorrelation between the two variables.
(c) If correlation coefficient is greater than 0.3 and probable error is relatively small,the correlation coefficient should be considered as significant.
Example: Find out correlation between age and playing habit from the following informationand also its probable error.
Age 15 16 17 18 19 20
No. of Students 250 200 150 120 100 80
Regular Players 200 150 90 48 30 12
Solution:
Let X denote age, p the number of regular players and q the number of students. Playing habit,denoted by Y, is measured as a percentage of regular players in an age group, i.e., Y = (p/q) × 100.
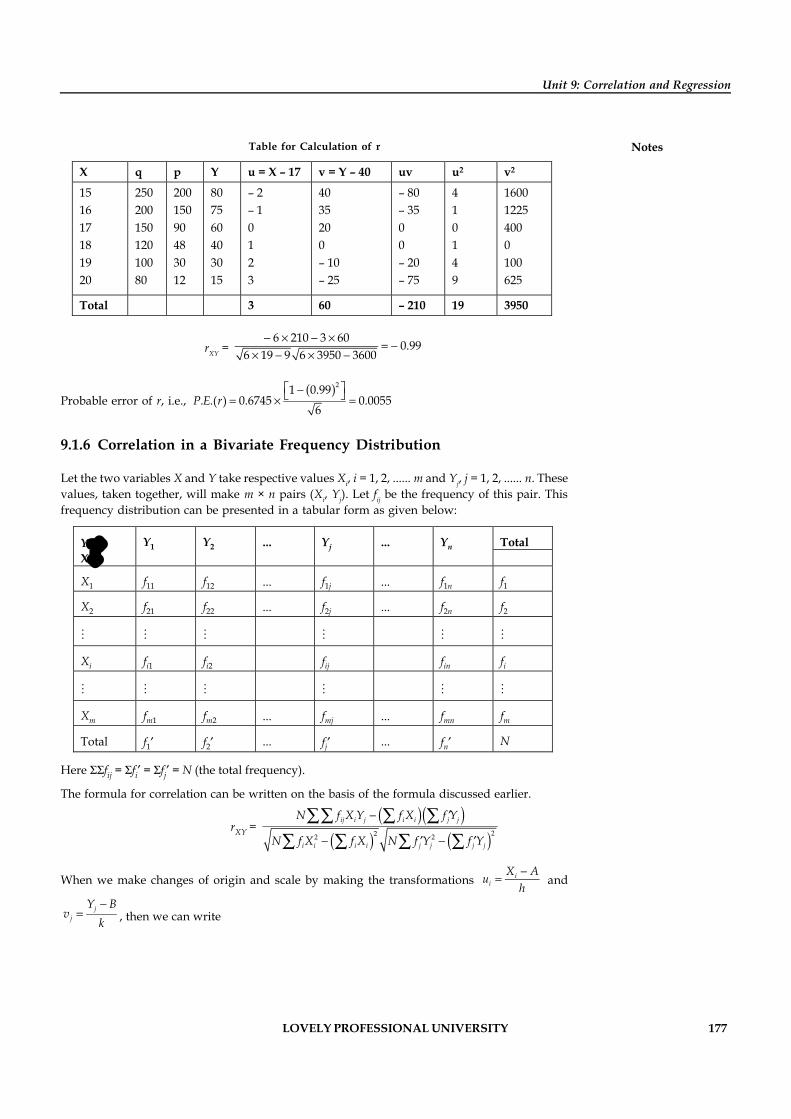
LOVELY PROFESSIONAL UNIVERSITY 177
Unit 9: Correlation and Regression
NotesTable for Calculation of r
X q p Y u = X – 17 v = Y – 40 uv u2 v2
15 16 17 18 19 20
250 200 150 120 100 80
200 150 90 48 30 12
80 75 60 40 30 15
– 2 – 1 0 1 2 3
40 35 20 0 – 10 – 25
– 80 – 35 0 0 – 20 – 75
4 1 0 1 4 9
1600 1225 400 0 100 625
Total 3 60 – 210 19 3950
rXY = 6 210 3 60 0.99
6 19 9 6 3950 3600- ´ - ´
= -´ - ´ -
Probable error of r, i.e., ( )21 0.99
. .( ) 0.6745 0.00556
P E ré ù-ë û= ´ =
9.1.6 Correlation in a Bivariate Frequency Distribution
Let the two variables X and Y take respective values Xi, i = 1, 2, ...... m and Yj, j = 1, 2, ...... n. Thesevalues, taken together, will make m × n pairs (Xi, Yj). Let fij be the frequency of this pair. Thisfrequency distribution can be presented in a tabular form as given below:
Total Y X
Y1 Y2 ... Yj ... Yn
X1 f11 f12 ... f1j ... f1n f1
X2 f21 f22 ... f2j ... f2n f2
Xi fi1 fi2 fij fin fi
Xm fm1 fm2 ... fmj ... fmn fm
Total f1 f2 ... fj ... fn N
Here fij = fi = fj = N (the total frequency).
The formula for correlation can be written on the basis of the formula discussed earlier.
rXY =( )( )
( ) ( )222 2
ij i j i i j j
i i i i j j j j
N f X Y f X f Y
N f X f X N f Y f Y
-
- -
åå å åå å å å
When we make changes of origin and scale by making the transformations ii
X Auh-
= and
jj
Y Bv
k-
= , then we can write
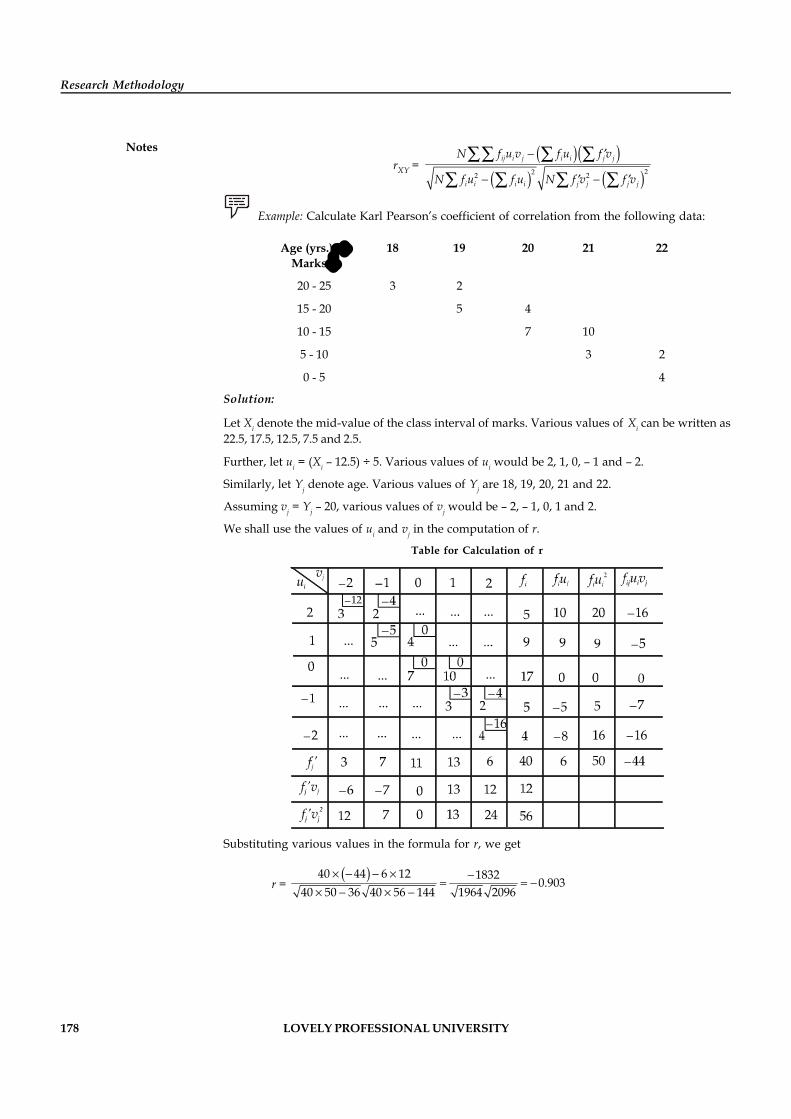
178 LOVELY PROFESSIONAL UNIVERSITY
Research Methodology
NotesrXY =
( )( )( ) ( )222 2
ij i j i i j j
i i i i j j j j
N f u v f u f v
N f u f u N f v f v
- ¢
- -¢ ¢
åå å åå å å å
Example: Calculate Karl Pearson’s coefficient of correlation from the following data:
Age (yrs.) 18 19 20 21 22 Marks
20 - 25 3 2
15 - 20 5 4
10 - 15 7 10
5 - 10 3 2
0 - 5 4
Solution:
Let Xi denote the mid-value of the class interval of marks. Various values of Xi can be written as22.5, 17.5, 12.5, 7.5 and 2.5.
Further, let ui = (Xi – 12.5) ÷ 5. Various values of ui would be 2, 1, 0, – 1 and – 2.
Similarly, let Yj denote age. Various values of Yj are 18, 19, 20, 21 and 22.
Assuming vj = Yj – 20, various values of vj would be – 2, – 1, 0, 1 and 2.
We shall use the values of ui and vj in the computation of r.
Table for Calculation of r
Substituting various values in the formula for r, we get
r = ( )40 44 6 12 1832 0.903
40 50 36 40 56 144 1964 2096´ - - ´ -
= = -´ - ´ -
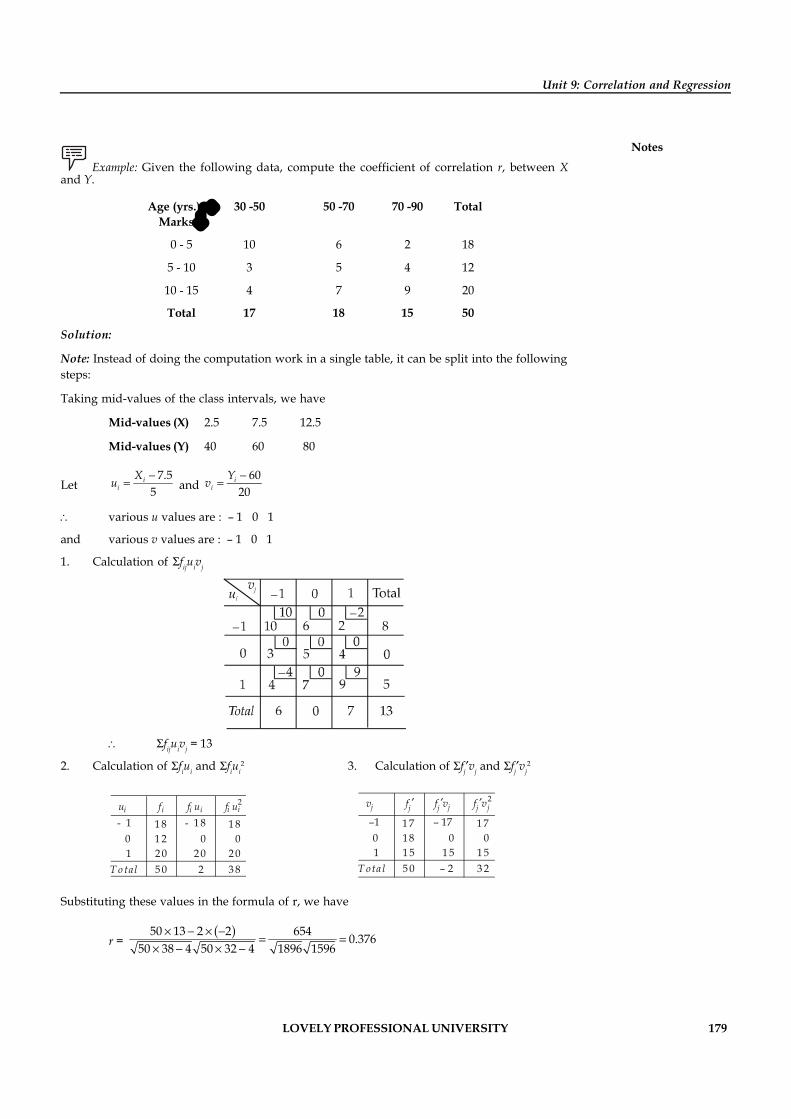
LOVELY PROFESSIONAL UNIVERSITY 179
Unit 9: Correlation and Regression
Notes Example: Given the following data, compute the coefficient of correlation r, between X
and Y.
Age (yrs.) 30 -50 50 -70 70 -90 Total Marks
0 - 5 10 6 2 18
5 - 10 3 5 4 12
10 - 15 4 7 9 20
Total 17 18 15 50
Solution:
Note: Instead of doing the computation work in a single table, it can be split into the followingsteps:
Taking mid-values of the class intervals, we have
Mid-values (X) 2.5 7.5 12.5
Mid-values (Y) 40 60 80
Let7.5
5i
iXu -
= and 60
20i
iYv -
=
various u values are : – 1 0 1
and various v values are : – 1 0 1
1. Calculation of fijuivj
fijuivj = 13
2. Calculation of fiui and fiui2 3. Calculation of fj¢vj and fj¢vj
2
ui fi fi ui fi ui2
- 101
1 81 22 0
- 1 80
2 0
1 80
2 0T o tal 5 0 2 3 8
vj ¢fj ¢fj vj ¢fj vj2
–101
1 7181 5
– 170
1 5
1 70
1 5T ota l 5 0 – 2 3 2
Substituting these values in the formula of r, we have
r = ( )50 13 2 2 654 0.376
50 38 4 50 32 4 1896 1596´ - ´ -
= =´ - ´ -
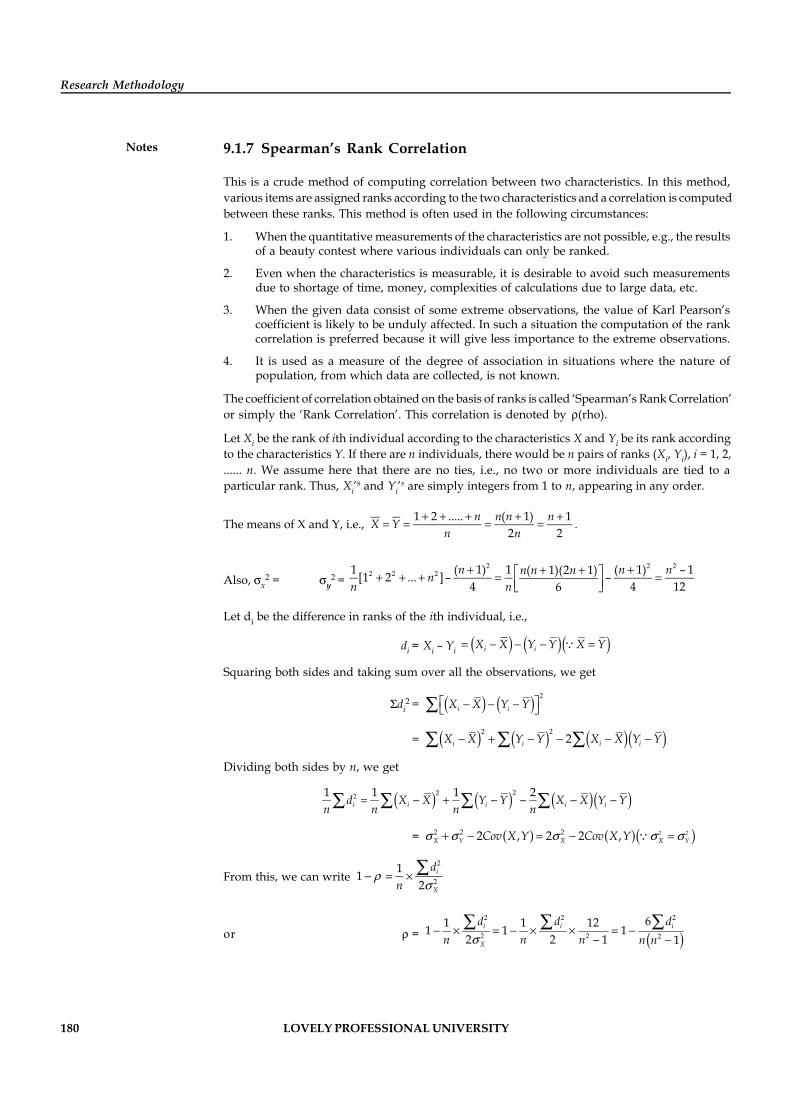
180 LOVELY PROFESSIONAL UNIVERSITY
Research Methodology
Notes 9.1.7 Spearman’s Rank Correlation
This is a crude method of computing correlation between two characteristics. In this method,various items are assigned ranks according to the two characteristics and a correlation is computedbetween these ranks. This method is often used in the following circumstances:
1. When the quantitative measurements of the characteristics are not possible, e.g., the resultsof a beauty contest where various individuals can only be ranked.
2. Even when the characteristics is measurable, it is desirable to avoid such measurementsdue to shortage of time, money, complexities of calculations due to large data, etc.
3. When the given data consist of some extreme observations, the value of Karl Pearson’scoefficient is likely to be unduly affected. In such a situation the computation of the rankcorrelation is preferred because it will give less importance to the extreme observations.
4. It is used as a measure of the degree of association in situations where the nature ofpopulation, from which data are collected, is not known.
The coefficient of correlation obtained on the basis of ranks is called ‘Spearman’s Rank Correlation’or simply the ‘Rank Correlation’. This correlation is denoted by (rho).
Let Xi be the rank of ith individual according to the characteristics X and Yi be its rank accordingto the characteristics Y. If there are n individuals, there would be n pairs of ranks (Xi, Yi), i = 1, 2,...... n. We assume here that there are no ties, i.e., no two or more individuals are tied to aparticular rank. Thus, Xi’s and Yi’s are simply integers from 1 to n, appearing in any order.
The means of X and Y, i.e., 1 2 ..... ( 1) 12 2
n n n nX Yn n
+ + + + + .
Also, sx2 = sy
2 = 2 2 2
2 2 21 ( 1) 1 ( 1) – 1( 1)(2 1)[1 2 ... ]– –4 4 126
n n nn n nnn n
+ ++ +é ù+ + + ê úë û
Let di be the difference in ranks of the ith individual, i.e.,
di = Xi – Yi ( ) ( )( )i iX X Y Y X Y - - -
Squaring both sides and taking sum over all the observations, we get
di2 = ( ) ( ) 2
i iX X Y Yé ù- - -ë ûå
= ( ) ( ) ( )( )222i i i iX X Y Y X X Y Y- + - - - -å å å
Dividing both sides by n, we get
( ) ( ) ( )( )2221 1 1 2i i i i id X X Y Y X X Y Y
n n n n - + - - - -å å å å
= ( ) ( )( )2 22 2 22 , 2 2 ,X Y X X YCov X Y Cov X Ys s s s s+ - -
From this, we can write 2
2
112
i
X
dn
s
- ´å
or = ( )2 2 2
2 2 2
61 1 121 1 12 2 1 1
i i i
X
d d dn n n n ns
- ´ - ´ ´ -- -
å å å
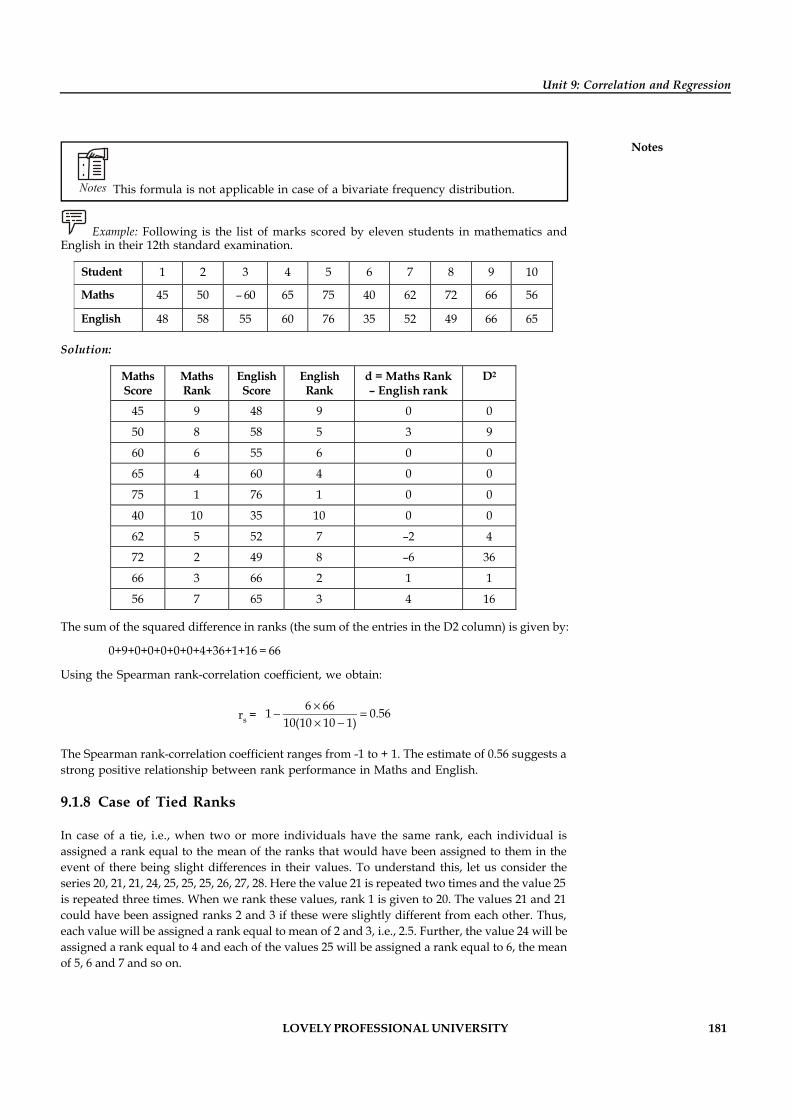
LOVELY PROFESSIONAL UNIVERSITY 181
Unit 9: Correlation and Regression
Notes
Notes This formula is not applicable in case of a bivariate frequency distribution.
Example: Following is the list of marks scored by eleven students in mathematics andEnglish in their 12th standard examination.
Student 1 2 3 4 5 6 7 8 9 10
Maths 45 50 – 60 65 75 40 62 72 66 56
English 48 58 55 60 76 35 52 49 66 65
Solution:
Maths Score
Maths Rank
English Score
English Rank
d = Maths Rank – English rank
D2
45 9 48 9 0 0
50 8 58 5 3 9
60 6 55 6 0 0
65 4 60 4 0 0
75 1 76 1 0 0
40 10 35 10 0 0
62 5 52 7 –2 4
72 2 49 8 –6 36
66 3 66 2 1 1
56 7 65 3 4 16
The sum of the squared difference in ranks (the sum of the entries in the D2 column) is given by:
0+9+0+0+0+0+0+4+36+1+16 = 66
Using the Spearman rank-correlation coefficient, we obtain:
rs = 6 661 0.56
10(10 10 1)´
- ´ -
The Spearman rank-correlation coefficient ranges from -1 to + 1. The estimate of 0.56 suggests astrong positive relationship between rank performance in Maths and English.
9.1.8 Case of Tied Ranks
In case of a tie, i.e., when two or more individuals have the same rank, each individual isassigned a rank equal to the mean of the ranks that would have been assigned to them in theevent of there being slight differences in their values. To understand this, let us consider theseries 20, 21, 21, 24, 25, 25, 25, 26, 27, 28. Here the value 21 is repeated two times and the value 25is repeated three times. When we rank these values, rank 1 is given to 20. The values 21 and 21could have been assigned ranks 2 and 3 if these were slightly different from each other. Thus,each value will be assigned a rank equal to mean of 2 and 3, i.e., 2.5. Further, the value 24 will beassigned a rank equal to 4 and each of the values 25 will be assigned a rank equal to 6, the meanof 5, 6 and 7 and so on.
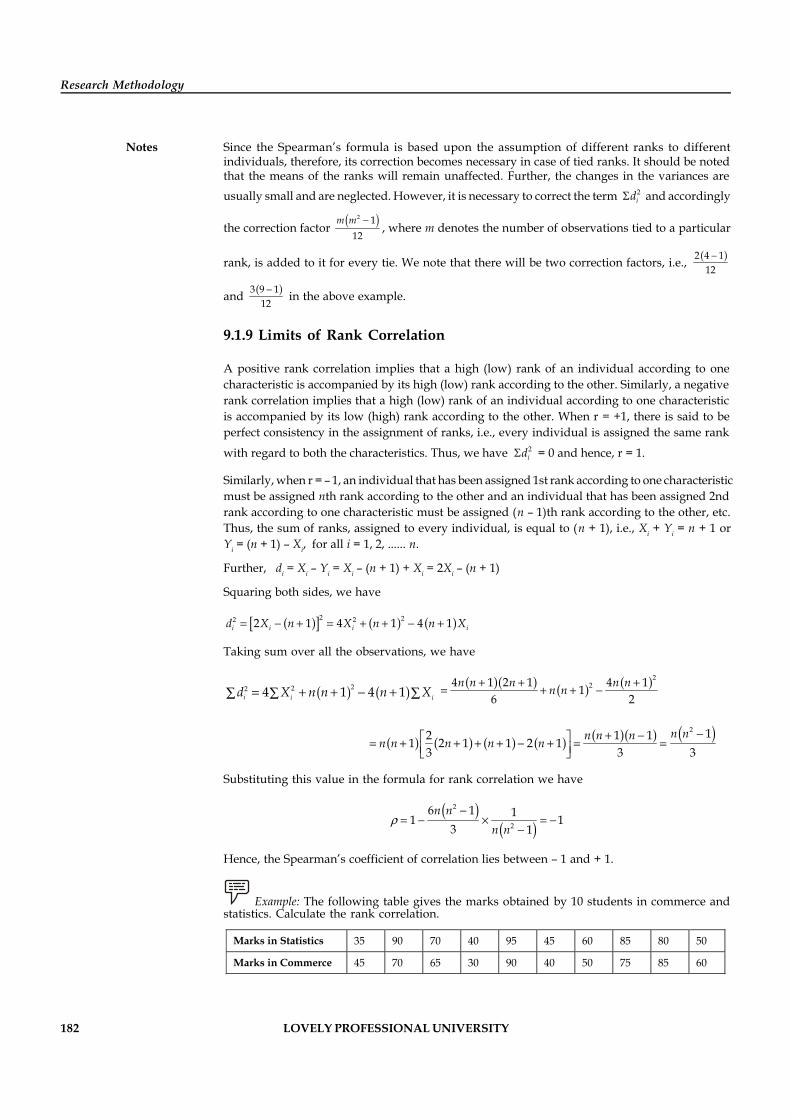
182 LOVELY PROFESSIONAL UNIVERSITY
Research Methodology
Notes Since the Spearman’s formula is based upon the assumption of different ranks to differentindividuals, therefore, its correction becomes necessary in case of tied ranks. It should be notedthat the means of the ranks will remain unaffected. Further, the changes in the variances areusually small and are neglected. However, it is necessary to correct the term 2
id and accordingly
the correction factor 2 112
m m , where m denotes the number of observations tied to a particular
rank, is added to it for every tie. We note that there will be two correction factors, i.e., 2 4 112
and 3 9 112 in the above example.
9.1.9 Limits of Rank Correlation
A positive rank correlation implies that a high (low) rank of an individual according to onecharacteristic is accompanied by its high (low) rank according to the other. Similarly, a negativerank correlation implies that a high (low) rank of an individual according to one characteristicis accompanied by its low (high) rank according to the other. When r = +1, there is said to beperfect consistency in the assignment of ranks, i.e., every individual is assigned the same rank
with regard to both the characteristics. Thus, we have 2id = 0 and hence, r = 1.
Similarly, when r = – 1, an individual that has been assigned 1st rank according to one characteristicmust be assigned nth rank according to the other and an individual that has been assigned 2ndrank according to one characteristic must be assigned (n – 1)th rank according to the other, etc.Thus, the sum of ranks, assigned to every individual, is equal to (n + 1), i.e., Xi + Yi = n + 1 orYi = (n + 1) – Xi, for all i = 1, 2, ...... n.
Further, di = Xi – Yi = Xi – (n + 1) + Xi = 2Xi – (n + 1)
Squaring both sides, we have
2 22 22 1 4 1 4 1i i i id X n X n n X
Taking sum over all the observations, we have
222 4 1 4 1i i id X n n n X 2
24 1 2 1 4 116 2
n n n n nn n
2 11 121 2 1 1 2 13 3 3
n nn n nn n n n n
Substituting this value in the formula for rank correlation we have
2
2
6 1 11 13 1
n nn n
Hence, the Spearman’s coefficient of correlation lies between – 1 and + 1.
Example: The following table gives the marks obtained by 10 students in commerce andstatistics. Calculate the rank correlation.
Marks in Statistics 35 90 70 40 95 45 60 85 80 50
Marks in Commerce 45 70 65 30 90 40 50 75 85 60
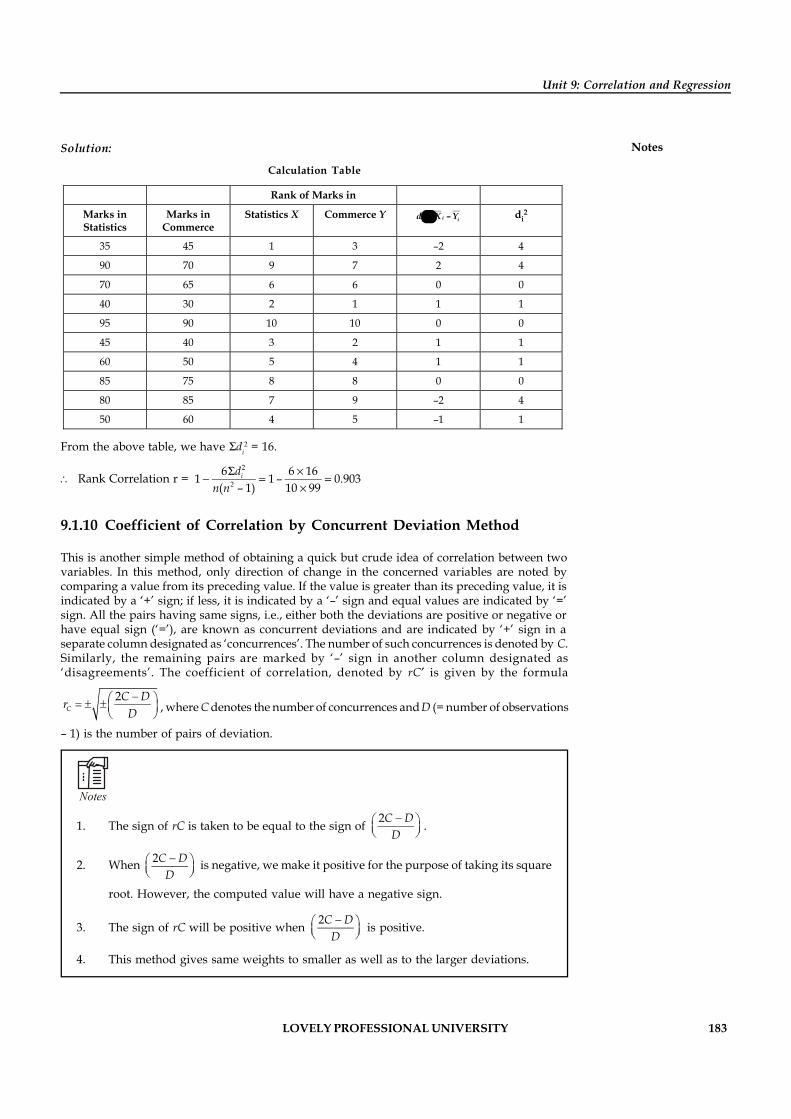
LOVELY PROFESSIONAL UNIVERSITY 183
Unit 9: Correlation and Regression
NotesSolution:
Calculation Table
Rank of Marks in
Marks in Statistics
Marks in Commerce
Statistics X Commerce Y –= ii id X Y di2
35 45 1 3 –2 4
90 70 9 7 2 4
70 65 6 6 0 0
40 30 2 1 1 1
95 90 10 10 0 0
45 40 3 2 1 1
60 50 5 4 1 1
85 75 8 8 0 0
80 85 7 9 –2 4
50 60 4 5 –1 1
From the above table, we have di2 = 16.
Rank Correlation r = 2
2
6 6 161 1 – 0.903( – 1) 10 99
idn n
´- = =
´
9.1.10 Coefficient of Correlation by Concurrent Deviation Method
This is another simple method of obtaining a quick but crude idea of correlation between twovariables. In this method, only direction of change in the concerned variables are noted bycomparing a value from its preceding value. If the value is greater than its preceding value, it isindicated by a ‘+’ sign; if less, it is indicated by a ‘–’ sign and equal values are indicated by ‘=’sign. All the pairs having same signs, i.e., either both the deviations are positive or negative orhave equal sign (‘=’), are known as concurrent deviations and are indicated by ‘+’ sign in aseparate column designated as ‘concurrences’. The number of such concurrences is denoted by C.Similarly, the remaining pairs are marked by ‘–’ sign in another column designated as‘disagreements’. The coefficient of correlation, denoted by rC is given by the formula
2
C
C DrD , where C denotes the number of concurrences and D (= number of observations
– 1) is the number of pairs of deviation.
Notes
1. The sign of rC is taken to be equal to the sign of 2
C DD
.
2. When 2
C DD
is negative, we make it positive for the purpose of taking its square
root. However, the computed value will have a negative sign.
3. The sign of rC will be positive when 2
C DD
is positive.
4. This method gives same weights to smaller as well as to the larger deviations.
184 LOVELY PROFESSIONAL UNIVERSITY
Research Methodology
Notes
!Caution This method is suitable only for the study of short term fluctuations because itdoes not take into account the changes in magnitudes of the values.
Self Assessment
Fill in the blanks:
1. The coefficient of correlation obtained on the basis of ranks is called .......................
2. The only merit of Karl Pearson’s coefficient of correlation is that it is the most popularmethod for expressing the ....................... and ....................... of linear association.
3. The ....................... of correlation coefficient is an amount which if added to and subtractedfrom the mean correlation coefficient, gives limits within which the chances are even thata coefficient of correlation from a series selected at random will fall.
4. The value of Karl Pearson’s coefficient is unduly affected by ....................... items.
5. ....................... correlation is used as a measure of the degree of association in situationswhere the nature of population, from which data are collected, is not known.
6. A ....................... rank correlation implies that a high (low) rank of an individual accordingto one characteristic is accompanied by its high (low) rank according to the other.
7. When two or more individuals have the same rank, each individual is assigned a rankequal to the ....................... of the ranks that would have been assigned to them in the eventof there being slight differences in their values.
8. If correlation coefficient is greater than ....................... and probable error is relatively......................., the correlation coefficient should be considered as significant.
9. Coefficient of correlation r does not give any idea about the existence of .......................relationship between the variables.
10. If X and Y are independent they are .......................
11. The coefficient of correlation lies between .......................
12. The coefficient of correlation is independent of the change of ....................... and .......................of measurements.
13. Even when the characteristics are measurable, it is desirable to ....................... suchmeasurements due to shortage of time, money, complexities of calculations due to largedata, etc.
9.2 Multiple Correlation
The coefficient of multiple correlation in case of regression of xi on xj and xk, denoted by Ri×jk, isdefined as a simple coefficient of correlation between xi and xic.
Thus Ri×jk =( )
( ) ( )( )( )
.
22 2 2.
, i i i jki ici ic
i ic i ic i i i jk
x x xx xCov x xVar x Var x x x x x x
-
-
ååå å å å
= ( ) ( )2 2
222 –ii i i jk i i jk
i i i jkii i i jk i x
x x x x x xx xxx x x x
× ×
××
- -å å å å
- å ååå å
(Using property III)
LOVELY PROFESSIONAL UNIVERSITY 185
Unit 9: Correlation and Regression
Notes
= ( )2 2
. 2 2.
2 2 2.
1i i jki i jk
ii i i jk
nS nSS S
SnS nS nS
- -
-.... (13)
Square of Ri×jk is known as the coefficient of multiple determination.
2i jkR × ( )
22 2
2 2
1 1 i jki i jk
i i
SS S
S S×
×- - .... (14)
It may be noted here that 2
2i jk
i
SS×
is proportion of unexplained variation. Thus, we can also write
22
21 i jki jk
i
xR
x×
× - .
Further, we can write 2i jkR × in terms of the simple correlation coefficients.
2i jkR ×
( )( )
2 2 2 2 2 2
22 2
1 2 21
11i ij ik jk ij ik jk ij ik ij ik jk
jki jk
S r r r r r r r r r r rrS r
- - - + + --
--
Notes If there are m variables, 221 23....2 1 23....
1 23.... 2 21 1
1 1 mmm
xSRS x
××× - -å
å
Self Assessment
Fill in the blanks:
14. The coefficient of ………………correlation in case of regression of xi on xj and xk, denotedby Ri×jk
15. The coefficient of multiple correlation in case of regression of xi on xj and xk is defined asa ………………coefficient of correlation between xi and xic.
9.3 Partial Correlation
In case of three variables xi, xj and xk, the partial correlation between xi and xj is defined as thesimple correlation between them after eliminating the effect of xk. This is denoted as rij×k.
We note that xi×k = xi – bikxk is that part of xi which is left after the removal of linear effect of xk onit. Similarly, xj×k = xj – bjkxk is that part of xj which is left after the removal of linear effect of xk onit. Equivalently, rij×k can also be regarded as correlation between xi×k and xj×k. Thus, we can write
2 2
i k j kij k
i k j k
x xr
x x× ×
×
× ×
åå .
Using property III of residual products, we can write
Sxi×kxj×k = Sxi×kxj = S(xi – bikxk)xj = Sxixj – bikSxjxk
= ( )ii j ij ik j k jk i j ij ik jk
k
SnS S r r nS S r nS S r r rS
- -
186 LOVELY PROFESSIONAL UNIVERSITY
Research Methodology
Notes Further, using property III, we can write
S 2i×kx = Sxixi×k = Sxi(xi – bikxk) = Sxi
2 – bikSxixk
= ( )2 2 21ii ik i k ik i ik
k
SnS r nS S r nS rS
- = -
Similarly, S 2i×kx = ( )2 21 .j jknS r-
Thus, we have rij×k =( )
( ) ( ) ( )( )2 2 2 2 2 21 1 1 1
i j ij ik jk ij ik jk
i ik j jk ik jk
nS S r r r r r r
nS r nS r r r
- -=
- - - -
Self Assessment
Fill in the blanks:
16. In case of three variables xi, xj and xk, the partial correlation between xi and xj is defined asthe simple correlation between them after eliminating the effect of………..
17. ……………… correlation is denoted as rij×k
9.4 Regression Analysis
If the coefficient of correlation calculated for bivariate data (Xi, Yi), i = 1, 2, ...... n, is reasonablyhigh and a cause and effect type of relation is also believed to be existing between them, the nextlogical step is to obtain a functional relation between these variables. This functional relation isknown as regression equation in statistics. Since the coefficient of correlation is measure of thedegree of linear association of the variables, we shall discuss only linear regression equation.This does not, however, imply the non-existence of non-linear regression equations.
The regression equations are useful for predicting the value of dependent variable for givenvalue of the independent variable. As pointed out earlier, the nature of a regression equation isdifferent from the nature of a mathematical equation, e.g., if Y = 10 + 2X is a mathematicalequation then it implies that Y is exactly equal to 20 when X = 5. However, if Y = 10 + 2X is aregression equation, then Y = 20 is an average value of Y when X = 5.
The term regression was first introduced by Sir Francis Galton in 1877. In his study of therelationship between heights of fathers and sons, he found that tall fathers were likely to havetall sons and vice-versa. However, the mean height of sons of tall fathers was lower than themean height of their fathers and the mean height of sons of short fathers was higher than themean height of their fathers. In this way, a tendency of the human race to regress or to return toa normal height was observed. Sir Francis Galton referred this tendency of returning to themean height of all men as regression in his research paper, “Regression towards mediocrity inhereditary stature”. The term ‘Regression’, originated in this particular context, is now used invarious fields of study, even though there may be no existence of any regressive tendency.
9.4.1 Simple Regression
For a bivariate data (Xi, Yi), i = 1, 2, ...... n, we can have either X or Y as independent variable. IfX is independent variable then we can estimate the average values of Y for a given value of X.The relation used for such estimation is called regression of Y on X. If on the other hand Y is usedfor estimating the average values of X, the relation will be called regression of X on Y. For a
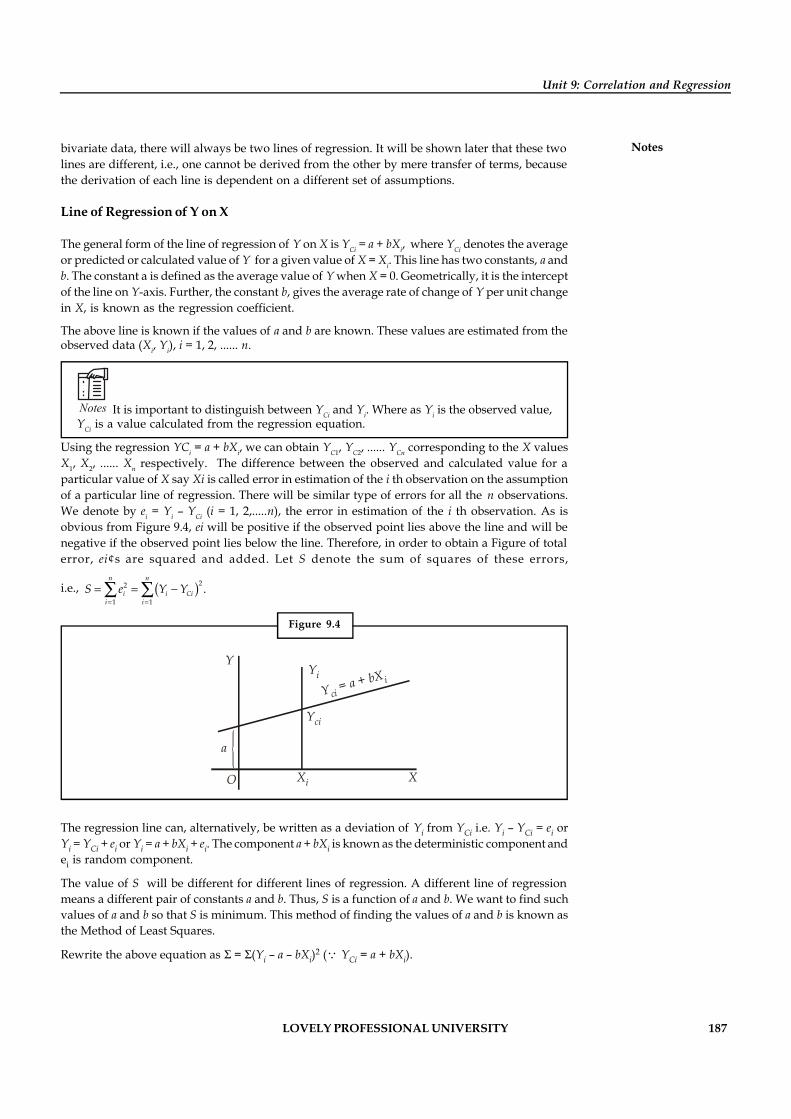
LOVELY PROFESSIONAL UNIVERSITY 187
Unit 9: Correlation and Regression
Notesbivariate data, there will always be two lines of regression. It will be shown later that these twolines are different, i.e., one cannot be derived from the other by mere transfer of terms, becausethe derivation of each line is dependent on a different set of assumptions.
Line of Regression of Y on X
The general form of the line of regression of Y on X is YCi = a + bXi, where YCi denotes the averageor predicted or calculated value of Y for a given value of X = Xi. This line has two constants, a andb. The constant a is defined as the average value of Y when X = 0. Geometrically, it is the interceptof the line on Y-axis. Further, the constant b, gives the average rate of change of Y per unit changein X, is known as the regression coefficient.
The above line is known if the values of a and b are known. These values are estimated from theobserved data (Xi, Yi), i = 1, 2, ...... n.
Notes It is important to distinguish between YCi and Yi. Where as Yi is the observed value,YCi is a value calculated from the regression equation.
Using the regression YCi = a + bXi, we can obtain YC1, YC2, ...... YCn corresponding to the X valuesX1, X2, ...... Xn respectively. The difference between the observed and calculated value for aparticular value of X say Xi is called error in estimation of the i th observation on the assumptionof a particular line of regression. There will be similar type of errors for all the n observations.We denote by ei = Yi – YCi (i = 1, 2,.....n), the error in estimation of the i th observation. As isobvious from Figure 9.4, ei will be positive if the observed point lies above the line and will benegative if the observed point lies below the line. Therefore, in order to obtain a Figure of totalerror, ei¢s are squared and added. Let S denote the sum of squares of these errors,
i.e., ( )22
1 1.
n n
i i Cii i
S e Y Y= =
= = -å å
Figure 9.4
a
O Xi X
Yci
YiY
Y a bXci
i= +
The regression line can, alternatively, be written as a deviation of Yi from YCi i.e. Yi – YCi = ei orYi = YCi + ei or Yi = a + bXi + ei. The component a + bXi is known as the deterministic component andei is random component.
The value of S will be different for different lines of regression. A different line of regressionmeans a different pair of constants a and b. Thus, S is a function of a and b. We want to find suchvalues of a and b so that S is minimum. This method of finding the values of a and b is known asthe Method of Least Squares.
Rewrite the above equation as S = S(Yi – a – bXi)2 (YCi = a + bXi).
188 LOVELY PROFESSIONAL UNIVERSITY
Research Methodology
Notes The necessary conditions for minima of S are
(i) 0Sa
¶¶
and (ii) 0,Sb
¶¶
where Sa
¶¶
and Sb
¶¶
are the partial derivatives of S w.r.t. a and b
respectively.
NowSa
¶¶ = ( )
12 0
n
i ii
Y a bX
- - - å
or ( )1
n
i ii
Y a bX
- -å =1 1
0n n
i ii i
Y na b X
- - å å
or1
n
ii
Yå =
1
n
ii
na b X
+ å .... (1)
Also,Sb
¶¶ = ( )( )
12 0
n
i i ii
Y a bX X
- - - å
or ( )2
12
n
i i i ii
X Y aX bX
- - -å = ( )2
10
n
i i i ii
X Y aX bX
- - å
or 2
1 1 1
n n n
i i i ii i i
X Y a X b X
- -å å å = 0
or 1
n
i ii
X Yå = 2
1 1
n n
i ii i
a X b X
+å å .... (2)
Equations (1) and (2) are a system of two simultaneous equations in two unknowns a and b,which can be solved for the values of these unknowns. These equations are also known asnormal equations for the estimation of a and b. Substituting these values of a and b in theregression equation YCi = a + bXi, we get the estimated line of regression of Y on X.
Expressions for the Estimation of a and b.
Dividing both sides of the equation (1) by n, we have
i iY b Xnan n n
+å å or Y a bX + .... (3)
This shows that the line of regression YCi = a + bXi passes through the point ( ), .X Y
From equation (3), we have a Y bX - .... (4)
Substituting this value of a in equation (2), we have
SXiYi = ( ) 2i iY bX X b X- +
= 2 2 2.i i i iY X bX X b X nXY b nX b X- + - +å å å å
or i iX Y nXY-å = ( )2 2ib X nX-å
or b = 2 2i i
i
X Y nXYX nX
--
åå .... (5)
LOVELY PROFESSIONAL UNIVERSITY 189
Unit 9: Correlation and Regression
NotesAlso, i iX Y nXY-å = ( )( )i iX X Y Y- -å
and 2 2iX nX-å = ( )2
iX X-å
b =( )( )
( )2i i
i
X X Y Y
X X
- -
-
åå
.... (6)
or b = 2i i
i
x yx
åå .... (7)
where xi and yi are deviations of values from their arithmetic mean.
Dividing numerator and denominator of equation (6) by n we have
b =( )( )
( )( )
22
1,
1i i
Xi
X X Y Y Cov X YnX X
ns
- -
-
åå
.... (8)
The expression for b, which is convenient for use in computational work, can be written fromequation (5) is given below:
b =
( )( )
( )2 2
2 2
i ii ii i i i
i ii i
X YX YX Y n X Y
n n nX X
X n Xn n
- × -
æ ö- -ç ÷è ø
å åå åå åå åå å
Multiplying numerator and denominator by n, we have
b =( )( )( )22
i i i i
i i
n X Y X Y
n X X
-
-
å å åå å
.... (9)
To write the shortcut formula for b, we shall show that it is independent of change of origin butnot of change of scale.
As in case of coefficient of correlation we define
ui =iX Ah-
and vi =iY Bk-
or Xi = A + hui
and Yi = B + kvi
X = A hu+
and Y = B kv+
also ( )iX X- = ( )ih u u-
and iY Y- = ( )ik v v-
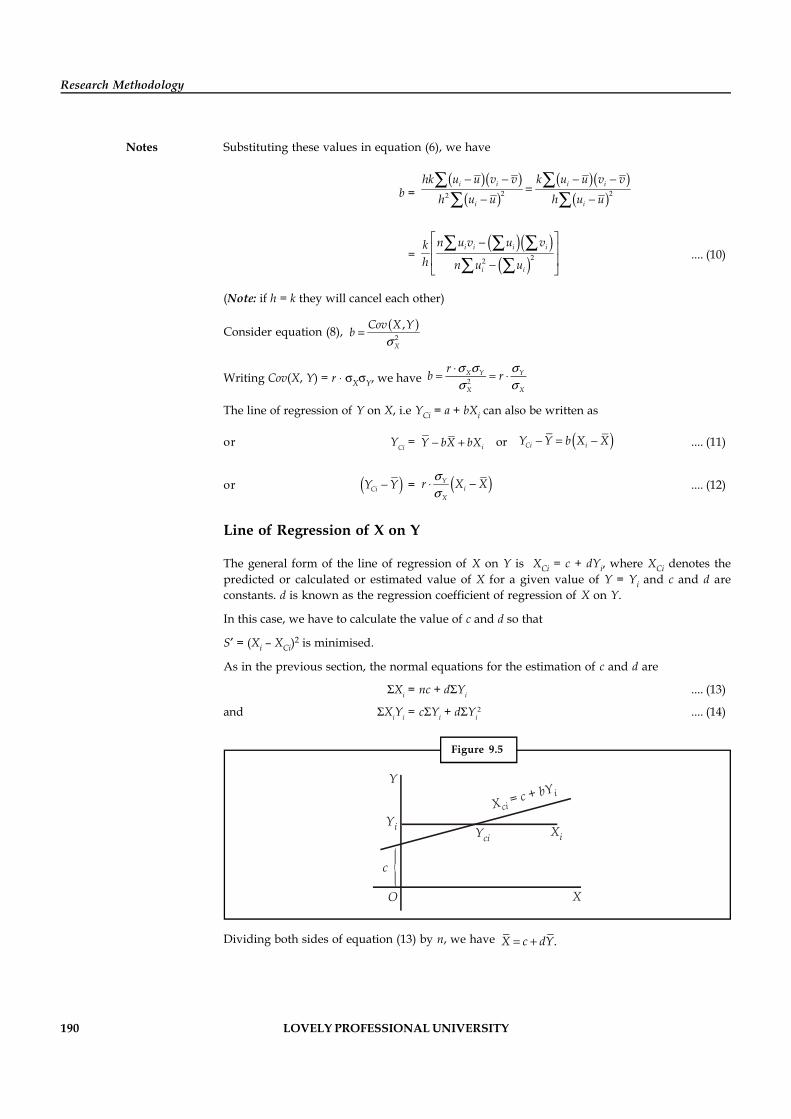
190 LOVELY PROFESSIONAL UNIVERSITY
Research Methodology
Notes Substituting these values in equation (6), we have
b =( )( )
( )( )( )
( )2 22i i i i
i i
hk u u v v k u u v vh u u h u u
- - - -=
- -å åå å
=( )( )( )22
i i i i
i i
n u v u vkh n u u
é ù-ê úê ú-ë û
å å åå å
.... (10)
(Note: if h = k they will cancel each other)
Consider equation (8), ( )2
,
X
Cov X Ybs
=
Writing Cov(X, Y) = r sXsY, we have 2X Y Y
X X
rb rs s ss s
= =
The line of regression of Y on X, i.e YCi = a + bXi can also be written as
or YCi = iY bX bX- + or ( )Ci iY Y b X X- = - .... (11)
or ( )CiY Y- = ( )Yi
X
r X Xss - .... (12)
Line of Regression of X on Y
The general form of the line of regression of X on Y is XCi = c + dYi, where XCi denotes thepredicted or calculated or estimated value of X for a given value of Y = Yi and c and d areconstants. d is known as the regression coefficient of regression of X on Y.
In this case, we have to calculate the value of c and d so that
S = (Xi – XCi)2 is minimised.
As in the previous section, the normal equations for the estimation of c and d are
Xi = nc + dYi .... (13)
and XiYi = cYi + dYi2 .... (14)
Figure 9.5
Yi
Y
c
O
XiYci
X
X c bYci
i= +
Dividing both sides of equation (13) by n, we have .X c dY= +
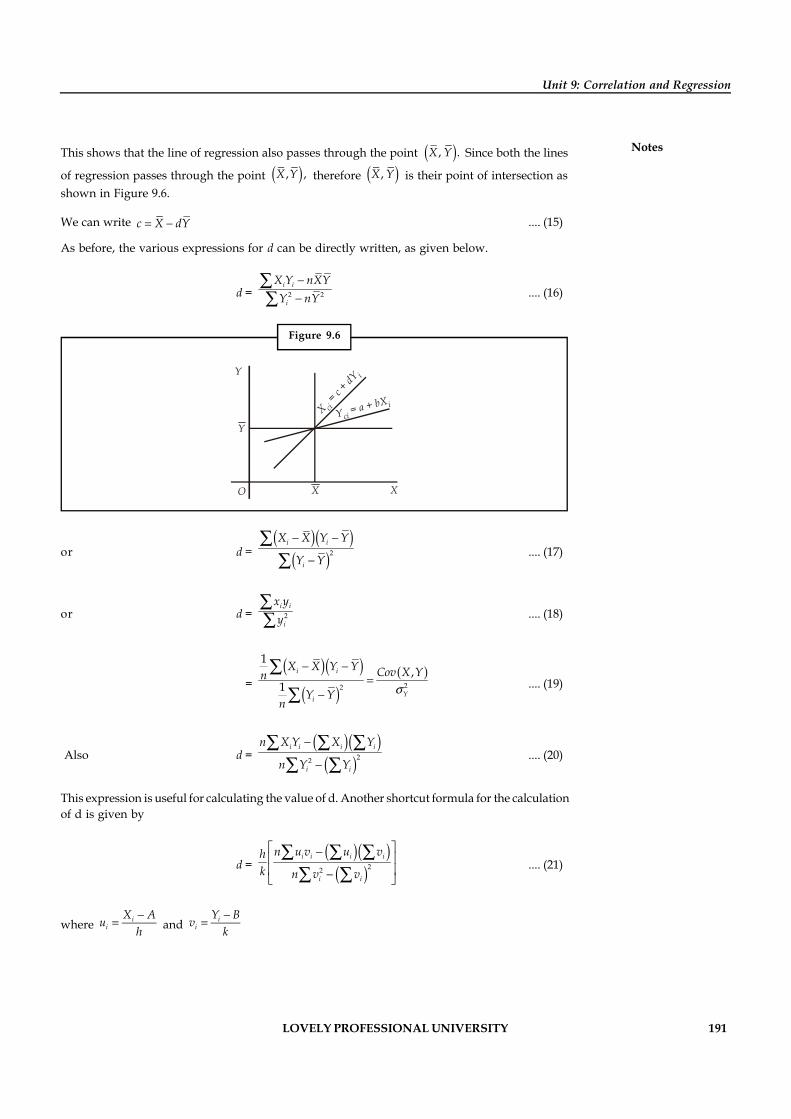
LOVELY PROFESSIONAL UNIVERSITY 191
Unit 9: Correlation and Regression
NotesThis shows that the line of regression also passes through the point ( ), .X Y Since both the lines
of regression passes through the point ( ), ,X Y therefore ( ),X Y is their point of intersection asshown in Figure 9.6.
We can write c X dY - .... (15)
As before, the various expressions for d can be directly written, as given below.
d = 2 2i i
i
X Y nXYY nY
--
åå .... (16)
Figure 9.6
O
Y
Y
X
Y a bXci
i= +
X
X c
dY
ci
i
=+
or d =( )( )
( )2i i
i
X X Y Y
Y Y
- -
-
åå .... (17)
or d = 2i i
i
x yy
åå .... (18)
=( )( )
( )( )
22
1,
1i i
Yi
X X Y Y Cov X YnY Y
ns
- -
-
åå
.... (19)
Also d =( )( )( )22
i i i i
i i
n X Y X Y
n Y Y
-
-
å å åå å
.... (20)
This expression is useful for calculating the value of d. Another shortcut formula for the calculationof d is given by
d =( )( )( )22
i i i i
i i
n u v u vhk n v v
é ù-ê úê ú-ë û
å å åå å
.... (21)
where ii
X Auh-
and ii
Y Bvk-
192 LOVELY PROFESSIONAL UNIVERSITY
Research Methodology
Notes Consider equation (19)
d =( )
2 2
, X Y X
Y Y Y
Cov X Y r rs s ss s s
= = × .... (22)
Substituting the value of c from equation (15) into line of regression of X on Y we have
XCi = ( ) ( )ori Ci iX dY dY X X d Y Y- + - = - .... (23)
or ( )CiX X- = ( )Xi
Y
r Y Yss× - .... (24)
Remarks: It should be noted here that the two lines of regression are different because thesehave been obtained in entirely two different ways. In case of regression of Y on X, it is assumedthat the values of X are given and the values of Y are estimated by minimising S(Yi – YCi)2 whilein case of regression of X on Y, the values of Y are assumed to be given and the values of X areestimated by minimising S(Xi – XCi)2. Since these two lines have been estimated on the basis ofdifferent assumptions, they are not reversible, i.e., it is not possible to obtain one line from theother by mere transfer of terms. There is, however, one situation when these two lines willcoincide. From the study of correlation we may recall that when r = ± 1, there is perfect correlationbetween the variables and all the points lie on a straight line. Therefore, both the lines ofregression coincide and hence they are also reversible in this case. By substituting r = ± 1 inequation (12) or (24) it can be shown that the lines of regression in both the cases become
i i
Y X
Y Y X Xs s
æ ö æ ö- -= ±ç ÷ ç ÷è øè ø
Further when r = 0, equation (12) becomes CiY Y= and equation (24) becomes .CiX X= These arethe equations of lines parallel to X-axis and Y-axis respectively. These lines also intersect at thepoint ( , )X Y and are mutually perpendicular at this point, as shown in Figure.
9.4.2 Correlation Coefficient and the two Regression Coefficients
Since Y
X
b r ss
= × and ,X
Y
d r ss
= × we have
2Y X
X Y
b d r r rs ss s
× = × = or .r b d= × This shows that correlation coefficient is the geometric mean
of the two regression coefficients.
Remarks: The following points should be kept in mind about the coefficient of correlation andthe regression coefficients:
1. Since ( )2
,( , ) ,X Y X
Cov X YCov X Yr bs s s
= = and ( )2
, ,Y
Cov X Yds
= therefore the sign of r, b and d will
always be same and this will depend upon the sign of Cov(X, Y).2. Since bd = r2 and 0 r2 1, therefore either both b and d are less than unity or if one of them
is greater than unity, the other must be less than unity such that 0 b × d 1 is always true.
Example: Obtain the two regression equations and find correlation coefficient between Xand Y from the following data:
X 10 9 7 8 11
Y 6 3 2 4 5
LOVELY PROFESSIONAL UNIVERSITY 193
Unit 9: Correlation and Regression
NotesSolution:Calculation Table
X Y XY X2 Y2
10 6 60 100 36
9 3 27 81 9
7 2 14 49 4
8 4 32 64 16
11 5 55 121 25
45 20 188 415 90
(a) Regression of Y on X
b =( )( )( ) ( )2 22
5 188 45 20 0.85 415 45
n XY X Y
n X X
- ´ - ´= =
´ --
å å åå å
Also, 45 95
X = = and 20 45
Y = =
Now a Y bX= - = 4 - 0.8 × 9 = – 3.2
Regression of Y on X is YC = – 3.2 + 0.8X
(b) Regression of X on Y
d =( )( )( ) ( )2 22
5 188 45 20 0.85 90 20
n XY X Y
n Y Y
- ´ - ´= =
´ --
å å åå å
Also, c X dY= - = 9 – 0.8 × 4 = 5.8
The regression of X on Y is XC = 5.8 + 0.8Y
(c) Coefficient of correlation 0.8 0.8 0.8r b d= × = ´ =
9.4.3 Non-parametric Regression
Nonparametric regression analysis traces the dependence of a response variable (y) on one orseveral predictors (xs) without specifying in advance the function that relates the response to thepredictors:
E(yi) = f(x1i,..., xpi)
where E(yi) is the mean of y for the ith of n observations. It is typically assumed that theconditional variance of y, Var(y i|x1i,..., xpi) is a constant, and that the conditional distribution ofy is normal, although these assumptions can be relaxed.
There are many specific methods of non-parametric regression. Most, but not all, assume thatthe regression function is in some sense smooth.
The simplest use of non-parametric regression is in smoothing scatterplots. Here, there is anumerical response y and a single predictor x, and we seek to clarify visually the relationshipbetween the two variables in a scatterplot. Three common methods of nonparametric regressionare kernel estimation, local-polynomial regression (which is a generalization of kernelestimation), and smoothing splines.
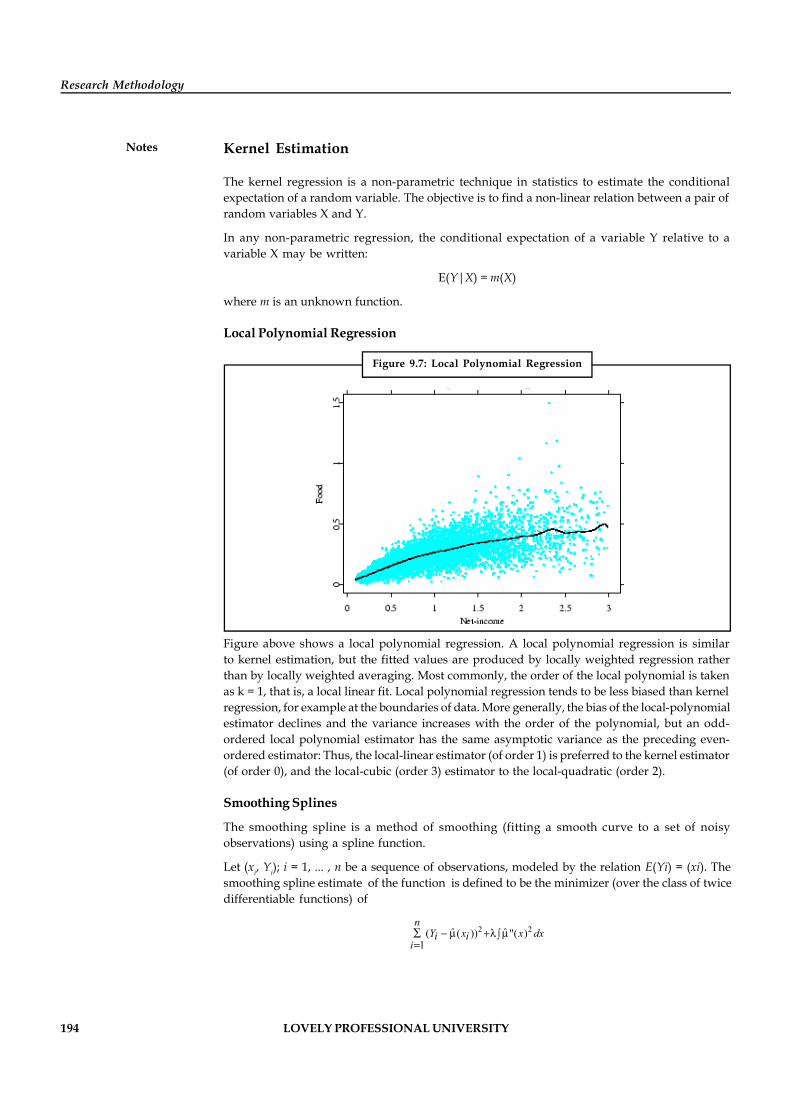
194 LOVELY PROFESSIONAL UNIVERSITY
Research Methodology
Notes Kernel Estimation
The kernel regression is a non-parametric technique in statistics to estimate the conditionalexpectation of a random variable. The objective is to find a non-linear relation between a pair ofrandom variables X and Y.
In any non-parametric regression, the conditional expectation of a variable Y relative to avariable X may be written:
E(Y|X) = m(X)
where m is an unknown function.
Local Polynomial Regression
Figure 9.7: Local Polynomial Regression
Figure above shows a local polynomial regression. A local polynomial regression is similarto kernel estimation, but the fitted values are produced by locally weighted regression ratherthan by locally weighted averaging. Most commonly, the order of the local polynomial is takenas k = 1, that is, a local linear fit. Local polynomial regression tends to be less biased than kernelregression, for example at the boundaries of data. More generally, the bias of the local-polynomialestimator declines and the variance increases with the order of the polynomial, but an odd-ordered local polynomial estimator has the same asymptotic variance as the preceding even-ordered estimator: Thus, the local-linear estimator (of order 1) is preferred to the kernel estimator(of order 0), and the local-cubic (order 3) estimator to the local-quadratic (order 2).
Smoothing Splines
The smoothing spline is a method of smoothing (fitting a smooth curve to a set of noisyobservations) using a spline function.
Let (xi, Yi); i = 1, ... , n be a sequence of observations, modeled by the relation E(Yi) = (xi). Thesmoothing spline estimate of the function is defined to be the minimizer (over the class of twicedifferentiable functions) of
2 2ˆ ˆ( ( )) "( )1
å - m +l mò
nY x x dxi i
i
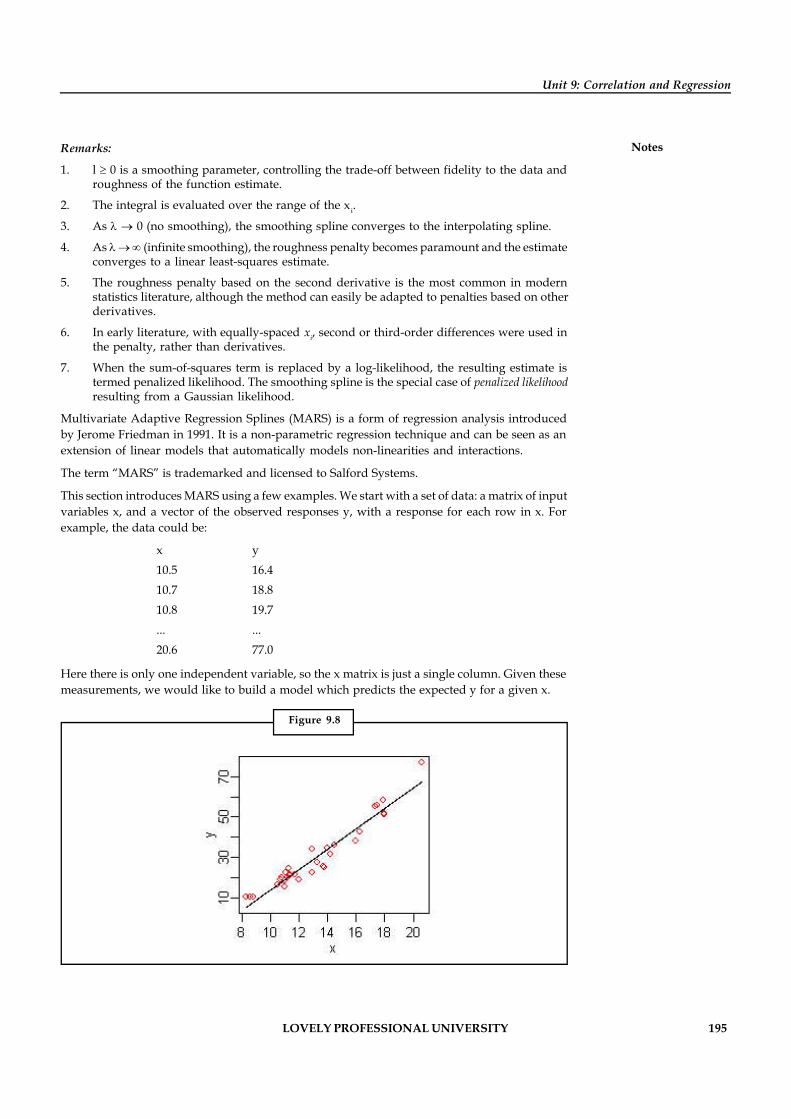
LOVELY PROFESSIONAL UNIVERSITY 195
Unit 9: Correlation and Regression
NotesRemarks:
1. l 0 is a smoothing parameter, controlling the trade-off between fidelity to the data androughness of the function estimate.
2. The integral is evaluated over the range of the x i.
3. As 0 (no smoothing), the smoothing spline converges to the interpolating spline.
4. As (infinite smoothing), the roughness penalty becomes paramount and the estimateconverges to a linear least-squares estimate.
5. The roughness penalty based on the second derivative is the most common in modernstatistics literature, although the method can easily be adapted to penalties based on otherderivatives.
6. In early literature, with equally-spaced xi, second or third-order differences were used inthe penalty, rather than derivatives.
7. When the sum-of-squares term is replaced by a log-likelihood, the resulting estimate istermed penalized likelihood. The smoothing spline is the special case of penalized likelihoodresulting from a Gaussian likelihood.
Multivariate Adaptive Regression Splines (MARS) is a form of regression analysis introducedby Jerome Friedman in 1991. It is a non-parametric regression technique and can be seen as anextension of linear models that automatically models non-linearities and interactions.
The term “MARS” is trademarked and licensed to Salford Systems.
This section introduces MARS using a few examples. We start with a set of data: a matrix of inputvariables x, and a vector of the observed responses y, with a response for each row in x. Forexample, the data could be:
x y10.5 16.410.7 18.810.8 19.7... ...20.6 77.0
Here there is only one independent variable, so the x matrix is just a single column. Given thesemeasurements, we would like to build a model which predicts the expected y for a given x.
Figure 9.8
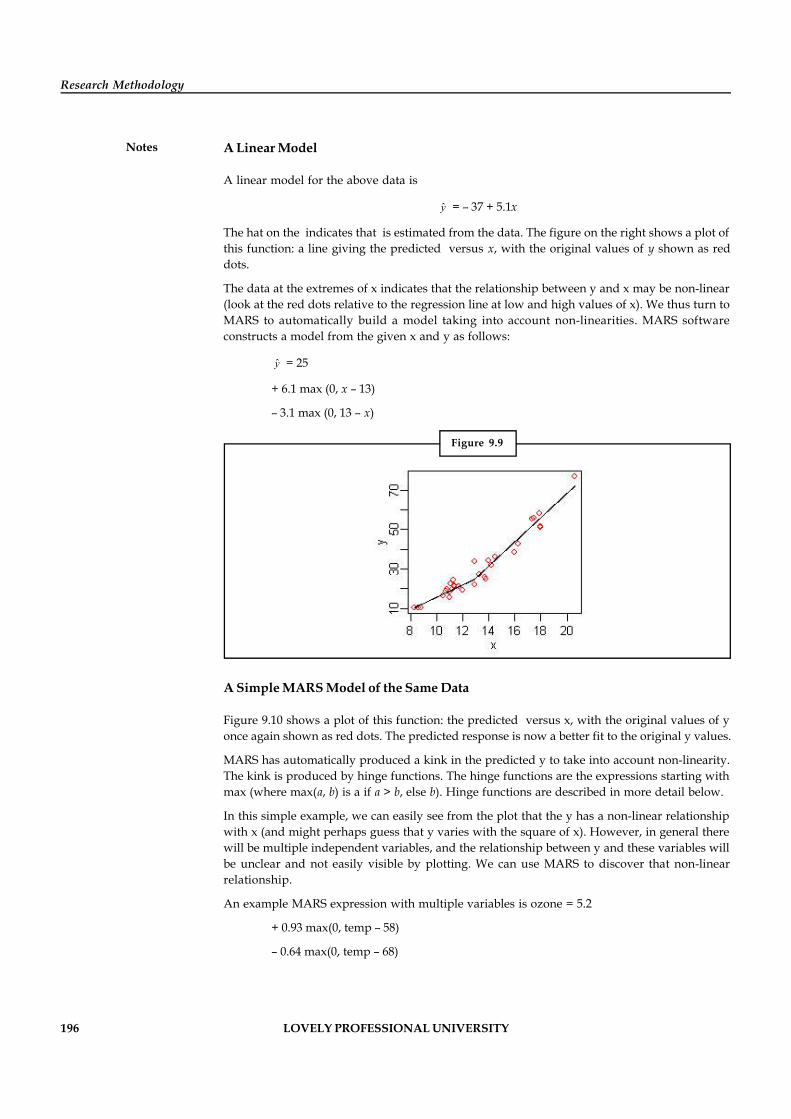
196 LOVELY PROFESSIONAL UNIVERSITY
Research Methodology
Notes A Linear Model
A linear model for the above data is
y = – 37 + 5.1x
The hat on the indicates that is estimated from the data. The figure on the right shows a plot ofthis function: a line giving the predicted versus x, with the original values of y shown as reddots.
The data at the extremes of x indicates that the relationship between y and x may be non-linear(look at the red dots relative to the regression line at low and high values of x). We thus turn toMARS to automatically build a model taking into account non-linearities. MARS softwareconstructs a model from the given x and y as follows:
y = 25
+ 6.1 max (0, x – 13)
– 3.1 max (0, 13 – x)
Figure 9.9
A Simple MARS Model of the Same Data
Figure 9.10 shows a plot of this function: the predicted versus x, with the original values of yonce again shown as red dots. The predicted response is now a better fit to the original y values.
MARS has automatically produced a kink in the predicted y to take into account non-linearity.The kink is produced by hinge functions. The hinge functions are the expressions starting withmax (where max(a, b) is a if a > b, else b). Hinge functions are described in more detail below.
In this simple example, we can easily see from the plot that the y has a non-linear relationshipwith x (and might perhaps guess that y varies with the square of x). However, in general therewill be multiple independent variables, and the relationship between y and these variables willbe unclear and not easily visible by plotting. We can use MARS to discover that non-linearrelationship.
An example MARS expression with multiple variables is ozone = 5.2
+ 0.93 max(0, temp – 58)
– 0.64 max(0, temp – 68)
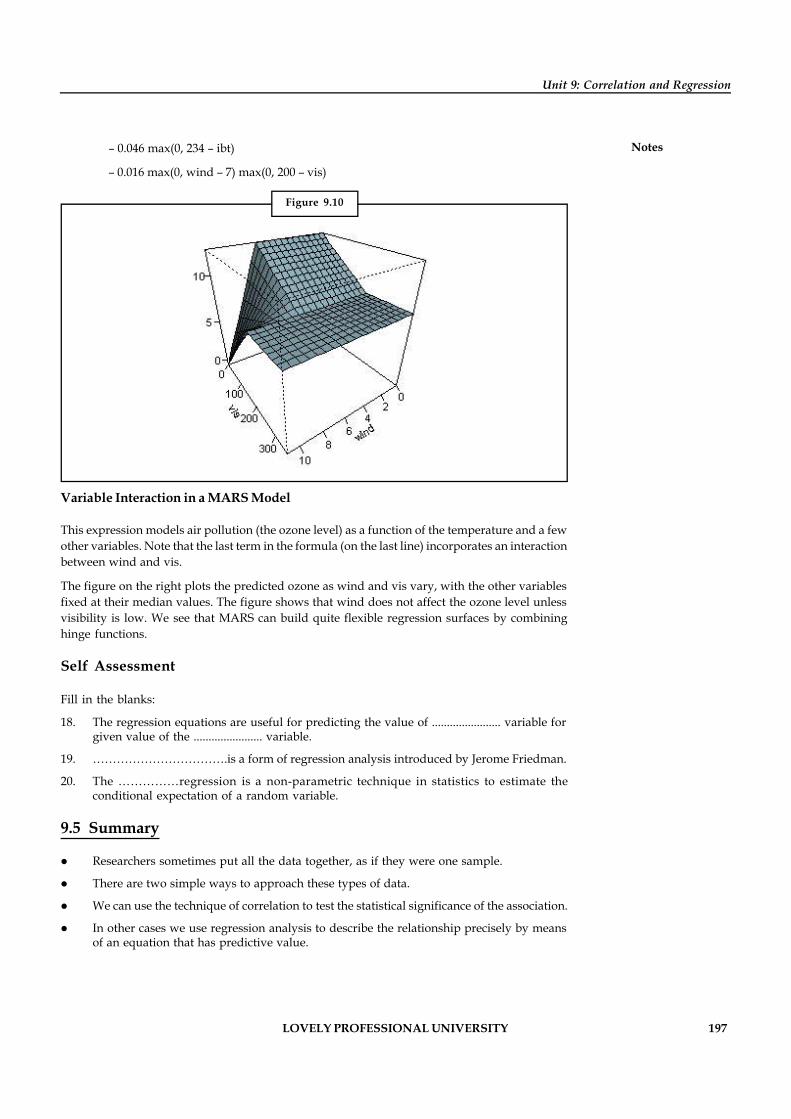
LOVELY PROFESSIONAL UNIVERSITY 197
Unit 9: Correlation and Regression
Notes– 0.046 max(0, 234 – ibt)
– 0.016 max(0, wind – 7) max(0, 200 – vis)
Figure 9.10
Variable Interaction in a MARS Model
This expression models air pollution (the ozone level) as a function of the temperature and a fewother variables. Note that the last term in the formula (on the last line) incorporates an interactionbetween wind and vis.
The figure on the right plots the predicted ozone as wind and vis vary, with the other variablesfixed at their median values. The figure shows that wind does not affect the ozone level unlessvisibility is low. We see that MARS can build quite flexible regression surfaces by combininghinge functions.
Self Assessment
Fill in the blanks:
18. The regression equations are useful for predicting the value of ....................... variable forgiven value of the ....................... variable.
19. …………………………….is a form of regression analysis introduced by Jerome Friedman.
20. The ……………regression is a non-parametric technique in statistics to estimate theconditional expectation of a random variable.
9.5 Summary
Researchers sometimes put all the data together, as if they were one sample.
There are two simple ways to approach these types of data.
We can use the technique of correlation to test the statistical significance of the association.
In other cases we use regression analysis to describe the relationship precisely by meansof an equation that has predictive value.
198 LOVELY PROFESSIONAL UNIVERSITY
Research Methodology
Notes Straight-line (linear) relationships are particularly important because a straight line is asimple pattern that is quite common.
The correlation measures the direction and strength of the linear relationship.
The least-squares regression line is the line that makes the sum of the squares of thevertical distances of the data points from the line as small as possible.
Non-parametric regression analysis traces the dependence of a response variable on oneor several predictors without specifying in advance the function that relates the responseto the predictors.
9.6 Keywords
Correlation: It is an analysis of covariation between two or more variables.
Correlation Coefficient: It is a numerical measure of the degree of association between two ormore variables.
Kernel Estimation: The kernel regression is a non-parametric technique in statistics to estimatethe conditional expectation of a random variable.
Regression Equation: If the coefficient of correlation calculated for bivariate data (Xi, Yi), i = 1, 2,...... n, is reasonably high and a cause and effect type of relation is also believed to be existingbetween them, the next logical step is to obtain a functional relation between these variables.This functional relation is known as regression equation in statistics.
Smoothing Splines: It is a method of fitting a smooth curve to a set of noisy observations usinga spline function.
9.7 Review Questions
1. Obtain the two lines of regression from the following data and estimate the blood pressurewhen age is 50 years. Can we also estimate the blood pressure of a person aged 20 years onthe basis of this regression equation? Discuss.
Age (X) (in years) 56 42 72 39 63 47 52 49 40 42 68 60
Blood Pressure (Y) 127 112 140 118 129 116 130 125 115 120 135 133
2. Show that the coefficient of correlation, r, is independent of change of origin and scale.
3. Prove that the coefficient of correlation lies between – 1 and + 1.
4. “If two variables are independent the correlation between them is zero, but the converseis not always true”. Explain the meaning of this statement.
5. What is Spearman’s rank correlation? What are the advantages of the coefficient of rankcorrelation over Karl Pearson’s coefficient of correlation?
6. Distinguish between correlation and regression. Discuss least square method of fittingregression.
7. What do you understand by linear regression? Why there are two lines of regression?Under what condition(s) can there be only one line?
8. What do you think as the reason behind the two lines of regression being different?
9. For a bivariate data, which variable can we have as independent? Why?
10. What can you conclude on the basis of the fact that the correlation between body weightand annual income were high and positive?
LOVELY PROFESSIONAL UNIVERSITY 199
Unit 9: Correlation and Regression
Notes11. From the data given below, find out:
(i) Karl Pearson's coefficient of correlation.
(ii) The two regression equations.
(iii) The two regression coefficients.
(iv) The most likely value of X when Y = 41.
(v) The most likely value of Y when X = - 45.
X 52 60 58 39 41 53 47 34
Y 40 46 43 54 49 55 48 57
12. Find the multiple and partial correlation coefficients for the following data.
X 19 21 24 2 6 27 27 2 9 31 30 3 1
Y 24 28 29 3 9 30 31 3 4 35 36 3 7
Z 21 2 - 26 3 0 27 32 3 1 36 33 3 8
13. Find the multiple correlation coefficient R1.23, the partial correlation coefficient r23.1 andthe multiple regression equation of X2 on X3 X1.
X1 5 5 59 63 68 56 73 82 7 6 64 74
Y1 5 8 60 53 52 61 70 76 7 7 63 80
Z 1 6 3 55 51 56 59 74 74 8 1 61 84
14. Find the three multiple correlation coefficients for the following data.
X1 7 2 6 8 3 5 9 10 15 12
X2 1 5 8 4 9 3 6 7 13 10
X3 3 4 9 2 1 7 5 8 10 14
15. Find the regression equation of X2 on X3, X1 for the following data.
X1 1 2 16 19 27 29 32 33 3 9 40 43
X2 7 9 11 13 16 19 24 3 1 33 37
X3 3 6 9 11 15 21 25 2 6 34 40
Answers: Self Assessment
1. ‘Spearman’s Rank Correlation 2. degree, direction
3. probable error 4. extreme
5. Rank 6. positive
7. mean 8. 0.3, small
9. cause and effect 10. uncorrelated
11. – 1 and + 1 12. origin, scale
13. avoid 14. multiple
15. simple 16. xk
17. Partial 18. dependent, independent
19. Multivariate Adaptive Regression Splines
20. kernel

200 LOVELY PROFESSIONAL UNIVERSITY
Research Methodology
Notes 9.8 Further Readings
Books Abrams, M.A., Social Surveys and Social Action, London: Heinemann, 1951.
Arthur, Maurice, Philosophy of Scientific Investigation , Baltimore: John HopkinsUniversity Press, 1943.
RS. Bhardwaj, Business Statistics, Excel Books, New Delhi, 2008.
S.N. Murthy and U. Bhojanna, Business Research Methods, Excel Books, 2007.
LOVELY PROFESSIONAL UNIVERSITY 201
Unit 10: Time Series
NotesUnit 10: Time Series
CONTENTS
Objectives
Introduction
10.1 Time Series Analysis
10.2 Components of a Time Series
10.2.1 Secular Trend
10.2.2 Periodic Variations
10.2.3 Random or Irregular Variations
10.3 Time Series Forecasting Method
10.3.1 Method of Moving Average
10.3.2 Exponential Smoothing
10.4 The Mean Absolute Deviation (MAD)
10.5 Mean Squared Error (MSE)
10.6 Seasonal Variations
10.6.1 Method of Simple Averages
10.6.2 Ratio to Trend Method
10.6.3 Ratio to Moving Average Method
10.6.4 Link Relatives Method
10.7 Summary
10.8 Keywords
10.9 Review Questions
10.10 Further Readings
Objectives
After studying this unit, you will be able to:
Recognize the time series analysis
Identify the components of time series
Explain the time series forecasting method
Discuss the seasonal variations
Describe the various methods to measure seasonal variations
Introduction
The future has always held a great fascination for mankind. Perhaps this is biologicallydetermined. Man and the higher apes seem to have brains that are equipped to engage in actionsfor which a future reward is anticipated. In extreme situation reward is anticipated not in thislife but in the next life.
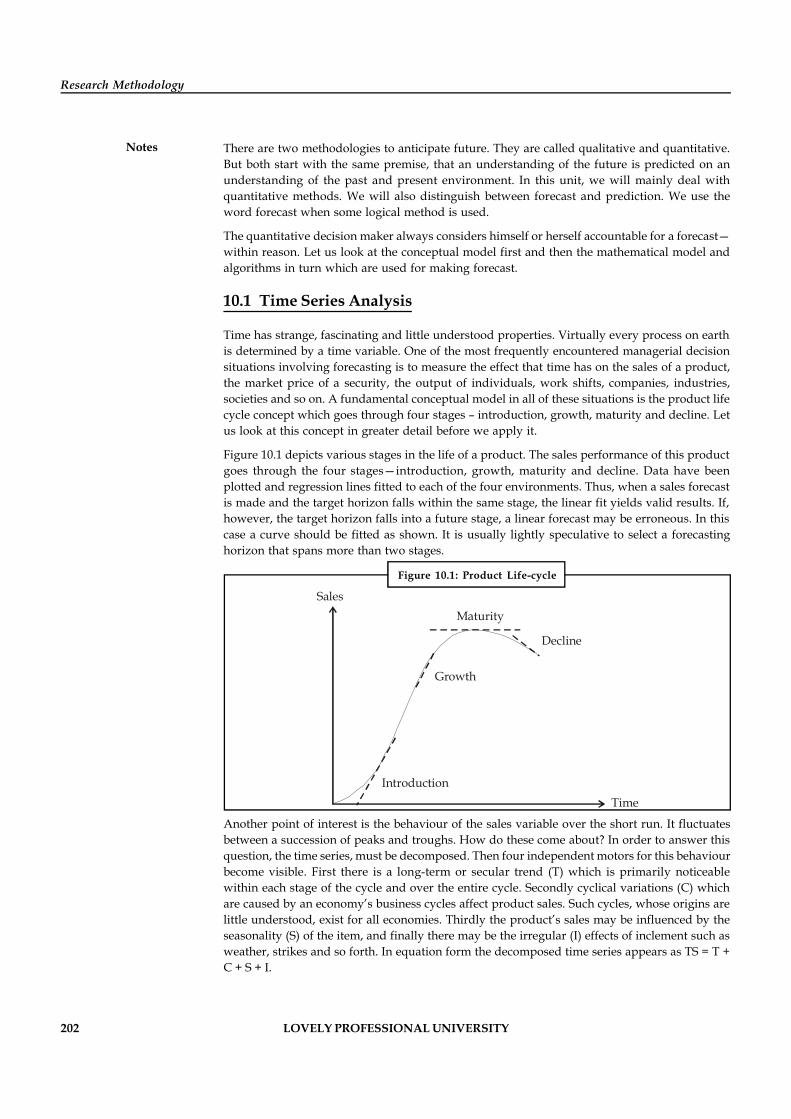
202 LOVELY PROFESSIONAL UNIVERSITY
Research Methodology
Notes There are two methodologies to anticipate future. They are called qualitative and quantitative.But both start with the same premise, that an understanding of the future is predicted on anunderstanding of the past and present environment. In this unit, we will mainly deal withquantitative methods. We will also distinguish between forecast and prediction. We use theword forecast when some logical method is used.
The quantitative decision maker always considers himself or herself accountable for a forecast—within reason. Let us look at the conceptual model first and then the mathematical model andalgorithms in turn which are used for making forecast.
10.1 Time Series Analysis
Time has strange, fascinating and little understood properties. Virtually every process on earthis determined by a time variable. One of the most frequently encountered managerial decisionsituations involving forecasting is to measure the effect that time has on the sales of a product,the market price of a security, the output of individuals, work shifts, companies, industries,societies and so on. A fundamental conceptual model in all of these situations is the product lifecycle concept which goes through four stages – introduction, growth, maturity and decline. Letus look at this concept in greater detail before we apply it.
Figure 10.1 depicts various stages in the life of a product. The sales performance of this productgoes through the four stages—introduction, growth, maturity and decline. Data have beenplotted and regression lines fitted to each of the four environments. Thus, when a sales forecastis made and the target horizon falls within the same stage, the linear fit yields valid results. If,however, the target horizon falls into a future stage, a linear forecast may be erroneous. In thiscase a curve should be fitted as shown. It is usually lightly speculative to select a forecastinghorizon that spans more than two stages.
Figure 10.1: Product Life-cycle
Maturity
Decline
Growth
Introduction
Sales
Time
Another point of interest is the behaviour of the sales variable over the short run. It fluctuatesbetween a succession of peaks and troughs. How do these come about? In order to answer thisquestion, the time series, must be decomposed. Then four independent motors for this behaviourbecome visible. First there is a long-term or secular trend (T) which is primarily noticeablewithin each stage of the cycle and over the entire cycle. Secondly cyclical variations (C) whichare caused by an economy’s business cycles affect product sales. Such cycles, whose origins arelittle understood, exist for all economies. Thirdly the product’s sales may be influenced by theseasonality (S) of the item, and finally there may be the irregular (I) effects of inclement such asweather, strikes and so forth. In equation form the decomposed time series appears as TS = T +C + S + I.
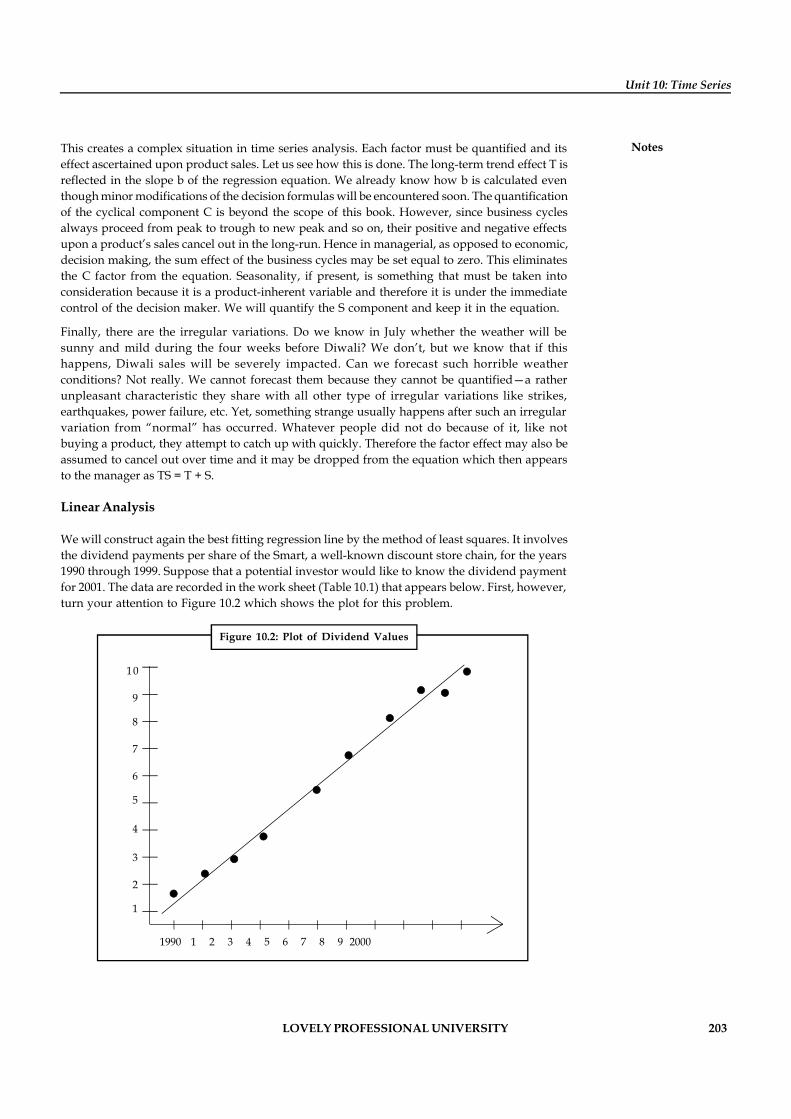
LOVELY PROFESSIONAL UNIVERSITY 203
Unit 10: Time Series
NotesThis creates a complex situation in time series analysis. Each factor must be quantified and itseffect ascertained upon product sales. Let us see how this is done. The long-term trend effect T isreflected in the slope b of the regression equation. We already know how b is calculated eventhough minor modifications of the decision formulas will be encountered soon. The quantificationof the cyclical component C is beyond the scope of this book. However, since business cyclesalways proceed from peak to trough to new peak and so on, their positive and negative effectsupon a product’s sales cancel out in the long-run. Hence in managerial, as opposed to economic,decision making, the sum effect of the business cycles may be set equal to zero. This eliminatesthe C factor from the equation. Seasonality, if present, is something that must be taken intoconsideration because it is a product-inherent variable and therefore it is under the immediatecontrol of the decision maker. We will quantify the S component and keep it in the equation.
Finally, there are the irregular variations. Do we know in July whether the weather will besunny and mild during the four weeks before Diwali? We don’t, but we know that if thishappens, Diwali sales will be severely impacted. Can we forecast such horrible weatherconditions? Not really. We cannot forecast them because they cannot be quantified—a ratherunpleasant characteristic they share with all other type of irregular variations like strikes,earthquakes, power failure, etc. Yet, something strange usually happens after such an irregularvariation from “normal” has occurred. Whatever people did not do because of it, like notbuying a product, they attempt to catch up with quickly. Therefore the factor effect may also beassumed to cancel out over time and it may be dropped from the equation which then appearsto the manager as TS = T + S.
Linear Analysis
We will construct again the best fitting regression line by the method of least squares. It involvesthe dividend payments per share of the Smart, a well-known discount store chain, for the years1990 through 1999. Suppose that a potential investor would like to know the dividend paymentfor 2001. The data are recorded in the work sheet (Table 10.1) that appears below. First, however,turn your attention to Figure 10.2 which shows the plot for this problem.
10
9
8
7
6
5
4
3
2
1
1990 1 2 3 4 5 6 7 8 9 2000
Figure 10.2: Plot of Dividend Values
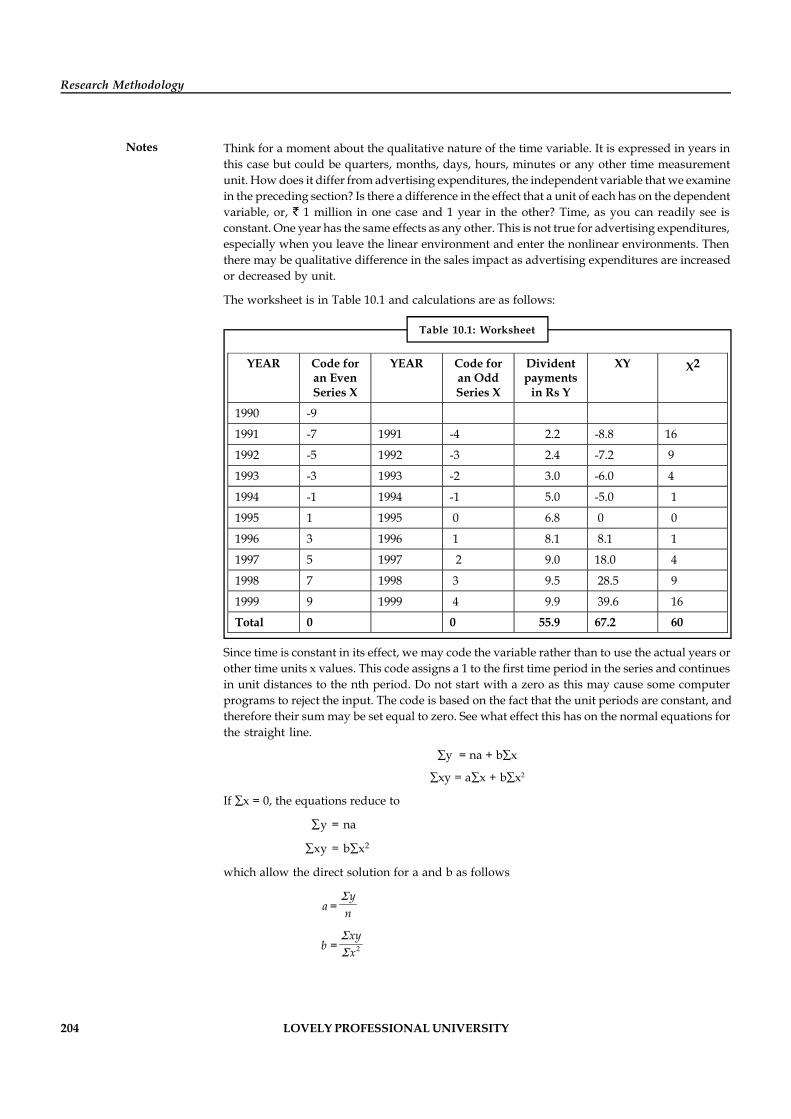
204 LOVELY PROFESSIONAL UNIVERSITY
Research Methodology
Notes Think for a moment about the qualitative nature of the time variable. It is expressed in years inthis case but could be quarters, months, days, hours, minutes or any other time measurementunit. How does it differ from advertising expenditures, the independent variable that we examinein the preceding section? Is there a difference in the effect that a unit of each has on the dependentvariable, or, 1 million in one case and 1 year in the other? Time, as you can readily see isconstant. One year has the same effects as any other. This is not true for advertising expenditures,especially when you leave the linear environment and enter the nonlinear environments. Thenthere may be qualitative difference in the sales impact as advertising expenditures are increasedor decreased by unit.
The worksheet is in Table 10.1 and calculations are as follows:
Table 10.1: Worksheet
YEAR Code for an Even Series X
YEAR Code for an Odd Series X
Divident payments
in Rs Y
XY X2
1990 -9
1991 -7 1991 -4 2.2 -8.8 16
1992 -5 1992 -3 2.4 -7.2 9
1993 -3 1993 -2 3.0 -6.0 4
1994 -1 1994 -1 5.0 -5.0 1
1995 1 1995 0 6.8 0 0
1996 3 1996 1 8.1 8.1 1
1997 5 1997 2 9.0 18.0 4
1998 7 1998 3 9.5 28.5 9
1999 9 1999 4 9.9 39.6 16
Total 0 0 55.9 67.2 60
Since time is constant in its effect, we may code the variable rather than to use the actual years orother time units x values. This code assigns a 1 to the first time period in the series and continuesin unit distances to the nth period. Do not start with a zero as this may cause some computerprograms to reject the input. The code is based on the fact that the unit periods are constant, andtherefore their sum may be set equal to zero. See what effect this has on the normal equations forthe straight line.
y = na + bx
xy = ax + bx2
If x = 0, the equations reduce to
y = na
xy = bx2
which allow the direct solution for a and b as follows
a =y
nS
b = 2
xyx
SS
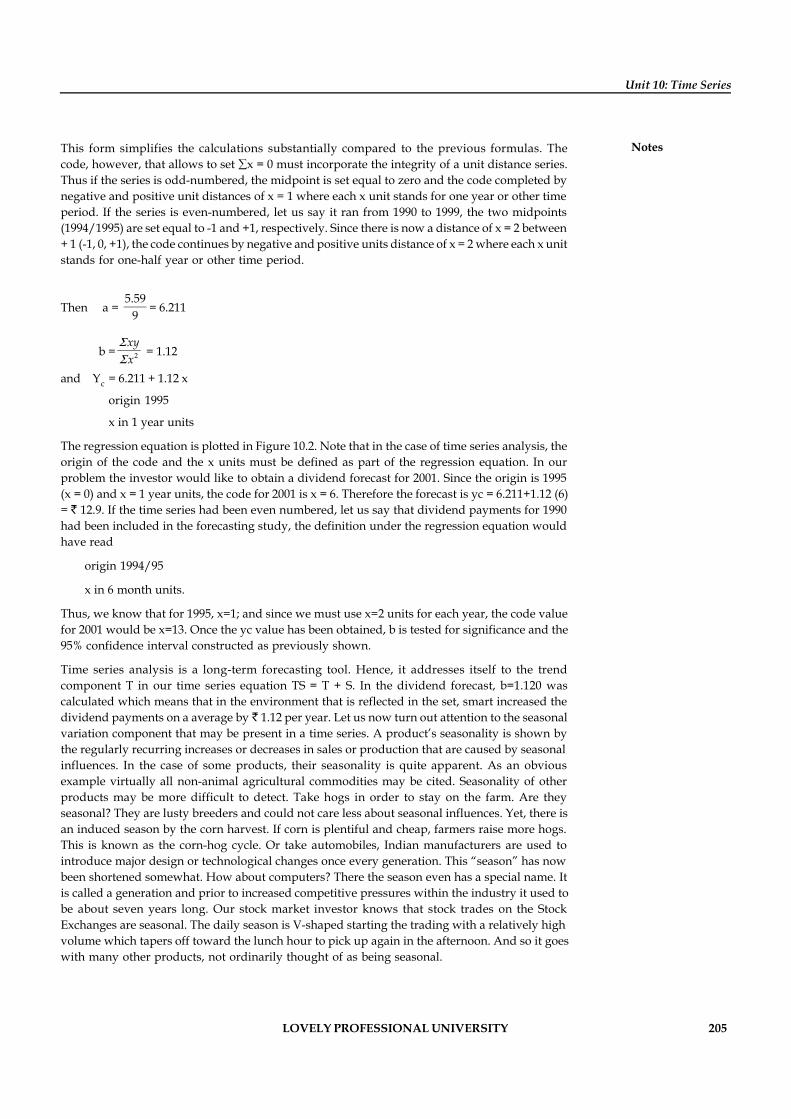
LOVELY PROFESSIONAL UNIVERSITY 205
Unit 10: Time Series
NotesThis form simplifies the calculations substantially compared to the previous formulas. Thecode, however, that allows to set x = 0 must incorporate the integrity of a unit distance series.Thus if the series is odd-numbered, the midpoint is set equal to zero and the code completed bynegative and positive unit distances of x = 1 where each x unit stands for one year or other timeperiod. If the series is even-numbered, let us say it ran from 1990 to 1999, the two midpoints(1994/1995) are set equal to -1 and +1, respectively. Since there is now a distance of x = 2 between+ 1 (-1, 0, +1), the code continues by negative and positive units distance of x = 2 where each x unitstands for one-half year or other time period.
Then a = 5.59
9= 6.211
b = 2
xyx
SS = 1.12
and Yc = 6.211 + 1.12 x
origin 1995
x in 1 year units
The regression equation is plotted in Figure 10.2. Note that in the case of time series analysis, theorigin of the code and the x units must be defined as part of the regression equation. In ourproblem the investor would like to obtain a dividend forecast for 2001. Since the origin is 1995(x = 0) and x = 1 year units, the code for 2001 is x = 6. Therefore the forecast is yc = 6.211+1.12 (6)= 12.9. If the time series had been even numbered, let us say that dividend payments for 1990had been included in the forecasting study, the definition under the regression equation wouldhave read
origin 1994/95
x in 6 month units.
Thus, we know that for 1995, x=1; and since we must use x=2 units for each year, the code valuefor 2001 would be x=13. Once the yc value has been obtained, b is tested for significance and the95% confidence interval constructed as previously shown.
Time series analysis is a long-term forecasting tool. Hence, it addresses itself to the trendcomponent T in our time series equation TS = T + S. In the dividend forecast, b=1.120 wascalculated which means that in the environment that is reflected in the set, smart increased thedividend payments on a average by 1.12 per year. Let us now turn out attention to the seasonalvariation component that may be present in a time series. A product’s seasonality is shown bythe regularly recurring increases or decreases in sales or production that are caused by seasonalinfluences. In the case of some products, their seasonality is quite apparent. As an obviousexample virtually all non-animal agricultural commodities may be cited. Seasonality of otherproducts may be more difficult to detect. Take hogs in order to stay on the farm. Are theyseasonal? They are lusty breeders and could not care less about seasonal influences. Yet, there isan induced season by the corn harvest. If corn is plentiful and cheap, farmers raise more hogs.This is known as the corn-hog cycle. Or take automobiles, Indian manufacturers are used tointroduce major design or technological changes once every generation. This “season” has nowbeen shortened somewhat. How about computers? There the season even has a special name. Itis called a generation and prior to increased competitive pressures within the industry it used tobe about seven years long. Our stock market investor knows that stock trades on the StockExchanges are seasonal. The daily season is V-shaped starting the trading with a relatively highvolume which tapers off toward the lunch hour to pick up again in the afternoon. And so it goeswith many other products, not ordinarily thought of as being seasonal.
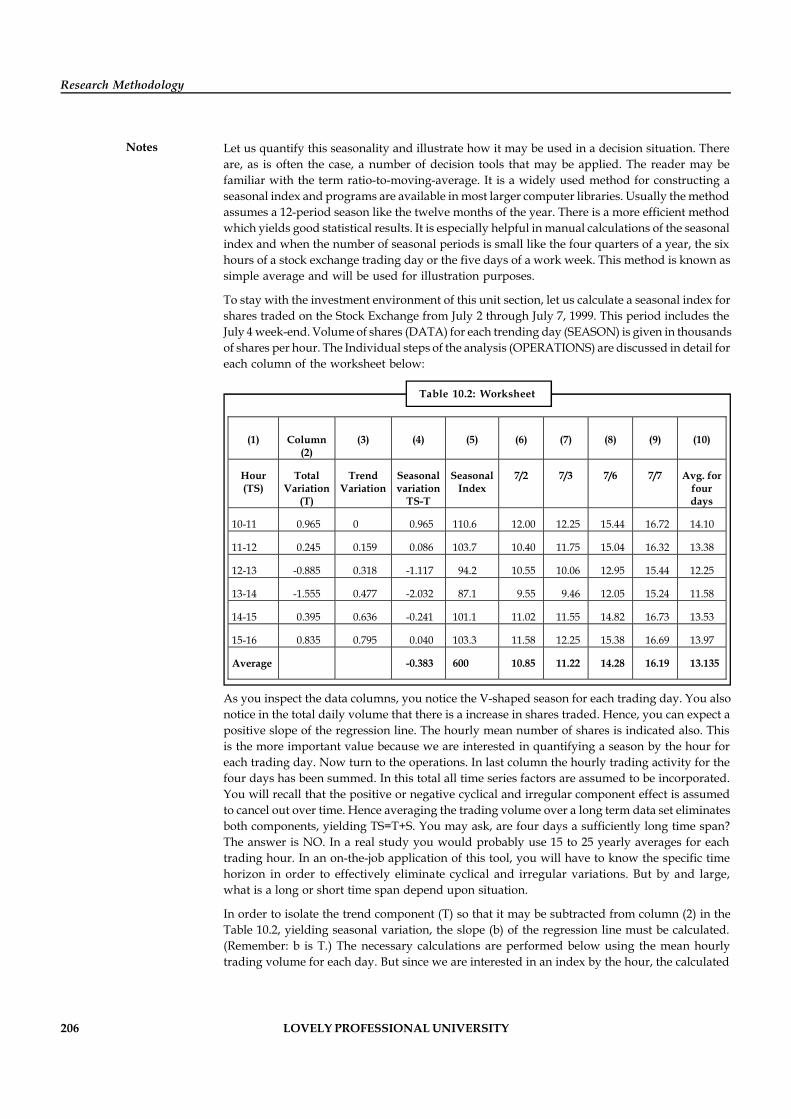
206 LOVELY PROFESSIONAL UNIVERSITY
Research Methodology
Notes Let us quantify this seasonality and illustrate how it may be used in a decision situation. Thereare, as is often the case, a number of decision tools that may be applied. The reader may befamiliar with the term ratio-to-moving-average. It is a widely used method for constructing aseasonal index and programs are available in most larger computer libraries. Usually the methodassumes a 12-period season like the twelve months of the year. There is a more efficient methodwhich yields good statistical results. It is especially helpful in manual calculations of the seasonalindex and when the number of seasonal periods is small like the four quarters of a year, the sixhours of a stock exchange trading day or the five days of a work week. This method is known assimple average and will be used for illustration purposes.
To stay with the investment environment of this unit section, let us calculate a seasonal index forshares traded on the Stock Exchange from July 2 through July 7, 1999. This period includes theJuly 4 week-end. Volume of shares (DATA) for each trending day (SEASON) is given in thousandsof shares per hour. The Individual steps of the analysis (OPERATIONS) are discussed in detail foreach column of the worksheet below:
Table 10.2: Worksheet
(1) Column (2)
(3) (4) (5) (6) (7) (8) (9) (10)
Hour (TS)
Total Variation
(T)
Trend Variation
Seasonal variation
TS-T
Seasonal Index
7/2 7/3 7/6 7/7 Avg. for four days
10-11 0.965 0 0.965 110.6 12.00 12.25 15.44 16.72 14.10
11-12 0.245 0.159 0.086 103.7 10.40 11.75 15.04 16.32 13.38
12-13 -0.885 0.318 -1.117 94.2 10.55 10.06 12.95 15.44 12.25
13-14 -1.555 0.477 -2.032 87.1 9.55 9.46 12.05 15.24 11.58
14-15 0.395 0.636 -0.241 101.1 11.02 11.55 14.82 16.73 13.53
15-16 0.835 0.795 0.040 103.3 11.58 12.25 15.38 16.69 13.97
Average -0.383 600 10.85 11.22 14.28 16.19 13.135
As you inspect the data columns, you notice the V-shaped season for each trading day. You alsonotice in the total daily volume that there is a increase in shares traded. Hence, you can expect apositive slope of the regression line. The hourly mean number of shares is indicated also. Thisis the more important value because we are interested in quantifying a season by the hour foreach trading day. Now turn to the operations. In last column the hourly trading activity for thefour days has been summed. In this total all time series factors are assumed to be incorporated.You will recall that the positive or negative cyclical and irregular component effect is assumedto cancel out over time. Hence averaging the trading volume over a long term data set eliminatesboth components, yielding TS=T+S. You may ask, are four days a sufficiently long time span?The answer is NO. In a real study you would probably use 15 to 25 yearly averages for eachtrading hour. In an on-the-job application of this tool, you will have to know the specific timehorizon in order to effectively eliminate cyclical and irregular variations. But by and large,what is a long or short time span depend upon situation.
In order to isolate the trend component (T) so that it may be subtracted from column (2) in theTable 10.2, yielding seasonal variation, the slope (b) of the regression line must be calculated.(Remember: b is T.) The necessary calculations are performed below using the mean hourlytrading volume for each day. But since we are interested in an index by the hour, the calculated
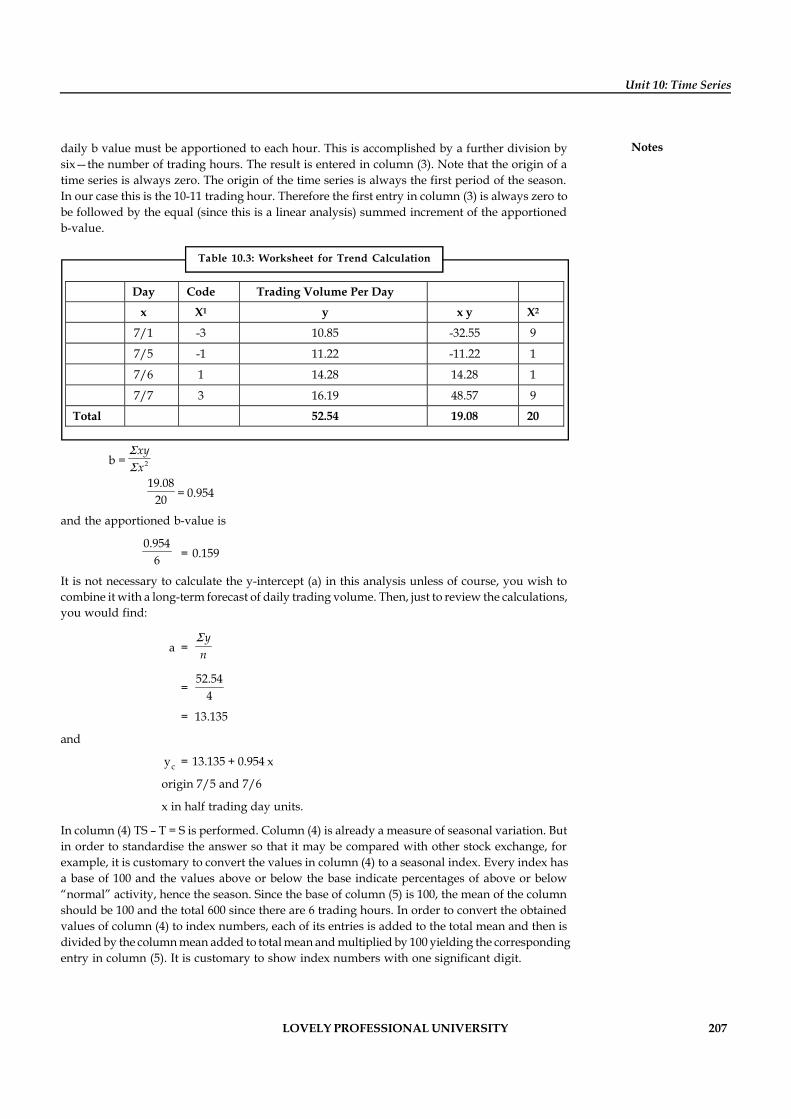
LOVELY PROFESSIONAL UNIVERSITY 207
Unit 10: Time Series
Notesdaily b value must be apportioned to each hour. This is accomplished by a further division bysix—the number of trading hours. The result is entered in column (3). Note that the origin of atime series is always zero. The origin of the time series is always the first period of the season.In our case this is the 10-11 trading hour. Therefore the first entry in column (3) is always zero tobe followed by the equal (since this is a linear analysis) summed increment of the apportionedb-value.
Table 10.3: Worksheet for Trend Calculation
Day Code Trading Volume Per Day
x X1 y x y X2
7/1 -3 10.85 -32.55 9
7/5 -1 11.22 -11.22 1
7/6 1 14.28 14.28 1
7/7 3 16.19 48.57 9
Total 52.54 19.08 20
b = 2
xyx
SS
19.0820 = 0.954
and the apportioned b-value is
0.9546 = 0.159
It is not necessary to calculate the y-intercept (a) in this analysis unless of course, you wish tocombine it with a long-term forecast of daily trading volume. Then, just to review the calculations,you would find:
a =y
nS
=52.54
4
= 13.135
and
yc = 13.135 + 0.954 x
origin 7/5 and 7/6
x in half trading day units.
In column (4) TS – T = S is performed. Column (4) is already a measure of seasonal variation. Butin order to standardise the answer so that it may be compared with other stock exchange, forexample, it is customary to convert the values in column (4) to a seasonal index. Every index hasa base of 100 and the values above or below the base indicate percentages of above or below“normal” activity, hence the season. Since the base of column (5) is 100, the mean of the columnshould be 100 and the total 600 since there are 6 trading hours. In order to convert the obtainedvalues of column (4) to index numbers, each of its entries is added to the total mean and then isdivided by the column mean added to total mean and multiplied by 100 yielding the correspondingentry in column (5). It is customary to show index numbers with one significant digit.
208 LOVELY PROFESSIONAL UNIVERSITY
Research Methodology
Notes Column (6) shows the seasonal effect of this decision variable—share trading on the StockExchange. Regardless of heavy or light daily volume, the first hour volume is the heaviest byfar. It is 7.4% above what may be considered average trading volume for any given day. Keep inmind that a very limited data set was used in this analysis and while the season, reaching its lowpoint between 1 and 2 p.m., is generally correctly depicted, individual index members may beexaggerated. What managerial action programs would result from an analyses such as this?Would traders go out for tea and samosas between 10-11? How about lunch between 1-2? Whenwould brokers call clients with hot or lukewarm tips? Assuming that a decrease in volumemeans a decrease in prices in general during the trading day, when would a savvy trader buy?When would he sell? Think of some other intervening variables and you have yourself a nicelittle bull session in one of Dalal Street’s watering holes. If, in addition, you make money foryourself or firm, then, you have got it.
Non-linear Analysis
Any number of different curves may be fitted to a data set. The most widely used program incomputer libraries, known as CURFIT, offers a minimum of 5 curves plus the straight line. Thecurves may differ from program to program. So, which ones are the “best” ones? There is noanswer. Every forecaster has to decide individually about his pet forecasting tools. We willdiscuss and apply three curves in this section. They appear to be promising decision toolsespecially in problem situations that in some way incorporate the life cycle concept and therange of such problems is vast, indeed.
If you take a look again at Figure 10.2, you see that three curves have been plotted. As we knowfrom many empirical studies, achievement is usually normally distributed. Growth, on theother hand, seem to be exponentially distributed. The same holds true for decline. As the lifecycle moves from growth to maturity, a parabolic trend may often be used as the forecastingtool. These are two of the curves that will be considered. The third one is related to the exponentialcurve. As you look at the growth stage and mentally extrapolate the trend, your eyes will run offthe page. Now, we know—again from all sorts of empirical evidence—that trees don’t growinto the high heavens. Even the most spectacular growth must come to an end. Therefore, whenusing the exponential forecast, care must be taken that the eventual ceiling or floor ( in the caseof a decline) are not overlooked. The modified exponential trend has the ceiling or floor buildin. It is the third curve to be discussed.
One final piece of advice before we start fitting curves. If you can do it by straight line, do it. Forobvious reasons, just look at Figure 10.2, any possible error—and there is always a built-in fivepercent chance—is worse when a curve is fitted. By extending the planning and forecastinghorizon over a reasonable shorter period rather than spectacular but dangerous longer period,the straight line can serve as useful prediction tool.
The Parabola Fit
The parabola is defined by
yc = a + bx + cx2
Where a, b and c are constants a and b have been dealt. c can be treated as acceleration. Thenormal equations are (method of least square).
Sy = na + bSx +cSx2
Sxy = aSx + bSx2 + cSx3
Sx2y = aSx2 + bSx3 + cSx4
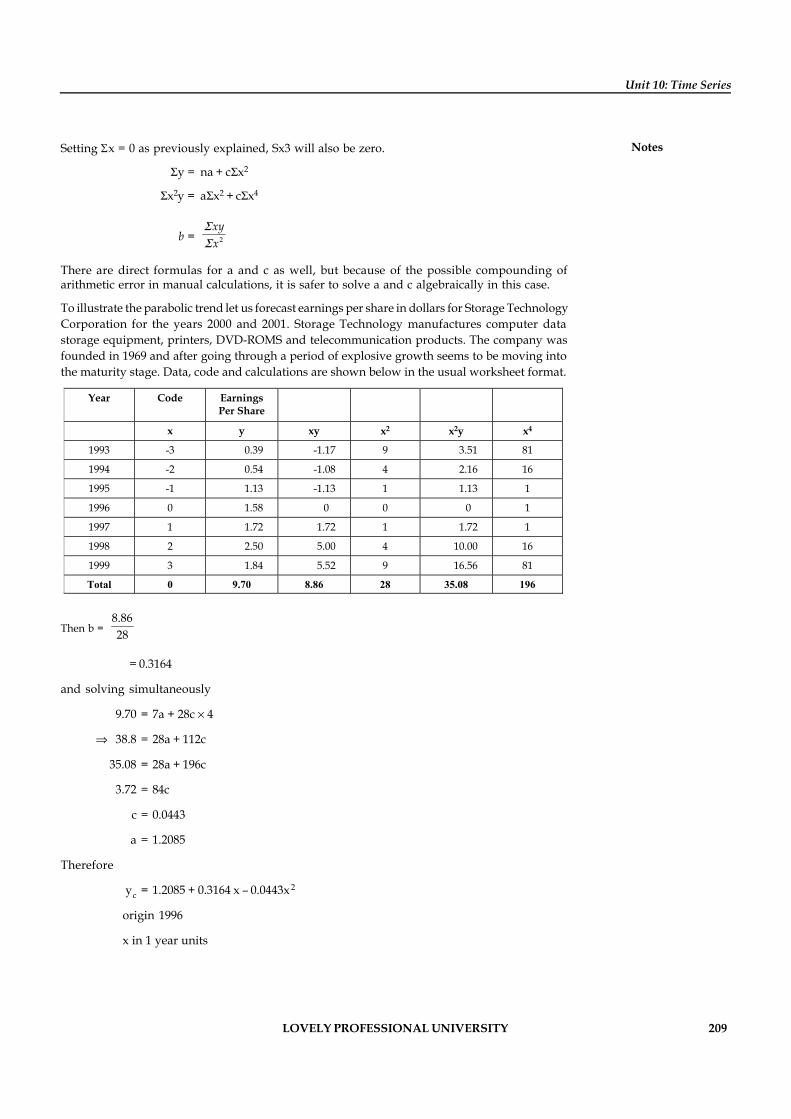
LOVELY PROFESSIONAL UNIVERSITY 209
Unit 10: Time Series
NotesSetting x = 0 as previously explained, Sx3 will also be zero.
Sy = na + cSx2
Sx2y = aSx2 + cSx4
b = 2
xyx
SS
There are direct formulas for a and c as well, but because of the possible compounding ofarithmetic error in manual calculations, it is safer to solve a and c algebraically in this case.
To illustrate the parabolic trend let us forecast earnings per share in dollars for Storage TechnologyCorporation for the years 2000 and 2001. Storage Technology manufactures computer datastorage equipment, printers, DVD-ROMS and telecommunication products. The company wasfounded in 1969 and after going through a period of explosive growth seems to be moving intothe maturity stage. Data, code and calculations are shown below in the usual worksheet format.
Year Code Earnings Per Share
x y xy x2 x2y x4
1993 -3 0.39 -1.17 9 3.51 81
1994 -2 0.54 -1.08 4 2.16 16
1995 -1 1.13 -1.13 1 1.13 1
1996 0 1.58 0 0 0 1
1997 1 1.72 1.72 1 1.72 1
1998 2 2.50 5.00 4 10.00 16
1999 3 1.84 5.52 9 16.56 81
Total 0 9.70 8.86 28 35.08 196
Then b =8.8628
= 0.3164
and solving simultaneously
9.70 = 7a + 28c 4
38.8 = 28a + 112c
35.08 = 28a + 196c
3.72 = 84c
c = 0.0443
a = 1.2085
Therefore
yc = 1.2085 + 0.3164 x – 0.0443x 2
origin 1996
x in 1 year units
210 LOVELY PROFESSIONAL UNIVERSITY
Research Methodology
Notes and specifically,
y2000 = 1.2085 + 0.3164(5) – 0.0443(5) 2
= 1.68,
y2001 = 1.2085 + 0.3164(6) – 0.0443(6) 2
= 1.51
!Caution Remember that the data set is small. Quarterly earnings per share figures for theperiod may have been better because of the larger sample size. The significance test andconstruction of the confidence interval is performed as previously shown. Furthermore,as soon as new earnings per share figures become available, the regression line should berecalculated, because there is always the chance that there may be a change in theenvironment.
Self Assessment
Fill in the blanks:
1. Time series analysis is a ……………..forecasting tool.
2. In time series analysis, Each factor must be …………….and its effect ascertained uponproduct sales.
3. A product’s seasonality is shown by the regularly recurring increases or decreases in salesor production that are caused by ……………………….
10.2 Components of a Time Series
An observed value of a time series, Yt, is the net effect of many types of influences such aschanges in population, techniques of production, seasons, level of business activity, tastes andhabits, incidence of fire floods, etc. It may be noted here that different types of variables may beaffected by different types of factors, e.g., factors affecting the agricultural output may be entirelydifferent from the factors affecting industrial output. However, for the purpose of time seriesanalysis, various factors are classified into the following three general categories applicable toany type of variable:
1. Secular Trend or Simply Trend
2. Periodic or Oscillatory Variations
(a) Seasonal Variations
(b) Cyclical Variations
3. Random or Irregular Variations
10.2.1 Secular Trend
Secular trend or simply trend is the general tendency of the data to increase or decrease orstagnate over a long period of time. Most of the business and economic time series would reveala tendency to increase or to decrease over a number of years. For example, data regardingindustrial production, agricultural production, population, bank deposits, deficit financing, etc.,
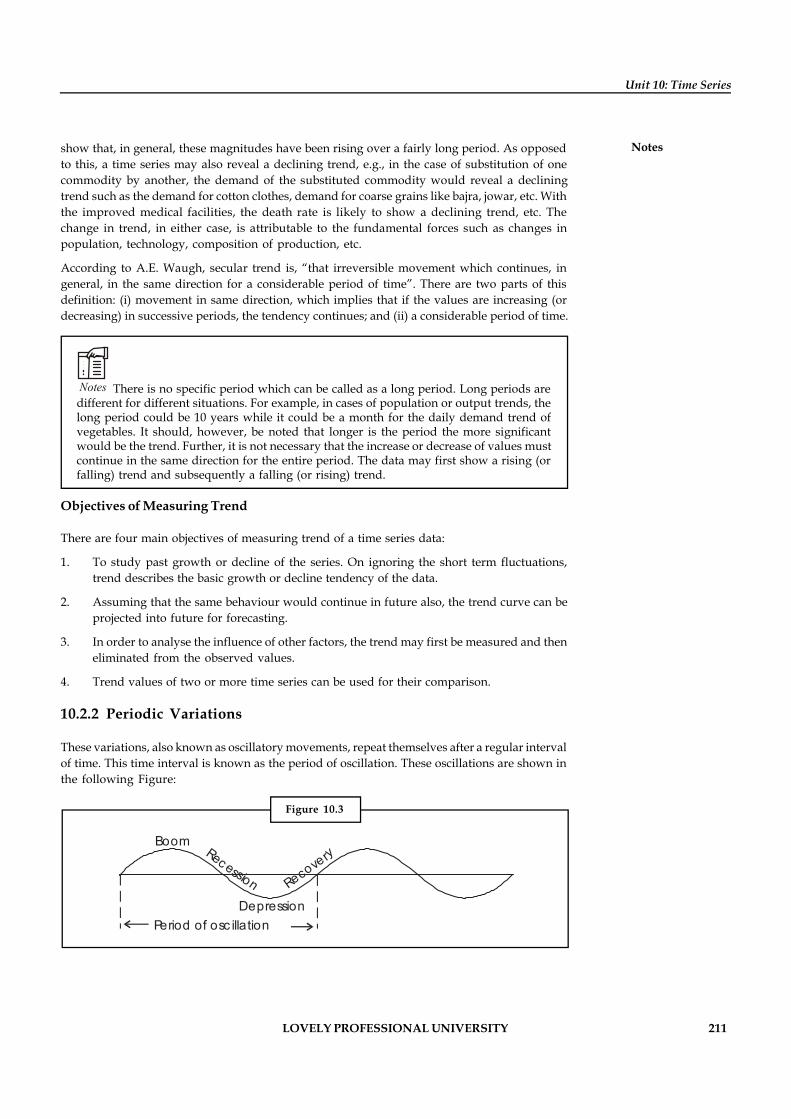
LOVELY PROFESSIONAL UNIVERSITY 211
Unit 10: Time Series
Notesshow that, in general, these magnitudes have been rising over a fairly long period. As opposedto this, a time series may also reveal a declining trend, e.g., in the case of substitution of onecommodity by another, the demand of the substituted commodity would reveal a decliningtrend such as the demand for cotton clothes, demand for coarse grains like bajra, jowar, etc. Withthe improved medical facilities, the death rate is likely to show a declining trend, etc. Thechange in trend, in either case, is attributable to the fundamental forces such as changes inpopulation, technology, composition of production, etc.
According to A.E. Waugh, secular trend is, “that irreversible movement which continues, ingeneral, in the same direction for a considerable period of time”. There are two parts of thisdefinition: (i) movement in same direction, which implies that if the values are increasing (ordecreasing) in successive periods, the tendency continues; and (ii) a considerable period of time.
Notes There is no specific period which can be called as a long period. Long periods aredifferent for different situations. For example, in cases of population or output trends, thelong period could be 10 years while it could be a month for the daily demand trend ofvegetables. It should, however, be noted that longer is the period the more significantwould be the trend. Further, it is not necessary that the increase or decrease of values mustcontinue in the same direction for the entire period. The data may first show a rising (orfalling) trend and subsequently a falling (or rising) trend.
Objectives of Measuring Trend
There are four main objectives of measuring trend of a time series data:
1. To study past growth or decline of the series. On ignoring the short term fluctuations,trend describes the basic growth or decline tendency of the data.
2. Assuming that the same behaviour would continue in future also, the trend curve can beprojected into future for forecasting.
3. In order to analyse the influence of other factors, the trend may first be measured and theneliminated from the observed values.
4. Trend values of two or more time series can be used for their comparison.
10.2.2 Periodic Variations
These variations, also known as oscillatory movements, repeat themselves after a regular intervalof time. This time interval is known as the period of oscillation. These oscillations are shown inthe following Figure:
Figure 10.3
BoomRec ession
DepressionRecovery
Period of osc illation
212 LOVELY PROFESSIONAL UNIVERSITY
Research Methodology
Notes The oscillatory movements are termed as Seasonal Variations if their period of oscillation isequal to one year, and as Cyclical Variations if the period is greater than one year.
A time series, where the time interval between successive observations is less than or equal toone year, may have the effects of both the seasonal and cyclical variations. However, the seasonalvariations are absent if the time interval between successive observations is greater than oneyear.
Although the periodic variations are more or less regular, they may not necessarily be uniformlyperiodic, i.e., the pattern of their variations in different periods may or may not be identical inrespect of time period and size of periodic variations. For example, if a cycle is completed in fiveyears then its following cycle may take greater or less than five years for its completion.
1. Causes of Seasonal Variations: The main causes of seasonal variations are: (a) ClimaticConditions and (b) Customs and Traditions
(a) Climatic Conditions: The changes in climatic conditions affect the value of time seriesvariable and the resulting changes are known as seasonal variations. For example,the sale of woolen garments is generally at its peak in the month of Novemberbecause of the beginning of winter season. Similarly, timely rainfall may increaseagricultural output, prices of agricultural commodities are lowest during theirharvesting season, etc., reflect the effect of climatic conditions on the value of timeseries variable.
(b) Customs and Traditions: The customs and traditions of the people also give rise to theseasonal variations in time series.
Example: The sale of garments and ornaments may be highest during the marriageseason, sale of sweets during Diwali, etc., are variations that are the results of customs andtraditions of the people.
It should be noted here that both of the causes, mentioned above, occur regularly and areoften repeated after a gap of less than or equal to one year.
Objectives of Measuring Seasonal Variations: The main objectives of measuring seasonalvariations are:
(a) To analyse the past seasonal variations.
(b) To predict the value of a seasonal variation which could be helpful in short-termplanning.
(c) To eliminate the effect of seasonal variations from the data.
2. Causes of Cyclical Variations: Cyclical variations are revealed by most of the economicand business time series and, therefore, are also termed as trade (or business) cycles. Anytrade cycle has four phases which are respectively known as boom, recession, depressionand recovery phases. Various phases repeat themselves regularly one after another in thegiven sequence. The time interval between two identical phases is known as the period ofcyclical variations. The period is always greater than one year. Normally, the period ofcyclical variations lies between 3 to 10 years.
Objectives of Measuring Cyclical Variations: The main objectives of measuring cyclicalvariations are:
(a) To analyse the behaviour of cyclical variations in the past.
LOVELY PROFESSIONAL UNIVERSITY 213
Unit 10: Time Series
Notes(b) To predict the effect of cyclical variations so as to provide guidelines for futurebusiness policies.
10.2.3 Random or Irregular Variations
As the name suggests, these variations do not reveal any regular pattern of movements. Thesevariations are caused by random factors such as strikes, floods, fire, war, famines, etc. Randomvariations is that component of a time series which cannot be explained in terms of any of thecomponents discussed so far. This component is obtained as a residue after the elimination oftrend, seasonal and cyclical components and hence is often termed as residual component.
Random variations are usually short-term variations but sometimes their effect may be sointense that the value of trend may get permanently affected.
Self Assessment
Fill in the blanks:
4. .............................. is the general tendency of the data to increase or decrease or stagnateover a long period of time.
5. The oscillatory movements are termed as ……………….if their period of oscillation isequal to one year.
6. Random variations are usually ………………variations
10.3 Time Series Forecasting Method
Time series forecasting methods are based on analysis of historical data. They make theassumption that part patterns in data can be used to forecast future data points. In this unit, wewill discuss two methods: (a) Moving Average Method and (b) Exponential Smoothing.
10.3.1 Method of Moving Average
This method is based on the principle that the total effect of periodic variations at differentpoints of time in its cycle gets completely neutralised, i.e., SSt = 0 in one year and SCt = 0 in theperiod of cyclical variations.
In the method of moving average, successive arithmetic averages are computed fromoverlapping groups of successive values of a time series. Each group includes all the observationsin a given time interval, termed as the period of moving average. The next group is obtained byreplacing the oldest value by the next value in the series. The averages of such groups are knownas the moving averages.
The moving average of a group is always shown at the centre of its period. The process ofcomputing moving averages smoothens out the fluctuations in the time series data. It can beshown that if the trend is linear and the oscillatory variations are regular, the moving averagewith period equal to the period of oscillatory variations would completely eliminate them.Further, the effect of random variations would get minimised because the average of a numberof observations must lie between the smallest and the largest observation. It should be notedhere that the larger is the period of moving average the more would be the reduction in theeffect of random component but more information is lost at the two ends of data.
When the trend is non-linear, the moving averages would give biased rather than the actualtrend values.
214 LOVELY PROFESSIONAL UNIVERSITY
Research Methodology
Notes Let Y1, Y2, ...... Yn be the n values of a time series for successive time periods 1, 2, ...... n respectively.The calculation of 3-period and 4-period moving averages are shown in the following tables:
It should be noted that, in case of 3-period moving average, it is not possible to get the movingaverages for the first and the last periods. Similarly, the larger is the period of moving averagethe more information will be lost at the ends of a time series.
When the period of moving average is even, the computed average will correspond to themiddle of the two middle most periods. These values should be centred by taking arithmeticmean of the two successive averages. The computation of moving average in such a case is alsoillustrated in the above table.
Year : 1981 1982 1983 1984 1985 1986 1987 1988 1989 1990Production
: 26 27 28 30 29 27 30 31 32 31('000' tonnes)
Example: Determine the trend values of the following data by using 3-year movingaverage. Also find short-term fluctuations for various years, assuming additive model. Plot theoriginal and the trend values on the same graph.
Solution:
Calculation of Trend and Short-term Fluctuations
3- . . - 3- ( ) ( ) ( )
1981 261982 27 81 27.001983 28 85 28.331984 30 87 29.001985 29 86 28.671986 27 86 21987 30 881988 31 931989 32 941990 31
Production Year M A or Short term fluctuationsYear MovingYears TotalY Trend values T Y T
0.000.331.000.33
8.67 1.6729.33 0.6731.00 0.0031.33 0.67
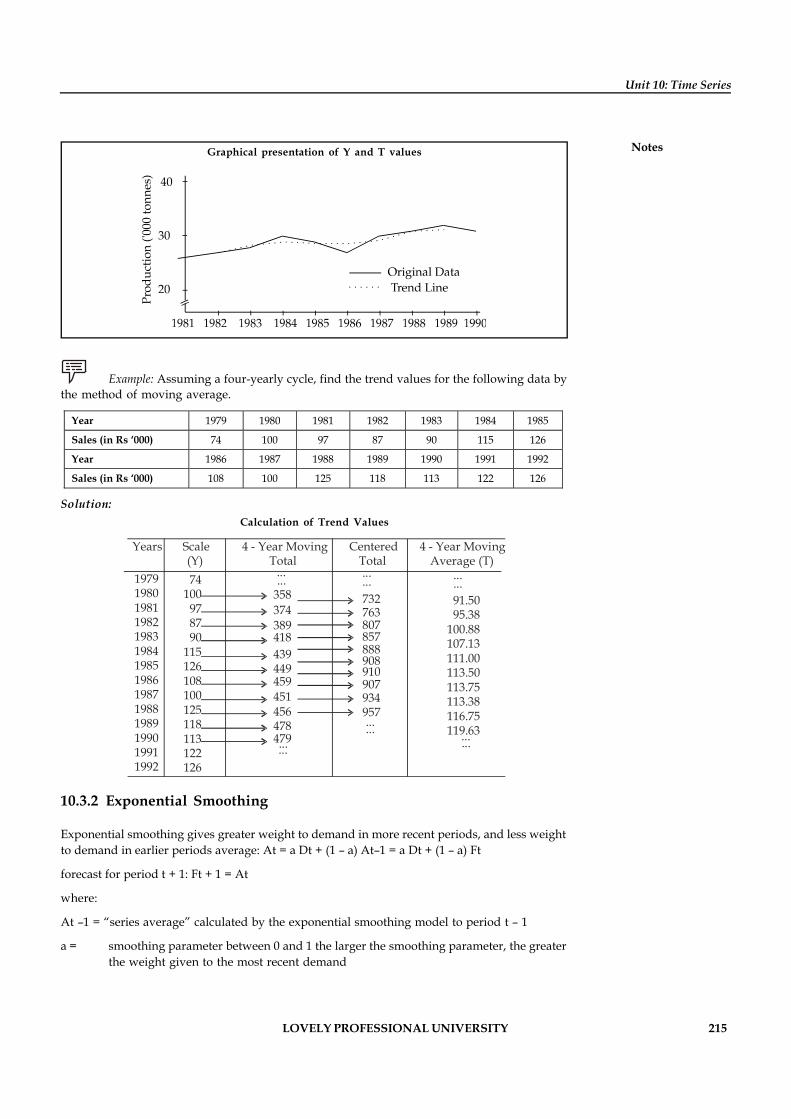
LOVELY PROFESSIONAL UNIVERSITY 215
Unit 10: Time Series
NotesGraphical presentation of Y and T values
Example: Assuming a four-yearly cycle, find the trend values for the following data bythe method of moving average.
Year 1979 1980 1981 1982 1983 1984 1985
Sales (in Rs ‘000) 74 100 97 87 90 115 126
Year 1986 1987 1988 1989 1990 1991 1992
Sales (in Rs ‘000) 108 100 125 118 113 122 126
Solution:Calculation of Trend Values
Years Scale (Y)
4 - Year MovingTotal
Centered Total
4 - Year MovingAverage (T)
19791980198119821983198419851986198719881989199019911992
74100 97 87 90115126108100125118113122126
...
...
......
358374389418439449459451456478479
...
... 91.50 95.38100.88107.13111.00113.50113.75113.38116.75119.63
...
...732763807857888908910907934957...... ......
10.3.2 Exponential Smoothing
Exponential smoothing gives greater weight to demand in more recent periods, and less weightto demand in earlier periods average: At = a Dt + (1 – a) At–1 = a Dt + (1 – a) Ft
forecast for period t + 1: Ft + 1 = At
where:
At –1 = “series average” calculated by the exponential smoothing model to period t – 1
a = smoothing parameter between 0 and 1 the larger the smoothing parameter, the greaterthe weight given to the most recent demand
216 LOVELY PROFESSIONAL UNIVERSITY
Research Methodology
Notes Double Exponential Smoothing (Trend-Adjusted Exponential Smoothing)
When a trend exists, the forecasting technique must consider the trend as well as the seriesaverage ignoring the trend will cause the forecast to always be below (with an increasing trend)or above (with a decreasing trend) actual demand double exponential smoothing smooths(averages) both the series average and the trend
forecast for period t + 1: Ft + 1 = At + Tt
average: At = aDt + (1 – a) (At – 1 + Tt – 1) = aDt + (1 – a) Ft
average trend: Tt = B CTt + (1 – B) Tt - 1
current trend: CTt = At – At – 1
forecast for p periods into the future: Ft + p = At + pTt
where:
At = exponentially smoothed average of the series in period t
Tt = exponentially smoothed average of the trend in period t
CTt = current estimate of the trend in period t
a = smoothing parameter between 0 and 1 for smoothing the averages
B = smoothing parameter between 0 and 1 for smoothing the trend
Self Assessment
Fill in the blanks:
7. Time series forecasting methods are based on analysis of ……………data.
8. …………………..gives greater weight to demand in more recent periods.
9. …………………..method is based on the principle that the total effect of periodic variationsat different points of time in its cycle gets completely neutralised.
10.4 The Mean Absolute Deviation (MAD)
The mean absolute deviation is the sum of the absolute values of the deviations from the mean.
Procedure
1. Find the mean of the data
2. Subtract the mean from each data value to get the deviation from the mean
3. Take the absolute value of each deviation from the mean
4. Total the absolute values of the deviations from the mean
5. Divide the total by the sample size.
Typically the point from which the deviation is measured is the value of either the median or themean of the data set.
|D| = |xi – m(X)|
LOVELY PROFESSIONAL UNIVERSITY 217
Unit 10: Time Series
Noteswhere
|D| is the absolute deviation,
xi is the data element
and m(X) is the chosen measure of central tendency of the data set–sometimes the mean (), butmost often the median.
The average absolute deviation or simply average deviation of a data set is the average of theabsolute deviations and is a summary statistic of statistical dispersion or variability. It is alsocalled the mean absolute deviation, but this is easily confused with the median absolute deviation.
The average absolute deviation of a set {x1, x2, ..., xn} is
| |x xn
S -
Did u know? What is median absolute deviation?
The median absolute deviation is a measure of statistical dispersion. It is a more robustestimator of scale than the sample variance or standard deviation; it also exists for somedistributions which may not have a mean or variance.
The MAD is a robust statistic, being more resilient to outliers in a data set than the standarddeviation. In the standard deviation, the distances from the mean are squared, so on average,large deviations are weighted more heavily, and thus outliers can heavily influence it. In theMAD, the magnitude of the distances of a small number of outliers is irrelevant.
The MAD can be used to estimate the scale parameter of distributions for which the variance andstandard deviation do not exist, such as the Cauchy distribution.
Self Assessment
Fill in the blanks:
10. Typically the point from which the deviation is measured is the value of either the ………..orthe …….......of the data set.
11. The Mean Absolute Deviation is a robust statistic, being more resilient to outliers in a dataset than the……………………...
12. The Mean Absolute Deviation can be used to estimate the scale parameter of distributionsfor which the ………………and standard deviation do not exist.
10.5 Mean Squared Error (MSE)
MSE is the sum of the squared forecast errors for each of the observations divided by the numberof observations. It is an alternative to the mean absolute deviation, except that more weight isplaced on larger errors. While MSE is popular among statisticians, it is unreliable and difficultto interpret. The mean squared error of an estimator is the expected value of the square of the“error.” The error is the amount by which the estimator differs from the quantity to be estimated.The difference occurs because of randomness or because the estimator doesn’t account forinformation that could produce a more accurate estimate.
MSE of an estimator is one of many ways to quantify the amount by which an estimator differsfrom the true value of the quantity being estimated. As a loss function, MSE is called squarederror loss. MSE measures the average of the square of the “error.” The error is the amount by
218 LOVELY PROFESSIONAL UNIVERSITY
Research Methodology
Notes which the estimator differs from the quantity to be estimated. The difference occurs because ofrandomness or because the estimator doesn’t account for information that could produce a moreaccurate estimate.
The MSE is the second moment (about the origin) of the error, and thus incorporates both thevariance of the estimator and its bias. For an unbiased estimator, the MSE is the variance. Likethe variance, MSE has the same unit of measurement as the square of the quantity being estimated.In an analogy to standard deviation, taking the square root of MSE yields the root mean squarederror or RMSE, which has the same units as the quantity being estimated; for an unbiasedestimator, the RMSE is the square root of the variance, known as the standard error.
Mean squared error of an estimator b of true parameter vector B is:
MSE(b) = E[(b – B)2]
which is also
MSE(b) = var(b) + (bias(b))(bias(b)’)
Among unbiased estimators, the minimal MSE is equivalent to minimizing the variance, and isobtained by the MVUE. However, a biased estimator may have lower MSE. In statisticalmodelling, the MSE is defined as the difference between the actual observations and the responsepredicted by the model and is used to determine whether the model does not fit the data orwhether the model can be simplified by removing terms. Like variance, mean squared error hasthe disadvantage of heavily weighting outliers. This is a result of the squaring of each term,which effectively weights large errors more heavily than small ones. This property, undesirablein many applications, has led researchers to use alternatives such as the mean absolute error, orthose based on the median.
Did u know? What is key criterion in selecting estimators?
Minimizing MSE is a key criterion in selection estimators.
Self Assessment
Fill in the blanks:
13. …………………….is the sum of the squared forecast errors for each of the observationsdivided by the number of observations.
14. Mean Squared Error of an estimator is one of many ways to quantify the amount by whichan estimator differs from the ………………..of the quantity being estimated.
15. The ……………is the amount by which the estimator differs from the quantity to beestimated.
10.6 Seasonal Variations
If the time series data are in terms of annual figures, the seasonal variations are absent. Thesevariations are likely to be present in data recorded on quarterly or monthly or weekly or dailyor hourly basis. As discussed earlier, the seasonal variations are of periodic nature with periodequal to one year. These variations reflect the annual repetitive pattern of the economic orbusiness activity of any society. The main objectives of measuring seasonal variations are:
1. To understand their pattern.
2. To use them for short-term forecasting or planning.
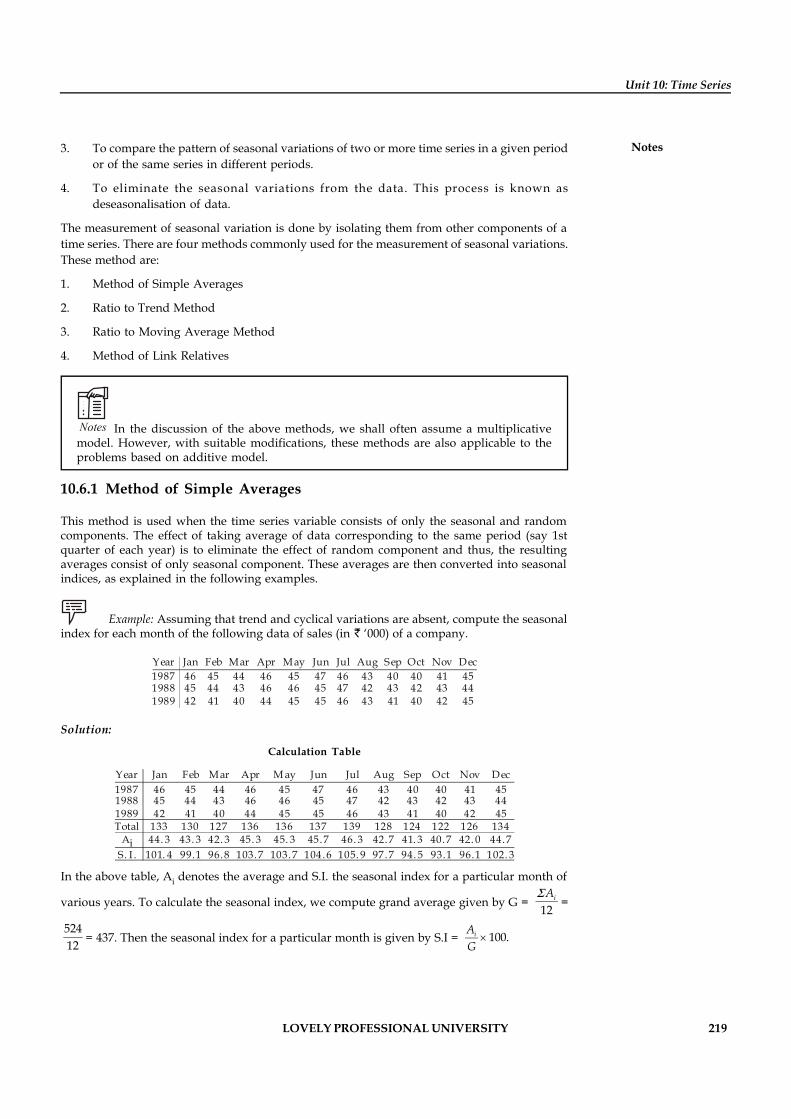
LOVELY PROFESSIONAL UNIVERSITY 219
Unit 10: Time Series
Notes3. To compare the pattern of seasonal variations of two or more time series in a given periodor of the same series in different periods.
4. To eliminate the seasonal variations from the data. This process is known asdeseasonalisation of data.
The measurement of seasonal variation is done by isolating them from other components of atime series. There are four methods commonly used for the measurement of seasonal variations.These method are:
1. Method of Simple Averages
2. Ratio to Trend Method
3. Ratio to Moving Average Method
4. Method of Link Relatives
Notes In the discussion of the above methods, we shall often assume a multiplicativemodel. However, with suitable modifications, these methods are also applicable to theproblems based on additive model.
10.6.1 Method of Simple Averages
This method is used when the time series variable consists of only the seasonal and randomcomponents. The effect of taking average of data corresponding to the same period (say 1stquarter of each year) is to eliminate the effect of random component and thus, the resultingaverages consist of only seasonal component. These averages are then converted into seasonalindices, as explained in the following examples.
Example: Assuming that trend and cyclical variations are absent, compute the seasonalindex for each month of the following data of sales (in ‘000) of a company.
Year Jan Feb Mar Apr May Jun Jul Aug Sep Oct Nov Dec1987 46 45 44 46 45 47 46 43 40 40 41 451988 45 44 43 46 46 45 47 42 43 42 43 441989 42 41 40 44 45 45 46 43 41 40 42 45
Solution:
Calculation Table
Year Jan Feb Mar Apr M ay Jun Jul Aug Sep Oct Nov Dec1987 46 45 44 46 45 47 46 43 40 40 41 451988 45 44 43 46 46 45 47 42 43 42 43 441989 42 41 40 44 45 45 46 43 41 40 42 45Total 133 130 127 136 136 137 139 128 124 122 126 134
Ai 44. 3 43. 3 42. 3 45. 3 45. 3 45.7 46. 3 42.7 41. 3 40.7 42. 0 44.7S. I . 101. 4 99.1 96.8 103.7 103.7 104.6 105. 9 97.7 94. 5 93.1 96.1 102. 3
In the above table, Ai denotes the average and S.I. the seasonal index for a particular month of
various years. To calculate the seasonal index, we compute grand average given by G = 12iAS
=
52412 = 437. Then the seasonal index for a particular month is given by S.I = 100.iA
G
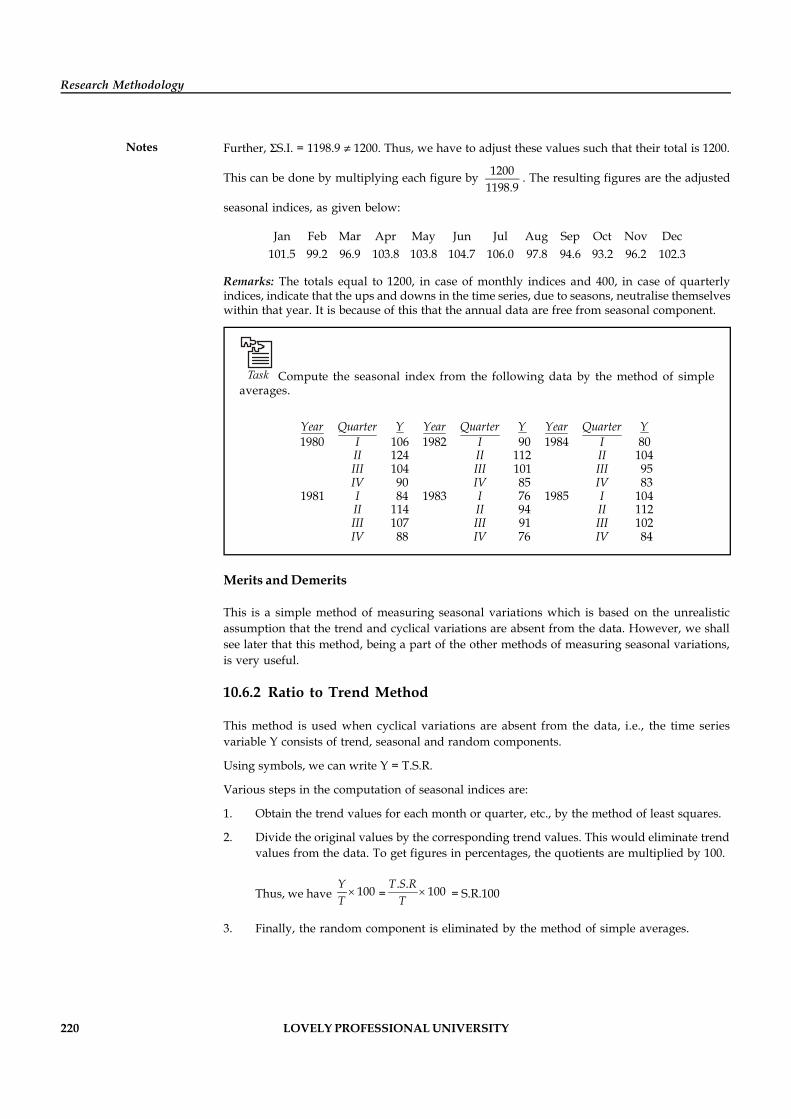
220 LOVELY PROFESSIONAL UNIVERSITY
Research Methodology
Notes Further, SS.I. = 1198.9 1200. Thus, we have to adjust these values such that their total is 1200.
This can be done by multiplying each figure by 12001198.9
. The resulting figures are the adjusted
seasonal indices, as given below:
Jan Feb Mar Apr May Jun Jul Aug Sep Oct Nov Dec101.5 99.2 96.9 103.8 103.8 104.7 106.0 97.8 94.6 93.2 96.2 102.3
Remarks: The totals equal to 1200, in case of monthly indices and 400, in case of quarterlyindices, indicate that the ups and downs in the time series, due to seasons, neutralise themselveswithin that year. It is because of this that the annual data are free from seasonal component.
Task Compute the seasonal index from the following data by the method of simpleaverages.
Year Quarter Y Year Quarter Y Year Quarter Y1980 I 106 1982 I 90 1984 I 80
II 124 II 112 II 104III 104 III 101 III 95IV 90 IV 85 IV 83
1981 I 84 1983 I 76 1985 I 104II 114 II 94 II 112III 107 III 91 III 102IV 88 IV 76 IV 84
Merits and Demerits
This is a simple method of measuring seasonal variations which is based on the unrealisticassumption that the trend and cyclical variations are absent from the data. However, we shallsee later that this method, being a part of the other methods of measuring seasonal variations,is very useful.
10.6.2 Ratio to Trend Method
This method is used when cyclical variations are absent from the data, i.e., the time seriesvariable Y consists of trend, seasonal and random components.
Using symbols, we can write Y = T.S.R.
Various steps in the computation of seasonal indices are:
1. Obtain the trend values for each month or quarter, etc., by the method of least squares.
2. Divide the original values by the corresponding trend values. This would eliminate trendvalues from the data. To get figures in percentages, the quotients are multiplied by 100.
Thus, we have 100YT =
. . 100T S RT
= S.R.100
3. Finally, the random component is eliminated by the method of simple averages.
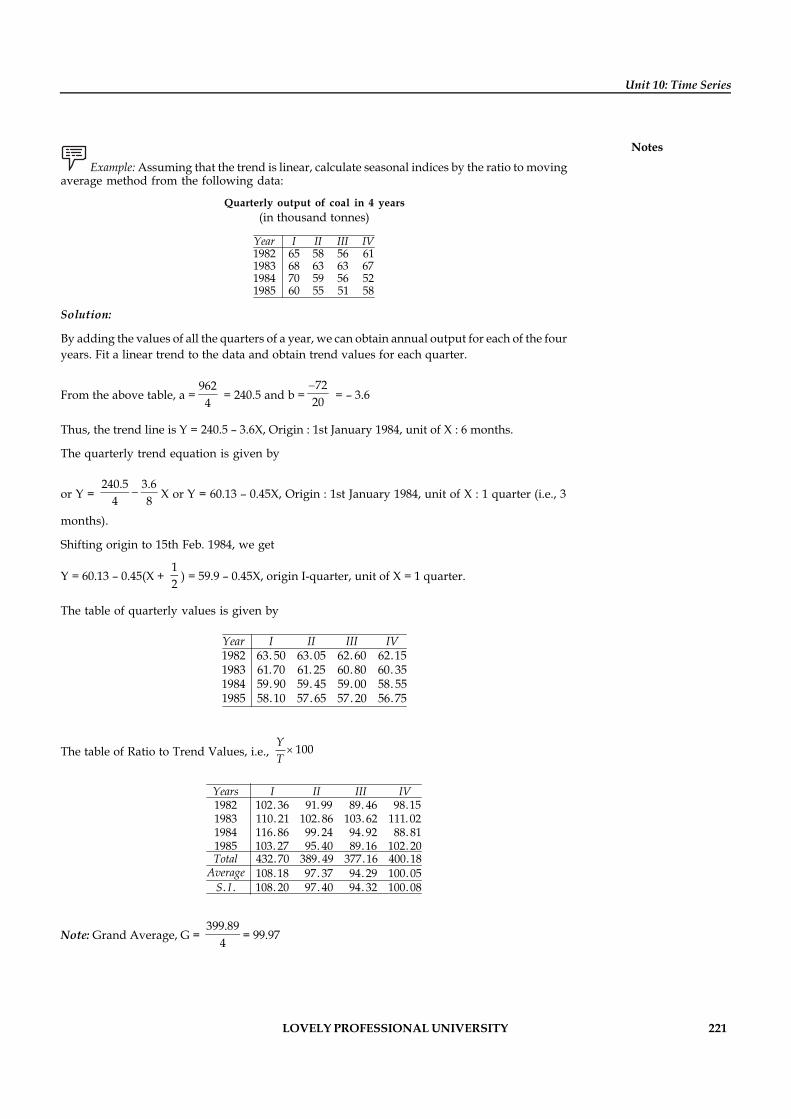
LOVELY PROFESSIONAL UNIVERSITY 221
Unit 10: Time Series
Notes Example: Assuming that the trend is linear, calculate seasonal indices by the ratio to moving
average method from the following data:
Quarterly output of coal in 4 years(in thousand tonnes)
Year I II III IV1982 65 58 56 611983 68 63 63 671984 70 59 56 521985 60 55 51 58
Solution:
By adding the values of all the quarters of a year, we can obtain annual output for each of the fouryears. Fit a linear trend to the data and obtain trend values for each quarter.
From the above table, a =962
4 = 240.5 and b =72
20
= – 3.6
Thus, the trend line is Y = 240.5 – 3.6X, Origin : 1st January 1984, unit of X : 6 months.
The quarterly trend equation is given by
or Y = 240.5 3.6
4 8 X or Y = 60.13 – 0.45X, Origin : 1st January 1984, unit of X : 1 quarter (i.e., 3
months).
Shifting origin to 15th Feb. 1984, we get
Y = 60.13 – 0.45(X + 12 ) = 59.9 – 0.45X, origin I-quarter, unit of X = 1 quarter.
The table of quarterly values is given by
Year I II III IV1982 63. 50 63.05 62.60 62.151983 61.70 61. 25 60.80 60. 351984 59. 90 59. 45 59.00 58. 551985 58.10 57.65 57. 20 56.75
The table of Ratio to Trend Values, i.e., 100YT
Years I II III IV1982 102. 36 91. 99 89. 46 98.151983 110. 21 102.86 103.62 111.021984 116.86 99. 24 94. 92 88.811985 103. 27 95. 40 89.16 102. 20Total 432.70 389. 49 377.16 400.18Average 108.18 97. 37 94. 29 100.05S. I . 108. 20 97. 40 94. 32 100.08
Note: Grand Average, G = 399.89
4 = 99.97
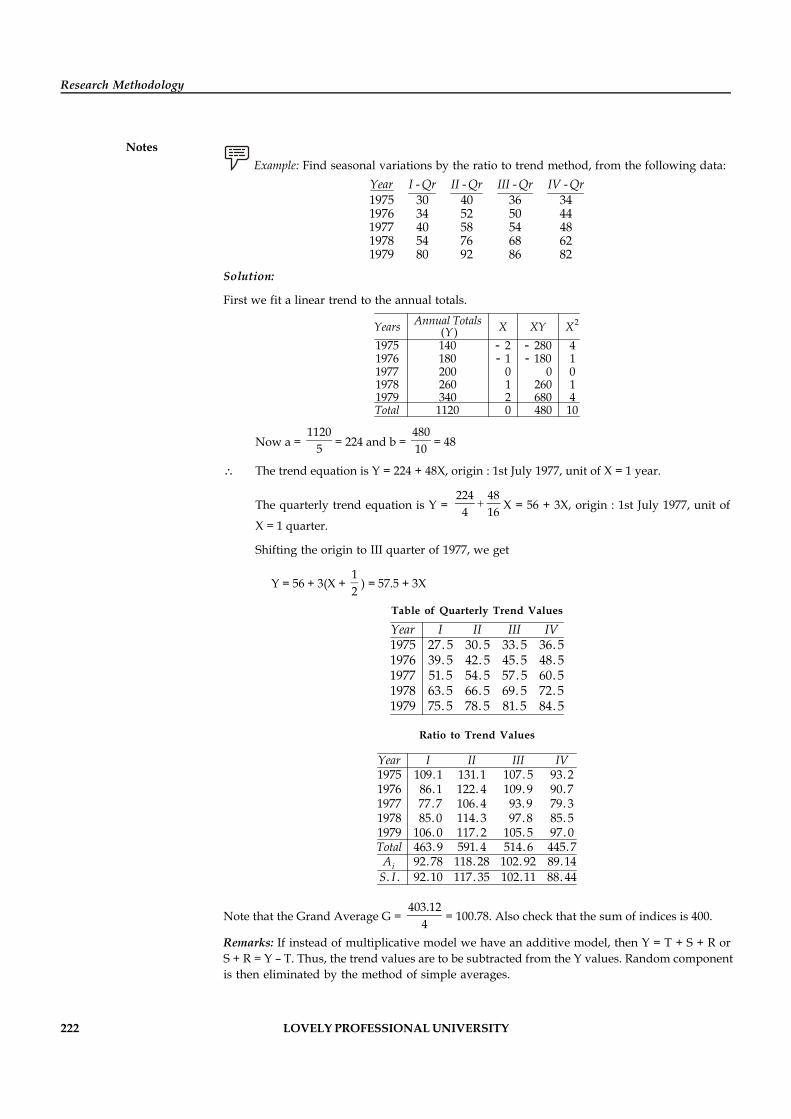
222 LOVELY PROFESSIONAL UNIVERSITY
Research Methodology
Notes Example: Find seasonal variations by the ratio to trend method, from the following data:
Year I -Qr II -Qr III -Qr IV -Qr1975 30 40 36 341976 34 52 50 441977 40 58 54 481978 54 76 68 621979 80 92 86 82
Solution:
First we fit a linear trend to the annual totals.
Years Annual Totals (Y) X XY X2
1975 140 - 2 - 280 41976 180 - 1 - 180 11977 200 0 0 01978 260 1 260 11979 340 2 680 4Total 1120 0 480 10
Now a = 1120
5 = 224 and b = 48010 = 48
The trend equation is Y = 224 + 48X, origin : 1st July 1977, unit of X = 1 year.
The quarterly trend equation is Y = 224 48
4 16 X = 56 + 3X, origin : 1st July 1977, unit of
X = 1 quarter.
Shifting the origin to III quarter of 1977, we get
Y = 56 + 3(X + 12 ) = 57.5 + 3X
Table of Quarterly Trend Values
Year I II III IV1975 27. 5 30. 5 33. 5 36. 51976 39. 5 42. 5 45. 5 48. 51977 51. 5 54. 5 57. 5 60. 51978 63. 5 66. 5 69. 5 72. 51979 75. 5 78. 5 81. 5 84. 5
Ratio to Trend Values
Year I II III IV1975 109.1 131.1 107. 5 93. 21976 86.1 122. 4 109. 9 90.71977 77.7 106. 4 93. 9 79. 31978 85.0 114. 3 97.8 85. 51979 106.0 117. 2 105. 5 97.0Total 463. 9 591. 4 514.6 445.7Ai 92.78 118. 28 102. 92 89.14S. I . 92.10 117. 35 102.11 88. 44
Note that the Grand Average G = 403.12
4 = 100.78. Also check that the sum of indices is 400.
Remarks: If instead of multiplicative model we have an additive model, then Y = T + S + R orS + R = Y – T. Thus, the trend values are to be subtracted from the Y values. Random componentis then eliminated by the method of simple averages.
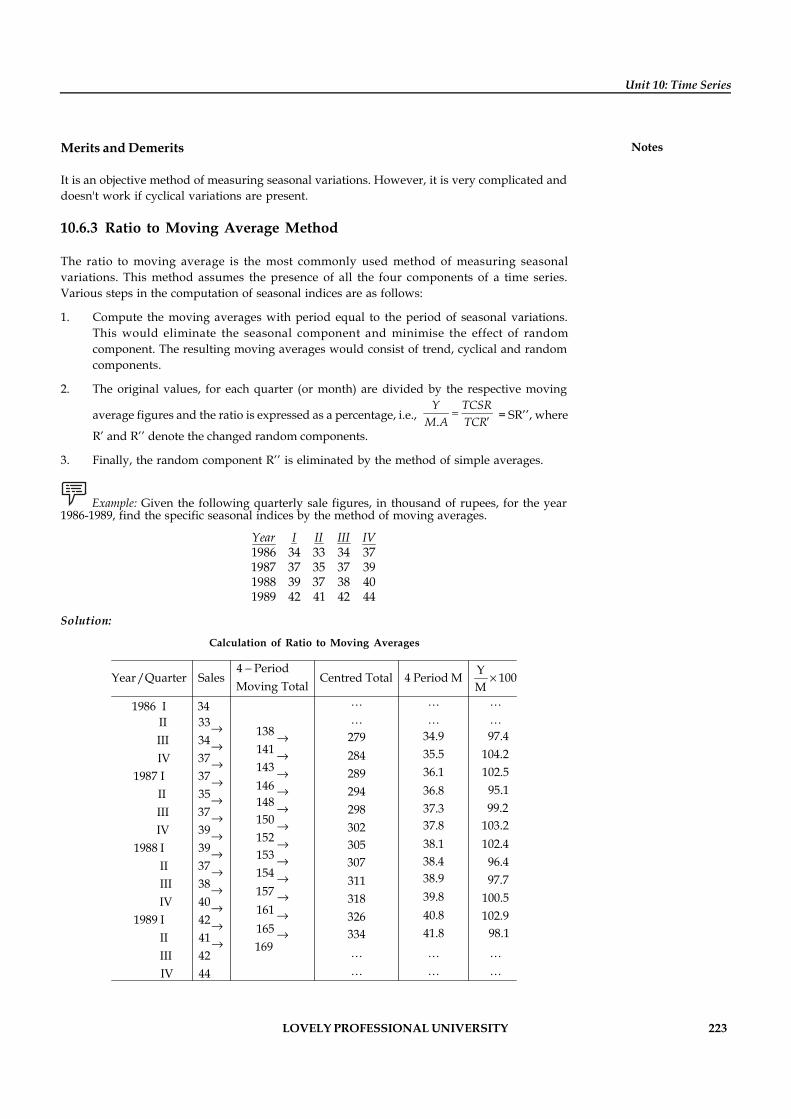
LOVELY PROFESSIONAL UNIVERSITY 223
Unit 10: Time Series
NotesMerits and Demerits
It is an objective method of measuring seasonal variations. However, it is very complicated anddoesn't work if cyclical variations are present.
10.6.3 Ratio to Moving Average Method
The ratio to moving average is the most commonly used method of measuring seasonalvariations. This method assumes the presence of all the four components of a time series.Various steps in the computation of seasonal indices are as follows:
1. Compute the moving averages with period equal to the period of seasonal variations.This would eliminate the seasonal component and minimise the effect of randomcomponent. The resulting moving averages would consist of trend, cyclical and randomcomponents.
2. The original values, for each quarter (or month) are divided by the respective moving
average figures and the ratio is expressed as a percentage, i.e., .Y TCSR
M A TCR
= SR’’, where
R’ and R’’ denote the changed random components.
3. Finally, the random component R’’ is eliminated by the method of simple averages.
Example: Given the following quarterly sale figures, in thousand of rupees, for the year1986-1989, find the specific seasonal indices by the method of moving averages.
Year I II III IV1986 34 33 34 371987 37 35 37 391988 39 37 38 401989 42 41 42 44
Solution:
Calculation of Ratio to Moving Averages
4 Period YYear/Quarter Sales Centred Total 4 Period M 100Moving Total M
1986 I 34II 33
138 34.9 97.4279III 34141 35.5 104.2284IV 37143 36.1 102.52891987 I 37146 95.136.8294II 35 148 99.237.3298III 37 150 3302IV 39
-
®®
®®
®®
®®
®®
®®
®
7.8 103.2152 38.1 102.43051988 I 39 153 38.4 96.4307II 37 154 38.9 97.7311III 38 157 39.8 100.5318IV 40 161 40.8 102.93261989 I 42165 41.8 98.1334II 41169
III 42IV 44
®® ®® ®® ®® ®®
®®
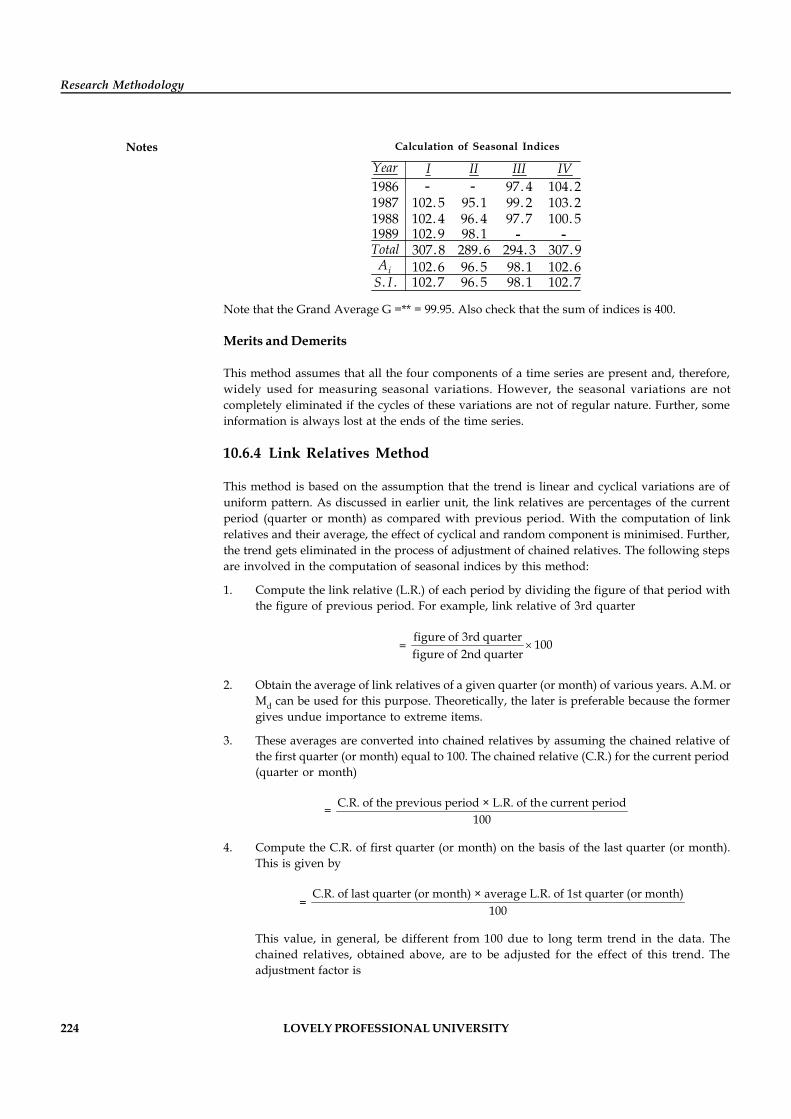
224 LOVELY PROFESSIONAL UNIVERSITY
Research Methodology
Notes Calculation of Seasonal Indices
Year I II III IV1986 - - 97. 4 104. 21987 102. 5 95.1 99. 2 103. 21988 102. 4 96. 4 97.7 100. 51989 102.9 98.1 - -Total 307.8 289.6 294. 3 307.9Ai 102.6 96. 5 98.1 102.6S. I . 102.7 96. 5 98.1 102.7
Note that the Grand Average G =** = 99.95. Also check that the sum of indices is 400.
Merits and Demerits
This method assumes that all the four components of a time series are present and, therefore,widely used for measuring seasonal variations. However, the seasonal variations are notcompletely eliminated if the cycles of these variations are not of regular nature. Further, someinformation is always lost at the ends of the time series.
10.6.4 Link Relatives Method
This method is based on the assumption that the trend is linear and cyclical variations are ofuniform pattern. As discussed in earlier unit, the link relatives are percentages of the currentperiod (quarter or month) as compared with previous period. With the computation of linkrelatives and their average, the effect of cyclical and random component is minimised. Further,the trend gets eliminated in the process of adjustment of chained relatives. The following stepsare involved in the computation of seasonal indices by this method:
1. Compute the link relative (L.R.) of each period by dividing the figure of that period withthe figure of previous period. For example, link relative of 3rd quarter
= figure of 3rd quarter 100figure of 2nd quarter
2. Obtain the average of link relatives of a given quarter (or month) of various years. A.M. orMd can be used for this purpose. Theoretically, the later is preferable because the formergives undue importance to extreme items.
3. These averages are converted into chained relatives by assuming the chained relative ofthe first quarter (or month) equal to 100. The chained relative (C.R.) for the current period(quarter or month)
= C.R. of the previous period × L.R. of the current period
100
4. Compute the C.R. of first quarter (or month) on the basis of the last quarter (or month).This is given by
= C.R. of last quarter (or month) × average L.R. of 1st quarter (or month)
100
This value, in general, be different from 100 due to long term trend in the data. Thechained relatives, obtained above, are to be adjusted for the effect of this trend. Theadjustment factor is
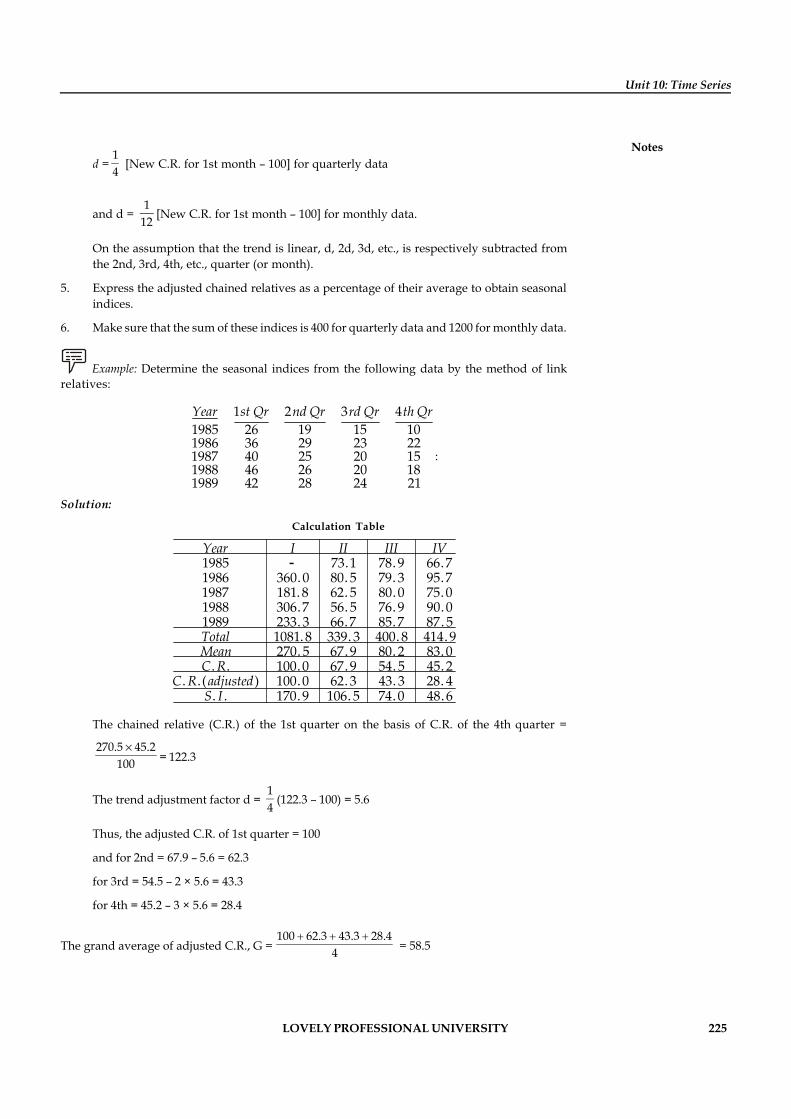
LOVELY PROFESSIONAL UNIVERSITY 225
Unit 10: Time Series
Notesd =
14 [New C.R. for 1st month – 100] for quarterly data
and d = 1
12 [New C.R. for 1st month – 100] for monthly data.
On the assumption that the trend is linear, d, 2d, 3d, etc., is respectively subtracted fromthe 2nd, 3rd, 4th, etc., quarter (or month).
5. Express the adjusted chained relatives as a percentage of their average to obtain seasonalindices.
6. Make sure that the sum of these indices is 400 for quarterly data and 1200 for monthly data.
Example: Determine the seasonal indices from the following data by the method of linkrelatives:
Year 1st Qr 2nd Qr 3rd Qr 4th Qr1985 26 19 15 101986 36 29 23 221987 40 25 20 151988 46 26 20 181989 42 28 24 21
:
Solution:
Calculation Table
Year I II III IV1985 - 73.1 78. 9 66.71986 360.0 80. 5 79. 3 95.71987 181.8 62. 5 80.0 75.01988 306.7 56. 5 76. 9 90.01989 233. 3 66.7 85.7 87. 5Total 1081.8 339. 3 400.8 414. 9Mean 270. 5 67. 9 80. 2 83.0C.R. 100.0 67. 9 54. 5 45. 2
C.R. (adjusted) 100.0 62. 3 43. 3 28. 4S. I . 170. 9 106. 5 74.0 48.6
The chained relative (C.R.) of the 1st quarter on the basis of C.R. of the 4th quarter =
270.5 45.2100
= 122.3
The trend adjustment factor d = 14 (122.3 – 100) = 5.6
Thus, the adjusted C.R. of 1st quarter = 100
and for 2nd = 67.9 – 5.6 = 62.3
for 3rd = 54.5 – 2 × 5.6 = 43.3
for 4th = 45.2 – 3 × 5.6 = 28.4
The grand average of adjusted C.R., G =100 62.3 43.3 28.4
4
= 58.5
226 LOVELY PROFESSIONAL UNIVERSITY
Research Methodology
NotesThe seasonal index of a quarter =
Adjusted C.R. × 100G
Merits and Demerits
This method is less complicated than the ratio to moving average and the ratio to trend methods.However, this method is based upon the assumption of a linear trend which may not alwayshold true.
Remarks: Looking at the merits and demerits of various methods of measuring seasonalvariations, we find that the ratio to moving average method is most general and, therefore,most popular method of measuring seasonal variations.
Self Assessment
Fill in the blanks:
16. If the time series data are in terms of annual figures, the ……………………are absent.
17. …………………..method is based on the assumption that the trend is linear and cyclicalvariations are of uniform pattern.
18. ………………….method is used when cyclical variations are absent from the data
10.7 Summary
Many types of data are collected over time.
Stock prices, sales volumes, interest rates, and quality measurements are typical examples.
Because of the sequential nature of the data, special statistical techniques that account forthe dynamic nature of the data are required.
A time series is a sequence of data points, measured typically at successive times, spacedat time intervals.
Time series analysis comprises methods that attempt to understand such time series, ofteneither to understand the underlying context of the data points, or to make forecasts.
Time series forecasting is the use of a model to forecast future events based on known pastevents: to forecast future data points before they are measured.
seasonal variations are likely to be present in data recorded on quarterly or monthly orweekly or daily or hourly basis.
There are four methods commonly used for the measurement of seasonal variations. Theyare: Method of Simple Averages, Ratio to Trend Method, Ratio to Moving Average Methodand Method of Link Relatives
10.8 Keywords
Mean Squared Error: It is the sum of the squared forecast errors for each of the observationsdivided by the number of observations.
Period of Oscillation: The time interval between the variations is known as the period ofoscillation.
LOVELY PROFESSIONAL UNIVERSITY 227
Unit 10: Time Series
NotesPeriodic Variations: The variations that repeat themselves after a regular interval of time.
Random Variations: The variations that do not reveal any regular pattern of movements.
Secular Trend: It is the general tendency of the data to increase or decrease or stagnate over along period of time.
10.9 Review Questions
1. Smart Discount Stores: There are 2117 Smart stores in the India (the chain is building up).It is one of India’s most interesting discounters tracing its origins back to 1980’s and theopening of the first Smart store. At present Smart has reached an “upgrading” phase likeso many discounters before.
Given the data below, perform the indicated analyses.
Year 1999 1998 1997 1996 1995 1994 1993 1992 1991 1990
EarningsPer Share 19.0 17.5 20.7 28.4 27.4 23.9 21.1 16.1 8.5 11.1
DividendsPer Share 9.9 9.5 9.0 8.1 6.8 5.0 3.0 2.4 2.2 1.9
Pre-taxMargin 2.1 2.0 3.1 4.9 5.4 5.7 5.8 5.8 3.3 5.3
(a) To what extent does the Board of directors regard dividend payments as a functionof earnings? Test whether there is a significant relationship between the variables.Use a parametric analysis.
(b) Find the linear forecasting equation that would allow you to predict dividendpayments based on earnings and test the significance of the slope.
(c) Is there a significant difference in pre-tax margin when comparing the periods 1995-1999 and 1990-1994. Perform a non-parametric analysis. Explain the managerialimplications of your findings.
2. Big and Small Apples Employment figures in thousands for Neo-Classical City and suburbsare given below. Perform the required analyses:
(a) Using linear forecasts, predict the year in which employment will be the same forthe two locations.
(b) Construct the NCC confidence interval for that year.
(c) Correlate the employment figures for the two areas using both parametric and non-parametric methods and test the significance of the correlation coefficients.
(d) Fit a modified exponential trend to SUB data and discuss the results in terms of yourfindings in (a) above.
(e) Are NCC employment figures uniformly distributed over the period 1994 through2000?
YEAR 1994 1995 1996 1997 1998 1999 2000
NYC 64.1 60.2 59.2 59.0 57.6 54.4 50.9
SUB 20.7 21.4 22.1 23.8 24.5 26.3 26.5
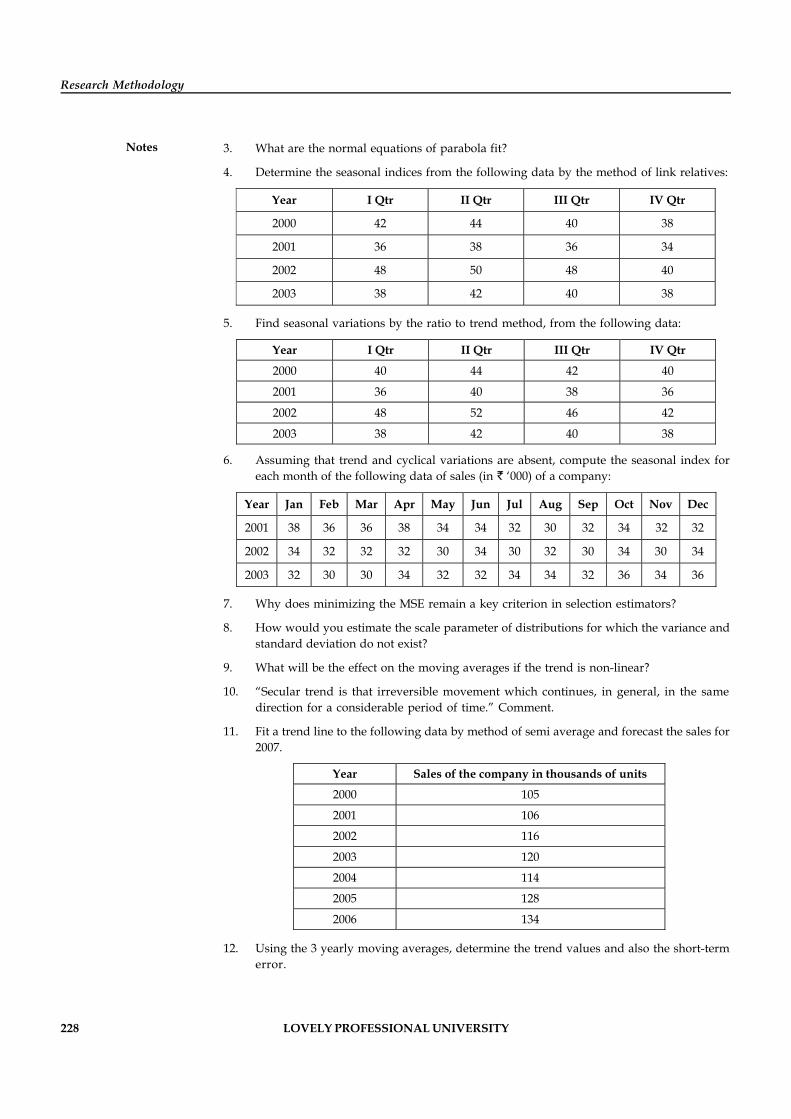
228 LOVELY PROFESSIONAL UNIVERSITY
Research Methodology
Notes 3. What are the normal equations of parabola fit?
4. Determine the seasonal indices from the following data by the method of link relatives:
Year I Qtr II Qtr III Qtr IV Qtr
2000 42 44 40 38
2001 36 38 36 34
2002 48 50 48 40
2003 38 42 40 38
5. Find seasonal variations by the ratio to trend method, from the following data:
Year I Qtr II Qtr III Qtr IV Qtr
2000 40 44 42 40
2001 36 40 38 36
2002 48 52 46 42
2003 38 42 40 38 6. Assuming that trend and cyclical variations are absent, compute the seasonal index for
each month of the following data of sales (in ‘000) of a company:
Year Jan Feb Mar Apr May Jun Jul Aug Sep Oct Nov Dec
2001 38 36 36 38 34 34 32 30 32 34 32 32
2002 34 32 32 32 30 34 30 32 30 34 30 34
2003 32 30 30 34 32 32 34 34 32 36 34 36
7. Why does minimizing the MSE remain a key criterion in selection estimators?
8. How would you estimate the scale parameter of distributions for which the variance andstandard deviation do not exist?
9. What will be the effect on the moving averages if the trend is non-linear?
10. “Secular trend is that irreversible movement which continues, in general, in the samedirection for a considerable period of time.” Comment.
11. Fit a trend line to the following data by method of semi average and forecast the sales for2007.
Year Sales of the company in thousands of units
2000 105
2001 106
2002 116
2003 120
2004 114
2005 128
2006 134
12. Using the 3 yearly moving averages, determine the trend values and also the short-termerror.
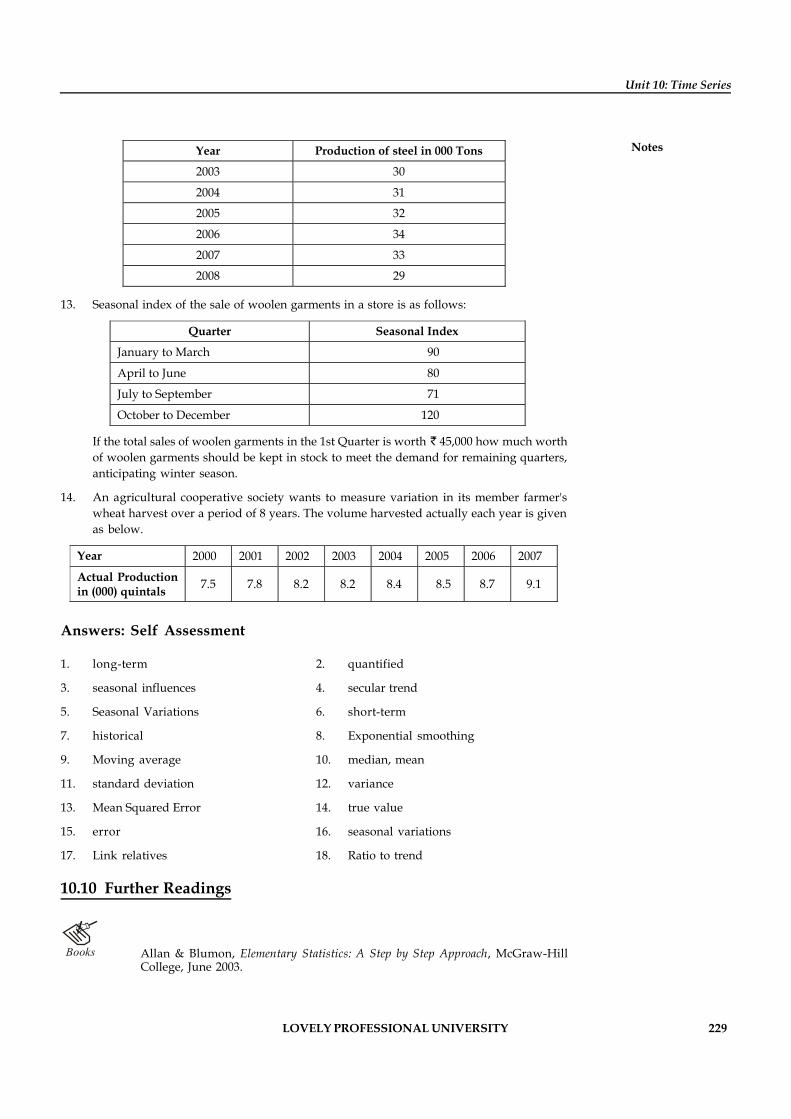
LOVELY PROFESSIONAL UNIVERSITY 229
Unit 10: Time Series
NotesYear Production of steel in 000 Tons
2003 30
2004 31
2005 32
2006 34
2007 33
2008 29
13. Seasonal index of the sale of woolen garments in a store is as follows:
Quarter Seasonal Index
January to March 90
April to June 80
July to September 71
October to December 120 If the total sales of woolen garments in the 1st Quarter is worth 45,000 how much worth
of woolen garments should be kept in stock to meet the demand for remaining quarters,anticipating winter season.
14. An agricultural cooperative society wants to measure variation in its member farmer'swheat harvest over a period of 8 years. The volume harvested actually each year is givenas below.
Year 2000 2001 2002 2003 2004 2005 2006 2007
Actual Production in (000) quintals 7.5 7.8 8.2 8.2 8.4 8.5 8.7 9.1
Answers: Self Assessment
1. long-term 2. quantified
3. seasonal influences 4. secular trend
5. Seasonal Variations 6. short-term
7. historical 8. Exponential smoothing
9. Moving average 10. median, mean
11. standard deviation 12. variance
13. Mean Squared Error 14. true value
15. error 16. seasonal variations
17. Link relatives 18. Ratio to trend
10.10 Further Readings
Books Allan & Blumon, Elementary Statistics: A Step by Step Approach, McGraw-HillCollege, June 2003.

230 LOVELY PROFESSIONAL UNIVERSITY
Research Methodology
Notes David & Moae, Introduction to the Practice of Statistics, W.H. Freeman & Co., February2005.
James T. McClave Terry Sincich, William Mendenhall, Statistics, Prentice Hall,February 2005.
Mario F. Triola, Elementary Statistics, Addison-Wesley, January 2006.
Mark L. Berenson, David M. Revine, Tineothy C. Krehbiel, Basic Business Statistics:Concepts & Applications, Prentice Hall, May 2005.
LOVELY PROFESSIONAL UNIVERSITY 231
Unit 11: Index Numbers
NotesUnit 11: Index Numbers
CONTENTS
Objectives
Introduction
11.1 Definitions and Characteristics of Index Numbers
11.2 Uses of Index Numbers
11.3 Construction of Index Numbers
11.4 Price Index Numbers
11.4.1 Use of Price Index Numbers in Deflating
11.5 Quantity Index Numbers
11.6 Consumer Price Index Number
11.6.1 Construction of Consumer Price Index
11.6.2 Uses of Consumer Price Index
11.7 Problems in the Construction of Index Numbers
11.8 Limitations of Index Numbers
11.9 Summary
11.10 Keywords
11.11 Review Questions
11.12 Further Readings
Objectives
After studying this unit, you will be able to:
Define the conception of index numbers
Discuss the uses of index numbers
Describe the construction of index numbers
Recognize the thought of consumer price index number
Identify the problems in the construction of index numbers
Introduction
An index number is a statistical measure used to compare the average level of magnitude of agroup of distinct but related variables in two or more situations. Suppose that we want tocompare the average price level of different items of food in 1992 with what it was in 1990. Letthe different items of food be wheat, rice, milk, eggs, ghee, sugar, pulses, etc. If the prices of allthese items change in the same ratio and in the same direction; assume that prices of all the itemshave increased by 10% in 1992 as compared with their prices in 1990; then there will be nodifficulty in finding out the average change in price level for the group as a whole. Obviously,
232 LOVELY PROFESSIONAL UNIVERSITY
Research Methodology
Notes the average price level of all the items taken as a group will also be 10% higher in 1992 ascompared with prices of 1990. However, in real situations, neither the prices of all the itemschange in the same ratio nor in the same direction, i.e., the prices of some commodities maychange to a greater extent as compared to prices of other commodities. Moreover, the price ofsome commodities may rise while that of others may fall. For such situations, the index numbersare very useful device for measuring the average change in prices or any other characteristicslike quantity, value, etc. for the group as a whole.
11.1 Definitions and Characteristics of Index Numbers
Some important definitions of index numbers are given below:
1. “An index number is a device for comparing the general level of magnitude of a group ofdistinct, but related, variables in two or more situations.”
—Karmel and Polasek
2. “An index number is a special type of average that provides a measurement of relativechanges from time to time or from place to place.”
— Wessell, Wilett and Simone
3. “Index number shows by its variation the changes in a magnitude which is not susceptibleeither of accurate measurement in itself or of direct valuation in practice.”
— Edgeworth
4. “An index number is a single ratio (usually in percentage) which measures the combined(i.e., averaged) change of several variables between two different times, places orsituations.”
— Tuttle
On the basis of the above definitions, the following characteristics of index numbers are worthmentioning:
1. Index numbers are specialised averages: As we know that an average of data is itsrepresentative summary figure. In a similar way, an index number is also an average,often a weighted average, computed for a group. It is called a specialised average becausethe figures, that are averaged, are not necessarily expressed in homogeneous units.
2. Index numbers measure the changes for a group which are not capable of being directlymeasured: The examples of such magnitudes are: Price level of a group of items, level ofbusiness activity in a market, level of industrial or agricultural output in an economy, etc.
3. Index numbers are expressed in terms of percentages: The changes in magnitude of a groupare expressed in terms of percentages which are independent of the units of measurement.This facilitates the comparison of two or more index numbers in different situations.
Self Assessment
Fill in the blanks:
1. Index numbers are called a specialised average because the figures, that are averaged, arenot necessarily expressed in ………………..units.
2. Index number is often recognized a ……………….average, computed for a group.
LOVELY PROFESSIONAL UNIVERSITY 233
Unit 11: Index Numbers
Notes11.2 Uses of Index Numbers
The main uses of index numbers are:
1. To measure and compare changes: The basic purpose of the construction of an index numberis to measure the level of activity of phenomena like price level, cost of living, level ofagricultural production, level of business activity, etc. It is because of this reason thatsometimes index numbers are termed as barometers of economic activity. It may bementioned here that a barometer is an instrument which is used to measure atmosphericpressure in physics.
The level of an activity can be expressed in terms of index numbers at different points oftime or for different places at a particular point of time. These index numbers can be easilycompared to determine the trend of the level of an activity over a period of time or withreference to different places.
2. To help in providing guidelines for framing suitable policies: Index numbers areindispensable tools for the management of any government or non-governmentorganisation.
Example: The increase in cost of living index is helpful in deciding the amount ofadditional dearness allowance that should be paid to the workers to compensate them for therise in prices. In addition to this, index numbers can be used in planning and formulation ofvarious government and business policies.
3. Price index numbers are used in deflating: This is a very important use of price indexnumbers. These index numbers can be used to adjust monetary figures of various periodsfor changes in prices.
Example: The figure of national income of a country is computed on the basis of theprices of the year in question. Such figures, for various years often known as national income atcurrent prices, do not reveal the real change in the level of production of goods and services. Inorder to know the real change in national income, these figures must be adjusted for pricechanges in various years. Such adjustments are possible only by the use of price index numbersand the process of adjustment, in a situation of rising prices, is known as deflating.
4. To measure purchasing power of money: We know that there is inverse relation betweenthe purchasing power of money and the general price level measured in terms of a priceindex number. Thus, reciprocal of the relevant price index can be taken as a measure of thepurchasing power of money.
Self Assessment
Fill in the Blanks:
3. Index numbers are termed as ……………….of economic activity.
4. The ………………….can be expressed in terms of index numbers at different points of timeor for different places at a particular point of time.
11.3 Construction of Index Numbers
To illustrate the construction of an index number, we reconsider various items of food mentionedearlier. Let the prices of different items in the two years, 1990 and 1992, be as given below:
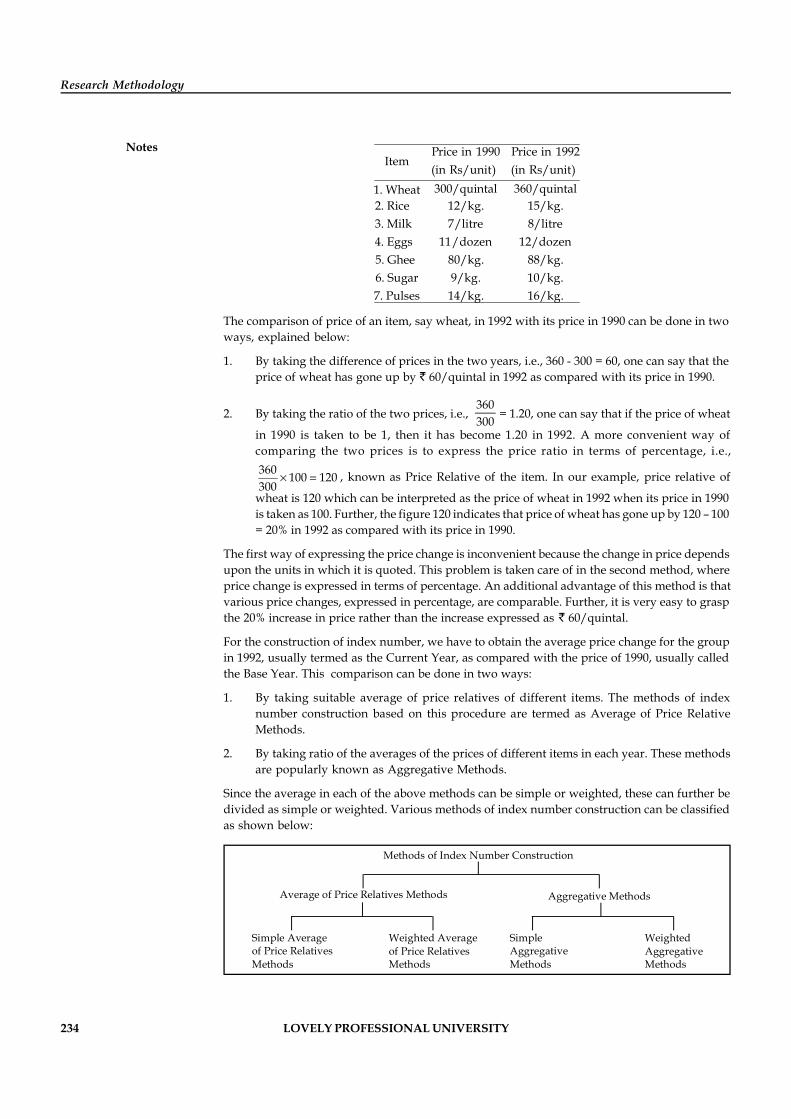
234 LOVELY PROFESSIONAL UNIVERSITY
Research Methodology
Notes Price in 1990 Price in 1992Item
(in Rs/unit) (in Rs/unit)300/quintal 360/quintal1. Wheat
2. Rice 12/kg. 15/kg.3. Milk 7/litre 8/litre4. Eggs 11/dozen 12/dozen5. Ghee 80/kg. 88/kg.6. Sugar 9/kg. 10/kg.7. Pulses 14/kg. 16/kg.
The comparison of price of an item, say wheat, in 1992 with its price in 1990 can be done in twoways, explained below:
1. By taking the difference of prices in the two years, i.e., 360 - 300 = 60, one can say that theprice of wheat has gone up by 60/quintal in 1992 as compared with its price in 1990.
2. By taking the ratio of the two prices, i.e., 360300
= 1.20, one can say that if the price of wheat
in 1990 is taken to be 1, then it has become 1.20 in 1992. A more convenient way ofcomparing the two prices is to express the price ratio in terms of percentage, i.e.,360 100 120300
´ = , known as Price Relative of the item. In our example, price relative of
wheat is 120 which can be interpreted as the price of wheat in 1992 when its price in 1990is taken as 100. Further, the figure 120 indicates that price of wheat has gone up by 120 – 100= 20% in 1992 as compared with its price in 1990.
The first way of expressing the price change is inconvenient because the change in price dependsupon the units in which it is quoted. This problem is taken care of in the second method, whereprice change is expressed in terms of percentage. An additional advantage of this method is thatvarious price changes, expressed in percentage, are comparable. Further, it is very easy to graspthe 20% increase in price rather than the increase expressed as 60/quintal.
For the construction of index number, we have to obtain the average price change for the groupin 1992, usually termed as the Current Year, as compared with the price of 1990, usually calledthe Base Year. This comparison can be done in two ways:
1. By taking suitable average of price relatives of different items. The methods of indexnumber construction based on this procedure are termed as Average of Price RelativeMethods.
2. By taking ratio of the averages of the prices of different items in each year. These methodsare popularly known as Aggregative Methods.
Since the average in each of the above methods can be simple or weighted, these can further bedivided as simple or weighted. Various methods of index number construction can be classifiedas shown below:
Methods of Index Number Construction
WeightedAggregativeMethods
Simple AggregativeMethods
Weighted Averageof Price RelativesMethods
Simple Averageof Price RelativesMethods
Aggregative MethodsAverage of Price Relatives Methods
LOVELY PROFESSIONAL UNIVERSITY 235
Unit 11: Index Numbers
NotesIn addition to this, a particular method would depend upon the type of average used. Although,geometric mean is more suitable for averaging ratios, arithmetic mean is often preferred becauseof its simplicity with regard to computations and interpretation.
Notes Before writing various formulae of index numbers, it is necessary to introducecertain notations and terminology for convenience.
Base Year: The year from which comparisons are made is called the base year. It is commonlydenoted by writing ‘0’ as a subscript of the variable.
Current Year: The year under consideration for which the comparisons are to be computedis called the current year. It is commonly denoted by writing ‘1’ as a subscript of thevariable.
Let there be n items in a group which are numbered from 1 to n. Let p0i denote the price ofthe i th item in base year and p1i denote its price in current year, where i = 1, 2, ...... n. In asimilar way q0i and q1i will denote the quantities of the i th item in base and current yearsrespectively.
Using these notations, we can write an expression for price relative of the ith item as
1ii
0i
pP 100p
= ´ and quantity relative of the i th item as 1ii
0i
qQ 100q
= ´ .
Further, P01 will be used to denote the price index number of period ‘1’ as compared withthe prices of period ‘0’. Similarly, Q01 and V01 would denote the quantity and the valueindex numbers respectively of period ‘1’ as compared with period ‘0’.
Self Assessment
Fill in the blanks:
5. The year from which comparisons are made is called the………………….
6. ………………………is commonly denoted by writing ‘1’ as a subscript of the variable
11.4 Price Index Numbers
Simple Average of Price Relatives
1. When arithmetic mean of price relatives is used
The index number formula is given by
1i
i 0i01 01
p 100P pP or Pn n
´= =
åå Omitting the
subscript i, the above formula can also be written as P01 =
1
0
p 100p
n
´å
2. When geometric mean of price relatives is used
The index number formula is given by
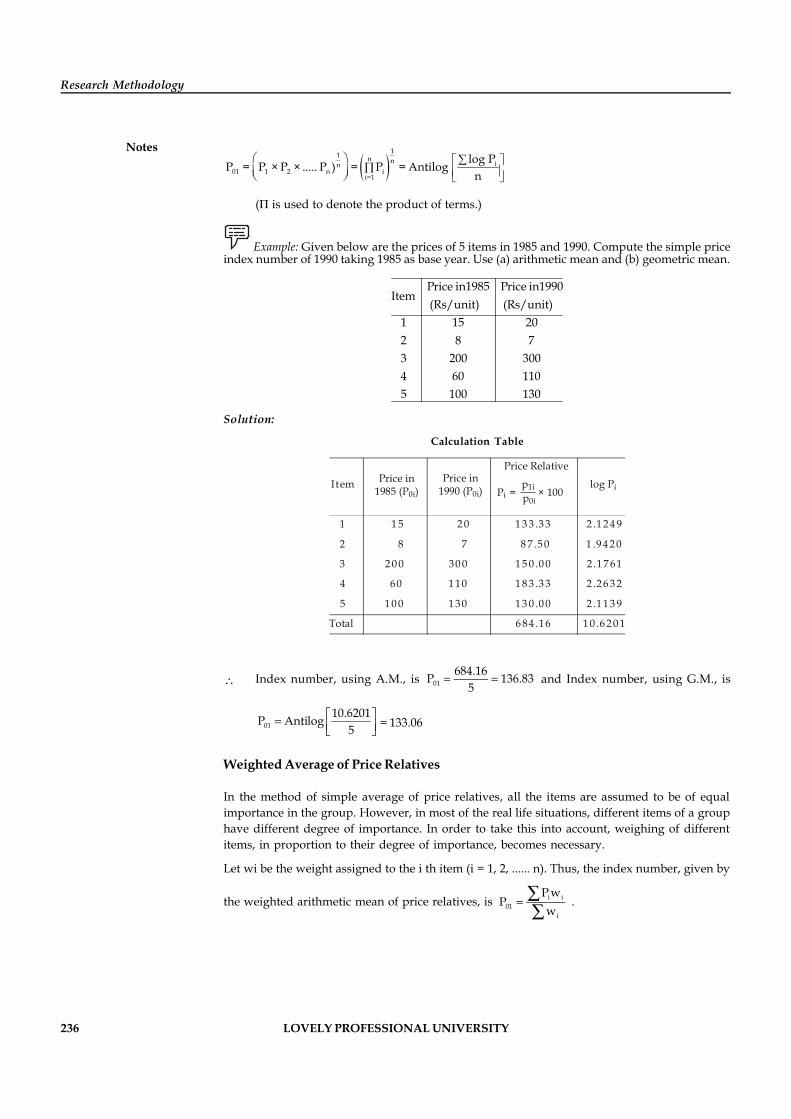
236 LOVELY PROFESSIONAL UNIVERSITY
Research Methodology
Notes
11 n n in
01 1 2 n ii=1
log PP = P × P × ..... P ) = P = Antilogn
( is used to denote the product of terms.)
Example: Given below are the prices of 5 items in 1985 and 1990. Compute the simple priceindex number of 1990 taking 1985 as base year. Use (a) arithmetic mean and (b) geometric mean.
Price in1985 Price in1990Item
(Rs/unit) (Rs/unit)1 15 202 8 73 200 3004 60 1105 100 130
Solution:
Calculation Table
=
Price RelativePrice in
1985 (P )0iItem p 1i log PiPi × 100p0i
Total
1 1 5 2 0 1 3 3 .3 3 2 .1 2 4 9
2 8 7 8 7.5 0 1 .9 4 2 0
3 2 0 0 30 0 1 5 0 .0 0 2.1 7 61
4 60 1 10 1 8 3 .3 3 2 .2 6 3 2
5 1 0 0 1 30 1 3 0 .0 0 2 .1 1 3 9
6 84 .16 1 0 .6 2 0 1
Price in1990 (P )0i
\ Index number, using A.M., is 01684.16P 136.83
5= = and Index number, using G.M., is
0110.6201P Antilog
5é ù= ê úë û
= 133.06
Weighted Average of Price Relatives
In the method of simple average of price relatives, all the items are assumed to be of equalimportance in the group. However, in most of the real life situations, different items of a grouphave different degree of importance. In order to take this into account, weighing of differentitems, in proportion to their degree of importance, becomes necessary.
Let wi be the weight assigned to the i th item (i = 1, 2, ...... n). Thus, the index number, given by
the weighted arithmetic mean of price relatives, is i i01
i
P wP
w= åå
.
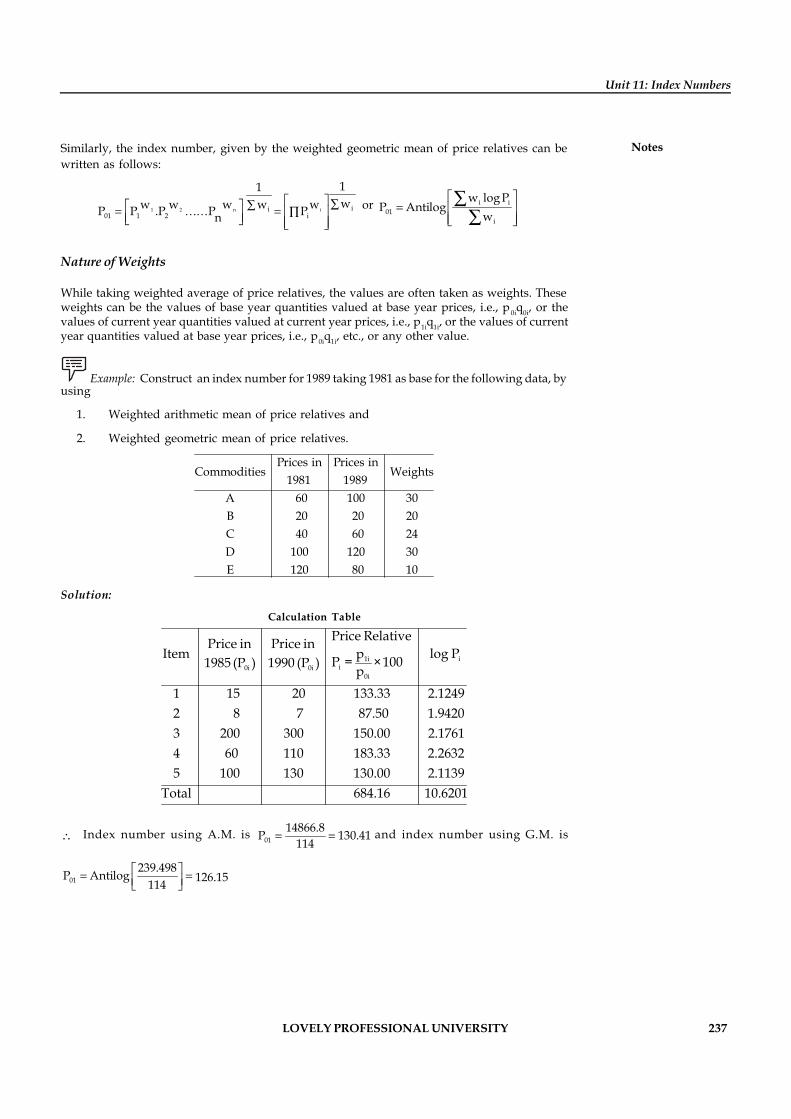
LOVELY PROFESSIONAL UNIVERSITY 237
Unit 11: Index Numbers
NotesSimilarly, the index number, given by the weighted geometric mean of price relatives can bewritten as follows:
1 2 n i ii01 1 2 i
11ww w w w w P P .P P Pn
é ùååé ù= = Õê úê úë û ê úë û or i i
01i
w log PP Antilog
wé ù
= ê úê úë û
åå
Nature of Weights
While taking weighted average of price relatives, the values are often taken as weights. Theseweights can be the values of base year quantities valued at base year prices, i.e., p 0iq0i, or thevalues of current year quantities valued at current year prices, i.e., p1iq1i, or the values of currentyear quantities valued at base year prices, i.e., p0iq1i, etc., or any other value.
Example: Construct an index number for 1989 taking 1981 as base for the following data, byusing
1. Weighted arithmetic mean of price relatives and
2. Weighted geometric mean of price relatives.
Prices in Prices inCommodities Weights
1981 1989A 60 100 30B 20 20 20C 40 60 24D 100 120 30E 120 80 10
Solution:
Calculation Table
i1ii0i 0i
0i
Price RelativePrice in Price in Item log PpP = ×1001985 (P ) 1990 (P ) p1 15 20 133.33 2.12492 8 7 87.50 1.94203 200 300 150.00 2.17614 60 110 183.33 2.26325 100 130 130.00 2.1139
Total 684.16 10.6201
\ Index number using A.M. is 0114866.8P 130.41
114= = and index number using G.M. is
01239.498P Antilog
114é ù= =ê úë û
126.15
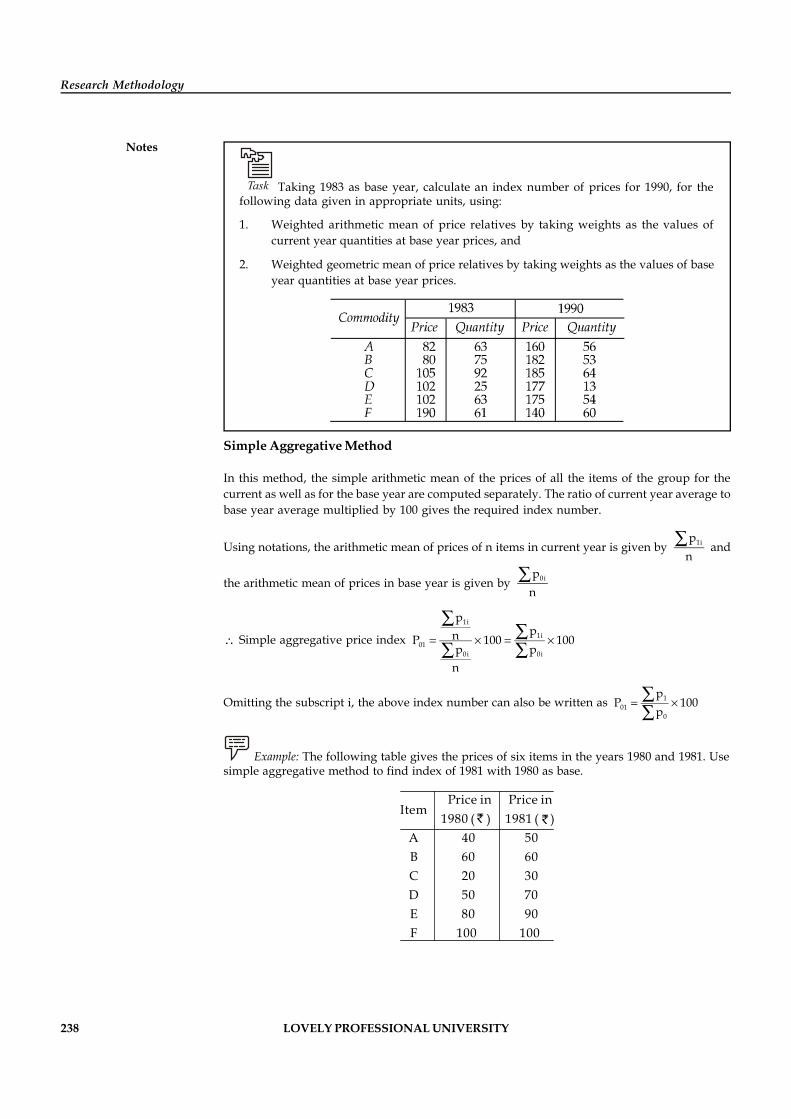
238 LOVELY PROFESSIONAL UNIVERSITY
Research Methodology
Notes
Task Taking 1983 as base year, calculate an index number of prices for 1990, for thefollowing data given in appropriate units, using:
1. Weighted arithmetic mean of price relatives by taking weights as the values ofcurrent year quantities at base year prices, and
2. Weighted geometric mean of price relatives by taking weights as the values of baseyear quantities at base year prices.
Simple Aggregative Method
In this method, the simple arithmetic mean of the prices of all the items of the group for thecurrent as well as for the base year are computed separately. The ratio of current year average tobase year average multiplied by 100 gives the required index number.
Using notations, the arithmetic mean of prices of n items in current year is given by 1ipn
å and
the arithmetic mean of prices in base year is given by 0ipn
å
\ Simple aggregative price index 1i
1i01
0i 0i
ppnP 100 100
p pn
= ´ = ´
åå
å å
Omitting the subscript i, the above index number can also be written as 101
0
pP 100
p= ´åå
Example: The following table gives the prices of six items in the years 1980 and 1981. Usesimple aggregative method to find index of 1981 with 1980 as base.
Price in Price inItem
1980 ( ) 1981 ( )A 40 50B 60 60C 20 30D 50 70E 80 90F 100 100
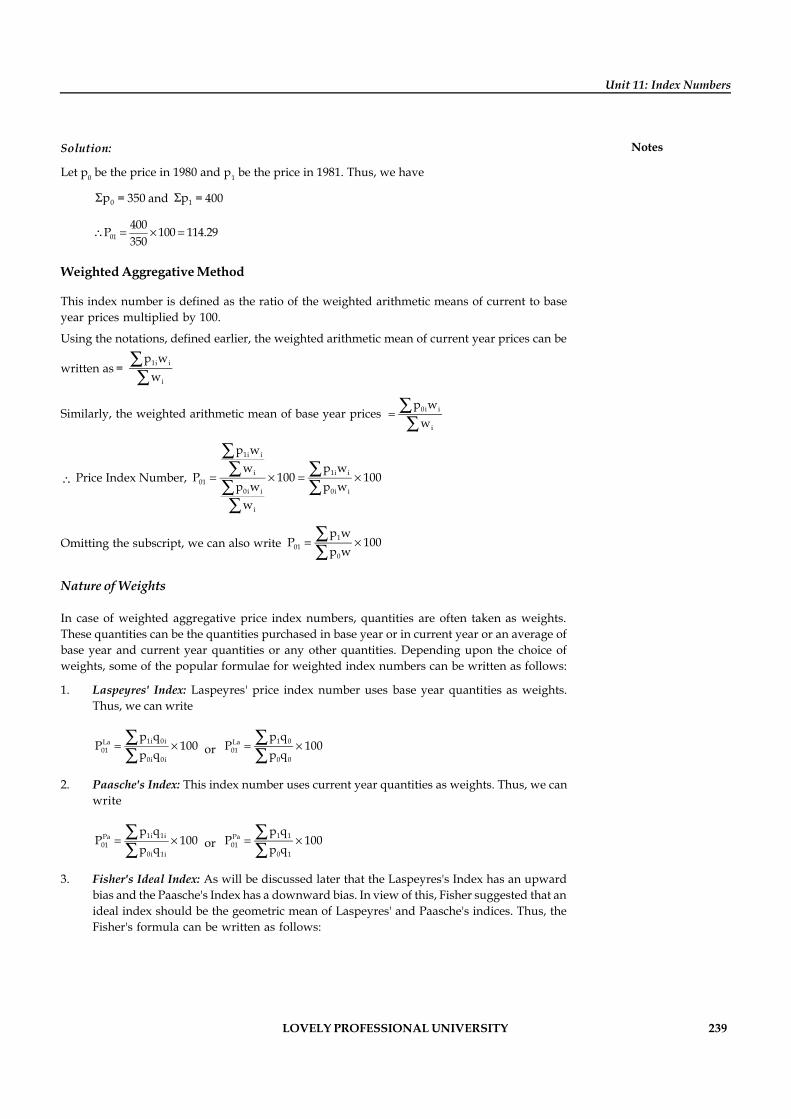
LOVELY PROFESSIONAL UNIVERSITY 239
Unit 11: Index Numbers
NotesSolution:
Let p0 be the price in 1980 and p1 be the price in 1981. Thus, we have
0pS = 350 and 1pS = 400
01400P 100 114.29350
\ = ´ =
Weighted Aggregative Method
This index number is defined as the ratio of the weighted arithmetic means of current to baseyear prices multiplied by 100.
Using the notations, defined earlier, the weighted arithmetic mean of current year prices can be
written as = 1i i
i
p ww
åå
Similarly, the weighted arithmetic mean of base year prices 0i i
i
p ww
= åå
\ Price Index Number,
1i i
i 1i i01
0i i 0i i
i
p ww p w
P 100 100p w p w
w
= ´ = ´
åå åå åå
Omitting the subscript, we can also write 101
0
p wP 100
p w= ´åå
Nature of Weights
In case of weighted aggregative price index numbers, quantities are often taken as weights.These quantities can be the quantities purchased in base year or in current year or an average ofbase year and current year quantities or any other quantities. Depending upon the choice ofweights, some of the popular formulae for weighted index numbers can be written as follows:
1. Laspeyres' Index: Laspeyres' price index number uses base year quantities as weights.Thus, we can write
1i 0iLa01
0i 0i
p qP 100
p q= ´åå or
1 0La01
0 0
p qP 100
p q= ´åå
2. Paasche's Index: This index number uses current year quantities as weights. Thus, we canwrite
1i 1iPa01
0i 1i
p qP 100
p q= ´åå or
1 1Pa01
0 1
p qP 100
p q= ´åå
3. Fisher's Ideal Index: As will be discussed later that the Laspeyres's Index has an upwardbias and the Paasche's Index has a downward bias. In view of this, Fisher suggested that anideal index should be the geometric mean of Laspeyres' and Paasche's indices. Thus, theFisher's formula can be written as follows:
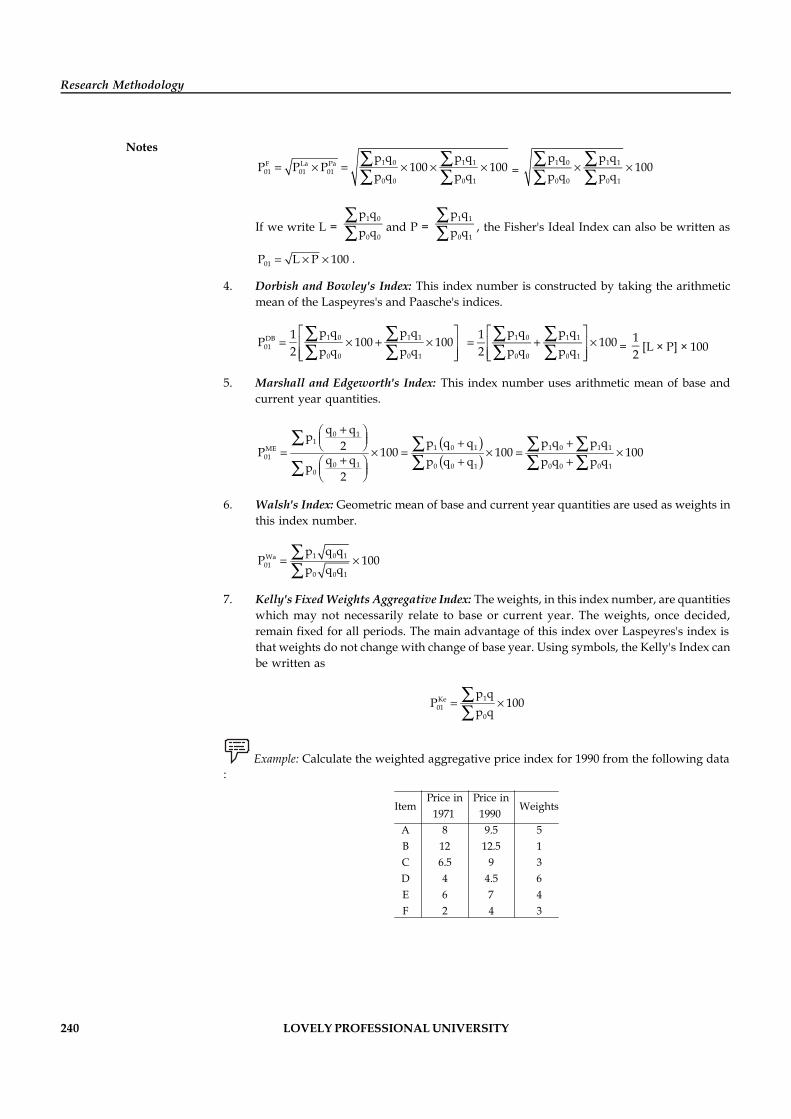
240 LOVELY PROFESSIONAL UNIVERSITY
Research Methodology
Notes1 0 1 1F La Pa
01 01 010 0 0 1
p q p qP P P 100 100
p q p q= ´ = ´ ´ ´å å
å å = 1 0 1 1
0 0 0 1
p q p q100
p q p q´ ´å å
å å
If we write L = 1 0
0 0
p qp q
åå and P =
1 1
0 1
p qp q
åå , the Fisher's Ideal Index can also be written as
01P L P 100= ´ ´ .
4. Dorbish and Bowley's Index: This index number is constructed by taking the arithmeticmean of the Laspeyres's and Paasche's indices.
1 0 1 1DB01
0 0 0 1
p q p q1P 100 1002 p q p qé ù
= ´ + ´ê úê úë û
å åå å
1 0 1 1
0 0 0 1
p q p q1 1002 p q p qé ù
= + ´ê úê úë û
å åå å =
12 [L × P] × 100
5. Marshall and Edgeworth's Index: This index number uses arithmetic mean of base andcurrent year quantities.
( )( )
0 11
1 0 1 1 0 1 1ME01
0 1 0 0 1 0 0 0 10
q qp p q q p q p q2P 100 100 100q q p q q p q p qp2
+æ öç ÷ + +è ø
= ´ = ´ = ´+æ ö + +
ç ÷è ø
å å å åå å åå
6. Walsh's Index: Geometric mean of base and current year quantities are used as weights inthis index number.
1 0 1Wa01
0 0 1
p q qP 100
p q q= ´åå
7. Kelly's Fixed Weights Aggregative Index: The weights, in this index number, are quantitieswhich may not necessarily relate to base or current year. The weights, once decided,remain fixed for all periods. The main advantage of this index over Laspeyres's index isthat weights do not change with change of base year. Using symbols, the Kelly's Index canbe written as
1Ke01
0
p qP 100
p q= ´åå
Example: Calculate the weighted aggregative price index for 1990 from the following data:
Price in Price inItem Weights
1971 1990A 8 9.5 5B 12 12.5 1C 6.5 9 3D 4 4.5 6E 6 7 4F 2 4 3
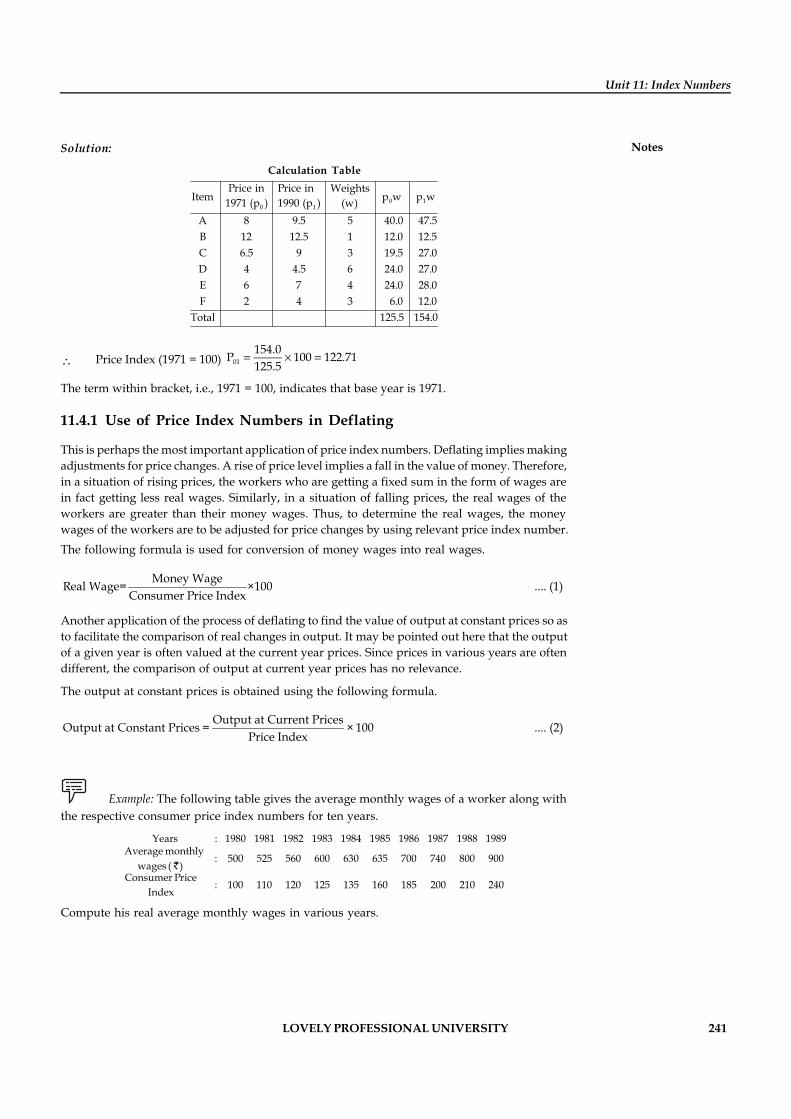
LOVELY PROFESSIONAL UNIVERSITY 241
Unit 11: Index Numbers
NotesSolution:
Calculation Table
0 10 1
Price in Price in WeightsItem p w p w1971 (p ) 1990 (p ) (w)
A 8 9.5 5 40.0 47.5B 12 12.5 1 12.0 12.5C 6.5 9 3 19.5 27.0D 4 4.5 6 24.0 27.0E 6 7 4 24.0 28.0F 2 4 3 6.0 12.0
Total 125.5 154.0
\ Price Index (1971 = 100) 01154.0P 100 122.71125.5
= ´ =
The term within bracket, i.e., 1971 = 100, indicates that base year is 1971.
11.4.1 Use of Price Index Numbers in Deflating
This is perhaps the most important application of price index numbers. Deflating implies makingadjustments for price changes. A rise of price level implies a fall in the value of money. Therefore,in a situation of rising prices, the workers who are getting a fixed sum in the form of wages arein fact getting less real wages. Similarly, in a situation of falling prices, the real wages of theworkers are greater than their money wages. Thus, to determine the real wages, the moneywages of the workers are to be adjusted for price changes by using relevant price index number.The following formula is used for conversion of money wages into real wages.
Money WageReal Wage= ×100Consumer Price Index
.... (1)
Another application of the process of deflating to find the value of output at constant prices so asto facilitate the comparison of real changes in output. It may be pointed out here that the outputof a given year is often valued at the current year prices. Since prices in various years are oftendifferent, the comparison of output at current year prices has no relevance.
The output at constant prices is obtained using the following formula.
Output at Current PricesOutput at Constant Prices = × 100Price Index
.... (2)
Example: The following table gives the average monthly wages of a worker along withthe respective consumer price index numbers for ten years.
Y e a r s : 1980 1981 1982 1983 1984 1985 1986 1987 1988 1989Average monthly
: 500 525 560 600 630 635 700 740 800 900 wages ( )Consumer Price
: 100 110 120 125 135 160 185 200 210 240 I ndex
Compute his real average monthly wages in various years.
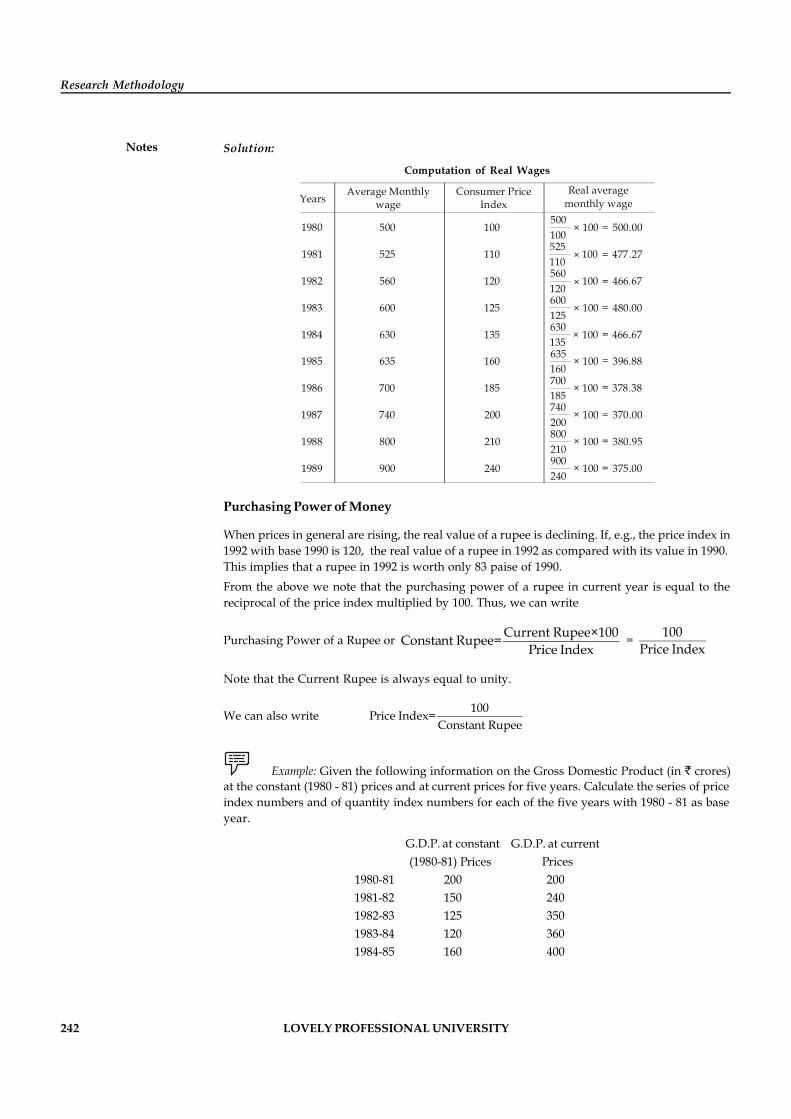
242 LOVELY PROFESSIONAL UNIVERSITY
Research Methodology
Notes Solution:
Computation of Real Wages
YearsAverage Monthly
wageConsumer Price
IndexReal average
monthly wage
1980 500 100500100
100 500.00
1981 525 110525110
100 477.27
1982 560 120560120
100 466.67
1983 600 125600125
100 480.00
1984 630 135630135
100 466.67
1985 635 160635160
100 396.88
1986 700 185700185
100 378.38
1987 740 200740200
100 370.00
1988 800 210800210
100 380.95
1989 900 240900240
100 375.00
×
×
×
×
×
×
×
×
×
×
=
=
=
=
=
=
=
=
=
=
Purchasing Power of Money
When prices in general are rising, the real value of a rupee is declining. If, e.g., the price index in1992 with base 1990 is 120, the real value of a rupee in 1992 as compared with its value in 1990.This implies that a rupee in 1992 is worth only 83 paise of 1990.From the above we note that the purchasing power of a rupee in current year is equal to thereciprocal of the price index multiplied by 100. Thus, we can write
Purchasing Power of a Rupee or Current Rupee×100Constant Rupee=Price Index
= 100Price Index
Note that the Current Rupee is always equal to unity.
We can also write 100Price Index=Constant Rupee
Example: Given the following information on the Gross Domestic Product (in crores)at the constant (1980 - 81) prices and at current prices for five years. Calculate the series of priceindex numbers and of quantity index numbers for each of the five years with 1980 - 81 as baseyear.
G.D.P. at constant G.D.P. at currentPrices(1980-81) Prices
1980-81 200 2001981-82 150 2401982-83 125 3501983-84 120 3601984-85 160 400
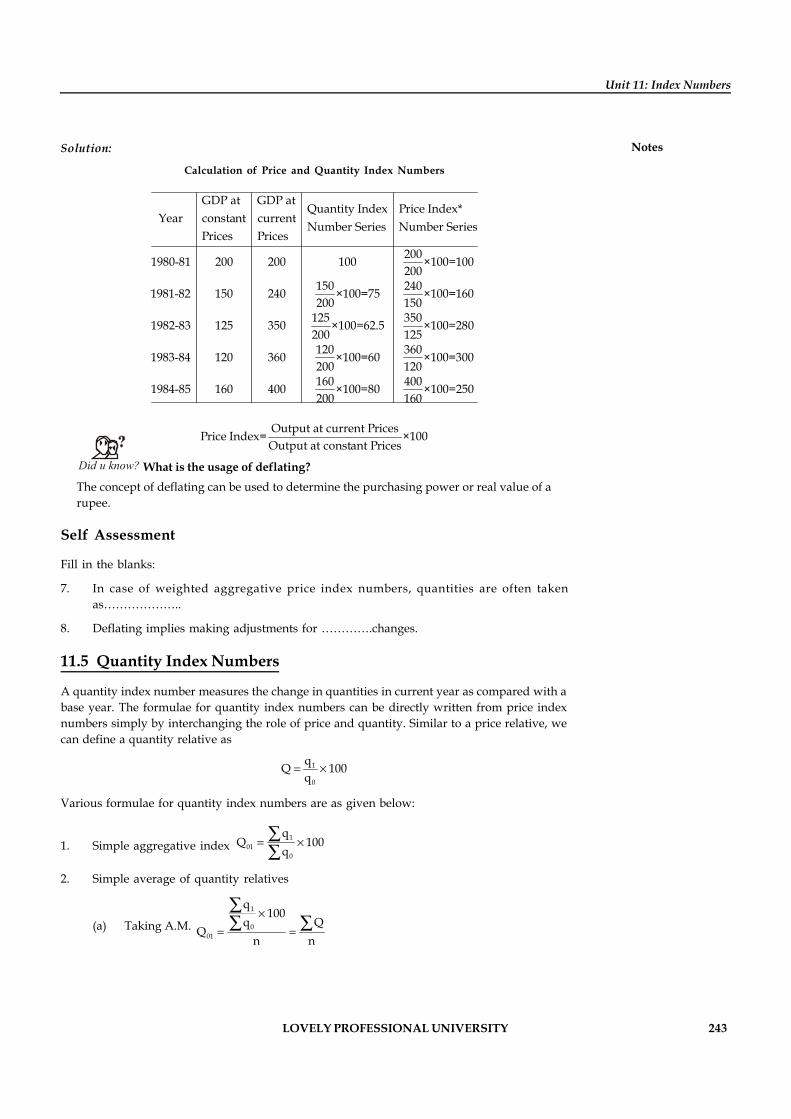
LOVELY PROFESSIONAL UNIVERSITY 243
Unit 11: Index Numbers
NotesSolution:
Calculation of Price and Quantity Index Numbers
GDP at GDP atQuantity Index Price Index*
Year constant currentNumber Series Number Series
Prices Prices2001980-81 200 200 100 ×100=100200
150 2401981-82 150 240 ×100=75 ×100=160200 150
125 3501982-83 125 350 ×100=62.5 ×100=28200 125
0
120 3601983-84 120 360 ×100=60 ×100=300200 120160 4001984-85 160 400 ×100=80 ×100=250200 160
Output at current PricesPrice Index= ×100Output at constant Prices
Did u know? What is the usage of deflating?The concept of deflating can be used to determine the purchasing power or real value of arupee.
Self Assessment
Fill in the blanks:
7. In case of weighted aggregative price index numbers, quantities are often takenas………………..
8. Deflating implies making adjustments for ………….changes.
11.5 Quantity Index Numbers
A quantity index number measures the change in quantities in current year as compared with abase year. The formulae for quantity index numbers can be directly written from price indexnumbers simply by interchanging the role of price and quantity. Similar to a price relative, wecan define a quantity relative as
1
0
qQ 100q
= ´
Various formulae for quantity index numbers are as given below:
1. Simple aggregative index 1
010
qQ 100
q= ´åå
2. Simple average of quantity relatives
(a) Taking A.M. 1
001
q100
q QQ
n n
´= =
åå å
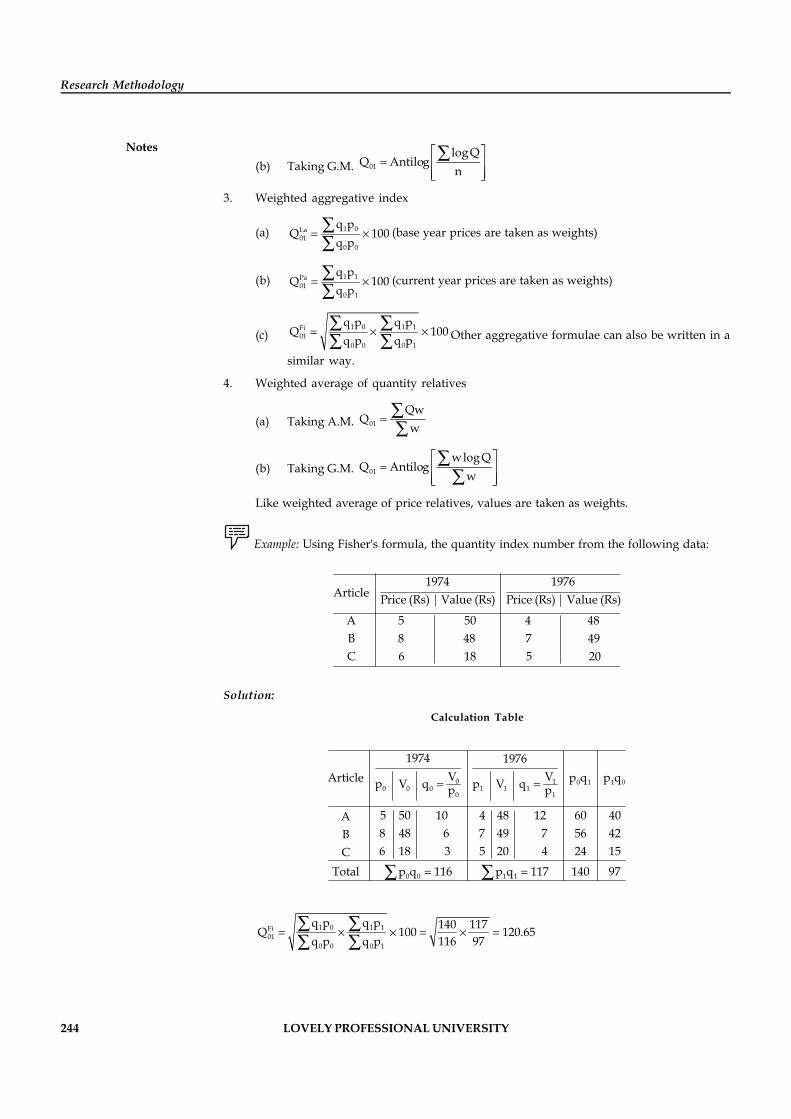
244 LOVELY PROFESSIONAL UNIVERSITY
Research Methodology
Notes(b) Taking G.M. 01
log QQ Antilog
né ù
= ê úê úë û
å
3. Weighted aggregative index
(a) 1 0La01
0 0
q pQ 100
q p= ´åå
(base year prices are taken as weights)
(b) 1 1Pa01
0 1
q pQ 100
q p= ´åå
(current year prices are taken as weights)
(c)1 0 1 1Fi
010 0 0 1
q p q pQ 100
q p q p= ´ ´å åå å Other aggregative formulae can also be written in a
similar way.
4. Weighted average of quantity relatives
(a) Taking A.M. 01
QwQ
w= åå
(b) Taking G.M. 01
wlog QQ Antilog
wé ù
= ê úê úë û
åå
Like weighted average of price relatives, values are taken as weights.
Example: Using Fisher's formula, the quantity index number from the following data:
1974 1976Article Price (Rs) Value (Rs) Price (Rs) Value (Rs)
A 5 50 4 48B 8 48 7 49C 6 18 5 20
Solution:
Calculation Table
0 1 0 1 1 00 0 0 1 1 1
0 1
0 0 1 1
1974 1976V VArticle p q p qp V q p V qp p
5 50 1 0 4 48 1 2 60 40A8 48 6 7 49 7 56 42B6 18 3 5 20 4 24 15C
Total p q 116 p q 117 140 97
= =
= =å å
1 0 1 1Fi01
0 0 0 1
q p q p 140 117Q 100 120.65116 97q p q p
= ´ ´ = ´ =å åå å
LOVELY PROFESSIONAL UNIVERSITY 245
Unit 11: Index Numbers
NotesSelf Assessment
Fill in the blanks:
9. …………………………..measures the change in quantities in current year as comparedwith a base year.
10. The formulae for quantity index numbers can be directly written from…………………….simply by interchanging the role of price and quantity.
11.6 Consumer Price Index Number
The consumer price or the retail price is the price at which the ultimate consumer purchases hisgoods and services from the retailer. According to the Labour Bureau, “with the help of ConsumerPrice Index Number, it is intended to show over time the average change in prices paid by the consumersbelonging to the population group proposed to be covered by the index for a fixed list of goods and servicesconsumed by them”.
Formerly, this index was also known as the cost of living index. However, since this indexmeasures changes in cost of living due to changes in retail prices only and not due to changes inliving standards, etc., the name was changed to consumer price index or retail price index.
11.6.1 Construction of Consumer Price Index
The following steps are involved in the construction of a consumer price index:
1. Scope and Coverage: The scope of consumer price index, proposed to be constructed, mustbe very clearly defined. This implies the identification of the class of people for whom theindex will be constructed such as industrial workers, agricultural workers, urban wageearners, etc. Further, it is also necessary to define the coverage of the class of people, i.e.,the definition of geographical location of their stay such as a city or two or more villages,etc. The selected class of people should form a homogeneous group so that weights ofvarious commodities are same for all the people.
2. Selection of Base Period: A normal period having comparative economic stability shouldbe selected as a base period in order that the consumption pattern used in the constructionof the index remain practically stable over a fairly long period.
3. Conducting Family Budget Enquiry: A family budget gives the details of expenditureincurred by the family on various items in a given period. In order to estimate theconsumption pattern, a sample survey of family budgets of the group of people, for whomthe index is to be constructed, is conducted and from this an average family budget isprepared. The goods and services that are to be included in the construction of the indexare selected from this average family budget. Efforts should be made to include as manycommodities as possible. Generally the commodities are divided into five broad groups:(i) Food, (ii) Clothing, (iii) Fuel and Lighting, (iv) House Rent and (v) Miscellaneous.
If necessary, these groups may further be divided into sub-groups. Percentage expenditureof a group is taken as its weight.
4. Obtaining Price Quotations: The next step in the construction of consumer price index isto obtain the retail price quotations of various items that are selected. The price quotationsshould be obtained from those markets from which the group of people, for whom theindex number is being constructed, normally make purchases. The quality of variousgoods and services used by the group of people should also be kept in mind while obtainingprice quotations.
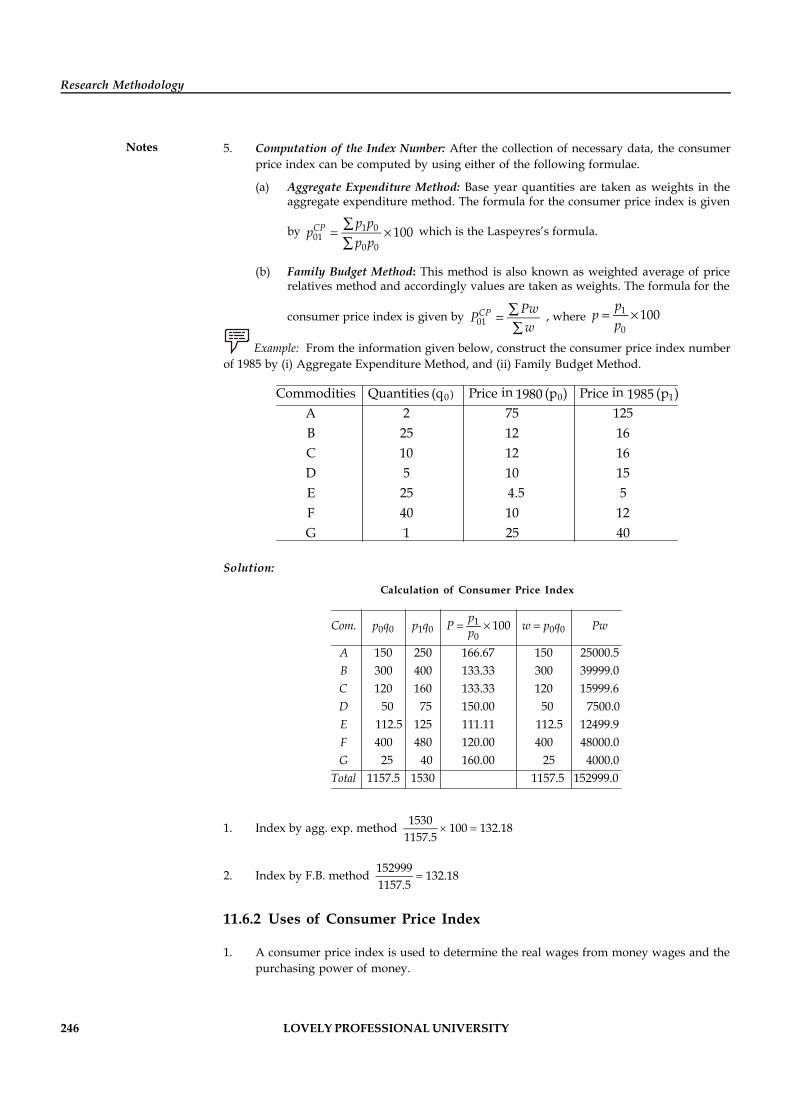
246 LOVELY PROFESSIONAL UNIVERSITY
Research Methodology
Notes 5. Computation of the Index Number: After the collection of necessary data, the consumerprice index can be computed by using either of the following formulae.
(a) Aggregate Expenditure Method: Base year quantities are taken as weights in theaggregate expenditure method. The formula for the consumer price index is given
by 1 001
0 0100CP p p
pp p
= ´åå
which is the Laspeyres’s formula.
(b) Family Budget Method: This method is also known as weighted average of pricerelatives method and accordingly values are taken as weights. The formula for the
consumer price index is given by 01CP Pw
Pw
= åå
, where 1
0100
pp
p= ´
Example: From the information given below, construct the consumer price index numberof 1985 by (i) Aggregate Expenditure Method, and (ii) Family Budget Method.
0 0 1) in inCommodities Quantities (q Price (p ) Price (p )1980 1985A 2 75 125B 25 12 16C 10 12 16D 5 10 15E 25 4.5 5F 40 10 12G 1 25 40
Solution:
Calculation of Consumer Price Index
= ´ =10 0 1 0 0 0
0. 100
150 250 166.67 150 25000.5300 400 133.33 300 39999.0120 160 133.33 120 15999.6
50 75 150.00 50 7500.0112.5 125 111.11 112.5 12499.9400 480 120.00 400 48000.0
25 40 160.00 25 4000.01157.5 15
pCom p q p q P w p q PwpABCDEFG
Total 30 1157.5 152999.0
1. Index by agg. exp. method 1530 100 132.181157.5
2. Index by F.B. method 152999 132.181157.5
11.6.2 Uses of Consumer Price Index
1. A consumer price index is used to determine the real wages from money wages and thepurchasing power of money.
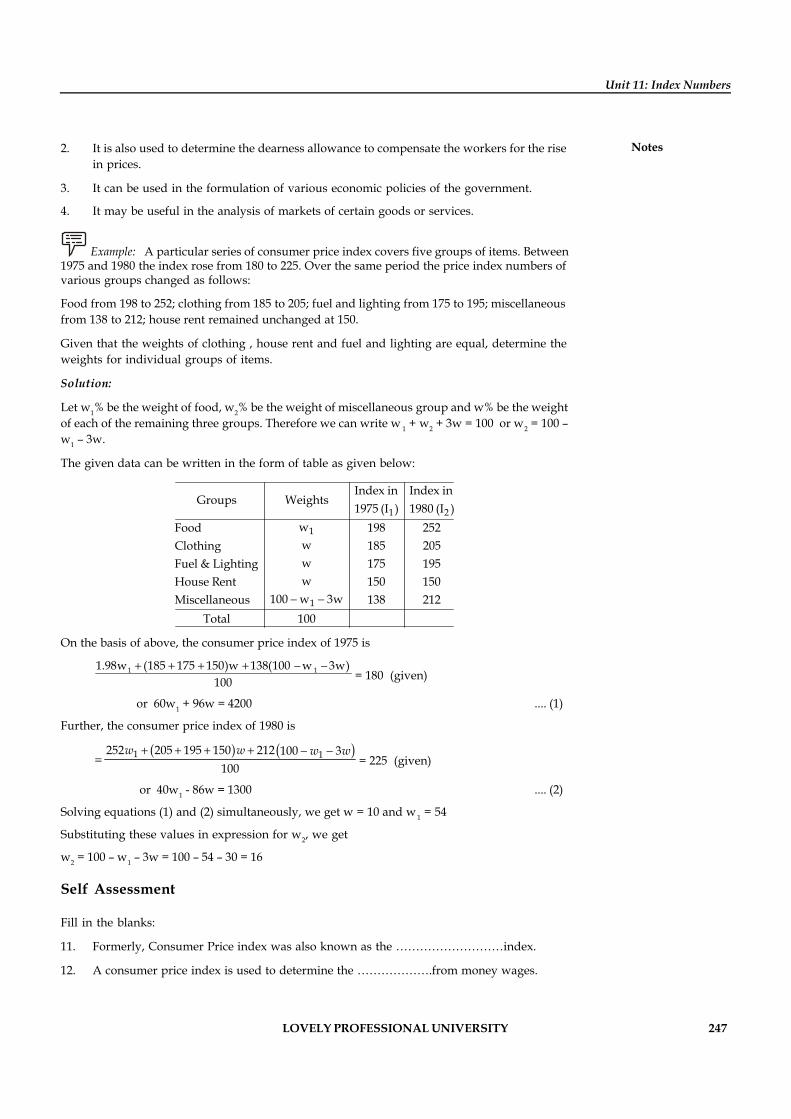
LOVELY PROFESSIONAL UNIVERSITY 247
Unit 11: Index Numbers
Notes2. It is also used to determine the dearness allowance to compensate the workers for the risein prices.
3. It can be used in the formulation of various economic policies of the government.
4. It may be useful in the analysis of markets of certain goods or services.
Example: A particular series of consumer price index covers five groups of items. Between1975 and 1980 the index rose from 180 to 225. Over the same period the price index numbers ofvarious groups changed as follows:
Food from 198 to 252; clothing from 185 to 205; fuel and lighting from 175 to 195; miscellaneousfrom 138 to 212; house rent remained unchanged at 150.
Given that the weights of clothing , house rent and fuel and lighting are equal, determine theweights for individual groups of items.
Solution:
Let w1% be the weight of food, w2% be the weight of miscellaneous group and w% be the weightof each of the remaining three groups. Therefore we can write w 1 + w2 + 3w = 100 or w2 = 100 –w1 – 3w.
The given data can be written in the form of table as given below:
- -
1 2
1
1
Index in Index inGroups Weights
1975 (I ) 1980 (I )w 198 252Foodw 185 205Clothingw 175 195Fuel & Lightingw 150 150House Rent
100 w 3w 138 212MiscellaneousTotal 100
On the basis of above, the consumer price index of 1975 is
1 11.98w (185 175 150)w 138(100 w 3w)100
+ + + + - -= 180 (given)
or 60w1 + 96w = 4200 .... (1)
Further, the consumer price index of 1980 is
( ) ( )+ + + + - -=
w w w w1 1252 205 195 150 212 100 3100 = 225 (given)
or 40w1 - 86w = 1300 .... (2)
Solving equations (1) and (2) simultaneously, we get w = 10 and w 1 = 54
Substituting these values in expression for w2, we get
w2 = 100 – w1 – 3w = 100 – 54 – 30 = 16
Self Assessment
Fill in the blanks:
11. Formerly, Consumer Price index was also known as the ………………………index.
12. A consumer price index is used to determine the ……………….from money wages.
248 LOVELY PROFESSIONAL UNIVERSITY
Research Methodology
Notes 11.7 Problems in the Construction of Index Numbers
The following are some general problems that are faced in the construction of any index number:
1. Definition of the purpose: Since it is possible to construct index numbers for a number ofpurposes and one cannot have an all purpose index, therefore, it is very essential to definethe specific purpose of its construction. For example, if we are interested in the constructionof a price index number, we must have knowledge about the purpose to be served by it,i.e., what is to be measured by it; like the cost of living of workers or the change inwholesale prices, etc. In the absence of this information, it may be difficult to carry outvarious steps in the construction of an index number. The questions like what are items tobe included, from which of the markets the price quotations are to be obtained, what willbe the weights of different items, etc., cannot be answered unless the purpose of the indexnumber construction is known. Further, an index number can be of sensitive or generalnature. In case of sensitive index, only those items are included whose variables (likeprices in case of price index) fluctuate very often; while efforts are made to include asmany items as possible when the index is of general nature. It may be pointed out that theindex numbers are specialised tools and as such are more useful and efficient when properlyused. The first step in this direction is a specific definition of the purpose of its construction.
2. Selection of the base period: Every index number is constructed with reference to a baseperiod. There are two important points that must be kept in mind while selecting the baseperiod of an index number.
(a) The base period should correspond to a period of relative economic and politicalstability, i.e., it should be a normal or representative period in some way. In certainsituations where identification of such a period is not possible, the average of certainperiods can also be taken as base.
(b) The comparison of current period with a remote base doesn’t have much relevance.In the words of Morris Hamburg, “It is desirable that the base period be not too faraway in time from the present. The further away we move from the base period thedimmer are our recollections of economic conditions prevailing at that time.Consequently, comparisons with these remote base periods tend to lose significanceand become rather tenuous in meaning”.
Another problem with a remote base period can be that certain items that were inuse in the base period are no longer in use while certain new items are in use incurrent period. In such a situation the two item bundles are no longer homogeneousand comparable. This problem is less likely to occur when fairly recent period ischosen as base.
!Caution The base period should not be too distant from the current period.
3. Selection of number and type of items: An index number of a particular group of items isin fact based on a sample of items taken from it. It is neither possible nor necessary toinclude all the items of the group in the construction of an index number. The number ofitems to be included depends largely upon the purpose of the index number.
There are no hard and fast rules that can be laid down with regard to the selection of thenumber of items, however, it must be remembered that more is the number of items themore representative will be the index number and more cumbersome will be the task ofcomputations. Therefore, it is necessary to have some sort of balance between having arepresentative index and the work of computation involved in its construction.
LOVELY PROFESSIONAL UNIVERSITY 249
Unit 11: Index Numbers
NotesThe following points should be kept in mind in selecting the type of items:
(a) The items should be representative of the tastes, habits and customs of the peoplefor whom the index is to be constructed.
(b) The selected items should be of stable quality. The standardised items should begiven preference.
(c) As far as possible, the non-tangible items like personal services, goodwill, etc.,should be excluded because it is difficult to ascertain their value.
4. Collection of data: The next important step in the construction of an index number is thecollection of data. For example, for the construction of price index, price quotations are tobe obtained. Since the prices of commodities may vary from one market to another and incertain cases from one shop to another, it is necessary to select those markets which arerepresentative in the sense that the group under consideration generally make purchasesfrom these markets. The next logical step is to select an agency through which pricequotations are to be obtained. The selected agency should be highly reliable and if necessarythe accuracy of price quotations reported by it may also be checked by appointing someother agency or agencies. Furthermore, care should always be taken to obtain pricequotations for the same quality of items.
Similar type of considerations are necessary for the collection of data for the constructionof index numbers such as quantity index, value index, unemployment index, etc.
5. Selection of a suitable average: Since the index numbers are also averages, any of the fiveaverages, viz. arithmetic mean, median, mode, geometric mean and harmonic mean canbe used in its construction. However, since in most of the situations we have to averageratios of the values in current period to that in base period, geometric mean is the mostsuitable average in the construction of index numbers. The main difficulty of using thegeometric mean is the complexities of its computations and hence, the use of arithmeticmean is more popular in spite of its being less suitable.
6. Selection of suitable weights: According to John I. Griffin, “Weighing is designed to givecomponent series an importance in proper relation to their real significance.” The basicpurpose of weighing is to enable each item to have an influence, on the index number, inproportion to its importance in the group. It is, therefore, necessary to design a system ofweighing such that true importance of the items is reflected by it. The system of weighingmay be either arbitrary or rational. Arbitrary or chance weighing implies that thestatistician is free to assign weights to different items as he thinks fit or reasonable.Rational or logical weighing, on the other hand, implies that some criterion has beenfixed for assigning weights. Two types of weights are commonly used in the constructionof a price index number: (i) physical quantities and (ii) money values. These weights canbe quantities (or values) produced or consumed or sold in base or current or in any otherperiod.
Another problem, to be tackled, with regard to system of weights is whether weightsshould be fixed or fluctuating. When relative importance of various items change indifferent periods, it is desirable to have fluctuating system of weights to get better results.
Self Assessment
Fill in the blanks:
13. Every index number is constructed with reference to a …………..period.
14. The basic purpose of …………..is to enable each item to have an influence, on the indexnumber, in proportion to its importance in the group.
250 LOVELY PROFESSIONAL UNIVERSITY
Research Methodology
Notes 11.8 Limitations of Index Numbers
Despite the fact that index numbers are very useful for the measurement of relative changes,these suffer from the following limitations:
1. The computation of an index number is based on the data obtained from a sample, whichmay not be a true representative of the universe.
2. The composition of the bundle of commodities may be for different years. This cannot betaken into account by the fixed base method. Although this difficulty can be overcome bythe use of chain base index numbers, but their calculations are quite cumbersome.
3. An index number doesn’t take into account the quality of the items. Since a superior itemgenerally has a higher price and the increase in index may be due to an improvement inthe quality of the items and not due to rise of prices.
4. Index numbers are specialised averages and as such these also suffer from all the limitationsof an average.
5. An index number can be computed by using a number of formulae and different formulaewill give different results. Unless a proper method is used, the results are likely to beinaccurate and misleading.
6. By the choice of a wrong base period or weighing system, the results of the index numbercan be manipulated and, thus, are likely to be misused.
Self Assessment
Fill in the blanks:
15. An index number doesn’t take into account the ……………..of the items.
16. Index number computed by using a number of formulae will give …………….results
11.9 Summary
An index number is a device for comparing the general level of magnitude of a group ofdistinct, but related, variables in two or more situations
Simple Average of Price Relatives Index
1
001
ppP
n=å
(using A.M.)
1
001
log 100ppP Antilogn
é ù´ê úê ú=ê úê úë û
å
(using G.M.)
Simple Aggregative Index 101
0100pP
p= ´åå
Weighted Average of Price relatives Index
01PwPw
= åå (using weighted A.M.)
LOVELY PROFESSIONAL UNIVERSITY 251
Unit 11: Index Numbers
Notes
01
logw PP Antilog
w
(using weighted G.M.)
Here 1
0
100pPp
and w denotes values (weights)
Weighted Aggregative Index Numbers
(a) Laspeyres's Index 1 001
0 0
100La p qP
p q
(b) Paasche's Index 1 101
0 1
100Pa p qP
p q
(c) Fisher's Ideal Index 1 0 1 101
0 0 0 1
100Fi p q p qP
p q p q
(d) Dorbish and Bowley's Index P01DB 1 0 1 1
0 0 0 1
1 1002
p q p qp q p q
(e) Marshall and Edgeworth Index 1 0 1 101
0 0 0 0
100ME p q p qP
p q p q
(f) Walsh's Index 1 0 101
0 0 1
100Wa p q qP
p q q
(g) Kelly's Index 101
0
100Ke p qP
p q
Real Wage = 100. . .
Money WageC P I
Output at Current PricesOutput at Constant Prices 100
Price Index
1Purchasing Power of Money 100
Price Index
11.10 Keywords
Base Year: The year from which comparisons are made is called the base year. It is commonlydenoted by writing ‘0’ as a subscript of the variable.
Consumer Price: It is the price at which the ultimate consumer purchases his goods and servicesfrom the retailer.
Current Year: The year under consideration for which the comparisons are to be computed iscalled the current year. It is commonly denoted by writing ‘1’ as a subscript of the variable.
Index Number: An index number is a statistical measure used to compare the average level ofmagnitude of a group of distinct but related variables in two or more situations.
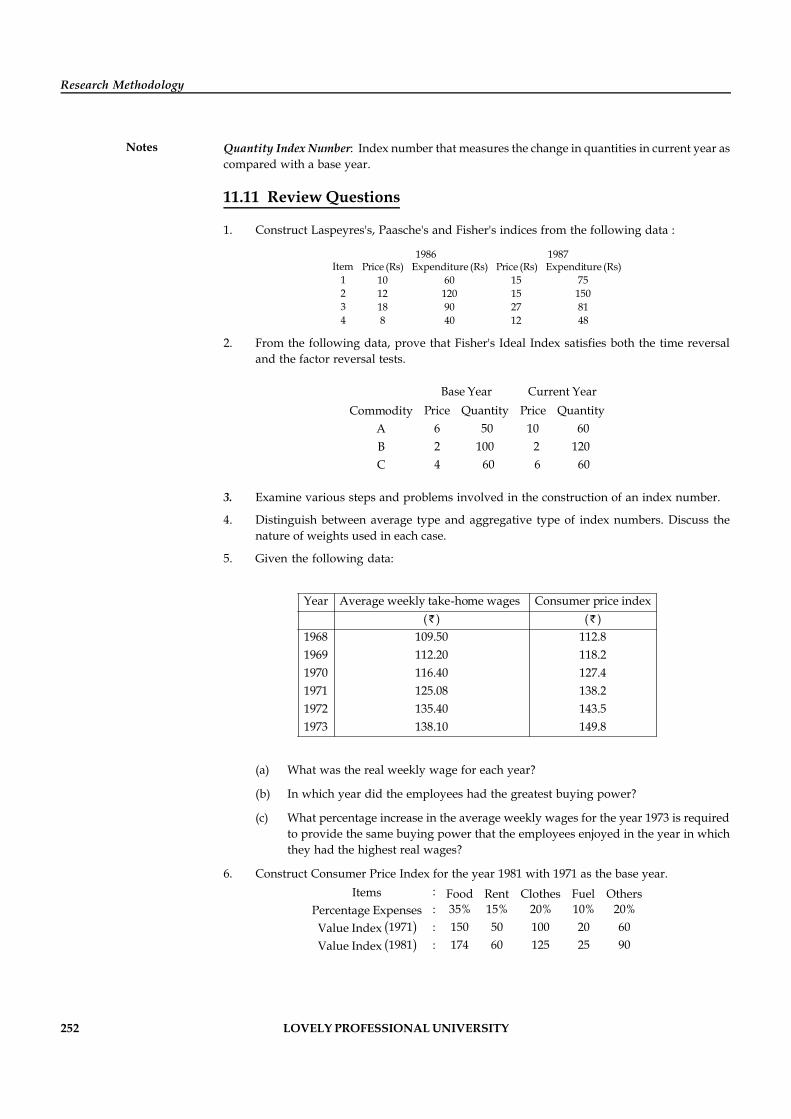
252 LOVELY PROFESSIONAL UNIVERSITY
Research Methodology
Notes Quantity Index Number: Index number that measures the change in quantities in current year ascompared with a base year.
11.11 Review Questions
1. Construct Laspeyres's, Paasche's and Fisher's indices from the following data :
1986 1987Item Price (Rs) Expenditure (Rs) Price (Rs) Expenditure (Rs)
1 10 60 15 752 12 120 15 1503 18 90 27 814 8 40 12 48
2. From the following data, prove that Fisher's Ideal Index satisfies both the time reversaland the factor reversal tests.
Base Year Current YearPrice Quantity Price QuantityCommodity
6 50 10 60A2 100 2 120B4 60 6 60C
3. Examine various steps and problems involved in the construction of an index number.
4. Distinguish between average type and aggregative type of index numbers. Discuss thenature of weights used in each case.
5. Given the following data:
Year Average weekly take-home wages Consumer price index( ) ( )
1968 109.50 112.81969 112.20 118.21970 116.40 127.41971 125.08 138.21972 135.40 143.51973 138.10 149.8
(a) What was the real weekly wage for each year?
(b) In which year did the employees had the greatest buying power?
(c) What percentage increase in the average weekly wages for the year 1973 is requiredto provide the same buying power that the employees enjoyed in the year in whichthey had the highest real wages?
6. Construct Consumer Price Index for the year 1981 with 1971 as the base year.
( )( )
:Items Food Rent Clothes Fuel Others: 35% 15% 20% 10% 20%Percentage Expenses
1971 : 150 50 100 20 60Value Index1981 : 174 60 125 25 90Value Index
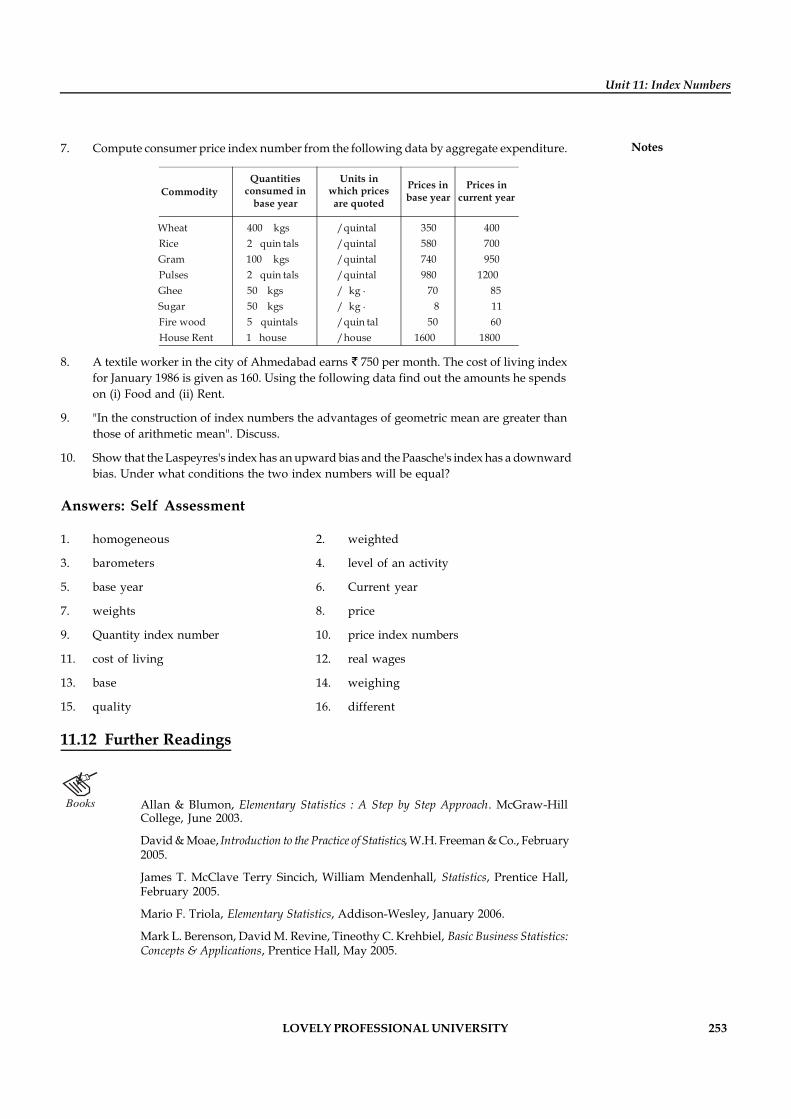
LOVELY PROFESSIONAL UNIVERSITY 253
Unit 11: Index Numbers
Notes7. Compute consumer price index number from the following data by aggregate expenditure.
CommodityQuantities
consumed inbase year
Units inwhich pricesare quoted
Prices inbase year
Prices incurrent year
WheatRiceGramPulsesGheeSugarFire woodHouse Rent
400 kgs2 quin tals100 kgs2 quin tals50 kgs50 kgs5 quintals1 house
/quintal/quintal/quintal/quintal/ kg .
/ kg .
/quin tal/house
350580740980
708
501600
400700950
1200851160
1800
8. A textile worker in the city of Ahmedabad earns 750 per month. The cost of living indexfor January 1986 is given as 160. Using the following data find out the amounts he spendson (i) Food and (ii) Rent.
9. "In the construction of index numbers the advantages of geometric mean are greater thanthose of arithmetic mean". Discuss.
10. Show that the Laspeyres's index has an upward bias and the Paasche's index has a downwardbias. Under what conditions the two index numbers will be equal?
Answers: Self Assessment
1. homogeneous 2. weighted
3. barometers 4. level of an activity
5. base year 6. Current year
7. weights 8. price
9. Quantity index number 10. price index numbers
11. cost of living 12. real wages
13. base 14. weighing
15. quality 16. different
11.12 Further Readings
Books Allan & Blumon, Elementary Statistics : A Step by Step Approach. McGraw-HillCollege, June 2003.
David & Moae, Introduction to the Practice of Statistics, W.H. Freeman & Co., February2005.
James T. McClave Terry Sincich, William Mendenhall, Statistics, Prentice Hall,February 2005.
Mario F. Triola, Elementary Statistics, Addison-Wesley, January 2006.
Mark L. Berenson, David M. Revine, Tineothy C. Krehbiel, Basic Business Statistics:Concepts & Applications, Prentice Hall, May 2005.
254 LOVELY PROFESSIONAL UNIVERSITY
Research Methodology
Notes Unit 12: Hypothesis Testing
CONTENTS
Objectives
Introduction
12.1 Steps Involved in Hypothesis Testing
12.1.1 Formulate the Hypothesis
12.1.2 Significance Level
12.2 Errors in Hypothesis Testing
12.3 Parametric Tests
12.3.1 One Sample Test
12.3.2 Two Sample Test
12.4 Chi-square Test
12.5 ANOVA
12.5.1 One-way ANOVA
12.5.2 Two-way ANOVA
12.6 Non-parametric Test
12.6.1 One Sample Tests
12.6.2 Two Sample Tests
12.6.3 K Sample Test
12.7 Summary
12.8 Keywords
12.9 Review Questions
12.10 Further Readings
Objectives
After studying this unit, you will be able to:
Identify the Steps involved in Hypothesis Testing
Resolve the errors in Hypothesis Testing
Describe the One Sample and Two Sample Parametric Tests
Explain the Chi-square Test
Recognize the conception of ANOVA
Introduction
A statistical hypothesis test is a method of making statistical decisions using experimental data.In statistics, a result is called statistically significant if it is unlikely to have occurred by chance.
LOVELY PROFESSIONAL UNIVERSITY 255
Unit 12: Hypothesis Testing
NotesThe phrase “test of significance” was coined by Ronald Fisher: “Critical tests of this kind may becalled tests of significance, and when such tests are available we may discover whether a secondsample is or is not significantly different from the first.”
Hypothesis testing is sometimes called confirmatory data analysis, in contrast to exploratorydata analysis. In frequency probability, these decisions are almost always made using null-hypothesis tests; that is, ones that answer the question. Assuming that the null hypothesis istrue, what is the probability of observing a value for the test statistic that is at least as extremeas the value that was actually observed? One use of hypothesis testing is deciding whetherexperimental results contain enough information to cast doubt on conventional wisdom.
12.1 Steps Involved in Hypothesis Testing
1. Formulate the null hypothesis, with H0 and HA, the alternate hypothesis. According to thegiven problem, H0 represents the value of some parameter of population.
2. Select on appropriate test assuming H0 to be true.
3. Calculate the value.
4. Select the level of significance other at 1% or 5%.
5. Find the critical region.
6. If the calculated value lies within the critical region, then reject H0.
7. State the conclusion in writing.
12.1.1 Formulate the Hypothesis
The normal approach is to set two hypotheses instead of one, in such a way, that if one hypothesisis true, the other is false. Alternatively, if one hypothesis is false or rejected, then the other is trueor accepted. These two hypotheses are:
1. Null hypothesis
2. Alternate hypothesis
Let us assume that the mean of the population is m0 and the mean of the sample is x. Since wehave assumed that the population has a mean of m0, this is our null hypothesis. We write this asH0m = m0, where H0 is the null hypothesis. Alternate hypothesis is HA = m. The rejection of nullhypothesis will show that the mean of the population is not m0. This implies that alternatehypothesis is accepted.
12.1.2 Significance Level
Having formulated the hypothesis, the next step is its validity at a certain level of significance.The confidence with which a null hypothesis is accepted or rejected depends upon thesignificance level. A significance level of say 5% means that the risk of making a wrongdecision is 5%. The researcher is likely to be wrong in accepting false hypothesis or rejectinga true hypothesis by 5 out of 100 occasions. A significance level of say 1% means, that theresearcher is running the risk of being wrong in accepting or rejecting the hypothesis is one ofevery 100 occasions. Therefore, a 1% significance level provides greater confidence to thedecision than 5% significance level.
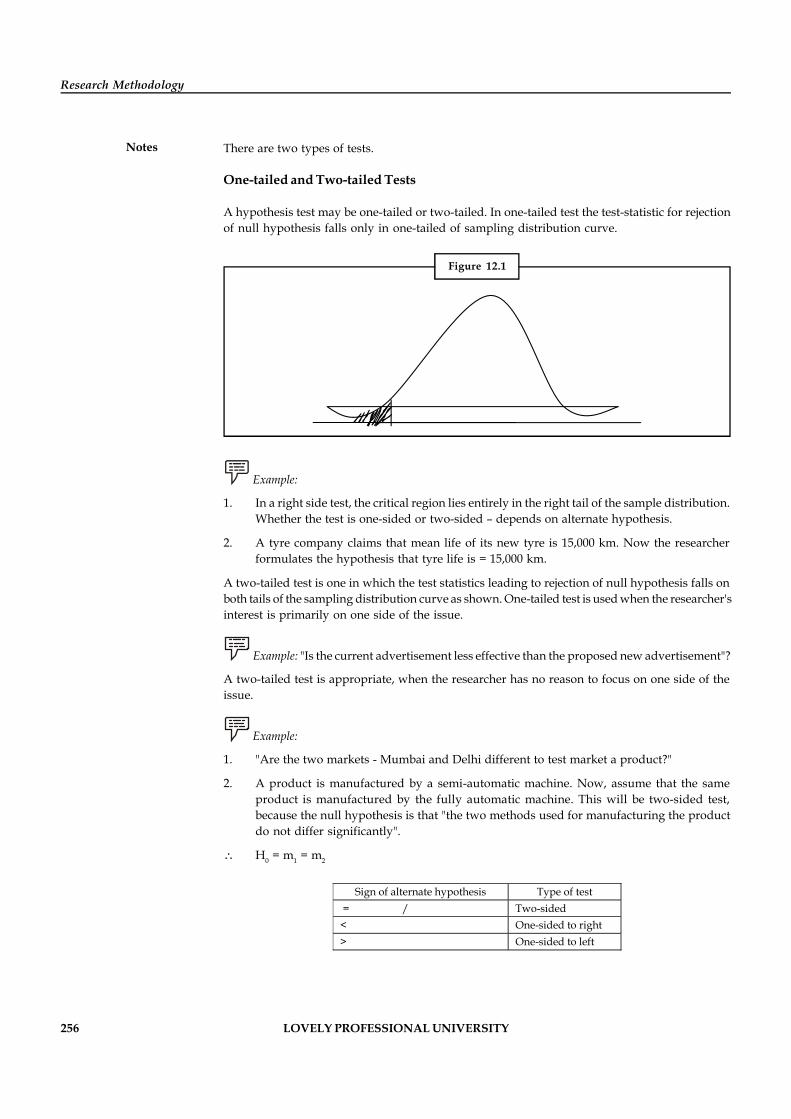
256 LOVELY PROFESSIONAL UNIVERSITY
Research Methodology
Notes There are two types of tests.
One-tailed and Two-tailed Tests
A hypothesis test may be one-tailed or two-tailed. In one-tailed test the test-statistic for rejectionof null hypothesis falls only in one-tailed of sampling distribution curve.
Figure 12.1
Example:
1. In a right side test, the critical region lies entirely in the right tail of the sample distribution.Whether the test is one-sided or two-sided – depends on alternate hypothesis.
2. A tyre company claims that mean life of its new tyre is 15,000 km. Now the researcherformulates the hypothesis that tyre life is = 15,000 km.
A two-tailed test is one in which the test statistics leading to rejection of null hypothesis falls onboth tails of the sampling distribution curve as shown. One-tailed test is used when the researcher'sinterest is primarily on one side of the issue.
Example: "Is the current advertisement less effective than the proposed new advertisement"?
A two-tailed test is appropriate, when the researcher has no reason to focus on one side of theissue.
Example:
1. "Are the two markets - Mumbai and Delhi different to test market a product?"
2. A product is manufactured by a semi-automatic machine. Now, assume that the sameproduct is manufactured by the fully automatic machine. This will be two-sided test,because the null hypothesis is that "the two methods used for manufacturing the productdo not differ significantly".
H0 = m1 = m2
Sign of alternate hypothesis Type of test = / Two-sided < One-sided to right > One-sided to left
LOVELY PROFESSIONAL UNIVERSITY 257
Unit 12: Hypothesis Testing
NotesDegree of Freedom
It tells the researcher the number of elements that can be chosen freely.
Example: a + b/2 = 5. fix a = 3, b has to be 7.
Therefore, the degree of freedom is 1.
Select Test Criteria
If the hypothesis pertains to a larger sample (30 or more), the Z-test is used. When the sample issmall (less than 30), the T-test is used.
Compute
Carry out computation.
Make Decisions
Accepting or rejecting of the null hypothesis depends on whether the computed value falls in theregion of rejection at a given level of significance.
Task Discuss when would you prefer two tailed test to one tailed test.
Self Assessment
Fill in the blanks:
1. Hypothesis testing is sometimes called ............................. analysis.
2. The confidence with which a null hypothesis is accepted or rejected depends upon the.............................
3. The rejection of null hypothesis means that the ............................. hypothesis is accepted.
12.2 Errors in Hypothesis Testing
There are two types of errors:
1. Hypothesis is rejected when it is true.
2. Hypothesis is not rejected when it is false.
(1) is called Type 1 error (a), (2) is called Type 2 error (b). When a = 0.10 it means that truehypothesis will be accepted in 90 out of 100 occasions. Thus, there is a risk of rejecting a truehypothesis in 10 out of every 100 occasions. To reduce the risk, use a = 0.01 which implies that weare prepared to take a 1% risk i.e., the probability of rejecting a true hypothesis is 1%. It is alsopossible that in hypothesis testing, we may commit Type 2 error (b) i.e., accepting a null hypothesiswhich is false.
Notes The only way to reduce Type 1 and Type 2 error is by increasing the sample size.
258 LOVELY PROFESSIONAL UNIVERSITY
Research Methodology
Notes Example of Type 1 and Type 2 error
Type 1 and Type 2 error is presented as follows. Suppose a marketing company has 2 distributors(retailers) with varying capabilities. On the basis of capabilities, the company has grouped theminto two categories (1) Competent retailer (2) Incompetent retailer. Thus R1 is a competentretailer and R2 is an incompetent retailer. The firm wishes to award a performance bonus (as apart of trade promotion) to encourage good retailership. Assume that two actions A1 and A2would represent whether the bonus or trade incentive is given and not given. This is shown asfollows:
Action (R1) Competent retailer (R2) Incompetent retailer
A 1 performance bonus is awarded Correct decision Incorrect decision error ()
A 2 performance bonus is not awarded Incorrect decision error () Correct decision When the firm has failed to reward a competent retailer, it has committed type-2 error. On the
other hand, when it was rewarded to an incompetent retailer, it has committed type-1 Error.
Self Assessment
Fill in the blanks:
4. Hypothesis is rejected when it is true is called ……………error.
5. Hypothesis is not rejected when it is false is called …………..error
12.3 Parametric Tests
Parametric tests have following advantages:
1. Parametric tests are more powerful. The data in this test is derived from interval and ratiomeasurement.
2. In parametric tests, it is assumed that the data follows normal distributions. Examples ofparametric tests are
(a) Z-Test,
(b) T-Test and
(c) F-Test.
3. Observations must be independent i.e., selection of any one item should not affect thechances of selecting any others be included in the sample.
Did u know? What is univariate/bivariate data analysis?
Univariate
If we wish to analyse one variable at a time, this is called univariate analysis. Example:Effect of sales on pricing. Here, price is an independent variable and sales is a dependentvariable. Change the price and measure the sales.
Bivariate
The relationship of two variables at a time is examined by means of bivariate data analysis.
If one is interested in a problem of detecting whether a parameter has either increased ordecreased, a two-sided test is appropriate.
LOVELY PROFESSIONAL UNIVERSITY 259
Unit 12: Hypothesis Testing
NotesParametric tests are of following types:
12.3.1 One Sample Test
One sample tests can be categorized into 2 categories.
z Test
1. When sample size is > 30
P1 = Proportion in sample 1
P2 = Proportion in sample 2
Example: You are working as a purchase manager for a company. The followinginformation has been supplied by two scooter tyre manufacturers.
Company A Company B
Mean life (in km) 13000 12000
S.D (in km) 340 388
Sample size 100 100
In the above, the sample size is 100, hence a Z-test may be used.
2. Testing the hypothesis about difference between two means: This can be used when twopopulation means are given and null hypothesis is Ho : P1 = P2.
Example: In a city during the year 2000, 20% of households indicated that they read Feminamagazine. Three years later, the publisher had reasons to believe that circulation has gone up. Asurvey was conducted to confirm this. A sample of 1,000 respondents were contacted and it wasfound 210 respondents confirmed that they subscribe to the periodical 'Femina'. From the above,can we conclude that there is a significant increase in the circulation of 'Femina'?
Solution:
We will set up null hypothesis and alternate hypothesis as follows:
Null Hypothesis is H0 × m = 15%
Alternate Hypothesis is HA × m > 15%
This is a one-tailed (right) test.
Z = ( )
210 – 0.2010000.20 1 0.20
1000-
Z =0.21 – 0.20
0.2 0.81000´
=0.01 –
0.161000
m
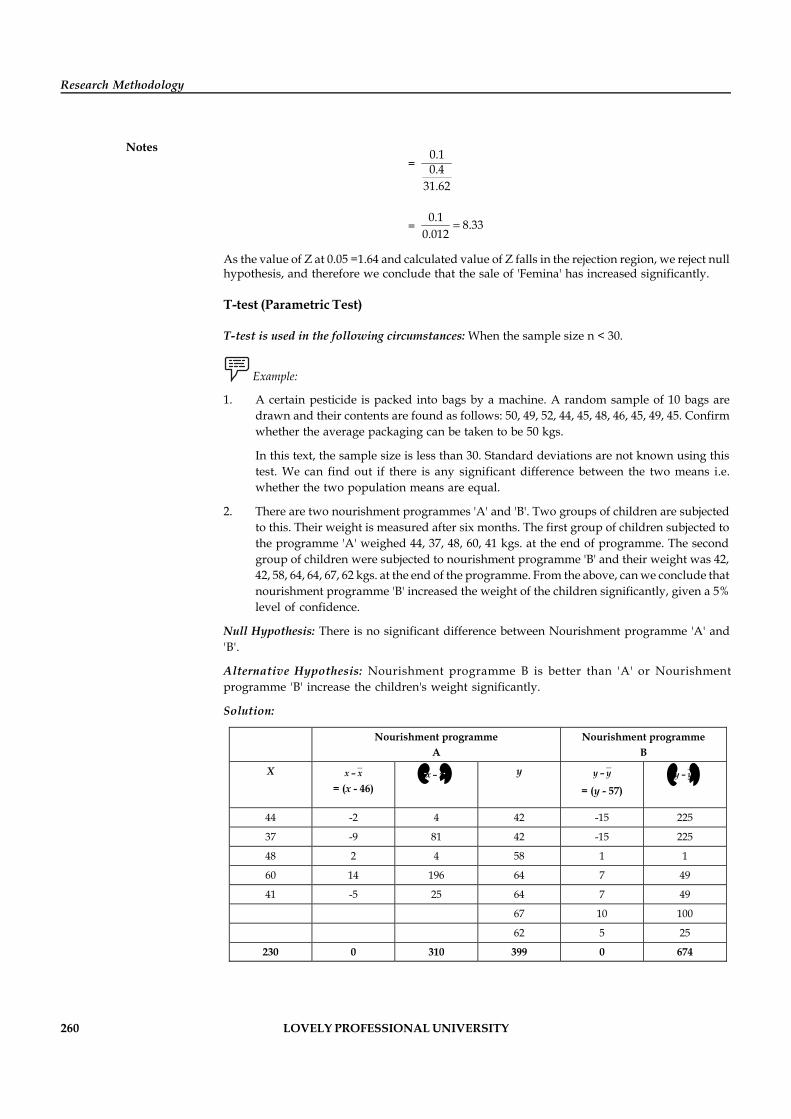
260 LOVELY PROFESSIONAL UNIVERSITY
Research Methodology
Notes=
0.10.4
31.62
=0.1 8.33
0.012=
As the value of Z at 0.05 =1.64 and calculated value of Z falls in the rejection region, we reject nullhypothesis, and therefore we conclude that the sale of 'Femina' has increased significantly.
T-test (Parametric Test)
T-test is used in the following circumstances: When the sample size n < 30.
Example:
1. A certain pesticide is packed into bags by a machine. A random sample of 10 bags aredrawn and their contents are found as follows: 50, 49, 52, 44, 45, 48, 46, 45, 49, 45. Confirmwhether the average packaging can be taken to be 50 kgs.
In this text, the sample size is less than 30. Standard deviations are not known using thistest. We can find out if there is any significant difference between the two means i.e.whether the two population means are equal.
2. There are two nourishment programmes 'A' and 'B'. Two groups of children are subjectedto this. Their weight is measured after six months. The first group of children subjected tothe programme 'A' weighed 44, 37, 48, 60, 41 kgs. at the end of programme. The secondgroup of children were subjected to nourishment programme 'B' and their weight was 42,42, 58, 64, 64, 67, 62 kgs. at the end of the programme. From the above, can we conclude thatnourishment programme 'B' increased the weight of the children significantly, given a 5%level of confidence.
Null Hypothesis: There is no significant difference between Nourishment programme 'A' and'B'.
Alternative Hypothesis: Nourishment programme B is better than 'A' or Nourishmentprogramme 'B' increase the children's weight significantly.
Solution:
Nourishment programme A
Nourishment programme B
X –x x = (x - 46)
( )2–x x y –y y
= (y - 57) ( )2
–y y
44 -2 4 42 -15 225
37 -9 81 42 -15 225
48 2 4 58 1 1
60 14 196 64 7 49
41 -5 25 64 7 49
67 10 100
62 5 25
230 0 310 399 0 674
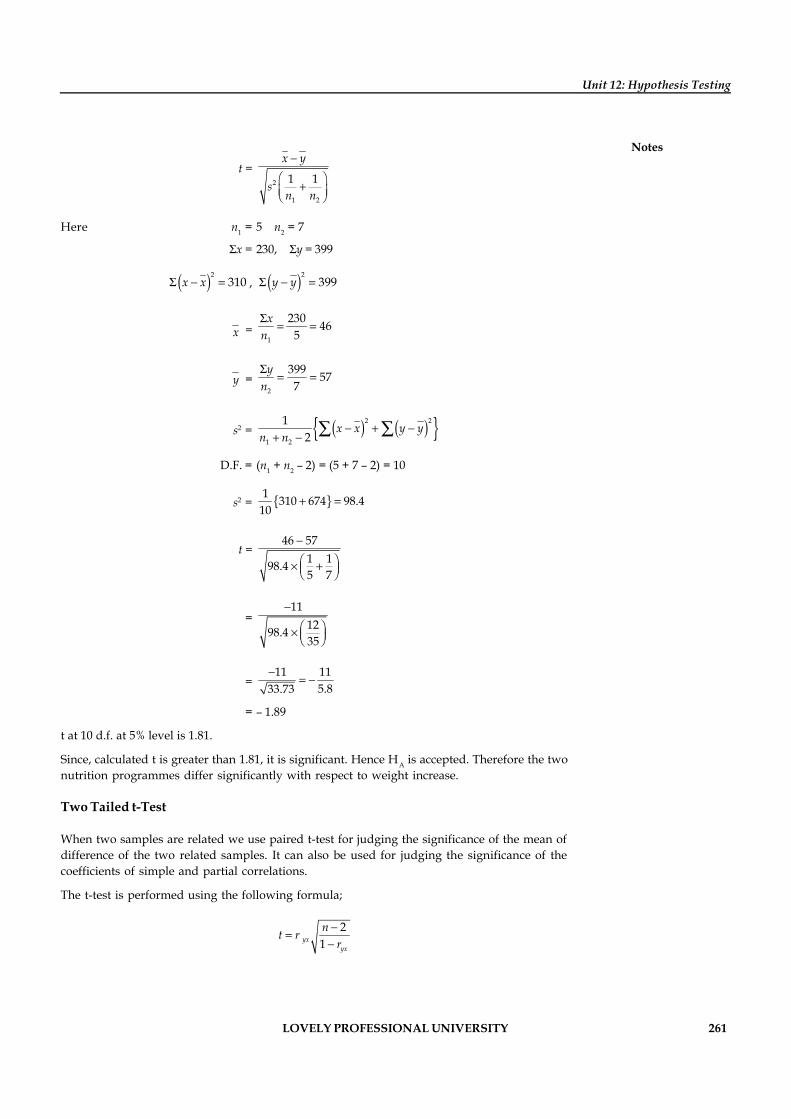
LOVELY PROFESSIONAL UNIVERSITY 261
Unit 12: Hypothesis Testing
Notes
t =2
1 2
1 1
x y
sn n
-
æ ö+ç ÷è ø
Here n1 = 5 n2 = 7
x = 230, y = 399
( )2310x x - = , ( )2
399y y - =
x =1
230 465
xn
= =
y =2
399 577
yn
= =
s2 = ( ) ( ){ }2 2
1 2
12
x x y yn n
- + -+ - å å
D.F. = (n1 + n2 – 2) = (5 + 7 – 2) = 10
s2 = { }1 310 674 98.410
+ =
t =46 57
1 198.45 7
-
æ ö´ +ç ÷è ø
=11
1298.435
-
æ ö´ ç ÷è ø
=11 11
5.833.73-
= -
= – 1.89
t at 10 d.f. at 5% level is 1.81.
Since, calculated t is greater than 1.81, it is significant. Hence HA is accepted. Therefore the twonutrition programmes differ significantly with respect to weight increase.
Two Tailed t-Test
When two samples are related we use paired t-test for judging the significance of the mean ofdifference of the two related samples. It can also be used for judging the significance of thecoefficients of simple and partial correlations.
The t-test is performed using the following formula;
21yx
yx
nt rr-
=-
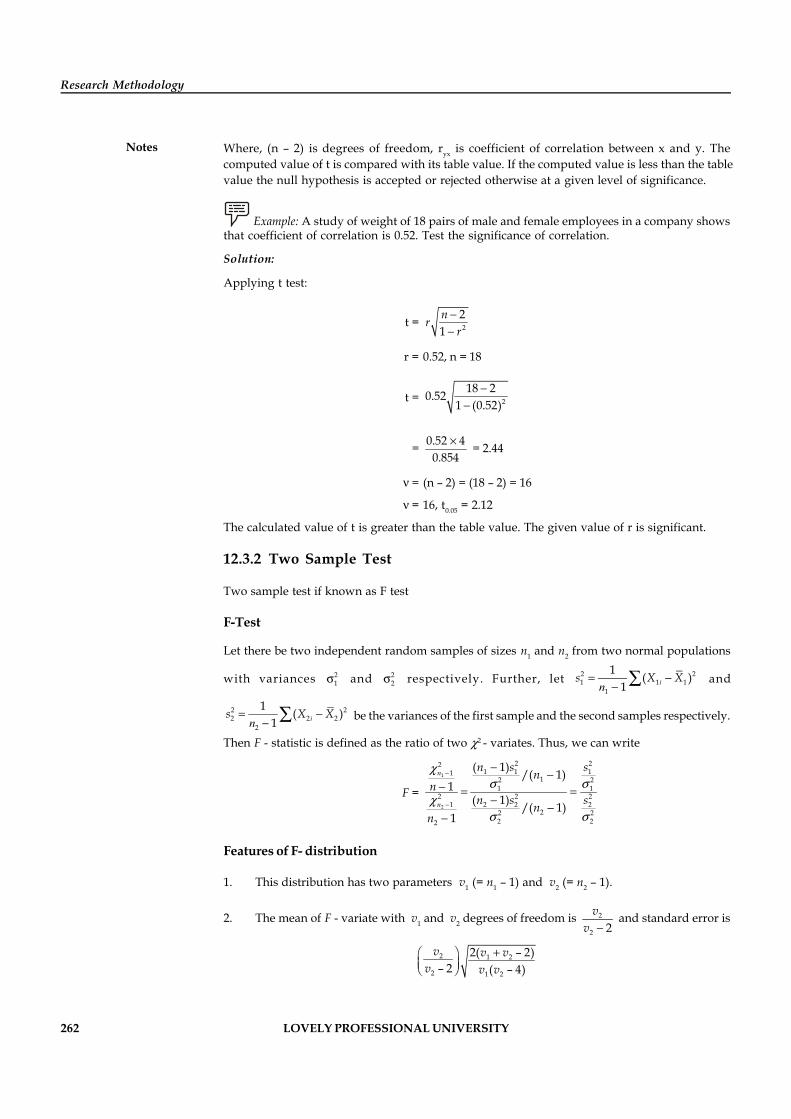
262 LOVELY PROFESSIONAL UNIVERSITY
Research Methodology
Notes Where, (n – 2) is degrees of freedom, ryx is coefficient of correlation between x and y. Thecomputed value of t is compared with its table value. If the computed value is less than the tablevalue the null hypothesis is accepted or rejected otherwise at a given level of significance.
Example: A study of weight of 18 pairs of male and female employees in a company showsthat coefficient of correlation is 0.52. Test the significance of correlation.
Solution:
Applying t test:
t = 2
21nr
r--
r = 0.52, n = 18
t = 2
18 20.521 (0.52)
--
= 0.52 40.854
´ = 2.44
= (n – 2) = (18 – 2) = 16
= 16, t0.05 = 2.12
The calculated value of t is greater than the table value. The given value of r is significant.
12.3.2 Two Sample Test
Two sample test if known as F test
F-Test
Let there be two independent random samples of sizes n1 and n2 from two normal populations
with variances 21s and 2
2s respectively. Further, let 2 21 1 1
1
1 ( )1
s X X= -- å i
n and
2 22 2 2
2
1 ( )1
s X X= -- å i
n be the variances of the first sample and the second samples respectively.
Then F - statistic is defined as the ratio of two 2 - variates. Thus, we can write
F =1
2
2 221 1 11
12 21 1
2 2 21 2 2 2
22 22 22
( 1) /( 1)1
( 1) /( 1)1
n
n
n s snn
n s snn
s s
s s
-
-
- -- = =
- --
Features of F- distribution
1. This distribution has two parameters v1 (= n1 – 1) and v2 (= n2 – 1).
2. The mean of F - variate with v1 and v2 degrees of freedom is 2
2 2v
v - and standard error is
2 1 2
2 1 2
2( – 2)– 2 ( – 4)
v v vv v v
+æ öç ÷è ø
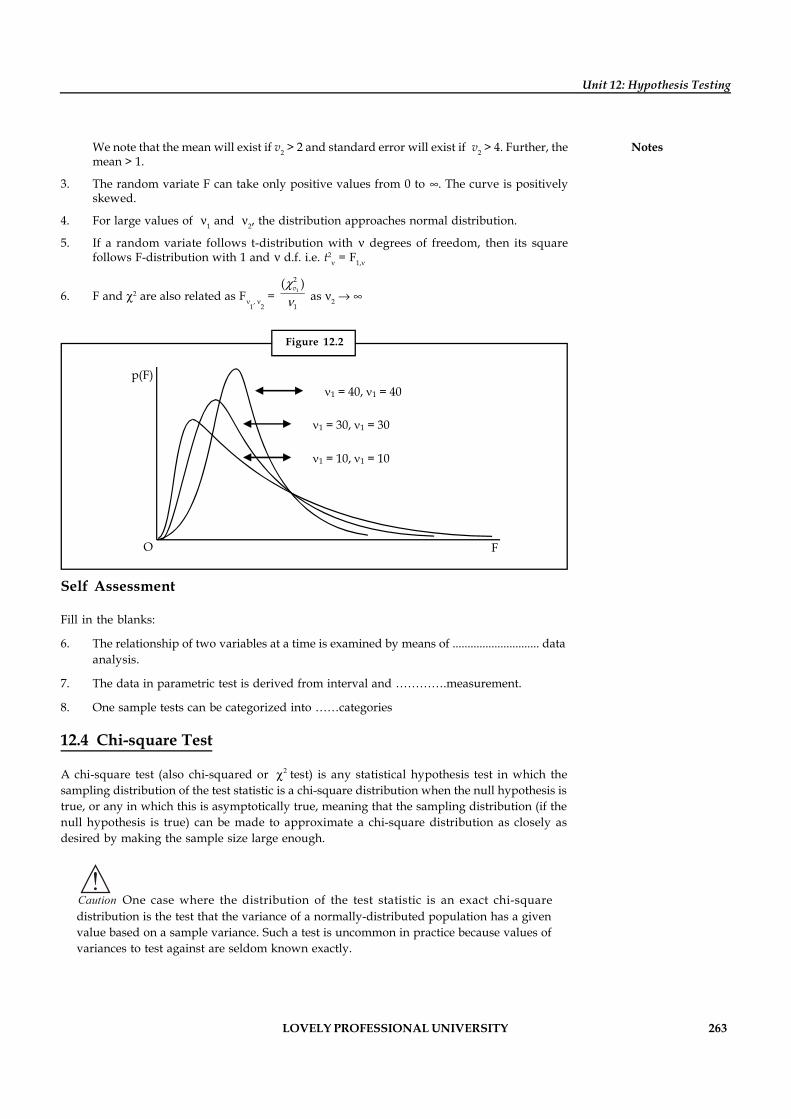
LOVELY PROFESSIONAL UNIVERSITY 263
Unit 12: Hypothesis Testing
NotesWe note that the mean will exist if v2 > 2 and standard error will exist if v2 > 4. Further, themean > 1.
3. The random variate F can take only positive values from 0 to . The curve is positivelyskewed.
4. For large values of 1 and 2, the distribution approaches normal distribution.
5. If a random variate follows t-distribution with degrees of freedom, then its squarefollows F-distribution with 1 and d.f. i.e. t2
= F1,
6. F and 2 are also related as F1
, 2 = 1
2
1
( )v as 2
Figure 12.2
1 = 40, 1 = 40
1 = 30, 1 = 30
1 = 10, 1 = 10
p(F)
O F
Self Assessment
Fill in the blanks:
6. The relationship of two variables at a time is examined by means of ............................. dataanalysis.
7. The data in parametric test is derived from interval and ………….measurement.
8. One sample tests can be categorized into ……categories
12.4 Chi-square Test
A chi-square test (also chi-squared or 2 test) is any statistical hypothesis test in which thesampling distribution of the test statistic is a chi-square distribution when the null hypothesis istrue, or any in which this is asymptotically true, meaning that the sampling distribution (if thenull hypothesis is true) can be made to approximate a chi-square distribution as closely asdesired by making the sample size large enough.
!Caution One case where the distribution of the test statistic is an exact chi-squaredistribution is the test that the variance of a normally-distributed population has a givenvalue based on a sample variance. Such a test is uncommon in practice because values ofvariances to test against are seldom known exactly.
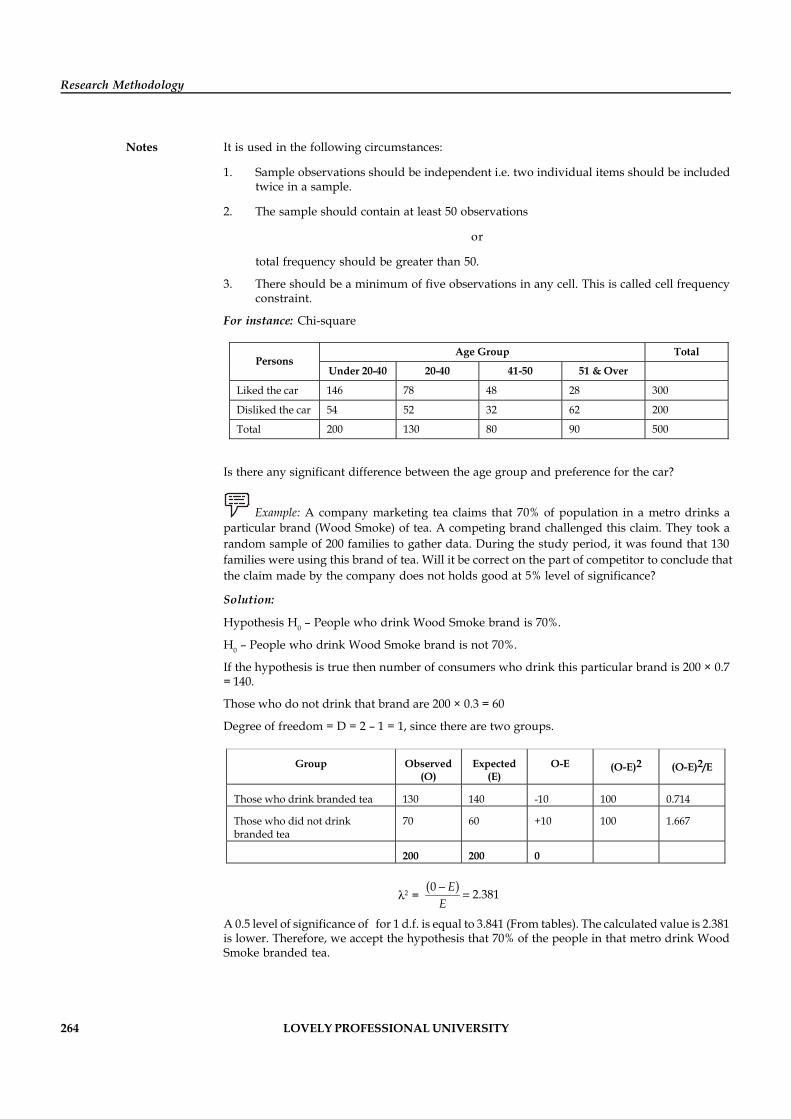
264 LOVELY PROFESSIONAL UNIVERSITY
Research Methodology
Notes It is used in the following circumstances:
1. Sample observations should be independent i.e. two individual items should be includedtwice in a sample.
2. The sample should contain at least 50 observations
or
total frequency should be greater than 50.
3. There should be a minimum of five observations in any cell. This is called cell frequencyconstraint.
For instance: Chi-square
Age Group Total Persons
Under 20-40 20-40 41-50 51 & Over
Liked the car 146 78 48 28 300
Disliked the car 54 52 32 62 200
Total 200 130 80 90 500
Is there any significant difference between the age group and preference for the car?
Example: A company marketing tea claims that 70% of population in a metro drinks aparticular brand (Wood Smoke) of tea. A competing brand challenged this claim. They took arandom sample of 200 families to gather data. During the study period, it was found that 130families were using this brand of tea. Will it be correct on the part of competitor to conclude thatthe claim made by the company does not holds good at 5% level of significance?
Solution:
Hypothesis H0 – People who drink Wood Smoke brand is 70%.
H0 – People who drink Wood Smoke brand is not 70%.
If the hypothesis is true then number of consumers who drink this particular brand is 200 × 0.7= 140.
Those who do not drink that brand are 200 × 0.3 = 60
Degree of freedom = D = 2 – 1 = 1, since there are two groups.
Group Observed (O)
Expected (E)
O-E (O-E)2 (O-E)2/E
Those who drink branded tea 130 140 -10 100 0.714
Those who did not drink branded tea
70 60 +10 100 1.667
200 200 0
2 =( )0 2.381E
E-
=
A 0.5 level of significance of for 1 d.f. is equal to 3.841 (From tables). The calculated value is 2.381is lower. Therefore, we accept the hypothesis that 70% of the people in that metro drink WoodSmoke branded tea.
LOVELY PROFESSIONAL UNIVERSITY 265
Unit 12: Hypothesis Testing
NotesSelf Assessment
Fill in the blanks:
9. A chi-square test is used when sample observations should be ………………
10. For applying chi-square test , sample should contain at least ……… observations
12.5 ANOVA
ANOVA is a statistical technique. It is used to test the equality of three or more sample means.Based on the means, inference is drawn whether samples belongs to same population or not.
Notes Conditions for using ANOVA
1. Data should be quantitative in nature.
2. Data normally distributed.
3. Samples drawn from a population follow random variation.
ANOVA can be discussed in two parts:
1. One-way classification
2. Two and three-way classification.
12.5.1 One-way ANOVA
Following are the steps followed in ANOVA:
1. Calculate the variance between samples.
2. Calculate the variance within samples.
3. Calculate F ratio using the formula.
F = Variance between the samples/Variance within the sample
4. Compare the value of F obtained above in (3) with the critical value of F such as 5% levelof significance for the applicable degree of freedom.
5. When the calculated value of F is less than the table value of F, the difference in samplemeans is not significant and a null hypothesis is accepted. On the other hand, when thecalculated value of F is more than the critical value of F, the difference in sample means isconsidered as significant and the null hypothesis is rejected.
Example: ANOVA is useful.
1. To compare the mileage achieved by different brands of automotive fuel.
2. Compare the first year earnings of graduates of half a dozen top business schools.
Application in Market Research
Consider the following pricing experiment. Three prices are considered for a new toffee boxintroduced by Nutrine company. Price of three varieties of toffee boxes are 39, 44 and
49. The idea is to determine the influence of price levels on sales. Five supermarkets areselected to exhibit these toffee boxes. The sales are as follows:
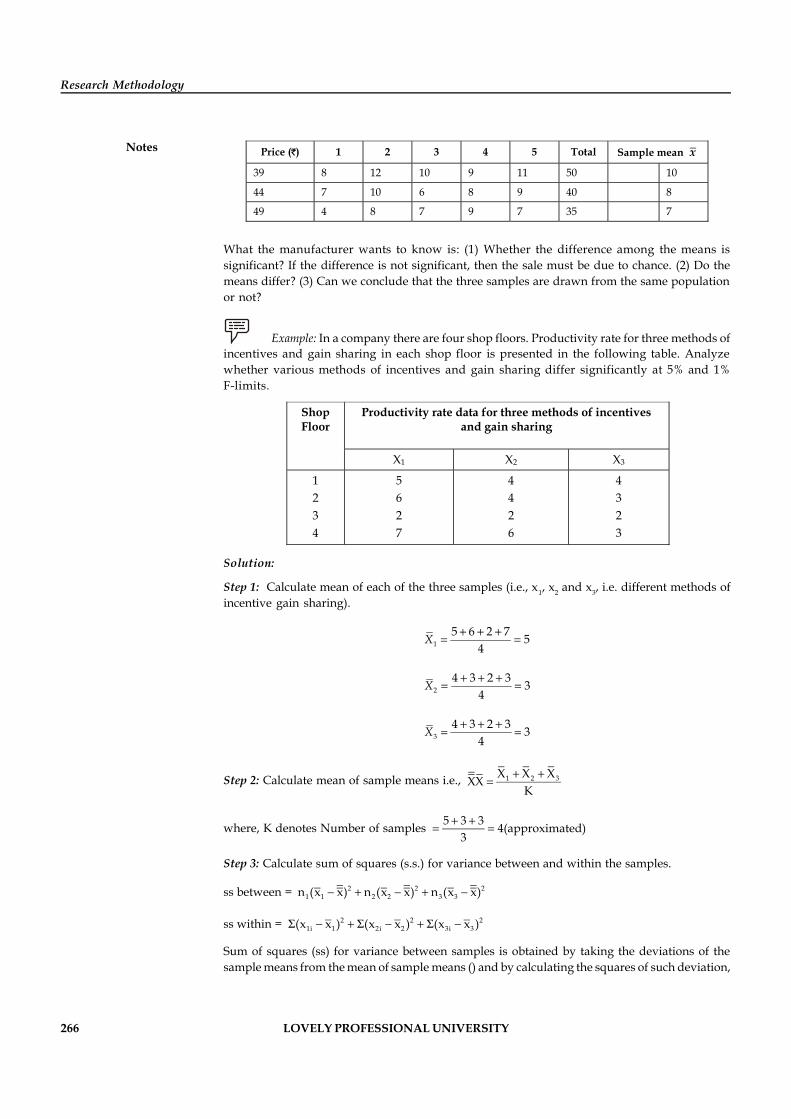
266 LOVELY PROFESSIONAL UNIVERSITY
Research Methodology
Notes Price ( ) 1 2 3 4 5 Total Sample mean x
39 8 12 10 9 11 50 10
44 7 10 6 8 9 40 8
49 4 8 7 9 7 35 7
What the manufacturer wants to know is: (1) Whether the difference among the means issignificant? If the difference is not significant, then the sale must be due to chance. (2) Do themeans differ? (3) Can we conclude that the three samples are drawn from the same populationor not?
Example: In a company there are four shop floors. Productivity rate for three methods ofincentives and gain sharing in each shop floor is presented in the following table. Analyzewhether various methods of incentives and gain sharing differ significantly at 5% and 1%F-limits.
Productivity rate data for three methods of incentives and gain sharing
Shop Floor
X1 X2 X3
1 2 3 4
5 6 2 7
4 4 2 6
4 3 2 3
Solution:
Step 1: Calculate mean of each of the three samples (i.e., x1, x2 and x3, i.e. different methods ofincentive gain sharing).
15 6 2 7 5
4X + + +
= =
24 3 2 3 3
4X + + +
= =
34 3 2 3 3
4X + + +
= =
Step 2: Calculate mean of sample means i.e., 1 2 3X X XXXK
+ +=
where, K denotes Number of samples 5 3 3 4(approximated)3
+ += =
Step 3: Calculate sum of squares (s.s.) for variance between and within the samples.
ss between = 2 2 21 1 2 2 3 3n (x x) n (x x) n (x x)- + - + -
ss within = 2 2 21i 1 2i 2 3i 3(x x ) (x x ) (x x )S - + S - + S -
Sum of squares (ss) for variance between samples is obtained by taking the deviations of thesample means from the mean of sample means () and by calculating the squares of such deviation,
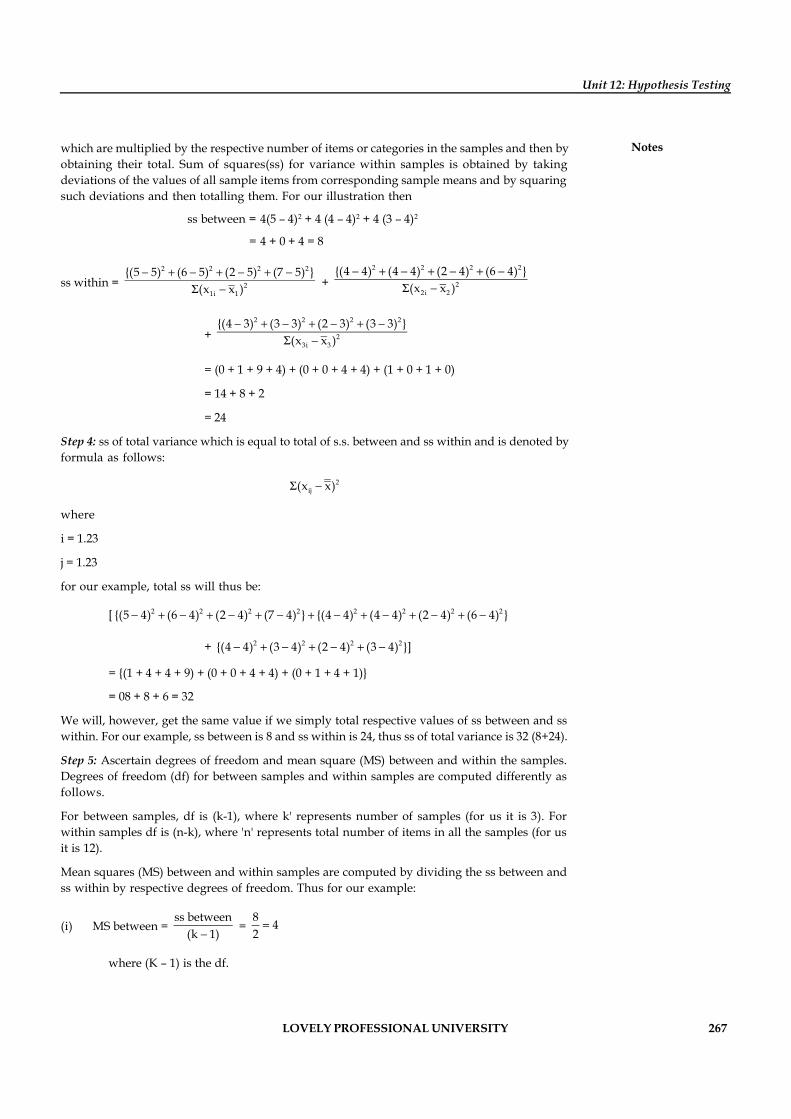
LOVELY PROFESSIONAL UNIVERSITY 267
Unit 12: Hypothesis Testing
Noteswhich are multiplied by the respective number of items or categories in the samples and then byobtaining their total. Sum of squares(ss) for variance within samples is obtained by takingdeviations of the values of all sample items from corresponding sample means and by squaringsuch deviations and then totalling them. For our illustration then
ss between = 4(5 – 4)2 + 4 (4 – 4)2 + 4 (3 – 4)2
= 4 + 0 + 4 = 8
ss within = 2 2 2 2
21i 1
{(5 5) (6 5) (2 5) (7 5) }(x x )
- + - + - + -S - +
2 2 2 2
22i 2
{(4 4) (4 4) (2 4) (6 4) }(x x )
- + - + - + -S -
+ 2 2 2 2
23i 3
{(4 3) (3 3) (2 3) (3 3) }(x x )
- + - + - + -S -
= (0 + 1 + 9 + 4) + (0 + 0 + 4 + 4) + (1 + 0 + 1 + 0)
= 14 + 8 + 2
= 24
Step 4: ss of total variance which is equal to total of s.s. between and ss within and is denoted byformula as follows:
2ij(x x)S -
where
i = 1.23
j = 1.23
for our example, total ss will thus be:
[ 2 2 2 2 2 2 2 2{(5 4) (6 4) (2 4) (7 4) } {(4 4) (4 4) (2 4) (6 4) }- + - + - + - + - + - + - + -
+ 2 2 2 2{(4 4) (3 4) (2 4) (3 4) }]- + - + - + -
= {(1 + 4 + 4 + 9) + (0 + 0 + 4 + 4) + (0 + 1 + 4 + 1)}
= 08 + 8 + 6 = 32
We will, however, get the same value if we simply total respective values of ss between and sswithin. For our example, ss between is 8 and ss within is 24, thus ss of total variance is 32 (8+24).
Step 5: Ascertain degrees of freedom and mean square (MS) between and within the samples.Degrees of freedom (df) for between samples and within samples are computed differently asfollows.
For between samples, df is (k-1), where k' represents number of samples (for us it is 3). Forwithin samples df is (n-k), where 'n' represents total number of items in all the samples (for usit is 12).
Mean squares (MS) between and within samples are computed by dividing the ss between andss within by respective degrees of freedom. Thus for our example:
(i) MS between = ss between
(k 1)- =
8 42=
where (K – 1) is the df.
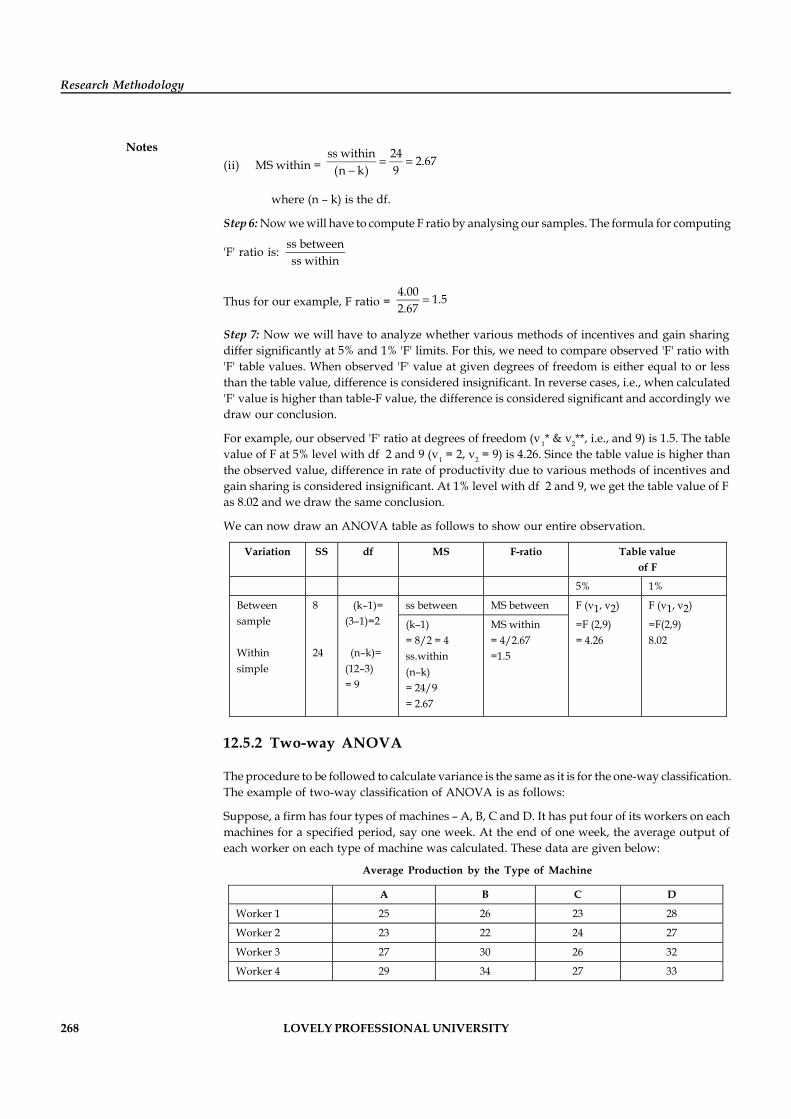
268 LOVELY PROFESSIONAL UNIVERSITY
Research Methodology
Notes(ii) MS within =
ss within 24 2.67(n k) 9
= =-
where (n – k) is the df.
Step 6: Now we will have to compute F ratio by analysing our samples. The formula for computing
'F' ratio is: ss betweenss within
Thus for our example, F ratio = 4.00 1.52.67
=
Step 7: Now we will have to analyze whether various methods of incentives and gain sharingdiffer significantly at 5% and 1% 'F' limits. For this, we need to compare observed 'F' ratio with'F' table values. When observed 'F' value at given degrees of freedom is either equal to or lessthan the table value, difference is considered insignificant. In reverse cases, i.e., when calculated'F' value is higher than table-F value, the difference is considered significant and accordingly wedraw our conclusion.
For example, our observed 'F' ratio at degrees of freedom (v1* & v2**, i.e., and 9) is 1.5. The tablevalue of F at 5% level with df 2 and 9 (v1 = 2, v2 = 9) is 4.26. Since the table value is higher thanthe observed value, difference in rate of productivity due to various methods of incentives andgain sharing is considered insignificant. At 1% level with df 2 and 9, we get the table value of Fas 8.02 and we draw the same conclusion.
We can now draw an ANOVA table as follows to show our entire observation.
Variation
SS
df
MS
F-ratio
Table value of F
5% 1%
ss between MS between Between sample Within simple
8 24
(k–1)= (3–1)=2 (n–k)= (12–3) = 9
(k–1) = 8/2 = 4 ss.within (n–k) = 24/9 = 2.67
MS within = 4/2.67 =1.5
F (v1, v2)
=F (2,9) = 4.26
F (v1, v2)
=F(2,9) 8.02
12.5.2 Two-way ANOVA
The procedure to be followed to calculate variance is the same as it is for the one-way classification.The example of two-way classification of ANOVA is as follows:
Suppose, a firm has four types of machines – A, B, C and D. It has put four of its workers on eachmachines for a specified period, say one week. At the end of one week, the average output ofeach worker on each type of machine was calculated. These data are given below:
Average Production by the Type of Machine
A B C D
Worker 1 25 26 23 28
Worker 2 23 22 24 27
Worker 3 27 30 26 32
Worker 4 29 34 27 33
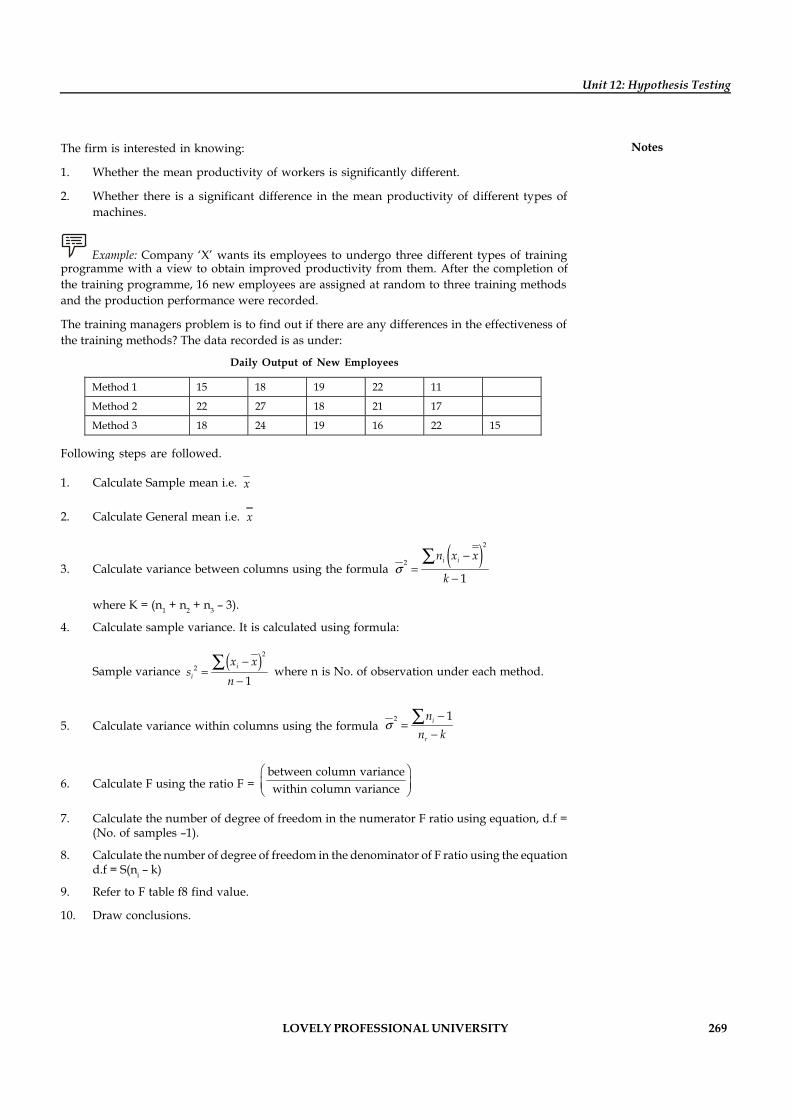
LOVELY PROFESSIONAL UNIVERSITY 269
Unit 12: Hypothesis Testing
NotesThe firm is interested in knowing:
1. Whether the mean productivity of workers is significantly different.
2. Whether there is a significant difference in the mean productivity of different types ofmachines.
Example: Company ‘X’ wants its employees to undergo three different types of trainingprogramme with a view to obtain improved productivity from them. After the completion ofthe training programme, 16 new employees are assigned at random to three training methodsand the production performance were recorded.
The training managers problem is to find out if there are any differences in the effectiveness ofthe training methods? The data recorded is as under:
Daily Output of New Employees
Method 1 15 18 19 22 11
Method 2 22 27 18 21 17
Method 3 18 24 19 16 22 15
Following steps are followed.
1. Calculate Sample mean i.e. x
2. Calculate General mean i.e. x
3. Calculate variance between columns using the formula ( )2
2
1i in x x
ks
-=
-
å
where K = (n1 + n2 + n3 – 3).
4. Calculate sample variance. It is calculated using formula:
Sample variance ( )2
2
1i
i
x xs
n-
=-
å where n is No. of observation under each method.
5. Calculate variance within columns using the formula 2 1i
r
nn k
s-
=-
å
6. Calculate F using the ratio F = between column variancewithin column variance
æ öç ÷è ø
7. Calculate the number of degree of freedom in the numerator F ratio using equation, d.f =(No. of samples –1).
8. Calculate the number of degree of freedom in the denominator of F ratio using the equationd.f = S(ni – k)
9. Refer to F table f8 find value.
10. Draw conclusions.
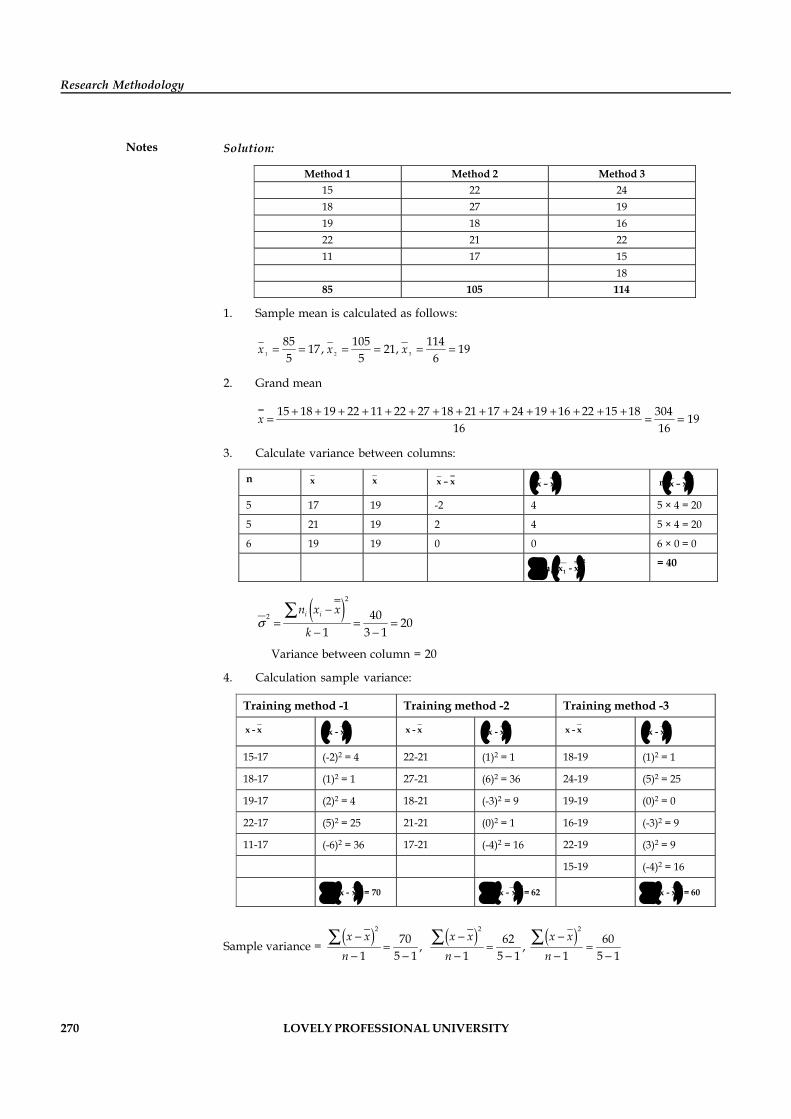
270 LOVELY PROFESSIONAL UNIVERSITY
Research Methodology
Notes Solution:
Method 1 Method 2 Method 3 15 22 24 18 27 19 19 18 16 22 21 22 11 17 15
18 85 105 114
1. Sample mean is calculated as follows:
1 2 3
85 105 11417, 21, 195 5 6
x x x= = = = = =
2. Grand mean
15 18 19 22 11 22 27 18 21 17 24 19 16 22 15 18 304 1916 16
x + + + + + + + + + + + + + + += = =
3. Calculate variance between columns:
n x x x – x ( )2x – x ( )2
n x – x 5 17 19 -2 4 5 × 4 = 20
5 21 19 2 4 5 × 4 = 20
6 19 19 0 0 6 × 0 = 0
( )2
i 1n x - xå = 40
( )2
2 40 201 3 1
i in x x
ks
-= = =
- -
å
Variance between column = 20
4. Calculation sample variance:
Training method -1 Training method -2 Training method -3
x - x ( )2x - x
x - x ( )2x - x
x - x ( )2x - x
15-17 (-2)2 = 4 22-21 (1)2 = 1 18-19 (1)2 = 1
18-17 (1)2 = 1 27-21 (6)2 = 36 24-19 (5)2 = 25
19-17 (2)2 = 4 18-21 (-3)2 = 9 19-19 (0)2 = 0
22-17 (5)2 = 25 21-21 (0)2 = 1 16-19 (-3)2 = 9
11-17 (-6)2 = 36 17-21 (-4)2 = 16 22-19 (3)2 = 9
15-19 (-4)2 = 16
( )2x - x = 70å
( )2x - x = 62å
( )2x - x = 60å
Sample variance = ( )2
70 ,1 5 1
x xn-
=- -
å ( )2
62 ,1 5 1
x xn-
=- -
å ( )2
601 5 1
x xn-
=- -
å
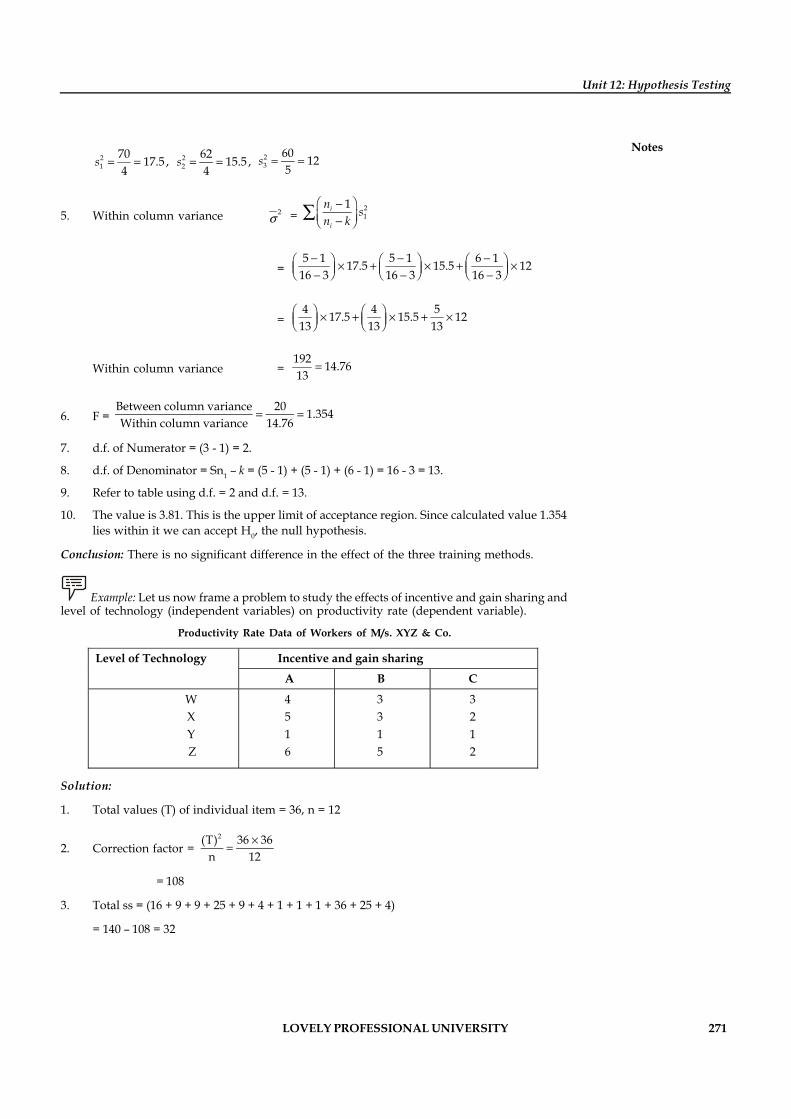
LOVELY PROFESSIONAL UNIVERSITY 271
Unit 12: Hypothesis Testing
Notes21
70 17.5 ,4
s = = 22
62 15.5 ,4
s = = 23
60 125
s = =
5. Within column variance 2s = 21
1i
i
n sn k
æ ö-ç ÷-è øå
=5 1 5 1 6 117.5 15.5 12
16 3 16 3 16 3- - -æ ö æ ö æ ö´ + ´ + ´ç ÷ ç ÷ ç ÷è ø è ø è ø- - -
=4 4 517.5 15.5 12
13 13 13æ ö æ ö´ + ´ + ´ç ÷ ç ÷è ø è ø
Within column variance =192 14.7613
=
6. F = Between column variance 20 1.354Within column variance 14.76
= =
7. d.f. of Numerator = (3 - 1) = 2.
8. d.f. of Denominator = Sn1 – k = (5 - 1) + (5 - 1) + (6 - 1) = 16 - 3 = 13.
9. Refer to table using d.f. = 2 and d.f. = 13.
10. The value is 3.81. This is the upper limit of acceptance region. Since calculated value 1.354lies within it we can accept H0, the null hypothesis.
Conclusion: There is no significant difference in the effect of the three training methods.
Example: Let us now frame a problem to study the effects of incentive and gain sharing andlevel of technology (independent variables) on productivity rate (dependent variable).
Productivity Rate Data of Workers of M/s. XYZ & Co.
Incentive and gain sharing Level of Technology
A B C
W X Y Z
4 5 1 6
3 3 1 5
3 2 1 2
Solution:
1. Total values (T) of individual item = 36, n = 12
2. Correction factor = 2(T) 36 36
n 12´
=
= 108
3. Total ss = (16 + 9 + 9 + 25 + 9 + 4 + 1 + 1 + 1 + 36 + 25 + 4)
= 140 – 108 = 32
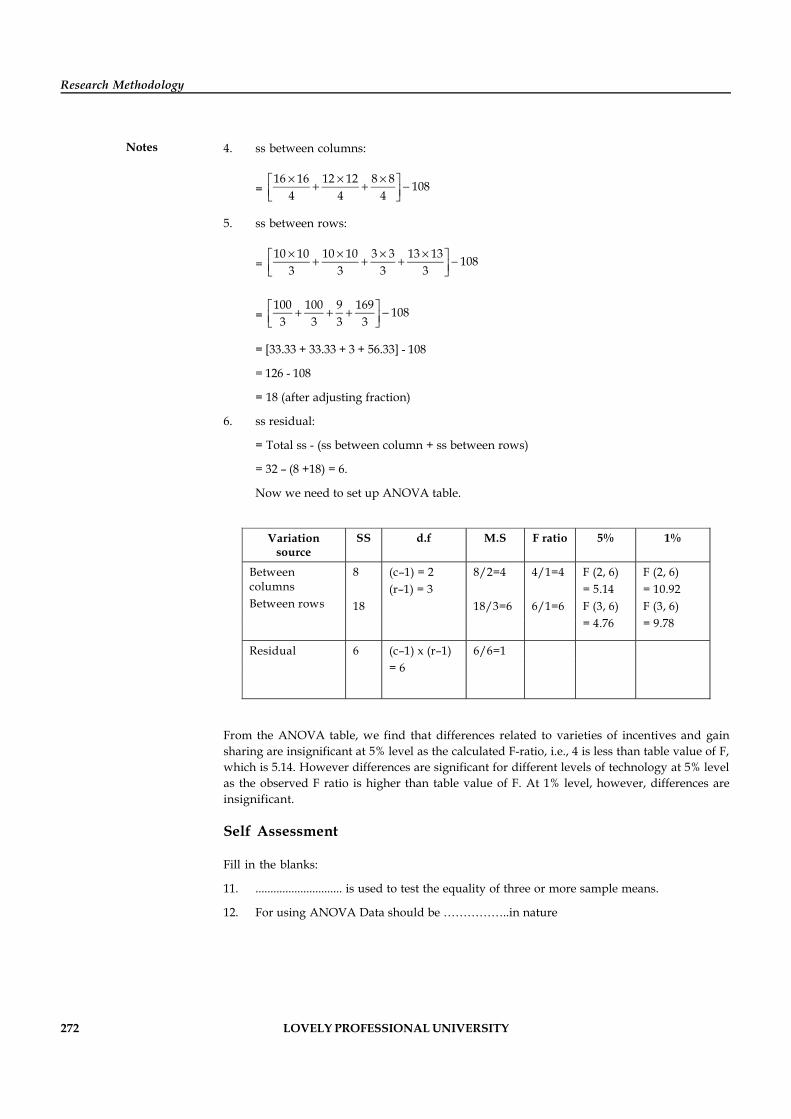
272 LOVELY PROFESSIONAL UNIVERSITY
Research Methodology
Notes 4. ss between columns:
= 16 16 12 12 8 8 108
4 4 4´ ´ ´é ù+ + -ê úë û
5. ss between rows:
= 10 10 10 10 3 3 13 13 108
3 3 3 3´ ´ ´ ´é ù+ + + -ê úë û
= 100 100 9 169 108
3 3 3 3é ù+ + + -ê úë û
= [33.33 + 33.33 + 3 + 56.33] - 108
= 126 - 108
= 18 (after adjusting fraction)
6. ss residual:
= Total ss - (ss between column + ss between rows)
= 32 – (8 +18) = 6.
Now we need to set up ANOVA table.
Variation source
SS d.f M.S F ratio 5% 1%
Between columns Between rows
8 18
(c–1) = 2 (r–1) = 3
8/2=4 18/3=6
4/1=4 6/1=6
F (2, 6) = 5.14 F (3, 6) = 4.76
F (2, 6) = 10.92 F (3, 6) = 9.78
Residual 6 (c–1) x (r–1) = 6
6/6=1
From the ANOVA table, we find that differences related to varieties of incentives and gainsharing are insignificant at 5% level as the calculated F-ratio, i.e., 4 is less than table value of F,which is 5.14. However differences are significant for different levels of technology at 5% levelas the observed F ratio is higher than table value of F. At 1% level, however, differences areinsignificant.
Self Assessment
Fill in the blanks:
11. ............................. is used to test the equality of three or more sample means.
12. For using ANOVA Data should be ……………..in nature
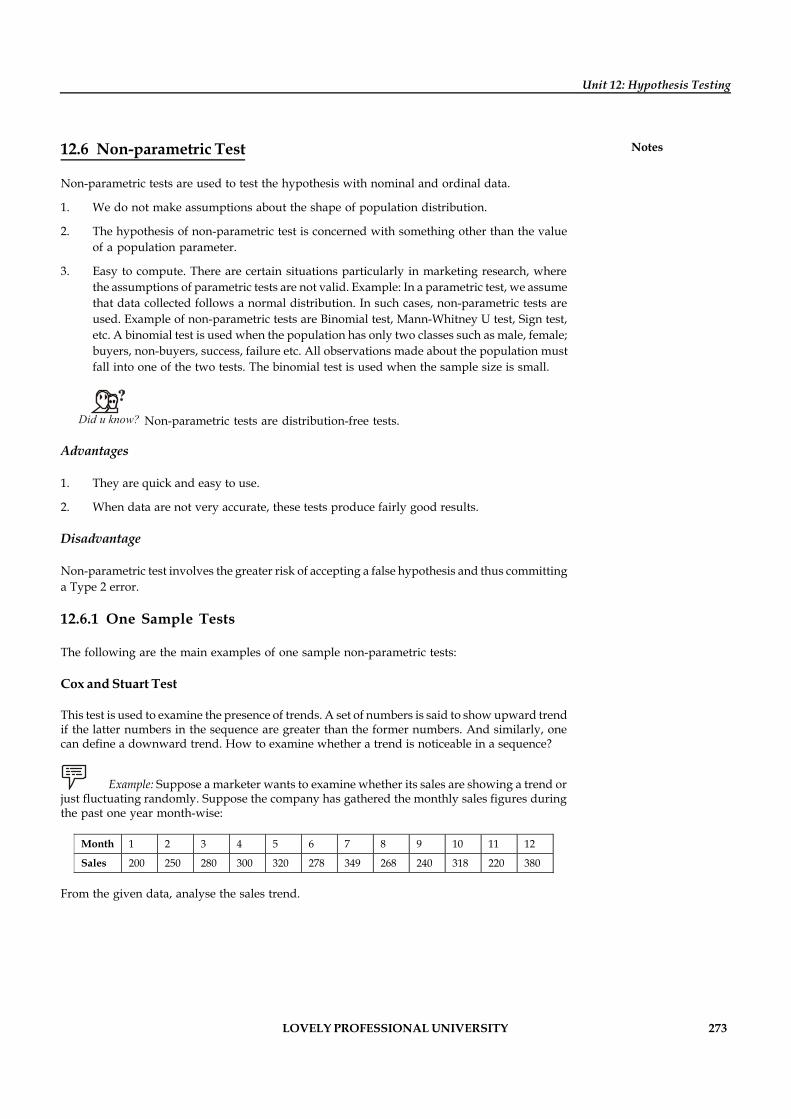
LOVELY PROFESSIONAL UNIVERSITY 273
Unit 12: Hypothesis Testing
Notes12.6 Non-parametric Test
Non-parametric tests are used to test the hypothesis with nominal and ordinal data.
1. We do not make assumptions about the shape of population distribution.
2. The hypothesis of non-parametric test is concerned with something other than the valueof a population parameter.
3. Easy to compute. There are certain situations particularly in marketing research, wherethe assumptions of parametric tests are not valid. Example: In a parametric test, we assumethat data collected follows a normal distribution. In such cases, non-parametric tests areused. Example of non-parametric tests are Binomial test, Mann-Whitney U test, Sign test,etc. A binomial test is used when the population has only two classes such as male, female;buyers, non-buyers, success, failure etc. All observations made about the population mustfall into one of the two tests. The binomial test is used when the sample size is small.
Did u know? Non-parametric tests are distribution-free tests.
Advantages
1. They are quick and easy to use.
2. When data are not very accurate, these tests produce fairly good results.
Disadvantage
Non-parametric test involves the greater risk of accepting a false hypothesis and thus committinga Type 2 error.
12.6.1 One Sample Tests
The following are the main examples of one sample non-parametric tests:
Cox and Stuart Test
This test is used to examine the presence of trends. A set of numbers is said to show upward trendif the latter numbers in the sequence are greater than the former numbers. And similarly, onecan define a downward trend. How to examine whether a trend is noticeable in a sequence?
Example: Suppose a marketer wants to examine whether its sales are showing a trend orjust fluctuating randomly. Suppose the company has gathered the monthly sales figures duringthe past one year month-wise:
Month 1 2 3 4 5 6 7 8 9 10 11 12
Sales 200 250 280 300 320 278 349 268 240 318 220 380
From the given data, analyse the sales trend.
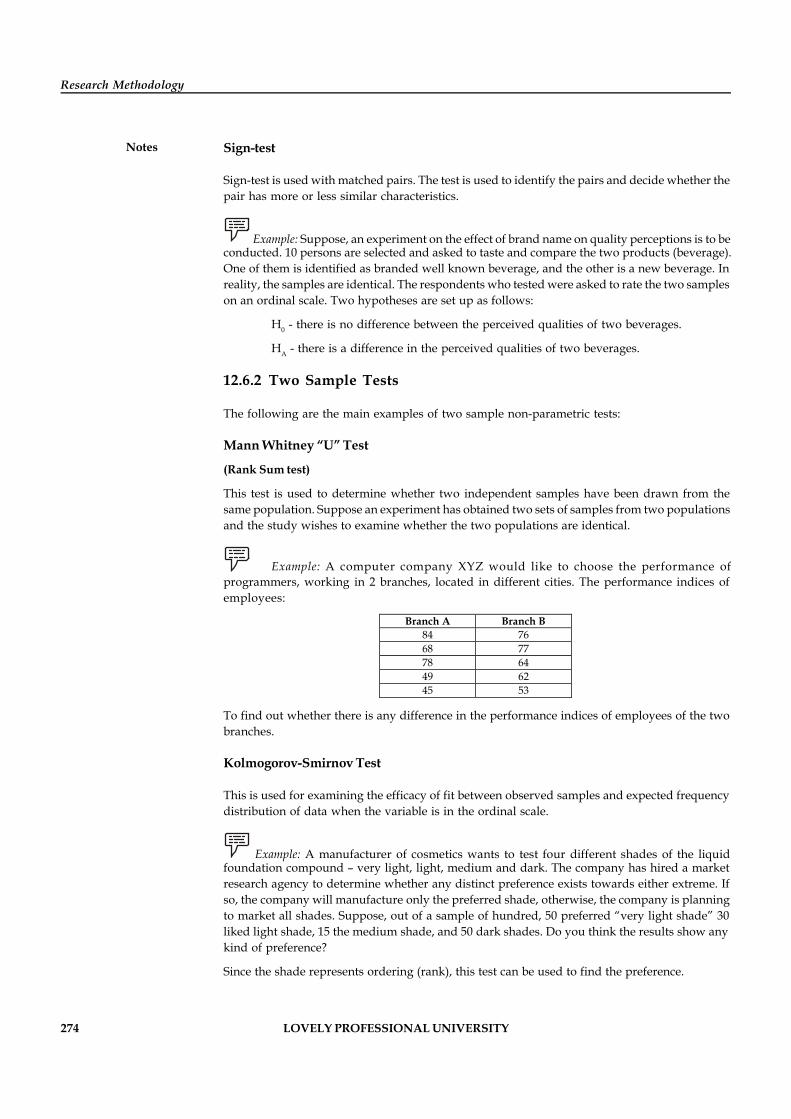
274 LOVELY PROFESSIONAL UNIVERSITY
Research Methodology
Notes Sign-test
Sign-test is used with matched pairs. The test is used to identify the pairs and decide whether thepair has more or less similar characteristics.
Example: Suppose, an experiment on the effect of brand name on quality perceptions is to beconducted. 10 persons are selected and asked to taste and compare the two products (beverage).One of them is identified as branded well known beverage, and the other is a new beverage. Inreality, the samples are identical. The respondents who tested were asked to rate the two sampleson an ordinal scale. Two hypotheses are set up as follows:
H0 - there is no difference between the perceived qualities of two beverages.
HA - there is a difference in the perceived qualities of two beverages.
12.6.2 Two Sample Tests
The following are the main examples of two sample non-parametric tests:
Mann Whitney “U” Test
(Rank Sum test)
This test is used to determine whether two independent samples have been drawn from thesame population. Suppose an experiment has obtained two sets of samples from two populationsand the study wishes to examine whether the two populations are identical.
Example: A computer company XYZ would like to choose the performance ofprogrammers, working in 2 branches, located in different cities. The performance indices ofemployees:
Branch A Branch B 84 76 68 77 78 64 49 62 45 53
To find out whether there is any difference in the performance indices of employees of the twobranches.
Kolmogorov-Smirnov Test
This is used for examining the efficacy of fit between observed samples and expected frequencydistribution of data when the variable is in the ordinal scale.
Example: A manufacturer of cosmetics wants to test four different shades of the liquidfoundation compound – very light, light, medium and dark. The company has hired a marketresearch agency to determine whether any distinct preference exists towards either extreme. Ifso, the company will manufacture only the preferred shade, otherwise, the company is planningto market all shades. Suppose, out of a sample of hundred, 50 preferred “very light shade” 30liked light shade, 15 the medium shade, and 50 dark shades. Do you think the results show anykind of preference?
Since the shade represents ordering (rank), this test can be used to find the preference.
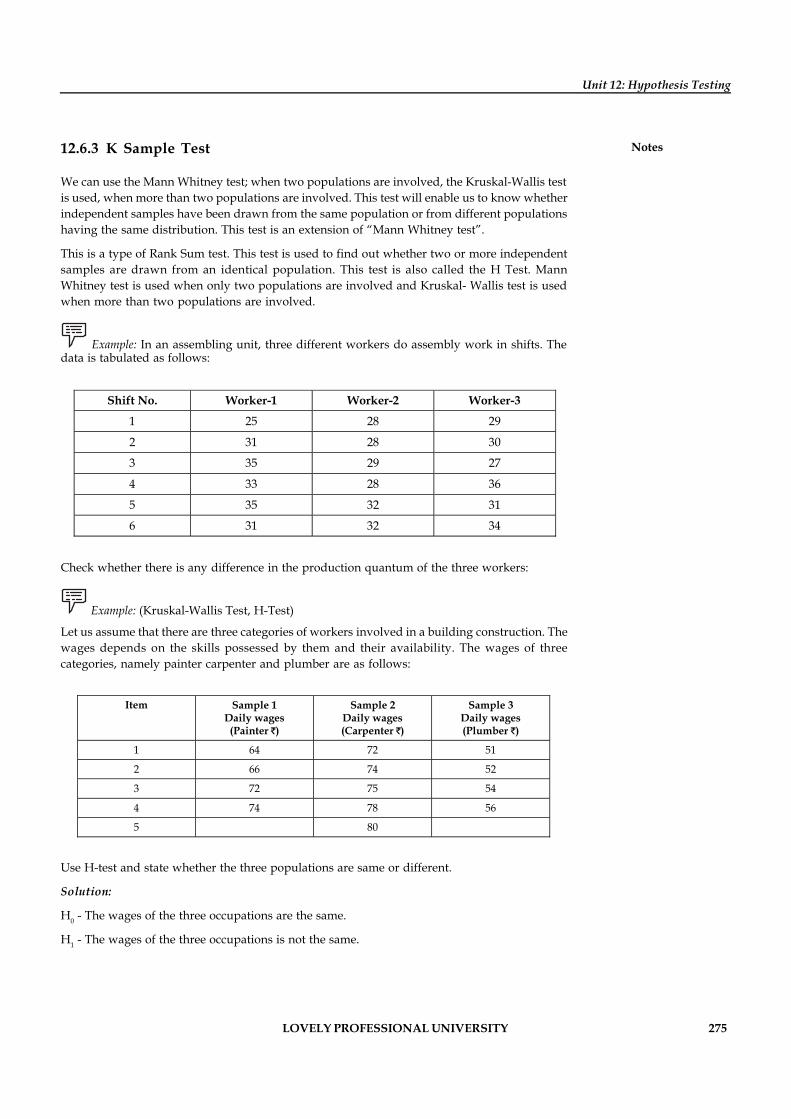
LOVELY PROFESSIONAL UNIVERSITY 275
Unit 12: Hypothesis Testing
Notes12.6.3 K Sample Test
We can use the Mann Whitney test; when two populations are involved, the Kruskal-Wallis testis used, when more than two populations are involved. This test will enable us to know whetherindependent samples have been drawn from the same population or from different populationshaving the same distribution. This test is an extension of “Mann Whitney test”.
This is a type of Rank Sum test. This test is used to find out whether two or more independentsamples are drawn from an identical population. This test is also called the H Test. MannWhitney test is used when only two populations are involved and Kruskal- Wallis test is usedwhen more than two populations are involved.
Example: In an assembling unit, three different workers do assembly work in shifts. Thedata is tabulated as follows:
Shift No. Worker-1 Worker-2 Worker-3
1 25 28 29
2 31 28 30
3 35 29 27
4 33 28 36
5 35 32 31
6 31 32 34
Check whether there is any difference in the production quantum of the three workers:
Example: (Kruskal-Wallis Test, H-Test)
Let us assume that there are three categories of workers involved in a building construction. Thewages depends on the skills possessed by them and their availability. The wages of threecategories, namely painter carpenter and plumber are as follows:
Item Sample 1 Daily wages
(Painter )
Sample 2 Daily wages (Carpenter )
Sample 3 Daily wages (Plumber )
1 64 72 51
2 66 74 52
3 72 75 54
4 74 78 56
5 80
Use H-test and state whether the three populations are same or different.
Solution:
H0 - The wages of the three occupations are the same.
H1 - The wages of the three occupations is not the same.
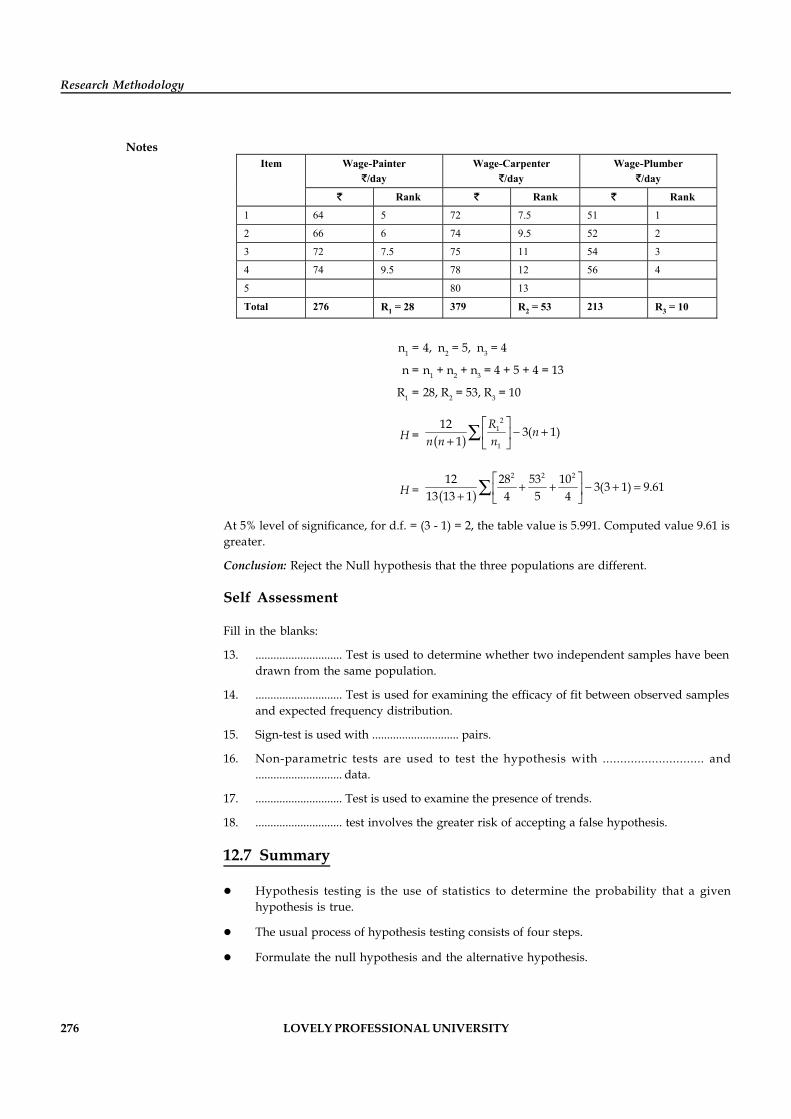
276 LOVELY PROFESSIONAL UNIVERSITY
Research Methodology
NotesWage-Painter
/day
Wage-Carpenter
/day
Wage-Plumber
/day
Item
Rank Rank Rank
1 64 5 72 7.5 51 1
2 66 6 74 9.5 52 2
3 72 7.5 75 11 54 3
4 74 9.5 78 12 56 4
5 80 13
Total 276 R1 = 28 379 R
2 = 53 213 R
3 = 10
n1 = 4, n2 = 5, n3 = 4
n = n1 + n2 + n3 = 4 + 5 + 4 = 13
R1 = 28, R2 = 53, R3 = 10
H = ( )2
1
1
12 3( 1)1
R nn n n
é ù- +ê ú+ ë û
å
H = ( )2 2 212 28 53 10 3(3 1) 9.61
13 13 1 4 5 4é ù
+ + - + =ê ú+ ë ûå
At 5% level of significance, for d.f. = (3 - 1) = 2, the table value is 5.991. Computed value 9.61 isgreater.
Conclusion: Reject the Null hypothesis that the three populations are different.
Self Assessment
Fill in the blanks:
13. ............................. Test is used to determine whether two independent samples have beendrawn from the same population.
14. ............................. Test is used for examining the efficacy of fit between observed samplesand expected frequency distribution.
15. Sign-test is used with ............................. pairs.
16. Non-parametric tests are used to test the hypothesis with ............................. and............................. data.
17. ............................. Test is used to examine the presence of trends.
18. ............................. test involves the greater risk of accepting a false hypothesis.
12.7 Summary
Hypothesis testing is the use of statistics to determine the probability that a givenhypothesis is true.
The usual process of hypothesis testing consists of four steps.
Formulate the null hypothesis and the alternative hypothesis.
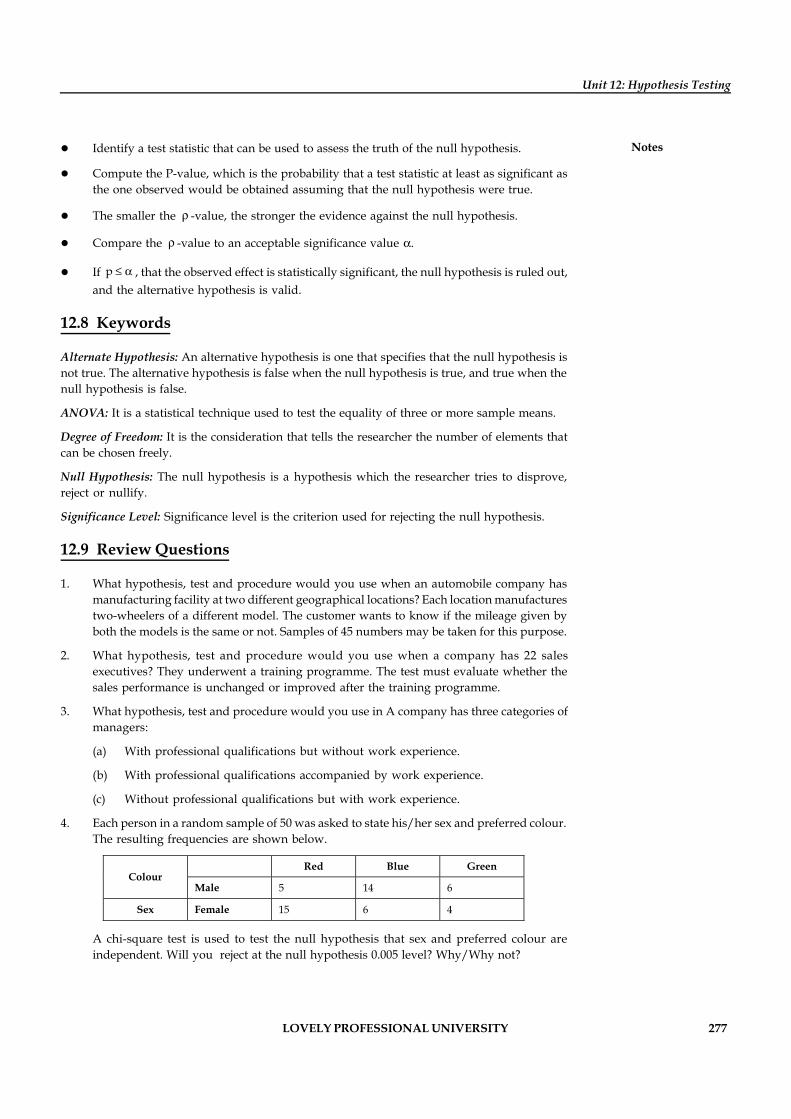
LOVELY PROFESSIONAL UNIVERSITY 277
Unit 12: Hypothesis Testing
Notes Identify a test statistic that can be used to assess the truth of the null hypothesis.
Compute the P-value, which is the probability that a test statistic at least as significant asthe one observed would be obtained assuming that the null hypothesis were true.
The smaller the r -value, the stronger the evidence against the null hypothesis.
Compare the r -value to an acceptable significance value .
If p £ , that the observed effect is statistically significant, the null hypothesis is ruled out,and the alternative hypothesis is valid.
12.8 Keywords
Alternate Hypothesis: An alternative hypothesis is one that specifies that the null hypothesis isnot true. The alternative hypothesis is false when the null hypothesis is true, and true when thenull hypothesis is false.
ANOVA: It is a statistical technique used to test the equality of three or more sample means.
Degree of Freedom: It is the consideration that tells the researcher the number of elements thatcan be chosen freely.
Null Hypothesis: The null hypothesis is a hypothesis which the researcher tries to disprove,reject or nullify.
Significance Level: Significance level is the criterion used for rejecting the null hypothesis.
12.9 Review Questions
1. What hypothesis, test and procedure would you use when an automobile company hasmanufacturing facility at two different geographical locations? Each location manufacturestwo-wheelers of a different model. The customer wants to know if the mileage given byboth the models is the same or not. Samples of 45 numbers may be taken for this purpose.
2. What hypothesis, test and procedure would you use when a company has 22 salesexecutives? They underwent a training programme. The test must evaluate whether thesales performance is unchanged or improved after the training programme.
3. What hypothesis, test and procedure would you use in A company has three categories ofmanagers:
(a) With professional qualifications but without work experience.
(b) With professional qualifications accompanied by work experience.
(c) Without professional qualifications but with work experience.
4. Each person in a random sample of 50 was asked to state his/her sex and preferred colour.The resulting frequencies are shown below.
Red Blue Green Colour
Male 5 14 6
Sex Female 15 6 4
A chi-square test is used to test the null hypothesis that sex and preferred colour areindependent. Will you reject at the null hypothesis 0.005 level? Why/Why not?
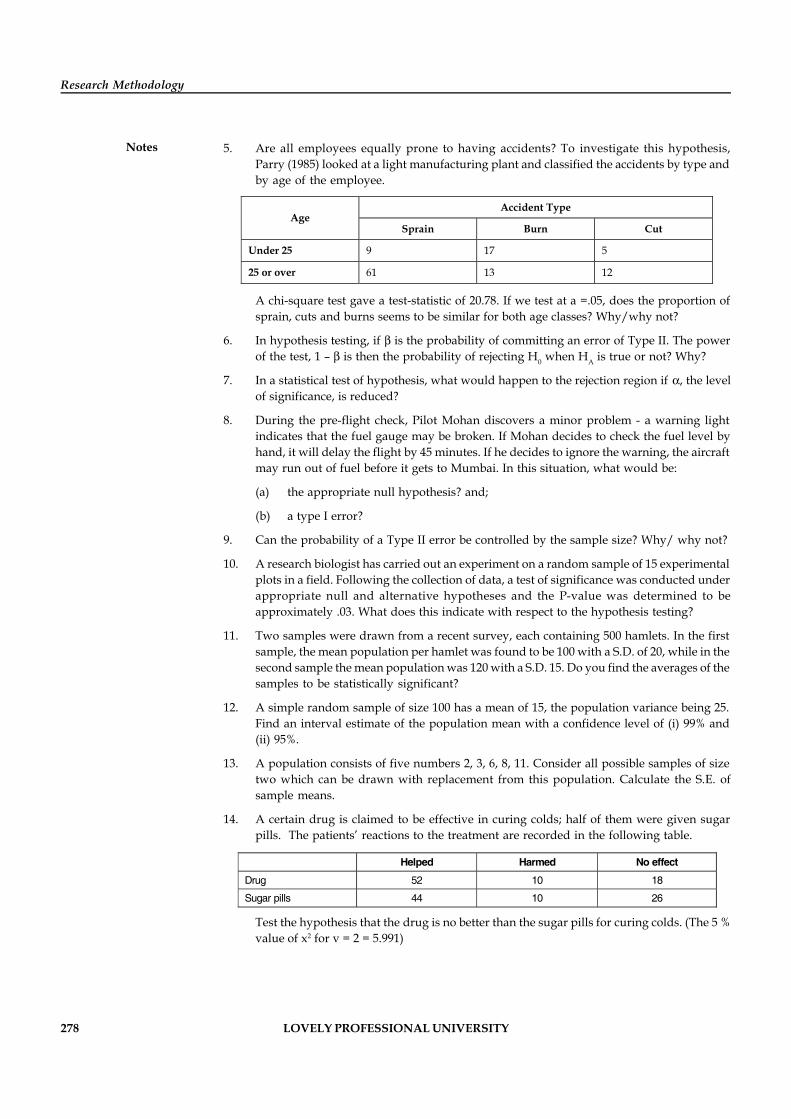
278 LOVELY PROFESSIONAL UNIVERSITY
Research Methodology
Notes 5. Are all employees equally prone to having accidents? To investigate this hypothesis,Parry (1985) looked at a light manufacturing plant and classified the accidents by type andby age of the employee.
Accident Type Age
Sprain Burn Cut
Under 25 9 17 5
25 or over 61 13 12
A chi-square test gave a test-statistic of 20.78. If we test at a =.05, does the proportion ofsprain, cuts and burns seems to be similar for both age classes? Why/why not?
6. In hypothesis testing, if is the probability of committing an error of Type II. The powerof the test, 1 – is then the probability of rejecting H0 when HA is true or not? Why?
7. In a statistical test of hypothesis, what would happen to the rejection region if , the levelof significance, is reduced?
8. During the pre-flight check, Pilot Mohan discovers a minor problem - a warning lightindicates that the fuel gauge may be broken. If Mohan decides to check the fuel level byhand, it will delay the flight by 45 minutes. If he decides to ignore the warning, the aircraftmay run out of fuel before it gets to Mumbai. In this situation, what would be:
(a) the appropriate null hypothesis? and;
(b) a type I error?
9. Can the probability of a Type II error be controlled by the sample size? Why/ why not?
10. A research biologist has carried out an experiment on a random sample of 15 experimentalplots in a field. Following the collection of data, a test of significance was conducted underappropriate null and alternative hypotheses and the P-value was determined to beapproximately .03. What does this indicate with respect to the hypothesis testing?
11. Two samples were drawn from a recent survey, each containing 500 hamlets. In the firstsample, the mean population per hamlet was found to be 100 with a S.D. of 20, while in thesecond sample the mean population was 120 with a S.D. 15. Do you find the averages of thesamples to be statistically significant?
12. A simple random sample of size 100 has a mean of 15, the population variance being 25.Find an interval estimate of the population mean with a confidence level of (i) 99% and(ii) 95%.
13. A population consists of five numbers 2, 3, 6, 8, 11. Consider all possible samples of sizetwo which can be drawn with replacement from this population. Calculate the S.E. ofsample means.
14. A certain drug is claimed to be effective in curing colds; half of them were given sugarpills. The patients’ reactions to the treatment are recorded in the following table.
Helped Harmed No effect
Drug 52 10 18
Sugar pills 44 10 26
Test the hypothesis that the drug is no better than the sugar pills for curing colds. (The 5 %value of x2 for v = 2 = 5.991)
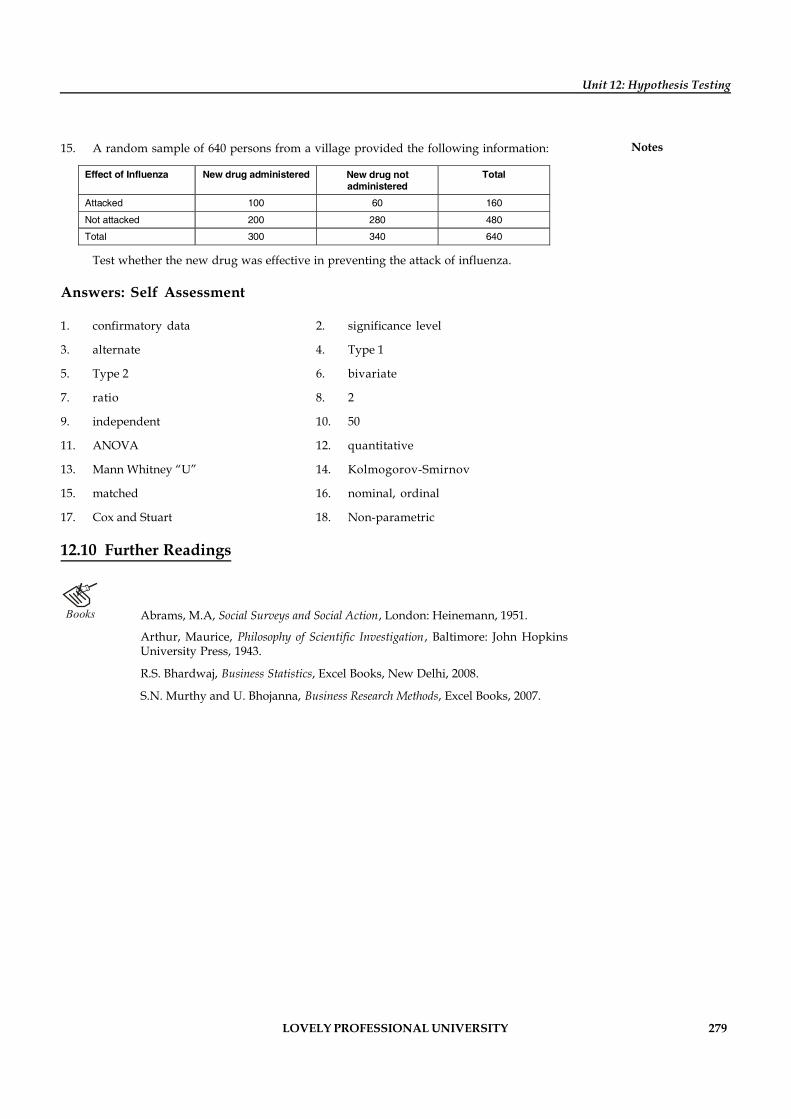
LOVELY PROFESSIONAL UNIVERSITY 279
Unit 12: Hypothesis Testing
Notes15. A random sample of 640 persons from a village provided the following information:
Effect of Influenza New drug administered New drug not administered
Total
Attacked 100 60 160
Not attacked 200 280 480
Total 300 340 640
Test whether the new drug was effective in preventing the attack of influenza.
Answers: Self Assessment
1. confirmatory data 2. significance level
3. alternate 4. Type 1
5. Type 2 6. bivariate
7. ratio 8. 2
9. independent 10. 50
11. ANOVA 12. quantitative
13. Mann Whitney “U” 14. Kolmogorov-Smirnov
15. matched 16. nominal, ordinal
17. Cox and Stuart 18. Non-parametric
12.10 Further Readings
Books Abrams, M.A, Social Surveys and Social Action, London: Heinemann, 1951.
Arthur, Maurice, Philosophy of Scientific Investigation , Baltimore: John HopkinsUniversity Press, 1943.
R.S. Bhardwaj, Business Statistics, Excel Books, New Delhi, 2008.
S.N. Murthy and U. Bhojanna, Business Research Methods, Excel Books, 2007.
280 LOVELY PROFESSIONAL UNIVERSITY
Research Methodology
Notes Unit 13: Multivariate Analysis
CONTENTS
Objectives
Introduction
13.1 Multivariate Analysis
13.1.1 Multiple Regression
13.2 Discriminant Analysis
13.3 Conjoint Analysis
13.4 Factor Analysis
13.4.1 Principle Component Factor Analysis
13.4.2 Rotation in Factor Analysis
13.5 Cluster Analysis
13.6 Multidimensional Scaling (MDS)
13.7 Summary
13.8 Keywords
13.9 Review Questions
13.10 Further Readings
Objectives
After studying this unit, you will be able to:
Explain the concept of multivariate analysis
Classify the multivariate analysis
Define the Discriminant Analysis and Conjoint Analysis
Discuss the Factor Analysis and Cluster Analysis
State the Multidimensional Scaling (MDS)
Introduction
As the name indicates, multivariate analysis comprises a set of techniques dedicated to theanalysis of data sets with more than one variable. Several of these techniques were developedrecently in part because they require the computational capabilities of modern computers.Multivariate analysis (MVA) is based on the statistical principle of multivariate statistics, whichinvolves observation and analysis of more than one statistical variable at a time. In design andanalysis, the technique is used to perform trade studies across multiple dimensions while takinginto account the effects of all variables on the responses of interest. Sometimes, the marketerswill come across situations, which are complex involving two or more variables. Hence, bivariateanalysis deals with this type of situation. Chi-Square is an example of bivariate analysis.
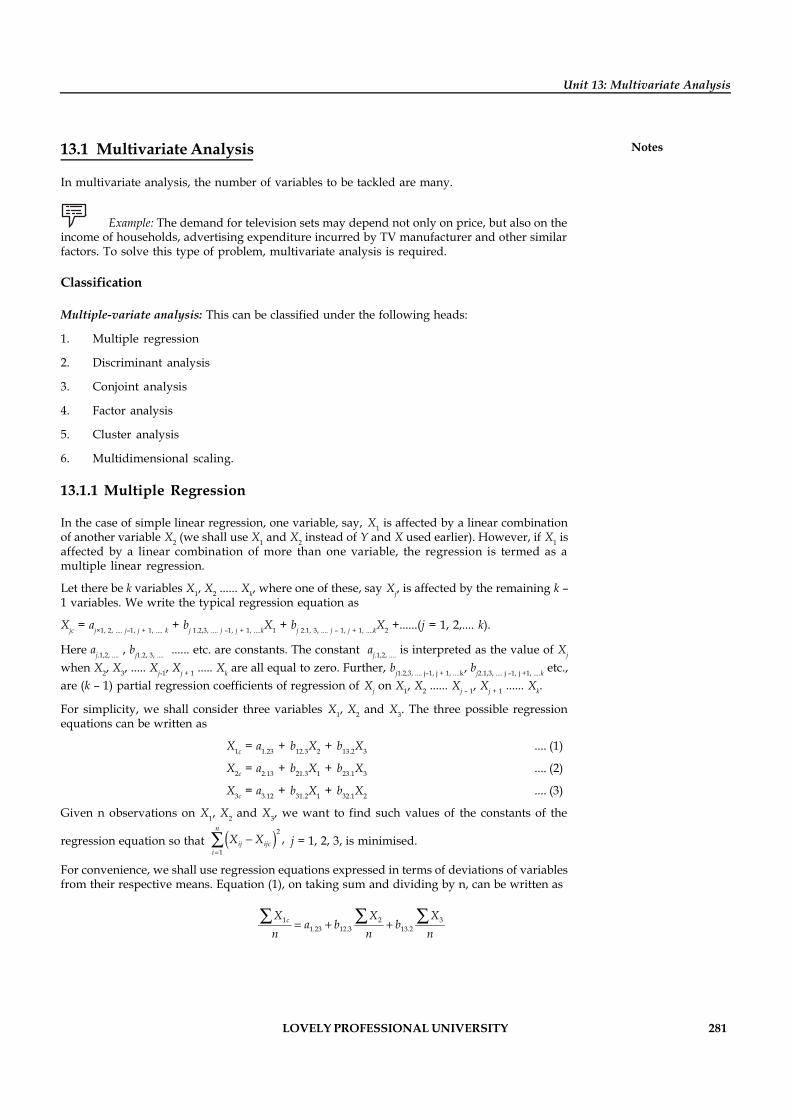
LOVELY PROFESSIONAL UNIVERSITY 281
Unit 13: Multivariate Analysis
Notes13.1 Multivariate Analysis
In multivariate analysis, the number of variables to be tackled are many.
Example: The demand for television sets may depend not only on price, but also on theincome of households, advertising expenditure incurred by TV manufacturer and other similarfactors. To solve this type of problem, multivariate analysis is required.
Classification
Multiple-variate analysis: This can be classified under the following heads:
1. Multiple regression
2. Discriminant analysis
3. Conjoint analysis
4. Factor analysis
5. Cluster analysis
6. Multidimensional scaling.
13.1.1 Multiple Regression
In the case of simple linear regression, one variable, say, X1 is affected by a linear combinationof another variable X2 (we shall use X1 and X2 instead of Y and X used earlier). However, if X1 isaffected by a linear combination of more than one variable, the regression is termed as amultiple linear regression.
Let there be k variables X1, X2 ...... Xk, where one of these, say Xj, is affected by the remaining k –1 variables. We write the typical regression equation as
Xjc = aj×1, 2, .... j–1, j + 1, .... k + bj 1.2,3, .... j –1, j + 1, ....kX1 + bj 2.1, 3, .... j – 1, j + 1, ....kX2 +......(j = 1, 2,.... k).
Here aj.1,2, .... , bj1.2, 3, .... ...... etc. are constants. The constant aj.1,2, .... is interpreted as the value of Xj
when X2, X3, ..... Xj-1, Xj + 1 ..... Xk are all equal to zero. Further, bj1.2,3, .... j–1, j + 1, ....k, bj2.1,3, .... j –1, j +1, ....k etc.,are (k – 1) partial regression coefficients of regression of Xj on X1, X2 ...... Xj – 1, Xj + 1 ...... Xk.
For simplicity, we shall consider three variables X1, X2 and X3. The three possible regressionequations can be written as
X1c = a1.23 + b12.3X2 + b13.2X3 .... (1)
X2c = a2.13 + b21.3X1 + b23.1X3 .... (2)
X3c = a3.12 + b31.2X1 + b32.1X2 .... (3)
Given n observations on X1, X2 and X3, we want to find such values of the constants of the
regression equation so that ( )2
1,
n
ij ijci
X X=
-å j = 1, 2, 3, is minimised.
For convenience, we shall use regression equations expressed in terms of deviations of variablesfrom their respective means. Equation (1), on taking sum and dividing by n, can be written as
1 2 31.23 12.3 13.2
cX X Xa b b
n n n= + +å å å
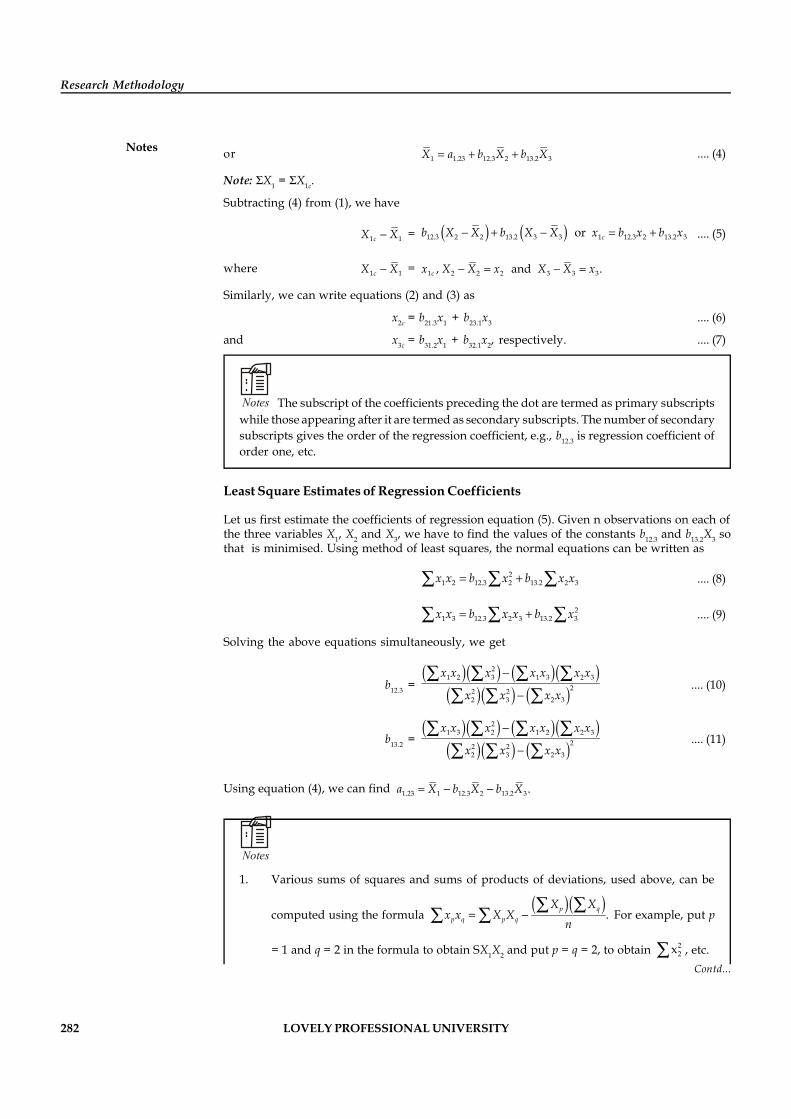
282 LOVELY PROFESSIONAL UNIVERSITY
Research Methodology
Notes or 1 1.23 12.3 2 13.2 3X a b X b X= + + .... (4)
Note: X1 = X1c.
Subtracting (4) from (1), we have
1 1cX X- = ( ) ( )12.3 2 2 13.2 3 3 1 12.3 2 13.2 3 or cb X X b X X x b x b x- + - = + .... (5)
where 1 1cX X- = 1 2 2 2 3 3 3, and .cx X X x X X x- = - =
Similarly, we can write equations (2) and (3) as
x2c = b21.3x1 + b23.1x3 .... (6)
and x3c = b31.2x1 + b32.1x2, respectively. .... (7)
Notes The subscript of the coefficients preceding the dot are termed as primary subscriptswhile those appearing after it are termed as secondary subscripts. The number of secondarysubscripts gives the order of the regression coefficient, e.g., b12.3 is regression coefficient oforder one, etc.
Least Square Estimates of Regression Coefficients
Let us first estimate the coefficients of regression equation (5). Given n observations on each ofthe three variables X1, X2 and X3, we have to find the values of the constants b12.3 and b13.2X3 sothat is minimised. Using method of least squares, the normal equations can be written as
21 2 12.3 2 13.2 2 3x x b x b x x= +å å å .... (8)
21 3 12.3 2 3 13.2 3x x b x x b x= +å å å .... (9)
Solving the above equations simultaneously, we get
b12.3 =( )( ) ( )( )
( )( ) ( )2
1 2 3 1 3 2 322 2
2 3 2 3
x x x x x x x
x x x x
-
-
å å å åå å å
.... (10)
b13.2 =( )( ) ( )( )
( )( ) ( )2
1 3 2 1 2 2 322 2
2 3 2 3
x x x x x x x
x x x x
-
-
å å å åå å å
.... (11)
Using equation (4), we can find 1.23 1 12.3 2 13.2 3.a X b X b X= - -
Notes
1. Various sums of squares and sums of products of deviations, used above, can be
computed using the formula ( )( )
.p qp q p q
X Xx x X X
n= -
å åå å For example, put p
= 1 and q = 2 in the formula to obtain SX1X2 and put p = q = 2, to obtain 22xå , etc.
Contd...
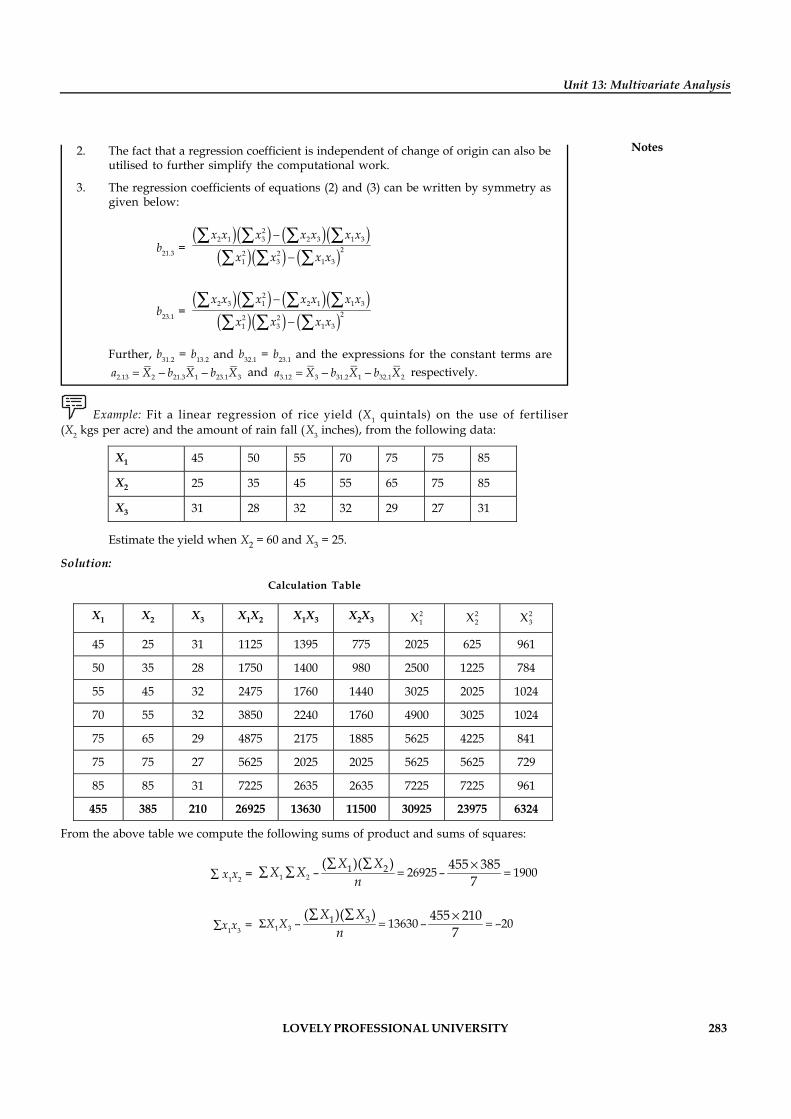
LOVELY PROFESSIONAL UNIVERSITY 283
Unit 13: Multivariate Analysis
Notes2. The fact that a regression coefficient is independent of change of origin can also beutilised to further simplify the computational work.
3. The regression coefficients of equations (2) and (3) can be written by symmetry asgiven below:
b21.3 = ( )( ) ( )( )
( )( ) ( )2
2 1 3 2 3 1 322 2
1 3 1 3
x x x x x x x
x x x x
-
-
å å å åå å å
b23.1 = ( )( ) ( )( )
( )( ) ( )2
2 3 1 2 1 1 322 2
1 3 1 3
x x x x x x x
x x x x
-
-
å å å åå å å
Further, b31.2 = b13.2 and b32.1 = b23.1 and the expressions for the constant terms are
2.13 2 21.3 1 23.1 3a X b X b X= - - and 3.12 3 31.2 1 32.1 2a X b X b X= - - respectively.
Example: Fit a linear regression of rice yield (X1 quintals) on the use of fertiliser(X2 kgs per acre) and the amount of rain fall (X3 inches), from the following data:
X1 45 50 55 70 75 75 85
X2 25 35 45 55 65 75 85
X3 31 28 32 32 29 27 31
Estimate the yield when X2 = 60 and X3 = 25.
Solution:
Calculation Table
X1 X2 X3 X1X2 X1X3 X2X3 21X 2
2X 23X
45 25 31 1125 1395 775 2025 625 961
50 35 28 1750 1400 980 2500 1225 784
55 45 32 2475 1760 1440 3025 2025 1024
70 55 32 3850 2240 1760 4900 3025 1024
75 65 29 4875 2175 1885 5625 4225 841
75 75 27 5625 2025 2025 5625 5625 729
85 85 31 7225 2635 2635 7225 7225 961
455 385 210 26925 13630 11500 30925 23975 6324
From the above table we compute the following sums of product and sums of squares:
å x1x2 = 1 21 2– 26925 – 1900
( )( ) 455 3857
X XX Xn
= =å å ´å å
åx1x3 = 1 31 3– 13630 – –20
( )( ) 455 2107
X XX X
nS = =
å å ´
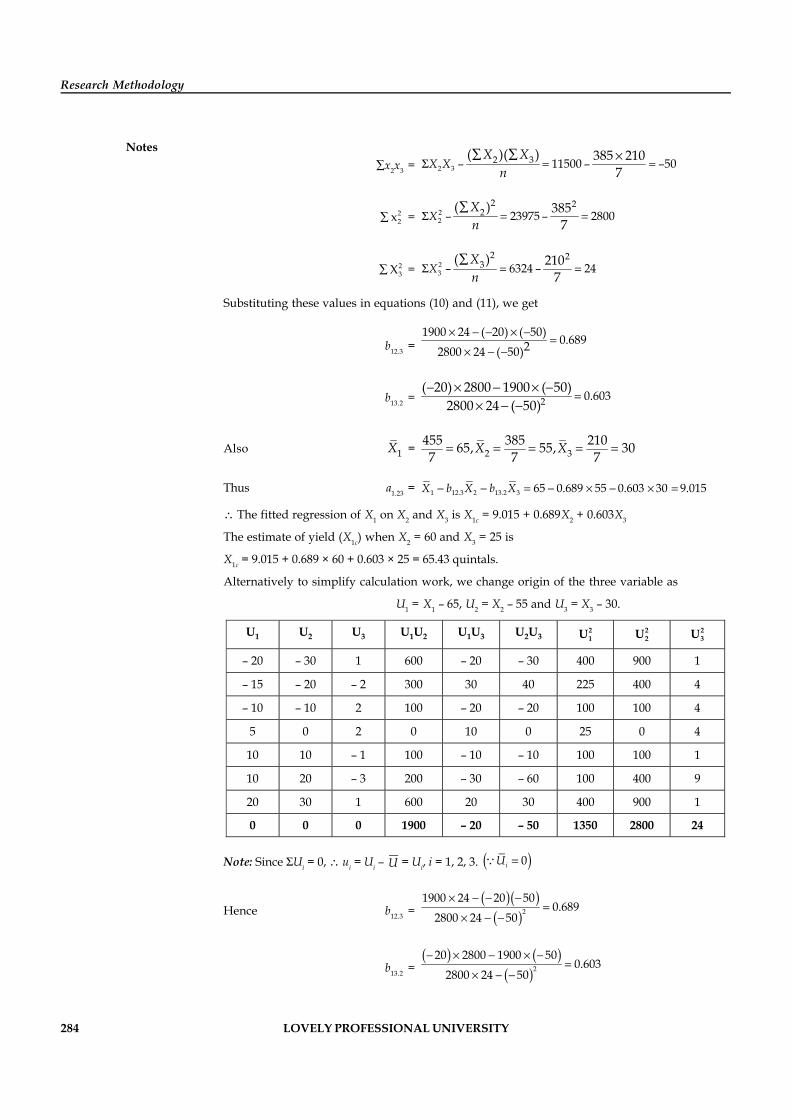
284 LOVELY PROFESSIONAL UNIVERSITY
Research Methodology
Notesåx2x3 = 2 3
2 3– 11500 – –50( )( ) 385 210
7X X
X Xn
S = =å å ´
å 22x = 2
2
2 22– 23975 – 2800
( ) 3857
XXn
S = =å
å 23X = 2
3
2 23– 6324 – 24
( ) 2107
XXn
S = =å
Substituting these values in equations (10) and (11), we get
b12.3 =1900 24 ( 20) ( 50) 0.68922800 24 ( 50)
´ - - ´ -=
´ - -
b13.2 = 2 0.603( 20) 2800 1900 ( 50)
2800 24 ( 50)=
- ´ - ´ -´ - -
Also 1X = 2 3455 385 21065, 55, 307 7 7
X X
Thus a1.23 = 1 12.3 2 13.2 3 65 0.689 55 0.603 30 9.015X b X b X- - = - ´ - ´ =
The fitted regression of X1 on X2 and X3 is X1c = 9.015 + 0.689X2 + 0.603X3
The estimate of yield (X1c) when X2 = 60 and X3 = 25 is
X1c = 9.015 + 0.689 × 60 + 0.603 × 25 = 65.43 quintals.
Alternatively to simplify calculation work, we change origin of the three variable as
U1 = X1 – 65, U2 = X2 – 55 and U3 = X3 – 30.
U1 U2 U3 U1U2 U1U3 U2U3 21U 2
2U 23U
– 20 – 30 1 600 – 20 – 30 400 900 1
– 15 – 20 – 2 300 30 40 225 400 4
– 10 – 10 2 100 – 20 – 20 100 100 4
5 0 2 0 10 0 25 0 4
10 10 – 1 100 – 10 – 10 100 100 1
10 20 – 3 200 – 30 – 60 100 400 9
20 30 1 600 20 30 400 900 1
0 0 0 1900 – 20 – 50 1350 2800 24
Note: Since SUi = 0, ui = Ui – U = Ui, i = 1, 2, 3. ( )0iU =
Hence b12.3 =( )( )( )2
1900 24 20 500.689
2800 24 50´ - - -
=´ - -
b13.2 =( ) ( )
( )2
20 2800 1900 500.603
2800 24 50- ´ - ´ -
=´ - -
LOVELY PROFESSIONAL UNIVERSITY 285
Unit 13: Multivariate Analysis
NotesFurther, we have
1X = 1 2 32 365 65, 55 55 and 30 30
U U UX X
n n n+ = = + = = + =å å å
!Caution The above method should be used when mean of all the variables are integers.
Alternative Method
The coefficients of the regression equation X1c = a1.23 + b12.3X2 + b13.2X3 can also be obtained bysimultaneously solving the following normal equations:
SX1 = na1.23 + b12.3SX2 + b13.2SX3
SX1X2 = a1.23SX2 + b12.3SX22 + b13.2SX2X3
SX1X3 = a1.23SX3 + b12.3SX2X3 + b13.2SX32
Self Assessment
Fill in the blanks:
1. Regression coefficient is independent of change of .......................
2. In the case of ………………regression, one variable is affected by a linear combination ofanother variable.
3. ……………..analysis is based on the statistical principle of multivariate statistics, whichinvolves observation and analysis of more than one statistical variable at a time.
13.2 Discriminant Analysis
In this analysis, two or more groups are compared. In the final analysis, we need to find outwhether the groups differ one from another.
Example: Where discriminant analysis is used
1. Those who buy our brand and those who buy competitors’ brand.
2. Good salesman, poor salesman, medium salesman
3. Those who go to Food World to buy and those who buy in a Kirana shop.
4. Heavy user, medium user and light user of the product.
Suppose there is a comparison between the groups mentioned as above along with demographicand socio-economic factors, then discriminant analysis can be used. One way of doing this is toproceed and calculate the income, age, educational level, so that the profile of each group couldbe determined. Comparing the two groups based on one variable alone would be informativebut it would not indicate the relative importance of each variable in distinguishing the groups.This is because several variables within the group will have some correlation which means thatone variable is not independent of the other.
If we are interested in segmenting the market using income and education, we would beinterested in the total effect of two variables in combinations, and not their effects separately.Further, we would be interested in determining which of the variables are more important or
286 LOVELY PROFESSIONAL UNIVERSITY
Research Methodology
Notes had a greater impact. To summarize, we can say, that Discriminant Analysis can be used whenwe want to consider the variables simultaneously to take into account their interrelationship.
Like regression, the value of dependent variable is calculated by using the data of independentvariable.
Z = b1x1 + b2x2 + b3x3 + ..............
Z = Discriminant score
b1 = Discriminant weight for variable
x = Independent variable
As can be seen in the above, each independent variable is multiplied by its correspondingweightage.
This results in a single composite discriminant score for each individual. By taking the averageof discriminant score of the individuals within a certain group, we create a group mean. This isknown as centroid. If the analysis involves two groups, there are two centroids. This is verysimilar to multiple regression, except that different types of variables are involved.
Application
A company manufacturing FMCG products introduces a sales contest among its marketingexecutives to find out “How many distributors can be roped in to handle the company’s product”.Assume that this contest runs for three months. Each marketing executive is given target regardingnumber of new distributors and sales they can generate during the period. This target is fixedand based on the past sales achieved by them about which, the data is available in the company.It is also announced that marketing executives who add 15 or more distributors will be given aMaruti Omni-van as prize. Those who generate between 5 and 10 distributors will be given atwo-wheeler as the prize. Those who generate less than 5 distributors will get nothing. Nowassume that 5 marketing executives won a Maruti van and 4 won a two-wheeler.
The company now wants to find out, “Which activities of the marketing executive made thedifference in terms of winning a prize and not winning the prize”. One can proceed in a numberof ways. The company could compare those who won the Maruti van against the others.Alternatively, the company might compare those who won, one of the two prizes against thosewho won nothing. It might compare each group against each of the other two.
Discriminant analysis will highlight the difference in activities performed by each groupmembers to get the prize. The activity might include:
1. More number of calls made to the distributors.
2. More personal visits to the distributors with advance appointments.
3. Use of better convincing skills.
Discriminant analysis answers the following questions:
1. What variable discriminates various groups as above; the number of groups could be twoor more? Dealing with more than two groups is called Multiple Discriminant Analysis(M.D.A.).
2. Can discriminating variables be chosen to forecast the group to which the brand/person/place belong to?
3. Is it possible to estimate the size of different groups?
LOVELY PROFESSIONAL UNIVERSITY 287
Unit 13: Multivariate Analysis
NotesSPSS Commands for Discriminate Analysis
Input data has to be typed in an SPSS file.
1. Click on STATISTICS at the SPSS menu bar.
2. Click on CLASSIFY followed by DISCRIMINANT.
3. Dialogue box will appear. Select the GROUPING VARIABLE. This can be done by clickingon the right arrow to transfer them from the variable list on the left to the groupingvariable box on the right.
4. Define the range of values by clicking on DEFINE RANGE. Enter Minimum and Maximumvalue then click CONTINUE.
5. Select all the independent variable for discriminant analysis from the variable list byclicking on the arrow that transfers them to box on the right.
6. Click on STATISTICS on the lower part of main dialogue box. This will open up a smallerdialogue box.
7. Click on CLASSIFY on the lower part of the main dialogue box select SUMMARY TABLEunder the heading DISPLAY in a small dialogue box that appears.
8. Click OK to get the discriminant analysis output.
Self Assessment
Fill in the blanks:
4. In discriminant analysis, ....................... groups are compared.
5. If the discriminant analysis involves two groups, there are ....................... centroids.
13.3 Conjoint Analysis
Conjoint analysis is concerned with the measurement of the joint effect of two or more attributesthat are important from the customers’ point of view. In a situation where the company wouldlike to know the most desirable attributes or their combination for a new product or service, theuse of conjoint analysis is most appropriate.
Example: An airline would like to know, which is the most desirable combination ofattributes to a frequent traveller: (a) Punctuality (b) Air fare (c) Quality of food served on theflight and (d) Hospitality and empathy shown.
Conjoint Analysis is a multivariate technique that captures the exact levels of utility that anindividual customer places on various attributes of the product offering. Conjoint Analysisenables a direct comparison,
Example: A comparison between the utility of a price level of 400 versus 500, a deliveryperiod of 1 week versus 2 weeks, or an after-sales response of 24 hours versus 48 hours.
Once we know the utility levels for each attribute (and at individual levels as well), we cancombine these to find the best combination of attributes that gives the customer the highestutility, the second best combination that gives the second highest utility, and so on. Thisinformation is then used to design a product or service offering.
288 LOVELY PROFESSIONAL UNIVERSITY
Research Methodology
Notes Application
Conjoint Analysis is extremely versatile and the range of applications includes virtually in anyindustry. New product or service design, including the concepts in the pre-prototyping stagecan specifically benefit from the conjoint applications.
Some examples of other areas where this technique can be used are:
1. Designing an automobile loan or insurance plan in the insurance industry,
2. Designing a complex machine for business customers.
Process
Design attributes for a product are first identified. For a shirt manufacturer, these could bedesign such as designer shirts vs plain shirts, this price of 400 versus 800. The outlets can haveexclusive distribution or mass distribution. All possible combinations of these attribute levelsare then listed out. Each design combination will be ranked by customers and used as input datafor Conjoint Analysis. Then the utility of the products relative to price can be measured.
The output is a part-worth or utility for each level of each attribute. For example, the design mayget a utility level of 5 and plain, 7.5. Similarly, the exclusive distribution may have a part utilityof 2, and mass distribution, 5.8. We then put together the part utilities and come up with a totalutility for any product combination we want to offer, and compare that with the maximumutility combination for this customer segment.
This process clarifies to the marketer about the product or service regarding the attributes thatthey should focus on in the design.
If a retail store finds that the height of a shelf is an important attribute for selling at a particularlevel, a well-designed shelf may result from this knowledge. Similarly, a designer of clocks willbenefit from knowing the utility attached by customers to the dial size, background colours, andprice range of the clocks.
Approach
From a discussion with the client, identify the design attributes to be studied and the levels atwhich they can be offered. Then build a list of product concepts on offer. These product conceptsare then ranked by customers. Once this data is available, use Conjoint Analysis to derive thepart utilities of each attribute level. This is then used to predict the best product design for thegiven customer segment. Use the SPSS Conjoint procedure to analyse the data.
There are three steps in conjoint analysis:
1. Identification of relevant products or service attributes.
2. Collection of data.
3. Estimation of worth for the attribute chosen.
For attributes selection, the market researcher can conduct interview with the customers directly.
Example: Example of conjoint analysis for a Laptop:
For a laptop, consider 3 attributes:
1. Weight (3 Kg or 5 Kg)
2. Battery life (2 hours or 4 hours)
3. Brand name (Lenovo or Dell)
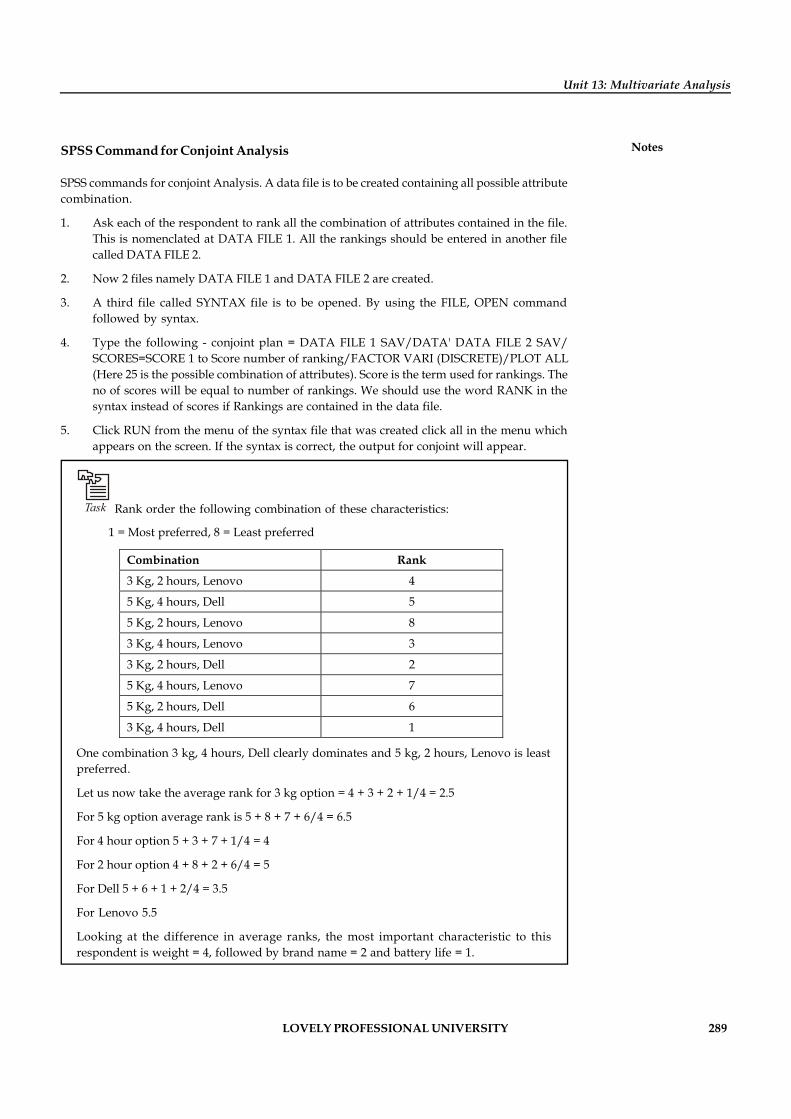
LOVELY PROFESSIONAL UNIVERSITY 289
Unit 13: Multivariate Analysis
NotesSPSS Command for Conjoint Analysis
SPSS commands for conjoint Analysis. A data file is to be created containing all possible attributecombination.
1. Ask each of the respondent to rank all the combination of attributes contained in the file.This is nomenclated at DATA FILE 1. All the rankings should be entered in another filecalled DATA FILE 2.
2. Now 2 files namely DATA FILE 1 and DATA FILE 2 are created.
3. A third file called SYNTAX file is to be opened. By using the FILE, OPEN commandfollowed by syntax.
4. Type the following - conjoint plan = DATA FILE 1 SAV/DATA' DATA FILE 2 SAV/SCORES=SCORE 1 to Score number of ranking/FACTOR VARI (DISCRETE)/PLOT ALL(Here 25 is the possible combination of attributes). Score is the term used for rankings. Theno of scores will be equal to number of rankings. We should use the word RANK in thesyntax instead of scores if Rankings are contained in the data file.
5. Click RUN from the menu of the syntax file that was created click all in the menu whichappears on the screen. If the syntax is correct, the output for conjoint will appear.
Task Rank order the following combination of these characteristics:
1 = Most preferred, 8 = Least preferred
Combination Rank
3 Kg, 2 hours, Lenovo 4
5 Kg, 4 hours, Dell 5
5 Kg, 2 hours, Lenovo 8
3 Kg, 4 hours, Lenovo 3
3 Kg, 2 hours, Dell 2
5 Kg, 4 hours, Lenovo 7
5 Kg, 2 hours, Dell 6
3 Kg, 4 hours, Dell 1
One combination 3 kg, 4 hours, Dell clearly dominates and 5 kg, 2 hours, Lenovo is leastpreferred.
Let us now take the average rank for 3 kg option = 4 + 3 + 2 + 1/4 = 2.5
For 5 kg option average rank is 5 + 8 + 7 + 6/4 = 6.5
For 4 hour option 5 + 3 + 7 + 1/4 = 4
For 2 hour option 4 + 8 + 2 + 6/4 = 5
For Dell 5 + 6 + 1 + 2/4 = 3.5
For Lenovo 5.5
Looking at the difference in average ranks, the most important characteristic to thisrespondent is weight = 4, followed by brand name = 2 and battery life = 1.
290 LOVELY PROFESSIONAL UNIVERSITY
Research Methodology
Notes Self Assessment
Fill in the blanks:
6. ....................... analysis is concerned with the measurement of the joint effect of two or moreattributes.
7. For ....................... selection, the market researcher can conduct interview with the customersdirectly.
8. The ....................... is a part-worth or utility for each level of each attribute.
13.4 Factor Analysis
The main purpose of Factor Analysis is to group large set of variable factors into fewer factors.Each factor will account for one or more component. Each factor a combination of many variables.There are two most commonly employed factor analysis procedures or methods. They are:
1. Principle component analysis
2. Common factor analysis.
When the objective is to summarise information from a large set of variables into fewer factors,principle component factor analysis is used. On the other hand, if the researcher wants to analysethe components of the main factor, common factor analysis is used.
Example: Common factor – Inconvenience inside a car. The components may be:
1. Leg room
2. Seat arrangement
3. Entering the rare seat
4. Inadequate dickey space
5. Door locking mechanism.
13.4.1 Principle Component Factor Analysis
Purposes: Customer feedback about a two-wheeler manufactured by a company.
Method: The MR manager prepares a questionnaire to study the customer feedback. The researcherhas identified six variables or factors for this purpose. They are as follows:
1. Fuel efficiency (A)
2. Durability (Life) (B)
3. Comfort (C)
4. Spare parts availability (D)
5. Breakdown frequency (E)
6. Price (F)
The questionnaire may be administered to 5,000 respondents. The opinion of the customer isgathered. Let us allot points 1 to 10 for the variables factors A to F. 1 is the lowest and 10 is thehighest. Let us assume that application of factor analysis has led to grouping the variables asfollows:
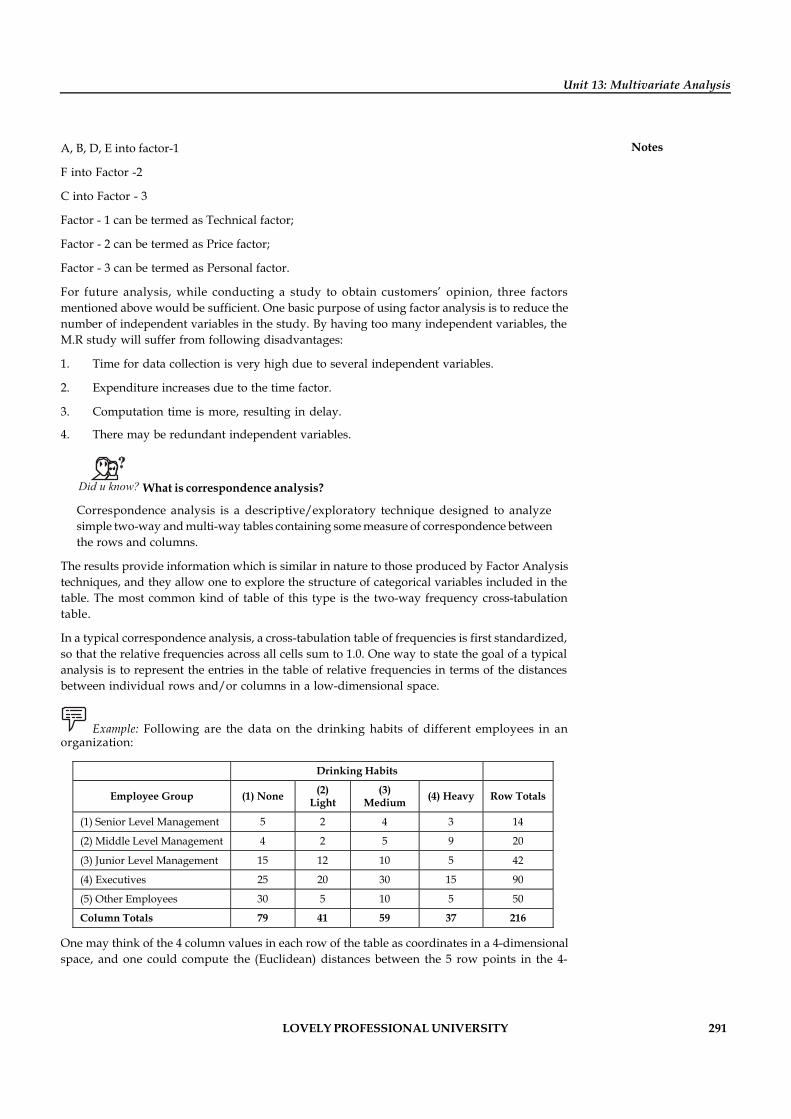
LOVELY PROFESSIONAL UNIVERSITY 291
Unit 13: Multivariate Analysis
NotesA, B, D, E into factor-1
F into Factor -2
C into Factor - 3
Factor - 1 can be termed as Technical factor;
Factor - 2 can be termed as Price factor;
Factor - 3 can be termed as Personal factor.
For future analysis, while conducting a study to obtain customers’ opinion, three factorsmentioned above would be sufficient. One basic purpose of using factor analysis is to reduce thenumber of independent variables in the study. By having too many independent variables, theM.R study will suffer from following disadvantages:
1. Time for data collection is very high due to several independent variables.
2. Expenditure increases due to the time factor.
3. Computation time is more, resulting in delay.
4. There may be redundant independent variables.
Did u know? What is correspondence analysis?
Correspondence analysis is a descriptive/exploratory technique designed to analyzesimple two-way and multi-way tables containing some measure of correspondence betweenthe rows and columns.
The results provide information which is similar in nature to those produced by Factor Analysistechniques, and they allow one to explore the structure of categorical variables included in thetable. The most common kind of table of this type is the two-way frequency cross-tabulationtable.
In a typical correspondence analysis, a cross-tabulation table of frequencies is first standardized,so that the relative frequencies across all cells sum to 1.0. One way to state the goal of a typicalanalysis is to represent the entries in the table of relative frequencies in terms of the distancesbetween individual rows and/or columns in a low-dimensional space.
Example: Following are the data on the drinking habits of different employees in anorganization:
Drinking Habits
Employee Group (1) None (2) Light
(3) Medium (4) Heavy Row Totals
(1) Senior Level Management 5 2 4 3 14
(2) Middle Level Management 4 2 5 9 20
(3) Junior Level Management 15 12 10 5 42
(4) Executives 25 20 30 15 90
(5) Other Employees 30 5 10 5 50
Column Totals 79 41 59 37 216
One may think of the 4 column values in each row of the table as coordinates in a 4-dimensionalspace, and one could compute the (Euclidean) distances between the 5 row points in the 4-
292 LOVELY PROFESSIONAL UNIVERSITY
Research Methodology
Notes dimensional space. The distances between the points in the 4-dimensional space summarize allinformation about the similarities between the rows in the table above. Now suppose one couldfind a lower-dimensional space, in which to position the row points in a manner that retains all,or almost all, of the information about the differences between the rows. You could then presentall information about the similarities between the rows (types of employees in this case) in asimple 1, 2, or 3-dimensional graph. While this may not appear to be particularly useful forsmall tables like the one shown above, one can easily imagine how the presentation andinterpretation of very large tables (e.g., differential preference for 10 consumer items among100 groups of respondents in a consumer survey) could greatly benefit from the simplificationthat can be achieved via correspondence analysis (e.g., represent the 10 consumer items in a two-dimensional space).
13.4.2 Rotation in Factor Analysis
Rotation is the step in factor analysis that permits you to identify meaningful factor names ordescriptions like these.
Linear Functions of Predictors
To identify with rotation, first consider a problem that doesn’t involve factor analysis. Supposeyou want to predict the grades of college students (all in the same college) in many dissimilarcourses, from their scores on general “verbal” and “math” skill tests. To build up predictiveformulas, you have a body of past data consisting of the grades of numerous hundred previousstudents in these courses, plus the scores of those students on the math and verbal tests. Topredict grades for present and future students, you might use these data from past students to fita series of two-variable multiple regressions, each regression forecasting grade in one coursefrom scores on the two skill tests.
At present suppose a co-worker suggests summing each student’s verbal and math scores toobtain a composite “academic skill” score I’ll call AS, and taking the difference among eachstudent’s verbal and math scores to obtain a second variable I’ll call VMD (verbal-math difference).The co-worker advises running the same set of regressions to predict grades in individualcourses, except using AS and VMD as predictors in each regression, instead of the original verbaland math scores. In this instance, you would get exactly the same predictions of course gradesfrom these two families of regressions: one predicting grades in individual courses from verbaland math scores, the other predicting the identical grades from AS and VMD scores. In fact, youwould get the same predictions if you formed composites of 3 math + 5 verbal and 5 verbal + 3math, and ran a series of two-variable multiple regressions forecasting grades from these twocomposites. These examples are all linear functions of the original verbal and math scores.
The vital point is that if you have m predictor variables, and you replace the m original predictorsby m linear functions of those predictors, you usually neither gain nor lose any information—you could if you wish use the scores on the linear functions to rebuild the scores on the originalvariables. But multiple regression uses whatever information you have in the optimum way (asmeasured by the sum of squared errors in the current sample) to forecast a new variable (e.g.grades in a particular course). Since the linear functions contain the same information as theoriginal variables, you get the similar predictions as before.
Specified that there are lots of ways to get exactly the same predictions, is there any advantageto using one set of linear functions rather than another? Yes there is; one set might be simplerthan another. One particular pair of linear functions may enable many of the course grades to beforecasted from just one variable (that is, one linear function) rather than from two. If we regardregressions with less predictor variables as simpler, then we can ask this question: Out of all the
LOVELY PROFESSIONAL UNIVERSITY 293
Unit 13: Multivariate Analysis
Notespossible pairs of predictor variables that would give the same predictions, which is simplest touse, in the logic of minimizing the number of predictor variables needed in the typical regression?The pair of predictor variables maximising some measure of minimalism could be said to havesimple structure. In this example involving grades, you might be able to predict grades in somecourses correctly from just a verbal test score, and predict grades in other courses accuratelyfrom just a math score. If so, then you would have achieved a “simpler structure” in yourpredictions than if you had used both tests for each and every predictions.
Simple Structure in Factor Analysis
The points of the preceding section are relevant when the predictor variables are factors. Thinkof the m factors F as a set of independent or predictor variables, and imagine of the p observedvariables X as a set of dependent or criterion variables. Think a set of p multiple regressions,each predicting one of the variables from all m factors. The standardized coefficients in this set ofregressions structure a p x m matrix called the factor loading matrix. If we replaced the originalfactors by a set of linear functions of those factors, we would get just the same predictions asbefore, but the factor loading matrix would be different. So we can ask which, of the manypossible sets of linear functions we might use, produces the simplest factor loading matrix.Specially we will define simplicity as the number of zeros or near-zero entries in the factorloading matrix—the more zeros, the simpler the structure. Rotation does not alter matrix C orU at all, but does transform the factor loading matrix.
In the intense case of simple structure, each X-variable will have merely one large entry, so thatall the others can be ignored. But that would be a simpler structure than you would usuallyexpect to achieve; after all, in the real world each variable isn’t in general affected by only oneother variable. You then name the factors subjectively, based on an examination of their loadings.
In common factor analysis the procedure of rotation is in fact somewhat more abstract that Ihave implied here, since you don’t actually know the individual scores of cases on factors.However, the statistics for a multiple regression that is mainly relevant here—the multiplecorrelation and the standardized regression slopes—can all be calculated just from the correlationsof the variables and factors involved. So we can base the calculations for rotation to simplestructure on just those correlations, devoid of using any individual scores.
A rotation which necessitates the factors to remain uncorrelated is an orthogonal rotation, whileothers are oblique rotations. Oblique rotations regularly achieve greater simple structure, thoughat the cost that you have to also consider the matrix of factor intercorrelations when interpretingresults. Manuals are usually clear which is which, but if there is ever any ambiguity, a simplerule is that if there is any capability to print out a matrix of factor correlations, then the rotationis oblique, as no such capacity is needed for orthogonal rotations.
Self Assessment
Fill in the blanks:
9. When the objective is to summarise information from a large set of variables into fewerfactors, ....................... analysis is used.
10. Correspondence analysis is a ....................... technique.
11. In a typical correspondence analysis, a cross-tabulation table of frequencies is first.......................
294 LOVELY PROFESSIONAL UNIVERSITY
Research Methodology
Notes 13.5 Cluster Analysis
Cluster Analysis is used:
1. To classify persons or objects into small number of clusters or group.
2. To identify specific customer segment for the company’s brand.
Cluster Analysis is a technique used for classifying objects into groups. This can be used to sortdata (a number of people, companies, cities, brands or any other objects) into homogeneousgroups based on their characteristics.
The result of Cluster Analysis is a grouping of the data into groups called clusters. The researchercan analyse the clusters for their characteristics and give the cluster, names based on these.
Where can Cluster Analysis be applied?
The marketing application of cluster analysis is in customer segmentation and estimation ofsegment sizes. Industries, where this technique is useful include automobiles, retail stores,insurance, B-to-B, durables and packaged goods. Some of the well-known frameworks in consumerbehaviour (like VALS) are based on value cluster analysis.
Cluster Analysis is applicable when:
1. An FMCG company wants to map the profile of its target audience in terms of life-style,attitude and perceptions.
2. A consumer durable company wants to know the features and services a consumer takesinto account, when purchasing through catalogues.
3. A housing finance corporation wants to identify and cluster the basic characteristics, life-styles and mindset of persons who would be availing housing loans. Clustering can bedone based on parameters such as interest rates, documentation, processing fee, numberof installments etc.
Process
There are two ways in which Cluster Analysis can be carried out:
1. First, objects/respondents are segmented into a pre-decided number of clusters. In thiscase, a method called non-hierarchical method can be used, which partitions data into thespecified number of clusters
2. The second method is called the hierarchical method.
The above two are basic approaches used in cluster analysis. This can be used to segmentcustomer groups for a brand or product category, or to segment retail stores into similar groupsbased on selected variables.
Interpretation of Results
Ideally, the variables should be measured on an interval or ratio scale. This is because theclustering techniques use the distance measure to find the closest objects to group into a cluster.An example of its use can be clustering of towns similar to each other which will help decidewhere to locate new retail stores.
If clusters of customers are found based on their attitudes towards new products and interest indifferent kinds of activities, an estimate of the segment size for each segment of the populationcan be obtained, by looking at the number of objects in each cluster.
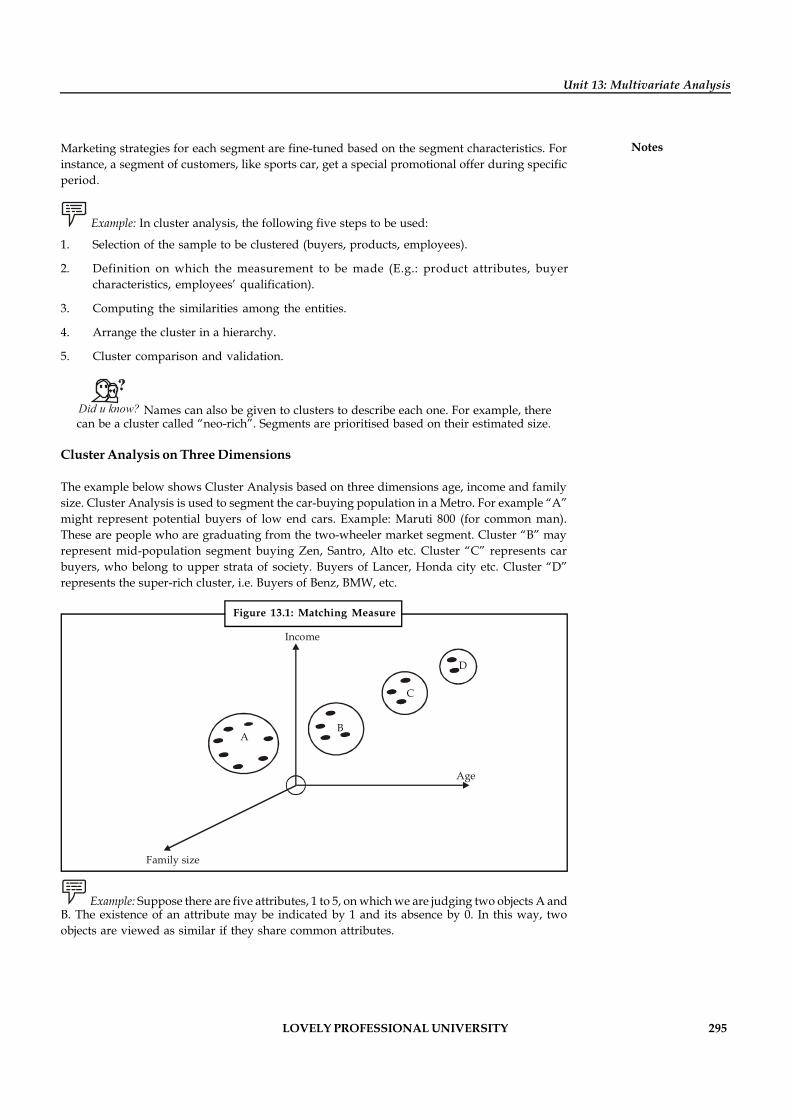
LOVELY PROFESSIONAL UNIVERSITY 295
Unit 13: Multivariate Analysis
NotesMarketing strategies for each segment are fine-tuned based on the segment characteristics. Forinstance, a segment of customers, like sports car, get a special promotional offer during specificperiod.
Example: In cluster analysis, the following five steps to be used:
1. Selection of the sample to be clustered (buyers, products, employees).
2. Definition on which the measurement to be made (E.g.: product attributes, buyercharacteristics, employees’ qualification).
3. Computing the similarities among the entities.
4. Arrange the cluster in a hierarchy.
5. Cluster comparison and validation.
Did u know? Names can also be given to clusters to describe each one. For example, therecan be a cluster called “neo-rich”. Segments are prioritised based on their estimated size.
Cluster Analysis on Three Dimensions
The example below shows Cluster Analysis based on three dimensions age, income and familysize. Cluster Analysis is used to segment the car-buying population in a Metro. For example “A”might represent potential buyers of low end cars. Example: Maruti 800 (for common man).These are people who are graduating from the two-wheeler market segment. Cluster “B” mayrepresent mid-population segment buying Zen, Santro, Alto etc. Cluster “C” represents carbuyers, who belong to upper strata of society. Buyers of Lancer, Honda city etc. Cluster “D”represents the super-rich cluster, i.e. Buyers of Benz, BMW, etc.
Figure 13.1: Matching Measure
B
C
D
Family size
Age
Income
A
Example: Suppose there are five attributes, 1 to 5, on which we are judging two objects A andB. The existence of an attribute may be indicated by 1 and its absence by 0. In this way, twoobjects are viewed as similar if they share common attributes.
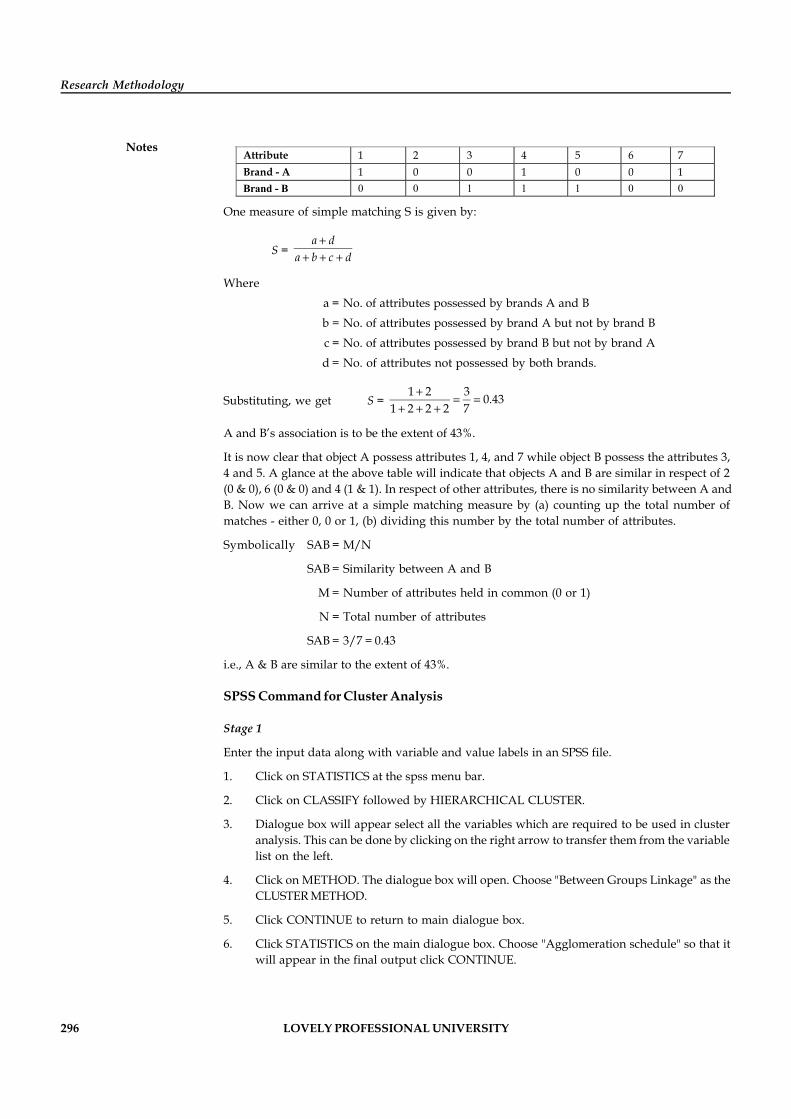
296 LOVELY PROFESSIONAL UNIVERSITY
Research Methodology
NotesAttribute 1 2 3 4 5 6 7 Brand - A 1 0 0 1 0 0 1 Brand - B 0 0 1 1 1 0 0
One measure of simple matching S is given by:
S = a d
a b c d+
+ + +
Wherea = No. of attributes possessed by brands A and Bb = No. of attributes possessed by brand A but not by brand Bc = No. of attributes possessed by brand B but not by brand Ad = No. of attributes not possessed by both brands.
Substituting, we get S = 1 2 3 0.43
1 2 2 2 7+
= =+ + +
A and B’s association is to be the extent of 43%.
It is now clear that object A possess attributes 1, 4, and 7 while object B possess the attributes 3,4 and 5. A glance at the above table will indicate that objects A and B are similar in respect of 2(0 & 0), 6 (0 & 0) and 4 (1 & 1). In respect of other attributes, there is no similarity between A andB. Now we can arrive at a simple matching measure by (a) counting up the total number ofmatches - either 0, 0 or 1, (b) dividing this number by the total number of attributes.
Symbolically SAB = M/N
SAB = Similarity between A and B
M = Number of attributes held in common (0 or 1)
N = Total number of attributes
SAB = 3/7 = 0.43
i.e., A & B are similar to the extent of 43%.
SPSS Command for Cluster Analysis
Stage 1
Enter the input data along with variable and value labels in an SPSS file.
1. Click on STATISTICS at the spss menu bar.
2. Click on CLASSIFY followed by HIERARCHICAL CLUSTER.
3. Dialogue box will appear select all the variables which are required to be used in clusteranalysis. This can be done by clicking on the right arrow to transfer them from the variablelist on the left.
4. Click on METHOD. The dialogue box will open. Choose "Between Groups Linkage" as theCLUSTER METHOD.
5. Click CONTINUE to return to main dialogue box.
6. Click STATISTICS on the main dialogue box. Choose "Agglomeration schedule" so that itwill appear in the final output click CONTINUE.
LOVELY PROFESSIONAL UNIVERSITY 297
Unit 13: Multivariate Analysis
Notes7. Choose DENDROGRAM then on the box called ICICLE, Choose "All Clusters" and "Vertical".
8. Click OK on the main dialogue box to get the output of the hierarchical cluster analysis.
Stage 2
This stage is used to know how many clusters are required. This stage is called K- MEANSCLUSTERING.
1. Click CLASSIFY, followed by K- FANS CLUSTER desired.
2. Fill in the desired number of clusters that has been identified from stage 1.
3. Click OPTIONS on the main dialogue box. Select "Initial Cluster Centers". Then clickCONTINUE to return to the main dialogue box.
4. Click OK on the main dialogue box to get the output which has final clusters.
Self Assessment
Fill in the blanks:
12. ....................... Analysis is a technique used for classifying objects into groups.
13. The ....................... application of cluster analysis is in customer segmentation and estimationof segment sizes.
13.6 Multidimensional Scaling (MDS)
In addition to fulfilling the goals of detecting underlying structure and data reduction that isshares with other methods, multidimensional scaling (MDS) provides the researcher with aspatial representation of data that can facilitate interpretation and reveal relationships. Therefore,we can define MDS as “a set of multivariate statistical methods for estimating the parameters inand assessing the fit of various spatial distance models for proximity data.”
The spatial display of data provided by MDS is why it is also sometimes referred to as perceptualmapping. MDS has much more flexibility about the types of data that can be used to generate thesolution. Almost any measures of similarity and dissimilarity can be used, depending on whatyour statistical computer software will accept.
Types of MDS
In general, there are two types of MDS:
1. Metric
2. Non-metric
Metric MDS makes the assumption that the input data is either ratio or interval data, while thenon-metric model requires simply that the data be in the form of ranks. Therefore, the non-metric model has more fewer restrictions than the metric model, but also less rigor. One techniqueto use if you are unsure whether your data is ordinal or can be considered interval is to try bothmetric and non-metric models. If the results are very close, the metric model may be used.
An advantage of the non-metric models is that they permit the researcher to categorize andexamine preference data, such as the kind obtained in marketing studies or other areas wherecomparisons are useful.
Another technique, correspondence analysis, can work with categorical data, i.e., data at thenominal level of measurement, however that technique will not be described here.
298 LOVELY PROFESSIONAL UNIVERSITY
Research Methodology
Notes
Notes Similarities and Differences between Factor Analysis and MDS
We have already seen that MDS can accept more different measures of similarity anddissimilarity than factor analysis techniques can. In addition, there are some differences interminology. These differences reflect the origin of MDS in the field of psychology. Themeasure corresponding to factors are called alternatively dimensions or stimuluscoordinates.
The output of MDS looks very similar to that of factor analysis and the determination ofthe optimal number of dimensions is handled in much the same way.
Steps in using MDS
There are four basic steps in MDS:
1. Data collection and formation of the similarity/dissimilarity matrix
2. Extraction of stimulus coordinates
3. Decision about the number of stimulus coordinates that represent the data
4. Rotation and interpretation
Example: Let us say that you have a matrix of distances between a number of major cities,such as you might find on the back of a road map. These distances can be used as the input datato derive an MDS solution. When the results are mapped in two dimensions, the solution willreproduce a conventional map, except that the MDS plot might need to be rotated so that thenorth-south and east-west dimensions conform to expectations. However, the once the rotationis completed, the configuration of the cities will be spatially correct.
Self Assessment
Fill in the blanks:
14. An advantage of the non-metric models is that they permit the researcher to .......................and ....................... preference data.
15. The spatial display of data provided by MDS is also sometimes referred to as ………………..
13.7 Summary
Multivariate analysis is used if there are more than 2 variables.
Some of the multi variate analysis are discriminant analysis, Factor analysis, Clusteranalysis, conjoint analysis, and multi dimensional scaling.
In discriminant analysis, it is verified whether the 2 groups differ from one another.
Factor analysis is used to reduce large no of various factors into fewer variables clusteranalysis is used to segmenting the market or to identify the target group.
Regression is a term used for predicting the value of one variable from the other.
Least square method is used to fit the line.
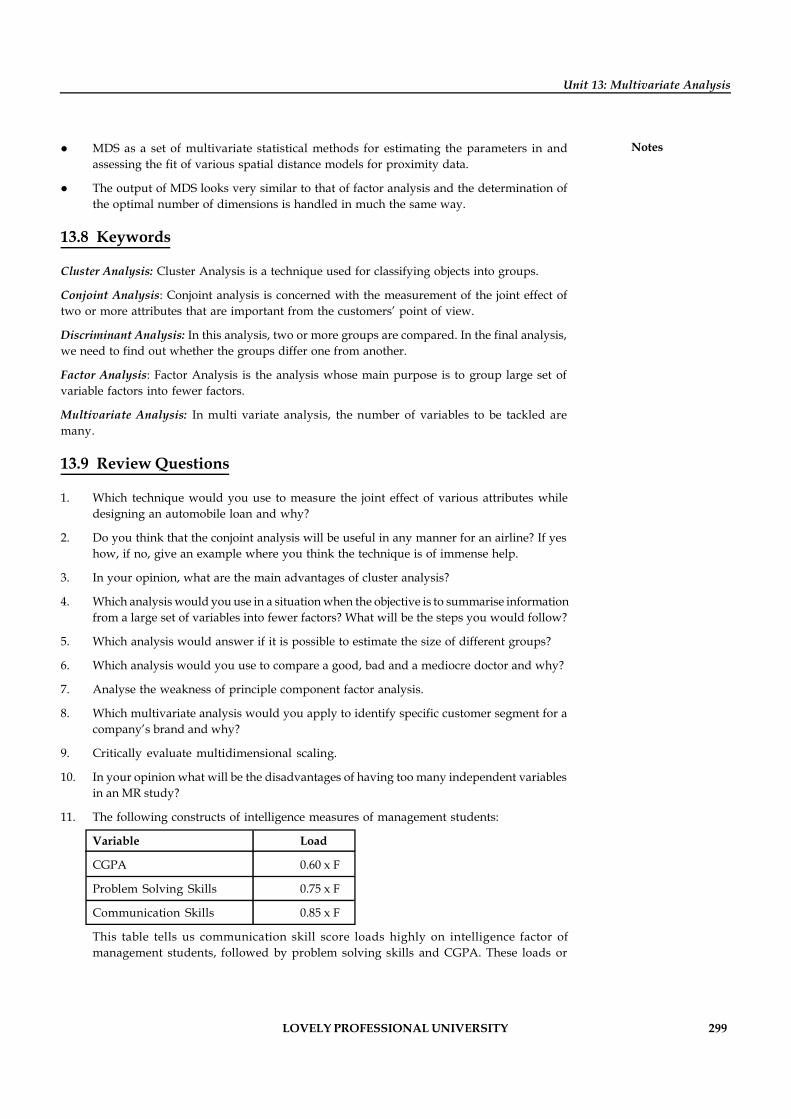
LOVELY PROFESSIONAL UNIVERSITY 299
Unit 13: Multivariate Analysis
Notes MDS as a set of multivariate statistical methods for estimating the parameters in andassessing the fit of various spatial distance models for proximity data.
The output of MDS looks very similar to that of factor analysis and the determination ofthe optimal number of dimensions is handled in much the same way.
13.8 Keywords
Cluster Analysis: Cluster Analysis is a technique used for classifying objects into groups.
Conjoint Analysis: Conjoint analysis is concerned with the measurement of the joint effect oftwo or more attributes that are important from the customers’ point of view.
Discriminant Analysis: In this analysis, two or more groups are compared. In the final analysis,we need to find out whether the groups differ one from another.
Factor Analysis: Factor Analysis is the analysis whose main purpose is to group large set ofvariable factors into fewer factors.
Multivariate Analysis: In multi variate analysis, the number of variables to be tackled aremany.
13.9 Review Questions
1. Which technique would you use to measure the joint effect of various attributes whiledesigning an automobile loan and why?
2. Do you think that the conjoint analysis will be useful in any manner for an airline? If yeshow, if no, give an example where you think the technique is of immense help.
3. In your opinion, what are the main advantages of cluster analysis?
4. Which analysis would you use in a situation when the objective is to summarise informationfrom a large set of variables into fewer factors? What will be the steps you would follow?
5. Which analysis would answer if it is possible to estimate the size of different groups?
6. Which analysis would you use to compare a good, bad and a mediocre doctor and why?
7. Analyse the weakness of principle component factor analysis.
8. Which multivariate analysis would you apply to identify specific customer segment for acompany’s brand and why?
9. Critically evaluate multidimensional scaling.
10. In your opinion what will be the disadvantages of having too many independent variablesin an MR study?
11. The following constructs of intelligence measures of management students:
Variable Load
CGPA 0.60 x F
Problem Solving Skills 0.75 x F
Communication Skills 0.85 x F
This table tells us communication skill score loads highly on intelligence factor ofmanagement students, followed by problem solving skills and CGPA. These loads or
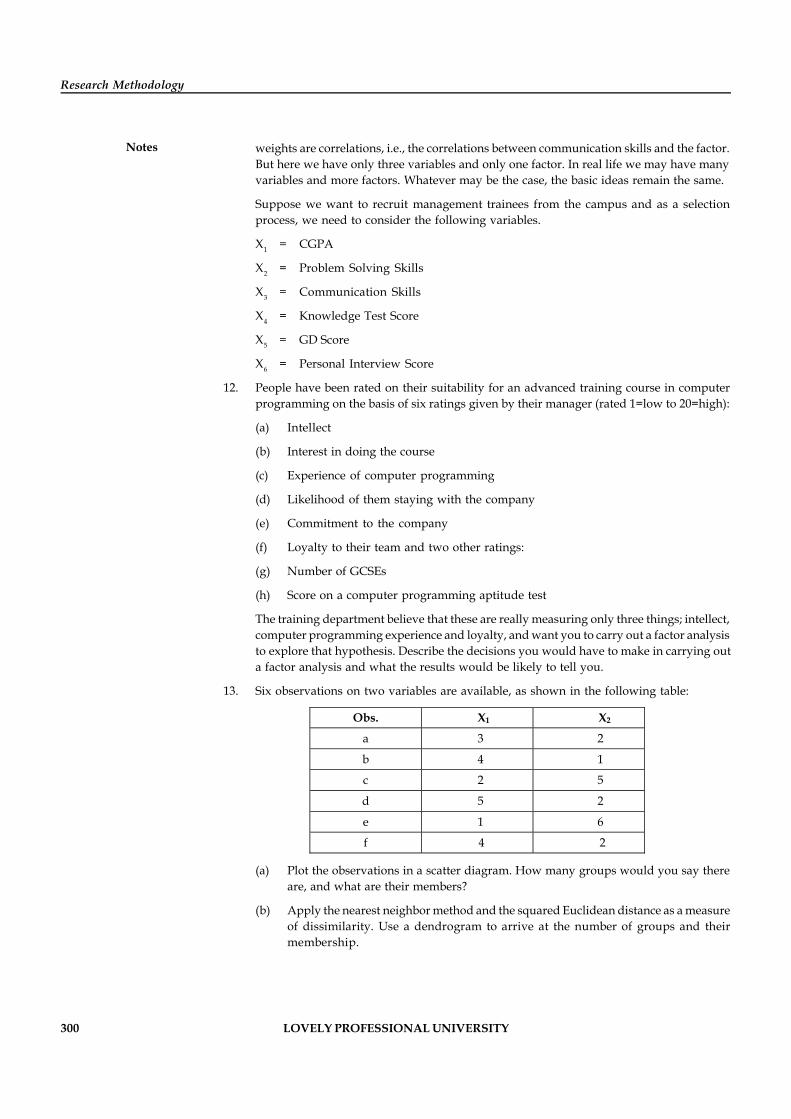
300 LOVELY PROFESSIONAL UNIVERSITY
Research Methodology
Notes weights are correlations, i.e., the correlations between communication skills and the factor.But here we have only three variables and only one factor. In real life we may have manyvariables and more factors. Whatever may be the case, the basic ideas remain the same.
Suppose we want to recruit management trainees from the campus and as a selectionprocess, we need to consider the following variables.
X1 = CGPA
X2 = Problem Solving Skills
X3 = Communication Skills
X4 = Knowledge Test Score
X5 = GD Score
X6 = Personal Interview Score
12. People have been rated on their suitability for an advanced training course in computerprogramming on the basis of six ratings given by their manager (rated 1=low to 20=high):
(a) Intellect
(b) Interest in doing the course
(c) Experience of computer programming
(d) Likelihood of them staying with the company
(e) Commitment to the company
(f) Loyalty to their team and two other ratings:
(g) Number of GCSEs
(h) Score on a computer programming aptitude test
The training department believe that these are really measuring only three things; intellect,computer programming experience and loyalty, and want you to carry out a factor analysisto explore that hypothesis. Describe the decisions you would have to make in carrying outa factor analysis and what the results would be likely to tell you.
13. Six observations on two variables are available, as shown in the following table:
Obs. X1 X2
a 3 2
b 4 1
c 2 5
d 5 2
e 1 6
f 4 2
(a) Plot the observations in a scatter diagram. How many groups would you say thereare, and what are their members?
(b) Apply the nearest neighbor method and the squared Euclidean distance as a measureof dissimilarity. Use a dendrogram to arrive at the number of groups and theirmembership.
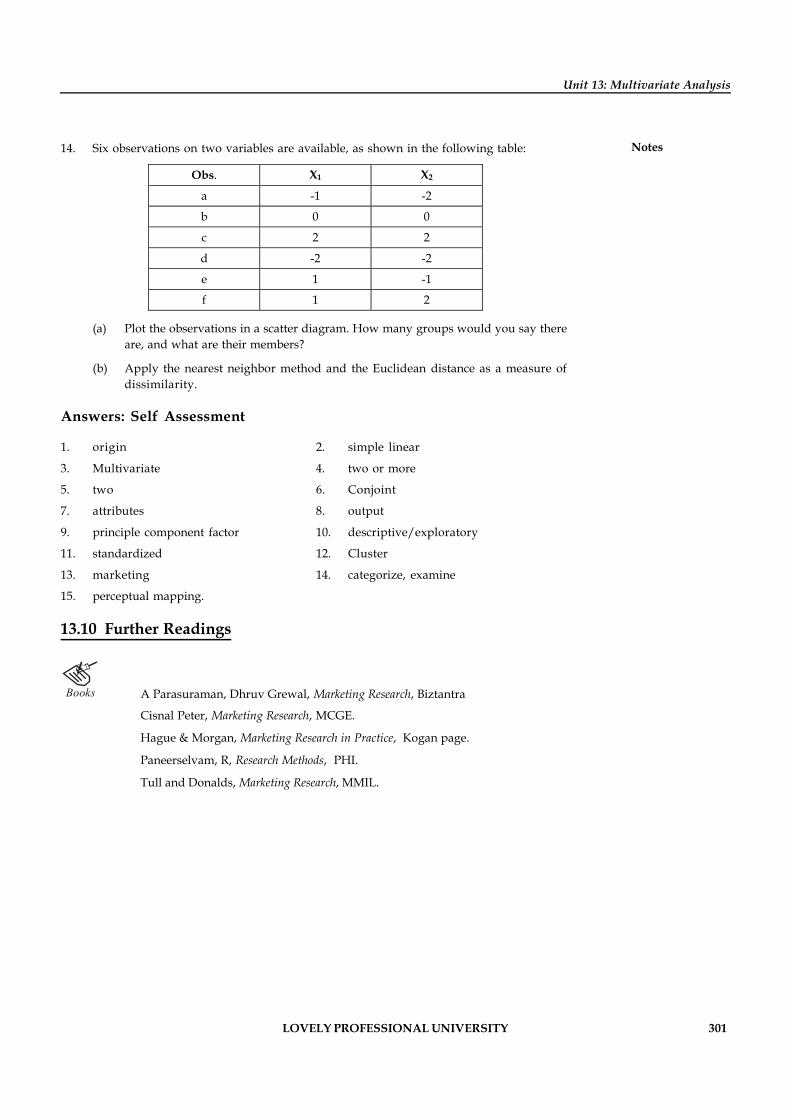
LOVELY PROFESSIONAL UNIVERSITY 301
Unit 13: Multivariate Analysis
Notes14. Six observations on two variables are available, as shown in the following table:
Obs. X1 X2
a -1 -2
b 0 0
c 2 2
d -2 -2
e 1 -1
f 1 2
(a) Plot the observations in a scatter diagram. How many groups would you say thereare, and what are their members?
(b) Apply the nearest neighbor method and the Euclidean distance as a measure ofdissimilarity.
Answers: Self Assessment
1. origin 2. simple linear
3. Multivariate 4. two or more
5. two 6. Conjoint
7. attributes 8. output
9. principle component factor 10. descriptive/exploratory
11. standardized 12. Cluster
13. marketing 14. categorize, examine
15. perceptual mapping.
13.10 Further Readings
Books A Parasuraman, Dhruv Grewal, Marketing Research, Biztantra
Cisnal Peter, Marketing Research, MCGE.
Hague & Morgan, Marketing Research in Practice, Kogan page.
Paneerselvam, R, Research Methods, PHI.
Tull and Donalds, Marketing Research, MMIL.
302 LOVELY PROFESSIONAL UNIVERSITY
Research Methodology
Notes Unit 14: Report Writing
CONTENTS
Objectives
Introduction
14.1 Characteristics of Research Report
14.1.1 Substantive Characteristics
14.1.2 Semantic Characteristics
14.2 Significance of Report Writing
14.3 Techniques and Precautions of Interpretation
14.3.1 Basic Analysis of "Quantitative" Information
14.3.2 Basic Analysis of "Qualitative" Information
14.3.3 Interpreting Information
14.3.4 Precautions
14.4 Types of Report
14.4.1 Oral Report
14.4.2 Written Report
14.4.3 Distinguish between Oral and Written Report
14.5 Preparation of Research Report
14.5.1 How to Write a Bibliography?
14.6 Style, Layout and Precautions of the Report writing
14.6.1 Style of Report Writing
14.6.2 Layout of the Report
14.6.3 Precautions in Report Writing
14.7 Summary
14.8 Keywords
14.9 Review Questions
14.10 Further Readings
Objectives
After studying this unit, you will be able to:
Explain the meaning and characteristics of research report
Recognize the significance of report writing
Describe the techniques and precaution of interpretation
Discuss the layout of report
Categorize different types of report
LOVELY PROFESSIONAL UNIVERSITY 303
Unit 14: Report Writing
NotesIntroduction
A report is a very formal document that is written for a variety of purposes, generally in thesciences, social sciences, engineering and business disciplines. Generally, findings pertaining toa given or specific task are written up into a report. It should be noted that reports are consideredto be legal documents in the workplace and, thus, they need to be precise, accurate and difficultto misinterpret.
There are three features that, together, characterize report writing at a very basic level: a predefinedstructure, independent sections, and reaching unbiased conclusions.
Predefined structure: Broadly, these headings may indicate sections within a report, suchas an introduction, discussion, and conclusion.
Independent sections: Each section in a report is typically written as a stand-alone piece, sothe reader can selectively identify the report sections they are interested in, rather thanreading the whole report through in one go from start to finish.
Unbiased conclusions: A third element of report writing is that it is an unbiased andobjective form of writing.
14.1 Characteristics of Research Report
Characteristics feature is an integral part of the report. There is no hard and fast rule for preparinga research report. The research report will differ based on the need of the particular managersusing the report. The report also depends on the philosophy of the researcher.
Example: A report prepared for a government agency will be different from the one preparedfor a private organization.
In spite of the fact that, marketing report is influenced by the researcher, there are certaincharacteristics which the report should possess, if it is to be effectively communicated. Thesecharacteristics can be classified as:
i. Substantive characteristics
ii. Semantic characteristics.
14.1.1 Substantive Characteristics
Substantive characteristics are:
Accuracy
Currency
Sufficiency
Availability
Relevancy
The more that the report possesses the above characteristics, the greater is its practical value indecision making.
Accuracy: Accuracy refers to the degree to which information reflects reality. Specifically, researchreport must accurately present both research procedure and research results. Even if the researchresults are not as per the expectation of the management, the researcher has the professional

304 LOVELY PROFESSIONAL UNIVERSITY
Research Methodology
Notes obligation to present the findings accurately and objectively. Less accurate report means, injusticeto the management.
Currency: Currency refers to the time span between completion of the research project andpresentation of the research report to management. If the management receives the researchreport too late, the results are no longer valid due to environmental changes, and then the reportwill have no or little value for decision making. Currency is one of the reasons for orally orinformally communicating preliminary research results to management to ensure timely decisionmaking.
Sufficiency: The research report must have sufficient details, so that important and valid decisioncan be made. Sometimes the sample size, sample representativeness may act as a constraint forsufficient details not being available.
Example: Data required by the management, say segment wise market, whereas overallmarket data is available.
Notes A research report must document methodology and techniques used so that anassessment can be made regarding validity, reliability and generalizability. Therefore,sufficiency refers to whether enough information is present in the research report toenable the manager to take valid decision.
It should be remembered that sufficiency characteristic does not mean that all possible researchproject information must be incorporated in the research report. A researcher should include ina report only that information, which is necessary to convey complete perspective of the researchproject.
Availability: The fourth important characteristic of research report is that, it is available to theappropriate decision maker when they need it. Availability refers to the communication processbetween researcher and the decision maker. We use the word 'appropriate decision maker' toemphasize the fact "who should or who should not have access to the report". This decision ismade by the management, and it is the duty of the researcher to carry out this decision. Mostreports carry confidential information. Therefore, it is necessary to restrict the report availability,to individuals as well as outside of an organization to prevent the competitor from havingaccess to it.
Relevancy: The research report should be confined to the decision issue researched. Sometimesthe researcher might include some information, which he thinks is interesting, but may nothave any relevance. This type of information should be excluded from the report.
Example: A researcher may be preparing a report on the audience perception of RJs(Radio Jockeys). This may be done with a view to recruit them based on the perception. In thiscontext, a lengthy commentary on relative audience appeal of each radio station is included.This type of data may be readily available from some research agency, who is selling commercialdata. Therefore, including this type of aspect may not be necessary.
14.1.2 Semantic Characteristics
Semantic characteristics are equally important in report. The report should be grammaticallycorrect. It should be free from spelling and typing errors. This will ensure that there is noambiguity or misunderstanding. Assistance of a proof reader, other than the researcher wouldbe required to eliminate the above errors.
LOVELY PROFESSIONAL UNIVERSITY 305
Unit 14: Report Writing
Notesi. Creative expressions in the form of superlatives, similes should be avoided.
ii. The report should be concise.
iii. Jargon of any kind should be avoided.
iv. Common words with multiple meaning should be avoided.
v. Language of the report must be simple. For example, sentences like "illumination must beextinguished when premises are not in use" can be expressed in simple words say "switchoff the lights when you leave".
vi. Avoid using 'I' 'we'. The report should be more impersonal.
vii. Sometimes, the current research uses the data of research conducted in the past. In this caseit is better to use past tense than present tense.
The following are the hindrances for clarity of any research report.
Ambiguity
Jargon
Misspelled words
Excessive prediction
Improper punctuation
Unfamiliar words
Clerical error
Some of the illustrations that can cause inaccuracy in report writing are given below:
Addition/subtraction error: Assume that a survey was conducted to ascertain the incomeof various strata of population in a city. Suppose, it is found that 15% belong to super rich,18% belong to rich class, 61% belong to middle class.
By oversight the total is recorded as (15+61+18) which is not equal to hundred. This errorcan be corrected easily by the researcher. This type of error leads to confusion because thereader or decision maker does not know which categories are left out (may be lowermiddle class and lower class).
Confusion between percentage and percentage points: Suppose the report indicates thatraw material cost of a product as a percentage of total cost increased from 8 percentagepoints in 2003 to 10 percentage points in 2009. Therefore, the raw material cost has increasedby only 2 percentage points in 6 years. The real increase is 2 percentage points or25 percent.
Wrong conclusion: Mr. X annual income has increased from 20,000 to 40,000 in 8 years.Therefore, the conclusion is, since income has doubled, the purchasing power also hasdoubled. This may not be true because due to inflation in 8 years, purchasing power mightcome down or money value could get eroded.
Self Assessment
Fill in the blanks:
1. The research report will differ based on the …………of the particular managers using thereport.
2. Accuracy refers to the degree to which information reflects……………..
306 LOVELY PROFESSIONAL UNIVERSITY
Research Methodology
Notes 3. Availability refers to the communication process between researcher and the………………..
4. …………….refers to the time span between completion of the research project andpresentation of the research report to management
14.2 Significance of Report Writing
Preparation and presentation of a research report is the most important part of the researchprocess. No matter how brilliant the hypothesis and how well designed is the research study,they are of little value unless communicated effectively to others in the form of a researchreport. Moreover, if the report is confusing or poorly written, the time and effort spent ongathering and analysing data would be wasted. It is therefore, essential to summarise andcommunicate the result to the management in the form of an understandable and logical researchreport.
Research report is regarded as a major component of the research study for the research taskremains unfinished till the report has been presented and/or written. As a matter of fact eventhe most brilliant hypothesis, very well designed and conducted research study, and the moststriking generalizations and findings are of modest value unless they are effectively communicatedto others. The rationale of research is not well served unless the findings are made known toothers. Research results must customarily enter the general store of knowledge. All this explainsthe importance of writing research report. There are people who do not consider writing ofreport as an essential part of the research process. But the general opinion is in favour of treatingthe presentation of research results or the writing of report as division and parcel of the researchproject. Writing of report is the final step in a research study and requires a set of skills somewhatdifferent from those called for in respect of the former stages of research. This task should beaccomplished by the researcher with extreme care; he may seek the assistance and guidance ofexperts for the reason.
Self Assessment
Fill in the blanks:
5. …………………is regarded as a major component of the research study
6. Writing of report is the ………..step in a research study and requires a set of skills somewhatdifferent from those called for in respect of the former stages of research.
14.3 Techniques and Precautions of Interpretation
Interpretation means bringing out the meaning of data. We can also say that interpretation isto convert data into information. The essence of any research is to do interpretation aboutthe study. This requires a high degree of skill. There are two methods of drawing conclusions(i) induction (ii) deduction.
In the induction method, one starts from observed data and then generalisation is done whichexplains the relationship between objects observed.
On the other hand, deductive reasoning starts from some general law and is then applied to aparticular instance i.e., deduction comes from the general to a particular situation.
Example:
Example of Induction: All products manufactured by Sony are excellent. DVD player model 2602MX is made by Sony. Therefore, it must be excellent.
LOVELY PROFESSIONAL UNIVERSITY 307
Unit 14: Report Writing
NotesExample of Deduction: All products have to reach decline stage one day and become obsolete. Thisradio is in decline mode. Therefore, it will become obsolete.
During the inductive phase, we reason from observation. During the deductive phase, we reasontowards the observation. Successful interpretation depends on how well the data is analysed. Ifdata is not properly analysed, the interpretation may go wrong. If analysis has to be corrected,then data collection must be proper. Similarly, if the data collected is proper but analysedwrongly, then too the interpretation or conclusion will be wrong. Sometimes, even with theproper data and proper analysis, the data can still lead to wrong interpretation. Interpretationdepends upon the experience of the researcher and methods used by him for interpretation.
Did u know? Both logic and observation are essential for interpretation.
Example: A detergent manufacturer is trying to decide which of the three sales promotionmethods (discount, contest, buy one get one free) would be most effective in increasing the sales.Each sales promotion method is run at different times in different cities. The sales obtained bythe different sale promotion methods is as follows.
Sales Impact of Different Sale Promotion Methods
Sales Promotion Method Sales Associated with Sales Promotion
1 2,000
2 3,500
3 2,510
The results may lead us to the conclusion that the second sales promotion method was the mosteffective in developing sales. This may be adopted nationally to promote the product. But onecannot say that the same method of sales promotion will be effective in each and every cityunder study.
14.3.1 Basic Analysis of "Quantitative" Information
(for information other than commentary, e.g., ratings, rankings, yes's, no's, etc.)
Make copies of your data and store the master copy away. Use the copy for making edits,cutting and pasting, etc.
Tabulate the information, i.e., add up the number of ratings, rankings, yes's, no's for eachquestion.
For ratings and rankings, consider computing a mean, or average, for each question. Forexample, "For question #1, the average ranking was 2.4". This is more meaningful thanindicating, e.g., how many respondents ranked 1, 2, or 3.
Consider conveying the range of answers, e.g., 20 people ranked "1", 30 ranked "2", and 20people ranked "3".
14.3.2 Basic Analysis of "Qualitative" Information
(respondents' verbal answers in interviews, focus groups, or written commentary onquestionnaires):
308 LOVELY PROFESSIONAL UNIVERSITY
Research Methodology
Notes Read through all the data.
Organize comments into similar categories, e.g., concerns, suggestions, strengths,weaknesses, similar experiences, program inputs, recommendations, outputs, outcomeindicators, etc.
Label the categories or themes, e.g., concerns, suggestions, etc.
Attempt to identify patterns, or associations and causal relationships in the themes, e.g.,all people who attended programs in the evening had similar concerns, most people camefrom the same geographic area, most people were in the same salary range, what processesor events respondents experience during the program, etc.
Keep all commentary for several years after completion in case needed for future reference.
14.3.3 Interpreting Information
Attempt to put the information in perspective, e.g., compare results to what you expected,promised results; management or program staff; any common standards for your productsor services; original goals (especially if you're conducting a program evaluation);indications or measures of accomplishing outcomes or results (especially if you'reconducting an outcomes or performance evaluation); description of the program'sexperiences, strengths, weaknesses, etc. (especially if you're conducting a processevaluation).
Consider recommendations to help employees improve the program, product or service;conclusions about program operations or meeting goals, etc.
Record conclusions and recommendations in a report, and associate interpretations tojustify your conclusions or recommendations.
14.3.4 Precautions
1. Keep the main objective of research in mind.
2. Analysis of data should start from simpler and more fundamental aspects.
3. It should not be confusing.
4. The sample size should be adequate.
5. Take care before generalising of the sample studied.
6. Give due attention to significant questions.
Caution: In report writing, do not miss the significance of some answers, because they are foundfrom very few respondents, such as "don't know" or "can't say".
Self Assessment
Fill in the blanks:
7. ………………means bringing out the meaning of data.
8. Successful interpretation depends on how well the data is……………...
9. In the ………………method, one starts from observed data and then generalisation is done
LOVELY PROFESSIONAL UNIVERSITY 309
Unit 14: Report Writing
Notes14.4 Types of Report
There are two types of reports (1) Oral report (2) Written report.
14.4.1 Oral Report
This type of reporting is required, when the researchers are asked to make an oral presentation.Making an oral presentation is somewhat difficult compared to the written report. This isbecause the reporter has to interact directly with the audience. Any faltering during an oralpresentation can leave a negative impression on the audience. This may also lower the self-confidence of the presenter. In an oral presentation, communication plays a big role. A lot ofplanning and thinking is required to decide 'What to say', 'How to say', 'How much to say'. Also,the presenter may have to face a barrage of questions from the audience. A lot of preparation isrequired; the broad classification of an oral presentation is as follows.
Nature of an Oral Presentation
Opening: A brief statement can be made on the nature of discussion that will follow. The openingstatement should explain the nature of the project, how it came about and what was attempted.
Finding/Conclusion: Each conclusion may be stated backed up by findings.
Recommendation: Each recommendation must have the support of conclusion. At the end of thepresentation, question-answer session should follow from the audience.
Method of presentation: Visuals, if need to be exhibited, can be made use of. The use of tabularform for statistical information would help the audience.
(a) What type of presentation is a root question? Is it read from a manuscript or memorized ordelivered ex-tempo. Memorization is not recommended, since there could be a slip duringpresentation. Secondly, it produces speaker-centric approach. Even reading from the manuscriptis not recommended, because it becomes monotonous, dull and lifeless. The best way to deliverin ex-tempo, is to make main points notes, so that the same can be expanded. Logical sequencesshould be followed.
Notes Points to remember in oral presentation:
1. Language used must be simple and understandable.
2. Time Management should be adhered.
3. Use of charts, graph, etc., will enhance understanding by the audience.
4. Vital data such as figures may be printed and circulated to the audience so that theirability to comprehend increases, since they can refer to it when the presentation isgoing on.
5. The presenter should know his target audience well in advance to prepare tailor-made presentation.
6. The presenter should know the purpose of report such as "Is it for making a decision","Is it for the sake of information", etc.
310 LOVELY PROFESSIONAL UNIVERSITY
Research Methodology
Notes 14.4.2 Written Report
Following are the Various Types of Written Reports:
(A) Reports can be classified based on the time-interval such as:
(1) Daily
(2) Weekly
(3) Monthly
(4) Quarterly
(5) Yearly
(B) Type of reports:
(1) Short report
(2) Long report
(3) Formal report
(4) Informal report
(5) Government report
1. Short report: Short reports are produced when the problem is very well defined and if thescope is limited. For example, Monthly sales report. It will run into about five pages. Itconsists of report about the progress made with respect to a particular product in a clearlyspecified geographical locations.
2. Long report: This could be both a technical report as well as non-technical report. This willpresent the outcome of the research in detail.
(a) Technical report: This will include the sources of data, research procedure, sampledesign, tools used for gathering data, data analysis methods used, appendix,conclusion and detailed recommendations with respect to specific findings. If anyjournal, paper or periodical is referred, such references must be given for the benefitof reader.
(b) Non-technical report: This report is meant for those who are not technically qualified.E.g. Chief of the finance department. He may be interested in financial implicationsonly, such as margins, volumes, etc. He may not be interested in the methodology.
3. Formal report:
Example: The report prepared by the marketing manager to be submitted to the Vice-President (marketing) on quarterly performance, reports on test marketing.
4. Informal report: The report prepared by the supervisor by way of filling the shift logbook, to be used by his colleagues.
5. Government report: These may be prepared by state governments or the central governmenton a given issue.
Example: Programme announced for rural employment strategy as a part of five-year plan.
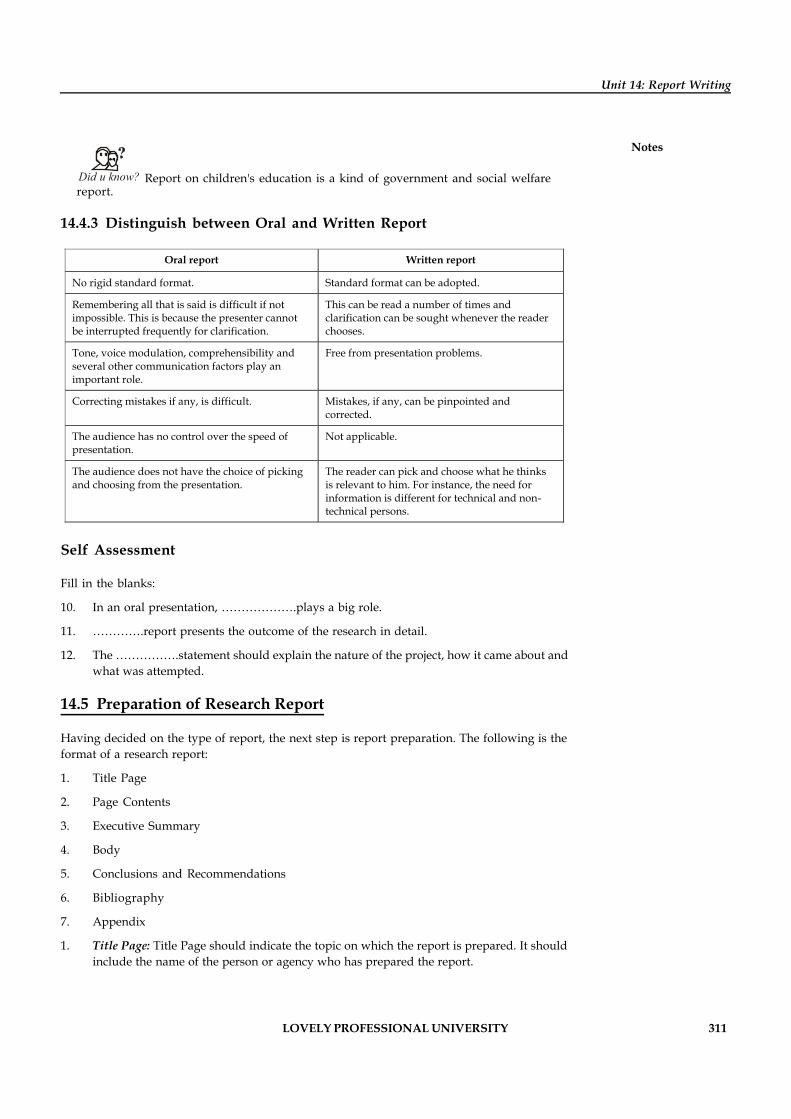
LOVELY PROFESSIONAL UNIVERSITY 311
Unit 14: Report Writing
Notes
Did u know? Report on children's education is a kind of government and social welfarereport.
14.4.3 Distinguish between Oral and Written Report
Oral report Written report
No rigid standard format. Standard format can be adopted.
Remembering all that is said is difficult if not impossible. This is because the presenter cannot be interrupted frequently for clarification.
This can be read a number of times and clarification can be sought whenever the reader chooses.
Tone, voice modulation, comprehensibility and several other communication factors play an important role.
Free from presentation problems.
Correcting mistakes if any, is difficult. Mistakes, if any, can be pinpointed and corrected.
The audience has no control over the speed of presentation.
Not applicable.
The audience does not have the choice of picking and choosing from the presentation.
The reader can pick and choose what he thinks is relevant to him. For instance, the need for information is different for technical and non-technical persons.
Self Assessment
Fill in the blanks:
10. In an oral presentation, ……………….plays a big role.
11. ………….report presents the outcome of the research in detail.
12. The …………….statement should explain the nature of the project, how it came about andwhat was attempted.
14.5 Preparation of Research Report
Having decided on the type of report, the next step is report preparation. The following is theformat of a research report:
1. Title Page
2. Page Contents
3. Executive Summary
4. Body
5. Conclusions and Recommendations
6. Bibliography
7. Appendix
1. Title Page: Title Page should indicate the topic on which the report is prepared. It shouldinclude the name of the person or agency who has prepared the report.
312 LOVELY PROFESSIONAL UNIVERSITY
Research Methodology
Notes 2. Table of Contents: The table of contents will help the reader to know "what the reportcontains". The table of contents should indicate the various parts or sections of the report.It should also indicate the chapter headings along with the page number.
Chapter no. Title of the chapter Page no.
1 2 3 4 5 6
Declaration Certificates Acknowledgement Executive summary Introduction to the project Research design and methodology Theoretical perspective of the study Company and industry profile Data analysis and interpretation Summary of findings, suggestions and conclusions Bibliography Appendix
3. Executive Summary: If your report is long and drawn out, the person to whom you haveprepared the report may not have the time to read it in detail. Apart from this, an executivesummary will help in highlighting major points. It is a condensed version of the wholereport. It should be written in one or two pages. Since top executives read only the executivesummary, it should be accurate and well-written. An executive summary should help indecision-making.
An executive summary should have,
(a) Objectives
(b) Brief methodology
(c) Important findings
(d) Key results
(e) Conclusion
4. The Body: This section includes:
(a) Introduction
(b) Methodology
(c) Limitations
(d) Analysis and interpretations
Introduction: The introduction must explain clearly the decision problem and researchobjective. The background information should be provided on the product and servicesprovided by the organisation which is under study.
Methodology: How you have collected the data is the key in this section. For example,Was primary data collected or secondary data used? Was a questionnaire used? What wasthe sample size and sampling plan and method of analysis? Was the design exploratory orconclusive?
Limitations: Every report will have some shortcoming. The limitations may be of time,geographical area, the methodology adopted, correctness of the responses, etc.
LOVELY PROFESSIONAL UNIVERSITY 313
Unit 14: Report Writing
NotesAnalysis and interpretations: collected data will be tabulated. Statistical tools if any willbe applied to make analysis and to take decisions.
5. Conclusion and Recommendation:
(a) What was the conclusion drawn from the study?
(b) Based on the study, what recommendation do you make?
6. Bibliography: If portions of your report are based on secondary data, use a bibliographysection to list the publications or sources that you have consulted. The bibliographyshould include, title of the book, name of the journal in case of article, volume number,page number, edition, etc.
7. Appendix: The purpose of an appendix is to provide a place for material which is notabsolutely essential to the body of the report. The appendix will contain copies of datacollection forms called questionnaires, details of the annual report of the company, detailsof graphs/charts, photographs, CDs, interviewers' instructions. Following are the itemsto be placed in this section.
(a) Data collection forms
(b) Project related paper cuttings
(c) Pictures and diagrams related to project
(d) Any other relevant things.
!Caution The date of the submission of the report is to be included in the title page of thereport.
14.5.1 How to Write a Bibliography?
Bibliography, the last section of the report comes after appendices. Appendices containsquestionnaires and other relevant material of the study. The bibliography contains the source ofevery reference used and any other relevant work that has been consulted. It imparts anauthenticity regarding the source of data to the reader.
Bibliography are of different types viz., bibliography of works cited; this contains only theitems referred in the text. A selected bibliography lists the items which the author thinks are ofprimary interest to the reader. An annotated bibliography gives brief description of each item.The method of representing bibliography is explained below.
Books
Name of the author, title of the book (underlined), publisher's detail, year of publishing, pagenumber.
Single Volume Works. Dube, S. C. "India's Changing Villages", Routledge and Kegan Paul Ltd.,1958, p. 76.
Chapter in an Edited Book
Warwick, Donald P., "Comparative Research Methods" in Balmer, Martin and Donald Warwick(eds), 1983, pp. 315-30.
314 LOVELY PROFESSIONAL UNIVERSITY
Research Methodology
Notes Periodicals Journal
Dawan Radile (2005), "They Survived Business World" (India), May 98, pp. 29-36.
Newspaper, Articles
Kumar Naresh, "Exploring Divestment", The Economic Times (Bangalore), August 7, 1999, p. 14.
Website
www.infocom.in.com
For citing Seminar Paper
Krishna Murthy, P., "Towards Excellence in Management" (Paper presented at a Seminar in XYZCollege Bangalore, July 2000).
Task List the various abbreviations frequently used in footnotes with their meanings.
Self Assessment
Fill in the blanks:
13. The ………………..should indicate the various parts or sections of the report.
14. …………..Page should indicate the topic on which the report is prepared.
15. A selected bibliography lists the items which the author thinks are of ………….interest tothe reader.
14.6 Style, Layout and Precautions of the Report writing
14.6.1 Style of Report Writing
Remember that the reader:
Has short of time,
Has many other urgent matters demanding his or her interest and attention,
Is probably not knowledgeable concerning 'research jargon'.
Therefore, the rules are:
Simplify. Keep to the essentials.
Justify. Make no statement that is not based on facts and data.
Quantify when you have the data to do so. Avoid large, small, instead, say 50%, one inthree.
Be precise and specific in your phrasing of findings.
Inform, not impress. Avoid exaggeration.
Use short sentences.
LOVELY PROFESSIONAL UNIVERSITY 315
Unit 14: Report Writing
Notes Use adverbs and adjectives sparingly.
Avoid the passive voice, if possible, as it creates vagueness (e.g., 'patients were interviewed'leaves uncertainty as to who interviewed them) and repeated use makes dull reading.
Aim to be logical and systematic in your presentation.
!Caution In report writing, be consistent in the use of tenses (past or present tense).
14.6.2 Layout of the Report
A good physical layout is important, as it will help your report:
i. Make a good initial impression,
ii. Encourage the readers, and
iii. Give them an idea of how the material has been organised so the reader can make a quickdetermination of what he will read first.
Particular attention should be paid to make sure there is:
i. An attractive layout for the title page and a clear table of contents.
ii. Consistency in margins and spacing.
iii. Consistency in headings and subheadings, for example, font size 16 or 18 bold, for headingsof chapters; size 14 bold for headings of major sections; size 12 bold, for headings of sub-sections, etc.
iv. Good quality printing and photocopying. Correct drafts carefully with spell check as wellas critical reading for clarity by other team-members, your facilitator and, if possible,outsiders.
v. Numbering of figures and tables, provision of clear titles for tables, and clear headings forcolumns and rows, etc.
vi. Accuracy and consistency in quotations and references.
14.6.3 Precautions in Report Writing
Endless description without interpretation is another pitfall. Tables need conclusions, not detailedpresentation of all numbers or percentages in the cells which readers can see for themselves.
Notes The unit discussion, in particular, needs comparison of data, highlighting ofunexpected results, your own or others' opinions on problems discovered, weighing ofpro's and con's of possible solutions. Yet, too often the discussion is merely a dry summaryof findings.
Neglect of qualitative data is also quite common. Still, quotes of informants as illustration ofyour findings and conclusions make your report lively. They also have scientific value in allowingthe reader to draw his/her own conclusions from the data you present. (Assuming you are notbiased in your presentation!)
Sometimes qualitative data (e.g., open opinion questions) are just coded and counted likequantitative data, without interpretation, whereas they may be providing interesting illustrations
316 LOVELY PROFESSIONAL UNIVERSITY
Research Methodology
Notes of reasons for the behavior of informants or of their attitudes. This is serious maltreatment ofdata that needs correction.
The following must be avoided while preparing a report:
The inclusion of careless, inaccurate, or conflicting data.
The inclusion of outdated or irrelevant data.
Facts and opinions that are not separated.
Unsupported conclusions and recommendations.
Careless presentation and proofreading.
Too much emphasis on appearance and not enough on content.
Self Assessment
Fill in the blanks:
16. In a report there must be …………….in margins and spacing.
17. Aim must be logical and ……………in the report presentation
14.7 Summary
A report is a very formal document that is written for a variety of purposes, generally inthe sciences, social sciences, engineering and business disciplines.
The most important aspect to be kept in mind while developing research report, is thecommunication with the audience.
Report should be able to draw the interest of the readers. Therefore, report should bereader centric.
Other aspect to be considered while writing report are accuracy and clarity.
The point to be remembered while doing oral presentation is language used, Timemanagement, use of graph, purpose of the report, etc. Visuals used must be understandableto the audience.
The presenter must make sure that presentation is completed within the time allotted.Sometime should be set apart for questions and answers.
Written report may be classified based on whether the report is a short report or a longreport. It can also be classified based on technical report or non technical report.
Written report should contain title page, contents, executive summary. Body, conclusionsand appendix. The last part is bibliography.
The style of the report should be simple and to the essentials.
There should not be endless description in report writing and qualitative data is not to beexcluded.
14.8 Keywords
Appendix: The part of the report whose purpose is to provide a place for material which is notabsolutely essential to the body of the report.
LOVELY PROFESSIONAL UNIVERSITY 317
Unit 14: Report Writing
NotesBibliography: The section to list the publications or sources that you have consulted inpreparation of report
Executive Summary: It is a condensed version of the whole report.
Informal Report: The report prepared by the supervisor by way of filling the shift log book, tobe used by his colleagues
Short Report: Short reports are the reports that are produced when the problem is very welldefined and if the scope is limited.
14.9 Review Questions
1. What is a research report?
2. What are the characteristics of report?
3. What is the criterion for an oral report? Explain.
4. What is meant by "consider the audience" when writing a research report.
5. On what criteria, oral report is evaluated? Suggest a suitable format.
6. Why are visual aids used in oral presentation?
7. What are the various criteria used for classification of written report?
8. What are the essential content of the following parts of research report?
(a) Table of contents
(b) Title page
(c) Executive summary
(d) Introduction
(e) Conclusion
(f) Appendix
9. Oral presentation requires the researcher to be good public speaker explain.
10. Explain the style and layout of report.
Answers: Self Assessment
1. need 2. reality
3. decision maker 4. Currency
5. Research report 6. final
7. Interpretation 8. analysed
9. induction 10. communication
11. Long 12. opening
13. table of contents 14. Title
15. primary 16. Consistency
17. systematic

318 LOVELY PROFESSIONAL UNIVERSITY
Research Methodology
Notes 14.10 Further Readings
Books Abrams, M.A., Social Surveys and Social Action, London: Heinemann, 1951.
Arthur, Maurice, Philosophy of Scientific Investigation , Baltimore: John HopkinsUniversity Press, 1943.
Bernal, J.D., The Social Function of Science, London: George Routledge and Sons,1939.
Chase, Stuart, The Proper Study of Mankind: An inquiry into the Science of HumanRelations, New York, Harper and Row Publishers, 1958.
S. N. Murthy and U. Bhojanna, Business Research Methods, Excel Books.
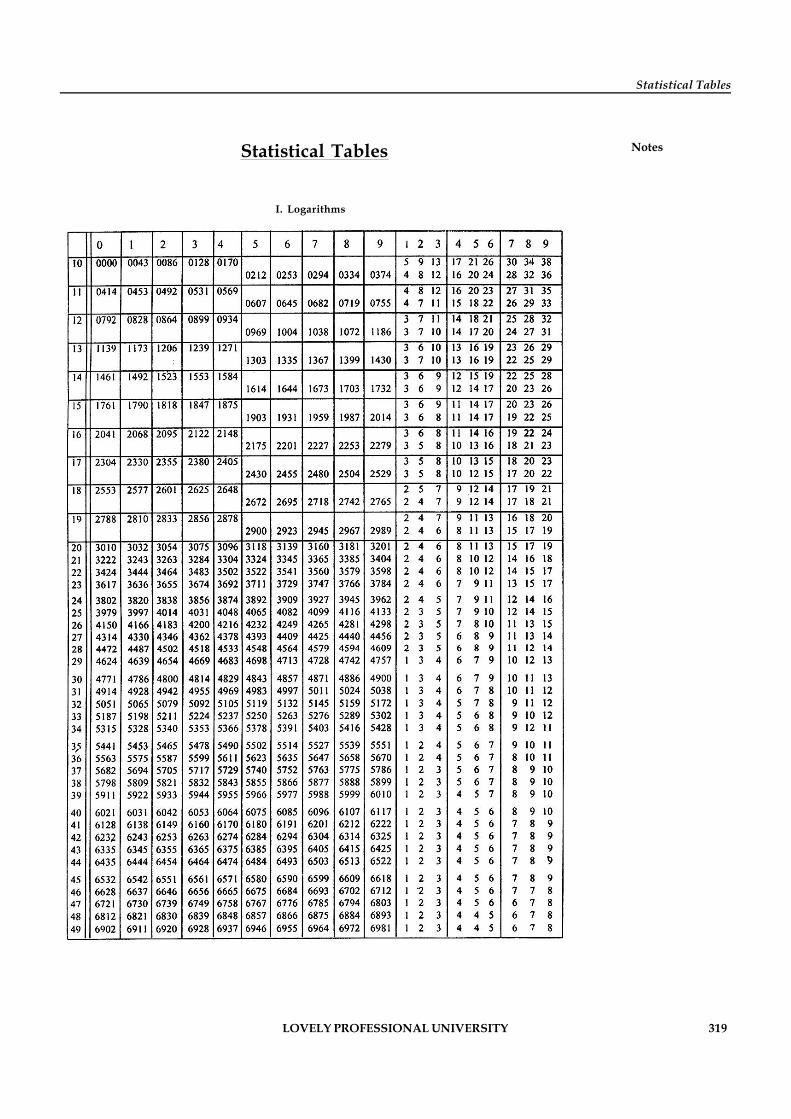
Statistical Tables
Notes
LOVELY PROFESSIONAL UNIVERSITY 319
Statistical Tables
I. Logarithms
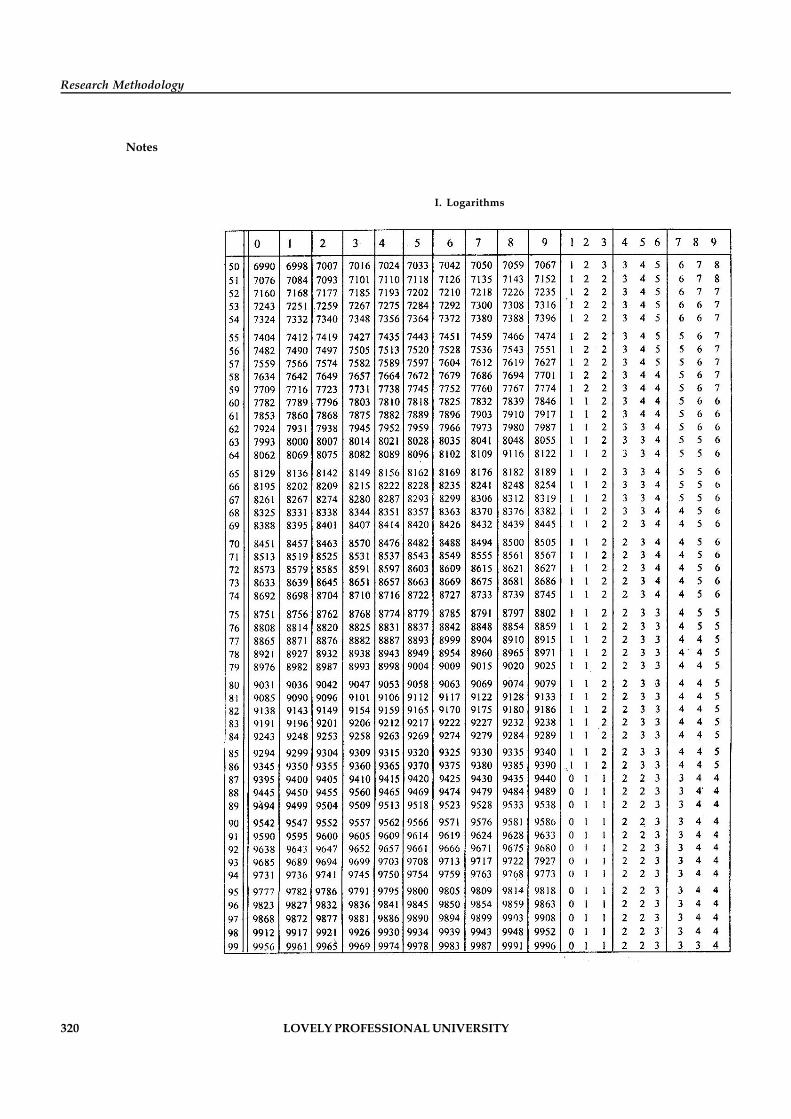
Research Methodology
Notes
320 LOVELY PROFESSIONAL UNIVERSITY
I. Logarithms
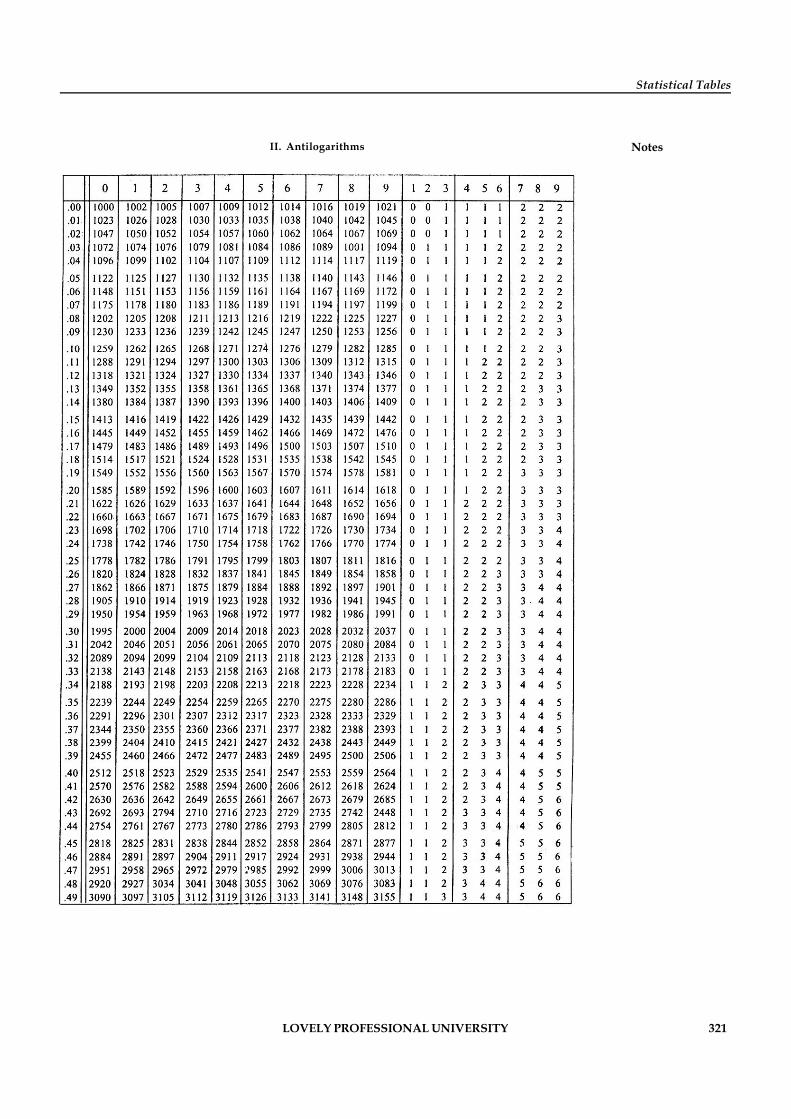
Statistical Tables
Notes
LOVELY PROFESSIONAL UNIVERSITY 321
II. Antilogarithms
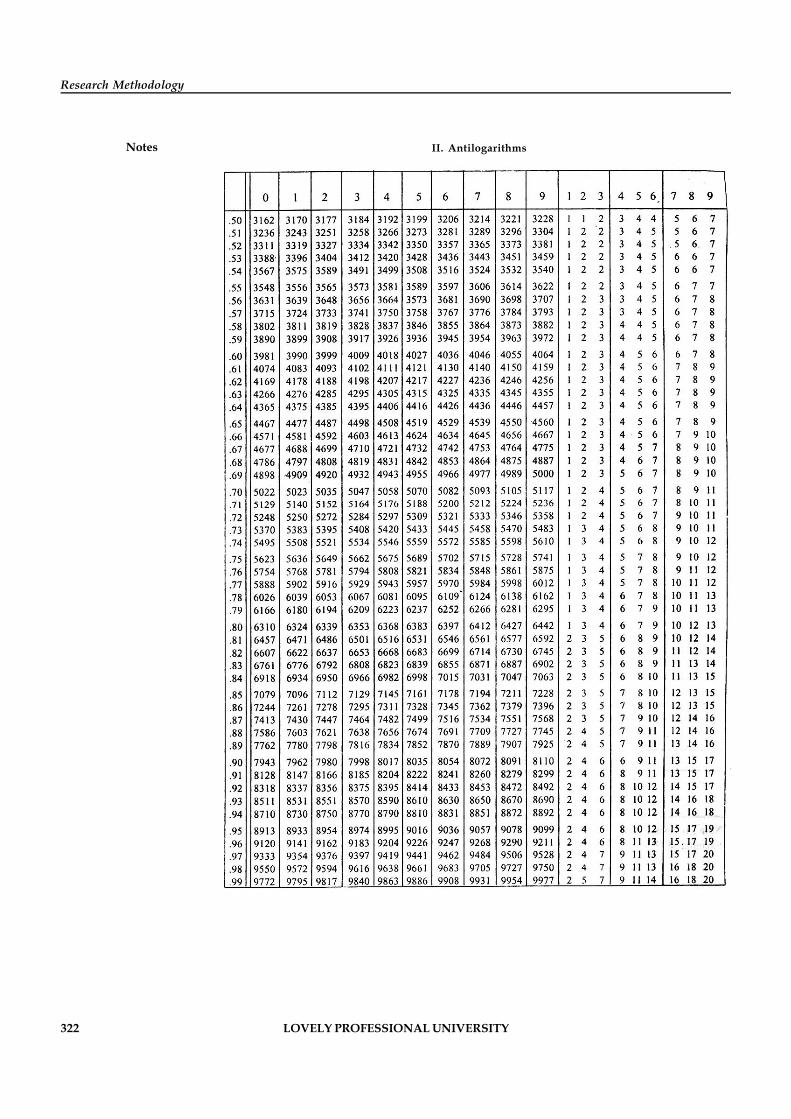
Research Methodology
Notes
322 LOVELY PROFESSIONAL UNIVERSITY
II. Antilogarithms
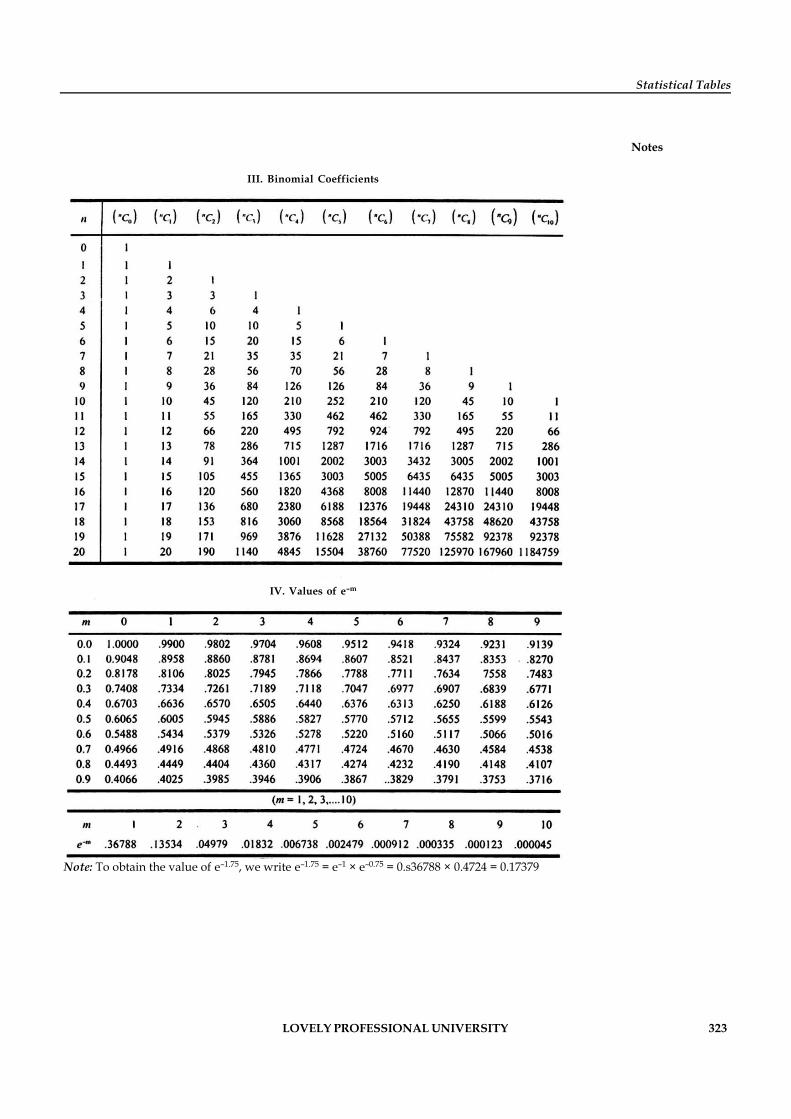
Statistical Tables
Notes
LOVELY PROFESSIONAL UNIVERSITY 323
III. Binomial Coefficients
Note: To obtain the value of e–1.75, we write e–1.75 = e–1 × e–0.75 = 0.s36788 × 0.4724 = 0.17379
IV. Values of e–m
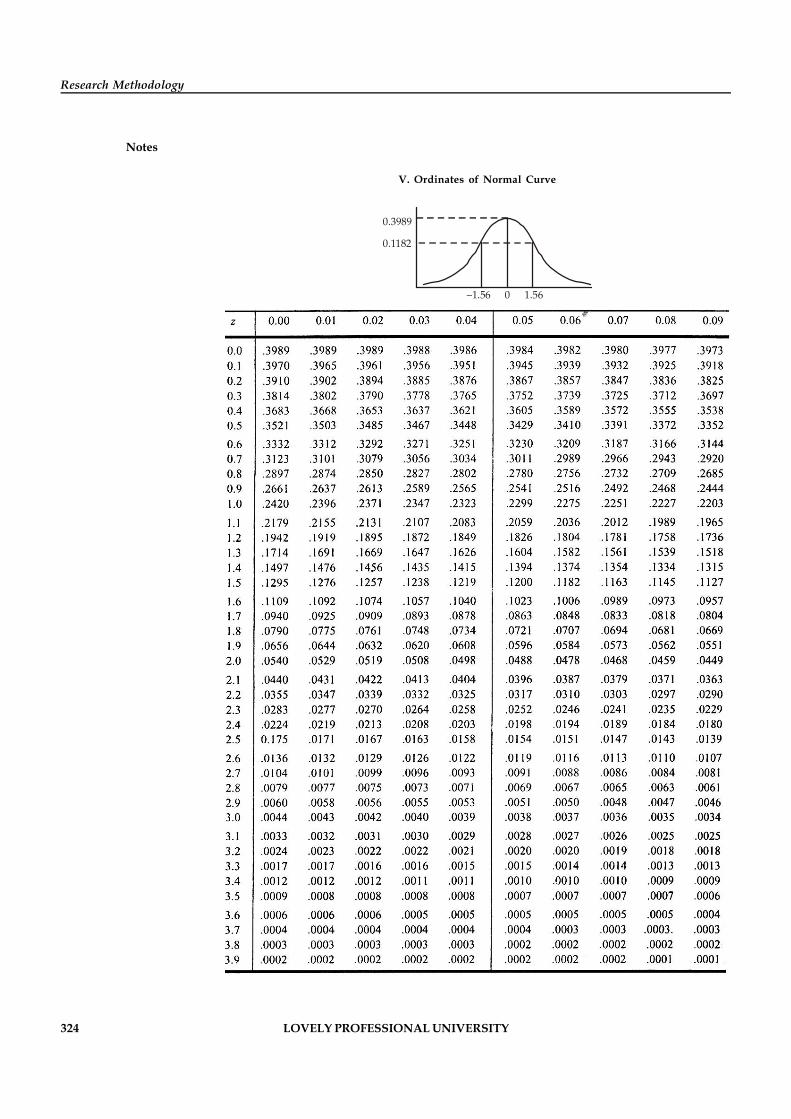
Research Methodology
Notes
324 LOVELY PROFESSIONAL UNIVERSITY
V. Ordinates of Normal Curve
–1.56 0 1.56
0.1182
0.3989
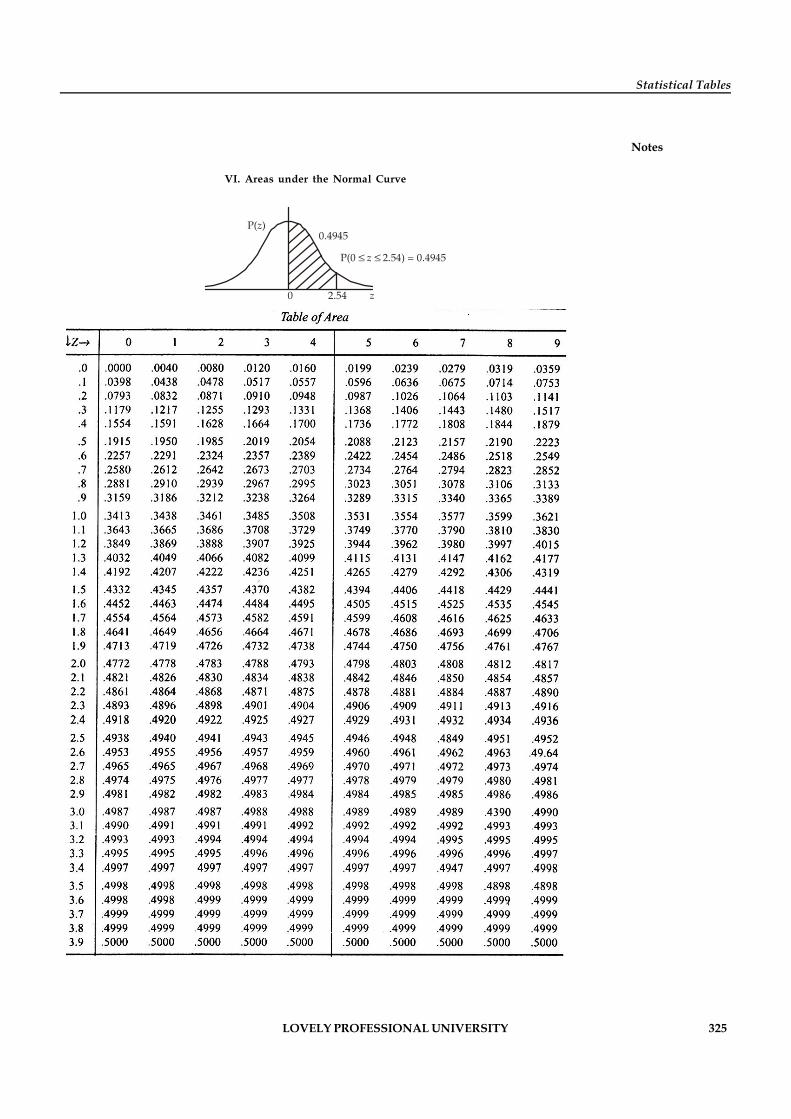
Statistical Tables
Notes
LOVELY PROFESSIONAL UNIVERSITY 325
VI. Areas under the Normal Curve
P( )z
0 2.54 z
0.4945
P(0 2.54) = 0.4945 z
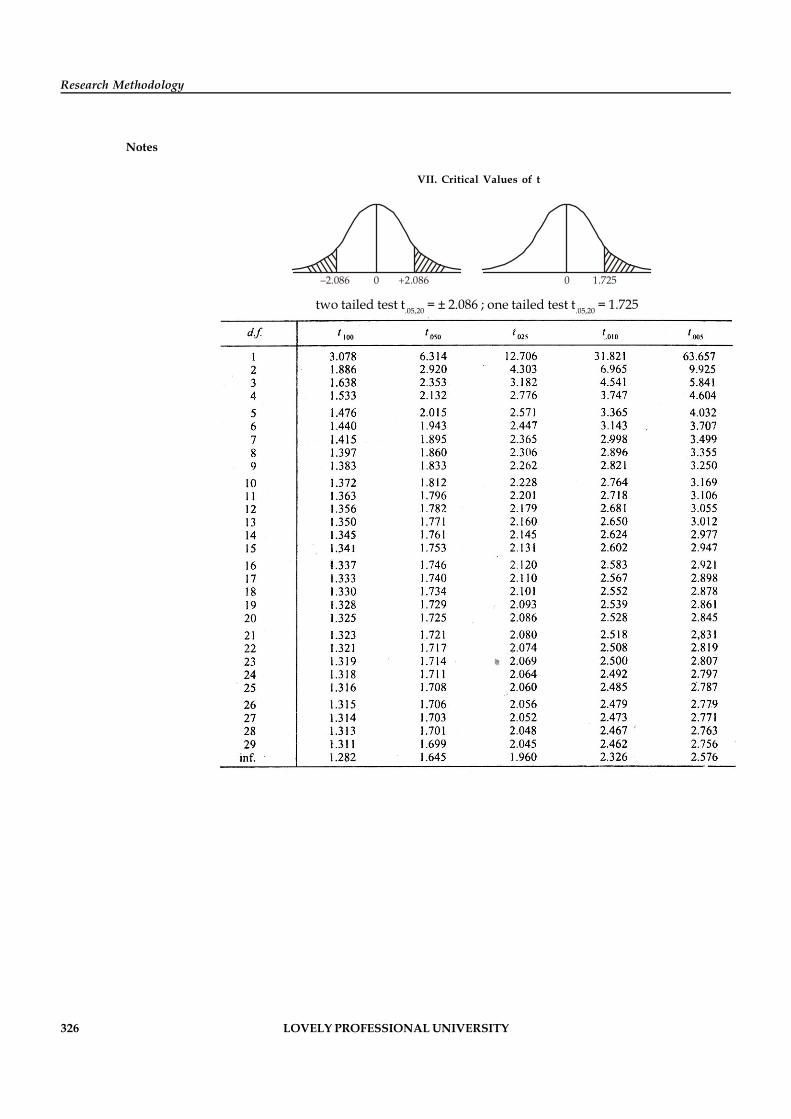
Research Methodology
Notes
326 LOVELY PROFESSIONAL UNIVERSITY
VII. Critical Values of t
two tailed test t.05,20 = ± 2.086 ; one tailed test t.05,20 = 1.725
0 0–2.086 +2.086 1.725
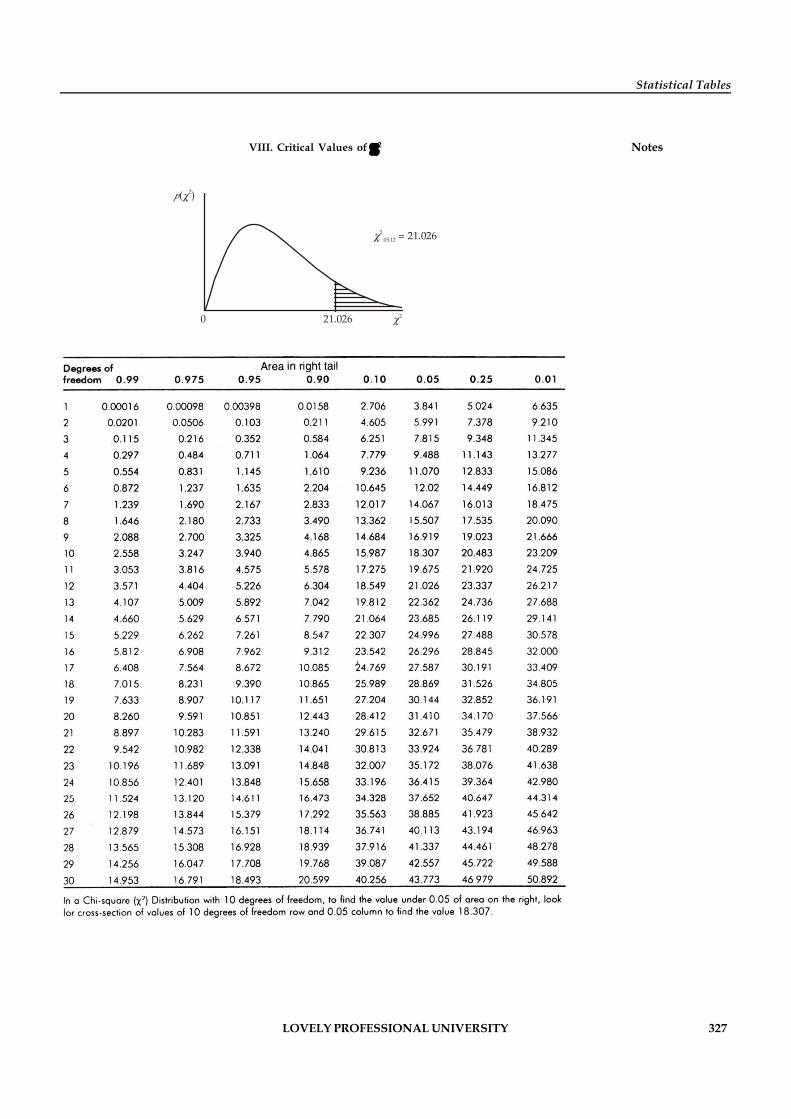
Statistical Tables
Notes
LOVELY PROFESSIONAL UNIVERSITY 327
VIII. Critical Values of c2
p( )2
0 21.026 2
2.05,12 = 21.026
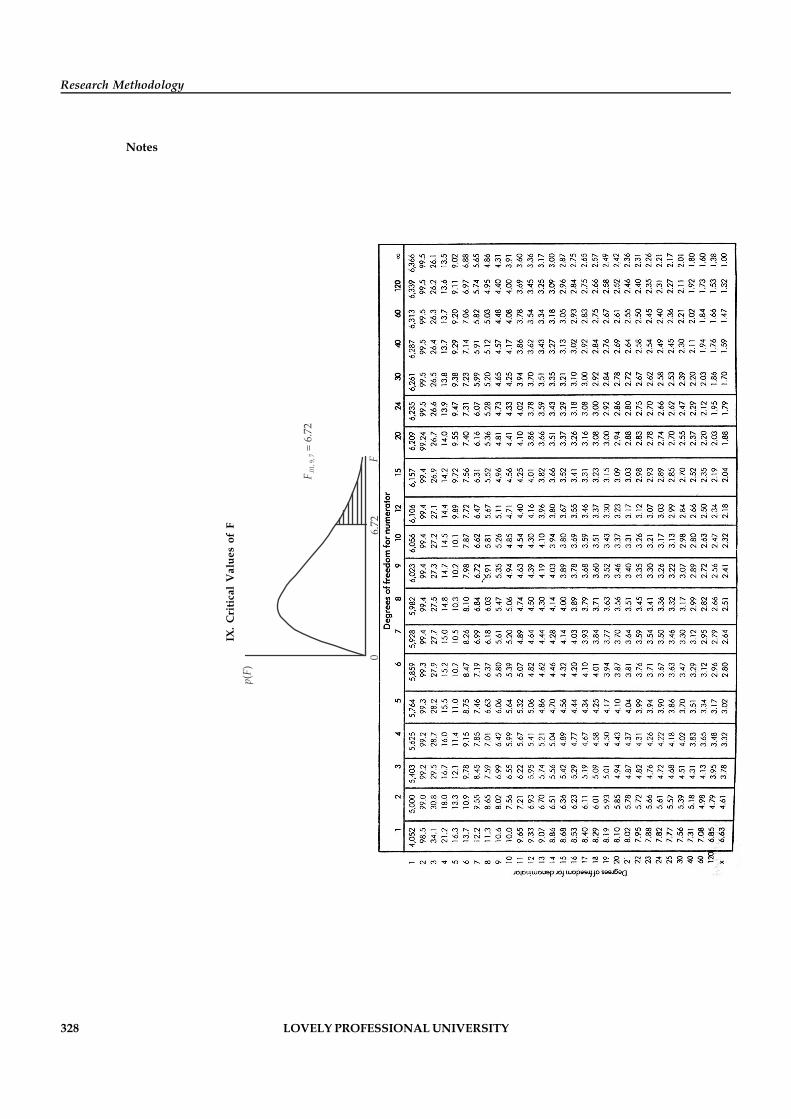
Research Methodology
Notes
328 LOVELY PROFESSIONAL UNIVERSITY
IX. C
ritic
al V
alue
s of
FpF(
)
6.72
F .01
, 9, 7
= 6
.72
F0
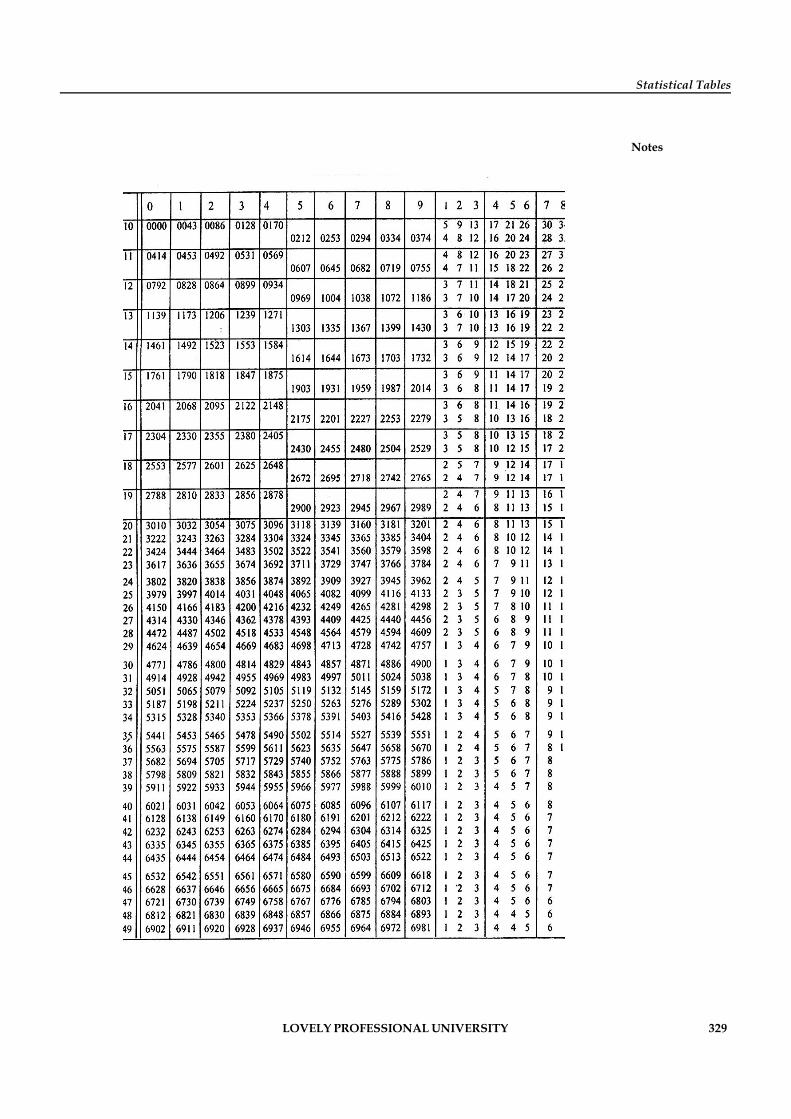
Statistical Tables
Notes
LOVELY PROFESSIONAL UNIVERSITY 329
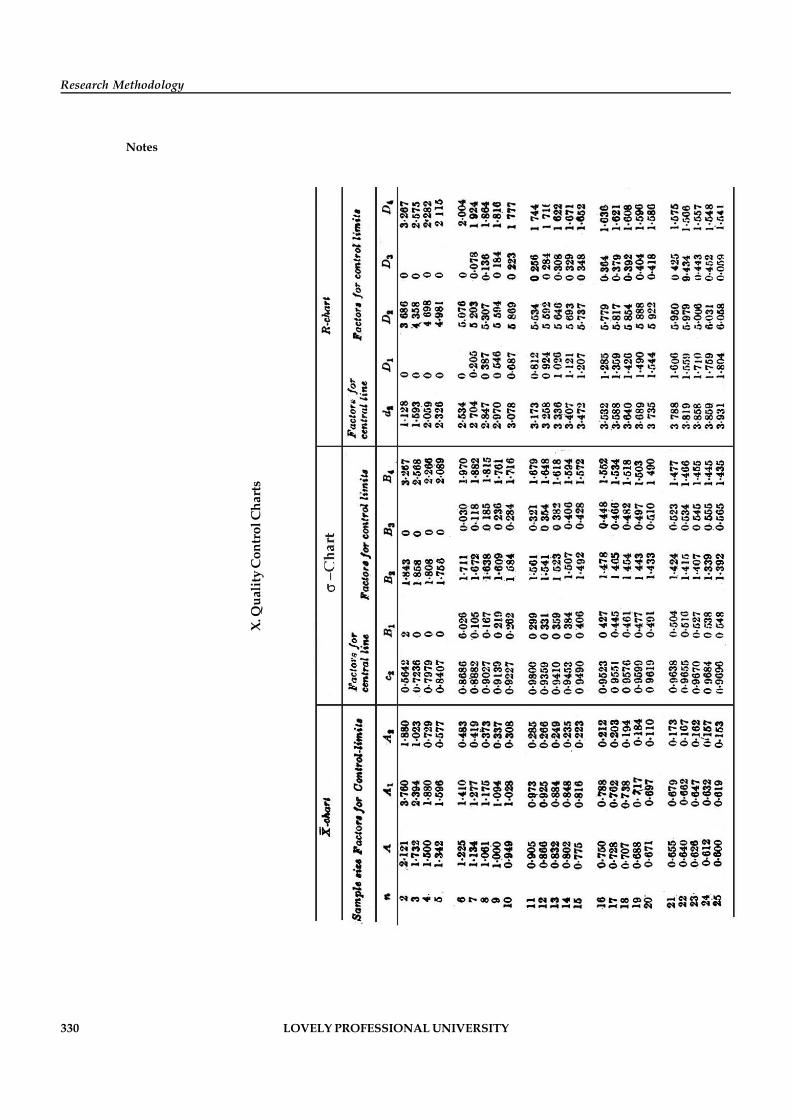
Research Methodology
Notes
330 LOVELY PROFESSIONAL UNIVERSITY
X. Q
ual
ity
Con
trol
Ch
arts

Jalandhar-Delhi G.T. Road (NH-1)Phagwara, Punjab (India)-144411For Enquiry: +91-1824-300360Fax.: +91-1824-506111Email: [email protected]
LOVELY PROFESSIONAL UNIVERSITY