basic financial management - lpu distance education...
TRANSCRIPT
Basic Financial ManagementDMGT409
BASIC FINANCIAL MANAGEMENT

Copyright © 2011 Sudhindra BhatAll rights reserved
Produced & Printed byEXCEL BOOKS PRIVATE LIMITED
A-45, Naraina, Phase-I,New Delhi-110028
forLovely Professional University
Phagwara
SYLLABUS
Basic Financial ManagementObjectives: To acquaint students with various concepts of Financial Management. It would enable them to understand varioustypes of decisions taken by a business organisation in the area of Finance.
S. No. Description 1 Meaning, Objectives and Scope of Financial Management 2 Finance Functions -Investment, Financing, Liquidity & Dividend Decisions. Risk & Return Trade off. 3 Source of Finance – Long term, Medium term & short term Time Value of Money – Basic Concepts 4 Cost of Capital: Concept and its significance, measurement of cost of capital of various sources of funds. Weighted Average
cost of capital. 5 Capital Structure Decision: Understanding debt and equity 6 Theories of Capital Structure, Optimum Capital Structure 7 Capital Budgeting : Analytical study of various methods of Capital Budgeting 8 Working Capital – Concept and Significance, Determining working capital requirements; Basics of receivables, Inventory
and cash management. 9 Dividend Policy; Determinants of Dividend Policy, Theories of dividend and Forms of dividend 10 Break Even Analysis
CONTENTS
Unit 1: An Overview of Financial Management 1
Unit 2: Source of Finance 12
Unit 3: Time Value of Money 30
Unit 4: Cost of Capital 52
Unit 5: Capital Structure Decisions 78
Unit 6: Capital Structure Theory 89
Unit 7: Capital Budgeting 112
Unit 8: Working Capital Management 135
Unit 9: Basics of Receivables 154
Unit 10: Inventory Management 165
Unit 11: Cash Management 175
Unit 12: Dividend Policy 187
Unit 13: Theory and Forms of Dividend 194
Unit 14: Break Even Analysis 209

6 LOVELY PROFESSIONAL UNIVERSITY
Corporate and Business Law

Unit 1: An Overview of Financial Management
Notes
LOVELY PROFESSIONAL UNIVERSITY 1
Unit 1: An Overview of Financial Management
CONTENTS
Objectives
Introduction
1.1 Meaning and Defi nition of Financial Management
1.2 Objectives of Financial Management
1.3 Scope of Financial Management
1.4 Finance Functions
1.5 Risk and Return Trade off
1.6 Summary
1.7 Keywords
1.8 Self Assessment
1.9 Review Questions
1.10 Further Readings
Objectives
After studying this unit, you will be able to:
Explain meaning of fi nancial management
Discuss objectives and scope of fi nancial management
Describe Finance functions like investment, fi nancing, liquidity and dividend decisions
Defi ne risk and return trade off
Introduction
Finance is one of the basic foundations of all kinds of economic activities; it is the master key which provides access to all the sources for being employed in manufacturing and merchandising activities. However, it is also true that money begets more money, only when it is properly managed. Hence, effi cient management of fi nances is very important. In short, we can say that “Finance is the backbone of every business”.
1.1 Meaning and Defi nition of Financial Management
According to Van Horne and Wachowicz, “Financial Management is concerned with the acquisition, fi nancing and management of assets with some overall goal in mind.” Financial manager has to forecast expected events in business and note their fi nancial implications. First, anticipating fi nancial needs means estimation of funds required for investment in fi xed and current assets or long-term and short-term assets. Second, acquiring fi nancial resources–once the required amount of capital is anticipated, the next task is acquiring fi nancial resources i.e., where and how to obtain the funds to fi nance the anticipated fi nancial needs and the last one is, allocating funds in business – means allocation of available funds among the best plans of assets, which are able to maximize shareholders’ wealth. Thus, the decisions of fi nancial management can be divided into three viz., investment, fi nancing and dividend decision.
Basic Financial Management
Notes
2 LOVELY PROFESSIONAL UNIVERSITY
!Caution Financial Management is broadly concerned with the acquisition and use of funds
by a business fi rm. Its scope may be defi ned in terms of the following questions.
1. How large should the fi rm be and how fast should it grow?
2. What should be the composition of the fi rm’s assets?
3. What should be the mix of the fi rm’s fi nancing?
4. How should the fi rm analyze, plan and control its fi nancial affairs?
Financial Management is concerned with the effi cient use of an important economic resource namely, capital funds.
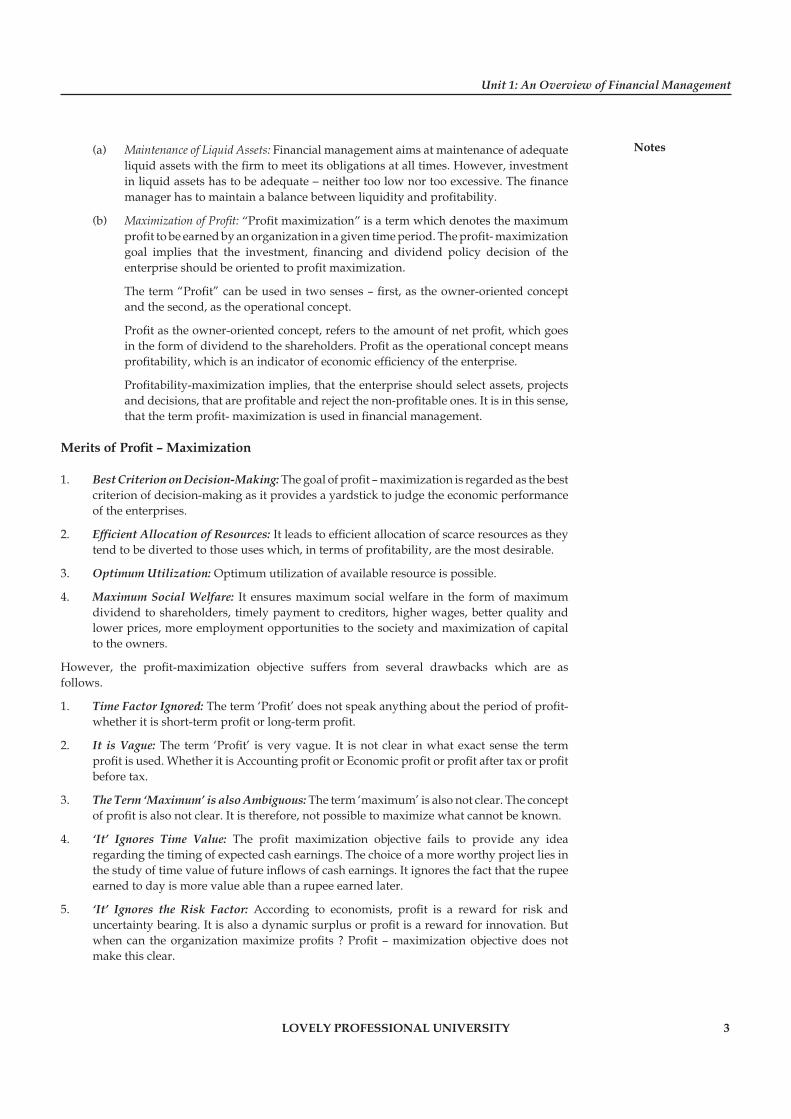
Thus, Financial Management includes – Anticipating Financial Needs, Acquiring Financial Resources and Allocating Funds in Business (i.e., Three A’s of fi nancial management).
Management of Long-TermFunds :Capital structureCost capitalSources of Long-term-FundsFinancial LeverageDividend policy
Management of Long-Term Assets:
Capital Budgeting
Operational Leverage
Risk Analysis
Management of Long-TermFunds :Capital structureCost capitalSources of Long-term-FundsFinancial LeverageDividend policy
Management of Long-Term Assets:
Capital Budgeting
Operational Leverage
Risk Analysis
Management of Short-term funds:Management of short-termLiabilities like creditors, BankOverdrafts, Bills payable, short-term LoansPrinciples of working capital ManagementWorking Capital Policy
Management of short-Term Assets:Receivable ManagementInventory ManagementCash ManagementPrinciples of working CapitalManagementWorking capital Policy
Financial Management
Working Capital Management
Figure 1.1: Framework of Financial Management
1.2 Objectives of Financial Management
(Profi t – Maximization vs Wealth Maximization)
The goals of fi nancial management can be broadly classifi ed into two categories:
1. Basic Goals: Traditionally, the basic goals of financial management have been (A) Maintenance of liquid assets and (B) Maximization of profitability of the firm. However, these days, there is a greater emphasis on (C) Shareholders’ wealth maximization rather than on profit maximization.
Unit 1: An Overview of Financial Management
Notes
LOVELY PROFESSIONAL UNIVERSITY 3
(a) Maintenance of Liquid Assets: Financial management aims at maintenance of adequate liquid assets with the firm to meet its obligations at all times. However, investment in liquid assets has to be adequate – neither too low nor too excessive. The finance manager has to maintain a balance between liquidity and profitability.
(b) Maximization of Profi t: “Profit maximization” is a term which denotes the maximum profit to be earned by an organization in a given time period. The profit- maximization goal implies that the investment, financing and dividend policy decision of the enterprise should be oriented to profit maximization.
The term “Profi t” can be used in two senses – fi rst, as the owner-oriented concept and the second, as the operational concept.
Profi t as the owner-oriented concept, refers to the amount of net profi t, which goes in the form of dividend to the shareholders. Profi t as the operational concept means profi tability, which is an indicator of economic effi ciency of the enterprise.
Profi tability-maximization implies, that the enterprise should select assets, projects and decisions, that are profi table and reject the non-profi table ones. It is in this sense, that the term profi t- maximization is used in fi nancial management.
Merits of Profi t – Maximization
1. Best Criterion on Decision-Making: The goal of profi t – maximization is regarded as the best criterion of decision-making as it provides a yardstick to judge the economic performance of the enterprises.
2. Effi cient Allocation of Resources: It leads to effi cient allocation of scarce resources as they tend to be diverted to those uses which, in terms of profi tability, are the most desirable.
3. Optimum Utilization: Optimum utilization of available resource is possible.
4. Maximum Social Welfare: It ensures maximum social welfare in the form of maximum dividend to shareholders, timely payment to creditors, higher wages, better quality and lower prices, more employment opportunities to the society and maximization of capital to the owners.
However, the profi t-maximization objective suffers from several drawbacks which are as follows.
1. Time Factor Ignored: The term ‘Profi t’ does not speak anything about the period of profi t-whether it is short-term profi t or long-term profi t.
2. It is Vague: The term ‘Profi t’ is very vague. It is not clear in what exact sense the term profi t is used. Whether it is Accounting profi t or Economic profi t or profi t after tax or profi t before tax.
3. The Term ‘Maximum’ is also Ambiguous: The term ‘maximum’ is also not clear. The concept of profi t is also not clear. It is therefore, not possible to maximize what cannot be known.
4. ‘It’ Ignores Time Value: The profi t maximization objective fails to provide any idea regarding the timing of expected cash earnings. The choice of a more worthy project lies in the study of time value of future infl ows of cash earnings. It ignores the fact that the rupee earned to day is more value able than a rupee earned later.
5. ‘It’ Ignores the Risk Factor: According to economists, profi t is a reward for risk and uncertainty bearing. It is also a dynamic surplus or profi t is a reward for innovation. But when can the organization maximize profi ts ? Profi t – maximization objective does not make this clear.
Basic Financial Management
Notes
4 LOVELY PROFESSIONAL UNIVERSITY
(c) Wealth Maximization: Wealth- maximization is also called value- maximization. The wealth or ‘net present worth’ of a course of action is the difference between gross present worth and the amount of capital investment required to achieve the benefits. Gross Present-worth represents the present value of expected cash benefits.
Wealth- maximization is also called value-maximization. The wealth or ‘net present worth’ of a course of action is the difference between gross present worth and the amount of capital investment required to achieve the benefi ts. Gross Present-worth represents the present value of expected cash benefi ts.
Signifi cance of Wealth- Maximization
The company, although it-cares more for the economic welfare of the shareholders, cannot forget the others who directly or indirectly work for the over-all development of the company. Thus, Wealth- Maximization takes care of.
1. Lenders or creditors
2. Workers or Employees
3. Public or Society
4. Management or Employer
Note Wealth-maximization means maximizing the present value of a course of action (i.e. NPV = GPW of benefi ts – Investment). Any fi nancial action which results in positive NPV, creates and adds to the existing wealth of the organization and the course of action which has a negative NPV, reduces the existing wealth and hence be given up. All positive actions can be adopted, as they add to the existing wealth and help in wealth maximization.
2. Other goals: Besides the above basic goals, the following are the other goals of financial management.
(a) Ensuring a fair return to shareholders
(b) Building up reserves for growth and expansion
(c) Ensuring maximum operational effi ciency by effi cient and effective utilization of fi nance
(d) Ensuring fi nancial discipline in the management
1.3 Scope of Financial Management
Study of the changes that have taken place over the years is known as “scope of fi nancial management.” In order to have an easy understanding and better exposition to the changes, it is necessary to divide the scope into two approaches.
1. Traditional Approach: The traditional approach, which was popular in the early stage, limited the role of financial management to raising and administering of funds needed by the corporate enterprises to meet their financial needs. It deals with the following aspects.
(a) Arrangement of funds from fi nancial institutions.
(b) Arrangement of funds through fi nancial instruments like share, bonds etc.
Unit 1: An Overview of Financial Management
Notes
LOVELY PROFESSIONAL UNIVERSITY 5
(c) Looking after the legal and accounting relationship between a corporation and its sources of funds.
?Did u know? The term “Corporation Finance” was used in place of the present term “Financial Management”.
2. Modern Approach: According to the modern approach, the term fi nancial management provides a conceptual and analytical framework for fi nancial decision-making. That means, the fi nance function covers both, acquisition of funds as well as their allocation. The new approach views the term fi nancial management in a broader sense. It is viewed as an integral part of the overall management.
The new approach is an analytical way of viewing the fi nancial problems of a fi rm. The main contents of the modern approach are as follows:
(a) What is the total volume of funds, an enterprise should commit?
(b) What specifi c assets should an enterprise acquire?
(c) How should the funds required, be fi nanced?
Thus, fi nancial management, in the modern sense of the term, can be divided into four major decisions as functions of fi nance. They are:
(a) The investment decision
(b) The fi nancing decision
(c) The dividend policy decision
(d) The funds requirement decision
1.4 Finance Functions
Financial Management is indeed, the key to successful business operations. Without proper administration and effective utilization of fi nance, no business enterprise can utilize its potentials for growth and expansion. Financial management is concerned with the acquisition, fi nancing and management of assets with some overall goals in mind.
The important fi nance functions are as follows:
1. Investment Function: It is most important function of finance management. It begins with a determination of the total amount of assets needed to be held by the firm. In other words, investment decision relates to the selection of assets, that a firm will invest funds. The required assets fall into two groups:
(a) Long-term Assets Long term assets involve huge investments and yield a return over a period of time in future.
Example: Fixed assets like plant & machinery, land and buildings, etc.
?Did u know? Investment in long-term assets is popularly known as “capital budgeting”.
(b) Short-term Assets: Short term assets are those assets that can be converted into cash within a financial year without diminution in value.
Example: Current assets like raw materials, working in process, finished goods, debtors, cash, etc.
Basic Financial Management
Notes
6 LOVELY PROFESSIONAL UNIVERSITY
?Did u know? Investment in current assets is popularly termed as “working capital management”.
2. Financing: After estimation of the amount required and the assets that require purchasing, comes the next fi nancing decision into the picture. Here, the fi nancial manager is concerned with make up of the left hand side of the balance sheet. It is related to the fi nancing mix or capital structure or leverage and he has to determine the proportion of debt and equity. It should be optimum fi nance mix, which maximizes shareholders’ wealth. A proper balance will have to be struck between risk and return. Debt involves fi xed cost (interest), which may help in increasing the return on equity alongwith an increase in risk.
Raising of funds by issue of equity shares is one permanent source, but the shareholders expect higher rates of earnings.
3. Dividend Decision: Dividend function relates to dividend policy. Dividend is a part of profi ts that are available for distribution, to equity shareholders. Payment of dividends should be analyzed in relation to the fi nancial decision of a fi rm. There are two options available in dealing with the net profi ts of a fi rm, viz., distribution of profi ts as dividends to the ordinary shareholders’ where, there is no need of retention of earnings or they can be retained in the fi rm itself if they require, for fi nancing of any business activity. But distribution of dividends or retaining should be determined in terms of its impact on the shareholders’ wealth. The Financial manager should determine optimum dividend policy, which maximizes market value of the share thereby market value of the fi rm. Considering the factors affecting the dividend policy is another aspect of dividend policy.
4. Liquidity Decisions: The finance manager should also manage the current assets, to have liquidity in the business. Investment of funds in current assets reduces the profitability of the firm. However, at the same time, the finance manager should also look after the current financial needs of the firm to maintain optimum production. While investing funds in current assets, he must see that proper balance (trade off) is maintained between profitability and liquidity.
Every fi nancial decision involves this trade off. At this level the market value of the company’s shares would be the maximum.
1.5 Risk and Return Trade off
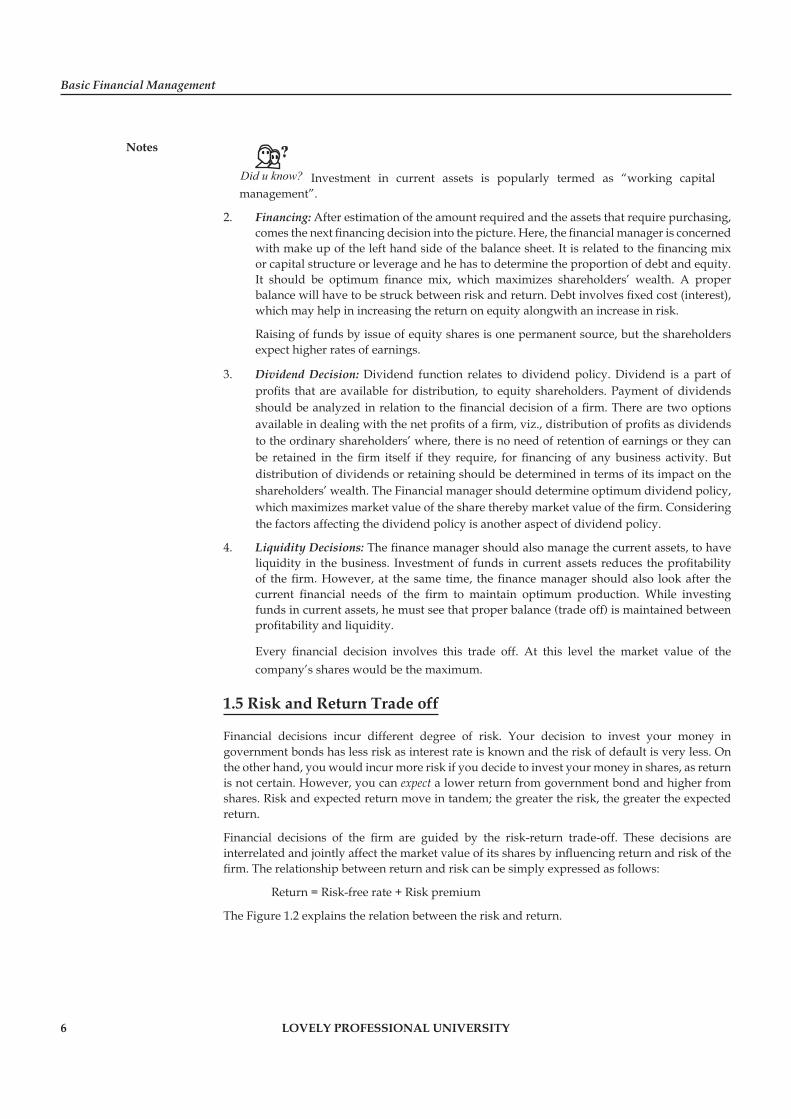
Financial decisions incur different degree of risk. Your decision to invest your money in government bonds has less risk as interest rate is known and the risk of default is very less. On the other hand, you would incur more risk if you decide to invest your money in shares, as return is not certain. However, you can expect a lower return from government bond and higher from shares. Risk and expected return move in tandem; the greater the risk, the greater the expected return.
Financial decisions of the fi rm are guided by the risk-return trade-off. These decisions are interrelated and jointly affect the market value of its shares by infl uencing return and risk of the fi rm. The relationship between return and risk can be simply expressed as follows:
Return = Risk-free rate + Risk premium
The Figure 1.2 explains the relation between the risk and return.
Unit 1: An Overview of Financial Management
Notes
LOVELY PROFESSIONAL UNIVERSITY 7
Contd...
Figure 1.2: Risk and Return Trade Off
Risk-free rate is a rate obtainable from a default-risk free government security. An investor assuming risk from her investment requires a risk premium above the risk-free rate. Risk-free rate is a compensation for time and risk premium for risk. Higher the risk of an action, higher will be the risk premium leading to higher required return on that action. A proper balance between return and risk should be maintained to maximise the market value of a fi rm’s shares. Such balance is called risk-return trade-off, and every fi nancial decision involves this trade-off.
Task Make an analysis on strategies used by Reliance Mutual Fund for maximizing the return of their customers.
Case Study Bhatt Industries – Basic Planning
This case will help the reader, develop an approach to structuring a case solution. It requires a logical approach to solving a general fi nancial problem.
Bhatt Industries has been manufacturing fi reworks at a small facility just outside Greensboro, North Carolina. The fi rm is known for the high level of quality control in its production process and is generally respected by distributors in the states, where fi reworks are legalized. Its selling market is fairly well defi ned ; it has the capacity to produce 800,000 cases annually, with peak consumption in the summer. The fi rm is fairly confi dent, that the whole of next year’s production can be sold for ` 25 a case.
On September 7, the company has ` 8,000,000 in cash. The fi rm has a policy against borrowing, to fi nance its production, a policy fi rst established by William Bhatt, the owner of the fi rm. Mr. Bhatt keeps a tight rein on the fi rm’s cash and invests any excess cash in treasury bonds, that pays a 12 per cent return and involve no risk of default.
The fi rm’s production cycle revolves around the seasonal nature of the fi reworks business. Production begins right after Labour Day and runs through May. The fi rms sales occur in February through May ; the fi rm closes from June 1 to Labour Day, when its employees return to farming. During this time, Mr. Bhatt visits his grandchildren in New York and
Basic Financial Management
Notes
8 LOVELY PROFESSIONAL UNIVERSITY
Pennsylvania. As a result of this scheduling, the fi rm pays all its expenses during September and in May receives, all its revenues from its distributors within 6 weeks after the 4th of July. The customers send their checks directly to Kenmy National Bank, where the money is deposited in Bhatt’s account.
Mr. Bhatt is the only full-time employee of his company and he and his family hold all the common stock. Thus, the company’s only costs are directly related to the production of fi reworks. The costs are affected by the law of variable proportions, depending on the production level. The fi rst 100,000 cases cost ` 16 each; the second 100,000 cases, ` 17 each ; the third 100,000 cases, ` 18 each and the fourth 100,000 cases, ` 19 each ; the fi fth 100,000 cases, ` 20 each ; the sixth 100,000 cases, ` 21 each. As an example, the total of 200,000 cases would be ` 1,600,000 plus ` 1,700,000 or ` 3,300,000.
BHATT INDUSTRIES - INCOME STATEMENT(August 31, fi scal year just ended)
Revenues from operations 50,00,000Revenues from interest on government bonds 9,20,000Total revenues 59,20,000Operating expenses 40,50,000Earnings before taxes 18,70,000Taxes 9,48,400Net income after taxes 9,21,600
Bhatt Industries is a corporation and pays a 30 per cent tax on income, because of the paperwork involved. Mr. Bhatt invests his excess cash on September 6 in one year treasury bonds. He does not invest for shorter periods.
Questions
1. How does this level affect long-term prospects of wealth maximization ?
2. What should be the level of production to maximize the profi t?
1.6 Summary
Business fi nance is the activity concerned with planning, raising, controlling and administering of the funds used in the business.
Financial Management is concerned with the acquisition, fi nancing and management of assets with some overall goal in mind. The main activities of a fi nancial manager are (1) anticipating fi nancial needs, (2) acquiring fi nancial resources, and (3) allocating funds in the business.
The scope of fi nancial management can be studied under two approaches. (1) The traditional approach and (2) The modern approach.
The scope of modern approach covers both, procurement of funds as well as their allocation.
Investment decision relates to the selection of assets, that a fi rm will invest fund to procure. The required assets fall into two groups, long-term assets (fi xed assets), and short-term assets (current assets).
Unit 1: An Overview of Financial Management
Notes
LOVELY PROFESSIONAL UNIVERSITY 9
Financing decision is related to the fi nancing mix or capital structure or leverage. While taking this decision, the fi nancial manager has to determine the proportion of debt and equity.
Dividend decision relates to dividend policy. Payment of dividends should be analyzed in relation to the fi nancial decision of a fi rm.
Financial management decisions are of different kinds but they are inter-related because the underlying objective of all the three decisions is (same) the maximisation of shareholders’ wealth.
1.7 Keywords
Business Finance: It is that business activity which is concerned with the acquisition and conservation of capital funds in meeting fi nancial needs and overall objectives of business enterprises.
Corporation: It is an association of two or more persons who contribute money or money’s worth to a common stock and employs it in business, and who share profi t and loss equally.
Corporate Finance: Corporate fi nance is the activity concerned with planning, raising, controlling and administering of the funds used in the business.
Dividend: Dividend is a part of profi ts that are available for distribution to shareholders.
Financing Decision: It is related to the fi nancing mix or capital structure or leverage and the determination of the proportion of debt and equity.
Financial Management: It is the operational activity of a business that is responsible for obtaining and effectively utilising the funds necessary for effi cient operations.
Investment Decision: Investment decision is related with the selection of assets, that a fi rm will invest.
Wealth Maximization: It is maximizing the present value of a course of action (i.e. NPV = GPW of benefi ts - Investment).
1.8 Self Assessment
Fill in the blanks:
1. Business Finance is wider than the ............................ .
2. ............................ Finance deals with the company form of business.
3. Maximization of ............................ is the main goal of fi nancial management.
4. ............................ and ............................ maximization are the goals of fi nancial management.
5. Profi t maximisation ignores ............................ .
6. Equity shareholders’ expected return is equal to risk free rate plus ............................ .
7. ............................ is a confl ict of interest between the agent and the owner.
State whether the following statements are true or false:
8. Traditional concept of fi nance was limited to acquisition of funds.
9. Investment decision, fi nancing decision, dividend decision are the decisions of fi nance.
10. There is no relation among fi nance decisions.
Basic Financial Management
Notes
10 LOVELY PROFESSIONAL UNIVERSITY
11. Profi t maximisation is suitable for sole proprietorship concerns.
12. A rupee receivable today, is less valuable than a rupee receivable in future.
13. Having basic knowledge of economics is necessary for a fi nancial manager.
14. There is risk involvement in fi nancial decisions.
15. Principles of corporate fi nance can be applied to all types of organisations.
1.9 Review Questions
1. Write a note on the evolution of fi nance function.
2. Contrast the salient features of traditional and modern approaches to fi nancial management.
3. Discuss in detail the scope of fi nancial management.
4. Should the goal of fi nancial decision-making be profi t maximisation or wealth maximisation? Discuss.
5. In what respect is the objective of wealth maximisation superior to profi t maximization?
6. “The profi t maximization is not an operationally feasible criterion.” Do you agree? Illustrate your views.
7. What are the basic fi nancial decisions? How do they involve risk return trade-off?
8. “Finance functions of a business is closely related to its other functions”. Discuss.
9. Assuming wealth maximization to be the objective of fi nancial management, show how the fi nancing, investment and dividend decisions of a company can help to attain this objective.
10. “………Finance has changed …….from a fi eld that was concerned primarily with the procurement of funds to one, that includes the management assets, the allocation of capital and valuation of the fi rm” Elucidate.
Answers: Self Assessment
1. Corporate fi nance 2. Corporate
3. Shareholders wealth 4. Profi t, Wealth
5. Time value of money 6. Risk premium
7. Agency confl ict 8. True
9. True 10. False
11. True 12. False
13. True 14. True
15. True
Unit 1: An Overview of Financial Management
Notes
LOVELY PROFESSIONAL UNIVERSITY 11
1.10 Further Readings
Books Chandra, P., Financial Management - Theory and Practice, New Delhi, Tata McGraw Hill Publishing Company Ltd., 2002, p. 3.
Sudhindra Bhat, Financial Management, New Delhi, Excel Books, 2008.
Van Horne, J.C. and Wachowicz, Jr, J.M., Fundamentals of Financial Management, New Delhi, Prentice Hall of India Pvt. Ltd., 1996, p. 2.
Online links www.globusz.com
www.scribd.com
Basic Financial Management
Notes
12 LOVELY PROFESSIONAL UNIVERSITY
Unit 2: Source of Finance
CONTENTS
Objectives
Introduction
2.1 Types of Business Finance
2.2 Instruments of Raising Long-term Finance
2.2.1 Issue of Shares
2.2.2 Issue of Debentures
2.2.3 Loans form Financial Institutions
2.2.4 Public Deposits
2.2.5 Retention of Profi t
2.2.6 Term Loans
2.2.7 Lease Financing
2.3 Instruments of Raising Short-term Finance
2.3.1 Commercial Papers (CPs)
2.3.2 Certifi cates of Deposit
2.3.3 Treasury Bills
2.3.4 Inter-corporate Deposits (ICDs)
2.3.5 Trade Credit
2.3.6 Deferred Income
2.3.7 Commercial Banks
2.3.8 Accruals
2.3.9 Factoring
2.4 Summary
2.5 Keywords
2.6 Self Assessment
2.7 Review Questions
2.8 Further Readings
Objectives
After studying this unit, you will be able to:
Discuss Long, medium and short-term sources of fi nance
Describe methods of raising long-term fi nance
Explain methods of raising short-term fi nance
Unit 2: Source of Finance
Notes
LOVELY PROFESSIONAL UNIVERSITY 13
Introduction
We all know that every business requires some amount of money to start and run the business. Whether it is a small business or large, manufacturing or trading or transportation business, money is an essential requirement for every activity. Money required for any activity is known as fi nance. So the term ‘business fi nance’ refers to the money required for business purposes and the ways by which it is raised. Thus, it involves procurement and utilisation of funds so that business fi rms will be able to carry out their operations effectively and effi ciently.
2.1 Types of Business Finance
The type and amount of funds required usually differs from one business to another. For instance, if the size of business is large, the amount of funds required will also be large. Likewise, the fi nancial requirements are more in manufacturing business as compared to trading business. The business need funds for longer period to be invested in fi xed assets like land and building, machinery etc. Sometimes, the business also needs fund to be invested in shorter period. So based on the period for which the funds are required, the business fi nance is classifi ed into three categories.
1. Short-term Finance: Funds required to meet day-to-day expenses are known as short-term fi nance.
Example: Purchase of raw materials, payment of wages, rent, insurance, electricity and water bills, etc.
The short-term fi nance is required for a period of one year or less. This fi nancial requirement for short period is also known as working capital requirement or circulating capital requirement.
2. Medium-term Finance: Medium-term fi nance is utilised for all such purposes where investments are required for more than one year but less than fi ve years.
Example: Amount required to fund modernisation and renovation, special promotional programmes etc.
3. Long-term Finance: The amount of funds required by a business for more than fi ve years is called long-term fi nance.
Example: The purchase of fi xed assets like land and building, plant and machinery furniture etc.
The long-term fi nance is also known as fi xed capital as such need in fact is, of a permanent nature.
Note Fixed vs Working Capital
Fixed capital refers to the total value of assets in a business, which is of durable nature and used in a business over a considerable period of time. It comprises assets like land, building, machinery, furniture etc. The capital invested in these assets is fi xed in the sense that these are required for permanent use in business and not for sale. Working capital consists of those assets which are either in the form of cash or can easily be converted into cash, e.g., cash and bank balances, debtors, bills receivable, stock, etc. These assets are also known as current assets. Working capital is needed for day-to-day operations of the business.

Basic Financial Management
Notes
14 LOVELY PROFESSIONAL UNIVERSITY
2.2 Instruments of Raising Long-term Finance
In small organisations the long-term fi nances are generally provided by the owners but for large organisations like joint stock companies there are various options available to raise the funds. The following are the key instruments of long-term fi nance:
1. Issue of Shares
2. Issue of Debentures
3. Loans from fi nancial institutions
4. Public Deposits
5. Retention of Profi t
6. Term loans form Banks
7. Lease Financing
2.2.1 Issue of Shares
Share is the smallest unit into which the total capital of the company is divided.
Example: When a company decides to raise ̀ 50 crores of capital from the public by issuing shares, then it can divide its capital into units of a defi nite value, say ` 10/- or ` 100/- each. These individual units are called as its share.
These may be of two types:
1. Equity shares
2. Preference shares
Equity Shares
Equity means ‘equal’. Equity share is a share that gives equal right to holders. Equity shareholders have to share the reward and risk associated with ownership of company.
Example: ABC Company has 10,000 equity shareholders and it has earned ` 10,000 profi t last year and assumes it may earn a loss of ` 10,000 in the next year.
Here, the shareholder will get ` 1 as profi t from last year and ` 1 loss in the coming year’s loss.
It is also called as ordinary share capital. Equity shareholders are the owners of the company, who have control over the working of the company. They are paid dividend at the rate recommended by Board of Directors (BoDs).
Features of Equity Shares
The following are the key features of equity shares:
1. Permanent Capital: An equity source is the main long-term or permanent source of fi nance. They can be redeemed or refunded only at the time of liquidation that too from the residue left after meeting all the obligations.
2. Residual Claim to Income: Equity shareholders have a residual claim to the income of a company. Residual claim means the income leftover after paying all outsider claims.

Unit 2: Source of Finance
Notes
LOVELY PROFESSIONAL UNIVERSITY 15
3. Residual Claim to Assets: Equity shareholders have a residual claim on fi rm’s assets. In an event of liquidation of a fi rm, the assets are used fi rst to settle the claims of outside creditors and preference shareholders, if anything left that is equity shareholders residue.
4. Voting right/Right to Control: Equity shareholders as real owners of the company they have voting right, in appointing Directors and Auditors of the company participate and vote in annual general meeting, which helps to control the company.
5. Limited Liability: This is the prime feature of equity share. Although, equity shareholders are the owners of the company, their liability is limited to the extent of the investment in the share.
Preference Shares
Preference share capital gives certain privileges to its holders on the equity shareholders. Preference shareholders have privileges in two ways:
1. A preferential privilege in payment of a fi xed dividend. The fi xed dividend may be in the form of fi xed rate or fi xed amount per share; and
2. Preferential right as to repayment of capital in case of liquidation/winding up of the company.
Note Preference share capital is a hybrid form of long-term fi nance, since it has the features of equity and debentures. Preference share resembles equity in the following ways:
1. Preference dividends are payable only after tax profi ts (PAT).
2. Payment of preference dividend depends on the discretion of BoD’s, (it is not an obligatory payment).
3. Preference dividend is not a tax deductable payment.
4. Irredeemable preference shares are long-term in nature (they have no maturity date).
Preference share capital is similar to debenture capital in the following ways:
1. It carries a fi xed rate of dividend.
2. It has prior claim on assets like debenture capital,
3. It normally does not have voting rights.
4. It is redeemable in nature (if it is redeemable preference share).
4. It does not have right to share residual profi ts/assets.
Features of Preference Share Capital
The features of preference share/ capital are as follows:
1. Claim on Assets: Companies does not create any charge on assets while issue of preference shares, still preference shareholders have prior claim on assets of the company in the event of liquidation. It means before payment of ordinary shareholders, the preference shareholders are paid.
Basic Financial Management
Notes
16 LOVELY PROFESSIONAL UNIVERSITY
2. Claim on Income: Not only the prior claim on assets at the time of liquidation, they also have prior claim on income or profi ts. Preference dividend must be paid in full before payment of any dividend on the equity share capital.
?Did u know? What is senior security?
As preference share capital lies between debenture capital and equity share capital with regards to claim on assets and income of the company. Hence, it is called as “senior security”.
3. Accumulation of Dividend: Most of the preference shares dividend is cumulative. It means that all the unpaid/arrears dividends are carried forward for the next year and paid with the current year’s dividend before payment of any dividend to equity shareholders.
Example: Company A issues 10 per cent preference shares of ̀ 100 each, in the beginning of the fi nancial year. The company needs to pay ` 10 as dividend but due to loss it was not able to pay, in this case the ` 10 is carried to the next year. If there are any profi ts in next year the company has to pay last year’s dividend and the current year’s dividend. Thereby the total dividend is `20.
4. Redeemable: Preference share capital has limited maturity period (if issued as redeemable) after that the share capital has to be refunded. It provides fl exibility in capital structure, which is benefi cial to the company.
5. Fixed Rate of Dividend: Issue of preference shares are at a fi xed rate of dividend. The rate is at par value basis.
6. Convertible: Convertible preference shares capital has the feature of conversion of preference shareholders investment into fully or partly paid equity shares at a pre-determined ratio within a given/specifi ed period.
7. Participation in Surplus Profi ts: Sometimes preference share capital is in the nature of participation in surplus profi ts.
Note It may be noted that the companies have to follow a prescribed procedure for issue of shares as per the Companies Act and the guidelines issued by Securities and Exchange Board of India (SEBI).
2.2.2 Issue of Debentures
The companies can raise long-term funds by issuing debentures that carry assured rate of return for investors in the form of a fi xed rate of interest. It is known as debt capital or borrowed capital of the company. The debenture is a written acknowledgement of money borrowed. It specifi es the terms and conditions, such as rate of interest, time of repayment, security offered, etc. These are offered to the public to subscribe in the same manner as is done in the case of shares.
Features of Debentures
The features of debentures/bonds are as follows:
1. Fixed Rate of Interest: In general the debentures are issued at a fi xed rate of interest, but they may also issued at a fl oating rate of interest or a zero interest.
Unit 2: Source of Finance
Notes
LOVELY PROFESSIONAL UNIVERSITY 17
2. Maturity: The debenture capital is a cheapest source of long-term fi nance, but it should be repaid after a specifi c period. In other words, debentures are issued for a specifi c period (i.e., 10 years or 5 years debentures).
3. Redemption: Debentures can be repaid either in installment wise or lump sum. If it is repaid in one lump sum amount, it can be done by creation of debenture redemption reserve. It is compulsory for all debentures whose maturity period exceeds 18 months.
!Caution Company should create dividend redemption reserve (DRR) equivalent to at least
50 per cent of the amount of issue before commencement of repayment.
4. Debenture Indenture: A debenture indenture is a legal document, which specifi es the rights of both the issuing company and the debenture holder.
5. Security Interest: Debenture may be either secured or insecured. In India most of the debentures are secured debentures.
6. Convertibility: Companies can also issue convertible debentures. It is the debenture that is convertible into equity shares at the option of the debenture holder.
7. Credit Ratings: Before issue of debentures to the public, the issuing company needs to get the debentures rated by anyone of the credit rating agencies.
Note The key four credit rating agencies in India are: Credit Rating Information Services Of India Limited (CRISIL), Investment Information and Credit Rating Agency of India Limited (ICRA), Credit Analysis and Research Limited (CARL), FITCH India and Duff & Phelps Credit Rating India Pvt. Ltd (DCRI).
8. Claim on Income and Assets: Debenture holders have priority of claim on income. At the same time they also have priority of claim on company assets at the time of winding up.
Types of Debentures
The given below are the some important types of debentures:
1. Bearer Debentures: Bearer debentures are registered and are payable to the bearer. They are negotiable instruments and are transferable by delivery.
2. Registered Debentures: They are payable to the registered holder whose name appears both on the debentures and in the Register of Debenture Holders maintained by the company.
3. Secured Debentures: Debentures which create a change on the assets of the company which may be fi xed or fl oating are known as secured Debentures.
!Caution The term “bonds” and “debentures”(secured) are used interchangeably in
common parlance. In USA, BOND is a long-term contract which is secured, whereas a debenture is an unsecured one.
4. Unsecured or Naked Debentures: Debentures which are issued without any charge on assets are insecured or naked debentures. The holders are like unsecured creditors and may see the company for the recovery of debt.
Basic Financial Management
Notes
18 LOVELY PROFESSIONAL UNIVERSITY
5. Redeemable Debentures: Normally debentures are issued on the condition that they shall be redeemed after a certain period. They can however, be reissued after redemption.
6. Perpetual Debentures: When debentures are irredeemable they are called perpetual. Perpetual Debentures cannot be issued in India at present.
7. Convertible Debentures: If an option is given to convert debentures into equity shares at the stated rate of exchange after a specifi ed period, they are called convertible debentures.
8. Participating Debentures: They are unsecured corporate debt securities which participate in the profi ts of the company. They might fi nd investors if issued by existing dividend paying companies.
2.2.3 Loans form Financial Institutions
There are many specialised fi nancial institutions established by the Central and State governments which give long-term loans at reasonable rate of interest.
Example: Industrial Finance Corporation of India (IFCI), Industrial Development Bank of India (IDBI), Industrial Credit and Investment Corporation of India (ICICI), Unit Trust of India (UTI), and State Finance Corporations etc.
These fi nancial institutions grant loans for a maximum period of 25 years. These loans are covered by mortgage of company’s property and/or hypothecation of stocks shares etc.
The major benefi ts derived from such loans are:
1. The rate of interest payable is lower than the market rate and
2. The amount of loan is large.
2.2.4 Public Deposits
Public deposits or term deposits are in the nature of unsecured deposits, have been solicited by the fi rms (both large and small) from general public primarily for the purpose of short and medium term requirements.
Important Guidelines
Fixed deposits accepted by companies are governed by the Companies (Acceptance of Deposits) Amendment Rules, 1978. The main features of this regulation are:
1. A fi rm cannot issue public deposits for more than 25 per cent of its share capital and free reserves.
2. The public deposits can be issued for a period ranging from a minimum 6 months to maximum 3 years. Public deposits for a period of three months, however, can as well be issued, but only for an amount up to 10% of the company’s share capital and free reserves. Maximum period of 5 years is allowed for Non-banking Financial Corporation (NBFCs).
3. The company that had raised funds by way of issue of public deposits is required to set aside, a deposit and/or investment, by the 30th April each year an amount equal to 10 per cent of the maturity deposits by the 31st March of the next year. The amount, so set aside can be used only for repairing the amount of deposits.
4. Finally, a company’s and accepting the public deposits is required to disclose some true, fair, vital and relevant facts in regards to its fi nancial position and performance.
Unit 2: Source of Finance
Notes
LOVELY PROFESSIONAL UNIVERSITY 19
Reasons for Raising Funds from Fixed Deposits
The following are the key reasons for raising funds from fi xed deposits:
1. Company point of view:
(a) Simple procedure involved in issuing public deposits.
(b) No restrictive covenants are involved.
(c) No security is offered against public deposits.
(d) Cheaper (post-tax cost is fairly reasonable).
2. Investors point of view:
(a) Higher interest rates when compared to other investment avenues.
(b) Short maturity period.
2.2.5 Retention of Profi t
Retained earnings are an important source of internal fi nancing of well-established companies. Retained earnings are the portion of earnings available to equity shareholders, which are ploughed back in the company. In other words, a part of earnings available to equity shareholders that are retained for future investment. Hence, the process of accumulating company profi ts regularly and their utilisation in the business is known as retained earnings or ploughing back of profi ts or internal fi nancing or self-investment.
Note Retained earnings are part of equity, since they are part of equity, which are sacrifi ced by equity shareholders. In this source of fi nance companies, generally retained or ploughed back about 20 per cent to 70 per cent of earnings available to equity shareholders for the purpose of fi nancing of the growth of the company. This becomes a main source of long-term fi nance, when the management capitalizes profi ts. It is known as capitalization of profi ts or issue of bonus shares.
Merits of Retained Earnings
Following are the benefi ts of retention of profi t.
1. Cheap source of capital: No expenses are incurred when capital is available from this source. There is no obligation on the part of the company either to pay interest or pay back the money. It can safely be used for expansion and modernisation of business.
2. Financial stability: A company which has enough reserves can face ups and downs in business. Such companies can continue with their business even in depression, thus building up its goodwill.
3. Benefi ts to the shareholders: Shareholders are assured of a stable dividend. When the company does not earn enough profi t it can draw upon its reserves for payment of dividends. Not only that their holding size can improve with issue of bonus shares.
Due to reserves, there is capital appreciation, i.e., the value of shares may go up in the share market.
Basic Financial Management
Notes
20 LOVELY PROFESSIONAL UNIVERSITY
Demerits of Retained Earnings
The following are the important disadvantages of retained earnings:
1. Limited funds available by way of retained earnings.
2. Continuous retention of profi ts may lead to over capitalization.
3. Creation of monopolies, since retained earnings in bigger organisations helps to grow bigger which may lead to the monopoly.
4. Loss to shareholders, when a fi rm pays less dividends or no dividends due to retained earnings, shareholders may sell their shares for meeting their expenditure.
5. The management may misuse the retained earnings, which is not helpful to maximize shareholders wealth.
6. The cost of retained earnings is high, retained earnings are the dividends foregone by ordinary shareholders, which involve an opportunity cost.
7. Retained earnings leads to evasion of super profi t tax, which is the revenue loss to the Government.
2.2.6 Term Loans
Traditionally, commercial banks in India do not grant long-term loans.
They grant loans only for short period not extending one year. But recently they have started giving loans for a long period. Commercial banks give term loans i.e. for more than one year. The period of repayment of short-term loan is extended at intervals and in some cases loan is given directly for a long period. Commercial banks provide long-term fi nance to small scale units in the priority sector.
Merits of Long-term Borrowings from Commercial Banks
The merits of long-term borrowing from banks are as follows:
1. It is a fl exible source of fi nance as loans can be repaid when the need is met.
2. Finance is available for a defi nite period, hence it is not a permanent burden.
3. Banks keep the fi nancial operations of their clients secret.
4. Less time and cost is involved as compared to issue of shares, debentures etc.
5. Banks do not interfere in the internal affairs of the borrowing concern, hence the management retains the control of the company.
6. Loans can be paid-back in easy instalments.
7. In case of small-scale industries and industries in villages and backward areas, the interest charged is low.
Demerits
Following are the demerits of borrowing from commercial banks:
1. Banks require personal guarantee or pledge of assets and business cannot raise further loans on these assets.
2. In case the short-term loans are extended again and again, there is always uncertainty about this continuity.
Unit 2: Source of Finance
Notes
LOVELY PROFESSIONAL UNIVERSITY 21
3. Too many formalities are to be fulfi lled for getting term loans from banks. These formalities make the borrowings from banks time consuming and inconvenient.
2.2.7 Lease Financing
Lease is a contract whereby one can use the assets of the other with due permission of the owner on payment of rent without purchasing them. The owner of the asset is called ‘lessor’ and the user is called lessee. The period of use is called the lease period after which the lessee may opt for purchase of the asset.
So leasing is an arrangement that enables a business enterprise to use and exercise complete control over the assets without owning it. The owner gets rent in return and at any time as per the terms of the contract he can cancel the agreement. This system helps the business to use the plants and machinery and other fi xed assets for a long period of time without investing a large amount of money in purchasing them. At the end of the lease period the asset goes back to the owner. The owner of the assets also has the option of selling it to the user at a reduced price. Sometimes the user company may request the leasing company to purchase its existing assets and allow them to use the same assets on lease basis. This enables the company to save the long-term funds that can be utilised for other purposes. This is known as ‘sale and lease back’ system.
2.3 Instruments of Raising Short-term Finance
Sources of short-term funds have to be used (exclusively) for meeting the working capital requirements only and not far fi nancing fi xed assets and for meeting the margin money for working capital loans.
The various sources of short-term fi nancing are as follows:
2.3.1 Commercial Papers (CPs)
Commercial paper represents a short-term unsecured promissory note issued by fi rms that have a fairly high credit (standing) rating. It was fi rst introduced in USA and it was an important money market instruments. In India, Reserve Bank of India introduced CP on the recommendations of the Vaghul Working Group on money market. CP is a source of short-term fi nance to only large fi rms with sound fi nancial position.
Features of CP
1. The maturity period of CP ranges from 15 to 365 day (but in India it ranges between 91 to 180 days).
2. It is sold at a discount from its face value and redeemed at its face value.
3. Return on CP is the difference between par value and redeemable value.
4. It may be sold directly to investors or indirectly (through) dealers.
5. There is no developed secondary market for CP.
“Eligibility” Criteria for Issuing CP
CP is unsecured promissory note, the issue of CP is being regulated by the Reserve Bank of India. RBI has laid down the following conditions to determine the eligibility of a company that wishes to raise funds through the issue of CPs:
1. The Tangible Net Worth (TNW) of the company, as per latest audited balance sheet should not be less than ` 4 crore.
Basic Financial Management
Notes
22 LOVELY PROFESSIONAL UNIVERSITY
2. The company should have been sanctioned as a fund based limit for bank(s) fi nance and / or the All India Financial Institutions.
3. Company can issue CPs amounting to 75% of the permitted bank (working capital limit) credit.
4. Company’s CPs receives a minimum rating of (P2 from CRISIL, A-2 form ICRA, etc).
5. The minimum size of each CP is ` 5 lakhs or multiples thereof.
6. The size of any single issue should not be less than ` 1 crore.
7. The CP is in the form of usance promissory note negotiable by endorsement and delivery.
Advantages of CP
1. It is an alternative source of fi nance and proves to be helpful during the period of tight bank credit.
2. It is a cheaper source of short-term fi nance when compared to the bank credit.
Disadvantages of CP
1. It is available only for large and fi nancially sound companies.
2. It cannot be redeemed before the maturity date.
2.3.2 Certifi cates of Deposit
Certifi cates of Deposit is a negotiable money market instrument and issued in dematerialized form or as a Usance Promissory Note, for funds deposited at a bank or other eligible fi nancial institution for a specifi ed time period. Guidelines for issue of CDs are presently governed by various directives issued by the Reserve Bank of India, as amended from time to time. CDs can be issued by
1. scheduled commercial banks excluding Regional Rural Banks (RRBs) and Local Area Banks (LABs); and
2. select all-India Financial Institutions that have been permitted by RBI to raise short-term resources within the umbrella limit fi xed by RBI.
!Caution Banks have the freedom to issue CDs depending on their requirements. An FI
may issue CDs within the overall umbrella limit fi xed by RBI, i.e., issue of CD together with other instruments viz., term money, term deposits, commercial papers and intercorporate deposits should not exceed 100 per cent of its net owned funds, as per the latest audited balance sheet.
Advantages of Certifi cate of Deposit as a Money Market Instrument
The key advantages of certifi cate of deposits are as follows:
1. Since one can know the returns from before, the certifi cates of deposits are considered much safe.
2. One can earn more as compared to depositing money in savings account.
3. The Federal Insurance Corporation guarantees the investments in the certifi cate of deposit.
Unit 2: Source of Finance
Notes
LOVELY PROFESSIONAL UNIVERSITY 23
Disadvantages of Certifi cate of deposit as a money market instrument
The key disadvantages of certifi cate of deposits are as follows:
1. As compared to other investments the returns is less.
2. The money is tied along with the long maturity period of the Certifi cate of Deposit. Huge penalties are paid if one gets out of it before maturity.
2.3.3 Treasury Bills
Treasury bills were fi rst issued by the Indian government in 1917. Treasury bills are short-term fi nancial instruments that are issued by the Central Bank of the country. It is one of the safest money market instruments as it is void of market risks, though the return on investments is not that huge.
The reserve bank of India holds the major portion of outstanding treasury bills. These bills have a low yield and hence the other holders of treasury bills such as banks rediscount these bills with the RBI at the earliest opportunity.
The treasuries bills have not developed as an active monetary instrument in the market as these bills of 91 days do not provide a yield which is positive. Due to their high liquidity and safety, 182 days treasury bills despite low rates represent the most important instrument of money market and a versatile one in the hands of the effective fund managers of fi rms, companies and banks. 182 days treasury bills can be sold to discount and fi nance house of India or discounted with banks and Financial Institutions. The market can be improved only by enhancing the nominal rate of discount as compared to the expected rate in the price level. The development of an active secondary market for treasury bills depends on suitable support to brokers and dealers and permitting banks also to avail their services.
2.3.4 Inter-Corporate Deposits (ICDS)
A deposit made by one fi rm with another fi rm is known as inter-corporate deposits (ICDs). Generally, these deposits are usually made for a period up to six months. Such deposits may be of three types:
1. Call Deposits: Deposits are expected to be payable on call. In other words, whenever its repayment is demanded on just one days notice. But, in actual practice, the lender has to wait for at least 2 or 3 days to get back the amount. Inter corporate deposits generally have 12 per cent interest per annum.
2,. Three Months Deposits: These deposits are more popular among companies for investing the surplus funds. The borrower takes this type of deposits for tiding over a short-term cash inadequacy. The interest rate on these types of deposits is around 14 per cent per annum.
3. Six-Months Deposits: Generally, the inter-corporate deposits are made for a maximum period of six months. These types of deposits are usually given to ‘A’ category borrowers only and they carry an interest rate of around 16% per annum.
Features of ICDs
1. There are no legal regulation, which makes an ICD transaction very convenient.
2. Inter-corporate deposits are given and taken in secrecy.
3. Inter-corporate deposits are given based on borrower’s fi nancial sound, but in practice lender lends money based on personal contacts.
Basic Financial Management
Notes
24 LOVELY PROFESSIONAL UNIVERSITY
2.3.5 Trade Credit
Trade credit refers to credit granted to manufacturers and traders by the suppliers of raw material, fi nished goods, components, etc. Usually business enterprises buy goods on 30 to 90 days credit. This means that the goods are delivered but payments are not made until the expiry of the period of credit. This type of credit does not make the funds available in cash but it facilitates purchases without making immediate payment which amounts to funding it by suppliers. This is a very popular source of short-term fi nance.
2.3.6 Deferred Income
Deferred incomes are incomes received in advance by the fi rm for supply of goods or services in future period. These income receipts increase the fi rm’s liquidity and constitute an important source of short-term source fi nance. These payments are not showed as revenue till the supply of goods or services, but showed in the balance sheet as income received in advance. Advance payment can be demanded by only fi rms having monopoly power, great demand for its products and services and if the fi rm is manufacturing a special product on a special order.
2.3.7 Commercial Banks
Commercial banks are the major source of working capital fi nance to industries and commerce. Granting loan to business is one of their primary functions. Getting bank loan is not an easy task since the lending bank offi ce may ask number of questions about the prospective borrower’s fi nancial position and its plans for the future. At the same time bank will want to monitor of the borrower’s business progress. But there is a good side to this, that is borrower’s share price tends to rise, because investor know that convince banks is very diffi cult.
Forms of Bank Finance
Banks provide different types of tailored made loans that are suitable for specific needs of a firm. The different types of forms of loans are:
1. Loans: Loan in an advance is lumpsum given to borrower against some security. Loan amount is paid to the applicant in the form of cash or by credit to his/her account. In practice the loan amount is paid to the customer by crediting his/her account. Interest will be charged on the entire loan amount from the date the loan is sanctioned.
2. Overdrafts: Overdraft facility is an agreement between the borrower and the banker, where the borrower is allowed to withdraw funds in excess of the balance in his/her current accounts up to a certain limit during a specifi ed period. It is fl exible from the borrower ‘s point of view because the borrower can withdraw and repay the cash whenever he/she wants within the given stipulations. Interest is charged on daily over drawn balances and not on the overdraft limit given by the bank. But bank charges some minimum charges.
3. Cash Credit: It is the most popular source of working capital fi nance in India. A cash credit facility is an arrangement where a bank permits a borrower to withdraw money up to a sanctioned credit limit against tangible security or guarantees. Borrower does not require to withdraw the total sanctioned credit at a time, rather, he can withdraw according to his/her requirements and he can also repay the surplus cash in his cash credit account. Interest is chargeable on actually used amount and there is no commitment charge. Cash credit is a fl exible source of working capital from borrower’s point of view.
Unit 2: Source of Finance
Notes
LOVELY PROFESSIONAL UNIVERSITY 25
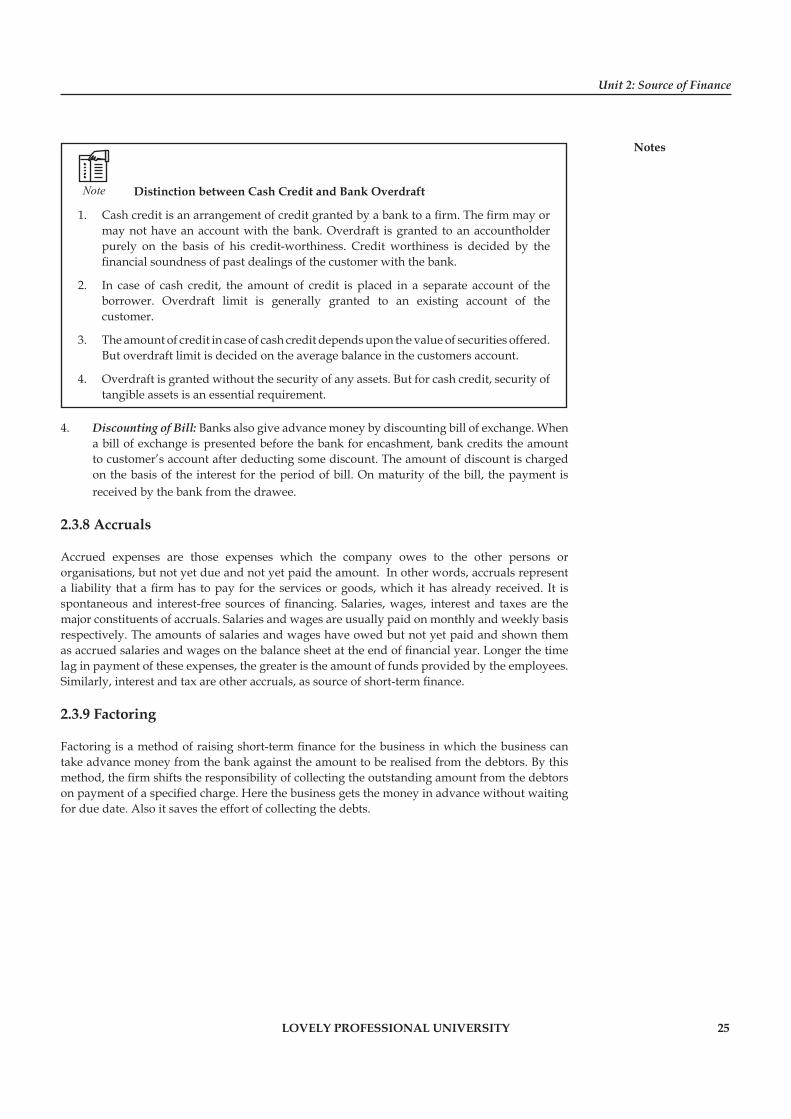
Note Distinction between Cash Credit and Bank Overdraft
1. Cash credit is an arrangement of credit granted by a bank to a fi rm. The fi rm may or may not have an account with the bank. Overdraft is granted to an accountholder purely on the basis of his credit-worthiness. Credit worthiness is decided by the fi nancial soundness of past dealings of the customer with the bank.
2. In case of cash credit, the amount of credit is placed in a separate account of the borrower. Overdraft limit is generally granted to an existing account of the customer.
3. The amount of credit in case of cash credit depends upon the value of securities offered. But overdraft limit is decided on the average balance in the customers account.
4. Overdraft is granted without the security of any assets. But for cash credit, security of tangible assets is an essential requirement.
4. Discounting of Bill: Banks also give advance money by discounting bill of exchange. When a bill of exchange is presented before the bank for encashment, bank credits the amount to customer’s account after deducting some discount. The amount of discount is charged on the basis of the interest for the period of bill. On maturity of the bill, the payment is received by the bank from the drawee.
2.3.8 Accruals
Accrued expenses are those expenses which the company owes to the other persons or organisations, but not yet due and not yet paid the amount. In other words, accruals represent a liability that a fi rm has to pay for the services or goods, which it has already received. It is spontaneous and interest-free sources of fi nancing. Salaries, wages, interest and taxes are the major constituents of accruals. Salaries and wages are usually paid on monthly and weekly basis respectively. The amounts of salaries and wages have owed but not yet paid and shown them as accrued salaries and wages on the balance sheet at the end of fi nancial year. Longer the time lag in payment of these expenses, the greater is the amount of funds provided by the employees. Similarly, interest and tax are other accruals, as source of short-term fi nance.
2.3.9 Factoring
Factoring is a method of raising short-term fi nance for the business in which the business can take advance money from the bank against the amount to be realised from the debtors. By this method, the fi rm shifts the responsibility of collecting the outstanding amount from the debtors on payment of a specifi ed charge. Here the business gets the money in advance without waiting for due date. Also it saves the effort of collecting the debts.

Basic Financial Management
Notes
26 LOVELY PROFESSIONAL UNIVERSITY
Caselet HSBC extends Factoring Service to SMEs
HSBC today announced the launch of factoring services to SMEs, whose rise in the wake of strong export growth has expanded opportunities in the fi nancial business stream. The service would be available at Mumbai, New Delhi, Kolkata,
Pune, Bangalore and Chennai. HSBC, which had been providing the factoring services to large corporates since 2005, decided to focus on SMEs due to their large contribution to the economy as factoring would help small businesses achieve faster growth by effi ciently managing their working capital. Announcing the launch of the service on Tuesday, Mr Bhriguraj Singh, Senior Vice-President and Head Factoring (India), said that HSBC with a large SME customer base would not be looking at any particular sector of the business for its factoring service.
Key Determinant
He added that the key determinant would be the quality of the product or services that could fi t within the manageable risk.
Stating that the ITES sector would be a business prospect, Mr Singh said that the bank would not be averse to IT product companies and would be factoring their transactions based on the parameters measurable risks.
Useful to Export Trade
Factoring is useful not only in export but also in export trade. It gains importance in today’s international trade since international buyers are increasingly unwilling to enter into letter of credit-based transactions due to the additional monetary and administrative costs involved.
The bank has already deployed 200 people to promote the product among SMEs and would add more manpower as the business expanded, he said.Source: thehindubusinessline.com
Task Visit the branches of any two banks in your locality and fi nd out from them about the various ways in which they provide fi nance to business enterprises. Find out about the types of securities the banks accepts for such fi nance.
2.4 Summary
Every business requires money to start and run the business. ‘Business fi nance’ refers to the money required for business purpose and the ways by which it is raised.
Every business needs funds to purchase fi xed assets, must day-to-day expenses, to fund business growth, bridge the time gap between production and sales, to meet contingencies and to avail of business opportunities.
The importance of fi nance has considerably increased in modern times due to need for large-scale operation, use of modern technology and promotion of sales.
Unit 2: Source of Finance
Notes
LOVELY PROFESSIONAL UNIVERSITY 27
Based on the period for which the funds are required, business fi nance is classifi ed as:
Short-term fi nance (for a period of less than one year)
Medium-term fi nance (for one year to fi ve years)
Long-term fi nance (for more than fi ve years).
There are two sources of raising the required funds by the business (i) internal source – owner’s capital, retained earnings, and (ii) external source-friends and relatives, banks, other fi nancial institutions, money lenders, capital market, etc.
Methods of raising long-term fi nance are:
Issue of Shares
Issue of Debentures
Loans from fi nancial institutions
Public Deposits
Retention of Profi t
Term loans form Banks
Lease Financing
Methods of Raising short-term fi nance are:
Commercial Papers (CPs)
Certifi cates of Deposit
Treasury Bills
Inter-Corporate Deposits (ICDS)
Trade Credit
Deferred Income
Commercial Banks
Factoring etc.
2.5 Keywords
Accruals: Accrued expenses are those expenses which the company owes to the other persons or organisations, but not yet due and not yet paid the amount.
Commercial Paper: It represents a short-term unsecured promissory note issued by fi rms that have a fairly high credit (standing) rating.
Deferred Income: Deferred incomes are incomes received in advance by the fi rm for supply of goods or services in future period.
Equity Share: Equity means ‘equal’. Equity share is a share that gives equal right to holders.
Factoring: Factoring is a fi nancial service covering the fi nancing and collection of book debts and receivables arising from credit sale of goods and services, both in the domestic as well as international market.
Inter-corporate Deposits (ICDs): A deposit made by one fi rm with another fi rm is known as Inter-corporate Deposits (ICDs).
Basic Financial Management
Notes
28 LOVELY PROFESSIONAL UNIVERSITY
Preference Share: Preference share capital gives certain privileges to its holders on the equity shareholders.
Retained Earnings: These are the portion of earnings available to equity shareholders, which are ploughed back in the company.
Trade Credit: It refers to the credit extended by the supplier of goods or services to his/her customer in the normal course of business.
2.6 Self Assessment
Fill in the blanks:
1. Trade credit is a ......................... source of short-term fi nance.
2. ......................... income is income received in advance by the fi rm for supply of goods in future.
3. CPs are sold at ......................... and redeemed at ......................... .
4. A fi rm cannot issue public deposits for more than ......................... of its share capital and free reserves.
5. ......................... interest rate ceiling on public deposits.
6. ......................... is the smallest unit into which the total capital of the company is divided.
7. As preference share capital lies between debenture capital and equity share capital with regards to claim on assets and income of the company hence, it is called as ........................ .
8. ........................ facility is an agreement between the borrower and the banker, where the borrower is allowed to withdraw funds in excess of the balance in his/her current accounts up to a certain limit during a specifi ed period.
9. Treasury bills were fi rst issued by the Indian government in ........................ .
State whether the following statements are true or false:
10. Minimum size of CP is ` 6 lakhs.
11. Public deposits are governed by the Companies (Acceptance of Deposits) Amendment Rules 1978.
12. There are three types of inter-corporate deposits.
13. A share is a small unit of capital of a company.
14. Preference share capital gives certain privileges to its holders on the equity shareholders.
15. Participatory preference share holders have the right to participate in company meetings.
16. Bonds are issued for short-term Finance
2.7 Review Questions
1. “Is Trade Credit a source of fi nance”. Discuss.
2. “Accruals are free source of fi nance”, comment.
3. Write a brief note on CP as a source of fi nance.
4. What is public deposit? Discuss its advantages and disadvantages.
Unit 2: Source of Finance
Notes
LOVELY PROFESSIONAL UNIVERSITY 29
5. Discuss the types of ICD’s.
6. Write a brief note on public deposits.
7. What is factoring? List out its features.
8. Briefl y discuss the sources of short-term fi nance.
9. Discuss in detail the sources of long-term fi nance.
10. What are the sources of working capital fi nance? Discuss.
11. Write short note on (a) CP’s, (b) Trade Credit and (c) Accruals.
Answers: Self Assessment
1. Spontaneous 2. Differed
3. Discount, face value 4. 25%
5. 15% 6. Share
7. “senior security” 8. Overdraft
9. 1917 10. False
11. True 12. True
13. True 14. True
15. False 16. False
2.8 Further Readings
Books Chandra, P., Financial Management - Theory and Practice, New Delhi, Tata McGraw Hill Publishing Company Ltd., 2002, p. 3.
Sudhindra Bhat, Financial Management, New Delhi, Excel Books, 2008.
Van Horne, J.C. and Wachowicz, Jr, J.M., Fundamentals of Financial Management, New Delhi, Prentice Hall of India Pvt. Ltd., 1996, p. 2.
Online links www.globusz.com
www.scribd.com
Basic Financial Management
Notes
30 LOVELY PROFESSIONAL UNIVERSITY
Unit 3: Time Value of Money
CONTENTS
Objectives
Introduction
3.1 Meaning of Time Value of Money
3.2 Valuation Concepts or Techniques
3.3 Compound Value Concept
3.3.1 Multiple Compounding Periods
3.3.2 Future Value of Series of Cash Flows
3.3.3 Compound Sum of an Annuity
3.4 Discounting or Present Value Concept
3.5 Practical Implications of Compounding and Discounting Value Concepts
3.6 Summary
3.7 Keywords
3.8 Self Assessment
3.9 Review Questions
3.10 Further Readings
Objectives
After studying this unit, you will be able to:
Discuss compounding value concept
Describe discounting value concept
Introduction
It has been explained in the preceding unit that Maximization of the shareholder’s wealth is the basic objective of the fi nance manager of a fi rm. This requires him to take appropriate decisions on fi nancing, investment and dividends. While taking these decisions, the fi nance manager must keep the “Time factor” in mind.
Example:
1. When interest on funds raised will have to be paid.
2. When return on investment will be received.
3. Whether it will be received on a consistent basis or otherwise etc.
All this requires that the fi nance manager knows about the various valuation concepts, viz., Compound Value Concept, Annuity Concept, Present Value Concept etc. All these concepts are basically based upon the fact that, money has time value.
Unit 3: Time Value of Money
Notes
LOVELY PROFESSIONAL UNIVERSITY 31
3.1 Meaning of Time Value of Money
“Money has time value” means that the value of money changes over a period of time. The value of a rupee, today is different from what it will be, say, after one year.
Money has a time value because of the following reasons:
1. Individuals generally prefer current consumption to future consumption.
2. An investor can profi tably employ a rupee received today, to give him a higher value to be received tomorrow or after a certain period of time.
3. In an infl ationary economy, the money received today, has more purchasing power than money to be received in future.
4. ‘A bird in hand is worth two in the bush’ : This statement implies that, people consider a rupee today, worth more than a rupee in the future, say, after a year. This is because of the uncertainty connected with the future.
Thus, the fundamental principle behind the concept of time value of money is that, a sum of money received today, is worth more than if the same is received after some time.
Example: If an individual is given an alternative either to receive ` 10,000 now or after six months; he will prefer ` 10,000 now. This may be because, today, he may be in a position to purchase more goods with this money than what he is going to get for the same amount after six months.
Time value of money or time preference of money is one of the central ideas in fi nance. It becomes important and is of vital consideration in decision making. This will be clear with the following example.
Example: A project needs an initial investment of ̀ 1,00,000. It is expected to give a return of ` 20,000 p.a. at the end of each year, for six years. The project thus involves a cash outfl ow of ` 1,00,000 in the ‘zero year’ and cash infl ows of ` 20,000 per year, for six years. In order to decide, whether to accept or reject the project, it is necessary, that the present value of cash infl ows received annually for six years is ascertained and compared with the initial investment of ` 1,00,000. The fi rm will accept the project only when the present value of the cash infl ows at the desired rate of interest is at least equal to the initial investment of ` 1,00,000.
3.2 Valuation Concepts or Techniques
The time value of money implies that:
1. a person will have to pay in future more, for a rupee received today and
2. a person may accept less today, for a rupee to be received in the future.
The above statements relate to two different concepts:
1. Compound Value Concept
2. Discounting or Present Value Concept
3.3 Compound Value Concept
In this concept, the interest earned on the initial principal amount becomes a part of the principal at the end of a compounding period.
Basic Financial Management
Notes
32 LOVELY PROFESSIONAL UNIVERSITY
Illustration 1: ` 1,000 invested at 10% is compounded annually for three years, Calculate the Compounded value after three years.
Solution:
Amount at the end of 1st year will be: 1,100
[1000 x 110/100 = 1,100]
Amount at the end of 2nd year will be: 1,210
[1100 x 110/100 = 1,210]
Amount at the end of 3rd year will be: 1,331
[1210 x 110/100 = 1,331]
This compounding process will continue for an indefi nite time period.
Compounding of Interest over ‘N’ years: The compounding of Interest can be calculated by the following equation.
A = P (1 + i)n
In which,
A = amount at the end of period ‘n’.
P = Principal at the beginning of the period.
I = Interest rate.
N = Number of years.
By taking into consideration, the above illustration we get,
A = P (1+i)n
A = 1000 (1 + .10)3
A = 1,331
Note Computation by this formula can also become very time consuming if the number of years increase, say 10, 20 or more. In such cases to save upon the computational efforts, Compound Value table* can be used. The table gives the compound value of ` 1, after ‘n’ years for a wide range of combination of ‘I’ and ‘n’.
For instance, the above illustration gives the compound value of ` 1 at 10% p.a. at the end of 3 years as 1.331, hence, the compound value of ` 1000 will amount to :
10001 × 331 = ` 1331
3.3.1 Multiple Compounding Periods
Interest can be compounded, even more than once a year. For calculating the multiple value above, logic can be extended. For instance, in case of Semi-annual compounding, interest is paid twice a year but at half the annual rate. Similarly in case of quarterly compounding, interest rate effectively is 1/4th of the annual rate and there are four quarter years.
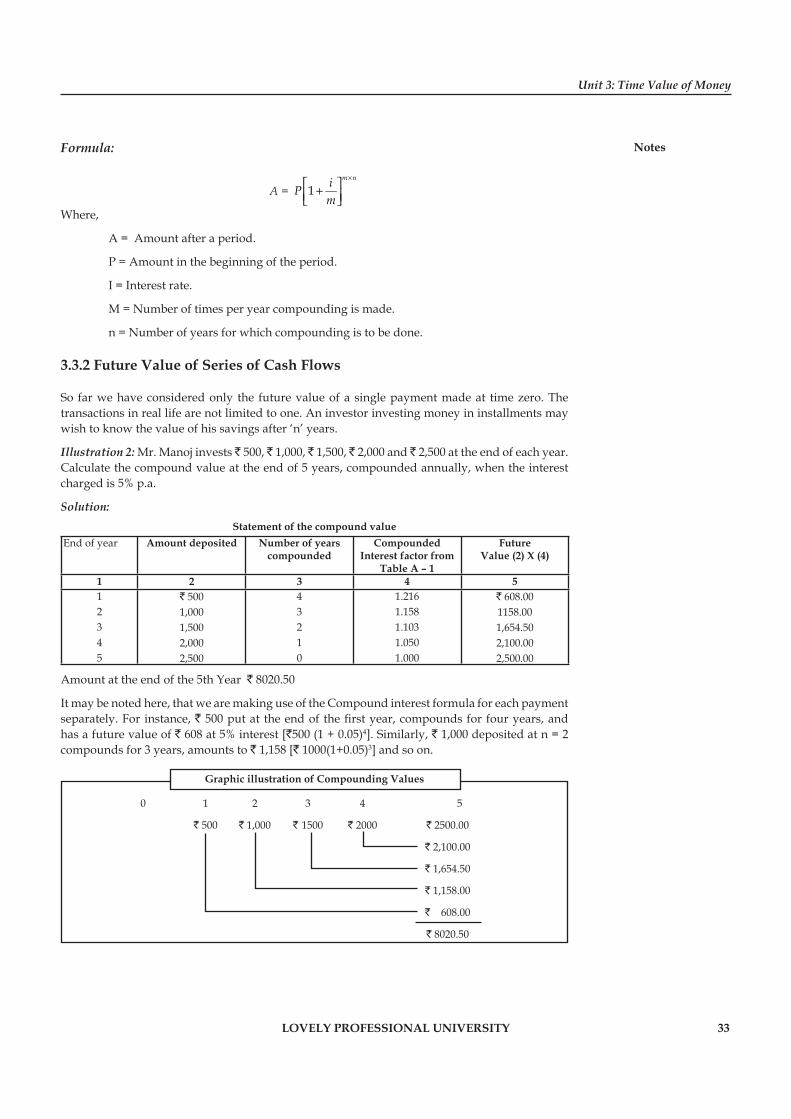
Unit 3: Time Value of Money
Notes
LOVELY PROFESSIONAL UNIVERSITY 33
Formula:
A = 1m niP
m
×⎡ ⎤+⎢ ⎥⎣ ⎦
Where,
A = Amount after a period.
P = Amount in the beginning of the period.
I = Interest rate.
M = Number of times per year compounding is made.
n = Number of years for which compounding is to be done.
3.3.2 Future Value of Series of Cash Flows
So far we have considered only the future value of a single payment made at time zero. The transactions in real life are not limited to one. An investor investing money in installments may wish to know the value of his savings after ‘n’ years.
Illustration 2: Mr. Manoj invests ` 500, ` 1,000, ` 1,500, ` 2,000 and ` 2,500 at the end of each year. Calculate the compound value at the end of 5 years, compounded annually, when the interest charged is 5% p.a.
Solution:Statement of the compound value
End of year Amount deposited Number of years compounded
Compounded Interest factor from
Table A – 1
Future Value (2) X (4)
1 2 3 4 512345
` 5001,0001,5002,0002,500
43210
1.2161.1581.1031.0501.000
` 608.001158.001,654.502,100.002,500.00
Amount at the end of the 5th Year ` 8020.50
It may be noted here, that we are making use of the Compound interest formula for each payment separately. For instance, ` 500 put at the end of the fi rst year, compounds for four years, and has a future value of ` 608 at 5% interest [`500 (1 + 0.05)4]. Similarly, ` 1,000 deposited at n = 2 compounds for 3 years, amounts to ` 1,158 [` 1000(1+0.05)3] and so on.
Graphic illustration of Compounding Values
0 1 2 3 4 5
` 500 ` 1,000 ` 1500 ` 2000 ` 2500.00
` 2,100.00
` 1,654.50
` 1,158.00
` 608.00
` 8020.50
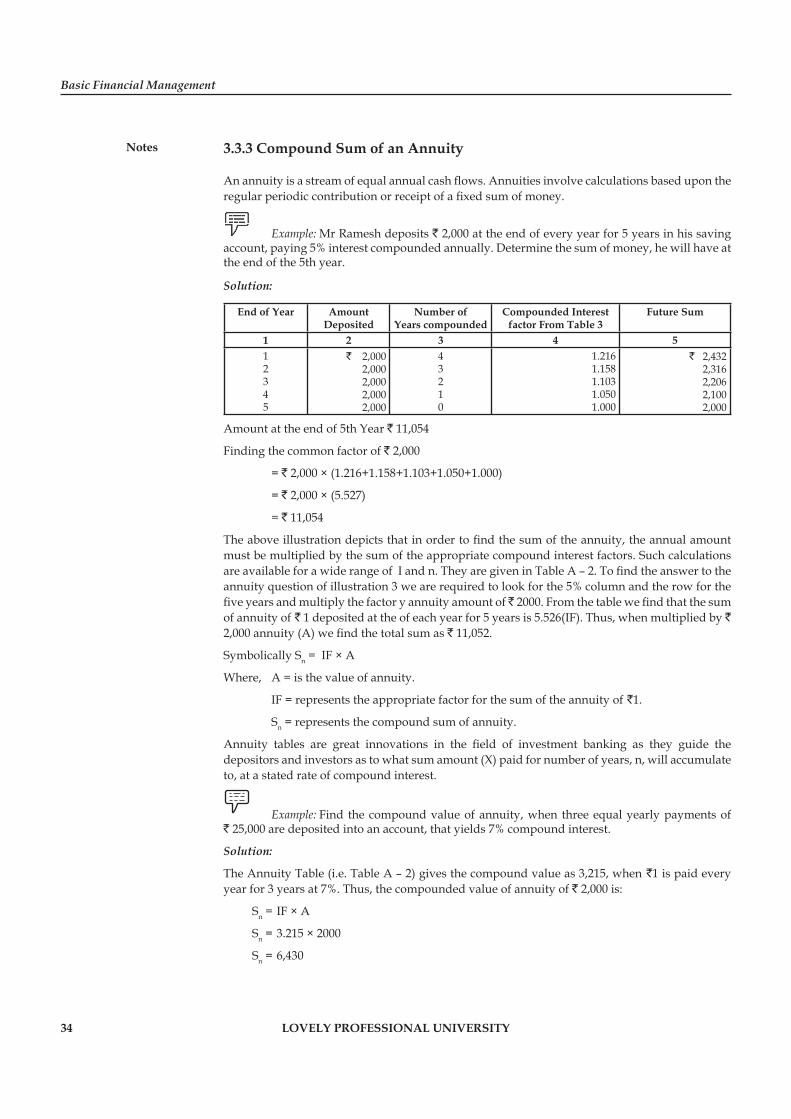
Basic Financial Management
Notes
34 LOVELY PROFESSIONAL UNIVERSITY
3.3.3 Compound Sum of an Annuity
An annuity is a stream of equal annual cash fl ows. Annuities involve calculations based upon the regular periodic contribution or receipt of a fi xed sum of money.
Example: Mr Ramesh deposits ` 2,000 at the end of every year for 5 years in his saving account, paying 5% interest compounded annually. Determine the sum of money, he will have at the end of the 5th year.
Solution:
End of Year AmountDeposited
Number ofYears compounded
Compounded Interest factor From Table 3
Future Sum
1 2 3 4 512345
` 2,0002,0002,0002,0002,000
43210
1.2161.1581.1031.0501.000
` 2,4322,3162,2062,1002,000
Amount at the end of 5th Year ` 11,054
Finding the common factor of ` 2,000
= ` 2,000 × (1.216+1.158+1.103+1.050+1.000)
= ` 2,000 × (5.527)
= ` 11,054
The above illustration depicts that in order to fi nd the sum of the annuity, the annual amount must be multiplied by the sum of the appropriate compound interest factors. Such calculations are available for a wide range of I and n. They are given in Table A – 2. To fi nd the answer to the annuity question of illustration 3 we are required to look for the 5% column and the row for the fi ve years and multiply the factor y annuity amount of ̀ 2000. From the table we fi nd that the sum of annuity of ` 1 deposited at the of each year for 5 years is 5.526(IF). Thus, when multiplied by ` 2,000 annuity (A) we fi nd the total sum as ` 11,052.
Symbolically Sn = IF × A
Where, A = is the value of annuity.
IF = represents the appropriate factor for the sum of the annuity of `1.
Sn = represents the compound sum of annuity.
Annuity tables are great innovations in the fi eld of investment banking as they guide the depositors and investors as to what sum amount (X) paid for number of years, n, will accumulate to, at a stated rate of compound interest.
Example: Find the compound value of annuity, when three equal yearly payments of ` 25,000 are deposited into an account, that yields 7% compound interest.
Solution:
The Annuity Table (i.e. Table A – 2) gives the compound value as 3,215, when `1 is paid every year for 3 years at 7%. Thus, the compounded value of annuity of ` 2,000 is:
Sn = IF × A
Sn = 3.215 × 2000
Sn = 6,430
Unit 3: Time Value of Money
Notes
LOVELY PROFESSIONAL UNIVERSITY 35
3.4 Discounting or Present Value Concept
The concept of present value is the exact opposite of that of a sum of money or series of payments, while in case of present value concept, we estimate the present worth or a future payment/instalment or series of payment adjusted for the time value of money.
The basis of present value approach is that, the opportunity cost exist for money lying idle. That is to say, that interest can be earned on the money. This return is termed as ‘discounting rate’.
!Caution Given a positive rate of interest, the present value of the future Rupee will always
be lower. The technique for fi nding the present value is termed as ‘discounting’.
Present value after ‘n’ Years:
Formula:
( )1 nAPV
i=
+
Where,
PV = principal amount the investor is willing to forego at present
I = Interest rate.
A = amount at the end of the period ‘n’.
N = Number of years.
With this formula, we can directly calculate the amount; any depositor would be willing to sacrifi ce at present, with a time preference rate or discount rate of x%.
Example: If Mr. X, depositor, expects to get ` 100 after one year, at the rate of 10%, the amount he will have to forego at present can be calculated as follows:
( )1 nAPV
i=
+
( )= =+100
. 90.901 .10
P V R s
Similarly, the present value of an amount of infl ow at the end of ‘n’ years can be computed.
Present Value of a Series of Cash Flows
In a business situation, it is very natural that returns received by a fi rm are spread over a number of years. An investment made now may fetch returns a certain time period. Every businessman will like to know whether it is worthwhile to invest or forego a certain sum now, in anticipating of returns he expects to earn over a number of years. In order to take this decision he needs to equate the total anticipated future returns, to the present sum he is going to sacrifi ce. The estimate of the present value of future series of returns, the present value of each expected infl ow will be calculated.
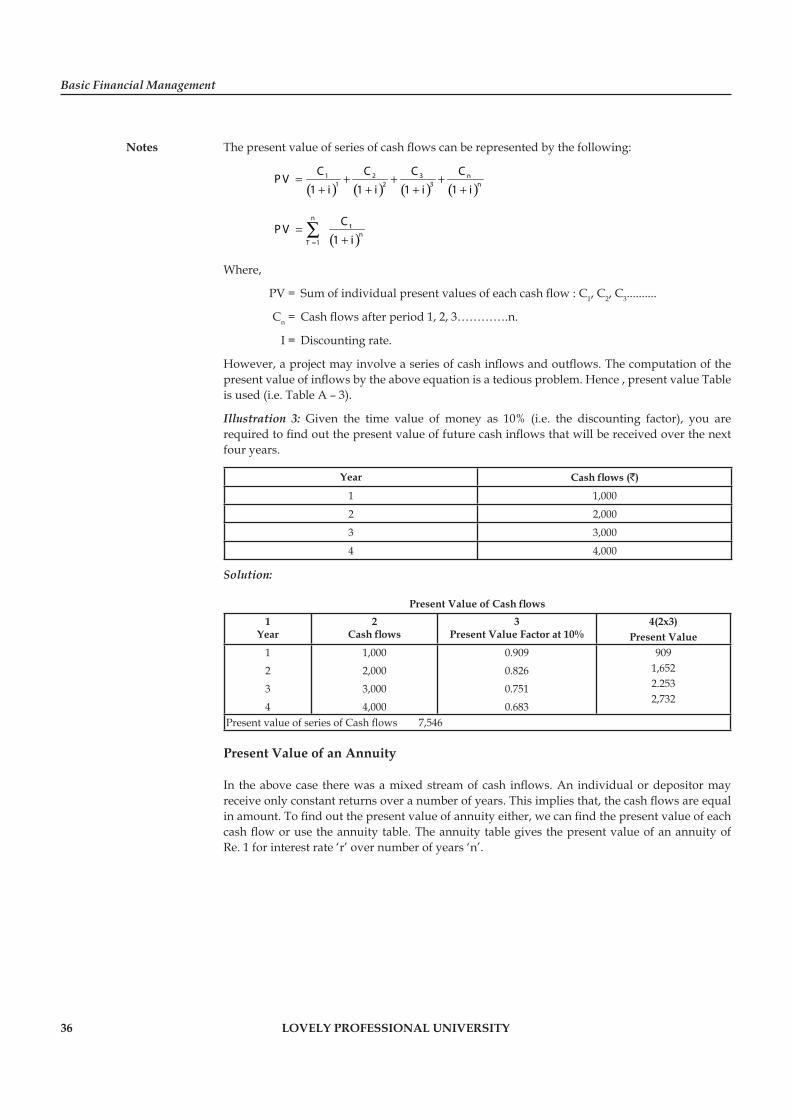
Basic Financial Management
Notes
36 LOVELY PROFESSIONAL UNIVERSITY
The present value of series of cash fl ows can be represented by the following:
( ) ( ) ( ) ( )= + + +
+ + + +1 2 3
1 2 31 1 1 1n
n
C C C CP V
i i i i
( )=
=+
∑1
1
nt
nT
CP V
i
Where,
PV = Sum of individual present values of each cash fl ow : C1, C2, C3..........
Cn = Cash fl ows after period 1, 2, 3………….n.
I = Discounting rate.
However, a project may involve a series of cash infl ows and outfl ows. The computation of the present value of infl ows by the above equation is a tedious problem. Hence , present value Table is used (i.e. Table A – 3).
Illustration 3: Given the time value of money as 10% (i.e. the discounting factor), you are required to fi nd out the present value of future cash infl ows that will be received over the next four years.
Year Cash fl ows (`)
1 1,000
2 2,000
3 3,000
4 4,000
Solution:
Present Value of Cash fl ows1
Year2
Cash fl ows3
Present Value Factor at 10%4(2x3)
Present Value1
2
3
4
1,000
2,000
3,000
4,000
0.909
0.826
0.751
0.683
9091,6522.2532,732
Present value of series of Cash fl ows 7,546
Present Value of an Annuity
In the above case there was a mixed stream of cash infl ows. An individual or depositor may receive only constant returns over a number of years. This implies that, the cash fl ows are equal in amount. To fi nd out the present value of annuity either, we can fi nd the present value of each cash fl ow or use the annuity table. The annuity table gives the present value of an annuity of Re. 1 for interest rate ‘r’ over number of years ‘n’.
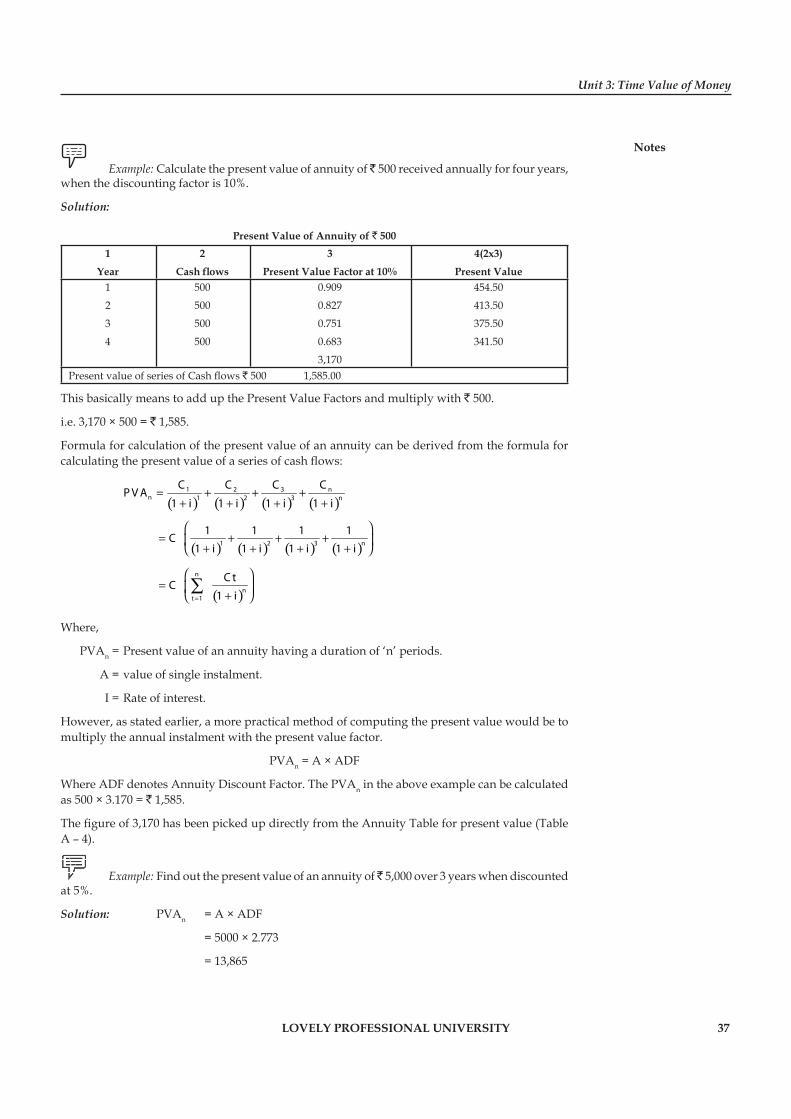
Unit 3: Time Value of Money
Notes
LOVELY PROFESSIONAL UNIVERSITY 37
Example: Calculate the present value of annuity of ̀ 500 received annually for four years, when the discounting factor is 10%.
Solution:
Present Value of Annuity of ` 5001
Year
2
Cash fl ows
3
Present Value Factor at 10%
4(2x3)
Present Value1
2
3
4
500
500
500
500
0.909
0.827
0.751
0.683
3,170
454.50
413.50
375.50
341.50
Present value of series of Cash fl ows ` 500 1,585.00
This basically means to add up the Present Value Factors and multiply with ` 500.
i.e. 3,170 × 500 = ` 1,585.
Formula for calculation of the present value of an annuity can be derived from the formula for calculating the present value of a series of cash fl ows:
( ) ( ) ( ) ( )= + + +
+ + + +1 2 3
1 2 31 1 1 1n
n n
C C C CP V A
i i i i
( ) ( ) ( ) ( )⎛ ⎞
= + + +⎜ ⎟+ + + +⎝ ⎠
1 2 3
1 1 1 1
1 1 1 1 nCi i i i
( )=
⎛ ⎞= ⎜ ⎟
+⎝ ⎠∑
n
1
1 n
t
C tC
i
Where,
PVAn = Present value of an annuity having a duration of ‘n’ periods.
A = value of single instalment.
I = Rate of interest.
However, as stated earlier, a more practical method of computing the present value would be to multiply the annual instalment with the present value factor.
PVAn = A × ADF
Where ADF denotes Annuity Discount Factor. The PVAn in the above example can be calculated as 500 × 3.170 = ` 1,585.
The fi gure of 3,170 has been picked up directly from the Annuity Table for present value (Table A – 4).
Example: Find out the present value of an annuity of ̀ 5,000 over 3 years when discounted at 5%.
Solution: PVAn = A × ADF
= 5000 × 2.773
= 13,865
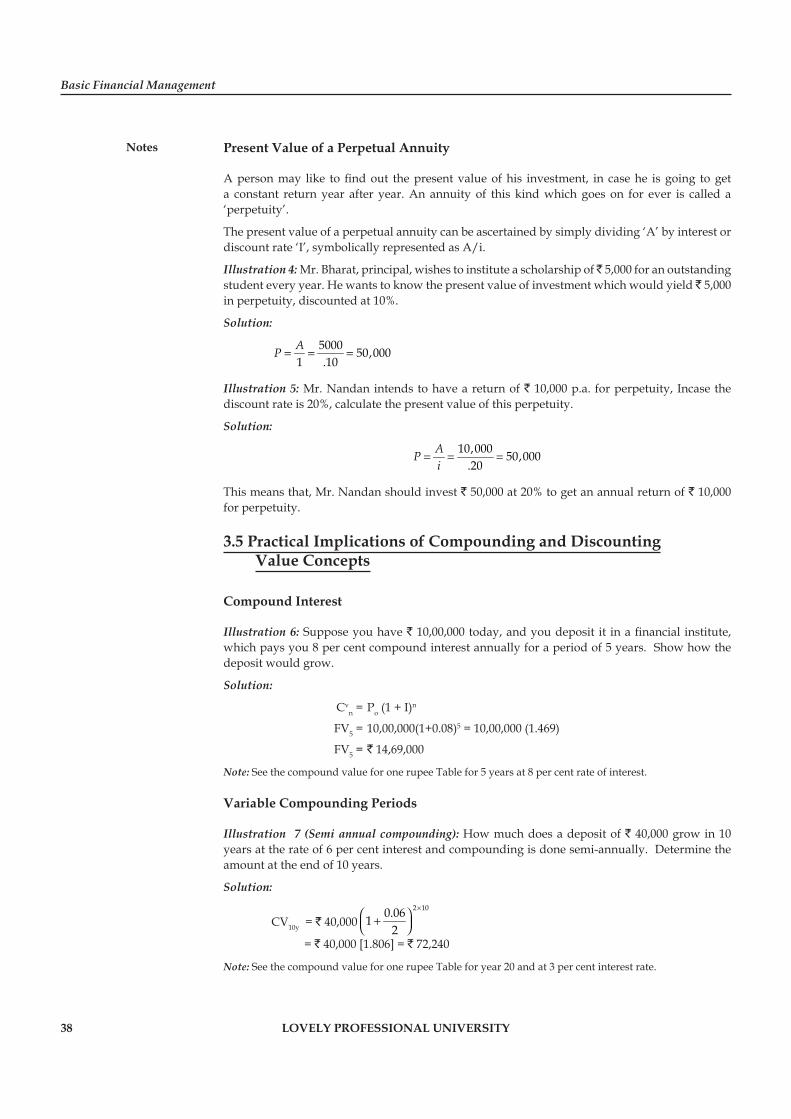
Basic Financial Management
Notes
38 LOVELY PROFESSIONAL UNIVERSITY
Present Value of a Perpetual Annuity
A person may like to fi nd out the present value of his investment, in case he is going to get a constant return year after year. An annuity of this kind which goes on for ever is called a ‘perpetuity’.
The present value of a perpetual annuity can be ascertained by simply dividing ‘A’ by interest or discount rate ‘I’, symbolically represented as A/i.
Illustration 4: Mr. Bharat, principal, wishes to institute a scholarship of ̀ 5,000 for an outstanding student every year. He wants to know the present value of investment which would yield ` 5,000 in perpetuity, discounted at 10%.
Solution:
5000 50,0001 .10AP = = =
Illustration 5: Mr. Nandan intends to have a return of ` 10,000 p.a. for perpetuity, Incase the discount rate is 20%, calculate the present value of this perpetuity.
Solution:
10,000 50,000.20
APi
= = =
This means that, Mr. Nandan should invest ` 50,000 at 20% to get an annual return of ` 10,000 for perpetuity.
3.5 Practical Implications of Compounding and Discounting Value Concepts
Compound Interest
Illustration 6: Suppose you have ` 10,00,000 today, and you deposit it in a fi nancial institute, which pays you 8 per cent compound interest annually for a period of 5 years. Show how the deposit would grow.
Solution:
Cvn = Po (1 + I)n
FV5 = 10,00,000(1+0.08)5 = 10,00,000 (1.469)
FV5 = ` 14,69,000
Note: See the compound value for one rupee Table for 5 years at 8 per cent rate of interest.
Variable Compounding Periods
Illustration 7 (Semi annual compounding): How much does a deposit of ` 40,000 grow in 10 years at the rate of 6 per cent interest and compounding is done semi-annually. Determine the amount at the end of 10 years.
Solution:
CV10y = ` 40,0002 100.061
2
×⎛ ⎞+⎜ ⎟⎝ ⎠
= ` 40,000 [1.806] = ` 72,240
Note: See the compound value for one rupee Table for year 20 and at 3 per cent interest rate.
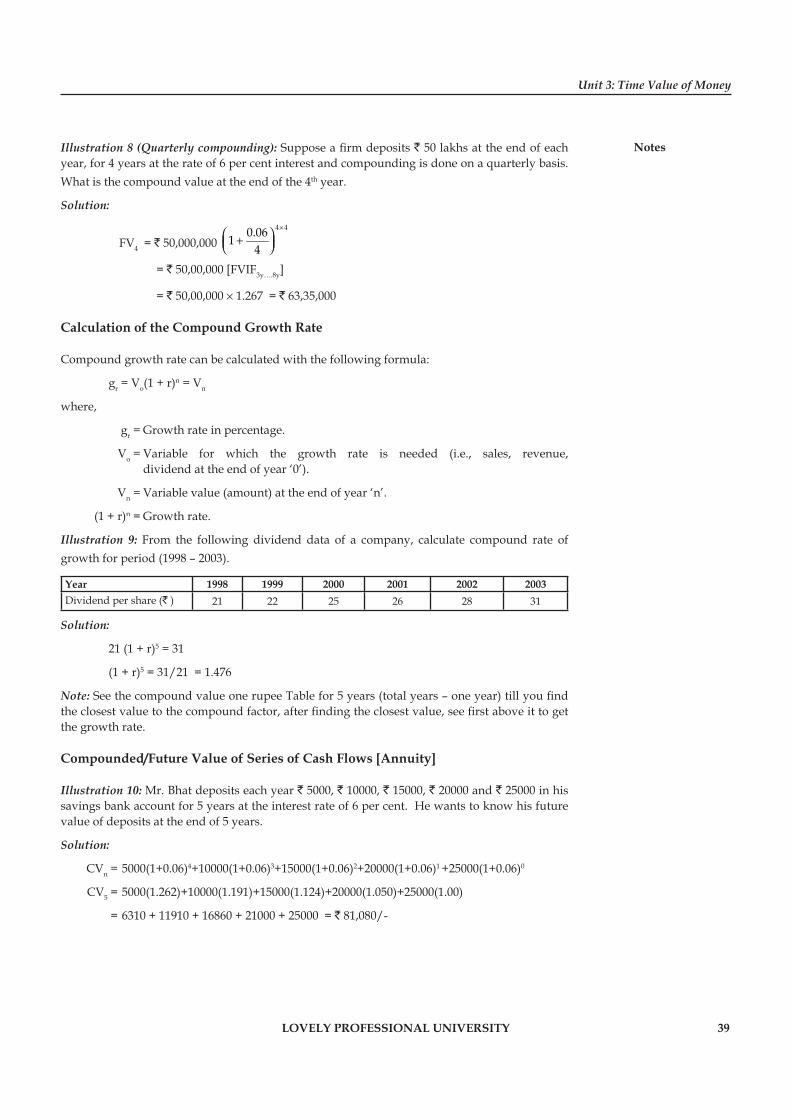
Unit 3: Time Value of Money
Notes
LOVELY PROFESSIONAL UNIVERSITY 39
Illustration 8 (Quarterly compounding): Suppose a fi rm deposits ` 50 lakhs at the end of each year, for 4 years at the rate of 6 per cent interest and compounding is done on a quarterly basis. What is the compound value at the end of the 4th year.
Solution:
FV4 = ` 50,000,000 4 40.061
4
×⎛ ⎞+⎜ ⎟⎝ ⎠
= ` 50,00,000 [FVIF3y….8y]
= ` 50,00,000 × 1.267 = ` 63,35,000
Calculation of the Compound Growth Rate
Compound growth rate can be calculated with the following formula:
gr = Vo(1 + r)n = Vn
where,
gr = Growth rate in percentage.
Vo = Variable for which the growth rate is needed (i.e., sales, revenue, dividend at the end of year ‘0’).
Vn = Variable value (amount) at the end of year ‘n’.
(1 + r)n = Growth rate.
Illustration 9: From the following dividend data of a company, calculate compound rate of growth for period (1998 – 2003).
Year 1998 1999 2000 2001 2002 2003Dividend per share (` ) 21 22 25 26 28 31
Solution:
21 (1 + r)5 = 31
(1 + r)5 = 31/21 = 1.476
Note: See the compound value one rupee Table for 5 years (total years – one year) till you fi nd the closest value to the compound factor, after fi nding the closest value, see fi rst above it to get the growth rate.
Compounded/Future Value of Series of Cash Flows [Annuity]
Illustration 10: Mr. Bhat deposits each year ` 5000, ` 10000, ` 15000, ` 20000 and ` 25000 in his savings bank account for 5 years at the interest rate of 6 per cent. He wants to know his future value of deposits at the end of 5 years.
Solution:
CVn = 5000(1+0.06)4+10000(1+0.06)3+15000(1+0.06)2+20000(1+0.06)1 +25000(1+0.06)0
CV5 = 5000(1.262)+10000(1.191)+15000(1.124)+20000(1.050)+25000(1.00)
= 6310 + 11910 + 16860 + 21000 + 25000 = ` 81,080/-

Basic Financial Management
Notes
40 LOVELY PROFESSIONAL UNIVERSITY
CV can also be calculated in the following ways:
Year Amount paid ` No. of years com-pounded
Compound interest factor Future value `
(1) (2) (3) (4) (5) = (2) x (4)
1
2
3
4
5
5000
10,000
15,000
20,000
25,000
4
3
2
1
0
1.262
1.191
1.124
1.05
1.00
6,310
11,910
16,860
21,000
25,000
Total 81,080
Compound Value of Annuity (Even Cash Flows)
Illustration 11: Mr. Ram deposits ` 500 at the end of every year, for 6 years at 6 per cent interest. Determine Ram’s money value at end of 6 years.
Solution:
FVn = P1 (1+I)n-1 + P2 (1+I)n-2 + --------------Pn-1(1+I)+Pn-n
FV6 = 500(1+0.06)5+500(1+0.06)4+500(1+0.06)3+500(1+0.06)2+500(1+0.06)1 + 500(1+0.06)0
= 500(1.338) + 500(1.262) + 500(1.19) + 500(1.124) + 500(1.060) + 500(1.00)
= 669 + 631 + 595.5 + 562 + 530 + 500 = ` 3487.5
By using table format,
Year Amount Paid ` No. of years compounded Compound interest factor Future value `123456
500500500500500500
543210
1.3381.2621.1911.1241.061.00
669.00631.00595.50562.00530.00500.00
Total 3,487.50
Short-cut formulan
n (1 I) – 1CV P
I⎡ ⎤+
= ⎢ ⎥⎣ ⎦
Where,
P = Fixed periodic cash fl ow.
I = Interest rate.
n = Duration of the amount.
( )1 11
nI+ − = (FVIFAI.n)
(FVIFAI.n) = Future value for interest factor annuity at ‘I’ interest and for ‘n’ years.
Illustration 12: Take the above example.
CV6 = 500( )61 0.06 1
0.06⎛ ⎞+ −⎜ ⎟⎝ ⎠
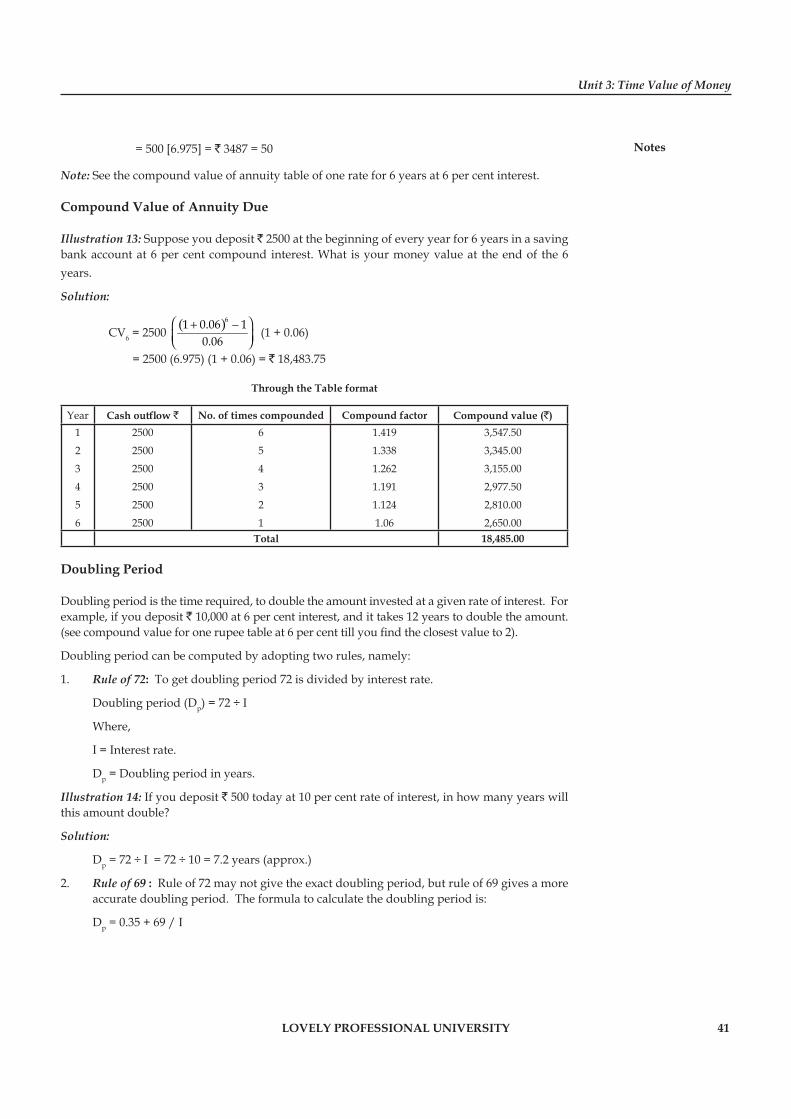
Unit 3: Time Value of Money
Notes
LOVELY PROFESSIONAL UNIVERSITY 41
= 500 [6.975] = ` 3487 = 50
Note: See the compound value of annuity table of one rate for 6 years at 6 per cent interest.
Compound Value of Annuity Due
Illustration 13: Suppose you deposit ` 2500 at the beginning of every year for 6 years in a saving bank account at 6 per cent compound interest. What is your money value at the end of the 6 years.
Solution:
CV6 = 2500 ( )61 0.06 10.06
⎛ ⎞+ −⎜ ⎟⎝ ⎠
(1 + 0.06)
= 2500 (6.975) (1 + 0.06) = ` 18,483.75
Through the Table format
Year Cash outfl ow ` No. of times compounded Compound factor Compound value (`)1
2
3
4
5
6
2500
2500
2500
2500
2500
2500
6
5
4
3
2
1
1.419
1.338
1.262
1.191
1.124
1.06
3,547.50
3,345.00
3,155.00
2,977.50
2,810.00
2,650.00 Total 18,485.00
Doubling Period
Doubling period is the time required, to double the amount invested at a given rate of interest. For example, if you deposit ` 10,000 at 6 per cent interest, and it takes 12 years to double the amount. (see compound value for one rupee table at 6 per cent till you fi nd the closest value to 2).
Doubling period can be computed by adopting two rules, namely:
1. Rule of 72: To get doubling period 72 is divided by interest rate.
Doubling period (Dp) = 72 ÷ I
Where,
I = Interest rate.
Dp = Doubling period in years.
Illustration 14: If you deposit ` 500 today at 10 per cent rate of interest, in how many years will this amount double?
Solution:
Dp = 72 ÷ I = 72 ÷ 10 = 7.2 years (approx.)
2. Rule of 69 : Rule of 72 may not give the exact doubling period, but rule of 69 gives a more accurate doubling period. The formula to calculate the doubling period is:
Dp = 0.35 + 69 / I
Basic Financial Management
Notes
42 LOVELY PROFESSIONAL UNIVERSITY
Illustration 15: Take the above problem as it is and calculate doubling period.
Solution:
Dp = 0.35 + 69 / 10 = 7.25 years.
Effective Rate of Interest in Case of Doubling Period
Sometimes investors may have doubts as to what is the effective interest rate applicable, if a fi nancial institute pays double amount at the end of a given number of years.
Effective rate of interest can be defi ned by using the following formula.
(a) In case of rule of 72
ERI = 72 per cent / Doubling period (Dp)
where,
ERI = Effective rate of interest.
Dp = Doubling period.
Illustration 16: A fi nancial institute has come with an offer to the public, where the institute pays double the amount invested in the institute by the end of 8 years. Mr. A, who is interested to make a deposit, wants to know the affective rate of interest that will be given by the institute Calculate:
Solution:
ERI = 72 ÷ Dp = 72 ÷ 8 years = 9 per cent
(b) In case of rule of 69
69 0.35
p
ERID
= +
Take the above example:
69 0.358 years
ERI = +
= 8.98 per cent or 9 per cent
Present Value
Illustration 17: An investor wants to fi nd the present value of ` 40,000, due 3 years. His interest rate is 10 per cent.
Solution:
Pv = 3
31
1FV
I⎛ ⎞⎜ ⎟⎝ ⎠+
= ` 40,000
31
(1 0.10)⎛ ⎞⎜ ⎟+⎝ ⎠
= ` 40,000 [0.751] = ` 30,040
Note: Present value of one rupee Table at 3 years for the rate of 10 per cent.
Unit 3: Time Value of Money
Notes
LOVELY PROFESSIONAL UNIVERSITY 43
Present Value of a Series of Cash Flows
Illustration 18: From the following information, calculate the present value at 10 per cent interest rate.
Year 0 1 2 3 4 5Cash infl ow (`) 2,000 3,000 4,000 5,000 4,500 5,500
Solution:
0 1 2 3 4 5
2000 3000 4000 5000 4500 5500(1 0.10) (1 0.10) (1 0.10) (1 0.10) (1 0.10) (1 0.10)vP = + + + + +
+ + + + + +
= 2000 + 2727 + 3304 + 3755 + 3073.5 + 3415.5 = ` 18.275
Present value can also be calculated by the following way:
Years Cash infl ow (`) PV Factor 10 per cent Present value (`)
012345
200030004000500045005500
1.000.9090.8260.7510.6830.621
2000.02727.03304.03755.03073.53415.5
Total present value 18275.0
(c) Present value of even cash flows (annuity)
Present Value of Deferred Annuity
PVAn = ( ) ( ) ( ) ( )
1 21 2 1............
1 1 1 1nn n
CIF CIF CIF CIFI I I I−+ + +
+ + + + or
( )( ) 1.
1 1 ( )1
n
nnICIF CIF PVIFA
I I⎛ ⎞+ −
=⎜ ⎟+⎝ ⎠
Where,
PVA = Present value of annuity.
I = Discounting factor or interest rate.
CIF = Cash infl ows.
n = Duration of the annuity.
Illustration 18: Mr. Bhat wishes to determine the PV of the annuity consisting of cash fl ows of ` 40,000 per annum for 6 years. The rate of interest he can earn from this investment is 10 per cent.
Solution:
= ` 40,000 × PVIFAI . n
= ` 4000 × 4.355 = ` 17,420
Note: See present value of annuity table for 6 year at 10 per cent.
Basic Financial Management
Notes
44 LOVELY PROFESSIONAL UNIVERSITY
Alternate way to fi nd present value
Years Cash infl ow (`) PV Factor 10 per cent Present value (`)
123456
400040004000400040004000
0.910.8260.7510.6830.6210.564
36403304.03004.02732.02484.02256.0
PV of Annuity 17420
Alternate way
Years Cash infl ow (`) PV factor at 10 per cent PV (`)1 to 6 4000 4.355 17,420
Present value of Annuity Due
PVAn = CIF (FVIFI . n) (1 + I) or
( ) ( )1 1 1n
nIPVA CIF I
I
−⎛ ⎞− += +⎜ ⎟⎝ ⎠
Illustration 20: Mr. Bhat has to receive ` 500 at the beginning of each year, for 4 years. Calculate personal value of annuity due, assuming 10 per cent rate of interest.
Solution:
PVA4 = ` 500 (3.170) × (1.10) = ` 1743.5
Alternatively
Years Cash infl ow (`) PV Factor at 10 per cent Present value (`)1
2
3
4
500
500
500
500
1.00
0.909
0.826
0.751
500.0
454.5
413.0
375.5
PV of Annuity 1743.0
Effective vs Nominal Rate
The nominal rate of interest or rate of interest per year is equal. Effective and nominal rate are equal only when the compounding is done yearly once, but there will be a difference, that is, effective rate is greater than the nominal rate for shorter compounding periods. Effective rate of interest can be calculated with the following formula.
1 1mIERI
m⎛ ⎞= + −⎜ ⎟⎝ ⎠
Where,
I = Nominal rate of interest.
m = Frequency of compounding per year.
Illustration 21: Mr. X deposited ̀ 1000 in a bank at 10 per cent of the rate of interest with quarterly compounding. He wants to know the effective rate of interest.
Unit 3: Time Value of Money
Notes
LOVELY PROFESSIONAL UNIVERSITY 45
Solution:
ERI = 40.101 1
4⎛ ⎞+ −⎜ ⎟⎝ ⎠
= 1.1038 – 1 = 0.1038 or 10.38 per cent.
Sinking Fund Factor
The fi nancial manager may need to estimate the amount of annual payments so as to accumulate a predetermined amount after a future date, to purchase assets or to pay a liability. The following formula is useful to calculate the annual payment.
( )1 1p n nIA FVAI
⎛ ⎞= ⎜ ⎟+ −⎝ ⎠
Where,
Ap = Annual payment.
VAn = Future value after ‘n’ years.
I = Interest rate.
( ) .1 1 I nnI FVIFAI
⎛ ⎞=⎜ ⎟+ −⎝ ⎠
Illustration 22: The fi nance manager of a company wants to buy an asset costing ` 1,00,000 at the end of 10 years. He requests to fi nd out the annual payment required, if his savings earn an interest rate of 12 per cent per annum.
Solution:
Ap = 1,00,000 ( )100.12
1 0.12 1⎛ ⎞⎜ ⎟+ −⎝ ⎠
= 1,00,000 (0.12 or 2/2.1058) = ` 5698.5
Ap = 12%.10
11,00,000yFVIFA
×
= 11,00,00017.548
×
= ` 5698.65
Present Value of Perpetuity
Perpetuity is an annuity of infi nite duration. It may be expressed as:
PV∝ = CIF X PVIFAI .∝
Where,
PV∝ = Present value of a perpetuity.
CIF = constant annual cash infl ow.
PVIFA I .∝ = PV interest factor for a perpetuity.
PV∝ = CIF/I
Basic Financial Management
Notes
46 LOVELY PROFESSIONAL UNIVERSITY
Illustration 23: Mr. Bhat an investor, expects a perpetual amount of ` 1000 annually from his investment. What is his present value of this perpetuity if the interest rate is 8 per cent?
Solution:
PV∝ = CIF/I = 1000/0.08 = ` 12,500
Loan Amortisation
Loan is an amount raised from outsiders at an interest and repayable at a specifi ed period (lumpsum) or in installments. The repayment of loan is known as amortisation. A fi nancial manager may take a loan and he may interested to know the amount of equal instalment to be paid every year to repay the complete loan amount including interest. Instalment can be calculated with the following formula:
( )( )
11 1
n
I A nI IL P
I⎛ ⎞+
= ⎜ ⎟+ −⎝ ⎠
or
LI = PA ÷ PVIFAn . I
Where,
LI = Loan installment.
PA = Principal amount.
I = Interest rate.
n = Loan repayment period.
PVIFAn . I = PV interest factors at loan repayment period at a specifi ed interest rate.
Illustration 24: ABC Company took a loan of ` 10,00,000 lakh for an expansion program from IDBI at 7 per cent interest per year. The amount has to be repaid in 6 equal annual installments. Calculate the per instalment amount.
Solution:
LI= 10,00,000 ( )( )
6
60.06 1 0.06
1 0.06 1⎛ ⎞+⎜ ⎟+ −⎝ ⎠
or
LI = 10,00,000 ÷ PVIFA7%. 6y
= 10,00,000 ÷ 4.769 = ` 2,09,687.56
Present Value of Growing Annuity
Growing annuity means the cash fl ow that grows at a constant rate for a specifi ed period of time. In others, the cash fl ow grows at a component rate.
Steps involved in calculation:
1. Calculate the series of cash fl ows.
2. Convert the series of cash fl ows into present values at a given discount factor.
3. Add all the present values, of series of cash fl ows to get total PV of a growing annuity.
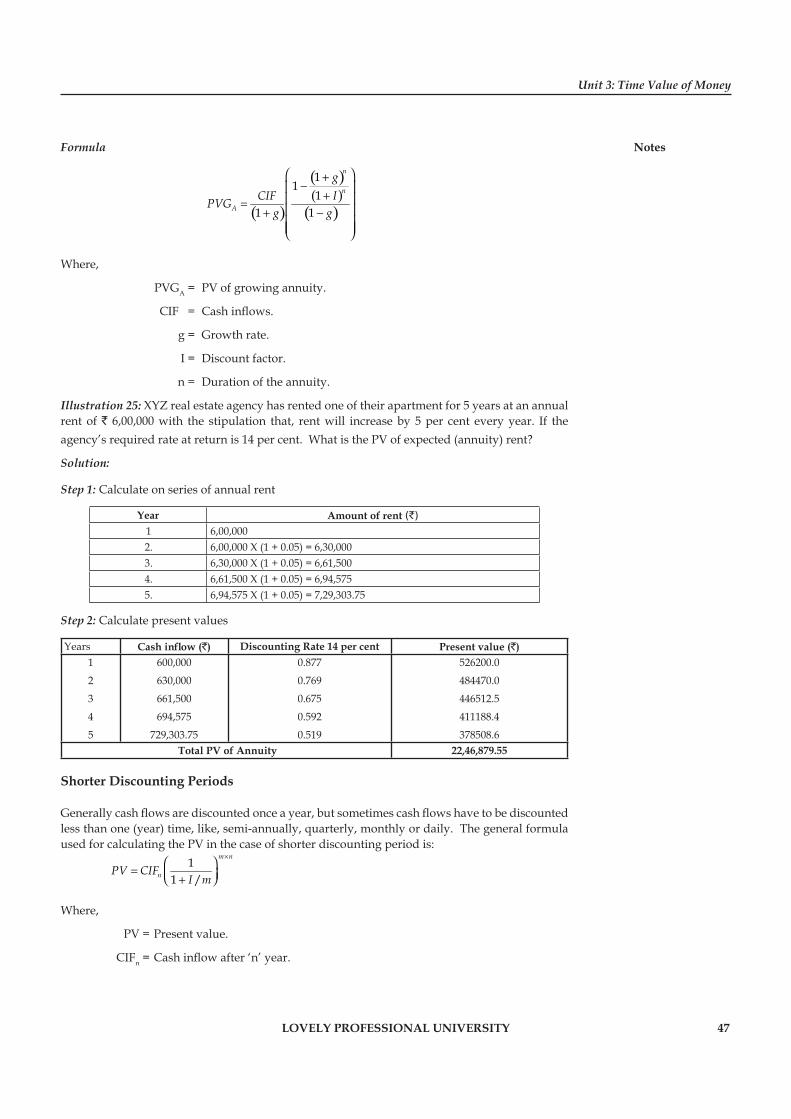
Unit 3: Time Value of Money
Notes
LOVELY PROFESSIONAL UNIVERSITY 47
Formula
( )
( )( )
( )
11
11 1
n
n
A
gICIFPVG
g g
⎛ ⎞+−⎜ ⎟
+⎜ ⎟= ⎜ ⎟+ −⎜ ⎟⎜ ⎟⎝ ⎠
Where,
PVGA = PV of growing annuity.
CIF = Cash infl ows.
g = Growth rate.
I = Discount factor.
n = Duration of the annuity.
Illustration 25: XYZ real estate agency has rented one of their apartment for 5 years at an annual rent of ` 6,00,000 with the stipulation that, rent will increase by 5 per cent every year. If the agency’s required rate at return is 14 per cent. What is the PV of expected (annuity) rent?
Solution:
Step 1: Calculate on series of annual rent
Year Amount of rent (`)
1 6,00,0002. 6,00,000 X (1 + 0.05) = 6,30,0003. 6,30,000 X (1 + 0.05) = 6,61,5004. 6,61,500 X (1 + 0.05) = 6,94,5755. 6,94,575 X (1 + 0.05) = 7,29,303.75
Step 2: Calculate present values
Years Cash infl ow (`) Discounting Rate 14 per cent Present value (`)1
2
3
4
5
600,000
630,000
661,500
694,575
729,303.75
0.877
0.769
0.675
0.592
0.519
526200.0
484470.0
446512.5
411188.4
378508.6 Total PV of Annuity 22,46,879.55
Shorter Discounting Periods
Generally cash fl ows are discounted once a year, but sometimes cash fl ows have to be discounted less than one (year) time, like, semi-annually, quarterly, monthly or daily. The general formula used for calculating the PV in the case of shorter discounting period is:
11 /
m n
nPV CIFI m
×⎛ ⎞
= ⎜ ⎟⎝ ⎠+
Where,
PV = Present value.
CIFn = Cash infl ow after ‘n’ year.
Basic Financial Management
Notes
48 LOVELY PROFESSIONAL UNIVERSITY
m = No. of times per year discounting is done.
I = Discount rate (annual).
Illustration 26: Mr. A expected to receive `1,00,000 at the end of 4 years. His required rate of return is 12 per cent and he wants to know PV of ` 1,00,000 with quarterly discounting.
Solution:
PV = 1,00,000 4 4
11 0.12/4
×⎛ ⎞⎜ ⎟⎝ ⎠+
= 1,00,000 × PVIF3per cent 4y
= 1,00,000 × 0.623 = ` 62,300
Task Calculate the following:
1. Mr. A deposits at the end of each year ` 2000, ` 3000, ` 4000, ` 5000 and ` 6000 for the consequent 5 years respectively. He wants to know his series of deposits value at the end of 5 years with 6 per cent rate of compound interest.
2. A borrower offers 16 per cent rate of interest with quarterly compounding. Determine the effective rate of income.
3. What is the present value of ` 1,00,000, which is receivable after 60 years. If the investor required rate of interest is 10 per cent.
Evolution of different Alternatives
The application of the time value of money principles can help you make decisions on loan alternatives. This exercise requires you to compare three mortgage alternatives using various combinations and points. Points on a mortgage refer to a payment
that is made upfront to secure the loan. A single point is a payment of one per cent of the amount of the total mortgage loan. If you were borrowing ` 200,000 a single point would require an upfront payment of ` 2,000.
When you are evaluating alternative mortgages, you may be able to obtain a lower rate by making an upfront payment. This comparison will not include an after-tax comparison. When taxes are considered, the effective costs are affected by interest paid and the amortization of points on the loan. This analysis will require you to compare only before-tax costs.
Zeal.com allows you to compare the effective costs on alternative mortgages. You are considering three alternatives for a ` 250,000 mortgage. Assume that the mortgage will start in December, 2006. The mortgage company is offering you a 6% rate on a 30-year mortgage with no points. If you pay 1.25 points, they are willing to offer you the mortgage at 5.875%. If you pay 2 points, they are willing to offer you the mortgage at 5.75%.
Questions
1. What are the mortgage payments under the three alternatives?
2. Which alternative has the lowest effective cost?
3. Can you explain how the effective rate is being calculated?
Unit 3: Time Value of Money
Notes
LOVELY PROFESSIONAL UNIVERSITY 49
3.6 Summary
Time value of money means that the value of money changes over a time.
It is the sum of money received today is worth more than if the same is received after some time.
In compound value concept, the interest earned on the initial principal amount becomes a part of the principal at the end of a compounding period.
Interest can be compounded even more than once a year.
An investor investing money in installments may wish to know the value of his savings after ‘n’ years. This is called future value of series of cash fl ows.
In case of present value concept, we estimate the present worth adjusted for the time value of money.
3.7 Keywords
Annuity: It is a stream of equal annual cash fl ows.
Cash Flow: It is the movement of cash into or out of a business, a project, or a fi nancial product. It is usually measured during a specifi ed, fi nite period of time
Compound Interest: When interest is added to the principal, so that from that moment on, the interest that has been added also itself earns interest.
Compound Value: The interest earned on the initial principal becomes a part of the principal at the end of a compounding period.
Present Value: In case of present value concept, we estimate the present worth of a future payment/instalment or series of payment adjusted for the time value of money.
Time Value of Money: Time value of money is that the value of money changes over a period of time.
3.8 Self Assessment
Fill in the blanks:
1. Simple interest (SI) = Po (I) (........................).
2. According to dividend capitalization approach dividend is paid ........................ .
3. An annuity is a stream of ........................ annual fl ows.
4. ........................ is repayment of loan over a period of time.
5. The nominal rate of interest and ........................ per year is equal.
State whether the following statements are true or false:
6. Current consumption is one of the reasons for time preference of money.
7. Compound value and future value both, are same.
8. There are two rules available to fi nd out double period.
9. Effective rate of interest is more than the nominal rate of interest in single period compounding.
10. Rule 73 is one of the rules of doubling period.
Basic Financial Management
Notes
50 LOVELY PROFESSIONAL UNIVERSITY
11. Cost of capital interest rate requires rate of return and discounting rate factor, all are used for calculating of PV of cash fl ows.
12. Compound growth rate formula is Vo (1 + r) = Vn.
13. A series of unequal cash fl ows are called Annuity.
14. 0.35 + 69/I is the formula used to calculate present value of perpetuity.
15. Cash fl ows are divided with interest (per cent) rate to calculate future value of perpetuity.
3.9 Review Questions
1. Mr. X deposited ` 1,00,000 in a savings bank account today, at 5 per cent simple interest for a period of 5 years. What is his accumulated interest?
2. Mr. X invested ` 40,000 today, for a period of 5 years. Calculate the future value if his required rate of returns is 10 per cent.
3. Suppose you deposit ` 1,00,000 with an investment company, which pays 10 per cent interest with semi annual compounding. What is the total deposit amount at the end of 5 years?
4. Mr. A deposits at the end of each year ` 2000, ` 3000, ` 4000, ` 5000 and ` 6000 for the consequent 5 years respectively. He wants to know his series of deposits value at the end of 5 years with 6 per cent rate of compound interest.
5. Assume you have been depositing each year for 5 years, the deposit amount of ` 100, ` 200, ` 300, ` 400 and ` 500 respectively. Calculate your deposits value if you get 7 per cent compound interest and assume you have deposited in the beginning of each year.
6. If you invest ` 500 today, at a compound interest of 9 per cent, what will be its future value after 60 years?
7. Explain the meaning and importance of valuation concept. How does valuation concept help in decision making?
8. Explain the rule of 69. How does it compare with the rule of 72?
9. “A bird in hand is more preferable than two birds in the bush”. Explain.
10. A borrower offers 16 per cent rate of interest with quarterly compounding. Determine the effective rate of income.
11. A fi nance company has advertised saying that, it will pay a lumpsum of ` 44,650 at the end of 5 years to anyone who deposits ` 6000 per annum. Mr. A is interested, but he wants to know the implicit rate of interest.
12. What is the present value of ` 1,00,000, which is receivable after 60 years. If the investor required rate of interest is 10 per cent.
Answers: Self Assessment
1. n 2. Annually
3. Equal 4. Amortization
5. Rate of interest 6. True
7. True 8. True
9. True 10. False
Unit 3: Time Value of Money
Notes
LOVELY PROFESSIONAL UNIVERSITY 51
11. True 12. False
13. False 14. False
15. False
3.10 Further Readings
Books Chandra, P., Financial Management - Theory and Practice, New Delhi, Tata McGraw Hill Publishing Company Ltd., 2002, p. 3.
Sudhindra Bhat, Financial Management, New Delhi, Excel Books, 2008.
Van Horne, J.C. and Wachowicz, Jr, J.M., Fundamentals of Financial Management, New Delhi, Prentice Hall of India Pvt. Ltd., 1996, p. 2.
Online link http://www.fei.org/
Basic Financial Management
Notes
52 LOVELY PROFESSIONAL UNIVERSITY
Unit 4: Cost of Capital
CONTENTS
Objectives
Introduction
4.1 Cost of Capital – Concept
4.2 Signifi cance of Cost of Capital
4.3 Measurement of Cost of Capital
4.3.1 Cost of Equity
4.3.2 Cost of Preference Shares
4.3.3 Cost of Debentures/Debt/Public Deposits
4.4 Weighted Average Cost of Capital (WACC)
4.5 Summary
4.6 Keywords
4.7 Self Assessment
4.8 Review Questions
4.9 Further Readings
Objectives
After studying this unit, you will be able to:
Describe concept and signifi cance of cost of capital
Explain measurement of cost of equity shares, preference shares and debentures
Define weighted average cost of capital
Introduction
The cost of capital is an important concept in formulating a fi rm’s capital structure. Cost of capital is a central concept in fi nancial management. It is also viewed as one of the corner stones in the theory of fi nancial management. It has received considerable attention from both theorists and practitioners. Two major schools of thought have emerged having basic difference on the relevance of cost of capital. In one camp, Modigline Miller argued, that a fi rm’s cost of capital is constant and it is independent of the method and level of fi nancing. In another camp (traditionalists) cost of capital is varying and dependent on capital structure. In both the camps, optimal policy is taken as the policy that maximizes the value of a company.
Cost of capital is still largely an academic term and the problem of measuring it in operational terms is a recent phenomena. Prior to this development, the problem was either ignored or by passed. In modern times, it is widely used as basis of investment projects and evaluating the alternative sources of fi nance.
Unit 4: Cost of Capital
Notes
LOVELY PROFESSIONAL UNIVERSITY 53
4.1 Cost of Capital – Concept
The term cost of capital is a concept having many different meanings. The three viewpoints, regarding the cost of capital is given below.
1. From Investors’ View Point: Investor may defi ne it as “the measurement of the sacrifi ce made by him in capital formation.
Example: Mr. A an investor invested in a company’s equity shares, amount ` 1,00,000, instead of investing in a bank at the rate of 7 per cent interest. Here he had sacrifi ced 7 per cent interest for not having invested in the bank.
2. Firms Point: It is the minimum required rate of return needed to justify the use of capital.
Example: A fi rm raised ̀ 50 lakhs through the issues of 10 per cent debentures, for justifying this issue, a minimum rate of return it has to earn is 10 per cent.
3. Capital Expenditure Point: The cost of capital is the minimum required rate of return, the hurdle or target rate or the cut off rate or any discounting rate used to value cash fl ows.
Example: Firm ‘A’ is planning to invest in a project, that requires ` 20 lakh as initial investment and provides cash fl ows for a period of 5 years. So for the conversion of future 5 years cash fl ows into present value, cost of capital is needed.
Cost of capital represents the rate of return that the fi rm must pay to the fund suppliers, who have provided the capital. In other words, cost of capital is the weighted average cost of various sources of fi nance used by the fi rm. The sources are, equity, preference, long-term debt and short-term debt.
Meaning and Defi nition of Cost of Capital
“The rate that must be earned on the net proceeds to provide the cost elements of the burden at the time they are due.”
– Hunt, William and Donaldson
“Cost of capital is the minimum required rate of earnings or the cut-off rate of capital expenditures.”
– Solomon Ezra
The above defi nitions indicate that the following are the three basic aspects of the concept of cost of capital.
1. Rates of Return: Cost of Capital is not a Cost as such, infact it is the rate of return that a fi rm requires to earn from its investment projects.
2. Minimum Rate of Return: Cost of Capital of any fi rm is that minimum rate of return that will at least maintain the market value of the shares.
3. Cost of Capital Comprises three Components:
(a) The risk less cost of the particular type of fi nancing (rj)
(b) The business risk premium, (b) and
(c) The fi nancial risk premium (f)
Note Symbolically cost of capital may be represented as: Ko = rj + b + f

Basic Financial Management
Notes
54 LOVELY PROFESSIONAL UNIVERSITY
4.2 Signifi cance of Cost of Capital
The concept of cost of capital is very important and the central concept in fi nancial management decisions. The decisions in which it is useful are as follows:
1. Designing Optimal Corporate Capital Structure: This concept is helpful in formulating a sound and economical capital structure for a fi rm. The debt policy of a fi rm is signifi cantly infl uenced by the cost consideration.
?Did u know? What is capital structure?
Capital structure involves determination of proportion of debt and equity in capital structure that provides less cost of capital.
While designing a fi rm’s capital structure, the fi nancial executives always keep in mind minimisation of the over all cost of capital and to maximise value of the fi rm. The measurement of specifi c costs of each source of funds and calculation of weighted average cost of capital help to form a balanced capital structure. By comparing various (sources of fi nance) specifi c costs, he/she can choose the best and most economical source of fi nance and can succeed in designing a sound and viable capital structure.
2. Investment Evaluation / Capital Budgeting: Wilson R.M.S., states that the Cost of Capital is a concept, which should be expressed in quantitative terms, if it is to be useful as a cut-off rate for capital expenses. Capital expenditure means investment in long-term projects like investment on new machinery. It is also known as Capital budgeting expenditure. Capital budgeting decisions require a fi nancial standard (cost of capita) for evaluation.
3. Financial Performance Appraisal: Cost of capital framework can be used to evaluate the fi nancial performance of top management. Financial performance evaluation involves a comparison of actual profi tability of the investment project with the project overall cost of capital of funds raised to fi nance the project. If the actual profi tability is more than the projected cost of capital, then the fi nancial performance may said to be satisfactory and vice versa.
4.3 Measurement of Cost of Capital
Computation of cost of capital for various sources of fi nance, viz., equity, preference shares, debentures, retained earnings, public deposits is discussed below:
4.3.1 Cost of Equity
Firms may obtain equity capital in two ways (a) retention of earnings and (b) issue of additional equity shares to the public. The cost of equity or the returns required by the equity shareholders is the same in both the cases, since in both cases, the shareholders are providing funds to the fi rm to fi nance their investment proposals.
In the following cost of equity is computed in both sources point of view (i.e., retained earnings and issue of equity shares to the public).
Cost of Retained Earnings (Kre)
Retained earnings are one of the internal sources to raise equity fi nance. Retained earnings are those part of (amount) earnings that are retained by the form of investing in capital budgeting proposals instead of paying them as dividends to shareholders.
Unit 4: Cost of Capital
Notes
LOVELY PROFESSIONAL UNIVERSITY 55
?Did u know? Cost of retained earnings = Required rate of return on equity
Corporate executives and some analysts too normally consider retained earnings as cost free, because there is nothing legally binding the fi rm to pay dividends to equity shareholders and the company has its own entity different from its stockholders. But it is not so. They involve opportunity cost. The opportunity cost of retained earning is the rate of return the shareholder forgoes by not putting his/her funds elsewhere, because the management has retained the funds. The opportunity cost can be well computed with the following formula.
( )( ) 100
T1T1
KKb
iere ×⎟⎟⎠
⎞⎜⎜⎝
⎛−−=
Where,
Ke = Cost of equity capital [D ÷ P or E/P + g].
Ti = Marginal tax rate applicable to the individuals concerned.
Tb = Cost of purchase of new securities/broker.
D = Expected dividend per share.
NP = Net proceeds of equity share/market price.
g = Growth rate in (%).
Illustration 1: A company paid a dividend of ` 2 per share, market price per share is ` 20, income tax rate is 60 per cent and brokerage is expected to be 2 per cent. Compute the cost of retained earnings.
Solution:
Kre = ( )( )1
1001
i
b
TDNP T
⎛ ⎞−× ×⎜ ⎟−⎝ ⎠
= ( )( )1 0.602 100
20 1 0.02⎛ ⎞−
× ×⎜ ⎟−⎝ ⎠
= 0.10 X 0.409 X 100 = 4.1 per cent
Illustration 2: ABC company’s cost of equity (Ke) capital is 14 per cent, the average tax rate of individual shareholders is 40 per cent and it is expected that 2 per cent is brokerage cost that shareholders will have to pay while investing their dividends in alternative securities. What is the cost of retained earnings?
Solution:
Kre = ( )( )1
1001
ie
b
TK
T⎛ ⎞−
× ×⎜ ⎟−⎝ ⎠
= ( )( )
1 0.40.14 1001 0.02
−× ×
−
= (0.14 X 0.613) X 100 = 8.6 per cent
Basic Financial Management
Notes
56 LOVELY PROFESSIONAL UNIVERSITY
!Caution The cost of equity capital (Ke), may be defi ned as the minimum rate of returns
that a fi rm must earn on the equity fi nanced portions of an investment project in order to leave unchanged the market price of the shares. The cost of equity is not the out-of-pocket cost of using equity capital as the equity shareholders are not paid dividend at a fi xed rate every year.
Approaches to Calculate the Cost of Equity (Ke)
There are six approaches available to calculate the cost of equity capital, they are:
Dividends Capitalisation Approach (D/MP Approach)
According to this approach, the cost of equity capital is calculated on the basis of a required rate of return in terms of the future dividends to be paid on the shares. Accordingly, Ke is defi ned as the discount rate that equates the present value of all expected future dividends per share, along with the net proceeds of the sale (or the current market price) of a share. It means investor arrives at a market price for a share by capitalizing dividends at a normal rate of return. The cost of equity capital can be measured by the given formula:
Ke = D/CMP or NP
Where,
Ke = cost of equity
D = Dividends per share
CMP = Current market price per share
NP = Net proceed per share
Note This method assumes that investor give prime importance to dividends and risk in the fi rm remains unchanged and it does not consider the growth in dividend.
Illustration 3: XYZ Ltd., is currently earning ` 1,00,000, its current share market price of ` 100 outstanding equity shares is 10,000. The company decides to raise an additional capital of ` 2,50,000 through issue of equity shares to the public. It is expected to pay 10 per cent per share as fl oatation cost. Equity capital is issued at a discount rate of 10 per cent, per share. The company is interested to pay a dividend of ` 8 per share. Calculate the cost of equity.
Solution:
Ke = 100DNP
×
Ke = ( ).8 100
100 10 10Rs
×− −
Ke = .8 10080
Rs×
= 10 per cent

Unit 4: Cost of Capital
Notes
LOVELY PROFESSIONAL UNIVERSITY 57
Earnings Capitalisation Approach (E/MP Approach)/Earning Price ratio Approach
According to this approach, the cost of equity (Ke) is the discount rate that equates the present value of expected future earnings per share with the net proceeds (or current market price) of a share.
Assumption of earnings capitalization approach is employed under the following conditions:
(a) Constant earnings per share over the future period;
(b) There should be either 100 per cent rotation ratio or 100 per cent dividend pay out ratio and,
(c) The company satisfi es the requirements through equity shares and does not employ debt.
Cost of equity can be calculated with the following formula:
oreEK
CMP NP=
Where,
Ke = Cost of equity
E = Earnings per share
CMP = Current market price per share
NP = Net proceeds per share
Illustration 4: Well do company Ltd. is currently earning 15 per cent operating profi t on its share capital of ` 20 lakh (FV of ` 200 per share). It is interested to go for expansion for which the company requires an additional share capital of ` 10 lakh. Company is raising this amount by the issue of equity shares at 10 per cent premium and the expected fl oatation cost is 5 per cent. Calculate the cost of equity.
Solution:
Ke = 100ENP
×
= ( )30 100
200 20 10×
+ −`
`
= 30 100210
×``
= 14.3 per cent
1. Calculation of EPS
Operating Profi t = `20,00,000 x 0.15 = `3,00,000
No.of Equity Shares = 20,00,000/200 = 10,000 Shares
EPS = 3,00,000/10,000 = `30
2. Net Proceeds (NP) = Face value + Premium – Floatation cost = 200 +20 – 10 = `210
Illustration 5: A fi rm is currently earning ` 1,00,000 and its share is selling at a market price of` 90. The fi rm has 10,000 shares outstanding and has no debt. Compute the cost of equity.
Basic Financial Management
Notes
58 LOVELY PROFESSIONAL UNIVERSITY
Solution:
Ke = 100EMP
×
= 10 100 11.1190
× =`
Dividend Capitalization plus Growth Rate Approach [(D/MP) + g]/ Dividend Growth Model Approach
Computation of cost of equity capital based on a fi xed dividend rate may not be appropriate, because the future dividend may grow. The growth in dividends may be constant perpetually or may vary over a period of time. It is the best method over dividend capitalisation approach, since it considers the growth in dividends. Generally, investors invest in equity shares on the basis of the expected future dividends rather than on current dividends. They expect increase in future dividends. Growth in dividends will have positive impact on share prices.
Cost of Capital under Constant Growth Rate Perpetually
The formula for computation of cost of equity under constant growth rate is:
Ke = orD g
NP CMP+
Where,
Ke = Cost of equity capital.
D = Dividends per share.
NP = Net proceeds per share.
CMP = Current market price per share.
g = Growth rate (%).
Dividend per share is the expected dividend per share and if dividend for the last year is given then the expected dividend will be calculated as:
D1 = D0 (1+g)
Where
D1 = value of expected divided
D0 = value of dividend paid for last year
G = growth rate
In the above case if the formula to calculate the cost of equity will be:
= D0 (1+g)/NP or CMP + g
Illustration 6: Equity shares of a paper manufacturing company is currently selling for ` 100. It wants to fi nance its capital expenditure of ` 1 lakh either by retaining earnings or selling new shares. If company seeks to sell shares, the issue price will be ` 95. The expected dividend next year is ` 4.75 and it is expected to grow at 6 per cent perpetually. Calculate cost of equity capital (internal and external).
Solution:
e
DK gMP
= +
Unit 4: Cost of Capital
Notes
LOVELY PROFESSIONAL UNIVERSITY 59
e4.75K 0.06100
= +
= 0.048 + 0.06
= 10.8 per cent
Calculate cost of external equity (Issue of shares)
e
4.75K 0.0695
= +
= 0.050 + 0.06
= 11 per cent
Cost of Capital under Variable Growth Rate
The computation cost of equity after a specifi c period, is based on the estimation of growth rate in dividends of a company. Expected growth rate will be calculated based upon the past trend in dividend. It may not be unreasonable to project the trend into the future, based on the past trend. The fi nancial manager must estimate the internal growth rate in dividends on the basis of long range plans of the company. Expected growth rate in the internal context requires to be adjusted.
Your can estimate by using the following formula:
1. Average Annual Growth Rate: The following group to explain the calculation by using Average Annual Growth Rate method.
Example:
Year Div. per share Rupee charge Growth1996 21 ---- ----
1997 22 1 4.761998 23 1 4.551999 24 1 4.352000 25 1 4.172001 26 1 4.002002 27 1 3.852003 28 1 3.70
If you average the 7 growth rates, the result will be 4.19%. So you can use this as an estimate of the expected growth rate g.
2. Return of Growth Rate Method: In this method you fi rst forecast the fi rm’s average retention rate and then multiply it by the fi rm’s expected future return on equity (ROE)
g = (Retention Rate) × (ROE)
where
Retention Rate = 1- Div. Payout Rate
Example: If the forecasted retention rate and return on equity are 0.60 and 15% respectively, the growth rate is:
g = (0.60) (15%) = 9 %
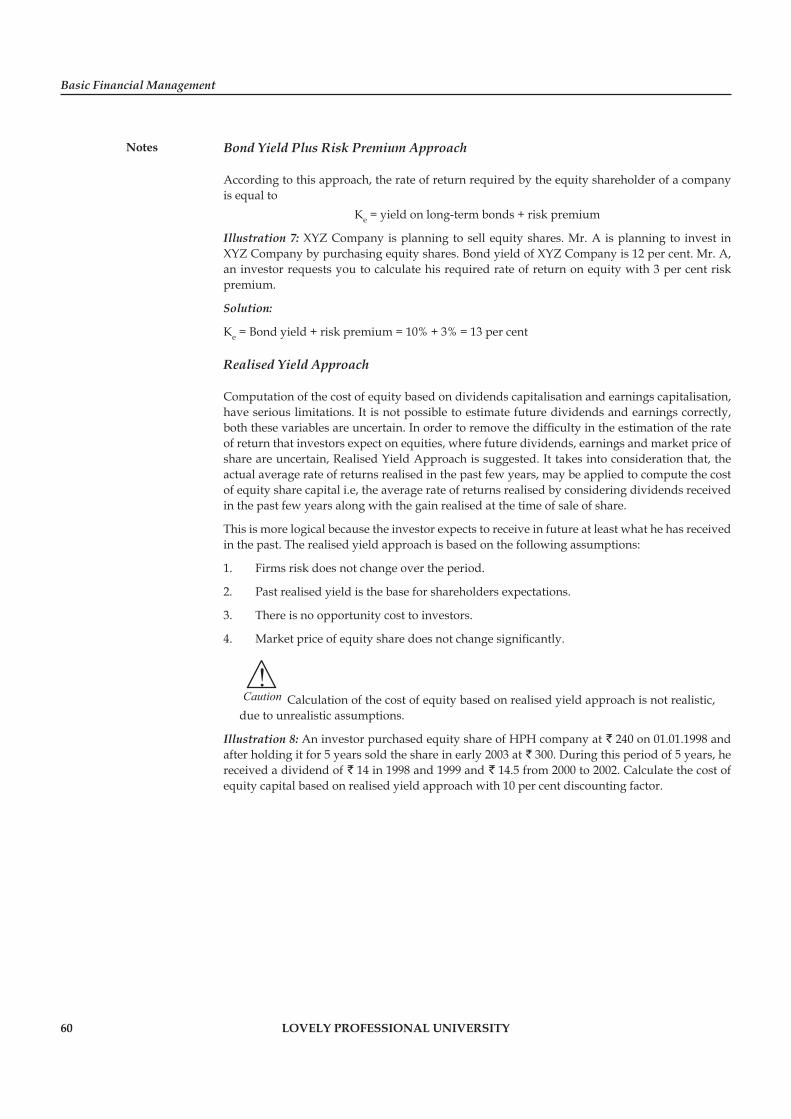
Basic Financial Management
Notes
60 LOVELY PROFESSIONAL UNIVERSITY
Bond Yield Plus Risk Premium Approach
According to this approach, the rate of return required by the equity shareholder of a company is equal to
Ke = yield on long-term bonds + risk premium
Illustration 7: XYZ Company is planning to sell equity shares. Mr. A is planning to invest in XYZ Company by purchasing equity shares. Bond yield of XYZ Company is 12 per cent. Mr. A, an investor requests you to calculate his required rate of return on equity with 3 per cent risk premium.
Solution:
Ke = Bond yield + risk premium = 10% + 3% = 13 per cent
Realised Yield Approach
Computation of the cost of equity based on dividends capitalisation and earnings capitalisation, have serious limitations. It is not possible to estimate future dividends and earnings correctly, both these variables are uncertain. In order to remove the diffi culty in the estimation of the rate of return that investors expect on equities, where future dividends, earnings and market price of share are uncertain, Realised Yield Approach is suggested. It takes into consideration that, the actual average rate of returns realised in the past few years, may be applied to compute the cost of equity share capital i.e, the average rate of returns realised by considering dividends received in the past few years along with the gain realised at the time of sale of share.
This is more logical because the investor expects to receive in future at least what he has received in the past. The realised yield approach is based on the following assumptions:
1. Firms risk does not change over the period.
2. Past realised yield is the base for shareholders expectations.
3. There is no opportunity cost to investors.
4. Market price of equity share does not change signifi cantly.
!Caution Calculation of the cost of equity based on realised yield approach is not realistic,
due to unrealistic assumptions.
Illustration 8: An investor purchased equity share of HPH company at ` 240 on 01.01.1998 and after holding it for 5 years sold the share in early 2003 at ` 300. During this period of 5 years, he received a dividend of ` 14 in 1998 and 1999 and ` 14.5 from 2000 to 2002. Calculate the cost of equity capital based on realised yield approach with 10 per cent discounting factor.
Unit 4: Cost of Capital
Notes
LOVELY PROFESSIONAL UNIVERSITY 61
Solution:
Years Cash infl ows (`) DF 10% PV of Cash infl ows (`)
1998
1999
2000
2001
2002
2003
14.0
14.0
14.5
14.5
14.5
300.0
0.909
0.826
0.751
0.683
0.621
0.621
12.7
11.6
10.9
9.9
9.0
186.3 240.4
(-) Purchase price in 1998 240.0 0.4
At 10 per cent discount rate, the total PV of cash infl ows equals to the PV of cash outfl ows. Hence, cost of equity capital is 10 per cent.
Capital Asset Pricing Model Approach (CAPM)
Capital Asset Pricing Model (CAPM) was developed by William F. Sharpe. This is another approach that can be used to calculate cost of equity. From the cost of capital point of view, CAPM explains the relationship between the required rate of return, or the cost of equity capital and the non-diversifi able or relevant risk, of the fi rm as refl ected in its index of non-diversifi able risk that is beta (β). Symbolically,
Ke = Rf + (Rmf – Rf) β
Where,
Ke = Cost of equity capital.
Rf = Rate of return required on a risk free security (%).
β = Beta coeffi cient.
Rmf = Required rate of return on the market past folio of assets, that can be viewed as the average rate of return on all assets.
Assumptions
CAPM approach is based on the following assumptions:
1. Perfect Capital Market: All investors have the same information about securities:
(a) There are no restrictions on investments (buying and selling)
(b) Securities are completely divisible
(c) There are no transaction costs
(d) There are no taxes
(e) Competitive market – means no single investor can affect market price signifi cantly
2. Investors preferences: Investors are risk averse:
(a) Investors have homogenous expectations regarding the expected returns, variances and correlation of returns among all securities.
(b) Investors seek to maximise the expected utility of their portfolios over a single period planning horizon.
Basic Financial Management
Notes
62 LOVELY PROFESSIONAL UNIVERSITY
Illustration 9: The Capital Ltd., wishes to calculate its cost of equity capital using the Capital Asset Pricing Model (CAPM) approach. Company’s analyst found, that its risk free rate of return equals 12 per cent beta equal equals 1.7 and the return on market portfolio equals 14.5 per cent.
Solution:
Ke = Rf + (Rmf – Rf) β = 12 + [14.5 - 12] 1.7
= 12 + 4.25 = 16.25 per cent
Task A company’s earnings available to ordinary shareholders is ̀ 5,00,000. It has capital ` 50,00,000, face value of ` 100 each. The company’s share is selling at ` 200. Compute cost of equity (Assuming 100% dividend payout ratio).
4.3.2 Cost of Preference Shares
The preference share is issued by companies to raise funds from investors.
?Did u know? Preference share has two preferential rights over equity shares, (i) preference in payment of dividend, from distributable profi ts, (ii) preference in the payment of capital at the time of liquidation of the company.
There are different types of preference shares, cumulative and non-cumulative, redeemable and irredeemable, participating and non-participating, and convertible and non-convertible. But computation of cost of preference share will be only for redeemable and irredeemable.
Cost of Irredeemable Preference Share/Perpetual Preference Share
The share that cannot be paid till the liquidation of the company is known as irredeemable preference share. The cost is measured by the following formula:
Kp (without tax) = orD
CMP NPWhere,
Kp = Cost of preference share.
D = Dividend per share.
CMP = Market price per share.
NP = Net proceeds.
Cost of irredeemable preference stock (with dividend tax)
Kp (without tax) = ( )1
orD Dt
CMP NP+
Where,
Dt = tax on preference dividend
Illustration 10: HHC Ltd., issues 12 per cent perpetual preference shares of face value of ` 200 each. Compute cost of preference share (without tax).

Unit 4: Cost of Capital
Notes
LOVELY PROFESSIONAL UNIVERSITY 63
Solution:
Kp = 100DNP
×
Kp = 24 100
200× = 12 per cent
Illustration 11: (with dividend tax): A company is planning to issue 14 per cent irredeemable preference share at the face value of ` 250 per share, with an estimated fl otation cost of 5%. What is the cost of preference share with 10% dividend tax.
Solution:
Kp = ( )1 100D DtNP
+×
= ( )35 1 0.10 100 16.21 per cent237.5
+× =
Illustration 12: Sai Ram & Co. is planning to issue 14 per cent perpetual preference shares, with face value of ` 100 each. Floatation costs are estimated at 4 per cent on sales price. Compute(a) cost of preference shares if they are issued at (i) face/par value, (ii) 10 per cent premium, and (iii) 5 per cent discount, (b) compute cost of preference share in these situation assuming 5 per cent dividend.
Solution:
Without dividend tax With dividend tax(i) Issued at face value
14 14.6 per cent(100 4)
Kp = =−
(i) Issued at face value
( )14 1 0.05 15.4 per cent96
Kp+
= =
(ii) Issued at 10% premium
14 13.2 per cent(110 4)
Kp = =−
(ii) Issued at 10% premium
( )14 1 0.05 13.9 per cent106
Kp+= =
(iii) Issued at 5% discount
14 15.4 per cent(100 5 3.8)
Kp = =− −
(iii) Issued at 5% discount
( )14 1 0.05 16.2 per cent91.2
Kp+= =
Cost of Redeemable Preference Shares
Shares that are issued for a specifi c maturity period or redeemable after a specifi c period are known as redeemable preference shares. The explicit cost of redeemable preference shares is the discount rate that equates the net proceeds of the sale of preference shares with the present value of the future dividend and principle repayments. In other words, cost of preference share is the discount rate that equates the present value of cash infl ows (sale proceeds) with the present value of cash outfl ows (dividend + principal repayment). Dividends will be paid at the end of each year, but the principle amount will be repaid either in lump sum at the end of maturity period or in installments (equal or unequal). If the principle amount is paid in installments, then the cash outfl ow for each year equals to dividend plus part of principal amount. Cost of preference shares, when the principal amount is repaid in one lumpsum amount:
Kp = ( )/
( )/2mD f d pr pi N
RV NP+ + + −
+
Basic Financial Management
Notes
64 LOVELY PROFESSIONAL UNIVERSITY
Where,
D = Dividend per share.
f = Flotation cost (`).
d = Discount on issue of preference share (`).
pr = Premium on redemption of preference shares (`).
pi = Premium on issue of preference share (`).
Nm = Term of preference shares.
RV = Redeemable value of preference share.
NP = Net proceeds realized.
Illustration 13 (Lump sum repayment): A company issues ` 1,00,000, 10 per cent preference shares of ` 100 each redeemable after 10 years at face value. Cost of issue is 10 per cent. Calculate the cost of preference share.
Kp = ( )/
( )/2mD f d pr pi N
RV NP+ + + −
+Where,
D = Dividend per share.
f = Flotation cost (`).
d = Discount on issue of preference share (`).
pr = Premium on redemption of preference shares (`).
pi = Premium on issue of preference share (`).
Nm = Term of preference shares.
RV = Redeemable value of preference share.
NP = Net proceeds realized.
Kp = 10 (10 0 0 0)/10
(100 90)/2+ + + −
+
= 10 (1) 11.579 per cent
95+
=
4.3.3 Cost of Debentures/Debt/Public Deposits
Companies may raise debt capital through issue of debentures or loan from fi nancial institutions or deposits from public. All these resources involve a specifi c rate of interest. The interest paid on these sources of funds is a charge on the profi t & loss account of the company. In other words, interest payments made by the fi rm on debt issue qualify tax deduction in determining net taxable income. Computation of cost of debenture or debt is relatively easy, because the interest rate that is payable on debt is fi xed by the agreement between the fi rm and the creditors. Computation of cost of debenture or debt capital depends on their nature. The debt/debentures can be perpetual or irredeemable and redeemable cost of debt capital is equal to the interest paid on that debt, but from company’s point of view it will be less than the interest payable, when the debt is issued at par, since the interest is tax deductible. Hence, computation of debt is always after tax cost.
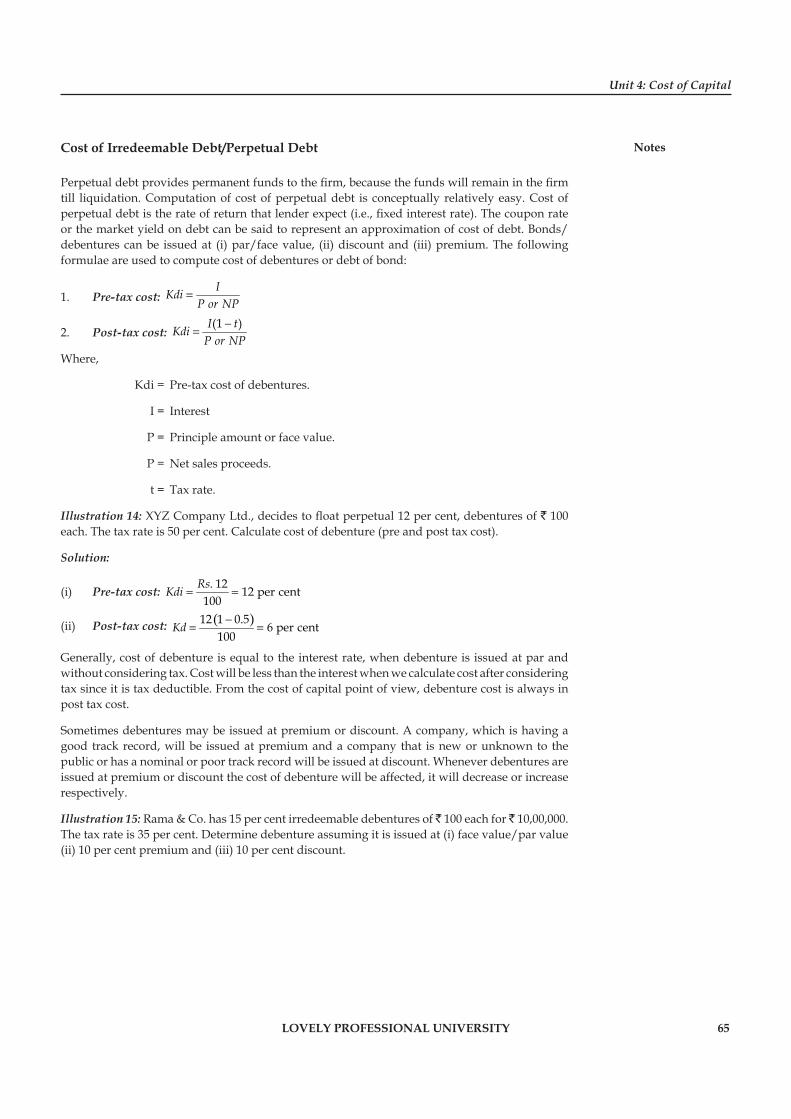
Unit 4: Cost of Capital
Notes
LOVELY PROFESSIONAL UNIVERSITY 65
Cost of Irredeemable Debt/Perpetual Debt
Perpetual debt provides permanent funds to the fi rm, because the funds will remain in the fi rm till liquidation. Computation of cost of perpetual debt is conceptually relatively easy. Cost of perpetual debt is the rate of return that lender expect (i.e., fi xed interest rate). The coupon rate or the market yield on debt can be said to represent an approximation of cost of debt. Bonds/ debentures can be issued at (i) par/face value, (ii) discount and (iii) premium. The following formulae are used to compute cost of debentures or debt of bond:
1. Pre-tax cost: IKdi
P or NP=
2. Post-tax cost: (1 )I tKdi
P or NP−
=
Where,
Kdi = Pre-tax cost of debentures.
I = Interest
P = Principle amount or face value.
P = Net sales proceeds.
t = Tax rate.
Illustration 14: XYZ Company Ltd., decides to fl oat perpetual 12 per cent, debentures of ` 100 each. The tax rate is 50 per cent. Calculate cost of debenture (pre and post tax cost).
Solution:
(i) Pre-tax cost: . 12 12 per cent100
RsKdi = =
(ii) Post-tax cost: ( )12 1 0.5 6 per cent100
Kd −= =
Generally, cost of debenture is equal to the interest rate, when debenture is issued at par and without considering tax. Cost will be less than the interest when we calculate cost after considering tax since it is tax deductible. From the cost of capital point of view, debenture cost is always in post tax cost.
Sometimes debentures may be issued at premium or discount. A company, which is having a good track record, will be issued at premium and a company that is new or unknown to the public or has a nominal or poor track record will be issued at discount. Whenever debentures are issued at premium or discount the cost of debenture will be affected, it will decrease or increase respectively.
Illustration 15: Rama & Co. has 15 per cent irredeemable debentures of ̀ 100 each for ` 10,00,000. The tax rate is 35 per cent. Determine debenture assuming it is issued at (i) face value/par value (ii) 10 per cent premium and (iii) 10 per cent discount.
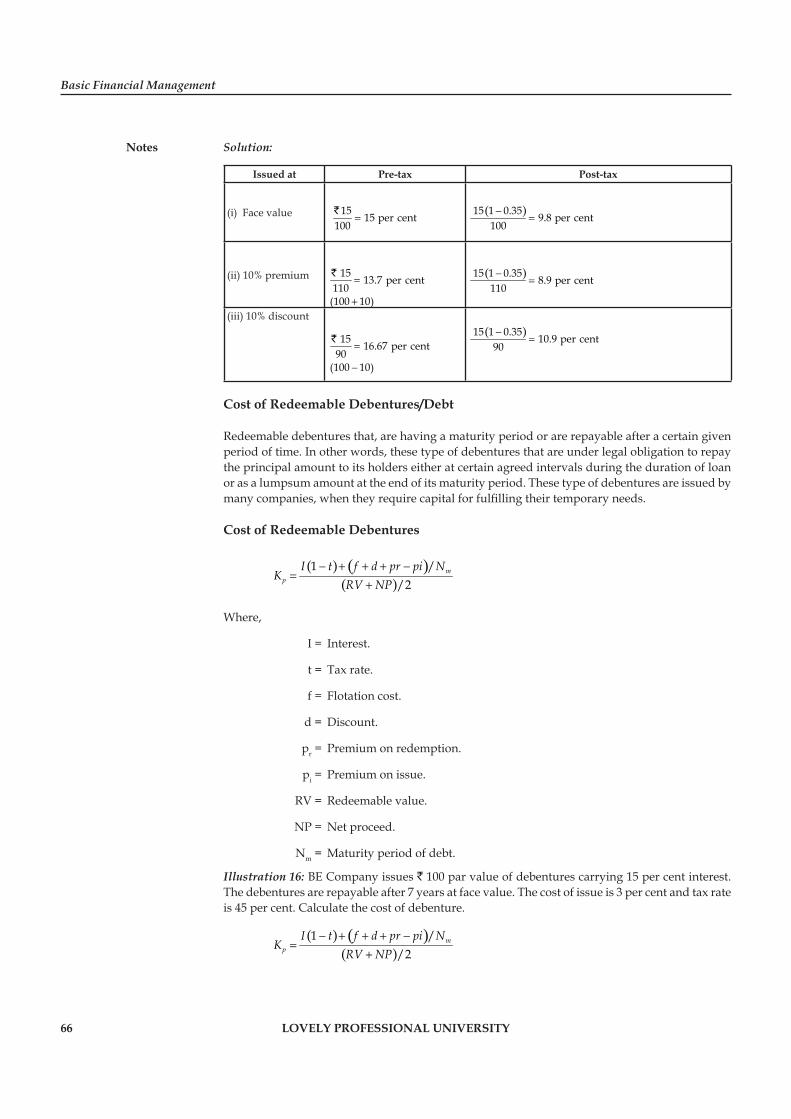
Basic Financial Management
Notes
66 LOVELY PROFESSIONAL UNIVERSITY
Solution:
Issued at Pre-tax Post-tax
(i) Face value
15 15 per cent100
=` ( )15 1 0.35 9.8 per cent
100−
=
(ii) 10% premium 15 13.7 per cent110
(100 10)
=
+
` ( )15 1 0.35 8.9 per cent110−
=
(iii) 10% discount
15 16.67 per cent90
(100 10)
=
−
`( )15 1 0.35 10.9 per cent
90−
=
Cost of Redeemable Debentures/Debt
Redeemable debentures that, are having a maturity period or are repayable after a certain given period of time. In other words, these type of debentures that are under legal obligation to repay the principal amount to its holders either at certain agreed intervals during the duration of loan or as a lumpsum amount at the end of its maturity period. These type of debentures are issued by many companies, when they require capital for fulfi lling their temporary needs.
Cost of Redeemable Debentures
( ) ( )( )
1 //2
mp
I t f d pr pi NK
RV NP− + + + −
=+
Where,
I = Interest.
t = Tax rate.
f = Flotation cost.
d = Discount.
pr = Premium on redemption.
pi = Premium on issue.
RV = Redeemable value.
NP = Net proceed.
Nm = Maturity period of debt.
Illustration 16: BE Company issues ` 100 par value of debentures carrying 15 per cent interest. The debentures are repayable after 7 years at face value. The cost of issue is 3 per cent and tax rate is 45 per cent. Calculate the cost of debenture.
( ) ( )( )
1 //2
mp
I t f d pr pi NK
RV NP− + + + −
=+
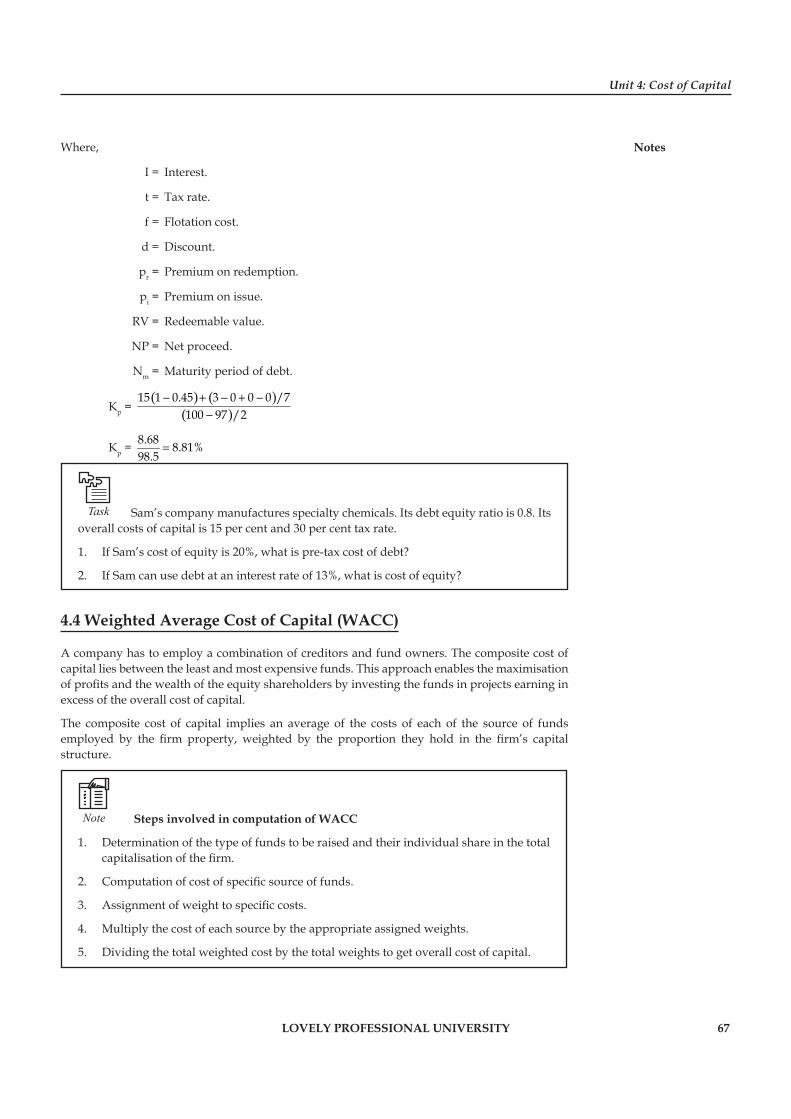
Unit 4: Cost of Capital
Notes
LOVELY PROFESSIONAL UNIVERSITY 67
Where,
I = Interest.
t = Tax rate.
f = Flotation cost.
d = Discount.
pr = Premium on redemption.
pi = Premium on issue.
RV = Redeemable value.
NP = Net proceed.
Nm = Maturity period of debt.
Kp = ( ) ( )
( )15 1 0.45 3 0 0 0 /7
100 97 /2− + − + −
−
Kp = 8.68 8.81%98.5
=
Task Sam’s company manufactures specialty chemicals. Its debt equity ratio is 0.8. Its overall costs of capital is 15 per cent and 30 per cent tax rate.
1. If Sam’s cost of equity is 20%, what is pre-tax cost of debt?
2. If Sam can use debt at an interest rate of 13%, what is cost of equity?
4.4 Weighted Average Cost of Capital (WACC)
A company has to employ a combination of creditors and fund owners. The composite cost of capital lies between the least and most expensive funds. This approach enables the maximisation of profi ts and the wealth of the equity shareholders by investing the funds in projects earning in excess of the overall cost of capital.
The composite cost of capital implies an average of the costs of each of the source of funds employed by the fi rm property, weighted by the proportion they hold in the fi rm’s capital structure.
Note Steps involved in computation of WACC
1. Determination of the type of funds to be raised and their individual share in the total capitalisation of the fi rm.
2. Computation of cost of specifi c source of funds.
3. Assignment of weight to specifi c costs.
4. Multiply the cost of each source by the appropriate assigned weights.
5. Dividing the total weighted cost by the total weights to get overall cost of capital.
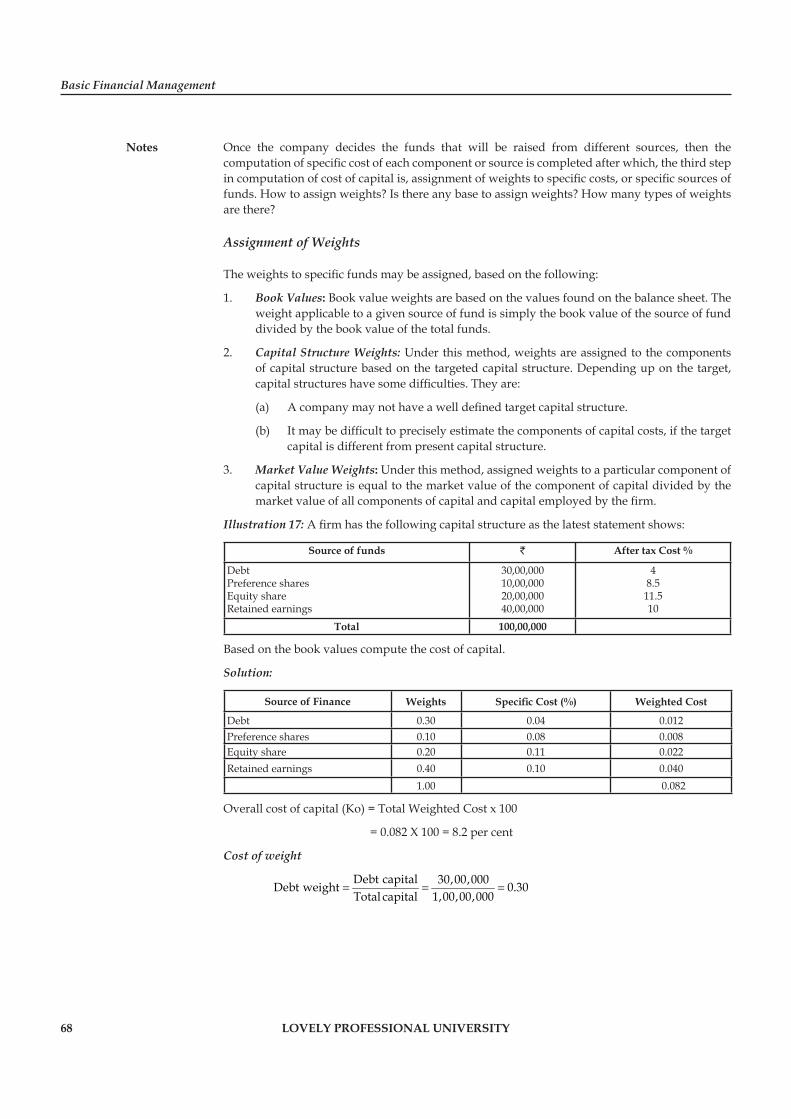
Basic Financial Management
Notes
68 LOVELY PROFESSIONAL UNIVERSITY
Once the company decides the funds that will be raised from different sources, then the computation of specifi c cost of each component or source is completed after which, the third step in computation of cost of capital is, assignment of weights to specifi c costs, or specifi c sources of funds. How to assign weights? Is there any base to assign weights? How many types of weights are there?
Assignment of Weights
The weights to specifi c funds may be assigned, based on the following:
1. Book Values: Book value weights are based on the values found on the balance sheet. The weight applicable to a given source of fund is simply the book value of the source of fund divided by the book value of the total funds.
2. Capital Structure Weights: Under this method, weights are assigned to the components of capital structure based on the targeted capital structure. Depending up on the target, capital structures have some diffi culties. They are:
(a) A company may not have a well defi ned target capital structure.
(b) It may be diffi cult to precisely estimate the components of capital costs, if the target capital is different from present capital structure.
3. Market Value Weights: Under this method, assigned weights to a particular component of capital structure is equal to the market value of the component of capital divided by the market value of all components of capital and capital employed by the fi rm.
Illustration 17: A fi rm has the following capital structure as the latest statement shows:
Source of funds ` After tax Cost %
DebtPreference sharesEquity shareRetained earnings
30,00,00010,00,00020,00,00040,00,000
48.511.510
Total 100,00,000
Based on the book values compute the cost of capital.
Solution:
Source of Finance Weights Specifi c Cost (%) Weighted Cost
Debt 0.30 0.04 0.012Preference shares 0.10 0.08 0.008Equity share 0.20 0.11 0.022Retained earnings 0.40 0.10 0.040
1.00 0.082
Overall cost of capital (Ko) = Total Weighted Cost x 100
= 0.082 X 100 = 8.2 per cent
Cost of weight
Debt capital 30,00,000Debt weight 0.30Total capital 1,00,00,000
= = =
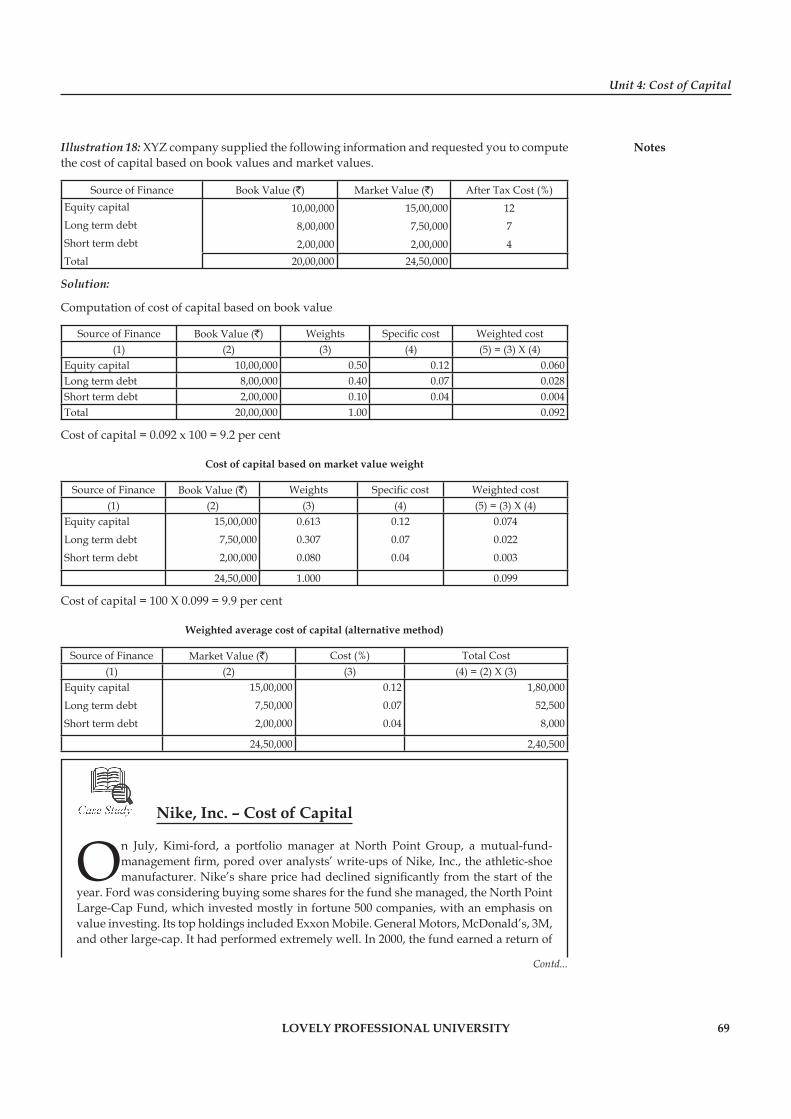
Unit 4: Cost of Capital
Notes
LOVELY PROFESSIONAL UNIVERSITY 69
Illustration 18: XYZ company supplied the following information and requested you to compute the cost of capital based on book values and market values.
Source of Finance Book Value (`) Market Value (`) After Tax Cost (%)Equity capital
Long term debt
Short term debt
Total
10,00,000
8,00,000
2,00,000
15,00,000
7,50,000
2,00,000
12
7
420,00,000 24,50,000
Solution:
Computation of cost of capital based on book value
Source of Finance Book Value (`) Weights Specifi c cost Weighted cost(1) (2) (3) (4) (5) = (3) X (4)
Equity capital 10,00,000 0.50 0.12 0.060Long term debt 8,00,000 0.40 0.07 0.028Short term debt 2,00,000 0.10 0.04 0.004Total 20,00,000 1.00 0.092
Cost of capital = 0.092 x 100 = 9.2 per cent
Cost of capital based on market value weight
Source of Finance Book Value (`) Weights Specifi c cost Weighted cost(1) (2) (3) (4) (5) = (3) X (4)
Equity capital
Long term debt
Short term debt
15,00,000
7,50,000
2,00,000
0.613
0.307
0.080
0.12
0.07
0.04
0.074
0.022
0.003
24,50,000 1.000 0.099
Cost of capital = 100 X 0.099 = 9.9 per cent
Weighted average cost of capital (alternative method)
Source of Finance Market Value (`) Cost (%) Total Cost(1) (2) (3) (4) = (2) X (3)
Equity capital
Long term debt
Short term debt
15,00,000
7,50,000
2,00,000
0.12
0.07
0.04
1,80,000
52,500
8,000
24,50,000 2,40,500
Nike, Inc. – Cost of Capital
On July, Kimi-ford, a portfolio manager at North Point Group, a mutual-fund-management fi rm, pored over analysts’ write-ups of Nike, Inc., the athletic-shoe manufacturer. Nike’s share price had declined signifi cantly from the start of the
year. Ford was considering buying some shares for the fund she managed, the North Point Large-Cap Fund, which invested mostly in fortune 500 companies, with an emphasis on value investing. Its top holdings included Exxon Mobile. General Motors, McDonald’s, 3M, and other large-cap. It had performed extremely well. In 2000, the fund earned a return of
Contd...
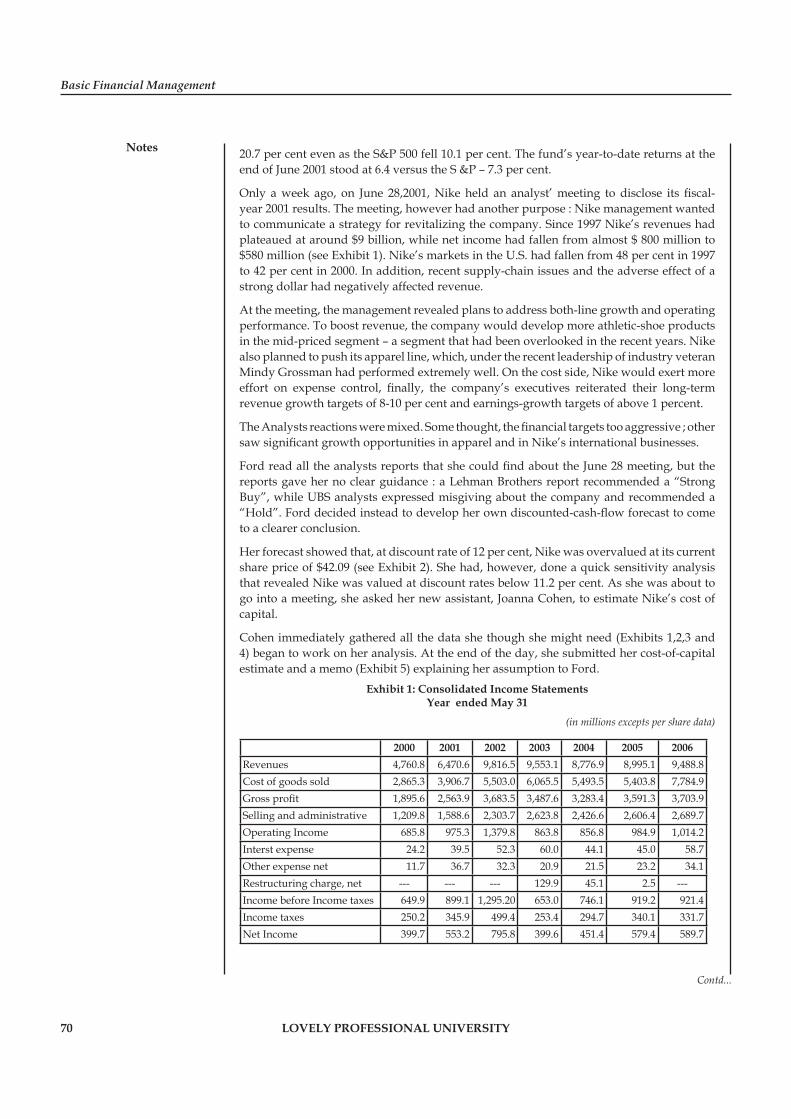
Basic Financial Management
Notes
70 LOVELY PROFESSIONAL UNIVERSITY
20.7 per cent even as the S&P 500 fell 10.1 per cent. The fund’s year-to-date returns at the end of June 2001 stood at 6.4 versus the S &P – 7.3 per cent.
Only a week ago, on June 28,2001, Nike held an analyst’ meeting to disclose its fi scal-year 2001 results. The meeting, however had another purpose : Nike management wanted to communicate a strategy for revitalizing the company. Since 1997 Nike’s revenues had plateaued at around $9 billion, while net income had fallen from almost $ 800 million to $580 million (see Exhibit 1). Nike’s markets in the U.S. had fallen from 48 per cent in 1997 to 42 per cent in 2000. In addition, recent supply-chain issues and the adverse effect of a strong dollar had negatively affected revenue.
At the meeting, the management revealed plans to address both-line growth and operating performance. To boost revenue, the company would develop more athletic-shoe products in the mid-priced segment – a segment that had been overlooked in the recent years. Nike also planned to push its apparel line, which, under the recent leadership of industry veteran Mindy Grossman had performed extremely well. On the cost side, Nike would exert more effort on expense control, fi nally, the company’s executives reiterated their long-term revenue growth targets of 8-10 per cent and earnings-growth targets of above 1 percent.
The Analysts reactions were mixed. Some thought, the fi nancial targets too aggressive ; other saw signifi cant growth opportunities in apparel and in Nike’s international businesses.
Ford read all the analysts reports that she could fi nd about the June 28 meeting, but the reports gave her no clear guidance : a Lehman Brothers report recommended a “Strong Buy”, while UBS analysts expressed misgiving about the company and recommended a “Hold”. Ford decided instead to develop her own discounted-cash-fl ow forecast to come to a clearer conclusion.
Her forecast showed that, at discount rate of 12 per cent, Nike was overvalued at its current share price of $42.09 (see Exhibit 2). She had, however, done a quick sensitivity analysis that revealed Nike was valued at discount rates below 11.2 per cent. As she was about to go into a meeting, she asked her new assistant, Joanna Cohen, to estimate Nike’s cost of capital.
Cohen immediately gathered all the data she though she might need (Exhibits 1,2,3 and 4) began to work on her analysis. At the end of the day, she submitted her cost-of-capital estimate and a memo (Exhibit 5) explaining her assumption to Ford.
Exhibit 1: Consolidated Income Statements Year ended May 31
(in millions excepts per share data)
2000 2001 2002 2003 2004 2005 2006Revenues 4,760.8 6,470.6 9,816.5 9,553.1 8,776.9 8,995.1 9,488.8Cost of goods sold 2,865.3 3,906.7 5,503.0 6,065.5 5,493.5 5,403.8 7,784.9Gross profi t 1,895.6 2,563.9 3,683.5 3,487.6 3,283.4 3,591.3 3,703.9Selling and administrative 1,209.8 1,588.6 2,303.7 2,623.8 2,426.6 2,606.4 2,689.7Operating Income 685.8 975.3 1,379.8 863.8 856.8 984.9 1,014.2Interst expense 24.2 39.5 52.3 60.0 44.1 45.0 58.7Other expense net 11.7 36.7 32.3 20.9 21.5 23.2 34.1Restructuring charge, net --- --- --- 129.9 45.1 2.5 ---Income before Income taxes 649.9 899.1 1,295.20 653.0 746.1 919.2 921.4Income taxes 250.2 345.9 499.4 253.4 294.7 340.1 331.7Net Income 399.7 553.2 795.8 399.6 451.4 579.4 589.7
Contd...
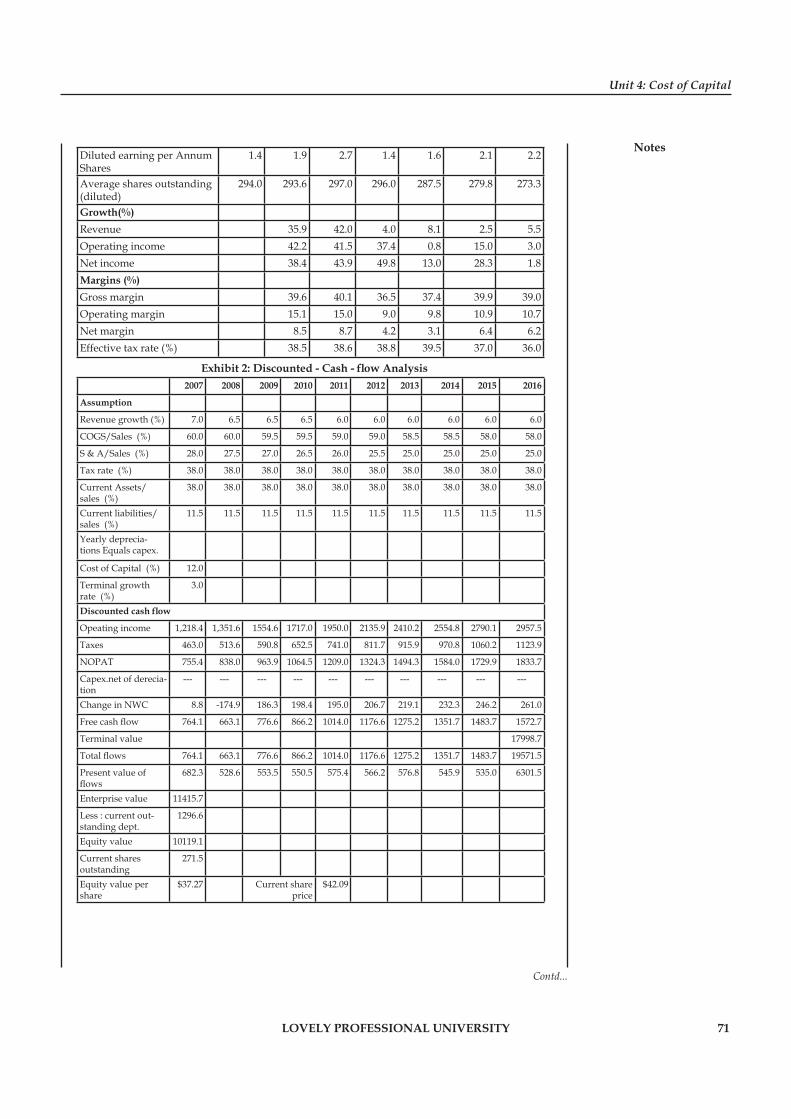
Unit 4: Cost of Capital
Notes
LOVELY PROFESSIONAL UNIVERSITY 71
Diluted earning per Annum Shares
1.4 1.9 2.7 1.4 1.6 2.1 2.2
Average shares outstanding (diluted)
294.0 293.6 297.0 296.0 287.5 279.8 273.3
Growth(%)Revenue 35.9 42.0 4.0 8.1 2.5 5.5Operating income 42.2 41.5 37.4 0.8 15.0 3.0Net income 38.4 43.9 49.8 13.0 28.3 1.8Margins (%)Gross margin 39.6 40.1 36.5 37.4 39.9 39.0Operating margin 15.1 15.0 9.0 9.8 10.9 10.7Net margin 8.5 8.7 4.2 3.1 6.4 6.2Effective tax rate (%) 38.5 38.6 38.8 39.5 37.0 36.0
Exhibit 2: Discounted - Cash - fl ow Analysis 2007 2008 2009 2010 2011 2012 2013 2014 2015 2016
Assumption
Revenue growth (%) 7.0 6.5 6.5 6.5 6.0 6.0 6.0 6.0 6.0 6.0
COGS/Sales (%) 60.0 60.0 59.5 59.5 59.0 59.0 58.5 58.5 58.0 58.0
S & A/Sales (%) 28.0 27.5 27.0 26.5 26.0 25.5 25.0 25.0 25.0 25.0
Tax rate (%) 38.0 38.0 38.0 38.0 38.0 38.0 38.0 38.0 38.0 38.0
Current Assets/sales (%)
38.0 38.0 38.0 38.0 38.0 38.0 38.0 38.0 38.0 38.0
Current liabilities/sales (%)
11.5 11.5 11.5 11.5 11.5 11.5 11.5 11.5 11.5 11.5
Yearly deprecia-tions Equals capex.
Cost of Capital (%) 12.0
Terminal growth rate (%)
3.0
Discounted cash fl ow
Opeating income 1,218.4 1,351.6 1554.6 1717.0 1950.0 2135.9 2410.2 2554.8 2790.1 2957.5
Taxes 463.0 513.6 590.8 652.5 741.0 811.7 915.9 970.8 1060.2 1123.9
NOPAT 755.4 838.0 963.9 1064.5 1209.0 1324.3 1494.3 1584.0 1729.9 1833.7
Capex.net of derecia-tion
--- --- --- --- --- --- --- --- --- ---
Change in NWC 8.8 -174.9 186.3 198.4 195.0 206.7 219.1 232.3 246.2 261.0
Free cash fl ow 764.1 663.1 776.6 866.2 1014.0 1176.6 1275.2 1351.7 1483.7 1572.7
Terminal value 17998.7
Total fl ows 764.1 663.1 776.6 866.2 1014.0 1176.6 1275.2 1351.7 1483.7 19571.5
Present value of fl ows
682.3 528.6 553.5 550.5 575.4 566.2 576.8 545.9 535.0 6301.5
Enterprise value 11415.7
Less : current out-standing dept.
1296.6
Equity value 10119.1
Current shares outstanding
271.5
Equity value per share
$37.27 Current share price
$42.09
Contd...
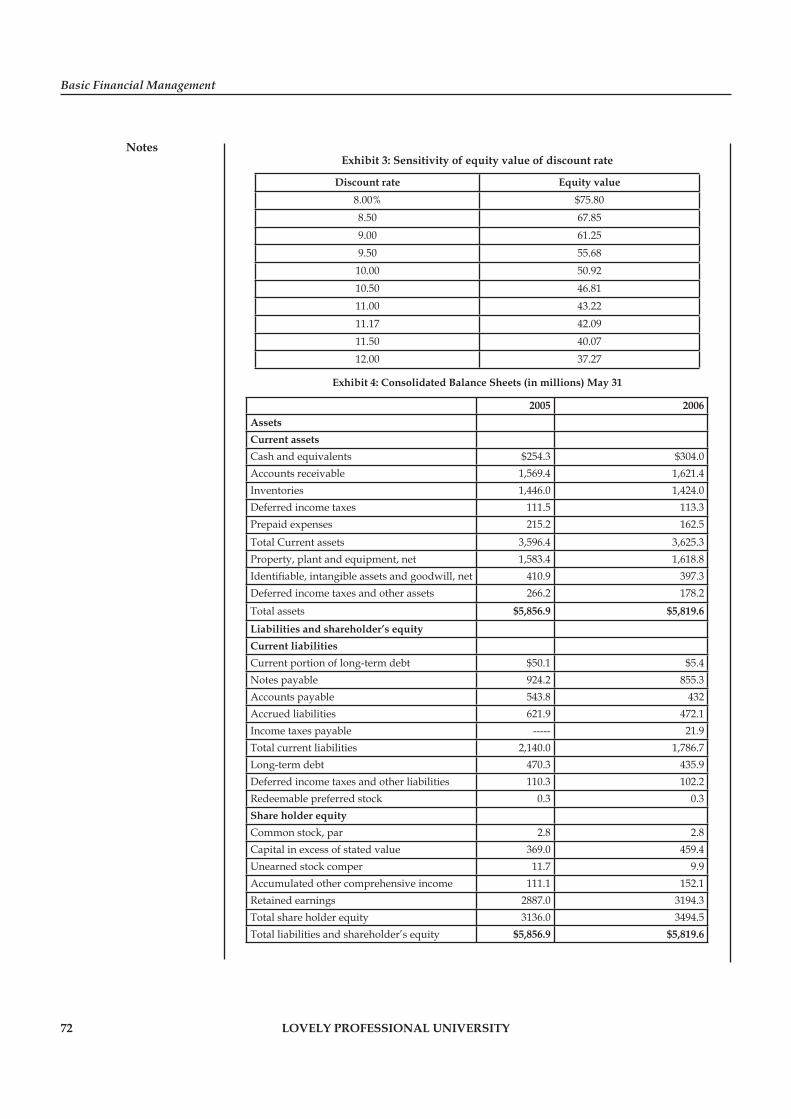
Basic Financial Management
Notes
72 LOVELY PROFESSIONAL UNIVERSITY
Exhibit 3: Sensitivity of equity value of discount rate
Discount rate Equity value8.00% $75.808.50 67.859.00 61.259.50 55.6810.00 50.9210.50 46.8111.00 43.2211.17 42.0911.50 40.0712.00 37.27
Exhibit 4: Consolidated Balance Sheets (in millions) May 31
2005 2006AssetsCurrent assetsCash and equivalents $254.3 $304.0 Accounts receivable 1,569.4 1,621.4Inventories 1,446.0 1,424.0Deferred income taxes 111.5 113.3Prepaid expenses 215.2 162.5
Total Current assets 3,596.4 3,625.3Property, plant and equipment, net 1,583.4 1,618.8Identifi able, intangible assets and goodwill, net 410.9 397.3Deferred income taxes and other assets 266.2 178.2
Total assets $5,856.9 $5,819.6 Liabilities and shareholder’s equityCurrent liabilitiesCurrent portion of long-term debt $50.1 $5.4 Notes payable 924.2 855.3Accounts payable 543.8 432Accrued liabilities 621.9 472.1Income taxes payable ----- 21.9Total current liabilities 2,140.0 1,786.7Long-term debt 470.3 435.9Deferred income taxes and other liabilities 110.3 102.2Redeemable preferred stock 0.3 0.3Share holder equity Common stock, par 2.8 2.8Capital in excess of stated value 369.0 459.4Unearned stock comper 11.7 9.9Accumulated other comprehensive income 111.1 152.1Retained earnings 2887.0 3194.3Total share holder equity 3136.0 3494.5Total liabilities and shareholder’s equity $5,856.9 $5,819.6
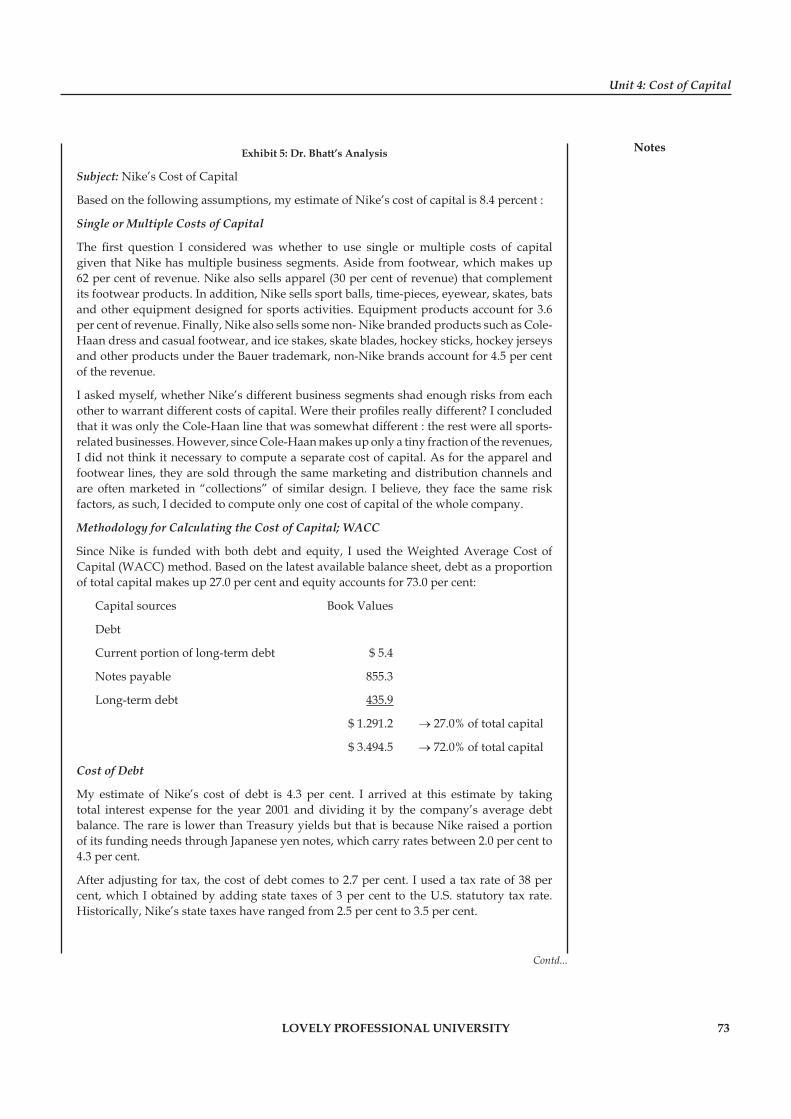
Unit 4: Cost of Capital
Notes
LOVELY PROFESSIONAL UNIVERSITY 73
Contd...
Exhibit 5: Dr. Bhatt’s Analysis
Subject: Nike’s Cost of Capital
Based on the following assumptions, my estimate of Nike’s cost of capital is 8.4 percent :
Single or Multiple Costs of Capital
The fi rst question I considered was whether to use single or multiple costs of capital given that Nike has multiple business segments. Aside from footwear, which makes up 62 per cent of revenue. Nike also sells apparel (30 per cent of revenue) that complement its footwear products. In addition, Nike sells sport balls, time-pieces, eyewear, skates, bats and other equipment designed for sports activities. Equipment products account for 3.6 per cent of revenue. Finally, Nike also sells some non- Nike branded products such as Cole-Haan dress and casual footwear, and ice stakes, skate blades, hockey sticks, hockey jerseys and other products under the Bauer trademark, non-Nike brands account for 4.5 per cent of the revenue.
I asked myself, whether Nike’s different business segments shad enough risks from each other to warrant different costs of capital. Were their profi les really different? I concluded that it was only the Cole-Haan line that was somewhat different : the rest were all sports-related businesses. However, since Cole-Haan makes up only a tiny fraction of the revenues, I did not think it necessary to compute a separate cost of capital. As for the apparel and footwear lines, they are sold through the same marketing and distribution channels and are often marketed in “collections” of similar design. I believe, they face the same risk factors, as such, I decided to compute only one cost of capital of the whole company.
Methodology for Calculating the Cost of Capital; WACC
Since Nike is funded with both debt and equity, I used the Weighted Average Cost of Capital (WACC) method. Based on the latest available balance sheet, debt as a proportion of total capital makes up 27.0 per cent and equity accounts for 73.0 per cent:
Capital sources Book Values
Debt
Current portion of long-term debt $ 5.4
Notes payable 855.3
Long-term debt 435.9
$ 1.291.2 → 27.0% of total capital
$ 3.494.5 → 72.0% of total capital
Cost of Debt
My estimate of Nike’s cost of debt is 4.3 per cent. I arrived at this estimate by taking total interest expense for the year 2001 and dividing it by the company’s average debt balance. The rare is lower than Treasury yields but that is because Nike raised a portion of its funding needs through Japanese yen notes, which carry rates between 2.0 per cent to 4.3 per cent.
After adjusting for tax, the cost of debt comes to 2.7 per cent. I used a tax rate of 38 per cent, which I obtained by adding state taxes of 3 per cent to the U.S. statutory tax rate. Historically, Nike’s state taxes have ranged from 2.5 per cent to 3.5 per cent.
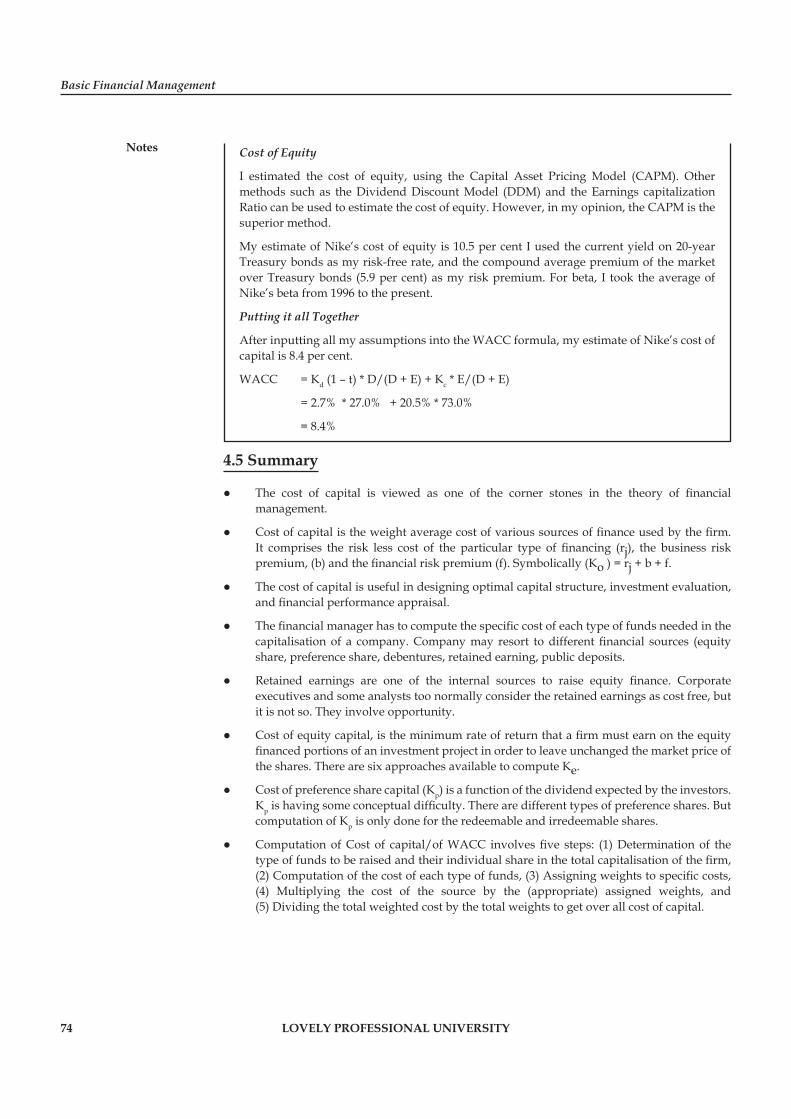
Basic Financial Management
Notes
74 LOVELY PROFESSIONAL UNIVERSITY
Cost of Equity
I estimated the cost of equity, using the Capital Asset Pricing Model (CAPM). Other methods such as the Dividend Discount Model (DDM) and the Earnings capitalization Ratio can be used to estimate the cost of equity. However, in my opinion, the CAPM is the superior method.
My estimate of Nike’s cost of equity is 10.5 per cent I used the current yield on 20-year Treasury bonds as my risk-free rate, and the compound average premium of the market over Treasury bonds (5.9 per cent) as my risk premium. For beta, I took the average of Nike’s beta from 1996 to the present.
Putting it all Together
After inputting all my assumptions into the WACC formula, my estimate of Nike’s cost of capital is 8.4 per cent.
WACC = Kd (1 – t) * D/(D + E) + Kc * E/(D + E)
= 2.7% * 27.0% + 20.5% * 73.0%
= 8.4%
4.5 Summary
The cost of capital is viewed as one of the corner stones in the theory of fi nancial management.
Cost of capital is the weight average cost of various sources of fi nance used by the fi rm. It comprises the risk less cost of the particular type of fi nancing (rj), the business risk premium, (b) and the fi nancial risk premium (f). Symbolically (Ko ) = rj + b + f.
The cost of capital is useful in designing optimal capital structure, investment evaluation, and fi nancial performance appraisal.
The fi nancial manager has to compute the specifi c cost of each type of funds needed in the capitalisation of a company. Company may resort to different fi nancial sources (equity share, preference share, debentures, retained earning, public deposits.
Retained earnings are one of the internal sources to raise equity fi nance. Corporate executives and some analysts too normally consider the retained earnings as cost free, but it is not so. They involve opportunity.
Cost of equity capital, is the minimum rate of return that a fi rm must earn on the equity fi nanced portions of an investment project in order to leave unchanged the market price of the shares. There are six approaches available to compute Ke.
Cost of preference share capital (Kp) is a function of the dividend expected by the investors. Kp is having some conceptual diffi culty. There are different types of preference shares. But computation of Kp is only done for the redeemable and irredeemable shares.
Computation of Cost of capital/of WACC involves fi ve steps: (1) Determination of the type of funds to be raised and their individual share in the total capitalisation of the fi rm, (2) Computation of the cost of each type of funds, (3) Assigning weights to specifi c costs, (4) Multiplying the cost of the source by the (appropriate) assigned weights, and (5) Dividing the total weighted cost by the total weights to get over all cost of capital.
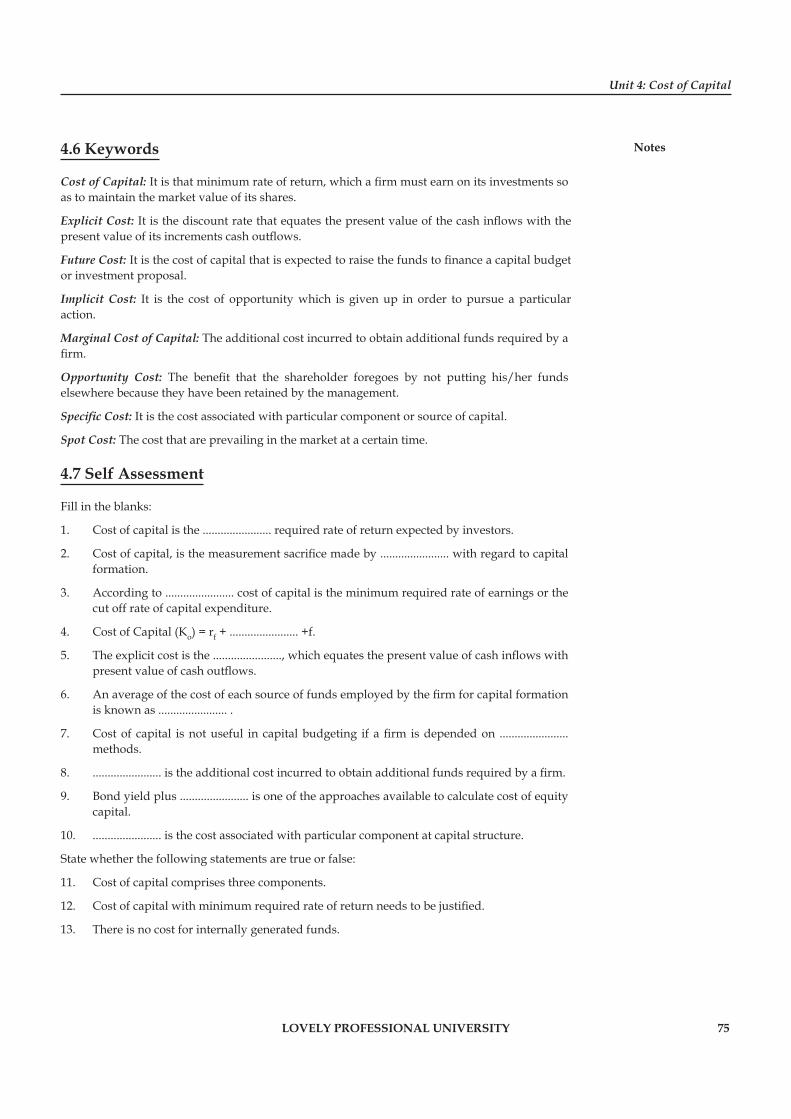
Unit 4: Cost of Capital
Notes
LOVELY PROFESSIONAL UNIVERSITY 75
4.6 Keywords
Cost of Capital: It is that minimum rate of return, which a fi rm must earn on its investments so as to maintain the market value of its shares.
Explicit Cost: It is the discount rate that equates the present value of the cash infl ows with the present value of its increments cash outfl ows.
Future Cost: It is the cost of capital that is expected to raise the funds to fi nance a capital budget or investment proposal.
Implicit Cost: It is the cost of opportunity which is given up in order to pursue a particular action.
Marginal Cost of Capital: The additional cost incurred to obtain additional funds required by a fi rm.
Opportunity Cost: The benefi t that the shareholder foregoes by not putting his/her funds elsewhere because they have been retained by the management.
Specifi c Cost: It is the cost associated with particular component or source of capital.
Spot Cost: The cost that are prevailing in the market at a certain time.
4.7 Self Assessment
Fill in the blanks:
1. Cost of capital is the ....................... required rate of return expected by investors.
2. Cost of capital, is the measurement sacrifi ce made by ....................... with regard to capital formation.
3. According to ....................... cost of capital is the minimum required rate of earnings or the cut off rate of capital expenditure.
4. Cost of Capital (Ko) = rf + ....................... +f.
5. The explicit cost is the ......................., which equates the present value of cash infl ows with present value of cash outfl ows.
6. An average of the cost of each source of funds employed by the fi rm for capital formation is known as ....................... .
7. Cost of capital is not useful in capital budgeting if a fi rm is depended on ....................... methods.
8. ....................... is the additional cost incurred to obtain additional funds required by a fi rm.
9. Bond yield plus ....................... is one of the approaches available to calculate cost of equity capital.
10. ....................... is the cost associated with particular component at capital structure.
State whether the following statements are true or false:
11. Cost of capital comprises three components.
12. Cost of capital with minimum required rate of return needs to be justifi ed.
13. There is no cost for internally generated funds.
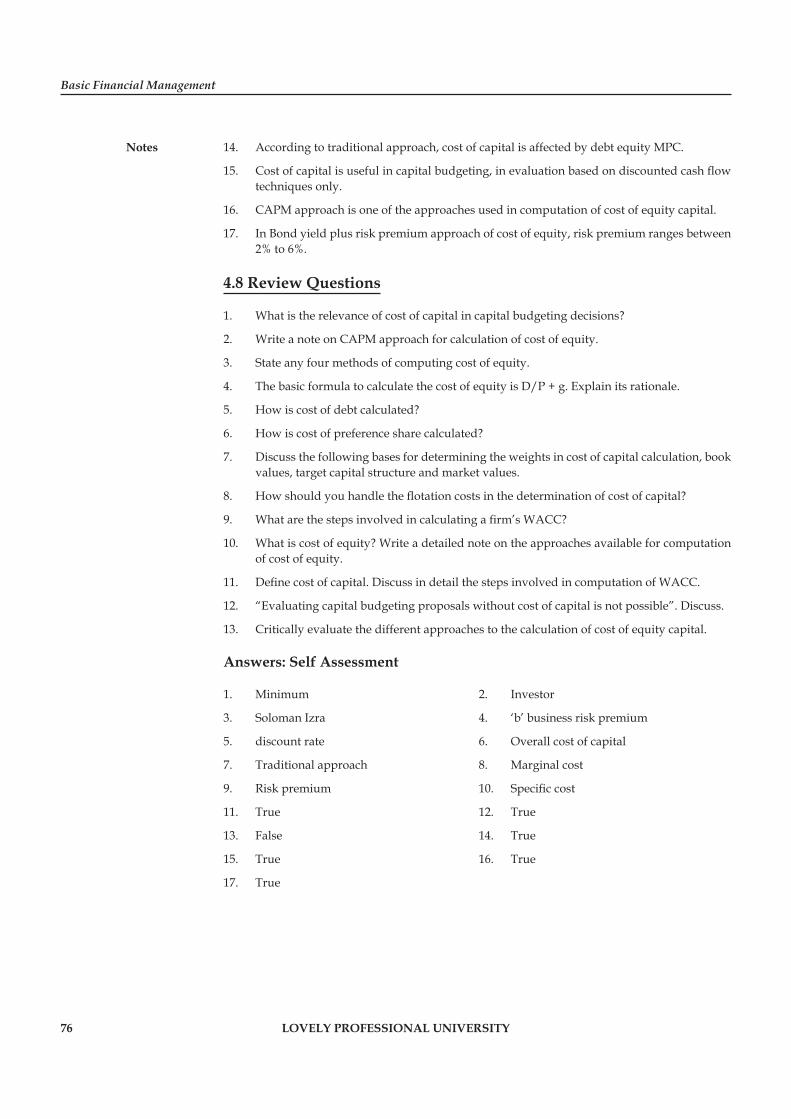
Basic Financial Management
Notes
76 LOVELY PROFESSIONAL UNIVERSITY
14. According to traditional approach, cost of capital is affected by debt equity MPC.
15. Cost of capital is useful in capital budgeting, in evaluation based on discounted cash fl ow techniques only.
16. CAPM approach is one of the approaches used in computation of cost of equity capital.
17. In Bond yield plus risk premium approach of cost of equity, risk premium ranges between 2% to 6%.
4.8 Review Questions
1. What is the relevance of cost of capital in capital budgeting decisions?
2. Write a note on CAPM approach for calculation of cost of equity.
3. State any four methods of computing cost of equity.
4. The basic formula to calculate the cost of equity is D/P + g. Explain its rationale.
5. How is cost of debt calculated?
6. How is cost of preference share calculated?
7. Discuss the following bases for determining the weights in cost of capital calculation, book values, target capital structure and market values.
8. How should you handle the fl otation costs in the determination of cost of capital?
9. What are the steps involved in calculating a fi rm’s WACC?
10. What is cost of equity? Write a detailed note on the approaches available for computation of cost of equity.
11. Defi ne cost of capital. Discuss in detail the steps involved in computation of WACC.
12. “Evaluating capital budgeting proposals without cost of capital is not possible”. Discuss.
13. Critically evaluate the different approaches to the calculation of cost of equity capital.
Answers: Self Assessment
1. Minimum 2. Investor
3. Soloman Izra 4. ‘b’ business risk premium
5. discount rate 6. Overall cost of capital
7. Traditional approach 8. Marginal cost
9. Risk premium 10. Specifi c cost
11. True 12. True
13. False 14. True
15. True 16. True
17. True
Unit 4: Cost of Capital
Notes
LOVELY PROFESSIONAL UNIVERSITY 77
4.9 Further Readings
Books Chandra, P., Financial Management - Theory and Practice, New Delhi, Tata McGraw Hill Publishing Company Ltd., 2002, p. 3.
Sudhindra Bhat, Financial Management, New Delhi, Excel Books, 2008.
Van Horne, J.C. and Wachowicz, Jr, J.M., Fundamentals of Financial Management, New Delhi, Prentice Hall of India Pvt. Ltd., 1996, p. 2.
Online link http://www.fei.org/
Basic Financial Management
Notes
78 LOVELY PROFESSIONAL UNIVERSITY
Unit 5: Capital Structure Decisions
CONTENTS
Objectives
Introduction
5.1 Meaning of Capital Structure
5.2 Forms of Capital Structure
5.3 Factors Determining the Capital Structure
5.4 Concept of Leverage
5.4.1 Operating Leverage
5.4.2 Financial Leverage
5.5 Summary
5.6 Keywords
5.7 Self Assessment
5.8 Review Questions
5.9 Further Readings
Objectives
After studying this unit, you will be able to:
Discuss concept of capital structure
Know about debt and equity
Describe Leverage
Introduction
Every organisation requires funds to run and maintain its business. The required funds may be raised from short-term sources or long-term sources or a combination both the sources of funds, so as to equip itself with an appropriate combination of fi xed assets and current assets. Current assets to a considerable extent are fi nanced with the help of short-term sources. Normally, fi rms are expected to follow a prudent fi nancial policy, as revealed in the maintenance of net current assets. This net positive current asset must be fi nanced by long-term sources. Hence, long-term sources of funds are required to fi nance for both (a) long-term assets (fi xed assets) and (b) networking capital (positive current assets). The long-term fi nancial strength as well as profi tability of a fi rm is infl uenced by its fi nancial structure.
?Did u know? The term ‘Financial Structure’ refers to the left hand side of the balance sheet as represented by “total liabilities” consisting of current liabilities, long-term debt, preference share and equity share capital. The fi nancial structure, therefore, includes both short-term and long-term sources of funds.

Unit 5: Capital Structure Decisions
Notes
LOVELY PROFESSIONAL UNIVERSITY 79
5.1 Meaning of Capital Structure
Capital structure is that part of fi nancial structure, which represents long-term sources. The term capital structure is generally defi ned to include only long-term debt and total stockholder investment. The term capital structure refers to the mix of long-term sources of funds, such as equity shares capital, reserves and surpluses, debenture, long-term debt from outside sources and preference share capital. To quote Bogen, “Capital structure may consist of a single class of stock, or it may be complicated by several issues of bonds and preferred stock, the characteristics of which may vary considerably”. In other words, capital structure refers to the composition of capitalisation, i.e., to the proportion between debt and equity that make up capitalisation.
Note Capital Structure = Long-term Debt + Preferred Stock + Net worth
or
Capital Structure = Total Assets – Current Liabilities
Thus, the capital structure of a fi rm consists of the shareholder‘ funds and debt. The inherent fi nancial stability of an enterprise and risk of insolvency to which it is exposed, are primarily dependent on the source of its funds as well as the type of assets it holds and relative magnitude of such asset categories.
5.2 Forms of Capital Structure
While making or farming the capital structure, a fi rm may use equity share capital or preference share capital or debt capital (debentures or loans) or a combination of them all. However, the use of any one of the above sources does not help to come up with an optimum capital structure. Optimum capital structure is possible only when there is a mix of all the above sources (debt and equity). The following are the forms of capital structure.
1. Complete equity share capital;
2. Different proportions of equity and preference share capital;
3. Different proportions of equity and debenture (debt) capital and
4. Different proportions of equity, preference and debenture (debt) capital.
5.3 Factors Determining the Capital Structure
The given below are the key factors which affect the capital structure decision:
1. Retaining Control: The capital structure of a company is also affected by the extent to which the existing management of the company desires to maintain control over the affairs of the company. If the company issues debt capital or preference capital, there is no risk of dilutions of control. The company can also buy back the shares to increase the control of the promoters over the company.
2. Nature of the Enterprise: Business fi rms with stable earnings or monopoly fi rms supplying basic necessaries can have more or debt capital because they have the capacity to service the debt. The fi rms without the above advantages should rely more on equity.
3. Purposes of Financing: If the purpose is productive, the fi rm may use the debt capital otherwise it is better to rely more on equity capital.
Basic Financial Management
Notes
80 LOVELY PROFESSIONAL UNIVERSITY
4. Period of Finance: If the fi nance is required for a very long time, equity shares should be issued because it is a permanent source. If the funds are required only for a short period, short term debt may be raised.
5. Requirement of Investors: The Company requiring large amount of capital must issue different kinds of securities to suit the requirements of different investors.
Example: Regular income bonds, deep discount bonds, partly convertible bonds, equity shares, preference shares etc.
6. Size of the Company: Small companies and companies with low credit ratings must rely more on equity capital market as it is very easy to issue equity capital. On the other hand, large companies with good credit ratings can raise debt capital easily.
7. Market Sentiments: This is another factor infl uencing the capital structure decision. When there is a boom in the capital market it is very easy to issue equity capital. But when in the market bear conditions prevail, people will look for safety. So only debt instruments with good credit rating can be issued during such periods.
8. Cash Flow Ability: The issue of debt depends on the future cash fl ow ability of the company.
9. Floating Costs: Floatation costs are incurred when the funds are raised externally. So retained earnings do not involve fl oatation costs. Floatation costs for the issue of share is more than that of debentures and bonds. Further the fl oatation costs are much less when the company issues securities on private placement basis instead of public issue.
5.4 Concept of Leverage
As we have seen in the above discussion, that a fi rm can raise its required fi nance either equity or debt or both the sources. While constructing capital structure, a fi rm can use fi xed cost bearing securities for maximisation of shareholder ‘ wealth. Leverage has been defi ned as, the action of a lever and mathematical advantage gained by it. In other words, leverage allows accomplishing certain things that are otherwise not possible. The concept is valid in business also. From the fi nancial management point of view, the term leverage is commonly used to describe the fi rm’s ability to use fi xed cost assets or sources of funds to magnify the returns to its owners.
There are two types of leverages, such as:
1. Operating leverage
2. Financial leverage
5.4.1 Operating Leverage
Operating leverage may be defi ned as the fi rm’s ability to use operating costs to magnify the effects of changes in sales on its earnings before interest and taxes. Operating leverage is associated with investment (assets acquisition) activities. Hence, operating leverage results from the present fi xed operating expenses with in fi rm’s income stream. The operating costs are categorised into three:
1. First: Fixed costs, which do not vary with the level of production, they must be paid regardless of the amount of revenue available.
Example: Depreciation plant and machinery, buildings, insurance, etc.
Unit 5: Capital Structure Decisions
Notes
LOVELY PROFESSIONAL UNIVERSITY 81
2. Second: Variable costs that varies directly with the level of production.
Example: Raw materials, direct labour costs, etc.
3. Third: Semi-variable costs, which partly vary and is partly fi xed.
The degree of operating leverage may be defi ned as the change in the percentage of operating income (EBIT), for the change in percentage of sales revenue. The degree of operating leverage at any level of output is arrived at by dividing the percentage change in EBIT with percentage change in sales.
That is
Degree of Operating Leverage = Percentage change in EBITPercentage change in sales
or
= Contribution
Operating Profit (EBIT)
!Caution Operating leverage may be favourable or unfavourable. High degree of operating
leverage indicates high degree of risk.
Notes Computation of Earnings available to Equity Shareholders
Particulars Amount (`)Sales Revenue (units sold x selling price pu) X X X X
Less : Variable cost X X X [Units produced x cost per unit]
Contribution X X X XLess: Fixed cost X X X Earnings Before Interest & Taxes (EBIT) X X X XLess: Interest X X X Earnings Before Tax (EBT) X X X XLess: Tax X X X Earnings After Taxes (EAT) X X X XLess: Preference Dividend X X XEarnings available to Equity shareholder (EAES) X X X X
Illustration 1: XYZ Ltd., produced and sold 1,00,000 units of a product at the rate of `100. For production of 1,00,000 units, it has spend a variable cost of ` 6,00,000 at the rate of ` 6 per unit and a fi xed cost of ` 2,50,000. The fi rm has paid interest ` 50,000 at the rate of 5 per cent and ` 1,00,000 debt. Calculate operating leverage.
Solution:
Particulars Amount `Sales Revenue (1,00,000 x ` 100) 10,00,000Less: Variable cost (1,00,000 x ` 6) 6,00,000 Contribution 4,00,000Less: Fixed cost 2,50,000 EBIT 1,50,000
Basic Financial Management
Notes
82 LOVELY PROFESSIONAL UNIVERSITY
ContributionDOL = EBIT or Operating profit (EBIT)
Operating leverage = 4,00,000 2.661,50,000
=
5.4.2 Financial Leverage
A fi rm may need long-term funds for long-term activities like expansion, diversifi cation, modernization etc., the fi nancial managers job is to compose funds. The required funds may be raised by two sources: equity and debt. Use of various sources to compose capital is known as fi nancial structure. The use of fi xed charges, sources of funds such as debt and preference share capital along with the equity share capital in capital structure is described as fi nancial leverage.
Financial leverage results from the presence of fi xed fi nancial charges in the income statement. Financial leverage associates with fi nancing activities. The fi xed charges do not vary with fi rm’s EBIT. They must be paid regardless of the amount of EBIT available to the fi rm. It indicates the effect on EBIT created by the use of fi xed charge securities in the capital structure of a fi rm.
Financial leverage is computed by the following formula:
Financial (Leverage) = EBIT or operating profitEBT or taxable incomeor
Degree of fi nancial leverage (DFL) = Percentage change in EPSPercentage change in EBIT
!Caution A Financial leverage may be positive or negative. Favourable leverage occurs
when the fi rm earns more on the assets purchased with the funds, than the fi xed cost of their use and vice versa. High degree of fi nancial leverage leads to high fi nancial risk.
Illustration 2: A fi rm has sales of 1,00,000 units at ̀ 10 pu. Variable cost of the produced products is 60 per cent of the total sales revenue. Fixed cost is ` 2,00,000. The fi rm has used a debt of ` 5,00,000 at 20 per cent interest. Calculate the operating leverage and fi nancial leverage.
Solution:
Calculation of EBT
Particulars Amount `Sales Revenue (1,00,000 units x ` 10 P.u) 10,00,000Less: Variable cost (10,00,000 x 0.60) 6,00,000 Contribution 4,00,000Less: Fixed cost 2,00,000 EBIT 2,00,000Less: Interest (5,00,000 x 20 /100) 1,00,000Earning before tax (EBT) 1,00,000
Operating leverage = Contribution ÷ EBIT = 4,00,000 ÷ 2,00,000 = 2
Financial leverage = 2,00,000 ÷ 1,00,000 = 2
Illustration 3: From the following particulars of PQR Company, calculate operating and fi nancial leverages. The company’s current sales revenue is ` 15,00,000 lakh and sales are expected to increase by 25 per cent. ` 9,00,000 incurred on variable expenses for generating `15 lakh sales revenue. The fi xed cost is ` 2,50,000. The company has ` 20 lakh equity shares capital and ` 20
Unit 5: Capital Structure Decisions
Notes
LOVELY PROFESSIONAL UNIVERSITY 83
lakh, 10 per cent debt capital. Calculate operating leverage and fi nancial leverage. ` 10 equity and 50 per cent tax rate.
Solution:
Calculation of EPS
Particulars Current position Expected change Percentage of change
Sales Revenue 15,00,000 18,75,000 25Less: Variable cost 9,00,000 11,25,000(1)
Contribution 6,00,000 7,50,000Less: Fixed cost 2,50,000 2,50,000
EBIT 3,50,000 5,00,000 42.86Less: Interest 2,00,000 2,00,000
EBT 1,50,000 3,00,000Less: Tax 50% 75,000 1,50,000
EAT 75,000 1,50,000Less: Preference dividend --- ---
Earnings available to shareholder 75,000 1,50,000EPS 0.375 0.75 100%
Working Notes
1. Variable cost in percentage of Sales:
Total variable cost 9,00,000% 100 100 60 per centSales 15,00,000
VC = × = × =
Increase in variable cost = 3,75,000 x 60/100 = 2,25,000
Total variable cost = 9,00,000 + 2,25,000 = ` 11,25,000
2. Percentage change in EBIT:
Increase or decrease in EBIT 1,50,000100 100 42.86 percentBase EBIT 3,50,000
× = × =
3. Interest on Debt:
2020,00,000 4,00,000100
× = `
4. EPS
Earnings available to shareholdersNo. of ordinary shares
EPS =
Current position = 75000 ÷ 2,00,000 = 0.375
Expected change = 1,50,000 ÷ 2,00,000 = 0.75
(a) Operating Leverage = % change in EBITContribution or
EBIT % change in Sales
= 6,00,000 42.86 or 1.7143,50,000 25
=
Basic Financial Management
Notes
84 LOVELY PROFESSIONAL UNIVERSITY
(b) Financial leverage = % change in EPSEBIT or
EBT % change in Sales
= 3,50,000 100 or 2.3331,50,000 42.86
=
Task A fi rm has ` 40,00,000 lakh sales, variable cost is 70 per cent of sales, and fi xed cost is ` 8 lakh and debt of ` 20 lakh at 10 per cent. Calculate operating and fi nancial leverages.
Rajart and Associates: Financial Alternatives
This case provides the opportunity to match fi nancing alternatives with the needs of different companies. It allows the reader to demonstrate a familiarity with different types of securities.
George Thomas was fi nishing some weekend reports on a Friday afternoon in the downtown offi ce of Wishart and Associates, an investment-banking fi rm. Meenda, a partner in the fi rm, had not been in the New York offi ce since Monday. He was on a trip through Pennsylvania, visiting fi ve potential clients, who were considering the fl otation of securities with the assistance of Wishart and Associates. Meenda had called the offi ce on Wednesday and told George’s secretary that he would cable his recommendations on Friday afternoon. George was waiting for the cable.
George knew that Meenda would be recommending different types of securities for each of the fi ve clients to meet their individual needs. He also knew Meenda wanted him to call each of the clients to consider the recommendations over the weekend. George was prepared to make these calls as soon as the cable arrived. At 4:00 p.m. a secretary handed George the following telegramc
George Thomas, Wishart and Associates STOP Taking advantage of offer to go skiing in Poconos STOP Recommendations as follows: (1) common stock, (2 ) preferred stock, (3) debt with warrants, (4) convertible bonds, (5) callable debentures STOP. See you Wednesday STOP Meenda.
As George picked up the phone to make the fi rst call, he suddenly realized that the potential clients were not matched with the investment alternatives. In Meenda’s offi ce, George found folders on each of the fi ve fi rms seeking fi nancing. In the front of each folder were some handwritten notes that Meenda had made on Monday before he left. George read each of the notes in turn.
APT, Inc, needs $8 million now and $4 million in four years. Packaging fi rm with high growth rate in tri-state area. Common stock trades over the counter. Stock is depressed but should rise in year to 18 months. Willing to accept any type of security. Good management. Expects moderate growth. New machinery should increase profi ts substantially. Recently retired $7 million in debt. Has virtually no debt remaining except short-term obligations.
Sandford Enterprises
Needs $16 million. Crusty management. Stock price depressed but expected to improve. Excellent growth and profi ts forecast in the next two year. Low debt-equity ratio, as the
Contd....

Unit 5: Capital Structure Decisions
Notes
LOVELY PROFESSIONAL UNIVERSITY 85
fi rm has record of retiring debt prior to maturity. Retains bulk of earnings and pays low dividends. Management not interested in surrendering voting control to outsiders. Money to be used to fi nance machinery for plumbing supplies.
Sharma Brothers., Inc.
Needs $20 million to expand cabinet and woodworking business. Started as family business but now has 1200 employees, $50 million in sales, and is traded over the counter. Seeks additional shareholder but not willing to stock at discount. Cannot raise more than $12 million with straight debt. Fair management. Good growth prospects. Very good earnings. Should spark investor’s interest. Banks could be willing to lend money for long-term needs.
Sacheetee Energy Systems
The fi rm is well respected by liberal investing community near Boston area. Sound growth company. Stock selling for $16 per share. Management would like to sell common stock at $21 or more willing to use debt to raise $ 28 million, but this is second choice. Financing gimmicks and chance to turn quick profi t on investment would appeal to those likely to invest in this company.
Ranbaxy Industry
Needs $25 million. Manufactures boat canvas covers and needs funds to expand operations. Needs long-term money. Closely held ownership reluctant surrender control. Cannot issue debt without permission of bondholders and First National Bank of Philadelphia. Relatively low debt-equity ratio. Relatively high profi ts. Good prospects for growth. Strong management with minor weaknesses in sales and promotion areas.
As George was looking over the folders, Meenda’s secretary entered the offi ce. George said, “Did Meenda leave any other material here on Monday except for these notes?”.
She responded, “No, that’s it, but I think those notes should be useful. Meenda called early this morning and said that he verifi ed the facts in the folders. He also said that he learned nothing new on the trip and he sort of indicated that, he had wasted his week, except of course, that he was invited to go skiing at the company lodge up there”.
George pondered over the situation. He could always wait until next week, when he could be sure that he had the right recommendations and some of the considerations that outlined each client’s needs and situation. If he could determine which fi rm matched each recommendation, he could still call the fi rms by 6:00 P.M. and meet the original deadline. George decided to return to his offi ce and match each fi rm with the appropriate fi nancing.
Questions
1. Which type of fi nancing is appropriate to each fi rm?
2. What types of securities must be issued by a fi rm which is on the growing stage in order to meet the fi nancial requirements?
5.5 Summary
Organisation requires funds to run and maintain the business. The required funds may be raised from short-term sources or long-term sources or a combination of both the sources of funds, so as to equip itself with an appropriate combination of fi xed assets and current assets. Generally, capital is raised from two prime sources (a) equity and (b) debt. What should be the proportion of equity and debt in the capital structure of a company?
Basic Financial Management
Notes
86 LOVELY PROFESSIONAL UNIVERSITY
Capital structure refers to the mix of long-term sources of funds, such as equity shares capital, reserves and surpluses, debenture, long-term debt from outside sources, and preference share capital.
Capital structure is indicated by the equation: Capital structure = Long-term debt + Preferred stock + Net worth or Capital structure = Total assets – Current liabilities.
Leverage has been defi ned as, the action of a lever and mathematical advantage gained by it. From the fi nancial management point of view, the term leverage is commonly used to describe the fi rm's ability to use fi xed cost assets or sources of funds to magnify the returns to its owners.
There are two types of leverages: (i) operating leverage and (ii) fi nancial leverage.
Operating leverage (OL) refers as the fi rm's ability to use operating costs to magnify the effects of changes in sales on its earnings before interest and taxes.
Financial leverage (FL) is the ability of the fi rm to use fi xed fi nancial charges to magnify the effects of changes in EBIT on the fi rm's earnings per share.
5.6 Keywords
Capital Structure: It is that part of fi nancial structure, which represents long-term sources.
Financial Leverage: Financial leverage (FL) is the ability of the fi rm to use fi xed fi nancial charges to magnify the effects of changes in EBIT on the fi rm’s earnings per share.
Operating Leverage: Operating leverage may be defi ned as the fi rm’s ability to use operating costs to magnify the effects of changes in sales on its earnings before interest and taxes.
5.7 Self Assessment
Fill in the blanks:
1. Capital structure is that part of ........................, which represents long-term sources.
2. The term capital structure refers to the mix of ........................ sources of funds.
3. ........................ is possible only when there is a mix of debt and equity.
4. From the fi nancial management point of view, ........................ is commonly used to describe the fi rm’s ability to use fi xed cost assets or sources of funds to magnify the returns to its owners.
5. ........................ is associated with investment (assets acquisition) activities.
6. Operating leverage may be defi ned as the fi rm’s ability to use ........................ to magnify the effects of changes in sales on its earnings before interest and taxes.
7. ........................ results from the presence of fi xed fi nancial charges in the income statement.
8. Financial leverage associates with ........................ .
9. The issue of debt depends on the future ........................ of the company.
10. Small companies and companies with low credit ratings must rely more on ........................ market
State whether the following statements are true or false:
11. Company issues preference shares or redeemable debentures when it requires fi nance.
12. Trading on equity uses the variable cost sources of fi nance in capital structure of fi rm.
Unit 5: Capital Structure Decisions
Notes
LOVELY PROFESSIONAL UNIVERSITY 87
13. Optimum leverage is that mix of debt & equity which will maximise the market value of the company.
14. Capital structure that allows the existing capital structure to change according to the changing conditions without increasing the costs is called fl exible capital structure.
15. The fi xed charges vary with fi rm’s EBIT.
5.8 Review Questions
1. A fi rm has sales of ` 5 lakh, variable cost ` 3.5 lakh and fi xed cost ` 1 lakh, and debt of ` 2.5 lakh at 10 per cent.
2. The following data is available for X Ltd:
Selling price ` 120 pu; Variable cost ` 70 pu; Total fi xed cost ` 200,000
(a) What is the operating leverage when, X Ltd produces and sells 6000 units,
(b) What is the percentage change that will occurring in the operating profi t (EBIT) of X Ltd, if output increases by 5 per cent
3. Calculate operating and fi nancial leverages under situations A, B and C and Financial plan 1,2, and 3 respectively from the following functions of XYZ Co. Also fi nd out the combination of operating and fi nancial leverage that gives the highest value and least value:
Installed capacity = 12,000 units;
Actual production & sales = 800 units
Selling price = ` 15 p.u;
Variable cost = ` 10 p.u
Fixed Cost = Situation A, ` 1000; Situation B, ` 2000; Situation C, ` 3000
4. Defi ne capital structure? Discuss the important factors that should be considered while determining capital structure.
5. What is operating leverage? How does it help to maximize, revenue of a fi rm?
6. What is trading an equity? How does it maximize the equity earnings?
7. Distinguish between capital structure and fi nancial structure.
8. What basic principles will you advocate in the matter of deciding on a proper constitution of capital structure for a fi rm?
9. Sales ` 1,00,000 units at ` 2 per unit, variable cost `0.70 per unit, fi xed cost `1, 00,000, interest charges ` 3,668. Compute degree of operating leverage, fi nancial leverage, and combined leverage.
10. Distinguish between operating and fi nancial leverage.
Answers: Self Assessment
1. fi nancial structure 2. long-term
3. Optimum capital structure 4. leverage
5. Operating leverage 6. operating costs
7. Financial leverage 8. fi nancing activities
Basic Financial Management
Notes
88 LOVELY PROFESSIONAL UNIVERSITY
9. cash fl ow ability 10. equity capital
11. True 12. False
13. True 14. True
15. False
5.9 Further Readings
Books Chandra, P., Financial Management - Theory and Practice, New Delhi, Tata McGraw Hill Publishing Company Ltd., 2002, p. 3.
Sudhindra Bhat, Financial Management, New Delhi, Excel Books, 2008.
Van Horne, J.C. and Wachowicz, Jr, J.M., Fundamentals of Financial Management, New Delhi, Prentice Hall of India Pvt. Ltd., 1996, p. 2.
Online links http://www.fei.org/
www.scribd.com
www.globusz.com
Unit 6: Capital Structure Theory
Notes
LOVELY PROFESSIONAL UNIVERSITY 89
Unit 6: Capital Structure Theory
CONTENTS
Objectives
Introduction
6.1 Theory of Capital Structure
6.2 Net Income Approach (NI)
6.3 NOI Approach
6.4 Traditional or Intermediate Approach or WACC Approach
6.5 Modigliani Miller Approach (MM)
6.5.1 Proof of MM Argument
6.5.2 Working of the Arbitrage Process
6.6 Optimum Capital Structure
6.6.1 Computation of Optimum Capital Structure
6.6.2 Approaches to Determine Appropriate Capital Structure
6.7 The Trade off Theory: Cost of Financial Distress and Agency Cost
6.8 Summary
6.9 Keywords
6.10 Self Assessment
6.11 Review Questions
6.12 Further Readings
Objectives
After studying this unit, you will be able to:
Discuss theories of capital structure
Describe Optimum capital structure
Introduction
The Capital structure decision is yet another important area under fi nancial management. Capital structure refers to the mix of proportions of a fi rm’s permanent long-term fi nancing represented by debt, preference capital and equity share Capital.
While taking any fi nancial decisions, the fi rm must ensure the maximization of wealth of shareholders. So even the Capital structure decision must be taken in the light of wealth maximization objective. That particular mix of debt and equity which maximizes the value of the fi rm, is known as optimum capital structure.
Basic Financial Management
Notes
90 LOVELY PROFESSIONAL UNIVERSITY
Notes Assumptions of Capital Structure Theories
1. There are only two sources of funds i.e. debt and equity.
2. The total assets of the company are given and do not change.
3. The total fi nancing remains constant. The fi rm can change the degree of leverage, either by selling the shares and retiring debt or by issuing debt and redeeming equity.
4. Operating profi ts (EBIT) are not expected to grow.
5. All the investors are assumed to have the same expectation about the future profi ts.
6. Business risk is constant over time and assumed to be independent of its capital structure and fi nancial risk.
7. Corporate tax does not exit.
8. The company has infi nite life.
9. Dividend payout ratio = 100%.
6.1 Theory of Capital Structure
The long-term source of fi nance, which a company may use for investments, may be broadly classifi ed into 2 types. They are debt capital and equity capital. The fi nancial manager must determine the proportion of debt and equity and fi nancial leverage.
There are 4 major theories explaining the relationship between capital structure, cost of capital and valuation of the fi rm. They are:
1. Net income approach (NI)
2. Net operating income approach ( NOI)
3. Traditional approach
4. Modigliani-Miller approach
6.2 Net Income Approach (NI)
According to this approach, the cost of debt and the cost of equity do not change with a change in the leverage ratio. As a result, the average cost of capital declines as the leverage ratio increases. This is because when the leverage ratio increases, the cost of debt, which is lower than the cost of equity, gets a higher weightage in the calculation of the cost of capital.
This approach has been suggested by David Durand. According to this approach, capital structure decision is relevant to the valuation of the fi rm. According to the theory it is possible to change the cost of capital by changing the debt equity mix. In other words, a change in the capital structure causes a change in the overall of capital as well as the value of the fi rm.
The formula to calculate the average cost of capital is as follows:
Ko = Kd (B/ (B + S)) + Ke (S/(B + S))
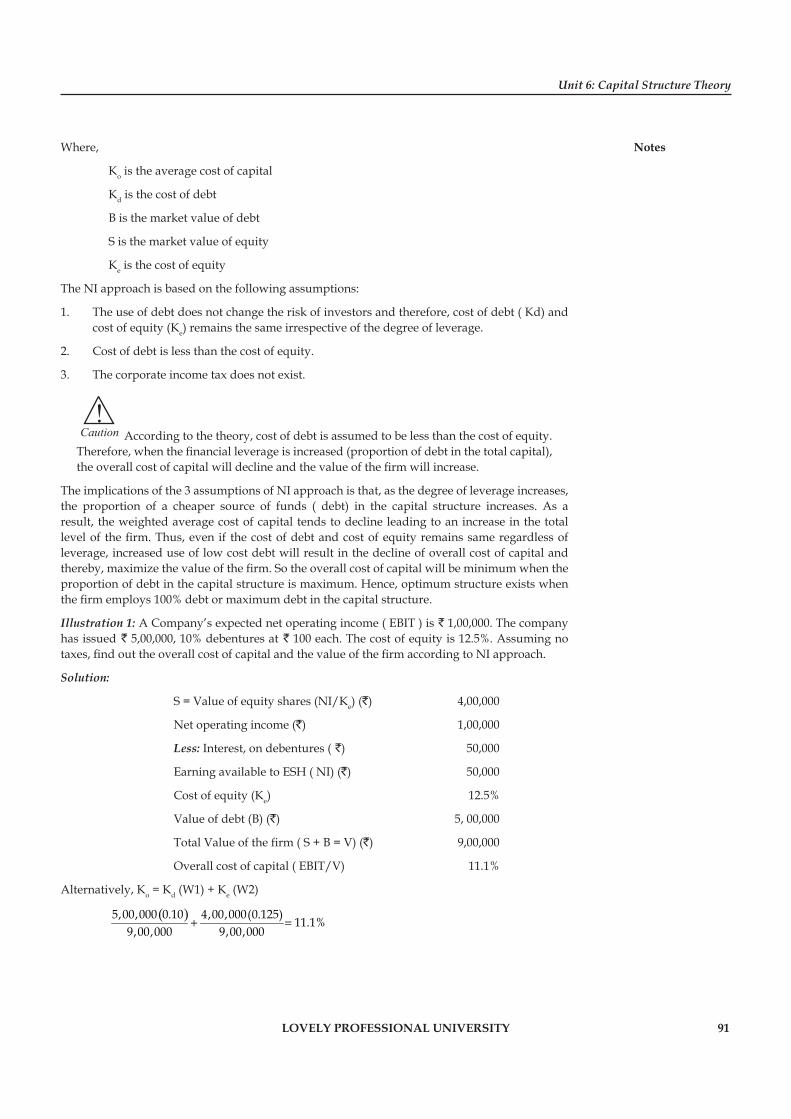
Unit 6: Capital Structure Theory
Notes
LOVELY PROFESSIONAL UNIVERSITY 91
Where,
Ko is the average cost of capital
Kd is the cost of debt
B is the market value of debt
S is the market value of equity
Ke is the cost of equity
The NI approach is based on the following assumptions:
1. The use of debt does not change the risk of investors and therefore, cost of debt ( Kd) and cost of equity (Ke) remains the same irrespective of the degree of leverage.
2. Cost of debt is less than the cost of equity.
3. The corporate income tax does not exist.
!Caution According to the theory, cost of debt is assumed to be less than the cost of equity.
Therefore, when the fi nancial leverage is increased (proportion of debt in the total capital), the overall cost of capital will decline and the value of the fi rm will increase.
The implications of the 3 assumptions of NI approach is that, as the degree of leverage increases, the proportion of a cheaper source of funds ( debt) in the capital structure increases. As a result, the weighted average cost of capital tends to decline leading to an increase in the total level of the fi rm. Thus, even if the cost of debt and cost of equity remains same regardless of leverage, increased use of low cost debt will result in the decline of overall cost of capital and thereby, maximize the value of the fi rm. So the overall cost of capital will be minimum when the proportion of debt in the capital structure is maximum. Hence, optimum structure exists when the fi rm employs 100% debt or maximum debt in the capital structure.
Illustration 1: A Company’s expected net operating income ( EBIT ) is ` 1,00,000. The company has issued ` 5,00,000, 10% debentures at ` 100 each. The cost of equity is 12.5%. Assuming no taxes, fi nd out the overall cost of capital and the value of the fi rm according to NI approach.
Solution:
S = Value of equity shares (NI/Ke) (`) 4,00,000
Net operating income (`) 1,00,000
Less: Interest, on debentures ( `) 50,000
Earning available to ESH ( NI) (`) 50,000
Cost of equity (Ke) 12.5%
Value of debt (B) (`) 5, 00,000
Total Value of the fi rm ( S + B = V) (`) 9,00,000
Overall cost of capital ( EBIT/V) 11.1%
Alternatively, Ko = Kd (W1) + Ke (W2)
( )5,00,000 0.10 4,00,000(0.125) 11.1%9,00,000 9,00,000
+ =
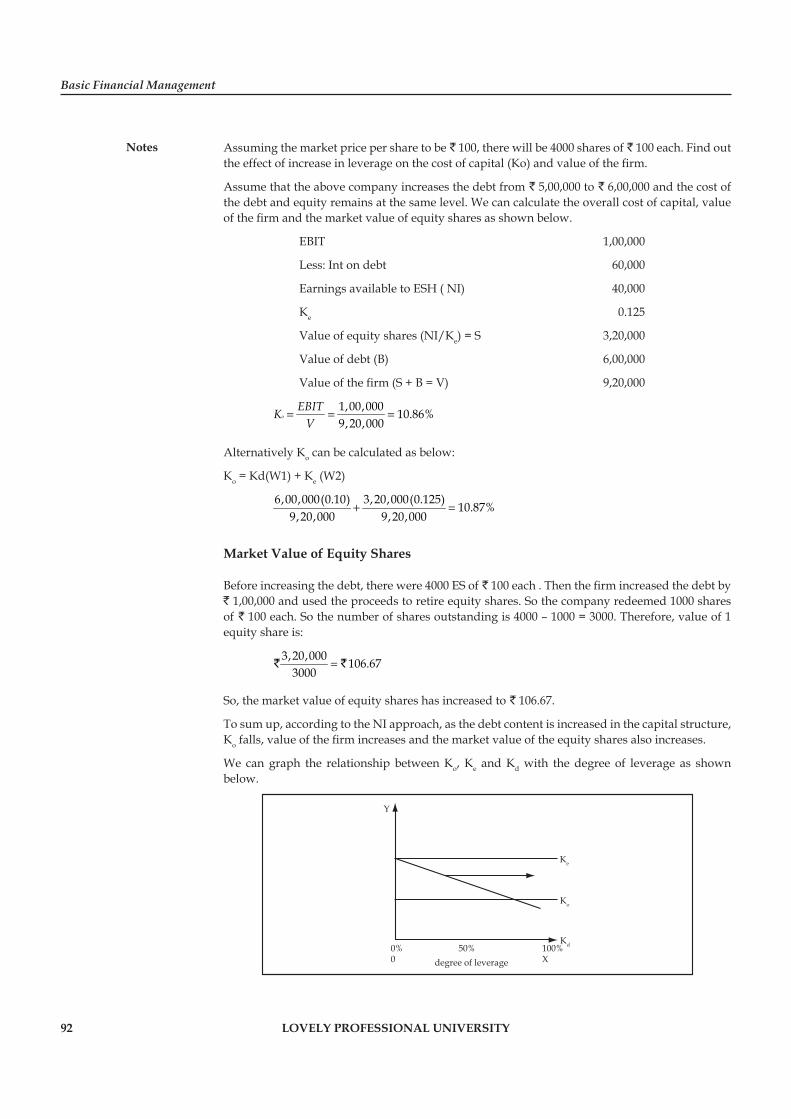
Basic Financial Management
Notes
92 LOVELY PROFESSIONAL UNIVERSITY
Assuming the market price per share to be ` 100, there will be 4000 shares of ` 100 each. Find out the effect of increase in leverage on the cost of capital (Ko) and value of the fi rm.
Assume that the above company increases the debt from ` 5,00,000 to ` 6,00,000 and the cost of the debt and equity remains at the same level. We can calculate the overall cost of capital, value of the fi rm and the market value of equity shares as shown below.
EBIT 1,00,000
Less: Int on debt 60,000
Earnings available to ESH ( NI) 40,000
Ke 0.125
Value of equity shares (NI/Ke) = S 3,20,000
Value of debt (B) 6,00,000
Value of the fi rm (S + B = V) 9,20,000
1,00,000 10.86%9,20,000
oEBITK
V= = =
Alternatively Ko can be calculated as below:
Ko = Kd(W1) + Ke (W2)
6,00,000(0.10) 3,20,000(0.125) 10.87%9,20,000 9,20,000
+ =
Market Value of Equity Shares
Before increasing the debt, there were 4000 ES of ` 100 each . Then the fi rm increased the debt by ` 1,00,000 and used the proceeds to retire equity shares. So the company redeemed 1000 shares of ` 100 each. So the number of shares outstanding is 4000 – 1000 = 3000. Therefore, value of 1 equity share is:
3,20,000 106.673000
=` `
So, the market value of equity shares has increased to ` 106.67.
To sum up, according to the NI approach, as the debt content is increased in the capital structure, Ko falls, value of the fi rm increases and the market value of the equity shares also increases.
We can graph the relationship between Ko, Ke and Kd with the degree of leverage as shown below.
Y
Ke
Kd
Ko
0%0
50% 100%Xdegree of leverage
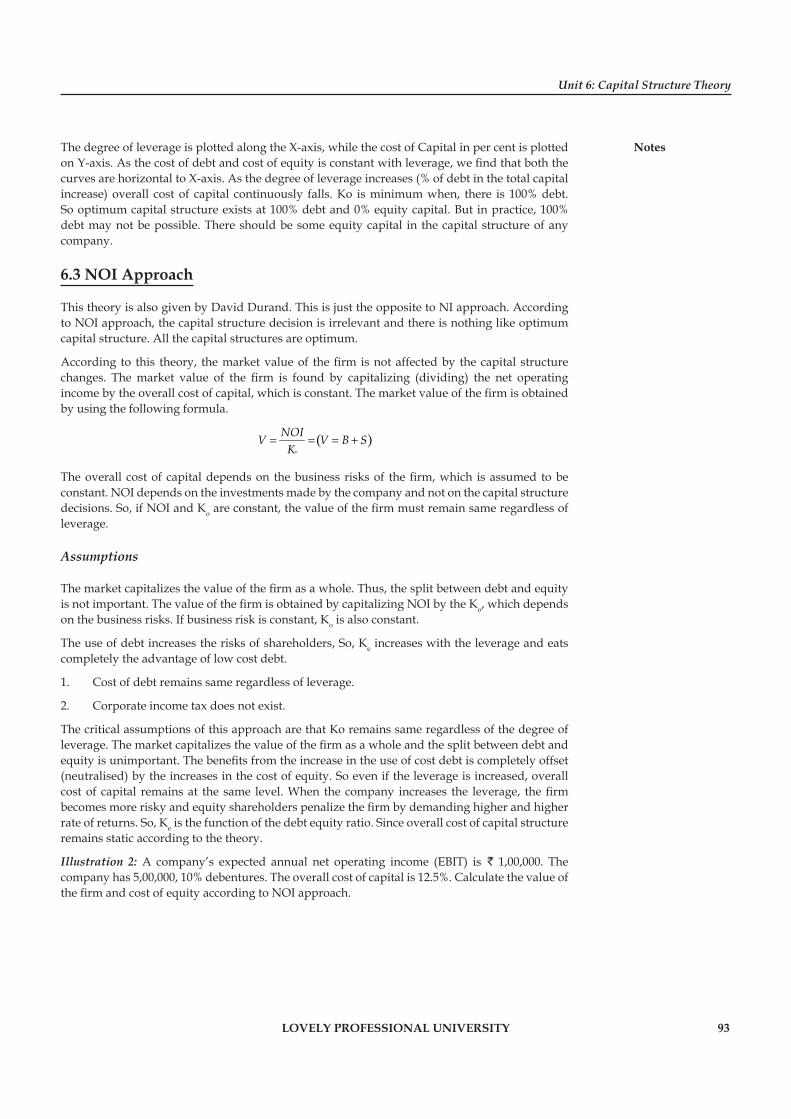
Unit 6: Capital Structure Theory
Notes
LOVELY PROFESSIONAL UNIVERSITY 93
The degree of leverage is plotted along the X-axis, while the cost of Capital in per cent is plotted on Y-axis. As the cost of debt and cost of equity is constant with leverage, we fi nd that both the curves are horizontal to X-axis. As the degree of leverage increases (% of debt in the total capital increase) overall cost of capital continuously falls. Ko is minimum when, there is 100% debt. So optimum capital structure exists at 100% debt and 0% equity capital. But in practice, 100% debt may not be possible. There should be some equity capital in the capital structure of any company.
6.3 NOI Approach
This theory is also given by David Durand. This is just the opposite to NI approach. According to NOI approach, the capital structure decision is irrelevant and there is nothing like optimum capital structure. All the capital structures are optimum.
According to this theory, the market value of the fi rm is not affected by the capital structure changes. The market value of the fi rm is found by capitalizing (dividing) the net operating income by the overall cost of capital, which is constant. The market value of the fi rm is obtained by using the following formula.
( )o
NOIV V B SK
= = = +
The overall cost of capital depends on the business risks of the fi rm, which is assumed to be constant. NOI depends on the investments made by the company and not on the capital structure decisions. So, if NOI and Ko are constant, the value of the fi rm must remain same regardless of leverage.
Assumptions
The market capitalizes the value of the fi rm as a whole. Thus, the split between debt and equity is not important. The value of the fi rm is obtained by capitalizing NOI by the Ko, which depends on the business risks. If business risk is constant, Ko is also constant.
The use of debt increases the risks of shareholders, So, Ke increases with the leverage and eats completely the advantage of low cost debt.
1. Cost of debt remains same regardless of leverage.
2. Corporate income tax does not exist.
The critical assumptions of this approach are that Ko remains same regardless of the degree of leverage. The market capitalizes the value of the fi rm as a whole and the split between debt and equity is unimportant. The benefi ts from the increase in the use of cost debt is completely offset (neutralised) by the increases in the cost of equity. So even if the leverage is increased, overall cost of capital remains at the same level. When the company increases the leverage, the fi rm becomes more risky and equity shareholders penalize the fi rm by demanding higher and higher rate of returns. So, Ke is the function of the debt equity ratio. Since overall cost of capital structure remains static according to the theory.
Illustration 2: A company’s expected annual net operating income (EBIT) is ` 1,00,000. The company has 5,00,000, 10% debentures. The overall cost of capital is 12.5%. Calculate the value of the fi rm and cost of equity according to NOI approach.
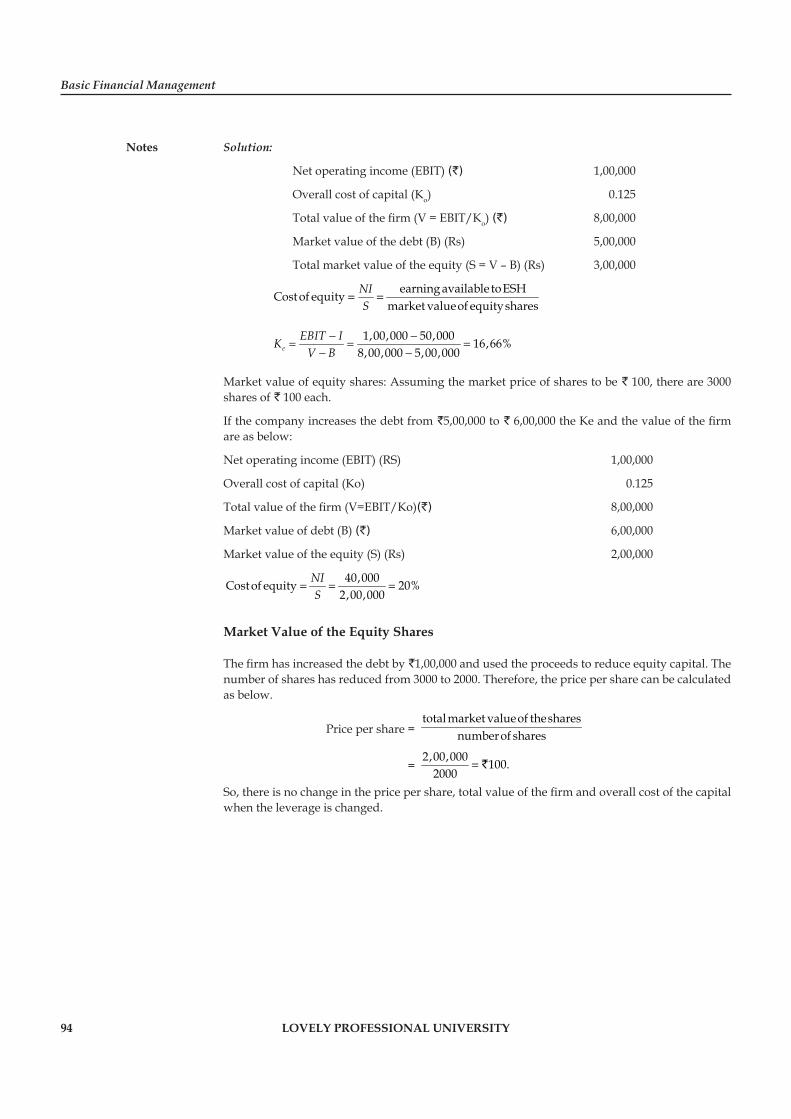
Basic Financial Management
Notes
94 LOVELY PROFESSIONAL UNIVERSITY
Solution:
Net operating income (EBIT) (`) 1,00,000
Overall cost of capital (Ko) 0.125
Total value of the fi rm (V = EBIT/Ko) (`) 8,00,000
Market value of the debt (B) (Rs) 5,00,000
Total market value of the equity (S = V – B) (Rs) 3,00,000
earning available toESHCostof equitymarket valueof equityshares
NIS
= =
1,00,000 50,000 16,66%
8,00,000 5,00,000eEBIT IK
V B− −
= = =− −
Market value of equity shares: Assuming the market price of shares to be ` 100, there are 3000 shares of ` 100 each.
If the company increases the debt from `5,00,000 to ` 6,00,000 the Ke and the value of the fi rm are as below:
Net operating income (EBIT) (RS) 1,00,000
Overall cost of capital (Ko) 0.125
Total value of the fi rm (V=EBIT/Ko)(`) 8,00,000
Market value of debt (B) (`) 6,00,000
Market value of the equity (S) (Rs) 2,00,000
40,000Costof equity 20%2,00,000
NIS
= = =
Market Value of the Equity Shares
The fi rm has increased the debt by `1,00,000 and used the proceeds to reduce equity capital. The number of shares has reduced from 3000 to 2000. Therefore, the price per share can be calculated as below.
Price per share = total market valueof theshares
numberof shares
= 2,00,000 100.
2000= `
So, there is no change in the price per share, total value of the fi rm and overall cost of the capital when the leverage is changed.
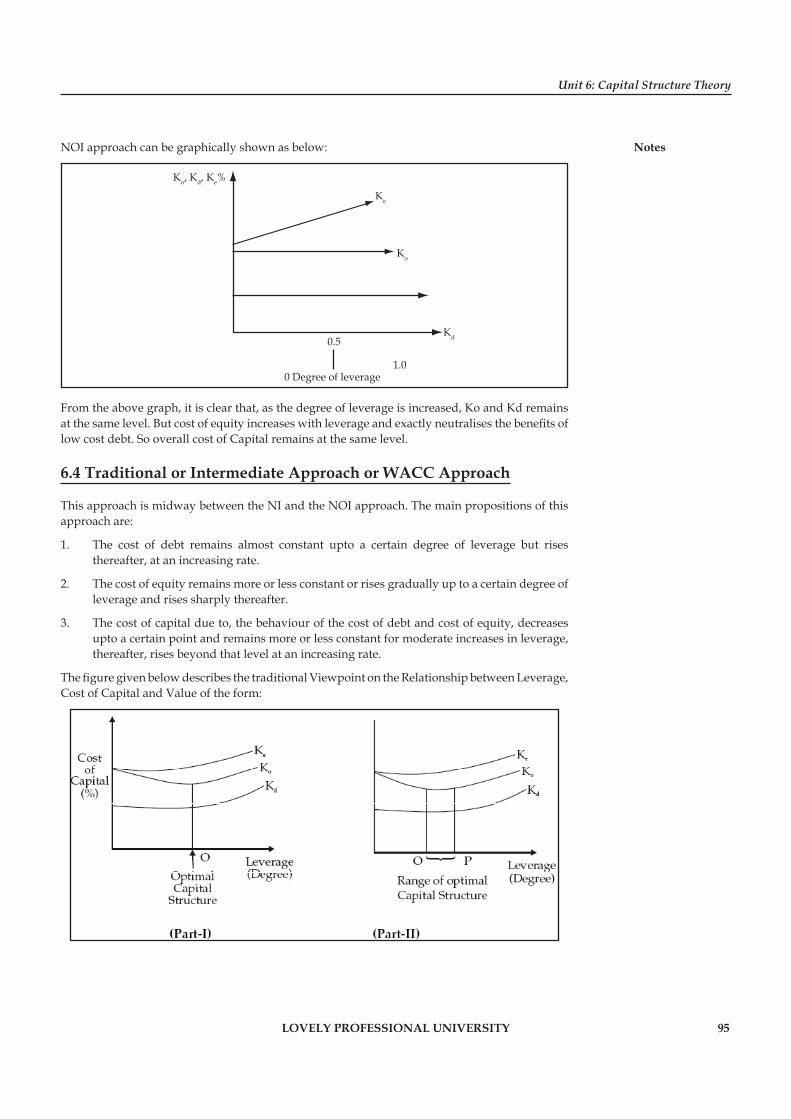
Unit 6: Capital Structure Theory
Notes
LOVELY PROFESSIONAL UNIVERSITY 95
NOI approach can be graphically shown as below:
Kd
Ko
Ke
Ko, Kd, Ke%
0 Degree of leverage
0.5
1.0
From the above graph, it is clear that, as the degree of leverage is increased, Ko and Kd remains at the same level. But cost of equity increases with leverage and exactly neutralises the benefi ts of low cost debt. So overall cost of Capital remains at the same level.
6.4 Traditional or Intermediate Approach or WACC Approach
This approach is midway between the NI and the NOI approach. The main propositions of this approach are:
1. The cost of debt remains almost constant upto a certain degree of leverage but rises thereafter, at an increasing rate.
2. The cost of equity remains more or less constant or rises gradually up to a certain degree of leverage and rises sharply thereafter.
3. The cost of capital due to, the behaviour of the cost of debt and cost of equity, decreases upto a certain point and remains more or less constant for moderate increases in leverage, thereafter, rises beyond that level at an increasing rate.
The fi gure given below describes the traditional Viewpoint on the Relationship between Leverage, Cost of Capital and Value of the form:
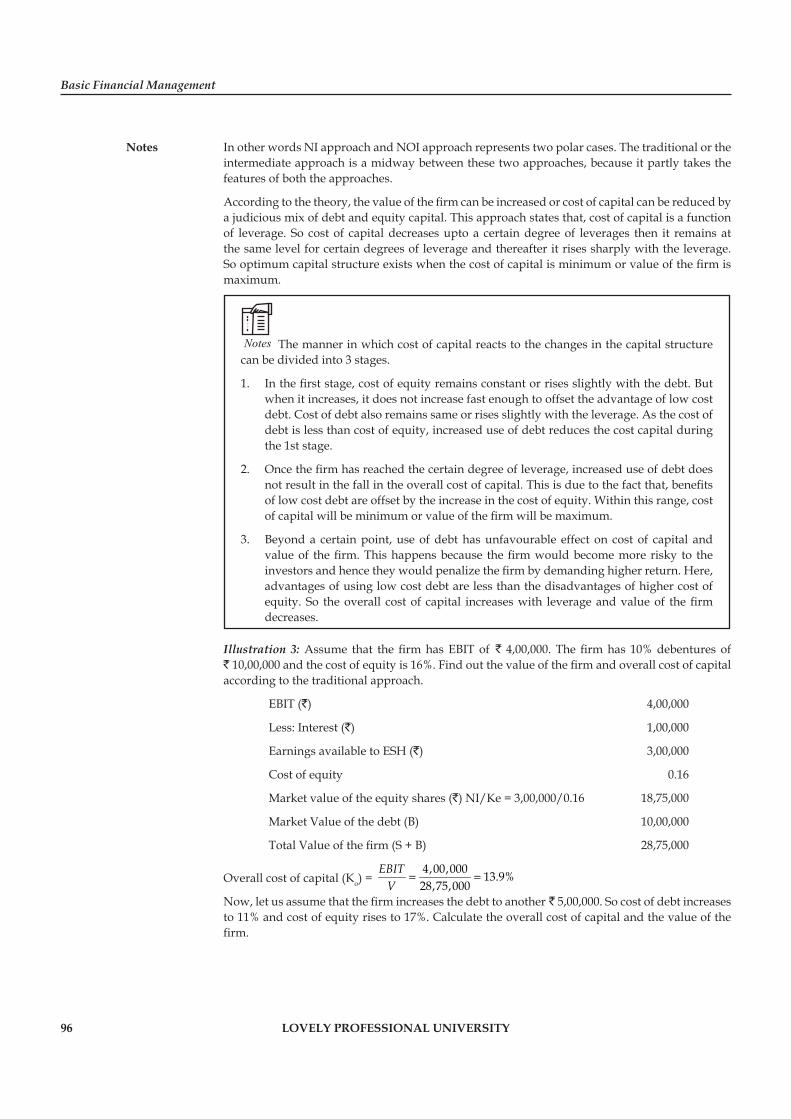
Basic Financial Management
Notes
96 LOVELY PROFESSIONAL UNIVERSITY
In other words NI approach and NOI approach represents two polar cases. The traditional or the intermediate approach is a midway between these two approaches, because it partly takes the features of both the approaches.
According to the theory, the value of the fi rm can be increased or cost of capital can be reduced by a judicious mix of debt and equity capital. This approach states that, cost of capital is a function of leverage. So cost of capital decreases upto a certain degree of leverages then it remains at the same level for certain degrees of leverage and thereafter it rises sharply with the leverage. So optimum capital structure exists when the cost of capital is minimum or value of the fi rm is maximum.
Notes The manner in which cost of capital reacts to the changes in the capital structure can be divided into 3 stages.
1. In the fi rst stage, cost of equity remains constant or rises slightly with the debt. But when it increases, it does not increase fast enough to offset the advantage of low cost debt. Cost of debt also remains same or rises slightly with the leverage. As the cost of debt is less than cost of equity, increased use of debt reduces the cost capital during the 1st stage.
2. Once the fi rm has reached the certain degree of leverage, increased use of debt does not result in the fall in the overall cost of capital. This is due to the fact that, benefi ts of low cost debt are offset by the increase in the cost of equity. Within this range, cost of capital will be minimum or value of the fi rm will be maximum.
3. Beyond a certain point, use of debt has unfavourable effect on cost of capital and value of the fi rm. This happens because the fi rm would become more risky to the investors and hence they would penalize the fi rm by demanding higher return. Here, advantages of using low cost debt are less than the disadvantages of higher cost of equity. So the overall cost of capital increases with leverage and value of the fi rm decreases.
Illustration 3: Assume that the fi rm has EBIT of ` 4,00,000. The fi rm has 10% debentures of ` 10,00,000 and the cost of equity is 16%. Find out the value of the fi rm and overall cost of capital according to the traditional approach.
EBIT (`) 4,00,000
Less: Interest (`) 1,00,000
Earnings available to ESH (`) 3,00,000
Cost of equity 0.16
Market value of the equity shares (`) NI/Ke = 3,00,000/0.16 18,75,000
Market Value of the debt (B) 10,00,000
Total Value of the fi rm (S + B) 28,75,000
Overall cost of capital (Ko) = 4,00,000 13.9%28,75,000
EBITV
= =
Now, let us assume that the fi rm increases the debt to another ` 5,00,000. So cost of debt increases to 11% and cost of equity rises to 17%. Calculate the overall cost of capital and the value of the fi rm.
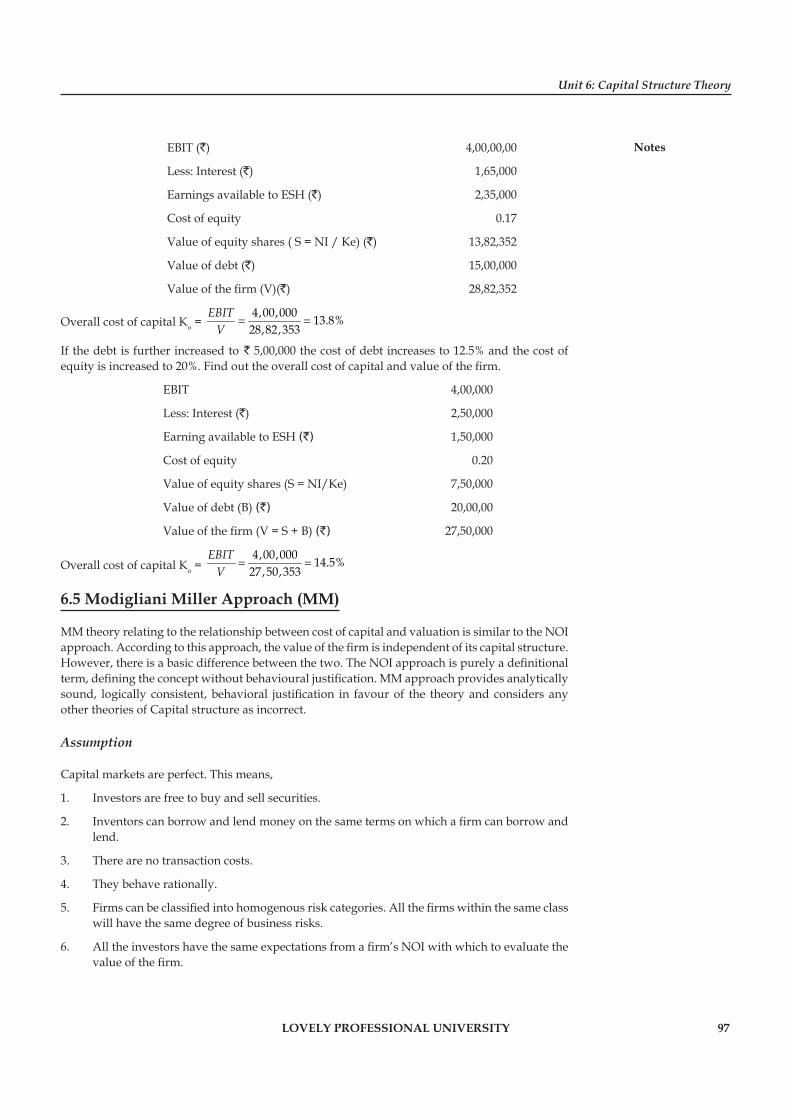
Unit 6: Capital Structure Theory
Notes
LOVELY PROFESSIONAL UNIVERSITY 97
EBIT (`) 4,00,00,00
Less: Interest (`) 1,65,000
Earnings available to ESH (`) 2,35,000
Cost of equity 0.17
Value of equity shares ( S = NI / Ke) (`) 13,82,352
Value of debt (`) 15,00,000
Value of the fi rm (V)(`) 28,82,352
Overall cost of capital Ko = 4,00,000 13.8%
28,82,353EBIT
V= =
If the debt is further increased to ` 5,00,000 the cost of debt increases to 12.5% and the cost of equity is increased to 20%. Find out the overall cost of capital and value of the fi rm.
EBIT 4,00,000
Less: Interest (`) 2,50,000
Earning available to ESH (`) 1,50,000
Cost of equity 0.20
Value of equity shares (S = NI/Ke) 7,50,000
Value of debt (B) (`) 20,00,00
Value of the fi rm (V = S + B) (`) 27,50,000
Overall cost of capital Ko = 4,00,000 14.5%
27,50,353EBIT
V= =
6.5 Modigliani Miller Approach (MM)
MM theory relating to the relationship between cost of capital and valuation is similar to the NOI approach. According to this approach, the value of the fi rm is independent of its capital structure. However, there is a basic difference between the two. The NOI approach is purely a defi nitional term, defi ning the concept without behavioural justifi cation. MM approach provides analytically sound, logically consistent, behavioral justifi cation in favour of the theory and considers any other theories of Capital structure as incorrect.
Assumption
Capital markets are perfect. This means,
1. Investors are free to buy and sell securities.
2. Inventors can borrow and lend money on the same terms on which a fi rm can borrow and lend.
3. There are no transaction costs.
4. They behave rationally.
5. Firms can be classifi ed into homogenous risk categories. All the fi rms within the same class will have the same degree of business risks.
6. All the investors have the same expectations from a fi rm’s NOI with which to evaluate the value of the fi rm.
Basic Financial Management
Notes
98 LOVELY PROFESSIONAL UNIVERSITY
7. Dividends Payout ratio is 100% and there are no retained earnings.
8. There are no corporate income taxes. This assumption is removed later.
!Caution There are three basic propositions of MM approach:
1. The overall cost of capital (KO) and the value of the fi rm (V) are independent of leverage. The Ko and V are constant for all the degree of leverage. The total value of the fi rm is obtained by capitalizing the EBIT at a discount rate appropriate for its risks class.
2. Cost of equity (Ke) is equal to the capitalization rate of a pure equity stream plus a premium for fi nancial risk. The fi nancial risks increases with the leverage and therefore, Ke increases in a manner to offset exactly the benefi t from the use of low cost debt.
Ke = Ko + (Ko – Kd) B/S.
3. The cut-off rate for investment purposes is completely independent of the way in which an investment is fi nanced. This is true because cost of capital remains same regardless of the degree of leverage. So both, investment decision and fi nancing decision are independent.
6.5.1 Proof of MM Argument
The value of a fi rm depends on its profi tability and risks. It is in variant with respect to relative changes in the fi rm’s capitalization. Similarly, according to the theory, cost of capital and market value of the fi rm must be same regardless of the degree of leverage.
?Did u know? What is Arbitrage?
The term arbitrage refers to the act of buying a security in the market, where the price is less and simultaneously selling it in another market where the price is more, to take advantage of the difference in price prevailing in two different markets.
The operational justifi cation for the MM hypothesis is the “Arbitrage Argument”. The term arbitrage refers to the act of buying a security in the market, where the price is less and simultaneously selling it in another market where the price is more, to take advantage of the difference in price prevailing in two different markets.
Suppose two identical fi rms, except for their capital structures, have different market values.
In this situation, arbitrage (or switching) will take place to enable investors to engage in the personal or homemade leverage as against the corporate leverage, to restore equilibrium in the market. On the basis of the arbitrage process, MM conclude that the market value of a fi rm is not affected by leverage. Thus, the fi nancing (or capital structure) decision is irrelevant. It does not help in creating any wealth for shareholders. Hence one capital structure is as much desirable (or undesirable) as the other.
Arbitrage process helps to bring equilibrium in the market. Because of arbitrage, a security cannot be sold at different prices in different markets. MM approach illustrates the arbitrage process with reference to valuation in terms of two fi rms, which are exactly similar in all aspects with respect to leverage, so that one of them has debt in the capital structure while other does
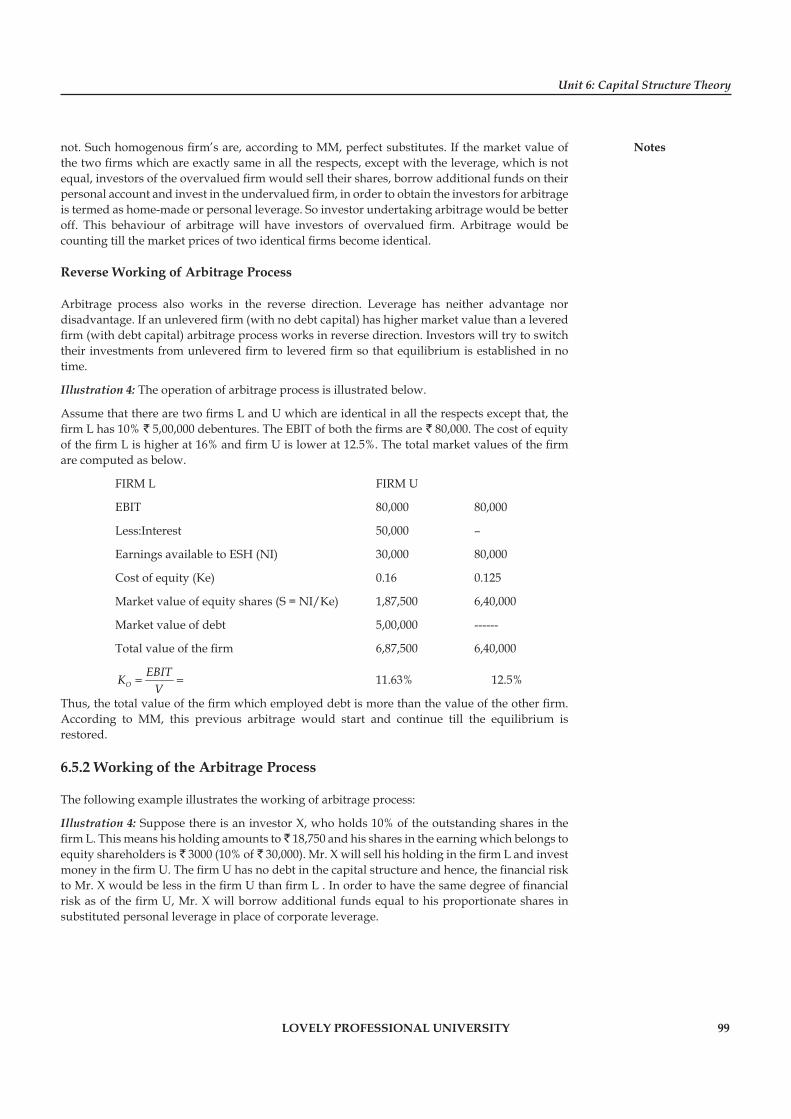
Unit 6: Capital Structure Theory
Notes
LOVELY PROFESSIONAL UNIVERSITY 99
not. Such homogenous fi rm’s are, according to MM, perfect substitutes. If the market value of the two fi rms which are exactly same in all the respects, except with the leverage, which is not equal, investors of the overvalued fi rm would sell their shares, borrow additional funds on their personal account and invest in the undervalued fi rm, in order to obtain the investors for arbitrage is termed as home-made or personal leverage. So investor undertaking arbitrage would be better off. This behaviour of arbitrage will have investors of overvalued fi rm. Arbitrage would be counting till the market prices of two identical fi rms become identical.
Reverse Working of Arbitrage Process
Arbitrage process also works in the reverse direction. Leverage has neither advantage nor disadvantage. If an unlevered fi rm (with no debt capital) has higher market value than a levered fi rm (with debt capital) arbitrage process works in reverse direction. Investors will try to switch their investments from unlevered fi rm to levered fi rm so that equilibrium is established in no time.
Illustration 4: The operation of arbitrage process is illustrated below.
Assume that there are two fi rms L and U which are identical in all the respects except that, the fi rm L has 10% ` 5,00,000 debentures. The EBIT of both the fi rms are ` 80,000. The cost of equity of the fi rm L is higher at 16% and fi rm U is lower at 12.5%. The total market values of the fi rm are computed as below.
FIRM L FIRM U
EBIT 80,000 80,000
Less:Interest 50,000 –
Earnings available to ESH (NI) 30,000 80,000
Cost of equity (Ke) 0.16 0.125
Market value of equity shares (S = NI/Ke) 1,87,500 6,40,000
Market value of debt 5,00,000 ------
Total value of the fi rm 6,87,500 6,40,000
OEBITK
V= = 11.63% 12.5%
Thus, the total value of the fi rm which employed debt is more than the value of the other fi rm. According to MM, this previous arbitrage would start and continue till the equilibrium is restored.
6.5.2 Working of the Arbitrage Process
The following example illustrates the working of arbitrage process:
Illustration 4: Suppose there is an investor X, who holds 10% of the outstanding shares in the fi rm L. This means his holding amounts to ̀ 18,750 and his shares in the earning which belongs to equity shareholders is ` 3000 (10% of ` 30,000). Mr. X will sell his holding in the fi rm L and invest money in the fi rm U. The fi rm U has no debt in the capital structure and hence, the fi nancial risk to Mr. X would be less in the fi rm U than fi rm L . In order to have the same degree of fi nancial risk as of the fi rm U, Mr. X will borrow additional funds equal to his proportionate shares in substituted personal leverage in place of corporate leverage.
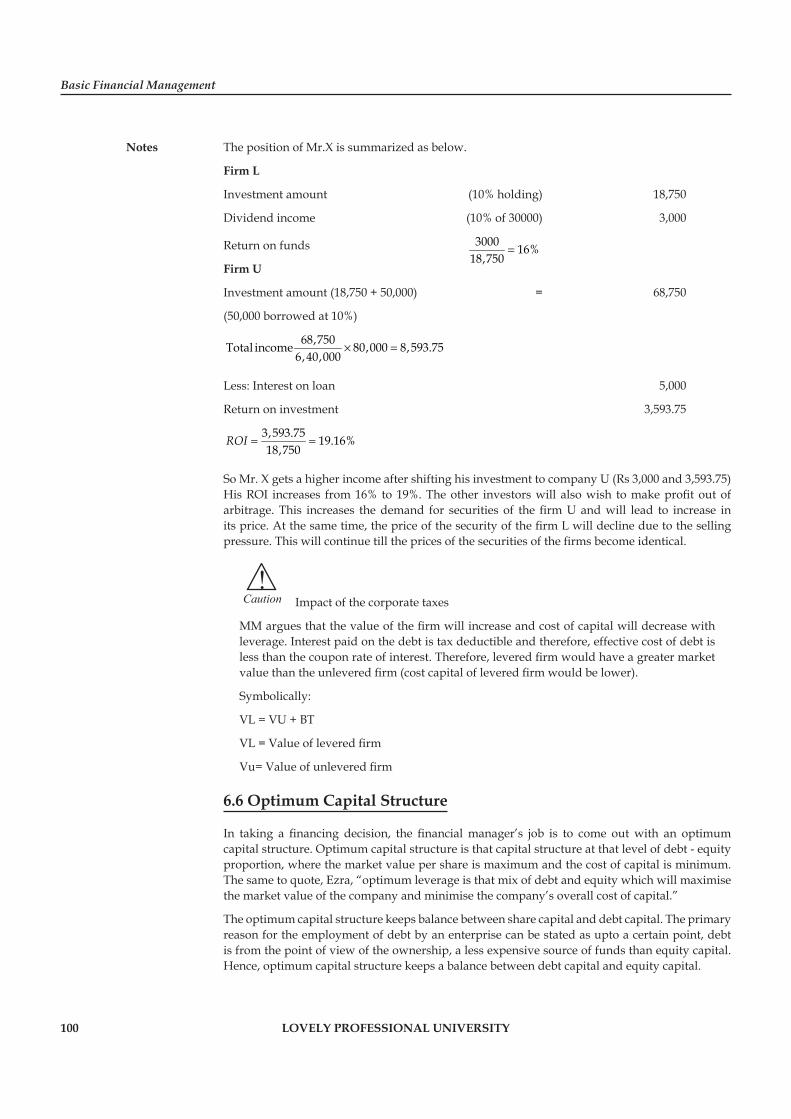
Basic Financial Management
Notes
100 LOVELY PROFESSIONAL UNIVERSITY
The position of Mr.X is summarized as below.
Firm L
Investment amount (10% holding) 18,750
Dividend income (10% of 30000) 3,000
Return on funds 3000 16%18,750
=Firm U
Investment amount (18,750 + 50,000) = 68,750
(50,000 borrowed at 10%)
68,750Total income 80,000 8,593.756,40,000
× =
Less: Interest on loan 5,000
Return on investment 3,593.75
3,593.75 19.16%18,750
ROI = =
So Mr. X gets a higher income after shifting his investment to company U (Rs 3,000 and 3,593.75) His ROI increases from 16% to 19%. The other investors will also wish to make profi t out of arbitrage. This increases the demand for securities of the fi rm U and will lead to increase in its price. At the same time, the price of the security of the fi rm L will decline due to the selling pressure. This will continue till the prices of the securities of the fi rms become identical.
!Caution Impact of the corporate taxes
MM argues that the value of the fi rm will increase and cost of capital will decrease with leverage. Interest paid on the debt is tax deductible and therefore, effective cost of debt is less than the coupon rate of interest. Therefore, levered fi rm would have a greater market value than the unlevered fi rm (cost capital of levered fi rm would be lower).
Symbolically:
VL = VU + BT
VL = Value of levered fi rm
Vu= Value of unlevered fi rm
6.6 Optimum Capital Structure
In taking a fi nancing decision, the fi nancial manager’s job is to come out with an optimum capital structure. Optimum capital structure is that capital structure at that level of debt - equity proportion, where the market value per share is maximum and the cost of capital is minimum. The same to quote, Ezra, “optimum leverage is that mix of debt and equity which will maximise the market value of the company and minimise the company’s overall cost of capital.”
The optimum capital structure keeps balance between share capital and debt capital. The primary reason for the employment of debt by an enterprise can be stated as upto a certain point, debt is from the point of view of the ownership, a less expensive source of funds than equity capital. Hence, optimum capital structure keeps a balance between debt capital and equity capital.
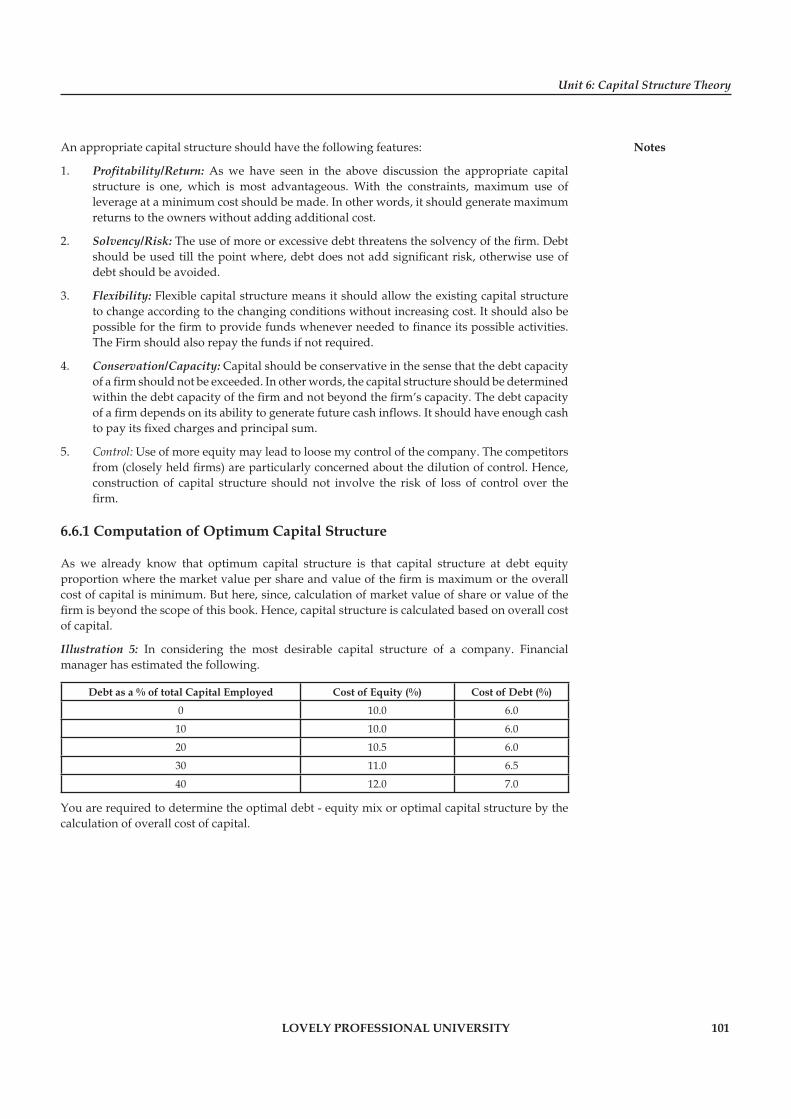
Unit 6: Capital Structure Theory
Notes
LOVELY PROFESSIONAL UNIVERSITY 101
An appropriate capital structure should have the following features:
1. Profitability/Return: As we have seen in the above discussion the appropriate capital structure is one, which is most advantageous. With the constraints, maximum use of leverage at a minimum cost should be made. In other words, it should generate maximum returns to the owners without adding additional cost.
2. Solvency/Risk: The use of more or excessive debt threatens the solvency of the firm. Debt should be used till the point where, debt does not add significant risk, otherwise use of debt should be avoided.
3. Flexibility: Flexible capital structure means it should allow the existing capital structure to change according to the changing conditions without increasing cost. It should also be possible for the firm to provide funds whenever needed to finance its possible activities. The Firm should also repay the funds if not required.
4. Conservation/Capacity: Capital should be conservative in the sense that the debt capacity of a firm should not be exceeded. In other words, the capital structure should be determined within the debt capacity of the firm and not beyond the firm’s capacity. The debt capacity of a firm depends on its ability to generate future cash inflows. It should have enough cash to pay its fixed charges and principal sum.
5. Control: Use of more equity may lead to loose my control of the company. The competitors from (closely held fi rms) are particularly concerned about the dilution of control. Hence, construction of capital structure should not involve the risk of loss of control over the fi rm.
6.6.1 Computation of Optimum Capital Structure
As we already know that optimum capital structure is that capital structure at debt equity proportion where the market value per share and value of the fi rm is maximum or the overall cost of capital is minimum. But here, since, calculation of market value of share or value of the fi rm is beyond the scope of this book. Hence, capital structure is calculated based on overall cost of capital.
Illustration 5: In considering the most desirable capital structure of a company. Financial manager has estimated the following.
Debt as a % of total Capital Employed Cost of Equity (%) Cost of Debt (%)
0 10.0 6.0
10 10.0 6.0
20 10.5 6.0
30 11.0 6.5
40 12.0 7.0
You are required to determine the optimal debt - equity mix or optimal capital structure by the calculation of overall cost of capital.
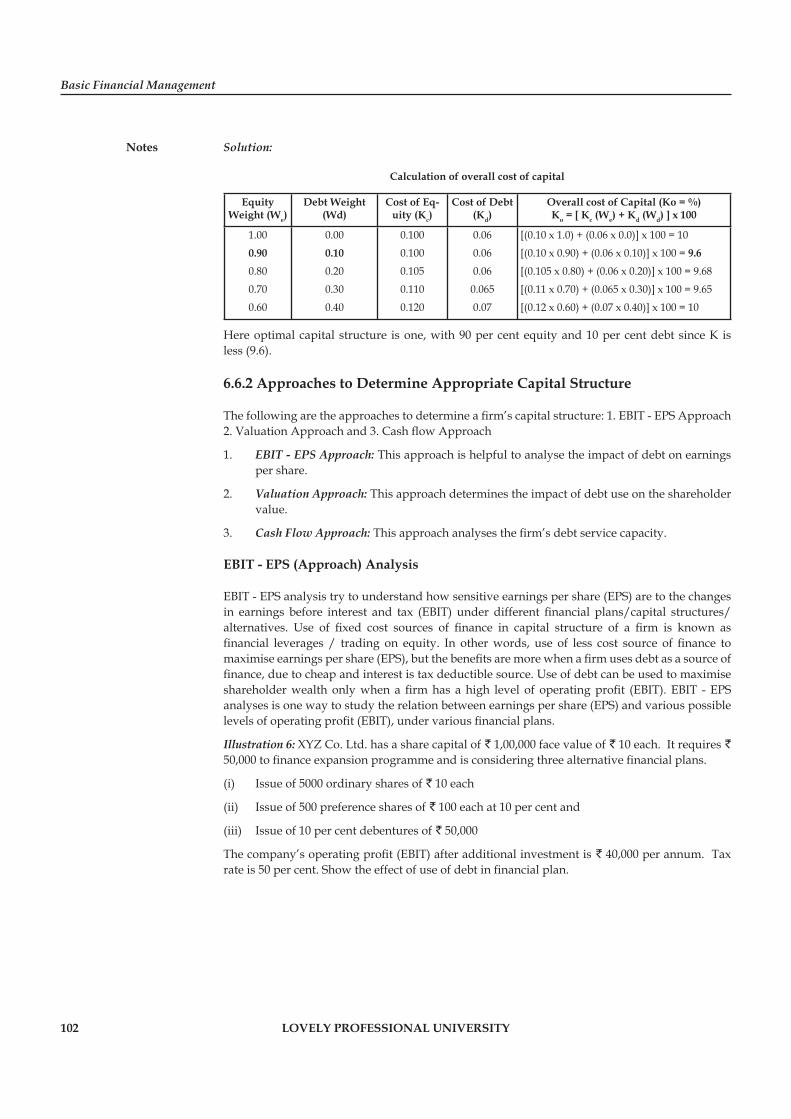
Basic Financial Management
Notes
102 LOVELY PROFESSIONAL UNIVERSITY
Solution:
Calculation of overall cost of capital
Equity Weight (We)
Debt Weight (Wd)
Cost of Eq-uity (Kc)
Cost of Debt (Kd)
Overall cost of Capital (Ko = %) Ko = [ Kc (We) + Kd (Wd) ] x 100
1.00
0.90
0.80
0.70
0.60
0.00
0.10
0.20
0.30
0.40
0.100
0.100
0.105
0.110
0.120
0.06
0.06
0.06
0.065
0.07
[(0.10 x 1.0) + (0.06 x 0.0)] x 100 = 10
[(0.10 x 0.90) + (0.06 x 0.10)] x 100 = 9.6
[(0.105 x 0.80) + (0.06 x 0.20)] x 100 = 9.68
[(0.11 x 0.70) + (0.065 x 0.30)] x 100 = 9.65
[(0.12 x 0.60) + (0.07 x 0.40)] x 100 = 10
Here optimal capital structure is one, with 90 per cent equity and 10 per cent debt since K is less (9.6).
6.6.2 Approaches to Determine Appropriate Capital Structure
The following are the approaches to determine a fi rm’s capital structure: 1. EBIT - EPS Approach 2. Valuation Approach and 3. Cash fl ow Approach
1. EBIT - EPS Approach: This approach is helpful to analyse the impact of debt on earnings per share.
2. Valuation Approach: This approach determines the impact of debt use on the shareholder value.
3. Cash Flow Approach: This approach analyses the fi rm’s debt service capacity.
EBIT - EPS (Approach) Analysis
EBIT - EPS analysis try to understand how sensitive earnings per share (EPS) are to the changes in earnings before interest and tax (EBIT) under different fi nancial plans/capital structures/alternatives. Use of fi xed cost sources of fi nance in capital structure of a fi rm is known as fi nancial leverages / trading on equity. In other words, use of less cost source of fi nance to maximise earnings per share (EPS), but the benefi ts are more when a fi rm uses debt as a source of fi nance, due to cheap and interest is tax deductible source. Use of debt can be used to maximise shareholder wealth only when a fi rm has a high level of operating profi t (EBIT). EBIT - EPS analyses is one way to study the relation between earnings per share (EPS) and various possible levels of operating profi t (EBIT), under various fi nancial plans.
Illustration 6: XYZ Co. Ltd. has a share capital of ` 1,00,000 face value of ` 10 each. It requires ` 50,000 to fi nance expansion programme and is considering three alternative fi nancial plans.
(i) Issue of 5000 ordinary shares of ` 10 each
(ii) Issue of 500 preference shares of ` 100 each at 10 per cent and
(iii) Issue of 10 per cent debentures of ` 50,000
The company’s operating profi t (EBIT) after additional investment is ` 40,000 per annum. Tax rate is 50 per cent. Show the effect of use of debt in fi nancial plan.
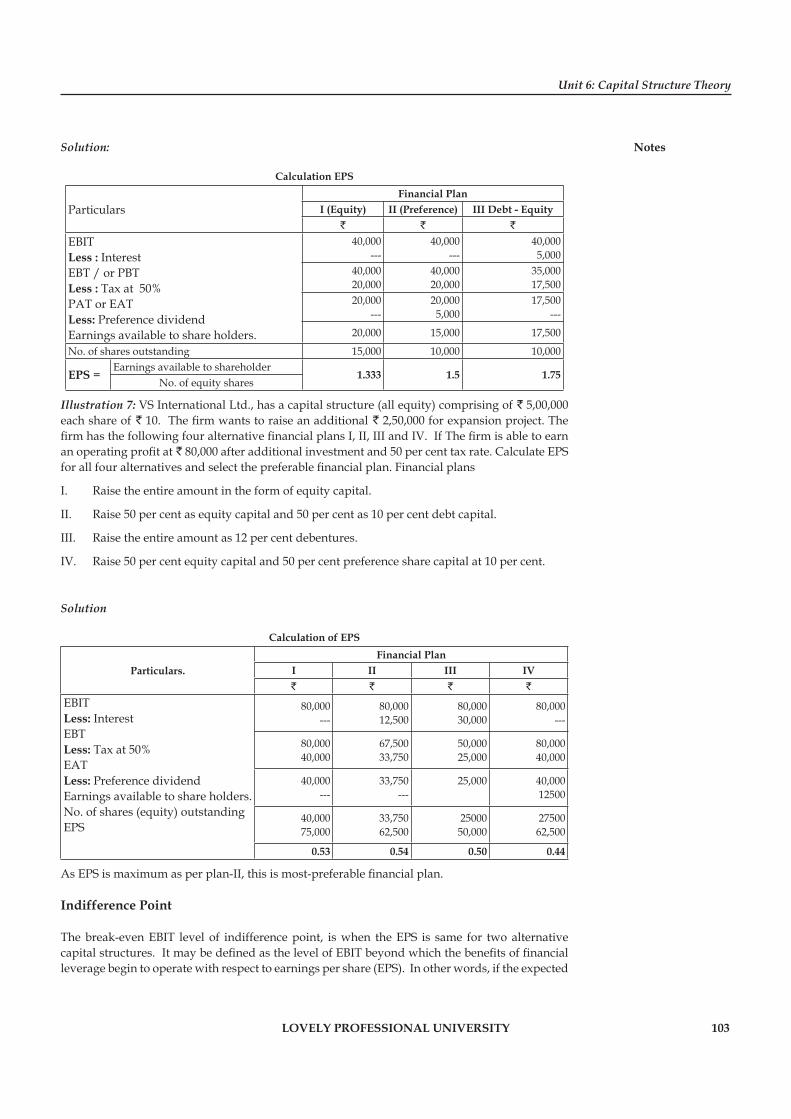
Unit 6: Capital Structure Theory
Notes
LOVELY PROFESSIONAL UNIVERSITY 103
Solution:
Calculation EPS
Particulars Financial Plan
I (Equity) II (Preference) III Debt - Equity` ` `
EBITLess : InterestEBT / or PBTLess : Tax at 50%PAT or EATLess: Preference dividendEarnings available to share holders.
40,000---
40,000---
40,0005,000
40,00020,000
40,00020,000
35,00017,500
20,000---
20,0005,000
17,500---
20,000 15,000 17,500
No. of shares outstanding 15,000 10,000 10,000
EPS =Earnings available to shareholder
1.333 1.5 1.75No. of equity shares
Illustration 7: VS International Ltd., has a capital structure (all equity) comprising of ` 5,00,000 each share of ` 10. The fi rm wants to raise an additional ` 2,50,000 for expansion project. The fi rm has the following four alternative fi nancial plans I, II, III and IV. If The fi rm is able to earn an operating profi t at ` 80,000 after additional investment and 50 per cent tax rate. Calculate EPS for all four alternatives and select the preferable fi nancial plan. Financial plans
I. Raise the entire amount in the form of equity capital.
II. Raise 50 per cent as equity capital and 50 per cent as 10 per cent debt capital.
III. Raise the entire amount as 12 per cent debentures.
IV. Raise 50 per cent equity capital and 50 per cent preference share capital at 10 per cent.
Solution
Calculation of EPS
Particulars. Financial Plan
I II III IV` ` ` `
EBITLess: InterestEBTLess: Tax at 50%EATLess: Preference dividendEarnings available to share holders.No. of shares (equity) outstandingEPS
80,000---
80,00012,500
80,00030,000
80,000---
80,00040,000
67,50033,750
50,00025,000
80,00040,000
40,000---
33,750---
25,000 40,00012500
40,00075,000
33,75062,500
2500050,000
2750062,500
0.53 0.54 0.50 0.44
As EPS is maximum as per plan-II, this is most-preferable fi nancial plan.
Indifference Point
The break-even EBIT level of indifference point, is when the EPS is same for two alternative capital structures. It may be defi ned as the level of EBIT beyond which the benefi ts of fi nancial leverage begin to operate with respect to earnings per share (EPS). In other words, if the expected

Basic Financial Management
Notes
104 LOVELY PROFESSIONAL UNIVERSITY
level of EBIT is less than the indifference point, it is advantageous with the use of equity capital to maximise EPS.
Indifference point between two capital structures can be obtained by using the following formula:
Where
X = EBIT I1I2 = Interest under alternatives 1 and 2
t = Tax rate PD = Preference dividend
Dt = Preference dividend tax
ES1, ES2 = No. of equity share outstanding under alternative 1 and 2
Illustration 8: WDC Ltd., has a total capitalisation of ̀ 10 lakh consisting entirely of equity capital (` 10 each share). It is planning to raise an additional funds of ` 5 lakh for implementing capital budgeting project. There are two alternatives available to the company.
a) Entire equity share capital by issue of shares.
b) Entire amount by debt at 10 per cent interest.
The company is in the tax brackets of 50 per cent. Calculate indifference point.
Solution:
Indifference point formula
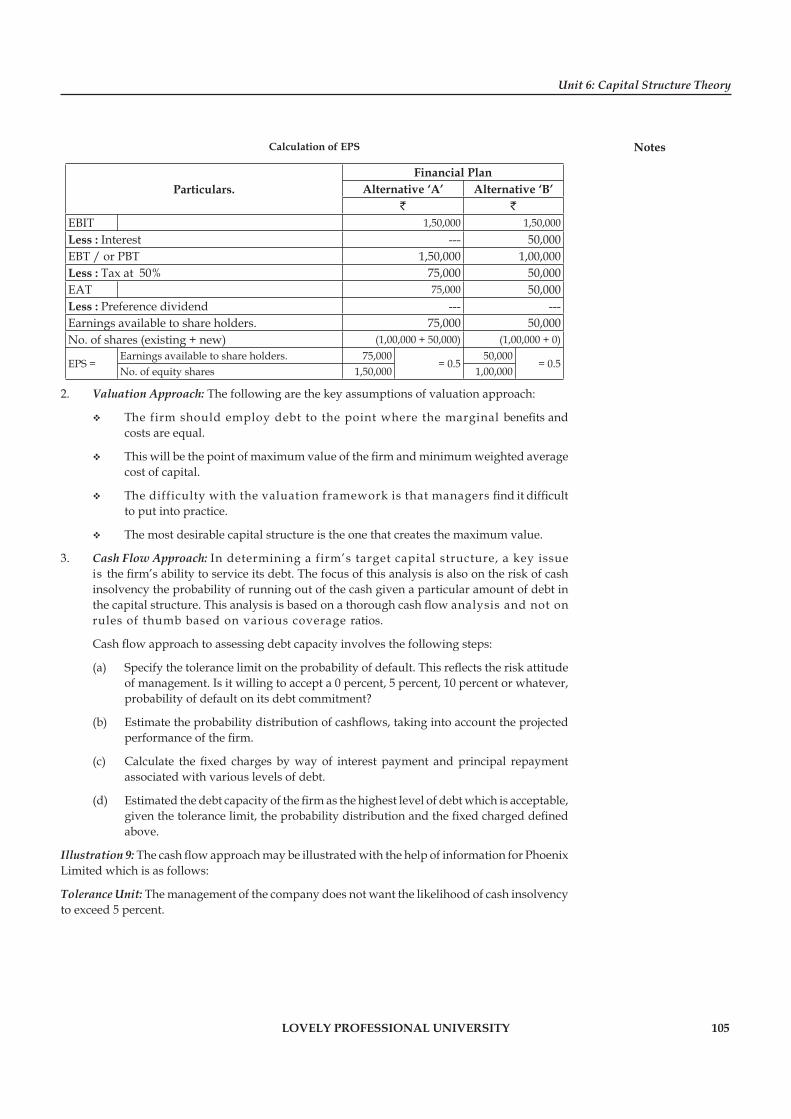
Unit 6: Capital Structure Theory
Notes
LOVELY PROFESSIONAL UNIVERSITY 105
Calculation of EPS
Particulars. Financial Plan
Alternative ‘A’ Alternative ‘B’` `
EBIT 1,50,000 1,50,000Less : Interest --- 50,000EBT / or PBT 1,50,000 1,00,000Less : Tax at 50% 75,000 50,000EAT 75,000 50,000Less : Preference dividend --- ---Earnings available to share holders. 75,000 50,000No. of shares (existing + new) (1,00,000 + 50,000) (1,00,000 + 0)
EPS =Earnings available to share holders. 75,000
= 0.550,000
= 0.5No. of equity shares 1,50,000 1,00,000
2. Valuation Approach: The following are the key assumptions of valuation approach:
The firm should employ debt to the point where the marginal benefi ts and costs are equal.
This will be the point of maximum value of the fi rm and minimum weighted average cost of capital.
The difficulty with the valuation framework is that managers fi nd it diffi cult to put into practice.
The most desirable capital structure is the one that creates the maximum value.
3. Cash Flow Approach: In determining a firm’s target capital structure, a key issue is the fi rm’s ability to service its debt. The focus of this analysis is also on the risk of cash insolvency the probability of running out of the cash given a particular amount of debt in the capital structure. This analysis is based on a thorough cash fl ow analysis and not on rules of thumb based on various coverage ratios.
Cash fl ow approach to assessing debt capacity involves the following steps:
(a) Specify the tolerance limit on the probability of default. This refl ects the risk attitude of management. Is it willing to accept a 0 percent, 5 percent, 10 percent or whatever, probability of default on its debt commitment?
(b) Estimate the probability distribution of cashfl ows, taking into account the projected performance of the fi rm.
(c) Calculate the fi xed charges by way of interest payment and principal repayment associated with various levels of debt.
(d) Estimated the debt capacity of the fi rm as the highest level of debt which is acceptable, given the tolerance limit, the probability distribution and the fi xed charged defi ned above.
Illustration 9: The cash fl ow approach may be illustrated with the help of information for Phoenix Limited which is as follows:
Tolerance Unit: The management of the company does not want the likelihood of cash insolvency to exceed 5 percent.
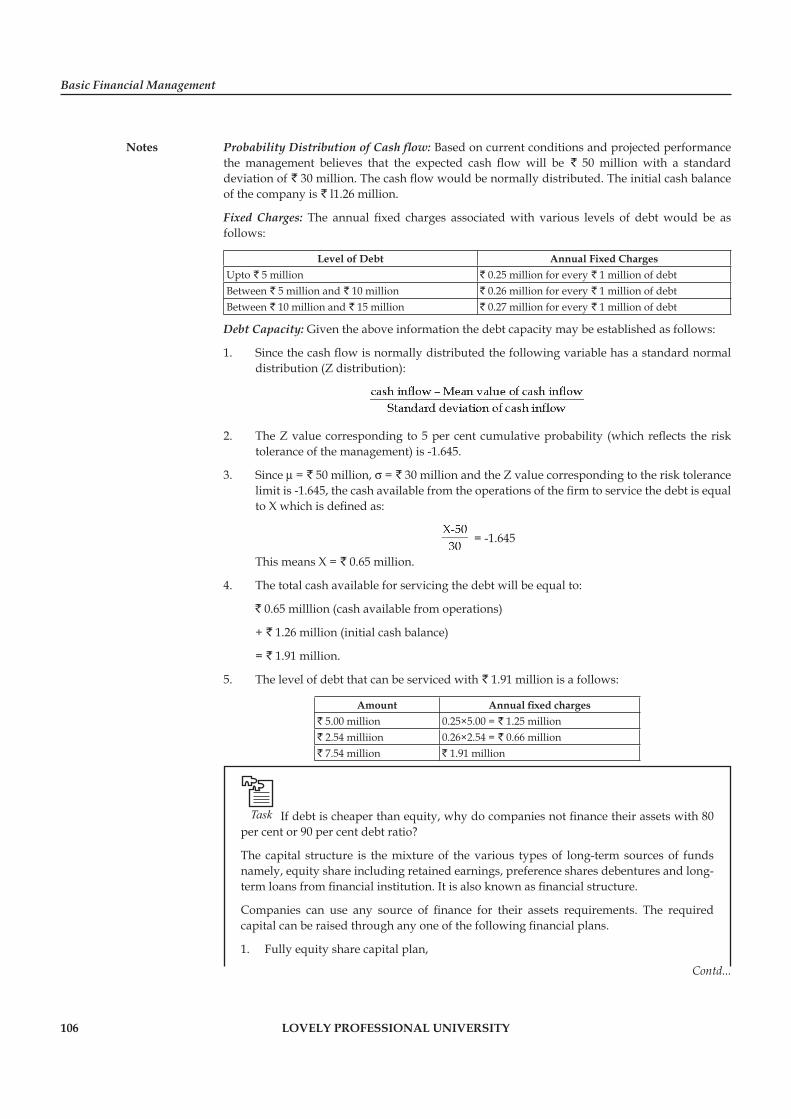
Basic Financial Management
Notes
106 LOVELY PROFESSIONAL UNIVERSITY
Probability Distribution of Cash fl ow: Based on current conditions and projected performance the management believes that the expected cash fl ow will be ` 50 million with a standard deviation of ` 30 million. The cash fl ow would be normally distributed. The initial cash balance of the company is ` l1.26 million.
Fixed Charges: The annual fi xed charges associated with various levels of debt would be as follows:
Level of Debt Annual Fixed Charges Upto ` 5 million ` 0.25 million for every ` 1 million of debt Between ` 5 million and ` 10 million ` 0.26 million for every ` 1 million of debtBetween ` 10 million and ` 15 million ` 0.27 million for every ` 1 million of debt
Debt Capacity: Given the above information the debt capacity may be established as follows:
1. Since the cash fl ow is normally distributed the following variable has a standard normal distribution (Z distribution):
2. The Z value corresponding to 5 per cent cumulative probability (which refl ects the risk tolerance of the management) is -1.645.
3. Since m = ` 50 million, s = ` 30 million and the Z value corresponding to the risk tolerance limit is -1.645, the cash available from the operations of the fi rm to service the debt is equal to X which is defi ned as:
= -1.645
This means X = ` 0.65 million.
4. The total cash available for servicing the debt will be equal to:
` 0.65 milllion (cash available from operations)
+ ` 1.26 million (initial cash balance)
= ` 1.91 million.
5. The level of debt that can be serviced with ` 1.91 million is a follows:
Amount Annual fi xed charges` 5.00 million 0.25×5.00 = ` 1.25 million` 2.54 milliion 0.26×2.54 = ` 0.66 million ` 7.54 million ` 1.91 million
Task If debt is cheaper than equity, why do companies not fi nance their assets with 80 per cent or 90 per cent debt ratio?
The capital structure is the mixture of the various types of long-term sources of funds namely, equity share including retained earnings, preference shares debentures and long-term loans from fi nancial institution. It is also known as fi nancial structure.
Companies can use any source of fi nance for their assets requirements. The required capital can be raised through any one of the following fi nancial plans.
1. Fully equity share capital plan,
Contd...
Unit 6: Capital Structure Theory
Notes
LOVELY PROFESSIONAL UNIVERSITY 107
2. Fully debt capital plan,
3. Fully preference share capital plan,
4. Combination of (a) and (b) in different proportions,
5. A combination of (a), (b) and (c) in different proportions, and
6. A combination of (a) and (c) in different proportions and so on.
Of all the sources of long-term fi nance, debt is the cheapest source no doubt, because the interest paid on debt is allowed for tax purpose. The company can save tax due to the interest, but company cannot use debt beyond certain limit, up to certain limit use of debt reduces overall cost of capital; beyond the limit it will increase. This can be illustrated with the following example.
Finance source and their cost Plan 1 Plan 2 Plan 3 Plan 4 Plan 5 Plan 6 Plan 7Debt as a percentage of total capital
Debt cost (Kd %)
Cost of Equity (Ke %)
0
7
15
10
7
15
20
7
15.5
30
7.5
16
40
8
17
50
8.5
19
60
9.5
20
You are required to fi nd out optimal debt-equity mix of the company.
6.7 The Trade off Theory: Cost of Financial Distress and Agency Cost
As the debt equity ratio (ie leverage) increases, there is a trade-off between the interest tax shield and bankruptcy, causing an optimum capital structure, D/E*
The Trade-Off Theory of Capital Structure is a theory in the realm of Financial Economics about the corporate fi nance choices of corporations. Its purpose is to explain the fact that fi rms or corporations usually are fi nanced partly with debt and partly with equity. It states that there is an advantage to fi nancing with debt, the tax benefi t of debt and there is a cost of fi nancing with debt, the costs of fi nancial distress including bankruptcy costs of debt and non-bankruptcy costs e.g. staff leaving, suppliers demanding disadvantageous payment terms, bondholder/stockholder infi ghting, etc.
Trade-Off Model
Financial distress costs (includes bankruptcy)
1. Direct costs: Lawyer’s fees, court costs, administrative expenses, assets disappear or become obsolete
2. Indirect costs: Managers make short-run decisions; customers and suppliers may impose costs
Agency costs
More debt is likely to be experienced. Distress stockholders (thus management) want risk, while bondholders do not.
Use covenants to align interests costs: monitoring to ensure they are followed; also may hamper business. In essence, lost effi ciency and monitoring costs reduce advantage of debt, given agency costs and fi nancial distress.
VL = VU + TD – (PV of expected costs of fi nancial distress) – (PV of agency costs)
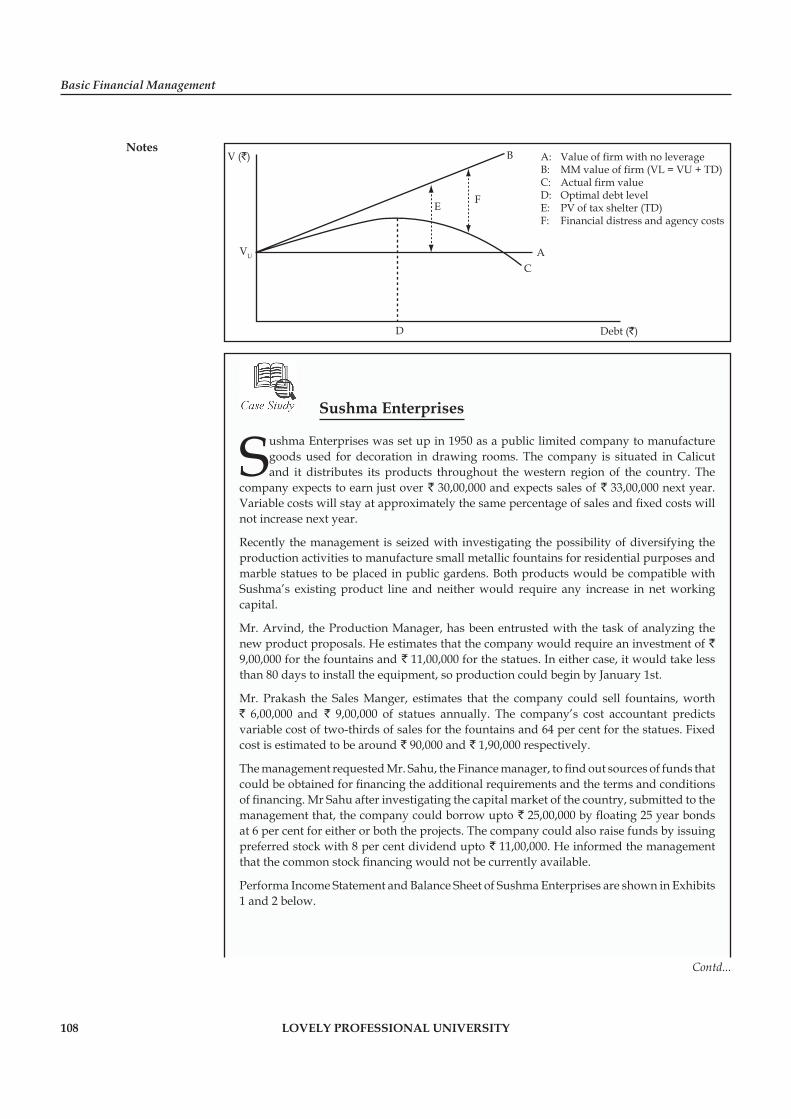
Basic Financial Management
Notes
108 LOVELY PROFESSIONAL UNIVERSITY
V (`) B
FE
AC
D
VU
Debt (`)
A: Value of firm with no leverageB: MM value of firm (VL = VU + TD)C: Actual firm valueD: Optimal debt levelE: PV of tax shelter (TD)F: Financial distress and agency costs
Sushma Enterprises
Sushma Enterprises was set up in 1950 as a public limited company to manufacture goods used for decoration in drawing rooms. The company is situated in Calicut and it distributes its products throughout the western region of the country. The
company expects to earn just over ` 30,00,000 and expects sales of ` 33,00,000 next year. Variable costs will stay at approximately the same percentage of sales and fi xed costs will not increase next year.
Recently the management is seized with investigating the possibility of diversifying the production activities to manufacture small metallic fountains for residential purposes and marble statues to be placed in public gardens. Both products would be compatible with Sushma’s existing product line and neither would require any increase in net working capital.
Mr. Arvind, the Production Manager, has been entrusted with the task of analyzing the new product proposals. He estimates that the company would require an investment of ` 9,00,000 for the fountains and ` 11,00,000 for the statues. In either case, it would take less than 80 days to install the equipment, so production could begin by January 1st.
Mr. Prakash the Sales Manger, estimates that the company could sell fountains, worth ` 6,00,000 and ` 9,00,000 of statues annually. The company’s cost accountant predicts variable cost of two-thirds of sales for the fountains and 64 per cent for the statues. Fixed cost is estimated to be around ` 90,000 and ` 1,90,000 respectively.
The management requested Mr. Sahu, the Finance manager, to fi nd out sources of funds that could be obtained for fi nancing the additional requirements and the terms and conditions of fi nancing. Mr Sahu after investigating the capital market of the country, submitted to the management that, the company could borrow upto ` 25,00,000 by fl oating 25 year bonds at 6 per cent for either or both the projects. The company could also raise funds by issuing preferred stock with 8 per cent dividend upto ` 11,00,000. He informed the management that the common stock fi nancing would not be currently available.
Performa Income Statement and Balance Sheet of Sushma Enterprises are shown in Exhibits 1 and 2 below.
Contd...

Unit 6: Capital Structure Theory
Notes
LOVELY PROFESSIONAL UNIVERSITY 109
Exhibit 1: Performa Income Statement For December 31, 2001
Sales 30,00,000Variable Cost 18,56,000Marginal Contribution 11,44,000Fixed Costs 5,60,000Earnings before interest and tax (EBIT) 5,84,000Interest 80,000Earning before tax (EBT) 5,04,000Taxes 2,62,000Net Income after tax 2,42,000
Exhibit 2: Performa Balance Sheet For December 2001
Liabilities ` Assets `
Current Liabilities 3,00,000 Cash 1,40,000Long-term debt 10% 8,00,000 Accounts Receivable 3,00,000Common stock (` 2%) 4,00,000 Inventory 2,40,000Retained earnings 15,80,000 Fixed Assets 24,00,000Total 30,80,000 Total 30,80,000
Normal profi t margin is 20 per cent and normal asset turnover is 1.2/1
Questions
1. What will be the effect on EPS of the company in each fi nancing alternative and how the acceptance of each project will affect the leverage.
2. Without the new projects, what would the fi rms operating, fi xed shares, and combined leverage be, the next year? Does it have a favourable fi nancial leverage?
6.8 Summary
Capital structures refers to the mix of different sources of long terms funds such as debt, preference capital and equity capital in the total capitalization of a company. There are difference of opinion on the relationship between capital structure, cost of capital and valuation.
According to the NI approach overall cost of capital continuously decreases as and when the debt content is increased in the capital structure. So optimum capital structure exists when the fi rm borrows maximum.
NOI is just opposite to NI approach and argues that capital structure is irrelevant. According to the theory, Ko depends on business risk, which is assumed to be constant. So, KO does not change when leverage is changed.
The MM approach to capital structure is akin to that of NOI approach and argues that capital structure is irrelevant.
According to the traditional approach, Ko decreases with the leverage in the beginning, then reaches the minimum point and rises thereafter. So optimum capital structure exists according to the theory. Thus traditional theory strikes a balances between NI and NOI approach.

Basic Financial Management
Notes
110 LOVELY PROFESSIONAL UNIVERSITY
6.9 Keywords
EBIT-EPS Approach: This approach determines the impact of debt on earnings per share.
MM Theory: According to this theory the value of the fi rm is independent of its capital structure.
Net Income Approach: According to this approach, the cost of debt and the cost of equity do not change with a change in the leverage ratio.
NOI Approach: According to this approach, the market value of the fi rm is not affected by the capital structure changes.
Optimum Capital Structure: It is that capital structure where market value per share is maximum and the cost of capital is minimum.
WACC Approach: It is midway between NI and NOI approaches.
6.10 Self Assessment
Fill in the blanks:
1. According to ......................., capital structure decision is relevant to the valuation of the fi rm.
2. NI approach assumes that cost of debt is ....................... than the cost of equity.
3. According to NOI approach, the capital structure decision is irrelevant and there is nothing like ....................... .
4. According to ......................., the value of the fi rm is independent of its capital structure.
5. Arbitrage process helps to bring ....................... in the market.
6. The ....................... keeps balance between share capital and debt capital.
7. ....................... is helpful to analyse the impact of debt on earnings per share.
8. ....................... analyses the fi rm’s debt service capacity.
State whether the following statements are true or false:
9. Net income approach of capital structure was propounded by David Durand.
10. According to NI approach the cost of debt and the cost of equity change with a change in the leverage ratio.
11. According to NI theory, cost of equity is assumed to be less than the cost of debt.
12. Net operating income (NOI) theory is propounded by David Durand.
13. According to NOI theory, the market value of the fi rm is not affected by the capital structure changes.
14. The WACC approach is midway between the NI and NOI approach.
15. According to WACC approach, the cost of debt remains almost constant up to certain degree of leverage but decreases thereafter at an increasing rate.
Unit 6: Capital Structure Theory
Notes
LOVELY PROFESSIONAL UNIVERSITY 111
6.11 Review Questions
1. What is the relationship between leverage and cost of capital according to NI and NOI approach?
2. What are the main propositions of MM approach?
3. There is nothing like optimum capital structure for a fi rm. Critically evaluate the statement.
4. Write briefl y a note on the arbitrage process.
5. Briefl y explain the traditional approach of capital structure.
6. What do you mean by appropriate capital structure? What are the features?
7. Explain the factors that determine the capital structure for a fi rm.
8. Illustrate the arbitrage process with suitable example.
9. Write a note on Trade Off theory.
10. What are the key features of an optimum capital structure?
Answers: Self Assessment
1. NI approach 2. less
3. optimum capital structure 4. MM approach
5. equilibrium 6. optimum capital structure
7. EBIT-EPS approach 8. Cash fl ow approach
9. True 10. False
11. False 12. True
13. True 14. True
15. False
6.12 Further Readings
Books Chandra, P., Financial Management - Theory and Practice, New Delhi, Tata McGraw Hill Publishing Company Ltd., 2002, p. 3.
Sudhindra Bhat, Financial Management, New Delhi, Excel Books, 2008.
Van Horne, J.C. and Wachowicz, Jr, J.M., Fundamentals of Financial Management, New Delhi, Prentice Hall of India Pvt. Ltd., 1996, p. 2.
Online links http://www.fei.org/
www.scribd.com
www.globusz.com
Basic Financial Management
Notes
112 LOVELY PROFESSIONAL UNIVERSITY
Unit 7: Capital Budgeting
CONTENTS
Objectives
Introduction
7.1 Meaning and Defi nition of Capital Budgeting
7.2 Capital Budgeting Process
7.3 Methods of Capital Budgeting
7.3.1 Traditional Techniques or Non-discounted Cash Flow Techniques
7.3.2 Modern Techniques or Discounted Cash Flow (DCF) Techniques
7.4 Summary
7.5 Keywords
7.6 Self Assessment
7.7 Review Questions
7.8 Further Readings
Objectives
After studying this unit, you will be able to:
Defi ne meaning and defi nition of capital budgeting
Describe process of capital budgeting
Explain methods of capital budgeting
Introduction
Capital project planning is the process by which companies allocate funds to various investment projects designed to ensure profi tability and growth.
Evaluation of such projects involves estimating their future benefi ts to the company and comparing these with their costs.
In a competitive economy, the economic viability and prosperity of a company depends upon the effectiveness and adequacy of capital expenditure evaluation and fi xed assets management.
7.1 Meaning and Defi nition of Capital Budgeting
Capital budgeting refers to planning the deployment of available capital for the purpose of maximizing the long-term profi tability of the fi rm. It is the fi rm’s decision to invest its current funds most effi ciently in long-term activities in anticipation of fl ow of future benefi ts over a series of years.
In other words, Capital budget may be defi ned as the fi rm’s decision to invest its current funds most effi ciently in the long-term assets in anticipation of an expected fl ow of benefi ts over a series of years. Therefore, it involves a current outlay or series of outlay of cash resources in return for an anticipated fl ow of future benefi ts.
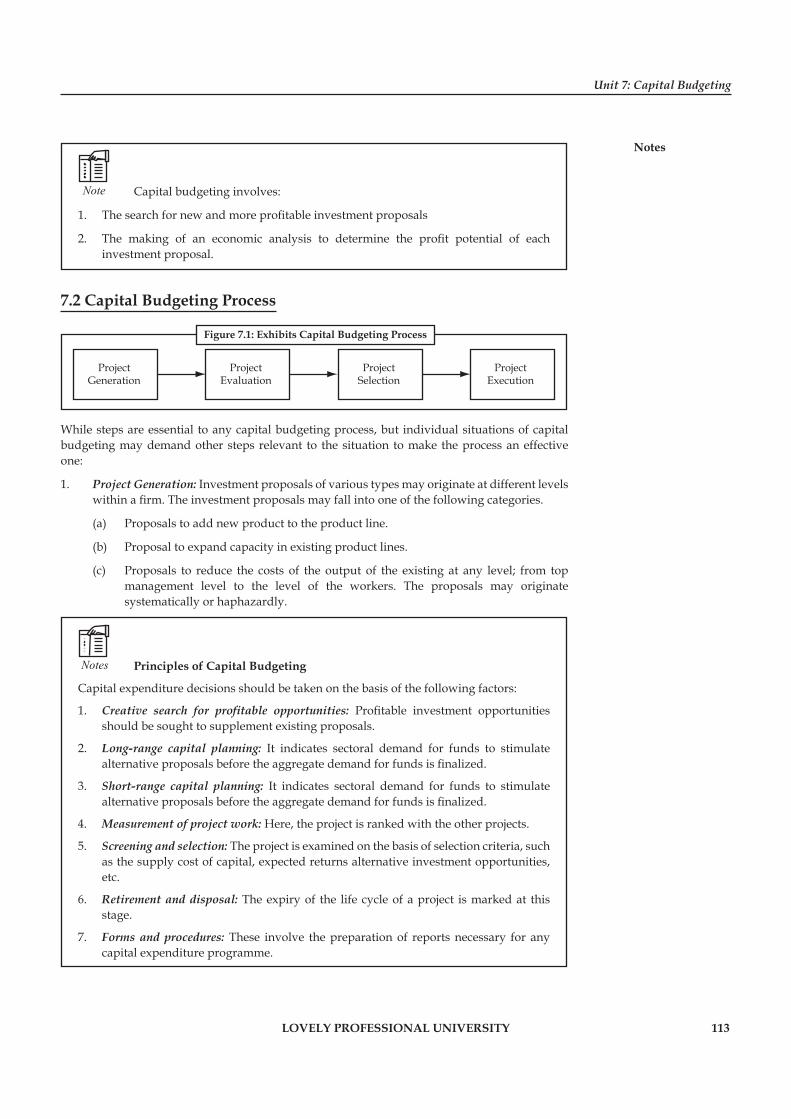
Unit 7: Capital Budgeting
Notes
LOVELY PROFESSIONAL UNIVERSITY 113
Note Capital budgeting involves:
1. The search for new and more profi table investment proposals
2. The making of an economic analysis to determine the profi t potential of each investment proposal.
7.2 Capital Budgeting Process
ProjectGeneration
ProjectEvaluation
ProjectSelection
ProjectExecution
Figure 7.1: Exhibits Capital Budgeting Process
While steps are essential to any capital budgeting process, but individual situations of capital budgeting may demand other steps relevant to the situation to make the process an effective one:
1. Project Generation: Investment proposals of various types may originate at different levels within a fi rm. The investment proposals may fall into one of the following categories.
(a) Proposals to add new product to the product line.
(b) Proposal to expand capacity in existing product lines.
(c) Proposals to reduce the costs of the output of the existing at any level; from top management level to the level of the workers. The proposals may originate systematically or haphazardly.
Notes Principles of Capital Budgeting
Capital expenditure decisions should be taken on the basis of the following factors:
1. Creative search for profi table opportunities: Profi table investment opportunities should be sought to supplement existing proposals.
2. Long-range capital planning: It indicates sectoral demand for funds to stimulate alternative proposals before the aggregate demand for funds is fi nalized.
3. Short-range capital planning: It indicates sectoral demand for funds to stimulate alternative proposals before the aggregate demand for funds is fi nalized.
4. Measurement of project work: Here, the project is ranked with the other projects.
5. Screening and selection: The project is examined on the basis of selection criteria, such as the supply cost of capital, expected returns alternative investment opportunities, etc.
6. Retirement and disposal: The expiry of the life cycle of a project is marked at this stage.
7. Forms and procedures: These involve the preparation of reports necessary for any capital expenditure programme.
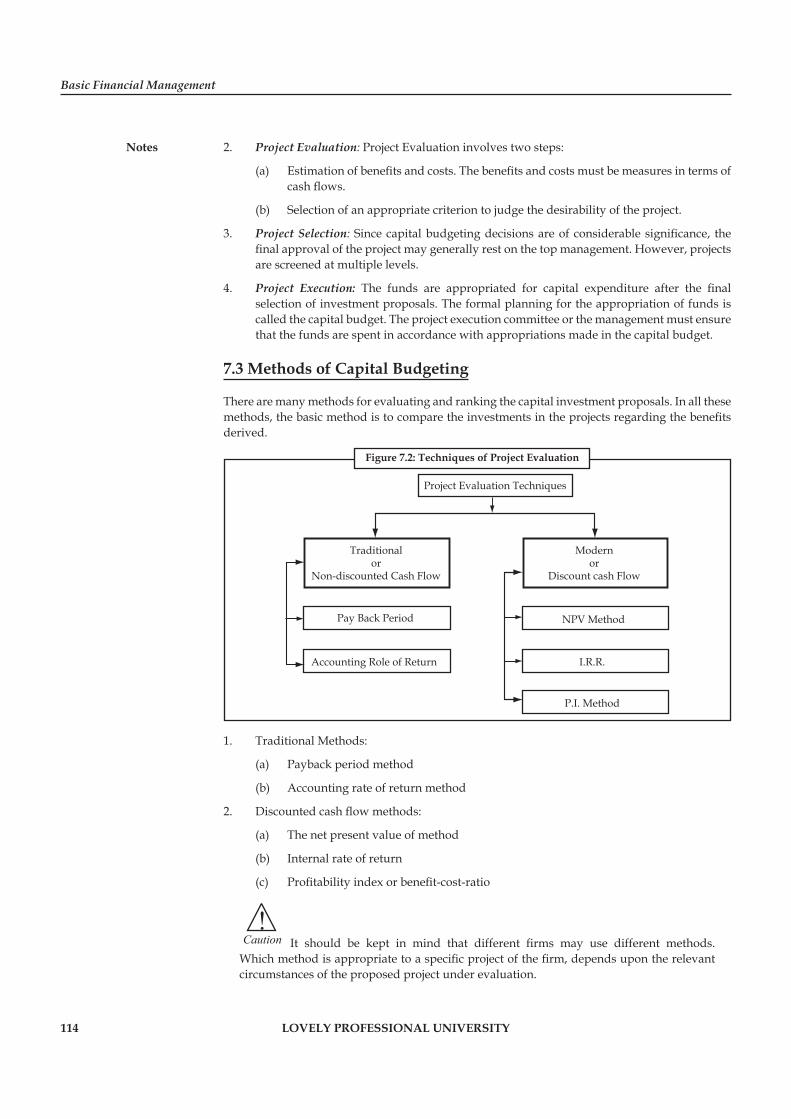
Basic Financial Management
Notes
114 LOVELY PROFESSIONAL UNIVERSITY
2. Project Evaluation: Project Evaluation involves two steps:
(a) Estimation of benefi ts and costs. The benefi ts and costs must be measures in terms of cash fl ows.
(b) Selection of an appropriate criterion to judge the desirability of the project.
3. Project Selection: Since capital budgeting decisions are of considerable signifi cance, the fi nal approval of the project may generally rest on the top management. However, projects are screened at multiple levels.
4. Project Execution: The funds are appropriated for capital expenditure after the fi nal selection of investment proposals. The formal planning for the appropriation of funds is called the capital budget. The project execution committee or the management must ensure that the funds are spent in accordance with appropriations made in the capital budget.
7.3 Methods of Capital Budgeting
There are many methods for evaluating and ranking the capital investment proposals. In all these methods, the basic method is to compare the investments in the projects regarding the benefi ts derived.
Project Evaluation Techniques
Traditionalor
Non-discounted Cash Flow
Modernor
Discount cash Flow
Pay Back Period
Accounting Role of Return
NPV Method
I.R.R.
P.I. Method
Figure 7.2: Techniques of Project Evaluation
1. Traditional Methods:
(a) Payback period method
(b) Accounting rate of return method
2. Discounted cash fl ow methods:
(a) The net present value of method
(b) Internal rate of return
(c) Profi tability index or benefi t-cost-ratio
!Caution It should be kept in mind that different fi rms may use different methods.
Which method is appropriate to a specifi c project of the fi rm, depends upon the relevant circumstances of the proposed project under evaluation.
Unit 7: Capital Budgeting
Notes
LOVELY PROFESSIONAL UNIVERSITY 115
7.3.1 Traditional Techniques or Non-discounted Cash Flow Techniques
The traditional techniques are further subdivided into two, such as:
1. Pay back period, and
2. Accounting Rate of Return or Average Rate of Return (ARR).
Pay Back Period
Pay back period is one of the most popular and widely recognized technique of evaluating investment proposals. Pay back period may be defi ned as that period required, to recover the original cash outfl ow invested in a project. In other words it is the minimum required number of years to recover the original cash outlay invested in a project. The cash fl ow after taxes is used to compute pay back period.
Pay back period can be calculated in two ways, (i) Using formula (ii) Using Cumulative cash fl ow method. The fi rst method can be applied when the cash fl ows stream of each year is equal/ annuity in all the years’ or projects life, i.e., uniform cash fl ows for all the years. In this situation the following formula is used to calculate pay back period.
Pay Back Period = Original Investment ÷ Constant Annual Cash Flows After Taxes
or
Initial investment (cash outlay)
Pay back period = Initial investment (cash outlay)Annual cash inflow
!Caution The Second method is applied when, the cash fl ows after taxes are unequal or
not uniform over the projects’ life period. In this situation, pay back period is calculated through the process of cumulative cash fl ows, cumulative process goes up to the period where cumulative cash fl ows equals to the actual cash outfl ows. Put it simple:
PBP = Year before full recovery+(Unrecovered Amount of Investment ‚ Cash fl ows during the year)
Accept-Reject Rule
Acceptance or rejection of the project is based on the comparison of calculated PBP with the maximum or standard pay back period. Put it simple
Accept: Cal PBP < Standard PBP
Reject: Cal PBP > Standard PBP
Considered: Cal PBP = Standard PBP
Accept-reject role for mutually exclusive projects
These kinds of Proposals are those proposals which represent alternative methods of doing the same job. In case one proposal is accepted, the need to accept the other is ruled out. For Example, there are 5 pieces of equipment available in the market to carry out a job. If the management chooses one piece of the equipment, others will not be required because they are mutually exclusive projects.
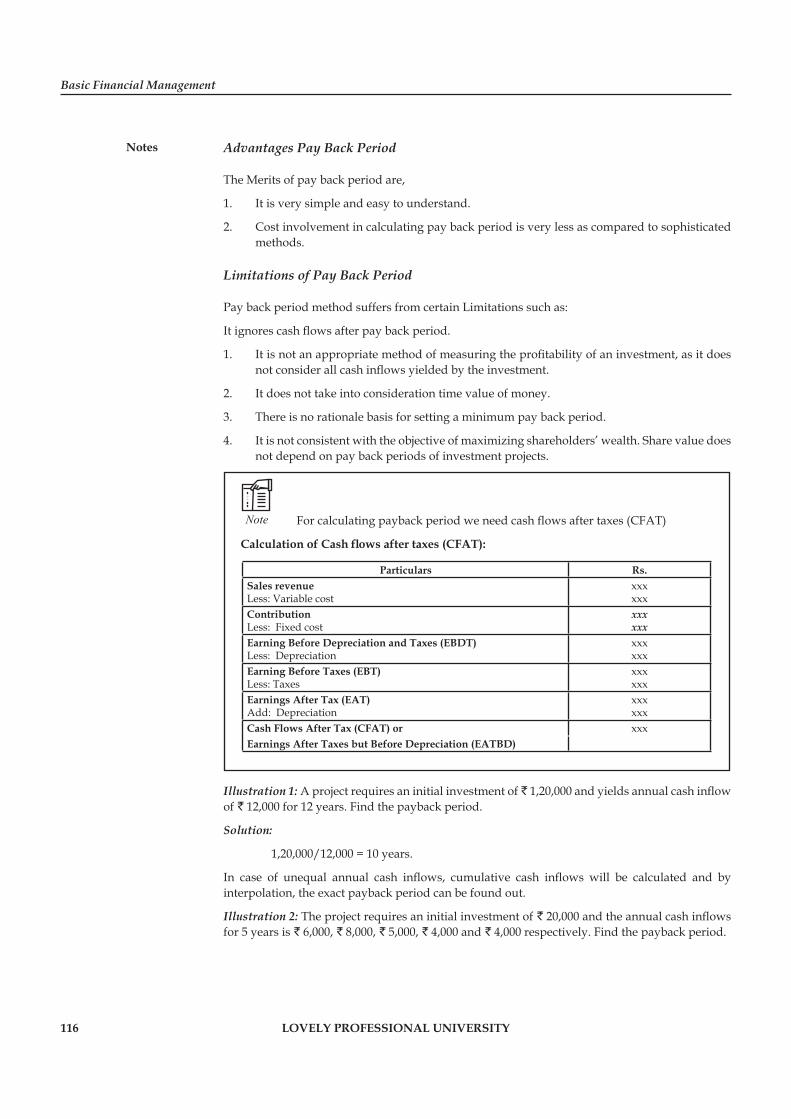
Basic Financial Management
Notes
116 LOVELY PROFESSIONAL UNIVERSITY
Advantages Pay Back Period
The Merits of pay back period are,
1. It is very simple and easy to understand.
2. Cost involvement in calculating pay back period is very less as compared to sophisticated methods.
Limitations of Pay Back Period
Pay back period method suffers from certain Limitations such as:
It ignores cash fl ows after pay back period.
1. It is not an appropriate method of measuring the profi tability of an investment, as it does not consider all cash infl ows yielded by the investment.
2. It does not take into consideration time value of money.
3. There is no rationale basis for setting a minimum pay back period.
4. It is not consistent with the objective of maximizing shareholders’ wealth. Share value does not depend on pay back periods of investment projects.
Note For calculating payback period we need cash fl ows after taxes (CFAT)
Calculation of Cash fl ows after taxes (CFAT):
Particulars Rs.Sales revenue Less: Variable cost
xxxxxx
ContributionLess: Fixed cost
xxxxxx
Earning Before Depreciation and Taxes (EBDT)Less: Depreciation
xxxxxx
Earning Before Taxes (EBT)Less: Taxes
xxxxxx
Earnings After Tax (EAT)Add: Depreciation
xxxxxx
Cash Flows After Tax (CFAT) or xxxEarnings After Taxes but Before Depreciation (EATBD)
Illustration 1: A project requires an initial investment of ` 1,20,000 and yields annual cash infl ow of ` 12,000 for 12 years. Find the payback period.
Solution:
1,20,000/12,000 = 10 years.
In case of unequal annual cash infl ows, cumulative cash infl ows will be calculated and by interpolation, the exact payback period can be found out.
Illustration 2: The project requires an initial investment of ` 20,000 and the annual cash infl ows for 5 years is ` 6,000, ` 8,000, ` 5,000, ` 4,000 and ` 4,000 respectively. Find the payback period.
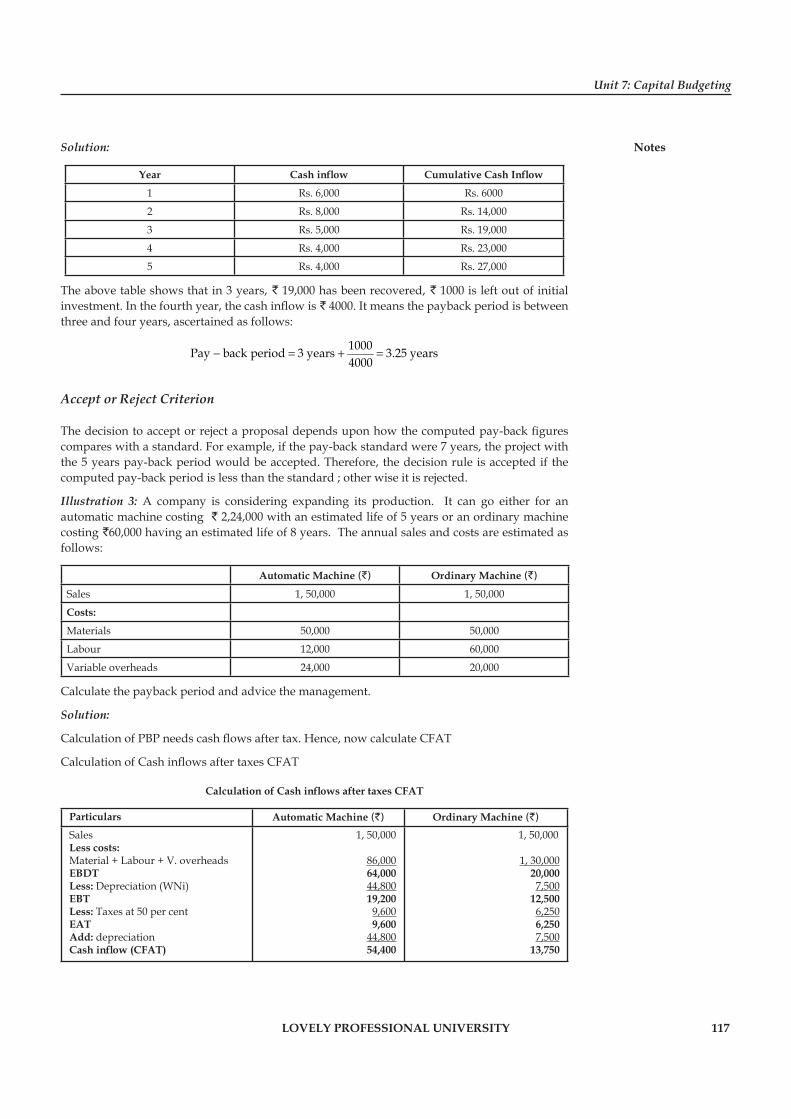
Unit 7: Capital Budgeting
Notes
LOVELY PROFESSIONAL UNIVERSITY 117
Solution:
Year Cash infl ow Cumulative Cash Infl ow
1 Rs. 6,000 Rs. 6000
2 Rs. 8,000 Rs. 14,000
3 Rs. 5,000 Rs. 19,000
4 Rs. 4,000 Rs. 23,000
5 Rs. 4,000 Rs. 27,000
The above table shows that in 3 years, ` 19,000 has been recovered, ` 1000 is left out of initial investment. In the fourth year, the cash infl ow is ` 4000. It means the payback period is between three and four years, ascertained as follows:
1000Pay back period 3 years 3.25 years4000
− = + =
Accept or Reject Criterion
The decision to accept or reject a proposal depends upon how the computed pay-back fi gures compares with a standard. For example, if the pay-back standard were 7 years, the project with the 5 years pay-back period would be accepted. Therefore, the decision rule is accepted if the computed pay-back period is less than the standard ; other wise it is rejected.
Illustration 3: A company is considering expanding its production. It can go either for an automatic machine costing ` 2,24,000 with an estimated life of 5 years or an ordinary machine costing `60,000 having an estimated life of 8 years. The annual sales and costs are estimated as follows:
Automatic Machine (`) Ordinary Machine (`)
Sales 1, 50,000 1, 50,000
Costs:
Materials 50,000 50,000
Labour 12,000 60,000
Variable overheads 24,000 20,000
Calculate the payback period and advice the management.
Solution:
Calculation of PBP needs cash fl ows after tax. Hence, now calculate CFAT
Calculation of Cash infl ows after taxes CFAT
Calculation of Cash infl ows after taxes CFAT
Particulars Automatic Machine (`) Ordinary Machine (`)
Sales Less costs:Material + Labour + V. overheads EBDT Less: Depreciation (WNi)EBTLess: Taxes at 50 per centEATAdd: depreciationCash infl ow (CFAT)
1, 50,000
86,000 64,00044,80019,2009,6009,600
44,80054,400
1, 50,000
1, 30,00020,0007,500
12,5006,2506,2507,500
13,750
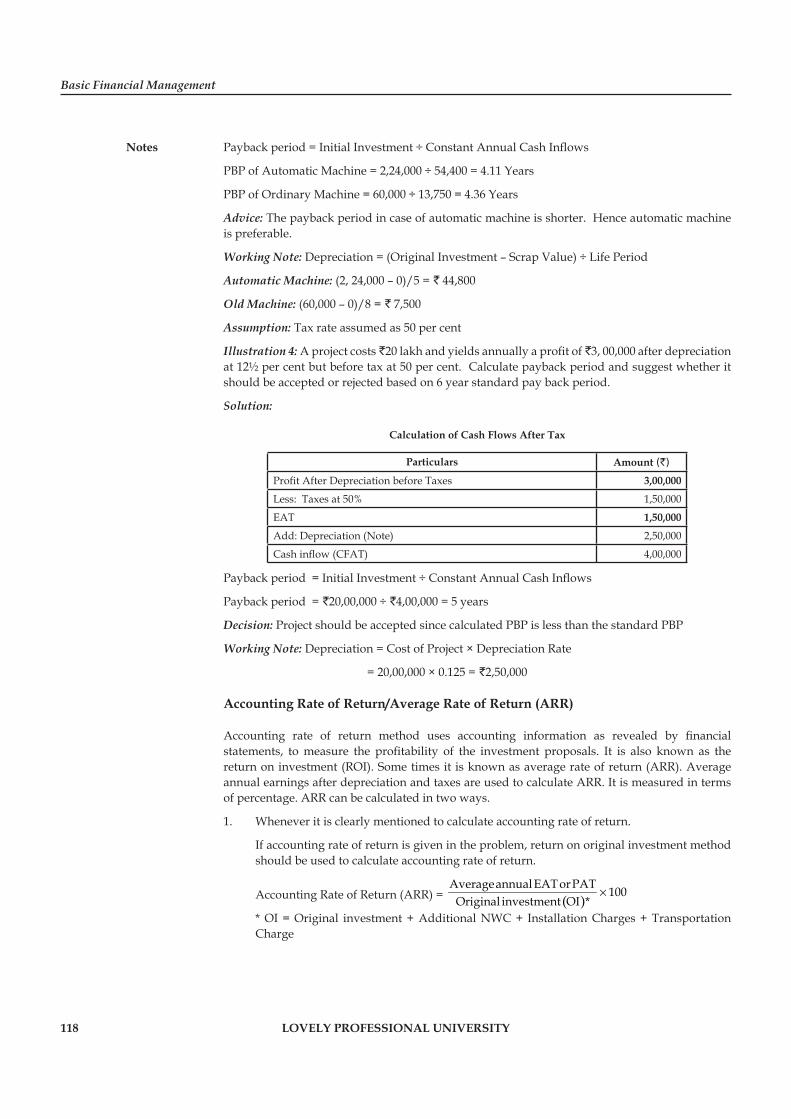
Basic Financial Management
Notes
118 LOVELY PROFESSIONAL UNIVERSITY
Payback period = Initial Investment ÷ Constant Annual Cash Infl ows
PBP of Automatic Machine = 2,24,000 ÷ 54,400 = 4.11 Years
PBP of Ordinary Machine = 60,000 ÷ 13,750 = 4.36 Years
Advice: The payback period in case of automatic machine is shorter. Hence automatic machine is preferable.
Working Note: Depreciation = (Original Investment – Scrap Value) ÷ Life Period
Automatic Machine: (2, 24,000 – 0)/5 = ` 44,800
Old Machine: (60,000 – 0)/8 = ` 7,500
Assumption: Tax rate assumed as 50 per cent
Illustration 4: A project costs ̀ 20 lakh and yields annually a profi t of ̀ 3, 00,000 after depreciation at 12½ per cent but before tax at 50 per cent. Calculate payback period and suggest whether it should be accepted or rejected based on 6 year standard pay back period.
Solution:
Calculation of Cash Flows After Tax
Particulars Amount (`)
Profi t After Depreciation before Taxes 3,00,000
Less: Taxes at 50% 1,50,000
EAT 1,50,000
Add: Depreciation (Note) 2,50,000
Cash infl ow (CFAT) 4,00,000
Payback period = Initial Investment ÷ Constant Annual Cash Infl ows
Payback period = `20,00,000 ÷ `4,00,000 = 5 years
Decision: Project should be accepted since calculated PBP is less than the standard PBP
Working Note: Depreciation = Cost of Project × Depreciation Rate
= 20,00,000 × 0.125 = `2,50,000
Accounting Rate of Return/Average Rate of Return (ARR)
Accounting rate of return method uses accounting information as revealed by fi nancial statements, to measure the profi tability of the investment proposals. It is also known as the return on investment (ROI). Some times it is known as average rate of return (ARR). Average annual earnings after depreciation and taxes are used to calculate ARR. It is measured in terms of percentage. ARR can be calculated in two ways.
1. Whenever it is clearly mentioned to calculate accounting rate of return.
If accounting rate of return is given in the problem, return on original investment method should be used to calculate accounting rate of return.
Accounting Rate of Return (ARR) = ( )Averageannual EAT orPAT 100
Original investment OI *×
* OI = Original investment + Additional NWC + Installation Charges + Transportation Charge
Unit 7: Capital Budgeting
Notes
LOVELY PROFESSIONAL UNIVERSITY 119
2. Whenever it is clearly mentioned as average rate of return
If Average rate of return is given in the Illustration, return on average investment method should be used to calculate average rate of return.
Average Rate of Return = ( )Averageannual EAT 100
Averageinvestment AI *×
* AI = (Original investment – scrap)1/2 + Additional NWC + Scrap value
?Did u know? What will be the accounting treatment if ARR is given in problem?
If ARR is given in the problem, any one of the above method can be used to calculate ARR (preferably return on average investment method).
Accept-Reject Rule
Acceptance or rejection of the project is based on the comparison of calculated ARR with the predetermined rate or cut of rate.
Accept: Cal ARR > Predetermined ARR or Cut-off rate
Reject: Cal ARR < Predetermined ARR or Cut-off rate
Considered: Cal ARR = Predetermined ARR or Cut-off rate
Advantages of ARR Method
The ARR method has some merits.
1. The most signifi cant merit of ARR is that, it is very simple to understand and easy to calculate.
2. Information can easily be drawn from accounting records.
3. It takes into account all profi ts of the projects’ life period.
4. Cost involvement in calculating pay back period is very less in comparison to the sophisticated methods, since it saves analysts’ time.
Limitations of ARR Method
ARR method suffers form serious demerits.
1. It uses accounting profi ts instead of actual cash fl ows after taxes, in evaluating the projects. Accounting profi ts are inappropriate for evaluating and accepting projects, since they are computed based on arbitrary assumptions and choices and also include non-cash items.
2. It ignores the concept of time value of money.
3. It does not allow profi ts to be reinvested.
4. It does not differentiate between the size of the investment required for each project.
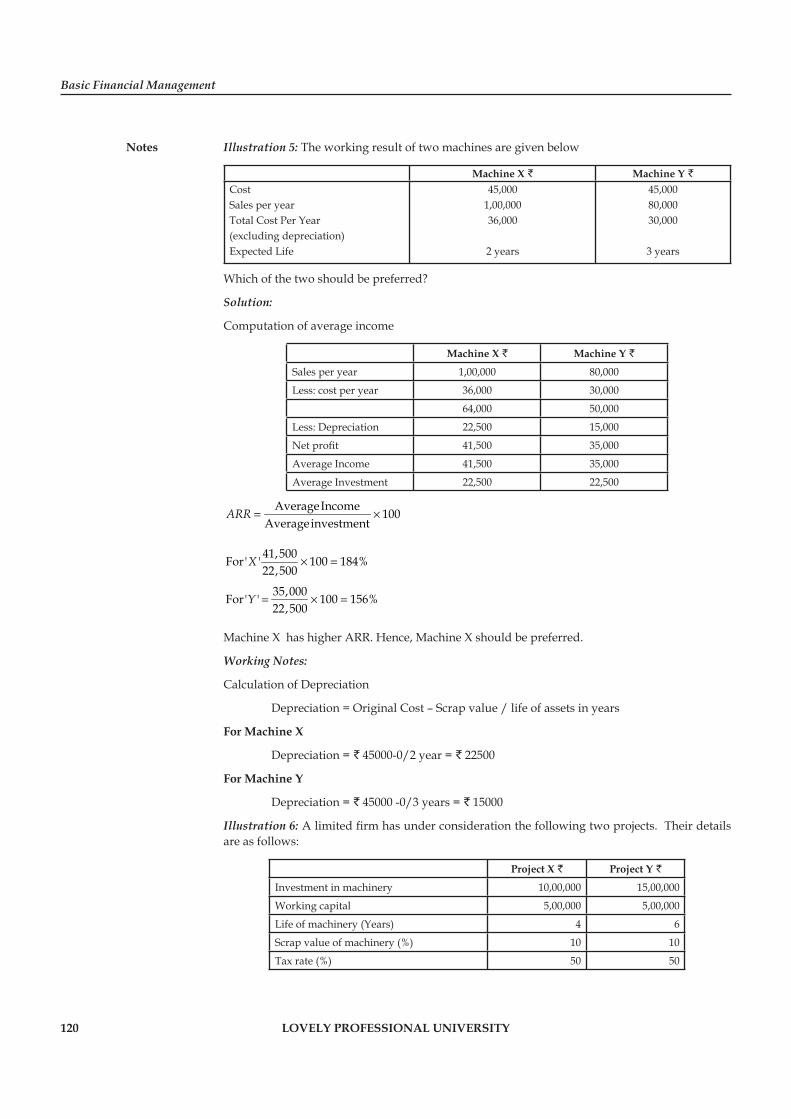
Basic Financial Management
Notes
120 LOVELY PROFESSIONAL UNIVERSITY
Illustration 5: The working result of two machines are given below
Machine X ` Machine Y `
CostSales per yearTotal Cost Per Year(excluding depreciation)Expected Life
45,0001,00,00036,000
2 years
45,00080,00030,000
3 years
Which of the two should be preferred?
Solution:
Computation of average income
Machine X ` Machine Y `
Sales per year 1,00,000 80,000
Less: cost per year 36,000 30,000
64,000 50,000
Less: Depreciation 22,500 15,000
Net profi t 41,500 35,000
Average Income 41,500 35,000
Average Investment 22,500 22,500
AverageIncome 100Averageinvestment
ARR = ×
41,500For' ' 100 184%22,500
X × =
35,000For' ' 100 156%22,500
Y = × =
Machine X has higher ARR. Hence, Machine X should be preferred.
Working Notes:
Calculation of Depreciation
Depreciation = Original Cost – Scrap value / life of assets in years
For Machine X
Depreciation = ` 45000-0/2 year = ` 22500
For Machine Y
Depreciation = ` 45000 -0/3 years = ` 15000
Illustration 6: A limited fi rm has under consideration the following two projects. Their details are as follows:
Project X ` Project Y `
Investment in machinery 10,00,000 15,00,000
Working capital 5,00,000 5,00,000
Life of machinery (Years) 4 6
Scrap value of machinery (%) 10 10
Tax rate (%) 50 50

Unit 7: Capital Budgeting
Notes
LOVELY PROFESSIONAL UNIVERSITY 121
Income before depreciation and tax at the end of
Year 1 2 3 4 5 6X (`)Y (`)
8,00,00015,00,000
8,00,0009,00,000
8,00,00015,00,000
8,00,0008,00,000
--6,00,000
----3,00,000
You are required to calculate the average rate of return and suggest which project is to be preferred.
Solution:
Calculation of ARR: (Average annual income after taxes ÷ Average investment) × 100
Project X = (2,87,500/10,50,000) × 100 = 27.38 per cent
Project Y = (3,54,167/13,25,000) × 100 = 26.73 per cent
ARR of Project X is higher than that of Project Y. Hence Project X is preferred.
Working Notes:
1. Calculation of Average Annual Income After Depreciation and Taxes:
Project X ` Project Y `
Average EBDT 8,00,000 9,33,333
Less: Depreciation 2,25,000 2,25,000
Average EBT 5,75,000 7,08,333
Less: Taxes at 50 % 2,87,500 3,54,166
Average EAT 2,87,500 3,54,167
2. Calculation of Average Investment
(Original investment – scrap value)1/2 + Additional Working Capital + Scrap value
Project X: (10,00,000 – 1,00,000) 1/2 + 5,00,000 + 1,00,000 = `10,50,000
Project Y: (15,00,000 – 1,50,000) 1/2 + 5,00,000 + 1,50,000 = `13,25,000
3. Depreciation: (Original Investment – Scrap Value ) ÷ Life Period
Project X: (10,00,000 – 1,00,000)/4 = ` 2,25,000
Project Y: (15,00,000 – 1,50,000)/6 = ` 2,25,000
4. Average EBDT = 32,00,000/4 = 8,00,000 56,00,000/6 = 9,33,333
7.3.2 Modern Techniques or Discounted Cash Flow (DCF) Techniques
Modern/discounted cash fl ow techniques take into consideration almost all the defi ciencies of the traditional methods and consider all benefi ts and cost occurring during the projects’ entire life period. Modern techniques can be again subdivided into three, viz., (A) Net Present Value (NPV) (B) Internal Rate of Return (IRR) or trail and error (C) Profi tability Index (PI) or Discounted Benefi t Cost Ratio (DBCR).
Basic Financial Management
Notes
122 LOVELY PROFESSIONAL UNIVERSITY
Net Present Value Method (NPV)
The net present value method is one of the discounted cash fl ow methods. It is also known as discounted benefi t cost ratio method. NPV can be defi ned as preset value of benefi ts minus preset value of costs. It is the process of calculating present values of cash infl ows using cost of capital as an appropriate rate of discount and subtract present value of cash outfl ows from the present value of cash infl ows and fi nd the net present value, which may be positive or negative. Positive net present value occurs when the present value of cash infl ow is higher than the present value of cash outfl ows and vice versa.
Formula
NPV = PV of Cash infl ow – Pv of cash fl ow
Notes Steps involved in computation of NPV
1. Forecasting of cash infl ows of the investment project based on realistic assumptions.
2. Computation of cost of capital, which is used as discounting factor for conversion of future cash infl ows into present values.
3. Calculation of cash fl ows using cost of capital as discounting rate/factor.
4. Finding out NPV by subtracting present value of cash outfl ows from present value of cash infl ows.
Accept-Reject Rule
Acceptance or reject rule of the project is decided based on the NPV.
Accept: NPV> Zero
Reject: NPV< Zero
Consider: NPV= Zero
Advantages of NPV Method
The Merits of NPV are
1. It takes into account the time value of money.
2. It uses all cash infl ows occurring over the entire life period of the project including scrap value of the old project.
3. It is particularly useful for the selection of mutually exclusive projects.
4. It takes into consideration the changing discount rate.
5. It is consistent with the objective of maximization of shareholders’ wealth.
Limitations of NPV Method:
NPV is the most acceptable method in comparison with traditional methods. Nevertheless, it has certain Limitations also.
1. It is diffi cult to understand when compared with PBP and ARR.

Unit 7: Capital Budgeting
Notes
LOVELY PROFESSIONAL UNIVERSITY 123
2. Calculation of required rate or discounting factor or cost of capital is diffi cult, which involves a lengthy and time consuming process and presents illustrations. At the same time calculation cost of capital is based on different methods.
3. In case of projects involving different cash outlays, NPV method may not give dependable results.
Illustration 7: A choice is to be made between the two competing proposals which require an equal investment of ` 50000 and are expected to generate net cash fl ows as under:
Years Project A (`) Project B (`)
1 25000 10000
2 15000 12000
3 10000 18000
4 Nil 25000
5 12000 8000
6 6000 4000
Cost of capital of the company is 10%. The following are the present value factor at 10% p.a.
Year : 1 2 3 4 5 6
P.V. Factor At 10% : 0.909 0.826 0.751 0.683 0.621 0.564
Which proposal should be selected using NPV method? Suggest the best project.
Solution:
Comparative Statement of NPV
Year PV Factor@10%
Project A Project BCash Infl ow Present Value Cash Infl ow Present Value
123456
0.9090.8260.7510.6830.6210.564
250001500010000
Nil120006000
22725123907510
Nil74523384
1000012000180002500080004000
90909912
135181707549682256
Total present Value :Less : Initial Investment :
NPV :
5346150000
Rs. 3461
568195000
Rs. 6819
Since project B has the highest NPV, Project B should be selected.
Illustration 8: The Gama Co., Ltd., is considering the purchase of a new machine. Two alternative machines (X and Y have been suggested, each having an initial cost of ` 400000 and requiring ` 20000 as additional working capital at the end of the 1st year. Earnings after taxation are expected to be as follows:
Year Cash infl owsMachine X ` Machine Y `
12345
40000120000160000240000160000
12000016000020000012000080000
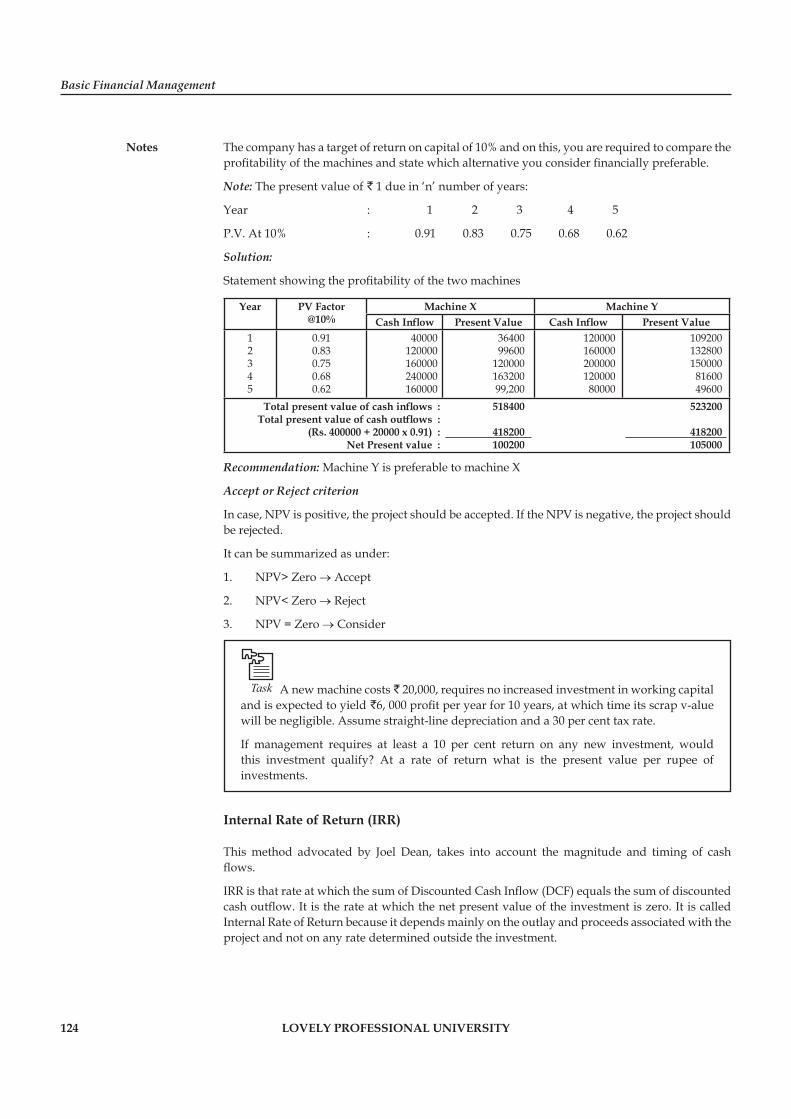
Basic Financial Management
Notes
124 LOVELY PROFESSIONAL UNIVERSITY
The company has a target of return on capital of 10% and on this, you are required to compare the profi tability of the machines and state which alternative you consider fi nancially preferable.
Note: The present value of ` 1 due in ‘n’ number of years:
Year : 1 2 3 4 5
P.V. At 10% : 0.91 0.83 0.75 0.68 0.62
Solution:
Statement showing the profi tability of the two machines
Year PV Factor@10%
Machine X Machine YCash Infl ow Present Value Cash Infl ow Present Value
12345
0.910.830.750.680.62
40000120000160000240000160000
3640099600
12000016320099,200
12000016000020000012000080000
1092001328001500008160049600
Total present value of cash infl ows :Total present value of cash outfl ows :
(Rs. 400000 + 20000 x 0.91) :Net Present value :
518400
418200100200
523200
418200105000
Recommendation: Machine Y is preferable to machine X
Accept or Reject criterion
In case, NPV is positive, the project should be accepted. If the NPV is negative, the project should be rejected.
It can be summarized as under:
1. NPV> Zero → Accept
2. NPV< Zero → Reject
3. NPV = Zero → Consider
Task A new machine costs ` 20,000, requires no increased investment in working capital and is expected to yield `6, 000 profi t per year for 10 years, at which time its scrap v-alue will be negligible. Assume straight-line depreciation and a 30 per cent tax rate.
If management requires at least a 10 per cent return on any new investment, would this investment qualify? At a rate of return what is the present value per rupee of investments.
Internal Rate of Return (IRR)
This method advocated by Joel Dean, takes into account the magnitude and timing of cash fl ows.
IRR is that rate at which the sum of Discounted Cash Infl ow (DCF) equals the sum of discounted cash outfl ow. It is the rate at which the net present value of the investment is zero. It is called Internal Rate of Return because it depends mainly on the outlay and proceeds associated with the project and not on any rate determined outside the investment.
Unit 7: Capital Budgeting
Notes
LOVELY PROFESSIONAL UNIVERSITY 125
?Did u know? This method is also known by following names:
1. Marginal effi ciency of capital
2. Rate of return over cost
3. Time adjusted rate of return
4. Yield on investment
Computation of IRR is based on the cash fl ows after taxes. IRR is mathematically represented as ‘r’. It can be found by trial and error method. In this method the evaluator selects any discount rate to compute present value of cash infl ows. Generally the cost of capital is taken as fi rst trial. If calculated present value of the cash infl ows is higher than the present value cash outfl ows then evaluator has to try at higher rate. On the other hand if the present value of cash infl ows is lower than the present value of cash outfl ows then evaluator has to try lower discounting factor. This process will be repeated till the present value of cash infl ows equals to the present value of cash outfl ows.
Generally, IRR may lie between two discounting factors; in that case analyst has to use interpolation formula for calculation of IRR. The formula is as follows:
% LDPV OIIRR LDF DF
LDPV HDPV−⎡ ⎤= + Δ⎢ ⎥−⎣ ⎦
Where, LDF = Discount factor of low trial
DDF = Difference between low discounting factor and High discounting factor
LDPV = PV of cash infl ows at low discounting factor trial
HDPV = PV of cash infl ows at high discounting factor trial
OI = Original investment
Or
( )0CIRR A B A
C D−
= + × −−
Where,
A = Discounted factor of low trial
B = Discounted factor of high trial
C = Present value of cash infl ow in the low trial
D = Present value of cash infl ow in the high trial
O = Original or initial outlay
Accept-Reject Rule
Acceptance or reject rule of the project decides based upon the calculated IRR and Cost of capital (Ko).
Accepted: IRR > Cost of capital (Ko)
Reject: IRR < Cost of capital (Ko)
Consider: IRR = Cost of capital (Ko)

Basic Financial Management
Notes
126 LOVELY PROFESSIONAL UNIVERSITY
Merits of IRR
1. IRR attempts to fi nd the maximum rate of interest at which funds invested in the project could be repaid out of the cash infl ows arising from that project.
2. It considers the time value of money.
3. It considers cash fl ows thought out the life of the project.
4. It is not in confl ict with the concept of maximizing the welfare of the equity shareholders.
5. It is calculated by the method of trial and error, usually it gives more psychological satisfaction to the user.
6. It is consistent with the objective of shareholders; wealth maximization.
Demerits of IRR
1. Calculation of IRR is quite tedious and it is diffi cult to understand.
2. Both NPV and IRR assume that the cash infl ows can be reinvested at the discounting rate in the new project. However, reinvestment of funds at the cut-off rate is more appropriate than at the IRR. Hence, NPV method is more reliable than IRR to ranking two or more projects.
3. It implies that profi ts can be reinvested at internal rate of return, which is not logical.
4. It produces multiple rate of returns which can be confusing.
5. It does not help in the evaluation of mutually exclusive projects, since a project with highest IRR would be selected. However, in practice, it may not turn out to be the one, that is the most profi table and consistent with the objective of shareholders i.e. wealth maximization.
6. It may not give fruitful results in case of unequal projects life, unequal cash outfl ows, and difference in the timing of cash fl ows.
Note Comparison of NPV and IRR Methods
NPV Method IRR Method
1. Interest rate is a known factor 1. Interest rate is an unknown factor
2. It involves computation of the amount that can be invested in a given project so that the an-ticipated earnings will be suffi cient to repay this amount with market rate of interest.
2. It attempts to fi nd out the maximum rate of interest at which funds are invested in the proj-ect. Earnings from the project in the form of cash fl ow will help us to get back the funds already invested.
3.It assumes that the cash infl ows can be rein-vested at the discounting rate in the new proj-ects.
3. It also assumes that the cash infl ows can be re-invested at the discounting rate in the new proj-ects.
4. Reinvestment is assumed to be at the cut-off rate.
4. Reinvestment in funds is assumed to be at the IRR.
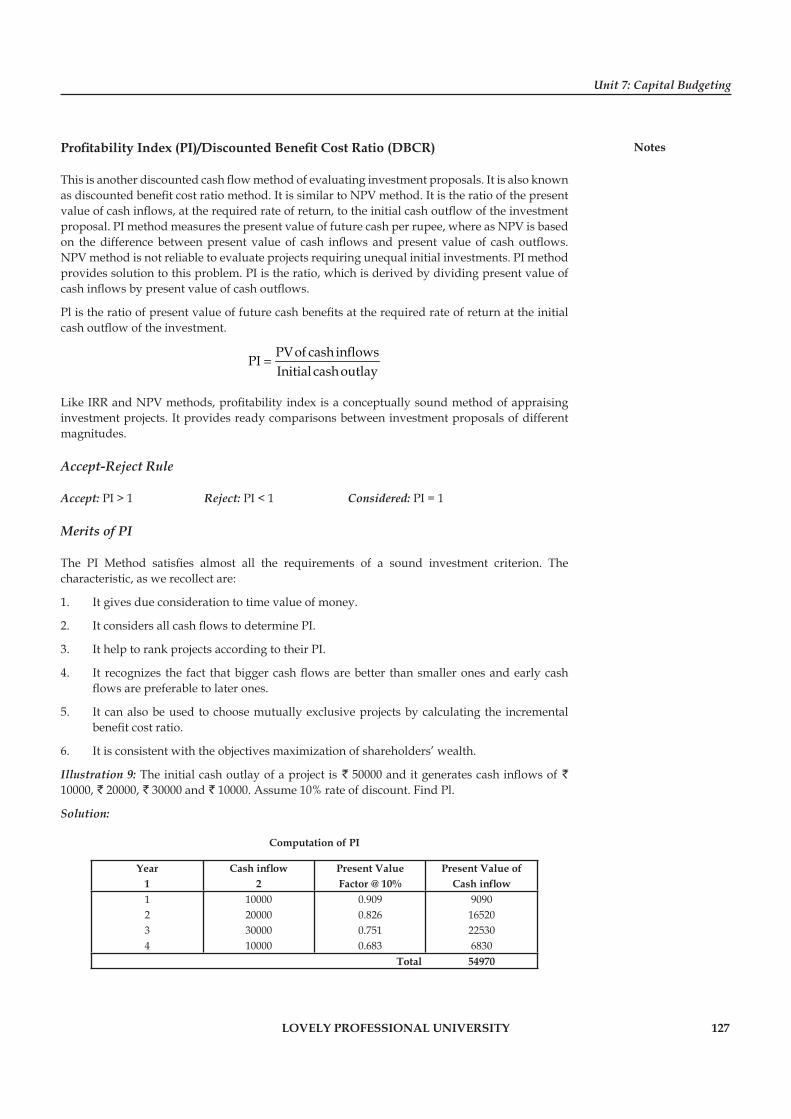
Unit 7: Capital Budgeting
Notes
LOVELY PROFESSIONAL UNIVERSITY 127
Profi tability Index (PI)/Discounted Benefi t Cost Ratio (DBCR)
This is another discounted cash fl ow method of evaluating investment proposals. It is also known as discounted benefi t cost ratio method. It is similar to NPV method. It is the ratio of the present value of cash infl ows, at the required rate of return, to the initial cash outfl ow of the investment proposal. PI method measures the present value of future cash per rupee, where as NPV is based on the difference between present value of cash infl ows and present value of cash outfl ows. NPV method is not reliable to evaluate projects requiring unequal initial investments. PI method provides solution to this problem. PI is the ratio, which is derived by dividing present value of cash infl ows by present value of cash outfl ows.
Pl is the ratio of present value of future cash benefi ts at the required rate of return at the initial cash outfl ow of the investment.
PVof cash inflowsPIInitial cash outlay
=
Like IRR and NPV methods, profi tability index is a conceptually sound method of appraising investment projects. It provides ready comparisons between investment proposals of different magnitudes.
Accept-Reject Rule
Accept: PI > 1 Reject: PI < 1 Considered: PI = 1
Merits of PI
The PI Method satisfi es almost all the requirements of a sound investment criterion. The characteristic, as we recollect are:
1. It gives due consideration to time value of money.
2. It considers all cash fl ows to determine PI.
3. It help to rank projects according to their PI.
4. It recognizes the fact that bigger cash fl ows are better than smaller ones and early cash fl ows are preferable to later ones.
5. It can also be used to choose mutually exclusive projects by calculating the incremental benefi t cost ratio.
6. It is consistent with the objectives maximization of shareholders’ wealth.
Illustration 9: The initial cash outlay of a project is ` 50000 and it generates cash infl ows of ` 10000, ` 20000, ` 30000 and ` 10000. Assume 10% rate of discount. Find Pl.
Solution:
Computation of PI
Year1
Cash infl ow2
Present ValueFactor @ 10%
Present Value ofCash infl ow
1234
10000200003000010000
0.9090.8260.7510.683
909016520225306830
Total 54970
Basic Financial Management
Notes
128 LOVELY PROFESSIONAL UNIVERSITY
PVof cash inflowsPIInitial cash outlay
=
= 54970/50000 = 1.0994
Accept or reject criterion
Accept the project if its profi tability index is greater than one. Such a project will have the positive net present value. Projects can be ranked on the basis of PI. Highest rank will be assigned to the project with highest PI, while the lowest rank will be given to the project having lowest PI.
Illustration 10: A project requires an investment of `10,000 and the expected cash fl ows are: 1st year `12,000; and 2nd year `4,000
The cost of capital is 10 per cent and the PV factors at 10 per cent are 1st year-0.909, 2nd year-0.826. Compute the profi tability index.
Solution:
Profi tability index = Total PV of cash infl ows ÷ Initial investment
= (`12,000 × 0.909 + `4,000 X 0.826) ÷ 10,000
= 14,212 ÷ 10,000 = 1.42
It indicates that for every one rupee investment, there is (1.42-1) 0.42 paise profi t.
Case Study RNS Motors Ltd.
RNS Adwani, an ITI diploma holder had been working with M/s. RNS and workshop for the last ten years. He had joined as a technician. He was recognized as the best mechanic of Supreme Garage. A good number of clients preferred to get
their cars repaired by RNS Adwani . In three years time, he was promoted as a supervisor. RNS Adwani then joined distance education programme of IGNOU and completed his graduation. He studied accounts and would assist the owner Mr. Gupta in maintaining the accounts. Mr. Gupta liked him very much and two years back, RNS Adwani was promoted as the manager of RNS and Workshop.
Gupta had set up this business about 18 years back when he had retired from the Indian Army due to a leg injury. Due to good customer relations and quality service, RNS and workshop had earned a very good reputation and was known as the best motor garage in the district. A large number of clients form the neighbouring district would bring in their vehicles to Supreme Garage. The workshop was known for engine overhauling. It had an electrical section for auto electrical and an agency for Exide batteries. RNS specialized in denting and painting and maintained good relations with insurance companies. It maintained its own tow truck and did good business during accidents and break-downs. It presently employed ten full time mechanics, one supervisor besides RNS Adwani and Gupta who were manager and the owner respectively. During the rush season the workers worked overtime and additional casual labour was also employed to meet the delivery schedules.
Contd...

Unit 7: Capital Budgeting
Notes
LOVELY PROFESSIONAL UNIVERSITY 129
Since past one year, Mrs. Gupta was not keeping well. Six months ago, she had a minor heart attack. Mrs and Mr. Gupta decided to shift to USA and join their daughter, who was a heart specialist at Los Angles, USA. Gupta had no one to succeed him, he decided to sell the business. He wanted the buyer to run the business on similar lines and maintain its reputation.
He called RNS Adwani and made him an offer to sell his business. The initial offer was for ` 57.50 lakh. He also proposed to assist RNS in fi nancing the purchase.
Gupta provided him with the information on past earnings with projections for fi ve years. He also provided him with the Balance Sheet and Profi t and Loss Accounts of RNS Motors as on 31st March 2000. He informed RNS that based upon the business fl ow, he had valued the goodwill as ` 15 lakh.
RNS was excited about the offer. He knew that the business was very profi table and its profi ts had been increasing over the years. It had never been at loss. He consulted a friend who was a banker and also a Chartered Accountant. He advised him differently. He knew there was a scope of negotiation over the price of the business. Now RNS now needs assistance.
Sales and Profi t of Previous Years
Net sales
PBT
PAT
81,95,000
7,37,500
5,25,000
90,34,000
7,56,600
6,23,200
Summary of Projected sales and earnings
Year 2001 2002 2003 2004 2005Net Sales
PBT
PAT
11,00,000
8,65,000
7,00,000
120,00,000
9,50,000
7,80,000
125,00,000
10,50,000
8,60,000
130,00,000
12,00,000
9,30,000
135,00,000
12,50,000
9,75,000
Questions
1. Evaluate the value of RNS Motors using discounted cash fl ow and multiple earning method (Assume 20% required rate of return).
2. How do you think the banker will value this business? Discuss the method and calculate the value.
3. If you were the banker, will you fi nance?
4. How would you evaluate the good will of RNS Motors.
5. As a consultant would you advice Mr. RNS Adwani to buy RNS Motors or not. Explain with reasons.
Contd...
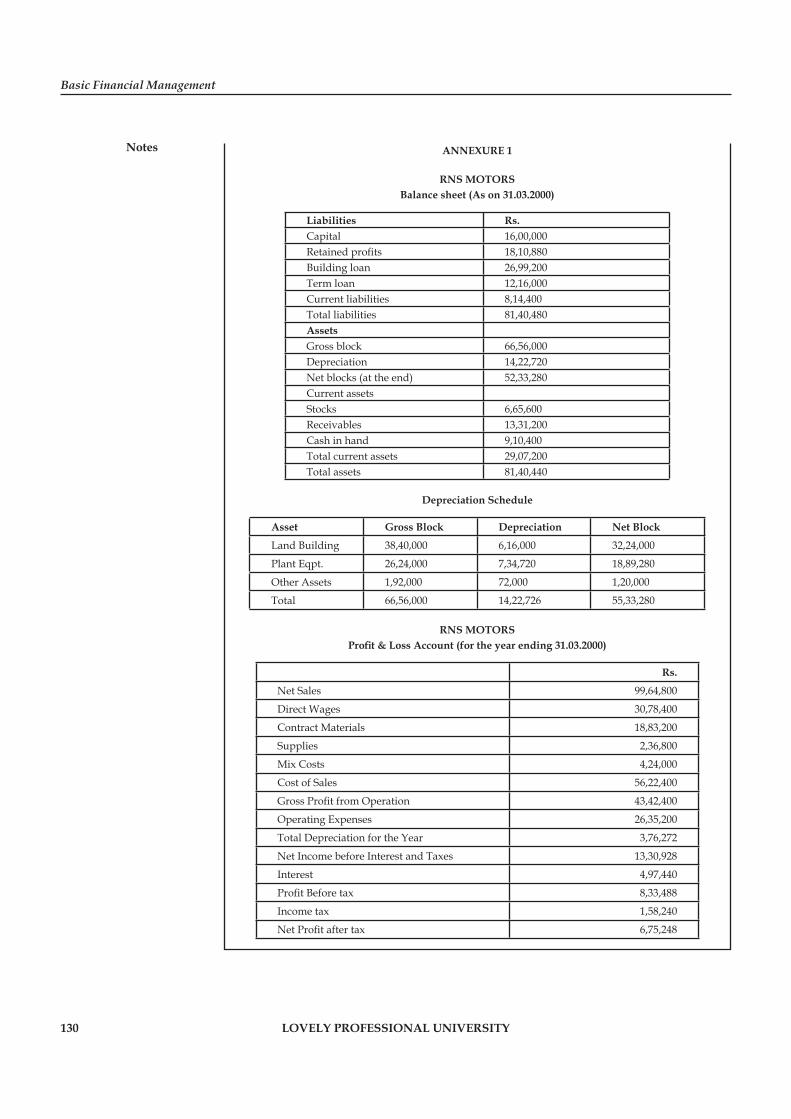
Basic Financial Management
Notes
130 LOVELY PROFESSIONAL UNIVERSITY
ANNEXURE 1
RNS MOTORSBalance sheet (As on 31.03.2000)
Liabilities Rs.Capital 16,00,000Retained profi ts 18,10,880Building loan 26,99,200Term loan 12,16,000Current liabilities 8,14,400Total liabilities 81,40,480AssetsGross block 66,56,000Depreciation 14,22,720Net blocks (at the end) 52,33,280Current assetsStocks 6,65,600Receivables 13,31,200Cash in hand 9,10,400Total current assets 29,07,200Total assets 81,40,440
Depreciation Schedule
Asset Gross Block Depreciation Net Block
Land Building 38,40,000 6,16,000 32,24,000
Plant Eqpt. 26,24,000 7,34,720 18,89,280
Other Assets 1,92,000 72,000 1,20,000
Total 66,56,000 14,22,726 55,33,280
RNS MOTORSProfi t & Loss Account (for the year ending 31.03.2000)
Rs.
Net Sales 99,64,800
Direct Wages 30,78,400
Contract Materials 18,83,200
Supplies 2,36,800
Mix Costs 4,24,000
Cost of Sales 56,22,400
Gross Profi t from Operation 43,42,400
Operating Expenses 26,35,200
Total Depreciation for the Year 3,76,272
Net Income before Interest and Taxes 13,30,928
Interest 4,97,440
Profi t Before tax 8,33,488
Income tax 1,58,240
Net Profi t after tax 6,75,248
Unit 7: Capital Budgeting
Notes
LOVELY PROFESSIONAL UNIVERSITY 131
7.4 Summary
Modern fi nancial manager’s function is effi cient allocation of capital among available investment opportunities. The investment opportunity may be long-term investment or fi xed assets; short–term or current assets.
One of the important problems confronting the top management of a fi rm is to determine whether the fi rm should invest funds in fi xed assets. Fixed assets may be tangible as well as intangible. While the former represent assets like land and buildings, plant and machinery and, furniture and fi xtures, the latter group consists of copyrights, patents and goodwill.
Capital budgeting is the fi rm’s decision to invest its current funds most effi ciently in the long-term assets in anticipation of an expected fl ow of benefi ts over a series of years.
Capital budgeting decisions are important since growth of the fi rm depends on fi xed assets, it is a more risky decision as huge investments are involved, an irreversible decision, it has effect on other projects too, a and diffi cult decision (became the decision is based on future years cash infl ows, and involves uncertainty of future and hence more risk).
Capital budgeting decisions are very important, but they pose diffi culties, which shoot form three principle sources: measurement problem, uncertainty, and temporal spread.
The capital budgeting process may be more or less depended on the type of the project. So fi rm normally classify the projects into different categories. It may differ from one fi rm to another fi rm, but the most important classifi cation of projects are: new projects, expansion projects, diversifi cation projects, replacement and modernization projects, research and development projects, interior decoration, recreational facilities, executive aircrafts, landscaped gardens etc.
A wide range of criteria has been suggested to judge the worthwhileness of investment projects. They are divided into two broad categories, viz., (I) Traditional techniques or non-discounted techniques and (II) Modern techniques or discounted cash fl ow techniques. The traditional techniques are further subdivided into two, such as (a) Pay back period, and (b) Accounting rate of return or average rate of return (ARR). The discounted cash fl ow techniques are again subdivided into three, such as (A) Net present value (NPV) technique, (B) Internal rate of return (IRR) or trial and error technique, and (C) Profi tability Index (PI) of Benefi t Cost Ratio (BCR).
7.5 Keywords
Capital Budgeting: It refers to planning and deployment of available capital for the purpose of maximizing long-term profi tability of the fi rm.
Contingent Investment Proposals: There are certain projects which are contingent upon the acceptance of others.
Mutually Exclusive Investment Proposals: Those proposals which represent alternative methods of doing the same job.
Replacement Investment: The investments, which are contemplated for replacing, old and antiquated equipment so that the job could be performed more effi ciently, are termed as replacement investment.
Basic Financial Management
Notes
132 LOVELY PROFESSIONAL UNIVERSITY
7.6 Self Assessment
Fill in the blanks:
1. Fixed assets represent ....................... and ....................... elements.
2. ....................... is the fi rm’s decision to invest its current funds most effi ciently in the long-term assets in anticipation of an expected fl ow of benefi ts over a series of years.
3. Capital budgeting decisions are ....................... without ....................... .
4. Capital budgeting evaluation techniques are divided into ....................... broad categories.
5. Traditional techniques of capital budgeting evaluation is also known as ....................... .
6. Pay back period and Accounting rate of return methods are ....................... .
7. Modern techniques are also known as ....................... .
8. Discounted cash fl ow techniques are subdivided into ....................... .
9. Net present value (NPV), ......................., and profi tability index are three discounted cash fl ow techniques.
10. Profi tability index technique is also known as ....................... .
State whether the following statements are true or false:
11. Capital budgeting is a short-term decision.
12. CFAT is the base for computation of pay back period.
13. When cash fl ows after taxes are unequal then cumulative cash fl ow method is used to compute pay back period.
14. Intermediate cash fl ows are reinvested at the rate of IRR is the assumption of IRR.
15. Additional working capital required is not added to the cost of the project when evaluation is based on DCF techniques.
16. Additional, scrap value and cost of project are the components of average investment.
17. NPV and IRR both, are DCF methods.
18. If there is a size disparity the NPV and IRR will give different rankings.
7.7 Review Questions
1. A project requires an investment of ̀ 100,000. It is expected t yield an annual cash fl ow after taxes of ` 20,000 for 10 years. Calculate payback period.
2. ABC company is planning to buy an equipment, that had two alternatives A and B. Each equipment requires an initial investment of ` 30,000. From the following additional information you are required to calculate payback period and suggest which equipment should be preferred? why?
Years 1 2 3 4 5
CFATA(`) 10,500 8,000 6,000 7,500 12,000B(`) 3,000 6,000 8,000 12,000 80,000
3. An equipment costs ` 10,00,000 and it is expected to yield a profi t after depreciation but before loss is ` 150,000. Depreciation rate is 10 per cent on straight-line method, and company’s tax rate is 50 per cent, calculate the pay back period.
Unit 7: Capital Budgeting
Notes
LOVELY PROFESSIONAL UNIVERSITY 133
4. A project expected cash fl ows are as follows:
Year 0 1 2 3 4 5CFAT (`) 50,000 10,000 15,000 20,000 25,000 20,000
Calculate pay back period.
5. A project costs `30, 00,000 and yields annually `4, 50,000 after depreciation at 15 per cent but before tax at 40 per cent. Calculate payback period.
6. From the following information calculate pay back period and Accounting Rate of Return
Projects Original Investment CFAT(Rs) Economic lifeABCDE
25,0003,00012,00020,00040,000
3,0001,0002,0004,0008,000
1058102
7. A company is planning to consider any one of the three alternatives A, B and C. Calculate ARR.
Alternatives CFAT(Rs)0 1 2
A
B
C
5,000
5,000
5,000
0
1,080
5,750
6,610
3,080
0
8. From the following cash fl ow (CFAT) stream of X and Y, calculate (a) PBP (b) ARR (c) NPV, and (d) PI.
Years 0 1 2 3 4 5 6 7 8 9 10X (Rs. in Lakhs)Y (Rs. in Lakhs)
46
0.800.80
0.800.80
0.800.80
0.800.80
0.800.80
0.800.60
0.800.70
0.800.30
0.800.30
0.800.40
Assume 10 per cent discounting rate.
9. VS International co, Ltd, is evaluating a project that costs ` 2,00,000 and it require an all additional net working capital of ` 1,00,000. It is expected to generate a net cash fl ow of ` 1,05,000 for 5 years. What is the NPV and IRR of the project assuming 50 per cent tax rate and 10 per cent cash of capital. [Answer: NPV: `, 160.155, IRR: 29.86 per cent]
10. XYZ company is considering the following projects P and Q.
Year 0 1 2 3P
Q
25,000
28,000
5,000
12,672
5,000
12,672
25,640
12,602
Calculate NPV and IRR of both projects. [Answer: NPV:P–Rs.1700, Q–Rs.2436, IRR:P–15 per cent, Q–17 per cent]
11. What is capital budgeting? The process and techniques of capital budgeting.
12. Briefl y discuss the techniques of capital budgeting with their merits and limitations.
13. What is capital budgeting? Discuss its nature, importance and defi ciencies of capital budgeting.
Basic Financial Management
Notes
134 LOVELY PROFESSIONAL UNIVERSITY
Answers: Self Assessment
1. Non-liquid, long-term 2. Capital budgeting
3. Irreversible, loss 4. Two
5. Non-discounted 6. Traditional
7. Discounted cash fl ow techniques 8. Three
9. Internal Rate of Return (IRR) 10. Benefi t cost ratio
11. False 12. True
13. True 14. True
15. False 16. True
17. True 18. True
7.8 Further Readings
Books Chandra, P., Financial Management - Theory and Practice, New Delhi, Tata McGraw
Hill Publishing Company Ltd., 2002, p. 3.
Sudhindra Bhat, Financial Management, New Delhi, Excel Books, 2008.
Van Horne, J.C. and Wachowicz, Jr, J.M., Fundamentals of Financial Management, New Delhi, Prentice Hall of India Pvt. Ltd., 1996, p. 2.
Online link http://www.fei.org/
Unit 8: Working Capital Management
Notes
LOVELY PROFESSIONAL UNIVERSITY 135
Unit 8: Working Capital Management
CONTENTS
Objectives
Introduction
8.1 Concept and Signifi cance of Working Capital
8.1.1 Gross Working Capital Concept
8.1.2 Net Working Capital Concept
8.2 Operating Cycle and Cash Cycle
8.3 Factors Affecting Working Capital Management
8.4 Estimation of Working Capital
8.5 Sources of Working Capital
8.6 Summary
8.7 Keywords
8.8 Self Assessment
8.9 Review Questions
8.10 Further Readings
Objectives
After studying this unit, you will be able to:
Discuss concept and signifi cance of working capital
Explain determining working capital requirements
Introduction
Working capital management is signifi cant in fi nancial management due to the fact that it plays a vital role in keeping the wheel of the business running. Every business requires capital, without which it cannot be promoted. Investment decision is concerned with investment in current assets and fi xed assets. There are two assets required to be fi nanced by fi xed capital and working capital. In other words, the required capital can be divided into two categories, such as fi xed capital and working capital. Fixed capital required for establishment of a business, where as working capital required to utilize fi xed assets. Fixed assets cannot be utilized without current assets. It is just like a blood in the human body, without which there is no body.
8.1 Concept and Signifi cance of Working Capital
Working capital refers to short-term funds to meet operating expenses. It refers to the funds, which a company must possess to fi nance its day-to-day operations. It is concerned with the management of the fi rm’s current assets and current liabilities. It relates with the problems that arise in attempting to manage the current assets, current liabilities and their inter-relationship that exists between them. If a fi rm cannot maintain a satisfactory level of working capital, it is likely to become insolvent and may even be forced into bankruptcy.
Basic Financial Management
Notes
136 LOVELY PROFESSIONAL UNIVERSITY
!Caution The concept of working capital has been a matter of great controversy, among the fi nancial wizards and they view it differently. There is no universally accepted defi nition of working capital. Broadly, there are two concepts of working capital commonly found in the existing literature of fi nance such as:
1. Gross Working Capital (Quantitative Concept), and
2. Net Working Capital (Qualitative Concept).
Both these concepts of working capital have operational signifi cance. The two concepts are not to be regarded as mutually exclusive. Each has its relevance in specifi c situations from the management point of view.
Each concept of working capital has its own signifi cance – the ‘gross concept’ emphasising the ‘use’ and the ‘net concept’ the ‘source’ – an integration of both these concepts is necessary in order to understand working capital management in the context of risk, return and uncertainty.
8.1.1 Gross Working Capital Concept
According to this concept, the total current assets are termed as the gross working capital or circulating capital. Total current assets include; cash, marketable securities, accounts receivables, inventory, prepaid expense, advance payment of tax; etc. This concept also called as ‘quantitative or broader approach’. To quote Weston and Brigham, “Gross Working Capital refers to fi rm’s investments in short term assets such as cash, short term securities, accounts receivables and inventories”. The concept helps in making optimum investment in current assets and their fi nancing. According to Walker, “Use of this concept is helpful in providing for the current amount of working capital at the right time so that the fi rm is able to realise the greatest return on investment”. The supporters of this concept like Mead, Field, and Baker and Malott, argue that the management is very much concerned with the total current assets as they constitute the total funds available for operating process.
Signifi cance
Gross Working Capital Concept focuses attention on the two aspects of current assets management, they are:
1. Optimum Investment in Current Assets: Investment in current assets must be just adequate to the needs of the fi rm. In other words, current assets investment should not be inadequate or excessive. Inadequate working capital can disturb production and can also threaten the solvency of the fi rm, if it fails to meet its current obligations. On the other hand, excessive investment in current assets should be avoided, since it impairs the fi rm’s profi tability.
2. Financing of Current Assets: Need for working capital arise due to the increasing level of business activity. Therefore, there is a need to provide/arrange it quickly. Similarly, some times surplus funds may arise, thus they should be invested in short-term securities. They should not be kept as idle.
8.1.2 Net Working Capital Concept
As per this concept, the excess of current assets over current liabilities represents net working capital. Similar view is expressed by Guthmann and Dougall, Gerstenberg, Goel, Park and Gladson, Kennedy and McMullen, and Myer in their distinguished works. ‘Accounts Hand Book’ has also fully supported this view. The famous economists like, Sailer, Lincoln, and Stevens, fully
Unit 8: Working Capital Management
Notes
LOVELY PROFESSIONAL UNIVERSITY 137
supported this concept and viewed that the net working capital helps creditors and investors to judge the fi nancial soundness of a fi rm.
Net Working Capital Concept represents the amount of the current assets, which would remain after all the current liabilities were paid. It may be either positive or negative. It will be positive, if current assets exceed the current liabilities and negative, if the current liabilities are in excess of current assets. Another alternative defi nition is that net working capital refers to that portion of fi rm’s current assets, which fi nanced with long-term funds.
Net Working Capital Concept indicates or measures the liquidity and also suggests the extent to which working capital needs may be fi nanced by the permanent source of funds. To quote Roy Chowdary, “Net Working Capital indicates the liquidity of the business whilst gross working capital denotes the quantum of working capital with which business has to operate”.
Net working capital = Current Assets – Current Liabilities
Signifi cance
Net Working Capital Concept focuses attention on the two aspects of current assets management, they are: (i) Maintaining liquidity position, and (ii) To decide upon the extent of long-term capital in fi nancing current assets.
1. Maintaining Liquidity Position: For maintaining liquidity position there is a need to maintain current assets suffi ciently in excess of current liabilities. In other words, excess current assets helps in meeting its fi nancial obligation within the operating cycle of the fi rm. Generally for every one rupee of current asset there will be one rupee of current liability. As discussed above, negative and excess working capitals both are bad to the fi rm.
2. To decide upon the Extent of Long-term Capital in Financing Current Assets: Net Working Capital (NWC) means the portion of current assets that should be fi nanced by long-term funds. This concept helps to decide the extent of long-term funds required in fi nance current assets.
Example: If there are ` 1, 00,000 current assets and ` 75,000 current liabilities, the extent of current assets should be decided by the NWC base. The NWC is the difference between current assets and current liabilities. In the above example NWC is ` 25,000. This is the amount that is supposed to be fi nanced by long-term funds.
Hence, NWC helps management to decide the extent to which current assets should be fi nanced with equity capital and borrowed funds.
8.2 Operating Cycle and Cash Cycle
The continuing fl ow from cash to suppliers, to inventory, to accounts receivables and back into cash is what is called the operating cycle. The operating cycle involves the following procedure:
1. Conversion of cash into raw materials.
2. Conversion of raw materials into work-in-process.
3. Conversion of work-in-process into fi nished goods.
4. Conversion of fi nished goods into sales [debtors and cash].
If fi rm sells good on cash basis with (d) operating cycle then returns to the operating cycle (a). But if, fi rm sells goods on credit basis then there will be another cycle that is,
5. Conversion of debtors into cash.
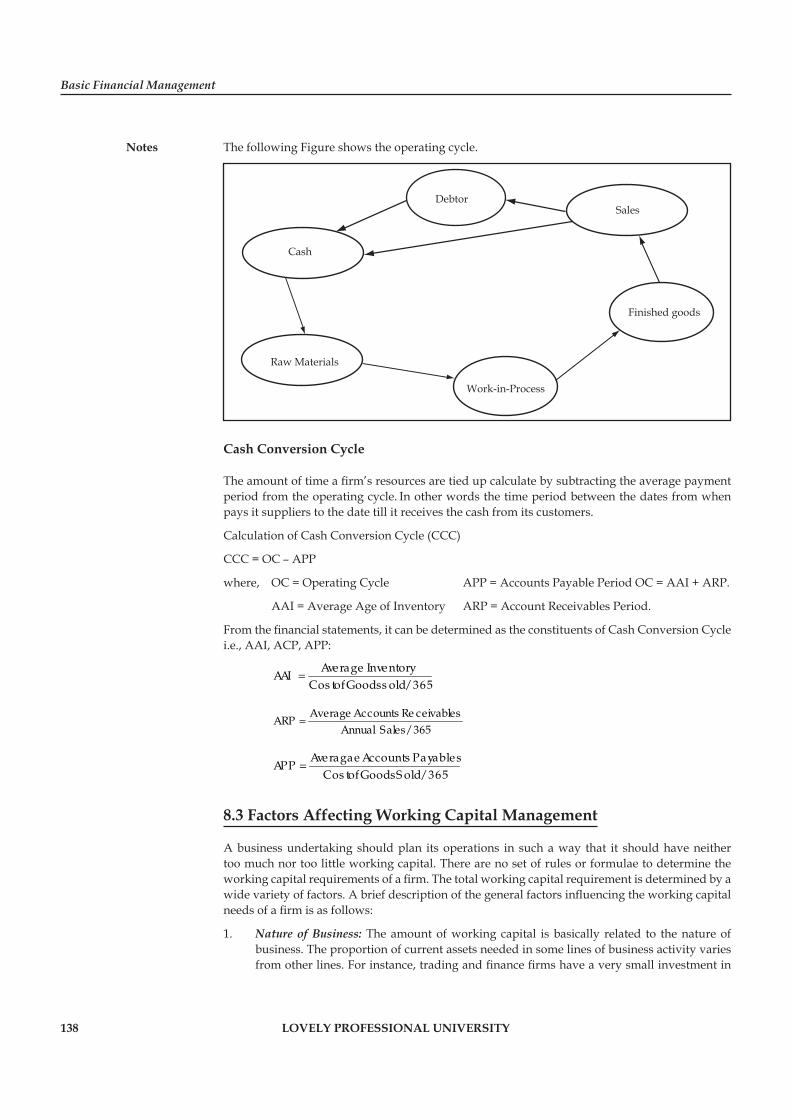
Basic Financial Management
Notes
138 LOVELY PROFESSIONAL UNIVERSITY
The following Figure shows the operating cycle.
DebtorSales
Finished goods
Work-in-Process
Raw Materials
Cash
Cash Conversion Cycle
The amount of time a fi rm’s resources are tied up calculate by subtracting the average payment period from the operating cycle. In other words the time period between the dates from when pays it suppliers to the date till it receives the cash from its customers.
Calculation of Cash Conversion Cycle (CCC)
CCC = OC – APP
where, OC = Operating Cycle APP = Accounts Payable Period OC = AAI + ARP.
AAI = Average Age of Inventory ARP = Account Receivables Period.
From the fi nancial statements, it can be determined as the constituents of Cash Conversion Cycle i.e., AAI, ACP, APP:
365/s oldGoodsofCos tInventoryAverage
AAI =
365/SalesAnnualceivablesReAccountsAverage
ARP =
365/S oldGoodsofCos tPayablesAccountsAveragae
APP =
8.3 Factors Affecting Working Capital Management
A business undertaking should plan its operations in such a way that it should have neither too much nor too little working capital. There are no set of rules or formulae to determine the working capital requirements of a fi rm. The total working capital requirement is determined by a wide variety of factors. A brief description of the general factors infl uencing the working capital needs of a fi rm is as follows:
1. Nature of Business: The amount of working capital is basically related to the nature of business. The proportion of current assets needed in some lines of business activity varies from other lines. For instance, trading and fi nance fi rms have a very small investment in
Unit 8: Working Capital Management
Notes
LOVELY PROFESSIONAL UNIVERSITY 139
fi xed assets, but they require more working capital. In contrast, public utility concerns rendering public services require huge investment in fi xed assets.
2. Size of Business: It may be argued that a fi rm’s size, measured in terms of assets or sales, affects need for working capital. Size may be measured in terms of a scale of operation. A fi rm having with large-scale operations will need more working capital required then a small fi rm having small-scale operations. A small fi rm may use extra current assets as a cushion against cash fl ow interruptions.
3. Production Cycle Process: This is another factor, which has bearing on the quantum of working capital, is the production cycle. The term production or manufacturing cycle refers to the time involved in the manufacturing of goods. It covers the time span between the procurement of raw materials and the completion of the manufacturing process leading to the production of fi nished goods. Longer the production cycle, the higher will be the working capital requirement and vice versa.
5. Credit Policy or Terms of Purchase and Sales: The credit policy relating to sales and purchases also affects the working capital. If a company purchases raw materials in cash and sells goods on credit, it will require larger amount of working capital. On the contrary, a concern having credit facilities for the purchase of raw materials and allowing no credit to its customers will require lesser amount of working capital.
6. Business Cycle: The amount of working capital requirements of a fi rm varies with every movement of business cycle. The variations in business conditions may be in two directions (a) Upward phase – when boom conditions prevail, in this case more working capital is required to cover the lag between the increased sales and receipt of cash as well as to fi nance purchase of additional material. (b) Downswing phase – in this case, the need for working capital will be very less, since there is no growth in sales.
8. Scarce Availability of Raw Materials: The availability of certain raw materials on a continuous basis without interruption would sometimes affect the working capital requirement. There may be some materials, which cannot be procured easily either because of either their sources are few or they are irregular. Therefore, the fi rm might be compelled to purchase more than required to manage smooth production. In this case, the amount of working capital required is large.
11. Dividend Policy: Dividend has a bearing on working capital, since it is appropriation profi ts. The payment of dividend reduces cash resources and thereby, affects working capital to that extent. Conversely, if the fi rm does not pay dividends but retains profi ts, the working capital increases. In other words, declaration of dividends leads to more working capital requirement and vice versa.
14. Operating Effi ciency: The operating effi ciency of the fi rm relates to the optimum utilisation of resources at minimum costs. Effi ciency of operations accelerates the pace of cash cycle and involves the working capital turnover. In this case the amount of working capital needed is less since it releases pressure by improving profi tability and improving the internal generation of funds.
15. Availability of Credit: The need for working capital in a fi rm will be less, if it avails liberal credit facilities. Similarly, the availability of credit from banks also infl uences the working capital needs of the fi rm. A fi rm enjoying bank credit facilities can secure funds to fi nance its working capital requirement very easily, whenever it requires. It can therefore, perform its business activities with less working capital than a fi rm without such credit facility.
The amount of working capital is also infl uenced by the inventory policies, depreciation policies, management attitude and wages and government policies.
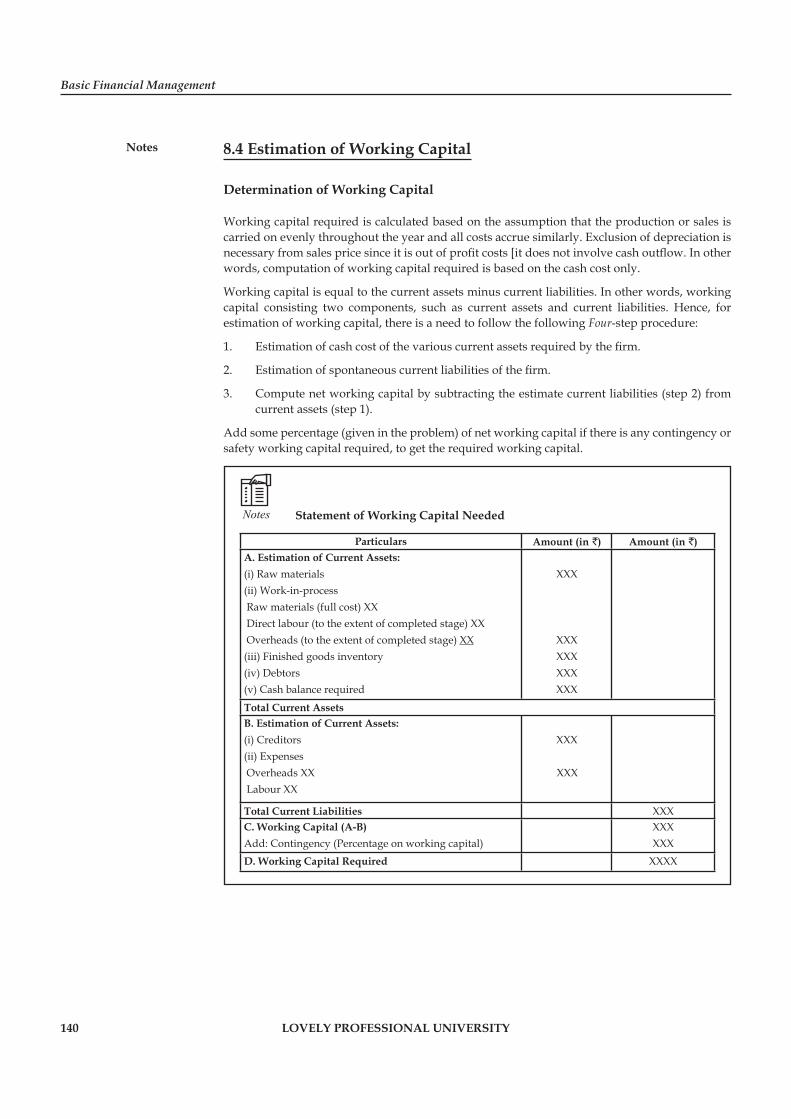
Basic Financial Management
Notes
140 LOVELY PROFESSIONAL UNIVERSITY
8.4 Estimation of Working Capital
Determination of Working Capital
Working capital required is calculated based on the assumption that the production or sales is carried on evenly throughout the year and all costs accrue similarly. Exclusion of depreciation is necessary from sales price since it is out of profi t costs [it does not involve cash outfl ow. In other words, computation of working capital required is based on the cash cost only.
Working capital is equal to the current assets minus current liabilities. In other words, working capital consisting two components, such as current assets and current liabilities. Hence, for estimation of working capital, there is a need to follow the following Four-step procedure:
1. Estimation of cash cost of the various current assets required by the fi rm.
2. Estimation of spontaneous current liabilities of the fi rm.
3. Compute net working capital by subtracting the estimate current liabilities (step 2) from current assets (step 1).
Add some percentage (given in the problem) of net working capital if there is any contingency or safety working capital required, to get the required working capital.
Notes Statement of Working Capital Needed
Particulars Amount (in `) Amount (in `)A. Estimation of Current Assets:(i) Raw materials (ii) Work-in-process Raw materials (full cost) XX Direct labour (to the extent of completed stage) XX Overheads (to the extent of completed stage) XX(iii) Finished goods inventory(iv) Debtors(v) Cash balance required
XXX
XXXXXXXXXXXX
Total Current AssetsB. Estimation of Current Assets:(i) Creditors (ii) Expenses Overheads XX Labour XX
XXX
XXX
Total Current Liabilities XXXC. Working Capital (A-B)Add: Contingency (Percentage on working capital)
XXXXXX
D. Working Capital Required XXXX
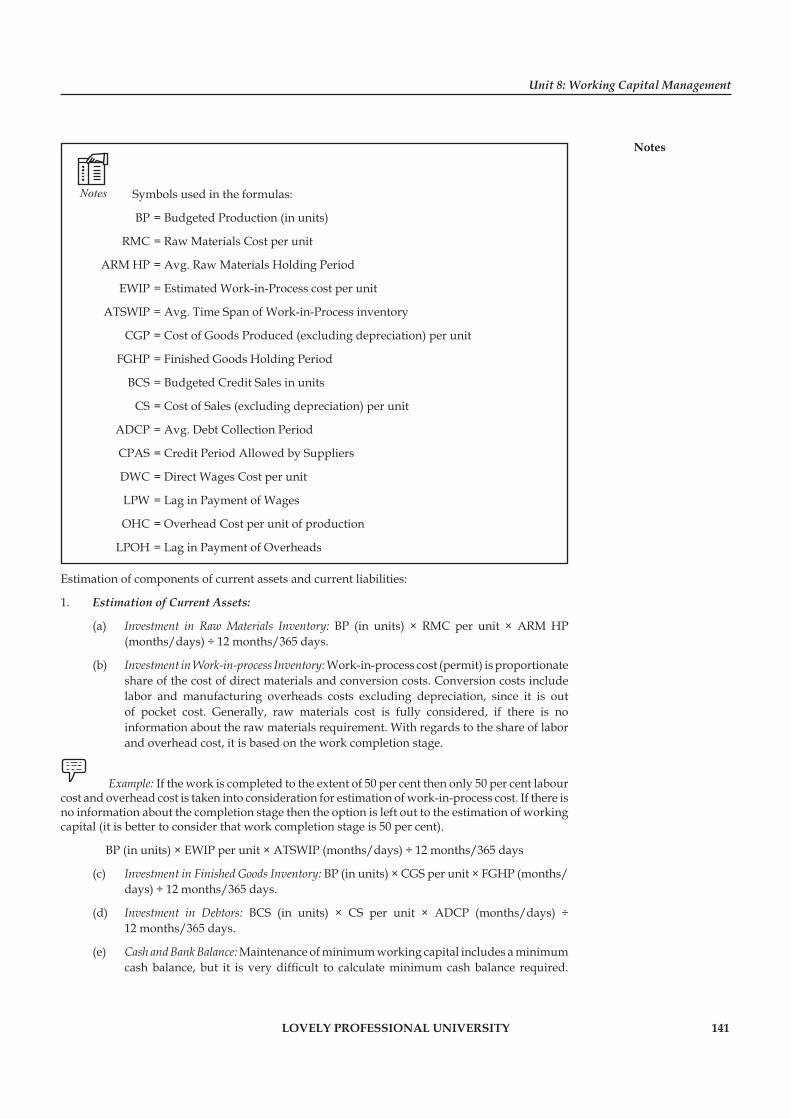
Unit 8: Working Capital Management
Notes
LOVELY PROFESSIONAL UNIVERSITY 141
Notes Symbols used in the formulas:
BP = Budgeted Production (in units)
RMC = Raw Materials Cost per unit
ARM HP = Avg. Raw Materials Holding Period
EWIP = Estimated Work-in-Process cost per unit
ATSWIP = Avg. Time Span of Work-in-Process inventory
CGP = Cost of Goods Produced (excluding depreciation) per unit
FGHP = Finished Goods Holding Period
BCS = Budgeted Credit Sales in units
CS = Cost of Sales (excluding depreciation) per unit
ADCP = Avg. Debt Collection Period
CPAS = Credit Period Allowed by Suppliers
DWC = Direct Wages Cost per unit
LPW = Lag in Payment of Wages
OHC = Overhead Cost per unit of production
LPOH = Lag in Payment of Overheads
Estimation of components of current assets and current liabilities:
1. Estimation of Current Assets:
(a) Investment in Raw Materials Inventory: BP (in units) × RMC per unit × ARM HP (months/days) ÷ 12 months/365 days.
(b) Investment in Work-in-process Inventory: Work-in-process cost (permit) is proportionate share of the cost of direct materials and conversion costs. Conversion costs include labor and manufacturing overheads costs excluding depreciation, since it is out of pocket cost. Generally, raw materials cost is fully considered, if there is no information about the raw materials requirement. With regards to the share of labor and overhead cost, it is based on the work completion stage.
Example: If the work is completed to the extent of 50 per cent then only 50 per cent labour cost and overhead cost is taken into consideration for estimation of work-in-process cost. If there is no information about the completion stage then the option is left out to the estimation of working capital (it is better to consider that work completion stage is 50 per cent).
BP (in units) × EWIP per unit × ATSWIP (months/days) ÷ 12 months/365 days
(c) Investment in Finished Goods Inventory: BP (in units) × CGS per unit × FGHP (months/ days) ÷ 12 months/365 days.
(d) Investment in Debtors: BCS (in units) × CS per unit × ADCP (months/days) ÷ 12 months/365 days.
(e) Cash and Bank Balance: Maintenance of minimum working capital includes a minimum cash balance, but it is very diffi cult to calculate minimum cash balance required.
Basic Financial Management
Notes
142 LOVELY PROFESSIONAL UNIVERSITY
Generally determination of minimum cash balance would be based on the motives for holding cash of business fi rm, attitude of management towards risk, accessibility of the fi rm to the sources of fi nance, when needed and past experience etc. Generally in examinations the minimum cash balance will be provided.
2. Estimation of Current Liabilities:
(a) Trade Debtors: BP (in units) × RMC per unit production × CPAS (months/days) ÷ 12 months/365 days.
(b) Direct Wages: BP (in units) × DWC per unit × LPW (months/days) ÷ 12 months/365 days.
(c) Overheads: BP (in units) × OHC per unit of production × LPOH (months/days) ÷ 12 months/365 days.
Example: From the following information of VSGR Company Ltd., estimate the working capital needed to fi nance a level of activity of 1,10,000 units of production after adding a 10 per cent safety contingency.
Amount (per unit)
Raw materials 78
Direct labour 29
Overheads (excluding depreciation) 58
Total cost 165
Profi t 24
Selling price 189
Additional information:
Average raw materials in stock: One month
Average materials-in-process (50 per cent completion stage): Half a month
Average fi nished goods in stock: One month
Credit allowed by suppliers: One month
Credit allowed to customers: two months
Time lag in payment of wages: One and half weeks
Overhead expenses: one month
One fourth of the sales is on cash basis. Cash balance is expected to be ̀ 2,15,000. You may assume that production is carried on evenly throughout the year and wages and overhead expenses accrue similarly.
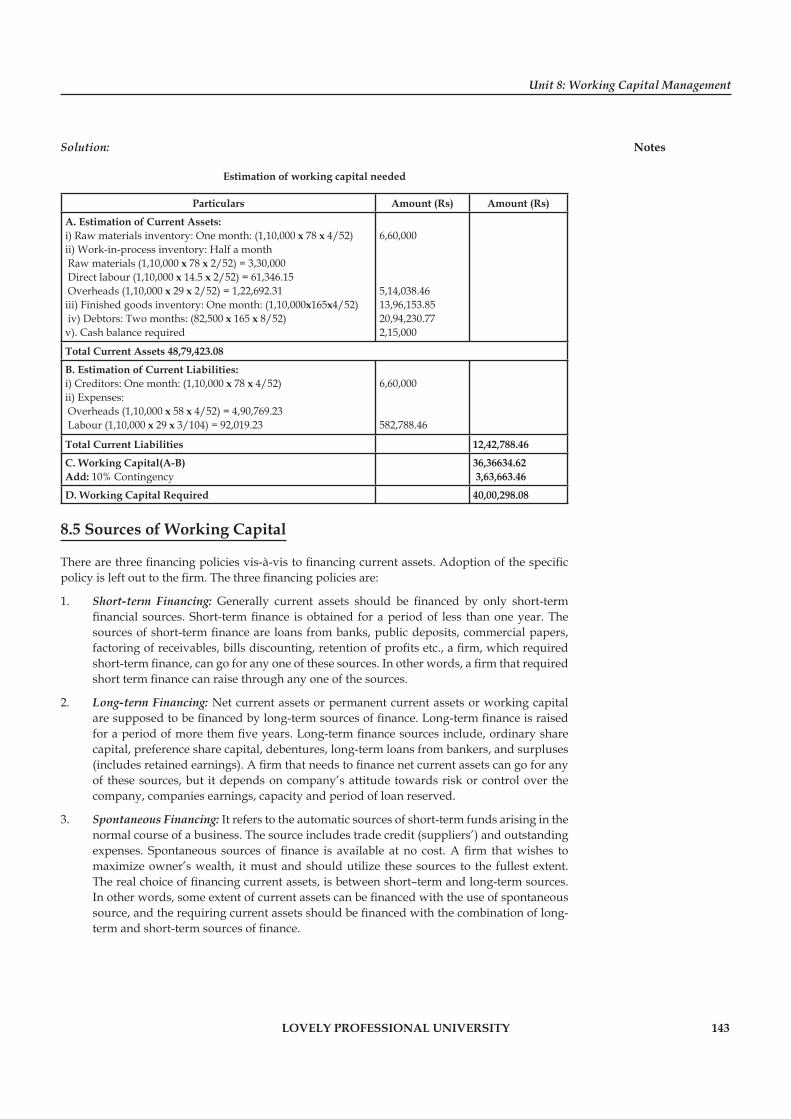
Unit 8: Working Capital Management
Notes
LOVELY PROFESSIONAL UNIVERSITY 143
Solution:
Estimation of working capital needed
Particulars Amount (Rs) Amount (Rs)
A. Estimation of Current Assets:i) Raw materials inventory: One month: (1,10,000 x 78 x 4/52) ii) Work-in-process inventory: Half a month Raw materials (1,10,000 x 78 x 2/52) = 3,30,000 Direct labour (1,10,000 x 14.5 x 2/52) = 61,346.15 Overheads (1,10,000 x 29 x 2/52) = 1,22,692.31iii) Finished goods inventory: One month: (1,10,000x165x4/52) iv) Debtors: Two months: (82,500 x 165 x 8/52)v). Cash balance required
6,60,000
5,14,038.4613,96,153.8520,94,230.772,15,000
Total Current Assets 48,79,423.08
B. Estimation of Current Liabilities:i) Creditors: One month: (1,10,000 x 78 x 4/52) ii) Expenses: Overheads (1,10,000 x 58 x 4/52) = 4,90,769.23 Labour (1,10,000 x 29 x 3/104) = 92,019.23
6,60,000
582,788.46
Total Current Liabilities 12,42,788.46
C. Working Capital(A-B)Add: 10% Contingency
36,36634.62 3,63,663.46
D. Working Capital Required 40,00,298.08
8.5 Sources of Working Capital
There are three fi nancing policies vis-à-vis to fi nancing current assets. Adoption of the specifi c policy is left out to the fi rm. The three fi nancing policies are:
1. Short-term Financing: Generally current assets should be fi nanced by only short-term fi nancial sources. Short-term fi nance is obtained for a period of less than one year. The sources of short-term fi nance are loans from banks, public deposits, commercial papers, factoring of receivables, bills discounting, retention of profi ts etc., a fi rm, which required short-term fi nance, can go for any one of these sources. In other words, a fi rm that required short term fi nance can raise through any one of the sources.
2. Long-term Financing: Net current assets or permanent current assets or working capital are supposed to be fi nanced by long-term sources of fi nance. Long-term fi nance is raised for a period of more them fi ve years. Long-term fi nance sources include, ordinary share capital, preference share capital, debentures, long-term loans from bankers, and surpluses (includes retained earnings). A fi rm that needs to fi nance net current assets can go for any of these sources, but it depends on company’s attitude towards risk or control over the company, companies earnings, capacity and period of loan reserved.
3. Spontaneous Financing: It refers to the automatic sources of short-term funds arising in the normal course of a business. The source includes trade credit (suppliers’) and outstanding expenses. Spontaneous sources of fi nance is available at no cost. A fi rm that wishes to maximize owner’s wealth, it must and should utilize these sources to the fullest extent. The real choice of fi nancing current assets, is between short–term and long-term sources. In other words, some extent of current assets can be fi nanced with the use of spontaneous source, and the requiring current assets should be fi nanced with the combination of long-term and short-term sources of fi nance.
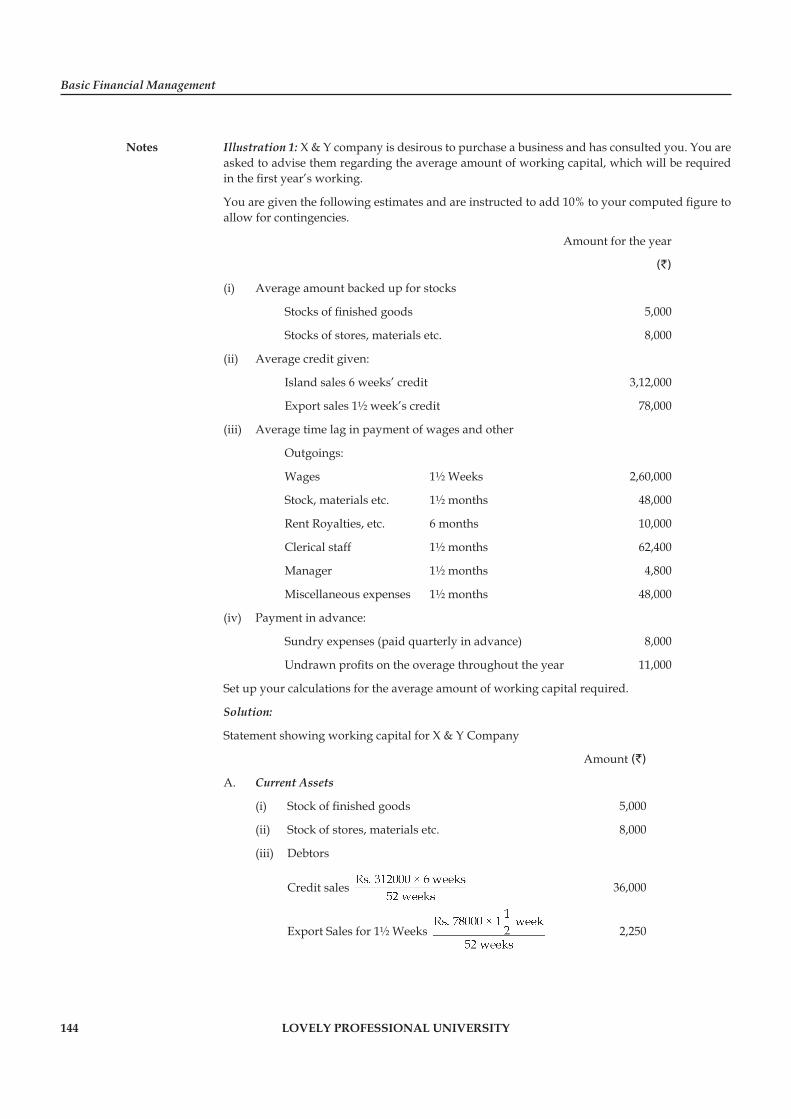
Basic Financial Management
Notes
144 LOVELY PROFESSIONAL UNIVERSITY
Illustration 1: X & Y company is desirous to purchase a business and has consulted you. You are asked to advise them regarding the average amount of working capital, which will be required in the fi rst year’s working.
You are given the following estimates and are instructed to add 10% to your computed fi gure to allow for contingencies.
Amount for the year
(`)
(i) Average amount backed up for stocks
Stocks of fi nished goods 5,000
Stocks of stores, materials etc. 8,000
(ii) Average credit given:
Island sales 6 weeks’ credit 3,12,000
Export sales 1½ week’s credit 78,000
(iii) Average time lag in payment of wages and other
Outgoings:
Wages 1½ Weeks 2,60,000
Stock, materials etc. 1½ months 48,000
Rent Royalties, etc. 6 months 10,000
Clerical staff 1½ months 62,400
Manager 1½ months 4,800
Miscellaneous expenses 1½ months 48,000
(iv) Payment in advance:
Sundry expenses (paid quarterly in advance) 8,000
Undrawn profi ts on the overage throughout the year 11,000
Set up your calculations for the average amount of working capital required.
Solution:
Statement showing working capital for X & Y Company
Amount (`)
A. Current Assets
(i) Stock of fi nished goods 5,000
(ii) Stock of stores, materials etc. 8,000
(iii) Debtors
Credit sales 36,000
Export Sales for 1½ Weeks 2,250
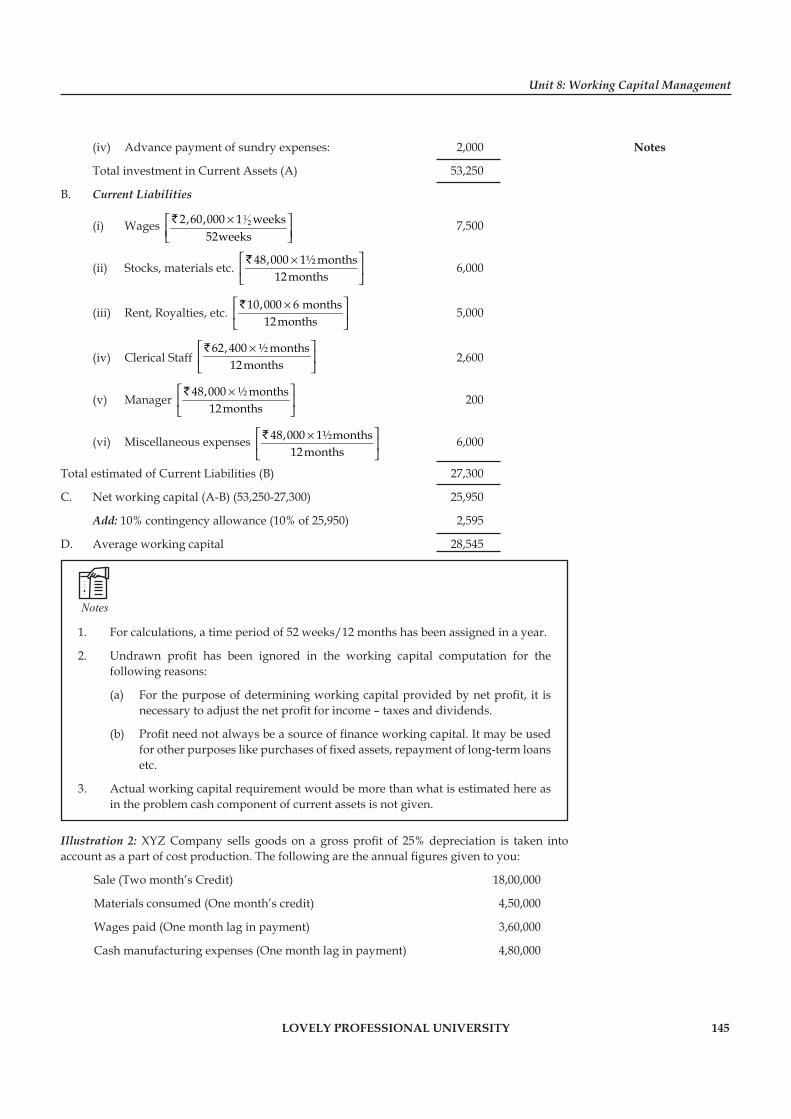
Unit 8: Working Capital Management
Notes
LOVELY PROFESSIONAL UNIVERSITY 145
(iv) Advance payment of sundry expenses: 2,000
Total investment in Current Assets (A) 53,250
B. Current Liabilities
(i) Wages 1
22,60,000 1 weeks52weeks
×⎡ ⎤⎢ ⎥⎣ ⎦` 7,500
(ii) Stocks, materials etc. 48,000 1½ months
12months⎡ ⎤×⎢ ⎥⎣ ⎦
` 6,000
(iii) Rent, Royalties, etc. 10,000 6 months
12months⎡ ⎤×⎢ ⎥⎣ ⎦
` 5,000
(iv) Clerical Staff 62,400 ½ months
12months⎡ ⎤×⎢ ⎥⎣ ⎦
` 2,600
(v) Manager 48,000 ½ months
12months⎡ ⎤×⎢ ⎥⎣ ⎦
` 200
(vi) Miscellaneous expenses 48,000 1½months12months
⎡ ⎤×⎢ ⎥⎣ ⎦
` 6,000
Total estimated of Current Liabilities (B) 27,300
C. Net working capital (A-B) (53,250-27,300) 25,950
Add: 10% contingency allowance (10% of 25,950) 2,595
D. Average working capital 28,545
Notes
1. For calculations, a time period of 52 weeks/12 months has been assigned in a year.
2. Undrawn profi t has been ignored in the working capital computation for the following reasons:
(a) For the purpose of determining working capital provided by net profi t, it is necessary to adjust the net profi t for income – taxes and dividends.
(b) Profi t need not always be a source of fi nance working capital. It may be used for other purposes like purchases of fi xed assets, repayment of long-term loans etc.
3. Actual working capital requirement would be more than what is estimated here as in the problem cash component of current assets is not given.
Illustration 2: XYZ Company sells goods on a gross profi t of 25% depreciation is taken into account as a part of cost production. The following are the annual fi gures given to you:
Sale (Two month’s Credit) 18,00,000
Materials consumed (One month’s credit) 4,50,000
Wages paid (One month lag in payment) 3,60,000
Cash manufacturing expenses (One month lag in payment) 4,80,000
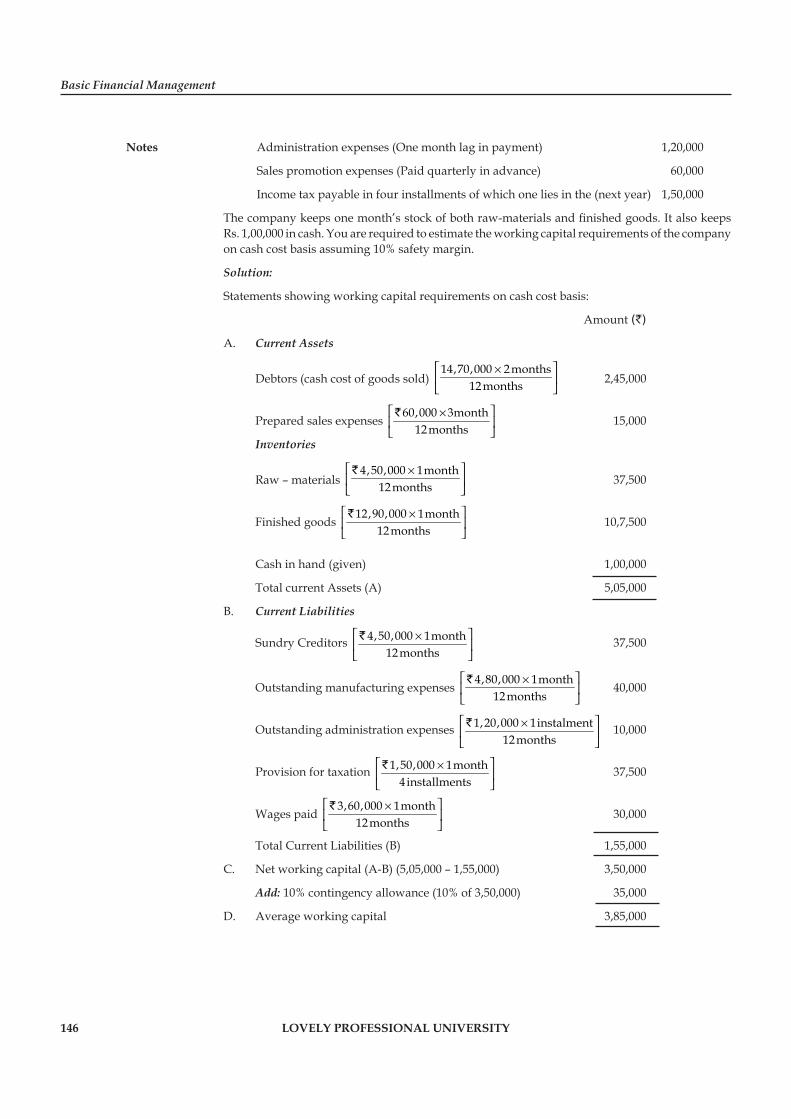
Basic Financial Management
Notes
146 LOVELY PROFESSIONAL UNIVERSITY
Administration expenses (One month lag in payment) 1,20,000
Sales promotion expenses (Paid quarterly in advance) 60,000
Income tax payable in four installments of which one lies in the (next year) 1,50,000
The company keeps one month’s stock of both raw-materials and fi nished goods. It also keeps Rs. 1,00,000 in cash. You are required to estimate the working capital requirements of the company on cash cost basis assuming 10% safety margin.
Solution:
Statements showing working capital requirements on cash cost basis:
Amount (`)
A. Current Assets
Debtors (cash cost of goods sold) 14,70,000 2months
12months⎡ ⎤×⎢ ⎥⎣ ⎦
2,45,000
Prepared sales expenses 60,000 3month
12months⎡ ⎤×⎢ ⎥⎣ ⎦
` 15,000
Inventories
Raw – materials 4,50,000 1month
12months⎡ ⎤×⎢ ⎥⎣ ⎦
` 37,500
Finished goods 12,90,000 1month
12months⎡ ⎤×⎢ ⎥⎣ ⎦
` 10,7,500
Cash in hand (given) 1,00,000
Total current Assets (A) 5,05,000
B. Current Liabilities
Sundry Creditors 4,50,000 1month12months
⎡ ⎤×⎢ ⎥⎣ ⎦
` 37,500
Outstanding manufacturing expenses 4,80,000 1month
12months⎡ ⎤×⎢ ⎥⎣ ⎦
` 40,000
Outstanding administration expenses 1,20,000 1instalment12months
⎡ ⎤×⎢ ⎥⎣ ⎦
` 10,000
Provision for taxation 1,50,000 1month4installments
⎡ ⎤×⎢ ⎥⎣ ⎦
` 37,500
Wages paid 3,60,000 1month
12months⎡ ⎤×⎢ ⎥⎣ ⎦
` 30,000
Total Current Liabilities (B) 1,55,000
C. Net working capital (A-B) (5,05,000 – 1,55,000) 3,50,000
Add: 10% contingency allowance (10% of 3,50,000) 35,000
D. Average working capital 3,85,000
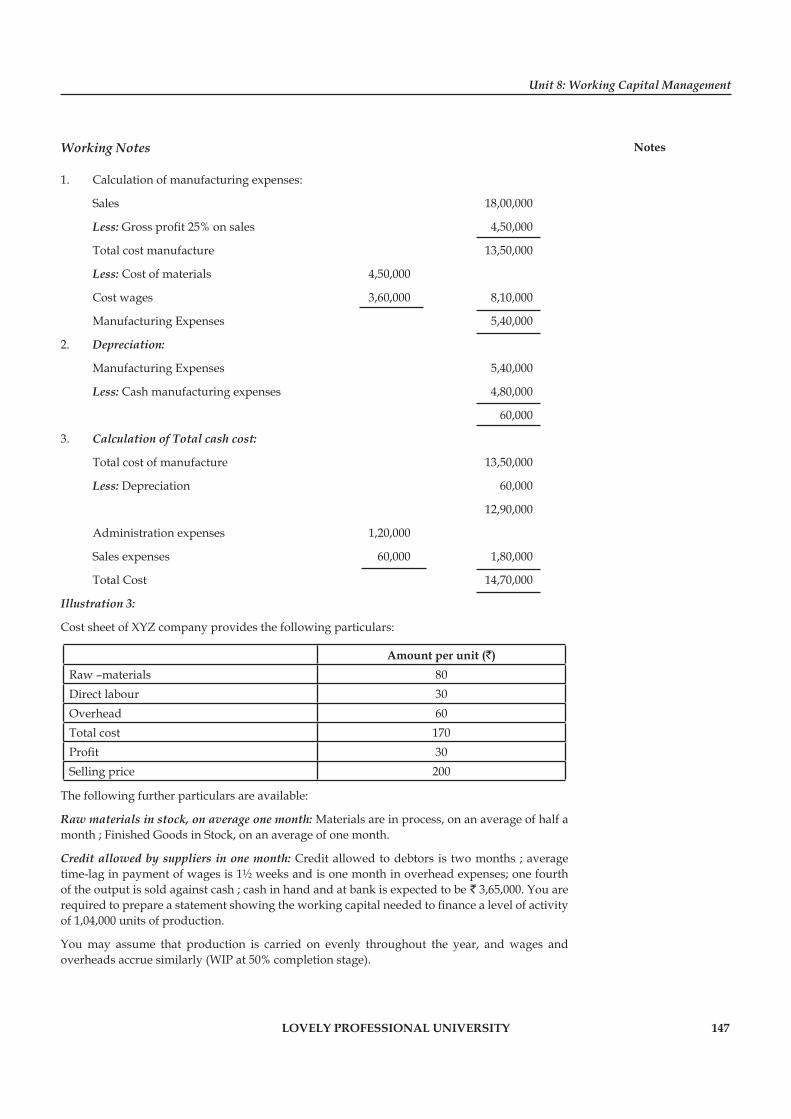
Unit 8: Working Capital Management
Notes
LOVELY PROFESSIONAL UNIVERSITY 147
Working Notes
1. Calculation of manufacturing expenses:
Sales 18,00,000
Less: Gross profi t 25% on sales 4,50,000
Total cost manufacture 13,50,000
Less: Cost of materials 4,50,000
Cost wages 3,60,000 8,10,000
Manufacturing Expenses 5,40,000
2. Depreciation:
Manufacturing Expenses 5,40,000
Less: Cash manufacturing expenses 4,80,000
60,000
3. Calculation of Total cash cost:
Total cost of manufacture 13,50,000
Less: Depreciation 60,000
12,90,000
Administration expenses 1,20,000
Sales expenses 60,000 1,80,000
Total Cost 14,70,000
Illustration 3:
Cost sheet of XYZ company provides the following particulars:
Amount per unit (`)Raw –materials 80Direct labour 30Overhead 60Total cost 170Profi t 30Selling price 200
The following further particulars are available:
Raw materials in stock, on average one month: Materials are in process, on an average of half a month ; Finished Goods in Stock, on an average of one month.
Credit allowed by suppliers in one month: Credit allowed to debtors is two months ; average time-lag in payment of wages is 1½ weeks and is one month in overhead expenses; one fourth of the output is sold against cash ; cash in hand and at bank is expected to be ` 3,65,000. You are required to prepare a statement showing the working capital needed to fi nance a level of activity of 1,04,000 units of production.
You may assume that production is carried on evenly throughout the year, and wages and overheads accrue similarly (WIP at 50% completion stage).
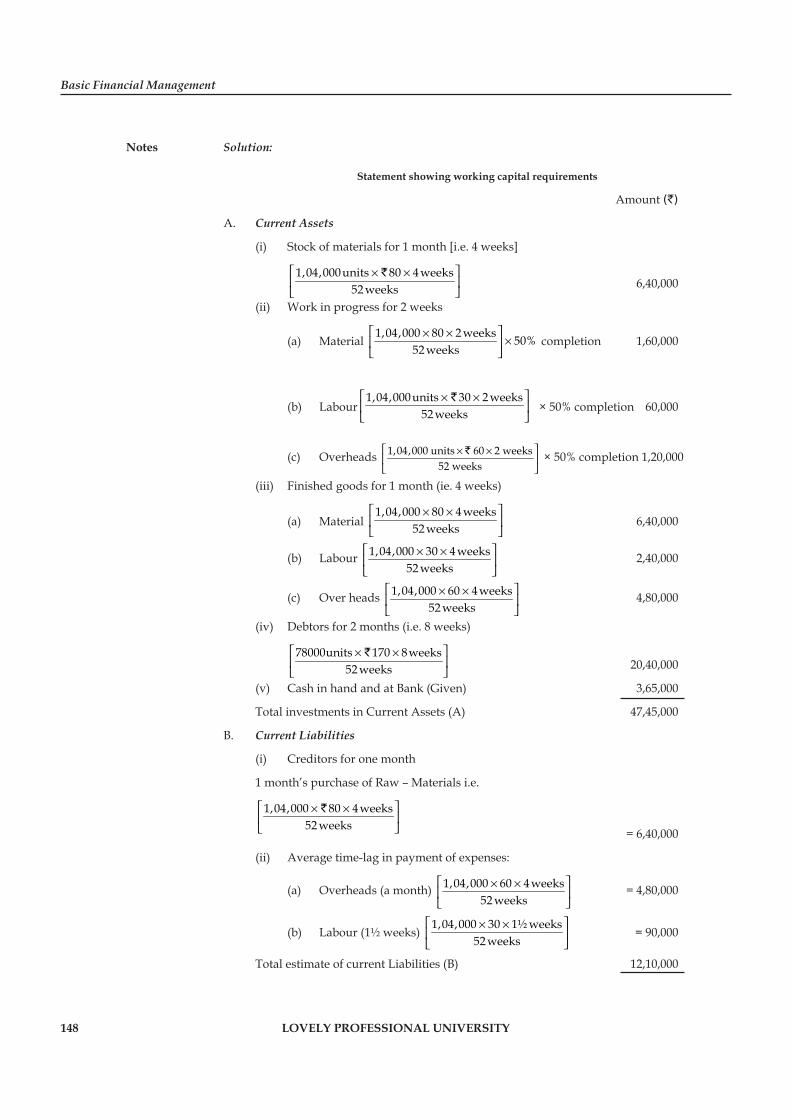
Basic Financial Management
Notes
148 LOVELY PROFESSIONAL UNIVERSITY
Solution:
Statement showing working capital requirements
Amount (`)
A. Current Assets
(i) Stock of materials for 1 month [i.e. 4 weeks]
1,04,000units 80 4weeks
52 weeks⎡ ⎤× ×⎢ ⎥⎣ ⎦
` 6,40,000
(ii) Work in progress for 2 weeks
(a) Material 1,04,000 80 2 weeks 50%
52 weeks⎡ ⎤× ×
×⎢ ⎥⎣ ⎦
completion 1,60,000
(b) Labour1,04,000units 30 2 weeks
52 weeks⎡ ⎤× ×⎢ ⎥⎣ ⎦
` × 50% completion 60,000
(c) Overheads 1,04,000 units 60 2 weeks52 weeks
⎡ ⎤× ×⎢ ⎥⎣ ⎦
` × 50% completion 1,20,000
(iii) Finished goods for 1 month (ie. 4 weeks)
(a) Material 1,04,000 80 4weeks
52 weeks⎡ ⎤× ×⎢ ⎥⎣ ⎦
6,40,000
(b) Labour 1,04,000 30 4weeks52 weeks
⎡ ⎤× ×⎢ ⎥⎣ ⎦
2,40,000
(c) Over heads 1,04,000 60 4weeks52 weeks
⎡ ⎤× ×⎢ ⎥⎣ ⎦
4,80,000
(iv) Debtors for 2 months (i.e. 8 weeks)
78000units 170 8weeks
52 weeks⎡ ⎤× ×⎢ ⎥⎣ ⎦
` 20,40,000
(v) Cash in hand and at Bank (Given) 3,65,000
Total investments in Current Assets (A) 47,45,000
B. Current Liabilities
(i) Creditors for one month
1 month’s purchase of Raw – Materials i.e.
1,04,000 80 4weeks52 weeks
⎡ ⎤× ×⎢ ⎥⎣ ⎦
`
= 6,40,000
(ii) Average time-lag in payment of expenses:
(a) Overheads (a month) 1,04,000 60 4weeks52 weeks
⎡ ⎤× ×⎢ ⎥⎣ ⎦
= 4,80,000
(b) Labour (1½ weeks) 1,04,000 30 1½ weeks
52 weeks⎡ ⎤× ×⎢ ⎥⎣ ⎦
= 90,000
Total estimate of current Liabilities (B) 12,10,000
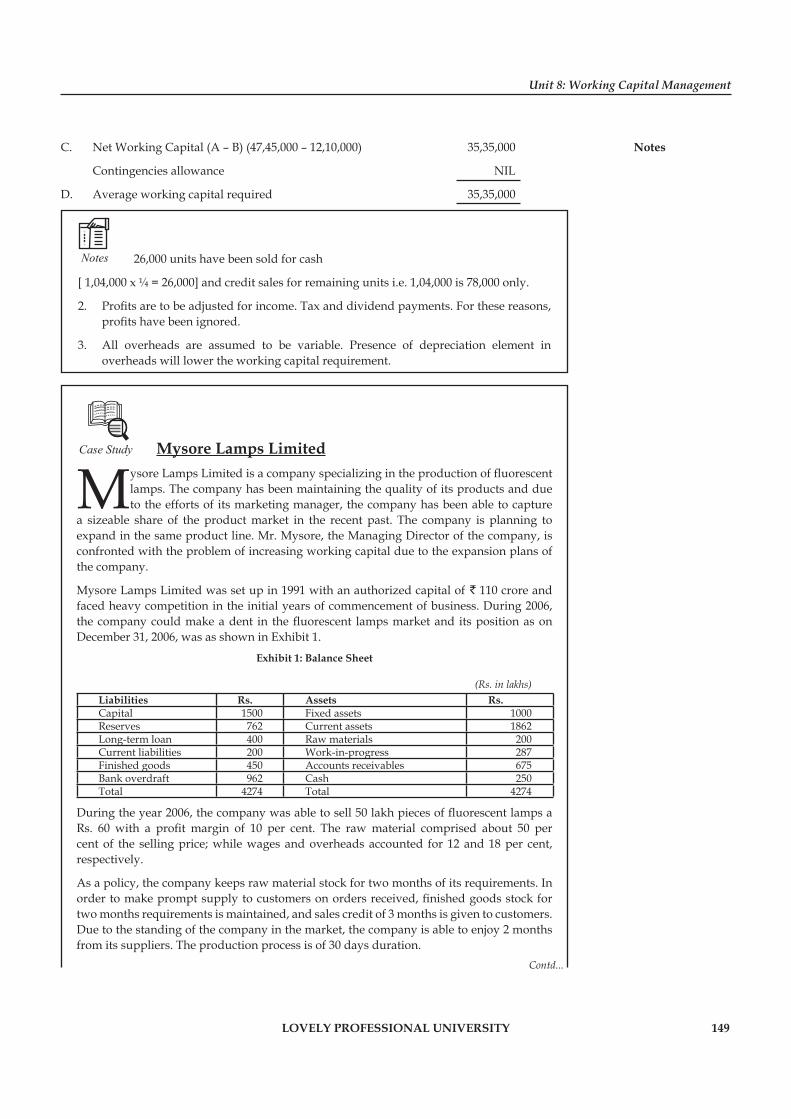
Unit 8: Working Capital Management
Notes
LOVELY PROFESSIONAL UNIVERSITY 149
C. Net Working Capital (A – B) (47,45,000 – 12,10,000) 35,35,000
Contingencies allowance NIL
D. Average working capital required 35,35,000
Notes 26,000 units have been sold for cash
[ 1,04,000 x ¼ = 26,000] and credit sales for remaining units i.e. 1,04,000 is 78,000 only.
2. Profi ts are to be adjusted for income. Tax and dividend payments. For these reasons, profi ts have been ignored.
3. All overheads are assumed to be variable. Presence of depreciation element in overheads will lower the working capital requirement.
Case Study Mysore Lamps Limited
Mysore Lamps Limited is a company specializing in the production of fl uorescent lamps. The company has been maintaining the quality of its products and due to the efforts of its marketing manager, the company has been able to capture
a sizeable share of the product market in the recent past. The company is planning to expand in the same product line. Mr. Mysore, the Managing Director of the company, is confronted with the problem of increasing working capital due to the expansion plans of the company.
Mysore Lamps Limited was set up in 1991 with an authorized capital of ` 110 crore and faced heavy competition in the initial years of commencement of business. During 2006, the company could make a dent in the fl uorescent lamps market and its position as on December 31, 2006, was as shown in Exhibit 1.
Exhibit 1: Balance Sheet
(Rs. in lakhs)Liabilities Rs. Assets Rs.Capital 1500 Fixed assets 1000Reserves 762 Current assets 1862Long-term loan 400 Raw materials 200Current liabilities 200 Work-in-progress 287Finished goods 450 Accounts receivables 675Bank overdraft 962 Cash 250Total 4274 Total 4274
During the year 2006, the company was able to sell 50 lakh pieces of fl uorescent lamps aRs. 60 with a profi t margin of 10 per cent. The raw material comprised about 50 per cent of the selling price; while wages and overheads accounted for 12 and 18 per cent, respectively.
As a policy, the company keeps raw material stock for two months of its requirements. In order to make prompt supply to customers on orders received, fi nished goods stock for two months requirements is maintained, and sales credit of 3 months is given to customers. Due to the standing of the company in the market, the company is able to enjoy 2 months from its suppliers. The production process is of 30 days duration.
Contd...
Basic Financial Management
Notes
150 LOVELY PROFESSIONAL UNIVERSITY
Mr. Mysore is seriously considering the proposal for expansion by installing an automatic plant costing ` 30 crores. The expansion will bring in an additional capacity of 100 lakh units per annum. Mr. Mysore is not worried about the fi nancing of this plant as the same would be done for the retained earnings supplemented by fi nances from Mr. Mysore’s personal sources. He expects that the company would be able to increase its sale from 50 lakh pieces after the expansion scheme.
Questions
1. As a manager, what steps would you take to effectively manage the working capital in an infl ationary situation?
2. What additional informations are required while evaluating the additional working capital requirement and expansion plans?
3. What steps must be taken to manage the working capital effectively under infl ationary situation? What would be the effect of expansion plan on working capital requirement?
8.6 Summary
Working capital management is concerned with the problems that arise in attempting to manage the current assets, current liabilities and their inter-relationship that exists between them.
Working capital management goal is maintain a satisfactory level of working capital.
Gross Working Capital Concept focuses attention on the two aspects of current assets management; they are optimum investment in current assets, and fi nancing of current assets.
Net working capital concept focuses attention on maintaining liquidity position, and to decide upon the extent of long-term capital in fi nancing current assets.
The working capital management is concerned with determination of relevant levels of current assets and their effi cient use as well as the choice of the fi nancing mix.
The time that elapses to convert raw materials into cash is known as operating cycle
Cash Conversion Cycle (CCC) is the time length between the payment for suppliers of raw materials and the collection of cash for sales, CCC = OC – APP.
There are three fi nancing policies vis-à-vis, to fi nance current assets.
8.7 Keywords
Gross Working Capital: The total current assets are termed as the gross working capital.
Net Working Capital: The excess of current assets over current liabilities represents net working capital.
Permanent Working Capital: It is the minimum investment kept in the form of inventory of raw materials, work in progress, fi nished goods, stores and spares, and book debts to facilitate uninterrupted operation in a fi rm.
Temporary Working Capital: Any additional working capital apart from permanent working capital required to support the changing production and sales activities is referred to as temporary working capital.
Working Capital: It refers to short-term funds to meet operating expenses.
Unit 8: Working Capital Management
Notes
LOVELY PROFESSIONAL UNIVERSITY 151
8.8 Self Assessment
Fill in the blanks:
1. Total of all current assets ......................... .
2. The excess of current assets over current liabilities ......................... .
3. Gross operating cycle equal to inventory conversion period plus ......................... .
4. The time elapses between the receipt of raw materials and payment to suppliers ...................................
5. Net operating cycle equal to gross operating cycle less ......................... .
6. When current assets are less than current liabilities then the resulting fi gure is .................. .
7. Components of working capital are ......................... .
8. The automatic sources of short-term funds arising in the normal course of business is known as ......................... .
State whether the following statements are true or false:
9. Working capital is the part of current assets that are supposed to be fi nanced by long-term sources of fi nance.
10. Net working capital is the excess of current assets over current liabilities.
11. Negative working capital is the excess of current assets over current liabilities.
12. Trade credit is the source of working capital.
13. Operating cycle and cash cycle both are one and the same.
14. Depreciation is source of working capital.
15. In boom period working capital requirement is less.
16. Manufacturing companies require less amount of working capital.
17. Utilization of fi xed assets depends on the availability of working capital.
18. Net operating cycle is equal to the gross operating cycle plus payables differed period.
8.9 Review Questions
1. From the following information RRR Company Ltd., for the next year, you are required to estimate the working capital needed to fi nance a level of activity of 2,08,000 units of production after adding a fi ve per cent safety contingency.
Amount (per unit)
Raw materials 160
Direct labour 60
Overheads (including depreciation of `10) 130
Total cost 350
Profi t 50
Selling price 400
Additional information
Average raw materials in stock: one month
Basic Financial Management
Notes
152 LOVELY PROFESSIONAL UNIVERSITY
Average materials-in-process (50 per cent completion stage): half a month
Average fi nished goods in stock: one month
Credit allowed by suppliers: one month
Credit allowed to customers: two months
Time lag in payment of wages: one and half weeks
All sales are credit sales. Cash balance is expected to be ` 75,000. You may assume that production is carried on evenly throughout the year and wages and overhead expenses accrued similarly.
2. From the following information estimate working capital required for the level of activity 78,000 units. You may assume that production is carried on evenly throughout the year and wages and overhead expenses accrue similarly and a time period of four weeks is equivalent to a month.
Amount (per unit)
Raw materials 45
Direct labour 20
Overheads 37.5
Total cost 102.5
Profi t 22.5
Selling price 125
Additional information
Raw materials in stock: two weeks; Materials-in-process: one week; Finished goods in stock: two weeks; Credit allowed by suppliers: half month; Credit allowed to customers: four weeks; Overheads: two weeks; Cash at bank is expected to be `30, 000. 80% of sales are credit sales.
3. You are requested by A.P. Paper Mills Limited to estimate working capital required for the level of activity of 6,24,000 units of production. Add 5 per cent for safety. It provides the following information. You may assume that production is carried on evenly throughout the year and wages and overhead expenses accrued similarly and a time period of four weeks is equivalent to a month.
Amount (per unit)
Raw materials 90
Direct labour 40
Overheads 80
Total cost 210
Profi t 60
Selling price 270
Additional Information
Raw materials in stock: one month; Materials-in-process: half month; Finished goods in stock: four weeks; Credit allowed by suppliers: one month; Credit allowed to customers: eight weeks; lag in payment of wages: one and half week; Overheads: one weeks; 20 per cent of sales are cash sales and cash at bank is expected to be `60, 000.

Unit 8: Working Capital Management
Notes
LOVELY PROFESSIONAL UNIVERSITY 153
4. DP Mills Limited has the following information as for the year 2003.
Sales – ` 3782.79 lakhs Cost of Goods sold – ` 3444.47 lakhs
Opening inventory – ` 856.25 lakhs closing inventory ` 1037.73 lakhs
Accounts Receivables: Opening – ` 852 lakhs, Closing – ` 636.88 lakhs
Accounts Payables: Opening: ` 832.96 lakhs Closing : 84689 lakhs
Calculate (a) OC and (b) CCC
5. Discuss the steps involved in estimation of working capital needed by a fi rm.
6. What is working capital? Is there any signifi cant difference in the concepts of gross working capital and net working capital? Discuss in detail.
7. What is working capital management? What is the need to maintain optimum working capital? Discuss the consequences of inadequate and excess working capital.
8. What is cash cycle or net operating cycle?
9. Discuss the signifi cance of gross working capital and net working capital.
10. “Working capital must be adequate but at the same time not excessive”. Comment.
Answers: Self Assessment
1. Gross working capital 2. Net working capital
3. Debtors collection period 4. Cash cycle
5. payables differed period 6. Negative working capital
7. Current assets and current liabilities 8. Spontaneous
9. True 10. True
11. False 12. True
13. False 14. True
15. False 16. False
17. True 18. True
8.10 Further Readings
Books Chandra, P., Financial Management - Theory and Practice, New Delhi, Tata McGraw Hill Publishing Company Ltd., 2002, p. 3.
Sudhindra Bhat, Financial Management, New Delhi, Excel Books, 2008.
Van Horne, J.C. and Wachowicz, Jr, J.M., Fundamentals of Financial Management, New Delhi, Prentice Hall of India Pvt. Ltd., 1996, p. 2.
Online link http://www.fei.org/
Basic Financial Management
Notes
154 LOVELY PROFESSIONAL UNIVERSITY
Unit 9: Basics of Receivables
CONTENTS
Objectives
Introduction
9.1 Meaning and Characteristics of Accounts Receivables
9.2 Concept of Account Receivable Management
9.2.1 Objectives of Accounts Receivables Management
9.2.2 Costs of Accounts Receivables Management
9.3 Factors Infl uencing the Size of Investment in Receivables
9.4 Credit Policy
9.5 Credit Evaluation of Individual Accounts
9.6 Monitoring Accounts Receivables
9.7 Summary
9.8 Keywords
9.9 Self Assessment
9.10 Review Questions
9.11 Further Readings
Objectives
After studying this unit, you will be able to:
Defi ne meaning and characteristics of receivables
Discuss concept of accounts receivables management
Explain credit policy
Describe credit evaluation and monitoring
Introduction
Accounts Receivables occupy an important position in the structure of current assets of a fi rm. They are the outcome of rapid growth of credit sales granted by the fi rms to their customers. Credit sales are refl ected in the value of Sundry Debtors [SD’s In India]. It is also known as Trade Debtors (TD’s), Accounts Receivables (AR’s), Bills Receivables (BR’s) on the asset side of balance sheet. Trade credit is most prominent force of modern business. It is considered as a marketing tool acting as a bridge between production and customers. Firm grants credit to protect its sales from the competitors and attract the potential customers. It is not possible to increase sales without credit facility, increase in sales also increases profi ts. But investments on accounts receivables involve certain costs and risks. Therefore, a great deal of attention is normally paid to the effective and effi cient management of accounts receivables.
Unit 9: Basics of Receivables
Notes
LOVELY PROFESSIONAL UNIVERSITY 155
9.1 Meaning and Characteristics of Accounts Receivables
The term receivable is defi ned as “debt owed to the fi rm by customers arising from sale of goods or services in the ordinary course of business”.
?Did u know? When the fi rm sells its products services on credit, and it does not receive cash for it immediately, but would be collected in near future. Till collection they form as current assets.
The accounts receivables arising out of credit sales have the following characteristics’.
1. Risk Involvement: Receivables involve risk, since payment takes Bajaj in future, and future is uncertain so they should carefully analyzed.
2. Based on Economic Value: Accounts receivables are based on economic value. The economic value in goods or services passes to the buyer currently in return the seller expects an equivalent value from the buyer latter.
3. Implies Futurity: Buyer will make cash payment of the goods or services received by him/her in a future period. [i.e generally after credit period]
9.2 Concept of Account Receivable Management
Accounts Receivable Management, means making decisions relating to the investment in current assets as an integral part of operating process. The objectives of the accounts receivables management are the maximization of return on investment in receivables. In other words, accounts receivables management involves maintenance of receivables of optimum level, the degree of credit sales to be made, and the debtor’s collection.
9.2.1 Objectives of Accounts Receivables Management
The following are the main objectives of accounts receivables management:
1. Maximizing the Value of the Firm: The basic objective of debtors’ management is to maximise the value of the fi rm by achieving a trade off between liquidity (risk) and return. The main purpose of receivables management is to minimise the risk of bad debts and not maximisation of order. Effi cient management of receivables expands sales by retaining old customers and attracting new customers.
2. Optimum Investment in Sundry Debtors: Credit sales expand, but they involve block of funds, that have an opportunity cost, which can be reduced by optimum investment in receivables. Providing liberal credit increases sales consequently profi ts will increase, but increasing investment in receivables results in increased costs.
3. Control and Cost of Trade Credit: When there are no credit sales, there will not be any trade credit cost. But credit sale increases profi ts. It is possible only when the fi rm is able to keep the costs at minimum. The costs are discussed below.
9.2.2 Costs of Accounts Receivables Management
Management of accounts receivables is not cost free. The following are the main costs associate with accounts receivables management:
1. Opportunity Cost/Capital Cost: Providing goods or services on credit involves block of fi rm’s funds. In other words, the increased level of accounts receivables is an investment in current assets. These blocked funds or investment in receivables need to be fi nanced, by

Basic Financial Management
Notes
156 LOVELY PROFESSIONAL UNIVERSITY
shareholders funds or from short-term borrowings. They involve some cost. If receivables are fi nanced by shareholder funds, there involves opportunity cost to shareholders. If they are fi nanced by borrowed funds, it involves payments of interest, which is also a cost.
2. Collection Cost: Collection of receivable is one of the tasks of receivables management. Collection costs are those costs that are increased in collecting the debts from the customers to whom the credit sales have been granted. The collection costs may include, staff, records, stationary, postage they are related to maintenance credit department, and exposes details involved in collecting information about prospective customers, from specialized agencies, for evaluation of prospective customer before going to grant credit.
3. Bad Debts: Some times customer may not be able to honour the dues to the fi rm because of the inability to pay. Such costs are referred as bad debts, and they have to be written off, because they cannot be collected. These costs can be reduced to some extent, if the fi rm properly evaluates customer before granting credit, but complete avoidance is not possible.
9.3 Factors Infl uencing the Size of Investment in Receivables
The level of investment in receivables is affected by the following factors:
1. Volume of Credit Sales: Size of credit sale is the prime factor that affects the level of investment in receivables. Investment in receivable increase when the fi rm sells major portion of goods on credit base and vice versa. In other words an increase in credit sales, increase the level of receivables and vice versa.
2. Credit Policy of the Firm: There are two types of credit policies such as lenient and stringent credit policy. A fi rm that is following lenient credit policy tends to sell on credit to customers very liberally, which will increase the size of receivables. On the other hand, a fi rm that following stringent credit policy will have low size of receivables because the fi rm is very selective in providing of stringent credit. A fi rm that is providing string one credit, may be able to collect debts promptly this will keep the level of receivables under control.
3. Trade Terms: It is the most important factor (variable) in determining the level of investment in receivables. The important credit terms are credit period and cash discount. If credit period is more when compared to other companies/industry, then the investment in receivables will be more. Cash discount reduces the investment in receivables because it encourages early payments.
4. Seasonality of Business: A fi rm doing seasonal business has to provide credit sales in the other seasons. When the fi rm provides credit automatically the level of investment in receivables will increase with the comparison of the level of receivables in the season; because in season fi rm will sell goods on cash basis only.
For example, refrigerators, air-cooling products will be sold on credit in the winter season and on cash in summer season.
5. Collection Policy: Collection policy is needed because all customers do not pay the fi rm’s bill on time. A fi rm’s liberal collection policy will not be able to reduce investment in receivables, but in future sales may be increased. On the other hand, a fi rm that follows stringent collection policy will defi nitely reduce receivables, but it may reduce future sales. Therefore, the collection policy should aim at accelerating collections from slow payers and reducing bad debt base.
6. Bill Discounting and Endorsement: Bill discounting and endorsing bill to the third party, which the fi rm has to pay, will reduce the size of investment in receivables. If the bills are dishonored on the due date, again the investment in receivable will increase because discounted bills or endorsed bills have to be paid by the fi rm.
Unit 9: Basics of Receivables
Notes
LOVELY PROFESSIONAL UNIVERSITY 157
9.4 Credit Policy
Credit policy means a fi rm’s credit policy regarding its credit standards, credit period, cash discounts, and collection procedures. The credit policy may be lenient or stringent (tight).
Lenient Credit Policy
It is that policy where the seller sells goods on very liberal credit terms and standards. In other words, goods are sold to the customers whose creditworthiness is not up to the standards or whose fi nancial position is doubtful.
Stringent Credit Policy
Stringent credit policy seller sells goods on credit on a highly selective basis only i.e., the customers who have proven creditworthiness and fi nancially sound.
Notes Credit Policy Variables
The major credit policy variables include the following:
1. Credit Standards: Firm has to select some customers for extension of credit. For this fi rm has to evaluate the customer. In evaluation of customers what standards should be applied? Credit standards refer to the minimum criteria for the extension of credit to a customer. Credit ratings, credit references, average payment periods, and certain fi nancial ratios provide a quantitative basis for establishing and enforcing credit standards.
2. Credit Terms: The second decision criteria in receivables management are the credit terms. Credit terms mean the stipulations under which goods or services are sold on credit. Once the credit terms have been established and the credit worthiness of the customers has been assessed, then the fi nancial managers have to decide the terms and conditions on which the credit will be granted. The credit terms specify the lengthy of time over which credit is extended to a customer and the discount, if any, given for early payment. Credit terms have three components such as: (i) credit period, and (ii) cash discount, and (iii) cash discount period.
3. Collection Policy: This is the third aspect in receivables management. The collection of a fi rm is the procedures passed to collect amount receivables, when they become due. It is needed because all customers do not pay the bill receivables in time collection procedures includes monitoring the state of receivables, dispatch of letters to customers whose due date is approaching, electronic and telephonic advice to customers around the due date, threat of legal action to overdue customers, and legal action against overdue accounts.
9.5 Credit Evaluation of Individual Accounts
Receivables management requires a lot of decision making exercises, setting credit standards, identifying credit terms (credit period and cash discount), collection policy, evaluation of individual accounts. Evaluation of individual accounts is the prime activity, which affects fi rm’s profi tability. In this, fi rm should develop procedures for evaluating credit applicants and consider the possibilities of bad debt or slow payment. Mere determination of appropriate credit policy will not serve the purpose of minimizing investment in receivables and reducing bad debt losses,
Basic Financial Management
Notes
158 LOVELY PROFESSIONAL UNIVERSITY
without credit evaluation of individual accounts and identifi cation of their credit worthiness. In other words, the fi rm has to evaluate the customers before extension of credit.
The credit evaluation procedure involves three related steps:
1. Obtaining credit information
2. Analyzing the information
3. Making the credit decision
9.6 Monitoring Accounts Receivables
Just evaluation of individual accounts does not help in effi cient accounts receivables management without continuous monitoring and control of receivables. In other words success of collection effort depends on monitoring and controlling receivables. Then how to monitor and control receivables? There are traditional techniques available for monitoring accounts receivables. They are (a) Receivables turnover, (b) Average Collection period, (c) Aging Schedule and (d) Collection matrix.
1. Receivables Turnover: Receivables turnover provides relationship between credit sales and debtors (receivables) of a fi rm. It indicates how quickly receivables or debtors are converted into cash. Ramamurthy observes “collection of debtors is the concluding stage for process of sales transaction”. The liquidity of receivables is therefore, is measured through the receivables (debtors) turnover rate.
Debtors or Receivables Turnover Rate = Credit Sales ÷ Average Debtors or receivables
Debtor’s turnover rate is expressed in terms of times. Analyst may not be able to access credit sales information, average debtors and bills receivables.
To avoid of non-availability of the above information and to evaluate receivables turnover there is another method available for analyst.
Debtors or Receivables Turnover Rate = Total Net Sales ÷ Average Debtors (including receivables)
2. Average Collection Period (ACP): Turnover rate converted into average collection period is a signifi cant measure of the collection activities of debtors. Average collection period is a measure of how long it takes from the time sales is made to the time to cash is collected from the customers.
ACP = 365 ÷ Debtors or Receivables turnover.
Example: A company’s credit sales are ̀ 20 lakhs in a year. The opening debts are ̀ 2 lakhs and closing debtors are `2,10,000. Determine Debtors turnover and ACP.
Solution:
Debtors Turnover Ratio = ` 20,00,000 ÷ (Rs.2,00,000 + `2,10,000)/2 = 9.75 times
ACP = 365 ÷ 9.75 = 37.43 Days
Unit 9: Basics of Receivables
Notes
LOVELY PROFESSIONAL UNIVERSITY 159
Collection Policy
The collection of a fi rm is the procedures passed to collect amount receivables, when they become due. It is needed because all customers do not pay the bill receivables in time collection procedures includes monitoring the state of receivables, dispatch of letters to customers whose due date is approaching, electronic and telephonic advice to customers around the due date, threat of legal action to overdue customers, and legal action against overdue accounts.
Customers may be divided into two categories. Such as slow payer and non-payers. Hence, there is a need for accelerating collections from slow payers and reduce bad debt losses.
Collection policies may be divided into two categories.
(i) Strict / rigorous
(ii) lenient/lax collection policy.
Adoption of strict collection policy tends to decrease sales, reduces average collection period, bad debt percentage, and increases the collection expenses. On the other hand, lenient collection policy will increase sales average collection period, bad debt losses, and reduce collection expenses. Financial manager has to see the benefi ts and costs from adopting one credit policy, if the change in net profi t is positive, he/she has to go with new credit policy and vice versa.
3. Aging Schedule: As we have seen in the above average collection period measures quality of receivables in an aggregate manner, which is the limitation of ACP. This can be overcome by preparing aging schedule. Aging schedule is a statement that shows age wise grouping of debtors. In other words, it breaks down debtors according to the length of time for which they have been outstanding.
Example: A hypothetical aging schedule is as follows:
Age Group (in days) Amount Outstanding (`) Percentage of Debtors to total Debtors
Less than 3031 – 4546 – 60
Above 60
40,00,00020,00,00030,00,00010,00,000
40203010
Total 1,00,00,000 100
4. Collection Matrix: Traditional methods (debtors turnover rate, average collection period) of receivables management are very popular, but they have limitations, that they are on aggregate data and fail to relate the outstanding accounts receivables of a period with credit sales of the same period. The problem of aggregating data can be eliminated by preparing and analyzing collection matrix. Collection matrix is a method (statement) showing percentage of receivables collected during the month of sales and subsequent months. It helps in studying the effi ciency of collections whether they are improving or deteriorating.

Basic Financial Management
Notes
160 LOVELY PROFESSIONAL UNIVERSITY
Example: Following table shows hypothetical collection matrix.
Percentage of Receivables collected During the April May June July August
Sales (Rs. Lakhs)Month of SalesFirst Month followingSecond Month followingThird Month followingFourth Month followingFifth Month following
3501030252015–
3401238242610–
3201440222202–
300113020191505
250083421182009
From the above table, it may be read for April sales are ̀ 350 lakhs. The pattern of collections are 10 per cent in the same month (April), 30 per cent of sales in May, 25 per cent of sales in June, 20 per cent of sales in July and the remaining 15 per cent in the August.
Task VST Co. produces plastic home appliances and it has annual credit sales of ` 20 lakhs, the average accounts receivables amount to `4,00,000. Compute ACP assuming 365 day year.
Case Study Yahoo. Products Limited
Yahoo.. Products Limited manufactures a special variety of industrial which are used by other manufacturing units to produce shoes and chappals. The market for the company’s product comprises a few large public limited companies and a number
of small units run as proprietary or partnership concerns. The sales had in the past proved to be seasonal, with peak sales being recorded in the period January to July (year).
One year back, the company had expanded its production capacity form 4,000 to 9,000 MT per annum. However, the actual production in the fi nancial year Just ended was restricted to 6,000 MT, mainly on account of lack of orders. The cost statement for the year indicated the following:
`/MT
Raw Materials (V) 2,500
Direct Labour and Supervision (F) 800
Indirect Materials, Fuel, etc. (F) 500
Depreciation, Insurance, etc. (F) 2,700
Factory Cost of Production 6,500
Administration, Selling and Interest Charges (F) 500
Selling Price per MT 7,000(exclusive of all discounts, allowance for freight, etc.) ------
Dr. Bhatt the Director was not satisfi ed by the under utilization of installed capacity and its effect on the profi tability of the company. He called his senior managers to discuss the situation and means of improving the profi tability of the concern. The Sales Manager,
Contd....
Unit 9: Basics of Receivables
Notes
LOVELY PROFESSIONAL UNIVERSITY 161
on whom the pressure was tried to described the limitation of sales to be the stringent credit policy pursued by the company. He argued that under the strict norms for grant of credit followed by the company, only the larger public limited companies among the customers were on the approved credit list of the company and the smaller customers were put on the cash and carry list. This, he maintained, led to an overdependence on the larger customers and an almost complete neglection of a section of the market consisting of the small manufacturers, who were cultivated by the competition by offering them attractive discounts. In fact, the smaller manufacturers came to his company, only if, the market was starved of the product. The Sales Manager pleaded for a more liberal credit policy which would also help increase the sales volume. He ruled out the possibility of procuring additional volume of business from the big customers who had already evolved a scheme sharing out their business among the different suppliers. Any attempt to obtain more business by offering discounts to the bigger fi rms, the sales manager argued, will only lead to a retaliatory action by competitors and ultimately escalate into a price war which will only prove disastrous for the company. On the other hand, granting credit to the smaller customer will bring the company’s policy in line with competitors and will actually stimulate growth in the consuming industry with benefi cial effects to the company.
Dr. Bhatt obviously undecided about the wisdom of extending credit to the smaller customers to boost sales volume, called for a detailed note from both the Sales Manager and the Credit Manager. He, However, pointed out that any such change of credit policy, even if approved, would bring in results only in long run while there was an immediate need to boost sales. The Sales Manager, at this point, conveyed to Dr. Bhatt, an offer he had just received from the Shoe Manager. An offer he had just received from the Shoe Plast Limited, one of the larger public limited company. The controller referred to the substantial investment in receivables that this transaction would entail and reckoning interest at 18 percent per annum which was the rate the company was paying to its bankers; he argued that this transaction would involve an interest burden of ` 1,64,250 whereas the profi ts from the transaction would only be ` 90,000. As such the offer was wholly unattractive. Shoe Plast Limited would pay for these additional supplies to be effected in the next three months, in the seventh month from date. It was, however, unwilling to pay an interest on the extended credit term. The Sales Manager pointed out that Shoe Plast Limited ranked high in the ratings by the Credit Department and therefore, there should be no hesitation in accepting this offer for additional business.
The customer company wads carrying out an expansion scheme at that time using partly its current resources to fi nance the same and was, therefore, fi nding itself in a diffi cult liquid situation. It, however, expected this to be only temporary and anticipated that the position would improve considerably after six months. Shoe Plast Limited had made an offer to take 100 MT additional each month in the next three months over and above the regular off-take, if Plastic Products Limited agreed to give special credit terms. The Credit Manager, intervening at this stage, pointed to the high rate of mortality among the smaller fi rms. He read out a long list of the smaller fi rms in the industry which had closed their creditors in the last few years. He points out with pride the excellent record of the company in the matter of credit management and to the fact that the company has had no incidence of bad debts in the last smaller manufacturers. He further argued that the company would be taking grave risk if it chose to adopt such a policy, as it would lead to bad debts. About 6 per cent each year, which he was quick to point out, was about the profi t margin company appears to have from its products.
Contd....
Basic Financial Management
Notes
162 LOVELY PROFESSIONAL UNIVERSITY
Questions
1. What consideration he should take into account, while revising the credit policy of a company?
2. Advice Dr. Bhatt how he should deal with the circumstances?
3. Defi ne factoring. Briefl y discuss the services provided by a factor.
4. What are the various types of factoring?
5. Distinguish between factoring and bill fi nancing.
6. Briefl y discuss the appraisal technique followed by a factor.
7. What are the benefi ts, limitations and constraints of factoring in India?
8. Write a short note on international factoring.
9.7 Summary
Accounts Receivables occupy an important position in the structure of current assets of a fi rm.
The term receivable is defi ned as debt owed to the fi rm by customers arising from sale of goods or services in the ordinary course of business.
The management of accounts receivables is not cost free. It involves cost and its association with accounts receivables results in: Opportunity Cost/Capital Cost, Collection Cost, and Bad Debts.
Liberal credit policy is that policy where the seller sells goods on very liberal credit terms and standards, which increase in sales, higher profi ts.
Stringent credit policy seller sells goods on credit on a highly selective basis only, which reduces bad losses, sound liquidity position.
Firms should follow optimum credit policy that lies between lenient and stringent credit policy.
Optimum credit policy occurs at point where there is a trade off between liquidity and profi tability.
Collection policies may be divided into two categories – strict/rigorous, and lenient/lax collection policy.
9.8 Keywords
Collection Policy: It is the procedures passed to collect amount receivables, when they become due.
Credit Terms: It means the stipulations under which goods or services are sold on credit.
Credit Standards: It refers to the minimum criteria for the extension of credit to a customer.
Lenient Credit Policy: It is that policy where the seller sells goods on very liberal credit terms and standards.
Receivables: It is defi ned as debt owed to the fi rm by customers arising from sale of goods or services in the ordinary course of business.

Unit 9: Basics of Receivables
Notes
LOVELY PROFESSIONAL UNIVERSITY 163
Receivables Management: It involves decision areas: credit standards, credit period, cash discounts and collection procedures.
Stringent Credit Policy: Seller sells goods on credit on a highly selective basis.
9.9 Self Assessment
Fill in the blanks:
1. In India accounts receivables are known as ............................ .
2. Debt owed to the fi rm by customers arising from sale of goods or services in the ordinary course of business is known as ............................ .
3. ............................ involvement is one of the characteristic features of receivables.
4. ............................ is a formal document issued by a bank on behalf of its customers, stating the conditions under which the bank will honor the commitments of the customer (Buyer).
5. Credit terms have three components ........................., .......................... and .......................... .
6. ............................ represents a percentage of reduction in sales or purchase price allowed for early payment of invoices.
7. Cash discount reduces the investment in receivables because it encourages ........................ .
8. ............................ is a statement that shows age wise grouping of debtors.
9. ............................ is a method (statement) showing percentage of receivables collected during the month of sales and subsequent months.
10. ............................ = 365 ÷ Debtors or Receivables turnover.
State whether the following statements are true or false:
11. Receivables constitute to a signifi cant potential current assets.
12. Credit period is one of the terms of credit.
13. Letter of credit is one of the modes of payment.
14. Optimum credit policy occurs where there is a trade of between liquidity and profi tability.
15. Bad debt loss is are the losses of receivables management.
16. Credit standards, Credit period, Cash discount and Collection are the variables of credit policy.
17. Monitoring the state of receivables does not include receivables collection procedure.
9.10 Review Questions
1. What is receivables management? Discuss in detail the objective benefi ts and cost of receivables management.
2. Briefl y discuss the factors that infl uence the size of investment in receivables.
3. What is credit policy? Discuss the types of credit policy’s with their advantages and disadvantages.
4. What is the role of credit policy variables in the credit policy of a fi rm? Discuss.
Basic Financial Management
Notes
164 LOVELY PROFESSIONAL UNIVERSITY
5. “The credit policy of a fi rm is criticized because the bad debt losses have increased”. Discuss under what situations this criticism may not be justifi ed.
6. What is credit evaluation? Discuss the steps involved in it.
7. What do you mean by aging schedule?
8. Hare Ram & Co, produces 1,00,000 units and sells at `80 per unit. 70 per cent of sales are credit sales. Average receivables amount is `2,00,000. Determine average collection period (ACP).
9. Dream Well Company’s credit sales for the year 2004 are ` 1,50,000. The company was started 2004 year with opening balance of receivables `15,000 and 2004 year business is closed with `11,000 receivables. Calculate receivables turnover and ACP.
10. Name various costs of accounts receivables management.
Answers: Self Assessment
1. Sundry debtors 2. Bills receivables 3. Risk
4. Letter of credit 5. Credit period, Cash discount and Cash discount period
6. Cash discount 7. early payments 8. Aging schedule
9. Collection matrix 10. ACP 11. True
12. True 13. True 14. True
15. True 16. True 17. False
9.11 Further Readings
Books Chandra, P., Financial Management - Theory and Practice, New Delhi, Tata McGraw
Hill Publishing Company Ltd., 2002, p. 3.
Sudhindra Bhat, Financial Management, New Delhi, Excel Books, 2008.
Van Horne, J.C. and Wachowicz, Jr, J.M., Fundamentals of Financial Management, New Delhi, Prentice Hall of India Pvt. Ltd., 1996, p. 2.
Online links http://www.fei.org/
www.scribd.com
Unit 10: Inventory Management
Notes
LOVELY PROFESSIONAL UNIVERSITY 165
Unit 10: Inventory Management
CONTENTS
Objectives
Introduction
10.1 Meaning and Defi nition of Inventory
10.2 Costs of Holding Inventories
10.3 Tools and Techniques of Inventory Management
10.4 Summary
10.5 Keywords
10.6 Self Assessment
10.7 Review Questions
10.8 Further Readings
Objectives
After studying this unit, you will be able to:
Describe concept of inventory management
Explain costs of holding inventory and tools of inventory management
Introduction
Inventory management occupies the most signifi cant position in the structure of working capital. Management of inventory may be defi ned as the sum of total of those activities necessary for the acquisition, storage, disposal or use of materials. It is one of the important component of current assets. Inventory management is an important area of working capital management, which plays a crucial role in economic operation of the fi rm. Maintenance of large size of inventories by a fi rm required a considerable amount of funds to be invested on them. Effi cient and effective inventory management is necessary in order to avoid unnecessary investment and inadequate investment.
10.1 Meaning and Defi nition of Inventory
The term “Inventory” is originated from the French word “Inventaire” and the Latin “Inventariom”, which implies a list of things found. The term inventory has been defi ned by the American Institute of Accountants as the aggregate of those items of tangible personal property which (a) are held for sale in the ordinary course of business, (b) are in the process of production for such sales, or (c) are to be currently consumed in the production of goods or services to be available for sale. The term inventory refers to the stockpile of the products a fi rm is offering for sales and the components that make up the product. Inventories are the stocks of the product of a company, manufacturing for sale and the components that make up the product.
The various components of inventory are as follows:
1. Raw Materials: Raw materials are those inputs that are converted into fi nished goods through a manufacturing or conversion process. These form a major input for manufacturing a product. In other words, they are very much needed for uninterrupted production.
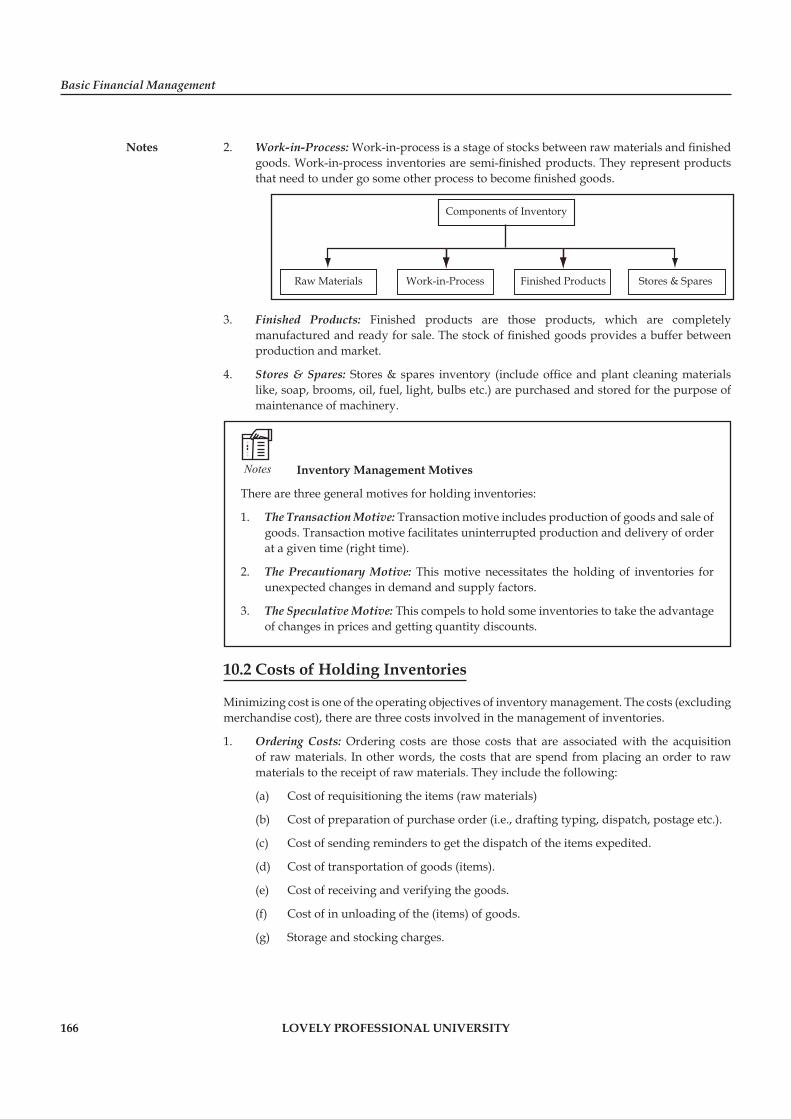
Basic Financial Management
Notes
166 LOVELY PROFESSIONAL UNIVERSITY
2. Work-in-Process: Work-in-process is a stage of stocks between raw materials and fi nished goods. Work-in-process inventories are semi-fi nished products. They represent products that need to under go some other process to become fi nished goods.
Components of Inventory
Raw Materials Work-in-Process Finished Products Stores & Spares
3. Finished Products: Finished products are those products, which are completely manufactured and ready for sale. The stock of fi nished goods provides a buffer between production and market.
4. Stores & Spares: Stores & spares inventory (include offi ce and plant cleaning materials like, soap, brooms, oil, fuel, light, bulbs etc.) are purchased and stored for the purpose of maintenance of machinery.
Notes Inventory Management Motives
There are three general motives for holding inventories:
1. The Transaction Motive: Transaction motive includes production of goods and sale of goods. Transaction motive facilitates uninterrupted production and delivery of order at a given time (right time).
2. The Precautionary Motive: This motive necessitates the holding of inventories for unexpected changes in demand and supply factors.
3. The Speculative Motive: This compels to hold some inventories to take the advantage of changes in prices and getting quantity discounts.
10.2 Costs of Holding Inventories
Minimizing cost is one of the operating objectives of inventory management. The costs (excluding merchandise cost), there are three costs involved in the management of inventories.
1. Ordering Costs: Ordering costs are those costs that are associated with the acquisition of raw materials. In other words, the costs that are spend from placing an order to raw materials to the receipt of raw materials. They include the following:
(a) Cost of requisitioning the items (raw materials)
(b) Cost of preparation of purchase order (i.e., drafting typing, dispatch, postage etc.).
(c) Cost of sending reminders to get the dispatch of the items expedited.
(d) Cost of transportation of goods (items).
(e) Cost of receiving and verifying the goods.
(f) Cost of in unloading of the (items) of goods.
(g) Storage and stocking charges.
Unit 10: Inventory Management
Notes
LOVELY PROFESSIONAL UNIVERSITY 167
However, incase of items manufactured in house the ordering costs would comprise the following costs:
(a) Requisitioning cost,
(b) Set-up cost,
(c) Cost of receiving and verifying the items,
(d) Cost of placing and arranging/stacking of the items in the store etc.
!Caution Ordering costs are fi xed as per order placed, irrespective of the amount of the
order but ordering costs increases in proportion to the number of orders placed. If the fi rm maintains small inventory levels, then the number of orders will increase, there by ordering cost will increase and vice versa.
2. Inventory Carrying Costs: Inventory carrying costs are those costs, which are associated in carrying or maintaining inventory. The following are the carrying costs of inventory:
(a) Capital cost [interest on capital locked in the inventories]
(b) Storage cost [insurance, maintenance on building, utilities serving costs]
(c) Insurance [on inventory - against fi re and theft insurance]
(d) Obsolescence cost and deterioration
(e) Taxes
Carrying costs usually constitute to around 25 per cent of the value of inventories held.
3. Shortage: Costs [Costs of stock out]: Shortage costs are those costs that arise due to stock out, either shortage of raw materials or fi nished goods.
(a) Shortage of inventories of raw materials affect the fi rm in one or more of the following ways:
(i) The fi rm may have to pay some higher prices, connected with immediate (cash) procurements.
(ii) The fi rm may have to compulsorily resort to some different production schedules, which may not be as effi cient and economical.
(b) Stock of fi nished goods - may result in the dissatisfaction of the customers and the resultant lead, to loss of rules,
Thus, with a view to keep inventory costs of minimum level, we may have to arrive at the optional level of inventory cost, its total order’s cost plus carrying costs are minimum.
In other words, we have to determine Economic Order Quantity (EOQ), at that level in which the total inventory [ordering plus carrying less] cost is minimum.
?Did u know? What is the meaning of EOQ?
Economic order quantity refers to that level of inventory at which the total cost of inventory is minimum.
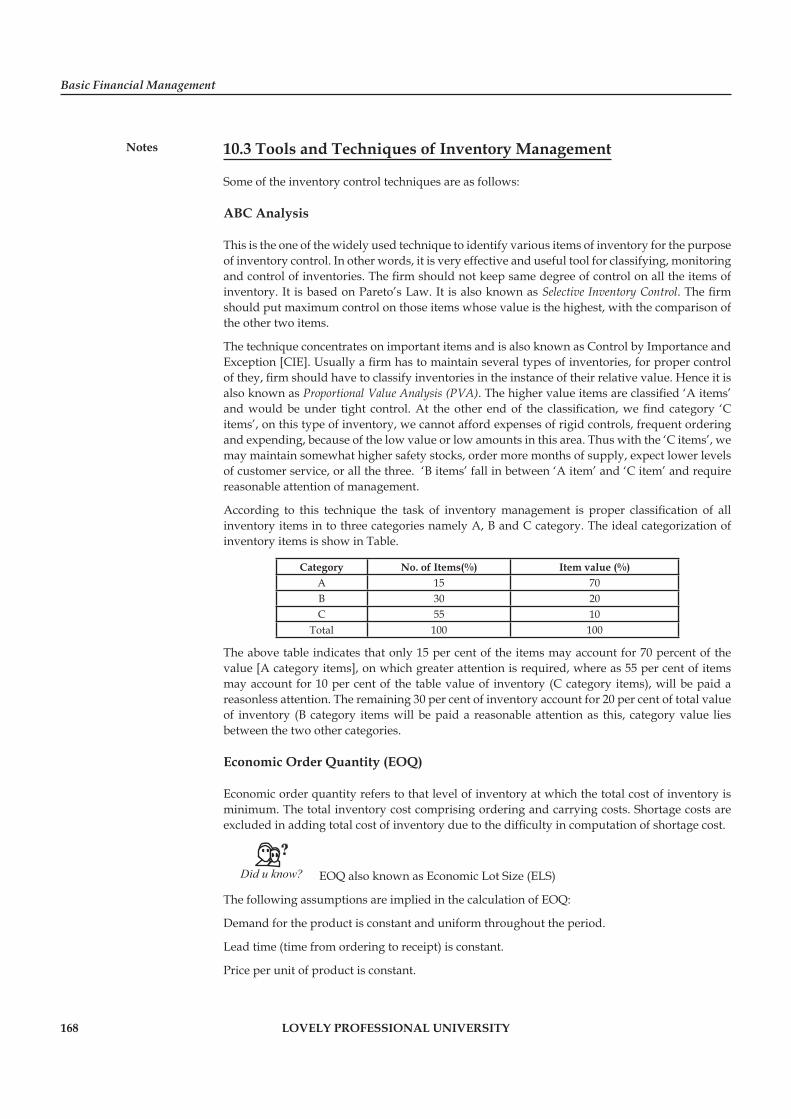
Basic Financial Management
Notes
168 LOVELY PROFESSIONAL UNIVERSITY
10.3 Tools and Techniques of Inventory Management
Some of the inventory control techniques are as follows:
ABC Analysis
This is the one of the widely used technique to identify various items of inventory for the purpose of inventory control. In other words, it is very effective and useful tool for classifying, monitoring and control of inventories. The fi rm should not keep same degree of control on all the items of inventory. It is based on Pareto’s Law. It is also known as Selective Inventory Control. The fi rm should put maximum control on those items whose value is the highest, with the comparison of the other two items.
The technique concentrates on important items and is also known as Control by Importance and Exception [CIE]. Usually a fi rm has to maintain several types of inventories, for proper control of they, fi rm should have to classify inventories in the instance of their relative value. Hence it is also known as Proportional Value Analysis (PVA). The higher value items are classifi ed ‘A items’ and would be under tight control. At the other end of the classifi cation, we fi nd category ‘C items’, on this type of inventory, we cannot afford expenses of rigid controls, frequent ordering and expending, because of the low value or low amounts in this area. Thus with the ‘C items’, we may maintain somewhat higher safety stocks, order more months of supply, expect lower levels of customer service, or all the three. ‘B items’ fall in between ‘A item’ and ‘C item’ and require reasonable attention of management.
According to this technique the task of inventory management is proper classifi cation of all inventory items in to three categories namely A, B and C category. The ideal categorization of inventory items is show in Table.
Category No. of Items(%) Item value (%)A 15 70B 30 20C 55 10
Total 100 100
The above table indicates that only 15 per cent of the items may account for 70 percent of the value [A category items], on which greater attention is required, where as 55 per cent of items may account for 10 per cent of the table value of inventory (C category items), will be paid a reasonless attention. The remaining 30 per cent of inventory account for 20 per cent of total value of inventory (B category items will be paid a reasonable attention as this, category value lies between the two other categories.
Economic Order Quantity (EOQ)
Economic order quantity refers to that level of inventory at which the total cost of inventory is minimum. The total inventory cost comprising ordering and carrying costs. Shortage costs are excluded in adding total cost of inventory due to the diffi culty in computation of shortage cost.
?Did u know? EOQ also known as Economic Lot Size (ELS)
The following assumptions are implied in the calculation of EOQ:
Demand for the product is constant and uniform throughout the period.
Lead time (time from ordering to receipt) is constant.
Price per unit of product is constant.
Unit 10: Inventory Management
Notes
LOVELY PROFESSIONAL UNIVERSITY 169
Inventory holding cost is based on average inventory.
Ordering costs are constant.
All demands for the product will be satisfi ed (no back orders are allowed).
EOQ Formula
EOQ can be obtained by adopting two methods (a) Trial and Error approach and (b) Short cut or Simple mathematical formula. Here for calculation of EOQ we have adopted simple short cut method. The formula is
CCAO2
EOQ =
Where: A = Annual usage,
O = Ordering cost per order
CC = Carrying cost per unit
CC = Price per unit x Carrying cost per unit in percentage
The above simple formula will not be suffi cient to determine EOQ when more complex cost equations are involved.
!Caution EOQ is applicable both to single items and to any group of stock items with
similar holding and ordering costs. Its use causes the sum of the two costs to be lower than under any other system of replenishment.
Example: A company purchases a component of a product at the rate of ` 50 per piece. The annual consumption of that component is 25,000 pieces. If the ordering cost is `230 per order and carrying cost is 20 per cent per annum, what would be the EOQ?
Solution: Annual usage – 25,000 units; Cost of placing and receiving one order – ` 230;
Cost of materials – ` 50 per unit; Annual carrying cost of one unit – 20 per cent of inventory value
Example: XYZ Company buys 75,000 glass bottles per year. Price of each bottle is `0.90. Cost of purchase is ` 100 per order; Cost of holding one bottle per year is ` 0.20. Bank interest is 15 per cent including a charge for taxes and insurance. Find out EOQ quantity.
Solution: Annual usage – 75,000 units; Cost of placing and receiving one order – ` 100
Cost of bottle – ` 0.90 per bottle; Annual carrying cost of one bottle – `0.20 per bottle
* Inventory carrying cost = ` 0.20 + [Re.0.90 x 0.15] = `0.335
Basic Financial Management
Notes
170 LOVELY PROFESSIONAL UNIVERSITY
Order Point Problem
After determination of EOQ, then at what level should the order be placed? If the inventory level is too high, it will be unnecessary blocks the capital, and if the level is too low, it will disturb the production by frequent stock out and also involves high ordering cost. Hence, an effi cient management of inventory needs to maintain optimum inventory level, where there is no stock out and the costs are minimum.
The different stock levels are as follows:
1. Minimum Level: Minimum stock is that level that must be maintained always production will be disturbed, if it is less than the minimum level. How to fi x minimum level? While determination of minimum stock level, lead time, consumption rate, the material nature must be considered
?Did u know? What is Lead time?
Lead-time is the time taken to receive the delivery after placing orders with the supplier. In other words, the number of days required to receive the inventory from the date of placing order. Lead time also called as procurement time of inventory.
Minimum stock level = Re-order level – [Normal Usage x Average delivery time]
2. Reordering Level: Reorder level is that level of inventory at in weeks, which an order should be placed for replenishing the current stock of inventory. Generally, the reorder level lies between minimum stock level and maximum stock level.
Re-order point = Lead time (in days) x Average Daily usage
The above formula is based on the assumption that (a) Consistent daily usage, and (b) Fixed lead-time.
3. Safety Stock: Prediction of average daily usage and lead-time is diffi cult. Raw materials may vary from day-to-day or from week-to-week, it is in the case of lead-time also. Lead-time may be delayed, if the usage increases then the company faces problem of stock out. To avoid stock out fi rm may require to maintain safety stock.
Formula (under uncertainty of usage and lead time)
Re-order point = Lead time (in days) × Average usage + Safety stock
4. Maximum Level: Maximum level of stock, is that level of stock beyond which a fi rm should not maintain the stock. If the fi rm stocks inventory beyond the maximum stock level it is called as overstocking. Excess inventory (overstock) involves heavy cost of inventory, because it blocks fi rms funds in investment inventory, excess carrying cost, wastage, obsolescence, and theft cost. Hence, fi rm should not stock above the maximum stock level.
?Did u know? What is Safety Stock?
Safety stock is that minimum additional inventory to serve as a safety margin or better or buffer or cushion to meet an unanticipated and increase in usage resulting from an unusually high demand and or an uncontrollable late receipt of incoming inventory.
Maximum Stock Level = Reorder Level + Reorder Quantity - (Minimum Usage x Minimum Delivery Time)
Unit 10: Inventory Management
Notes
LOVELY PROFESSIONAL UNIVERSITY 171
Average Stock Level:
Average Stock Level = Minimum level + [Reorder Quantity ÷ 2]
5. Danger Stock Level: Danger level is that level of materials beyond which materials should not fall in any situation. When it falls in danger level it will disturb production. Hence, the fi rm should not allow the stock level to go to danger level, if at all falls in that level then immediately stock should be arranged even if it costly.
Danger Level = Average Usage x Minimum Deliver Time [for emergency purchase]
Two-Bin Technique
It is the oldest techniques of inventory control. Generally, it is used to control ‘C’ category inventories. According to this technique, stock of each item is separated into two piles, bins or groups. First bin contains stock, just enough to last from the date a new order is placed until it is received for inventory. The second bin contains stock, which is enough to meet current demand over the period of replenishment. First stock is issued from fi rst bin whenever the fi rst bin is completed, then an order for replenishment is placed, and the stock in the second is utilized until the ordered material is received.
VED Classifi cation
According to this classifi cation, inventories are grouped based on the effect of production and inventories are grouped into three, they are Vital, Essential and Desirable inventories. It is specially used for classifi cation of spare parts. If a part is vital, in production, then it is classifi ed as ‘V’, if it is essential, then it is assigned ‘E’ and if it is not so essential, desirable that is given ‘D’. ‘V’ category item are stocked high and category ‘D’ items are maintained at minimum level.
Just in Time (JIT)
Popularly known in its acronym JIT. JIT may be applied for either raw materials purchase or producing fi nished goods. From raw materials purchases it means that no inventories are held at any stage of production and the exact requirement is bought in each and every successive stage of production of the right time. In other words, maintenance of a minimum level of raw materials, where by the inventory carrying cost could be minimized, and the risk of loss due to stock-out position could be well avoided. From production of goods view, JIT means goods are produced only when the orders are received, there by no storage of fi nished goods, can avoid costs of carrying fi nished goods. JIT is also known as “Zero Inventory Production System” (ZIPS), Zero Inventories (ZIN), Materials as Needed (MAN), or Neck of Time (NOT).
Task The annual cash requirement of a company is ` 20 lakhs, fi rm has short-term marketable securities is lot size of ` 50,000; ` 1,00,000; ` 1,50,000; ` 2,00,000; ` 2,50,000; ` 5,00,000 and ` 5,50,000. The cost of conversion of marketable securities is ` 4,000 per lot. The company’s opportunity cost is 6 per cent. Determine the economic lot size.
Basic Financial Management
Notes
172 LOVELY PROFESSIONAL UNIVERSITY
10.4 Summary
Inventory management occupies the most signifi cant position in the structure of working
capital.
Management of optimum level of inventory investment is the prime objective of inventory
management.
Inadequate or excess investment in inventories is not healthy by for any fi rm.
The optimum level if investment in inventories lies between excess investment and
inadequate investment.
Economic Order Quantity (EOQ) [Order Quantity Problem] refers to that level of inventory
at which the total cost of inventory is minimum.
10.5 Keywords
Economic Order Quantity (EOQ): It refers to that level of inventory at which the total cost of inventory is minimum.
Inventory: The stockpile of the products a fi rm is offering for sales and the components that make up the product.
Optimum Level of Inventory: It is the level where the total costs of inventory is less.
Raw Materials: It is the input that is converted into fi nished goods through a manufacturing or conversion process.
Work-in-progress: It is the stage of stocks between raw materials & fi nished goods.
10.6 Self Assessment
Fill in the blanks:
1. Inventory is one of components of ..................... assets.
2. The term inventory is originated from the .....................”Inventoried”, and the Latin ............................................
3. Raw materials, work-in-process, fi nished goods and stores and spares are the components of ...................................................
4. ..................... motive necessitates the holiday of inventories for unexpected changes in demand and supply factors.
5. ............................... are those costs that are associated with the acquisition of raw materials.
6. ............................ are those costs that arise due to stock out, either shortage of raw materials or fi nished goods.
7. .............................. refers to that level of inventory at which the total cost of inventory is minimum.
State whether the following statements are true or false:
8. Holding of inventories to take the advantages of changes in prices and getting quantity discounts are known as speculative motive.
9. Inventory carrying costs are those costs that are associated with the carrying of goods from supplies to the fi rm.
Unit 10: Inventory Management
Notes
LOVELY PROFESSIONAL UNIVERSITY 173
10. Price decline, product deterioration, and product obsolescence are the risks of holding inventory.
10.7 Review Questions
1. What is EOQ?
2. What is inventory management?
3. Name the three main components of inventory.
4. The Management of Shesha Sai Textiles has predicted sales of 1,00,000 units of a product in the next 12 months. The product cost is `18 per unit. Its estimated carrying cost is 25 per cent of inventory value and ordering cost is `10 per order. What is the EOQ ?
5. Bharath Engineering Factory consumes 3,00,000 units of a component per year. The ordering, receiving and handling costs are ` 60 per order and the fi rm is estimating its carrying cost at 20 per cent. Component cost per unit is ` 20. Calculate EOQ.
6. Finance Department of RRR Cement Company gathered the following information. You are required to compute EOQ, number of orders in a year, the time gap between the two orders and the total cost of ordering and carrying. Monthly usage 150 units, ordering cost ` 20, cost of purchase of the component ` 5 and carrying cost are 16 per cent.
7. From the following information of ABC Co, Ltd., calculate minimum, maximum and re-order stock levels.
Minimum consumption – 300 units per day
Maximum consumption – 400 units per day
Normal consumption – 320 units per day
Re-order period – 10-20 days
Re-order quantity – 1,500 units
Normal re-order period – 14 days.
8. A manufacturing company has an expected usage of 1,00,000 units of certain product during the next year. The cost of an order is ` 40 and carrying cost is ` 0.5 per unit for one year. Lead-time on an order is fi ve days and company will keep a reserve supply of two days’ usage. You are required to calculate (a) EOQ and (b) the Re-order point (assuming 250-day year).
9. A company received an order for 15,000 units at the rate of 1,000 units per order. The production cost per unit is ` 24 per unit – ` 10 for raw materials and ` 14 as overhead cost. It costs ` 1,500 to set up for one run of 1,000 units and inventory-carrying cost is 20 per cent of the production cost. Since the customer may buy at least 15,000 this year, the company would like to avoid making fi ve different production runs. Determine most economic production run.
10. A wholesale fruit dealer sells 16,000 boxes of dry fruits during the year. The cost of placing an order is ` 500 and each box of dry fruit costs ` 2,000. The cost of carrying inventory is 20 per cent. Find out economic order quantity.
Basic Financial Management
Notes
174 LOVELY PROFESSIONAL UNIVERSITY
Answers: Self Assessment
1. Current 2. French, Inventariom
3. Inventory 4. Precautionary
5. Ordering costs 6. Shortage costs
7. Economic order quantity 8. True
9. False 10. True
10.8 Further Readings
Books Chandra, P., Financial Management - Theory and Practice, New Delhi, Tata McGraw
Hill Publishing Company Ltd., 2002, p. 3.
Sudhindra Bhat, Financial Management, New Delhi, Excel Books, 2008.
Van Horne, J.C. and Wachowicz, Jr, J.M., Fundamentals of Financial Management, New Delhi, Prentice Hall of India Pvt. Ltd., 1996, p. 2.
Online link http://www.fei.org/
Unit 11: Cash Management
Notes
LOVELY PROFESSIONAL UNIVERSITY 175
Unit 11: Cash Management
CONTENTS
Objectives
Introduction
11.1 Concept of Cash Management
11.2 Objectives of Cash Management
11.3 Aspects of Cash Management
11.4 Cash Planning or Cash Budget
11.5 Managing Cash Flows
11.6 Computation of Optimum Cash Balance
11.6.1 Baumol Model
11.6.2 Miller and Orr Model
11.7 Summary
11.8 Keywords
11.9 Self Assessment
11.10 Review Questions
11.11 Further Readings
Objectives
After studying this unit, you will be able to:
Defi ne meaning and objectives of cash management
Discuss important aspects of cash management
Introduction
Cash is one of the components of current assets. It is a medium of exchange for purpose of goods and services and for discharging liabilities. Cash management is one of the key areas of working capital management as cash is both beginning and the end of working capital cycle-cash, inventories, receivables and cash. It is the most liquid asset and the basic input required to keep the business running on a continuous basis.
11.1 Concept of Cash Management
Effi cient management of the infl ow and outfl ow of cash plays a crucial role in the overall performance of a fi rm. Shortage of cash will disrupt the fi rm’s manufacturing process while excess cash will remain idle without any contribution towards profi t. Cash is not an end itself, but is a means to achieve the end. To quote Brigham, “Cash is a non-earning asset, so excessive cash balance simply lowers the total assets turnover, thereby reducing both the rate of return on net worth and the value of the stock.” The steady and healthy circulation of cash throughout the entire business operation is the business solvency.
Basic Financial Management
Notes
176 LOVELY PROFESSIONAL UNIVERSITY
Therefore, effective management of cash involves an effort to minimise investment in cash without impairing to liquidity of the fi rm. It implies a proper balancing between the two confl icting objectives of the liquidity and profi tability.
Notes Nature of Cash
Cash is the medium of exchange for purchase of goods and services, and for discharging liabilities. In cash management the term cash has been used in two senses:
1. Narrow Sense: Under this cash covers currency and generally accepted equivalents of cash, viz., cheques, demand drafts and banks demand deposits.
2. Broad Sense: Here, cash includes not only the above stated but also cash assets. There are bank’s time deposits and marketable securities. The marketable security can easily sold and converted into cash. Here, cash management is in broader sense.
11.2 Objectives of Cash Management
Following as the objectives of cash management:
1. To Meet Cash Payments: The prime objective of cash management is to meet various cash payments needed to pay in business operations. The payments are like payment to supplier of raw materials, payment of wages and salaries, payment of electricity bills, telephone bills and so on. Firm should maintain cash balances to meet the payments; otherwise it will not be able to run business. To quote Bollen, “Cash is an oil to lubricate the ever-turning wheels of business: without it, the process grinds to a stop”. Hence, one of the cash management objectives is to meet the payments with the maintenance of suffi cient cash.
2. To Maintain Minimum Cash Balance (Reserve): This is second important objective of cash management. It means the fi rm should not maintain excess cash balances. Excess cash balance may ensure prompt payment, but if the excess balance will remain idle, as cash is a non-earning asset and the fi rm will have to forego profi ts. On the other hand, maintenance of low level of cash balance may not help to pay the obligations. Hence, the aim of cash management is to maintain optimum cash balance.
Notes Motives for Holding Cash
Cash is the most crucial component of the working capital of a fi rm, as every transaction results either in an infl ow or outfl ow of cash. Cash has no earning power, then why does a fi rm need cash? John Maynard Keynes puts forth that there are three possible motives for holding cash.
1. The Transaction Motive: This motive arises due to the necessity of having cash for various disbursements like purchase of raw materials, payment of business expenses, payment of tax, payment of dividend and so on. The need to hold cash would not arise, if there is perfect synchronization between the cash receipts and the cash payments. Hence, the fi rm must have an adequate cash balance particularly when payments are in excess of receipts to meet its obligations. The requirement of cash to meet routine cash needs is known as the transaction motive and such motive refers to the holding of cash to meet anticipated obligations whose timing is not perfectly synchronized with each receipts. The transaction motive, thus, refers to the holding
Contd....
Unit 11: Cash Management
Notes
LOVELY PROFESSIONAL UNIVERSITY 177
of cash to meet anticipated obligations whose timing is not perfectly synchronized with cash receipts.
2. The Precautionary Motive: Apart from the non-synchronization of anticipated cash fl ows in the ordinary course of business, fi rm may require cash for the payment of unexpected disbursements. The unexpected cash needs at short-notice may be the result of fl oods, strikes and failure of important customers, bills may be presented for settlement earlier than expected, slow down in collection of accounts receivables, sharp increase in cost of raw materials. It provides a cushion or buffer to withstand some unexpected emergency. The precautionary balance may be held in near-money assets like marketable securities. The amount set aside for precautionary motive is not expected to earn anything. As matter of abundant caution, many companies had learnt the art of ‘cultivating the rich uncle’, by establishing and maintaining good lasting link with progressive banking institutions. Ready borrowing power is the best antidote to emergency cash drains and facilities release available cash resources for remunerative applications.
3. The Speculative Motive: It refers to the desire of a fi rm to take advantage of opportunities, which present themselves at unexpected moments and that are typically outside the normal course of business. In simple words, it is a motive of holding cash relates for investing in profi table opportunities as and when they arise. In other words, this motive comes from a desire of holding cash to gain in speculative transactions such as, purchase of raw materials at reduced price on payment of immediate cash, dealing in commodities in bulk purchasing and selling when rates are considered favourable. Hence fi rms, which have such speculative dealings, may carry additional liquidity.
11.3 Aspects of Cash Management
The aspects or problems of cash management can be examined under three heads, such as:
1. Cash infl ows and outfl ows,
2. Cash fl ow within the fi rm, and
3. Cash balances held at the point of time.
Cash infl ows (receipts) and outfl ows (payments) may not match, they may be excess or less over cash outfl ows. Surplus cash arise when the cash infl ows are excess over cash outfl ows and defi cit will arise when the cash infl ows are less than the cash outfl ows. The balance known as synchronisation fi rm should develop appropriate strategies for resolving the uncertainty involved in cash fl ow prediction and in balance between cash receipts and payments. Firm has to come up with some cash management strategies regarding the following four facets of cash management.
1. Cash Planning: Cash planning is required to estimate the cash surplus or defi cit for each planning period. Estimation of cash surplus or defi cit can be arrived by preparation of cash budget.
2. Cash Flows Management: Cash fl ows means cash infl ows and cash outfl ows. The cash fl ows should be properly managed that the cash infl ows should be accelerated (collected as early as possible) and cash outfl ows should be decelerated (cash payments should be delayed without affecting fi rm name).
3. Determination of Optimum Cash Balance: Optimum cash balance is that balance at which the cost of excess cash and danger of cash defi ciency will match. In other words, it is the cash balance at that the total cost (total cost equals to transaction cost and opportunity cost) is minimum. Firm has to determine optimum cash balance.
Basic Financial Management
Notes
178 LOVELY PROFESSIONAL UNIVERSITY
4. Investment of Surplus Cash: Whenever there is surplus cash it should be properly invested in marketable securities, to earn profi ts. Firms should not invest in long-term securities; they cannot be converted into cash within a short period.
11.4 Cash Planning or Cash Budget
Cash planning and control of cash is the central point of fi nance functions. Maintenance of adequate cash is one of the prime responsibilities of fi nancial manager. It is possible only through preparation of cash planning.
Cash control is also included in cash planning. Since planning and control are the twins of management. Cash planning is a technique to plan and control the use of cash.
Cash Forecasting and Budgeting
Cash forecast is used as a method to predict future cash fl ow because it deals with the estimation of cash fl ows (i.e., cash in fl ows and cash outfl ows) at different stages and offers the management an advance notice to take appropriate and timely action.
Cash budget is an important tool for the fl ow of cash in any fi rm over a future period of time. In other words, it is a statement showing the estimated cash infl ows and cash outfl ows over a planning period. It pinpoints the surplus or defi cit cash of a fi rm as it moves from one period to another period. The surplus of defi cit data helps the fi nancial manager to determine the future cash needs of the fi rm, plan for the fi nancing of those needs and exercise control over the cash and liquidity of the fi rm. Cash budget is also known as short-term cash forecasting.
Notes Steps Involved in Preparation of Cash Budget
Preparation of cash budget involves the following steps:
Step 1: Selection of period of time (planning horizon): Planning horizon is that period for which cash budget is prepared. There are no fi xed rules for cash budget preparation. Planning horizon of a cash budget may differ from fi rm to fi rm, depending upon the size of the fi rm. Cash budget period should not be too short or too long.
Step 2: Selection of factor that has bearing on cash fl ows: The factors that generate cash fl ows are divided into two broad categories. (a) Operating, and (b) Financial.
1. Operating Cash Flows: Operating cash infl ows are cash sales, collection of accounts receivables and disposal of fi xed assets and the operating cash outfl ows are bills payables, purchase of raw materials, wages, factory expenses, administrative expenses, maintenance expenses and purchase of fi xed assets.
2. Financial Cash Flows: Loans and borrowings, sale of securities, dividend received, refund of tax, rent received, interest received and issue of new shares and debentures cash outfl ows are redemption of loan, repurchase of shares, income tax payments, interest paid and dividend paid.
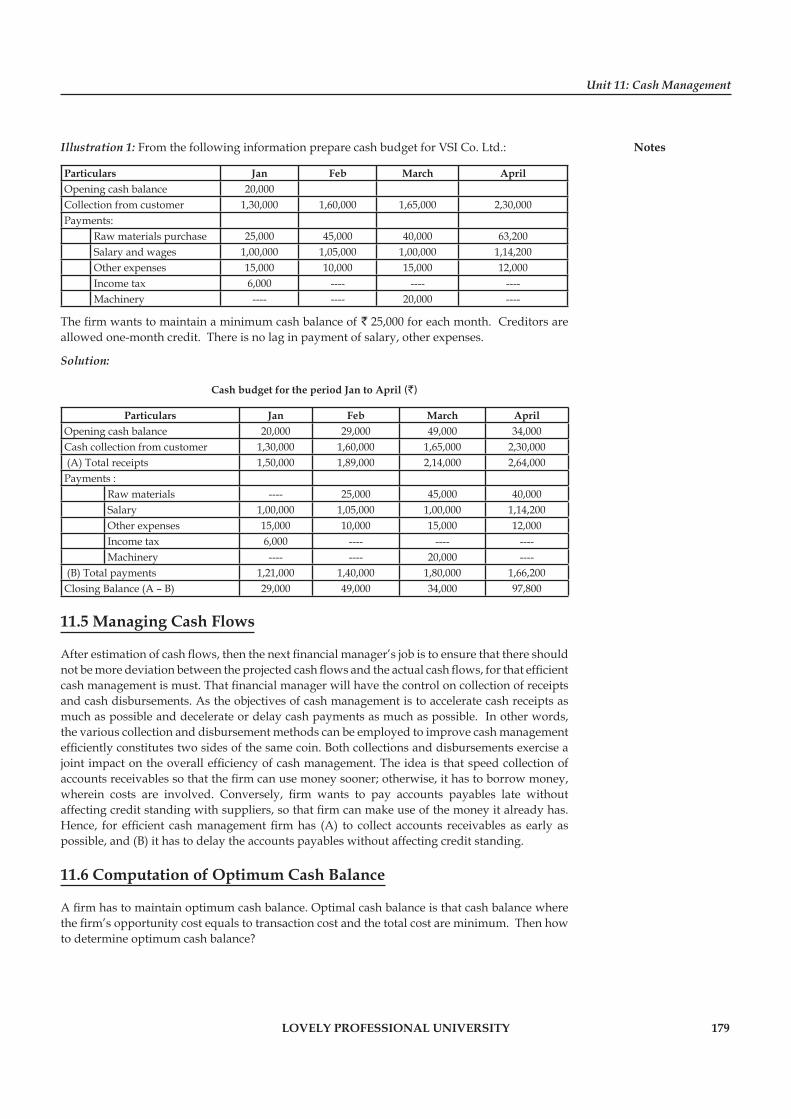
Unit 11: Cash Management
Notes
LOVELY PROFESSIONAL UNIVERSITY 179
Illustration 1: From the following information prepare cash budget for VSI Co. Ltd.:
Particulars Jan Feb March AprilOpening cash balance 20,000Collection from customer 1,30,000 1,60,000 1,65,000 2,30,000Payments:
Raw materials purchase 25,000 45,000 40,000 63,200Salary and wages 1,00,000 1,05,000 1,00,000 1,14,200Other expenses 15,000 10,000 15,000 12,000Income tax 6,000 ---- ---- ----Machinery ---- ---- 20,000 ----
The fi rm wants to maintain a minimum cash balance of ` 25,000 for each month. Creditors are allowed one-month credit. There is no lag in payment of salary, other expenses.
Solution:
Cash budget for the period Jan to April (`)
Particulars Jan Feb March AprilOpening cash balance 20,000 29,000 49,000 34,000Cash collection from customer 1,30,000 1,60,000 1,65,000 2,30,000 (A) Total receipts 1,50,000 1,89,000 2,14,000 2,64,000Payments :
Raw materials ---- 25,000 45,000 40,000Salary 1,00,000 1,05,000 1,00,000 1,14,200Other expenses 15,000 10,000 15,000 12,000Income tax 6,000 ---- ---- ----Machinery ---- ---- 20,000 ----
(B) Total payments 1,21,000 1,40,000 1,80,000 1,66,200Closing Balance (A – B) 29,000 49,000 34,000 97,800
11.5 Managing Cash Flows
After estimation of cash fl ows, then the next fi nancial manager’s job is to ensure that there should not be more deviation between the projected cash fl ows and the actual cash fl ows, for that effi cient cash management is must. That fi nancial manager will have the control on collection of receipts and cash disbursements. As the objectives of cash management is to accelerate cash receipts as much as possible and decelerate or delay cash payments as much as possible. In other words, the various collection and disbursement methods can be employed to improve cash management effi ciently constitutes two sides of the same coin. Both collections and disbursements exercise a joint impact on the overall effi ciency of cash management. The idea is that speed collection of accounts receivables so that the fi rm can use money sooner; otherwise, it has to borrow money, wherein costs are involved. Conversely, fi rm wants to pay accounts payables late without affecting credit standing with suppliers, so that fi rm can make use of the money it already has. Hence, for effi cient cash management fi rm has (A) to collect accounts receivables as early as possible, and (B) it has to delay the accounts payables without affecting credit standing.
11.6 Computation of Optimum Cash Balance
A fi rm has to maintain optimum cash balance. Optimal cash balance is that cash balance where the fi rm’s opportunity cost equals to transaction cost and the total cost are minimum. Then how to determine optimum cash balance?
Basic Financial Management
Notes
180 LOVELY PROFESSIONAL UNIVERSITY
Optimum cash balance can be determined by a number of mathematical models. But here the most important two models are discussed. They are:
1. Baumol Model (Inventory Model)
2. Miller—Orr Model (Statistical Model)
11.6.1 Baumol Model
This model was developed by Baumol. This model is suitable only when the cost fl ows are predictable (under certainty). It considers optimum cash balance similar to the economic order quantity, since it is based on EOQ Concept and also in both the cases there is trade off between cost of borrowing (sale of securities cost) and opportunity the cost. The point where the total cost is minimum. Figure shows Baumol model.
!Caution Baumol model is based on the following assumptions:
The fi rm knows its cash needs with certainty.
1. The cash payment (disbursement) of the fi rm occurs uniformly over a period of time and is known with certainty.
2. The opportunity cost of holding cash is known and it remains stable over time.
3. The transaction cost is known and remains stable.
Elements of Total Cost
The total cost associated with management of cash under this model involves two elements (a) Conversion cost (transaction cost) and (b) Opportunity cost (interest cost).
1. Conversion Cost (Transaction cost): Conversion costs are those costs that are associated with sale of marketable security and raise whenever fi rm converts marketable security into cash. Conversion Cost (C) = C [F/M]
Where, C = Cost per conversion;
F = Expected cash need for future period
M = Amount of marketable securities sold in each sale.
2. Opportunity Cost: Is the (cost benefi t) foregone by holding idle cash. In other words, opportunity cost is the interest forgone on an average cash balance. Symbolically,
Opportunity cost (O) = I (M ÷ 2)
Where, I = Interest rate that could have been earned
M ÷ 2 = Average can balance [(Opening cash + Closing cash)/2]
Total cost = Conversion cost + Opportunity cost
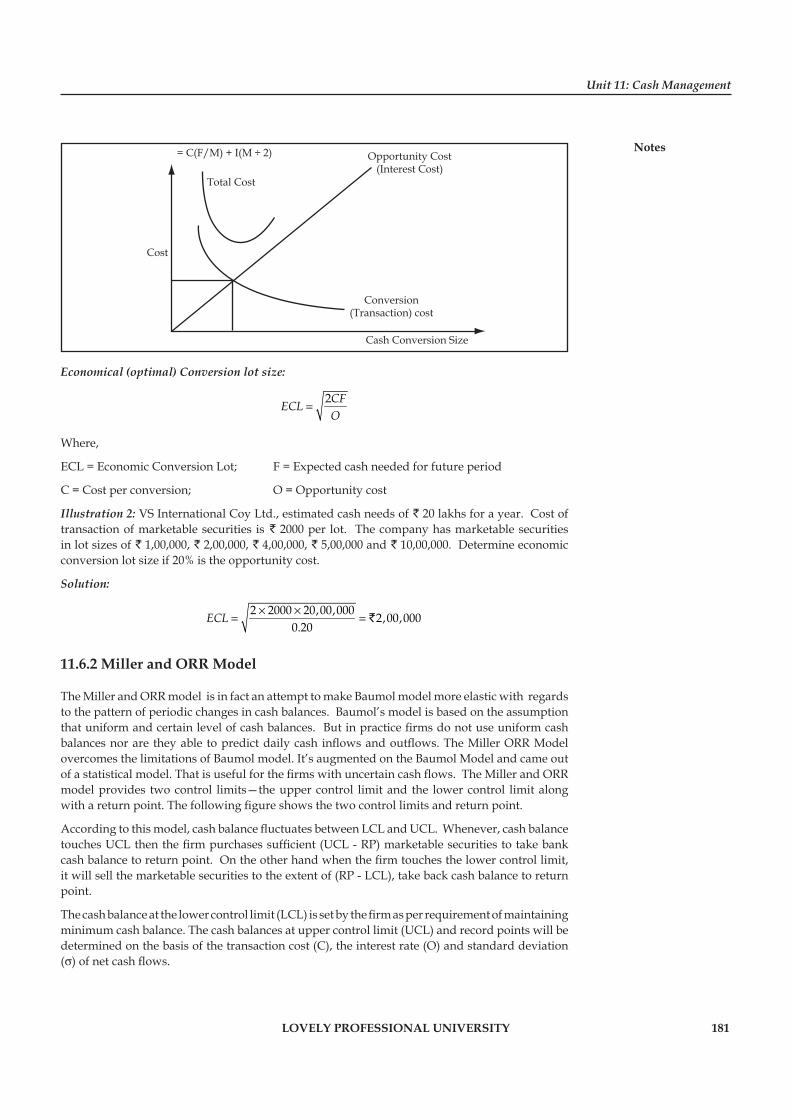
Unit 11: Cash Management
Notes
LOVELY PROFESSIONAL UNIVERSITY 181
= C(F/M) + I(M ÷ 2)
Total Cost
Opportunity Cost(Interest Cost)
Conversion(Transaction) cost
Cash Conversion Size
Cost
Economical (optimal) Conversion lot size:
2CFECLO
=
Where,
ECL = Economic Conversion Lot; F = Expected cash needed for future period
C = Cost per conversion; O = Opportunity cost
Illustration 2: VS International Coy Ltd., estimated cash needs of ` 20 lakhs for a year. Cost of transaction of marketable securities is ` 2000 per lot. The company has marketable securities in lot sizes of ` 1,00,000, ` 2,00,000, ` 4,00,000, ` 5,00,000 and ` 10,00,000. Determine economic conversion lot size if 20% is the opportunity cost.
Solution:
2 2000 20,00,000 2,00,0000.20
ECL × ×= = `
11.6.2 Miller and ORR Model
The Miller and ORR model is in fact an attempt to make Baumol model more elastic with regards to the pattern of periodic changes in cash balances. Baumol’s model is based on the assumption that uniform and certain level of cash balances. But in practice fi rms do not use uniform cash balances nor are they able to predict daily cash infl ows and outfl ows. The Miller ORR Model overcomes the limitations of Baumol model. It’s augmented on the Baumol Model and came out of a statistical model. That is useful for the fi rms with uncertain cash fl ows. The Miller and ORR model provides two control limits—the upper control limit and the lower control limit along with a return point. The following fi gure shows the two control limits and return point.
According to this model, cash balance fl uctuates between LCL and UCL. Whenever, cash balance touches UCL then the fi rm purchases suffi cient (UCL - RP) marketable securities to take bank cash balance to return point. On the other hand when the fi rm touches the lower control limit, it will sell the marketable securities to the extent of (RP - LCL), take back cash balance to return point.
The cash balance at the lower control limit (LCL) is set by the fi rm as per requirement of maintaining minimum cash balance. The cash balances at upper control limit (UCL) and record points will be determined on the basis of the transaction cost (C), the interest rate (O) and standard deviation (σ) of net cash fl ows.
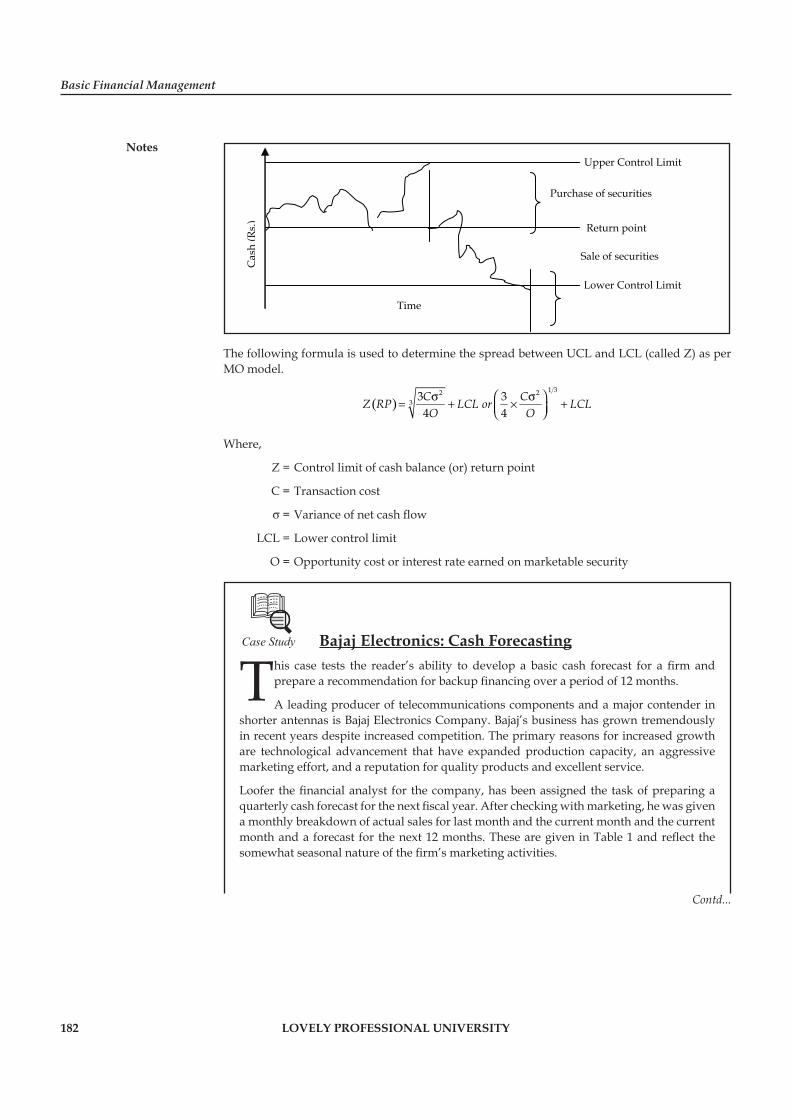
Basic Financial Management
Notes
182 LOVELY PROFESSIONAL UNIVERSITY
Upper Control Limit
Return point
Lower Control Limit
Purchase of securities
Time
Cas
h (R
s.)
Sale of securities
The following formula is used to determine the spread between UCL and LCL (called Z) as per MO model.
( )1 32 2
33 34 4C CZ RP LCL or LCLO O
⎛ ⎞σ σ= + × +⎜ ⎟⎝ ⎠
Where,
Z = Control limit of cash balance (or) return point
C = Transaction cost
σ = Variance of net cash fl ow
LCL = Lower control limit
O = Opportunity cost or interest rate earned on marketable security
Case Study Bajaj Electronics: Cash Forecasting
This case tests the reader’s ability to develop a basic cash forecast for a fi rm and prepare a recommendation for backup fi nancing over a period of 12 months.
A leading producer of telecommunications components and a major contender in shorter antennas is Bajaj Electronics Company. Bajaj’s business has grown tremendously in recent years despite increased competition. The primary reasons for increased growth are technological advancement that have expanded production capacity, an aggressive marketing effort, and a reputation for quality products and excellent service.
Loofer the fi nancial analyst for the company, has been assigned the task of preparing a quarterly cash forecast for the next fi scal year. After checking with marketing, he was given a monthly breakdown of actual sales for last month and the current month and the current month and a forecast for the next 12 months. These are given in Table 1 and refl ect the somewhat seasonal nature of the fi rm’s marketing activities.
Contd...
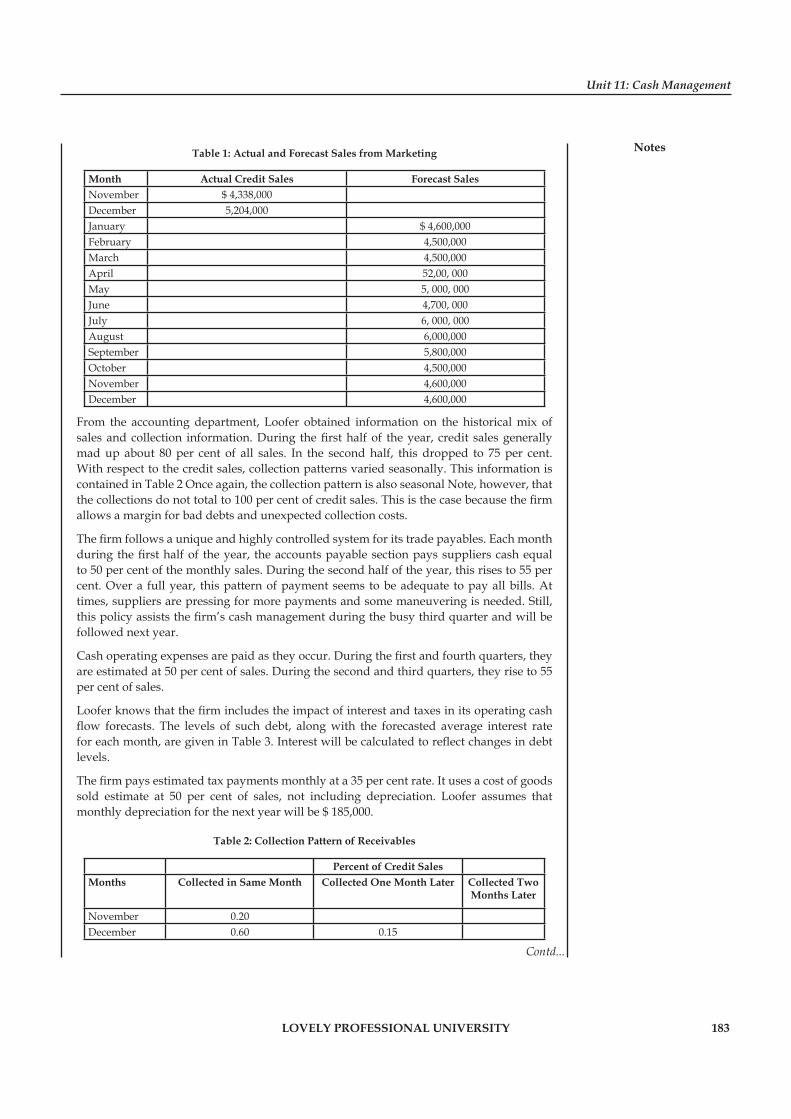
Unit 11: Cash Management
Notes
LOVELY PROFESSIONAL UNIVERSITY 183
Table 1: Actual and Forecast Sales from Marketing
Month Actual Credit Sales Forecast SalesNovember $ 4,338,000December 5,204,000January $ 4,600,000February 4,500,000March 4,500,000April 52,00, 000May 5, 000, 000June 4,700, 000July 6, 000, 000August 6,000,000September 5,800,000October 4,500,000November 4,600,000December 4,600,000
From the accounting department, Loofer obtained information on the historical mix of sales and collection information. During the fi rst half of the year, credit sales generally mad up about 80 per cent of all sales. In the second half, this dropped to 75 per cent. With respect to the credit sales, collection patterns varied seasonally. This information is contained in Table 2 Once again, the collection pattern is also seasonal Note, however, that the collections do not total to 100 per cent of credit sales. This is the case because the fi rm allows a margin for bad debts and unexpected collection costs.
The fi rm follows a unique and highly controlled system for its trade payables. Each month during the fi rst half of the year, the accounts payable section pays suppliers cash equal to 50 per cent of the monthly sales. During the second half of the year, this rises to 55 per cent. Over a full year, this pattern of payment seems to be adequate to pay all bills. At times, suppliers are pressing for more payments and some maneuvering is needed. Still, this policy assists the fi rm’s cash management during the busy third quarter and will be followed next year.
Cash operating expenses are paid as they occur. During the fi rst and fourth quarters, they are estimated at 50 per cent of sales. During the second and third quarters, they rise to 55 per cent of sales.
Loofer knows that the fi rm includes the impact of interest and taxes in its operating cash fl ow forecasts. The levels of such debt, along with the forecasted average interest rate for each month, are given in Table 3. Interest will be calculated to refl ect changes in debt levels.
The fi rm pays estimated tax payments monthly at a 35 per cent rate. It uses a cost of goods sold estimate at 50 per cent of sales, not including depreciation. Loofer assumes that monthly depreciation for the next year will be $ 185,000.
Table 2: Collection Pattern of Receivables
Percent of Credit SalesMonths Collected in Same Month Collected One Month Later Collected Two
Months Later
November 0.20December 0.60 0.15
Contd...
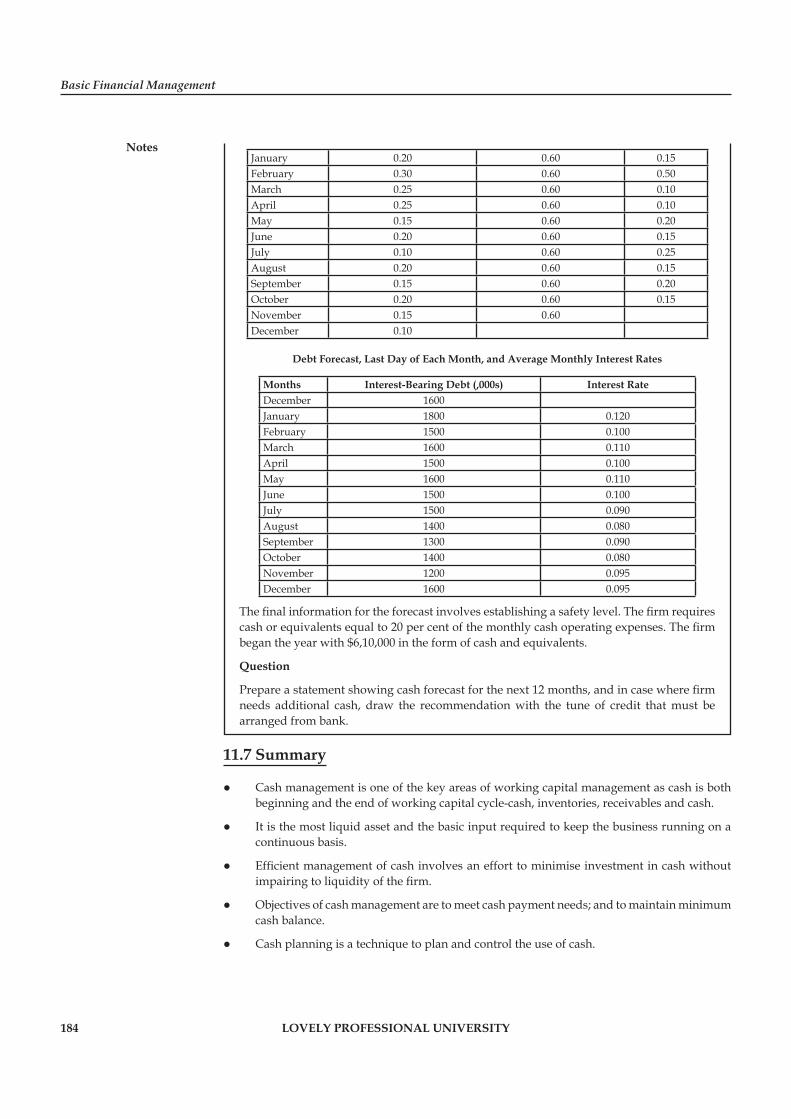
Basic Financial Management
Notes
184 LOVELY PROFESSIONAL UNIVERSITY
January 0.20 0.60 0.15February 0.30 0.60 0.50March 0.25 0.60 0.10April 0.25 0.60 0.10May 0.15 0.60 0.20June 0.20 0.60 0.15July 0.10 0.60 0.25August 0.20 0.60 0.15September 0.15 0.60 0.20October 0.20 0.60 0.15November 0.15 0.60December 0.10
Debt Forecast, Last Day of Each Month, and Average Monthly Interest Rates
Months Interest-Bearing Debt (,000s) Interest RateDecember 1600January 1800 0.120February 1500 0.100March 1600 0.110April 1500 0.100May 1600 0.110June 1500 0.100July 1500 0.090August 1400 0.080September 1300 0.090October 1400 0.080November 1200 0.095December 1600 0.095
The fi nal information for the forecast involves establishing a safety level. The fi rm requires cash or equivalents equal to 20 per cent of the monthly cash operating expenses. The fi rm began the year with $6,10,000 in the form of cash and equivalents.
Question
Prepare a statement showing cash forecast for the next 12 months, and in case where fi rm needs additional cash, draw the recommendation with the tune of credit that must be arranged from bank.
11.7 Summary
Cash management is one of the key areas of working capital management as cash is both
beginning and the end of working capital cycle-cash, inventories, receivables and cash.
It is the most liquid asset and the basic input required to keep the business running on a
continuous basis.
Effi cient management of cash involves an effort to minimise investment in cash without
impairing to liquidity of the fi rm.
Objectives of cash management are to meet cash payment needs; and to maintain minimum
cash balance.
Cash planning is a technique to plan and control the use of cash.
Unit 11: Cash Management
Notes
LOVELY PROFESSIONAL UNIVERSITY 185
A projected cash fl ow statement prepared based on expected cash receipts and payments,
anticipation the fi nancial condition of the fi rm.
Cash budget is a statement showing the estimated cash infl ows and cash outfl ows over a
planning period.
11.8 Keywords
Cash Budget: It is a statement showing the estimated cash infl ows and cash outfl ows over a planning period.
Cash Planning: It is a technique to plan and control the use of cash.
Cash: It is one of the components of current assets and a medium of exchange for the purpose of transactions.
Money Market: It refers to the market for short-term securities.
11.9 Self Assessment
Fill in the blanks:
1. Cash is one of the components of ..................... .
2. Cash is the most ..................... asset.
3. The two types of cash forecasting are ..................... and ..................... .
4. Surplus cash is ..................... .
5. ................................... is required to estimate the cash surplus or defi cit for each planning period.
6. ............................is that balance at which the cost of excess cash and danger of cash defi ciency will match.
State whether the following statements are true or false:
7. There is no time gap between cash infl ows and outfl ows.
8. The time taken by post offi ces in transferring the cheques from the customer to the fi rm is referred to as postal fl oat.
9. There are four motives for holding cash.
10. Conversion cost is the cost of converting securities into cash.
11.10 Review Questions
1. ABC Ltd., estimates its total cash requirement as ` 5 crore in the next year. ` 300 is the conversion cost of securities in cash on which the fi rm was earning 15 per cent interest per annum. Determining the optimum cash balance.
2. Best of Luck Co. Ltd., fi rm estimated its total cash requirements of ` 2,00,000 for next six months. The fi rm has to spend ` 200 as conversion cost, if it wants to convert its securities into cash. The fi rm has 10 per cent securities. What is the economic conversion size of cash. Assume the fi rm has securities in the lot sizes of ` 20,000, ` 40,000, ` 60,000, ` 80,000 and ` 1,00,000.
Basic Financial Management
Notes
186 LOVELY PROFESSIONAL UNIVERSITY
3. Venkat & Co., expects its cash fl ow to behave in a random manner, as it was assumed by Miller Orr model. Venkat & Co. requested you to set an UCL and RP, with the following information. The management of fi rm would like to maintain a minimum cash balance of ` 70,000. The standard deviation its daily cash balances in ` 7,000. Firm earns a 12 per cent yield on its short-term marketable securities. Conversion of securities into cash is net cost free it involves ` 120 (Assume 366 days a year).
4. How do you determining optimum level of cash balances? How does uncertainty of cash balance affects this problem?
5. “Management of cash fl ows plays a very important role in cash management”. Discuss.
6. Briefl y discuss the various avenues or opportunities available to the companies to park their surplus funds for a short-term.
7. Effi cient cash management will aim at maximizing the cash infl ows and slowing cash outfl ows”. Discuss.
8. “Cash budgeting or short-term cash forecasting (budgeting) is the principal tool of cash management.” Discuss.
9. What represents the optimal cash balance for a fi rm?
10. What do you understand by Badla fi nancing?
Answers: Self Assessment
1. Current assets 2. Liquid
3. Short-term, Long-term 4. Unproductive
5. Cash planning 6. Optimum cash balance
7. False 8. True
9. False 10. True
11.11 Further Readings
Books Chandra, P., Financial Management - Theory and Practice, New Delhi, Tata McGraw Hill Publishing Company Ltd., 2002, p. 3.
Sudhindra Bhat, Financial Management, New Delhi, Excel Books, 2008.
Van Horne, J.C. and Wachowicz, Jr, J.M., Fundamentals of Financial Management, New Delhi, Prentice Hall of India Pvt. Ltd., 1996, p. 2.
Online link http://www.fei.org/

Unit 12: Dividend Policy
Notes
LOVELY PROFESSIONAL UNIVERSITY 187
Unit 12: Dividend Policy
CONTENTS
Objectives
Introduction
12.1 Meaning of Dividend Policy
12.2 Types of Dividend Policies
12.2.1 Stable Dividend Policy
12.2.2 Irregular Dividend Policy
12.2.3 No Dividend Policy
12.2.4 Residual Dividend Policy
12.3 Determinants of Dividend Policy
12.4 Summary
12.5 Keywords
12.6 Self Assessment
12.7 Review Questions
12.8 Further Readings
Objectives
After studying this unit, you will be able to:
Defi ne meaning of dividend policy
Discuss determinants of dividend policy
Introduction
Finance is the life-blood of business, without which a fi rm cannot promote, maintain and expand and achieve its predetermined objective. Whether it is big, medium or small it needs fi nance. Profi t is the primary motivating force for any economic activity, a business enterprise essentially being an economic organization, it has to maximise the welfare of its stakeholders. To this end, the business undertaking has to earn profi t from its operations. Profi t is the excess of revenue over expenses on conducting operations. In fact, profi ts are useful intermediate beacon towards which a fi rm’s capital should be directed. In this connection McAlpine rightly remarked that profi t cannot be ignored since it is both, a measure of the success of business and the means of its survival and growth.
Certainly, profi t growth coupled with high level of profi t and the ability to maintain reasonable profi t will help towards:
1. Ensuring that shareholders receive an adequate dividend;
2. Preserving the assets worth of the business;
3. Generating a suffi cient cash fl ow out of profi ts to provide capital for expansion; and
Basic Financial Management
Notes
188 LOVELY PROFESSIONAL UNIVERSITY
4. Providing funds for research, and development of new and improved products to replace the existing products before they decline.
12.1 Meaning of Dividend Policy
The term ‘dividend’ refers to that portion of company’s net earnings that is paid out to the equity shareholders (not for preference shareholders, since they are entitled to have a fi xed rate of dividend). Dividend policy of a fi rm decides the portion of earnings is to be paid as dividends to ordinary shareholders and the portion that is ploughed back in the fi rm for investment purpose. The total net earnings of equity may be paid as dividends (100% dividend payout ratio), which may consequently result in slower growth and lower market price or a part of net earnings may be paid as dividends, higher capital gains and higher market price. When a company uses a part of its net earnings for dividend payments then, the remaining earnings are retained.
?Did u know? Net earnings = Operating Profi t - (Interest + Tax + Preference Dividend)
Hence, the alternative use of net earnings or net profi t dividends and retained earnings are competitive and confl icting.
12.2 Types of Dividend Policies
Dividend decision of a fi rm is taken after taking into consideration, its operating and fi nancial condition. When there are variations in these conditions the fi rm may require to adopt the one that is suitable for the present conditions. What are the different types of dividend policies available to the fi nancial manager? The types of dividend policies are as follows:
12.2.1 Stable Dividend Policy
The term “stability” refers to the consistency or lack of variability in the stream of dividend payments. In more precise terms, stable dividend means payment of a certain minimum amount of dividend regularly. There are three distinct forms of stability, they are:
1. Constant Dividend Per Share: A company that follows this policy will pay a fi xed amount per share as dividend. For example ` 2 as a dividend on the face value of share of ̀ 10 each. The level of earnings would not affect this policy or the dividend payments. This type of dividend policy is more suitable for the company whose earnings are stable over a number of years. Stability of dividend does not mean stagnation in dividend payout. In fact, the prime feature of this policy is to study positive change.
2. Constant Payout Ratio: The ratio of dividend to earnings is known as payout ratio. In other words, dividend per share is divided by earnings per share to get dividend payout ratio. It is also known as constant percentage of net earnings. In this policy a fi xed percentage of earnings are paid as dividends each year. Here the ratio is fi xed or constant, but dividend per share varies according to the fl uctuations in the earnings.
Example: It a company follows a 30 per cent payout ratio it means for every one rupee of net earnings, ` 0.30 ,paid as dividends. Assume if a company earned ` 10 last year and ` 15 in the current year. Then the dividend amount for last year is ` 3 (10 x 30/100) and ` 4.5 (15 x 30/100) for the current year. The relationship between EPS and DPS is shown in fi gure 12.1.
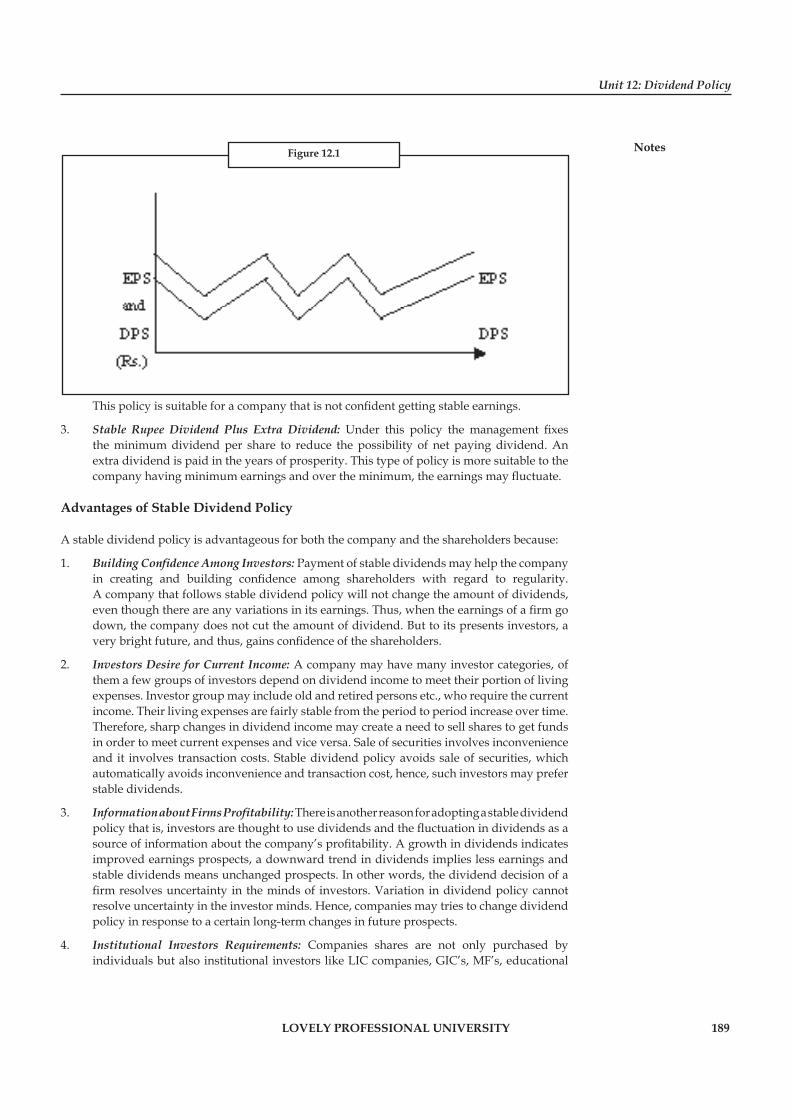
Unit 12: Dividend Policy
Notes
LOVELY PROFESSIONAL UNIVERSITY 189
This policy is suitable for a company that is not confi dent getting stable earnings.
3. Stable Rupee Dividend Plus Extra Dividend: Under this policy the management fi xes the minimum dividend per share to reduce the possibility of net paying dividend. An extra dividend is paid in the years of prosperity. This type of policy is more suitable to the company having minimum earnings and over the minimum, the earnings may fl uctuate.
Advantages of Stable Dividend Policy
A stable dividend policy is advantageous for both the company and the shareholders because:
1. Building Confi dence Among Investors: Payment of stable dividends may help the company in creating and building confi dence among shareholders with regard to regularity. A company that follows stable dividend policy will not change the amount of dividends, even though there are any variations in its earnings. Thus, when the earnings of a fi rm go down, the company does not cut the amount of dividend. But to its presents investors, a very bright future, and thus, gains confi dence of the shareholders.
2. Investors Desire for Current Income: A company may have many investor categories, of them a few groups of investors depend on dividend income to meet their portion of living expenses. Investor group may include old and retired persons etc., who require the current income. Their living expenses are fairly stable from the period to period increase over time. Therefore, sharp changes in dividend income may create a need to sell shares to get funds in order to meet current expenses and vice versa. Sale of securities involves inconvenience and it involves transaction costs. Stable dividend policy avoids sale of securities, which automatically avoids inconvenience and transaction cost, hence, such investors may prefer stable dividends.
3. Information about Firms Profi tability: There is another reason for adopting a stable dividend policy that is, investors are thought to use dividends and the fl uctuation in dividends as a source of information about the company’s profi tability. A growth in dividends indicates improved earnings prospects, a downward trend in dividends implies less earnings and stable dividends means unchanged prospects. In other words, the dividend decision of a fi rm resolves uncertainty in the minds of investors. Variation in dividend policy cannot resolve uncertainty in the investor minds. Hence, companies may tries to change dividend policy in response to a certain long-term changes in future prospects.
4. Institutional Investors Requirements: Companies shares are not only purchased by individuals but also institutional investors like LIC companies, GIC’s, MF’s, educational
Figure 12.1

Basic Financial Management
Notes
190 LOVELY PROFESSIONAL UNIVERSITY
institutes and social institutes. Normally, companies are very much interested to have these institutional investors in the list of their investors. Generally, this type of institutional investors have large size of their ingestible funds, these funds will be invested in the shares of those companies that have the record of paying stable dividends. So, to attract institutional investors a fi rm may prefer to adopt a regular or stable dividend policy.
5. Raising Additional Finances: This is another advantage to the company that is following a stable dividend policy, in raising external fi nance. Shares of this type of company appear as investment rather than a speculation. Investors, who invest in this type of company’s shares hold them for a long period of time and their loyalty and goodwill towards the fi rm increase by adoption of stable dividend policy. If the company wants to raise additional funds by issuing shares to the public, they would be more receptive to that offer. For example recently in beginning of the year 2004, the public issue of ONGC, ICICI, IPTCL, GAIL are over subscribed. Thus, rising of additional funds required by the fi rm becomes very easy, even with high premium.
Limitations of Stable Dividend Policy
In spite of the above discussed advantages the stable dividend policy suffers from certain limitations. They are:
1. Diffi cult to Change: Once a stable dividend policy is established, it cannot be changed without affecting investors’ attitude and fi nancial position of the company, in the minds of investor.
2. Adverse Effect on Market Price of Share: As we have discussed in the advantages, about the investors desire for current income to meet their living expenses, the investors who prefer or depend on stable dividends, may feel bad, when the fi rm cuts dividend, consequently they may sell some of their shares to fulfi ll the gap between expected dividend and the actual dividend received (negative dividend. This leads to the reduction in the share price. Hence, directors have to maintain stability in dividends, in lean years.
3. Long-Run Effect on Company: When a fi rm maintains stable dividend policy in lean years over a period of time with borrowed funds it may lead to death in the long-run.
12.2.2 Irregular Dividend Policy
Some companies follow irregular dividend payments on account of the following:
1. Uncertainty of earnings.
2. Unsuccessful business operations.
3. Lack of liquid resources.
4. Fear of adverse effects of regular dividends on the fi nancial standing of the company.
12.2.3 No Dividend Policy
A company may follow a policy of paying no dividends presently because of its unfavourable working capital position or on account of requirements of funds for future expansion and growth.
12.2.4 Residual Dividend Policy
When new equity is raised fl oatation costs are involved. This makes new equity costlier than retained earnings. Under the Residual approach, dividends are paid out of profi ts after making provision for money required to meet upcoming capital expenditure commitments.
Unit 12: Dividend Policy
Notes
LOVELY PROFESSIONAL UNIVERSITY 191
12.3 Determinants of Dividend Policy
The following are the various factors that have a bearing on the dividend policy:
1. Nature of Business: The nature of business has an important bearing on the dividend policy.
Example: The industrial units that are having stability of earnings may formulate (adopt) stable or a more consistent dividend policy than other that are having unstable earnings, because they can predict easily their earnings. Firms that are involved in necessities suffer less from stable incomes than the fi rms that are involved in luxury goods.
2. Age of Company: The age of company has more impact on distribution of profi ts as dividends. A newly started and growing company may require much of its earnings for fi nancing expansion programs or growth requirements and it may follow rigid dividend policy.
3. Liquidity Position of Company: Generally dividends are paid in the form of cash, hence, it entails, cash. Although, a fi rm may have suffi cient profi ts to declare dividends, but it may not have suffi cient cash to pay dividends. Thus, availability of cash and sound fi nancial position of the fi rm is an important factor in taking dividend decision.
4. Equity Shareholders Preference for Current Income: Legally, the Board of Directors has discretion to decide the distribution of the earnings of a fi rm. The shareholders who are legal owners of the fi rm appoint the (BOD’s). Hence, directors have to take into consideration owners’ preferences, while deciding dividend payment.
5. Legal Rules: Legal rules restrictions are signifi cant as they provide framework within which dividend policy is formulated. In other words, dividend policy of a fi rm has to be evolved within the legal framework and rules and regulations. The legal rules have to do with capital impairment rule, net profi ts and insolvency rule.
Example: The dividend can be paid from earnings either from current years earnings or from past years earnings and be refl ected in the earned surplus.
6. Financial Needs of the Company: This is one of the key factors, which infl uence the dividend policy of a fi rm. Financial needs means funds required for foreseeable future investment.
7. Access to the Capital Market (External Sources): Access to the capital market means the fi rms ability to raise funds from the capital market. A company, which has easy access to the capital market provides that fl exibility in deciding dividend policy. Easy access is possible only to the companies that are well established and hence here a profi t track record.
8. Control Objective: Control over the company is also an important factor, which infl uences dividend policy. When a fi rm distributes more earning as dividends in the form of cash it reduces its cash position. As a result, the fi rm will have to issue shares to the public to raise funds required to fi nance investment opportunities that leads to loss of control, since, the existing shareholders will have to share control with new owners. Financing investment projects by way of internal source avoids, loss of control.
9. Inflation: Infl ation is the state of economy in which the prices of products or goods have been increasing. Infl ation is a factor that infl uences dividend policy indirectly. Indian accounting system is based on historical costs. The funds accumulated from depreciation may not be suffi cient to replace the absolute asset or equipment, since depreciation is provided based on historical costs. Consequently, to replace assets and equipment, fi rm has to depend upon retained earnings, this leads to the payment of low dividend, during infl ation period.

Basic Financial Management
Notes
192 LOVELY PROFESSIONAL UNIVERSITY
10. Dividend Policy of Competitors: Keeping one eye on competitors’ dividend policy is very important. If the fi rm wants to retain the existing shareholders or it want to maintain share price in the market, and if it is planning to raise funds from public for expansion programs, it has to pay dividends at par with its competitors. Hence, it is one of the factors that infl uence dividend policy of a fi rm.
12.4 Summary
The term ‘dividend’ refers to that portion of company’s net earnings that is paid out to the equity shareholders (not for preference shareholders, since they are entitled to have a fi xed rate of dividend).
Dividend policy of a fi rm decides the portion of earnings to be paid as dividends to ordinary shareholders and what portion is ploughed back in the fi rm for investment purpose.
Payment of dividend through issue of bonus share is a fi nancial gimmick, since it will not affect the owners’ wealth.
Stock dividend is advantages for company and the owners.
Stock dividend is also benefi cial to owners by tax savings, indication of future benefi ts, psychological value.
12.5 Keywords
Dividends: It refers to that portion of company’s net earnings that is paid out to the equity shareholders.
Dividend Policy: It decides the portion of earnings to be paid as dividends to ordinary shareholders and what portion is ploughed back in the fi rm for investment purpose.
Payout Ratio: The ratio of dividend to earnings is known as payout ratio.
Stability: It refers to the consistency or lack of variability in the stream of dividend payments.
12.6 Self Assessment
Fill in the blanks:
1. Dividend refers to that portion of companies .................. that are paid out to the equity shareholders.
2. Distribution of profi ts between dividends and retained earnings affects the .................. of the fi rm.
3. Dividend policy of a fi rm affects both .................. and owners’ wealth.
4. Investors’ desire for current income is one of the advantages of .................. policy.
5. Making share trading attractive is one of the reasons of ..................
State whether the following statement are true or false:
6. Dividend decision involves legal as well as fi nancial considerations.
7. Capital impairment rule says that dividends can be paid from capital.
8. Sec 205 of the Companies Act says that dividends can be declared only from current years profi ts or from past reserves after providing depreciation.
Unit 12: Dividend Policy
Notes
LOVELY PROFESSIONAL UNIVERSITY 193
9. Payment of dividend is prohibited when the fi rm is insolvent.
10. There is no relation between fi nancing decisions and dividend decision.
12.7 Review Questions
1. ‘Payment of dividend involves legal considerations’ - Discuss.
2. Explain the factors that infl uence the dividend policy of a company.
3. Is there any relation between the dividend policy and value of a form? Give suggestions with some live market examples.
4. Briefl y discuss the legal and procedural aspects of dividends according to company’s law.
5. Discuss the dividend procedural aspects.
6. Infl ation is a factor that infl uences dividend policy indirectly. How?
7. Why companies go for no divided policy?
8. A stable dividend policy is advantageous for both the company and the shareholders. Discuss.
9. The age of company has more impact on distribution of profi ts as dividends. Give some suggestions in support of the above statement.
10. Illustrate constant payout ratio with suitable example.
Answers: Self Assessment
1. Net earnings 2. value
3. Long-term fi nance 4. Stable dividend
5. Stock split 6. True
7. False 8. True
9. True 10. False
12.8 Further Readings
Books Chandra, P. Financial Management - Theory and Practice, New Delhi, Tata McGraw-Hill Publishing Company Ltd., 2002, p. 3.
Sudhindra Bhat, Financial Management, New Delhi, Excel Books, 2008
Van Horne, J.C. and Wachowicz, Jr, J.M., Fundamentals of Financial Management, New Delhi, Prentice Hall of India Pvt. Ltd., 1996. p. 2.
Online links http://www.fei.org/
www.scribd.com
www.globusz.com

Basic Financial Management
Notes
194 LOVELY PROFESSIONAL UNIVERSITY
Unit 13: Theory and Forms of Dividend
CONTENTS
Objectives
Introduction
13.1 Theories of Dividend
13.1.1 Walter’s Model (Relevant)
13.1.2 Gordon’s Model
13.1.3 Modigliani-Miller Model (Irrelevance Theory)
13.2 Forms of Dividend
13.3 Summary
13.4 Keywords
13.5 Self Assessment
13.6 Review Questions
13.7 Further Readings
Objectives
After studying this unit, you will be able to:
Discuss theories of dividend
Explain forms of dividend
Introduction
If the choice of the dividend policy affects the value of a fi rm, it is considered as relevant. In that case a change in the dividend payout ratio will be followed by a change in the market value of the fi rm. If the dividend is relevant there must be an optimum payout ratio. If the dividend is irrelevant, there must be an optimum payout ratio.
?Did u know? What is optimum payout ratio?
Optimum payout ratio is that which gives highest market value per share.
13.1 Theories of Dividend
13.1.1 Walter’s Model (Relevant)
Prof. James E Walter argues that the choice of dividend payout ratio almost always affects the value of the fi rm Prof. Walter has very scholarly studied the signifi cance of the relationship between internal rate of return (R) and cost of capital (K) in determining optimum dividend policy which maximizes the wealth of shareholders.
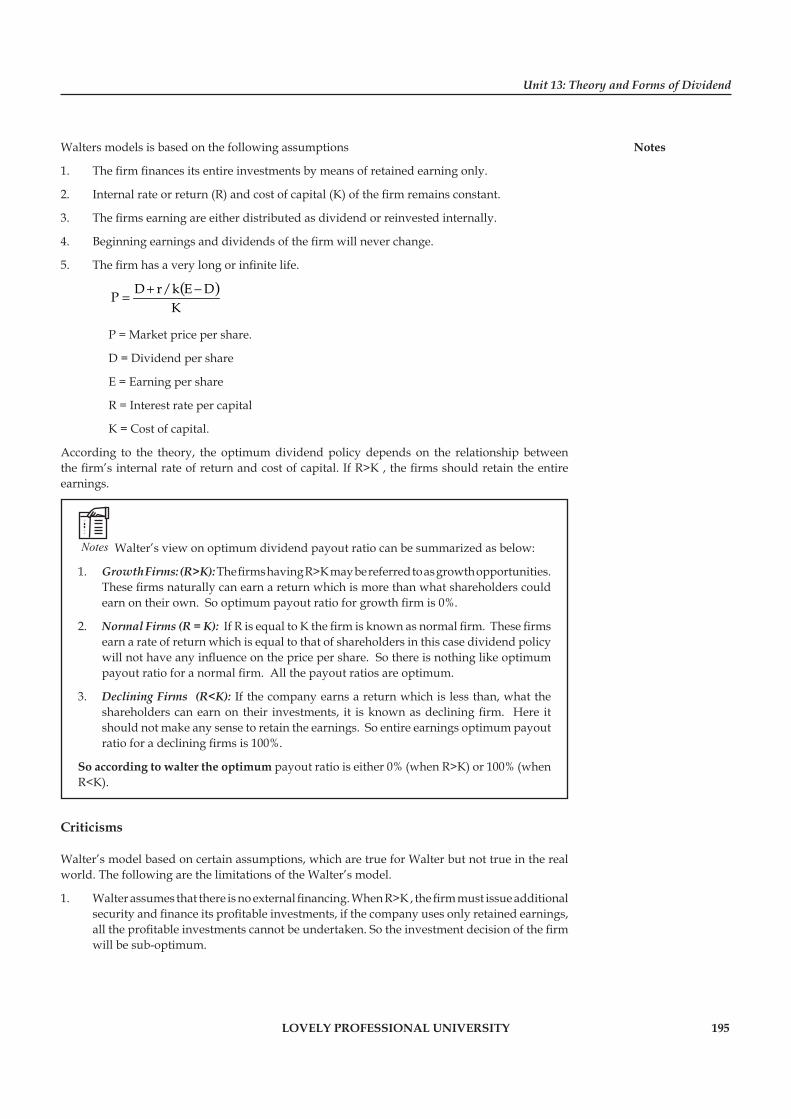
Unit 13: Theory and Forms of Dividend
Notes
LOVELY PROFESSIONAL UNIVERSITY 195
Walters models is based on the following assumptions
1. The fi rm fi nances its entire investments by means of retained earning only.
2. Internal rate or return (R) and cost of capital (K) of the fi rm remains constant.
3. The fi rms earning are either distributed as dividend or reinvested internally.
4. Beginning earnings and dividends of the fi rm will never change.
5. The fi rm has a very long or infi nite life.
( )K
DEk/rDP
−+=
P = Market price per share.
D = Dividend per share
E = Earning per share
R = Interest rate per capital
K = Cost of capital.
According to the theory, the optimum dividend policy depends on the relationship between the fi rm’s internal rate of return and cost of capital. If R>K , the fi rms should retain the entire earnings.
Notes Walter’s view on optimum dividend payout ratio can be summarized as below:
1. Growth Firms: (R>K): The fi rms having R>K may be referred to as growth opportunities. These fi rms naturally can earn a return which is more than what shareholders could earn on their own. So optimum payout ratio for growth fi rm is 0%.
2. Normal Firms (R = K): If R is equal to K the fi rm is known as normal fi rm. These fi rms earn a rate of return which is equal to that of shareholders in this case dividend policy will not have any infl uence on the price per share. So there is nothing like optimum payout ratio for a normal fi rm. All the payout ratios are optimum.
3. Declining Firms (R<K): If the company earns a return which is less than, what the shareholders can earn on their investments, it is known as declining fi rm. Here it should not make any sense to retain the earnings. So entire earnings optimum payout ratio for a declining fi rms is 100%.
So according to walter the optimum payout ratio is either 0% (when R>K) or 100% (when R<K).
Criticisms
Walter’s model based on certain assumptions, which are true for Walter but not true in the real world. The following are the limitations of the Walter’s model.
1. Walter assumes that there is no external fi nancing. When R>K , the fi rm must issue additional security and fi nance its profi table investments, if the company uses only retained earnings, all the profi table investments cannot be undertaken. So the investment decision of the fi rm will be sub-optimum.
Basic Financial Management
Notes
196 LOVELY PROFESSIONAL UNIVERSITY
2. Constant R, Internal rate of return cannot remain same. It actually diminishes as and when we make more and more investments.
3. Constant K, Cost of capital of a company cannot remain same. Risk of the company defi nitely changes with additional investments of retained earnings.
Illustration 1: Given the following information about Sunrise Industries Ltd. Show the effect of the dividend policy on the market price per share, using Walter’s model.
EPS = `8
Cost of capital (K) = 12%
Assumed rate of return
1. 15%
2. 10%
3. 12%
Solution:
To show the effect of different dividend policies on the shareholders of the fi rm for 15% and 12%, let us consider 0%, 25%, 50%, 75% and 100% payout ratios.
I when R>K (15>12)
At 0% payout ratio (dividend=0)
( )/D R K E DPK
+ −=
0 0.15/0.12(8 0)0.12
+ −=
= ` 83.33
At 25% payout ratio.
2 0.15/0.12(8-2)0.12
P +=
= ` 79.16
At 50% payout ratio
4 0.15/0.12(8-4)0.12
P +=
= ` 75.
At 75% payout ratio
6 0.15/0.12(8-6)0.12
P +=
= ` 70.83
At 100% payout ratio
8 0.15/0.12(8-8)0.12
P +=
= 66.67
Unit 13: Theory and Forms of Dividend
Notes
LOVELY PROFESSIONAL UNIVERSITY 197
Therefore, when R>K, price share will be maximum at 0% payout ratio. Price per share decreases as and when payout ratio is increased.
II when R<K (10%<12%)
At 0% payout ratio
12.00)-80.10/0.12(0
P+=
= ` 55.55
At 25% payout ratio
12.02)-80.10/0.12(2
P+=
= ` 58.33
At 50% payout ratio
4 0.10/0.12(8-4)0.12
P +=
= ` 61.11
At 75% payout ratio
6 0.10/0.12(8-6)0.12
P +=
= ` 63.88
At 100% payout ratio
8 0.10/0.12(8-8)0.12
P +=
= ` 66.66
Therefore, when R<K, price per will be maximum at 100% payout ratio. Price per share increases as and when the payout ratio is increased.
III when R=K (12%=12%)
At 0% payout ratio
0 0.12/0.12(8-0)0.12
P +=
= ` 66.66
At 25% payout ratio
2 0.12/0.12(8-2)0.12
P +=
= ` 66.66
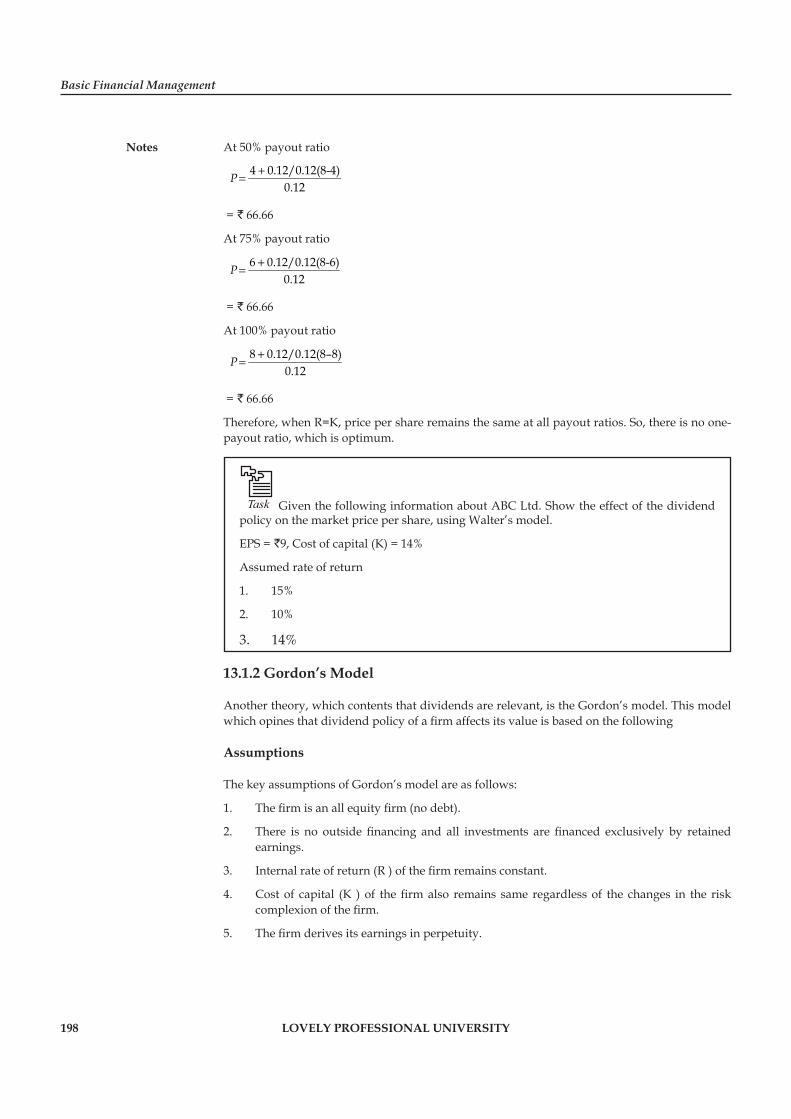
Basic Financial Management
Notes
198 LOVELY PROFESSIONAL UNIVERSITY
At 50% payout ratio
4 0.12/0.12(8-4)0.12
P +=
= ` 66.66
At 75% payout ratio
6 0.12/0.12(8-6)0.12
P +=
= ` 66.66
At 100% payout ratio
8 0.12/0.12(8–8)0.12
P +=
= ` 66.66
Therefore, when R=K, price per share remains the same at all payout ratios. So, there is no one-payout ratio, which is optimum.
Task Given the following information about ABC Ltd. Show the effect of the dividend policy on the market price per share, using Walter’s model.
EPS = `9, Cost of capital (K) = 14%
Assumed rate of return
1. 15%
2. 10%
3. 14%
13.1.2 Gordon’s Model
Another theory, which contents that dividends are relevant, is the Gordon’s model. This model which opines that dividend policy of a fi rm affects its value is based on the following
Assumptions
The key assumptions of Gordon’s model are as follows:
1. The fi rm is an all equity fi rm (no debt).
2. There is no outside fi nancing and all investments are fi nanced exclusively by retained earnings.
3. Internal rate of return (R ) of the fi rm remains constant.
4. Cost of capital (K ) of the fi rm also remains same regardless of the changes in the risk complexion of the fi rm.
5. The fi rm derives its earnings in perpetuity.
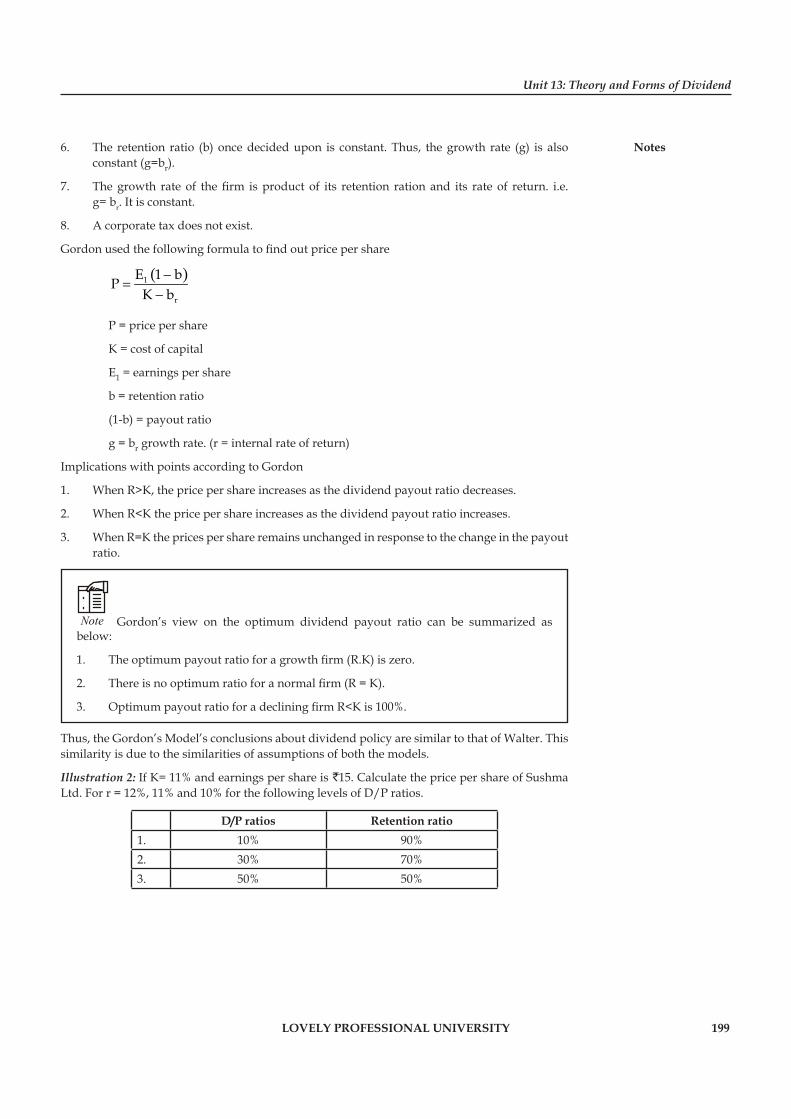
Unit 13: Theory and Forms of Dividend
Notes
LOVELY PROFESSIONAL UNIVERSITY 199
6. The retention ratio (b) once decided upon is constant. Thus, the growth rate (g) is also constant (g=br).
7. The growth rate of the fi rm is product of its retention ration and its rate of return. i.e. g= br. It is constant.
8. A corporate tax does not exist.
Gordon used the following formula to fi nd out price per share
( )-=
-1
r
E 1 bP
K b
P = price per share
K = cost of capital
E1 = earnings per share
b = retention ratio
(1-b) = payout ratio
g = br growth rate. (r = internal rate of return)
Implications with points according to Gordon
1. When R>K, the price per share increases as the dividend payout ratio decreases.
2. When R<K the price per share increases as the dividend payout ratio increases.
3. When R=K the prices per share remains unchanged in response to the change in the payout ratio.
Note Gordon’s view on the optimum dividend payout ratio can be summarized as below:
1. The optimum payout ratio for a growth fi rm (R.K) is zero.
2. There is no optimum ratio for a normal fi rm (R = K).
3. Optimum payout ratio for a declining fi rm R<K is 100%.
Thus, the Gordon’s Model’s conclusions about dividend policy are similar to that of Walter. This similarity is due to the similarities of assumptions of both the models.
Illustration 2: If K= 11% and earnings per share is `15. Calculate the price per share of Sushma Ltd. For r = 12%, 11% and 10% for the following levels of D/P ratios.
D/P ratios Retention ratio1. 10% 90%2. 30% 70%3. 50% 50%
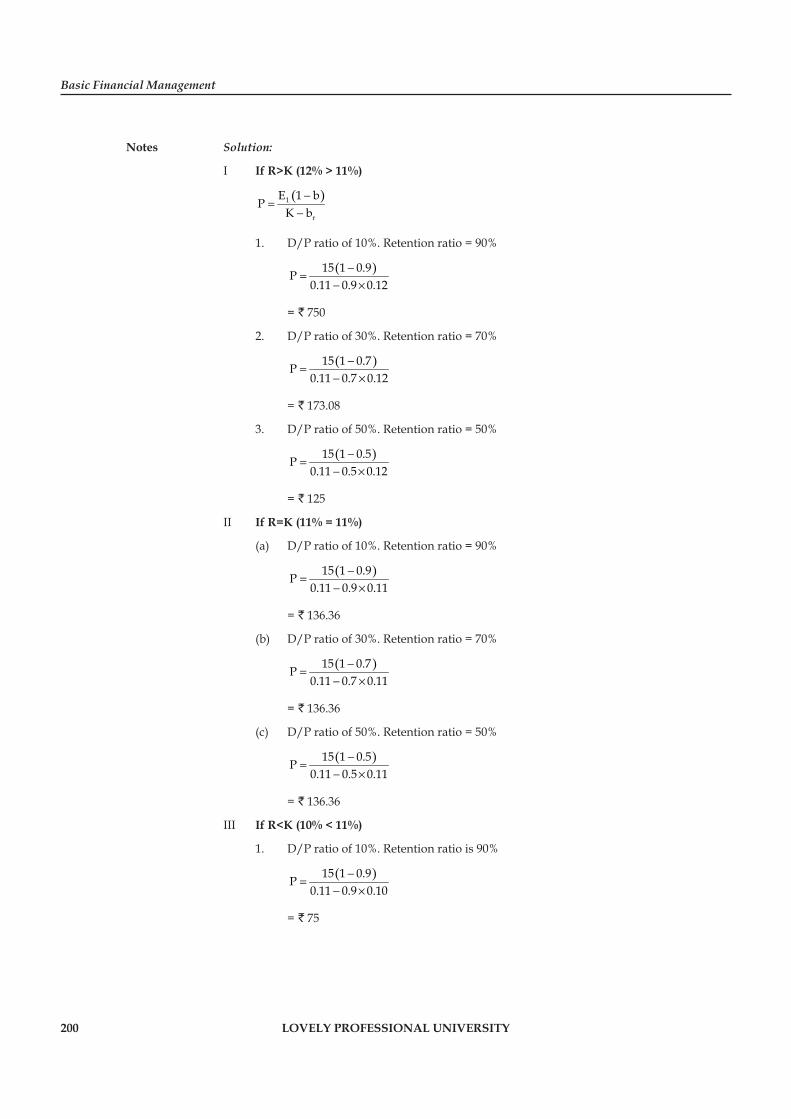
Basic Financial Management
Notes
200 LOVELY PROFESSIONAL UNIVERSITY
Solution:
I If R>K (12% > 11%)
( )1
r
E 1 bP
K b−
=−
1. D/P ratio of 10%. Retention ratio = 90%
( )15 1 0.9P0.11 0.9 0.12
−=
− ×
= ` 750
2. D/P ratio of 30%. Retention ratio = 70%
( )15 1 0.7P0.11 0.7 0.12
−=
− ×
= ` 173.08
3. D/P ratio of 50%. Retention ratio = 50%
( )15 1 0.5P0.11 0.5 0.12
−=
− ×
= ` 125
II If R=K (11% = 11%)
(a) D/P ratio of 10%. Retention ratio = 90%
( )15 1 0.9P0.11 0.9 0.11
−=
− ×
= ` 136.36
(b) D/P ratio of 30%. Retention ratio = 70%
( )15 1 0.7P0.11 0.7 0.11
−=
− ×
= ` 136.36
(c) D/P ratio of 50%. Retention ratio = 50%
( )15 1 0.5P0.11 0.5 0.11
−=
− ×
= ` 136.36
III If R<K (10% < 11%)
1. D/P ratio of 10%. Retention ratio is 90%
( )15 1 0.9P0.11 0.9 0.10
−=
− ×
= ` 75
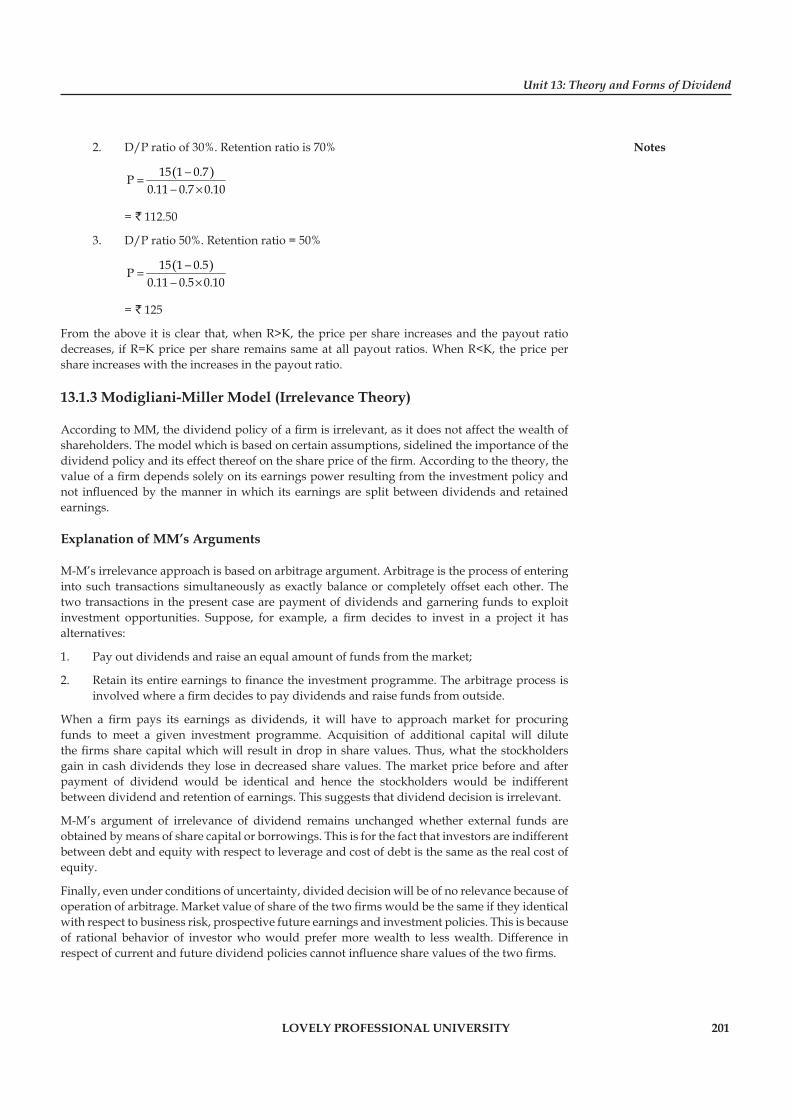
Unit 13: Theory and Forms of Dividend
Notes
LOVELY PROFESSIONAL UNIVERSITY 201
2. D/P ratio of 30%. Retention ratio is 70%
( )15 1 0.7P0.11 0.7 0.10
−=
− ×
= ` 112.50
3. D/P ratio 50%. Retention ratio = 50%
( )15 1 0.5P0.11 0.5 0.10
−=
− ×
= ` 125
From the above it is clear that, when R>K, the price per share increases and the payout ratio decreases, if R=K price per share remains same at all payout ratios. When R<K, the price per share increases with the increases in the payout ratio.
13.1.3 Modigliani-Miller Model (Irrelevance Theory)
According to MM, the dividend policy of a fi rm is irrelevant, as it does not affect the wealth of shareholders. The model which is based on certain assumptions, sidelined the importance of the dividend policy and its effect thereof on the share price of the fi rm. According to the theory, the value of a fi rm depends solely on its earnings power resulting from the investment policy and not infl uenced by the manner in which its earnings are split between dividends and retained earnings.
Explanation of MM’s Arguments
M-M’s irrelevance approach is based on arbitrage argument. Arbitrage is the process of entering into such transactions simultaneously as exactly balance or completely offset each other. The two transactions in the present case are payment of dividends and garnering funds to exploit investment opportunities. Suppose, for example, a fi rm decides to invest in a project it has alternatives:
1. Pay out dividends and raise an equal amount of funds from the market;
2. Retain its entire earnings to fi nance the investment programme. The arbitrage process is involved where a fi rm decides to pay dividends and raise funds from outside.
When a fi rm pays its earnings as dividends, it will have to approach market for procuring funds to meet a given investment programme. Acquisition of additional capital will dilute the fi rms share capital which will result in drop in share values. Thus, what the stockholders gain in cash dividends they lose in decreased share values. The market price before and after payment of dividend would be identical and hence the stockholders would be indifferent between dividend and retention of earnings. This suggests that dividend decision is irrelevant.
M-M’s argument of irrelevance of dividend remains unchanged whether external funds are obtained by means of share capital or borrowings. This is for the fact that investors are indifferent between debt and equity with respect to leverage and cost of debt is the same as the real cost of equity.
Finally, even under conditions of uncertainty, divided decision will be of no relevance because of operation of arbitrage. Market value of share of the two fi rms would be the same if they identical with respect to business risk, prospective future earnings and investment policies. This is because of rational behavior of investor who would prefer more wealth to less wealth. Difference in respect of current and future dividend policies cannot infl uence share values of the two fi rms.
Basic Financial Management
Notes
202 LOVELY PROFESSIONAL UNIVERSITY
Assumption
1. Capital markets are perfect: Investors are rational as information is freely available, transaction cost are nil, securities are divisible and no investor can infl uence the market price of the share.
2. There are no taxes: No difference between tax rates on divisible and capital gains.
3. The fi rm has a fi xed investment policy: Which will not change. So if the retained earnings are reinvested, there will not be any change in the risk of the fi rm. So K remains same.
4. Floatation costs does not exist:
The substance of MM arguments may be stated as below:
(a) If the company retains the earnings instead of giving it out as dividends, the share holders enjoy capital appreciation, which is equal to the earnings, retained.
(b) If the company distributes the earnings by the way of dividends instead of retention, the shareholders enjoy the dividend, which is equal to the amount by which his capital would have been appreciated had the company chosen to retain the earnings.
Hence, the division of earnings between dividends and retained earnings is irrelevant from the point of view of shareholders.
Criticisms
MM theory of division irrelevance is based on some assumptions. When these assumptions hold good, the conclusions derived by them are logically consistent and intuitively appealing. But the assumption will not hold water in the real world. So MM theory lacks practical relevance. The following are some of the limitations.
1. Tax differentials: MM’s assumption that taxes does not exist is far from reality. Dividends are not taxed where as tax is levied on capital gains. So the shareholders may prefer dividend to capital gains.
2. Floatation cost: MM argue that payment of dividend and raising external funds are equivalent. This is not true in practice due to the presence of fl otation costs. So a rupee of dividend cannot be replaced by a rupee by external funds. So it is advantageous to retain the earnings.
3. Transaction costs: In the absence of transition cost a rupee of capital value can be converted into a rupee of current income and vice versa. This implies that if the dividends are not paid, the shareholders desiring current income can sell a part of their holdings without incurring transaction cost. Because of the presence of the transaction cost, investors may prefer current dividend than retained earnings.
4. Diversifi cation: If the company retains the earnings, investors cannot diversify their portfolios. As the investors are willing to pay a higher value to the company which pays more current dividend.
5. Uncertainty: MM argues that the prices of the 2 fi rms which are exactly identical in all the respect except with the dividend policy cannot be different. But this is not true due to “bird in hand argument”.
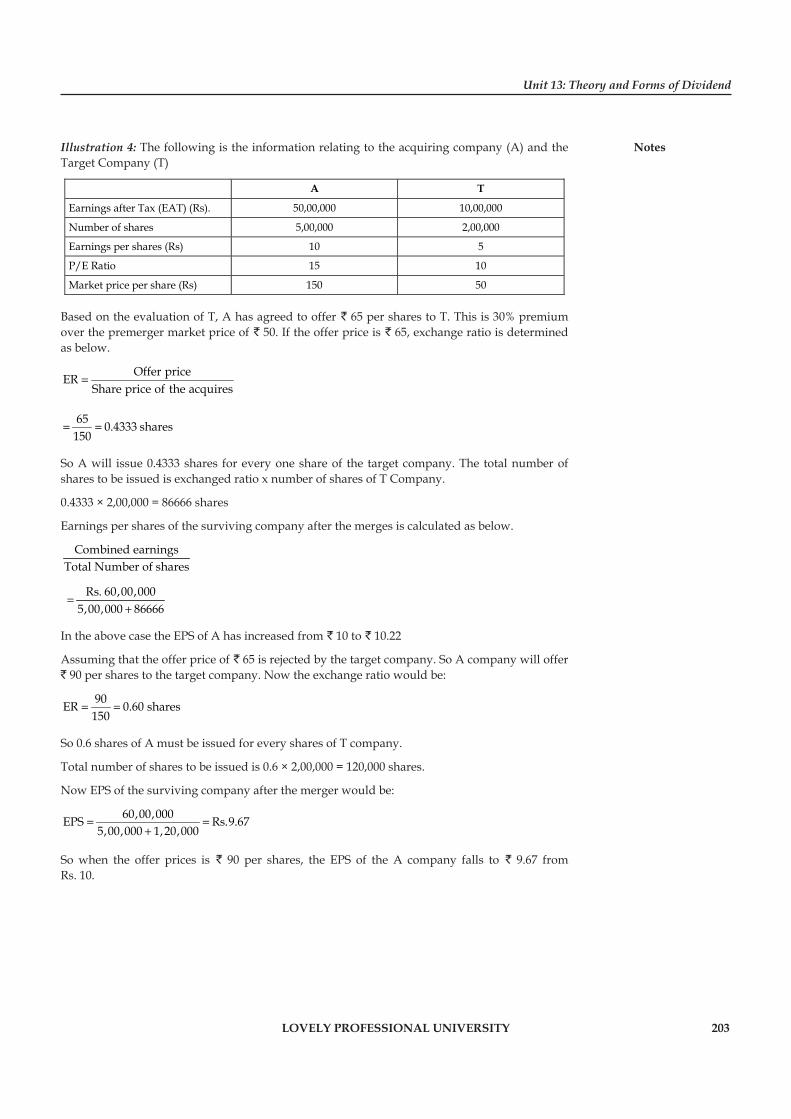
Unit 13: Theory and Forms of Dividend
Notes
LOVELY PROFESSIONAL UNIVERSITY 203
Illustration 4: The following is the information relating to the acquiring company (A) and the Target Company (T)
A T
Earnings after Tax (EAT) (Rs). 50,00,000 10,00,000
Number of shares 5,00,000 2,00,000
Earnings per shares (Rs) 10 5
P/E Ratio 15 10
Market price per share (Rs) 150 50
Based on the evaluation of T, A has agreed to offer ` 65 per shares to T. This is 30% premium over the premerger market price of ` 50. If the offer price is ` 65, exchange ratio is determined as below.
Offer priceERShare price of the acquires
=
65 0.4333 shares150
= =
So A will issue 0.4333 shares for every one share of the target company. The total number of shares to be issued is exchanged ratio x number of shares of T Company.
0.4333 × 2,00,000 = 86666 shares
Earnings per shares of the surviving company after the merges is calculated as below.
Combined earningsTotal Number of shares
Rs. 60,00,0005,00,000 86666
=+
In the above case the EPS of A has increased from ` 10 to ` 10.22
Assuming that the offer price of ` 65 is rejected by the target company. So A company will offer ` 90 per shares to the target company. Now the exchange ratio would be:
90ER 0.60 shares150
= =
So 0.6 shares of A must be issued for every shares of T company.
Total number of shares to be issued is 0.6 × 2,00,000 = 120,000 shares.
Now EPS of the surviving company after the merger would be:
60,00,000EPS Rs.9.675,00,000 1,20,000
= =+
So when the offer prices is ` 90 per shares, the EPS of the A company falls to ` 9.67 fromRs. 10.
Basic Financial Management
Notes
204 LOVELY PROFESSIONAL UNIVERSITY
Task A textile company belongs to a risk-class for which the appropriate PE ratio is 10. It currently has 50,000 outstanding shares selling at `100 each. The fi rm is contemplating the declaration of `8 dividend at the end of the current fi scal year which has just started.
Given the assumption of MM, answer the following questions:
1. What will be the price of the share at the end of the year: (a) if a dividend is not declared, (b) if its is declared?
2. Assuming that the fi rm pays the dividend and has a net income of `5,00,000 and makes new investments of ̀ 10,00,000 during the period, how many new shares must be issued?
3. What would be the current value of the fi rm: (a) if a dividend is declared, (b) if a dividend is not declared?
13.2 Forms of Dividend
Dividend is the portion of earnings available to equity shareholders that equally (per share bias) is distributed among the shareholders. The following discussion deals with the different forms of dividends.
1. Cash Dividend: Generally many companies pay dividends in the form of cash. But payment of dividend in the form of cash requires enough cash in the bank or in hands. In other words, there should not be any shortage of cash for payment of dividends. Suffi cient cash is available only when a company prepares cash budget to estimate the required amount for the period for which the budget is prepared. If the company fi nds any shortage of cash, it should make arrangements to borrow funds. But it may be diffi cult to prepare a cash budget with the expected amount needed for payment of dividends.
2. Scrip Dividend: In this form of dividends, the equity shareholders are issued transferable promissory notes for a shorter maturity period that may or may not be interest bearing. It is a simple payment of dividends in the form of promissory notes. Payment of dividend in this form takes place only when the fi rm is suffering from shortage of cash or weak liquidity position. Payment of dividends in the form of cash is justifi able only when the company has earned profi ts and it will take some time to convert current assets into cash.
3. Bond Dividend: Both scrip dividend and bond dividend are same, but they differ in terms of maturity. Bond dividends caries longer maturity whereas, scrip dividend carries shorter maturity. The effect of both forms of dividends on the company is the same. Bond dividend bears interest.
4. Property Dividend: The name itself suggests that payment of dividend takes place in the form of property. In other words, payment of dividends in the form of assets. This form of dividends takes place only when a fi rm has assets that are no longer necessary in the operation of business and shareholders are ready to accept dividend in the form of assets. This form of dividend payment is not popular in India.
5. Stock Dividend (Bonus Shares): Stock dividend is the payment of additional shares of common stocks to the ordinary shareholders. In other words, distribution of bonus shares to the stockholders instead of cash dividend.
Unit 13: Theory and Forms of Dividend
Notes
LOVELY PROFESSIONAL UNIVERSITY 205
Case Study Future Earnings Per ShareRamesh Products Case
This case allows the reader to apply the concept of future EPS in evaluating a course of action in terms of its effect on the market value of the fi rm’s common stock.
Ramesh Products (RKP) is a medium-sized producer of chemicals and vinyl coating used in a variety of industrial processes. The company’s main facilities are located in an industrial park in East Baltimost, a central site by a rail line that is linking the fi rm with its major customers on the east coast.
Last year the fi rm recorded over $200 million in sales, showed a net income of $53 million and concluded a very successful year. For the coming year, the fi rm expects a 15 per cent improvement in sales and operating income fi gures.
The fi rm’s management committee, consisting of the president and the vice-presidents of production, marketing, and fi nance, will be meeting with in a week to discuss a major new activity for the next year. Products has been invited to bid on a long-term contract to produce a line of plastics for a large chemical company in Wilmington, Delaware. It appears that the fi rm can easily get the $50 million contract which should yield an additional $14 million in operating income. These fi gures are for next year only, and the fi rm estimates even higher sales and profi ts in the future.
Chowdhary vice -president of fi nance, has been studying the fi nancial data related to the new line of plastics. The production manager knows of a small plastic company located about three miles from RKP’s facilities. The plastics company has all the equipment needed to produce the new line of plastics; the company is for sale for $104 million. This price represents largely the value of the assets, since the company has lost its only large contracts. Chowdhary Prasad has discussed the purchase of this plastics company with a local real estate agent and has confi rmed that it is available for $100 million.
Chowdhary Prasad fi gures that RKP has suffi cient working capital to add the new plastics line but does not have the cash to buy the 100 million of machinery and equipment needed to begin the production. Discussion with a representative of a large Baltimore bank reveals that RKP can borrow $39 million through a 12 per cent mortgage on its main facilities. A mortgage company has indicated that it would help fi nance the plastic machinery with a $51 million, 13.6 per cent mortgage. Chowdhary Prasad is considering these choices but knows that RKP has traditionally kept its debt-asset ratio below 41 per cent He does not want to borrow if the additional debt causes the ratio to exceed 41 per cent.
Chowdhary Prasad discussed equity fi nancing with RKP’s investment banker on a recent trip to New Jersy City. He learned that the fi rm could probably issue upto $150 million in 15 per cent preferred stock or class A common stock. If the common stock were offered, it could net $20 per share to RKP. Chowdhary Prasad called new Jersy and confi rmed that these options were still open to the fi rm.
In making decision on new investments, Chowdhary Prasad believes in the validity of the future-earnings per share technique. He knows that RKP has traditionally traded at a 6/1 price-earning multiple and he expects that this will hold. Thus, if a new project increases future earnings per share, it will increase the value of the fi rm for its shareholders.
Question
According to the future earning share approach and after detailed analysis what do you feel about the plastic project. Is it worth while to accept.
Basic Financial Management
Notes
206 LOVELY PROFESSIONAL UNIVERSITY
13.3 Summary
Payment of dividend through issue of bonus share is a fi nancial gimmick, since it will not affect the owners’ wealth. The reasons for payment of dividend in the form of stock are to: bring the market price per share within a more popular range, promotes more active trading, reduce the nominal rate of dividend, increase paid up share capital, indicate the prospects of the fi rm, improve prospects of raising additional funds.
Stock dividend is advantages for company and the owners. Advantages enjoyed by the issuing company are: Maintenance of liquidity portion, manage fi nancial diffi culties, attractive share price, enhances prestige, widening the share for market, availability of funds for expansion programme. Stock dividend is also benefi cial to owners by tax savings, indication of future benefi ts, psychological value.
Apart from the advantages stock dividend has the following disadvantages. Costly, reduces EPS and price earnings ratio, prevents new investor from becoming the shareholders of the fi rm, misuse of management power, since there is no dilution of control it is disadvantageous to the company. Disappointment of shareholders, shareholders wealth remains unaffected, lowers the market value of existing shares, less security to investors, done to reduction in reserves are the few disadvantages to owners.
13.4 Keywords
Infl ation: It is the state of the economy in which the prices of the products have been increasing.
Scrip Dividend: It is the dividend payment method in the form of promissory note.
Stock Dividend: It is the payment of the additional shares of common stocks to the ordinary shareholders.
13.5 Self Assessment
Fill in the blanks:
1. Prof. James E Walter argues that the choice of ................................. almost always affects the value of the fi rm.
2. The fi rms having R>K may be referred to as ..................................
3. According to MM, the dividend policy of a fi rm is ............................
4. ............................. carries longer maturity whereas, scrip dividend carries shorter maturity.
5. ............................. is the payment of additional shares of common stocks to the ordinary shareholders.
6. Usual forms of paying dividend is ..........................
7. The issue of bonus shares amounts to a corresponding increase in the ................................. of a fi rm.
State whether the following statement are true or false:
8. Stock dividend affects the liquidity position of the fi rm.
9. Management of earnings has nothing to do with retention of profi ts.
10. Ploughing back of profi ts is the same as self-fi nancing.
Unit 13: Theory and Forms of Dividend
Notes
LOVELY PROFESSIONAL UNIVERSITY 207
13.6 Review Questions
1. ‘Stock dividends are unfair to those stockholders who desire cash income’, comment.
2. What is stock dividend? Discuss the advantages of stock dividend to the company.
3. The earnings per share of a company is ` 8 and the rate of capitalisation applicable is 10%. The company has before it an option of adopting (i) 5 0 % , (ii) 75%and (iii) 100% dividend payout ratio. Compute the market price of the company’s quoted shares as per Walter’s model if it can earn a return of (i) 15%, (ii) 10% and (iii) 5% on its retained earnings
4. Illustrate the Walter Model with a suitable example.
5. State the irrelevant theories of dividend.
6. ABC Ltd. has a capital of `10 lakhs in equity shares of `100 each. The shares currently quoted at par. The company proposes declaration of a dividend of `10 per share at the end of the current fi nancial year. The capitalisation rate for the risk class to which the company belongs is 12%.
What will be the market price of the share at the end of the year, if
(a) A dividend is not declared?
(b) A dividend is declared?
(c) Assuming that the company pays the dividend and has net profi ts of `5,00,000 and makes new investments of `10 lakhs during the period, how many new shares must be issued?
Use the M.M. model.
7. Illustrate that dividend policy is irrelevant.
8. Agile Ltd. belongs to a risk class of which the appropriate capitalisation rate is 10%. It currently has 1,00,000 shares selling at ` 100 each. The fi rm is contemplating declaration of a dividend of `6 per share at the end of the current fi scal year which has just begun. Answer the following questions based on Modigliani and Miller Model and assumption of no taxes:
(a) What will be the price of the shares at the end of the year if a diviend is not declared?
(b) What will be the price if dividend is declared?
(c) Assuming that the fi rm pays dividend, has net income of ` 10 lakh and new investments of ` 20 lakhs during the period, how many new shares must be issued?
Answers: Self Assessment
1. dividend payout ratio 2. growth opportunities
3. irrelevant 4. Bond dividends
5. Stock dividend 6. Cash
7. Paid up capital 8. False
9. False 10. True
Basic Financial Management
Notes
208 LOVELY PROFESSIONAL UNIVERSITY
13.7 Further Readings
Books Chandra, P. Financial Management - Theory and Practice, New Delhi, Tata McGraw-Hill Publishing Company Ltd., 2002, p. 3.
Sudhindra Bhat, Financial Management, New Delhi, Excel Books, 2008
Van Horne, J.C. and Wachowicz, Jr, J.M., Fundamentals of Financial Management, New Delhi, Prentice Hall of India Pvt. Ltd., 1996. p. 2.
Online links http://www.fei.org/
www.globusz.com
www.scribd.com
Unit 14: Break Even Analysis
Notes
LOVELY PROFESSIONAL UNIVERSITY 209
Unit 14: Break Even Analysis
CONTENTS
Objectives
Introduction
14.1 Meaning and Concept of Break Even Analysis
14.2 Uses of Break Even Analysis
14.3 Advantages of Break Even Point
14.4 Limitations of Break Even Analysis
14.5 Methods of Break Even Analysis
14.5.1 Algebraic Method
14.5.2 Break even Chart
14.6 Summary
14.7 Keywords
14.8 Self Assessment
14.9 Review Questions
14.10 Further Readings
Objectives
After studying this unit, you will be able to:
Defi ne meaning and concept of break even analysis
Discuss uses of break even analysis
Explain advantages and limitations of break even analysis
Describe methods of break even analysis
Introduction
Break even is the point where total revenue equals the total costs (variable and fi xed). It is that level of activity at which an enterprise makes neither a loss nor any profi t. At this point or level, the sales revenues are just equal to the costs incurred. Below this level the fi rm will make losses, while above this level it will be making profi ts.
14.1 Meaning and Concept of Break Even Analysis
Break even analysis examines the relationship between the total revenue, total costs and total profi ts of the fi rm at various levels of output. It is used to determine the sales volume required for the fi rm to break even and the total profi ts and losses at other sales level. Break even analysis is a method, as said by Dominick Salnatore, of revenue and total cost functions of the fi rm. According to Martz, Curry and Frank, a break even analysis indicates at what level cost and revenue are in equilibrium.
In case of break even analysis, the break even point is of particular importance.
Basic Financial Management
Notes
210 LOVELY PROFESSIONAL UNIVERSITY
Did u know? What is Break Even Point?
Break even point is that volume of sales where the fi rm breaks even i.e., the total costs equal total revenue.
It is, therefore, a point where losses cease to occur while profi ts have not yet begun. That is, it is the point of zero profi t.
BEP = Fixed CostsSelling price – Variable costs per unit
Example:
= Fixed Costs Rs 10,000
Selling price Rs 5 per unit – Variable costs Rs 3 per unit
Therefore, BEP = Rs 10,000 =5,000 units.5 – 3
The conclusion that can be drawn from the above example is that sales volume of 5000 units will be the accurate point at which the manufacturing unit would not make any loss or profi t.
Note Assumptions of Break Even Analysis
The break even analysis is based on certain assumptions, namely:
1. All costs are either perfectly variable or absolutely fi xed over the entire period of production but this assumption does not hold good in practice.
2. The volume of production and the volume of sales are equal; but in reality they differ.
3. All revenue is perfectly variable with the physical volume of production and this assumption is not valid.
4. The assumption of stable product mix is unrealistic.
14.2 Uses of Break Even Analysis
Break even analysis is a very generalised approach for dealing with a wide variety of questions associated with profi t planning and forecasting. Some of the important practical applications of break even analysis are:
1. What happens to overall profi tability when a new product is introduced?
2. What level of sales is needed to cover all costs and earn, say, ` 1,00,000 profi t or a 14% rate of return?
3. What happens to revenues and costs if the price of one of a company’s product is hanged?
4. What happens to overall profi tability if a company purchases new capital equipment or incurs higher or lower fi xed or variable costs?
5. Between two alternative investments, which one offers the greater margin of profi t (safety)?
Unit 14: Break Even Analysis
Notes
LOVELY PROFESSIONAL UNIVERSITY 211
6. What are the revenue and cost implications of changing the process of production?
7. Should one make, buy or lease capital equipment?
!Caution Margin of safety is the difference between the actual sales and sales at break even point. Sales beyond break even volume bring in profi ts. Such sales represent a margin of safety.
Margin of safety = Actual sales – Break even Sales
or = Profi t/PV Ratio
or Profit × Selling Price per Unit
Selling Price per Unit – Variable Cost Per Unit
Margin of safety as % of total sales
= Margin of Safety/Total cost × 100
14.3 Advantages of Break Even Point
A break even point does not help a person to run his business; its usefulness lies in the fact that it enables him to discern variations a little more clearly.
1. The usefulness of the break even point is evident in budgeting, forecasting and controlling costs. In itself, a break even point moves only with changing conditions and, in so moving, it fl ashes a warning.
2. The cost-volume-profi t analysis deals with the net effect of changes in cost, price and volume in profi ts. It not only helps a management in profi t prediction, but is also very useful to it in virtually all decision-making areas.
3. It is useful in product decisions, the pricing of products, the selection of channels of distribution, in making or buying decisions and if changing to the best methods of production.
4. The price-volume study method has proved to be of the greatest possible assistance to the management, for it enables to fi x prices on a scientifi c basis.
5. A cost-volume-profi t analysis is useful when, it determines the sales volume required to attain a given level of profi ts, and; it yields the most profi table combination of products to produce and sell.
14.4 Limitations of Break Even Analysis
Key limitations of break even analysis are:
1. It does not include adjustments for risk and uncertainty.
2. The break even chart shows the short-run relationship of total costs to total revenue. It is a static picture in which assumption of profi t is infl uenced solely by the level of output.
3. A break even point is virtually useless, if the materials used fl uctuate widely in price, particularly when these materials represent large proportions of the total cost.
4. If the product mix consists of product with varying profi t margins, the picture presented by a simple break even point may be meaningless.
Basic Financial Management
Notes
212 LOVELY PROFESSIONAL UNIVERSITY
5. It is diffi cult in practice to distinguish between variable and fi xed decision costs, particularly, when the distinction is drawn in the light of a specifi c problem situation and not in general terms.
6. A single fi xed cost level clearly implies that the analysis is concerned with a situation within a single given plant capacity. If volume in excess of that limit is to be considered, then the same level of fi xed costs would not be appropriate.
14.5 Methods of Break Even Analysis
The sales volume which equates total revenue with related costs and results in neither profi t nor loss is called Break even Point (BEP). Break even point can be determined by the following methods:
14.5.1 Algebraic Method
Algebraic Methods
(i) Contribution Margin Approach
Break even Point (units) = Fixed cost
Contribution per Unit
Break even point (`) = Fixed costP/V ratio
OR = Break even units × Selling price p.u.
P/V ratio = Contribution
Sales × 100
Desired sales = Fixed cost + Desired profit
P/V ratio Desired sales or profi t or fi xed cost or to know variable cost we can use following equation
i.e.,
Sales X P/V Ratio – Total Fixed Cost – Profi t
At Break even point
Contribution = Fixed cost
Contribution – Fixed cost = 0
(ii) Equation Technique
It is based on an income equation i.e.
Sales – Total costs = Net profi t.
Breaking up total costs into fi xed and variable,
Sales – Fixed costs – Variable cost = Net profi t
Sales = Fixed costs + Variable cost + Net profi t
i.e. SP(S) = FC + VC(S) + P.
where
SP = Selling price per unit
Unit 14: Break Even Analysis
Notes
LOVELY PROFESSIONAL UNIVERSITY 213
S = Number of units required to be sold to break even
FC = Total fi xed costs
VC = Variable cost per unit
P = Net profi t (Zero)
SP(S) = FC + VC(S) + Zero
SP(S) = FC + VC(S) + 0
SP(S) – VC(S) = FC
Or S(SP – VC) = FC FC
S = FC (SP – VC)
To calculate the level of sales required to earn a particular level of profi t, the formula is:
Required Sales = (Fixed cost + Desired profi t)/P/V ratio.
Did u know? What is PV ratio?
The ratio or percentage of contribution margin to sales is known as P/V ratio. This ratio is also known as marginal income ratio, contribution to sales ratio, or variable profi t ratio.
Example: KSBS Co. produces a simple article and sells it at `100 each at the mat. Cost of production is ` 60 p/unit and fi xed cost `40,000 P/annum. Calculate:
1. P.V(ratio)
2. BEP (sales)
Solution
1. PV (r) = 100 – 60/100 × 100
= 40/100 × 60 = 40%
2. BEP (sales) = 40,000/40 × 100
= 4,00,000/4 = ` 1,00,000
Task Calculate BEP from the following informations: Sales ` 500000, FC ` 150000, Profi t ` 100000
14.5.2 Break Even Chart
According to the Chartered Institute of Management Accountants, London, the break even chart means, “A chart which shows profi t or loss at various levels of activity, the level at which neither profi t nor loss is shown being termed as the break even point”. It is a graphic relationship between costs, volume and profi ts. It shows not only the BEP but also the effects of costs and revenue at varying levels of sales. The break even chart can, therefore, be more appropriately called the cost-volume-profi t graph.
Basic Financial Management
Notes
214 LOVELY PROFESSIONAL UNIVERSITY
Assumptions regarding Break even Charts
1. Costs are bifurcated into variable and fi xed components.
2. Fixed costs will remain constant and will not change with change in level of output.
3. Selling price will remain constant even though there may be competition or change in volume of production.
4. The number of units produced and sold will be the same so that there is no operating or closing stock.
5. There will be no change in operating effi ciency.
6. In case of multi-product companies, it is assumed that the sales mix remains constant.
7. Variable cost per unit will remain constant during the relevant volume range of graph.
Note Steps Involved in Construction of Break Even Chart
1. Select a scale for sales (units) on horizontal axis.
2. Select scale for costs and revenues on vertical axis.
3. Draw the fi xed cost line parallel to the horizontal axis.
4. Draw the total cost line, starting from the point on the vertical axis which represents fi xed costs.
5. Draw the sales line, starting from the point of origin (zero) and fi nishing at point of maximum sales.
6. The sales line will cut the total cost line at the point where the total cost equal to total revenues.
7. The point of intersection of two lines is called ‘break even point’ i.e., the point of no profi t no loss.
8. The lines drawn from intersection to horizontal axis and vertical axis give the sales value and number of units produced at break even point.
9. The loss is shown if the production is less than the break even point and profi t is shown if the production is more than the break even point.
10. The total sales minus break even sales represent the margin of safety.
11. The angle that the sales line makes with total cost line, while intersecting it at break even point is called ‘angle of incidence’.
Illustration 1: From the following data, calculate the break even point by means of a break even chart:
Selling price per unit = ` 15
Variable cost per unit = ` 10
Total fi xed cost = ` 1,50,000

Unit 14: Break Even Analysis
Notes
LOVELY PROFESSIONAL UNIVERSITY 215
Solution:
For plotting the data, we need at least two points – one for plotting the total cost line and the other for plotting the total sales line. Therefore, it will be necessary to presume different levels of output and sales as below:
Output Units Fixed costs Variable costs Total costs Sales
(Rs.) (Rs.) (Rs.) (Rs.)
0 1,50,000 — 1,50,000 —
10,000 1,50,000 1,00,000 2,50,000 1,50,000
20,000 1,50,000 2,00,000 3,50,000 3,00,000
30,000 1,50,000 3,00,000 4,50,000 4,50,000
40,000 1,50,000 4,00,000 5,50,000 6,00,000
50,000 1,50,000 5,00,000 6,50,000 7,50,000
60,000 1,50,000 6,00,000 7,50,000 9,00,000
Caselet To Break Even, Tata hopes to sell 12,500 Nanos a month
Despite the slow start and low sales, Tata Motors hopes to sell more than 20,000 Nanos a month. And, if sales pick up, the company may increase the Sanand plant’s capacity to 3.5 lakh units.
Tata Motors produces the Nano at Sanand in Gujarat.
The company should sell at least 12,500 units to make Nano a profi table venture.
Mr C. Ramakrishnan, Chief Financial Offi cer, Tata Motors, has indicated that it requires more than 60 per cent of plant capacity realisation for Nano to start making profi t. The Sanand plant’s installed capacity is 2.5 lakh units a year.
From July 2009 to October 2010, Tata Motors despatched 70,000 Nanos. The despatch to select customers is coming to an end and the company has started retail sales in 11 States.
“Typically in a small segment car, the margins are low, it’s a volume and scale issue. Typically one would operate at around 60 per cent to 65 per cent break even. I do not want to comment specifi cally on Nano but that is typically the broad picture in passenger car industry, particularly in these segments,” Mr Ramakrishnan said in a recent interaction with analysts.
“The plant has a capacity of 250,000 which can be increased to about 300,000 or even 350,000. So, on an average our hope and expectation would be we should be able to do about 20,000 to 25,000 cars a month,” he said.
However, analysts do not share this optimism. Four auto analysts with stock broking fi rms whom Business Line spoke to expressed doubts over Nano clocking 20,000-plus numbers. Three of them did not want to be identifi ed or their fi rms mentioned. Analysts said that issues related to availability and safety had impacted the sales prospect of Nano.
Immediate target
“I don’t think they will make 20,000 anytime soon. Their immediate target would be around 10,000 units a month,” said Mr Amol Bhutada, auto analyst with Elara Capital. “The sales might not exceed 8,000-10,000 levels in the near future,” said another analyst.
Contd...
Basic Financial Management
Notes
216 LOVELY PROFESSIONAL UNIVERSITY
Tata Motors despatched 3,000 units of Nano in October. However, sales are expected to improve with the open sales in many states. Mr Bhutada said that the operating profi t on Nano might have improved quite signifi cantly with company hiking the price of the car by ` 9,000.
Volume game
“Nano is a volume game which is purely driven by pricing. The ex-showroom price of even the base version of Nano is now ` 1.4 lakh. There are pressures on raw material front,” said another analyst.
Source: http://www.thehindubusinessline.in/2010/12/01/stories/2010120152730200.htm
14.6 Summary
Break even analysis refers to ascertainment of level of operations where total revenue equal to total costs.
This is the point where profi t equal to zero or in other words BEP is point where there is no profi t and loss.
The break even chart indicates fi xed and variable costs, sales revenue so that profi t or loss at any given level of production or sales can be ascertained.
Break even point helps in assessing the viability of the organization and to take decisions on profi t planning and cost control.
Break even point indicates the level of operating capacity and sales to be achieved to recover all costs.
14.7 Keywords
B E P (Units): It is the level of units at which the fi rm neither incurs a loss nor earns profi t
BEP (Volume): It is the level of sales in Rupees at which the fi rm neither incurs a loss nor earns profi t
Contribution: It is an amount of balance available after the deduction of variable cost from the sales
Fixed Cost: It is a cost which is fi xed or remains the same for irrespective level of production
Variable Cost: It varies along with the level of production
14.8 Self Assessment
Fill in the blanks:
1. .................... is the point where total revenue equals the total costs.
2. .................... = Fixed Costs
Selling price – Variable costs per unit
3. The .................... deals with the net effect of changes in cost, price and volume in profi ts.
4. The .................... can be more appropriately called the cost-volume-profi t graph.
5. The fi rm will make .................... below the BEP.
6. The fi rm will make .................... above the BEP.
Unit 14: Break Even Analysis
Notes
LOVELY PROFESSIONAL UNIVERSITY 217
7. According to Martz, Curry and Frank, a break even analysis indicates at what level cost and revenue are in ....................
8. The break even chart shows the .................... relationship of total costs to total revenue.
9. Break even analysis does not include adjustments for risk and ....................
10. The ratio or percentage of contribution margin to sales is known as ....................
State whether the following statements are true or false:
11. Break Even is the point where TR > TC.
12. Costs incurred for pilots’ salaries by a commercial airline can be classifi ed as variable.
13. CVP analysis is useful in product decisions.
14. Break even analysis is a very generalised approach for dealing with a wide variety of questions associated with profi t planning and forecasting.
15. If the product mix consists of product with varying profi t margins, the picture presented by a simple break even point may be meaningless.
14.9 Review Questions
1. What do you understand by the term ‘break even point’? Mention the types of problems which an accountant can expect to solve with the help of such analysis.
You are required to calculate the break even point in the following case:
The fi xed costs for the year are ` 80,000, variable cost per unit for the single product is ` 4.
Estimated sales for the period are valued at ` 2,00,000. The number of units involved coincides with the expected volume of output. Each unit sells at ` 20.
2. From the following results of a company, determine by how much the value of sales must be increased for the company to break even?
Net sales – ` 400000
Fixed Cost – ` 200000
Variable Cost – ` 240000
Use break even chart to illustrate this.
3. Golden Ltd. has annual fi xed cost of ̀ 1,20,000. In the year 2005 sales amounted to ̀ 6,00,000 as compared with ̀ 4,50,000 in 2004 and the profi t for 2005 was ̀ 50,000 higher than in 2004. You are required to:
(i) Estimate profi ts for 2006 on forecast sales volume of ` 8,40,000 on the assumption that this would not involve any addition to the company’s capacity; and
(ii) Calculate the break even sales volume (in rupees).
4. The following information are available from the cost records of a manufacturing company:
Fixed expenses ` 4.000
Break even point ` 10,000
Basic Financial Management
Notes
218 LOVELY PROFESSIONAL UNIVERSITY
You are required to calculate:
(i) P/V ratio
(ii) Profi t where sales are ` 20,000
5. Draw a break even chart that will show contribution more clearly than the orthodox presentation.
6. Taking suitable data construct a simple break even chart and show the break even point, angle of incidence and margin of safety on the chart.
7. Distinguish between P/V ratio and break even point?
8. What are the various applications of break even chart? What are the criticisms leveled against BEP analysis?
9. Fixed costs do not change with changes in volume and it is diffi cult for management to control them”. Discuss.
10. “While variable costs are fi xed per unit of output, the fi xed costs are variable per unit of output although all costs tend to be variable in the long run”. Explain.
Answers: Self Assessment
1. Break Even 2. BEP
3. cost-volume-profi t analysis 4. Break Even chart
5. losses 6. profi t
7. equilibrium 8. short-run
9. uncertainty 10. P/V ratio
11. false 12. false
13. true 14. true
15. true
14.10 Further Readings
Books Chandra, P. Financial Management - Theory and Practice, New Delhi, Tata McGraw-Hill Publishing Company Ltd., 2002, p. 3.
Sudhindra Bhat, Management Accounting, New Delhi, Excel Books, 2009
Van Horne, J.C. and Wachowicz, Jr, J.M., Fundamentals of Financial Management, New Delhi, Prentice Hall of India Pvt. Ltd., 1996. p. 2.
Online links http://www.fei.org/
www.scribd.com

Jalandhar-Delhi G.T. Road (NH-1)Phagwara, Punjab (India)-144411For Enquiry: +91-1824-300360Fax.: +91-1824-506111Email: [email protected]
LOVELY PROFESSIONAL UNIVERSITY