financial management - lpu distance education...
TRANSCRIPT

Financial ManagementDCOM307/DMGT405/DCOM406

FINANCIAL MANAGEMENT

Copyright © 2012 P K SinhaAll rights reserved
Produced & Printed byEXCEL BOOKS PRIVATE LIMITED
A-45, Naraina, Phase-I,New Delhi-110028
forLovely Professional University
Phagwara
SYLLABUS
Financial Management
Objectives: To make the students aware regarding the basic concepts of financial management i.e capital budgeting, cost ofcapital, sources of finance, capital structure etc.
DMGT405 FINANCIAL MANAGEMENT
Sr. No. Description
1. Financial Management: Meaning , Objective and scope, Finance functions – Investment, financing and dividend decisions, Financial goal- Profit Maximization vs. Wealth Maximization
2. Concept of time value of money: Present & future value of annuities & Single Amount, perpetuity, Growth rate calculations
3. Source of Finance: Short term and long term Source of Finance, Leasing as a Source of Finance
4. Concept of economic value added
5. Risk and return analysis: Risk Measurement
6. Cost of Capital: Concept and its significance, Measurement of cost of capital of various source of funds, Weighted average cost of capital
7. Capital structure decision: theories of Capital Structure, Optimum Capital Structure Leverage: Operating and Financial Leverage
8. Capital budgeting: Meaning and Process, Methods of analyze capital budgeting decisions, Capital rationing, Capital decision under risk and uncertainty
9. Working Capital: Concept and significance, Determining working capital requirements, Management of Inventory , debtors and cash, Financing of working capital needs
10. Management of surplus: Retained earning and dividend policy, Theories of dividend, Forms of dividend and corporate dividend behavior.
DCOM406 FINANCIAL MANAGEMENT
Sr. No.
1. Financial management: meaning, scope and objectives
Financial decision making and planning: objectives types and steps in financial planning; Investment,
financing and dividend decisions
2. Time value of money: compounding and discounting techniques. 3. Capital Budgeting: methods, capital rationing, risk and uncertainty in capital budgeting decisions 4. Sources of finance: short-term and long-term, leasing as a source of finance
5. Capital structure decisions: theories of capital structure, optimum capital structure 6. Cost of capital: Significance and computation of cost of capital equity, preference, debt and retained
earnings, weighted average cost of capital 7. Leverage: operating, financial and combined. 8. Working capital: concept, significance and determinants, sources of working capital, Inventory
Management.
9. Cash and receivable management,
10. Dividend Policy: theories and forms of dividend, controversy over supremacy between dividend and
retention.
Description
Description
DCOM307 FINANCIAL MANAGEMENT
Sr. No.
1 Financial Management: meaning, scope and objectives, Financial decision
making and planning: objectives types and steps in financial planning;
Investment, financing and dividend decisions
2 Time Value of money
3 Sources of finance: short-term and long-term
4 Cost of Capital: Significance, computation of cost of capital equity, preference,
debt and retained earnings, weighted average cost of capital.
5 Capital Budgeting: meaning, importance, limitations & methods using excel
6 Capital Structure decisions: theories of capital structure, optimum capital
structure; Leverage : operating , financial and combined.
7 Working Capital: concept, significance and determinants
8 Inventory Management
9 Receivables Management (including factoring); Management of Cash
10 Dividend Policy: theories and forms of dividend
Description

CONTENTS
Unit 1: Introduction to Financial Management 1
Unit 2: Time Value of Money 17
Unit 3: Sources of Finance 31
Unit 4: Concept of Economic Value Added 55
Unit 5: Risk and Return Analysis 66
Unit 6: Cost of Capital 86
Unit 7: Capital Structure Decision 121
Unit 8: Concept of Leverages 141
Unit 9: Capital Budgeting 154
Unit 10: Working Capital Management 204
Unit 11: Inventory Management 231
Unit 12: Receivables Management 255
Unit 13: Management of Cash 270
Unit 14: Management of Surplus & Dividend Policy 288
LOVELY PROFESSIONAL UNIVERSITY 1
Unit 1: Introduction to Financial Management
NotesUnit 1: Introduction to Financial Management
CONTENTS
Objectives
Introduction
1. 1 Meaning and Scope of Financial Management
1.1.1 Scope of Financial Management
1.1.2 Important Topics in Financial Management
1.2 Goals/Objectives of Financial Management—Profit Maximization vs. WealthMaximization
1.3 Finance Functions
1.3.1 Place of Finance Function in the Organizational Structure
1.3.2 Relation of Finance with Economics
1.3.3 Relation to Accounting
1.3.4 Interface with other Functions
1.4 Supplementary noteworthy Aspects related to Financial Management
1.4.1 Methods and Tools of Financial Management
1.4.2 Forms of Business Organization
1.5 Summary
1.6 Keywords
1.7 Review Questions
1.8 Further Readings
Objectives
After studying this unit, you will be able to:
Recognize the meaning and scope of financial management
Describe the goals and objectives of financial management
Explain the different Finance functions
Discuss various significant aspects related to financial management
Introduction
Finance can be defined as the art and science of managing money. Virtually, all individuals andorganizations earn or raise money and spend or invest money. Finance is concerned with theprocess, institutions, markets and instruments involved in the transfer of money amongindividuals, business and governments.
1. 1 Meaning and Scope of Financial Management
Financial management as an academic discipline has undergone fundamental changes withregard to its scope and coverage. In the earlier years, it was treated synonymously with the

2 LOVELY PROFESSIONAL UNIVERSITY
Financial Management
Notes raising of funds. In the later years, its broader scope, included in addition to the procurement offunds, efficient use of resources.
1.1.1 Scope of Financial ManagementFinancial Management is broadly concerned with the acquisition and use of funds by a businessfirm. The important tasks of financial management, as related to the above, may be categorizedas follows:
Financial Analysis, Planning and Control
Analysis of financial condition and preference
Profit planning
Financial forecasting
Financial control
1.1.2 Important Topics in Financial Management
Balance Sheet and Topics in Financial Management

LOVELY PROFESSIONAL UNIVERSITY 3
Unit 1: Introduction to Financial Management
NotesIncome Statement and Topics in Financial Management
Self AssessmentFill in the blanks:
1. In the earlier years, financial manageemnt was treated synonymously with the...............................
2. Financial management broader scope includes efficient use of resources in addition to the...............................
3. Current liabilities are associated with ............................... financing policy.
4. ............................... profit margin is obtained by deducting cost of goods sold from net sales.
1.2 Goals/Objectives of Financial Management—Profit Maximizationvs. Wealth Maximization
Traditional Approach—Profit Maximization
It has been traditionally argued that the objective of a company is to earn profit. This means thatthe finance manager has to make decision in a manner that the profit is maximised. Eachalternative, therefore, is to be seen as to whether or not it gives maximum profit.
Profit maximization objective gives rise to a number of problems as below:
1. Profit maximization concept should be considered in relation to risks involved. There is adirect relationship between risk and profit. Many risky propositions yield high profit.Higher the risk, higher is the possibility of profits. If profit maximization is the only goal,then risk factor is altogether ignored.

4 LOVELY PROFESSIONAL UNIVERSITY
Financial Management
Notes 2. Profit maximization, as an objective does not take into account time pattern of return.
Example: Proposal A may give a higher amount of profits compared to proposal B,yet if the returns begin to flow say, 10 years later, proposal B may be preferred,which may have lower overall profits but the returns flow is more early andquick.
3. Profit maximization, as an objective is too narrow. It fails to take into account the socialconsiderations as also the obligations to various interests of workers, consumers, societyas well as ethical trade practices. Further, most business leaders believe that adoption ofethical standards strengthen their competitive positions.
4. Profits do not necessarily result in cash flows available to the stockholder. Owners receivecash flow in the form of either cash dividends paid to them or proceeds from selling theirshares for a higher price than paid initially.
Modern Approach—Wealth Maximization
The alternative to profit maximization is wealth maximization. This is also known as ValueMaximization or Net Present Worth Maximization. Value is represented by the market price ofthe company’s equity shares. Prices in the share market at a given point of time, are the result ofmany factors like general economic outlook, particularly if the companies are underconsideration, technical factors and even mass psychology. However, taken on a long-termbasis, the share market prices of a company’s shares do reflect the value, which the variousparties put on a company. Normally, the value is a function of two factors:
1. The likely rate of earnings per share (EPS) of a company and
2. The capitalization rate
EPS are calculated by dividing the periods total earnings available for the firm’s common sharesby the number of shares of common shares outstanding. The likely rate of earnings per share(EPS) depends on the assessment as to how profitably a company is going to operate in thefuture.
!Caution The capitalisation rate reflects the liking of the investors for a company.
If the company earns a higher rate of earning per share through risky operations or riskyfinancing pattern, the investors will not look upon its shares with favour. To that extent, themarket value of the shares of such a company will be low. If a company invests its fund in riskyventures, the investors will put in their money if they get higher return as compared to thatfrom a low risk share.
The market value of a firm is a function of the earning per share and the capitalisation rate.
Example: Suppose the earning per share is expected to be 7 for a share, and thecapitalisation rate expected by the shareholder is 20 per cent, the market value of the share islikely to be
This is so because at this price, the investors have an earning of 20%, something they expect froma company with this degree of risk.
7 7 100 3520% 20
LOVELY PROFESSIONAL UNIVERSITY 5
Unit 1: Introduction to Financial Management
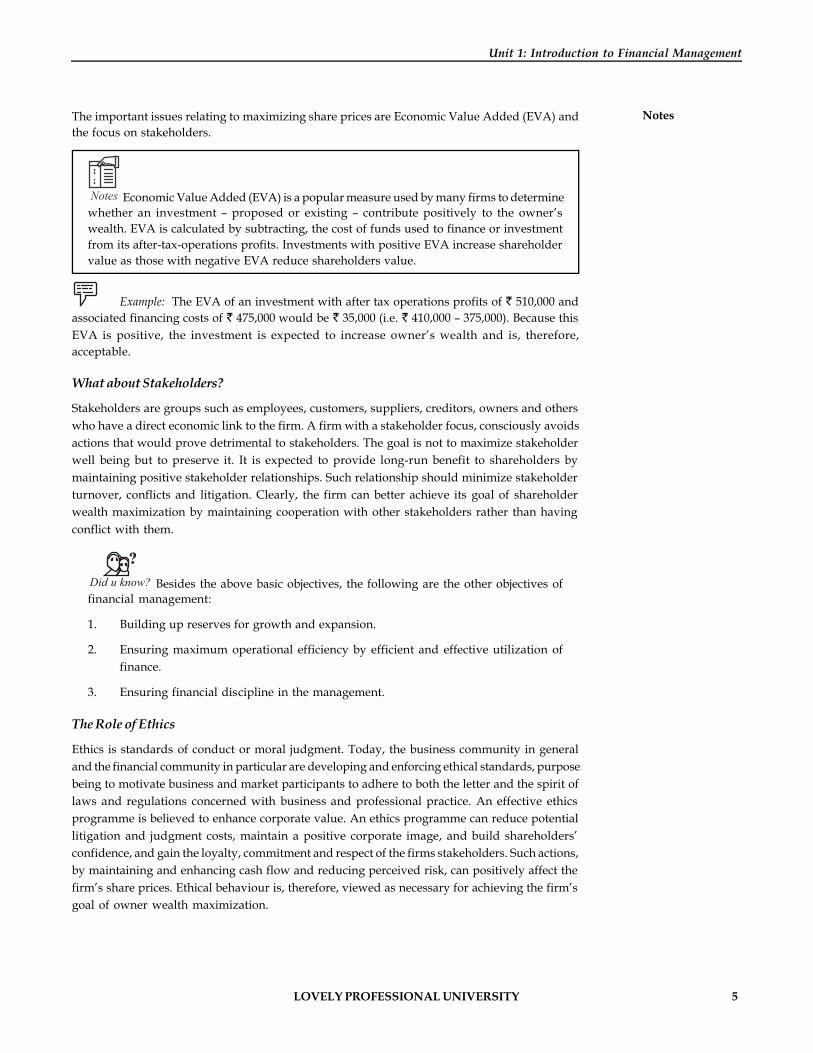
NotesThe important issues relating to maximizing share prices are Economic Value Added (EVA) andthe focus on stakeholders.
Notes Economic Value Added (EVA) is a popular measure used by many firms to determinewhether an investment – proposed or existing – contribute positively to the owner’swealth. EVA is calculated by subtracting, the cost of funds used to finance or investmentfrom its after-tax-operations profits. Investments with positive EVA increase shareholdervalue as those with negative EVA reduce shareholders value.
Example: The EVA of an investment with after tax operations profits of 510,000 andassociated financing costs of 475,000 would be 35,000 (i.e. 410,000 – 375,000). Because thisEVA is positive, the investment is expected to increase owner’s wealth and is, therefore,acceptable.
What about Stakeholders?
Stakeholders are groups such as employees, customers, suppliers, creditors, owners and otherswho have a direct economic link to the firm. A firm with a stakeholder focus, consciously avoidsactions that would prove detrimental to stakeholders. The goal is not to maximize stakeholderwell being but to preserve it. It is expected to provide long-run benefit to shareholders bymaintaining positive stakeholder relationships. Such relationship should minimize stakeholderturnover, conflicts and litigation. Clearly, the firm can better achieve its goal of shareholderwealth maximization by maintaining cooperation with other stakeholders rather than havingconflict with them.
Did u know? Besides the above basic objectives, the following are the other objectives offinancial management:
1. Building up reserves for growth and expansion.
2. Ensuring maximum operational efficiency by efficient and effective utilization offinance.
3. Ensuring financial discipline in the management.
The Role of Ethics
Ethics is standards of conduct or moral judgment. Today, the business community in generaland the financial community in particular are developing and enforcing ethical standards, purposebeing to motivate business and market participants to adhere to both the letter and the spirit oflaws and regulations concerned with business and professional practice. An effective ethicsprogramme is believed to enhance corporate value. An ethics programme can reduce potentiallitigation and judgment costs, maintain a positive corporate image, and build shareholders’confidence, and gain the loyalty, commitment and respect of the firms stakeholders. Such actions,by maintaining and enhancing cash flow and reducing perceived risk, can positively affect thefirm’s share prices. Ethical behaviour is, therefore, viewed as necessary for achieving the firm’sgoal of owner wealth maximization.
6 LOVELY PROFESSIONAL UNIVERSITY
Financial Management
Notes Self AssessmentFill in the blanks:
5. There is a …………..relationship between risk and profit.
6. ………………………is also known as Value maximization or Net Present Worthmaximization.
7. A firm with a stakeholder focus, consciously avoids actions that would prove ………………tostakeholders.
8. Ethics programme reduces potential litigation and ……………..costs and gain the loyalty,commitment and respect of the firms stakeholders.
1.3 Finance FunctionsFinancial Management is indeed, the key to successful business operations. Without properadministration and effective utilization of finance, no business enterprise can utilize its potentialsfor growth and expansion.
Financial management is concerned with the acquisition, financing and management of assetswith some overall goals in mind. In the contents of modern approach, the discussions on financialmanagement can be divided into three major decisions viz., (1) Investing; (2) Financing; and(3) Dividend decision. A firm takes these decisions simultaneously and continuously in thenormal course of its business. Firm may not take these decisions in a sequence, but decisionshave to be taken with the objective of maximizing shareholders’ wealth.
Investing
1. Management of current assets (cash, marketable securities, receivables and inventories)
2. Capital budgeting (identification, selection and implementation of capital projects)
3. Managing of mergers, reorganizations and divestments
Financing
1. Identification of sources of finance and determination of financing mix
2. Cultivating sources of funds and raising funds
Dividend Decision
This is the third financial decision, which relates to dividend policy. Dividend is a part of profits,that are available for distribution, to equity shareholders. Payment of dividends should beanalyzed in relation to the financial decision of a firm. There are two options available indealing with the net profits of a firm, viz., distribution of profits as dividends to the ordinaryshareholders’ where, there is no need of retention of earnings or they can be retained in the firmitself if they require, for financing of any business activity. But distribution of dividends orretaining should be determined in terms of its impact on the shareholders’ wealth. The Financialmanager should determine optimum dividend policy, which maximizes market value of theshare thereby market value of the firm. Considering the factors to be considered whiledetermining dividends is another aspect of dividend policy.
LOVELY PROFESSIONAL UNIVERSITY 7
Unit 1: Introduction to Financial Management
Notes1.3.1 Place of Finance Function in the Organizational StructureThe finance function is almost the same in most enterprises. The details may differ but theimportant features are universal in nature. The finance function occupies such a major place thatit cannot be the sole responsibility of the executive. The important aspects of the finance functionhave to be carried on by the top management i.e., the Managing Director and the Board ofDirectors. It is the Board of Directors, which makes all the material final decisions involvingfinance.
Financial management in many ways is an integral part of the jobs of managers who are involvedin planning, allocation of resources and control. The responsibilities for financial managementare disposed throughout the organization.
Example:
1. The engineer, who proposes a new plant, shapes the investment policy of the firm.
2. The marketing analyst provides inputs in the process of forecasting and planning.
3. The purchase manager influences the level of investment in inventories.
4. The sales manager has a say in the determination of receivable policy.
5. Departmental managers, in general, are important links in the financial control systemof the firm.
The Chief Financial Officer (CFO) is basically to assist the top management. He has an importantrole to contribute to good decision-making on issues that involve all the functional areas of thebusiness. He must clearly bring out financial implications of all decisions and make themunderstood.
CFO (his designation varies from company to company) works directly under the President orthe Managing Director of the company. Besides routine work, he keeps the Board of Directorsinformed about all the phases of business activity, including economic, social and politicaldevelopments affecting the business behaviour. He also furnishes information about the financialstatus of the company by reviewing from time-to-time. The CFO may have different officersunder him to carry out his functions. Broadly, the functions are divided into two parts.
1. Treasury function
2. Control function
Treasury function (headed by financial manager) is commonly responsible for handling financialactivities, such as financial planning and fund raising, making capital expenditures decisions,managing cash, managing credit activities, managing the pension fund and managing foreignexchange.
Notes The control function (headed by Chief Accountant/Financial Controller) typicallyhandles the accounting activities such as corporate accounting, tax management, financialaccounting and cost accounting.
8 LOVELY PROFESSIONAL UNIVERSITY
Financial Management
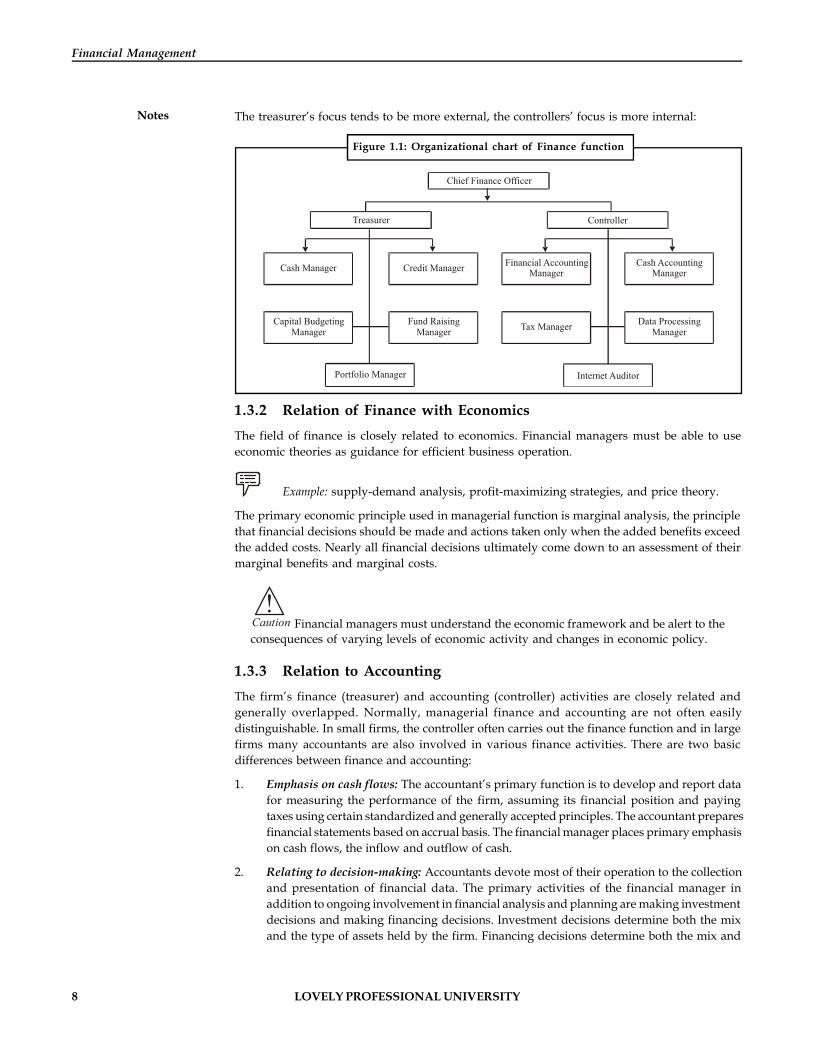
Notes The treasurer’s focus tends to be more external, the controllers’ focus is more internal:
Figure 1.1: Organizational chart of Finance function
Chief Finance Officer
Treasurer Controller
Cash Manager Credit Manager
Capital BudgetingManager
Fund RaisingManager
Portfolio Manager
Financial AccountingManager
Cash AccountingManager
Tax ManagerData Processing
Manager
Internet Auditor
1.3.2 Relation of Finance with EconomicsThe field of finance is closely related to economics. Financial managers must be able to useeconomic theories as guidance for efficient business operation.
Example: supply-demand analysis, profit-maximizing strategies, and price theory.
The primary economic principle used in managerial function is marginal analysis, the principlethat financial decisions should be made and actions taken only when the added benefits exceedthe added costs. Nearly all financial decisions ultimately come down to an assessment of theirmarginal benefits and marginal costs.
!Caution Financial managers must understand the economic framework and be alert to theconsequences of varying levels of economic activity and changes in economic policy.
1.3.3 Relation to AccountingThe firm’s finance (treasurer) and accounting (controller) activities are closely related andgenerally overlapped. Normally, managerial finance and accounting are not often easilydistinguishable. In small firms, the controller often carries out the finance function and in largefirms many accountants are also involved in various finance activities. There are two basicdifferences between finance and accounting:
1. Emphasis on cash flows: The accountant’s primary function is to develop and report datafor measuring the performance of the firm, assuming its financial position and payingtaxes using certain standardized and generally accepted principles. The accountant preparesfinancial statements based on accrual basis. The financial manager places primary emphasison cash flows, the inflow and outflow of cash.
2. Relating to decision-making: Accountants devote most of their operation to the collectionand presentation of financial data. The primary activities of the financial manager inaddition to ongoing involvement in financial analysis and planning are making investmentdecisions and making financing decisions. Investment decisions determine both the mixand the type of assets held by the firm. Financing decisions determine both the mix and
LOVELY PROFESSIONAL UNIVERSITY 9
Unit 1: Introduction to Financial Management
Notesthe type of financing used by the firm. However, the decisions are actually made on thebasis of cash flow effects on the overall value of the firm.
1.3.4 Interface with other FunctionsFinance is defined as the lifeblood of an organization. It is a common thread, which binds all theorganizational functions as each function when carried out creates financial implications. Theinterface between finance and other functions can be described as follows:
Manufacturing Finance
1. Manufacturing function necessitates a large investment. Productive use of resources ensuresa cost advantage for the firm.
2. Optimum investment in inventories improves profit margin.
3. Many parameters of the production cost having effect on production cost are possible tocontrol through internal management thus improving profits.
4. Important production decisions like make or buy can be taken only after financialimplications have been considered.
Marketing Finance
1. Many aspects of marketing management have financial implications e.g., hold inventoriesto provide off the shelf service to customers and thus increase sales; extension of creditfacility to customers to increase sales.
2. Marketing strategies to increase sales have additional cost impact, which needs to beweighed carefully against incremental revenue.
Personnel Finance
In the global competitive scenario, business firms are moving to leaner and flat organizations.Investments in Human Resource Development are also bound to increase. Restructuring ofremuneration structure, voluntary retirement schemes, sweat equity etc., has become majorfinancial decisions in the area of human resource management.
Task Which of the following functions should be the responsibility of a finance manager?
1. Maintaining the books of account.
2. Negotiating loans with banks.
3. Conducting of internal audit.
4. Deciding about change in the policies regarding recruitment.
5. Change in marketing and advertising techniques routine.
Strategic Planning – Finance
Finance function is an important tool in the hands of management for strategic planning andcontrol on two counts:1. The decision variables when converted into monetary terms are easier to grasp.2. Finance function has strong inter-linkages with other functions. Controlling other functions
through finance route is possible.
10 LOVELY PROFESSIONAL UNIVERSITY
Financial Management
Notes Self AssessmentFill in the blanks:
9. Financial management can be divided into three major decisions which are investing;Financing; and ……………decision.
10. Identification of sources of finance and determination of financing mix is a part of …………decision.
11. Finance is defined as the ……………of an organization.
12. ………………decisions determine both the mix and the type of assets held by the firm.
1.4 Supplementary noteworthy Aspects related to FinancialManagement
Modern financial management has come a long way from the traditional corporate finance.
The finance manager is working in a challenging environment, which changes continuously. Asthe economy is opening up and global resources are being tapped, the opportunities availableto finance manager have no limits. At the same time one must understand the risk in thedecisions. Financial management is passing through an era of experimentation and excitement,as a large part of the finance activities carried out today were not heard of a few years ago.
A few instances are enumerated below:
1. Interest rates have been deregulated. Further, interest rates are fluctuating, and minimumcost of capital necessitates anticipating interest rate movements.
2. The rupee has become freely convertible in current account.
3. Optimum debt equity mix is possible. Firms have to take advantage of the financialleverage to increase the shareholders wealth. However, financial leverage entails financialrisk. Hence a correct trade off between risk and improved rate of return to shareholders isa challenging task.
4. With free pricing of issues, the optimum price of new issue is a challenging task, asoverpricing results in under subscription and loss of investor confidence, whereasunderpricing leads to unwarranted increase in a number of shares and also reduction ofearnings per share.
5. Maintaining share prices is crucial. In the liberalized scenario, the capital markets are theimportant avenue of funds for business. The dividend and bonus policies framed have adirect bearing on the share prices.
6. Ensuring management control is vital, especially in the light of foreign participation inequity (which is backed by huge resources) making the firm an easy takeover target.Existing managements may lose control in the eventuality of being unable to take up theshare entitlements. Financial strategies to prevent this are vital to the present management.
1.4.1 Methods and Tools of Financial Management1. In the area of financing, funds are procured from long-term sources as well as short-term
sources. Long-term funds may be made available by owners, i.e., shareholders, lendersthrough issue of debentures/bonds, from financial institutions, banks and public at large.Short-term funds may be procured from commercial banks, suppliers of goods, publicdeposits etc. The finance manager has to decide on optimum capital structure with a view
LOVELY PROFESSIONAL UNIVERSITY 11
Unit 1: Introduction to Financial Management
Notesto maximize shareholder’s wealth. Financial leverage or trading on equity is an importantmethod by which return to shareholders can be increased.
2. For evaluating capital expenditure (investment) decisions, a finance manager uses variousmethods such as average rate of return, payback, internal rate of return, net present valueand profitability index.
3. In the area of working capital management, there are various methods for efficientutilization of current resources at the disposal of the firm, thus increasing profitability.The centralized method of cash management is considered a better method of managingliquid resources of the firm.
4. In the area of dividend decision, a firm is faced with the problem of declaring dividend orpostponing dividend declaration, a problem of internal financing. There are tools totackle such situation.
5. For the evaluation of a firm’s performance, there are different methods.
Example: Ratio analysis is a popular technique to evaluate different aspects of a firm.
6. The main concern of the finance manager is to provide adequate funds from the bestpossible source, at the right time and the minimum cost and to ensure that the funds soacquired are put to best possible use through various methods/techniques are used todetermine that funds have been procured from the best possible available services and thefunds have been used in the best possible way. Funds flow and cash flow statements andprojected financial statements help a lot in this regard.
Task Which of the following statements do you agree with?
1. Financial management is essential only in private sector enterprises.
2. Only capitalists have to bother about money. The bureaucrat is to administer andnot to manage funds.
3. The public administrators in our country must be given a basic understanding ofessentials of finance.
4. A state-owned transport company must immediately deposit in the bank all itstakings.
5. “Financial Management is counting pennies. We do not believe in such miserlyattitude”.
1.4.2 Forms of Business OrganizationThe three most common forms of business organization are sole proprietorship, partnershipand the company. Other specialized forms of business organizations also exist. Soleproprietorship is the most in terms of total receipts and in net profits the corporate form ofbusiness dominates.
Sole Proprietorship
A sole proprietorship is a business owned by one person who runs for his own profit. Majorityof the business firms are sole proprietorships. The typical sole proprietorship is a small business
12 LOVELY PROFESSIONAL UNIVERSITY
Financial Management
NotesExample: bakeshop, personal trainer or plumber.
The majority of sole proprietorship are found in the wholesale, retail, service and constructionindustries.
Typically, the proprietor along with a few employees runs the business. He raises capitalfrom personal resources or by borrowing and is responsible for all business decisions. Thesole proprietor has unlimited liability, towards creditors not restricted to the amountoriginally invested. The key strengths and weaknesses of sole proprietorship are given inTable 1.1 below.
Partnership
A partnership firm is a business run by two or more persons for profit. Partnership accounts forthe next majority of business and they are typically larger than sole proprietorship. Finance,legal and real estate firms often have large number of partners.
Most partnerships are established by a written contract known as ‘Deed of Partnership’. Inpartnership, all partners have unlimited liability for all the debts of the partnership. The strengthsand weaknesses or partnerships are summarized in Table below.
Did u know? Which is the governing act for partnership in India?
In India, partnership is governed by the Partnership Act, 1932.
Company Form
A company form of business is a legal entity, separated from the owners, with perpetual succession.Just like an individual, the company can sue and be sued, make and be party to contracts andacquire property in its own name. The company form of organization is the dominant form ofbusiness organization in terms of receipts and profits. Although, corporations are involved inall types of business, manufacturing corporation account for the largest portion of corporatebusiness receipts and net profits. The key strengths and weaknesses of corporate form aresummarized in Table below.
The owners of the company are its shareholders, whose ownership is evidenced by eithercommon shares or preference shares. Shareholders get a return by receiving dividends i.e.,periodic distribution of earnings or gains through increase in share price. The owner’s liabilityis limited to the amount paid on their shares. Shareholder elects the Board of Directors throughvote. The Board of Directors has the ultimate authority in running the organization includingmaking the general policy.
The President or Chief Executive Office (CEO) is responsible for managing day-to-day operationsand carrying out the policies established by the Board. The CEO is required to report periodicallyto the firm’s board of directors.
The corporate form of business is subject to strict control by Regulatory Agencies includingCompanies Act, 1956, SEBI, etc.
LOVELY PROFESSIONAL UNIVERSITY 13
Unit 1: Introduction to Financial Management
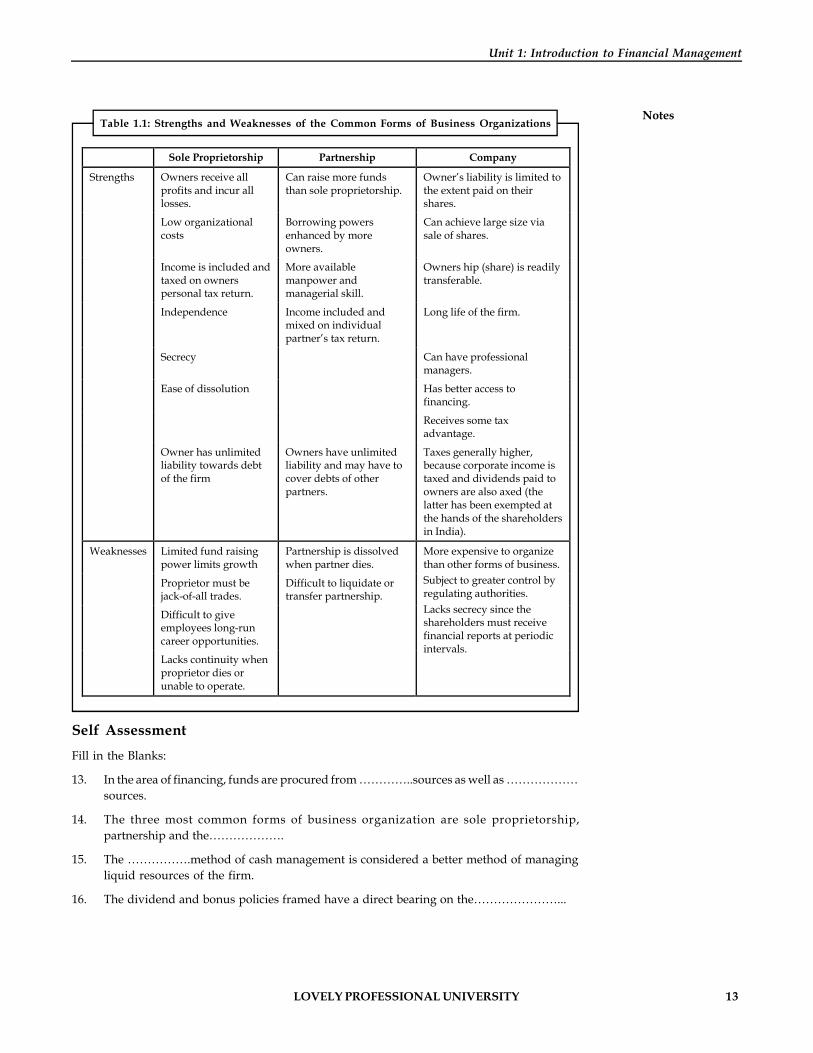
NotesTable 1.1: Strengths and Weaknesses of the Common Forms of Business Organizations
Sole Proprietorship Partnership Company
Strengths Owners receive all profits and incur all losses.
Can raise more funds than sole proprietorship.
Owner’s liability is limited to the extent paid on their shares.
Low organizational costs
Borrowing powers enhanced by more owners.
Can achieve large size via sale of shares.
Income is included and taxed on owners personal tax return.
More available manpower and managerial skill.
Owners hip (share) is readily transferable.
Independence Income included and mixed on individual partner’s tax return.
Long life of the firm.
Secrecy Can have professional managers.
Ease of dissolution Has better access to financing.
Receives some tax advantage.
Owner has unlimited liability towards debt of the firm
Owners have unlimited liability and may have to cover debts of other partners.
Taxes generally higher, because corporate income is taxed and dividends paid to owners are also axed (the latter has been exempted at the hands of the shareholders in India).
Weaknesses Limited fund raising power limits growth
Partnership is dissolved when partner dies.
Proprietor must be jack-of-all trades.
Difficult to liquidate or transfer partnership.
Difficult to give employees long-run career opportunities.
Lacks continuity when proprietor dies or unable to operate.
More expensive to organize than other forms of business. Subject to greater control by regulating authorities. Lacks secrecy since the shareholders must receive financial reports at periodic intervals.
Self AssessmentFill in the Blanks:
13. In the area of financing, funds are procured from …………..sources as well as ………………sources.
14. The three most common forms of business organization are sole proprietorship,partnership and the……………….
15. The …………….method of cash management is considered a better method of managingliquid resources of the firm.
16. The dividend and bonus policies framed have a direct bearing on the…………………...
14 LOVELY PROFESSIONAL UNIVERSITY
Financial Management
Notes
Case Study Case: Bhatt Industries Basic Planning
This case will help the reader, develop an approach to structuring a case solution. Itrequires a logical approach to solving a general financial problem.
Bhatt Industries has been manufacturing fireworks at a small facility just outsideGreensboro, North Carolina. The firm is known for the high level of quality control in itsproduction process and is generally respected by distributors in the states, where fireworksare legalized. Its selling market is fairly well defined; it has the capacity to produce800,000 cases annually, with peak consumption in the summer. The firm is fairly confident,that the whole of next year’s production can be sold for 25 a case.
On September 7, the company has 8,000,000 in cash. The firm has a policy againstborrowing, to finance its production, a policy first established by William Bhatt, theowner of the firm. Mr. Bhatt keeps a tight rein on the firm’s cash and invests any excesscash in treasury bonds, that pays a 12 per cent return and involve no risk of default.
The firm’s production cycle revolves around the seasonal nature of the fireworks business.Production begins right after Labour Day and runs through May. The firms sales occur inFebruary through May; the firm closes from June 1 to Labour Day, when its employeesreturn to farming. During this time, Mr. Bhatt visits his grandchildren in New York andPennsylvania. As a result of this scheduling, the firm pays all its expenses during Septemberand in May receives, all its revenues from its distributors within 6 weeks after the 4th ofJuly. The customers send their checks directly to Kenmy National Bank, where the moneyis deposited in Bhatt’s account.
Mr. Bhatt is the only full-time employee of his company and he and his family hold all thecommon stock. Thus, the company’s only costs are directly related to the production offireworks. The costs are affected by the law of variable proportions, depending on theproduction level. The first 100,000 cases cost 16 each; the second 100,000 cases, 17 each;the third 100,000 cases, 18 each and the fourth 100,000 cases, 19 each ; the fifth 100,000cases, 20 each; the sixth 100,000 cases, 21 each. As an example, the total of 200,000 caseswould be 1,600,000 plus 1,700,000 or 3,300,000.
BHATT INDUSTRIES—INCOME STATEMENT (August 31, fiscal year just ended)
Revenues from operations 50,00,000
Revenues from interest on government bonds 9,20,000
Total revenues 59,20,000
Operating expenses 40,50,000
Earnings before taxes 18,70,000
Taxes 9,48,400
Net income after taxes 9,21,600
Contd...
LOVELY PROFESSIONAL UNIVERSITY 15
Unit 1: Introduction to Financial Management
NotesBhatt Industries is a corporation and pays a 30 per cent tax on income, because of thepaperwork involved. Mr. Bhatt invests his excess cash on September 6 in one year treasurybonds. He does not invest for shorter periods.
Questions
1. How does this level affect long-term prospects of wealth maximization?
2. What should be the level of production to maximize the profit?
1.5 Summary
Financial Management is broadly concerned with the acquisition and use of funds by abusiness firm.
It has been traditionally argued that the objective of a company is to earn profit. Thismeans that the finance manager has to make decision in a manner that the profit ismaximised.
The alternative to profit maximization is wealth maximization. This is also known asValue maximization or Net Present Worth maximization.
The important aspects of the finance function have to be carried on by the top managementi.e., the Managing Director and the Board of Directors.
Finance is defined as the lifeblood of an organization. It is a common thread, which bindsall the organizational functions as each function when carried out creates financialimplications.
The three most common forms of business organization are sole proprietorship,partnership and the company.
In the area of financing, funds are procured from long-term sources as well as short-termsources.
For evaluating investment decisions, a finance manager uses various methods such asaverage rate of return, payback, internal rate of return, net present value and profitabilityindex.
In the area of dividend decision, a firm is faced with the problem of declaring dividend orpostponing dividend declaration, a problem of internal financing.
1.6 Keywords
Corporate Finance: Corporate finance is the activity concerned with planning, raising, controllingand administering of the funds used in the business.
Dividend: Dividend is a part of profits that are available for distribution to shareholders.
Financial Management: It is the operational activity of a business that is responsible for obtainingand effectively utilising the funds necessary for efficient operations.
Financing Decision: It is related to the financing mix or capital structure or leverage and thedetermination of the proportion of debt and equity.
Investment Decision: Investment decision is related with the selection of assets, that a firm willinvert.
Wealth Maximization: It is maximizing the present value of a course of action (i.e. NPV = GPCof benefits—Investment).
16 LOVELY PROFESSIONAL UNIVERSITY
Financial Management
Notes 1.7 Review Questions
1. What are the tasks of Financial Management?
2. Discuss the salient features of the traditional approach to corporation finance.
3. Discuss the distinctive features of modern approach to corporation finance.
4. What is the normative goal of Financial Management?
5. “Financial Management is an integral part of the jobs of all managers. Hence, it cannot beentrusted to a staff department”. Discuss.
6. Discuss some of the problems financial managers in a developing country like India haveto grapple with.
7. Draw a typical organization chart highlighting the finance function of a company.
8. “The profit maximization is not an operationally feasible criterion.” Do you agree? Justify.
9. ‘Finance is considered to be the blood of the enterprise’. Justify.
10. You are the finance manager of a firm and asked to organize all the financial decisions ofthe firm. Elucidate the ways in which you will do it.
Answers: Self Assessment
1. raising of funds 2. procurement of funds
3. working capital 4. Gross
5. direct 6. Wealth maximization
7. detrimental 8. judgment
9. Dividend 10. financing
11. lifeblood 12. Investment
13. long-term, short-term 14. company
15. centralized 16. share prices
1.8 Further Readings
Books Dr Pradeep Kumar Sinha, Financial Management, New Delhi, Excel Books, 2009.
Van Horne, J.C. and Wachowicz, Jr, J.M., Fundamentals of Financial Management,New Delhi, Prentice Hall of India Pvt. Ltd., 1996, p. 2.
Chandra, P., Financial Management—Theory and Practice, New Delhi, Tata McGrawHill Publishing Company Ltd., 2002, p. 3.
LOVELY PROFESSIONAL UNIVERSITY 17
Unit 2: Time Value of Money
NotesUnit 2: Time Value of Money
CONTENTS
Objectives
Introduction
2.1 Future Value of Single Amount
2.2 Present Value of Single Amount
2.3 Present and Future Value of Annuities
2.3.1 Future Value of Annuity of 1
2.3.2 Present Value of Annuity of 1
2.4 Perpetuities
2.5 Calculation of the Compound Growth Rate
2.6 Summary
2.7 Keywords
2.8 Review Questions
2.9 Further Readings
Objectives
After studying this unit, you will be able to:
Explain the time value of money of single amount
Identify the conception of present and future value of annuity
Describe the concept of perpetuity
Discuss various significant aspects related growth rate calculations
Introduction
This unit is concerned with interest rates and their effects on the value of money. Interest rateshave widespread influence over decisions made by businesses and by us in personal lives.Corporations pay lakhs of rupees in interest each year for the use of money they have borrowed.We earn money on sums we have invested in savings accounts, certificate of deposit, and moneymarket funds. We also pay for the use of money that we have borrowed for school loans, mortgages,or credit card purchases. We will first examine the nature of interest and its computation. Then, wewill discuss several investment solutions and computations related to each.
2.1 Future Value of Single Amount
Money available at present is more valuable than money value in future.
Did u know? What is interest?
The compensation for waiting is the time value of money is called interest. Interest is a feethat is paid for having the use of money.
18 LOVELY PROFESSIONAL UNIVERSITY
Financial Management
NotesExample: Interest on mortgages for having the use of bank’s money.
Similarly, the bank pays us interest on money invested in savings accounts or certificates ofdeposit because it has temporary access to our money. The amount of money that is lent orinvested is called principal. Interest is usually paid in proportion and the period of time overwhich the money is used. The interest rate is typically stated as a percentage of the principal perperiod of time,
Example: 18 per cent per year or 1.5 per cent per month.
Interest that is paid solely on the amount of the principal is called simple interest. Simpleinterest is usually associated with loans or investments that are short-term in nature. Thecomputation of simple interest is based on the following formula:
Simple interest = principal × interest rate per time period × number of time period
Example:A person lends 10,000 to a corporation by purchasing a bond from thecorporation. Simple interest is computed quarterly at the rate of 3 per cent per quarter, and acheque for the interest is mailed each quarter to all bondholders. The bonds expire at the end of5 years and the final cheque includes the original principal plus interest earned during the lastquarter. Compute the interest earned each quarter and the total interest which will be earnedover the 5-year life of the bonds.
Solution:
In this problem, principal = 10,000, interest = 3 per cent per quarter and the period of loan is5 years. Since the time period for interest is a quarter of a year, we must consider 5 years as20 quarters. And since we are interested in the amount of interest earned over one quarter, theperiod is 1 quarter. Therefore, quarterly interest equals 10,000 × 0.03 × 1 = 300
To compute total interest over the 5-year period, we multiply the per-quarter interest of 300 bythe number of quarters 20, to obtain
Total interest = 300 × 20 = 6,000
Compound Interest: Compound Interest occurs when interest earned during the previous perioditself earns interest in the next and subsequent periods. If 1000 is placed into savings accountpaying 6% interest per year, interest accumulates as follows:
Principal invested in the first year 1000.00
Interest for first year ( 1000 × 0.06 × 1) 60.00
Amount available at end of first year 1060.00
Interest for second year ( 1060 × 0.06 × 1) 63.60
Amount available at end of second year 1123.60
The interest earned in the second year is greater than 60 because it is earned on the principalplus the first year’s interest. If the savings account pays 6% interest compounded quarterly, 1.5%interest is added to the account each quarter, as follows:
Principal invested in the first year 1000.00
Interest for first quarter ( 1000 × 0.06 × 1 × 1/4) 15.00
Amount available at end of first quarter 1015.00

LOVELY PROFESSIONAL UNIVERSITY 19
Unit 2: Time Value of Money
NotesInterest for second quarter ( 1015 × 0.06 × 1 × 1/4) 15.23
Amount available at end of second quarter 1030.23
Interest for third quarter ( 1030.23 × 0.06 × 1 × 1/4) 15.45
Amount available at end of third quarter 1045.68
Interest for fourth quarter ( 1045.68 × 0.06 × 1 × 1/4) 15.69
Amount available at end of first year 1061.37
With quarterly compounding, the initial investment of 1000 earned 1.37 more interest in thefirst year than with annual compounding. Compound interest is defined with the followingterms:
P = principal sum earns
i = interest rate per period
n = number of period during which compounding takes place – a period can beany length in time
Future Value of 1
A sum of money invested today at compound interest accumulates to a larger sum called theamount or future value. The future value of 1000 invested at 6% compounded annually for2 years is 1123.60. The future value includes the original principal and the accumulated interest.
Notes The future value varies with the interest rate, the compounding frequency and thenumber of periods.
If the future value of 1 principal investment is known, we can use it to calculate the future valueof any amount invested. For example, at 8% interest per period, 1 accumulates as follows:
Future value of 1 at 8% for 1 period = 1.00000 × 1.08 = 1.08000
Future value of 1 at 8% for 2 periods = 1.08000 × 1.08 = 1.16640
Future value of 1 at 8% for 3 periods = 1.16640 × 1.08 = 1.25971
The above can be diagrammed as follows:
Interest is added to principal at the end of each period
Figure 2.1
The end of each period is designated by a grey cylinder like figure. The arrows pointing to theend of each period indicate that payments are made into the investment. The general formulafor the future value of 1, with n representing the number of compounding period is
fv = (1 + i)n

20 LOVELY PROFESSIONAL UNIVERSITY
Financial Management
Notes Using this formula, future values can be calculated for any interest rate and any number of timeperiods. To obtain the future value of any principal other than 1, we multiply the principal bythe factor for the future value of 1.
fv = (1 + i)n
or fv = Pf
where f is the factor in the future value of 1, with interest rate i and number of periods n.
Example: XYZ Company invests 40,00,000 in certificates of deposit that earn 16%interest per year, compounded semi-annually. What will be the future value of this investmentat the end of 5 years when the company plans to use it to build a new plant?
Solution: Compounding is semi-annual and there are 5 years, so the number of half-yearperiods is 10. The semi-annual interest rate is half of the 16% annual rate or 8%. With i = 8% andn = 10, the factor in the table is 2.15892. Multiplying this factor by the principal investment, weget:
fv = P × f (n = 10, i = 8%)
= 40,00,000 × 2.15892
= 86,35,680
Self AssessmentFill in the blanks:
1. The compensation for waiting is the time value of money, called…………..
2. The future value includes the original principal and the……………………..
3. The future value varies with the interest rate, the …………….frequency and the number ofperiods.
2.2 Present Value of Single AmountIf 1 can be invested at 8% today to become 1.08 in the future, then 1 is the present value ofthe future amount of 1.08. The present value of future receipts of money is important inbusiness decision-making. It is necessary to decide how much future receipts are worth today inorder to determine whether an investment should be made or how much should be invested.Finding the present value of future receipts involves discounting the future value to the present.Discounting is the opposite of compounding. It involves finding the present value of somefuture amount of money that is assumed to include interest accumulations.
Present Value of 1
Knowing the present value of 1 is useful because it enables us to find the present value of anyfuture payment. Assuming 8% interest per period, a table of present values of 1 can be constructedas follows:
Present value of 1 discounted for 1 period at 8% = 1.0/1.08 = 0.92593
Present value of 1 discounted for 2 periods at 8% = 0.92593/1.08 = 0.85734
Present value of 1 discounted for 3 periods at 8% = 0.85734/1.08 = 0.79383
LOVELY PROFESSIONAL UNIVERSITY 21
Unit 2: Time Value of Money
NotesThe general formula for the present value of 1 is
pv = 1/(1+i)n
The present value on the tables can be constructed from this formula.
!Caution To find out the present value of any future amount, the appropriate factor fromthe table is multiplied by the amount.
Example: Alpha company can invest at 16 per cent compounded annually. Beta companycan invest at 16 per cent compounded semi-annually. Each company will need 2,00,000 fouryears from now. How much must each invest today?
Solution: With annual compounding n=4 and I =16 per cent. With semi-annual compoundingn=8 and i=8 per cent. Using the above formula we find the present value
= 1/(1.16) 4 = 0.55229 × 2,00,000 = 110,458
For Beta Company present value = 2,00,000 × 1/(1.08)4 = 200,000 × 0.54027 = 108,054
Beta company needs to invest less than Alpha Company because its investment grows faster dueto more frequent compounding.
Did u know? The more frequent the compounding the smaller the present value.
Self AssessmentFill in the blanks:
4. Discounting is the opposite of ………………
5. Finding the present value of future receipts involves ……………the future value to thepresent.
6. The more frequent the compounding the …………..the present value.
2.3 Present and Future Value of Annuities
An annuity is a series of equal payments made at equal time intervals, with compounding ordiscounting taking place at the time of each payment. Each annuity payment is called a rent.There are several types of annuities, out of which in an ordinary annuity each rent is paid orreceived at the end of each period.
Notes
There are as many rents as there are periods.
Installment purchases, long-term bonds, pension plans, and capital budgeting allinvolve annuities.
22 LOVELY PROFESSIONAL UNIVERSITY
Financial Management
Notes 2.3.1 Future Value of Annuity of 1If you open a savings account that compounds interest each month, and at the end of each monthyou deposit 100 in the savings account, your deposits are the rents of an annuity. After 1 year,you will have 12 deposits of 100 each, and a total of 1200, but the account will have more than
1200 in it because each deposit earns interest. If the interest rate is 6 per cent a year, compoundedmonthly, your balance is 1233.56. The future value of an annuity or amount of annuity is thesum accumulated in the future from all the rents paid and the interest earned by the rents. Theabbreviation FV is used for the future value of an annuity to differentiate it from the lower casefv used for the future value of 1.
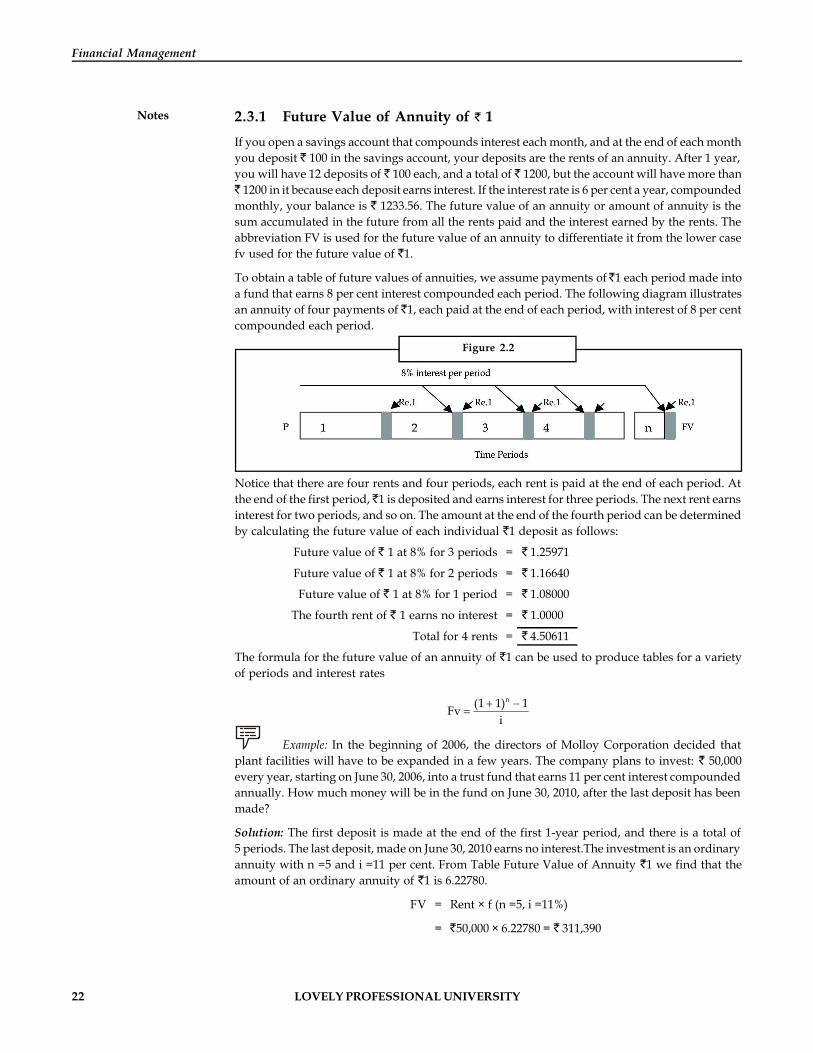
To obtain a table of future values of annuities, we assume payments of 1 each period made intoa fund that earns 8 per cent interest compounded each period. The following diagram illustratesan annuity of four payments of 1, each paid at the end of each period, with interest of 8 per centcompounded each period.
Figure 2.2
Notice that there are four rents and four periods, each rent is paid at the end of each period. Atthe end of the first period, 1 is deposited and earns interest for three periods. The next rent earnsinterest for two periods, and so on. The amount at the end of the fourth period can be determinedby calculating the future value of each individual 1 deposit as follows:
Future value of 1 at 8% for 3 periods = 1.25971
Future value of 1 at 8% for 2 periods = 1.16640
Future value of 1 at 8% for 1 period = 1.08000
The fourth rent of 1 earns no interest = 1.0000
Total for 4 rents = 4.50611
The formula for the future value of an annuity of 1 can be used to produce tables for a varietyof periods and interest rates
+ -=
n(1 1) 1Fvi
Example: In the beginning of 2006, the directors of Molloy Corporation decided thatplant facilities will have to be expanded in a few years. The company plans to invest: 50,000every year, starting on June 30, 2006, into a trust fund that earns 11 per cent interest compoundedannually. How much money will be in the fund on June 30, 2010, after the last deposit has beenmade?
Solution: The first deposit is made at the end of the first 1-year period, and there is a total of5 periods. The last deposit, made on June 30, 2010 earns no interest.The investment is an ordinaryannuity with n =5 and i =11 per cent. From Table Future Value of Annuity 1 we find that theamount of an ordinary annuity of 1 is 6.22780.
FV = Rent × f (n =5, i =11%)
= 50,000 × 6.22780 = 311,390
LOVELY PROFESSIONAL UNIVERSITY 23
Unit 2: Time Value of Money
NotesIf the company needs a total of 3,00,000 on June 30, 2010, how much would it have to depositevery year? Here we have to solve for the rent, given the future value, as follows:
FV = Rent × f (n =5, i =11%)
3,00,000 = Rent × 6.22780
Rent = 3,00,000/6.22780 = 48,171.10
The company has to deposit 48,171 each time in order to accumulate the necessary 3,00,0000by June 30, 2010.
2.3.2 Present Value of Annuity of 1The present value of an annuity is the sum that must be invested today at compound interest inorder to obtain periodic rents over some future time.
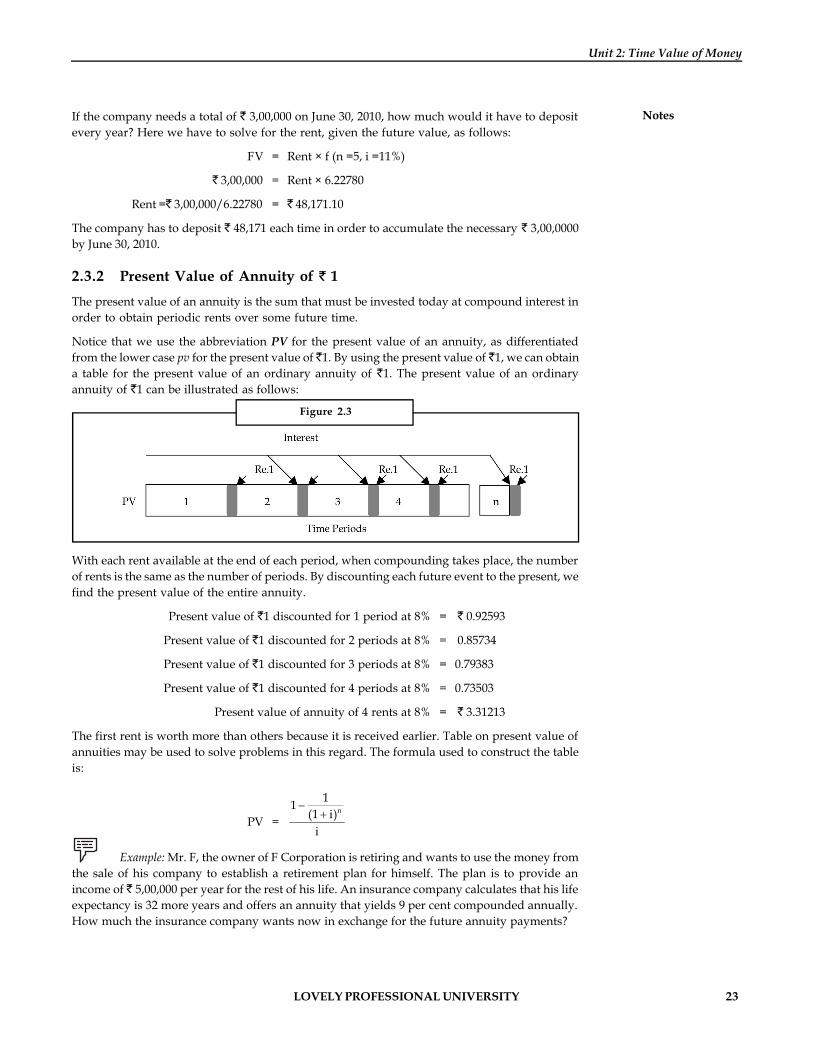
Notice that we use the abbreviation PV for the present value of an annuity, as differentiatedfrom the lower case pv for the present value of 1. By using the present value of 1, we can obtaina table for the present value of an ordinary annuity of 1. The present value of an ordinaryannuity of 1 can be illustrated as follows:
Figure 2.3
With each rent available at the end of each period, when compounding takes place, the numberof rents is the same as the number of periods. By discounting each future event to the present, wefind the present value of the entire annuity.
Present value of 1 discounted for 1 period at 8% = 0.92593
Present value of 1 discounted for 2 periods at 8% = 0.85734
Present value of 1 discounted for 3 periods at 8% = 0.79383
Present value of 1 discounted for 4 periods at 8% = 0.73503
Present value of annuity of 4 rents at 8% = 3.31213
The first rent is worth more than others because it is received earlier. Table on present value ofannuities may be used to solve problems in this regard. The formula used to construct the tableis:
PV =-
+ n11
(1 i)i
Example: Mr. F, the owner of F Corporation is retiring and wants to use the money fromthe sale of his company to establish a retirement plan for himself. The plan is to provide anincome of 5,00,000 per year for the rest of his life. An insurance company calculates that his lifeexpectancy is 32 more years and offers an annuity that yields 9 per cent compounded annually.How much the insurance company wants now in exchange for the future annuity payments?
24 LOVELY PROFESSIONAL UNIVERSITY
Financial Management
Notes Solution: The investment today is the present value of an annuity of 5,00,000 per year, with n=32 and i =9 per cent compounded annually. From the cumulative present value table we findthe factor 10.40624 which is the present value if the rents were 1.
PV = Rent × f (n =32, i =9%)
= 5,00,000 × 10.40624 = 52,03,120
Self AssessmentFill in the blanks:
7. …………..is a series of equal payments made at equal time intervals, with compoundingor discounting taking place at the time of each payment.
8. The …………….of an annuity is the sum that must be invested today at compound interestin order to obtain periodic rents over some future time.
9. The ……………..of an annuity or amount of annuity is the sum accumulated in the futurefrom all the rents paid and the interest earned by the rents.
2.4 PerpetuitiesAn annuity that goes on for ever is called a perpetuity. The present value of a perpetuity of Camount is given by the simple formula: C/i where i is the rate of interest.
This is because as the length of time for which the annuity is received increases, the annuitydiscount factor increases but as length gets very long, this increase in the annuity factor slowsdown.
!Caution as annuity life becomes infinitely long the annuity discount factor approaches anupper limit. Such a limit is 1/i.
Example: Mr. X wishes to find out the present value of investments which yield 500 inperpetuity, discounted at 5%. The appropriate factor can be calculated by dividing 1 by 0.05. Theresulting factor is 20. This is to be multiplied by the annual cash inflow of 500 to get the presentvalue of the perpetuity i.e., 10,000.
Managerial Problems
Many business problems are solved by use of compound interest and present value tables. Forexample, B Corporation is investigating two possible investments. Project A is the purchase ofa mine for 20,00,000 which will give an expected income from sale of ore of 480,000 per yearfor 10 years, after which the property will be sold at an estimated price of 600,000. Project B isthe purchase of an office building that is leased for 15 years. The lease provides annual receiptsof 4,00,000 at the end of the each of the next 4 years, and annual receipts of 4,50,000 for theremaining life of the lease. The purchase price is 20,00,000. B Corporation requires a 20 per centreturn on its investments. Which investment is preferable?
Solution: To evaluate Project A we need to find the present value of the future income stream of 4,80,000 per year for 10 years plus the present value of the future sales price of 6,00,000, both
discounted to the present at the company’s required rate of return of 20 per cent.

LOVELY PROFESSIONAL UNIVERSITY 25
Unit 2: Time Value of Money
NotesPV of annuity of 4,80,000 ( n =10, i =20%) = 480,000 × 4.19247 20,12,386
PV of 6,00,000 at the end of 10 years = 600,000 × 0.16151 96,906
Total present value of Project A cash inflows 21,09,292
The problem can be broken down into two separate annuities, one with receipts of 4,50,000 peryear for 15 years and the other with payments of 50,000 for 4 years. The present value of the twoannuities can be found by computing the present value of 4,50,000 for 15 years at 20 per centminus an annuity of 50,000 for 4 years at 20 per cent.
PV of annuity of 4,50,000 ( n=15, i=20 per cent) = 450,000 × 4.67547 21,03,961
PV of annuity of 50,000 ( n=4, i=20 per cent) = 50,000 × 2.58873 (1,29,437)
Total present value of project B cash inflows 19,74,524
By discounting each project at the company’s required rate of return, we find the Project A
cash inflows have a present value of 12,09,292 and Project B cash inflows have a present valueof 19,74,524. Since the asking price of each project is 20,00,000, project B should not beaccepted. The value of project A is greater than the asking price, therefore the company shouldacquire Project A.
Task Calculate the present value of cash flows of 700 per year for ever (in perpetuity)
1. Assuming an interest rate of 7%
2. Assuming an interest rate of 10%
Self AssessmentFill in the blanks:
10. An annuity that goes on for ever is called a……………...
11. The present value of a perpetuity of C amount is given by the simple formula: C/i wherei is the………………..
12. Many business problems are solved by use of compound interest and ……………….tables.
2.5 Calculation of the Compound Growth RateCompound growth rate can be calculated with the following formula:
gr = Vo(1 + r)n = Vn
where,
gr = Growth rate in percentage.
Vo = Variable for which the growth rate is needed (i.e., sales, revenue, dividend atthe end of year ‘0’).
Vn = Variable value (amount) at the end of year ‘n’.
(1 + r)n = Growth rate.
Illustration:
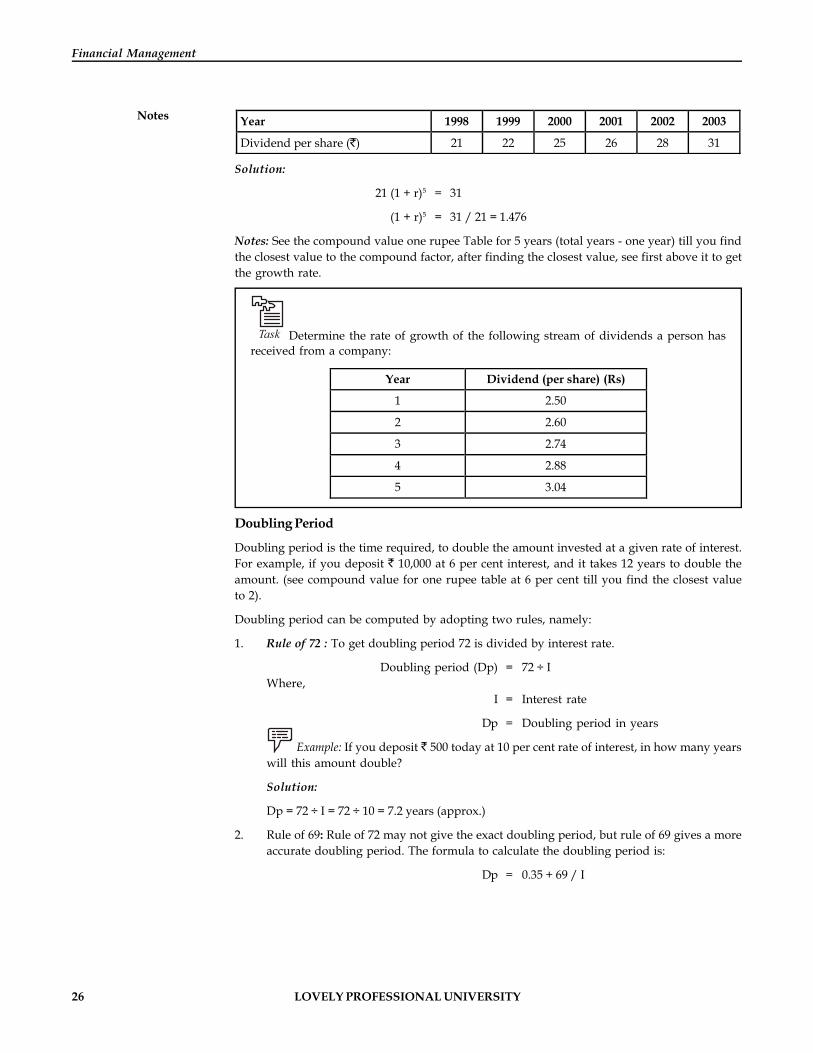
From the following dividend data of a company, calculate compound rate of growth for period(1998-2003).
26 LOVELY PROFESSIONAL UNIVERSITY
Financial Management
Notes Year 1998 1999 2000 2001 2002 2003
Dividend per share ( ) 21 22 25 26 28 31
Solution:
21 (1 + r)5 = 31
(1 + r)5 = 31 / 21 = 1.476
Notes: See the compound value one rupee Table for 5 years (total years - one year) till you findthe closest value to the compound factor, after finding the closest value, see first above it to getthe growth rate.
Task Determine the rate of growth of the following stream of dividends a person hasreceived from a company:
Year Dividend (per share) (Rs)
1 2.50
2 2.60
3 2.74
4 2.88
5 3.04
Doubling Period
Doubling period is the time required, to double the amount invested at a given rate of interest.For example, if you deposit 10,000 at 6 per cent interest, and it takes 12 years to double theamount. (see compound value for one rupee table at 6 per cent till you find the closest valueto 2).
Doubling period can be computed by adopting two rules, namely:
1. Rule of 72 : To get doubling period 72 is divided by interest rate.
Doubling period (Dp) = 72 ÷ IWhere,
I = Interest rate
Dp = Doubling period in years
Example: If you deposit 500 today at 10 per cent rate of interest, in how many yearswill this amount double?
Solution:
Dp = 72 ÷ I = 72 ÷ 10 = 7.2 years (approx.)
2. Rule of 69: Rule of 72 may not give the exact doubling period, but rule of 69 gives a moreaccurate doubling period. The formula to calculate the doubling period is:
Dp = 0.35 + 69 / I
LOVELY PROFESSIONAL UNIVERSITY 27
Unit 2: Time Value of Money
NotesExample: Take the above problem as it is and calculate doubling period.
Solution:Dp = 0.35 + 69 / 10 = 7.25 years.
Effective Rate of Interest in Case of Doubling Period
Sometimes investors may have doubts as to what is the effective interest rate applicable, if afinancial institute pays double amount at the end of a given number of years.
Effective rate of interest can be defined by using the following formula.
(a) In case of rule of 72
ERI = 72 per cent Doubling period (Dp)
where,
ERI = Effective rate of interest.
Dp = Doubling period.
Example: A financial institute has come with an offer to the public, where the institutepays double the amount invested in the institute by the end of 8 years. Mr. A, who isinterested to make a deposit, wants to know the affective rate of interest that will begiven by the institute. Calculate.
Solution:ERI = 72 ÷ Dp = 72 ÷ 8 years = 9 per cent
(b) In case of rule of 69
ERI = +69 0.35Dr
Example: Take the above example:
ERI = +69 0.35
8 years
= 8.98 per cent or 9 per cent
Self AssessmentFill in the blanks:
13. Compound growth rate can be calculated with the formula- …………………
14. To get doubling period 72 is divided by …………rate
15. …………..period is the time required, to double the amount invested at a given rate ofinterest.
Case Study Case: Comparing Mortgage Alternatives
The application of the time value of money principles can help you make decisions onloan alternatives. This exercise requires you to compare three mortgage alternatives
Contd...
28 LOVELY PROFESSIONAL UNIVERSITY
Financial Management
Notes using various combinations and points. Points on a mortgage refer to a payment that ismade upfront to secure the loan. A single point is a payment of one per cent of the amountof the total mortgage loan. If you were borrowing 200,000 a single point would requirean upfront payment of 2,000.
When you are evaluating alternative mortgages, you may be able to obtain a lower rateby making an upfront payment. This comparison will not include an after-tax comparison.When taxes are considered, the effective costs are affected by interest paid and theamortization of points on the loan. This analysis will require you to compare only before-tax costs.
Zeal.com allows you to compare the effective costs on alternative mortgages. You areconsidering three alternatives for a 250,000 mortgage. Assume that the mortgage willstart in December, 2006. The mortgage company is offering you a 6% rate on a 30-yearmortgage with no points. If you pay 1.25 points, they are willing to offer you the mortgageat 5.875%. If you pay 2 points, they are willing to offer you the mortgage at 5.75%.
Questions
1. What are the mortgage payments under the three alternatives?
2. Which alternative has the lowest effective cost?
3. Can you explain how the effective rate is being calculated?
2.6 Summary
The compensation for waiting is the time value of money, called interest. Interest is a feethat is paid for having the use of money
The future value varies with the interest rate, the compounding frequency and the numberof periods.
The general formula for the future value of 1, with n representing the number ofcompounding period is fv = (1 + i)n
Finding the present value of future receipts involves discounting the future value to thepresent. Discounting is the opposite of compounding.
The general formula for the present value of 1 is pv = 1/(1+i)n
An annuity is a series of equal payments made at equal time intervals, with compoundingor discounting taking place at the time of each payment. Each annuity payment is called arent.
The future value of an annuity or amount of annuity is the sum accumulated in the futurefrom all the rents paid and the interest earned by the rents.
The present value of an annuity is the sum that must be invested today at compoundinterest in order to obtain periodic rents over some future time.
An annuity that goes on for ever is called a perpetuity. The present value of a perpetuityof C amount is given by the simple formula: C/i where i is the rate of interest.
Compound growth rate can be calculated with the following formula:
gr = Vo(1 + r)n = Vn
LOVELY PROFESSIONAL UNIVERSITY 29
Unit 2: Time Value of Money
Notes2.7 Keywords
Annuity: It is a stream of equal annual cash flows.
Cash Flow: It is the movement of cash into or out of a business, a project, or a financial product.It is usually measured during a specified, finite period of time
Compound Interest: When interest is added to the principal, so that from that moment on, theinterest that has been added also itself earns interest.
Compound Value: The interest earned on the initial principal becomes a part of the principal atthe end of a compounding period.
Interest: It is a fee paid on borrowed assets. It is the price paid for the use of borrowed money.
Present Value: In case of present value concept, we estimate the present worth of a futurepayment/instalment or series of payment adjusted for the time value of money.
Time Value of Money: Time value of money is that the value of money changes over a period oftime.
2.8 Review Questions
1. “Cash flows of two years in absolute terms are uncomparable” Give reasons in support ofyour answer.
2. Define the following terms and phrases:
(a) Compound sum of an annuity
(b) Present value of a future sum
(c) Present value of an annuity
(d) Annuity
(e) Discount rate
3. What happens to the effective rate of interest as the frequency of compounding is increased?
4. As a financial consultant, will you advise your client to have term deposit in a commercialbank, which pays 8% interest compounded semi-annually or 8% interest compoundedannually? Why?
5. What effects do (i) increasing rate of interest and (2) increasing time periods have on the(a) present value of a future sum and (b) future value of the present sum? Why?
6. Can annuity tables be used for all types of cash flows?
7. For a given interest rate and a given number of years, is the factor for the sum of anannuity larger or smaller than the interest factor for the present value of the annuity?
8. Explain the mechanics of calculating the present value of a mixed stream that includes anannuity.
9. A limited company borrows from a commercial bank 10,00,000 at 12% rate of interest tobe paid in equal end-of-year installments. What would the size of the instalment be?Assume the repayment period is 5 years.
10. If ABC company expects cash inflows from its investment proposal it has undertaken intime zero period, 2,00,000 and 1,50,000 for the first two years respectively and thenexpects annuity payment of 1,00,000 for next eight years, what would be the presentvalue of cash inflows, assuming 10% rate of interest?
30 LOVELY PROFESSIONAL UNIVERSITY
Financial Management
Notes 11. The XYZ company is establishing a sinking fund to retire 5,00,000 8% debentures 10years from today. The company plans to put a fixed amount into the fund each year for 10years. The first payment will be made at the end of current year. The company anticipatesthat the fund will earn 6% a year. What equal annual contributions must be made toaccumulate 5,00,000, 10 years from now.
12. Calculate the price of 10% debentures having face value of 100, to be redeemed after 10years at par and paying interest after every six months, assuming the market rate ofinterest of debentures of similar risk and maturity period is (a) 10%, (b) 12%, (c) 8%
Answers: Self Assessment
1. interest 2. accumulated interest
3. compounding 4. compounding
5. discounting 6. smaller
7. Annuity 8. present value
9. future value 10. perpetuity
11. rate of interest 12. present value
13. gr = Vo(1 + r)n = Vn 14. interest
15. Doubling
2.9 Further Readings
Books Dr Pradeep Kumar Sinha, Financial Management, New Delhi, Excel Books, 2009.
Van Horne, J.C. and Wachowicz, Jr, J.M., Fundamentals of Financial Management,New Delhi, Prentice Hall of India Pvt. Ltd., 1996, p. 2.
Chandra, P., Financial Management—Theory and Practice, New Delhi, Tata McGrawHill Publishing Company Ltd., 2002, p. 3.
LOVELY PROFESSIONAL UNIVERSITY 31
Unit 3: Sources of Finance
NotesUnit 3: Sources of Finance
CONTENTS
Objectives
Introduction
3.1 Financial Needs and Sources of Finance of a Business
3.2 Long-term Sources of Finance
3.2.1 Owners’ Capital or Equity
3.2.2 Preference Share Capital
3.2.3 Debentures or Bonds
3.2.4 Types of Debentures
3.2.5 New Financial Instruments
3.2.6 Loans from Financial Institutions
3.2.7 Internal Accruals
3.3 Issue of Securities
3.3.1 Public Issue
3.3.2 Rights Issue
3.3.3 Private Placement
3.3.4 Bought out Deals
3.3.5 Euro Issues
3.4 Sources of Short-term Finance
3.4.1 Trade Credit
3.4.2 Bridge Finance
3.4.3 Loans from Commercial Banks
3.4.4 Commercial Papers (CPs)
3.4.5 Inter-corporate Deposits (ICDs)
3.5 Venture Capital Financing
3.6 Leasing and Hire Purchase as a Source of Finance
3.7 Deferred Credit
3.7.1 Capital Assistance Seed
3.7.2 Government Subsidies
3.7.3 Sales Tax Deferments and Exemptions
3.8 Summary
3.9 Keywords
3.10 Review Questions
3.11 Further Readings
32 LOVELY PROFESSIONAL UNIVERSITY
Financial Management
Notes Objectives
After studying this unit, you will be able to:
Identify the different long-term sources of finance
Explain the different short-term sources of finance
Describe leasing as a source of finance
Discuss various significant aspects related to venture capital finance
IntroductionOne of the most important element for an entrepreneur or company implementing a newproject or undertake expansion, diversification, modernization and rehabilitation scheme isworking out the cost of project and the means of finance. There are several sources of finance/funds available to any company. Among the various sources of funds available to a company aneffective mechanism is required to evaluate risk, tenure and cost of each and every source offund. The selection of the fund source is dependent on the financial strategy pursued by thecompany, the leverage planned by the company, the financial conditions prevalent in theeconomy and the risk profile of both viz., the company as well as the industry in which thecompany operates. Each and every source of funds has some merits and demerits.
3.1 Financial Needs and Sources of Finance of a BusinessFinancial needs of a business: The financial needs of a business may be grouped into followingthree categories:
1. Long-term financial needs: Such needs generally refer to funds for a period exceeding 5 –10 years. All investments in plant, machinery, land, buildings, etc., are considered as long-term financial needs. Funds required to finance permanent or hard-core working capitalshould also be procured from long-term sources.
2. Medium-term financial needs: Such requirements refer to funds for a period exceeding oneyear but not exceeding 5 years. For example, if a company as part of strategy goes forextensive publicity and advertisement campaign then such type of expenses, may bewritten off over a period of 3 to 5 years. These are called deferred revenue expenses andfunds required for them are classified in the category of medium term financial needs.Sometimes, long-term requirements, for which long-term funds cannot be arrangedimmediately, may be met from medium-term sources and thus the demand of medium-term finance is generated. As and when the desired long-term funds are made available,medium-term loans taken earlier may be paid off.
3. Short-term financial needs: To finance current assets such as stock, debtors, cash, etc.,investment in these assets is known as meeting of working capital requirements of theconcern. Firms require working capital to employ fixed assets gainfully. The requirementof working capital depends upon a number of factors, which may differ from industry toindustry and from company to company in the same industry. The main characteristic ofshort-term financial needs is that they arise for a short period of time, not exceeding theaccounting period i.e., one year.
The basic principle for meeting the short-term financial needs of a concern is that such needsshould be met from short-term sources, and for medium-term financial needs from medium-term sources and long-term financial needs from long-term sources. Accordingly, the method ofraising funds is to be decided with reference to the period for which funds are required. Basically,there are two sources of raising funds for any business enterprise viz., owner’s capital and
LOVELY PROFESSIONAL UNIVERSITY 33
Unit 3: Sources of Finance
Notesborrowed capital. The owner’s capital is used for meeting long-term financial needs and itprimarily comes from share capital and retained earnings. Borrowed capital for all the othertypes of requirement can be raised from different sources such as debentures, public deposits,loans from financial institutions and commercial banks, etc.
The following section shows at a glance the different sources from where the three aforesaidtypes of finance can be raised in India.
Sources of Finance of a Business
1. Long-term
(a) Share capital or equity share
(b) Preference shares
(c) Retained earnings
(d) Debentures/Bonds of different types
(e) Loans from financial institutions
(f) Loans from State Financial Corporation
(g) Loans from commercial banks
(h) Venture capital funding
(i) Asset securitisation
(j) International financing like Euro-issues, foreign currency loans
2. Medium-term
(a) Preference shares
(b) Debentures/Bonds
(c) Public deposits/fixed deposits for a duration of three years
(d) Commercial banks
(e) Financial institutions
(f) State financial corporations
(g) Lease financing/hire purchase financing
(h) External commercial borrowings
(i) Euro issues
(j) Foreign currency bonds
3. Short-term
(a) Trade credit
(b) Commercial banks
(c) Fixed deposits for a period of 1 year or less
(d) Advances received from customers
(e) Various short-term provisions
34 LOVELY PROFESSIONAL UNIVERSITY
Financial Management
Notes It is evident from the above section that funds can be raised from the same source for meetingdifferent types of financial requirements.
Notes Financial sources of a business can also be classified as follows by using differentbasis:
1. According to period:
(a) Long-term sources
(b) Medium-term sources
(c) Short-term sources
2. According to ownership:
(a) Owner’s capital or equity capital, retained earnings, etc.
(b) Borrowed capital such as debentures, public deposits, loans, etc.
3. According to source of generation:
(a) Internal sources e.g., retained earnings and depreciation funds, etc.
(b) External sources e.g., debentures, loans, etc.
However for the sake of convenience, the different sources of funds can also be classifiedinto following categories:
1. Security financing – financing through shares and debentures
2. Internal financing – financing through retained earning, depreciation
3. Loans financing – this includes both short-term and long-term loans
4. International financing
5. Other sources
Self Assessment
Fill in the blanks:
1. Long-term financial needs generally refer to funds for a period exceeding …………..years.
2. Investment in …………….financial assets is known as meeting of working capitalrequirements of the concern.
3.2 Long-term Sources of Finance
There are different sources of funds available to meet long-term financial needs of the business.These sources may be broadly classified into share capital (both equity and preference) and debt(including debentures, long-term borrowings or other debt instruments). In recent times inIndia, many companies have raised long-term finance by offering various instruments to publiclike deep discount bonds, fully convertible debentures, etc. These new instruments havecharacteristics of both equity and debt and it is difficult to categorize these either as debt orequity. The different sources of long-term finance can now be discussed.
LOVELY PROFESSIONAL UNIVERSITY 35
Unit 3: Sources of Finance
Notes3.2.1 Owners’ Capital or EquityA public limited company may raise funds from promoters or from the investing public by wayof owners’ capital or equity capital by issuing ordinary equity shares. Ordinary shareholdersare owners of the company and they undertake the risks inherent in business. They elect thedirectors to run the company and have the optimum control over the management of thecompany. Since equity shares can be paid off only in the event of liquidation, this source has theleast risk involved. This is more so due to the fact that equity shareholders can be paid dividendsonly when there are distributable profits. However, the cost of ordinary shares is usually thehighest. This is due to the fact that such shareholders expect a higher rate of return on theirinvestment as compared to other suppliers of long-term funds. Further, the dividend payable onshares is an appropriation of profits and not a charge against profits. This means that it has to bepaid only out of profits after tax.
Ordinary share capital also provides a security to other suppliers of funds. Thus, a companyhaving substantial ordinary share capital may find it easier to raise further funds, in view of thefact that share capital provides a security to other suppliers of funds.
Did u know? What are the governing acts for share capital?
The Companies Act, 1956 and SEBI Guidelines for disclosure and investors’ protectionsand the clarifications there to lay down a number of provisions regarding the issue andmanagement of equity shares capital.
Advantages of raising funds by issue of equity shares are:
1. It is a permanent source of finance.
2. The issue of new equity shares increases flexibility of the company.
3. The company can make further issue of share capital by making a right issue.
4. There are no mandatory payments to shareholders of equity shares.
3.2.2 Preference Share CapitalThese are a special kind of shares, the holders of such shares enjoy priority, both as regards to thepayment of a fixed amount of dividend and repayment of capital on winding up of the company.
Long-term funds from preference shares can be raised through a public issue of shares. Suchshares are normally cumulative i.e., the dividend payable in a year of loss gets carried over tothe next year till there is an adequate profit to pay the cumulative dividends. The rate of dividendon preference shares is normally higher than the rate of interest on debentures, loans, etc. Mostof preference shares these days carry a stipulation of period and the funds have to be repaid atthe end of a stipulated period.
Preference share capital is a hybrid form of financing that partakes some characteristics ofequity capital and some attributes of debt capital. It is similar to equity because preferencedividend, like equity dividend is not a tax-deductible payment. It resembles debt capital becausethe rate of preference dividend is fixed. Typically, when preference dividend is skipped it ispayable in future because of the cumulative feature associated with most of preference shares.
Cumulative Convertible Preference Shares (CCPS) may also be offered, under which the shareswould carry a cumulative dividend of specified limit for a period of say three years, after which theshares are converted into equity shares. These shares are attractive for projects with a long gestationperiod. For normal preference shares, the maximum permissible rate of dividend is 14%.
36 LOVELY PROFESSIONAL UNIVERSITY
Financial Management
Notes Preference share capital may be redeemed at a predefined future date or at an earlier stage interalia out of the profits of the company. This enables the promoters to withdraw their capital fromthe company, which is now self-sufficient, and the withdrawn capital may be reinvested in otherprofitable ventures. It may be mentioned that irredeemable preference shares cannot be issuedby any company.
Notes Preference shares have gained importance after the Finance Bill 1997 as dividendsbecame tax exempted in the hands of the individual investor and are taxable in the handsof the company as tax is imposed on distributed profits at a flat rate. The Budget for 2000–01 has doubled the dividend tax from 10% to 20% besides a surcharge of 10%. The Budgetfor 2001-2002 has reduced the dividend tax from 20% to 10%. Many companies raised fundsduring1997 through this route especially through private placement or preference shares,as the capital markets were not vibrant.
The advantages of taking the preference share capital route are:
1. No dilution in EPS on enlarged capital base – if equity is issued it reduces EPS, thusaffecting the market perception about the company.
2. There is leveraging advantage as it bears a fixed charge.
3. There is no risk of takeover.
4. There is no dilution of managerial control.
5. Preference capital can be redeemed after a specified period.
3.2.3 Debentures or BondsLoans can be raised from public by issuing debentures or funds by public limited companies.Debentures are normally issued in different denominations ranging from 100 to 1,000 andcarry different rates of interest. By issuing debentures, a company can raise long-term loansfrom public. Normally, debentures are issued on the basis of a debenture trust deed, which listthe terms and conditions on which the debentures are floated. Debentures are normally securedagainst the assets of the company.
As compared with preference shares, debentures provide a more convenient mode of long-termfunds. The cost of capital raised through debentures is quite low since the interest payable ondebentures can be charged as an expense before tax. From the investors’ point of view, debenturesoffer a more attractive prospect than the preference shares since interest on debentures is payablewhether or not the company makes profits.
Debentures are, thus, instruments for raising long-term debt capital. Secured debentures areprotected by a charge on the assets of the company. While the secured debentures of a well-established company may be attractive to investors, secured debentures of a new company donot normally evoke same interest in the investing public.
Advantages of raising finance by issue of debentures are:
1. The cost of debentures is much lower than the cost of preference or equity capital as theinterest is tax deductible. Also, investors consider debenture investment safer than equityor preferred investment and, hence, may require a lower return on debenture investment.
2. Debenture financing does not result in dilution of control.
3. In a period of rising prices, debenture issue is advantageous. The fixed monetary outgodecreases in real terms as the price level increases.

LOVELY PROFESSIONAL UNIVERSITY 37
Unit 3: Sources of Finance
NotesThe disadvantages of debenture financing are:
1. The protective covenants associated with a debenture issue may be restrictive
2. Debenture financing enhances the financial risk associated with the firm.
These days, many companies are issuing convertible debentures or bonds with a number ofschemes/incentives like warrants/options etc. These bonds or debentures are exchangeable atthe option of the holder for ordinary shares under specified terms and conditions. Thus, for thefirst few years these securities remain as debentures and later they can be converted into equityshares at a predetermined conversion price. The issue of convertible debentures has distinctadvantages from the point of view of the issuing company. Firstly, such as issue enables themanagement to raise equity capital indirectly without diluting the equity holding, until thecapital raised has started earning an added return to support the additional shares. Secondly,such securities can be issued even when the equity market is not very good. Thirdly, convertiblebonds are normally unsecured and, therefore, their issuance may ordinarily not impair theborrowing capacity. These debentures/bonds are issued subject to the SEBI guidelines notifiedfrom time to time.
Public issue of debentures and private placement to mutual funds now require that the issue berated by a Credit Rating Agency Like CRISIL (Credit Rating and Information Services at IndiaLtd.). The credit rating is given after evaluating factors like track record of the company,profitability, debt servicing capacity, credit worthiness and perceived risk of lending.
!Caution Debenture interest and capital repayment are obligatory payments.
3.2.4 Types of DebenturesDebentures can be classified based on security against which it is placed and whether convertibleinto shares or not.
Non-Convertible Debentures (NCDs)
These debentures cannot be convertible into equity shares and will be redeemed at the end ofthe maturity period.
Example:ICICI offered for public subscription for cash at par 20,00,000, 16% unsecuredredeemable bonds (Debentures) of 1000 each. These bonds are fully non-convertible (i.e., theinvestor is not given the option of converting into equity shares); interest payable half yearly onJune 30 and December 31, to be redeemed (paid back) on the expiry of 5 years from the date ofallotment. But ICICI has also allowed the investors, the option of requesting the company toredeem all or part of the bonds held by them on the expiry of 3 years from the date of allotment,provided the bond holders give the prescribed notice to the company.
Fully Convertible Debentures (FCDs)
These debentures will be converted into equity shares either fully at one stroke or in instalments.The debentures may or may not carry interest till the date of conversion. The conversion will beat a premium either fixed before hand or as per some formula. FCDs are very attractive to theinvestors as their bonds are converted into equity shares at a price, which actually in the marketmay be much higher.
38 LOVELY PROFESSIONAL UNIVERSITY
Financial Management
NotesExample: Let us look at the Jindal issue:
The total issue was 301,72,080 secured zero interest fully convertible debentures. Of these129,30,000 FCDs of 60 each were offered to the existing shareholders of the company as rightbasis in the ratio of one FCD for every one fully paid equal share held as on 30 th March of theyear. The balance of 172,42,080 secured zero interest, FCD’s were offered to the public at parvalue of 100 each.
The terms of conversion were: Each fully paid FCD’s will be compulsorily converted into oneequity shares of 10 each at a premium of 90 per share, credited as fully paid up, at the end of12 months from the date of investment.
Partly Convertible Debentures (PCDs)
These are debentures or bonds, a portion of which will be converted into equity share capitalafter a specified period, whereas the non-convertible part (NCD) of PCD will be redeemed asper terms of the issue after the maturity period. The non-convertible portion of the PCD willcarry interest upto redemption whereas the interest on the convertible portion will be only uptothe date immediately preceding the date of conversion.
Normally, PCDs carry a lower rate of interest (coupon) as compared to NCDs.
This is a kind of NCD with an attached warrant that gives the holder the right for allotment ofequity shares through cash payment. This right has to be exercised between certain time frameafter allotment, by which time the SPN will be fully paid up.
3.2.5 New Financial Instruments Non-voting shares: Useful for companies to increase net worth without losing management
control. These stocks are similar in every respect to equity, the sole exception being theabsence of voting rights.
Detachable equity warrants: This gives the holder the right to purchase a certain numberof shares (equity) at a specified price over a certain period of time (of course holders ofwarrants earn no income from them, till the option is exercised or warrants are sold).Warrants are often attached to debt issues as ‘sweetener’. When a firm makes a large bondissue the attachment of stock purchase warrants may add to the marketability of the issueand lower the required interest rate. A sweetener’s warrants are similar to conversionfeatures often when a new firm is raising its initial capital suppliers of debt will requirewarrants to permit them to participate in whatever success the firm achieves. In addition,established companies, offer warrants to debts to compensate for risk and thereby lowerthe interest rate/and/or provide for fewer restrictive covenants.
Participating debentures: These are unsecured corporate debt securities that participate inthe profits of the company. Potential issuers are existing dividend paying companiescould appeal to investors willing to take risk for higher returns.
Participating preference shares: Quasi equity instrument to bolster net worth without lossof management control payouts linked to equity dividend and also eligible for bonus willappeal to investors who are willing to take low risk.
Convertible debentures with options: A derivative of the convertible debentures, with anembedded option, providing flexibility to the issues as well as the investor to exit fromthe terms of the issue. The coupon rate is specified at the time of issue.
Third party convertible debenture: Debt with a warrant allowing the investor to subscribeto the equity of a third firm at a preferential price vis-à-vis the market price. Interest ratehere is lower than pure debt on account of the conversion option.

LOVELY PROFESSIONAL UNIVERSITY 39
Unit 3: Sources of Finance
Notes Mortgage backed securities: An instrument, otherwise known as the Asset Backed SecurityABS), for securitization of debt. An ABS is backed by pooled assets like mortgages, creditcard receivables and the like.
Convertible debentures redeemable at premium: Convertible debenture issued at face valuewith a ‘put’ option entitling investors to sell the bond later to the issuer at a premium. Itserves a similar purpose as that of convertible debt, but risks to investors are lower.
Debt equity swaps: An offer from the issue of debt to convert (swap) it for common share.The risk may dilute earnings per share in the case of the issues, the expect capital appreciationmay not materialize in the case of investor.
Zero coupon convertible note: A Zero Coupon Convertible Note (ZCCN) converts intocommon shares. If investors choose to convert, they forego all accrued and unpaid interest.The risk ZCCN prices are sensitive to interest rates.
Did u know? What are floating rate bonds?
The bonds in which the interest rate is not fixed and is allowed to float depending upon themarket conditions. This has become very popular as a money market investment.
3.2.6 Loans from Financial InstitutionsIn India, specialized institutions provide long-term financial assistance to industry. Thus, theIndustrial Finance Corporation of India, the State Financial Corporations, the Life InsuranceCorporation of India, the National Small Industries Corporation Limited, the Industrial Creditand Investment Corporation, the Industrial Development Bank of India and the IndustrialReconstruction Corporation of India provide term loans to companies. Before a term loan issanctioned, a company has to satisfy the concerned financial institution regarding the technical,commercial, economic, financial and managerial viability of the project for which the loan isrequired. Such loans are available at different rates of interest under different schemes of financialinstitutions and are to be repaid according to a stipulated repayment schedule.
Term loans represent secured borrowings and at present it is the most important source offinance for new projects. They generally carry a rate of interest inclusive of interest tax, dependingon the credit rating of the borrower, the perceived risk of lending and the cost of funds. Theseloans are generally repayable over a period of 6 to 10 years in annual, semi-annual or quarterlyinstallments.
Term loans are also provided by banks. State financial/development institutions and all-Indiaterm lending financial institutions. Banks and State Financial Corporations normally provideterm loans to projects in the small scale sector, while for the medium and large industries, termloans are provided by state developmental institutions alone or in consortium with banks andState-Financial Corporations. For large scale projects all-India financial institutions provide thebulk of term finance either singly or in consortium with other all-India financial institutions,state level institutions and/or banks.
After Independence, the institutional setup in India for the provision of medium and long-termcredit for industry has been broadened. The assistance sanctioned and disbursed by thesespecialized institutions has increased impressively over the years. A number of specializedinstitutions have been established all over the country.
!Caution The loans in many cases stipulate a number of conditions regarding themanagement and certain other financial policies of the company.
40 LOVELY PROFESSIONAL UNIVERSITY
Financial Management
Notes 3.2.7 Internal AccrualsThis basically means what is being ploughed back in business i.e., retained earnings and thedepreciation charge. While depreciation is used for replacing an old machinery, etc., retainedearnings can be used, for finding other long-term requirements of the business. The majoradvantage of using this as a source of long-term finance are its easy availability, elimination ofissue expenses and avoiding the problem of dilution of control (with equity source of fund). Thedisadvantage of this source is limited funds from this source, plus foregoing of dividendsreceipts may lead to higher opportunity costs for the firm.
Task Which of the following do you think is costliest of long-term sources of finance?Give reasons to support your answer.
1. Preference Share Capital
2. Retained Earnings
3. Equity Share Capital
4. Debentures
5. Capital raised through private placement.
Self AssessmentFill in the blanks:
3. Ordinary shareholders are owners of the company and they undertake the ……….inherentin business.
4. Long-term funds from preference shares can be raised through a ……………..of shares.
5. A Zero Coupon Convertible Note (ZCCN) converts into………………...
3.3 Issue of Securities
A firm can raise capital from the primary market (both domestic and foreign) by using securitiesin the following ways:
Public issue
Rights issue
Private placement
Bought out deals
Euro issues
The apex body regulating the Indian securities market and the companies raising finance fromit is the Securities and Exchange Board of India (SEBI). After the repeal of Capital Issues ControlAct, 1947 in May 1992, SEBI was given the statutory powers to regulate the securities market.
3.3.1 Public IssueCompanies issue securities in the public in the primary market and get them listed in the stockexchange. The major activities in making a public issue of securities are as below:
The firm should appoint a SEBI registered category I Merchant Banker to manage theissues. The lead manager will be responsible for all the pre and post issue activities,

LOVELY PROFESSIONAL UNIVERSITY 41
Unit 3: Sources of Finance
Notesliaison with the other intermediaries, and statutory bodies like SEBI, Stock Exchange andthe Register of Companies (ROC) and finally ensure that securities are listed on the StockExchange.
The other intermediaries involved in the public issue of securities are underwriters,registrars, and bankers to the issues, brokers and advertising agencies. It also involvespromotion of the issue, printing and dispatch of prospectus and application form, obtainingstatutory clearances, filing the initial listing application, final allotment and refundactivities. The cost of issue ranges between 12 – 15% of the issue size and may go up to 20%in adverse market conditions.
3.3.2 Rights IssueAs per Section 81 of the Companies Act, 1956, when a firm issues additional equity capital it hasto first offer such securities to the existing shareholders in a prorate basis. The company mustgive notice of maximum 14 days to each of the equity shareholders giving him the option to takethe shares offered to him by the company against payment of specified money per share. Theshareholder unless the articles otherwise provide, have the right to renounce the offer, in wholeor in part, in favour of some others who need not be a member of the company. The cost offloating right issue is comparatively less than the public issue. Since marketing costs and otherpublic issue expenses are avoided as the offer is made to the existing shareholders. The rightsissue is also priced lower than the public issue.
3.3.3 Private PlacementThe private placement method involves direct selling of securities to a limited number ofinstitutional or high net worth investors. This avoids delay involved in going public and alsoreduces the expenses involved in public issue. The company appoints a merchant banker tonetwork with the institutional investor and negotiate the price of the issue. The major advantagesof private placement securities are:
Easy access to any company
Fewer procedural formalities
Access to funds is faster
Lower cost involved in issues
Securities can be custom-tailored for firms with special problems or opportunities.
3.3.4 Bought out DealsBought out is a process whereby a investor or group of investors buy out a significant portion ofthe equity of an unlisted company with a view to sell the same to public within an agreed timeframe. The company places the equity shares, to be offered to the public with a sponsor or theMerchant Banker. At the right time, the shares are off loaded to the public through the OTCE Iroute or by way of public issue and the funds reach the company without much delay. Further,it affords greater flexibility in terms of issue and matters relating to offloading. Major advantagesof entering into a bought out deal are:
Companies both existing and new, which do not satisfy conditions laid down by SEBI forpremium issues, may issue at a premium through this route.
The procedural complexities are reduced, and funds reach faster upfront. Added to thisthere is significant reduction in issue cost.
An advantage accruing to the investor is that the issue price reflects the company’s intrinsicvalue.

42 LOVELY PROFESSIONAL UNIVERSITY
Financial Management
Notes
Task A company is in dire need for funds but lost the confidence of its shareholders dueto the inadequate return on investments. Which of the following methods is/are suitableto that company to raise funds? Why.
1. Public issue
2. Rights issue
3. Private placement
4. Bought out deals
3.3.5 Euro Issues
The Government of India as a part of liberalization and de-regulation of industry and to augmentthe financial resources of Indian companies, has allowed the companies to directly tap foreignresources for their requirements. The liberalized measures have boosted the confidence offoreign investors and also provided an opportunity to Indian companies to explore the possibilityof tapping the European Market for their financial requirements. Where the resources are raisedthrough the mechanism of EURO ISSUES i.e., Global Depository Receipts (GDRs), ForeignCurrency Convertible Bonds (FCCB) and pure debt bonds. These investments are issued abroadand listed and traded as a foreign stock exchange. Once they are converted into equity, theunderlying shares are listed and traded on the domestic exchange.
GDRs are created when the rising company delivers ordinary shares issued in the name ofoverseas depository bank (depository) to the domestic custodian bank (who is an agent of thedepository) against which the depository issues GDRs representing the underlying equity sharesto the foreign investors. The physical possession of the shares remains with the depository andthe respective foreign investors obtain GDRs from the depository evidencing their holding. Themain advantage of the issue is that there is an inflow of foreign exchange through the proceedsof the issue whereas the dividend outflow is in Indian rupees. The Department of EconomicAffairs, Ministry of Finance has given detailed Guidelines Regarding Issue of GD GDRs can betreated freely among non-resident investors like any other dollar-dominated security either ona foreign exchange market or in the OTC market.
Foreign currency convertible bond is an equity-linked unsecured debt instrument carrying afixed rate of interest and an option of conversion into fixed number of equity shares or GDRs ofthe issuer company. However, the option to retain FCCB as a bond also exists. As a bond, theissuer has the responsibility to repay the principal amount and make the specified interestpayment for the given period. These bonds are listed and traded on one or more such exchangesabroad till conversion interest and well as redemption is paid in dollars or freely convertiblecurrency.
Self AssessmentFill in the blanks:
6. The private placement method involves …………selling of securities to a limited numberof institutional or high net worth investors.
7. Foreign currency convertible bond is an equity-linked unsecured ………..instrumentcarrying a fixed rate of interest.

LOVELY PROFESSIONAL UNIVERSITY 43
Unit 3: Sources of Finance
Notes3.4 Sources of Short-term Finance
3.4.1 Trade CreditTrade credit refers to the credit extended by the supplier of goods or services to his/her customerin the normal course of business. Trade credit occupies very important position in short-termfinancing due to the competition. Almost all the traders and manufacturers are required toextend credit facility (a portion), without which there is no possibility of staying back in thebusiness. Trade credit is a spontaneous source of finance that arises in the normal businesstransactions of the firm without specific negotiations (automatic source of finance). In order toget this source of finance, the buyer should have acceptable and dependable credit worthinessand reputation in the market. Trade credit generally extended in the format open account orbills of exchange. Open account is the form of trade credit, where supplier sends goods to thebuyer for the payment to be received in future as per terms of the sales invoice. As such tradecredit constitutes a very important source of finance; it represents 25 per cent to 50 per cent of thetotal short-term sources for financing working capital requirements.
Getting trade credit may be easy to the well-established or well-reputed firm, but for a new orthe firm with financial problems will generally face problem in getting trade credit. Generallysuppliers look for earning record, liquidity position and payment record which is extendingcredit. Building confidence in suppliers is possible only when the buyer discussing his/herfinancial condition future plans and payment record. Trade credit involves some benefits andcosts.
Advantages of Trade Credit
The main advantages are:
1. Easy availability when compared to other sources of finance (except financially weakcompanies).
2. Flexibility is another benefit, as the credit increases with the growth of the firm’s sales.
3. Informality as we have already seen that it is an automatic finance.
The above discussion on trade credit reveals two things. One, cost of trade credit is very highbeyond the cash discount period, company should not have cash discount for prompt paymentand second, if the company is not able to avail cash discount it should pay only at the end oflast day of credit period, even if it can delay by one or two days, it does not affect the creditstanding.
3.4.2 Bridge Finance
Bridge finance refers to loans taken by a company normally from commercial banks for a shortperiod, pending disbursement of loans sanctioned by financial institutions. Normally, it takestime for financial institutions to disburse loans to companies. However, once the loans areapproved by the term lending institutions, companies, in order not to lose further time instarting their projects, arrange short-term loans from commercial banks. Bridge loans are alsoprovided by financial institutions pending the signing of regular term loan agreement, whichmay be delayed due to non-compliance of conditions stipulated by the institutions whilesanctioning the loan. The bridge loans are repaid/adjusted out of the term loans as and whendisbursed by the concerned institutions. Bridge loans are normally secured by hypothecatingmovable assets, personal guarantees and demand promissory notes. Generally, the rate of intereston bridge finance is higher as compared with that on term loans.
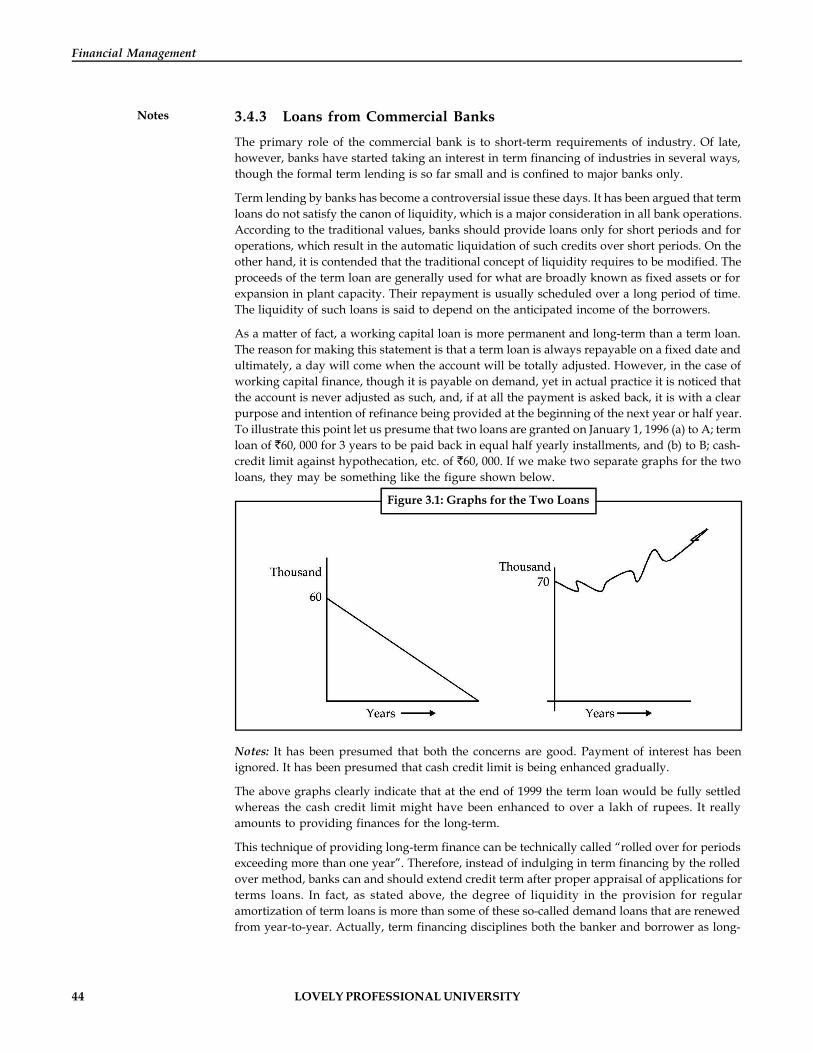
44 LOVELY PROFESSIONAL UNIVERSITY
Financial Management
Notes 3.4.3 Loans from Commercial BanksThe primary role of the commercial bank is to short-term requirements of industry. Of late,however, banks have started taking an interest in term financing of industries in several ways,though the formal term lending is so far small and is confined to major banks only.
Term lending by banks has become a controversial issue these days. It has been argued that termloans do not satisfy the canon of liquidity, which is a major consideration in all bank operations.According to the traditional values, banks should provide loans only for short periods and foroperations, which result in the automatic liquidation of such credits over short periods. On theother hand, it is contended that the traditional concept of liquidity requires to be modified. Theproceeds of the term loan are generally used for what are broadly known as fixed assets or forexpansion in plant capacity. Their repayment is usually scheduled over a long period of time.The liquidity of such loans is said to depend on the anticipated income of the borrowers.
As a matter of fact, a working capital loan is more permanent and long-term than a term loan.The reason for making this statement is that a term loan is always repayable on a fixed date andultimately, a day will come when the account will be totally adjusted. However, in the case ofworking capital finance, though it is payable on demand, yet in actual practice it is noticed thatthe account is never adjusted as such, and, if at all the payment is asked back, it is with a clearpurpose and intention of refinance being provided at the beginning of the next year or half year.To illustrate this point let us presume that two loans are granted on January 1, 1996 (a) to A; termloan of 60, 000 for 3 years to be paid back in equal half yearly installments, and (b) to B; cash-credit limit against hypothecation, etc. of 60, 000. If we make two separate graphs for the twoloans, they may be something like the figure shown below.
Figure 3.1: Graphs for the Two Loans
Notes: It has been presumed that both the concerns are good. Payment of interest has beenignored. It has been presumed that cash credit limit is being enhanced gradually.
The above graphs clearly indicate that at the end of 1999 the term loan would be fully settledwhereas the cash credit limit might have been enhanced to over a lakh of rupees. It reallyamounts to providing finances for the long-term.
This technique of providing long-term finance can be technically called “rolled over for periodsexceeding more than one year”. Therefore, instead of indulging in term financing by the rolledover method, banks can and should extend credit term after proper appraisal of applications forterms loans. In fact, as stated above, the degree of liquidity in the provision for regularamortization of term loans is more than some of these so-called demand loans that are renewedfrom year-to-year. Actually, term financing disciplines both the banker and borrower as long-
LOVELY PROFESSIONAL UNIVERSITY 45
Unit 3: Sources of Finance
Notesterm planning is required to ensure that cash inflow would be adequate to meet the instrumentsof repayments and allow an active turnover of bank loans. The adoption of the formal term loanlending by commercial banks will not in any way hamper the criteria of liquidity and as amatter of fact, it will introduce flexibility in the operations of the banking system.
The real limitation to the scope of bank activities in this field is that all banks are not wellequipped to make appraisal of such loan proposals. Term loan proposals involve an element ofrisk because of changes in the conditions affecting the borrower. The bank making such a loan,therefore, has to assess the situation to make a proper appraisal. The decision in such caseswould depend on various factors affecting the conditions of the industry concerned and theearning potential the borrower.
3.4.4 Commercial Papers (CPs)Commercial paper represents a short-term unsecured promissory note issued by firms thathave a fairly high credit (standing) rating. It was first introduced in USA and it was an importantmoney market instruments. In India, Reserve Bank of India introduced CP on therecommendations of the Vaghul Working Group on money market. CP is a source of short-termfinance to only large firms with sound financial position.
Features of CP
1. The maturity period of CP ranges from 15 to 365 day (but in India it ranges between 91 to180 days).
2. It is sold at a discount from its face value and redeemed at its face value.
3. Return on CP is the difference between par value and redeemable value.
4. It may be sold directly to investors or indirectly (through) dealers.
5. There is no developed secondary market for CP.
Eligibility Criteria for Issuing CP
CP is unsecured promissory note, the issue of CP is being regulated by the Reserve Bank ofIndia. RBI has laid down the following conditions to determine the eligibility of a company thatwishes to raise funds through the issue of CPs.
1. The Tangible Net worth (TNW) of the company, as per latest audited balance sheet shouldnot be less than 4 crore.
2. The company should have been sanctioned as a fund based limit for bank(s) finance and/or the All India Financial Institutions.
3. Company can issue CPs amounting to 75% of the permitted bank (working capital limit)credit.
4. Company’s CPs receives a minimum rating of (P2 from CRISIL, A-2 form ICRA, etc.).
5. The minimum size of each CP is 5 lakhs or multiples thereof.
6. The size of any single issue should not be less than 1 crore.
7. The CP is in the form of usance promissory note negotiable by endorsement and delivery.
Advantages of CP
1. It is an alternative source of finance and proves to be helpful during the period of tightbank credit.
2. It is a cheaper source of short-term finance when compared to the bank credit.

46 LOVELY PROFESSIONAL UNIVERSITY
Financial Management
Notes Disadvantages of CP
It is available only for large and financially sound companies.
!Caution Commercial Paper (CP) cannot be redeemed before the maturity date.
3.4.5 Inter-corporate Deposits (ICDs)A deposit made by one firm with another firm is known as Inter-corporate Deposits (ICDs).Generally, these deposits are usually made for a period up to six months. Such deposits may beof three types:
1. Call Deposits: Deposits are expected to be payable on call. In other words, whenever itsrepayment is demanded on just one days notice. But, in actual practice, the lender has towait for at least 2 or 3 days to get back the amount. Inter corporate deposits generally have12 per cent interest per annum.
2. Three Months Deposits: These deposits are more popular among companies for investingthe surplus funds. The borrower takes this type of deposits for tiding over a short-termcash inadequacy. The interest rate on these types of deposits is around 14 per cent perannum.
3. Six Months Deposits: Generally, the inter-corporate deposits are made for a maximumperiod of six months. These types of deposits are usually given to ‘A’ category borrowersonly and they carry an interest rate of around 16% per annum.
Features of ICDs
1. There are no legal regulations, which make an ICD transaction very convenient.
2. Inter-corporate deposits are given and taken in secrecy.
3. Inter-corporate deposits are given based on borrower’s financial sound, but in practicelender lends money based on personal contacts.
Self AssessmentFill in the blanks:
8. ………………refers to loans taken by a company normally from commercial banks for ashort period, pending disbursement of loans sanctioned by financial institutions.
9. Commercial paper represents a short-term ……………promissory note issued by firmsthat have a fairly high credit rating.
3.5 Venture Capital FinancingThe venture capital financing refers to financing of new high risky venture promoted by qualifiedentrepreneurs who lack experience and funds to give shape to their ideas. In a broad sense,under venture capital financing, venture capitalists make investments to purchase equity ordebt securities from inexperienced entrepreneurs, who undertake highly risky ventures with apotential of success.
Methods of Venture Capital Financing
The venture capital industry in India is just a decade old. The venture capitalist generallyfinance ventures, which are in national priority areas such as energy conservation, quality
LOVELY PROFESSIONAL UNIVERSITY 47
Unit 3: Sources of Finance
Notesupgradation, etc. In November 1988, the Government of India issued the first set of guidelinesfor venture capital companies’ funds and made them eligible for capital gain concessions. In1995, certain new clauses and amendments were made in the guidelines. These guidelines requirethe venture capitalists to meet the requirements of different statutory bodies and this makes itdifficult for them to operate as they do not have much flexibility in structuring investments. In1999, the existing guidelines were relaxed for increasing the attractiveness of the venture schemesand induce high net worth investors to commit their funds to ‘sunrise’ sectors particularly theinformation technology sector.
Initially, the contribution to the funds available for venture capital investment in the countrywas from the all-India development financial institutions, state development financialinstitutions, commercial banks and companies in private sector. In the last couple of years,many offshore funds have been started in country and the maximum contribution is fromforeign institutional investors. A few venture capital companies operate as both investment andfund management companies, while other set up funds and function as asset managementcompanies.
It is hoped that the changes in the guidelines for the implementation of venture capital schemesin the country would encourage more funds to be set up to provide the required momentum forventure capital investment in India.
Some common methods of venture capital financing are as follows:
1. Equity financing: The venture capital undertakings generally require funds for a longerperiod but may not be able to provide returns to the investors during the initial stages.Therefore, the venture capital finance is generally provided by way of equity share capital.The equity contribution of venture capital firm does not exceed 49% of the total equitycapital of venture capital undertakings so that the effective control and ownership remainwith the entrepreneur.
2. Conditional loan: A conditional loan is repayable in the form of a royalty after theventure is able to generate sales. No interest is paid on such loans. In India venture capitalfinanciers charge royalty ranging between 2 and 15 per cent; actual rate depends on otherfactors of the venture such as gestation period, cash flow patterns, riskiness and otherfactors of the enterprise. Some venture capital financiers give a choice to the enterprise ofpaying a high rate of interest (which could be well above 20 per cent) instead of royalty onsales, once it becomes commercially sounds.
3. Income note: It is a hybrid security, which combines the features of both conventional loanand conditional loan. The entrepreneur has to pay both interest and royalty on sales but atsubstantially low rates. IDBI’s VCF provides funding equal to 80-87.50% of the projectscost for commercial application of indigenous technology.
4. Participating debenture: Such security carries charges in three phases – in the start-upphase, no interest is charged, in next stage a low rate of interest is charged up to a particularlevel of operation, after that, a high rate of interest is required to be paid.
Self AssessmentFill in the blanks:
10. A …………….loan is repayable in the form of a royalty after the venture is able to generatesales.
11. ……………….is a hybrid security, which combines the features of both conventional loanand conditional loan.

48 LOVELY PROFESSIONAL UNIVERSITY
Financial Management
Notes 3.6 Leasing and Hire Purchase as a Source of FinanceA lease is a contractual arrangement under which the owner of an asset (called the lessor) agrees toallow the case of its asset by another party (lessee) in exchange of periodic payments (lease-rental)for a specified period. The lessee pays the lease rent as a fixed payment over a period of time at thebeginning or at the end of a month, quarter, half year or year. Although generally fixed, lease rentscan be tailored both in terms of amount and tuning to the profits and cash flow position of the lessee.At the end of the lease contract, the asset reverts back to the real owner i.e., the lessor. However, inlong-term lease contract, the lessee is generally given the option to buy or renew the lease.
Lease agreements are divided into two major ones—operating lease and financial lease.
Operating lease is for periods shorter than the useful life of the asset and is cancelable at theoption of the lessee. On the other hand, financial lease involves a relatively longer-termcommitment on the part of the lessee and non-cancelable during the entire period specified inthe contract. Operating lease is common among equipments/assets exposed to technologicalobsolescence such as computers, data processing equipments.
Financial leases are commonly used for leasing land, buildings and large pieces of fixedequipments.
Advantages of Leasing
1. Shifting the risk of technological obsolescence to the owner (lessor) the leasing company.2. Easy source of finance: A lessee (user of the machine) avoids many of the restrictive
covenants that are normally in the long-term loan agreements while borrowing fromfinancial institution or commercial banks.
3. Enhance liquidity: A firm having shortage of working capital or forecasting liquidityproblem may exercise the option of the selling the owned asset to a lesser (leasing company)and take it back on lease basis (the transaction is known as sale cum lease back).
4. Conserving borrowing capacity through off the balance-sheet financing.5. Improved performance as reflected through improved turnover of assets.6. Governance and flexibility-by adjusting the term based on losses) requirements.7. Maintenance and specialized services: Under a full service lease, the lessee receives
maintenance and other specialized services. Even in other types of lease, it is generallycommon to have maintenance provided by the lessor, thus absolving the lessee of themaintenance arrangement.
8. Lower administrative cuts as compared to other source of finance.
Disadvantages
1. Risk of being deprived of the use of equipment of the lessors (owners) financial conditionworsens, or if the leasing company is worried up, the lessee may be deprived of the use ofthe equipment thus disrupting normal manufacturing operations.
2. Alteration/change in the asset: Under the lease, the lessee is generally prohibited frommaking alterations/improvements on the leased asset without the prior approval of thelessor (the owner).
3. Terminal value of the asset: In case of assets (such as land and buildings), which have highterminal value at the end of the lease term, it would be more appropriate to own the assetthan to lease it.
4. To make lease payments even if the asset has become obsolete. If a lessee leases an assetthat subsequently becomes obsolete, it still must make lease payments over the remainingterm of the lease. This is true even if the asset is unsaleable.
LOVELY PROFESSIONAL UNIVERSITY 49
Unit 3: Sources of Finance
NotesHire Purchase
Very similar to leasing is hire purchase except that in hire purchase, the ownership will betransferred to the buyer after all the hire purchase instalments are paid up. With many non-banking finance companies offering the leasing and Chire purchase of equipments, manycompanies are opting for this route to finance their fixed assets.
Self AssessmentFill in the blanks:
12. Lease agreements are divided into two major ones – operating lease and ……………lease.
13. …………….. lease is for periods shorter than the useful life of the asset and is cancelable atthe option of the lessee.
3.7 Deferred CreditThe deferred credit facility is offered by the suppliers of machinery, whereby the buyer can paythe purchase price in instalments spread over a period of time. The interest and repaymentperiod are negotiated between the supplier and the buyer.
Notes Bill rediscounting scheme, supplier’s line of credit, seed capital assistance and riskcapital foundation schemes offered by financial institutions are examples of deferredcredit scheme.
3.7.1 Capital Assistance SeedThe seed capital assistance scheme is designed by IDBI for professionally or technically qualifiedentrepreneurs and/or persons possessing relevant experience, skills and entrepreneurial traits.The project cost should not exceed 2 crores and the maximum assistance under the project willbe restricted to 50% of the required promoters contribution or 15 lacs whichever is lower.
The seed capital assistance is interest free but carries a service charge of 1% for the first five yearand 10% p.a. thereafter. However, IDBI will have the option to change interest at such rate asmay be determined by IDBI based on the financial position and profitability of the company.The repayment schedule is fixed depending upon the repaying capacity of the unit with aninitial moratorium up to five years.
For projects with a project cost exceeding 200 lacs, seed capital may be detained from the RiskCapital and Technology Corporation Ltd. (RCTC). For small projects costing upto 5 lacs,assisted under the Natural Equity Fund of SIDBI may be availed.
3.7.2 Government SubsidiesThe central and state governments provide subsidies to industrial units located in backwardareas. The central government has classified backward areas into three categories of districts: A,B and C. The central subsidies applicable to industrial projects in these districts are:
1. Category A Districts-25% of the fixed capital investment subject to a maximum of 25 lakh
2. Category B Districts-15% of the fixed capital investment subject to a maximum of 15 lakh
50 LOVELY PROFESSIONAL UNIVERSITY
Financial Management
Notes 3. Category C Districts-10% of the fixed capital investment subject to a maximum of10 lakh.
State governments also offer cash subsidies to promote widespread dispersal of industrieswithin their states. Generally, the districts notified in the state subsidy schemes are differentfrom those covered under the central subsidy scheme. The state subsidies vary between 5% to25% of the fixed capital investment in the project, subject to a ceiling varying between 5 lakhand 25 lakh depending on the location.
Example: Satavahana Ispat Limited has been set up with the capacity to manufacture1,20,000 tones of pig iron. The cost of project has been appraised by IDBI at 5,450 lakh and is tobe mainly financed through equity capital and term loans. The unit is also eligible for a stategovernment subsidy (Andhra Pradesh) of 20 lakh, which will also be a source of long-termfinance. The unit is located at Anantapur district of Andhra Pradesh and falls into” the Categoryof a ‘backward area.’
3.7.3 Sales Tax Deferments and ExemptionsTo attract industries, the state provides incentives, in the form of sales tax deferments and salestax exemptions. Under the sales tax deferment scheme, the payment of sales tax on the sale offinished goods may be deferred for a period ranging between five to twelve years. Essentially,it implies that the project gets an interest-free loan, represented by the quantum of Sales Taxdeferment period.
Notes Under the sales tax exemption scheme, some states exempt the payment of sales taxapplicable on purchase of raw materials, consumables, packing and processing materialsfrom within the state while used for manufacturing purposes. The period of exemptionranges from three to nine years depending on the state and the specific location of theproject within the state.
Example: Lupin Chemicals Ltd. has stated in their prospects that they are eligible forsales tax incentive for a period of five years or till they reach the ceiling of 60% of fixed capitalinvestment whichever is earlier.
Self AssessmentFill in the blanks:
14. The seed capital assistance scheme is designed by …………for professionally or technicallyqualified entrepreneurs.
15. The central and state governments provide subsidies to industrial units located in…………… areas.
Case Study Case: DLF Ltd. – Lease Option
DLF Ltd. is engaged in the business of leasing and hire purchase. The company alsofunctions as a merchant banker equity researcher, corporate financier, portfolio
Contd...

LOVELY PROFESSIONAL UNIVERSITY 51
Unit 3: Sources of Finance
Notesmanager, etc. The company provides fund based as well as non-fund based financialsolutions to both wholesale and retail segments.
DLF Ltd. has been approached by A Ltd., Mumbai, for financial help. A Ltd. manufacturersprocess system for food processing, pharmaceuticals, engineering, dairy and chemicalindustries. A wide range of centrifugal separators, plate, spray drudgers, custom fabricatedequipment for exotic metals, refrigeration compressors, are also manufactured by thecompany. One of the major strengths of the company is project management.
A Ltd. has a well-equipped R&D centre. It has pilot plant facilities and a modern laboratoryfor chemical, metallurgical and mechanical analyser. The company has also set up atechnology centre with advanced testing facilities. Recently, the manager of the technologycentre has requisitioned for the acquisition of computerised sophisticated equipment forconducting important tests.
The equipment is likely to have the useful life of three years. The cost of the equipment is10 crore. The scrap value of the equipment at the end of its useful life will be zero for the
company. The finance manager of A Ltd. has suggested that the company should take aloan for three years from a commercial bank. Repayment of the loan would be made at theend of each year in three equal instalments. The repayments would comprise of the(i) principal, and (ii) interest at 10% p.a. (on the outstanding amount in the beginning ofthe year). A Ltd. uses a cost of capital of 15% to evaluate the investments of this type. Theequipment will be depreciated @ 33.3% p.a. (WDV).
P. Securities Ltd. has agreed to give the equipment to the company on a three-year lease.The annual rental for the lease, payable in the beginning of each year, would be 4 crore.P. Securities Ltd. discounts its cash flows @ 14%. The equipment is depreciable at 33.3% p.a.(straight line method). The lessee may exercise its option to purchase the equipment for 4crore at the termination of the lease.
A Ltd. would bear all maintenance, insurance and other charges in both the alternatives.Both the companies pay tax @ 35%.
You are a practicing Company Secretary. You are approached by the Managing Director ofA Ltd. to help the company in evaluating the proposal.
Prepare a report for the Managing Director of A Ltd. showing the effect of the leasealternative on the wealth of its shareholders. Support your answer with appropriatecalculations.
Notes Present value of 1 is:
Year 6% 7% 10% 14% 15%
1 0.943 0.935 0.909 0.877 0.870
2 0.890 0.873 0.826 0.769 0.756
3 0.840 0.816 0.751 0.675 0.658
4 0.792 0.763 0.683 0.592 0.572
Contd...
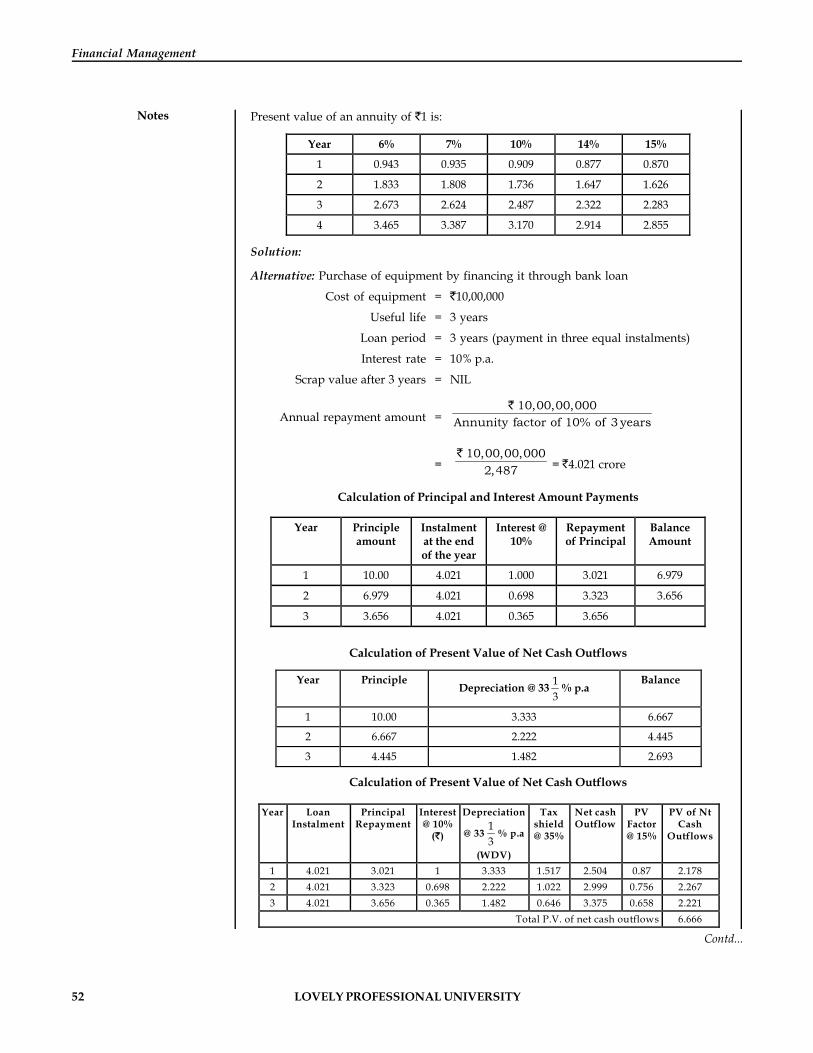
52 LOVELY PROFESSIONAL UNIVERSITY
Financial Management
Notes Present value of an annuity of 1 is:
Year 6% 7% 10% 14% 15%
1 0.943 0.935 0.909 0.877 0.870
2 1.833 1.808 1.736 1.647 1.626
3 2.673 2.624 2.487 2.322 2.283
4 3.465 3.387 3.170 2.914 2.855
Solution:
Alternative: Purchase of equipment by financing it through bank loan
Cost of equipment = 10,00,000
Useful life = 3 years
Loan period = 3 years (payment in three equal instalments)
Interest rate = 10% p.a.
Scrap value after 3 years = NIL
Annual repayment amount =10,00,00,000
Annunity factor of 10% of 3 years
= 10,00,00,000
2,487 = 4.021 crore
Calculation of Principal and Interest Amount Payments
Year Principle amount
Instalment at the end of the year
Interest @ 10%
Repayment of Principal
Balance Amount
1 10.00 4.021 1.000 3.021 6.979
2 6.979 4.021 0.698 3.323 3.656
3 3.656 4.021 0.365 3.656
Calculation of Present Value of Net Cash Outflows
Year Principle Depreciation @ 33 1
3% p.a
Balance
1 10.00 3.333 6.667
2 6.667 2.222 4.445
3 4.445 1.482 2.693
Calculation of Present Value of Net Cash Outflows
Year Loan Instalment
Principal Repayment
Interest @ 10%
( )
Depreciation
@ 3313
% p.a
(WDV)
Tax shield @ 35%
Net cash Outflow
PV Factor @ 15%
PV of Nt Cash
Outflows
1 4.021 3.021 1 3.333 1.517 2.504 0.87 2.178 2 4.021 3.323 0.698 2.222 1.022 2.999 0.756 2.267 3 4.021 3.656 0.365 1.482 0.646 3.375 0.658 2.221
Total P.V. of net cash outflows 6.666
Contd...

LOVELY PROFESSIONAL UNIVERSITY 53
Unit 3: Sources of Finance
NotesAlternative I: Lease the Equipment
Year Lease Rent
Tax Savings @
35%
Net Cash Outflow
PV Factor @ 15%
PV of Net Cash
Outflows
0 4.00 4.0 1.000 4.000
1 4.00 1.40 2.60 0.870 2.262
2 4.00 1.40 2.60 0.756 1.966
3 1.40 (1.40) 0.658 (0.921)
Total P.V of net cash outflows = 7,307
Suggestion: The present value of net cash outflows is lowest, if the equipment is purchasedby taking a loan from the bank. Hence it is suggested to consider Alternative I.
3.8 Summary
Financial needs of a business: The financial needs of a business may be grouped into threecategories which are Long-term, Medium-term and Short-term financial needs.
Long-term Sources of finance of a business include Share capital, Debentures/Bonds ofdifferent types, Loans from financial institutions and Venture capital funding
Short-term Sources of finance includes Trade credit, Commercial banks, Fixed deposits fora period of 1 year or less, Advances received from customers and Various short-termprovisions.
In recent times in India, many companies have raised long-term finance by offering variousinstruments to public like deep discount bonds, fully convertible debentures, etc.
In India, specialized institutions provide long-term financial assistance to industry.
Bridge finance refers to loans taken by a company normally from commercial banks for ashort period, pending disbursement of loans sanctioned by financial institutions.
CP is a source of short-term finance to large firms with sound financial position.
The venture capital financing refers to financing of new high risky venture promoted byqualified entrepreneurs who lack experience and funds to give shape to their ideas.
A lease is a contractual arrangement under which the owner of an asset agrees to allow thecase of its asset by another party in exchange of periodic payments (lease-rental) for aspecified period.
The seed capital assistance is interest free but carries a service charge of 1% for the first fiveyear and 10% p.a. thereafter.
3.9 Keywords
Commercial Paper: It represents a short-term unsecured promissory note issued by firms thathave a fairly high credit (standing) rating.
Income Note: It is a hybrid security, which combines the features of both conventional loan andconditional loan.
Inter-corporate Deposits (ICDs): A deposit made by one firm with another firm is known asInter-corporate Deposits.

54 LOVELY PROFESSIONAL UNIVERSITY
Financial Management
Notes Retained Earnings: These are the portion of earning available to equity shareholders, which areploughed back in the company.
Trade Credit: It refers to the credit extended by the supplier of goods or services to his/hercustomer in the normal course of business.
3.10 Review Questions
1. Explain the advantages of equity financing.
2. What are the advantages of debt financing from the point of the company and investors?
3. What do you mean by venture capital financing and what are the methods of this type offinancing?
4. Write short notes on:
(a) Zero interest fully convertible
(b) Deep discount bonds
(c) Inflation bonds
(d) Sales tax deferments and Exemptions.
5. What are the advantages of lease financing?
6. “Is Trade Credit is source of working capital finance”. Discuss.
7. Taking the example of the Indian corporate, analyse the importance of issuing the CPs forthe firm & to the investors.
8. Do you agree that lease is the efficient source of finance for corporates? How?
9. In your opinion, which is the best source of finance available to the firm for raising moneyfrom the public?
10. You are starting your new company & wanted to raise capital from public. Analyse thesources of finance available to you.
Answers: Self Assessment
1. 5 – 10 2. short-term 3. risk
4. public issue 5. common shares 6. direct
7. debt 8. Bridge finance 9. unsecured
10. conditional 11. Income note 12. financial
13. Operating 14. IDBI 15. backward
3.11 Further Readings
Books Dr Pradeep Kumar Sinha, Financial Management, New Delhi, Excel Books, 2009.Chandra, P., Financial Management—Theory and Practice, New Delhi, Tata McGrawHill Publishing Company Ltd., 2002, p. 3.
I.M. Pandey, Financial Management, 8th Edn., Vikas Publishing House Pvt. Ltd.
Lawrence J. Gitman, Principles of Managerial Finance, 10th Edn., Parson Education.
LOVELY PROFESSIONAL UNIVERSITY 55
Unit 4: Concept of Economic Value Added
NotesUnit 4: Concept of Economic Value Added
CONTENTS
Objectives
Introduction
4.1 Economic Value Added (EVA)
4.2 Advantages of EVA
4.3 Evaluation of EVA
4.4 Limitations of EVA Analysis
4.5 Summary
4.6 Keywords
4.7 Review Questions
4.8 Further Readings
Objectives
After studying this unit, you will be able to:
Recognize the meaning and scope of financial management
Describe the goals and objectives of financial management
Explain the different Finance functions
Discuss various significant aspects related to financial management
IntroductionManagement Information System can be developed as an act of interrelated components thatcollect (or retrieve), process, store and distribute information to support decision-making,co-ordinate and control in an organisation. Information means data have been shaped into aform that is meaningful and useful to human being. Data are stream of raw facts reportingevents occurring in organisation or physical environment before they have been organized andrearranged into a form that people can understand and use. Performance measures are a centralcomponent of management information and reporting system. It deals with performancemeasures for different levels of an organisation and for managers at these levels – both financialand non-financial performance measures.
Economic Value Added was developed to promote value-maximizing behaviour in corporatemanagers. It is a single, value-based measure that was intended to evaluate business strategies,capital projects and to maximize long-term shareholders wealth.
4.1 Economic Value Added (EVA)An alternative measure of financial performance in an investment centre is segment ResidualIncome or Economic Value Added.
Economic Value Added (EVA) is the amount in rupees that remains after deducting an “implied”interest charge from operating income. The implied interest charge reflects an opportunity cost, andis charged on the amount of assets in each investment centre. The rate of interest charge is equal to theminimum rate on investment specified by top management as part of the corporate strategic plan.
56 LOVELY PROFESSIONAL UNIVERSITY
Financial Management
Notes
Notes The importance of management information system has increased in recent timesbecause of the following:
1. Emergence of global economy
2. Transformation of industrial economics – knowledge and information intenseproducts have become available.
3. Transformation of multinational enterprises
4. Emergence of digital form.
Example:A division has a budgeted income of 10 lakhs and a budgeted investment of 60 lakhs. The average cost of capital for the firm is 12 per cent. The budgeted residual income
is:
Divisional Income 10 lakhs
Interest charge
12% on 60 lakhs 7.20
Residual income/ Economic value added 2.80
!Caution Different interest rates may be applied to different components of investment likefixed assets, inventories, receivables and cash.
During the 1990s, residual income has been refined and remained as Economic Value Added(EVA) by Stern Steward Counseling Organization and they have registered EVA (TM) as theirtrademark.
The EVA concept extends the traditional residual income measures by incorporating adjustmentsto the divisional performance measures against distortions introduced by generally acceptedaccounting principles (GAAP).
EVA can be defined as = Conventional divisional profit ± Accumulatedadjustment – Cost of capital charge on divisional assets.
Adjustments are made to the chosen, conventional divisional profit measures in order toreplace historical accounting data with a measure of economic profit and asset values. SternStewart has developed approximately 160 accounting adjustments but most organisationswill only need to use about 10 of the adjustments. These adjustments result in the capitalizationof many discretionary adjustments such as research and development, marketing andadvertising by spreading these costs over the periods in which the benefits are received.Therefore, adopting EVA reduces some of the harmful side effects arising from using financialmeasures. Also, because it is restatement of the residual income measure compared to ROI,EVA is more likely to encourage goal congruence in terms of asset acquisition and disposaldecisions. Managers are also made aware that capital has a cost and they are thus encouragedto dispose of underutilized assets that do not generate sufficient income to cover their cost ofcapital. There are a number of issues that apply to ROI, residual income or its replacement(EVA). They concern determining which assets should be included in a divisions asset base
LOVELY PROFESSIONAL UNIVERSITY 57
Unit 4: Concept of Economic Value Added
Notesand adjustments that should be made to financial accounting practices to derive managerialinformation that is closer to economic reality.
EVA = [Profit after Tax + Interest (1 – marginal tax rate of the firm)] – Cost of capital× Economic book value of the capital employed in the firm
EVA = Profit after Tax – Cost of equity × Equity employed in the firm
EVA is essentially the surplus left after making an appropriate charge for thecapital employed in the business. It may be calculated in any of the followingapparently different but essentially equivalent ways:
EVA = Net operating profit other tax – Cost of capital × Economic book value ofcapital employed in the firm.
EVA = Economic book value of capital employed in the firm (Return in capital – Costof capital)
Self AssessmentFill in the blanks:
1. …………………is the amount in rupees that remains after deducting an “implied” interestcharge from operating income.
2. EVA is essentially the ………….left after making an appropriate charge for the capitalemployed in the business.
3. The implied interest charge reflects a …………………cost.
4. The rate of interest charge is equal to the minimum rate on ……………..specified by topmanagement as part of the corporate strategic plan.
4.2 Advantages of EVA
1. EVA combines profit centre and investment centre concepts. With EVA, managementestablishes a target profit or target rate of return for the business segment. Any income inexcess of the target level is the residual income/EVA. To illustrate, the target rate of returnfor DD Ltd., is 20 per cent on total net assets. Total net assets are 800,000 and actual netincome 200,000 so the target net income is 800,000 × 0.20 = 160,000. The EVA for thecompany is actual net income minus target net income = 200,000 – 160,000 = 40,000.
2. In case of EVA, different interest rates may be used for different types of assets e.g., lowrates can be used for inventories while a higher rate can be used for investments in fixedassets. Furthermore, different rates may be used for different of fixed assets to take intoaccount different degrees of risk.
3. With EVA all business units have the same profit objective for comparable investments.The ROI approach, on the other hand provides different incentives for investments acrossbusiness units.
4. The EVA in contrast to ROI has a stronger positive correlation with changes in company’smarket share. Shareholders are important stakeholders in a company’s market value.
5. EVA eliminates economic distortions of GAAP to focus decisions on real economic results.
6. Provision of correct incentives for capital allocations.
58 LOVELY PROFESSIONAL UNIVERSITY
Financial Management
Notes 7. EVA provides for better assessment of decisions that affect balance sheet and incomestatement or trade-offs between each through the use of the capital charge against NOPAT.
8. Long-term performance that is not compromised in favor of short-term results.
9. EVA decouples bonus plans from budgetary targets.
10. EVA covers all aspects of the business cycle.
11. EVA aligns and speeds decision making, and enhances communication and teamwork.
12. Provision of significant information value beyond traditional accounting measures ofEPS, ROA and ROE.
13. Goal congruence of managerial and shareholder goals achieved by tying compensation ofmanagers and other employees to EVA measures.
14. Annual performance measured tied to executive compensation.
Did u know?Cola-Cola is one of the many companies that adopted EVA for measuring itsperformance. Its aim, which was to create shareholders wealth, was announced in itsannual report. Coca-Cola CEO Roberto Goizueta accredited EVA for turning Coca-Colainto the number one Market Value Added Company. Coca-Cola’s stock price increasedfrom $3 to over $60 when it first adopted EVA in the early 1980s. In 1995, Coca-Cola’sinvestor received $8.63 wealth for every dollar they invested.
Self AssessmentFill in the blanks:
5. EVA eliminates economic distortions of ………….to focus decisions on real economicresults
6. In case of EVA, ……………interest rates may be used for different types of assets
7. EVA combines profit centre and …………………concepts.
8. EVA decouples bonus plans from ……………..targets
4.3 Evaluation of EVA
Economic Value Added (EVA) vs. Earning Per Share (EPS)
EPS is calculated by dividing the net profits after interest, depreciation and taxation by thenumber of equity shares issued by the company to find out the profits earned per share. Thismeasure is flawed because it does not consider the equity cost of capital employed (i.e. itassumes that equity capital comes to the company for free). Naturally, when more funds arepumped into the company, the size of the business increases without necessary increasing theprofitability. Also, EVA takes into consideration the total capital employed by the company—total shareholders’ fund (equity and accumulated profits) and total debt—and finds out thedifference between the earning and the cost of the capital employed.
Did u know? EPS can be improved without corresponding improvement in performancesimply by issuing further equity at a premium.
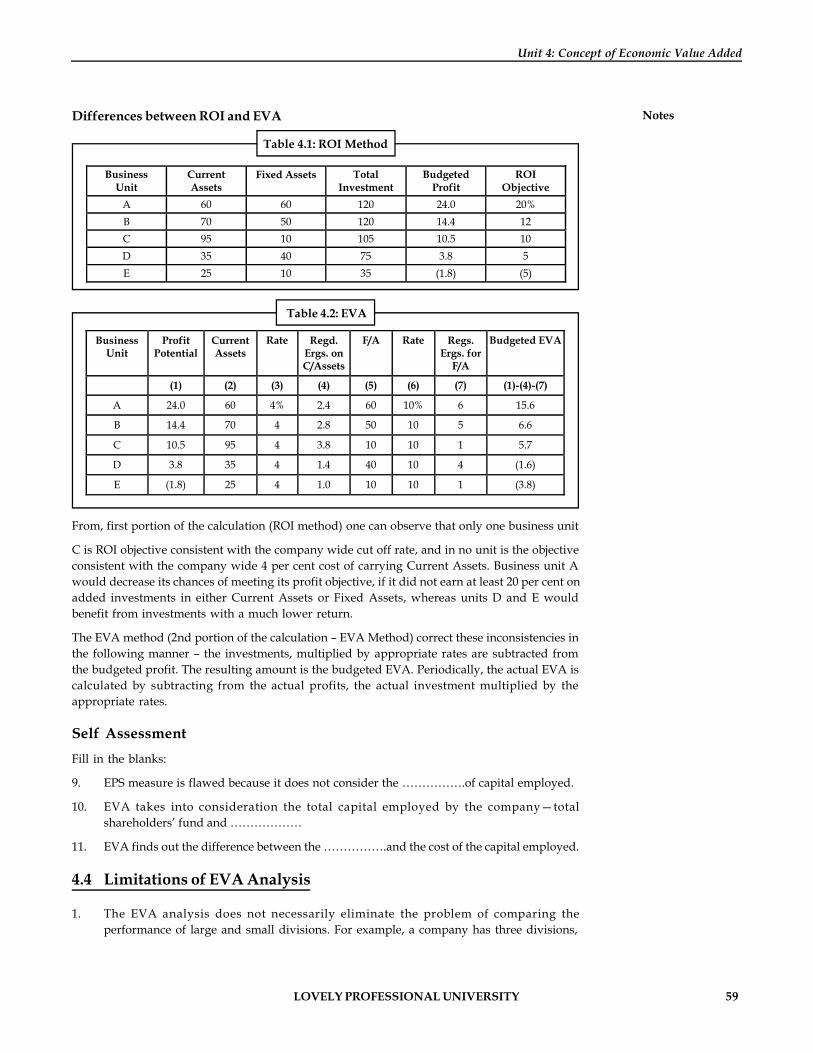
LOVELY PROFESSIONAL UNIVERSITY 59
Unit 4: Concept of Economic Value Added
NotesDifferences between ROI and EVA
Table 4.1: ROI Method
Business Unit
Current Assets
Fixed Assets Total Investment
Budgeted Profit
ROI Objective
A 60 60 120 24.0 20% B 70 50 120 14.4 12 C 95 10 105 10.5 10 D 35 40 75 3.8 5 E 25 10 35 (1.8) (5)
Table 4.2: EVA
Business Unit
Profit Potential
Current Assets
Rate Regd. Ergs. on C/Assets
F/A Rate Regs. Ergs. for
F/A
Budgeted EVA
(1) (2) (3) (4) (5) (6) (7) (1)-(4)-(7)
A 24.0 60 4% 2.4 60 10% 6 15.6
B 14.4 70 4 2.8 50 10 5 6.6
C 10.5 95 4 3.8 10 10 1 5.7
D 3.8 35 4 1.4 40 10 4 (1.6)
E (1.8) 25 4 1.0 10 10 1 (3.8)
From, first portion of the calculation (ROI method) one can observe that only one business unit
C is ROI objective consistent with the company wide cut off rate, and in no unit is the objectiveconsistent with the company wide 4 per cent cost of carrying Current Assets. Business unit Awould decrease its chances of meeting its profit objective, if it did not earn at least 20 per cent onadded investments in either Current Assets or Fixed Assets, whereas units D and E wouldbenefit from investments with a much lower return.
The EVA method (2nd portion of the calculation – EVA Method) correct these inconsistencies inthe following manner – the investments, multiplied by appropriate rates are subtracted fromthe budgeted profit. The resulting amount is the budgeted EVA. Periodically, the actual EVA iscalculated by subtracting from the actual profits, the actual investment multiplied by theappropriate rates.
Self AssessmentFill in the blanks:
9. EPS measure is flawed because it does not consider the …………….of capital employed.
10. EVA takes into consideration the total capital employed by the company—totalshareholders’ fund and ………………
11. EVA finds out the difference between the …………….and the cost of the capital employed.
4.4 Limitations of EVA Analysis
1. The EVA analysis does not necessarily eliminate the problem of comparing theperformance of large and small divisions. For example, a company has three divisions,
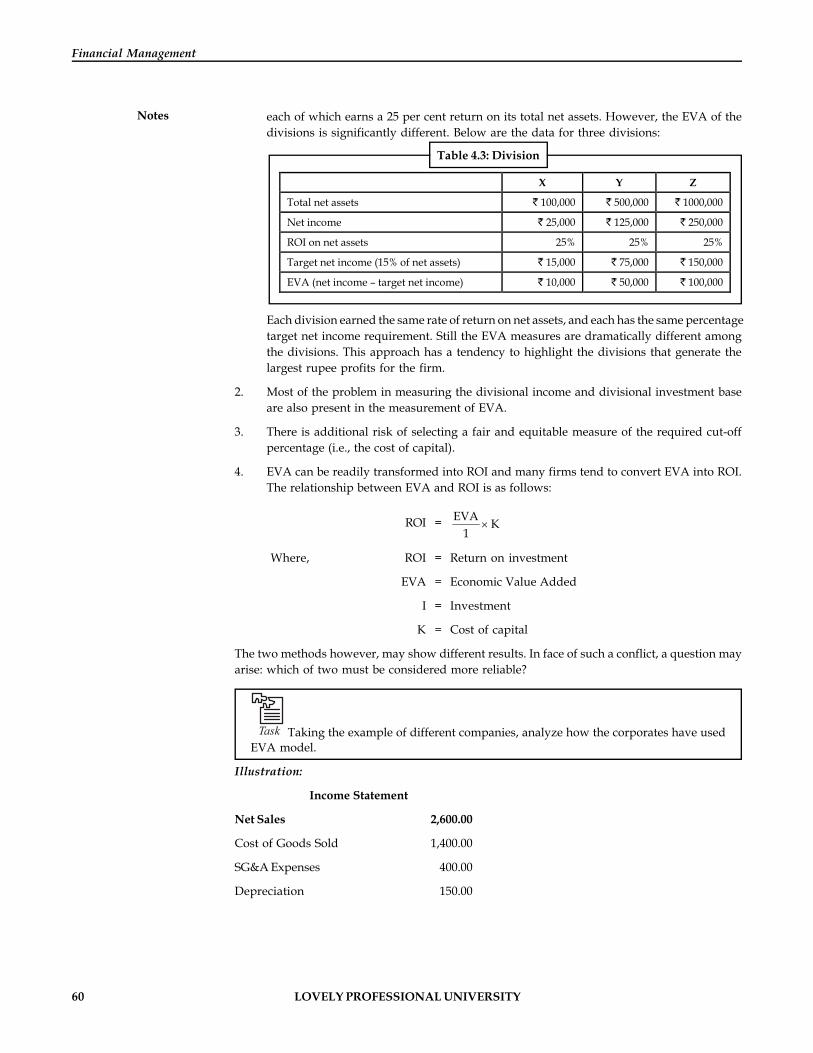
60 LOVELY PROFESSIONAL UNIVERSITY
Financial Management
Notes each of which earns a 25 per cent return on its total net assets. However, the EVA of thedivisions is significantly different. Below are the data for three divisions:
Table 4.3: Division
X Y Z
Total net assets 100,000 500,000 1000,000
Net income 25,000 125,000 250,000
ROI on net assets 25% 25% 25%
Target net income (15% of net assets) 15,000 75,000 150,000
EVA (net income – target net income) 10,000 50,000 100,000
Each division earned the same rate of return on net assets, and each has the same percentagetarget net income requirement. Still the EVA measures are dramatically different amongthe divisions. This approach has a tendency to highlight the divisions that generate thelargest rupee profits for the firm.
2. Most of the problem in measuring the divisional income and divisional investment baseare also present in the measurement of EVA.
3. There is additional risk of selecting a fair and equitable measure of the required cut-offpercentage (i.e., the cost of capital).
4. EVA can be readily transformed into ROI and many firms tend to convert EVA into ROI.The relationship between EVA and ROI is as follows:
ROI = EVA K1
Where, ROI = Return on investment
EVA = Economic Value Added
I = Investment
K = Cost of capital
The two methods however, may show different results. In face of such a conflict, a question mayarise: which of two must be considered more reliable?
Task Taking the example of different companies, analyze how the corporates have usedEVA model.
Illustration:
Income Statement
Net Sales 2,600.00
Cost of Goods Sold 1,400.00
SG&A Expenses 400.00
Depreciation 150.00

LOVELY PROFESSIONAL UNIVERSITY 61
Unit 4: Concept of Economic Value Added
NotesOther Operating Expenses 100.00
Operating income 550.00
Interest Expenses –200.00
Income Before Tax 350.00
Income Tax (25%) 140.00
Net Profit After Taxes 210.00
Common Balance Sheet
Current Assets Current Liabilities
Cash 50.00 Accounts Payable (A\P) 100.00
Receivable (A/R) 370.00 Accrued Expenses (A\E) 250.00
Inventory 235.00 Short-Term Debt 300.00
Other Current Assets 145.00 Total Current Liabilities 650.00
Total Current Assets 800.00 Long-Term Liabilities
Fixed Assets Long-Term Debt 760.00
Property, Land 650.00 Total Long-Term Liabilities 760.00
Equipment 410.00 Capital (Common Equity)
Other Long-Term Assets 490.00 Capital Stock 300.00
Total Fixed Assets 1,550.00 Retained Earnings 430.00
Year to Date Profit/Loss 210.00
Total Equity Capital 940.00
Total Assets 2,350.00 Total Liabilities 2,350.00
1. Calculate Net Operating Profit After Tax (NOPAT)
2. Identify company’s Capital (C)
3. Determine a reasonable Capital Cost Rate(CCR)
4. Calculate company’s Economic Value Added (EVA)
Solution:
Step 1: Calculate Net Operating Profit After
Taxes (NOPAT)
Net Sales 2,600
(A) Cost of Goods Sold 1,400.00
SG&A Expenses 400.00
Depreciation 150.00
Other Operating Expenses 100.00 2050
Operating income 550.00
Tax (25%) 140.00
NOPAT 410.00
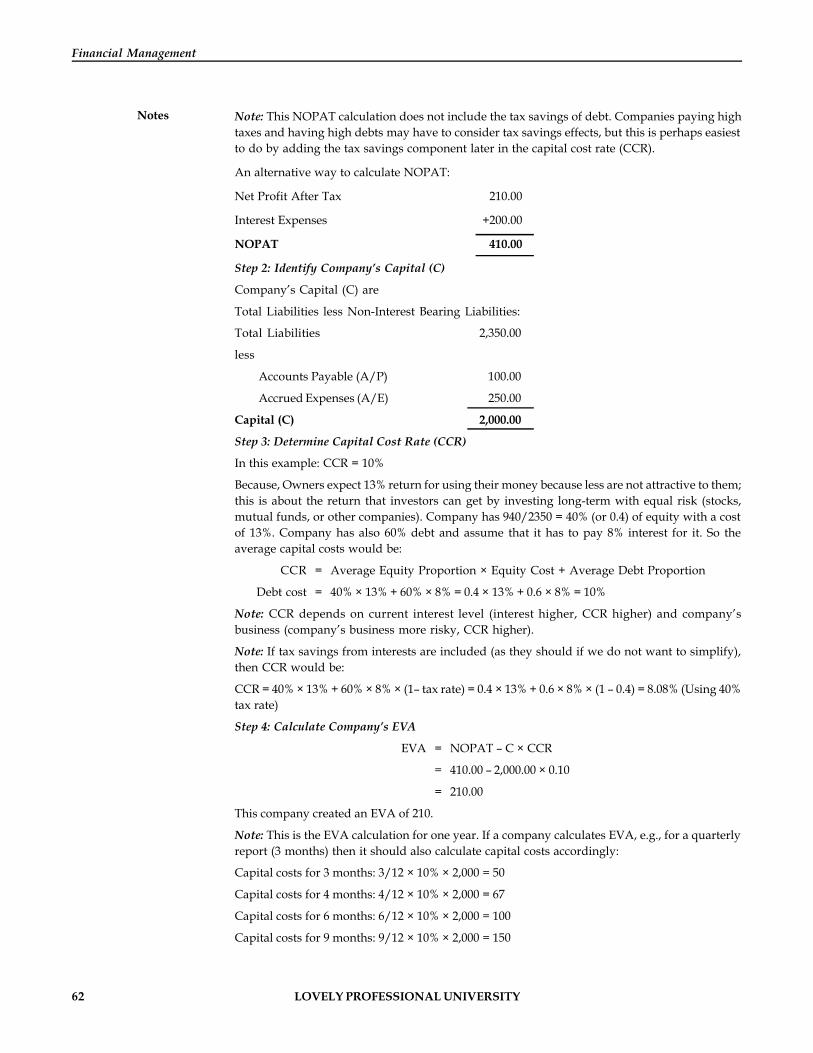
62 LOVELY PROFESSIONAL UNIVERSITY
Financial Management
Notes Note: This NOPAT calculation does not include the tax savings of debt. Companies paying hightaxes and having high debts may have to consider tax savings effects, but this is perhaps easiestto do by adding the tax savings component later in the capital cost rate (CCR).
An alternative way to calculate NOPAT:
Net Profit After Tax 210.00
Interest Expenses +200.00
NOPAT 410.00
Step 2: Identify Company’s Capital (C)
Company’s Capital (C) are
Total Liabilities less Non-Interest Bearing Liabilities:
Total Liabilities 2,350.00
less
Accounts Payable (A/P) 100.00
Accrued Expenses (A/E) 250.00
Capital (C) 2,000.00
Step 3: Determine Capital Cost Rate (CCR)
In this example: CCR = 10%
Because, Owners expect 13% return for using their money because less are not attractive to them;this is about the return that investors can get by investing long-term with equal risk (stocks,mutual funds, or other companies). Company has 940/2350 = 40% (or 0.4) of equity with a costof 13%. Company has also 60% debt and assume that it has to pay 8% interest for it. So theaverage capital costs would be:
CCR = Average Equity Proportion × Equity Cost + Average Debt Proportion
Debt cost = 40% × 13% + 60% × 8% = 0.4 × 13% + 0.6 × 8% = 10%
Note: CCR depends on current interest level (interest higher, CCR higher) and company’sbusiness (company’s business more risky, CCR higher).
Note: If tax savings from interests are included (as they should if we do not want to simplify),then CCR would be:
CCR = 40% × 13% + 60% × 8% × (1– tax rate) = 0.4 × 13% + 0.6 × 8% × (1 – 0.4) = 8.08% (Using 40%tax rate)
Step 4: Calculate Company’s EVA
EVA = NOPAT – C × CCR
= 410.00 – 2,000.00 × 0.10
= 210.00
This company created an EVA of 210.
Note: This is the EVA calculation for one year. If a company calculates EVA, e.g., for a quarterlyreport (3 months) then it should also calculate capital costs accordingly:
Capital costs for 3 months: 3/12 × 10% × 2,000 = 50
Capital costs for 4 months: 4/12 × 10% × 2,000 = 67
Capital costs for 6 months: 6/12 × 10% × 2,000 = 100
Capital costs for 9 months: 9/12 × 10% × 2,000 = 150

LOVELY PROFESSIONAL UNIVERSITY 63
Unit 4: Concept of Economic Value Added
NotesThe Complete Procedure:
Calculate EVA in the Internal Reporting
Net Sales 2,600.00
Cost of Goods Sold -1,400.00
SG&A Expenses -400.00
Depreciation -150.00
Other Operating Expenses -100.00
Operating income 550.00
Tax (25%) -140.00
NOPAT 410.00
Capital costs (10% * 2000) -200.00
Economic Value Added (EVA) 210.00
Note: In this example (for one year) the capital costs are calculated on a yearly basis. E.g. capitalcosts for 3 months: 3/12 × 10% × 2,000 = 50
Self AssessmentFill in the blanks:
12. Most of the problem in measuring the divisional income and divisional ……………..baseare also present in the measurement of EVA.
13. EVA can be readily transformed into…………...
14. The relationship between EVA and ROI is ROI = ………………….
15. EVA analysis does not necessarily eliminate the problem of comparing the performanceof …………and ………..divisions.
Case Study Case: Economic Value Added
In economics, the value addition is calculated by the following formula:
Value Added = Value of sales less the cost of bought-in goods and services.
In this formula, only cost of bought-in goods and services has been accounted for. Itcompletely ignores labour cost, depreciation, markup etc. In fact, they are factors ofproduction (land, labour and capital). They provide “services” which raise value of “inputs”to a much higher realized value. The difference would be shared among them.
Calculate the value added & the value distributed in the below case.
Sales of the company 2862000
Out-side purchases 676800
Workers salary 104400
Bankers 836570
Government 350810
Owners 500000
Firms deprecation 367800
Retained earnings 25620
Contd...

64 LOVELY PROFESSIONAL UNIVERSITY
Financial Management
Notes
Sales of the company 2862000
Out-side purchases 676800
Workers salary 104400
Bankers 836570
Government 350810
Owners 500000
Firms deprecation 367800
Retained earnings 25620
Indus Machine Tools Ltd. is a Private Ltd Company at Multan, a city in Punjab, Pakistan. ItsBalance Sheet is given below:
Indus Machines Tools Ltd. Balance Sheet as on 31st Dec08
Liabilities Assets
Accounts payable 208000 Cash 4940
Bank overdraft 484000 Raw material stock 86400
Long term debt 6000000 Finished goods stock 171360
Equity 4000000 Account receivables 429300
Fixed assets 10000000
Total 10692000 Total 10692000
Additional Information
Taxes accounts for 685, 440/-, Total costs is 1148, 400/-, effective returns on debt-7.5 %, equity- 20% & bank loan is 10.8%.
Questions
1. Calculate the NOPAT & total capital.
2. What is the return on capital?
3. From the given details, calculate the cost of capital.
4. Analyse the financial position of the company by calculating the EVA.
5. Do you think the company will be getting the desired equity investment if it plansto go for expansion? Why?
4.5 Summary Economic Value Added (EVA) is the amount in rupees that remains after deducting an
“implied” interest charge from operating income. The EVA concept extends the traditional residual income measures by incorporating
adjustments to the divisional performance measures against distortions introduced bygenerally accepted accounting principles (GAAP).
EVA is more likely to encourage goal congruence in terms of asset acquisition and disposaldecisions.
In case of EVA, different interest rates may be used for different types of assets e.g., lowrates can be used for inventories while a higher rate can be used for investments in fixedassets.
The EVA in contrast to ROI has a stronger positive correlation with changes in company’smarket share.
EVA decouples bonus plans from budgetary targets. The EVA analysis does not necessarily eliminate the problem of comparing the
performance of large and small divisions. EVA can be readily transformed into ROI and many firms tend to convert EVA into ROI.
LOVELY PROFESSIONAL UNIVERSITY 65
Unit 4: Concept of Economic Value Added
Notes4.6 KeywordsCapital Employed: It is the capital investment necessary for a business to function.
Corporate Finance: It is an area of finance dealing with the financial decisions corporationsmake and the tools and analysis used to make these decisions.
Economic Value Added: It is an estimate of economic profit by after making adjustments toGAAP accounting, including deducting the opportunity cost of equity capital.
Net Asset Value: It is a term used to describe the value of an entity’s assets less the value of itsliabilities.
NOPAT: It is a company’s after-tax operating profit for all investors, including shareholders anddebt holders.
4.7 Review Questions1. Why is performance measurement required in management control system?
2. Elucidate the advantages which a firm will obtain by using EVA approach.
3. EVA results in increasing the shareholders wealth. Do you agree? Justify.
4. Comment on the major applications of EVA.
5. Analyse the need for EVA in today’s competitive scenario.
6. Elucidate how EVA is much better & efficient approach than other traditional approaches.
7. “Successful implementation of EVA requires a substantial commitment by managers andemployees at all levels of an organisation.” Comment.
8. Critically appraise the Economic value added approach.
9. Given sales of a company- 4,500,000/-, cost of goods- 2,857,600/- & tax paid by the firmis 50000/-. Calculate NOPAT from the given data.
10. If XYZ employs a total capital of 15,896,000 & return on capital is 15%. The cost of capitalis 12%. Calculate EVA.
Answers: Self Assessment
1. Economic Value Added (EVA) 2. surplus 3. opportunity
4. investment 5. GAAP 6. different
7. investment centre 8. budgetary 9. equity cost
10. total debt 11. earning 12. investment
13. ROI 14.EVA K
1´ 15. large, small
4.8 Further Readings
Books Dr Pradeep Kumar Sinha, Financial Management, New Delhi, Excel Books, 2009.
Van Horne, J.C. and Wachowicz, Jr, J.M., Fundamentals of Financial Management,New Delhi, Prentice Hall of India Pvt. Ltd., 1996, p. 2.
Chandra, P., Financial Management—Theory and Practice, New Delhi, Tata McGrawHill Publishing Company Ltd., 2002, p. 3.

66 LOVELY PROFESSIONAL UNIVERSITY
Financial Management
Notes Unit 5: Risk and Return Analysis
CONTENTS
Objectives
Introduction
5.1 Risk and Return Characterization
5.1.1 Return Defined
5.1.2 Risk Preferences
5.2 Risk Measurement
5.2.1 Risk Assessment
5.2.2 Probability Distribution
5.2.3 Risk Measurement Quantitatively
5.3 Portfolio Theory and Risk Diversification
5.3.1 Portfolio Return and Standard Deviation
5.3.2 Measuring Portfolio Risk
5.3.3 Variance of a Portfolio
5.3.4 Minimum Variance Portfolio
5.4 Portfolio Risk and Correlation
5.4.1 Portfolio Risk N-Security Case
5.4.2 Systematic and Unsystematic Risk
5.5 Capital Asset Pricing Model (CAPM)
5.5.1 Assumptions of CAPM
5.5.2 Interpreting Beta
5.5.3 Limitations of CAPM
5.6 Summary
5.7 Keywords
5.8 Review Questions
5.9 Further Readings
Objectives
After studying this unit, you will be able to:
Recognize the concept of risk and return and determine their relationship
Differentiate relevant and irrelevant risk
Explain the measurement of risk
Describe the use of Capital Asset Pricing Model (CAPM)
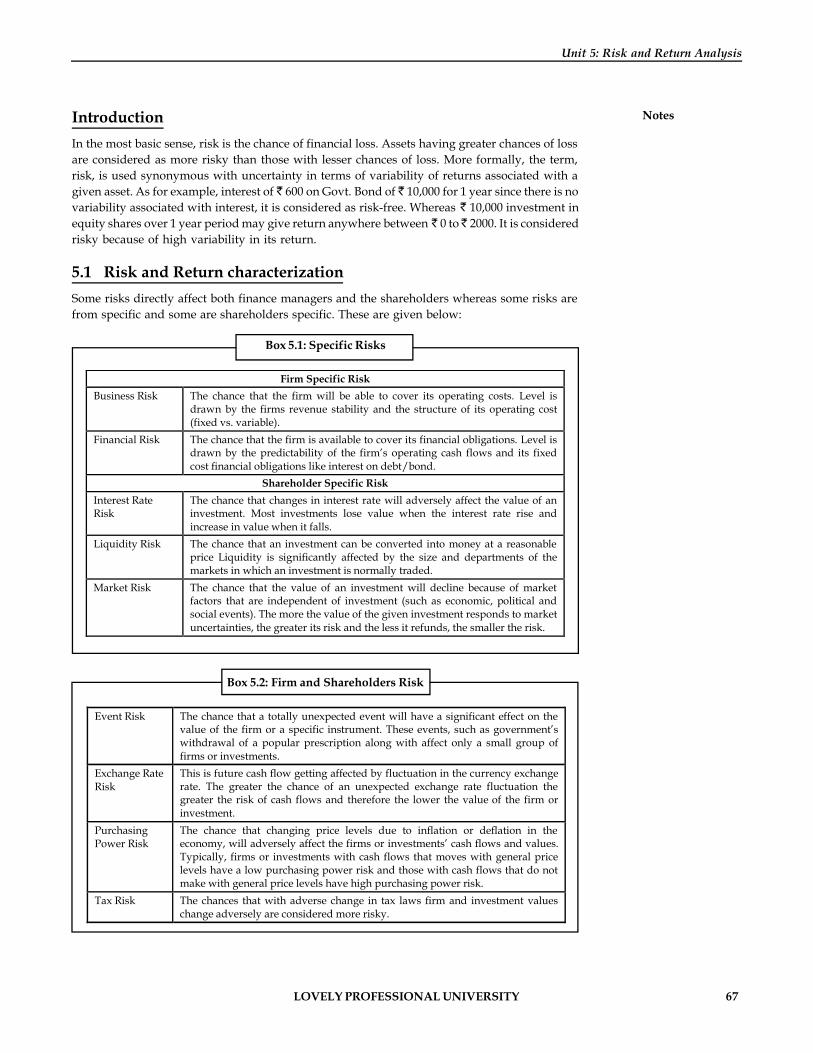
LOVELY PROFESSIONAL UNIVERSITY 67
Unit 5: Risk and Return Analysis
NotesIntroductionIn the most basic sense, risk is the chance of financial loss. Assets having greater chances of lossare considered as more risky than those with lesser chances of loss. More formally, the term,risk, is used synonymous with uncertainty in terms of variability of returns associated with agiven asset. As for example, interest of 600 on Govt. Bond of 10,000 for 1 year since there is novariability associated with interest, it is considered as risk-free. Whereas 10,000 investment inequity shares over 1 year period may give return anywhere between 0 to 2000. It is consideredrisky because of high variability in its return.
5.1 Risk and Return characterizationSome risks directly affect both finance managers and the shareholders whereas some risks arefrom specific and some are shareholders specific. These are given below:
Box 5.1: Specific Risks
Firm Specific Risk Business Risk The chance that the firm will be able to cover its operating costs. Level is
drawn by the firms revenue stability and the structure of its operating cost (fixed vs. variable).
Financial Risk The chance that the firm is available to cover its financial obligations. Level is drawn by the predictability of the firm’s operating cash flows and its fixed cost financial obligations like interest on debt/bond.
Shareholder Specific Risk Interest Rate Risk
The chance that changes in interest rate will adversely affect the value of an investment. Most investments lose value when the interest rate rise and increase in value when it falls.
Liquidity Risk The chance that an investment can be converted into money at a reasonable price Liquidity is significantly affected by the size and departments of the markets in which an investment is normally traded.
Market Risk The chance that the value of an investment will decline because of market factors that are independent of investment (such as economic, political and social events). The more the value of the given investment responds to market uncertainties, the greater its risk and the less it refunds, the smaller the risk.
Box 5.2: Firm and Shareholders Risk
Event Risk The chance that a totally unexpected event will have a significant effect on the value of the firm or a specific instrument. These events, such as government’s withdrawal of a popular prescription along with affect only a small group of firms or investments.
Exchange Rate Risk
This is future cash flow getting affected by fluctuation in the currency exchange rate. The greater the chance of an unexpected exchange rate fluctuation the greater the risk of cash flows and therefore the lower the value of the firm or investment.
Purchasing Power Risk
The chance that changing price levels due to inflation or deflation in the economy, will adversely affect the firms or investments’ cash flows and values. Typically, firms or investments with cash flows that moves with general price levels have a low purchasing power risk and those with cash flows that do not make with general price levels have high purchasing power risk.
Tax Risk The chances that with adverse change in tax laws firm and investment values change adversely are considered more risky.
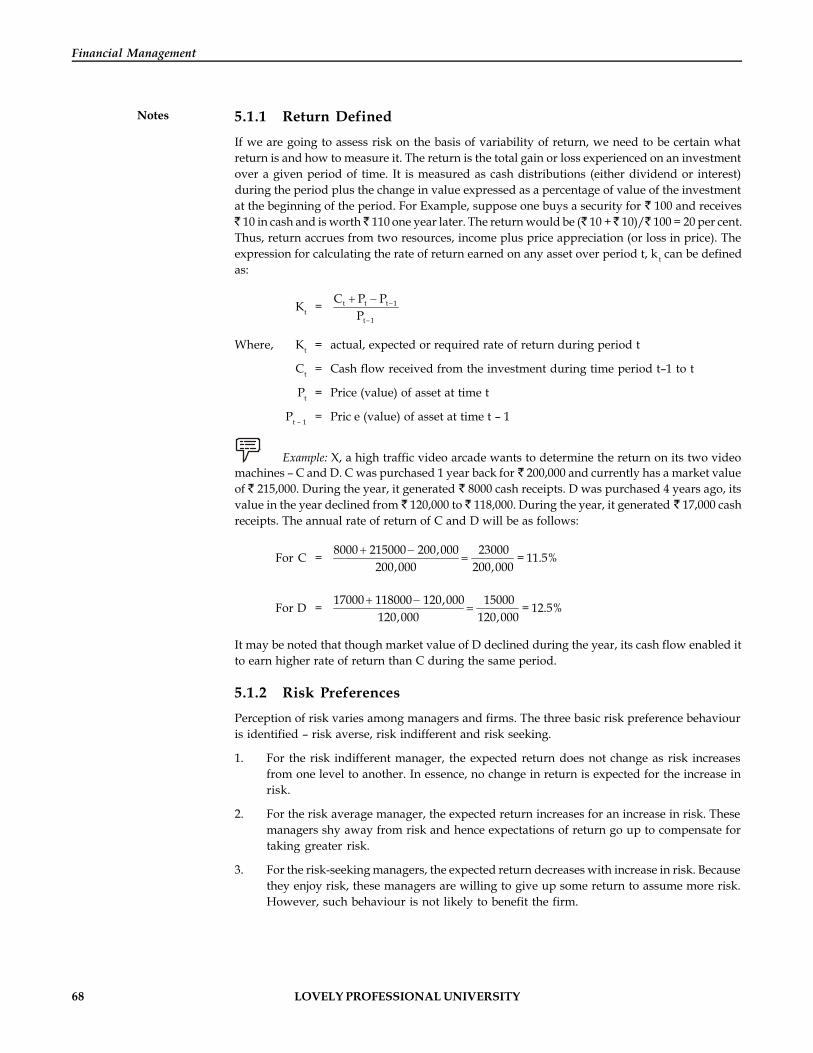
68 LOVELY PROFESSIONAL UNIVERSITY
Financial Management
Notes 5.1.1 Return DefinedIf we are going to assess risk on the basis of variability of return, we need to be certain whatreturn is and how to measure it. The return is the total gain or loss experienced on an investmentover a given period of time. It is measured as cash distributions (either dividend or interest)during the period plus the change in value expressed as a percentage of value of the investmentat the beginning of the period. For Example, suppose one buys a security for 100 and receives
10 in cash and is worth 110 one year later. The return would be ( 10 + 10)/ 100 = 20 per cent.Thus, return accrues from two resources, income plus price appreciation (or loss in price). Theexpression for calculating the rate of return earned on any asset over period t, k t can be definedas:
Kt = t t t 1
t 1
C P PP
-
-
+ -
Where, Kt = actual, expected or required rate of return during period t
Ct = Cash flow received from the investment during time period t–1 to t
Pt = Price (value) of asset at time t
Pt – 1 = Pric e (value) of asset at time t – 1
Example: X, a high traffic video arcade wants to determine the return on its two videomachines – C and D. C was purchased 1 year back for 200,000 and currently has a market valueof 215,000. During the year, it generated 8000 cash receipts. D was purchased 4 years ago, itsvalue in the year declined from 120,000 to 118,000. During the year, it generated 17,000 cashreceipts. The annual rate of return of C and D will be as follows:
For C = 8000 215000 200,000 23000200,000 200,000
+ -= = 11.5%
For D = 17000 118000 120,000 15000120,000 120,000
+ -= = 12.5%
It may be noted that though market value of D declined during the year, its cash flow enabled itto earn higher rate of return than C during the same period.
5.1.2 Risk PreferencesPerception of risk varies among managers and firms. The three basic risk preference behaviouris identified – risk averse, risk indifferent and risk seeking.
1. For the risk indifferent manager, the expected return does not change as risk increasesfrom one level to another. In essence, no change in return is expected for the increase inrisk.
2. For the risk average manager, the expected return increases for an increase in risk. Thesemanagers shy away from risk and hence expectations of return go up to compensate fortaking greater risk.
3. For the risk-seeking managers, the expected return decreases with increase in risk. Becausethey enjoy risk, these managers are willing to give up some return to assume more risk.However, such behaviour is not likely to benefit the firm.
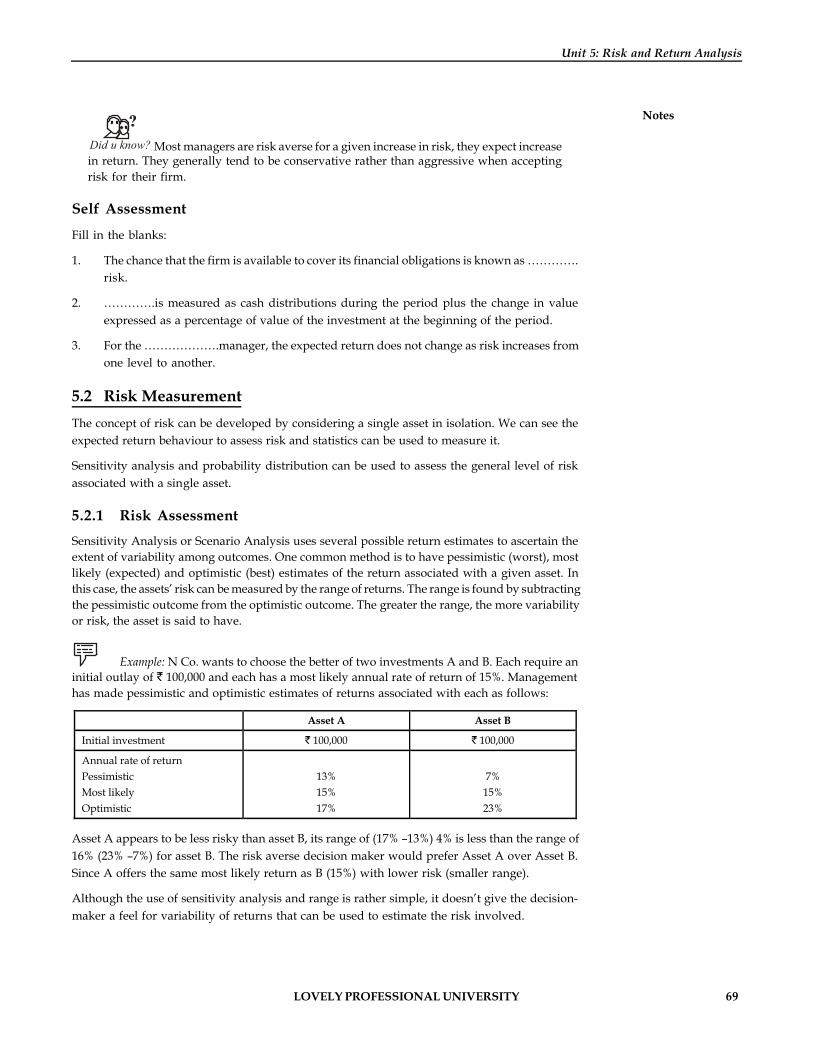
LOVELY PROFESSIONAL UNIVERSITY 69
Unit 5: Risk and Return Analysis
Notes
Did u know? Most managers are risk averse for a given increase in risk, they expect increasein return. They generally tend to be conservative rather than aggressive when acceptingrisk for their firm.
Self Assessment
Fill in the blanks:
1. The chance that the firm is available to cover its financial obligations is known as ………….risk.
2. ………….is measured as cash distributions during the period plus the change in valueexpressed as a percentage of value of the investment at the beginning of the period.
3. For the ……………….manager, the expected return does not change as risk increases fromone level to another.
5.2 Risk MeasurementThe concept of risk can be developed by considering a single asset in isolation. We can see theexpected return behaviour to assess risk and statistics can be used to measure it.
Sensitivity analysis and probability distribution can be used to assess the general level of riskassociated with a single asset.
5.2.1 Risk AssessmentSensitivity Analysis or Scenario Analysis uses several possible return estimates to ascertain theextent of variability among outcomes. One common method is to have pessimistic (worst), mostlikely (expected) and optimistic (best) estimates of the return associated with a given asset. Inthis case, the assets’ risk can be measured by the range of returns. The range is found by subtractingthe pessimistic outcome from the optimistic outcome. The greater the range, the more variabilityor risk, the asset is said to have.
Example: N Co. wants to choose the better of two investments A and B. Each require aninitial outlay of 100,000 and each has a most likely annual rate of return of 15%. Managementhas made pessimistic and optimistic estimates of returns associated with each as follows:
Asset A Asset B
Initial investment 100,000 100,000
Annual rate of return Pessimistic Most likely Optimistic
13% 15% 17%
7%
15% 23%
Asset A appears to be less risky than asset B, its range of (17% –13%) 4% is less than the range of16% (23% –7%) for asset B. The risk averse decision maker would prefer Asset A over Asset B.Since A offers the same most likely return as B (15%) with lower risk (smaller range).
Although the use of sensitivity analysis and range is rather simple, it doesn’t give the decision-maker a feel for variability of returns that can be used to estimate the risk involved.
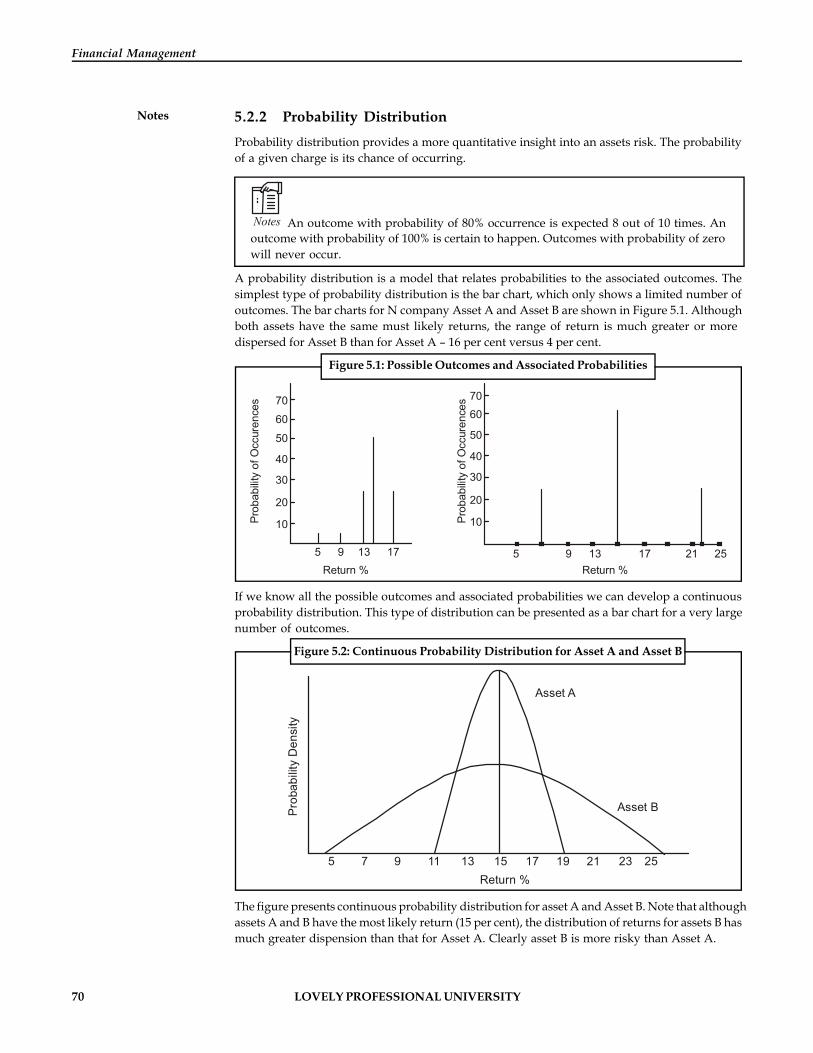
70 LOVELY PROFESSIONAL UNIVERSITY
Financial Management
Notes 5.2.2 Probability DistributionProbability distribution provides a more quantitative insight into an assets risk. The probabilityof a given charge is its chance of occurring.
Notes An outcome with probability of 80% occurrence is expected 8 out of 10 times. Anoutcome with probability of 100% is certain to happen. Outcomes with probability of zerowill never occur.
A probability distribution is a model that relates probabilities to the associated outcomes. Thesimplest type of probability distribution is the bar chart, which only shows a limited number ofoutcomes. The bar charts for N company Asset A and Asset B are shown in Figure 5.1. Althoughboth assets have the same must likely returns, the range of return is much greater or moredispersed for Asset B than for Asset A – 16 per cent versus 4 per cent.
Figure 5.1: Possible Outcomes and Associated Probabilities
Prob
abilit
y of
Occ
uren
ces
Prob
abilit
y of
Occ
uren
ces 70
60
50
40
30
20
10
5 9 13 17Return %
10
20
30
40
50
6070
5 9 13 17 21 25Return %
If we know all the possible outcomes and associated probabilities we can develop a continuousprobability distribution. This type of distribution can be presented as a bar chart for a very largenumber of outcomes.
Figure 5.2: Continuous Probability Distribution for Asset A and Asset B
Asset A
Asset B
Return %5 7 9 11 13 15 17 19 21 23 25
Pro
babi
lity
Den
sity
The figure presents continuous probability distribution for asset A and Asset B. Note that althoughassets A and B have the most likely return (15 per cent), the distribution of returns for assets B hasmuch greater dispension than that for Asset A. Clearly asset B is more risky than Asset A.

LOVELY PROFESSIONAL UNIVERSITY 71
Unit 5: Risk and Return Analysis
Notes5.2.3 Risk Measurement QuantitativelyThe risk of asset in addition to range can be measured quantitatively by using statisticalmethods – the standard deviation and the co-efficient of variation.
Standard Deviation
The most common statistical indicator of an asset’s risk is the standard deviation (6k) whichmeasures the dispension around the expected value k. The expected value of a return (k) is themost likely return on a given asset and is calculated as:
K =n
i ii 1
(k P )=
´å
where ki = return for the ith outcome
Pi = probability of occurrence of ith income
N = number of outcomes considered
The expression of Standard Deviation of returns (6k)
6K ==
´- ´å i i
i 1
0.8 0.03 (k k) P0.022
where represents the square root.
The square of the standard deviation (6k)2 is known as variance of the distribution.
Co-efficient of Variation
The coefficient of variation (CV) is a measure of relative dispension that is useful in comparingthe risk of assets with differing expected returns. Thus coefficient of variation (CV) is
CV = k S tandard Deviation of Returns6K Expected value of a return
=
Did u know? The higher the coefficient of variation, the greater the risk.
Example: The probability distribution of returns for assets A and B
Assets A Assets B
Returns Probability Returns Probability
13% 0.2 0 0.1
15% 0.7 15% 0.7
17% 01 25% 0.2
Calculate the expected value, the standard deviation and the coefficient of variation of returns inrespect of Asset A and Asset B. Which of these mutually exclusive assets do you prefer and why?
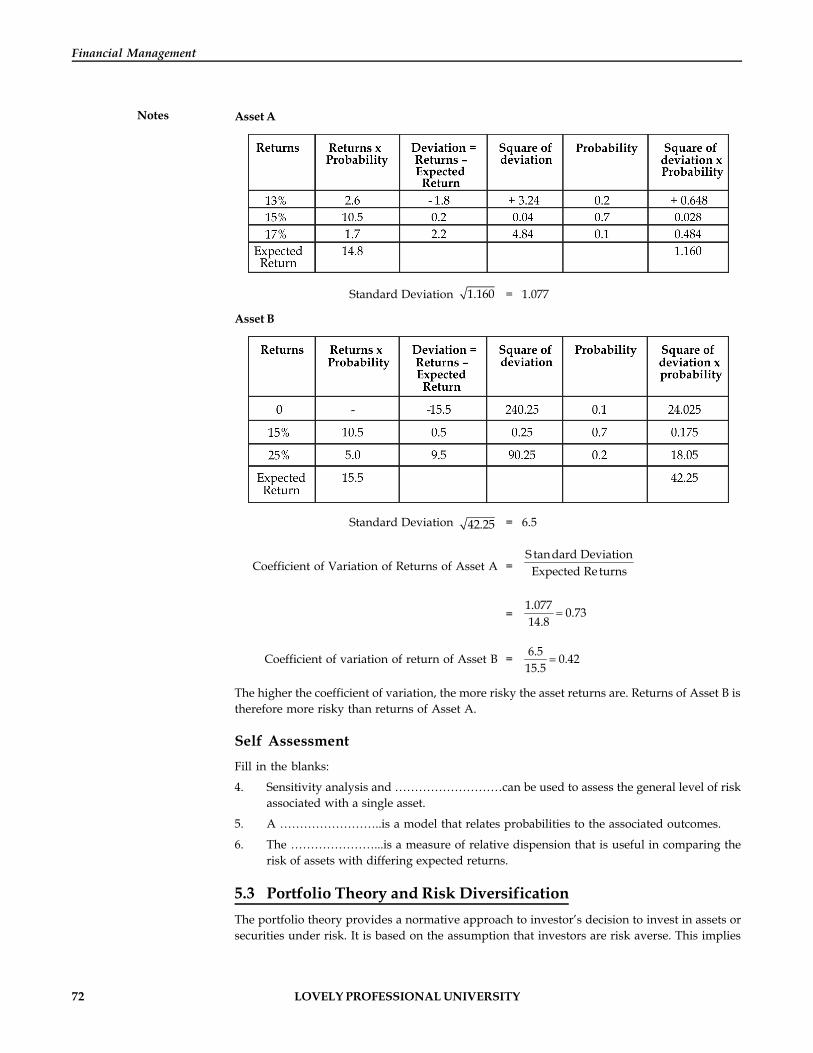
72 LOVELY PROFESSIONAL UNIVERSITY
Financial Management
Notes Asset A
Standard Deviation 1.160 = 1.077
Asset B
Standard Deviation 42.25 = 6.5
Coefficient of Variation of Returns of Asset A =S tandard Deviation
Expected Returns
=1.077 0.7314.8
=
Coefficient of variation of return of Asset B = 6.5 0.4215.5
=
The higher the coefficient of variation, the more risky the asset returns are. Returns of Asset B istherefore more risky than returns of Asset A.
Self AssessmentFill in the blanks:
4. Sensitivity analysis and ………………………can be used to assess the general level of riskassociated with a single asset.
5. A ……………………..is a model that relates probabilities to the associated outcomes.
6. The …………………...is a measure of relative dispension that is useful in comparing therisk of assets with differing expected returns.
5.3 Portfolio Theory and Risk DiversificationThe portfolio theory provides a normative approach to investor’s decision to invest in assets orsecurities under risk. It is based on the assumption that investors are risk averse. This implies

LOVELY PROFESSIONAL UNIVERSITY 73
Unit 5: Risk and Return Analysis
Notesthat investors hold well diversified portfolio instead of investing in a single asset or security. Aportfolio as the name signifies, is a bundle or a combination of individual assets or securities.Hence individuals concern should be on the expected return and risk of the portfolio rather thanon individual assets or securities. The second assumption of the portfolio theory is that thereturns of securities are normally distributed. This means that the expected value (mean) andvariance (or standard deviation) analysis is the foundation of the portfolio decisions.
5.3.1 Portfolio Return and Standard DeviationThe return of a portfolio is equal to the weightage average of the returns of individual assets orsecurities in the portfolio with weights being equal to the proportion of investment in eachasset.
Example: Suppose you have the opportunity of investing your wealth either in asset Xor asset Y. The possible outcomes of the two assets indifferent states of economy are givenbelow:
The expected rate of return of an individual asset:
K = (already seen earlier)
The expected rate of return of X is
xk = (–8 × 0.1) + (10 × .2) + (8 × 0.4) + (5 × 0.2) + (– 4 × 0.1) = 5%
and of Y =
yk = (14 × 0.1) + (– 4 × 0.2) + (6 × 0.4) + (15 × 0.2) + (20 × 0.1) =
8%Suppose you decide to invest 50% on X and 50% in Y.Since we know the expected rate of return of X (5 per cent) and Y (8%) and their weights (50%each) we can calculate the expected rate of return on the portfolio as the weighted average of theexpected rates of return of X and Y.i.e. 0.5 × 5 + 0.5 × 8 = 6.5%Thus, we can conclude the return on a portfolio is a weightage average of the returns on theindividual assets from which it is formed. The portfolio return
Kp = W1 × k1 + W2k2 + …….. Wnkn =
n
1 ii 1
W k
Where Wi = proportion of the portfolio rupee value represented by asset;ki = return on asset
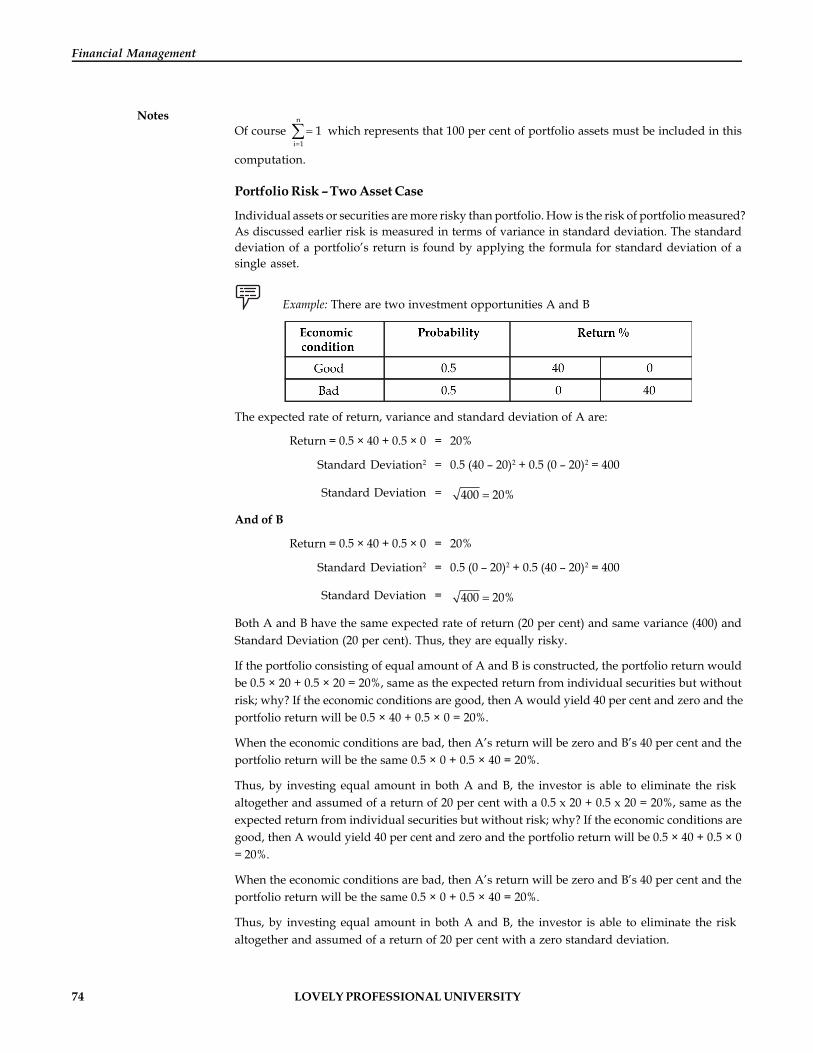
74 LOVELY PROFESSIONAL UNIVERSITY
Financial Management
NotesOf course
n
i 11
which represents that 100 per cent of portfolio assets must be included in this
computation.
Portfolio Risk – Two Asset Case
Individual assets or securities are more risky than portfolio. How is the risk of portfolio measured?As discussed earlier risk is measured in terms of variance in standard deviation. The standarddeviation of a portfolio’s return is found by applying the formula for standard deviation of asingle asset.
Example: There are two investment opportunities A and B
The expected rate of return, variance and standard deviation of A are:
Return = 0.5 × 40 + 0.5 × 0 = 20%
Standard Deviation2 = 0.5 (40 – 20)2 + 0.5 (0 – 20)2 = 400
Standard Deviation = 400 20%
And of B
Return = 0.5 × 40 + 0.5 × 0 = 20%
Standard Deviation2 = 0.5 (0 – 20)2 + 0.5 (40 – 20)2 = 400
Standard Deviation = 400 20%
Both A and B have the same expected rate of return (20 per cent) and same variance (400) andStandard Deviation (20 per cent). Thus, they are equally risky.
If the portfolio consisting of equal amount of A and B is constructed, the portfolio return wouldbe 0.5 × 20 + 0.5 × 20 = 20%, same as the expected return from individual securities but withoutrisk; why? If the economic conditions are good, then A would yield 40 per cent and zero and theportfolio return will be 0.5 × 40 + 0.5 × 0 = 20%.
When the economic conditions are bad, then A’s return will be zero and B’s 40 per cent and theportfolio return will be the same 0.5 × 0 + 0.5 × 40 = 20%.
Thus, by investing equal amount in both A and B, the investor is able to eliminate the riskaltogether and assumed of a return of 20 per cent with a 0.5 x 20 + 0.5 x 20 = 20%, same as theexpected return from individual securities but without risk; why? If the economic conditions aregood, then A would yield 40 per cent and zero and the portfolio return will be 0.5 × 40 + 0.5 × 0= 20%.
When the economic conditions are bad, then A’s return will be zero and B’s 40 per cent and theportfolio return will be the same 0.5 × 0 + 0.5 × 40 = 20%.
Thus, by investing equal amount in both A and B, the investor is able to eliminate the riskaltogether and assumed of a return of 20 per cent with a zero standard deviation.
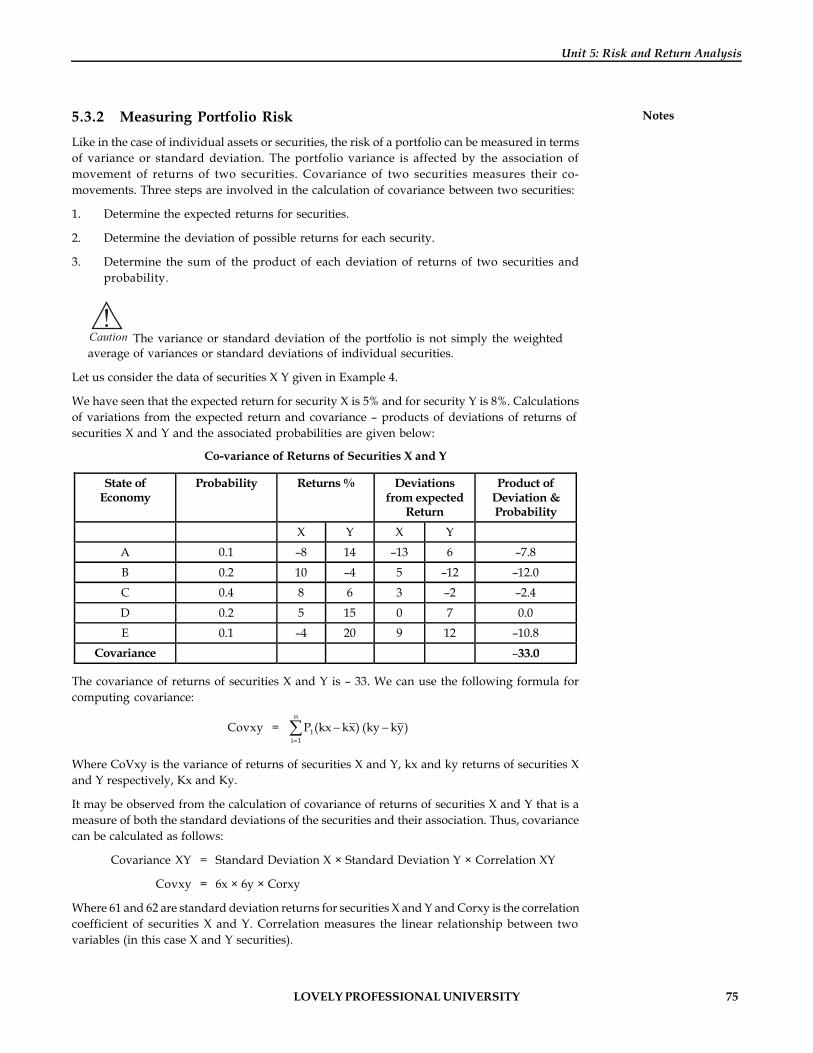
LOVELY PROFESSIONAL UNIVERSITY 75
Unit 5: Risk and Return Analysis
Notes5.3.2 Measuring Portfolio RiskLike in the case of individual assets or securities, the risk of a portfolio can be measured in termsof variance or standard deviation. The portfolio variance is affected by the association ofmovement of returns of two securities. Covariance of two securities measures their co-movements. Three steps are involved in the calculation of covariance between two securities:
1. Determine the expected returns for securities.
2. Determine the deviation of possible returns for each security.
3. Determine the sum of the product of each deviation of returns of two securities andprobability.
!Caution The variance or standard deviation of the portfolio is not simply the weightedaverage of variances or standard deviations of individual securities.
Let us consider the data of securities X Y given in Example 4.
We have seen that the expected return for security X is 5% and for security Y is 8%. Calculationsof variations from the expected return and covariance – products of deviations of returns ofsecurities X and Y and the associated probabilities are given below:
Co-variance of Returns of Securities X and Y
State of Economy
Probability Returns % Deviations from expected
Return
Product of Deviation & Probability
X Y X Y A 0.1 –8 14 –13 6 –7.8
B 0.2 10 –4 5 –12 –12.0 C 0.4 8 6 3 –2 –2.4
D 0.2 5 15 0 7 0.0 E 0.1 –4 20 9 12 –10.8
Covariance –33.0
The covariance of returns of securities X and Y is – 33. We can use the following formula forcomputing covariance:
Covxy =n
1i 1
P (kx kx) (ky ky)
Where CoVxy is the variance of returns of securities X and Y, kx and ky returns of securities Xand Y respectively, Kx and Ky.
It may be observed from the calculation of covariance of returns of securities X and Y that is ameasure of both the standard deviations of the securities and their association. Thus, covariancecan be calculated as follows:
Covariance XY = Standard Deviation X × Standard Deviation Y × Correlation XY
Covxy = 6x × 6y × Corxy
Where 61 and 62 are standard deviation returns for securities X and Y and Corxy is the correlationcoefficient of securities X and Y. Correlation measures the linear relationship between twovariables (in this case X and Y securities).
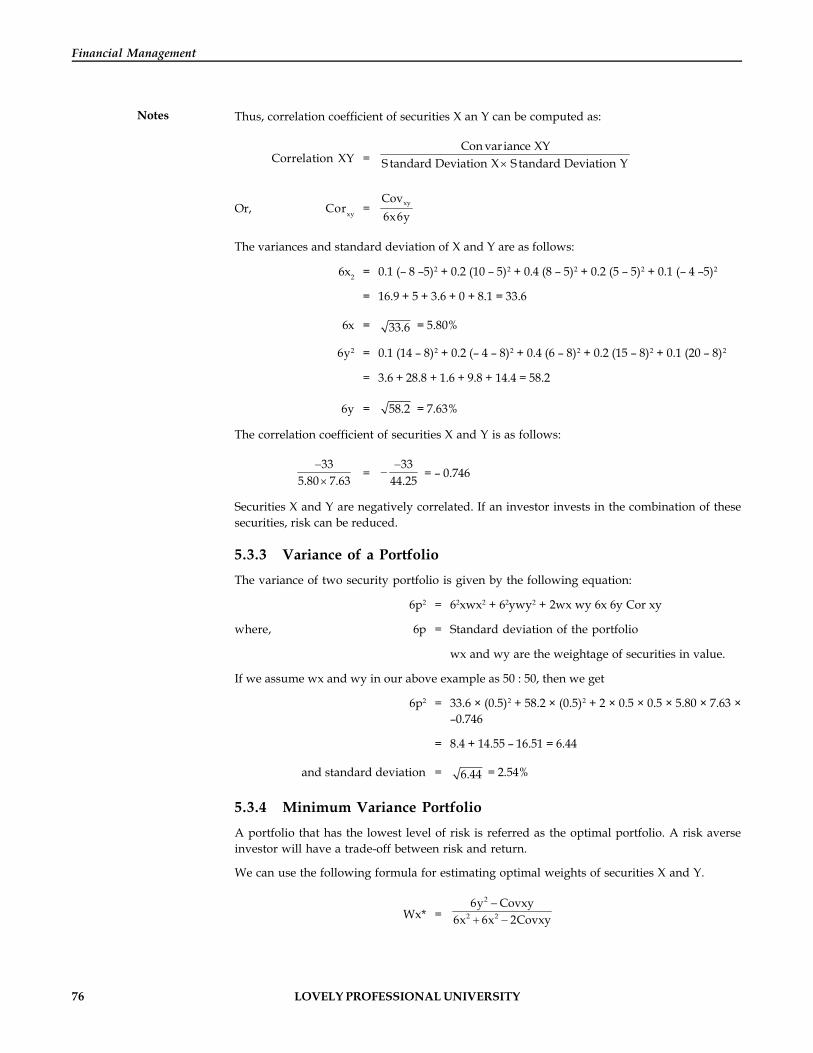
76 LOVELY PROFESSIONAL UNIVERSITY
Financial Management
Notes Thus, correlation coefficient of securities X an Y can be computed as:
Correlation XY = ´
Con var iance XYS tandard Deviation X S tandard Deviation Y
Or, Corxy = xyCov6x6y
The variances and standard deviation of X and Y are as follows:
6x2 = 0.1 (– 8 –5)2 + 0.2 (10 – 5)2 + 0.4 (8 – 5)2 + 0.2 (5 – 5)2 + 0.1 (– 4 –5)2
= 16.9 + 5 + 3.6 + 0 + 8.1 = 33.6
6x = 33.6 = 5.80%
6y2 = 0.1 (14 – 8)2 + 0.2 (– 4 – 8)2 + 0.4 (6 – 8)2 + 0.2 (15 – 8)2 + 0.1 (20 – 8)2
= 3.6 + 28.8 + 1.6 + 9.8 + 14.4 = 58.2
6y = 58.2 = 7.63%
The correlation coefficient of securities X and Y is as follows:
335.80 7.63
-
´=
3344.25-
- = – 0.746
Securities X and Y are negatively correlated. If an investor invests in the combination of thesesecurities, risk can be reduced.
5.3.3 Variance of a PortfolioThe variance of two security portfolio is given by the following equation:
6p2 = 62xwx2 + 62ywy2 + 2wx wy 6x 6y Cor xy
where, 6p = Standard deviation of the portfolio
wx and wy are the weightage of securities in value.
If we assume wx and wy in our above example as 50 : 50, then we get
6p2 = 33.6 × (0.5)2 + 58.2 × (0.5)2 + 2 × 0.5 × 0.5 × 5.80 × 7.63 ×–0.746
= 8.4 + 14.55 – 16.51 = 6.44
and standard deviation = 6.44 = 2.54%
5.3.4 Minimum Variance PortfolioA portfolio that has the lowest level of risk is referred as the optimal portfolio. A risk averseinvestor will have a trade-off between risk and return.
We can use the following formula for estimating optimal weights of securities X and Y.
Wx* =2
2 26y Covxy
6x 6x 2Covxy-
+ -
LOVELY PROFESSIONAL UNIVERSITY 77
Unit 5: Risk and Return Analysis
NotesWhere Wx* is the proportion of investment in security X (since the variance in Security X islower than Y). Investment in Y will be 1 – Wx*. In the above example, we find
Wx* = 58.2 ( 33) 91.258.2 33.6 2( 33) 157.6
- -=
+ - - = 0.578
Thus, the weight of Y will be 1 – 0.578 = 0.422
The portfolio variance (with 57.8 per cent of investment in X and 42.2 per cent in Y) is:
6p2 = 33.6 (0.578)2 + 58.2 (0.422)2 + 2(0.578) (0.422) (5.80) × (7.63) (–746)
6p2 = 11.23 + 10.36 – 16.11 = 5.48
Any other combination of X and Y will yield a higher variance.
(In the earlier example of 50% and 50% weights, we have seen the variance as 6.44)
Self AssessmentFill in the blanks:
7. The return of a portfolio is equal to the ………………..of the returns of individual assets.
8. A portfolio that has the lowest level of risk is referred as the …………….portfolio.
9. The portfolio ……………is affected by the association of movement of returns of twosecurities.
5.4 Portfolio Risk and CorrelationThe risk of portfolio of X and Y has considerably reduced due to the negative correlationbetween returns of securities X and Y. The above example shows that risk can be reduced byinvesting in more than one security. However, the extent of benefits of portfolio diversificationdepends on the correlation between returns of securities.
The correlation coefficient will always be between +1 and –1. Returns of securities vary perfectlywhen the correlation coefficient is + 1.0 and is perfectly opposite direction when it is – 1.0. A zerocorrelation coefficient implies that there is no relationship between the return of securities. Inpractice, the correlation coefficients of returns of securities may vary between +1 and –1. Howthe portfolio variance is affected by the Correlation Coefficient can be explained by an example.
Example: Securities M and N are equally risky but they have different expected returns:
Km = 0.16 62m = 0.04 Kn = 0.24 6n = 0.20
Wm = 0.50 ám = 0.20 Wn = 0.50 62n= 0.04
What is the portfolio variance if (a) Cormn = = +1.0, (b) Cormn = –1.0 (c) Cormn = +0.10 and(d) Cormn – 0.10
Perfect Positive Correlation
When the returns of two securities M and N are perfectly positively correlated the portfoliovariance will be
6p2 = 0.04 (0.5)2 + 0.04 (0.5)2 + 2 (0.5)(0.5) (1.0)(0.2)(0.2)
= 0.01 + 0.01 + 0.02 = 0.04
The portfolio variance is just equal to the variance of individual securities. Thus, the combinationof securities M and N is as risky as the individual securities.

78 LOVELY PROFESSIONAL UNIVERSITY
Financial Management
Notes Perfect Negative Correlation
If the returns of securities M and N are perfectly negative correlative the portfolio variance will be:
6p2 = 0.04 (0.5)2 + 0.04 (0.5) + 2 (0.5)(0.5) (–1.0)(0.2)(0.2)
= 0.01 + 0.01 –0.02 = 0
The portfolio variance is zero. The combination of securities M and N completely reduces therisk.
Weak Positive Correlation: The portfolio variance under weak positive correlation (+0.10) isgiven below:
6p2 = 0.04 (0.5)2 + 0.04 (0.5)2 + 2 (0.5)(0.5) (0.1)(0.2)(0.2)
= 0.01 + 0.01 + 0.002 = 0.022
The portfolio variance is less than the variance of individual securities.
Weak Negative Correlation
The portfolio variance under weak negative correlation (–0.10) is given below:
6p2 = 0.04 (0.5)2 + 0.04 (0.5)2 + 2 (0.5)(0.5) (–1.0)(0.2)(0.2)
= 0.01 + 0.01 –0.002 = 0.018
The portfolio variance has reduced more than when the returns were weak positive correlated.
5.4.1 Portfolio Risk N-Security CaseWe have so far discussed the computation of risk when a two security portfolio is formed. Thecalculations of risk becomes quite involved when a large number of securities are combined toform a portfolio.
Based on the logic of the portfolio risk in a two security case, the portfolio risk (measured asvariance) in N security can be calculated as follows:
6p2 = n(1/n)2 × average variance (+n2 – n) (1/n)2 × average covariance
= (1/n) × average variance + (1 – 1/n) × average covariance
It may be noted that the first term on the right hand side (1/n) will become insignificant whenn is very large and thus the positive variance will become approximately equal to averagecovariance.
5.4.2 Systematic and Unsystematic RiskRisk has two parts. A part of the risk arises from the uncertainties which are unique to individualsecurities and which is diversifiable if large number of securities are combined to form welldiversified portfolios. The unique risk of individual securities in a portfolio cancel out eachother. This part of the risk can be totally reduced through diversification and is calledunsystematic or unique risk. The examples of unsystematic risk are:
1. The company loses a big contract in a bid.
2. The company makes a breakthrough in process innovation.
3. The R&D expert of the company leaves.
4. Workers declare strike in a company.
5. A formidable competitor enters the market.
LOVELY PROFESSIONAL UNIVERSITY 79
Unit 5: Risk and Return Analysis
Notes6. The government increases customs duty on the material used by the company.
7. The company is not able to obtain adequate quantity of raw materials from the suppliers.
The other part of the risk arises on account of economywide uncertainties and the tendency ofindividual securities to move together with changes in the market. This part of the risk cannotbe reduced through diversification and it is called systematic or markets risk. The examples ofsystematic risk are:
1. The government changes the interest rate policy.
2. The corporate tax rate is increased.
3. The government resorts to massive deficit financing.
4. The inflation rate increases.
5. The Reserve Bank of India announces a restrictive credit policy.
Notes Investors are exposed to market risk even when they hold well diversified portfoliosof securities.
Total risk, which in the case of an individual security, is the variance (or standard deviation) ofits return can be divided into two parts.
Total risk = Systematic risk + Unsystematic risk
Self AssessmentFill in the blanks:
10. The extent of benefits of portfolio diversification depends on the ……………..betweenreturns of securities.
11. Part of the risk that cannot be reduced through diversification is called ……………ormarkets risk.
12. The ……………………..will always be between +1 and –1.
5.5 Capital Asset Pricing Model (CAPM)CAPM provides a framework for measuring the systematic risk of an individual security andrelates it to the systematic risk of a well diversified portfolio. In the context of CAPM, the risk ofan individual security is defined as the volatility of the security’s return vis-à-vis the return of amarket portfolio. The risk (volatility) of individual securities is measured by (beta). Beta is ameasure of a security’s risk relative to the market portfolio. Since diversifiable risk does notmatter, beta is thus a measure of systematic risk of a security.
Risk free security has no volatility and it has a zero beta:
The Capital Asset Pricing Model is given in equataion:
K1 = Rf + 1 × (km – Rf)
Where K1 = required rate of an asset I
Rf = risk-free rate of return, commonly measured by return on treasurybills or government securities
1 = beta coefficient or index of non diversifiable risk for the asset I
Km = market rate of return on the market portfolio of assets

80 LOVELY PROFESSIONAL UNIVERSITY
Financial Management
Notes The CAPM can be divided into two parts (1) risk-free interest Rf which is required return on arisk free asset typically treasury bill or short-term government security and (2) the risk premium.These are respectively the two elements on the either side of the plus sign in the above equation.The (km – Rf) portion of the risk premium is called the market risk premium, because it representsthe premium – the investor must receive for taking the average amount of risk associated withholding the market portfolio of assets.
The risk premium is the highest for small company stocks, followed by large company stocks,long-term corporate bonds, and long-term government bonds. Small company stocks are riskierthan large company stocks, which are riskier than long-term corporate bonds (equity is riskierthan debt instrument).
Long-term corporate bonds are riskier than long-term government bonds (because thegovernment is less likely to ravage on debt). And of course, treasury bills and short-termgovernment securities because of no default risk, very short maturity virtually risk-free asindicated by zero risk premium.
Other things being equal, the higher the beta, the higher the required return and lower the beta,the lower the required return.
Example: B Co. Ltd., wishes to determine the required rate of return on an asset Z, whichhas a beta of 1.5. The risk free rate of return is 7%, the return on market portfolio of assets is 11%.Thus we get:
Kz = 7% + 1.5 (11% –7%) = 7% + 6% = 13%
The market risk premium 4% (11% –7%) when adjusted for the assets index of risk (beta) of 1.5,results in a risk premium of 6% (1.5 × 4%). That risk premium when added to 7% risk-free return,results in 13% required return.
5.5.1 Assumptions of CAPM1. Market efficiency: The capital markets are efficient. The capital market efficiency implies
that share prices reflect all available information.
2. Risk aversion: Investors are risk-averse. They evaluate a security’s return and risk interms of the expected return and variance or standard deviation respectively. They preferthe highest expected return for a given level of risk.
3. Homogenous expectations: All the investors have the same explanation about the expectedreturn and risk of securities.
4. Single time period: All investors can lend or borrow at risk-free rate of interest.
5. Risk-free rate: All investors can lend or borrow at a risk-free rate of interest.
5.5.2 Interpreting BetaThe beta of a portfolio can be easily estimated by using the betas of the individual assets itincludes. Suppose w1, represent the proportion of the portfolio’s total rupee value representedby asset j, and let , denotes beta of the asset, the portfolio beta
p = (w1 × 1) + (w2 × 2) + ………….. ( )n
n 1 1i 1wn w=
´ = ´å
of coursen
i 1=å = I which means that 100 per cent of the portfolio’s assets must be
included in the computation.
LOVELY PROFESSIONAL UNIVERSITY 81
Unit 5: Risk and Return Analysis
NotesPortfolio betas are interpreted in the same way as the betas of individual assets. They indicatethe degree of responsiveness of the portfolio’s return to changes in the market return. Forexample, when the market return increases by 10 per cent, a portfolio with a beta of 0.75 willexperience a 7.5 per cent increase in its return (0.75 × 10%).
Again since beta measures the relative volatility of a security’s return, in relation to the marketreturn, it should be measured in terms of security’s and markets’ covariance and markets variance.Thus 1 can be measured by:
1 =s s s
= =s s s
i m 1 m m 1 m2 2
Cov(K , K ) Cor j Cor jm m
Where, ki = The expected return on indiversifiable security
Km = The expected return on market portfolio
s1 = Standard deviation of the security
sm = Standard deviation of the market portfolio
Cov(kikm) = Covariance of security with regard to market portfolio
Corjm = Correlation coefficient of the security with the market
Example: An investor is seeking the price to pay for a security whose standard deviationis 3.00 per cent. The correlation coefficient for the security with the market is 0.8 and the marketstandard deviation is 2.2 per cent. The return for government securities is 7.2 per cent and fromthe market portfolio 12.8 per cent. The investors know that, by calculating the required return hecan determine the price to pay for the security. What is the required return on the security?
Solution:
Beta Coefficient = 0.8 0.03 1.09090.022´
=
Required rate of return = 0.072 + 1.0909 × (0.128 – 0.072)
= 0.072 + 0.061 = 0.133
Task An investor holds two equity shares X and Y in equal proportion with the followingrisks and return characteristics:
Return of Security X = 24 %; Return of Security Y = 19 %
Standard Deviation of X = 28% Standard Deviation of Y = 23 %
The return of these securities has a positive correlation of 0.6. You are required to calculatethe portfolio return and risk. Further suppose that the investor wants to reduce the portfoliorisk to 15 per cent. How much should the correlative coefficient be to bring the particularrisk to the desired level?
5.5.3 Limitations of CAPM1. It is based on unrealistic assumptions that are far from reality. For example, it is very
difficult to find a risk-free security, since inflation causes uncertainty about the real rate ofreturn. The assumption of the equality of lending and borrowing rate is also not correct.Further, investors may not hold highly diversified portfolio or the market indices maynot be well-diversified.
82 LOVELY PROFESSIONAL UNIVERSITY
Financial Management
Notes 2. It is difficult to test the validity of CAPM from a practical point of view.
3. Betas do not remain stable over time. Beta is a measure of a security’s future risk. Butinvestors do not have future data to estimate beta. What they have are past data about theshare prices and market portfolio. Thus, they can only estimate beta based on historicaldata. This implies that historical betas are poor indicators of the future risk of securities.
!Caution Investors can use historical data as the measure of future risk only if it is a stableover time.
Despite the limitations of CAPM, it provides a useful conceptual framework for evaluating andlinking risk and return. An awareness of the trade-off and an attempt to consider risk as well asreturn in financial decision-making should help financial managers achieve their goals.
Self AssessmentFill in the blanks:
13. …………is a measure of a security’s risk relative to the market portfolio.
14. The CAPM can be divided into two parts which are risk-free interest and the………………..
15. ………….provides a framework for measuring the systematic risk of an individual securityand relates it to the systematic risk of a well diversified portfolio.
Case Study Case: To Invest or Not?
Wipro Company has asked the investors to invest in their securities & whilemaking an offer, they have provided you with the following information. Fora period of 10 years, company has provided you with the rate of return on
security & return on the market portfolio of its securities as:
Period Return on security WIPRO (%) Return on market portfolio (%)
1 20 22
2 22 20
3 25 18
4 21 16
5 18 20
6 -5 8
7 17 -6
8 19 5
9 -7 6
10 20 11
You as an investor have decided to invest in the securities of the company. The anticipatedreturn with the associated probabilities is as:
Contd...

LOVELY PROFESSIONAL UNIVERSITY 83
Unit 5: Risk and Return Analysis
NotesReturn % -10 -15 5 12 10 20 13
Probability 0.03 0.02 0.15 0.25 0.3 0.1 0.05
Question
Now after getting all the details, what would you suggest, whether to invest in thesecurities or not and what would be your expected rate of return & risk in terms ofstandard deviation. Also give your comments based on the average rate of return, varianceand beta value for the company’s securities.
5.6 Summary Risk is the chance of financial loss.
Some risks directly affect both finance managers and the shareholders whereas some risksare from specific and some are shareholders specific.
Sensitivity analysis and probability distribution can be used to assess the general level ofrisk associated with a single asset.
Probability distribution provides a more quantitative insight into an assets risk.
The risk of asset in addition to range can be measured quantitatively by using statisticalmethods – the standard deviation and the co-efficient of variation.
The coefficient of variation (CV) is a measure of relative dispension that is useful incomparing the risk of assets with differing expected returns
The risk of a portfolio can be measured in terms of variance or standard deviation.
The correlation coefficient will always be between +1 and –1.
The part of the risk that can be totally reduced through diversification is called unsystematicrisk and the part of the risk that cannot be reduced through diversification is called systematicrisk.
Capital Asset Pricing Model (CAPM) provides a framework for measuring the systematicrisk of an individual security and relates it to the systematic risk of a well diversifiedportfolio.
5.7 KeywordsBeta: It is a measure of the systematic risk of a security that cannot be avoided throughdiversification.
Correlation: It is a statistical measure that indicates the relationship between series of numberrepresenting anything from cash flows to test data.
Covariance: It is the measure of their co-movement, expressing the degree to which the securitiesvary together.
Non-systematic Risk: The variability in a security is total returns not related to overall marketvariability.
Portfolio: It is a collection of securities
Risk: Probability that the expected return from the security will not materialize.
Systematic Risk: Variability in a security is total returns that are directly associated with overallmovements in the general market or economy is called systematic risk.
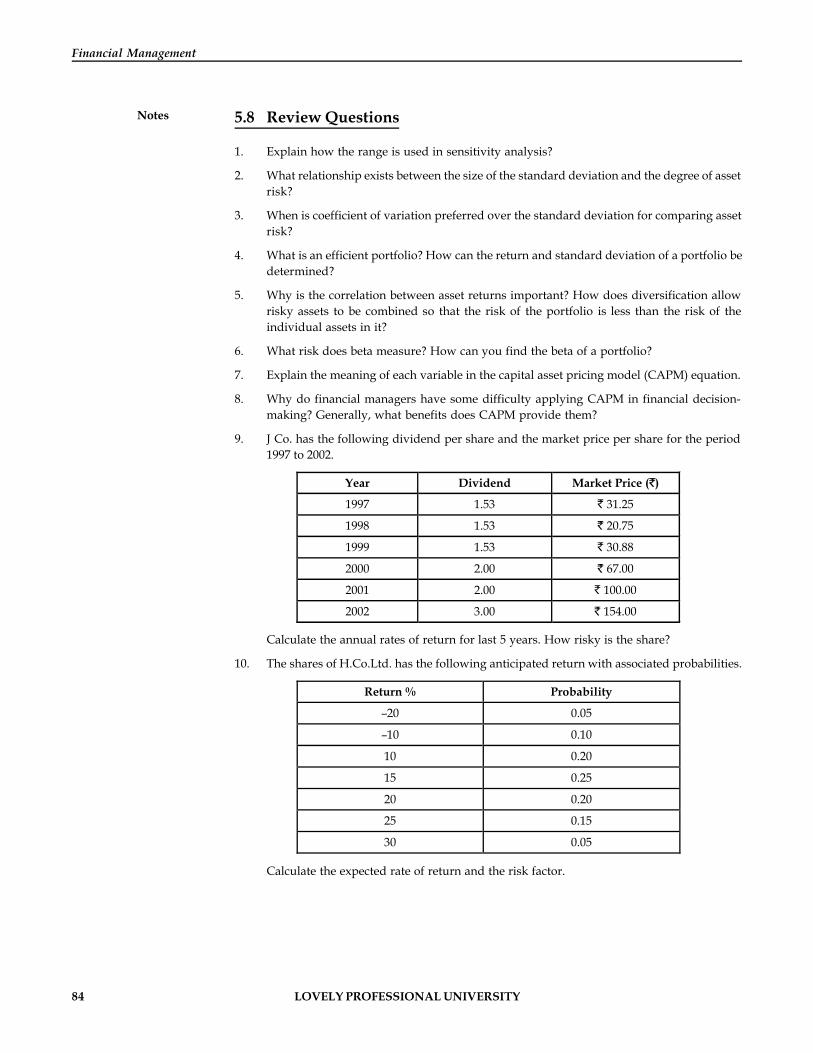
84 LOVELY PROFESSIONAL UNIVERSITY
Financial Management
Notes 5.8 Review Questions
1. Explain how the range is used in sensitivity analysis?
2. What relationship exists between the size of the standard deviation and the degree of assetrisk?
3. When is coefficient of variation preferred over the standard deviation for comparing assetrisk?
4. What is an efficient portfolio? How can the return and standard deviation of a portfolio bedetermined?
5. Why is the correlation between asset returns important? How does diversification allowrisky assets to be combined so that the risk of the portfolio is less than the risk of theindividual assets in it?
6. What risk does beta measure? How can you find the beta of a portfolio?
7. Explain the meaning of each variable in the capital asset pricing model (CAPM) equation.
8. Why do financial managers have some difficulty applying CAPM in financial decision-making? Generally, what benefits does CAPM provide them?
9. J Co. has the following dividend per share and the market price per share for the period1997 to 2002.
Year Dividend Market Price ( )
1997 1.53 31.25
1998 1.53 20.75
1999 1.53 30.88
2000 2.00 67.00
2001 2.00 100.00
2002 3.00 154.00
Calculate the annual rates of return for last 5 years. How risky is the share?
10. The shares of H.Co.Ltd. has the following anticipated return with associated probabilities.
Return % Probability
–20 0.05
–10 0.10
10 0.20
15 0.25
20 0.20
25 0.15
30 0.05
Calculate the expected rate of return and the risk factor.

LOVELY PROFESSIONAL UNIVERSITY 85
Unit 5: Risk and Return Analysis
NotesAnswers: Self Assessment
1. financial 2. Return 3. risk indifferent
4. probability distribution 5. probability distribution 6. coefficient of variation
7. weightage average 8. optimal 9. variance
10. correlation 11. systematic 12. correlation coefficient
13. Beta 14. risk premium 15. CAPM
5.9 Further Readings
Books Dr Pradeep Kumar Sinha, Financial Management, New Delhi, Excel Books, 2009.
Van Horne, J.C. and Wachowicz, Jr, J.M., Fundamentals of Financial Management,New Delhi, Prentice Hall of India Pvt. Ltd., 1996, p. 2.
Chandra, P., Financial Management—Theory and Practice, New Delhi, Tata McGrawHill Publishing Company Ltd., 2002, p. 3.

86 LOVELY PROFESSIONAL UNIVERSITY
Financial Management
Notes Unit 6: Cost of Capital
CONTENTS
Objectives
Introduction
6.1 Cost of Capital – Concept
6.2 Importance/Significance of Cost of Capital
6.3 Classification of Cost
6.4 Computation of Specific Cost of Capital
6.4.1 Cost of Equity
6.4.2 Cost of Preference Shares
6.4.3 Cost of Debentures/Debt/Public Deposits
6.5 Weighted Average Cost of Capital (Wacc)
6.5.1 Steps Involved in Computation of WACC
6.5.2 Marginal Cost of Capital
6.5.3 Factors Affecting Wacc
6.6 Summary
6.7 Keywords
6.8 Review Questions
6.9 Further Readings
Objectives
After studying this unit, you will be able to:
Recognize the significance of cost of capital
Discuss the basic aspects of the concept of cost of capital
Categorize the costs
Identify the factors that affect cost of capital
IntroductionThe cost of capital is an important concept in formulating a firm’s capital structure. Cost ofcapital is a central concept in financial management. It is also viewed as one of the corner stonesin the theory of financial management. It has received considerable attention from both theoristsand practitioners. Two major schools of thought, have emerged having basic difference on therelevance of cost of capital. In one camp, Modigliani Miller argued, that a firm’s cost of capital isconstant and it is independent of the method and level of financing. In another camp (traditionalists)cost of capital is varying and dependent on capital structure. In both the camps, optimal policyis taken as the policy that maximizes the value of a company.

LOVELY PROFESSIONAL UNIVERSITY 87
Unit 6: Cost of Capital
NotesCost of capital is still largely an academic term and the problem of measuring it in operationalterms is a recent phenomena. Prior to this development, the problem was either ignored or bypassed. In modern times, it is widely used as basis of investment projects and evaluating thealternative sources of finance.
6.1 Cost of Capital – ConceptThe term cost of capital is a concept having many different meanings. The three viewpoints,regarding the cost of capital is given below:
1. From Investors’ View Point: Investor may define it as “the measurement of the sacrificemade by him in capital formation.”
Example: Mr. A an investor invested in a company’s equity shares, amount 1,00,000,instead of investing in a bank at the rate of 7 per cent interest. Here he had sacrificed7 per cent interest for not having invested in the bank.
2. Firms Point: It is the minimum required rate of return needed to justify the use of capital.
Example: A firm raised 50 lakhs through the issues of 10 per cent debentures, forjustifying this issue, a minimum rate of return it has to earn is 10 per cent.
3. Capital Expenditure Point: The cost of capital is the minimum required rate of return, thehurdle or target rate or the cut off rate or any discounting rate used to value cash flows.
Example: Firm ‘A’ is planning to invest in a project, that requires 20 lakh as initialinvestment and provides cash flows for a period of 5 years. So for the conversion offuture 5 years cash flows into present value, cost of capital is needed.
Cost of capital represents the rate of return that the firm must pay to the fund suppliers, whohave provided the capital. In other words, cost of capital is the weighted average cost of varioussources of finance used by the firm. The sources are, equity, preference, long-term debt andshort-term debt.
“The rate that must be earned on the net proceeds to provide the cost elements of the burden at the time theyare due.”
—Hunt, William and Donaldson
“Cost of capital is the minimum required rate of earnings or the cut-off rate of capital expenditures.”
—Solomon Ezra
“A cut-off rate for the allocation of capital to investments of projects. It is the rate of returnon a project that will leave unchanged the market price of the stock.”
—James C. Van Horne
“The rate of return the firm requires, from investment in order to increase the value of the firm in the marketplace.”
—Hampton, John J
Thus, as defined above, we can say, that cost of capital is that minimum rate of return, which afirm must and is expected to earn on its investments so as to maintain the market value of itsshares. It is also known as Weighted Average Cost of Capital (WACC), composite cost of capitalor combined cost of capital. It is expressed in terms of percentage.
88 LOVELY PROFESSIONAL UNIVERSITY
Financial Management
Notes Basic Aspects on the Concept of Cost of Capital
The above definitions indicates, that the following are the three basic aspects of the concept ofcost of capital:
1. Rate of Return: Cost of capital is not a cost as such, infact it is the rate of return that a firmrequires to earn from its investment projects.
2. Minimum Rate of Return: Cost of capital of any firm is that minimum rate of return thatwill at least maintain the market value of the shares.
3. Cost of capital comprises three components:
(a) The risk less cost of the particular type of financing (r j)
(b) The business risk premium, (b) and
(c) The financial risk premium (f)
Symbolically cost of capital may be represented as: Ko = rj + b + f
Self AssessmentFill in the blanks:
1. Cost of capital represents the ……………………that the firm must pay to the fund suppliers,who have provided the capital.
2. Cost of capital is expressed in terms of ………………….
3. Investor defines Cost of capital as “the measurement of the sacrifice made by himin……………………..”
6.2 Importance/Significance of Cost of CapitalThe concept of cost of capital is very important and the central concept in financial managementdecisions. The decisions in which it is useful are as follows:
1. Designing Optimal Corporate Capital Structure: This concept is helpful in formulating asound and economical capital structure for a firm. The debt policy of a firm is significantlyinfluenced by the cost consideration. Capital structure involves determination of proportionof debt and equity in capital structure that provides less cost of capital.
!Caution While designing a firm’s capital structure, the financial executives always keepin mind minimisation of the over all cost of capital and to maximise value of the firm.
The measurement of specific costs of each source of funds and calculation of weightedaverage cost of capital help to form a balanced capital structure. By comparing various(sources of finance) specific costs, he/she can choose the best and most economical sourceof finance and can succeed in designing a sound and viable capital structure.
2. Investment Evaluation/Capital Budgeting: Wilson R.M.S., states that the Cost of Capitalis a concept, which should be expressed in quantitative terms, if it is to be useful as a cut-off rate for capital expenses. Capital expenditure means investment in long-term projectslike investment on new machinery. It is also known as Capital budgeting expenditure.Capital budgeting decisions require a financial standard (cost of capita) for evaluation.The financial standard is Cost of Capital. In the Net Present Value (NPV) method, aninvestment project is accepted, if the present value of cash inflows are greater than the
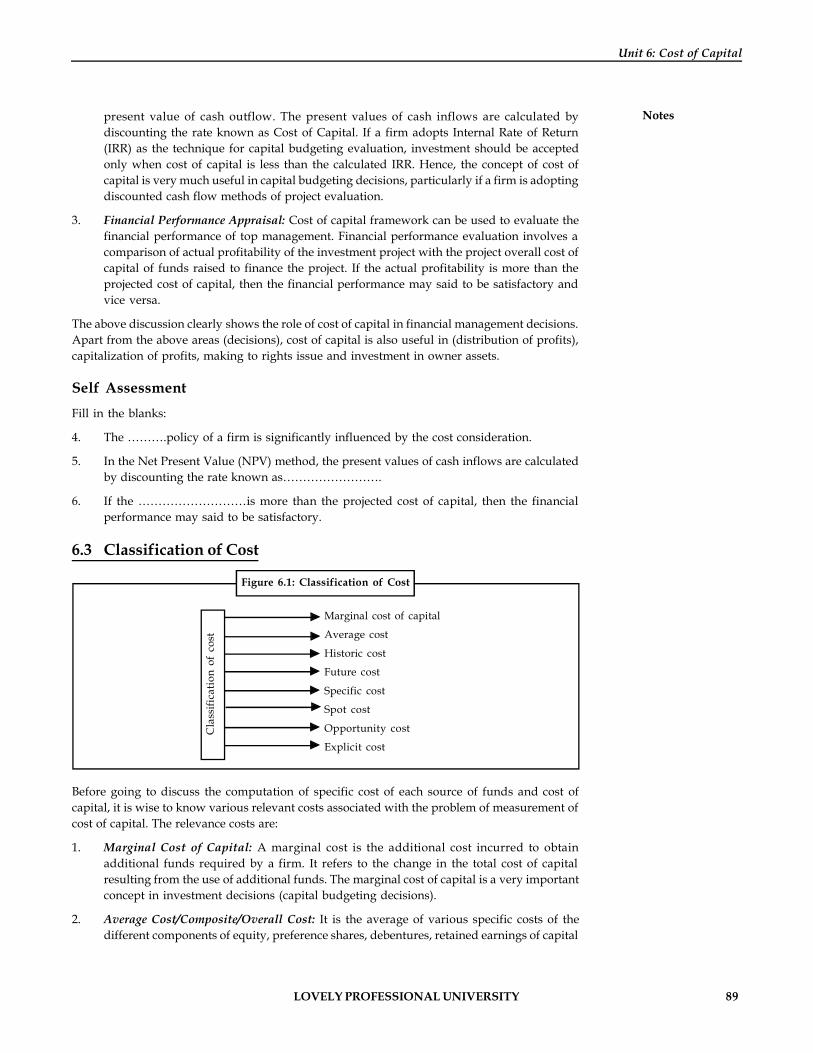
LOVELY PROFESSIONAL UNIVERSITY 89
Unit 6: Cost of Capital
Notespresent value of cash outflow. The present values of cash inflows are calculated bydiscounting the rate known as Cost of Capital. If a firm adopts Internal Rate of Return(IRR) as the technique for capital budgeting evaluation, investment should be acceptedonly when cost of capital is less than the calculated IRR. Hence, the concept of cost ofcapital is very much useful in capital budgeting decisions, particularly if a firm is adoptingdiscounted cash flow methods of project evaluation.
3. Financial Performance Appraisal: Cost of capital framework can be used to evaluate thefinancial performance of top management. Financial performance evaluation involves acomparison of actual profitability of the investment project with the project overall cost ofcapital of funds raised to finance the project. If the actual profitability is more than theprojected cost of capital, then the financial performance may said to be satisfactory andvice versa.
The above discussion clearly shows the role of cost of capital in financial management decisions.Apart from the above areas (decisions), cost of capital is also useful in (distribution of profits),capitalization of profits, making to rights issue and investment in owner assets.
Self AssessmentFill in the blanks:
4. The ……….policy of a firm is significantly influenced by the cost consideration.
5. In the Net Present Value (NPV) method, the present values of cash inflows are calculatedby discounting the rate known as…………………….
6. If the ………………………is more than the projected cost of capital, then the financialperformance may said to be satisfactory.
6.3 Classification of Cost
Figure 6.1: Classification of Cost
Before going to discuss the computation of specific cost of each source of funds and cost ofcapital, it is wise to know various relevant costs associated with the problem of measurement ofcost of capital. The relevance costs are:
1. Marginal Cost of Capital: A marginal cost is the additional cost incurred to obtainadditional funds required by a firm. It refers to the change in the total cost of capitalresulting from the use of additional funds. The marginal cost of capital is a very importantconcept in investment decisions (capital budgeting decisions).
2. Average Cost/Composite/Overall Cost: It is the average of various specific costs of thedifferent components of equity, preference shares, debentures, retained earnings of capital
Cla
ssifi
catio
n of
cos
t
Marginal cost of capital
Average cost
Historic cost
Future cost
Specific cost
Spot cost
Opportunity cost
Explicit cost
90 LOVELY PROFESSIONAL UNIVERSITY
Financial Management
Notes structure at a given time and this is used as the acceptance criteria for (capital budgeting)investment proposals.
3. Historic Cost/Book Cost: The book cost has its origin in the accounting system in whichbook values, as maintained by the books of accounts, are readily available. They arerelated to the past. It is in common use for computation of cost of capital. For example, costof capital may be computed based on the book value of the components of capital structure.
Did u know? Historical costs act as guide for future cost estimation.
4. Future Cost: It is the cost of capital that is expected to raise funds to finance a capital budgetor investment proposal.
5. Specific Cost: It is the cost associated with particular component/source of capital. It isalso known as component cost of capital. For example, cost of equity (Ke) or cost ofpreference share (Kp), or cost of debt (Kd), etc.
6. Spot Cost: The costs that are prevailing in the market at a certain time. For example, fewyears back cost of bank loans (house loans) was around 12 per cent, now it is 6 per cent isthe spot cost.
7. Opportunity Cost: The opportunity cost is the benefit that the shareholder foregoes bynot putting his/her funds elsewhere because they have been retained by the management.For example, an investor, had invested in a company’s equity shares (100 shares, eachshare at 10). The company decided to declare dividend of 10 per cent on book value ofshare, but due to capital requirements it retains its investment on one project that ishaving return on investment (RoI) of 4 per cent. Elsewhere, the project rate of interest(banks) is at 6 per cent. Here, the opportunity cost to the investor is (6-4) 2 per cent.
8. Explicit Cost: Cost of capital can be either explicit or implicit. Distinction between explicitand implicit is important from the point of view of computation cost of capital. An explicitcost of any source of capital is the discount rate that equates the present value of the cashinflows, that are incremental to the taking of the financing opportunity with present valueof its increments cash outflows. In other words, the discount rate that equates the presentvalue of cash inflows with present value of cash outflows. It is also called as the internalrate of return. For example, a firm raises 1,00,000 through the sale of 12 per cent perpetualdebentures. There will be a cash inflow of 1,00,000 and a cash outflow of 12,000 everyyear for a indefinite period. The rate that equates the PV of cash inflows ( 1,00,000) and PVof cash outflows ( 12,000 per year) would be the explicit cost. Computation of explicit costis almost similar to the computation of IRR, with one difference.
9. Implicit Cost: It is the cost of opportunity, which is given up in order to pursue a particularaction. It is also known as implicit cost of capital. The implicit cost of capital of fundsraised and invested by the firm may, therefore be defined as “the rate of return associatedwith the best investment opportunity for the firm and its shareholders that would beforegone, if the projects presently under consideration by the firm were accepted”. Thecost of retained earnings is an opportunity cost of implicit cost for a shareholder, who isdeprived of the opportunity to invest retained earnings elsewhere. Funds raised by anyform of financing have implicit capital costs once they are invested. Thus, in a sense,implicit costs may also be viewed as opportunity costs. This implies that a project reflectsnegative PV, when its cash flows are discounted by the implicit cost of capital.
LOVELY PROFESSIONAL UNIVERSITY 91
Unit 6: Cost of Capital
NotesSelf AssessmentFill in the blanks:
7. A ………………cost is the additional cost incurred to obtain additional funds required bya firm.
8. ……………….is the cost of capital that is expected to raise funds to finance a capital budgetor investment proposal.
9. …………..Cost is the cost that is prevailing in the market at a certain time.
6.4 Computation of Specific Cost of CapitalThe financial manager has to compute the specific cost of each type of funds needed in thecapitalisation of a company. The company may resort to different financial sources (equityshare, preference share, debentures, retained earning public deposits; or it may prefer internalsource (retained earnings) or external source (equity, preference and public deposits). Generally,the component cost of a specific source of capital is equal to the investors’ required rate ofreturns. Investors required rate of returns are interest, discount on debt, dividend, capitalappreciation, earnings per share on equity shareholders, dividend and share of profit onpreference shareholders funds. But investors’ required rate of returns should be adjusted fortaxes in practice for calculating the cost of a specific source of capital, to the firm.
Compensation of specific source of finance, viz., equity, preference shares, debentures, retainedearnings, public deposits is discussed below:
6.4.1 Cost of EquityFirms may obtain equity capital in two ways (a) retention of earnings and (b) issue of additionalequity shares to the public. The cost of equity or the returns required by the equity shareholdersis the same in both the cases, since in both cases, the shareholders are providing funds to the firmto finance their investment proposals. Retention of earnings involves an opportunity cost. Theshareholders could receive the earnings as dividends and invest the same in alternativeinvestments of comparable risk to earn returns. So, irrespective of whether a firm raises equityfinance by retaining earnings or issue of additional equity shares, the cost of equity is same. Butissue of additional equity shares to the public involves a floatation cost whereas, there is nofloatation cost for retained earnings. Hence, issue of additional equity shares to the public forraising equity finance involves a bigger cost when compared to the retained earnings.
In the following cost of equity is computed in both sources point of view (i.e., retained earningsand issue of equity shares to the public).
Cost of Retained Earnings (Kre)
Retained earnings is one of the internal sources to raise equity finance. Retained earnings arethose part of (amount) earnings that are retained by the form of investing in capital budgetingproposals instead of paying them as dividends to shareholders. Corporate executives and someanalysts too normally consider retained earnings as cost free, because there is nothing legallybinding the firm to pay dividends to equity shareholders and the company has its own entitydifferent from its stockholders. But it is not so. They involve opportunity cost. The opportunitycost of retained earning is the rate of return the shareholder forgoes by not putting his/herfunds elsewhere, because the management has retained the funds. The opportunity cost can bewell computed with the following formula.
ire e
b
(1 T )K K 100(1 T )æ ö-
= ´ç ÷-è ø

92 LOVELY PROFESSIONAL UNIVERSITY
Financial Management
Notes Where,
Ke = Cost of equity capital [D ÷ P or E/P + g].
Ti = Marginal tax rate applicable to the individuals concerned.
Tb = Cost of purchase of new securities/broker.
D = Expected dividend per share.
NP = Net proceeds of equity share/market price.
g = Growth rate in (%).
Illustration 1:
A company paid a dividend of 2 per share, market price per share is 20, income tax rate is 60per cent and brokerage is expected to be 2 per cent. Compute the cost of retained earnings.
Solution:
Kre = ( )( )
i
b
1 – TD 100NP 1 – T
æ ö´ ´ç ÷
è ø
= ( )( )
1 – 0.602 10020 1 – 0.02
æ ö´ ´ç ÷è ø
= 0.10 × 0.409 × 100 = 4.1 per cent
Illustration 2:
ABC company’s cost of equity (Ke) capital is 14 per cent, the average tax rate of individualshareholders is 40 per cent and it is expected that 2 per cent is brokerage cost that shareholderswill have to pay while investing their dividends in alternative securities. What is the cost ofretained earnings?
Solution:
Kre = ( )( )
ie
b
1 – TK 100
1 – Tæ ö
´ ´ç ÷è ø
=( )( )
1 - 0.40.14× ×1001 - 0.02
= (0.14 × 0.613) × 100 = 8.6 per cent
Illustration 3:
Life Style Garment Manufacturing Company has net earnings of 20 lakhs and all of itsstockholders are in the bracket of 50 per cent. The management estimates that under the presentconditions, the stockholder’s required rate of returns is 12 per cent. 3 per cent is the expectedbrokerage to be paid if stockholders want to invest in alternative securities. Compute the cost ofretained earnings.
Solution:
Kre = ( )( )
ie
b
1 – TK 100
1 – Tæ ö
´ç ÷è ø
LOVELY PROFESSIONAL UNIVERSITY 93
Unit 6: Cost of Capital
Notes =
1 – 0.500.10 1001 – 0.03
= (0.10 × 0.516) × 100 = 5.2 per cent
Illustration 4:
BPL company’s equity share is currently being sold at 350.75 and it is currently paying adividend of 5.25 per share. The dividend is expected to grow at 15 per cent per annum for oneyear. Income tax rate is 40 per cent and brokerage is 2 per cent. Calculate cost of retainedearnings.
Solution:
Kre =
i
b
1 – TD+ g 100
NP 1 – T
=5.25 1 – 0.40+ 0.15 100
350.75 1 – 0.02
= (0.165 × 0.613) × 100 = 10.2 per cent
Cost of Issue of Equity Shares (Ke)
Calculation of cost of equity (K e) capital cost brings forth, a host of problems. It is the mostdifficult and controversial cost to measure because there is no one common basis for computation.For calculation of cost of debt (Kd) interest charge is the base and preference dividend is the basefor calculation of cost of preference shares (Kp). Interest on debentures/debt and dividend onpreference shares is fixed in terms of the stipulations following the issue of such debentures andshares. In contrast, the return on equity shareholders solely depends upon the discretion of thecompany management. Apart from this, there is no stipulation for payment of dividend toequity shareholders. They are ranked at the bottom as claimants on the assets of the company atthe time of liquidation. Though it is quite evident from the above discussion that, equity capitaldoes not carry any cost. However, this is not true, equity capital has some cost.
The cost of equity capital (Ke), may be defined as the minimum rate of returns that a firm mustearn on the equity financed portions of an investment project in order to leave unchanged themarket price of the shares. The cost of equity is not the out-of-pocket cost of using equity capitalas the equity shareholders are not paid dividend at a fixed rate every year.
Approaches to Calculate the Cost of Equity (Ke)
There are six approaches available to calculate the cost of equity capital, they are:
Dividends Capitalisation Approach (D/MN Approach)
According to this approach, the cost of equity capital is calculated on the basis of a required rateof return in terms of the future dividends to be paid on the shares. Accordingly, K e is defined asthe discount rate that equates the present value of all expected future dividends per share, alongwith the net proceeds of the sale (or the current market price) of a share. It means investorarrives at a market price for a share by capitalizing dividends at a normal rate of return. The costof equity capital can be measured by the given formula:
Ke = D/CMP or NP
94 LOVELY PROFESSIONAL UNIVERSITY
Financial Management
Notes Where,
Ke = Cost of equity
D = Dividends per share
CMP = Current market price per share
NP = Net proceed per share
This method assumes that investor give prime importance to dividends and risk in the firmremains unchanged and it does not consider the growth in dividend.
Illustration 5:
XYZ Ltd., is currently earning 1,00,000, its current share market price of 100 outstandingequity shares is 10,000. The company decides to raise an additional capital of 2,50,000 throughissue of equity shares to the public. It is expected to pay 10 per cent per share as floatation cost.Equity capital is issued at a discount rate of 10 per cent, per share. The company is interested topay a dividend of 8 per share. Calculate the cost of equity.
Solution:
Ke =D ×100
NP
Ke = 8 × 100
100 – 10 – 10
Ke =8 × 100
80
= 10 per cent
Notes Dividend capitalization approach, suffers from the following limitations:
1. It does not consider future earnings.
2. It ignores the earnings on retained earnings.
3. It ignores the fact that market price raise may be due to retained earnings and not onaccount of high dividends.
4. It does not take into account the capital gains.
Earnings Capitalisation Approach (E/MP Approach)
According to this approach, the cost of equity (Ke) is the discount rate that equates the present valueof expected future earnings per share with the net proceeds (or current market price) of a share. Theadvocates of this approach establish a relationship between earnings and market price of theshare. They say that, it is more useful than the dividend capitalisation approach, due to tworeasons, one, the earnings capitalization approach acknowledges that all earnings of the company,after payment of fixed dividend to preference shareholders, legally belong to equity shareholderswhether they are paid as dividends or retained for investment, secondly, and most importantly,determining the market price of equity shares is based on earnings and not dividends. Computation
LOVELY PROFESSIONAL UNIVERSITY 95
Unit 6: Cost of Capital
Notesof retained earnings cost, taken separately leads to double the company’s cost of capital. Assumptionof earnings capitalization approach is employed under the following conditions:
1. Constant earnings per share over the future period;
2. There should be either 100 per cent rotation ratio or 100 per cent dividend payout ratio;and
3. The company satisfies the requirements through equity shares and does not employ debt.
Cost of equity can be calculated with the following formula:
Ke = ECMP or NP
Where,
Ke = Cost of equity
E = Earnings per share
CMP = Current market price per share
NP = Net proceeds per share.
Illustration 6:
Well do Company Ltd. is currently earning 15 per cent operating profit on its share capital of 20 lakh (FV of 200 per share). It is interested to go for expansion for which the company
requires an additional share capital of 10 lakh. Company is raising this amount by the issue ofequity shares at 10 per cent premium and the expected floatation cost is 5 per cent. Calculate thecost of equity.
Solution:
Ke = E ×100NP
= 30 ×100
200+20 –10
=30 ×100210
= 14.3 per cent
1. Calculation of EPS
Operating Profit = 20,00,000 × 0.15 = 3,00,000
No.of Equity Shares = 20,00,000/200 = 10,000 Shares
EPS = 3,00,000/10,000 = 30
2. Net Proceeds (NP) = Face value + Premium – Floatation cost
= 200 + 20 – 10 = 210
Illustration 7:
A firm is currently earning 1,00,000 and its share is selling at a market price of 90. The firm has10,000 shares outstanding and has no debt. Compute the cost of equity.
Solution:
Ke = E ×100MP
96 LOVELY PROFESSIONAL UNIVERSITY
Financial Management
Notes=
10 ×100 =11.1190
Limitations: Earnings capitalization approach has the following limitations:
1. All earnings are not distributed to the equity shareholders as dividends.
2. Earning per share may not be constant.
3. Share price also does not remain constant.
Dividend Capitalization plus Growth Rate Approach [(D/MP) + g]
Computation of cost of equity capital based on a fixed dividend rate may not be appropriate,because the future dividend may grow. The growth in dividends may be constant perpetually ormay vary over a period of time. It is the best method over dividend capitalisation approach,since it considers the growth in dividends. Generally, investors invest in equity shares on thebasis of the expected future dividends rather than on current dividends. They expect increase infuture dividends. Growth in dividends will have positive impact on share prices.
Cost of Capital under Constant Growth Rate Perpetually: The formula for computation of costof equity under constant growth rate is:
Ke =D +g
NP or CMP
Where,Ke = Cost of equity capital
D = Dividends per share.
NP = Net proceeds per share.
CMP = Current market price per share.
g = Growth rate (%).
Illustration 8:
Equity shares of a paper manufacturing company is currently selling for 100. It wants tofinance its capital expenditure of 1 lakh either by retaining earnings or selling new shares. Ifcompany seeks to sell shares, the issue price will be 95. The expected dividend next year is
4.75 and it is expected to grow at 6 per cent perpetually. Calculate cost of equity capital(internal and external).
Solution:
Ke = D +gMP
Ke =4.75 + 0.06100
= 0.048 + 0.06 = 10.8 per cent
Calculate cost of external equity (Issue of shares)
Ke =4.75 + 0.0695
= 0.050 + 0.06 = 11 per cent
LOVELY PROFESSIONAL UNIVERSITY 97
Unit 6: Cost of Capital
NotesCost of Capital under Variable Growth Rate: The computation cost of equity after a specificperiod, is based on the estimation of growth rate in dividends of a company. Expected growthrate will be calculated based upon the past trend in dividend. It may not be unreasonable toproject the trend into the future, based on the past trend. The financial manager must estimatethe internal growth rate in dividends on the basis of long range plans of the company. Expectedgrowth rate in the internal context requires to be adjusted. Compound growth rate in dividendscan be computed with the following formula.
gr = Do (1 + r)n = Dn
Where,
gr = Growth rate in dividends
Do = First year dividend payment
(1 + r)n = Present value factor for ‘nth’ year
Dn = Last year dividend payment.
Illustration 9:
From the following dividends record of a company, compute the expected growth rate individends.
Year 1996 1997 1998 1999 2000 2001 2002 2003
Dividends per share ( ) 21 22 23 24 25 26 27 28
Solution:
gr = Do (1 + r)n = Dn = 21 (1 + r)7 = 28
(1 + r)7 = 28 ÷ 21 (1 + r)7 = 1.334
During seven years the dividends has increased by 7 giving a compound factor of 1.334. Thegrowth rate is 4 per cent since the sum of 1 would accumulate to 1.334 in seven years at4 per cent interest.
Illustration 10:
Mr. A an investor, purchases an equity share of a growing company for 210. He expects thecompany to pay dividends of 10.5, 11.025 and 11.575 in years 1, 2 and 3 respectively and heexpects to sell the shares at a price of 243.10 at the end of three years.
1. Determine the growth rate in dividends.
2. Calculate the current dividend yield.
3. What is the required rate of return of Mr. A on his equity investment?
Solution:
1. Computation of growth rate (gr)
gr = Do (1 + r)n = Dn = 10.5 (1 + r)2 = 11.575
(1 + r)2 =11.57510.5
(1 + r)2 = 1.103
gr = 5 per cent
98 LOVELY PROFESSIONAL UNIVERSITY
Financial Management
Notes 2. Calculation of the current dividend yield
3rd year dividend 11.575
Current dividend yield =11.575 ×105 = 12.154100
Growth in dividend is [12.154 – 11.575] = 0.579
Current dividend yield 0.579 ×10011.575
= 5 per cent
In simple words, current dividend yield is equal to growth rate in dividends.
3. Mr. A’s required rate of return
Ke =D +g
Expected sales price (MP)
=12.154 +0.05243.10
= 0.050 + 0.05 = 0.10 × 100 = 10 per cent
Illustration 11: (Variable growth rates)
A textile company’s dividends have been expected to grow in the following manner.
1 – 2 years 15 per cent
3 – 5 years 10 per cent
6 year and beyond 5 per cent
The company currently pays a dividend of 2 per share, which is currently selling at 75 pershare. What would be the cost of equity capital assuming a fixed dividend pay out ratio?
Solution:
NP =
tn0 n+1
t nnt=1 ee e
D 1+gr D 1+ ×K - g1+ K 1+ K
75 =
1 2 3 4 5 5 5e e e e e e e
2.3 2.645 2.9095 3.200 3.52 3.52(1+ 0.05) 1+ + + + + ×1+ K 1+ K 1+ K 1+ K 1+ K 1+ K 1+ K
= e e e e1.K 2.K 3.K 4.K2.3 PVIF + 2.645 PVIF + 2.9095 PVIF + 3.2 PVIF +
e
e
6.K5.K
e
3.696 PVIF3.52 PVIF +
K - 0.05
By trial and error method using PV tables, we find Ke = 14%
First trial at 14%
75 = 3.6962.3(0.877)+2.645(0.769)+2.909(0.675)+3.2(0.592)+3.52(0.519)+ ×(0.456)0.14 - 0.05
75 = 2.02 + 2.03 + 1.96 + 1.89 + 1.83 + 18.73
75 = 28.5
LOVELY PROFESSIONAL UNIVERSITY 99
Unit 6: Cost of Capital
NotesHere, 75 is not equal to 28.5, for increasing the 28.5 to 75 we have to try at a lower rate, say 6%
=3.6962.3(0.943)+ 2.645(0.890)+ 2.907(0.840)+ 3.2(0.823)+ 3.52(0.747)+ ×(0.705)
0.06 0.05-
= 2.17 + 2.35 + 2.44 + 2.63 + 2.63 + 260.568 = 272.79
New PV of cash out flows exceeding cash inflow. So, we will use interpolation formula
Ke = ( )272.79 – 756%+ 14%– 6%
272.79 – 28.5æ öç ÷è ø
= 197.796%+ 8%244.29
æ öç ÷è ø
Ke = 6% + 6.48 = 12.48 per cent.
Bond Yield Plus Risk Premium Approach
According to this approach, the rate of return required by the equity shareholder of a companyis equal to
Ke = Yield on long-term bonds + Risk premium
The logic of this approach is very simple, equity investors bear a higher risk than bond investorsand hence their required rate of return should include a premium for their higher risk. In otherwords, bond holders and equity shareholders, both are providing funds to the company, but thecompany assures a fixed rate of interest to the bond holders and not to the equity shareholders,hence, there is a risk involved due to uncertainty of expected dividends. It makes a sense to basethe cost of equity on a readily observable cost of debt. The problem involved in this approach,is the addition of premium, should it be one per cent, two per cent, three per cent or ‘n’ per cent.There is no theoretical basis for estimating the risk premium. Most analysts look at the operatingand financial risks of the business and arrive at a subjectively determined risk premium thatnormally ranges between 3 per cent to 5 per cent. Cost of equity capital calculated, based on thisapproach is not a precise one, but it is a ballpark estimation.
Computation of the cost of equity based on dividends capitalisation and earnings capitalisation,have serious limitations. It is not possible to estimate future dividends and earnings correctly,both these variables are uncertain. In order to remove the difficulty in the estimation of the rateof return that investors expect on equities, where future dividends, earnings and market price ofshare are uncertain, Realised Yield Approach is suggested.
Did u know? What is Realised Yield Approach?
Realised Yield Approach takes into consideration that, the actual average rate of returnsrealised in the past few years, may be applied to compute the cost of equity share capitali.e, the average rate of returns realised by considering dividends received in the past fewyears along with the gain realised at the time of sale of share.
This is more logical because the investor expects to receive in future at least what he has receivedin the past. The realised yield approach is based on the following assumptions:
1. Firms risk does not change over the period.
2. Past realised yield is the base for shareholders expectations.
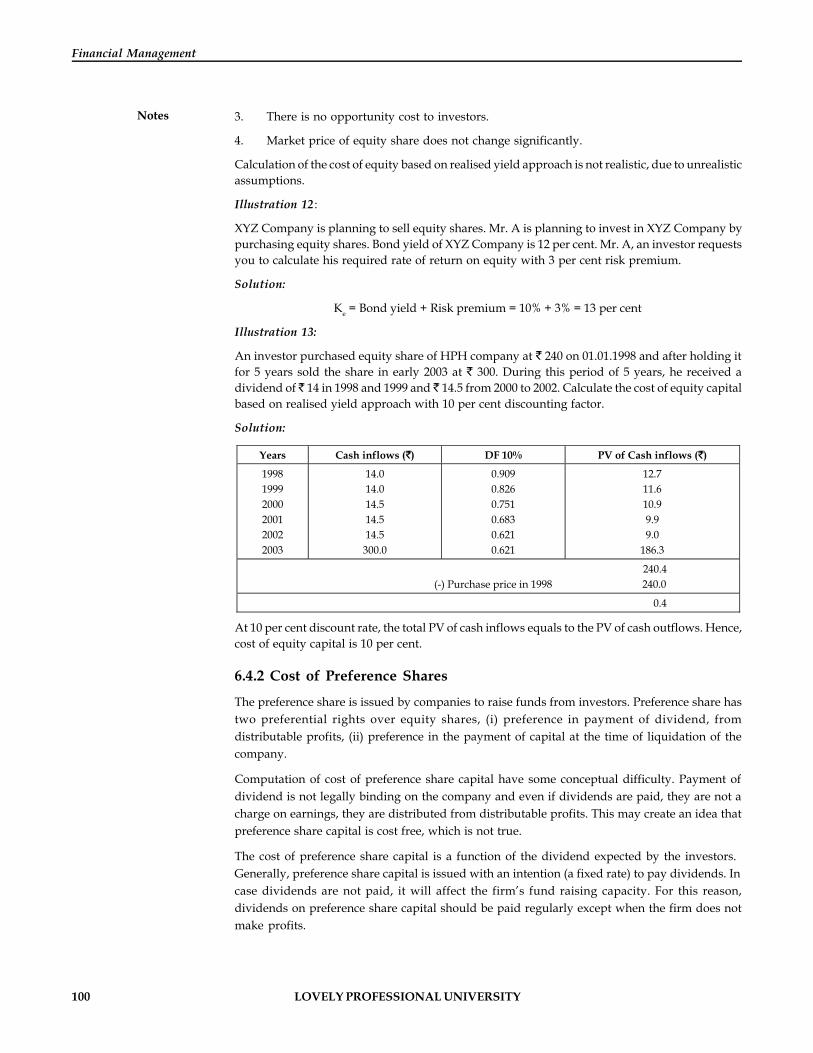
100 LOVELY PROFESSIONAL UNIVERSITY
Financial Management
Notes 3. There is no opportunity cost to investors.
4. Market price of equity share does not change significantly.
Calculation of the cost of equity based on realised yield approach is not realistic, due to unrealisticassumptions.
Illustration 12:
XYZ Company is planning to sell equity shares. Mr. A is planning to invest in XYZ Company bypurchasing equity shares. Bond yield of XYZ Company is 12 per cent. Mr. A, an investor requestsyou to calculate his required rate of return on equity with 3 per cent risk premium.
Solution:
Ke = Bond yield + Risk premium = 10% + 3% = 13 per cent
Illustration 13:
An investor purchased equity share of HPH company at 240 on 01.01.1998 and after holding itfor 5 years sold the share in early 2003 at 300. During this period of 5 years, he received adividend of 14 in 1998 and 1999 and 14.5 from 2000 to 2002. Calculate the cost of equity capitalbased on realised yield approach with 10 per cent discounting factor.
Solution:
Years Cash inflows ( ) DF 10% PV of Cash inflows ( )
1998 1999 2000 2001 2002 2003
14.0 14.0 14.5 14.5 14.5
300.0
0.909 0.826 0.751 0.683 0.621 0.621
12.7 11.6 10.9 9.9 9.0
186.3
240.4 (-) Purchase price in 1998 240.0
0.4
At 10 per cent discount rate, the total PV of cash inflows equals to the PV of cash outflows. Hence,cost of equity capital is 10 per cent.
6.4.2 Cost of Preference Shares
The preference share is issued by companies to raise funds from investors. Preference share hastwo preferential rights over equity shares, (i) preference in payment of dividend, fromdistributable profits, (ii) preference in the payment of capital at the time of liquidation of thecompany.
Computation of cost of preference share capital have some conceptual difficulty. Payment ofdividend is not legally binding on the company and even if dividends are paid, they are not acharge on earnings, they are distributed from distributable profits. This may create an idea thatpreference share capital is cost free, which is not true.
The cost of preference share capital is a function of the dividend expected by the investors.Generally, preference share capital is issued with an intention (a fixed rate) to pay dividends. Incase dividends are not paid, it will affect the firm’s fund raising capacity. For this reason,dividends on preference share capital should be paid regularly except when the firm does notmake profits.
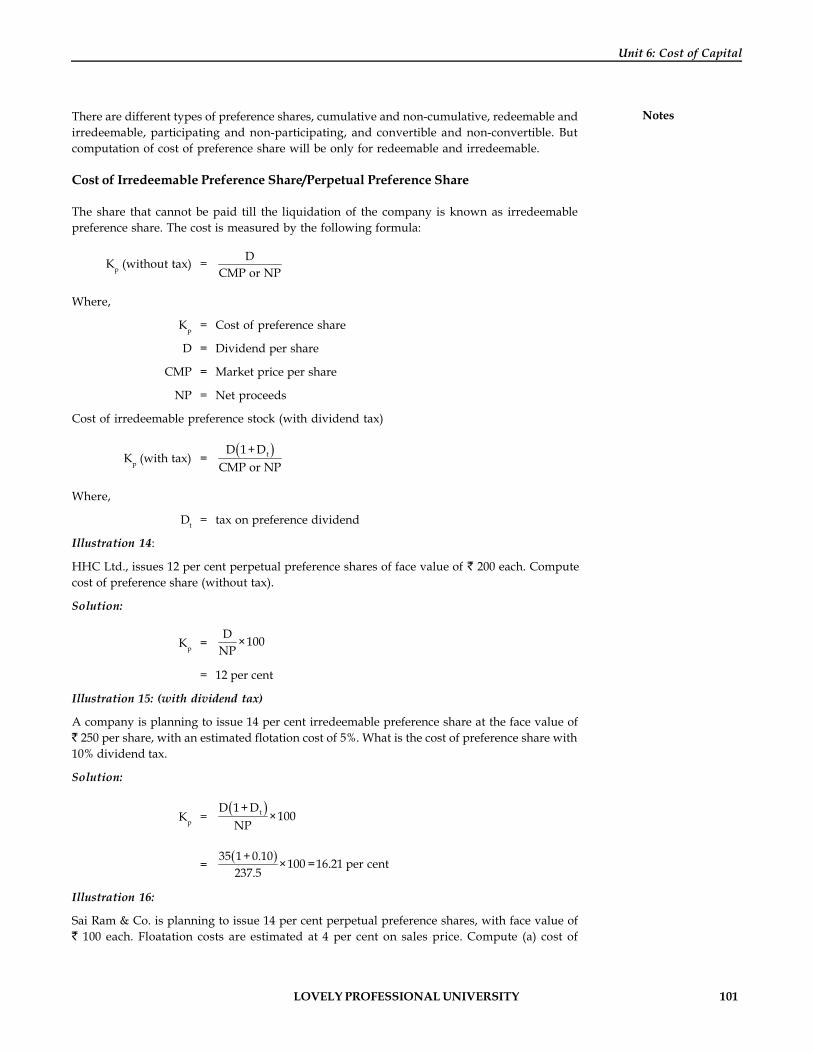
LOVELY PROFESSIONAL UNIVERSITY 101
Unit 6: Cost of Capital
NotesThere are different types of preference shares, cumulative and non-cumulative, redeemable andirredeemable, participating and non-participating, and convertible and non-convertible. Butcomputation of cost of preference share will be only for redeemable and irredeemable.
Cost of Irredeemable Preference Share/Perpetual Preference Share
The share that cannot be paid till the liquidation of the company is known as irredeemablepreference share. The cost is measured by the following formula:
Kp (without tax) = DCMP or NP
Where,
Kp = Cost of preference share
D = Dividend per share
CMP = Market price per share
NP = Net proceeds
Cost of irredeemable preference stock (with dividend tax)
Kp (with tax) = ( )tD 1+DCMP or NP
Where,
Dt = tax on preference dividend
Illustration 14:
HHC Ltd., issues 12 per cent perpetual preference shares of face value of 200 each. Computecost of preference share (without tax).
Solution:
Kp =D ×100
NP
= 12 per cent
Illustration 15: (with dividend tax)
A company is planning to issue 14 per cent irredeemable preference share at the face value of 250 per share, with an estimated flotation cost of 5%. What is the cost of preference share with
10% dividend tax.
Solution:
Kp =( )tD 1+ D
×100NP
=( )35 1+ 0.10 ×100 =16.21 per cent237.5
Illustration 16:
Sai Ram & Co. is planning to issue 14 per cent perpetual preference shares, with face value of 100 each. Floatation costs are estimated at 4 per cent on sales price. Compute (a) cost of
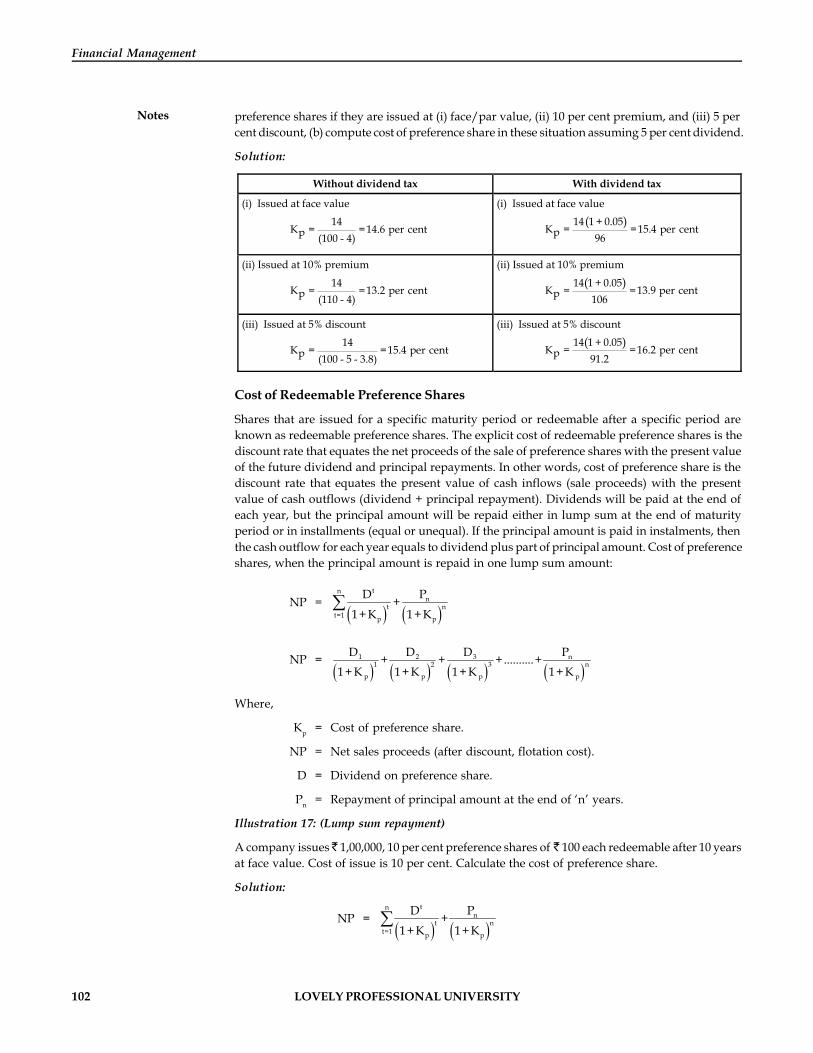
102 LOVELY PROFESSIONAL UNIVERSITY
Financial Management
Notes preference shares if they are issued at (i) face/par value, (ii) 10 per cent premium, and (iii) 5 percent discount, (b) compute cost of preference share in these situation assuming 5 per cent dividend.
Solution:
Without dividend tax With dividend tax
(i) Issued at face value
14
K = =14.6 per centp (100 - 4)
(i) Issued at face value
14 1 + 0.05
K = =15.4 per centp 96( )
(ii) Issued at 10% premium
14
K = =13.2 per centp (110 - 4)
(ii) Issued at 10% premium
14 1 + 0.05
K = =13.9 per centp 106( )
(iii) Issued at 5% discount
14
K = =15.4 per centp (100 - 5 - 3.8)
(iii) Issued at 5% discount
14 1 + 0.05
K = =16.2 per centp 91.2( )
Cost of Redeemable Preference Shares
Shares that are issued for a specific maturity period or redeemable after a specific period areknown as redeemable preference shares. The explicit cost of redeemable preference shares is thediscount rate that equates the net proceeds of the sale of preference shares with the present valueof the future dividend and principal repayments. In other words, cost of preference share is thediscount rate that equates the present value of cash inflows (sale proceeds) with the presentvalue of cash outflows (dividend + principal repayment). Dividends will be paid at the end ofeach year, but the principal amount will be repaid either in lump sum at the end of maturityperiod or in installments (equal or unequal). If the principal amount is paid in instalments, thenthe cash outflow for each year equals to dividend plus part of principal amount. Cost of preferenceshares, when the principal amount is repaid in one lump sum amount:
NP =( ) ( )
tnn
t nt=1 p p
D P+1+K 1+K
å
NP =( ) ( ) ( ) ( )
1 2 3 n1 2 3 n
p p p p
D D D P+ + +..........+1+ K 1+ K 1+ K 1+ K
Where,
Kp = Cost of preference share.
NP = Net sales proceeds (after discount, flotation cost).
D = Dividend on preference share.
Pn = Repayment of principal amount at the end of ‘n’ years.
Illustration 17: (Lump sum repayment)
A company issues 1,00,000, 10 per cent preference shares of 100 each redeemable after 10 yearsat face value. Cost of issue is 10 per cent. Calculate the cost of preference share.
Solution:
NP =( ) ( )
tnn
t nt=1 p p
D P+1+K 1+K
å

LOVELY PROFESSIONAL UNIVERSITY 103
Unit 6: Cost of Capital
Notes90 =
10
t 10t=1 p p
10 100+1+K 1+K
The trial and error method is used here, for the computation of the cost of preference share.
PV factor Present Values Year Cash outflow ( )
10% 12% 10% 12% 1 - 10 10 6.145 5.650 61.45 56.5
10 100 0.386 0.322 38.60 32.2
Total PV of Cash outflow 100.05 88.70
(-) PV of Cash inflow 90.00 90.00
10.05 (-) 1.3
In trials, PV of cash outflow did not equal to the PV of cash inflow ( 100). Hence, cost ofpreference share is calculated by using interpolation formula.
K = LDFPV PV of CIFLDF(%)+ HDF- LDFLDFPV HDFPV
Where,
LDF = Lower discounting factor in %.
LDFPV = Lower discounting factor present value ( ).
HDFPV = Higher discounting factor present value ( ).
PV of CIF = Present value of cash inflows.
Kp = 100.05 - 9010% + 12% - 10%
100.05 - 88.7
= 10.0510% + 2×11.35
= 10% + 2 × 0.886 = 10% + 1.772
= 11.77 per cent
Short cut formula:
Kp = r i mD + (f + d + p – p )/N(RV + NP)/2
Where,
D = Dividend per share.
f = Flotation cost ( ).
d = Discount on issue of preference share ( ).
pr = Premium on redemption of preference shares ( ).
pi = Premium on issue of preference share ( ).
Nm = Term of preference shares.
RV = Redeemable value of preference share.
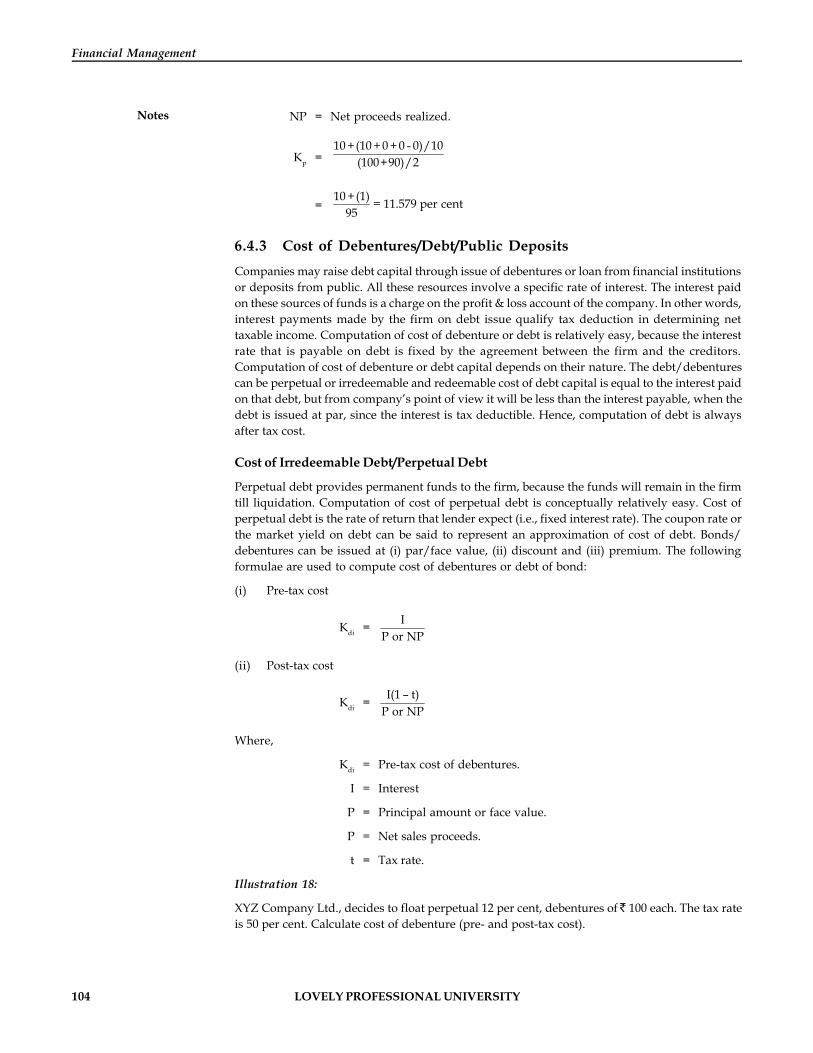
104 LOVELY PROFESSIONAL UNIVERSITY
Financial Management
Notes NP = Net proceeds realized.
Kp =10 +(10 + 0 + 0 - 0)/10
(100+90)/2
=10 +(1) = 11.579 per cent
95
6.4.3 Cost of Debentures/Debt/Public DepositsCompanies may raise debt capital through issue of debentures or loan from financial institutionsor deposits from public. All these resources involve a specific rate of interest. The interest paidon these sources of funds is a charge on the profit & loss account of the company. In other words,interest payments made by the firm on debt issue qualify tax deduction in determining nettaxable income. Computation of cost of debenture or debt is relatively easy, because the interestrate that is payable on debt is fixed by the agreement between the firm and the creditors.Computation of cost of debenture or debt capital depends on their nature. The debt/debenturescan be perpetual or irredeemable and redeemable cost of debt capital is equal to the interest paidon that debt, but from company’s point of view it will be less than the interest payable, when thedebt is issued at par, since the interest is tax deductible. Hence, computation of debt is alwaysafter tax cost.
Cost of Irredeemable Debt/Perpetual Debt
Perpetual debt provides permanent funds to the firm, because the funds will remain in the firmtill liquidation. Computation of cost of perpetual debt is conceptually relatively easy. Cost ofperpetual debt is the rate of return that lender expect (i.e., fixed interest rate). The coupon rate orthe market yield on debt can be said to represent an approximation of cost of debt. Bonds/debentures can be issued at (i) par/face value, (ii) discount and (iii) premium. The followingformulae are used to compute cost of debentures or debt of bond:
(i) Pre-tax cost
Kdi = IP or NP
(ii) Post-tax cost
Kdi = I(1 – t)P or NP
Where,
Kdi = Pre-tax cost of debentures.
I = Interest
P = Principal amount or face value.
P = Net sales proceeds.
t = Tax rate.
Illustration 18:
XYZ Company Ltd., decides to float perpetual 12 per cent, debentures of 100 each. The tax rateis 50 per cent. Calculate cost of debenture (pre- and post-tax cost).
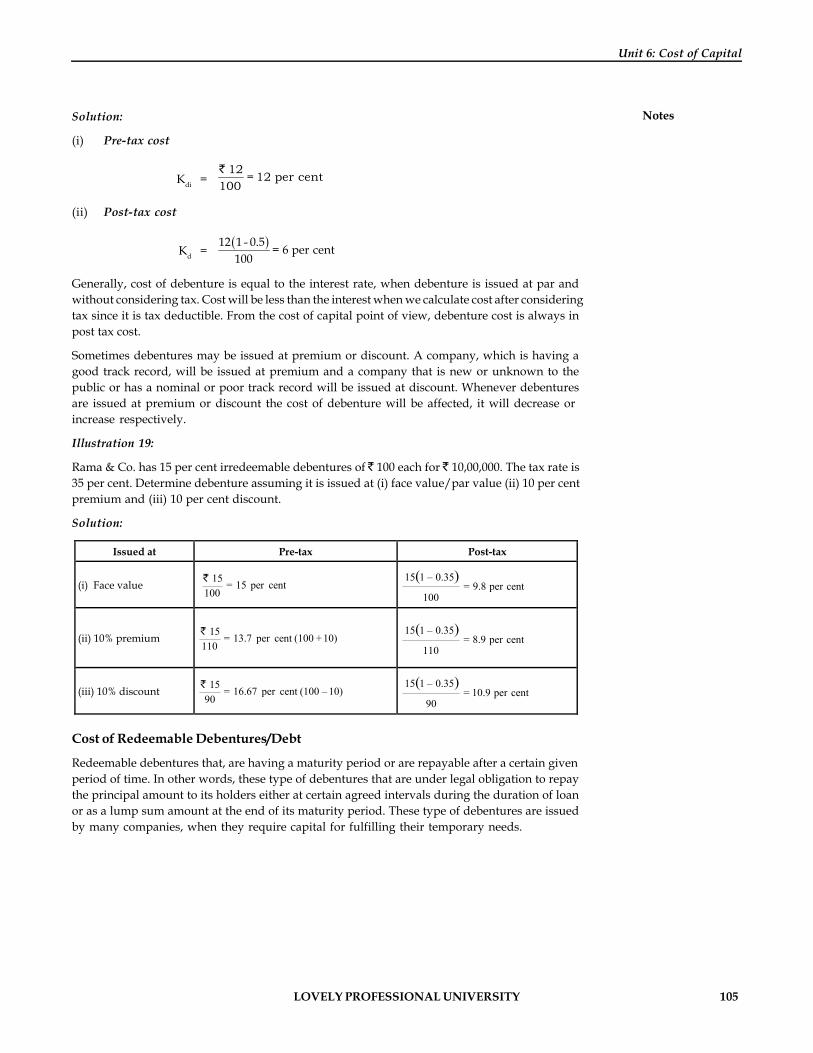
LOVELY PROFESSIONAL UNIVERSITY 105
Unit 6: Cost of Capital
NotesSolution:
(i) Pre-tax cost
Kdi =12 = 12 per cent
100
(ii) Post-tax cost
Kd = 12 1 - 0.5 = 6 per cent100
Generally, cost of debenture is equal to the interest rate, when debenture is issued at par andwithout considering tax. Cost will be less than the interest when we calculate cost after consideringtax since it is tax deductible. From the cost of capital point of view, debenture cost is always inpost tax cost.
Sometimes debentures may be issued at premium or discount. A company, which is having agood track record, will be issued at premium and a company that is new or unknown to thepublic or has a nominal or poor track record will be issued at discount. Whenever debenturesare issued at premium or discount the cost of debenture will be affected, it will decrease orincrease respectively.
Illustration 19:
Rama & Co. has 15 per cent irredeemable debentures of 100 each for 10,00,000. The tax rate is35 per cent. Determine debenture assuming it is issued at (i) face value/par value (ii) 10 per centpremium and (iii) 10 per cent discount.
Solution:
Issued at Pre-tax Post-tax
(i) Face value 15= 15 per cent
100
15 1 – 0.35= 9.8 per cent
100
( )
(ii) 10% premium 15= 13.7 per cent (100 +10)
110
15 1 – 0.35= 8.9 per cent
110
( )
(iii) 10% discount 15= 16.67 per cent (100 – 10)
90
15 1 – 0.35= 10.9 per cent
90
( )
Cost of Redeemable Debentures/Debt
Redeemable debentures that, are having a maturity period or are repayable after a certain givenperiod of time. In other words, these type of debentures that are under legal obligation to repaythe principal amount to its holders either at certain agreed intervals during the duration of loanor as a lump sum amount at the end of its maturity period. These type of debentures are issuedby many companies, when they require capital for fulfilling their temporary needs.
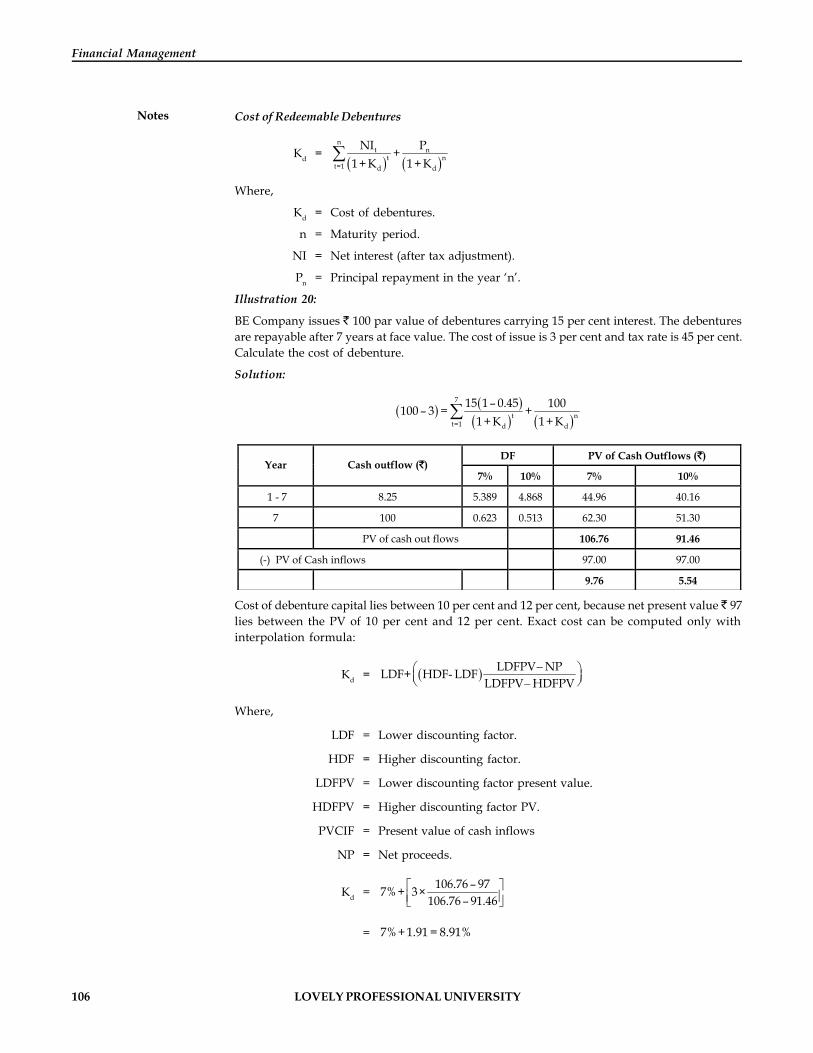
106 LOVELY PROFESSIONAL UNIVERSITY
Financial Management
Notes Cost of Redeemable Debentures
Kd =
nt n
t nt=1 d d
NI P+1+ K 1+ K
Where,
Kd = Cost of debentures.
n = Maturity period.
NI = Net interest (after tax adjustment).
Pn = Principal repayment in the year ‘n’.
Illustration 20:
BE Company issues 100 par value of debentures carrying 15 per cent interest. The debenturesare repayable after 7 years at face value. The cost of issue is 3 per cent and tax rate is 45 per cent.Calculate the cost of debenture.
Solution:
7
t nt=1 d d
15 1 – 0.45 100100 – 3 = +1+ K 1+ K
DF PV of Cash Outflows ( ) Year Cash outflow ( )
7% 10% 7% 10%
1 - 7 8.25 5.389 4.868 44.96 40.16
7 100 0.623 0.513 62.30 51.30
PV of cash out flows 106.76 91.46
(-) PV of Cash inflows 97.00 97.00
9.76 5.54
Cost of debenture capital lies between 10 per cent and 12 per cent, because net present value 97lies between the PV of 10 per cent and 12 per cent. Exact cost can be computed only withinterpolation formula:
Kd = LDFPV NPLDF+ HDF- LDF
LDFPV HDFPV
Where,
LDF = Lower discounting factor.
HDF = Higher discounting factor.
LDFPV = Lower discounting factor present value.
HDFPV = Higher discounting factor PV.
PVCIF = Present value of cash inflows
NP = Net proceeds.
Kd = 106.76 – 977%+ 3×106.76 – 91.46
= 7%+1.91 = 8.91%

LOVELY PROFESSIONAL UNIVERSITY 107
Unit 6: Cost of Capital
NotesShort cut method
Kp =
r i mI 1 – t + f+d+ p – p /N
RV+ NP /2
Where,
I = Interest
t = Tax rate
f = Flotation cost
d = Discount
pr = Premium on redemption
pi = Premium on issue
RV = Redeemable value
NP = Net proceed
Nm = Maturity period of debt
Kp =
15 1 – 0.45 + 3 – 0 + 0 – 0 /7100 – 97 /2
Kp = 8.68 = 8.81%98.5
Illustration 21: (Instalment repayment)
Hari Ram & Co. issued 14 per cent debentures aggregate at 2,00,000. The face value of debentureis 100. Issue cost is 5 per cent. The company has agreed to repay the debenture in 5 equalinstalment at par value. Instalment starts at the end of the year. The company’s tax rate is 35 percent. Compute cost of debenture.
Solution:
Sales proceeds = Face value – Flotation cost = 100 – 5 = 95
Instalment amount = Face value ÷ No. of instalments = 100 ÷ 5 = 20.
Cash Outflow ( ) DF Factor PV of Cash Outflows ( ) Years
(NI + Instalment) 8% 13% 8% 13% 1 9.1 + 20 = 29.1 0.926 0.885 26.947 25.754
2 7.28 + 20 = 27.28 0.857 0.783 23.379 21.361
3 5.46 + 20 = 25.46 0.794 0.693 20.216 17.644
4 3.64 + 20 = 23.64 0.735 0.613 17.376 14.492
5 1.82 + 20 = 21.82 0.681 0.543 14.860 11.849
PV of cash out flows 102.778 91.230
PV of cash inflows 95.000 95.000
(+) 7.778 (-)3.770
Kd = 102.778 – 958%+ 13 – 8 ×
102.778 – 91.1
= 7.7788%+ 5×11.678
= 8% + 3.33 = 11.33 per cent

108 LOVELY PROFESSIONAL UNIVERSITY
Financial Management
Notes Self AssessmentFill in the blanks:
10. Cost of debenture is equal to the……………., when debenture is issued at par and withoutconsidering tax.
11. Cost of preference share is the ……………that equates the present value of cash inflowswith the present value of cash outflows.
12. Retention of earnings involves an …………….cost.
6.5 Weighted Average Cost of Capital (WACC)A company has to employ a combination of creditors and fund owners. The composite cost ofcapital lies between the least and most expensive funds. This approach enables the maximisationof profits and the wealth of the equity shareholders by investing the funds in projects earning inexcess of the overall cost o capital.
The composite cost of capital implies an average of the costs of each of the source of fundsemployed by the firm property, weighted by the proportion they hold in the firm’s capitalstructure.
6.5.1 Steps Involved in Computation of WACC1. Determination of the type of funds to be raised and their individual share in the total
capitalisation of the firm.
2. Computation of cost of specific source of funds.
3. Assignment of weight to specific costs.
4. Multiply the cost of each source by the appropriate assigned weights.
5. Dividing the total weighted cost by the total weights to get overall cost of capital.
Once the company decides the funds that will be raised from different sources, then thecomputation of specific cost of each component or source is completed after which, the third stepin computation of cost of capital is, assignment of weights to specific costs, or specific sources offunds. How to assign weights? Is there any base to assign weights? How many types of weightsare there?
Assignment of Weights: The weights to specific funds may be assigned, based on the following:
1. Book Values: Book value weights are based on the values found on the balance sheet. Theweight applicable to a given source of fund is simply the book value of the source of funddivided by the book value of the total funds.
The merits of book values weights are:
(a) Calculation of weights is simple.
(b) Book values provide a usable base, when firm is not listed or security is not activelytraded.
(c) Book values are really available from the published records of the firm.
(d) Analysis of capital structure in terms of debt – equity ratio is based on book value.
Disadvantage of book value weights
Book value proportions are not consistent with the concept of cost of capital because thelatter is defined as the minimum rate of return to maintain the market value of the firm.
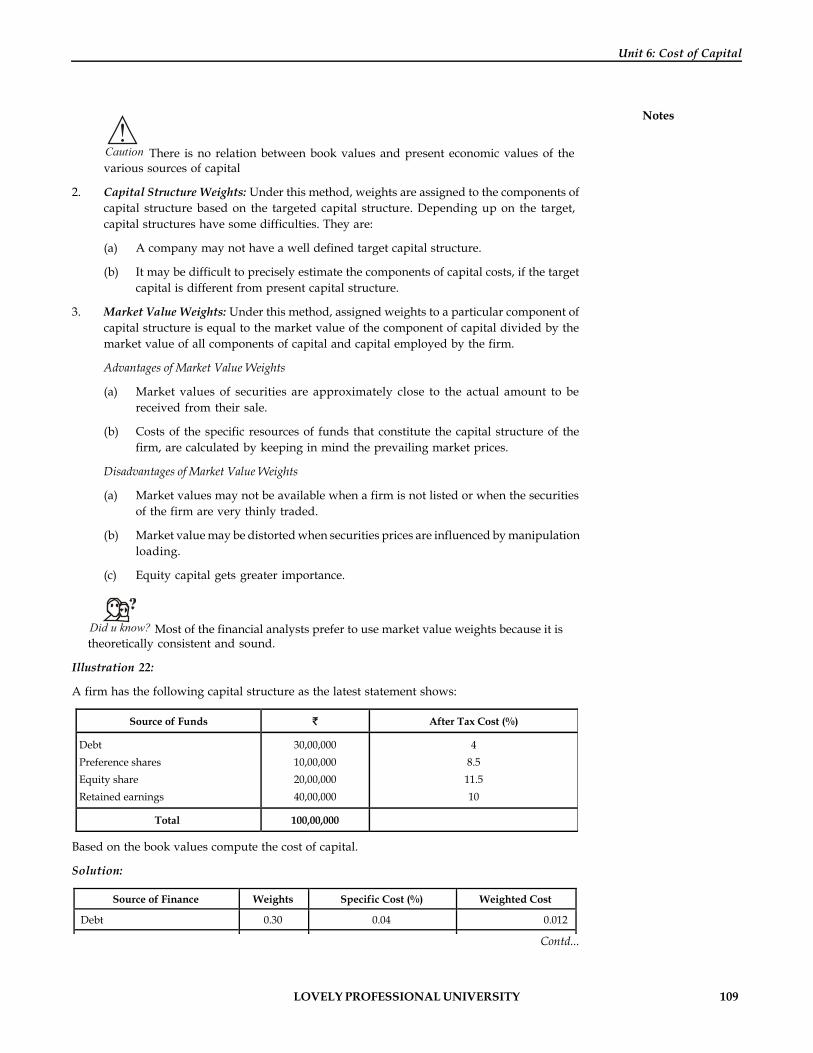
LOVELY PROFESSIONAL UNIVERSITY 109
Unit 6: Cost of Capital
Notes
!Caution There is no relation between book values and present economic values of thevarious sources of capital
2. Capital Structure Weights: Under this method, weights are assigned to the components ofcapital structure based on the targeted capital structure. Depending up on the target,capital structures have some difficulties. They are:
(a) A company may not have a well defined target capital structure.
(b) It may be difficult to precisely estimate the components of capital costs, if the targetcapital is different from present capital structure.
3. Market Value Weights: Under this method, assigned weights to a particular component ofcapital structure is equal to the market value of the component of capital divided by themarket value of all components of capital and capital employed by the firm.
Advantages of Market Value Weights
(a) Market values of securities are approximately close to the actual amount to bereceived from their sale.
(b) Costs of the specific resources of funds that constitute the capital structure of thefirm, are calculated by keeping in mind the prevailing market prices.
Disadvantages of Market Value Weights
(a) Market values may not be available when a firm is not listed or when the securitiesof the firm are very thinly traded.
(b) Market value may be distorted when securities prices are influenced by manipulationloading.
(c) Equity capital gets greater importance.
Did u know? Most of the financial analysts prefer to use market value weights because it istheoretically consistent and sound.
Illustration 22:
A firm has the following capital structure as the latest statement shows:
Source of Funds After Tax Cost (%)
Debt Preference shares Equity share Retained earnings
30,00,000 10,00,000 20,00,000 40,00,000
4 8.5 11.5 10
Total 100,00,000
Based on the book values compute the cost of capital.
Solution:
Source of Finance Weights Specific Cost (%) Weighted Cost
Debt 0.30 0.04 0.012
Preference shares 0.10 0.08 0.008
Equity share 0.20 0.11 0.022
Retained earnings 0.40 0.10 0.040
1.00 0.082
Contd...

110 LOVELY PROFESSIONAL UNIVERSITY
Financial Management
Notes
Source of Finance Weights Specific Cost (%) Weighted Cost
Debt 0.30 0.04 0.012
Preference shares 0.10 0.08 0.008
Equity share 0.20 0.11 0.022
Retained earnings 0.40 0.10 0.040
1.00 0.082
Overall cost of capital (Ko) = Total Weighted Cost × 100
= 0.082 × 100 = 8.2 per cent
Cost of Weight
Debt weight = Debt capital 30,00,000= = 0.30Total capital 1,00,00,000
Illustration 23:
XYZ company supplied the following information and requested you to compute the cost ofcapital based on book values and market values.
Source of Finance Book Value ( ) Market Value ( ) After Tax Cost (%)
Equity capital
Long-term debt
Short-term debt
10,00,000
8,00,000
2,00,000
15,00,000
7,50,000
2,00,000
12
7
4
Total 20,00,000 24,50,000
Solution:
Computation of Cost of Capital based on Book Value
Source of Finance Book Value ( ) Weights Specific cost Weighted cost
(1) (2) (3) (4) (5) = (3) × (4)
Equity capital 10,00,000 0.50 0.12 0.060
Long-term debt 8,00,000 0.40 0.07 0.028
Short-term debt 2,00,000 0.10 0.04 0.004
Total 20,00,000 1.00 0.092
Cost of capital = 0.092 × 100 = 9.2 per cent
Cost of Capital based on Market Value Weight
Source of Finance Book Value ( ) Weights Specific cost Weighted cost
(1) (2) (3) (4) (5) = (3) × (4)
Equity capital Long-term debt Short-term debt
15,00,000 7,50,000 2,00,000
0.613 0.307 0.080
0.12 0.07 0.04
0.074 0.022 0.003
24,50,000 1.000 0.099
Cost of capital = 100 × 0.099 = 9.9 per cent
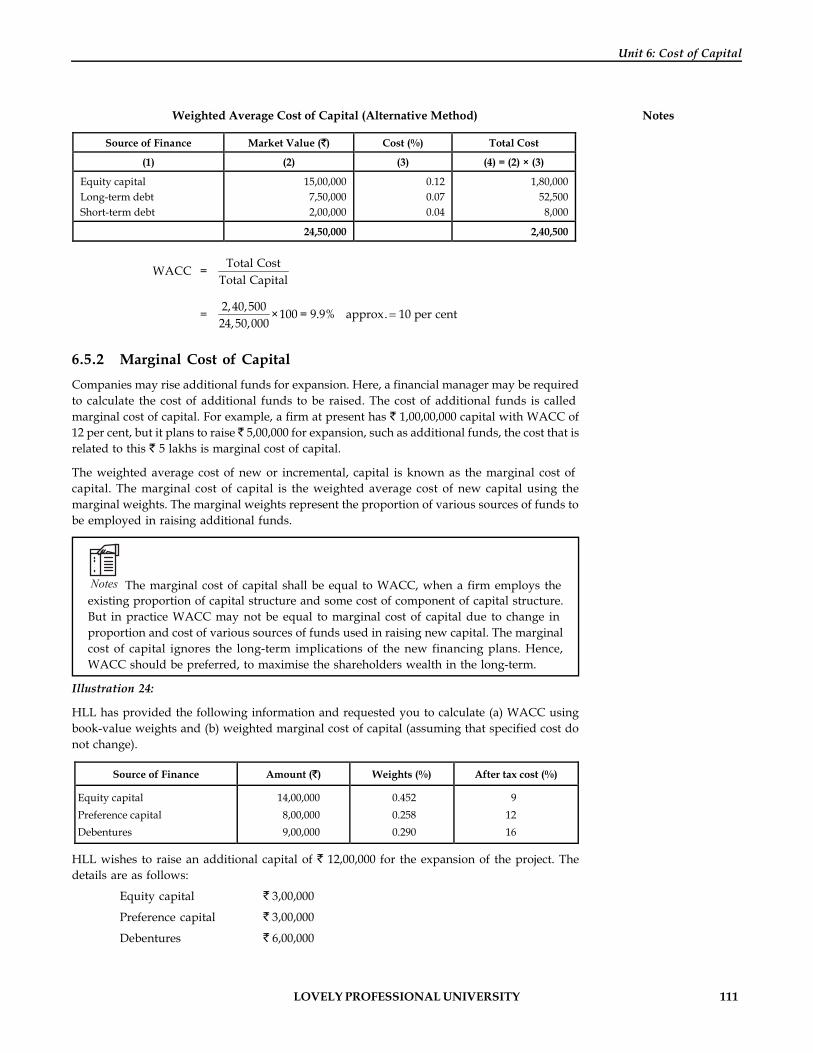
LOVELY PROFESSIONAL UNIVERSITY 111
Unit 6: Cost of Capital
NotesWeighted Average Cost of Capital (Alternative Method)
Source of Finance Market Value ( ) Cost (%) Total Cost
(1) (2) (3) (4) = (2) × (3)
Equity capital Long-term debt Short-term debt
15,00,000 7,50,000 2,00,000
0.12 0.07 0.04
1,80,000 52,500
8,000
24,50,000 2,40,500
WACC = Total CostTotal Capital
= 2,40,500 ×100 = 9.9% approx. 10 per cent24,50,000
6.5.2 Marginal Cost of CapitalCompanies may rise additional funds for expansion. Here, a financial manager may be requiredto calculate the cost of additional funds to be raised. The cost of additional funds is calledmarginal cost of capital. For example, a firm at present has 1,00,00,000 capital with WACC of12 per cent, but it plans to raise 5,00,000 for expansion, such as additional funds, the cost that isrelated to this 5 lakhs is marginal cost of capital.
The weighted average cost of new or incremental, capital is known as the marginal cost ofcapital. The marginal cost of capital is the weighted average cost of new capital using themarginal weights. The marginal weights represent the proportion of various sources of funds tobe employed in raising additional funds.
Notes The marginal cost of capital shall be equal to WACC, when a firm employs theexisting proportion of capital structure and some cost of component of capital structure.But in practice WACC may not be equal to marginal cost of capital due to change inproportion and cost of various sources of funds used in raising new capital. The marginalcost of capital ignores the long-term implications of the new financing plans. Hence,WACC should be preferred, to maximise the shareholders wealth in the long-term.
Illustration 24:
HLL has provided the following information and requested you to calculate (a) WACC usingbook-value weights and (b) weighted marginal cost of capital (assuming that specified cost donot change).
Source of Finance Amount ( ) Weights (%) After tax cost (%)
Equity capital Preference capital Debentures
14,00,000 8,00,000 9,00,000
0.452 0.258 0.290
9 12 16
HLL wishes to raise an additional capital of 12,00,000 for the expansion of the project. Thedetails are as follows:
Equity capital 3,00,000
Preference capital 3,00,000
Debentures 6,00,000

112 LOVELY PROFESSIONAL UNIVERSITY
Financial Management
Notes Solution:
Computation of WACC
Source of Finance Weights After tax Cost (%) Weighted Cost
Equity capital Preference capital Debentures
0.452 0.258 0.290
0.09 0.12 0.16
0.041 0.031 0.046
0.118
WACC = 0.118 × 100 = 11.8 per cent
Computation of Weighted Marginal Cost of Capital (WACC)
Source of Finance Marginal Weights After tax Cost (%) Weighted marginal cost
Equity capital Preference capital Debentures
0.50 0.25 0.25
0.09 0.12 0.16
0.045 0.030 0.040
0.115
WACC = 0.115 × 100 = 11.5 per cent
6.5.3 Factors Affecting WACCWeighted average cost of capital is affected by a number of factors. They are divided into twocategories such as:
1. Controllable Factors: Controllable factors are those factors that affect WACC, but the firmcan control them. They are:
(a) Capital Structure Policy: As we have assured, a firm has a given target capital structurewhere it assigns weights based on that target capital structure to calculate WACC.However, a firm can change its capital structure or proportions of components ofcapital that affect its WACC. For example, when a firm decides to use more debt andless equity, which will lead to reduction of WACC. At the same time increasingproportion of debt in capital structure increases the risk of both debt and equityholder, because it increases fixed financial commitment.
(b) Dividend Policy: The required capital may be raised by equity or debt or both. Equitycapital can be raised by issue of new equity shares or through retained earnings.Sometimes companies may prefer to raise equity capital by retention of earnings,due to issue of new equity shares, which are expensive (they involve flotation costs).Firms may feel that retained earnings is less costly when compared to issue of newequity. But if it is different it is more costly, since the retained earnings is incomethat is not paid as dividends hence, investors expect more return and so it affects thecost of capital.
(c) Investment Policy: While estimating the initial cost of capital, generally we use thestarting point as the required rate of return on the firm’s existing stock and bonds.Therefore, we implicitly assume that new capital will be invested in assets of thesame type and with the same degree of risk. But it is not correct as no firm invest inassets similar to the ones that currently operate, when a firm changes its investmentpolicy. For example, investment in diversified business.
LOVELY PROFESSIONAL UNIVERSITY 113
Unit 6: Cost of Capital
Notes2. Uncontrollable Factors: The factors that are not possible to be controlled by the firm andmostly affects the cost of capital. These factors are known as External factors.
(a) Tax Rates: Tax rates are beyond the control of a firm. They have an important effecton the overall cost of the capital. Computation of debt involves consideration of tax.In addition, lowering capital gains tax rate relative to the rate on ordinary incomemakes stocks more attractive and reduces cost of equity and lower the overall cost ofcapital.
(b) Level of Interest Rates: Cost of debt is interest rate. If interest rates increases,automatically cost of debt also increases. On the other hand, if interest rates are lowthen the cost of debt is less. The reduced cost of debt decreases WACC and this willencourage an additional investment.
(c) Market Risk Premium: Market risk premium is determined by the risk in investingproposed stock and the investor’s aversion to risk. Market risk is out of control risk,i.e., firms have no control on this factor.
The above are the important factors that affect the cost of capital.
Task Weighted average of cost of capital may be determined using book value andmarket value weights. Compare the pros and cons of using market value weights ratherthan book value weights in calculating WACC.
Self AssessmentFill in the blanks:
13. The weighted average cost of new or incremental, capital is known as the ………………....
14. Book value weights are based on the values found on the……………………….
15. The ………………..cost of capital lies between the least and most expensive funds.
Case Study Case: Nike, Inc. – Cost of Capital
On July, Kimi-ford, a portfolio manager at North Point Group, a mutual-fund-management firm, pored over analysts’ write-ups of Nike, Inc., the athletic-shoemanufacturer. Nike’s share price had declined significantly from the start of the
year. Ford was considering buying some shares for the fund she managed, the North PointLarge-Cap Fund, which invested mostly in fortune 500 companies, with an emphasis onvalue investing. Its top holdings included Exxon Mobile. General Motors, McDonald’s,3M, and other large-cap. It had performed extremely well. In 2000, the fund earned areturn of 20.7 per cent even as the S&P 500 fell 10.1 per cent. The fund’s year-to-date returnsat the end of June 2001 stood at 6.4 versus the S&P – 7.3 per cent.
Only a week ago, on June 28,2001, Nike held an analyst’ meeting to disclose its fiscal-year2001 results. The meeting, however had another purpose : Nike management wanted tocommunicate a strategy for revitalizing the company. Since 1997 Nike’s revenues hadplateaued at around $9 billion, while net income had fallen from almost $ 800 million to$580 million (see Exhibit 1). Nike’s markets in the U.S. had fallen from 48 per cent in 1997
Contd...
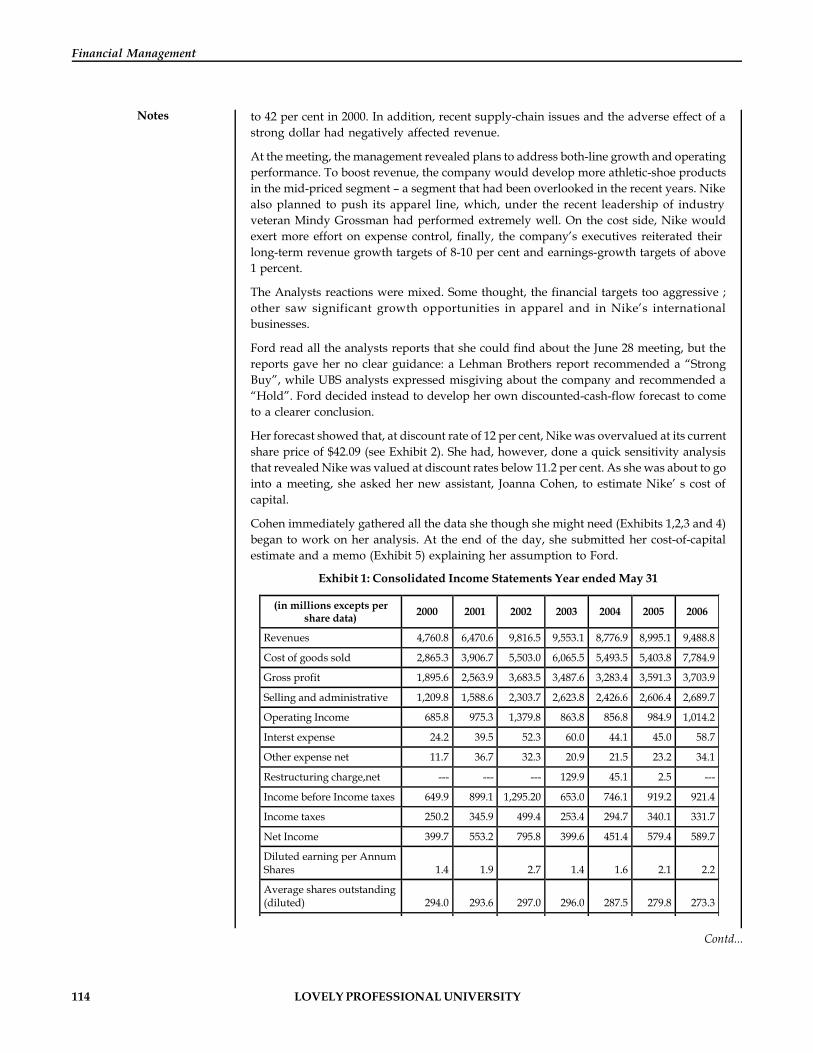
114 LOVELY PROFESSIONAL UNIVERSITY
Financial Management
Notes to 42 per cent in 2000. In addition, recent supply-chain issues and the adverse effect of astrong dollar had negatively affected revenue.
At the meeting, the management revealed plans to address both-line growth and operatingperformance. To boost revenue, the company would develop more athletic-shoe productsin the mid-priced segment – a segment that had been overlooked in the recent years. Nikealso planned to push its apparel line, which, under the recent leadership of industryveteran Mindy Grossman had performed extremely well. On the cost side, Nike wouldexert more effort on expense control, finally, the company’s executives reiterated theirlong-term revenue growth targets of 8-10 per cent and earnings-growth targets of above1 percent.
The Analysts reactions were mixed. Some thought, the financial targets too aggressive ;other saw significant growth opportunities in apparel and in Nike’s internationalbusinesses.
Ford read all the analysts reports that she could find about the June 28 meeting, but thereports gave her no clear guidance: a Lehman Brothers report recommended a “StrongBuy”, while UBS analysts expressed misgiving about the company and recommended a“Hold”. Ford decided instead to develop her own discounted-cash-flow forecast to cometo a clearer conclusion.
Her forecast showed that, at discount rate of 12 per cent, Nike was overvalued at its currentshare price of $42.09 (see Exhibit 2). She had, however, done a quick sensitivity analysisthat revealed Nike was valued at discount rates below 11.2 per cent. As she was about to gointo a meeting, she asked her new assistant, Joanna Cohen, to estimate Nike’ s cost ofcapital.
Cohen immediately gathered all the data she though she might need (Exhibits 1,2,3 and 4)began to work on her analysis. At the end of the day, she submitted her cost-of-capitalestimate and a memo (Exhibit 5) explaining her assumption to Ford.
Exhibit 1: Consolidated Income Statements Year ended May 31
(in millions excepts per share data) 2000 2001 2002 2003 2004 2005 2006
Revenues 4,760.8 6,470.6 9,816.5 9,553.1 8,776.9 8,995.1 9,488.8
Cost of goods sold 2,865.3 3,906.7 5,503.0 6,065.5 5,493.5 5,403.8 7,784.9
Gross profit 1,895.6 2,563.9 3,683.5 3,487.6 3,283.4 3,591.3 3,703.9
Selling and administrative 1,209.8 1,588.6 2,303.7 2,623.8 2,426.6 2,606.4 2,689.7
Operating Income 685.8 975.3 1,379.8 863.8 856.8 984.9 1,014.2
Interst expense 24.2 39.5 52.3 60.0 44.1 45.0 58.7
Other expense net 11.7 36.7 32.3 20.9 21.5 23.2 34.1
Restructuring charge,net --- --- --- 129.9 45.1 2.5 ---
Income before Income taxes 649.9 899.1 1,295.20 653.0 746.1 919.2 921.4
Income taxes 250.2 345.9 499.4 253.4 294.7 340.1 331.7
Net Income 399.7 553.2 795.8 399.6 451.4 579.4 589.7
Diluted earning per Annum Shares 1.4 1.9 2.7 1.4 1.6 2.1 2.2
Average shares outstanding (diluted) 294.0 293.6 297.0 296.0 287.5 279.8 273.3
Growth(%)
Revenue 35.9 42.0 4.0 8.1 2.5 5.5
Operating income 42.2 41.5 37.4 0.8 15.0 3.0
Net income 38.4 43.9 49.8 13.0 28.3 1.8
Margins (%)
Gross margin 39.6 40.1 36.5 37.4 39.9 39.0
Operating margin 15.1 15.0 9.0 9.8 10.9 10.7
Net margin 8.5 8.7 4.2 3.1 6.4 6.2
Effective tax rate (%) 38.5 38.6 38.8 39.5 37.0 36.0
Contd...
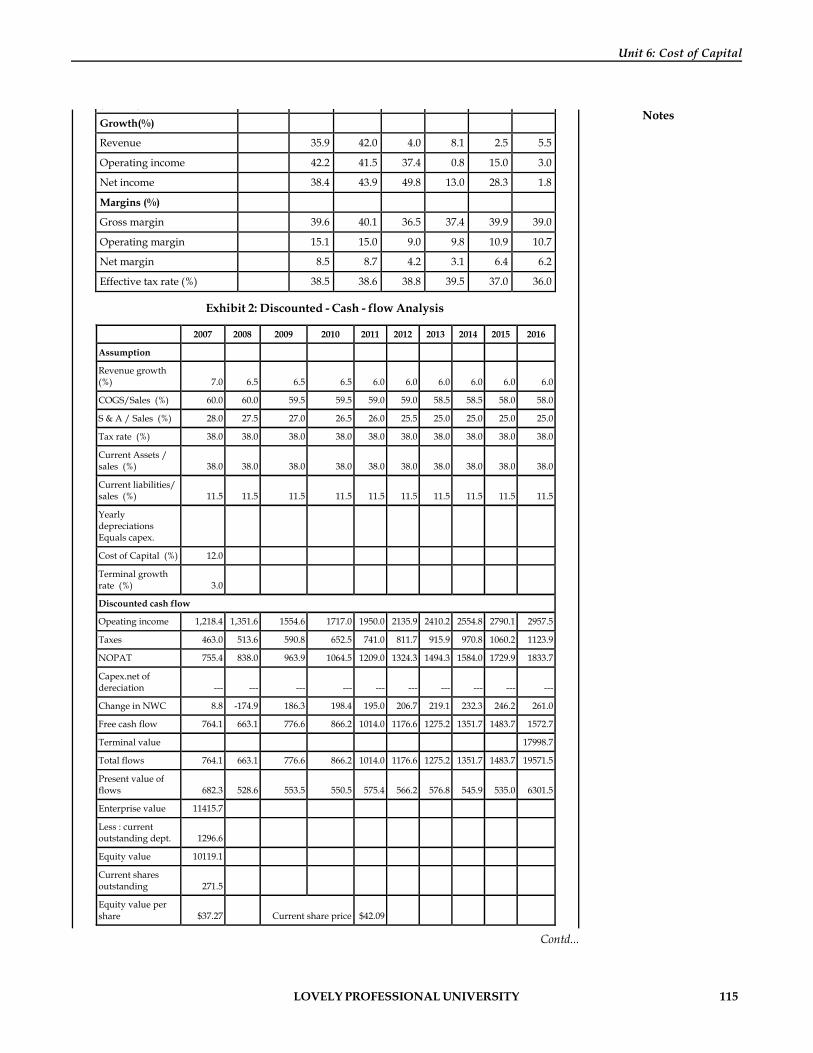
LOVELY PROFESSIONAL UNIVERSITY 115
Unit 6: Cost of Capital
Notes
(in millions excepts per share data) 2000 2001 2002 2003 2004 2005 2006
Revenues 4,760.8 6,470.6 9,816.5 9,553.1 8,776.9 8,995.1 9,488.8
Cost of goods sold 2,865.3 3,906.7 5,503.0 6,065.5 5,493.5 5,403.8 7,784.9
Gross profit 1,895.6 2,563.9 3,683.5 3,487.6 3,283.4 3,591.3 3,703.9
Selling and administrative 1,209.8 1,588.6 2,303.7 2,623.8 2,426.6 2,606.4 2,689.7
Operating Income 685.8 975.3 1,379.8 863.8 856.8 984.9 1,014.2
Interst expense 24.2 39.5 52.3 60.0 44.1 45.0 58.7
Other expense net 11.7 36.7 32.3 20.9 21.5 23.2 34.1
Restructuring charge,net --- --- --- 129.9 45.1 2.5 ---
Income before Income taxes 649.9 899.1 1,295.20 653.0 746.1 919.2 921.4
Income taxes 250.2 345.9 499.4 253.4 294.7 340.1 331.7
Net Income 399.7 553.2 795.8 399.6 451.4 579.4 589.7
Diluted earning per Annum Shares 1.4 1.9 2.7 1.4 1.6 2.1 2.2
Average shares outstanding (diluted) 294.0 293.6 297.0 296.0 287.5 279.8 273.3
Growth(%)
Revenue 35.9 42.0 4.0 8.1 2.5 5.5
Operating income 42.2 41.5 37.4 0.8 15.0 3.0
Net income 38.4 43.9 49.8 13.0 28.3 1.8
Margins (%)
Gross margin 39.6 40.1 36.5 37.4 39.9 39.0
Operating margin 15.1 15.0 9.0 9.8 10.9 10.7
Net margin 8.5 8.7 4.2 3.1 6.4 6.2
Effective tax rate (%) 38.5 38.6 38.8 39.5 37.0 36.0
Exhibit 2: Discounted - Cash - flow Analysis
2007 2008 2009 2010 2011 2012 2013 2014 2015 2016
Assumption
Revenue growth (%) 7.0 6.5 6.5 6.5 6.0 6.0 6.0 6.0 6.0 6.0
COGS/Sales (%) 60.0 60.0 59.5 59.5 59.0 59.0 58.5 58.5 58.0 58.0
S & A / Sales (%) 28.0 27.5 27.0 26.5 26.0 25.5 25.0 25.0 25.0 25.0
Tax rate (%) 38.0 38.0 38.0 38.0 38.0 38.0 38.0 38.0 38.0 38.0
Current Assets / sales (%) 38.0 38.0 38.0 38.0 38.0 38.0 38.0 38.0 38.0 38.0
Current liabilities/ sales (%) 11.5 11.5 11.5 11.5 11.5 11.5 11.5 11.5 11.5 11.5
Yearly depreciations Equals capex.
Cost of Capital (%) 12.0
Terminal growth rate (%) 3.0
Discounted cash flow
Opeating income 1,218.4 1,351.6 1554.6 1717.0 1950.0 2135.9 2410.2 2554.8 2790.1 2957.5
Taxes 463.0 513.6 590.8 652.5 741.0 811.7 915.9 970.8 1060.2 1123.9
NOPAT 755.4 838.0 963.9 1064.5 1209.0 1324.3 1494.3 1584.0 1729.9 1833.7
Capex.net of dereciation --- --- --- --- --- --- --- --- --- ---
Change in NWC 8.8 -174.9 186.3 198.4 195.0 206.7 219.1 232.3 246.2 261.0
Free cash flow 764.1 663.1 776.6 866.2 1014.0 1176.6 1275.2 1351.7 1483.7 1572.7
Terminal value 17998.7
Total flows 764.1 663.1 776.6 866.2 1014.0 1176.6 1275.2 1351.7 1483.7 19571.5
Present value of flows 682.3 528.6 553.5 550.5 575.4 566.2 576.8 545.9 535.0 6301.5
Enterprise value 11415.7
Less : current outstanding dept. 1296.6
Equity value 10119.1
Current shares outstanding 271.5
Equity value per share $37.27 Current share price $42.09
Contd...
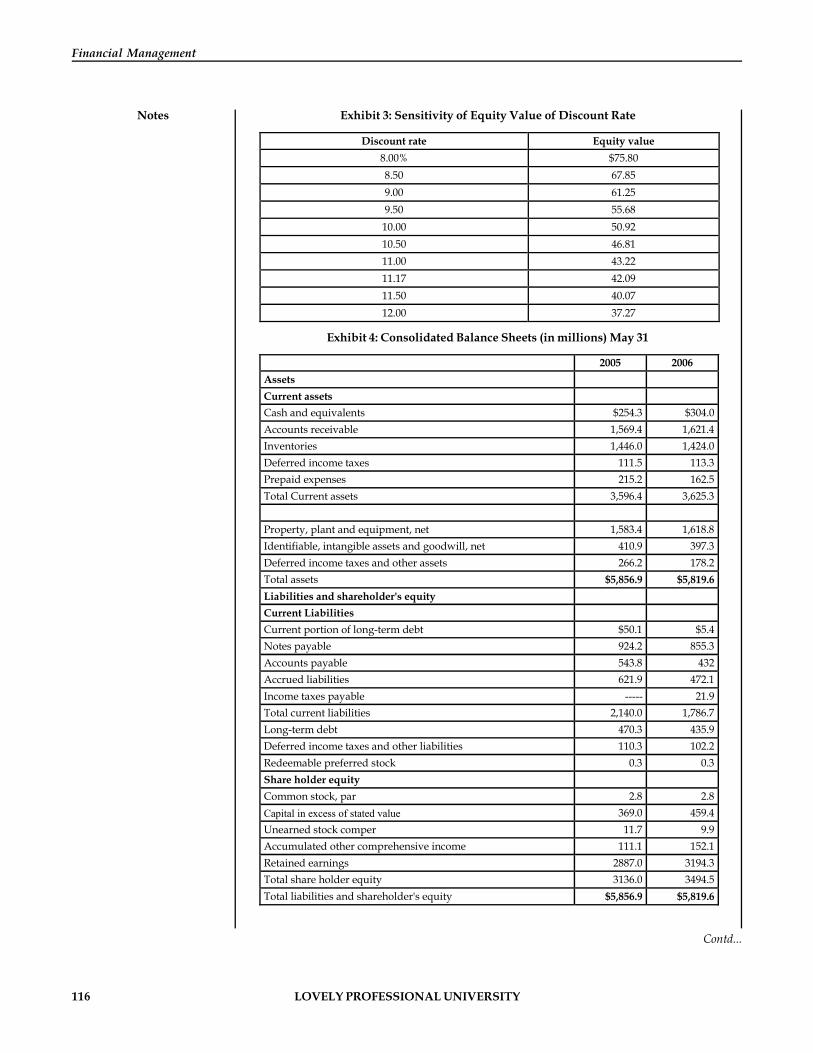
116 LOVELY PROFESSIONAL UNIVERSITY
Financial Management
Notes Exhibit 3: Sensitivity of Equity Value of Discount Rate
Discount rate Equity value 8.00% $75.80 8.50 67.85 9.00 61.25 9.50 55.68 10.00 50.92 10.50 46.81 11.00 43.22 11.17 42.09 11.50 40.07 12.00 37.27
Exhibit 4: Consolidated Balance Sheets (in millions) May 31
2005 2006 Assets Current assets Cash and equivalents $254.3 $304.0 Accounts receivable 1,569.4 1,621.4 Inventories 1,446.0 1,424.0 Deferred income taxes 111.5 113.3 Prepaid expenses 215.2 162.5 Total Current assets 3,596.4 3,625.3 Property, plant and equipment, net 1,583.4 1,618.8 Identifiable, intangible assets and goodwill, net 410.9 397.3 Deferred income taxes and other assets 266.2 178.2 Total assets $5,856.9 $5,819.6 Liabilities and shareholder's equity Current Liabilities Current portion of long-term debt $50.1 $5.4 Notes payable 924.2 855.3 Accounts payable 543.8 432 Accrued liabilities 621.9 472.1 Income taxes payable ----- 21.9 Total current liabilities 2,140.0 1,786.7 Long-term debt 470.3 435.9 Deferred income taxes and other liabilities 110.3 102.2 Redeemable preferred stock 0.3 0.3 Share holder equity Common stock, par 2.8 2.8 Capital in excess of stated value 369.0 459.4 Unearned stock comper 11.7 9.9 Accumulated other comprehensive income 111.1 152.1 Retained earnings 2887.0 3194.3 Total share holder equity 3136.0 3494.5 Total liabilities and shareholder's equity $5,856.9 $5,819.6
Contd...

LOVELY PROFESSIONAL UNIVERSITY 117
Unit 6: Cost of Capital
NotesExhibit 5: Dr. Bhatt’s Analysis
Subject: Nike’s Cost of Capital
Based on the following assumptions, my estimate of Nike’s cost of capital is 8.4 percent:
Single or Multiple Costs of Capital
The first question I considered was whether to use single or multiple costs of capital giventhat Nike has multiple business segments. Aside from footwear, which makes up 62 percent of revenue. Nike also sells apparel (30 per cent of revenue) that complement itsfootwear products. In addition, Nike sells sport balls, time-pieces, eyewear, skates, batsand other equipment designed for sports activities. Equipment products account for3.6 per cent of revenue. Finally, Nike also sells some non-Nike branded products such asCole-Haan dress and casual footwear, and ice stakes, skate blades, hockey sticks, hockeyjerseys and other products under the Bauer trademark, non-Nike brands account for4.5 per cent of the revenue.
I asked myself, whether Nike’s different business segments shad enough risks from eachother to warrant different costs of capital. Were their profiles really different? I concludedthat it was only the Cole-Haan line that was somewhat different: the rest were all sports-related businesses. However, since Cole-Haan makes up only a tiny fraction of the revenues,I did not think it necessary to compute a separate cost of capital. As for the apparel andfootwear lines, they are sold through the same marketing and distribution channels andare often marketed in “collections” of similar design. I believe, they face the same riskfactors, as such, I decided to compute only one cost of capital of the whole company.
Methodology for Calculating the Cost of Capital; WACC
Since Nike is funded with both debt and equity, I used the Weighted Average Cost ofCapital (WACC) method. Based on the latest available balance sheet, debt as a proportionof total capital makes up 27.0 per cent and equity accounts for 73.0 per cent:
Capital sources Book Values
Debt
Current portion of long-term debt $ 5.4
Notes payable 855.3
Long-term debt 435.9
$ 1.291.2 27.0% of total capital
$ 3.494.5 72.0% of total capital
Cost of Debt
My estimate of Nike’s cost of debt is 4.3 per cent. I arrived at this estimate by taking totalinterest expense for the year 2001 and dividing it by the company’s average debt balance.The rare is lower than Treasury yields but that is because Nike raised a portion of itsfunding needs through Japanese yen notes, which carry rates between 2.0 per cent to4.3 per cent.
After adjusting for tax, the cost of debt comes to 2.7 per cent. I used a tax rate of 38 per cent,which I obtained by adding state taxes of 3 per cent to the U.S. statutory tax rate. Historically,Nike’s state taxes have ranged from 2.5 per cent to 3.5 per cent.
Contd...
118 LOVELY PROFESSIONAL UNIVERSITY
Financial Management
Notes Cost of Equity
I estimated the cost of equity, using the Capital Asset Pricing Model (CAPM). Othermethods such as the Dividend Discount Model (DDM) and the Earnings CapitalizationRatio can be used to estimate the cost of equity. However, in my opinion, the CAPM is thesuperior method.
My estimate of Nike’s cost of equity is 10.5 per cent I used the current yield on 20-yearTreasury bonds as my risk-free rate, and the compound average premium of the marketover Treasury bonds (5.9 per cent) as my risk premium. For beta, I took the average ofNike’s beta from 1996 to the present.
Putting it all Together
After inputting all my assumptions into the WACC formula, my estimate of Nike’s cost ofcapital is 8.4 per cent.
WACC = Kd (1 – t) × D/(D + E) + Kc × E/(D + E)
= 2.7% × 27.0% + 20.5% × 73.0%
= 8.4%
Question
What is the importance of cost of capital for any firm?
6.6 Summary The cost of capital is viewed as one of the corner stones in the theory of financial
management.
Cost of capital may be viewed in different ways.
Cost of capital is the weight average cost of various sources of finance used by the firm. Itcomprises the risk less cost of the particular type of financing (rj), the business risk premium,(b) and the financial risk premium (f).
The cost of capital is useful in designing optimal capital structure, investment evaluation,and financial performance appraisal.
The financial manager has to compute the specific cost of each type of funds needed in thecapitalisation of a company.
Retained earnings are one of the internal sources to raise equity finance.
The opportunity cost of retained earning is the rate of return the shareholder forgoes bynot putting his funds elsewhere.
Cost of equity capital, is the minimum rate of return that a firm must earn on the equityfinanced portions of an investment project in order to leave unchanged the market price ofthe shares.
The marginal cost of capital is the weighted average cost of new capital using the marginalweights.
Marginal cost of capital shall be equal to WACC, when a firm employs the existingproportion of capital structure and some cost of component of capital structure.
LOVELY PROFESSIONAL UNIVERSITY 119
Unit 6: Cost of Capital
Notes6.7 KeywordsCost of Capital: It is that minimum rate of return, which a firm must earn on its investments soas to maintain the market value of its shares.
Explicit Cost: It is the discount rate that equates the present value of the cash inflows with thepresent value of its increments cash outflows.
Future Cost: It is the cost of capital that is expected to raise the funds to finance a capital budgetor investment proposal.
Implicit Cost: It is the cost of opportunity which is given up in order to pursue a particularaction.
Marginal Cost of Capital: The additional cost incurred to obtain additional funds required by afirm.
Opportunity Cost: The benefit that the shareholder foregoes by not putting his/her fundselsewhere because they have been retained by the management.
Specific Cost: It is the cost associated with particular component or source of capital.
Spot Cost: The cost that are prevailing in the market at a certain time.
6.8 Review Questions1. Examine the relevance of cost of capital in capital budgeting decisions.
2. Elucidate the importance of CAPM approach for calculation of cost of equity.
3. “Marginal cost of capital nothing but the average cost of capital”. Explain.
4. Analyse the concept of flotation costs in the determination of cost of capital.
5. AMC Engineering Company issues 12 per cent, 100 face value of preference stock, whichis repayable with 10 per cent premium at the end of 5 years. It involves a flotation cost of5 per cent per share. What is the cost of preference share capital, with 5 per cent dividendtax?
6. “Evaluating the capital budgeting proposals without cost of capital is not possible.”Comment.
7. VS International is thinking of rising funds by the issuance of equity capital. The currentmarket price of the firm’s share is 150. The firm is expected to pay a dividend of 3.9 nextyear. At present, the firm can sell its share for 140 each and it involves a flotation cost of
10. Calculate cost of new issue.
8. WACC may be determined using the book values & the market value weights. Comparethe pros & cons of using market value weights rather than book value weights in calculatingthe WACC.
9. Critically evaluate the different approaches to the calculation of cost of equity capital.
10. A company issues 12,000, 12 per cent perpetual preference shares of 100 each. Companyis expected to pay 2 per cent as flotation cost. Calculate the cost of preference sharesassuming to be issued at (a) face value of par value, (b) at a discount of 5% and (c) at apremium of 10%.
11. An investor supplied you the following information and requested you to calculate. Expectedrate of returns on market portfolio – Risk free returns = 10 per cent

120 LOVELY PROFESSIONAL UNIVERSITY
Financial Management
NotesInvestment in Company Initial Price Dividends Year-end Market
Price Beta risk
Factor
A Paper 20 2 55 0.7
Steel 30 2 65 0.8
Chemical 40 2 140 0.6
B GOI Bonds 1000 140 1005 0.99
12. A company currently is maintaining 6 per cent rate of growth in dividends. The last yeardividend was 4.5 per share. Equity share holders required rate of return is 15 per cent.What is the equilibrium price per share?
13. Karvy is planning to sell equity shares. Mr. Ram wishes to invest in Karvy Company bypurchasing equity shares. The company’s bond has been yielding at 13 per cent. You arerequested by Mr. Ram to calculate his expected rate of return on equity based on bondyield plus risk premium approach (assuming 3 per cent as risk premium).
14. Sai Enterprises issued 9 per cent preference share (irredeemable) four years ago. Thepreference share that has a face value of 100 is currently selling for 93. What is the costof preference share with 8 per cent tax on dividend?
15. Company has 50,000 preference shares of 100 at par outstanding at 11 per cent dividend.The current market price of the share is 90. What is its cost?
Answers: Self Assessment
1. rate of return 2. percentage. 3. capital formation
4. debt 5. Cost of Capital 6. actual profitability
7. marginal 8. Future Cost 9. Spot
10. interest rate 11. discount rate 12. opportunity
13. marginal cost of capital 14. balance sheet 15. composite
6.9 Further Readings
Books Dr Pradeep Kumar Sinha, Financial Management, New Delhi, Excel Books, 2009.
Sudhindra Bhat, Financial Management, New Delhi, Excel Books, 2008.
Van Horne, J.C. and Wachowicz, Jr, J.M., Fundamentals of Financial Management,New Delhi, Prentice Hall of India Pvt. Ltd., 1996, p. 2.
Chandra, P., Financial Management—Theory and Practice, New Delhi, Tata McGrawHill Publishing Company Ltd., 2002, p. 3.
LOVELY PROFESSIONAL UNIVERSITY 121
Unit 7: Capital Structure Decision
NotesUnit 7: Capital Structure Decision
CONTENTS
Objectives
Introduction
7.1 Meaning of Capital Structure
7.2 Major Considerations in Capital Structure Planning
7.3 Value of the Firm and Capital Structure
7.4 Capital Structure Theories
7.4.1 Net Income (NI) Approach
7.4.2 Net Operating Income (NOI) Approach
7.4.3 Modigliani–Miller’s Approach (Extension of NOI Approach)
7.5 Effects of a Financing Decision on Earnings Per Share
7.6 Summary
7.7 Keywords
7.8 Review Questions
7.9 Further Readings
Objectives
After studying this unit, you will be able to:
Define the capital structure
Recognize the conception of optimum capital structure
Explain the different considerations in capital structure planning
Describe the theories of capital structure.
IntroductionOrganizations have need of funds to run and maintain its business. The requisite funds may beraised from short-term sources or long-term sources or a combination both the sources of funds,so as to equip itself with an appropriate combination of fixed assets and current assets. Currentassets to a considerable extent, are financed with the help of short-term sources. Normally, firmsare expected to follow a prudent financial policy, as revealed in the maintenance of net currentassets. This net positive current asset must be financed by long-term sources. Hence, long-termsources of funds are required to finance for both (a) long-term assets (fixed assets) and(b) networking capital (positive current assets). The long-term financial strength as well asprofitability of a firm is influenced by its financial structure. The term ‘Financial Structure’refers to the left hand side of the balance sheet as represented by “total liabilities” consisting ofcurrent liabilities, long-term debt, preference share and equity share capital. The financialstructure, therefore, includes both short-term and long-term sources of funds.

122 LOVELY PROFESSIONAL UNIVERSITY
Financial Management
Notes 7.1 Meaning of Capital StructureThe basic objective of financial management is to maximize the shareholders wealth. Therefore,all financial decisions in any firm should be taken in the light of this objective.
Whenever a company is required to raise long-term funds the finance manager is required toselect such a mix of sources of finance that overall cost of capital is minimum (i.e., value of thefirm/wealth of shareholders is maximum). Mix of long-term sources of finance is referred as“capital structure”.
Optimum Capital Structure
The capital structure is said to be optimum when the firm has selected such a combination ofequity and debt so that the wealth of firm (shareholder) is maximum. At this capital structure,the cost of capital is minimum and market price per share is maximum.
It is very difficult to find out optimum debt and equity mix where capital structure would beoptimum because it is difficult to measure a fall in the market value of an equity shares onaccount of Increase in risk due to high debt content in capital structure. Hence, in practice, theexpression “appropriate capital structure” is more realistic expression than ‘optimum capitalstructure’.
Features of an Appropriate Capital Structure
1. Profitability: The most profitable capital structure is one that tends to minimize cost offinancing and maximize earning per equity share.
2. Flexibility: The capital structure should be such that company can raise funds wheneverneeded.
3. Conservation: The debt content in the capital structure should not exceed the limit, whichthe company can bear.
4. Solvency: The capital structure should be such that firm does not run the risk of becominginsolvent.
5. Control: The capital structure should be so devised that it involves minimum risk of lossof control of the company.
Self AssessmentFill in the blanks:
1. Capital structure is referred as mix of ……………..sources of finance.
2. At …………….capital structure, the cost of capital is minimum and market price per shareis maximum.
3. The most profitable capital structure is one that tends to minimize ………………….andmaximize earning per equity share.
7.2 Major Considerations in Capital Structure Planningln planning the capital structure, one should keep in mind that there is no one definitemodel that can be suggested/used as an ideal for all business undertakings. This is becauseof varying circumstances of business undertakings. It is, therefore important to understandthat different types of capital structure would be required for different types of businessundertakings.
LOVELY PROFESSIONAL UNIVERSITY 123
Unit 7: Capital Structure Decision
Notes
Notes The capital structure depends primarily on number of factors like:
The nature of industry,
Gestation period,
Certainty with which the profit will accrue after the undertaking goes intocommercial production, and
The likely quantum of return on investment.
However, finance manager should take into consideration following factors while planning thecapital structure:
1. Risk: Risk is of two kinds, i.e. financial risk and business risk. In the context of capitalstructure planning, financial risk is relevant. Financial risk also is of two types:
(a) Risk of cash insolvency: As a firm raises more debt, its risk of cash insolvency increases.This is due to two reasons. Firstly, higher proportion of debt in the capital structureincreases the commitments of the company with regard to fixed charges. This meansthat a company stands committed to pay a higher amount of interest irrespective ofthe fact whether it has cash or not. Secondly, the possibility that the supplier of fundsmay withdraw the funds at any given point of time. Thus, the long-term creditorsmay have to be paid back in installments, even if sufficient cash to do so does notexist. This risk is not there in the case of equity shares.
(b) Risk of variation in the expected earnings available to equity shareholders: In case a firm hashigher debt content in capital structure, the risk of variations in expected earningsavailable to equity shareholders will be higher. This is because of trading on equity,Financial leverage works both ways, i.e.; it enhances the shareholders return by ahigh magnitude, or brings it down sharply depending upon whether the return oninvestment is higher or lower than the rate of interest.
2. Cost of capital: Cost is an important consideration in capital structure decisions, it isobvious that a business should be at least capable of earning enough revenue to meet itscost of capital and finance its growth.
3. Control: Along with cost and risk factors, the control aspect is also important considerationin planning the capital structure. When a company issues further equity shares, itautomatically dilutes the controlling interest of the present owners. Similarly, preferenceshareholders can have voting rights and thereby affect the composition of the Board ofDirectors in case dividends on such shares are not paid for two consecutive years. Financialinstitutions normally stipulate that they shall have one or more directors on the Board.Hence, when the management agrees to raise loans from financial institutions, byimplication it agrees to forego a part of its control over the company. It is obvious therefore,that decisions concerning capital structure are taken after keeping the control factor mind.
4. Trading on Equity: A company may raise funds either by the issue of shares or byborrowings. Borrowings carry a fixed rate of interest and this interest is payable irrespectiveof fact whether there is profit or not. Of course, preference shareholders are also entitledto a fixed rate of dividend but payment of dividend is subject to the profitability of thecompany. In case the Rate Of Return (ROI) on the total capital employed i.e. shareholdersfunds plus log term borrowings, is more than the rate of interest on borrowed funds orrate of dividend on preference shares, it is said that the company is trading on equity. Oneof the prime objectives of a finance manager is to maximize both the return on ordinary
124 LOVELY PROFESSIONAL UNIVERSITY
Financial Management
Notes shares and the tota1 wealth of company. This objective has to be kept in view whilemaking a decision on a new source of finance its impact on the earnings per share has to becarefully analyzed. This helps in deciding whether funds should be raised by internalequity or by borrowings.
5. Corporate Taxation: Under the Income Tax laws, dividend on shares is not deductible,while interest paid on borrowed capital is allowed as deduction for computing taxableincome. The cost of raising finance through borrowing is deductible in the year in whichit is incurred. If it is incurred during the pre-commencement period, it is to be capitalized.Cost of issue of shares is allowed as deduction. Owing to these provisions corporatetaxation plays an important role in determining the choice between different sources offinancing.
6. Government Policies: Government policies are a major factor in determining capitalstructure.
Example: a change in the lending policies of financial institutions may mean a completechange in the financial pattern to be followed in the companies.
Similarly, the Rules and Regulations framed by SEBI considerably affect the capital issuepolicy of various companies. Monetary and fiscal policies of the government also affectthe capital structure decisions.
7. Legal Requirements: The finance manager has to keep in view the legal requirementswhile deciding about the capital structure of the company.
8. Marketability: To obtain a balanced capital structure it is necessary to consider the abilityof the company to market corporate securities.
9. Maneuverability: Maneuverability is required to have as many alternatives as possible atthe time of expanding or contracting the requirement of funds. It enables use of propertype of funds available at a given time and also enhances the bargaining power whendealing with the prospective suppliers of funds.
10. Flexibility: Flexibility refers to the capacity of the business and its management to adjustto expect and unexpected changes in circumstances. In other words, management wouldlike to have a capital structure, which provides maximum freedom to changes at all times.
11. Timing: Closely related to flexibility is the timing for issue of securities. Proper timing ofa security issue often brings substantial savings because of the dynamic nature of thecapital market. An Intelligent management tries to anticipate the climate in capital marketwith a view to minimize the cost of raising funds and also to minimize the dilutionresulting from an issue of new ordinary shares.
12. Size of the Company: Small companies rely heavily on owners’ funds while large companiesare generally considered to be less risky by the investors and therefore, they can issuedifferent types of securities.
13. Purpose of Financing: The purpose of financing also to some extent affects the capitalstructure of the company. In case funds are required for productive purposes likemanufacturing etc.; the company may raise funds through long-term sources. On otherhand, if funds are required for non-productive purposes, like welfare facilities to employeessuch as schools, hospitals etc., the company may rely only on internal resources.
14. Period of Finance: The period for which finance is required also effects the determinationof capital structure. In case such funds are required for long-term requirements, say 8-10
LOVELY PROFESSIONAL UNIVERSITY 125
Unit 7: Capital Structure Decision
Notesyears, then it will be appropriate to raise borrowed funds. However, if the funds arerequired more or less permanently, it will be appropriate to raise them by the issue ofequity share.
15. Nature of Enterprise: The nature of enterprise too, to a great extent, affects the capitalstructure or the company. Business enterprises that have stability in their earnings orthose who monopoly regarding their products may go for borrowings or preferenceshares, since they have adequate profits to pay interest/fixed charges. On the contrary,companies, which do not have assured income, should preferably rely on internal resourcesto a large extent.
16. Requirement of Investors: Different types of securities are issued to different classes ofinvestors according to their requirement.
17. Provision for Future: While planning capital structure the provision for future requirementof capital is also to be considered.
!Caution Along with the risk as a factor, the finance manager has to consider the cost aspectcarefully while determining the capital structure.
Self AssessmentFill in the blanks:
4. In the context of capital structure planning, ……………..risk is relevant.
5. Along with cost and risk factors, the …………..aspect is also important consideration inplanning the capital structure.
6. In case a firm has higher debt content in capital structure, the risk of variations in…………………….available to equity shareholders will be higher.
7.3 Value of the Firm and Capital StructureValue of the firm depends on the earnings of the firm and earnings of the firm depend upon theinvestment decisions of the firm.
Investment decision influences the size of the EBIT. The EBIT is shared among three mainclaimants:
1. The debt holders who receive their share in the form of interest.
2. The government which receives its share in the form of taxes.
3. The shareholders who receive the balance.
Thus, the investment decisions of the firm determine the size of the EBIT pool while the capitalstructure mix determines the way it is to be sliced. The total value of the firm is the sum of thevalue to the debt holders and its shareholders. Therefore, investment decision can increase thevalue of the firm by increasing the size of the EBIT whereas capital structure mix can affect thevalue only by reducing the share of the EBIT going to the government in the form of taxes.
Thus, the value of the firm, investment decisions and capital structure decisions are closelyrelated and is depicted by the following figure.
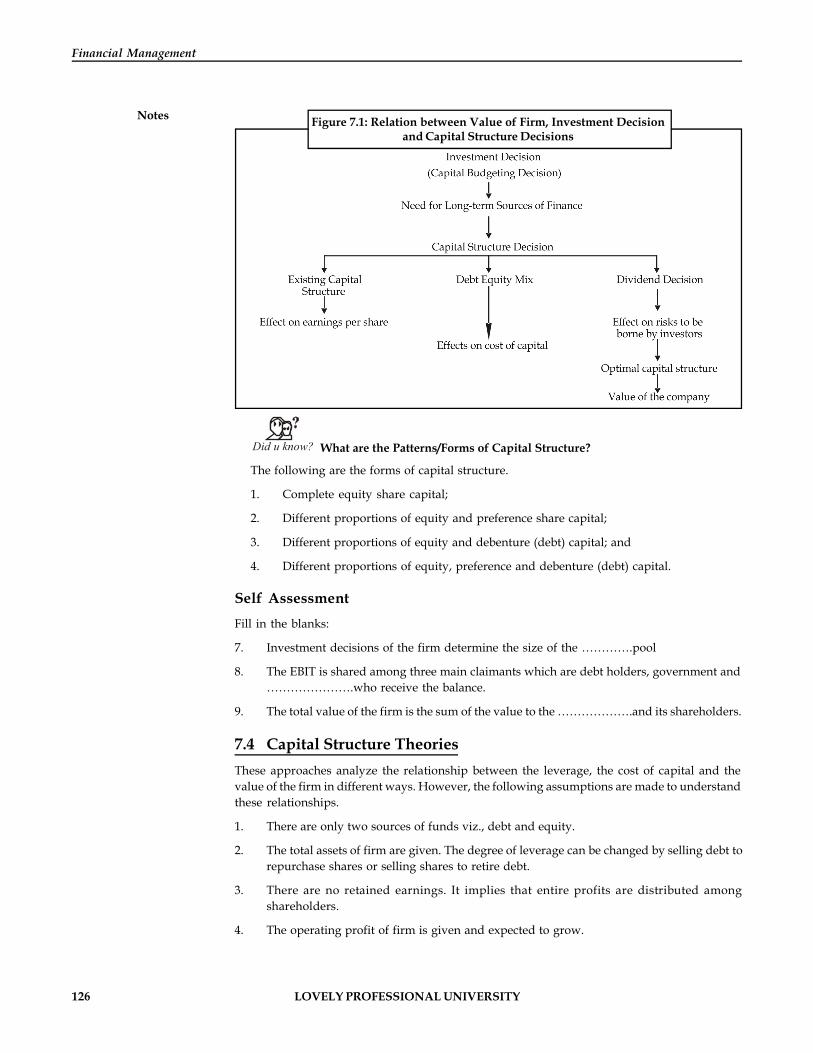
126 LOVELY PROFESSIONAL UNIVERSITY
Financial Management
Notes Figure 7.1: Relation between Value of Firm, Investment Decisionand Capital Structure Decisions
Did u know? What are the Patterns/Forms of Capital Structure?
The following are the forms of capital structure.
1. Complete equity share capital;
2. Different proportions of equity and preference share capital;
3. Different proportions of equity and debenture (debt) capital; and
4. Different proportions of equity, preference and debenture (debt) capital.
Self AssessmentFill in the blanks:
7. Investment decisions of the firm determine the size of the ………….pool
8. The EBIT is shared among three main claimants which are debt holders, government and………………….who receive the balance.
9. The total value of the firm is the sum of the value to the ……………….and its shareholders.
7.4 Capital Structure TheoriesThese approaches analyze the relationship between the leverage, the cost of capital and thevalue of the firm in different ways. However, the following assumptions are made to understandthese relationships.
1. There are only two sources of funds viz., debt and equity.
2. The total assets of firm are given. The degree of leverage can be changed by selling debt torepurchase shares or selling shares to retire debt.
3. There are no retained earnings. It implies that entire profits are distributed amongshareholders.
4. The operating profit of firm is given and expected to grow.
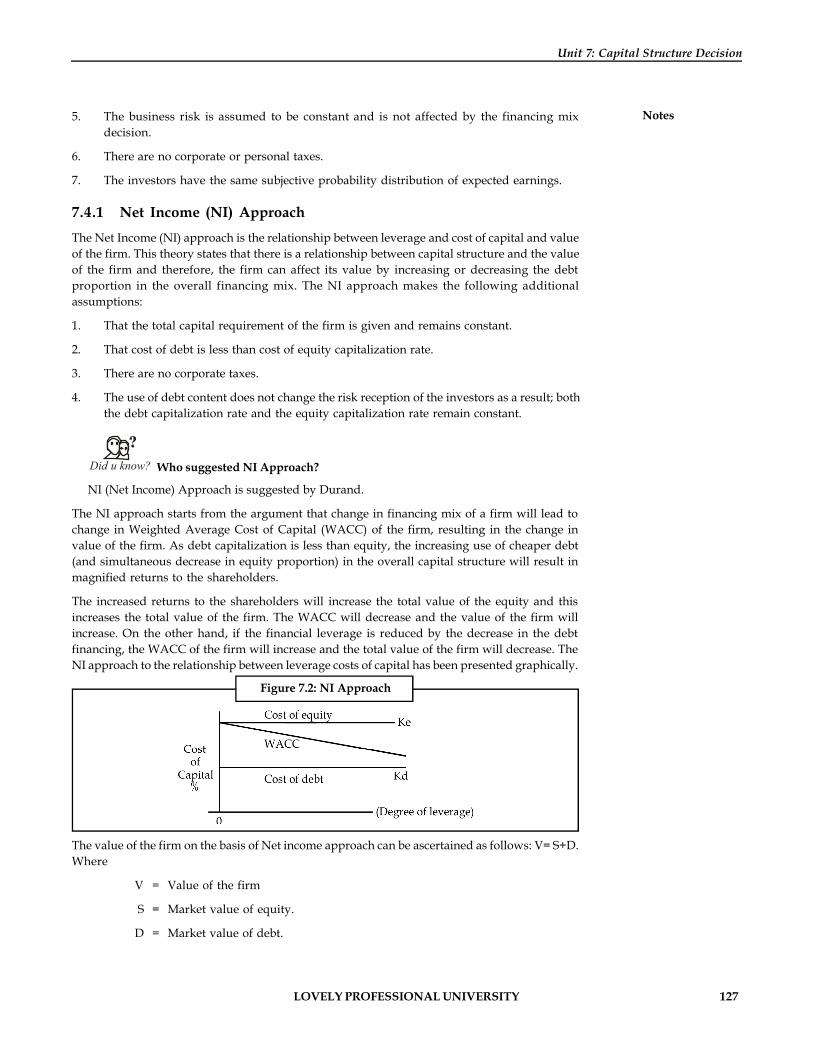
LOVELY PROFESSIONAL UNIVERSITY 127
Unit 7: Capital Structure Decision
Notes5. The business risk is assumed to be constant and is not affected by the financing mixdecision.
6. There are no corporate or personal taxes.
7. The investors have the same subjective probability distribution of expected earnings.
7.4.1 Net Income (NI) ApproachThe Net Income (NI) approach is the relationship between leverage and cost of capital and valueof the firm. This theory states that there is a relationship between capital structure and the valueof the firm and therefore, the firm can affect its value by increasing or decreasing the debtproportion in the overall financing mix. The NI approach makes the following additionalassumptions:
1. That the total capital requirement of the firm is given and remains constant.
2. That cost of debt is less than cost of equity capitalization rate.
3. There are no corporate taxes.
4. The use of debt content does not change the risk reception of the investors as a result; boththe debt capitalization rate and the equity capitalization rate remain constant.
Did u know? Who suggested NI Approach?
NI (Net Income) Approach is suggested by Durand.
The NI approach starts from the argument that change in financing mix of a firm will lead tochange in Weighted Average Cost of Capital (WACC) of the firm, resulting in the change invalue of the firm. As debt capitalization is less than equity, the increasing use of cheaper debt(and simultaneous decrease in equity proportion) in the overall capital structure will result inmagnified returns to the shareholders.
The increased returns to the shareholders will increase the total value of the equity and thisincreases the total value of the firm. The WACC will decrease and the value of the firm willincrease. On the other hand, if the financial leverage is reduced by the decrease in the debtfinancing, the WACC of the firm will increase and the total value of the firm will decrease. TheNI approach to the relationship between leverage costs of capital has been presented graphically.
Figure 7.2: NI Approach
The value of the firm on the basis of Net income approach can be ascertained as follows: V= S+D.Where
V = Value of the firm
S = Market value of equity.
D = Market value of debt.
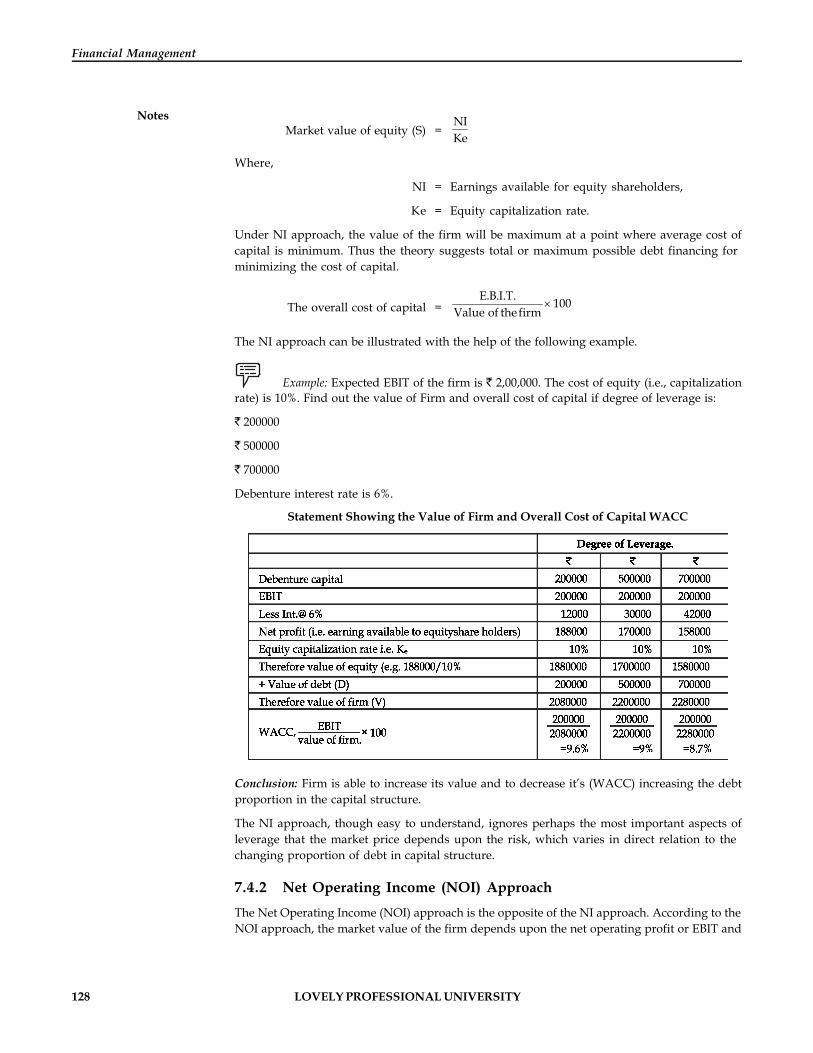
128 LOVELY PROFESSIONAL UNIVERSITY
Financial Management
NotesMarket value of equity (S) =
NIKe
Where,
NI = Earnings available for equity shareholders,
Ke = Equity capitalization rate.
Under NI approach, the value of the firm will be maximum at a point where average cost ofcapital is minimum. Thus the theory suggests total or maximum possible debt financing forminimizing the cost of capital.
The overall cost of capital =E.B.I.T. 100
Value of the firm
The NI approach can be illustrated with the help of the following example.
Example: Expected EBIT of the firm is 2,00,000. The cost of equity (i.e., capitalizationrate) is 10%. Find out the value of Firm and overall cost of capital if degree of leverage is:
200000
500000
700000
Debenture interest rate is 6%.
Statement Showing the Value of Firm and Overall Cost of Capital WACC
Conclusion: Firm is able to increase its value and to decrease it’s (WACC) increasing the debtproportion in the capital structure.
The NI approach, though easy to understand, ignores perhaps the most important aspects ofleverage that the market price depends upon the risk, which varies in direct relation to thechanging proportion of debt in capital structure.
7.4.2 Net Operating Income (NOI) ApproachThe Net Operating Income (NOI) approach is the opposite of the NI approach. According to theNOI approach, the market value of the firm depends upon the net operating profit or EBIT and
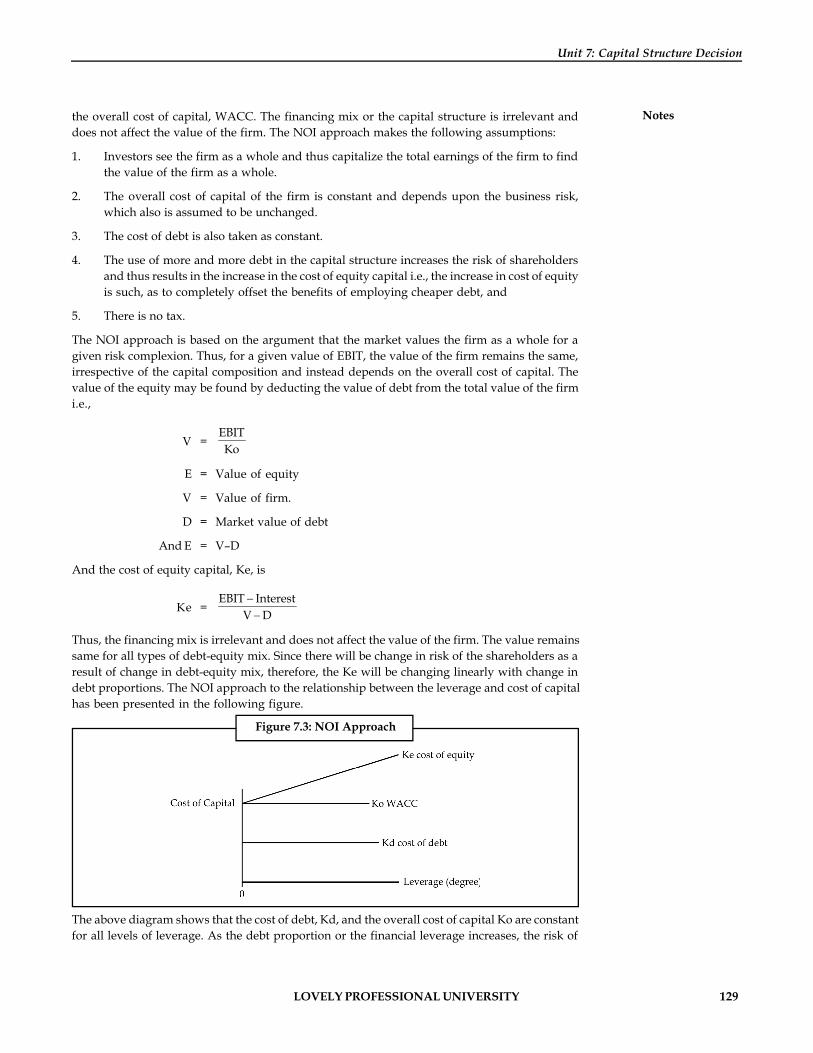
LOVELY PROFESSIONAL UNIVERSITY 129
Unit 7: Capital Structure Decision
Notesthe overall cost of capital, WACC. The financing mix or the capital structure is irrelevant anddoes not affect the value of the firm. The NOI approach makes the following assumptions:
1. Investors see the firm as a whole and thus capitalize the total earnings of the firm to findthe value of the firm as a whole.
2. The overall cost of capital of the firm is constant and depends upon the business risk,which also is assumed to be unchanged.
3. The cost of debt is also taken as constant.
4. The use of more and more debt in the capital structure increases the risk of shareholdersand thus results in the increase in the cost of equity capital i.e., the increase in cost of equityis such, as to completely offset the benefits of employing cheaper debt, and
5. There is no tax.
The NOI approach is based on the argument that the market values the firm as a whole for agiven risk complexion. Thus, for a given value of EBIT, the value of the firm remains the same,irrespective of the capital composition and instead depends on the overall cost of capital. Thevalue of the equity may be found by deducting the value of debt from the total value of the firmi.e.,
V =EBITKo
E = Value of equity
V = Value of firm.
D = Market value of debt
And E = V–D
And the cost of equity capital, Ke, is
Ke =EBIT Interest
V D-
-
Thus, the financing mix is irrelevant and does not affect the value of the firm. The value remainssame for all types of debt-equity mix. Since there will be change in risk of the shareholders as aresult of change in debt-equity mix, therefore, the Ke will be changing linearly with change indebt proportions. The NOI approach to the relationship between the leverage and cost of capitalhas been presented in the following figure.
Figure 7.3: NOI Approach
The above diagram shows that the cost of debt, Kd, and the overall cost of capital Ko are constantfor all levels of leverage. As the debt proportion or the financial leverage increases, the risk of
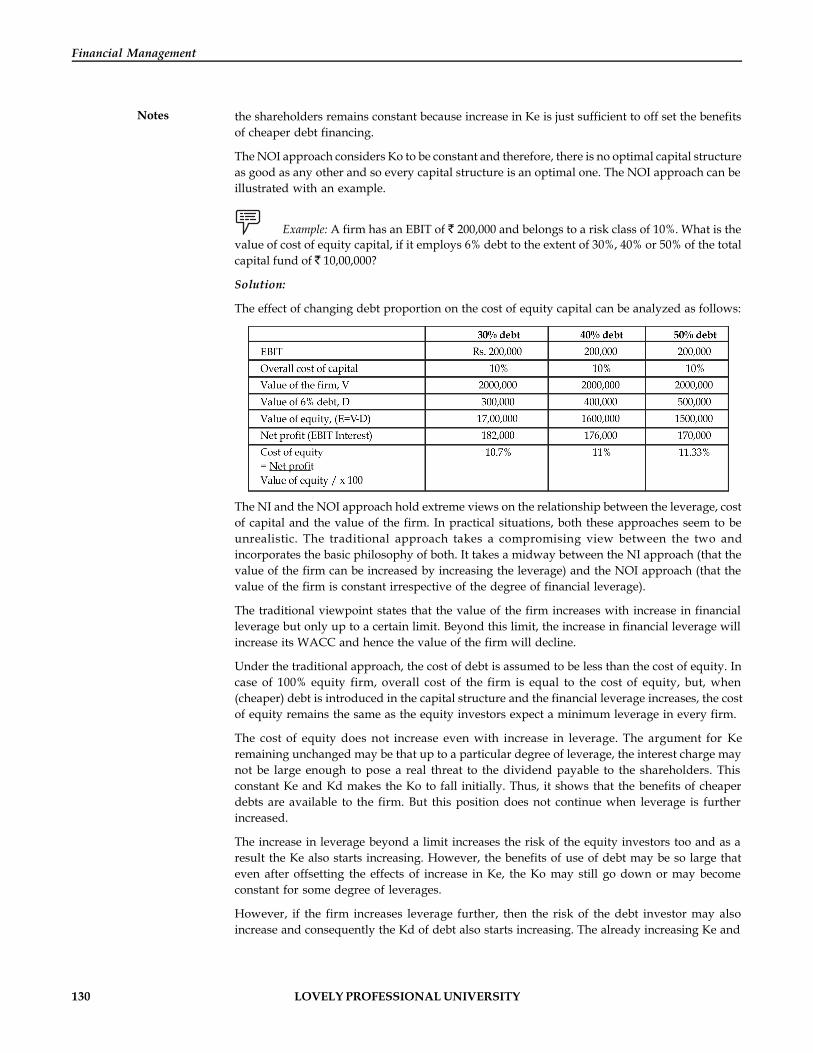
130 LOVELY PROFESSIONAL UNIVERSITY
Financial Management
Notes the shareholders remains constant because increase in Ke is just sufficient to off set the benefitsof cheaper debt financing.
The NOI approach considers Ko to be constant and therefore, there is no optimal capital structureas good as any other and so every capital structure is an optimal one. The NOI approach can beillustrated with an example.
Example: A firm has an EBIT of 200,000 and belongs to a risk class of 10%. What is thevalue of cost of equity capital, if it employs 6% debt to the extent of 30%, 40% or 50% of the totalcapital fund of 10,00,000?
Solution:
The effect of changing debt proportion on the cost of equity capital can be analyzed as follows:
The NI and the NOI approach hold extreme views on the relationship between the leverage, costof capital and the value of the firm. In practical situations, both these approaches seem to beunrealistic. The traditional approach takes a compromising view between the two andincorporates the basic philosophy of both. It takes a midway between the NI approach (that thevalue of the firm can be increased by increasing the leverage) and the NOI approach (that thevalue of the firm is constant irrespective of the degree of financial leverage).
The traditional viewpoint states that the value of the firm increases with increase in financialleverage but only up to a certain limit. Beyond this limit, the increase in financial leverage willincrease its WACC and hence the value of the firm will decline.
Under the traditional approach, the cost of debt is assumed to be less than the cost of equity. Incase of 100% equity firm, overall cost of the firm is equal to the cost of equity, but, when(cheaper) debt is introduced in the capital structure and the financial leverage increases, the costof equity remains the same as the equity investors expect a minimum leverage in every firm.
The cost of equity does not increase even with increase in leverage. The argument for Keremaining unchanged may be that up to a particular degree of leverage, the interest charge maynot be large enough to pose a real threat to the dividend payable to the shareholders. Thisconstant Ke and Kd makes the Ko to fall initially. Thus, it shows that the benefits of cheaperdebts are available to the firm. But this position does not continue when leverage is furtherincreased.
The increase in leverage beyond a limit increases the risk of the equity investors too and as aresult the Ke also starts increasing. However, the benefits of use of debt may be so large thateven after offsetting the effects of increase in Ke, the Ko may still go down or may becomeconstant for some degree of leverages.
However, if the firm increases leverage further, then the risk of the debt investor may alsoincrease and consequently the Kd of debt also starts increasing. The already increasing Ke and
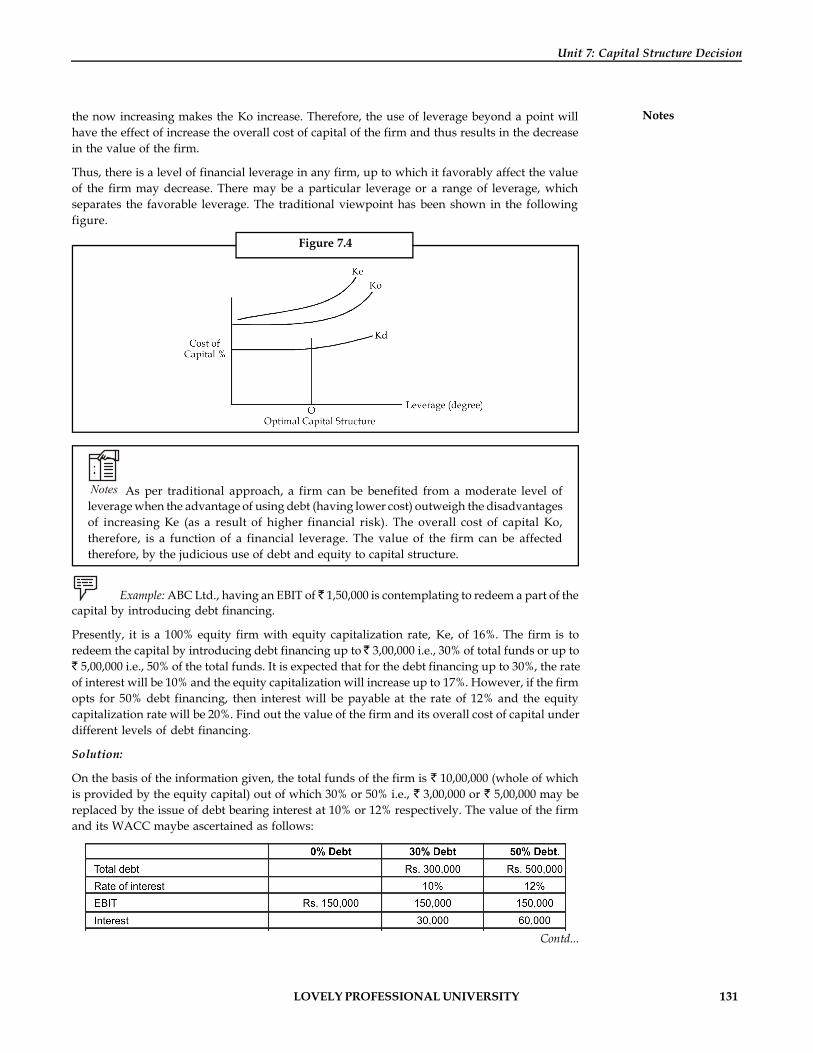
LOVELY PROFESSIONAL UNIVERSITY 131
Unit 7: Capital Structure Decision
Notesthe now increasing makes the Ko increase. Therefore, the use of leverage beyond a point willhave the effect of increase the overall cost of capital of the firm and thus results in the decreasein the value of the firm.
Thus, there is a level of financial leverage in any firm, up to which it favorably affect the valueof the firm may decrease. There may be a particular leverage or a range of leverage, whichseparates the favorable leverage. The traditional viewpoint has been shown in the followingfigure.
Figure 7.4
Notes As per traditional approach, a firm can be benefited from a moderate level ofleverage when the advantage of using debt (having lower cost) outweigh the disadvantagesof increasing Ke (as a result of higher financial risk). The overall cost of capital Ko,therefore, is a function of a financial leverage. The value of the firm can be affectedtherefore, by the judicious use of debt and equity to capital structure.
Example: ABC Ltd., having an EBIT of 1,50,000 is contemplating to redeem a part of thecapital by introducing debt financing.
Presently, it is a 100% equity firm with equity capitalization rate, Ke, of 16%. The firm is toredeem the capital by introducing debt financing up to 3,00,000 i.e., 30% of total funds or up to
5,00,000 i.e., 50% of the total funds. It is expected that for the debt financing up to 30%, the rateof interest will be 10% and the equity capitalization will increase up to 17%. However, if the firmopts for 50% debt financing, then interest will be payable at the rate of 12% and the equitycapitalization rate will be 20%. Find out the value of the firm and its overall cost of capital underdifferent levels of debt financing.
Solution:
On the basis of the information given, the total funds of the firm is 10,00,000 (whole of whichis provided by the equity capital) out of which 30% or 50% i.e., 3,00,000 or 5,00,000 may bereplaced by the issue of debt bearing interest at 10% or 12% respectively. The value of the firmand its WACC maybe ascertained as follows:
Contd...
132 LOVELY PROFESSIONAL UNIVERSITY
Financial Management
Notes
The example shows that with the increase in leverage from 0% to 30%, the firm is able to reduceits WACC from 16% to 14.9% and the value of the firm increases from 9,37,500 to 10,05,882.This happens as the benefits of employing cheaper debt are available and the cost of equity doesnot rise too much.
However, thereafter, when the leverage is increased further to 50%, the cost of debt as well as thecost of equity, both, rises to 12% and 20% respectively. The equity investors have increased theequity capitalization rate to 20% as they are now finding the firm to be more risky (as a result of50% leverage). The increase in cost of debt and the equity capitalization rate has increased thecost of equity, hence as a result, the value of the firm has reduced from 10,05,882 to 9,50,000and Ko has increased from 14.9% to 15.8%.
7.4.3 Modigliani–Miller’s Approach (Extension of NOI Approach)The Modigliani–Millers (MM) model is considered to be one of the most influential papers everwritten in corporate finance.
The Modigliani–Miller approach is similar to the Net Operating Income (NOI) approach. Inother words, according to this approach, the value of a firm is independent of its capital structure.However, there is a basic difference between the two. The NOI approach is purely conceptual. Itdoes not provide operational justification for irrelevance of the capital structure in the valuationof the firm. While MM approach supports the NOI approach providing behavioural justificationfor the independence of the total valuation and the cost of capital of the firm from its capitalstructure. In other words, MM approach maintains that the weighed average cost of capital doesnot change in the debt equity mix or capital structure of the firm.
Did u know? When was Modigilani–Miller (MM) represented?
Modigilani–Miller (MM) was represented in 1958
Basic Proportions
The following are the three basic proportions of the MM approach.
1. The overall cost of capital (K) and the value of the firm (V) are independent of the capitalstructure. In other words, K and V are constant for all levels of debt-equity mix. The totalmarket value of the firm is given by capitalizing the expected Net Operating Income(NOI) by the rate appropriate for that risk class.
2. The cost of equity (Ke) is equal to capitalization rate of a pure equity stream plus apremium for the financial risk. The financial risk increases with more debt content in thecapital structure. As a result, Ke increases in a manner to off set exactly the use of a lessexpensive source of funds represented by debt.
3. The cut-off rate for investment purposes is completely independent of the way in which aninvestment is financed.
LOVELY PROFESSIONAL UNIVERSITY 133
Unit 7: Capital Structure Decision
NotesAssumptions
The MM approach is subject to the following assumptions:
1. Capital markets are perfect: This means that investors are free to buy and sell securities.
2. The form can be classified into homogenous risk classes. All the forms within the sameclass will have the same degree of business risks.
3. All investors have the same expectations of a firm’s net operating income (EBIT) withwhich to evaluate the value of any firm.
4. The dividend payout ratio is 100%. In other words, there are no retained earnings.
5. There are no corporate taxes. However, this assumption has been removed later.
In brief, the MM hypothesis can be put in the following words:
“MM hypothesis is based on the idea that no matter how you bifurcate the capital structure of afirm among debt, equity and other claims, there is a conservation of investment value. That isbecause the total investment value of a corporation depends upon its underlying profitabilityand risk”.
It is invariant with respect to relative changes in the firm’s financial capitalization. Thus, thetotal pie does not change as it is divided into debt, equity and other securities. The sum of theparts must equal the whole; so regardless of financing mix; the total value of the firm stays thesame.
Arbitrage Process
The “arbitrage process” is the operational justification of MM hypothesis. The term ‘arbitrage’refers to an act of buying a security in one market having lower price and selling it in anothermarket at higher price. As a result of such action, the market prices of the securities can notremain different markets. Thus, arbitrage process restores equilibrium in the value of securities.This is because investors of the overvalued firm would sell their shares, borrow additionalfunds on personal account and invest in the undervalued firm in order to obtain the same returnon smaller investment outlay. The use of debt by the investor for arbitrage is termed as ‘homemade leverage’ or ‘personal leverage’. Arbitrage process can be explained with the help of thefollowing example.
Example: Two firms X Ltd. & Y Ltd. are alike and identical in all respects except that XLtd. is a levered firm and has 10% debt of 30,00,000 in its capital structure. On the other hand YLtd. is an unlevered firm and has raised funds only by way of equity capital. Both these firmshave same EBIT of 10,00,000 and equity capitalization rate (Ke) of 20%. Under these parameters,the total value and the WACC of both the firms may be ascertained as follows:
134 LOVELY PROFESSIONAL UNIVERSITY
Financial Management
Notes Comments
Though, EBIT is same, value of both the firm and WACC are different. MM argue that thisposition can not persist for a long; and soon there will be equilibrium in the values of the twofirms through arbitrage process, which is explained, in the following paragraphs.
Mr. A is holding 10% equity shares in X Ltd. The value of his loading is 3,50,000 i.e., 10% of 35,00,000. Further, he is entitled for 70,000 income (i.e., 10% of total profits of 7,00,000). Inorder to earn more income, he disposes off his holding in X Ltd. for 3,50,000 and buys 10%holding in Y Ltd. For this purpose, he adopts following steps.
Step 1: In order to buy 10% holding in Y Ltd, he requires total funds of 5,00,000, whereas hisproceeds are only 3,50,000. Therefore, he borrows 3,00,000 loan @ 10% i.e. (10% of Debt of XLtd). Thus, he substitutes personal loan for corporate loan.
Step 2:
Mr. A now has total funds of 6,50,000
Sale proceeds 3,50,000
10% personal loan 3,00,000
Total 6,50,000
Less: Invest in shares of Y Ltd shares – 5,00,000
Surplus funds (which he invests 1,50,000in some other securities say at 10%)
Step 3:
Mr. A will earn more through arbitrage process.
Profits available to A from Y Ltd. (10% of 10,00,000) 1,00,000
Less: interest on borrowing (10% 300,00,000) – 30,000
+ Interest income on some other investment (150000 × 10%) + 15,000
Total income after Arbitrage Process 85,000
Conclusion
MM model argues that this opportunity to earn extra income through arbitrage process willattract so many investors. The gradual increase in sales of shares of the levered firm X Ltd. willpush down its prices and the tendency to purchase the shares to unlevered firm Y Ltd. willdrive its prices up. These selling and purchasing processes will continue until the marketvalue of the two firms is equal. At this stage, the value of the leverage and unleveled firm andalso their cost of capital are same. Thus overall cost of capital is independent of the financialleverage.
Criticism
Theoretically speaking, the MM model seems to be good. However, most of its assumptions areunrealistic and untenable. Following are criticisms against MM Model:
1. The arbitrage process, which provides the behavioural justification for the model is itselfquestionable in real life because of following reasons:
(a) Investors do not have complete information about levered and unlevered firms.

LOVELY PROFESSIONAL UNIVERSITY 135
Unit 7: Capital Structure Decision
Notes(b) It is extremely doubtful that investors would substitute personal leverage forcorporate leverage, as they do not have the same risk characteristics. Rates of interestsare not the same for individuals and the firms.
2. The assumption that there is no corporate tax is unrealistic.
!Caution Existence of corporate tax results in higher value of the levered firm, since theinterest is tax deductible.
3. The assumption of no tries transaction cost is also imaginary. In reality, whenever a firmtries to obtain debt capital associates creditors, they seek certain restrictions on the firm.On the part of the firm, some protective comments incorporated in the loan contract.
4. In subsequently analyses, MM agreed that the leverage might increase the value of thefirm.
Task “As the debt-equity ratio increases, there is a trade-off between the interest tax shieldand bankruptcy, causing an optimum capital structure.” Do you agree with the statement?Give reasons.
Self AssessmentFill in the blanks:
10. The Net Income (NI) approach is the relationship between leverage and …………………andvalue of the firm.
11. The ………………….. is the operational justification of MM hypothesis.
12. The Net Operating Income (NOI) approach is the opposite of the …………….approach.
7.5 Effects of a Financing Decision on Earnings Per ShareOne of the present objectives of a finance function is to maximize both the return on ordinaryshares and the total wealth of the company. This objective is also important at the time ofdeciding in the new source of finance. Earnings Per Share (EPS) denote what has been earned bythe company during a particular period in each of the ordinary shares. It can be worked out bydividing net profit after interest, taxes and preference dividend, by the number of equity shares.
If the company has a number of options of new financing, it can compute the impact of eachmethod of new financing on earnings per share. It should also calculate the EPS without the newfinancing and compares it with cash of the various alternatives of financing available, is accepted.It is obvious that earnings per share would be the highest in case of financing, which has the leastcost to the company.
Example: X Ltd. requires 50 lacs for a new plant, which is expected to yield earningsbefore interest and taxes of 10 lacs. The company has three alternatives for financing.
Option I: Raising debt of 5 lacs and the balance by equity.
Option II: Raising debt of 20 lacs and the balance by equity.
Option III: Raising debt of 30 lacs and the balance by equity.
136 LOVELY PROFESSIONAL UNIVERSITY
Financial Management
Notes The company’s share is currently selling at 150, but it expected to decline to 125 in case thefunds are borrowed in excess of 20 lacs. The funds can be borrowed at the rate of 10% up to 50lacs at 15% over 5 lacs and up to 20 lacs and at 20% over 20 lacs. The tax rate applicable to thecompany is 50%. Which option of financing the company should choose?
Solution:
The earnings per share is higher in Alternative 2 i.e., if the company finances the project byraising debt of 70,00,000 and issue equity shares of 30,00,000.
Task The existing capital structure of XYZ Ltd. is as under:
The existing rate of return on the company’s capital is 12% and I/T rate 50%. The companyrequires a sum of 25,00,000 to finance its expansion programme for which it is consideringthe following alternatives:
(a) Issue of 20,000 equity shares at a premium of 25 per share.
(b) Issue of 10% preference shares.
(c) Issue of 8% debentures.
It is estimated that the P/E ratio in case of equity, preference and debentures financingwould be 20, 17 and 16 respectively.
Which of these alternatives would you advocate? Why?
EPS Volatility
EPS Volatility refers to the magnitude or the extent of fluctuations of earnings per share of acompany in various years as compared to the mean or average earnings per share. In otherwords, EPS volatility shows whether a company enjoys a stable income or not.
Did u know? Higher the EPS volatility, greater would be the risk attached to the company.
A major cause of EPS volatility would be the fluctuations in the sales volume and the operatingleverage. It is obvious that the net profits of a company would greatly fluctuate with small

LOVELY PROFESSIONAL UNIVERSITY 137
Unit 7: Capital Structure Decision
Notesfluctuations in the sales figures specially if the fixed cost instant were very high. Hence, EPS willfluctuate in such a situation. This effect may be heightened by the financial leverage.
Self AssessmentFill in the blanks:
13. …………………..denote what has been earned by the company during a particular periodin each of the ordinary shares.
14. A major cause of EPS volatility would be the fluctuations in the sales volume and the………………..leverage.
15. EPS volatility shows whether a company enjoys a ………………..or not.
Case Study Case: Wishart and Associates — Financial Alternatives
This case provides the opportunity to match financing alternatives with the needs ofdifferent companies. It allows the reader to demonstrate a familiarity with differenttypes of securities.
George Thomas was finishing some weekend reports on a Friday afternoon in the downtownoffice of Wishart and Associates, an investment-banking firm. Meenda, a partner in thefirm, had not been in the New York office since Monday. He was on a trip throughPennsylvania, visiting five potential clients, who were considering the flotation of securitieswith the assistance of Wishart and Associates. Meenda had called the office on Wednesdayand told George’s secretary that he would cable his recommendations on Friday afternoon.George was waiting for the cable.
George knew that Meenda would be recommending different types of securities for eachof the five clients to meet their individual needs. He also knew Meenda wanted him to calleach of the clients to consider the recommendations over the weekend. George wasprepared to make these calls as soon as the cable arrived. At 4:00 p.m. a secretary handedGeorge the following telegram.
George Thomas, Wishart and Associates STOP Taking advantage of offer to go skiing inPoconos STOP Recommendations as follows : (1) common stock, (2 ) preferred stock,(3) debt with warrants, (4) convertible bonds, (5) callable debentures STOP. See youWednesday STOP Meenda.
As George picked up the phone to make the first call, he suddenly realized that thepotential clients were not matched with the investment alternatives. In Meenda’s office,George found folders on each of the five firms seeking financing. In the front of eachfolder were some handwritten notes that Meenda had made on Monday before he left.George read each of the notes in turn.
API, Inc
APT, Inc, needs $8 million now and $4 million in four years. Packaging firm with highgrowth rate in tri-state area. Common stock trades over the counter. Stock is depressedbut should rise in year to 18 months. Willing to accept any type of security. Goodmanagement. Expects moderate growth. New machinery should increase profitssubstantially. Recently retired $7 million in debt. Has virtually no debt remaining exceptshort-term obligations.
Contd...

138 LOVELY PROFESSIONAL UNIVERSITY
Financial Management
Notes Sandford Enterprises
Needs $16 million. Crusty management. Stock price depressed but expected to improve.Excellent growth and profits forecast in the next two year. Low debt-equity ratio, as thefirm has record of retiring debt prior to maturity. Retains bulk of earnings and pays lowdividends. Management not interested in surrendering voting control to outsiders. Moneyto be used to finance machinery for plumbing supplies.
Sharma Brothers., Inc.
Needs $20 million to expand cabinet and woodworking business. Started as family businessbut now has 1200 employees, $50 million in sales, and is traded over the counter. Seeksadditional shareholder but not willing to stock at discount. Cannot raise more than $12million with straight debt. Fair management. Good growth prospects. Very good earnings.Should spark investor’s interest. Banks could be willing to lend money for long-termneeds.
Sacheetee Energy Systems
The firm is well respected by liberal investing community near Boston area. Sound growthcompany. Stock selling for $16 per share. Management would like to sell common stock at$21 or more willing to use debt to raise $ 28 million, but this is second choice. Financinggimmicks and chance to turn quick profit on investment would appeal to those likely toinvest in this company.
Ranbaxy Industry
Needs $25 million. Manufactures boat canvas covers and needs funds to expand operations.Needs long-term money. Closely held ownership reluctant surrender control. Cannotissue debt without permission of bondholders and First National Bank of Philadelphia.Relatively low debt-equity ratio. Relatively high profits. Good prospects for growth.Strong management with minor weaknesses in sales and promotion areas.
As George was looking over the folders, Meenda’s secretary entered the office. Georgesaid, “Did Meenda leave any other material here on Monday except for these notes?”.
She responded, “No, that’s it, but I think those notes should be useful. Meenda called earlythis morning and said that he verified the facts in the folders. He also said that he learnednothing new on the trip and he sort of indicated that, he had wasted his week, except ofcourse, that he was invited to go skiing at the company lodge up there”.
George pondered over the situation. He could always wait until next week, when he couldbe sure that he had the right recommendations and some of the considerations that outlinedeach client’s needs and situation. If he could determine which firm matched eachrecommendation, he could still call the firms by 6:00 P.M. and meet the original deadline.George decided to return to his office and match each firm with the appropriate financing.
Questions
1. Which type of financing is appropriate to each firm?
2. What types of securities must be issued by a firm which is on the growing stage inorder to meet the financial requirements?
7.6 Summary Mix of long-term sources of finance is referred as “capital structure”.
At optimum capital structure, the cost of capital is minimum and market price per share ismaximum.
LOVELY PROFESSIONAL UNIVERSITY 139
Unit 7: Capital Structure Decision
Notes ln planning the capital structure, one should keep in mind that there is no one definitemodel that can be suggested/used as an ideal for all business undertakings.
To obtain a balanced capital structure it is necessary to consider the ability of the companyto market corporate securities.
Small companies rely heavily on owners’ funds while large companies are generallyconsidered to be less risky by the investors and therefore, they can issue different types ofsecurities.
The Net Income (NI) approach is the relationship between leverage and cost of capital andvalue of the firm.
According to the NOI approach, the market value of the firm depends upon the net operatingprofit or EBIT and the overall cost of capital, WACC.
According to Modigilani-Miller approach, the value of a firm is independent of its capitalstructure.
Earnings per share would be the highest in case of financing, which has the least cost to thecompany.
EPS volatility shows whether a company enjoys a stable income or not.
7.7 KeywordsArbitrage: It refers to an act of buying a security in one market having lower price and selling itin another market at higher price.
Capital Structure: It is that part of financial structure, which represents long-term sources.
MM Theory: According to this theory the value of the firm is independent of its capital structure.
Net Income Approach: According to this approach, the cost of debt and the cost of equity do notchange with a change in the leverage ratio.
NOI Approach: According to this approach, the market value of the firm is not affected by thecapital structure changes.
Optimum Capital Structure: It is that capital structure where market value per share is maximumand the cost of capital is minimum.
7.8 Review Questions
1. Explain briefly the major considerations in capital structure planning.
2. Explain briefly, the Modigliani-Miller approach on cost of capital.
3. Explain the conditional theory of capital structure.
4. What important factors in addition to quantitative factor should a firm consider when it ismaking a capital structure decisions?
5. The total value of a firm remains unchanged, regardless of the variations in the financingmix. Discuss the statement and point out the role of arbitrating and who made leverage?
6. How will the firm go for optimizing capital structure?
7. List down the approach which advocates that the cost of Equity Capital and Debt Capitalremains unaltered when the degree of leverage varies?
140 LOVELY PROFESSIONAL UNIVERSITY
Financial Management
Notes 8. Explain the approach which pronounced that the overall capitalization rate and the cost ofdebt remain constant for all degrees of leverage.
9. Critically analyze the different theories of capital structure.
10. Comment on the flexibility in the capital structure.
Answers: Self Assessment
1. long-term 2. Optimum 3. cost of financing
4. financial 5. control 6. expected earnings
7. debt holders 8. shareholders 9. EBIT
10. cost of capital 11. arbitrage process 12. NI
13. Earnings Per Share (EPS) 14. operating 15. stable income
7.9 Further Readings
Books Dr Pradeep Kumar Sinha, Financial Management, New Delhi, Excel Books, 2009.
Van Horne, J.C. and Wachowicz, Jr, J.M., Fundamentals of Financial Management,New Delhi, Prentice Hall of India Pvt. Ltd., 1996, p. 2.
Chandra, P., Financial Management - Theory and Practice, New Delhi, Tata McGrawHill Publishing Company Ltd., 2002, p. 3.

LOVELY PROFESSIONAL UNIVERSITY 141
Unit 8: Concept of Leverages
NotesUnit 8: Concept of Leverages
CONTENTS
Objectives
Introduction
8.1 Operating Leverage
8.2 Relation with Break-Even Analysis
8.2.1 Changing Costs and the Operating Breakeven Point
8.2.2 Fixed Cost and Operating Leverage
8.3 Financial Leverage
8.4 Combined Leverage
8.5 Summary
8.6 Keywords
8.7 Review Questions
8.8 Further Readings
Objectives
After studying this unit, you will be able to:
Describe the notion of leverage
Define the operating leverage
Explain the significance of financial leverage
Discuss the aspect of combined leverage
IntroductionLeverage results from the use of fixed costs assets or funds to magnify returns to the firm’sowners. Generally, increases in leverage results in increased returns and risk; and decreases inleverage results in decrease in returns and risk. The amount of leverage in the firm’s capitalstructure (the mix of long-term debt and equity) can significantly affect its value by affectingreturns and risks.
The term ‘leverage’ in general refers to a relationship between two inter-related variable. Infinancial analysis, it represents the influence of one financial variable over some other relatedfinancial variable.
The three basic types of leverage can be defined with reference to firm’s income statement asfollows:
1. Operating leverage is concerned with the relationship between the firm’s sales revenueand its earnings before interest and taxes, or EBIT (EBIT is descriptive label for operatingprofits).
2. Financial leverage is concerned with the relationship between the firms EBIT and itscommon share earnings per share (EPS earnings per share). It is defined as the firm’sability to use fixed financial charges to magnify the effects of charge in EBIT/operatingprofit on firm’s earnings per share.

142 LOVELY PROFESSIONAL UNIVERSITY
Financial Management
Notes 3. Total leverage is concerned with the relationship between the firm’s sales revenue andEPS.
8.1 Operating LeverageOperating leverage results from the existence of the fixed operating expenses in the firm’sincome stream. The operating costs of a firm fall into three categories:
1. Fixed costs, which may be defined as those do not vary with sales volume, are a functionof time and are typically contractual; they must be paid regardless of the amount ofrevenue available with sales volume.
2. Variable costs, which vary directly.
3. Semi-variable or semi-fixed costs are those, which are partly fixed and partly variable.They are fixed over a certain higher sales volumes. Since the last category of cost can bebroken down into fixed and variable components, the cost of a firm in operational termscan be divided into fixed and variables. The operating leverage occurs anytime a firm hasfixed costs that must be met regardless of the volume. With fixed costs, the percentagechange in profit accompanying a change in volume is greater than the percentage changein volume.
Notes Operating leverage is defined as the firm’s ability to use fixed operating costs tomagnify effects of changes in sales or its earnings before interest on tax.
Example: A firm sells its product at 100%, as variable operating cost of 50% and fixedoperating cost of 50,000 per year. Show the various levels of EBIT that would result from sale.
1. 1000 units
2. 2000 units
3. 3000 units.
Solution:
Case 2 –50% Base data Case 1 +50%
Sales in units 1000 2000 3000
Sales revenue 100,000 200,000 300,000
Less variable operating costs 50,000 100,000 150,000
Contribution 50,000 100,000 150,000
Less fixed operating costs 50,000 50,000 50,00
EBIT ZERO 50,000 100,000
–100% +100%
From the above results, certain generalization can be made.
Case I: A 50% increase in sales (from 2000 to 3000 units) results in a 100% increase in EBIT (from50,000 to 100,000).
Case II: A 50% decrease in sales (from 2000 to 1000 units) results in a 100% decrease in EBIT (from50,000 to zero).

LOVELY PROFESSIONAL UNIVERSITY 143
Unit 8: Concept of Leverages
NotesHence, Operating leverage =
Percentage change in EBITPercentage change in sales
= + 100%+ 50%
= 2 (case I), – 100%– 50%
= 2 (case II).
Self AssessmentFill in the blanks:
1. Operating leverage results from the existence of the fixed operating expenses in the firm’s………….stream.
2. ………….costs are those which do not vary with sales volume.
3. …………………costs are those, which are partly fixed and partly variable.
4. ………………..costs are the costs which vary directly.
8.2 Relation with Break-even AnalysisBreak-even analysis is used by the firm.
1. To determine the level of operations necessary to cost all operating costs and,
2. To evaluate the profitability associated with various levels of sales. The firms operatingbreak-even point are the level of sale necessary to give all operating costs. At that point,earnings before interest and taxes equal zero.
In the example, we see that the firm has reached breakeven (‘0’ profit) at the sales level of 1000units, at which all the fixed and variable operating costs are coursed.
Did u know? Break-even analysis as is sometimes called cost volume profit analysis.
8.2.1 Changing Costs and the Operating Break-even PointThe firm’s operating breakeven point is sensitive to a number of variables. Fixed operating cost,the sales price per unit and the variable cost per unit. The effects of increase or decrease in thesevariables can be analyzed as under:
Increase in variable Effect on operating break-even
Fixed operating costs Increase
Sales price per unit Decrease
Variable operating cost per unit Increase
8.2.2 Fixed Cost and Operating LeverageChanges in fixed operating costs affect operating leverage. Significantly, the higher the fixedoperating costs, higher are the firms, operating leverage and its operating risks. High operatingleverage is good when revenues are rising and bad when they are falling.
Did u know? What is operating risk?
Operating risk is the risk of the firm not being able to cover is fixed operating costs.
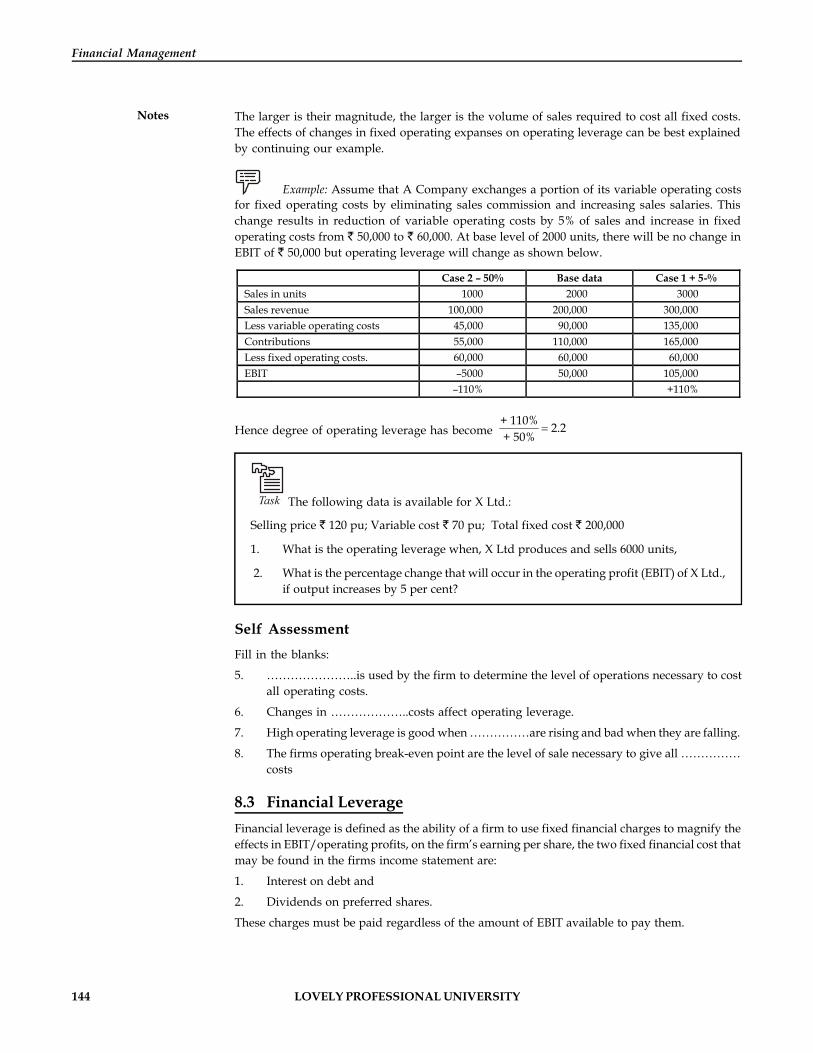
144 LOVELY PROFESSIONAL UNIVERSITY
Financial Management
Notes The larger is their magnitude, the larger is the volume of sales required to cost all fixed costs.The effects of changes in fixed operating expanses on operating leverage can be best explainedby continuing our example.
Example: Assume that A Company exchanges a portion of its variable operating costsfor fixed operating costs by eliminating sales commission and increasing sales salaries. Thischange results in reduction of variable operating costs by 5% of sales and increase in fixedoperating costs from 50,000 to 60,000. At base level of 2000 units, there will be no change inEBIT of 50,000 but operating leverage will change as shown below.
Case 2 – 50% Base data Case 1 + 5-% Sales in units 1000 2000 3000 Sales revenue 100,000 200,000 300,000 Less variable operating costs 45,000 90,000 135,000 Contributions 55,000 110,000 165,000 Less fixed operating costs. 60,000 60,000 60,000 EBIT –5000 50,000 105,000 –110% +110%
Hence degree of operating leverage has become + 110% 2.2+ 50%
=
Task The following data is available for X Ltd.:
Selling price 120 pu; Variable cost 70 pu; Total fixed cost 200,000
1. What is the operating leverage when, X Ltd produces and sells 6000 units,
2. What is the percentage change that will occur in the operating profit (EBIT) of X Ltd.,if output increases by 5 per cent?
Self AssessmentFill in the blanks:
5. …………………..is used by the firm to determine the level of operations necessary to costall operating costs.
6. Changes in ………………..costs affect operating leverage.
7. High operating leverage is good when ……………are rising and bad when they are falling.
8. The firms operating break-even point are the level of sale necessary to give all ……………costs
8.3 Financial LeverageFinancial leverage is defined as the ability of a firm to use fixed financial charges to magnify theeffects in EBIT/operating profits, on the firm’s earning per share, the two fixed financial cost thatmay be found in the firms income statement are:
1. Interest on debt and
2. Dividends on preferred shares.
These charges must be paid regardless of the amount of EBIT available to pay them.
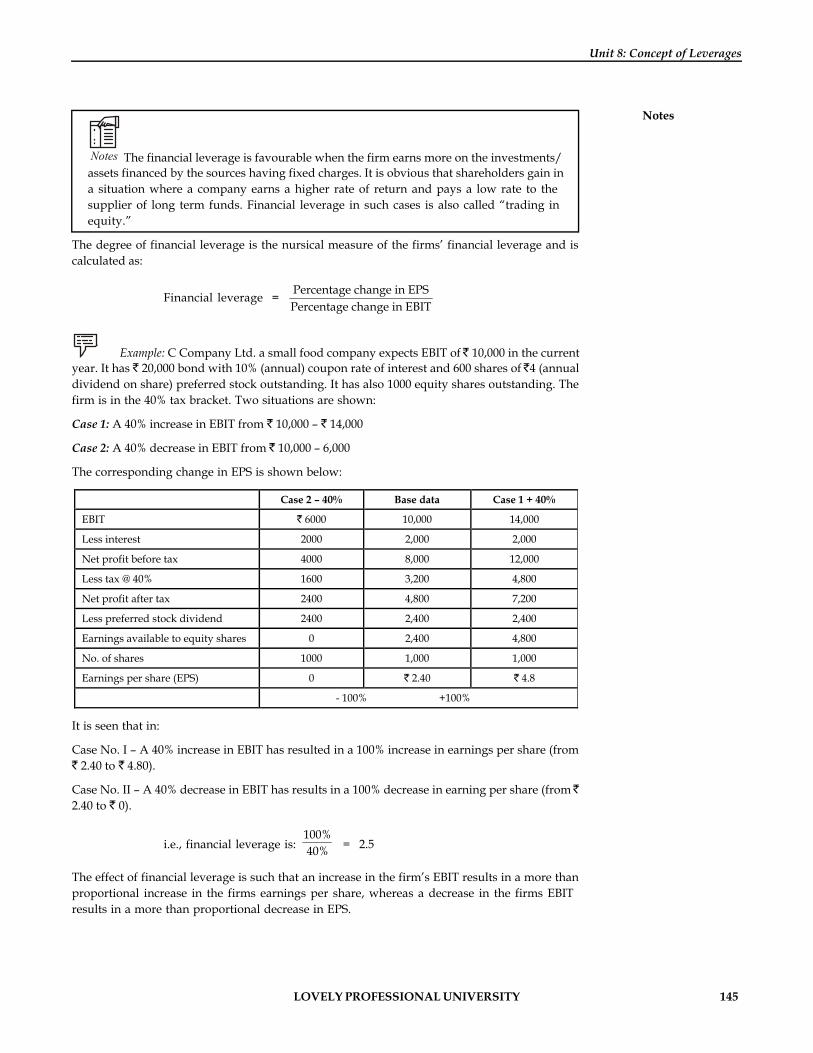
LOVELY PROFESSIONAL UNIVERSITY 145
Unit 8: Concept of Leverages
Notes
Notes The financial leverage is favourable when the firm earns more on the investments/assets financed by the sources having fixed charges. It is obvious that shareholders gain ina situation where a company earns a higher rate of return and pays a low rate to thesupplier of long term funds. Financial leverage in such cases is also called “trading inequity.”
The degree of financial leverage is the nursical measure of the firms’ financial leverage and iscalculated as:
Financial leverage = Percentage change in EPSPercentage change in EBIT
Example: C Company Ltd. a small food company expects EBIT of 10,000 in the currentyear. It has 20,000 bond with 10% (annual) coupon rate of interest and 600 shares of 4 (annualdividend on share) preferred stock outstanding. It has also 1000 equity shares outstanding. Thefirm is in the 40% tax bracket. Two situations are shown:
Case 1: A 40% increase in EBIT from 10,000 – 14,000
Case 2: A 40% decrease in EBIT from 10,000 – 6,000
The corresponding change in EPS is shown below:
Case 2 – 40% Base data Case 1 + 40%
EBIT 6000 10,000 14,000
Less interest 2000 2,000 2,000
Net profit before tax 4000 8,000 12,000
Less tax @ 40% 1600 3,200 4,800
Net profit after tax 2400 4,800 7,200
Less preferred stock dividend 2400 2,400 2,400
Earnings available to equity shares 0 2,400 4,800
No. of shares 1000 1,000 1,000
Earnings per share (EPS) 0 2.40 4.8
- 100% +100%
It is seen that in:
Case No. I – A 40% increase in EBIT has resulted in a 100% increase in earnings per share (from 2.40 to 4.80).
Case No. II – A 40% decrease in EBIT has results in a 100% decrease in earning per share (from 2.40 to 0).
i.e., financial leverage is: 100%40% = 2.5
The effect of financial leverage is such that an increase in the firm’s EBIT results in a more thanproportional increase in the firms earnings per share, whereas a decrease in the firms EBITresults in a more than proportional decrease in EPS.

146 LOVELY PROFESSIONAL UNIVERSITY
Financial Management
Notes
Task Given-Financial leverage is 2
Fixed interest charge 1,00,000.
Find out the operating profit.
Significance of Financial Leverage
Financial leverage is a double-edged sword. On the one hand, it increases earnings per share,and on the other hand it increases financial risk. A high financial leverage means high fixedfinancial cost and high financial risks, i.e., as the debt component in capital structure increases,the financial leverage increased and at the time of the financial risk also increases. i.e., risk ofinsolvency increases.
!Caution The finance manager is required to trade–off i.e., there has to be a balance betweenrisk and return for determining the appropriate amount of debt in the capital structure ofa firm.
Self AssessmentFill in the blanks:
9. The financial leverage is favourable when the firm earns more on the investments/assetsfinanced by the sources having ………..charges.
10. As the ……….component in capital structure increases, the financial leverage increased.
11. A high financial leverage means high fixed financial cost and high financial…………..
8.4 Combined LeverageCombined leverage or total leverage can be defined as potential use of fixed costs, both operatingand financial, to magnify the effect of changes in sales on the firms, earnings per share. Totalleverage or combined leverage can therefore be viewed as the total impact of the fixed cost inthe firms operating and financial structure.
Combined leverage = operating leverage × financial leverage
= % change in EBIT % change in EPS % change in sales % change in EBIT
´
= % Change in EPS% Change in Sales
Significance of Combined Leverage
A high operating leverage and a high financial leverage combination is very risky. If the companyis producing and selling at a high level it will make extremely high profit for its shareholders.But, even a small fall in the level of operations would result in tremendous fall in earnings pershare. A company must, therefore, maintain a proper balance between these two leverages.
A combination of high operating level and a low financial leverage indicates that the managementis careful since the higher amount of risk involved in high operating leverage has been sought to bebalanced by low financial leverage. However, a more preferable option would be to have a low
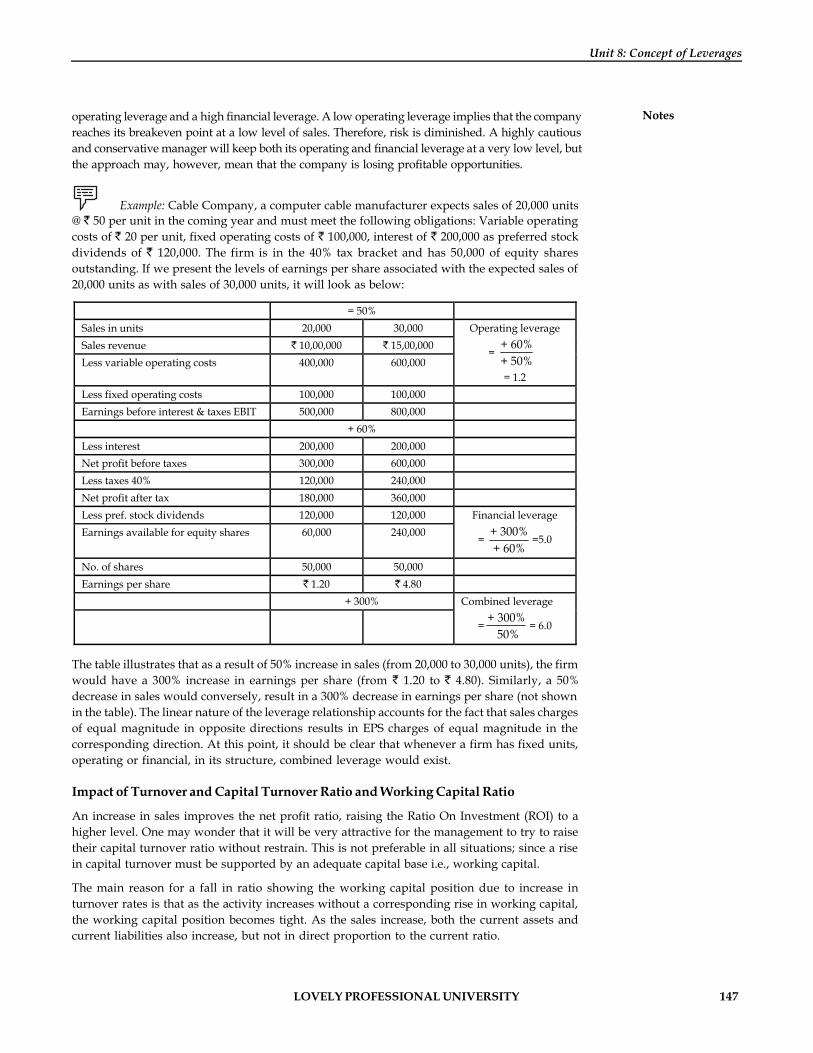
LOVELY PROFESSIONAL UNIVERSITY 147
Unit 8: Concept of Leverages
Notesoperating leverage and a high financial leverage. A low operating leverage implies that the companyreaches its breakeven point at a low level of sales. Therefore, risk is diminished. A highly cautiousand conservative manager will keep both its operating and financial leverage at a very low level, butthe approach may, however, mean that the company is losing profitable opportunities.
Example: Cable Company, a computer cable manufacturer expects sales of 20,000 units@ 50 per unit in the coming year and must meet the following obligations: Variable operatingcosts of 20 per unit, fixed operating costs of 100,000, interest of 200,000 as preferred stockdividends of 120,000. The firm is in the 40% tax bracket and has 50,000 of equity sharesoutstanding. If we present the levels of earnings per share associated with the expected sales of20,000 units as with sales of 30,000 units, it will look as below:
= 50% Sales in units 20,000 30,000 Sales revenue 10,00,000 15,00,000 Less variable operating costs 400,000 600,000
Operating leverage
= + 60% + 50%
= 1.2 Less fixed operating costs 100,000 100,000 Earnings before interest & taxes EBIT 500,000 800,000 + 60% Less interest 200,000 200,000 Net profit before taxes 300,000 600,000 Less taxes 40% 120,000 240,000 Net profit after tax 180,000 360,000 Less pref. stock dividends 120,000 120,000 Earnings available for equity shares 60,000 240,000
Financial leverage
= + 300%+ 60%
=5.0
No. of shares 50,000 50,000 Earnings per share 1.20 4.80 + 300%
Combined leverage
=+ 300%
50%= 6.0
The table illustrates that as a result of 50% increase in sales (from 20,000 to 30,000 units), the firmwould have a 300% increase in earnings per share (from 1.20 to 4.80). Similarly, a 50%decrease in sales would conversely, result in a 300% decrease in earnings per share (not shownin the table). The linear nature of the leverage relationship accounts for the fact that sales chargesof equal magnitude in opposite directions results in EPS charges of equal magnitude in thecorresponding direction. At this point, it should be clear that whenever a firm has fixed units,operating or financial, in its structure, combined leverage would exist.
Impact of Turnover and Capital Turnover Ratio and Working Capital Ratio
An increase in sales improves the net profit ratio, raising the Ratio On Investment (ROI) to ahigher level. One may wonder that it will be very attractive for the management to try to raisetheir capital turnover ratio without restrain. This is not preferable in all situations; since a risein capital turnover must be supported by an adequate capital base i.e., working capital.
The main reason for a fall in ratio showing the working capital position due to increase inturnover rates is that as the activity increases without a corresponding rise in working capital,the working capital position becomes tight. As the sales increase, both the current assets andcurrent liabilities also increase, but not in direct proportion to the current ratio.

148 LOVELY PROFESSIONAL UNIVERSITY
Financial Management
Notes If the current ratio is to be maintained at 2, each increase in sales must result in a two-fold rise inthe current assets as compared to current liabilities. But, this does not happen with the sameamount of funds, hence a fall in the current ration.
!Caution It needs to be ensured that when capital turnover ratio is sought to be increased,its effect on the working capital situation is to be carefully considered.
If the current ratio and the acid test ratio are high, it is apparent that the capital turnover ratio canbe increased without any problem. However, it may be very risky to increase capital turnoverratio when the working capital position is not satisfactory.
Self AssessmentFill in the blanks:
12. Combined leverage is equals to …………..leverage multiplied by financial leverage.
13. Combined leverage is viewed as the total impact of the ………..cost in the firms operatingand financial structure.
14. A high operating leverage and a high financial leverage combination is………………...
15. The ………..nature of the leverage relationship accounts for the fact that sales charges ofequal magnitude in opposite directions results in EPS charges of equal magnitude in thecorresponding direction
Case Study Case: RKV – Leverage
This case provides the reader with the opportunity to apply different concepts of leverageto the planning process of the firm.
RKV is an important manufacturer of swimming pools. The firm is located in a semi-urban area. The firm’s primary markets are hardware and discount stores located in fiveNortheastern states. Lucid products reach its market mostly by truck.Most of RKV’s financial planning is done by George Lee, GM of finance. Lee has recentlyprepared financial statements estimating next year’s operating results. He believes that,the firm will earn just over $800,000 in the current year on sales of $8 million and isforecasting sales of $13 million next year. It is likely, that variable costs will remain atapproximately the same percentage of sales next year as this year. Fixed costs will probablyrise to 12 per cent next year.Company A has an EBIT of $2.6 million, no debt, $8 in equity (300,000 shares), $18 million.Company B has the same level of sales, an EBIT of $2.85 million, $3.3 and sales of debt at11 per cent, and $8 in equity (300,000 shares). The tax rate is 35 per cent.RKV has been investigating the addition of a number of new product lines to be soldthrough its existing distribution channels. Two items have been of particular interest. Thefirst would involve the production and sale of chaise lounges for use around swimmingpools. The product would be aimed at commercial users, such as hotels, but could be soldthrough hardware and discount stores as a residential product. The second new itemwould be a patio umbrella. The umbrella would be a large, 12-rib, multicolored canvaswith fringe and would be aimed at the residential market. Both products would fit in withRKV’s existing product line and neither would require any increase in networking capital.
Contd...

LOVELY PROFESSIONAL UNIVERSITY 149
Unit 8: Concept of Leverages
NotesIn his analysis regarding the new product proposals, George Lee recognized that, the firmwould have to build new facilities to produce each product. The lounges would require aninvestment of $3.8 million which would include the purchase and installation ofmanufacturing and packaging machinery. The umbrellas, although a relatively simpleconcept, would require an investment of $6 million for efficient production. For bothproducts, it would take 80 days to install the equipment. This means that production couldbegin by January 1st.
Len haton, the firm’s vice-president of sales, has prepared sales estimates for the twoproducts. He forecasts $4 million in sales for the lounges and $ 4.3 million in sales for theumbrellas on annual basis. The report from the cost accounting department estimatesvariable costs of two-third of the sales value for the lounge unit and 61 per cent for theumbrellas. Fixed costs would be $400,000 and $ 650,000, respectively.
To finance the new projects, Lee has been working with Lucid’s investment bankers. At arecent meeting, Lee was told that the firm could raise money from two sources under thecurrent market conditions. First, it could borrow on an 11 year note at 12 per cent for eitheror both the projects in an amount not exceeding $ 8.5 million. Second, the investmentbankers felt confident that they could underwrite a preferred stock issue with a 12 per centdividend upto a dollar amount of $6 million. The issue would have to be cumulative withrespect to dividends. Common stock financing would not be a possibility at present.
RKV Balance Sheet (Projected through December 31 this Year)
Cash $ 425,000
Accounts receivables 750,000
Inventory 500,000
Fixed Assets 7,650,000
$ 9,325,000
Current liabilities $ 600,000
Long-term debt (10%) 3,800,000
Common stock ($3 par) 1,500,000
Retained earnings 3,425,000
$ 9,325,000
Question
What would be the effect of acceptance of each project on leverages? Would it give afavourable financial leverage to RKV?
RKV Income Statement (Projected through December 31 this Year)
EBIT 1,926,520 EBT 1,536,520 Fixed Costs 1,043,480 Interest 390,000 Marginal contribution 2,970,000 Net Income 1,027,303 Sales $ 8,000,000 Taxes 509,217 Variable Costs 5,030,000

150 LOVELY PROFESSIONAL UNIVERSITY
Financial Management
Notes 8.5 Summary
In financial analysis, leverage represents the influence of one financial variable over someother related financial variable.
The amount of leverage in the firm’s capital structure can significantly affect its value byaffecting returns and risks.
Operating leverage is concerned with the relationship between the firm’s sales revenueand its earnings before interest and taxes, or EBIT
Operating leverage = Percentage change in EBITPercentage change in sales
Break-even analysis, sometimes called cost volume profit analysis, is used by the firm todetermine the level of operations necessary to cost all operating costs
High operating leverage is good when revenues are rising and bad when they are falling.
Financial leverage = Percentage change in EBITPercentage change in EBIT
The financial leverage is favourable when the firm earns more on the investments/assetsfinanced by the sources having fixed charges.
Combined leverage or total leverage can be defined as potential use of fixed costs, bothoperating and financial, to magnify the effect of changes in sales on the firms, earnings pershare.
Combined leverage = operating leverage × financial leverage.
8.6 Keywords
Debt: It is that which is owed; usually referencing assets owed.
Degree of Operating Leverage: It is the change in the percentage of operating income (EBIT) forthe change in percentage of sales revenue.
Financial Leverage: It is the payment of fixed rate of interest for the use for the fixed interestbearing securities, to magnify the rate of return as equity shares.
Leverage: It allows accomplishing certain things that are otherwise not possible.
Operating Leverage: It results from the present fixed operating expenses within firm’s incomestream.
Operating Risk: It is the risk of the firm not being able to cover its fixed operating costs.
Return on Assets: This percentage shows how profitable a company’s assets are in generatingrevenue.
Operating Income: It is a measure of a firm’s profitability that excludes interest and income taxexpenses.
LOVELY PROFESSIONAL UNIVERSITY 151
Unit 8: Concept of Leverages
Notes8.7 Review Questions
1. What is meant by the term leverage? How are operating leverage, financial leverage andtotal leverage related to the income statement?
2. What is operating break-even point? How do charges in fixed operating costs, the saleprice per unit and the variable operating cost per unit affect it?
3. What is operating leverage? What causes it? How is the degree of operating leveragemeasured?
4. What is financial leverage? What causes it? How is the degree of financial leveragemeasured?
5. What is the general relationship among operating leverage, financial leverage and thetotal leverage of the firm? Do these types of leverage complement each other? Why orwhy not?
6. A firm has sales of 7500,000, variable cost of 42,00,000 and fixed cost of 6,00,000. It hasa debt of 45,00,000 @ 9% and equity of 55,00,000.
(a) What is the firm’s ROI?
(b) Does it have favorable financial leverage?
(c) What are the operating financial and combined leverages of the firm?
(d) If the sales drop to 500,00,000, what will be the new EBIT?
7. The capital structure of P Company consists of ordinary share capital of 10,00,000 (sharesof 100 per value) and 10,00,000 of 10% debentures. Sales increased by 20% from 100,000to 120,000 units; the selling price is 10 per unit, variable costs amount to 6 per unit andfixed expenses amount to 200,000. The income tax rate is 50%. You are required tocalculate the following :
(a) The percentage increase in earnings per share
(b) The degree of financial leverage at 100,000 units and 120,000 units.
(c) The degree of operating leverage of 100,000 and 120,000 units.
8. The selected financial data A, B & C Companies for the year ending 31st December, 2004are as follows:
A B C
Variable expenses on % of sales 66 2/3 75 50
Interest expenses 200 300 1000
Degree of operating leverage 5-1 6-1 2-1
Degree of financial leverage 3-1 4-1 2-1
Income tax rate. 50% 50% 50%
Prepare income statement for A, B and C
9. X Corporation has estimated that for a new product its break-even point is 2,000 units ofP. This item is sold for 14%( identified variable cost 7 per unit). Calculate the degree ofoperating leverage for sales volume of 2,500 units and 3,000 units. What do you infer fromthe degree of operating leverage at the sales volume of 2,500 units and 3,000 units andtheir differences, if any?
152 LOVELY PROFESSIONAL UNIVERSITY
Financial Management
Notes 10. ABC companies capital structure is of 5 lakh, [ 100 each share] and 10 per cent debtcapital equity of 2,00,000. The sales are increased by 20 per cent from 50,000 to 60,000units. 10 is the selling price per unit, and 6 is variable cost per unit and fixed expensesamount to 1,00,000. Tax rate is 10 per cent. Calculate:
(a) Percentage increase in EPS
(b) The degree of operating leverage at 5,0000 units and 60,000 units
(c) The degree of financial leverage at 50,000 units and 60,000 units
11. Calculate operating and financial leverages under situations A, B and C and Financial plan1,2, and 3 respectively from the following functions of XYZ Co. Also find out thecombination of operating and financial leverage that gives the highest value and leastvalue:
Installed capacity = 12,000 units;
Actual production & sales = 800 units
Selling price = 15 p.u;
Variable cost = 10 p.u
Fixed Cost = Situation A, 1000; Situation B, 2000; Situation C, 3000
12. Calculate the degree of operating leverage, degree of financial leverage, and the degree ofcombined leverage for the following firms and interpret the results:
Particulars P Q R
Output (Units) 3,00,000 75,000 5,00,000
Fixed Cost ( ) 3,50,000 7,00,000 75,000
Variable Cost per unit ( ) 1.00 7.5 0.1
Interest Expenses ( ) 25,000 40,000 ——
Selling Price per unit ( ) 3.00 25.00 0.50
13. From the following data, calculate operating leverage.
Year EBIT ( ) Sales in units
1998 60,000 3,00,000
1999 70000 3,60,000
14. Calculate operating leverage. Interest 5,0000; sales 50,000; Variable cost 25,000; Fixedcost 15,000.
15. AMC Company Ltd. provided the following information and requested you to Calculate(a) Operating leverage with 4000 and 6000 quantity of sales, (b) operating BEP (Q). Given,Selling price 300, variable cost 200, Fixed cost 2, 40,000.
Answers: Self Assessment
1. income 2. Fixed 3. Semi-variable or semi-fixed
4. Variable 5. Break-even analysis 6. fixed operating
7. revenues 8. operating 9. fixed
10. debt 11. risks 12. operating
13. fixed 14. very risky 15. linear

LOVELY PROFESSIONAL UNIVERSITY 153
Unit 8: Concept of Leverages
Notes8.8 Further Readings
Books Dr Pradeep Kumar Sinha, Financial Management, New Delhi, Excel Books, 2009.
Van Horne, J.C. and Wachowicz, Jr, J.M., Fundamentals of Financial Management,New Delhi, Prentice Hall of India Pvt. Ltd., 1996, p. 2.
Chandra, P., Financial Management—Theory and Practice, New Delhi, Tata McGrawHill Publishing Company Ltd., 2002, p. 3.
154 LOVELY PROFESSIONAL UNIVERSITY
Financial Management
Notes Unit 9: Capital Budgeting
CONTENTS
Objectives
Introduction
9.1 Capital Budgeting Characterization
9.2 Capital Budgeting Process
9.3 Methods of Analyze Capital Budgeting Decisions
9.3.1 Traditional Techniques of Evaluation
9.3.2 Discounted Cash Flow Methods
9.4 Comparison – NPV and IRR Methods
9.4.1 Net Present Value vs Profitability Index
9.4.2 Interrelation between Payback, Net Present Value, IRR andProfitability Index
9.4.3 The Concept of Project IRR
9.4.4 Capital Rationing
9.4.5 Break-Even Time and Capital Budgeting for New Products
9.4.6 BET vs. Payback Method
9.5 Financial Data for Sample Problem
9.6 Capital Decision under Risk and Uncertainty
9.7 Conventional Techniques to Handle Risk
9.7.1 Payback
9.7.2 Risk Adjusted Discount Rate Approach (RAD)
9.7.3 Certainty Equivalent Approach
9.7.4 Probability Distribution Approach
9.7.5 Decision–Trees Approach (DT)
9.7.6 Applied Utility Theory
9.8 Statistical Techniques to Handle Risk
9.9 Summary
9.10 Keywords
9.11 Review Questions
9.12 Further Readings
LOVELY PROFESSIONAL UNIVERSITY 155
Unit 9: Capital Budgeting
NotesObjectives
After studying this unit, you will be able to:
Explain the meaning and process of Capital budgeting
Describe the methods of analyzing capital budgeting decisions
Define the conception of capital rationing
Discuss capital decision under risk and uncertainty
IntroductionAs part of long range planning process decision is taken on the programme, the organizationwill undertake and the appropriate resources that will be allocated to each programme over thenext few years. Hence, management’s decision to expand or diversify emerges from the exerciseof strategic planning. The techniques of capital budgeting are used to take such decisions.
9.1 Capital Budgeting Characterization
Definition
Capital budgeting may be defined as the decision-making process by which firms evaluate thepurchase of major fixed assets such as machinery, equipment, buildings, acquisition of otherfirms either through the purchase of equity shares or group of assets to conduct an on-goingbusiness. Capital budgeting describes the firm’s formal planning process for the acquisition andinvestment of capital and results in a capital budget i.e., the firm’s formal plan outlay forpurchase of fixed assets.
Importance
Preparation of the firm’s formal capital budget is necessary for a number of reasons:
1. It affects profitability: Capital budgeting decisions affect the profitability of the firm.They also have a bearing on the competitive position of the firm. They determine thefuture destiny of the company. An opportune investment decision can yield spectacularreturns. On the other hand, an ill-advised and incorrect investment decision can endangerthe very survival even of the large sized firms.
2. Effects are felt over long time periods: The effects of capital spending decisions will be feltby the firm over extended periods of time, e.g., construction of a factory affects thecompany’s future cost structure.
3. It involves substantial expenditures: Capital expenditure may range from a single pieceequipment costing thousands of rupees to complete. Profit and other physical facilitiescosting crores of rupees.
4. Not easily reversible: Capital investment decisions once made, are not easily reversiblewithout much financial loss to the firm, since there may be no market for second handplant and equipment, or conversion to other uses may not be financially feasible.
5. Based on long-term policy decisions: Capital budgeting decisions should be based on long-term policy decisions and should rest firmly on organisation policies on growth, marketing,industry share, social responsibility and other matters and not taken on ad hoc basis.
6. Scarce capital resources: Capital investment involves cost and the majority of the firm’sresources are limited. This underlines the need for thoughtful and correct investment decisions.
7. Difficulties in evaluation: Evaluation of capital investment proposals is difficult since thebenefits from investment are received in some future period. Hence there is a substantial

156 LOVELY PROFESSIONAL UNIVERSITY
Financial Management
Notes risk involved in estimation of the future benefits. Added to this, the possibility of shifts inconsumer preferences, the actions of competitors, technological developments and changesin the economic and political environment. Even to quantify the future benefits in rupeesis not an easy task.
Notes Kinds of Proposals
One can identify five types of proposals:
1. Replacement: As fixed assets are used they wear out or become outdated by newtechnology. Money may be budgeted to replace worn out or obsolete equipment.
2. Expansion: A firm has to grow, and therefore production facilities are to be addedby way of single machinery or group of machines either for the same products ornew products in the same area.
3. Diversification: A business can reduce the risk by operating in several marketsrather than a single market. Firms seeking the facilities to enter new markets willconsider proposals for the purchase of new machinery and facilities to handle thenew products.
4. Research and development: Firms in industries where technology is rapidly changingwill expend large sums of money for research and development of new products. Iflarge sums of money are needed for equipment these proposals will normally beincluded in the capital budget.
5. Miscellaneous: A firm will frequently have proposals that do not directly help achieveprofit-oriented goals, e.g., installation of pollution control equipment. Safety items,such as automatic sprinkling systems to protect against fire, may involve considerableexpenditures.
Self AssessmentFill in the blanks:
1. …………………..describes the firm’s formal planning process for the acquisition andinvestment of capital.
2. Capital investment decisions once made, are not easily ……………….without muchfinancial loss to the firm
9.2 Capital Budgeting ProcessA capital budgeting decision is a two-sided process:
1. Calculation of likely or expected return from the proposal. Here the focus is cash outflowat the beginning of the project and a stream of cash flow flowing into the firm over the lifeof the project. The calculation of expected return from cash outflow and cash inflows maybe done by different methods discussed later.
2. To select a required return that a project must achieve before it is acceptable. The focus isthe relationship between risk and return. Two methods may be used weighted averagecost of capital (if project risk is identical to firms current risk) or capital asset pricingmodel (if project risk differs from firm’s current risk).
LOVELY PROFESSIONAL UNIVERSITY 157
Unit 9: Capital Budgeting
NotesThe concept of cash outflow vs. cash inflows: The following general rules to be followed:
1. Only cash flow is relevant: Cash flow should be differentiated with accounting profits.
2. Estimate cash flows on an incremented basis that follow from project acceptance.
3. Estimate cash flows before interest basis. This is essential since capital budgeting is anevaluation technique based on discounting future cash flows by cost of capital. Estimatecash flows on an after tax basis. Some firms do not deduct tax payments.
!Caution While working out cash flows debit or charge in account of interest and cut ofcapital should not be considered.
4. They try to offset this mistake by discounting the cash flows before taxes at a rate higherthan the opportunity cost of capital. Unfortunately, there is no reliable formula for makingsuch adjustments to the discount rate.
5. Do not confuse average with incremental profits: Most managers hesitate to throw goodmoney after bad e.g., they are reluctant to invest more money in a loosing division. Butoccasionally, you will find “turnaround” opportunities in a looser are strongly positive.
6. Cash flows should be recorded only when they occur and not when the work is undertakenor the liability incurred.
7. Include all incidental effects: It is important to include all incidental effects on the remainderof the business.
Example: a branch line for a railroad may have negative net inflows when consideredin isolation, but shall be a worthwhile investment when one allows for additionaltraffic that it brings to the main line.
8. Include working capital requirements: Most projects require additional investment inworking capital on a continuous basis with increase in sales. This increase in workingcapital should be considered as a cash outflow in the relevant period. Similarly, when theproject comes to an end, you can usually recover some of the investment, which will nolonger be required, which will be treated as a cash inflow.
9. Forget sunk costs: They are past and irreversible outflows. Because sunk costs are bygones, they cannot be affected by the decision to accept or reject the proposal and so theyshould be ignored.
10. Include opportunity costs: The cost of a resource may be relevant to the investmentdecision even no cash changes hands. For example, suppose a new manufacturing operationuses land which otherwise could be sold for 10,00,000. This resource has an opportunitycost, which is the cash it could generate for the company, if the project is not taken up, andthe resource sold or put to some other productive use.
11. Beware of allocated overhead costs: If the amount of overhead changes as a result of theinvestment decision, then they are relevant and should be included.
12. Effect of depreciation: Depreciation is a non-cash expense; it is important because it reducestaxable income. According to the income tax rules in India, depreciation is charged on thebasis of the written down value method at the rates prescribed by Income Tax Rules.Hence, book profit has to be adjusted by the difference in depreciation (depreciationcharged in books as per Companies Act and depreciation charged as per Income TaxRules) to arrive at taxable income. Hence depreciation provides an annual tax shield equalto the product of depreciation and the marginal tax rate.
158 LOVELY PROFESSIONAL UNIVERSITY
Financial Management
Notes 13. Treat inflation inconsistently: If the discount rate is stated in nominal terms, thenconsistency requires that cash flows be estimated in nominal terms, taking account oftrends in selling price, labour and material costs, etc. This calls for more than simplyapplying a single assumed inflation rate to all components of cash flow. Tax shields ondepreciation do not increase with inflation. They are constant in nominal terms becausetax law in India allows only the original cost of assets to be depreciated.
14. Effect on other projects: Cash flow effects of the project under consideration. If it is noteconomically independent on other existing projects of the firm it must be taken intoconsideration.
Example: If the company is considering the production of a new product that competeswith the existing products in the firms product line, it is likely that as a result of thenew proposal, the cash flows related to the old product will be effected.
15. Tax effect from investment tax credit: An investment tax credit is a tax benefit allowed tobusiness purchasing capital assets. The firm may claim a specified percentage of newcapital investments as credit against income tax in the current year. This is in line withinvestment allowance provided in the Income Tax Act, 1961 earlier.
Conversion of Incremental Accounting Profit to Cash Inflow for Project Evaluation:
Year wise Incremental
Cash Inflow = Year Wise Incremental Accounting Profit of any project (whether itbe for new product or replacement of old Machinery with newmachinery etc.) after tax, but, before interest + Depreciation + allother non-cash expenses.
– Non-cash revenue i.e., profit on sale of asset after the end of theproject.
Self AssessmentFill in the blanks:
3. A capital budgeting decision is a ………………process.
4. It is important to include all ……………..effects on the remainder of the business.
9.3 Methods of Analyze Capital Budgeting Decisions
9.3.1 Traditional Techniques of Evaluation
Payback Period
Sometimes called the payout method i.e., a computationally simple project evaluation approachthat has been used for many years. The procedure is to determine how long it takes a project toreturn the cost of the original investment.
Example: A project costing 20 lakhs yields annually a profit of 3 lakhs after [email protected]% (straight line method) but before tax 50%. In this case cash inflow = Profit after tax +Depreciation = 3,00,000 – Tax 1,50,000 + Depre. 2,00,000 = 4,00,000 p.a.
Payback period = Cost of the project1,60,000 – 10,000 20,00,00015 Annual cash inflow 4,00,000
= = 5 years.
LOVELY PROFESSIONAL UNIVERSITY 159
Unit 9: Capital Budgeting
NotesThe project with a lower payback period will be preferred. Sometimes, the management laysdown policy guidelines regarding payback period.
Merits
1. This method is quite simple and easy to understand; it has the advantage of making it clearthat there is no profit of any project unless the payback is over. When funds are limited itis always better to select projects having shorter payback periods. This method is suitableto industries where the risks of obsolescence are very high.
2. The payback period can be compared to a break-even point, the point at which costs arefully recovered, but profits are yet to commence.
3. The risk associated with a project arises due to uncertainty associated with the cash inflows.A shorter payback period means less uncertainty towards risk.
Limitations
1. The method does not give any considerations to time value of money. Cash flows occurringat all points of time are simply added.
2. This method becomes a very inadequate measure of evaluating two projects where cashinflows are uneven.
3. It stresses capital recovery rather than profitability. It does not take into account thereturns from a project after its payback period. Therefore, this method may not be a goodmeasure to evaluate where the comparison is between two projects one involving a longgestation period and other yielding quick results only for a short period.
The Payback Reciprocal
A simple method of calculating the internal rate of return is the payback reciprocal which is 1divided by the payback period.
Example: A project has an initial cash outlay of 2,00,000 followed by 10 years of annualcash savings of 50,000. The payback period is 2,00,000/ 50,000 = 4 years and the paybackreciprocal is
1Playback period
= 14
= 25%
A major drawback of the payback reciprocal that it does not indicate any cutoff period for thepurpose of investment decision. It is, however, argued that the reciprocal of the payback wouldbe a close approximation of the internal rate of return if the life of the project is at least twice thepayback period and the project generates equal amount of the annual, cash inflows.
Accounting Rate of Return (ARR)
The accounting rate of return (ARR) method of evaluating capital budgeting projects is sonamed because it parallels traditional accounting concepts of income and investment. A projectis evaluated by computing a rate of return on the investment, using accounting measures of netincome. The formula for the accounting rate of return is:
ARR = Annual revenue from project – Annual exp. of project 100Project investment
´
160 LOVELY PROFESSIONAL UNIVERSITY
Financial Management
Notes This rate is compared with the rate expected on other projects, had the same funds been investedalternatively in those projects. Sometimes, the management compares this rate with the minimumrate (called cut of rate) they may have in mind.
Merits: This method is quite simple and popular because it is easy to understand and includesincome from the project throughout its life.
Limitations:
1. This method ignores the timing of cash flows, the duration of cash flows and the timevalue of money.
2. It is based upon a crude average of profits of the future years. It ignores the effect offluctuations in profits from year to year.
Conclusion: The traditional techniques of appraising capital investment decision have two majordrawbacks:
1. They do not consider total benefits throughout the life of the project and
2. timing of cash inflows is not considered.
Hence, two essential ingredients of a theoretically sound appraisal method are that:
1. it should be based on total cash stream through the project life and
2. it should consider the time value of money of cash flows in each period of a projects life.
Did u know? The discounted cash flows techniques also known as time adjusted techniquessatisfy these requirements and provide a more objective basis for selecting and evaluatinginvestment projects.
9.3.2 Discounted Cash Flow MethodsDiscounted cash flow refers to the fact that all projected cash inflows and outflows for a capitalbudgeting project are discounted to their present value using an approximate interest rate.Three discounted cash flow methods are generally used in capital budgeting. One is called NetPresent Value Method (NPV); the other is called Profitability Index or Desirability factor and thethird Internal Rate of Return (lRR). All the three methods focus on the timing of cash flows overthe entire life of the project. The spotlight is on the cash flows as opposed to accounting measuresof revenue and expense.
All discounted cash flow methods are based on the time value of money, which means that anamount of money received now is worth more than an equal amount of money received infuture. Money in hand can be invested to earn a return.
To simplify the process of evaluating proposals using discounted cash flows, the assumption isoften made that cash flow or cash savings from a project occur at the end of accounting periodsince the results are not materially different from mere precise calculations.
Net Present Value (NPV)
nder this method, all cash inflows and outflow are discounted at a minimum acceptable rate ofreturn, usually the firm’s cost of capital. If the present value of the cash inflows is greater thanthe present value of the cash outflows, the project is acceptable i.e., NPV > 0, accept and NPV <0, reject. In other words, a positive NPV means the project earns a rate of return higher than thefirm’s cost of capital.

LOVELY PROFESSIONAL UNIVERSITY 161
Unit 9: Capital Budgeting
Notes Example: JP Company wants to buy a machine with a cost of 33,522 and annual cashsavings of 10,000 for each of 5 years. JP Company’s cost of capital is 12%. With uniform cashflows, the present value (PV) is computed using the present value of and annuity of 5 paymentsof 10,000 each at 12%, the NPV is calculated as follows:
PV of Cash inflows = 10,000 × 3,605 (PV 1 – 5 years @ 12%) 36,050
Less: Present Value of Cash outflows 33,522
Net present value of the project 2,528
Since NPV is positive, the project is acceptable since the net value of earnings exceeds by 2,528the amount paid for the use of the funds to finance the investment.
The net present value relies on the time value of money and the timings of cash flows inevaluating projects. All cash flows are discounted at the cost of capital and NPV assumes that allcash inflows from projects are re-invested at the cost of capital.
As a decision criterion, this method can be used to make a choice between mutually exclusiveprojects. The project with the highest NPV would be assigned the first rank, followed by othersin the descending order.
Merits:
1. It recognises the time value of money.
2. The whole stream of cash flows throughout the project life is considered.
3. A changing discount rate can be built into the NPV calculations by altering the denominator.
4. NPV can be seen as the addition to the wealth of shareholders. The criterion of NPV is,thus, in conformity with basic financial objectives.
5. This method is useful for selection of mutually exclusive projects.
6. An NPV uses the discounted cash flows i.e., expresses cash flows in terms of currentrupees. The NPV’s of different projects therefore, can be added/compared. This is calledthe value additive principle, implying that NPV’s of separate projects can be added. Itimplies that each project can be evaluated independent of others on its own merit.
Limitations:
1. It is difficult to calculate as well as understand and use in comparison with the paybackmethod or even the ARR method.
2. The calculation of discount rate presents serious problems. In fact, there is difference ofopinion even regarding the exact method of calculating it.
3. PV method is an absolute measure. Prima facie between the two projects, this method willfavour the project, which has Higher Present Value (or NPV). But it is likely that thisproject may also involve a larger initial outlay. Thus, in case of projects involving differentoutlays, the present value method may not give dependable results.
4. This method may not give satisfactory results in case of projects having different effectivelives.
Desirability Factor/Profitability Index (PI)
NPV of a project is a function of the discount rate, the timings of the cash flow and the size of thecash flows. Other things being equal, large investment proposals yield larger net present values.
162 LOVELY PROFESSIONAL UNIVERSITY
Financial Management
Notes Logic tells, cash flows of the larger machine are merely a multiple of cash flows of the smallermachines. To adjust, the size of the cash flows, we can calculate a profitability index, which is theratio of the present value of cash inflows to the present value of the cash outflows. Thus,profitability index
(PI) = P.V. of cash inf lowP.V. of cash outflow
The higher the PI, the more desirable the project in terms of return per rupees of investment. API of I.O. is the cut-off point for accepting projects and is equivalent to being NPV positive. A PIof less than 1.0 indicates negative net present value for the project.
Internal Rate of Return (IRR)
Internal rate of return is the interest rate that discounts an investment’s future cash flows to thepresent so that the present value of cash inflows exactly equals the present value of the cashoutflows i.e., at that interest rate the net present value equals zero.
The discount rate i.e., cost of capital is considered in determination of the net present valuewhile in the internal rate of return calculation, the net present value is set equal to zero and thediscount rate which satisfies this condition is determined and is called Internal Rate of Return.
Any investment that yields a rate of return greater than the cost of capital should be acceptedbecause the project will increase the value of the firm.
Did u know? Unlike, the NPV method, calculating the value of IRR is more difficult. Theprocedure depends on whether the cash flows are annuity (equal year wise) or non-uniform.
The following steps are taken in determining IRR for an annuity (equal cash flows):
1. Determine the payback period of the proposed investment.
2. From the table of Present value of Annuity, look for year that is equal to or closer to thelife of the project.
3. From the year column, find two Present Value or discount factors closest to paybackperiod, one larger and other smaller than it.
4. From the top row of the table note, the two interest rates corresponding to these Presentvalues as in (3) above.
5. Determine IRR by interpolation
When cash flows are not uniform, an interest rate cannot be found using annuity tables.
Instead trial and error methods or a computer can be used to find the IRR. If the IRR is computedmanually, the first step is to select an interest rate that seems reasonable (this can be done bycalculating average annual cash flows by the annuity method as mentioned earlier) and thencompute the present value of the individual cash flows using that rate.
If the net present value is positive, then the interest rate used is low, i.e., IRR is higher than theinterest rate selected. A higher interest rate is then chosen and the present value of the cash flowsis computed again. If the new interest rates yield a negative net present value, then a lowerinterest rate is to be selected. The process is repeated until the present value of cash inflow isequal to the present value of the cash outflows. Finding the rate of return using trial and errormethods can be tedious, but a computer can accomplish the task quite easily.

LOVELY PROFESSIONAL UNIVERSITY 163
Unit 9: Capital Budgeting
NotesAdvantages
1. It possesses the advantages, which are offered by the NPV criterion such as it considerstime value of money and takes into account the total cash inflows and outflows.
2. IRR is easier to understand. Business executives and non-technical people understand theconcept of IRR much more readily that they understand the concepts of NPV.
3. It does not use the concept of the required cost of return (or the cost of capital). It itselfprovides a rate of return which is indicative of the profitability of the proposal. The cost ofcapital enters the calculation, later on.
4. It is consistent with the overall objective of maximizing shareholders wealth since theacceptance or otherwise of a project is based on comparison of the IRR with the requiredrate of return.
Limitations
1. It involves tedious calculations.
2. It produces multiple rates, which can be confusing.
3. In evaluating mutually exclusive proposals, the project with the highest IRR would bepicked up to the exclusion of all others. However, in practice, it may not turn out to be onethat is the most profitable and consistent with the objectives of the firm i.e., maximizationof the wealth of the shareholders.
4. Under IRR method, it is assumed that, all intermediate cash flows are reinvested at the IRRrate. It is not logical to think that the same firm has the ability to re-invest, the cash flowsat different rates. In order to have correct and reliable results it is obvious, therefore, thatthey should be based on realistic estimates of the interest rate at which the income will bere-invested.
5. The IRR rule requires comparing the projects IRR with the opportunity cost of capital. But,sometimes, there is an opportunity cost of capital for 1 year cash flows, a different cost ofcapital for 2-year cash flows and so on. In these cases, there is no simple yardstick forevaluating the IRR of a project.
Self AssessmentFill in the blanks:
5. Under Net Present Value (NPV) method, all cash inflows and outflow are discounted at a……………..acceptable rate of return, usually the firm’s cost of capital.
6. …………………is the ratio of the present value of cash inflows to the present value of thecash outflows.
7. …………………..is the interest rate that discounts an investment’s future cash flows to thepresent so that the present value of cash inflows exactly equals the present value of thecash outflows.
9.4 Comparison – NPV and IRR Methods
Similarities
In respect of conventional and independent projects, the two methods give a concurrent acceptance-reject decision. In case of conventional investment cash outflows are confined to the initial
164 LOVELY PROFESSIONAL UNIVERSITY
Financial Management
Notes period (i.e. in the beginning) followed by cash inflows. The independent proposals refer toinvestment, the acceptance of which does not preclude the acceptance of others, so that allprofitable proposals can be accepted and there are no constraints. The decision rule is that aproposal will be accepted if
1. NPV exceeds zero,
2. IRR exceeds the required rate of return.
Similarly, when NPV = Zero or the IRR = required rate of return, the project may be accepted orrejected.
Differences
In case of mutually exclusive capital project i.e., the acceptance of an investment precludes theacceptance of others (i.e. if there are alternative courses of action, only one can be accepted).Mutual exclusiveness of the investment projects may be technical or financial. Technical meansprojects with different profitabilities and selection of the more profitable. Financial meansresource constraints, which is also called capital rationing.
The different ranking by NPV and IRR methods can be due to the following:
1. Size disparity
2. Time disparity
3. Unequal expected lives.
As stated earlier, the IRR criterion implicitly assumes that the cash flow generated by the projectwill be reinvested at the internal rate of return, as opposed to company’s cost of capital in caseof NPV. The assumption of the NPV method is considered to be superior since the rate can beconsistently applied to all investment proposals.
9.4.1 Net Present Value vs. Profitability IndexThe investment proposal will be acceptable if:
1. PI is greater than one.
2. Positive Net Present Value.
Likewise, PI will be less than I when the investment proposal has a negative net present valueunder the NPV method.
!Caution While evaluating mutually exclusive investment proposals, these methods willgive different rankings. The best project is the one, which adds the most, among availablealternatives, to the shareholders wealth. The NPV method by its very definition, willalways select such projects.
9.4.2 Interrelation between Payback, Net Present Value, IRR andProfitability Index
We have seen Payback period =Cost of the Project
Annual cost saving/Inflows
We have also seen that investment proposal will be acceptable if PI is greater than one and NetPresent Value is positive.
LOVELY PROFESSIONAL UNIVERSITY 165
Unit 9: Capital Budgeting
NotesAgain, NPV = 0, when the discount rate is equal to cost of capital and PI = I and by definition IRRis the interest rate that discounts an investments’, future cash flows to the present so that presentvalue of inflows equals to the present value of cash outflows i.e., NPV is equal to zero. Hence,under IRR, if interest rate is equal to cost of capital, NPV is zero and also PI = I.
The steps for determining IRR for an annuity (equal annual cash flows).
1. Payback period, which will give the cumulative present value factor.
2. From cumulative PV (discount) factor tables see the corresponding interest rate nearest tothat figure corresponding to the life of the project (No. of years).
From the above discussion we can conclude the following:
1. Payback period = Cumulative Present value of Discount, based.
(equal annual cash flows) on cost of capital.
2. At IRR rate of interest NPV = 0 i.e., Cost of the project = Cash outflows
= Present value of cash inflows
= Annual cash inflows × Cumulative discount factor
(In case of equal annual cash inflows)
Example: Following are the data on a capital project being evaluated by the managementof X Ltd.
Project M
Annual cost saving 40,000
Useful life 4 years
IRR 15%
Profitability Index (PI) 1.064
NPV ?
Cost of capital ?
Cost of project ?
Payback ?
Salvage value 0
Find the missing values. (Given cumulative PV 1-4 years @ 15% = 2.855)
Solution:
At 15% IRR, the sum total of cash inflows = Initial cash outlay i.e. cost of the project
Cumulative present value @ 15% for 4 years = 2.855 and Annual Cost saving 40,000
Hence, Total of Cash inflows = 40,000 × 2.855 = 1,14,200
Therefore, Initial Cost Outlay
i.e., Cost of the project = 1,14,200
Payback period = Cost of the project 1,14,200 2.855Annual cost saving 40,000
= =

166 LOVELY PROFESSIONAL UNIVERSITY
Financial Management
Notes = 2 years 11 months
P I. = 1.064
=P.V. of cash inflow
P.V. of cash outflow i.e. Cost of theproject
Hence, PV of Cash inflows = 1.064 × 1,14,200 = 1,21,508.8
NPV = 1,21,508.8 – 1,14,200 = 7,309
Current Present Value factor at Company’s Cost of Capital
=PV of Cash inflowsAnnual Cost Saving
=1,21,50940,000 = 3.0377
From the present value table corresponding to 4 years the discount/interest is 12%
i.e., Cost of capital = 12%.
Example: Following are the data on a capital project with equal annual cash savingsevaluated by the management of S company —
Project
Cost 1,01,400
Payback 5.07 years
Annual Cost Saving ?
Useful life ?
Cost of Capital ?
NPV - ?
IRR 19 per cent
PI 1.14
Salvage Value 0
Required: Find the missing values.
Solution:
1. Annual Cost Saving = Cost of Project/Payback period
= 1,01,400/5.07 = 20,000
2. At IRR rate of discount (i.e. 19%)
Cost of the project = PV of cash inflows
= 1,01,400
Hence, Cumulative Present Value at 19%
= 1,01,400 5.0720,000
=
LOVELY PROFESSIONAL UNIVERSITY 167
Unit 9: Capital Budgeting
NotesIf we refer to Cumulative Present Value @19% Cumulative Present Value of 5.07 is computedat 19 years. Therefore, useful life =19 years.
3. PI = 1.14 at cost of capital rate of interest; at IRR rate of discount
PI index = 1. Hence Cumulative Present Value at cost of capital rate of interest = 5.07 × 1.14= 5.778. By referring to Cumulative Present Value table up to 19 years. We find at 17%Cumulative Present Value 5,585 and at 16% = 5.877. Since 5,778 Cumulative Present valueis lying between 5.877 and 5,585 by interpolation we get,
16 + = 16 + = 34 + 16 = 16.34%
4. NPV at IRR rate of discount = 0 when PI = I
Since PI = 1.14
Therefore, NPV = 0.14 × Cost of the project = 0.14 × 1,01,400 = 1,41,196
9.4.3 The Concept of Project IRRIn spite of the theoretical superiority of NPV, financial managers prefer to use IRR. The preferencefor IRR is due to the general preference of business people towards rates of return rather thanactual rupee returns. Because interest rates, profitability and so on are most often expressed asannual rates of return, the use of IRR makes sense to financial decision makers. They tend to findNPV less intuitive because it does not measure benefits relative to amount invested. The conceptof project IRR finds favour material financial undertakings and other providers of capital. Itgives an idea of how much discounting towards amount of capital, the project can sustain duringits life span. This can be explained through an example.
Example: XYZ Ltd. an infrastructural company is evaluating a proposal to build, operateand transfer a section of 35 km of road at a project cost of 200 crores to be financed as:
Equity share capital 50 crores
Loans at the rate of interest of 15% from financial institutions 150 crores
The project after completion must be opened to the traffic and must be affected for a period of 15years and after 15 years, it must be handed over to the highway authorities at zero value. It isestimated that the total revenue must be 50 crore per annum and annual collection expensesincluding maintenance of roads will amount to 5% of the project cost. The company considers towrite off the total cost of the project in 15 years in a straight line basis for corporate income tax,the company is allowed to take depreciation @ 10% on NDV basis. The financial institutions areagreeable to the repayment of the loan in 15 equal annual installments – consisting of principaland interest.
Calculate Project IRR and Equity IRR. Ignore corporate taxation. Explain the difference in projectIRR and equity IRR.
Solution:
The project cash inflows and cash outflows can be summarized as follows:
Cash outflowCost of the project 0 1 2 3 – 15
200
Cash inflowRevenue for Tax 50
Less maintenance 5% of 200

168 LOVELY PROFESSIONAL UNIVERSITY
Financial Management
Notes Net.
1040 40 40 – 15 years
At IRR – Cost of the project equal to discounted cash inflows of 40 crores for total project lifei.e., 15 years.
Now, cost of the project = 200 crores.
Hence, 200 crores = cum discount factor 1 – 15 years × 40 crores or cum discount factor 1-15
years = 20040 = from the rate of present value of annuity, it will be observed that at 20% cum
present value 1-15 years 5.09158 at 19% cum present value 1-15 years 4.87586. Hence Project IRR
will be between 19% and 20%, it will be approximately 19% + 5 – 4.87586
5.09158 – 4.87568 i.e. 0.124140.21572 =
19 + 0.58%
Since, there is no corporate taxation, depreciation will not affect cash flow, hence depreciation;has not been considered. Now the project is financed by 50 crores debt @ 15% p.a. i.e., yearlyinterest of 7.50 crore and equity capital 150 crores. Hence profit available to equity shareholderseach year
= Net cash inflow – Interest outflow
= 40 – 7.5 = 32.5 crores.
Hence, cum discount factor for equity shares
=150325 = 4.61538
If we see the present value of annuity table 1-15 years cumulative, we find
20% = 4.67547)
21% = 4.48901) Hence it will be between 20 & 21%
It will be
20% + 4.61538 – 4.489014.67547 – 4.48901 i.e.
0.12607 0.18646 = 20.68%
Equity IRR is more than project IRR, since the project is earning 19.58% on discounted basis,interest is being paid @ 15% so capital is contributed by debt is interest paid is less than theinterest earned, the balance goes to equity share holders to increase their return.
9.4.4 Capital RationingThe process of selecting the more desirable projects among many profitable investments iscalled capital rationing. Like any rationing it is designed to maximize the benefit available fromusing scarce resources. In this case the scarce resources are funds available for capital investmentsand the benefits are returns on the investments. The objective is to select the combination ofprojects, which would give maximization of the total NPV. The project selection under capitalrationing involves two stages:
1. The identification of the acceptable projects,
2. To select the combination, of projects. The acceptability of projects can be based either onprofitability/present value index or IRR.
LOVELY PROFESSIONAL UNIVERSITY 169
Unit 9: Capital Budgeting
Notes
Notes Many firms’ capital constraints are ‘Soft’. They reflect no imperfections in capitalmarkets. Instead they are provisional limits adapted by management as an aid to financialcontrol. Soft rationing should never cost the firm anything. If capital constraints becometight enough to hurt in the sense that projects with significant positive NPV’s are passedup then the firm raises more money and loosens the constraint. But when it can’t raisemore money, then it faces hard rationing. ‘Hard’ capital rationing always reflects onmarket imperfection a barrier between the firm and capital markets, which can be attributedto non-availability of market information, investor attitude etc.
There are various ways of resorting to capital rationing. For instance, a firm may effect capitalrationing through budgets. Capital rationing may also be exercised by following the concept of“responsibility accounting”, whereby management may introduce capital rationing byauthorizing a particular department to make investment only up to a specified limit, beyondwhich the investment decisions are to be taken up by higher-ups.
In capital rationing, it may also be more desirable to accept small investment proposals than afew large investment proposals so that there may be full utilization of budgeted amount. Thismay result in accepting relatively less profitable investment proposals if full utilization ofbudget is a primary consideration.
Similarly, capital rationing may also mean that the firm foregoes the next most profitableinvestment following after the budget ceiling, even though it is estimated to yield a rate ofreturn much higher than the required rate of return. Thus, capital rationing does not always leadto optimum results.
Example: S. Ltd. has 10,00,000 allocated for capital budgeting purposes. The followingproposals and associated profitability indexes have been determined:
Project Amount Profitability( ) Index
1 3,00,0.00 1.222 1,50,000 0.953 3,50,000 1.204 4,50,000 1.185 2,00,000 1.206 4,00,000 1.05
Which of the above investments should be undertaken? Assume that projects are indivisible andthere is no alternative use of the money allocated for capital budgeting:
Solution:
We should go in for projects priority-wise based on PI Index:
Project PI Investment Priority Sum Total of NPVCash Inflows
1 1.22 3,00,000 I 3,66,000 66,0003 1.20 3,50,000 2 4,20,000 70,0005 1.20 2,00,000 2 2,40,000 40,0004 1.18 4,50,000 3 5,31,000 81,0006 1.05 4,00,000 4 4,20,000 20,000
170 LOVELY PROFESSIONAL UNIVERSITY
Financial Management
Notes Since there is no alternative use of money we should maximize capital spending providedproject is profitable, that is, PI is more than I and NPV is positive. Combination of project 1, 3, 5gives NPV of 1,76,000 but 1,50,000 remains unspent, whereas combination of 3, 4, 5 gives NPVof 1,91,000 and every amount is spent. Hence project 3, 4, 5 are to be taken.
9.4.5 Break-Even Time and Capital Budgeting for New ProductsTime is being considered as a competitive weapon specifically for firms that bring a new productto market at a very fast rate in order to gain sizeable shares of total market sales for that product.Hence, the increased emphasis to the use of break-even time as a capital budgeting method andas a performance measures.
Break-Even Time (BET) is the time taken from the start of the project (the initial idea date) till theperiod the Cumulative Present Value of cash inflows of a project equal to present values of thetotal cash outflows. Hence, product proposals with shorter BET’s are preferred to longer BETs ifall other things are equal.
BET also promotes aggressive efforts by personnel on different functional areas such as productdesign and manufacturing to speed up the time taken to bring the product to the market andreap the benefits fast.
Did u know? Hewlett-Packard is a strong advocate of BET.
Example: Two products A and B are being evaluated by a Computer ManufacturingCompany. The estimated cash outflows covering research and development, product design,manufacturing, marketing, distribution and customer services and cash inflows from sales aregiven below:
( lakhs)
Product A Product B
Year Cash Outflows Cash Inflows Cash Outflows Cash Inflows
1 8 0 10 4
2 6 14 7 32
3 22 34 17 26
4 13 37 6 8
5 10 22 0 2
The company uses a 14% required rate of return for discounting cash flows on a before tax basis.
Solution:
For Product A
( lakhs) Year
PV Factor
Cash
Outflows PV of cash Outflows
Cum PV of Cash Outflows
Cash Inflows
PV of cash Inflows
Cum. PV of cash Inflows.
1 0.877 8 7.016 7.016 0 - 0
2 0.769 6 4.614 11.63 14 10.766 10.766
3 0.675 22 14.85 26.48 34 22.95 33.716
4 0.592 13 7.696 34.176 37 21.904 55.62
5 0.519 10 5.19 39.366 22 11.418 67.038

LOVELY PROFESSIONAL UNIVERSITY 171
Unit 9: Capital Budgeting
NotesFor Product A, the present value of total cash outflows is 39.366 lakhs. At the end of 3 year, thecumulative present value of cash inflows is 33.716 lakhs and for 4th year the present value ofcash inflows is 21.904 lakhs.
BET of Product A = 3 + 39.366 – 33.716
21.904 = 3.26 years
For Product B ( Lakh)
Year
PV Factor
Cash Outflows
PV of cash outflows
Cum PV of cash outflows
Cash inflows
PV of cash inflows
Cum. PV of cash inflows.
1 0.877 10 8.77 8.77 4 3.508 3.508
2 0.769 7 5.383 14.153 32 24.608 28.116
3 0.675 17 11.475 25.628 26 17.55 45.666
4 0.592 6 3.552 29.18 8 4.736 50.402
5 0.519 0 0 29.18 2 1.038 51.44
For Product B, the present values of the total cash outflows are 29.18 1akh. At the end of 2 year,the cumulative present value of cash inflows is 28,116 lakhs and for 3rd year the present valueof cash inflows is 17.550.
BET for Product B =29.18 – 28.116
17.550 = 2.06 years
9.4.6 BET vs. the Payback Method
Differences
1. BET starts counting time at the start of the project, irrespective of when the cash outflowsoccur whereas payback method starts counting time from the initial cash outflow.
2. BET takes account of time value of money when cumulating cash inflows and cash outflows,whereas payback method ignores the time value of money.
Similarity
1. Both methods ignore cash inflows after the break-even time or the payback period.
Self Assessment
Fill in the blanks:8. Profitability Index will be less than I when the investment proposal has a ……………net
present value under the NPV method.9. ‘The process of selecting the more desirable projects among many profitable investments
is called ……………………..
9.5 Financial Data for Sample ProblemFrom the following, calculate differential cash flow streams considering that a firm has anexisting machine and is considering the purchase of a new machine:1. The new machine is more efficient than the existing machine. This will increase the firm’s
revenue from products made by the machine from 4,00,000 to 4,50,000 and will loweroperating cost from 2,10,000 to 1,70,000.

172 LOVELY PROFESSIONAL UNIVERSITY
Financial Management
Notes 2. The new machine will cost 2,20,000. It will cost 20,000 for transportation and installationof machine. The firm will receive 15,000 investment tax credit as a result of the purchasesand installation of the machine.
3. The new machine will have a service life of 4 years. The existing machine will also be ableto produce goods for four more years.
4. The new machine processes raw materials more quickly and works more efficiently onlong production runs. Thus, the firm must tie up an additional 20,000 of goods ininventories to support the new machine.
5. At the present time, the book value of the existing machine is 80,000 and it is beingdepreciated at 20,000 per year, to a zero book value. If the existing machine is sold today,its cash value would be 40,000. If it continues to operate for 4 more years, its cash valuewould be 10,000.
6. The new machine will be depreciated using straight-line depreciation. In four years, itwill have 40,000 book value and 30,000 cash salvage value. Take Income Tax @ 50%.
Step 1 – Calculate the Net Cash Outlay: The net cash outlay is the different amount of moneythat will be spent when the investment is made in year zero. It may be calculated by = Total costof new investment including purchase price, transportation, installation and any related charges.Tax savings from investment tax credit +/– changes in the working capital requirements netcash received from replacing existing machines (i.e., selling price or money received less anycosts of removing the asset) +/– either the taxes saved or additional taxes to be paid as a resultof purchasing the new asset. In our example, 2,20,000 is the purchase price plus 20,000 fortransportation and installation.
The investment tax credit produces a tax saving of 15,000. The working capital tied up is 20,000 that is treated as an outlay in year zero. It will be an inflow in year 4. The cash for the
existing machine is 40,000. The tax effect is a saving that occurs because the firm sells a 6,80,000 book value machine for 40,000, procuring non-cash or book loss. At a 50 per cent taxrate, the loss of 40, 000 in the sale produces a 20,000 tax savings. Thus, net cash outlay (outflow)is
2,20,000 + 20,000 – 15,000 + 20,000 – 40,000 – 20,000 = 1,85,000.
Step 2 – Calculate the Depreciation Schedules: In practice, we use the method employed by thefirm for tax purposes since only this method affects the tax shield and cash flow using straightline depreciation. In our example, the depreciation can be calculated with two formulas asfollows:
Depreciable Cost = Total Cost of machine – Book salvage value
2,40,000 – 40,000 = 2,00,000
Annual Depreciation = Depreciable Cost/Years of life
= 2,00,000/4 = 50,000
With the straight-line method, 50,000 depreciation is the same for each of the four years of thenew machines estimated service life. With other methods, the amount of depreciation differseach year.
The depreciation on the existing machine is given at 20,000 per year down to zero book value.Since the current book value is 80,000, the annual depreciation of 20,000 will be realised forthe remaining four years of service life.
LOVELY PROFESSIONAL UNIVERSITY 173
Unit 9: Capital Budgeting
NotesStep 3 – Calculate Annual after Tax Cash flows: In our example, the annual cash flows will besame each year since the revenues, costs, depreciation and taxes do not change. To compute aftertax cash flows from operations or employment of the asset there are 2 methods:
1. We begin with revenues, deduct cash expenses and taxes, and we have the cash flow, or
2. We can begin with revenues; deduct cash expenses, and non-cash expenses. Calculate taxesand deduct them and then add back depreciation. The two methods are shown below:
New Machine Existing MachineAccounting Cash flow Accounting Cash flow
Annual-revenues 450,000 400,900 400,000 400,000Less: Annual cost of operation 170,000 210,000 210,000 210,000Before tax cash flow 280,000 190,000 190,000 190,000Less: Annual depreciation 50,000 20,000 20,000 20,000
230,000 170,000 170,000 170,000Less: income taxes 50% 115,000 85,000 85,000Net income after taxes 115,000 85,000 85,000 85,000Add: Back Depreciation 50,000 20,000 20,000 20,000After tax cash flow 165,000 105,000 105,000 105,000
Notes Any tax shield from interest payments on debt is omitted, since the effects offfinancing by different methods are considered in cost of capital calculation and are notcovered in capital budgeting so as to avoid double counting of financing effects.
Step 4 – Calculate effects in final year:
In the final year two events occur:
1. The return of the working capital tied up in year zero. In our example, 20,000 is treatedas an inflow in the final year since the money is freed for other uses.
2. In the final year, each machine is sold in its respective cash flow stream. To get the after taxeffect, we must estimate the book and cash value and compute the net cash value from thesale of each asset, as given below:
New Machine Existing Machine
Book value in 4 years 40,000 0Cash value in 4 years 30,000 10,000Gain (Loss) on sale in 4 years (10,000) 10,000Tax saving (additional taxes) 5,000 (5,000)Plus Cash Received 30,000 10,000Net Cash Value 35,000 5,000
Thus, we have cash flow in the final year as follows:
New Machine Existing MachineAnnual inflows from step 3 1,65,000 1,05,000Return of working capital 20,000 -Sale of machine 35,000 5,000Final year cash flow 2,20.000 1,10.000
174 LOVELY PROFESSIONAL UNIVERSITY
Financial Management
Notes Step 5 – Calculate the Differential after Tax stream: We subtract the existing machine streamfrom the new machine stream as follows:
Year New Machine Existing Machine Difference0 (1,85,000) 0 (1,85,000)1 1,65,000 1,05,000 60,0002 1,65,000 1,05,000 60,0003 1,65,000 1,05,000 60,0004 2,20,000 1,10,000 1,10,000
This stream shows both the timing and amount of net cash outlay and net cash inflow over thelife of the new machine. All effects are differential – the difference between having the investmentand not having it, and can be evaluated with time-value of money techniques as have beendiscussed earlier.
Cost of Capital
As mentioned above, the cost of capital is an important element as basic input information incapital investment decisions. It provides a yard stick to measure the work of investment proposalsand thus, perform the role of accept reject criterion. It is also referred to a cut-off-rate, target rate,minimum required rate of return, standard return and so on. In the present value method ofdiscounted cash flow techniques, the cost of capital is used as the discount rate to calculate the NPV.
Notes The PI Index or benefit cost ratio method similarly employs to determine thepresent value of future cash inflows. In case of internal rate of return method, the computedIRR is compared with the cost of capital, and accept only the cases where they are morethan cost of capital.
In operational terms, cost of capital refers to the discount rate that would be used in determiningthe present values of estimated future cash proceeds and eventually deciding whether the projectis worth accepting or not.
The cost of capital is considered as consisting of different sources of funds. The cost of eachsource is called as specific cost of capital and these specific costs when combined refer to overallcost of capital or weighted cost of capital.
Assumptions – Cost of Capital
1. That the firm’s business and financial risk are unaffected by the acceptance and financingof projects.
2. The firm’s financial structure is assumed to remain fixed. It implies that the additionalfunds required to finance the new project are to be raised in the same proportion as thefirm’s existing financing.
Solved Illustrations
Illustraton 1: A project costing 5,60,000 is expected to produce annual net cash benefits of 80,000 over a period of 15 years. Estimate the IRR. Also, find the payback period and obtain theIRR from it. How do you compare this IRR with the one directly estimated?
Solution:
Payback period = 5,60,00080,000 . = 7
LOVELY PROFESSIONAL UNIVERSITY 175
Unit 9: Capital Budgeting
NotesHence from the present value of annuity 1—15 years closest factors to 7 are 7.191, (at 11% rate ofdiscount) and 6.811 (at 12% rate of discount). Hence IRR would be somewhere between 11% and12%.
Using interpolation IRR would be:
11% + 7.191 – 7
7.191 – 6.811 = 11% + 0.1910.380 = 11.5%
We know that reciprocal of payback period is a good approximation of the IRR provided the lifeof the project is large or at least twice the payback period and the project generates equal annualcash inflows. Since both the conditions are satisfied. IRR would be reciprocal of the paybackperiod i.e., 1/7 = 14.28%.
The two IRR’s are different. The second method is an approximation present value whereas thefirst gives the correct IRR, since at that discount rate cash inflows equals the cost of the project orthe net present value is zero.
Illustration 2:
Valuable Products are considering purchase of a machine for its production line. Two types ofoptions are available deluxe model with 30,000 initial cost and economy model with 20,000initial cost. Each model has 5 years life and no salvage value. The net cash flows after taxesassociated with each investment proposal are:
Deluxe Model Economy Model
Net cash flows after taxes 1—5 years 9,000 6,000
Solution:
1. Net Present Value Method:
Cash inflow after taxes Total Present Value
Year’s Deluxe Model Economy Model PV Factor Deluxe Model Economic ( ) ( ) 10% ( ) Model ( )
1 – 5 9,000 6,000 3.7907 34,116 22,744
Deduct initial cost 30,000 20,000
Net Present Value 4,116 2,744
Hence, the model that gives higher NPV should be chosen i.e. Deluxe Model.
Remark: Since capital outlay was higher for Deluxe Model it has given higher NPV.
2. Present Value Index:
Deluxe Model Economy Model
=34,11630,000 =
22,74420,000
= 1.1372 = 1.1372Since both give same PI Index, we are indifferent as to both the models.
3. IRR:Deluxe Model Economy Model
=30,0009,000 =
20,0006,000
= 3.33 years = 3.33 years
176 LOVELY PROFESSIONAL UNIVERSITY
Financial Management
Notes Decision: If the capital is adequate there are no constraints, the proposal that gives higher NPVshould be selected. In this case, the Deluxe Model.Illustration 3:The High Peaks Sporting Goods Stores have been plagued by numerous burglaries over the last3 years. To keep insurance premiums at reasonable level and protect 10,00,000 inventory, thestore fixed a night watchman. The watchman has solved the burglary problem, but he costs thefirm 12,000 a year.He is occasionally absent from work due to sickness or bad weather. A security system companyhas offered to sell the store system that would eliminate the need for the night watchman. Thesystem has an expected useful life of 15 years. The security system’s salesperson is computingthe cost of the system and will present a bid this week. The management estimates cost of capitalat 16%.Required:1. What is the maximum bid the store should accept?2. If the bid is 64,000 should the store accept?3. If the actual life of the security system is 12 years instead of 15, does it have any effect on
your answer in part (b)?Solution:In this case there are two alternatives:1. To employ watchman at a salary of 12,000 a year.2. To buy the system that has an expected life of 15 years.If one buys the system it will save 12,000 per year for 15 years i.e., at zero date it is equivalentto 12,000 × Cum Discount factor at 16% for 1 – 15 years = 12,000 × 5.575 = 66,900. Hence themaximum bid the store should accept is 66,900. Any offer less than 66,900 is acceptable henceif the bid is 64,000 the store should accept.If the actual life of the security system is 12 years, the saving is equivalent to 12,000 × Discountfactors at 16% 1 – 12 years = 12,000 × 5,197 = 62,364. Hence the maximum should be restrictedto 62.364 in this case. Therefore, the offer of 64,000 cannot be accepted in a situation where thelife of security is 12 years.Illustration 4:A company owns a machine, which is in current use. It was purchased at 1,60,000 and had aprojected life of 15 years with 10,000 salvage value. It has a depreciated straight line for 5 yearsto date and could be sold for 1,30,000.A new machine can be purchased at a total cost of 2,60,000 have a 10–year life salvage value of
10,000 and will be depreciated straight line. It is estimated that the new machine will reducelabour expenses of 15,000 per year and net working capital requirement of 20,000. Theincome tax rate applicable to the company is 40% and its required rate is 12% on investment.Determine whether the new machine should be purchased. The income statement of the firmusing the current machine for the current year is as follows:
Sales 20,00,000Labour 7,00,000Material 5,00,000Depreciation 2,00,000 14,00,000Earnings before Tax 6,00,000Taxation @ 40% 2,40,000Profit after tax 3,60,000
LOVELY PROFESSIONAL UNIVERSITY 177
Unit 9: Capital Budgeting
NotesAssume that if the sale proceeds of machine exceed the depreciated value, so much of the excessas does not exceed the difference between the costs and written down value, shall be subject toincome tax. Given cumulative present value factor 1–10 years at 12% 5.650 and present valuefactor year 10 at 12% 0.322.
Solution:
( (
Saving of labour expenses due to new machine 15,000
Less: Increase in depreciation on account of new machine
25,000
Depre. on account of existing machine 10,000 15,000
Net increase in profits 0
Add depreciation added back 15,000
Incremental cash inflow per year 15,000
Capital investment:
Cost of the new machine 2,60,000
Sale proceeds of old machine (–) 1,30,000
Tax on account of sale of old machine:
Sale proceeds 1,30,000
Depreciated value 160,000 – 5 × 10,000 1,10,000
40% tax 20,000 8,000
Reduction in Working Capital (–) 20,000 118,000
Inflow:
Saving from operations 1 - 10 years @ 15,000 × 5,650 84,750
Sale proceeds at 10th year 10,000 × 0.322 3,220
Reduction in working capital
restored at the end of the project 20,000 × 0.322 (–) 6,440 81,530
Net Present Value (–) 36,470
Since the net present value is negative, the new machine should not be purchased.
Illustration 5:
A company is setting up a project at a cost of 300 lakhs. It has to decide whether to locate theplant in a Forward Area (FA) or Backward Area (BA). Locating in Backward area means a cashsubsidy of 15 lakhs from the Central Govt. Besides, the taxable profits to the extent of 20% isexempt for 10 years. The project envisages a borrowing of 200 lakhs in either case.
The cost of borrowing will be 12% in Forward Area and 10% in Backward Area; costs are boundto be higher in Backward Area. However, the revenue costs are bound to be higher in Backward
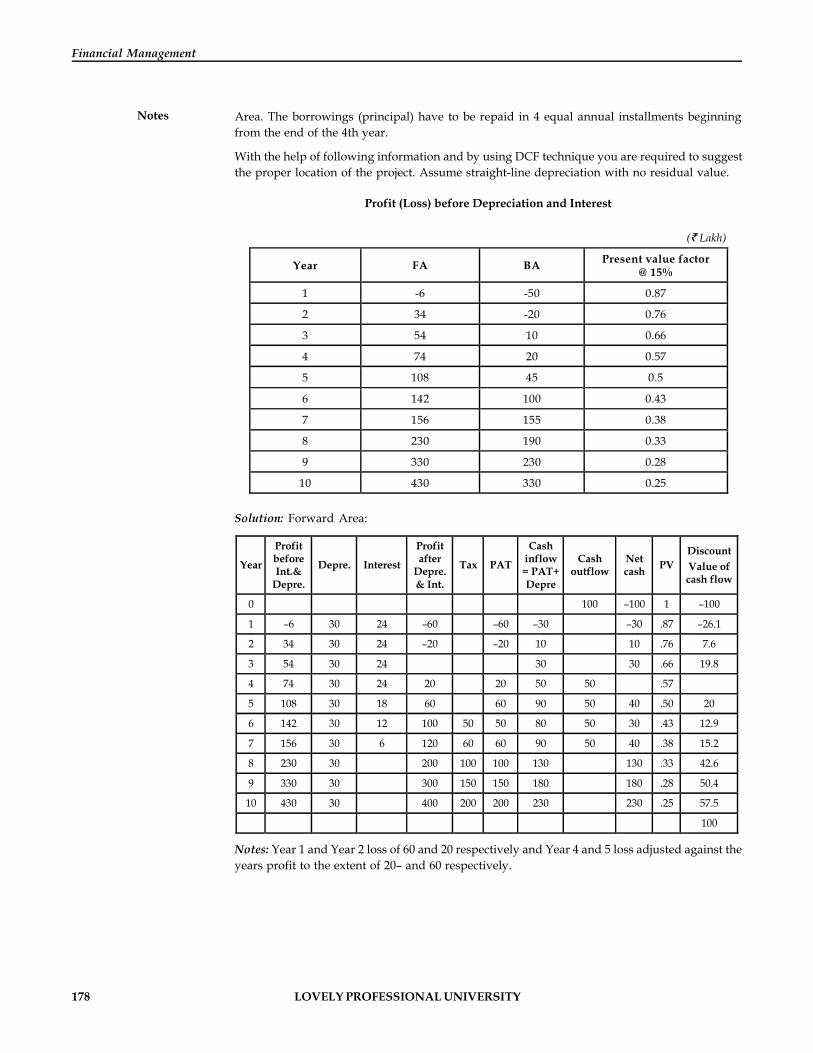
178 LOVELY PROFESSIONAL UNIVERSITY
Financial Management
Notes Area. The borrowings (principal) have to be repaid in 4 equal annual installments beginningfrom the end of the 4th year.
With the help of following information and by using DCF technique you are required to suggestthe proper location of the project. Assume straight-line depreciation with no residual value.
Profit (Loss) before Depreciation and Interest
( Lakh)
Year FA BA Present value factor @ 15%
1 -6 -50 0.87
2 34 -20 0.76
3 54 10 0.66
4 74 20 0.57
5 108 45 0.5
6 142 100 0.43
7 156 155 0.38
8 230 190 0.33
9 330 230 0.28
10 430 330 0.25
Solution: Forward Area:
Year
Profit before Int.&
Depre.
Depre. Interest
Profit after
Depre. & Int.
Tax PAT
Cash inflow = PAT+ Depre
Cash outflow
Net cash PV
Discount Value of cash flow
0 100 –100 1 –100
1 –6 30 24 –60 –60 –30 –30 .87 –26.1
2 34 30 24 –20 –20 10 10 .76 7.6
3 54 30 24 30 30 .66 19.8
4 74 30 24 20 20 50 50 .57
5 108 30 18 60 60 90 50 40 .50 20
6 142 30 12 100 50 50 80 50 30 .43 12.9
7 156 30 6 120 60 60 90 50 40 .38 15.2
8 230 30 200 100 100 130 130 .33 42.6
9 330 30 300 150 150 180 180 .28 50.4
10 430 30 400 200 200 230 230 .25 57.5
100
Notes: Year 1 and Year 2 loss of 60 and 20 respectively and Year 4 and 5 loss adjusted against theyears profit to the extent of 20– and 60 respectively.
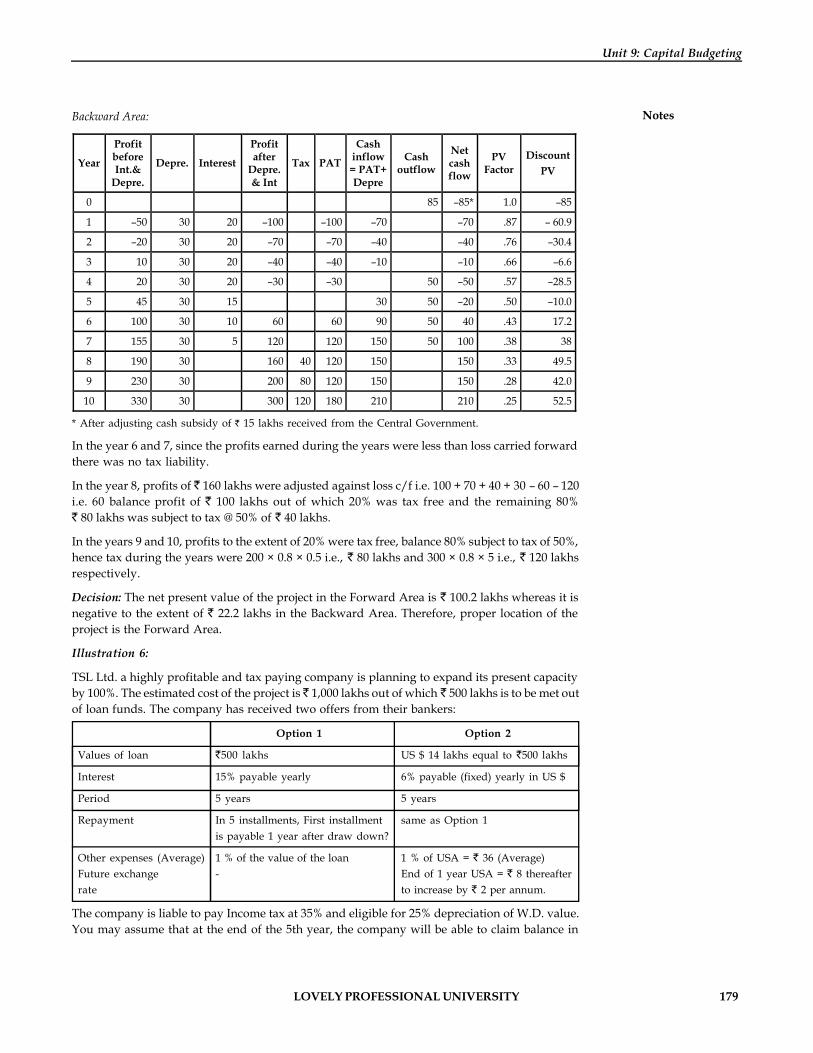
LOVELY PROFESSIONAL UNIVERSITY 179
Unit 9: Capital Budgeting
NotesBackward Area:
Year
Profit before Int.&
Depre.
Depre. Interest
Profit after
Depre. & Int
Tax PAT
Cash inflow = PAT+ Depre
Cash outflow
Net cash flow
PV Factor
Discount PV
0 85 –85* 1.0 –85
1 –50 30 20 –100 –100 –70 –70 .87 – 60.9
2 –20 30 20 –70 –70 –40 –40 .76 –30.4
3 10 30 20 –40 –40 –10 –10 .66 –6.6
4 20 30 20 –30 –30 50 –50 .57 –28.5
5 45 30 15 30 50 –20 .50 –10.0
6 100 30 10 60 60 90 50 40 .43 17.2
7 155 30 5 120 120 150 50 100 .38 38
8 190 30 160 40 120 150 150 .33 49.5
9 230 30 200 80 120 150 150 .28 42.0
10 330 30 300 120 180 210 210 .25 52.5
* After adjusting cash subsidy of 15 lakhs received from the Central Government.
In the year 6 and 7, since the profits earned during the years were less than loss carried forwardthere was no tax liability.
In the year 8, profits of 160 lakhs were adjusted against loss c/f i.e. 100 + 70 + 40 + 30 – 60 – 120i.e. 60 balance profit of 100 lakhs out of which 20% was tax free and the remaining 80%
80 lakhs was subject to tax @ 50% of 40 lakhs.
In the years 9 and 10, profits to the extent of 20% were tax free, balance 80% subject to tax of 50%,hence tax during the years were 200 × 0.8 × 0.5 i.e., 80 lakhs and 300 × 0.8 × 5 i.e., 120 lakhsrespectively.
Decision: The net present value of the project in the Forward Area is 100.2 lakhs whereas it isnegative to the extent of 22.2 lakhs in the Backward Area. Therefore, proper location of theproject is the Forward Area.
Illustration 6:
TSL Ltd. a highly profitable and tax paying company is planning to expand its present capacityby 100%. The estimated cost of the project is 1,000 lakhs out of which 500 lakhs is to be met outof loan funds. The company has received two offers from their bankers:
Option 1 Option 2
Values of loan 500 lakhs US $ 14 lakhs equal to 500 lakhs
Interest 15% payable yearly 6% payable (fixed) yearly in US $
Period 5 years 5 years
Repayment In 5 installments, First installment same as Option 1is payable 1 year after draw down?
Other expenses (Average) 1 % of the value of the loan 1 % of USA = 36 (Average)Future exchange - End of 1 year USA = 8 thereafterrate to increase by 2 per annum.
The company is liable to pay Income tax at 35% and eligible for 25% depreciation of W.D. value.You may assume that at the end of the 5th year, the company will be able to claim balance in
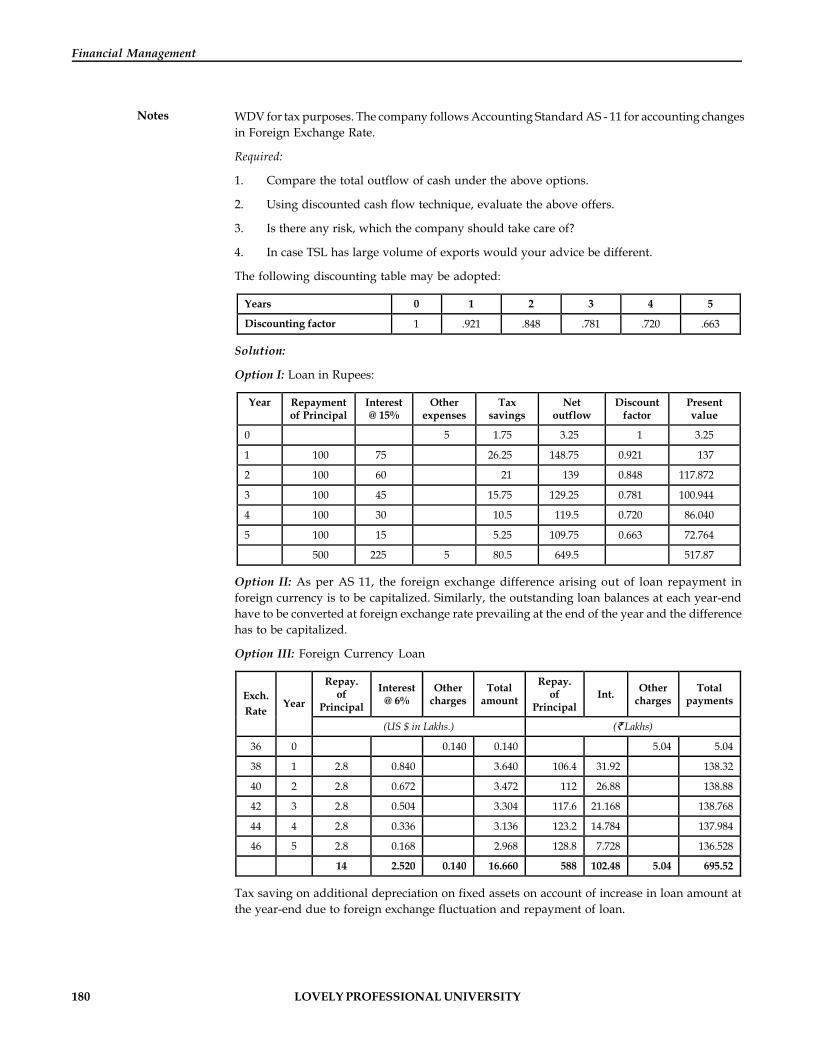
180 LOVELY PROFESSIONAL UNIVERSITY
Financial Management
Notes WDV for tax purposes. The company follows Accounting Standard AS - 11 for accounting changesin Foreign Exchange Rate.
Required:
1. Compare the total outflow of cash under the above options.
2. Using discounted cash flow technique, evaluate the above offers.
3. Is there any risk, which the company should take care of?
4. In case TSL has large volume of exports would your advice be different.
The following discounting table may be adopted:
Years 0 1 2 3 4 5
Discounting factor 1 .921 .848 .781 .720 .663
Solution:
Option I: Loan in Rupees:
Year Repayment of Principal
Interest @ 15%
Other expenses
Tax savings
Net outflow
Discount factor
Present value
0 5 1.75 3.25 1 3.25
1 100 75 26.25 148.75 0.921 137
2 100 60 21 139 0.848 117.872
3 100 45 15.75 129.25 0.781 100.944
4 100 30 10.5 119.5 0.720 86.040
5 100 15 5.25 109.75 0.663 72.764
500 225 5 80.5 649.5 517.87
Option II: As per AS 11, the foreign exchange difference arising out of loan repayment inforeign currency is to be capitalized. Similarly, the outstanding loan balances at each year-endhave to be converted at foreign exchange rate prevailing at the end of the year and the differencehas to be capitalized.
Option III: Foreign Currency Loan
Repay. of
Principal
Interest @ 6%
Other charges
Total amount
Repay. of
Principal Int. Other
charges Total
payments Exch. Rate
Year
(US $ in Lakhs.) ( Lakhs)
36 0 0.140 0.140 5.04 5.04
38 1 2.8 0.840 3.640 106.4 31.92 138.32
40 2 2.8 0.672 3.472 112 26.88 138.88
42 3 2.8 0.504 3.304 117.6 21.168 138.768
44 4 2.8 0.336 3.136 123.2 14.784 137.984
46 5 2.8 0.168 2.968 128.8 7.728 136.528
14 2.520 0.140 16.660 588 102.48 5.04 695.52
Tax saving on additional depreciation on fixed assets on account of increase in loan amount atthe year-end due to foreign exchange fluctuation and repayment of loan.

LOVELY PROFESSIONAL UNIVERSITY 181
Unit 9: Capital Budgeting
Notes
Year
Loan amount
o/s in US $ Lakhs
Increase in loan due to
foreign exchange
fluctuations.
Opening WDV on addition
TOTAL Depreciation
25% on additions (5)
Tax savings
on additions
@ 35%
Closing WDV on
additions.
(1) (2) (3) (4) (5 =3 + 4) 25% on (6) (7) (8 = 5-6)
1 14 32 32 8 2.8 24
2 11.2 22.4 24 46.4 11.6 4.06 34.8
3 8.4 16.8 34.8 51.6 12.9 4.515 38.7
4 5.6 11.2 38.7 49.9 12.475 4.366 37.425
5 2.8 5.6 37.425 43.025 43.025* 15.059
* Assumed that full benefit will be claimed for tax purposes.
Year
Amt of interest
and other charges
Tax saving of Int.
and other
charges
Tax savings on Addl.
Depreciation
Total payments
Net cash outflow
Discount factor
Present value
0 5.040 1.764 5.04 3.276 1 3.276
1 31.92 11.172 2.8 138.32 124.348 .921 114.525
2 26.88 9.408 4.06 138.88 125.412 .848 106.349
3 21.168 7.408 4.515 138.768 126.845 .781 99.066
4 14.784 5.174 4.366 137.984 128.444 .720 92.480
5 7.728 2.704 15.059 136.528 118.765 .663 78.741
37.630 30.800 695.52 727.090 494.437
1. The absolute and discounted value of Option II seems to be better than Option I. However,the company has to be careful about future exchange rate, since the indicated rates aremore by rule of a thumb rather than based on any specific approach. The company shouldcover possible foreign exchange fluctuations in future and then work out the value.
2. In case the company has good volume of exports, then it may help the company to help infuture payments. In that case, the company may take a lenient view of covering foreignexchange risk.
Illustration 7:
S Engineering Company is considering replacing or repairing a particular machine, which hasjust broken down. Last year, this machine costed 20,000 to run and maintain. These costs havebeen increasing in real terms in recent years with the age of the machine. A further useful life of5 years is expected, if immediate repairs of 19,000 are carried out. If the machine is not repairedit can be sold immediately to realize actual 5,000 (ignore loss/gain on such disposal).
Alternatively, the company can buy a new machine for 49,000 with an expected life of 10 yearswith no salvage value after providing depreciation on straight-line basis. In this case, runningand maintenance costs will reduce to 14,000 each year and are not expected to increase much inreal terms for a few years at least.
S Engineering Company regards an annual return of 10% p.a. after tax as a minimum requirementon any new investment. Considering the Capital Budgeting technique, which alternative willyou choose? Take corporate tax rate of 50% and assume that depreciation on straight-line basiswill be accepted for tax purposes also.

182 LOVELY PROFESSIONAL UNIVERSITY
Financial Management
Notes Given cumulative present value of Re. 1 p.a. @ 10% for 5 years 3,791 and for 10 years 6,145
Solution:
Repairing existing machine 9,500
Cost of repairs is 19,000 net of tax
Equivalent annual cost for 5 years 9,500 ÷ 3.791 = 2506
Annual Running & Maint. cost for 10 years 10000
20,000 net of tax
Total annual cost 12506
Buying new machinery
Purchase cost 49000
Less: realization from old machine 5000
Annual equivalent cost for 10 years 44000/6145 7160
Running & Maint. cost per machine 14000/net of tax 7000
Tax benefit of depreciation p.a. 49000/10/× 50 (2450)
Total annual cost 11710
Difference in annual cost in buying 796
Since annual cost of buying is less than that of repairing, one should go for buying option.
Second solution:
1. To repair existing machine.
Cost of repair immediately net of tax. ( 19,000 × 50%) 9,500
Running & Maint. Cost of 5 years ( 20,000 × 3.791) 37,910
Total net present value of after tax cash outflows for 5 years. 47,410
Hence net equivalent cash outflows p.a. 47,410/3.791 12,506
2. To buy new machine
Purchase cost of new machine 49,000
Less: Sale proceeds of old machine 5,000 44,000
Tax benefit on depreciation p.a. ( 49000/10×50%) (2,450)
Running & Maint. Cost p.a. (50% of 14000) 7,000
Net cash outflow for 10 years ( 4550×6.145) 4,550 27,960
Net cash outflows for 10 years. 71,960
Hence net equivalent cash outflows p.a. 71,960/6.145 11,710
Since, net equivalent cash outflow p.a. for buying a new machine 11,710 is less than netequivalent outflows of 12,506 for repairing of an existing machine. Therefore, it is advisablethat the company should go for buying a new machine.
LOVELY PROFESSIONAL UNIVERSITY 183
Unit 9: Capital Budgeting
Notes
!Caution Project with Unequal Lives: Where one is considering more than one project(mutually exclusive projects) with different project lives, one should consider the equivalentannual value method. Under this method, work out the following:
1. The total net present value of after tax cash flows of each project during the projectlife.
2. Divide the NAV of cash flows by the annual factor corresponding to the life of theproject at the given cost of capital, the result and figure in the equivalent annual netpresent value. (EANPV).
The decision criteria, in the case of revenue expanding proposal, is the maximization ofEANPV and minimization of equivalent annual cost of in the case of cost reductionproposal. This is illustrated in example above.
Task A machine purchased 6 years ago for 1,50,000 has been depreciated to a bookvalue of 90,000. It originally had a projected life of 15 years and zero salvage value. Anew machine will cost 2,50,000 and result in a reduced operating cost of 30,000 per yearfor the next 9 years. The older machine could be sold for 50,000. The cost of capital is 10%.The new machine will be depreciated on a straight-line basis over 9 years life with 25,000salvage value. The company’s tax rate is 50%; determine whether the old machine shouldbe replaced.
Self AssessmentFill in the blanks:
10. The net cash outlay is the different amount of money that will be spent when the investmentis made in year…………....
11. The cost of capital is an important element as basic input information in …………….decisions
9.6 Capital Decision under Risk and Uncertainty
In discussing the capital budgeting techniques, we have so far assumed that the proposedinvestment projects do not involve any risk. The assumption was made simply to facilitate theunderstanding of the capital budgeting techniques. In real life situations, the firm in general andits investment projects in particular are exposed to different degrees of risk. What is risk andhow can risk be incorporated and measured in investment decisions in real world situation.
Nature of Risk
In the context of capital budgeting, the term, risk, refers to the chance that a project will proveunacceptable – that is NPV < 0 or IRR < cost of capital. More formally, risk in capital budgetingis the degree of variability of cash flows. Projects with a small chance of acceptability and abroad range of expected cash flows are more risky than projects that have a high chance ofacceptability and a narrow range of expected cash flows.
In the capital budgeting projects, risk stems almost entirely from cash inflows, because theinitial investment i.e., cash outflow is generally known with relative certainty. These inflowsderive from a number of variables related to revenues expenditures and taxes.
184 LOVELY PROFESSIONAL UNIVERSITY
Financial Management
NotesExample: The level of sales, the cost of raw materials, labour rates, utility costs and tax
rates.
Risk is associated with the variability of future returns of a project. The greater the variability ofthe expected returns, the riskier the project. Risk can however be measured more precisely. Themost common measures of risk – standard deviation and co-efficient of variations – are discussedlater, in this unit.
Notes Risk Analysis in Practice in India
Most companies in India account for risk while evaluating their capital expendituredecisions. The following factors are considered to influence the riskiness of investmentprojects:
Price of raw material and other inputs
Price of product
Product demand
Government policies
Technological changes
Project life
Inflation
Out of these factors, four factors thought to be contributing most to the projectriskiness one selling price – product demand, technical changes and govt. policies.
The most commonly used methods of risk analysis in practice are: sensitivity analysis,conservative forecasts include using short payback or higher discount rate fordiscounting cash flows.
Except a very few companies, most companies do not use the statistical and othersophisticated techniques for analyzing risk in investment decisions.
Self AssessmentFill in the blanks
12. In the context of capital budgeting, the term………., refers to the chance that a project willprove unacceptable.
13. Risk is associated with the …………….of future returns of a project.
9.7 Conventional Techniques to Handle RiskThe following are conventional techniques to handle risk in capital budgeting:
Payback
Risk adjusted discount rate
Certainty equivalent
These methods are simple, familiar and partially defensible on theoretical grounds.
LOVELY PROFESSIONAL UNIVERSITY 185
Unit 9: Capital Budgeting
Notes9.7.1 PaybackPayback is one of the oldest and commonly used methods for explicitly recognizing risk associatedwith an investment project. Business firms using this method usually prefer short payback tolonger one and often establish policies that a firm should accept guidelines with some maximumpayback period say three to five years. Apart from simplicity, payback makes an allowance forrisk by:
1. Focusing attention on the near term future and thereby emphasizing liquidity throughearly recovery of capital and
2. By favouring short-term projects over long-term riskier projects.
9.7.2 Risk Adjusted Discount Rate Approach (RAD)Under this method, the amount of risk inherent in a project is incorporated in the discount rateemployed in the present value calculations. The relatively risky projects (e.g. project involvingintroduction of new product into the untried market) would have relatively high discount ratesand relatively safe projects would have relatively low discount rates. The rationale for usingdifferent risk adjusted rates for different projects is as follows. The rate of discount or the cost ofcapital is the minimum acceptable rate of return which the investors demand in providingcapital to the firm for that type of investment since such rate is applicable elsewhere in theeconomy on assets of similar risk. If the project earns less than the rates earned in the economyfor that risk, the shareholders will earn less and the value of the company’s shares will fall. Awell accepted economic premise is that the required rate of return should increase with increasein risks. Hence, the greater the risk, the greater should be the discount rate and vice versa.
The risk-adjusted rate can be used with both the NPV and IRR methods of evaluation of capitalexpenditure. If NPV were positive, the proposal would qualify for acceptance. In case of the IRR, asa decision criterion, the internal rate of return would be compared with the risk adjusted requiredrate of return and if the former exceeds the latter, the proposal would be accepted, otherwise not.
The risk in connection with future projections has two dimensions. First as already mentioned,riskiness of the projects at a particular point of time became of the nature of proposals, e.g.,expansion of new products. Second, the risk may be different in the case of the same project overtime e.g., risk at the end of Second year may be more than that at the end of first year.
Advantage
1. This method is simple to calculate and easy to understand, since companies in actualpractice apply different standards of discount for different projects.
Disadvantages and Difficulties
1. Difficulty encountered is how to express a higher risk in terms of higher discount rates. Itis doubtful if the exercise would give objective results.
2. It does not make direct use of the information available from the probability distributionof expected future cash. Conceptually, this approach adjusts the wrong element. It is thefuture cash flow of a project, which is subject to risk and hence should be adjusted and notthe required rate of return.
3. The process of adding the risk premium to the discount rate leads to compounding of riskover time. In other words, this method implies increase of risk with time and thereforeproposal in which risk does not necessarily increase with the time may not be properlyevaluated by this method.
186 LOVELY PROFESSIONAL UNIVERSITY
Financial Management
Notes In brief, this method can at best be considered as a crude method of incorporating risk into thecapital budgeting analysis.
Example: Let us determine the risk adjusted net present value of the following:
A B C Net cash outlays ( ) 1,00,000 1,20,000 2,10,000 Project life 5 years 5 years 5 years Annual cash inflow ( ) 30,000 42,000 70,000 Co-efficient of variation 0.4 0.8 1.2
The company selects the risk-adjusted rate of discount on the basis of coefficient of variation:
Coefficient of variation Risk adjusted rate of discount PV factor 1 to 5 years at risk adjusted rate of discount
0.00 10% 3.791 0.40 12% 3.605 0.8 14% 3.433 1.2 16% 3.274 1.6 18% 3.127 2.0 22% 2.864
More than 2.0 25% 2.689
Solution:
Project Net cash outflow
Coefficient of
variation
Market discount
rate
Annual cash
inflow
PV Factor (1-5 years) at market discount
Rate
Discounted cash inflow
NPV
A 1,00,000 0.4 12% 30,000 3,605 1,08,150 8,150
B 1,20,000 0.8 14% 42,000 3,433 1,44,186 24,186
C 2,10,000 1.2 16% 70,000 3,274 2,29,180 19,180
9.7.3 Certainty Equivalent Approach
Under this method, risk element is compensated by adjusting cash inflows rather than adjustingthe discount rate. The risk adjustment factor is expressed in terms of certainty – equivalentcoefficient i.e. the relationship between certain (riskless) cash flows and risky (uncertain) cashflows. The certainty equivalent coefficient can assume a value between 0 and 1 and is inverselyrelated with risk. If risk is more, certainty is less and certainty coefficient small and vice-versa.The coefficients can be determined by subjective or objective assessments of cash flows that willrise certainly and cash flows that are likely to occur.
The second step under this approach after conversion of expected cash flows into certaintyequivalents, is to calculate their present values based on the risk-free rate of discount (whichappropriately reflects the time value of money). Finally, it has to be decided whether the projectwould be accepted or not, based on either NPV or the IRR method.
Advantages
1. It is simple to calculate.2. It incorporates risk by modifying the cash flows, which are subject to risk.Conceptually, it is superior to the time adjusted discount rate approach.
LOVELY PROFESSIONAL UNIVERSITY 187
Unit 9: Capital Budgeting
NotesWeakness and Difficulties
1. Being a subjective estimate it cannot be objective, precise and consistent, hence conclusionsbased on such estimates are open to question.
2. It does not directly use the probability distribution of possible cash flows.
3. It cannot be consistently applied to various projects and over time.
Example:
Cash outflows 1,50,000
Cash inflows Year 1 70,000
Year 2 90,000
Year 3 60,000
Riskless rate of return 9%
Risk adjusted rate of return for the current project 20%
Certainty equivalent coefficients for future cash inflows:
Year 1 0.90
Year 2 0.80
Year 3 0.65
Solution:
NPV based on risk-adjusted rate of discount
= – 150,000 + 2 370,000 90000 60000
1.20 (1.20) (1.20)+ +
= – 150,000 + 58,333 + 62500 + 41667 = –150000 + 162500= 12500, positive; hence project should be accepted
NPV based on certainty equivalent coefficient:
= – 150,000 + 2 370,000 × 0.90 90000 × 0.80 60000 × 0.65
1.09 (1.09) (1.09)+ +
= – 150000 + 57798 + 60601 + 30115= – 150000 + 148514 = – 1486= Negative; hence project should not be accepted.
Hence from the above illustration, it is clear that both the above methods may not yield identicalresults.
9.7.4 Probability Distribution ApproachThe probability distribution of cash flows over different periods provides valuable informationabout expected value of return and the dispersion of probability distribution of possible returns.On this basis, an accept-reject decision can be taken.
The application of probability distribution approach in analysing risk in capital budgetingdepends upon the behaviour of the cash flows whether the cash flows are (a) independent or
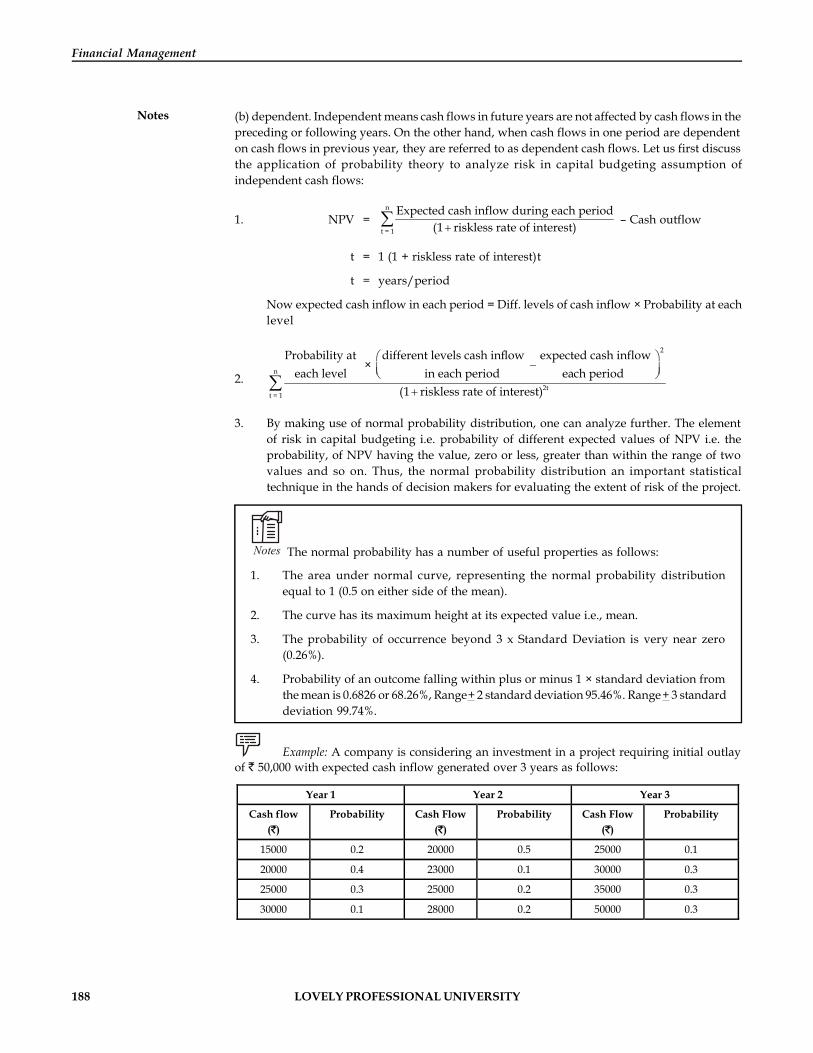
188 LOVELY PROFESSIONAL UNIVERSITY
Financial Management
Notes (b) dependent. Independent means cash flows in future years are not affected by cash flows in thepreceding or following years. On the other hand, when cash flows in one period are dependenton cash flows in previous year, they are referred to as dependent cash flows. Let us first discussthe application of probability theory to analyze risk in capital budgeting assumption ofindependent cash flows:
1. NPV =n
t = 1
Expected cash inflow during each period(1 riskless rate of interest)+
å – Cash outflow
t = 1 (1 + riskless rate of interest)t
t = years/period
Now expected cash inflow in each period = Diff. levels of cash inflow × Probability at eachlevel
2.
2
n
2tt = 1
Probability at different levels cash inflow expected cash inflow ×
each level in each period each period(1 riskless rate of interest)
æ ö-ç ÷è ø
+å
3. By making use of normal probability distribution, one can analyze further. The elementof risk in capital budgeting i.e. probability of different expected values of NPV i.e. theprobability, of NPV having the value, zero or less, greater than within the range of twovalues and so on. Thus, the normal probability distribution an important statisticaltechnique in the hands of decision makers for evaluating the extent of risk of the project.
Notes The normal probability has a number of useful properties as follows:
1. The area under normal curve, representing the normal probability distributionequal to 1 (0.5 on either side of the mean).
2. The curve has its maximum height at its expected value i.e., mean.
3. The probability of occurrence beyond 3 x Standard Deviation is very near zero(0.26%).
4. Probability of an outcome falling within plus or minus 1 × standard deviation fromthe mean is 0.6826 or 68.26%, Range + 2 standard deviation 95.46%. Range + 3 standarddeviation 99.74%.
Example: A company is considering an investment in a project requiring initial outlayof 50,000 with expected cash inflow generated over 3 years as follows:
Year 1 Year 2 Year 3
Cash flow ( )
Probability Cash Flow ( )
Probability Cash Flow ( )
Probability
15000 0.2 20000 0.5 25000 0.1
20000 0.4 23000 0.1 30000 0.3
25000 0.3 25000 0.2 35000 0.3
30000 0.1 28000 0.2 50000 0.3
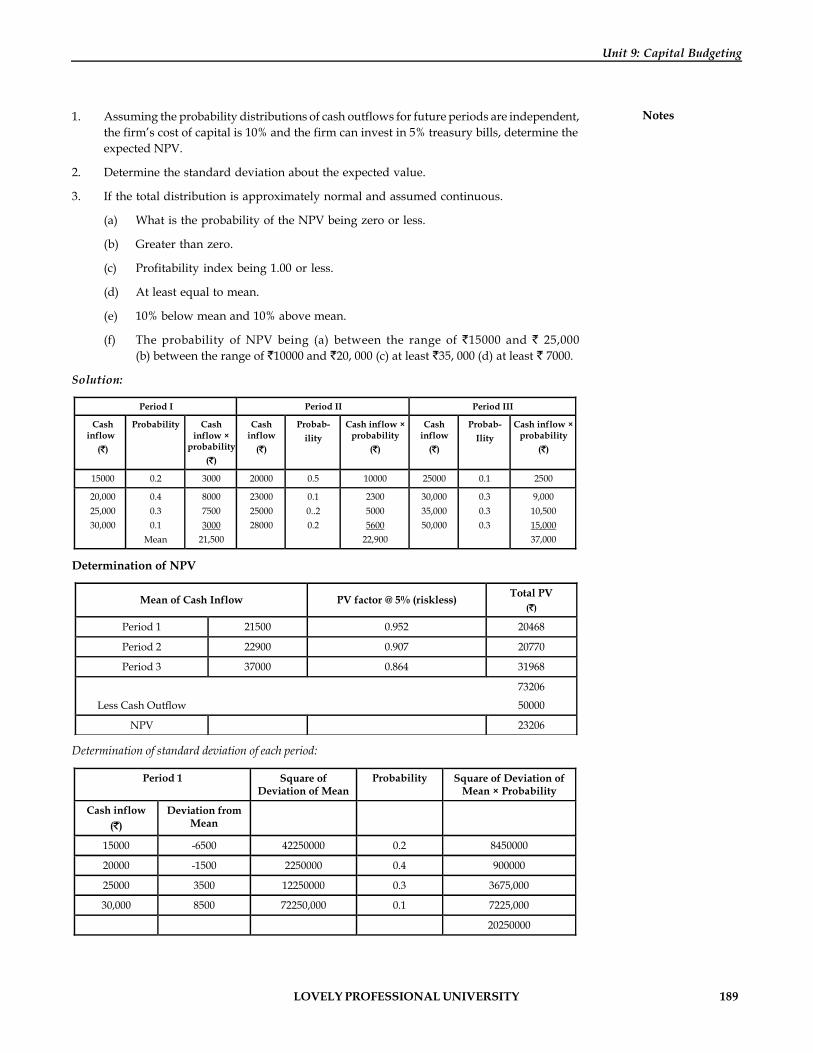
LOVELY PROFESSIONAL UNIVERSITY 189
Unit 9: Capital Budgeting
Notes1. Assuming the probability distributions of cash outflows for future periods are independent,the firm’s cost of capital is 10% and the firm can invest in 5% treasury bills, determine theexpected NPV.
2. Determine the standard deviation about the expected value.
3. If the total distribution is approximately normal and assumed continuous.
(a) What is the probability of the NPV being zero or less.
(b) Greater than zero.
(c) Profitability index being 1.00 or less.
(d) At least equal to mean.
(e) 10% below mean and 10% above mean.
(f) The probability of NPV being (a) between the range of 15000 and 25,000(b) between the range of 10000 and 20, 000 (c) at least 35, 000 (d) at least 7000.
Solution:
Period I Period II Period III
Cash inflow
( )
Probability Cash inflow ×
probability ( )
Cash inflow
( )
Probab- ility
Cash inflow × probability
( )
Cash inflow
( )
Probab- Ility
Cash inflow × probability
( )
15000 0.2 3000 20000 0.5 10000 25000 0.1 2500
20,000 25,000 30,000
0.4 0.3 0.1
Mean
8000 7500 3000
21,500
23000 25000 28000
0.1 0..2 0.2
2300 5000 5600
22,900
30,000 35,000 50,000
0.3 0.3 0.3
9,000 10,500 15,000 37,000
Determination of NPV
Mean of Cash Inflow PV factor @ 5% (riskless) Total PV ( )
Period 1 21500 0.952 20468
Period 2 22900 0.907 20770
Period 3 37000 0.864 31968
73206
Less Cash Outflow 50000
NPV 23206
Determination of standard deviation of each period:
Period 1 Square of Deviation of Mean
Probability Square of Deviation of Mean × Probability
Cash inflow ( )
Deviation from Mean
15000 -6500 42250000 0.2 8450000
20000 -1500 2250000 0.4 900000
25000 3500 12250000 0.3 3675,000
30,000 8500 72250,000 0.1 7225,000
20250000
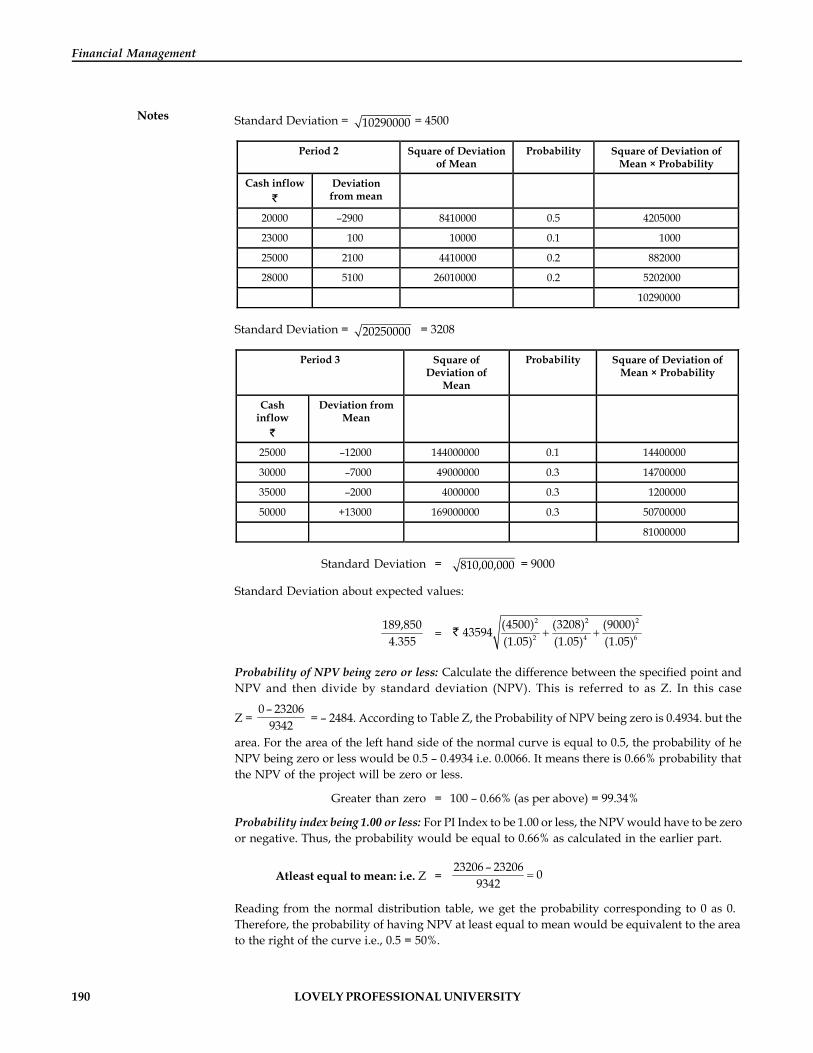
190 LOVELY PROFESSIONAL UNIVERSITY
Financial Management
Notes Standard Deviation = 10290000 = 4500
Period 2 Square of Deviation of Mean
Probability Square of Deviation of Mean × Probability
Cash inflow Deviation from mean
20000 –2900 8410000 0.5 4205000
23000 100 10000 0.1 1000
25000 2100 4410000 0.2 882000
28000 5100 26010000 0.2 5202000
10290000
Standard Deviation = 20250000 = 3208
Period 3 Square of Deviation of
Mean
Probability Square of Deviation of Mean × Probability
Cash inflow
Deviation from Mean
25000 –12000 144000000 0.1 14400000
30000 –7000 49000000 0.3 14700000
35000 –2000 4000000 0.3 1200000
50000 +13000 169000000 0.3 50700000
81000000
Standard Deviation = 810,00,000 = 9000
Standard Deviation about expected values:
189,8504.355 =
2 2 2
2 4 6
(4500) (3208) (9000) 43594(1.05) (1.05) (1.05)
Probability of NPV being zero or less: Calculate the difference between the specified point andNPV and then divide by standard deviation (NPV). This is referred to as Z. In this case
Z = 0 – 23206
9342 = – 2484. According to Table Z, the Probability of NPV being zero is 0.4934. but the
area. For the area of the left hand side of the normal curve is equal to 0.5, the probability of heNPV being zero or less would be 0.5 – 0.4934 i.e. 0.0066. It means there is 0.66% probability thatthe NPV of the project will be zero or less.
Greater than zero = 100 – 0.66% (as per above) = 99.34%
Probability index being 1.00 or less: For PI Index to be 1.00 or less, the NPV would have to be zeroor negative. Thus, the probability would be equal to 0.66% as calculated in the earlier part.
Atleast equal to mean: i.e. Z =23206 – 23206 0
9342
Reading from the normal distribution table, we get the probability corresponding to 0 as 0.Therefore, the probability of having NPV at least equal to mean would be equivalent to the areato the right of the curve i.e., 0.5 = 50%.

LOVELY PROFESSIONAL UNIVERSITY 191
Unit 9: Capital Budgeting
Notes10% below mean, and 10% above mean:
Z =20,885 – 23206 –0.248
9342
According to Table Z, the probability comes to 0.0979 i.e., 9.79% similarly for 10% above meanit comes to 9.79%.
Between the Range of 15000 and 25000
Cumulative Probability Distribution
1
15000 23206 25000Outcomes
Z1 =15000 – 23206 – 0.878
9342
Z2 =25000 – 23206 – 0.192
9342
According to Table Z, the probability corresponding to the respective values of Z1 and Z2 are0.3100 and 0.0761. Summing up the values we have 0.3861 i.e., 38.61%.
Between the Range of 10000 and 20000
Cumulative Probability Distribution
10000 20000 23206Outcomes

192 LOVELY PROFESSIONAL UNIVERSITY
Financial Management
NotesZ1 =
10000 – 23206 – 1.4149342
=
Z2 =20000 – 23206 – 0.343
9342=
According to Table Z, the probability corresponding to these values of Z is 0.4213 and 0.1341.Since both are on the left side of the normal curve, the probability of having its value between
10,000 and 20,000 would be the difference i.e. 0.4213 – 0.1341 = 0.2872 i.e., 28.72%.
At least 35,000 Z =35000 – 23206 1.262
9342=
According to table Z, the probability of having the NPV values 35,000 is 0.3965. The probabilityof having NPV 35,000 or more would be 0.5 – 0.3965 = 0.1035 or 10.35%.
At least 7000 in this case Z =7000 – 23206 – 1.735
9342=
According to Table Z, the probability of having the NPV value of 7000 is 0.4586. The probabilityof NPV at least equal to 7000 would be more by 0.50 (area to the right side of the mean) i.e.0.9586 or 95.86%.
Outcomes
Cumulative Probability Distribution
1700 23206 350000
Outcomes
9.7.5 Decision–Trees Approach (DT)DT is another useful alternatives for evaluating risky investment proposals. Under this method,every possible outcome is weighed in probabilistic terms and then evaluated. This approach isespecially useful for situations in which decisions at one point in time also affect the decisions ofthe firm at some later date. Another useful application of this approach is for such projects,which require decisions to be made in sequential parts.
A decision tree approach as the name suggests, is a pictorial representation in tree form alongwith branches of the magnitude, probability and inter relationship of all possible outcomes. Asa matter of convention the decision point is denoted by the symbol and the evens are denoted by0. The key steps in decision tree analysis are:
1. Identification of the problem and alternatives
2. Delineation of the decision tree
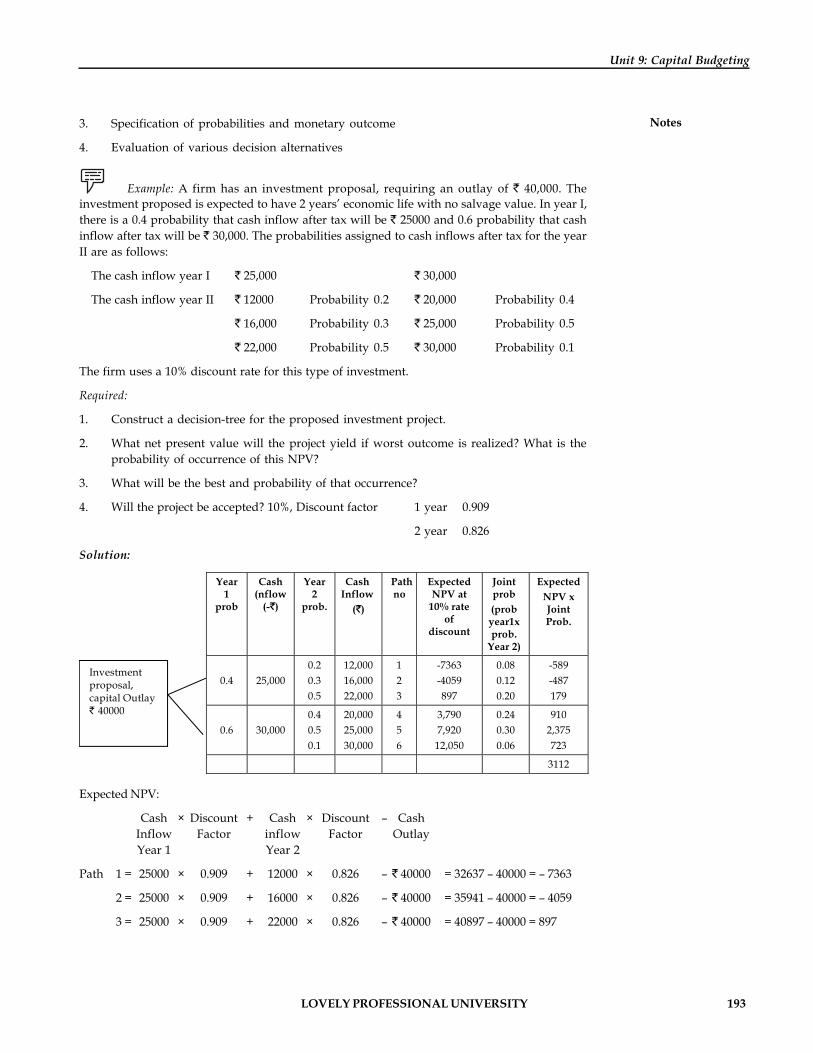
LOVELY PROFESSIONAL UNIVERSITY 193
Unit 9: Capital Budgeting
Notes3. Specification of probabilities and monetary outcome
4. Evaluation of various decision alternatives
Example: A firm has an investment proposal, requiring an outlay of 40,000. Theinvestment proposed is expected to have 2 years’ economic life with no salvage value. In year I,there is a 0.4 probability that cash inflow after tax will be 25000 and 0.6 probability that cashinflow after tax will be 30,000. The probabilities assigned to cash inflows after tax for the yearII are as follows:
The cash inflow year I 25,000 30,000
The cash inflow year II 12000 Probability 0.2 20,000 Probability 0.4
16,000 Probability 0.3 25,000 Probability 0.5
22,000 Probability 0.5 30,000 Probability 0.1
The firm uses a 10% discount rate for this type of investment.
Required:
1. Construct a decision-tree for the proposed investment project.
2. What net present value will the project yield if worst outcome is realized? What is theprobability of occurrence of this NPV?
3. What will be the best and probability of that occurrence?
4. Will the project be accepted? 10%, Discount factor 1 year 0.909
2 year 0.826
Solution:
Year1
prob
Cash (nflow
(- )
Year2
prob.
Cash Inflow
( )
Path no
Expected NPV at
10% rate of
discount
Joint prob (prob year1x prob.
Year 2)
Expected NPV x Joint Prob.
0.4
25,000
0.2 0.3 0.5
12,000 16,000 22,000
1 2 3
-7363 -4059 897
0.08 0.12 0.20
-589 -487 179
0.6
30,000
0.4 0.5 0.1
20,000 25,000 30,000
4 5 6
3,790 7,920
12,050
0.24 0.30 0.06
910 2,375 723
3112
Investment proposal, capital Outlay
40000
Expected NPV:
Cash × Discount + Cash × Discount – CashInflow Factor inflow Factor OutlayYear 1 Year 2
Path 1 = 25000 × 0.909 + 12000 × 0.826 – 40000 = 32637 – 40000 = – 7363
2 = 25000 × 0.909 + 16000 × 0.826 – 40000 = 35941 – 40000 = – 4059
3 = 25000 × 0.909 + 22000 × 0.826 – 40000 = 40897 – 40000 = 897
194 LOVELY PROFESSIONAL UNIVERSITY
Financial Management
Notes 4 = 30000 × 0.909 + 20000 × 0.826 – 40000 = 43790 – 40000 = + 3790
5 = 30000 × 0.909 + 25000 × 0.826 – 40000 = 47920 – 40000 = 7920
6 = 30000 × 0.909 + 30000 × 0.826 – 40000 = 52050 – 40000 = 12050
The last column shows the expected NPV, which is obtained by summing up the product of NPVand corresponding joint probability. The term of these weighted NPV is positive and therefore,the project would be accepted.
This DT approach has the advantage of exhibiting in a bird’s eye view of all the possibilitiesassociated with the proposed project. Management also becomes aware well in advance of theadverse possibilities when NPV is negative. The conditional nature of cash inflow associatedwith the project is clearly shown. The main limitation of the method is that decision format maybecome itself complex and difficult to understand and construct if the number of years of theexpected life of the project and the number of possible outcomes for each year are of large. Forinstance, if we have 3-year project, there will be 27 paths (i.e. 33) and 59,049 (31") paths if theproject life is 10 years, assuming only three possible outcomes.
9.7.6 Applied Utility TheoryIf the risk factor of the top management (i.e. the group that makes decisions regarding investment)can be translated into a utility curve, the risk factor can be incorporated in the final decision ina fairly simple and consistent manner.
Did u know? A utility function describes a person’s risk attitude.
The utility function shows the utilities (an arbitrary measure of satisfaction) associated withdifferent monetary outcomes. Normally, utilities are shown as the vertical axis and monetaryreturns are shown on the horizontal axis. A person’s utility function can be obtained as follows:
1. Find the monetary incomes that a person considers as relevant. The end may be designatedas A and B.
2. Assign utility of 0 to A (the lowest outcome) and utility of 1 to B (the highest outcome).
3. Determine the utility associated with any intermediate value by the following process:
(a) Present the individual with two alternatives. The first alternative of the intermediatevalue X, the utility of which is to be determined, second alternative consists of alottery which has two possible outcome A and B with probabilities P1 and P2 attachedto them (P1 + P2 = 1). Ask the individual to choose one of the alternatives.
(b) If the individual chooses the first alternative, revise the second alternative makes itmore attractive i.e., the value of P2 should be increased. If the individual chooses thesecond alternative, raise the same to less attractive i.e., value of P2 should be decreasedand the value of P2 should be increased.
(c) Continue the revision process laid down in (b), till the individual indifferent to bothalternatives.
(d) When the individual becomes indifferent to both alternatives, the utility of A issimply the value of P2.
4. Obtain the utility values of several intermediate outcomes and plot the utility function.
LOVELY PROFESSIONAL UNIVERSITY 195
Unit 9: Capital Budgeting
NotesOnce the utility curve of the decision-making unit is obtained, the expected utility project ismeasured as follows:
1. Define the probability distribution of NPV.
2. Calculate the expected utility by using utility function.
u (NPVi) Pi
where u(NPVi) = utility of the ith positive NPV
PI= Probability of ith possible outcome
Example: Let the probability distribution of NPV for a project be as follows:
NPV –10,000 0 20,000 30,000
Probability 0.1 0.3 0.4 0.2
Let the utility for money for the decision maker be as follows:
Money ( ) Utility – 20,000 0 – 10,000 0.10 0 0.35 + 10,000 0.50 + 20,000 0.68 + 30,000 0.85 + 40,000 0.90 + 50,000 1.00
Hence the expected utility of the project is:
= 0.10 × 0.1 + 0.35 × 0.3 + 0.68 × 0.4 + 0.85 × 0.2
= .01 + 0.105 + 0.272 + 0.17 = 0.557
Evaluation: This method is superior to other methods of risk adjustments since it offers anapproach for incorporating the risk factor consistently. However, the following are the problems:
1. It is difficult to obtain the utility functions of an individual i.e., translating the risk attitudeof an executive requires patience and ingenuity on the part of the analyst.
2. Utility function of the decision-maker may not remain stable over time, since it is dependenton the organization financial position.
3. There is no acceptable way of determining the utility function of a group. (Since investmentdecisions are group decisions)
Hence, utility theory is not very useful for investment decisions where the cost and benefits arespread over long period. It is, however, a potential tool for short-term investment.
Self AssessmentFill in the blanks:
14. Business firms using Payback method usually prefer ……………..payback.
15. Under Certainty equivalent approach method, risk element is compensated by adjustingcash inflows rather than adjusting the………………...
16. A ………………..approach is a pictorial representation in tree form along with branches ofthe magnitude, probability and inter relationship of all possible outcomes.

196 LOVELY PROFESSIONAL UNIVERSITY
Financial Management
Notes 9.8 Statistical Techniques to Handle RiskThe estimates of cash inflows and outflows may be termed as probability estimates i.e., theyrepresent only likely happenings.
The uncertainty about future leads to variations in returns. Risk is perceived to be variability ofactual returns from the estimated returns. For example, if two projects are considered, one witha NPV of 100 with probability I and other project with two possible outcomes.
NPV Probability
200 0.5
0 0.5
Both the projects have the same NPV of 100. However, the risk profile of second project isdifferent from the first. The returns on the first project do not vary or are certain while in thesecond project the returns can vary anywhere between 0 to 200 around its expected mean of 100.Thus, the certainty of getting returns of 100 is much lesser in the second project as compared tothe first project making it more risky.
Actually, if risk and uncertainty factors are not taken into account there is always a danger thatcapital expenditure evaluation may produce misleading results.
Method of Accounting for Risk
Having established the need for taking into account the risk involved in a capital expenditureproposal, the different measures to quantity the risk in more precise terms are given below:
1. Sensitivity Analysis: Sensitivity Analysis provides information as to how sensitive theestimated project parameters, namely the expected cash flow, the discount rate and theproject life are to estimation errors by considering a number of possible outcomes. Itprovides different cash flow estimates under three assumptions:
The worst (i.e. the, most pessimistic), the expected (i.e., the most likely) and the best(i.e., the most optimistic) outcomes associated with the project.
Example:
Project X Project Y
Initial cash outlays – 80,000 – 80,000
Cash flow estimates (1 – 15 years) worst 12,000 0
Most likely 16,000 16,000
Best 20,000 32,000
Required rate of return 10% 10%
Economic life 15 years 15 years
Solution:
Project X Project Y
PV ( )
NPV ( )
PV ( )
NPV ( )
Worst 91,272 11,272 NIL – 80,000
Most likely 1,21,696 41,696 1,21,696 41,696
Best 1,52,120 72,120 2,43,392 1,63,392
LOVELY PROFESSIONAL UNIVERSITY 197
Unit 9: Capital Budgeting
NotesThe above gives very useful information about projects that appear equally desirable onthe basis of most likely estimates of their cash flows. Project X is less risky than Project Y,since the quantum of variation is relatively less in Project Y. The actual selection of theproject (assuming projects are mutually exclusive) will depend on decision makers’ attitudetowards risk. If he is conservative, he will choose Project X since there is no possibility ofsuffering losses. On the other hand, if he is a risk-taker, he will choose Project Y, as thereis a possibility of higher returns as compared to Project X.
Advantages: Since sensitivity analysis provides more than one estimate of future returnof a project, it is superior to the single – figure forecast.
Limitation: The method does not disclose the chances of the occurrence of these variations.
To remedy this shortcoming of sensitivity analysis, so as to provide a more accurateforecast, probability of the variation should be provided.
2. Probability assignment to expected cash flow: This method provides a more precise measureof the variability of cash flows since it indicates the percentage chance of occurrence ofeach possible cash flow. For example, if some expected cash flow has (0.6) probability ofoccurrence, it means that the given cash flow is likely to be obtained in 6 out of 10 times.
The quantification of variability of returns involves two steps. First, depending on thechances of occurrence of a particular cash flow estimate, probabilities are assigned. Thesecond step is to estimate the expected return on the project. The returns are estimated interms of expected monetary values based on a weightage average return, weights are theprobabilities assigned.
Example: From the following information regarding expected cash flows and thenprobability for Project X, what is the expected return of the project assuming 10% asdiscount rate – [Discount factor 10% year 1 – 0.909; year 2 – 0.826; year 3 – 0.751]
Year1 Year 2 Year 3
Cash flow ( )
Probability Cash flow ( )
Probability Cash flow Probability
4,000 0.25 4,000 0.50 4,000 0.25
7,000 0.50 7,000 0.25 7,000 0.25
9,000 0.25 9,000 0.25 9,000 0.50
Solution: Cash flow
Year 1 = 4,000 × 0.25 + 7,000 × 0.50 + 9,000 × 0.25 = 6750
Year 2 = 4,000 × 0.50 + 7,000 × 0.25 + 9,000 × 0.25 = 6000
Year 3 = 4,000 × 0.25 + 7,000 × 0.25 + 9,000 × 0.50 = 7250
Calculation of Present Values:
Year 1 = 6750 × 0.909 = 6136, Year 2 = 6,000 × 0.826 = 4956
Year 3 = 7250 × 0.751 = 5445
Total 16,537
Advantages of the method: The assignment of probabilities and the calculation of expectedvalues, without doubt, taken into account the risk in terms of variability in explicit termsof investment decisions.
198 LOVELY PROFESSIONAL UNIVERSITY
Financial Management
Notes Limitation: The method does not provide the decision-maker with a concrete valueindicative of variability and therefore risk. The standard deviation and the coefficientvariation are two such measures, which tell us about the variability associated with theexpected cash flow in terms of degree of risk. Standard deviation can be applied when theproject involves the same outlay. If the prospects to be compared involve different outlay,the coefficient of variation is the correct choice, being a relative measure.
3. Standard Deviation and Co-efficient of variation: In statistical terms, standard deviationis defined as the square root of the mean of the standard deviations, where deviation is thedifference between an outcome and the expected mean value of all outcomes. Further,calculate the value of standard deviation after providing weights to the square of eachdeviation (its probability of occurrence).
The greater the standard deviation of a probability distribution, the greater is the dispersionof outcomes around the expected values.
If the two prospects have the same expected value (mean) then one that has the greaterstandard deviation will said to have the higher degree of uncertainty or risk.
However, if the size of the project’s outlay differs, the decision-maker should make use ofthe coefficient of variation to judge the riskiness of the project.
Example: The probability distribution of two projects NPVs is given below:
Project X Project Y
NPV ( ) Probability NPV Probability
5,000 7,500 10,000
0.2 0.7 0.1
0 7500
15,000
0.1 0.7 0.2
Calculate the expected value, the standard deviation and the coefficient of variation for‘each project. Which of these mutually exclusive projects do you prefer and why?
Solution: Project X
NPV NPV × Probability
NPV-Arithmetic mean
Square of deviation Probability
Square of deviation × Probability
5,000 7,500 10,000
1,000 5,250 1.000
–2,250 250
2,750
50,62,500 62,500
75,62,500
0.2 0.7 0.1
10,12,500 43,750
7,56,250
Mean 7,250 18,12,500
Standard deviation = 18,12,500 1,346
Project Y
NPV ( )
NPV x Probability
( )
NPV Arithmetic
mean
Square of deviation Probability
Square of deviation x Probability
0 7,500
15,000
0 5,250 3.000 8,250
– 8,250 –750
6,750
680,62,500 5,62,500
455,62,500
0.1 0.7 0.2
68,06,250 3,93,750
91.12.500
Mean 163,12,500
LOVELY PROFESSIONAL UNIVERSITY 199
Unit 9: Capital Budgeting
NotesStandard deviation = 163,12,500 = 4,039
The standard deviation of the project X is smaller than that of project Y. Therefore, it can beconcluded that Project X is less risky than project Y.
The conclusion regarding the superiority of Project X over Project Y would hold if theprojects have an equal size of outlay. However, if the size of the projects outlay differs, thedecision-maker should make use of the coefficient of variation to judge the riskiness of theproject. In this case –
Coefficient of variation of Project X = = =Standard Deviation 1,346 0.18
Arithmetic Mean 7,250
Coefficient of variation of Project Y = = =Standard Deviation 4039 0.49
Arithmetic Mean 8250
The higher the coefficient of variation, the more risky is the project. Project Y is, therefore,more risky than Project X.
Task A company is considering Projects X and Y with the following information:
Project
X Y
Expected Net Present Value 60,000 227,000
Standard Deviation 40,000 135,000
Which project will you recommend? Will your answer change if we use coefficient ofvariation as a measure of risk instead of standard deviation? Which measure is moreappropriate in this situation? Give reason.
Self AssessmentFill in the blanks:
17. ……………….analysis provides more than one estimate of future return of a project.
18. If the two prospects have the same expected value (mean) then one that has the greater…………………..will said to have the higher degree of uncertainty or risk.
Case Study Case: Mavis Machine Shop
The case is set in an metalworking shop in West Virginia, one of whose products isdrill bits for oil exploration. The time is 1980, in the midst of an oil drilling boomresulting from the oil crises of 1974 and 1979.
Early in 1980, Tom Mavis, President of Mavis Machine shop was considering a project tomodernize his plant facilities. The company operated out of a large converted warehousein Salem, West Virginia. It produced machinery or assorted machined metal parts for theoil and gas drilling and production industry in the surrounding area. One of Mavis major
Contd...
200 LOVELY PROFESSIONAL UNIVERSITY
Financial Management
Notes customer was Buckeye Drilling, Inc., which purchased specialized drill bits and replacementparts for its operations. Mavis had negotiated an annual contract with Buckeye to supplyits drill bit requirements and related spare parts in each of the past 8 years. In 1978 and1979 the requirements had been about 8,400 bits per year. All Buckeye’s rigs were busy.Mavis knew, there were 30 rigs operating in the state and that it had resin up from 17 in1972. Wells drilled was up even more, from 679 in 1972 to 1,474 last year.
The arrangement of the machine shop included four large manual lathes currently devotedto the Buckeye business. Each lathe was operated by a skilled worker, and each bit requiredmechanical keep. Mavis was considering replacing these manual lathes with an automaticmachine, capable of performing all four machinery operations necessary for a drill bit.This machine would produce drill bits at the same rate as the four existing lathes, andwould only require one operator. Instead of skill in metalworking, the job would nowinvolve more skill in computerized automation.
The four existing manual lathes were 3 years old and had cost a total of $590,000. Togetherthey produced 8,400 drill bits on a two-shift, 5-day/week basis. The useful life of theselathes, calculated on a two-shift/day, 5 day/week basis, was estimated to be 15 years. Thesalvage value at the end of their useful life was estimated to be $5,000 each. Depreciationof $114,000 had been accumulated on the four lathes. Cash for the purchase of these latheshad been partially supplied by a 10-year, unsecured, 10% bank loan, of which $180,000 wasstill outstanding. The best estimate of the current selling price of the four lathes in theirpresent condition was $240,000, after dismantling and removal costs. The loss from thesale would be deductible for tax purposes, resulting in a tax savings of 46% of the loss.
The automatic machine being considered needed only one skilled operator to feed in rawcastings, observe functioning, and make necessary adjustments. It would have an output of8,400 drill its annually on a two-shift, 5–day basis. As it would be specially built by amachine tool manufacturer, there was no catalogue price. The cost was estimated to be$680,000, delivered and installed, the useful life would be 15 years. Using a 12-year life (theremaining life of the current lathes). The estimated salvage value would be 10% of the cost.
The automatic lathe was first introduced in1975 at a cost of $ 750,000. It was expected thatas the manufacturing techniques became more generally familiar, the price would continueto drop over the next few years. This price decline was in stark contrast to the inflation inoil services products and supplies which was 18% in both, 1978 and 1979.
A study prepared by the cost accountant to help decide, what action to take, showed thefollowing information. The direct labour rate for lathe operations was $10 per hourincluding fringe benefits. Pay rates for operators would not change as a result of machiningchanges. The new machine would use less floor space, which would save $15,000 annuallyon the allocated charges for square footage of space used, although the layout of the plantwas such that the left space unoccupied would be difficult to utilize and no other use wasplanned. Miscellaneous cash expenses for supplies, maintenance, and power would be$20,000 less per year, if the automatic machine were used. The purchase price was subjectto 10% investment tax credit that did not reduce the depreciable cost.
Exhibit 1: Mavis Machine Shop Selected Financial InformationCondensed Income Statement, 1979
Neat Sales 85,364,213
Cost of Goods Sold 3,494,941
Selling, General & Administrative 643,706
Profit before Taxes 81,225,566
Income Taxes 602,851
Net Income 8622,715
Contd...

LOVELY PROFESSIONAL UNIVERSITY 201
Unit 9: Capital Budgeting
Notes
Neat Sales 85,364,213
Cost of Goods Sold 3,494,941
Selling, General & Administrative 643,706
Profit before Taxes 81,225,566
Income Taxes 602,851
Net Income 8622,715
Questions
1. Summarize the net cash flows for the proposed project.
2. For the project, calculate the internal rate of return, the accounting rate of return, thepayback period, the net present value and the profitability index.
3. What qualitative factors should be considered in evaluating this project?
4. What decision would you recommend?
9.9 Summary Capital budgeting describes the firm’s formal planning process for the acquisition and
investment of capital and results in a capital budget.
Traditional Techniques to Analyze Capital budgeting decisionsTraditional Techniques ofEvaluation are Payback period, The Payback Reciprocal and Accounting Rate of Return (ARR).
Three discounted cash flow methods used in capital budgeting are Net Present ValueMethod (NPV); the Profitability Index or Desirability factor and Internal Rate of Return(lRR).
The net present value relies on the time value of money and the timings of cash flows inevaluating projects.
Internal rate of return is the interest rate that discounts an investment’s future cash flowsto the present so that the present value of cash inflows exactly equals the present value ofthe cash outflows
The process of selecting the more desirable projects among many profitable investmentsis called capital rationing.
Risk in capital budgeting is the degree of variability of cash flows.
The conventional techniques to handle risk in capital budgeting are Payback, Risk adjusteddiscount rate and Certainty equivalent method
The application of probability distribution approach in analysing risk in capital budgetingdepends upon the behaviour of the cash flows whether the cash flows are independent ordependent.
The statistical techniques to quantity the risk in more precise terms are Sensitivity Analysis,Probability assignment to expected cash flow and Standard Deviation and Co-efficient ofvariation
9.10 KeywordsBreak-Even Time: It is the time taken from the start of the project till the period the CumulativePresent Value of cash inflows of a project equal to present values of the total cash outflows.
Capital Budgeting: It refers to planning and deployment of available capital for the purpose ofmaximizing long-term profitability of the firm.
Capital Rationing: The allocation of the limited funds available for financing the capital projectsto only some of the profitable projects in such a manner that the long term returns are maximized.

202 LOVELY PROFESSIONAL UNIVERSITY
Financial Management
Notes Risk-free Rate: The rate at which the future cash flows of a project which is not subjected to riskare discounted.
Risky Investment: Risk in an investment refers to the variability that is likely to occur betweenthe estimated returns and the actual returns.
9.11 Review Questions1. Why is capital budgeting significant to the firm?
2. How should working capital and sunk costs be treated in analyzing investmentopportunities? Explain with suitable examples.
3. Depreciation is a non-cash item and consequently does not affect the analysis of investmentproposal using discounted cash flow method? Comment.
4. Contrast the IRR and the NPV methods. Under what circumstances may they lead to
(a) Comparable recommendation
(b) Conflicting recommendation in circumstances in which they given contradictoryresults which criteria should be used to select the project and why?
5. A project costing 5,60,000 is expected to produce annual net cash benefits of 80,000 overa period of 15 years. Estimate the internal rate of return. Also find out the payback periodand obtain the IRR from it. How do you compare this IRR with one directly estimate?
6. How is risk assessed for a particular investment by using a probability distribution?Discuss the method with an example.
7. Why are cash flows estimated for distant years usually less reliable than for recent years?How can this factor be considered when evaluating the riskiness of a project?
8. What similarities and differences are there between risk adjusted discount rate methodand the certainty equivalent method?
9. What is sensitivity analysis? What are its advantages and limitations?
10. KC company is considering two mutually exclusive projects. The initial cost of bothprojects is 5000 and each has an expected life of four years. Under three possible states ofeconomy, their annual cash flows and associated probabilities are as follows:
Net Cash flow ( ) Economic state Probability Project A Project B
Good 0.3 6000 5000 Normal 0.4 4000 4000 Bad 0.3 2000 3000
Answers: Self Assessment
1. Capital budgeting 2. reversible 3. two-sided
4. incidental 5. minimum 6. Profitability index
7. Internal rate of return 8. negative 9. capital rationing
10. zero 11. capital investment 12. risk
13. variability 14. short 15. discount rate
16. decision tree 17. Sensitivity 18. standard deviation

LOVELY PROFESSIONAL UNIVERSITY 203
Unit 9: Capital Budgeting
Notes9.12 Further Readings
Books Dr Pradeep Kumar Sinha, Financial Management, New Delhi, Excel Books, 2009.
Van Horne, J.C. and Wachowicz, Jr, J.M., Fundamentals of Financial Management,New Delhi, Prentice Hall of India Pvt. Ltd., 1996, p. 2.
Chandra, P., Financial Management—Theory and Practice, New Delhi, Tata McGrawHill Publishing Company Ltd., 2002, p. 3.

204 LOVELY PROFESSIONAL UNIVERSITY
Financial Management
Notes Unit 10: Working Capital Management
CONTENTS
Objectives
Introduction
10.1 Meaning and Concept of Working Capital
10.1.1 Factors Affecting Working Capital
10.2 Importance of Adequate Working Capital and Optimum Working Capital
10.3 Managing Working Capital
10.3.1 How much Working Capital is Needed
10.3.2 Forecasting Working Capital Needs
10.4 Working Capital Cycle (Operating Cycle)
10.4.1 Estimate of Future Working Capital based on Current Assets and CurrentLiabilities
10.4.2 Working Capital Requirement based on Cash Cost
10.4.3 Effect of Double Shift Working on Working Capital Requirements
10.5 Working Capital Policy
10.5.1 Current Assets in Relation to Sales
10.5.2 Ratio of Short-term Financing to Long-term Financing
10.6 Financing of Working Capital
10.7 Regulation of Bank Finance
10.7.1 The Dehejia Committee
10.7.2 Tandon Committee
10.7.3 Recent Changes in Maximum Permissible Bank Finance (MPBF)
10.8 Summary
10.9 Keywords
10.10 Review Questions
10.11 Further Readings
Objectives
After studying this unit, you will be able to:
Recognize the meaning and significance of working capital
Explain how to determine working capital requirements
Describe the different aspects of Financing working capital needs
Discuss the issue of banking finance facility for working capital
IntroductionIn the first unit, we have explained the major task of financial management and procurement offunds and effective utilization of funds. Procurement of funds is firstly concurred for financingof working capital requirement of the firm and secondly for financing fixed assets.

LOVELY PROFESSIONAL UNIVERSITY 205
Unit 10: Working Capital Management
NotesWorking capital management is the functional area of finance that covers all the current accountsof the firm. It is concurred with management of the level of the individual current assets as wellas management of total working capital.
10.1 Meaning and Concept of Working Capital
Working capital refers to the funds invested in current assets, i.e., investment in sundry debtors,cash and other current assets. Current assets are essential to utilize facilities provided by plantand machinery, land and buildings. In case of the manufacturing organization, a machine cannotbe used without raw material. The investment in the purchase of raw materials is identified asworking capital. It is obvious that a certain amount of funds are tied up in raw material inventories,work in progress, finished goods, consumable stores, sundry debtors and day-to-day cashrequirements. However, the organization also enjoys credit facilities from its suppliers by wayof credit. Similarly, the organization need not pay immediately for various expenses, etc. theworkers are paid only periodically. Therefore, a certain amount of funds automatically becomeavailable to finance the current assets requirement. However, the requirement of current assetsis usually greater than the amount of funds provided through current liabilities. The goal ofworking capital management is to manage the firm’s current assets and current liabilities insuch a way that a satisfactory level of working capital is maintained.
From the point of view of concept the term, working capital, can be used in two different ways:
1. Gross working capital: The gross working capital refers to investment in all the current assetstaken together. The total of investments in all current assets is known as gross working capital.
2. Net working capital: Net working capital refers to the excess of total current assets over totalcurrent liabilities. Current liabilities are those liabilities that are intended to be paid in theordinary course of business within a year, out of the current assets or earnings of the concern.
From the point of view of time, the term working capital can be divided into two categories:
1. Permanent: It is also referred as hard core working capital. It is the minimum level ofinvestment in the current assets that is carried by the business at all times to carry outmaximum level of its activities. It should be financed by long-term sources.
2. Temporary working capital: It refers to that part of working capital, which is required bythe business over and above permanent working capital. It is also called variable workingcapital. Since the quantum of temporary working capital keeps on fluctuating from time-to-time depending on the business activities, at may be financed from short-term sources.
The following figure shows permanent and temporary or fluctuating or variable working capital:
Figure 10.1: Permanent and temporary Working capital
Fluctuating or temporary Fluctuating or temporary
PermanentPermanent
X axis -TimeY axis- Amount of Working Capital- Permanent and Temporary or fluctuating
206 LOVELY PROFESSIONAL UNIVERSITY
Financial Management
Notes 10.1.1 Factors Affecting Working CapitalThe important factors are:
1. General Nature of Business: In some organizations, the sales are mostly in cash basis andthe operating cycle (explained) later is also short. In these concerns, the working capitalrequirement is comparatively low. Mostly, service companies come under this category.In manufacturing companies, usually the operating cycle is very long and a firm is alsorequired to give credit to customers to boost sales. In such cases, working capitalrequirement is high. Similarly, a trading concern requires lower working capital than amanufacturing concern.
2. Production Policy: Working capital requirements also fluctuate according to productionpolicy adopted by the company
Example: In case of products having seasonal demand a steady production can beplanned throughout the year in which case finished goods are to be kept for a longerperiod. The other alternative is to produce only during the season in which case rawmaterials have to be accumulated throughout the year.
3. Credit Policy: A company, which allows liberal credit to its customers, may have highersales, but consequently will have larger amount of funds tied up in sundry debtors. Similarlya company, which has very efficient debt collection machinery and offers strict creditterms, may require lesser amount of working capital that the one where debt collectionsystem is not so efficient where the credit terms are liberal.
The creditability of a company in the market also has an effect on the working capitalrequirement. Reputed and established concern can purchase raw material on credit andenjoy many other services like door delivery after sales service, etc., This would mean thatthey could easily have large current liabilities.
4. Inventory Policy: The inventory policy of a company also has an impact on the workingcapital requirements. An efficient firm may stock raw material for a smaller period andmay, therefore, require lesser amount of working capital.
5. Abnormal Factors: Abnormal factors like strikes and lockouts require additional workingcapital. Recessionary conditions necessitate a higher amount of stock of finished goodsremaining in stock. Similarly, inflationary conditions necessitate more funds, to maintainthe same amount of current assets.
6. Market Conditions: In case of competitive pressure, large inventory is essential, as deliveryhas to be off the shelf or credit has to be extended on liberal terms.
7. Conditions of Supply: If prompt and adequate supply of raw materials, spares, stores, etc.,is available it is possible to manage with small investments in inventory or work on Just-In-Time (JIT) inventory principles. However, if supply is erratic, scant, seasonal, channelisedthrough government agencies etc. it is essential to keep larger stocks increasing workingcapital requirements.
8. Business Cycle: Business fluctuations lead to cyclical and seasonal changes in the productionand sales and affect the working capital requirements.
9. Growth and Expansion Activities: The working capital of the firm increases as it grows interms of sale or fixed assets.
10. Level of Taxes: The amount of taxes to be paid is determined by the prevailing taxregulations. Very often taxes have to be paid in advance on the basis of the profit of the
LOVELY PROFESSIONAL UNIVERSITY 207
Unit 10: Working Capital Management
Notespreceding year. Management has no discretion in regard to payment of taxes; in somecases non-payment may invite penal action. There is, however, wide scope to reduce thetax liability through proper tax planning.
11. Dividend Policy: Payment of dividend utilizes cash while retaining profit acts as a sourceof working capital. Thus working capital gets affected by dividend policies.
12. Operating Efficiency: Efficient and co-ordinated utilization of capital reduces the amountrequired to be invested in working capital.
13. Price Level Charges: Inflationary trends in the economy necessitate more working capitalto maintain the same level of activity.
14. Depreciation Policy: Depreciation charges do not involve any cash outflow. The effect ofdepreciation policy on working capital is, therefore, indirect. In the first place, depreciationaffects the tax liability and retention of profits and on dividend.
15. Vagaries in the Availability of Raw Materials: The availability or otherwise of certainraw materials on a continuous basis without interruption would sometimes effect therequirement of working capital. There may be some materials, which cannot be procuredeasily either because their sources are few or they are irregular. To sustain smoothproduction, therefore, the form may be compelled to purchase and stock them far in excessof genuine production needs. This will result in an excessive inventory of such materials.
Self AssessmentFill in the blanks:
1. The total of investments in all current assets is known as …………..working capital.
2. The effect of depreciation policy on working capital is ……………..
10.2 Importance of Adequate Working Capital and Optimum
Working Capital
A concern needs funds for its day-to-day running. Adequacy or inadequacy of these funds woulddetermine the efficiency with which the daily business may be carried on. A large amount ofworking capital would mean that the company has idle funds. Such firms have a cost. Thecompany has to pay large amount as interest on such funds. This results in over-capitalization.Over-capitalization implies that the company has too large funds for its requirements, resultingin a low rate of return a situation, which implies a less than optimal use of resources.
If the firm has inadequate working capital, it is said to be under-capitalized. Such a firm runs therisk of insolvency. This is because paucity of working capital may lead to a situation where thefirm may not be able to meet its liabilities. It is interesting to note that many firms that areotherwise prosperous (having good demand for their products and enjoying profitable marketingconditions) may fail because of lack of liquid resources.
A question may arise as to what is the amount of optimum working capital for a firm.
It cannot be overemphasized that optimum working capital can be determined only withreference to the particular circumstances of a specific situation. Thus, in a company where theinventories are easily saleable and the sundry debtors are as good as liquid cash, the currentrates may be lower than 2 and yet the firm may be sound. An optimum working capital ratio isdependent upon the business situation as such and the nature and composition of various currentassets.
208 LOVELY PROFESSIONAL UNIVERSITY
Financial Management
NotesExample: in the case of vanaspati manufacturing company enjoying high reputation and
credit terms in the market, a current ratio of 1.6 has been serving as ideal. On the other hand, acompany engaged in manufacturing heavy electrical equipment and machinery and the businessmostly being static electricity board might have to maintain a current ratio of more than 3.
The Trade-off between Profitability and Risk
The conversion of current assets for inventory to receivables to cash provides the sources of cashused to pay the current liabilities. The cash outlays for current liabilities are relatively preferable.When an obligation is incurred, the firm generally knows the corresponding payment will bedue. What is difficult to predict are the cash inflows – the conversion of the current assets to moreliquid term. The more predictable its cash inflows, the less net working capital a firm needs.Since most firms are unable to match cash inflows to cash outflows with certainty, current assetsthat more than cover outflows for current liabilities are usually necessary. In general, the greaterthe margin by which a firm’s current assets cover its current liabilities, the better able it will beto pay its bills as they become due.
A trade-off exists between a firm’s profitability and its risk probability. In this context, is therelationship between resources and costs generated by using the firm’s assets – both current andfixed – in productive activities? A firm’s profits can be increased by (1) increasing revenues or(2) reducing costs.. A firm that cannot pay its bills when due, is said to be technically insolvent.
Did u know? What is risk in short term context?
Risk, in the context of short-term financial management (working capital management) isthe probability that a firm will be unable to pay its bills as they become due.
Changes in Current Assets
How changing the level of firm’s current assets affects its profitability – risk trade-off can bedemonstrated using the ratio of current assets to total assets. This ratio indicates the percentageof total assets that is current. (It is assured that the level of total assets remains unchanged).When the ratio increases, that is, when current assets increase – profitability decreases. Why?Because, current assets are less profitable than fixed assets. Fixed assets are more profitablebecause they add more value to the product than provided by current assets.
The risk effect, however, decreases, as the ratio of current assets to total assets increase. Theincrease in current assets increases net working capital, thereby reducing the risk of technicalinsolvency. The opposite effects on profits and risk result from a decrease in the ratio of currentassets to total assets.
Changes in Current Liabilities
How changing the level of firm’s current liabilities affects its profitability – risk trade-off can bedemonstrated by using the ratio of current liabilities to total assets. This ratio indicates thepercentage of total assets that has been financed with current liabilities. (Assume that the totalassets remain unchanged.) Then ratio increases, profitability increases, because the form usesmore of the less expensive current liabilities financing and less long term financing currentliabilities are basically debts on which the firm pays no charge or interest. However, when theratio of current liabilities to total assets increases, the risk of technical insolvency also increases,because the increase in current liabilities in turns decreases not working capital. The oppositeeffects on profit and risk result from a decrease in the ratio of current liabilities to total assets.
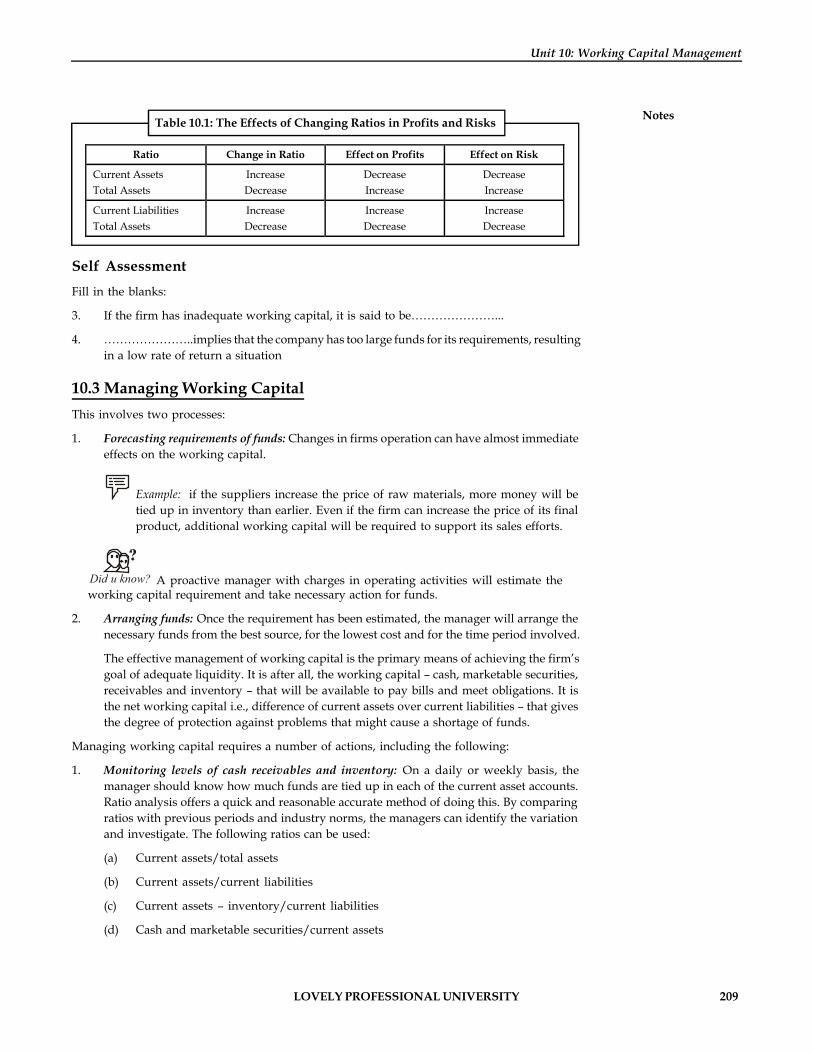
LOVELY PROFESSIONAL UNIVERSITY 209
Unit 10: Working Capital Management
NotesTable 10.1: The Effects of Changing Ratios in Profits and Risks
Ratio Change in Ratio Effect on Profits Effect on Risk
Current Assets Total Assets
Increase Decrease
Decrease Increase
Decrease Increase
Current Liabilities Total Assets
Increase Decrease
Increase Decrease
Increase Decrease
Self AssessmentFill in the blanks:
3. If the firm has inadequate working capital, it is said to be…………………...
4. …………………..implies that the company has too large funds for its requirements, resultingin a low rate of return a situation
10.3 Managing Working CapitalThis involves two processes:
1. Forecasting requirements of funds: Changes in firms operation can have almost immediateeffects on the working capital.
Example: if the suppliers increase the price of raw materials, more money will betied up in inventory than earlier. Even if the firm can increase the price of its finalproduct, additional working capital will be required to support its sales efforts.
Did u know? A proactive manager with charges in operating activities will estimate theworking capital requirement and take necessary action for funds.
2. Arranging funds: Once the requirement has been estimated, the manager will arrange thenecessary funds from the best source, for the lowest cost and for the time period involved.
The effective management of working capital is the primary means of achieving the firm’sgoal of adequate liquidity. It is after all, the working capital – cash, marketable securities,receivables and inventory – that will be available to pay bills and meet obligations. It isthe net working capital i.e., difference of current assets over current liabilities – that givesthe degree of protection against problems that might cause a shortage of funds.
Managing working capital requires a number of actions, including the following:
1. Monitoring levels of cash receivables and inventory: On a daily or weekly basis, themanager should know how much funds are tied up in each of the current asset accounts.Ratio analysis offers a quick and reasonable accurate method of doing this. By comparingratios with previous periods and industry norms, the managers can identify the variationand investigate. The following ratios can be used:
(a) Current assets/total assets
(b) Current assets/current liabilities
(c) Current assets – inventory/current liabilities
(d) Cash and marketable securities/current assets
210 LOVELY PROFESSIONAL UNIVERSITY
Financial Management
Notes 2. To have understanding of the percentage of funds in current accounts: Working capitalrepresents a sizeable investment for most firms. Normally, 30 to 60% of the firm’s totalassets are tied up in current accounts.
3. Recording time spent managing current accounts: Financial Managers spend much of theirtime to the daily internal operations relating to current assets and current liabilities of thefirms. Although estimates vary, managers spent somewhere between on third and twothirds of their time in managing the working capital.
!Caution The manager should be aware of the relationship between current and fixed assetsand any charges in the percentage of funds in current accounts.
10.3.1 How much Working Capital is Needed
A number of factors need to be included in the analysis, such as the following:
1. Size of the firm: It may be argued that a firm’s size, either in assets or sales will affect itsneed for working capital. A small firm may have extra current assets as a cashier againstcash flow disruptions. Small firms have cash inflows from fewer sources than larger firmsand hence are more affected by the failures of a few customers to pay on time. Larger firmswith many sources of funds may need less working capital as compared to total assets onsales.
2. Activities of firm: If the firm requires to stock large inventory or sell on relatively easycredit terms, it will have greater needs for working capital than firms providing servicesor only having cash sales.
3. Availability of credit: A firm with readily available credit from banks will be able to planfor less working capital than a firm without such credit.
4. Attitude towards profits: All funds have a cost; a relatively large amount of current assetstends to reduce a firm’s profit. Some firms want extra working capital and are willing tosuffer small costs. Other firms maintain an absolute minimum of working capital to gainthe full profits from operation.
5. Attitude towards risk: The greater the amount of working capital particularly cash andmarketable securities the lower the risk of liquidity problems. Firms that do not wish toincur even slight risks of liquidity problem may like to keep extra cash. Other firms acceptthe risks to earn profits and may not even keep adequate cash to pay bills always on time.
Did u know? Most firms seek to maintain sufficient working capital to meet their needs forliquidity without tying up unnecessary funds.
10.3.2 Forecasting Working Capital NeedsThe following are some of the methods used in practice:
1. Current assets holding period: To estimate working capital requirements on the basis ofaverage holding period of current assets and relating them to cost based on companyexperience in the previous year.
2. Ratio of sales: To estimate working capital requirements as a ratio of sales on theassumption that current assets charge with sales. This can be done through statistical

LOVELY PROFESSIONAL UNIVERSITY 211
Unit 10: Working Capital Management
Notestechniques like linear regression. A formula is developed for the straight line that best fitsthe data and this formula can be used to express the relationship between two variables –say prior month’s sales and working capital. The most widely used regression techniqueemploys the method of least squares. Let us take the following figures extracted from thebooks:
Table 10.2: Ratio of Sales
Month Prior Months Sales X (000)
Working Capital Level Y (000)
X2 (000,000)
XY (000,000)
January 450 300 202500 135000
February 400 300 160000 120000
March 350 250 122500 87500
April 300 220 90000 66000
May 250 200 62500 50000
June 500 400 250000 200000
July 700 500 490000 350000
August 600 450 360000 270000
September 300 300 90000 90000
October 250 250 62500 62500
November 650 500 422500 325000
December 550 400 302500 220000
5300 4070 2615000 1976000
x = 5300(000) y= 4070(000) x2= 2615000 (000,000)
xy = 1976000
Y = a + bx
y = Na + bx - 1
xy = ax + bx2
From (1) - 4070600 = 12 a + 5300,000 b
From (2) = 1976000 (000,000) = 53,00,000
To get the line of best for Y = a + bx, we can use the following formula
y = Na + bx
xy = ax + bx2
Solving the above two equations, we get,
a = 35638 and b = 0.687
Hence, the line of best fit Y = 35638 + 0.687
Suppose in October, the firm had sales of 1.25,000, the estimated working capital will be35638 + 0.687 × 425000 = 327613
3. Ratio of fixed investment: To estimate working capital requirements as a percentage offixed investment.
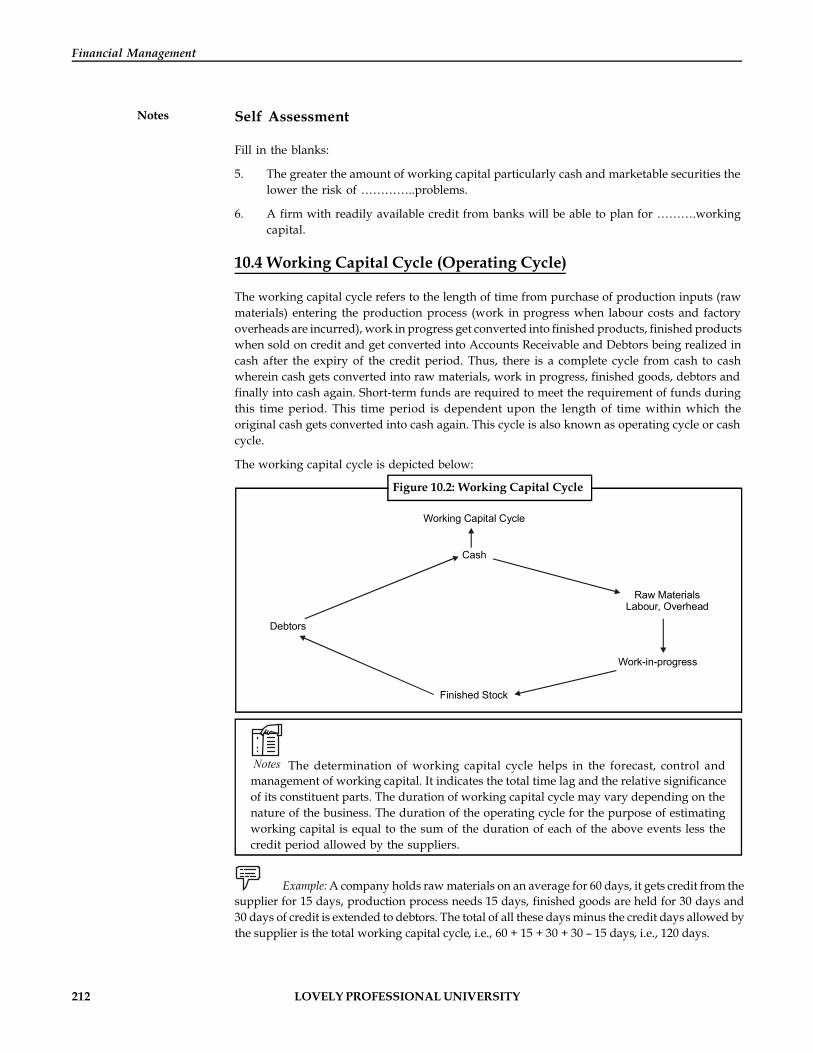
212 LOVELY PROFESSIONAL UNIVERSITY
Financial Management
Notes Self Assessment
Fill in the blanks:
5. The greater the amount of working capital particularly cash and marketable securities thelower the risk of …………..problems.
6. A firm with readily available credit from banks will be able to plan for ……….workingcapital.
10.4 Working Capital Cycle (Operating Cycle)
The working capital cycle refers to the length of time from purchase of production inputs (rawmaterials) entering the production process (work in progress when labour costs and factoryoverheads are incurred), work in progress get converted into finished products, finished productswhen sold on credit and get converted into Accounts Receivable and Debtors being realized incash after the expiry of the credit period. Thus, there is a complete cycle from cash to cashwherein cash gets converted into raw materials, work in progress, finished goods, debtors andfinally into cash again. Short-term funds are required to meet the requirement of funds duringthis time period. This time period is dependent upon the length of time within which theoriginal cash gets converted into cash again. This cycle is also known as operating cycle or cashcycle.
The working capital cycle is depicted below:
Figure 10.2: Working Capital Cycle
Working Capital Cycle
Cash
Raw Materials Labour, Overhead
Debtors
Work-in-progress
Finished Stock
Notes The determination of working capital cycle helps in the forecast, control andmanagement of working capital. It indicates the total time lag and the relative significanceof its constituent parts. The duration of working capital cycle may vary depending on thenature of the business. The duration of the operating cycle for the purpose of estimatingworking capital is equal to the sum of the duration of each of the above events less thecredit period allowed by the suppliers.
Example: A company holds raw materials on an average for 60 days, it gets credit from thesupplier for 15 days, production process needs 15 days, finished goods are held for 30 days and30 days of credit is extended to debtors. The total of all these days minus the credit days allowed bythe supplier is the total working capital cycle, i.e., 60 + 15 + 30 + 30 – 15 days, i.e., 120 days.
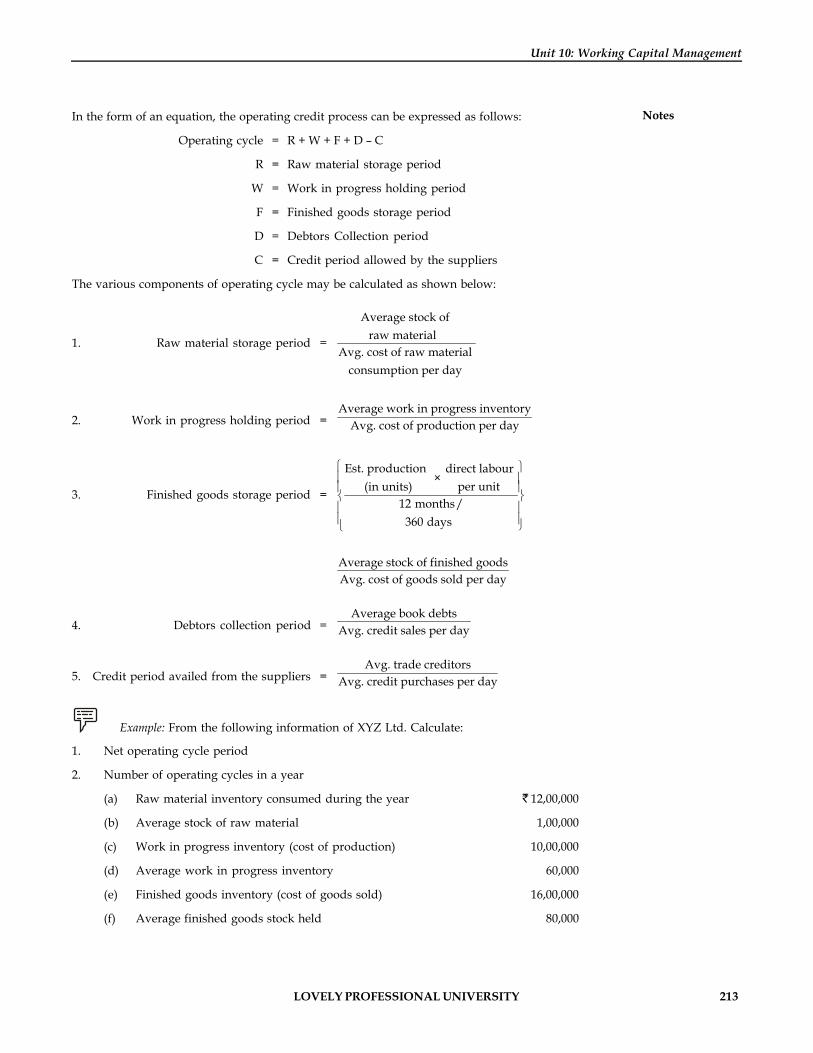
LOVELY PROFESSIONAL UNIVERSITY 213
Unit 10: Working Capital Management
NotesIn the form of an equation, the operating credit process can be expressed as follows:
Operating cycle = R + W + F + D – C
R = Raw material storage period
W = Work in progress holding period
F = Finished goods storage period
D = Debtors Collection period
C = Credit period allowed by the suppliers
The various components of operating cycle may be calculated as shown below:
1. Raw material storage period =
Average stock of raw material
Avg. cost of raw material consumption per day
2. Work in progress holding period =Average work in progress inventory
Avg. cost of production per day
3. Finished goods storage period =
Est. production direct labour ×
per unit(in units)12 months/
360 days
ì üï ïï ïí ýï ïï ï
þî
Average stock of finished goodsAvg. cost of goods sold per day
4. Debtors collection period =Average book debts
Avg. credit sales per day
5. Credit period availed from the suppliers =Avg. trade creditors
Avg. credit purchases per day
Example: From the following information of XYZ Ltd. Calculate:
1. Net operating cycle period
2. Number of operating cycles in a year
(a) Raw material inventory consumed during the year 12,00,000
(b) Average stock of raw material 1,00,000
(c) Work in progress inventory (cost of production) 10,00,000
(d) Average work in progress inventory 60,000
(e) Finished goods inventory (cost of goods sold) 16,00,000
(f) Average finished goods stock held 80,000
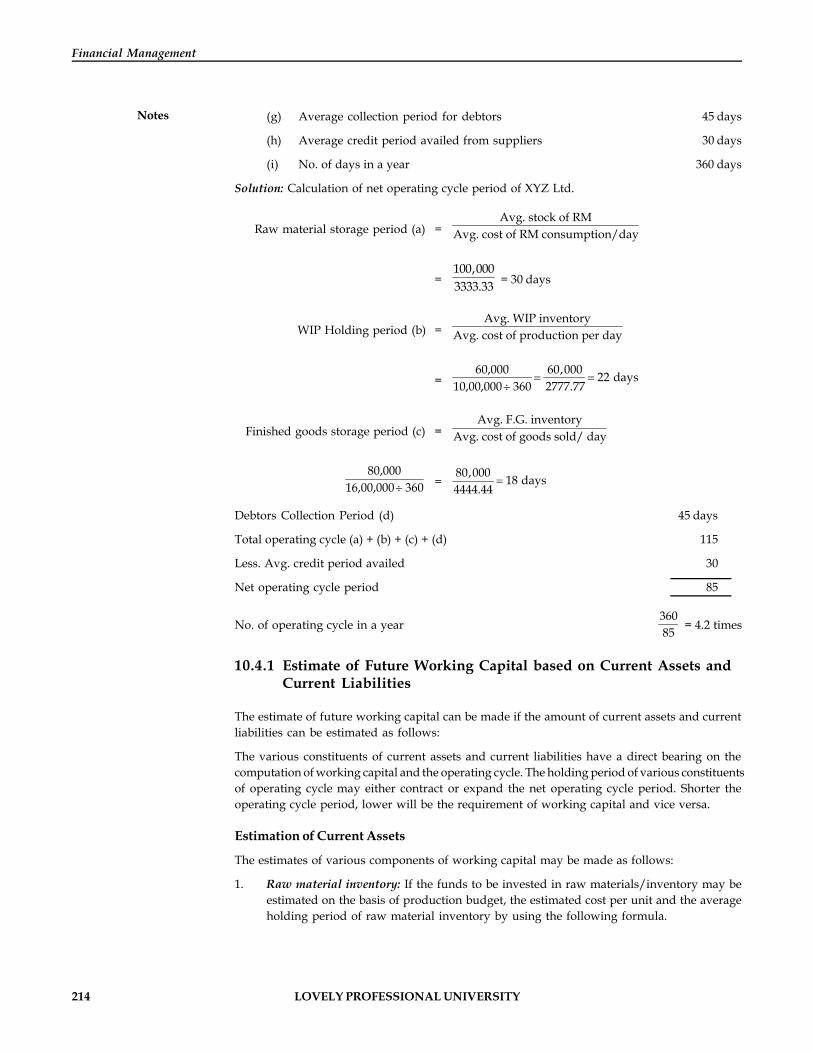
214 LOVELY PROFESSIONAL UNIVERSITY
Financial Management
Notes (g) Average collection period for debtors 45 days
(h) Average credit period availed from suppliers 30 days
(i) No. of days in a year 360 days
Solution: Calculation of net operating cycle period of XYZ Ltd.
Raw material storage period (a) =Avg. stock of RM
Avg. cost of RM consumption/day
=100,0003333.33 = 30 days
WIP Holding period (b) =Avg. WIP inventory
Avg. cost of production per day
=60,000 60,000 22 days
10,00,000 360 2777.77= =
¸
Finished goods storage period (c) =Avg. F.G. inventory
Avg. cost of goods sold/ day
80,00016,00,000 360¸
=80,000 18 days4444.44
=
Debtors Collection Period (d) 45 days
Total operating cycle (a) + (b) + (c) + (d) 115
Less. Avg. credit period availed 30
Net operating cycle period 85
No. of operating cycle in a year36085 = 4.2 times
10.4.1 Estimate of Future Working Capital based on Current Assets andCurrent Liabilities
The estimate of future working capital can be made if the amount of current assets and currentliabilities can be estimated as follows:
The various constituents of current assets and current liabilities have a direct bearing on thecomputation of working capital and the operating cycle. The holding period of various constituentsof operating cycle may either contract or expand the net operating cycle period. Shorter theoperating cycle period, lower will be the requirement of working capital and vice versa.
Estimation of Current Assets
The estimates of various components of working capital may be made as follows:
1. Raw material inventory: If the funds to be invested in raw materials/inventory may beestimated on the basis of production budget, the estimated cost per unit and the averageholding period of raw material inventory by using the following formula.

LOVELY PROFESSIONAL UNIVERSITY 215
Unit 10: Working Capital Management
NotesEst. production Avg. raw materials holding Est. cost of raw materials
× × per unit(in units) period (month/days)12 month/360 days
Note: 360 days in a year are generally assumed to facilitate calculation
2. Work in progress inventory: The funds to be invested in work in progress can be estimatedby the following formula:
Est. prodn. Avg. holding period of Est. work in process × ×
cost per unit(in units) WIP (month/days)12 month/360 days
3. Finished goods: The funds to be invested in finished goods inventory can be estimatedwith the help of the following formula:
Est. prodn. cost of prodn. (per Avg. holding period of Finished × ×
(in units) unit excl. dept.) goods (month/days)12 month/360 days
4. Debtors: Funds to be invested in trade debtors may be estimated with the help of thefollowing formula:
Est. credit sales cost of sales (per Avg. debtor collection Period × ×
(in units) unit excl. dept.) (month/days)12 month/360 days
5. Minimum desired cash and bank balance, to be maintained by the firm have to be addedin the current assets for calculation of working capital.
Estimation of Current Liabilities
Current liabilities generally affect computation of working capital. Hence the amount of workingcapital is lowered to the extent of current liabilities (other than bank credit) arising in thenormal course of business. The important current liabilities like trade creditors, wage andoverheads can be estimated as follows:
1. Trade creditors:
Est. yearly prod. × Raw material req. per unit12 months/36 days
ì üïí ý
ïï þî
× Credit period granted by supplier
(months/days)
2. Direct wages:
Est. production (in units) × Direct labour per unit12 months/360 days
ì üïí ý
ïï þî
× Avg. time lag in payment of wages
(months/days)
3. Overheads (other than depreciation and amortization)
2 U × PC =
S × Avg. time lag in payment of overhead (months/days)
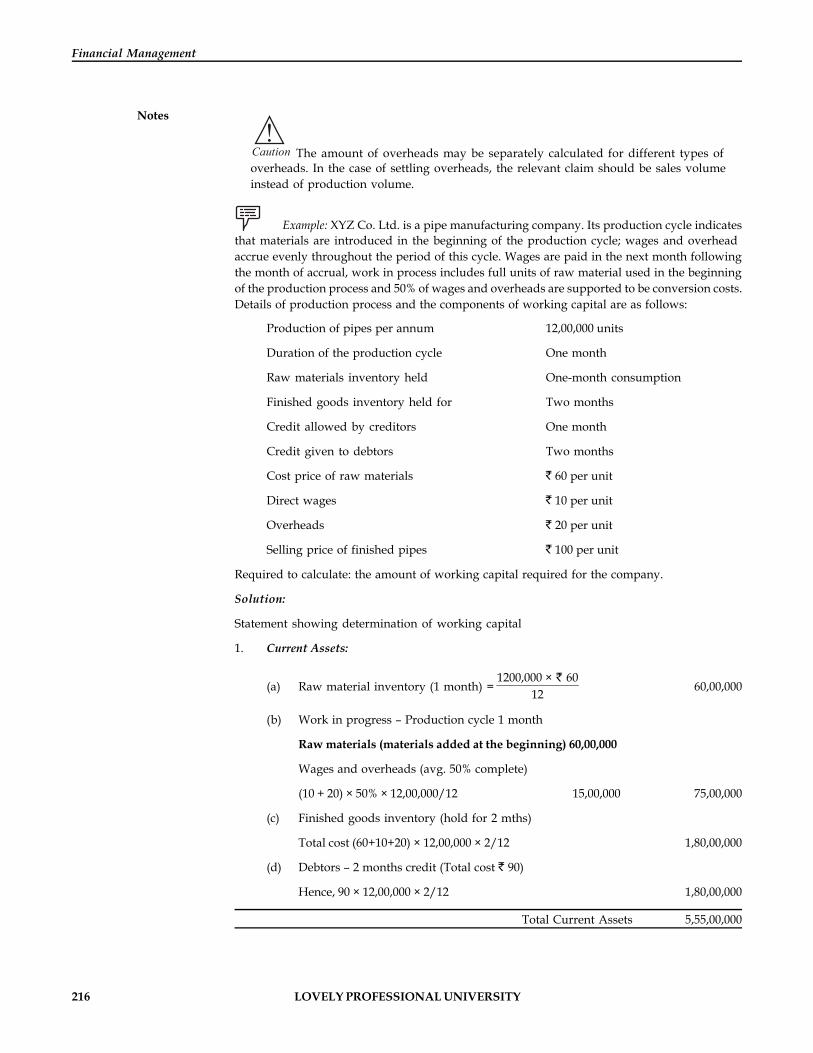
216 LOVELY PROFESSIONAL UNIVERSITY
Financial Management
Notes
!Caution The amount of overheads may be separately calculated for different types ofoverheads. In the case of settling overheads, the relevant claim should be sales volumeinstead of production volume.
Example: XYZ Co. Ltd. is a pipe manufacturing company. Its production cycle indicatesthat materials are introduced in the beginning of the production cycle; wages and overheadaccrue evenly throughout the period of this cycle. Wages are paid in the next month followingthe month of accrual, work in process includes full units of raw material used in the beginningof the production process and 50% of wages and overheads are supported to be conversion costs.Details of production process and the components of working capital are as follows:
Production of pipes per annum 12,00,000 units
Duration of the production cycle One month
Raw materials inventory held One-month consumption
Finished goods inventory held for Two months
Credit allowed by creditors One month
Credit given to debtors Two months
Cost price of raw materials 60 per unit
Direct wages 10 per unit
Overheads 20 per unit
Selling price of finished pipes 100 per unit
Required to calculate: the amount of working capital required for the company.
Solution:
Statement showing determination of working capital
1. Current Assets:
(a) Raw material inventory (1 month) =1200,000 × 60
12 60,00,000
(b) Work in progress – Production cycle 1 month
Raw materials (materials added at the beginning) 60,00,000
Wages and overheads (avg. 50% complete)
(10 + 20) × 50% × 12,00,000/12 15,00,000 75,00,000
(c) Finished goods inventory (hold for 2 mths)
Total cost (60+10+20) × 12,00,000 × 2/12 1,80,00,000
(d) Debtors – 2 months credit (Total cost 90)
Hence, 90 × 12,00,000 × 2/12 1,80,00,000
Total Current Assets 5,55,00,000
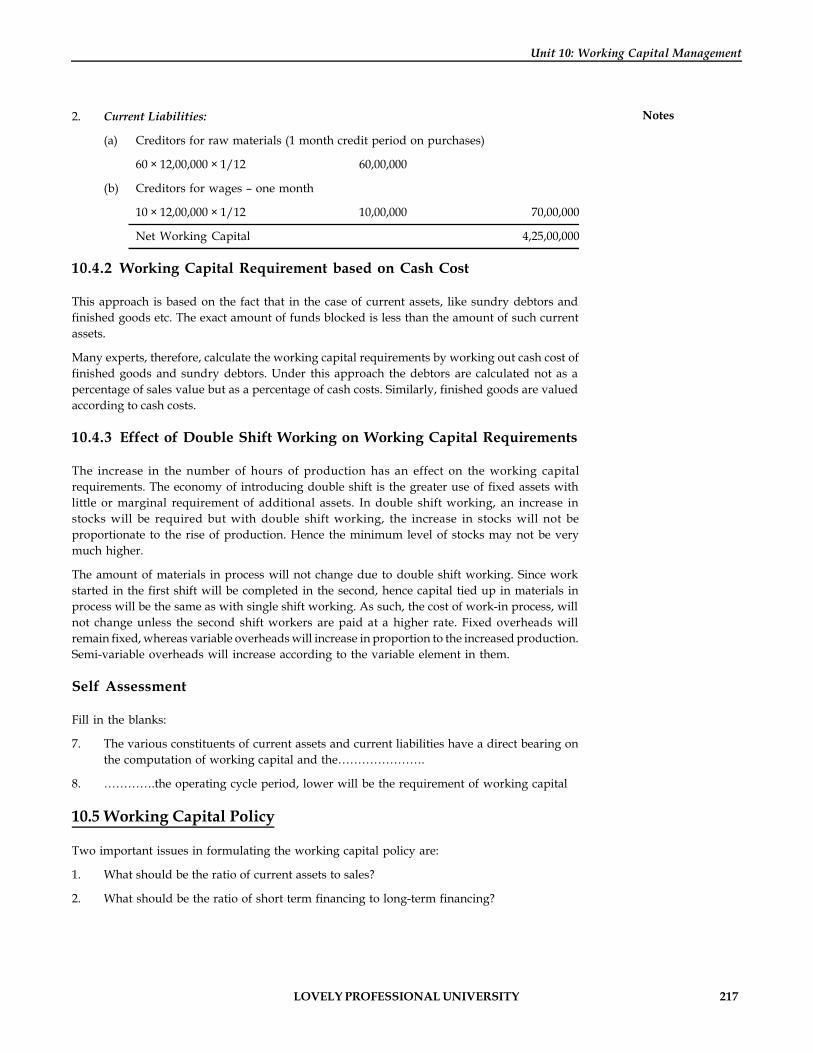
LOVELY PROFESSIONAL UNIVERSITY 217
Unit 10: Working Capital Management
Notes2. Current Liabilities:
(a) Creditors for raw materials (1 month credit period on purchases)
60 × 12,00,000 × 1/12 60,00,000
(b) Creditors for wages – one month
10 × 12,00,000 × 1/12 10,00,000 70,00,000
Net Working Capital 4,25,00,000
10.4.2 Working Capital Requirement based on Cash Cost
This approach is based on the fact that in the case of current assets, like sundry debtors andfinished goods etc. The exact amount of funds blocked is less than the amount of such currentassets.
Many experts, therefore, calculate the working capital requirements by working out cash cost offinished goods and sundry debtors. Under this approach the debtors are calculated not as apercentage of sales value but as a percentage of cash costs. Similarly, finished goods are valuedaccording to cash costs.
10.4.3 Effect of Double Shift Working on Working Capital Requirements
The increase in the number of hours of production has an effect on the working capitalrequirements. The economy of introducing double shift is the greater use of fixed assets withlittle or marginal requirement of additional assets. In double shift working, an increase instocks will be required but with double shift working, the increase in stocks will not beproportionate to the rise of production. Hence the minimum level of stocks may not be verymuch higher.
The amount of materials in process will not change due to double shift working. Since workstarted in the first shift will be completed in the second, hence capital tied up in materials inprocess will be the same as with single shift working. As such, the cost of work-in process, willnot change unless the second shift workers are paid at a higher rate. Fixed overheads willremain fixed, whereas variable overheads will increase in proportion to the increased production.Semi-variable overheads will increase according to the variable element in them.
Self Assessment
Fill in the blanks:
7. The various constituents of current assets and current liabilities have a direct bearing onthe computation of working capital and the………………….
8. ………….the operating cycle period, lower will be the requirement of working capital
10.5 Working Capital Policy
Two important issues in formulating the working capital policy are:
1. What should be the ratio of current assets to sales?
2. What should be the ratio of short term financing to long-term financing?
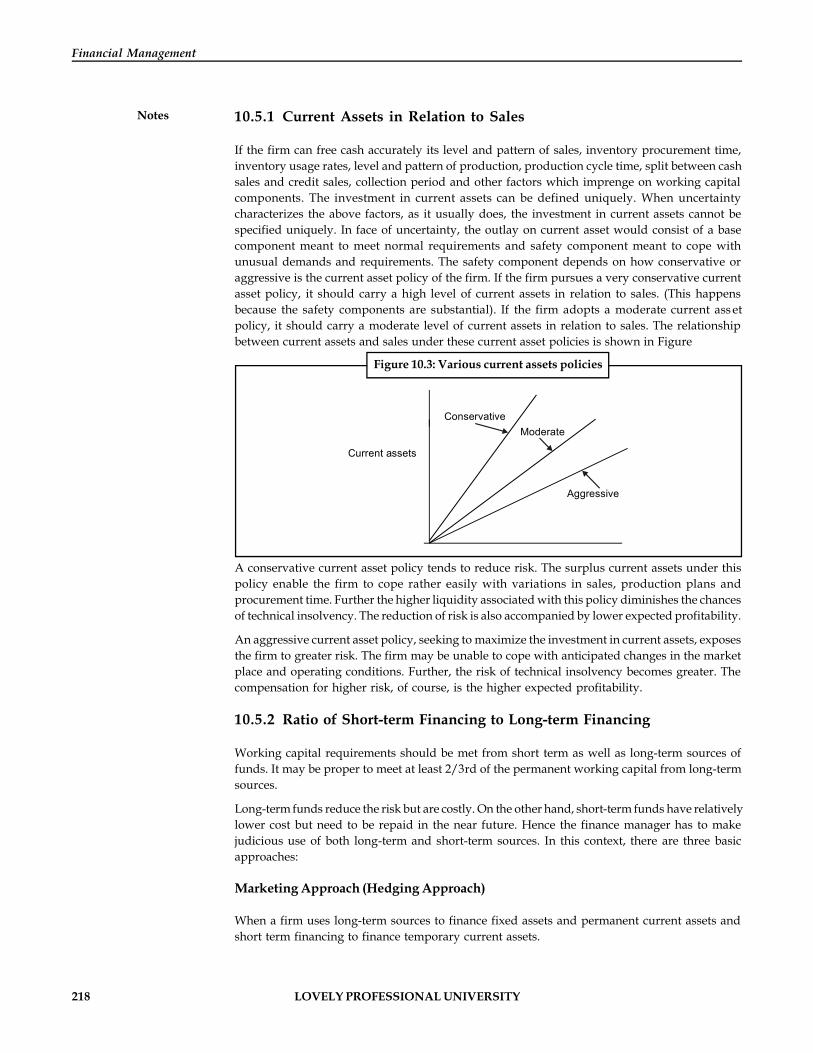
218 LOVELY PROFESSIONAL UNIVERSITY
Financial Management
Notes 10.5.1 Current Assets in Relation to Sales
If the firm can free cash accurately its level and pattern of sales, inventory procurement time,inventory usage rates, level and pattern of production, production cycle time, split between cashsales and credit sales, collection period and other factors which imprenge on working capitalcomponents. The investment in current assets can be defined uniquely. When uncertaintycharacterizes the above factors, as it usually does, the investment in current assets cannot bespecified uniquely. In face of uncertainty, the outlay on current asset would consist of a basecomponent meant to meet normal requirements and safety component meant to cope withunusual demands and requirements. The safety component depends on how conservative oraggressive is the current asset policy of the firm. If the firm pursues a very conservative currentasset policy, it should carry a high level of current assets in relation to sales. (This happensbecause the safety components are substantial). If the firm adopts a moderate current ass etpolicy, it should carry a moderate level of current assets in relation to sales. The relationshipbetween current assets and sales under these current asset policies is shown in Figure
Figure 10.3: Various current assets policies
Current assets
ConservativeModerate
Aggressive
A conservative current asset policy tends to reduce risk. The surplus current assets under thispolicy enable the firm to cope rather easily with variations in sales, production plans andprocurement time. Further the higher liquidity associated with this policy diminishes the chancesof technical insolvency. The reduction of risk is also accompanied by lower expected profitability.
An aggressive current asset policy, seeking to maximize the investment in current assets, exposesthe firm to greater risk. The firm may be unable to cope with anticipated changes in the marketplace and operating conditions. Further, the risk of technical insolvency becomes greater. Thecompensation for higher risk, of course, is the higher expected profitability.
10.5.2 Ratio of Short-term Financing to Long-term Financing
Working capital requirements should be met from short term as well as long-term sources offunds. It may be proper to meet at least 2/3rd of the permanent working capital from long-termsources.
Long-term funds reduce the risk but are costly. On the other hand, short-term funds have relativelylower cost but need to be repaid in the near future. Hence the finance manager has to makejudicious use of both long-term and short-term sources. In this context, there are three basicapproaches:
Marketing Approach (Hedging Approach)
When a firm uses long-term sources to finance fixed assets and permanent current assets andshort term financing to finance temporary current assets.
LOVELY PROFESSIONAL UNIVERSITY 219
Unit 10: Working Capital Management
NotesConservative Approach
Under this approach, a firm finances its permanent assets and also a part of temporary currentassets with long-term financing and is less risky so far as insolvency is concerned, however thefunds may be invested in such investments which fetch small returns to build up liquidity.
Aggressive Approach
The firm uses mere short-term financing than is warranted. In this approach, the firm finances apart of its permanent current assets with short-term financing. This is more risky, but may addto the return on assets.
Task How do changes in the ratio of current liabilities to total assets affect profitabilityand risk?
Self Assessment
Fill in the blanks:
9. A ………………current asset policy tends to reduce risk.
10. The …………..component depends on how conservative or aggressive is the current assetpolicy of the firm.
10.6 Financing of Working Capital
Following are the different short-term and long-term sources of finance available for workingcapital:
1. Long-term sources: For example, Share capital (equity and preference), Retained earnings,and debentures/bonds of different types, loans from bank and financial institutions, venturecapital financing.
2. Short-term sources:
(a) Bank credit: cash credit, bills finance, overdraft facility, working capital demandloan, commercial paper.
(b) Transaction credit: trade allowed by creditors, outstanding labour and other expenses.
Some of the short-term sources of finance are given below as a reference:
(a) Trade credit: It represents credit granted by suppliers of goods, etc., as an incident ofsale. The usual duration of such credit is 15 to 90 days. It can be in the form of an “openaccount” or “bills payable.” Trade credit is preferred as a source of finance because itis without any explicit cost and till a business as a going concern keeps on rotating.
(b) Advance from customers: Manufacturers and contractors engaged in producing andconstructing costly goods involving considerable length of manufacturing orconstructions usually demand advance mainly from their customers at the time ofaccepting the orders for executing the contracts or supplying the goods.
(c) Bank advances: Banks receive deposits from public for different periods at varyingrates of interest. These funds are invested and lent in such a manner that whenrequired they may be called back. Lending results in firm revenues out of whichcosts such as interest on deposits, administrative costs are met and a reasonableprofit is made.

220 LOVELY PROFESSIONAL UNIVERSITY
Financial Management
Notes (d) Loans: In a loan account, the entire advance is disbursed at one time either in cash orby transfers to the current account of the borrower.
(e) Overdraft: Under this facility, customers are allowed to withdraw in excess of creditadvance standing to their current deposit account. A fixed amount is therefore grantedto the borrower within which the borrower is allowed to overdraw his account.
(f) Clean overdrafts: Request for clean advances is entertained only from parties, whichare financially sound and reputed for their integrity. The bank has to rely upon thepersonal security of the borrowers.
(g) Cash credits: Cash credit is an arrangement under which a customer is allowed todraw advance up to a certain limit against credit granted by bank. Generally, thelimits are sanctioned against the security of goods by way of pledge or hypothecation.Though these accounts are repayable on demand, banks usually do not recall.
(h) Bills purchased/discounted: Advances are allowed against the security of bills, whichmay be clean or documentary. Bills are sometimes purchased from approvedcustomers in whose favour limits are sanctioned. Before granting a limit, the bankersatisfies himself as to the credit worthiness of the drawer.
(i) Advance against documents of title to goods: A document becomes a document of title togoods when its possession is recognized by law or business custom as possession ofthe goods. These documents include a bill of lading, dock warehouse keeper’scertificate, railway receipt, etc.,
(j) Term loan by banks: Term loan is an installment credit repayable over a period of timein monthly/quarterly/half yearly or yearly installment. Banks grant term loans forsmall projects falling under priority sector, small-scale sector and big units.
(k) Commercial paper: It is a form of financing that consists of short-term, unsecuredpromissory notes issued by firms with a high credit standing. Most commercialpapers have maturity ranging from 3 months to 6 months and denomination ofminimum 5 lakhs.
Notes The companies satisfying the following conditions are eligible to issue commercialpaper:
(a) The tangible worth of the company is 5 crores or more as per audited balance sheetof the company.
(b) The fund base working capital limit is not less than 5 crores.
(c) The company is required to obtain the necessary credit rating from the rating agenciessuch as CRISIL, ICRA, etc., and the rating should not be more than 2 months old atthe time of applying to the RBI.
(d) The minimum current assets ratio should be 1.33:1 based on classification of currentassets and liabilities.
(e) For public sector companies there are no listing requirements, but for companiesother than public sector, the same to be listed or one or more stock exchanges.
(l) Public deposits: A company can accept public deposits subject to the stipulation ofReserve Bank of India from time-to-time maximum up to 35 per cent of its paid upcapital and reserves from the public and shareholders. These deposits may beaccepted for a period of six months to three years. Public deposits are unsecuredloans and are used for financing working capital requirements.

LOVELY PROFESSIONAL UNIVERSITY 221
Unit 10: Working Capital Management
NotesSelf Assessment
Fill in the blanks:
11. ……………….represents credit granted by suppliers of goods
12. ……………….is an arrangement under which a customer is allowed to draw advance up toa certain limit against credit granted by bank.
10.7 Regulation of Bank Finance
Traditionally banks credit has been an easily accessible source of meeting the working capitalneeds of business firms. Indian banks have not been concerning themselves about the soundnessor otherwise of the business carried out or about the actual end use of the loan. In other words, theyhave been extending credit to industry and trade on the basis of security. This resulted in a numberof distortions in financing of working capital by banks. Consequently, bank credit has beensubjected to various rules, regulations and controls. The Reserve Bank of India had appointedvarious committees to ensure equitable distribution of bank resources to various sectors ofeconomy. These committees suggest ways and means to make the bank credit an effectiveinstrument of industrialization. Now we shall discuss the recommendations of various committees.
10.7.1 The Dehejia Committee
In September 1969, Dehejia Committee of the RBI pointed out in its reports that in the financingpractice of banks, there was no relationship between the optimum requirements for productionand the bank loan. The general tendency with business was to take short-term credit from banksand use it for purposes other than production. The Committee also pointed out that bank to notgive proper attention to the financing pattern of their clients. Further, the clients resort todouble financing or multiple financing of stocks.
The Dehejia Committee suggested that the banks should make an appraisal of credit applicationswith reference to the total financial situations of the client. It also suggested that all cash creditaccount with banks should be bifurcated in the following two categories:
1. The hard core which would represent the minimum level of raw material, finished goodsand stores, which any industrial concern is required to hold for maintaining certain levelof production.
2. The strictly short-term components, which should be the fluctuating part of the account.This part would represent the short-term increases in inventories, tax, dividends andbonus payments.
The Committee also recommended that to determine the hard-core element of cash credit account,norms for inventory levels should be worked out by the Chambers of Industry or by the IndianBank Association.
It can, thus, be seen that the orientation towards project oriented and need based lending wasfirst given by the Dehejia Committee. However, in practice the recommendations of theCommittee did not have more than a marginal effect on the pattern of bank financing.
10.7.2 Tandon Committee
In July 1974, the Reserve Bank constituted a Study Group under the Chairmanship of Mr. P.L.Tandon. This study group was asked to give its recommendations on the following matters:
1. What constitutes the working capital requirements of the industry and what is the end useof credit?

222 LOVELY PROFESSIONAL UNIVERSITY
Financial Management
Notes 2. How is the quantum of bank advance to be determined?
3. Can norms be evolved of current assets and for debt equity ratio to ensure minimaldependence on bank finance?
4. Can the current manner and state of lending be improved?
5. Can an adequate planning, assessment and information system be evolved to ensure adisciplined flow of credit to meet genuine production needs and its proper supervision?
The final recommendations of this Committee regarding the approach of the banks towards theassessment of the working capital requirements of industrial units are very significant. Themajor recommendations have been discussed as below:
1. Banks’ finance essentially for meeting working capital needs: Banks’ credit is essentiallyintended to finance working capital requirements only; for other requirements, othersources have to be found. Even for working capital requirements, some portion of thecontribution must come from source other than bank finance, viz. from owner’s ownfunds, plough back of surpluses and long term borrowed funds. With increased scale ofoperation and production, the owner’s own stake in the business should keep on rising.While it is not practicable to lay down absolute standards of debt equity ratio, eachborrower should take appropriate steps to strengthen his equity base.
2. Working capital gap: The study group has emphasized the concept of ‘the working capitalgap’, which represented the excess of current assets over current liabilities other than bankborrowing. The maximum permissible bank finance shall be limited to 75% of this workingcapital gap. In other words, the balance of 25% will have to be provided by the borrowerfrom equity and long-term borrowings. For the purpose of arriving at the working capitalgap, the current assets and the current liabilities will have to be estimated on the basis ofthe production plan submitted by the borrower. The level of inventories under rawmaterials, work-in-process, finished goods, consumable stores and also the level ofreceivables shall be projected on the norms prescribed by the study group.
3. Norms: The borrowing requirements of any industrial unit basically depend on the lengthof the working capital cycle, from building inventories of raw material to getting the saleproceeds. If norms of inventory and other current assets are laid down for differentindustries, the bank can easily work out the standard working capital required by a unitand sanction the advance accordingly. The study group has, therefore, prescribed normsfor inventory and receivables for fifteen industries. The industries covered by the reportare cotton and synthetic textiles, manmade fibres, jute, textiles, rubber products, fertilizers,pharmaceuticals, dyes and dyestuffs, basic industrial chemicals, vegetable andhydrogenated oils, paper, cement, consumer durables, automobiles and ancillaries,engineering ancillaries and components supplies and machinery manufacturers. The studygroup has not suggested any norms for the heavy engineering industry because each unitin this industry has certain special characteristics.
The norms for the various items are described below:
(a) Raw materials Consumption in terms of months
(b) Stock-in-process Cost of production in terms of months
(c) Finished goods Cost of sales in terms of months
(d) Receivables Sales in terms of months
4. Three different methods of calculating the borrowing limit to finance the working capitalrequirements: The group views the role of banker only to “supplement the borrower’sresources in carrying a reasonable level of current assets in relation to his production
LOVELY PROFESSIONAL UNIVERSITY 223
Unit 10: Working Capital Management
Notesrequirement”. It proposed three progressive stages by which the banks may finance theworking capital requirements of their industrial borrowers. In the first stage, the currentassets may be worked out as per norms and the current liabilities (excepting bankborrowing) may be deducted there from. This amount would represent the workingcapital gap, 25% of which must be financed by the borrowers out of long-term funds. Themaximum permissible bank borrowings would, therefore, be only 75% of the workingcapital requirements calculated as per the norms laid down regarding inventories andreceivables. The Committee suggests, that as a first step, the banks may adopt this methodof sanctioning advances. In cases where the banks have already sanctioned advances higherthan the requirements as calculated above, the excess should be converted into a term loanto be phased out gradually. Thus, the Committee does not support that the banks shouldfinance excessive inventory build up by industrial enterprises.
In the second stage, the borrower will have to provide a minimum of 25% of total currentassets from term funds (as against his providing 25% of working capital gap from longterm funds in the first alternative.)
In the third stage and the ‘ideal’ method of calculating the borrowing limits, the groupmakes a distinction between core current assets and the other current assets. Accordingly,the total current assets need to be divided into these two categories. The borrower shouldfinance the entire core current assets plus a minimum of 25% of the other current assets.The group feels that the classification of current assets and current liabilities be as per theaccepted approach of the bankers.
The recommendations of the Committee aim at reducing the reliance of the borrowers onthe bank finance. Implementation of these recommendations would result in a bettercurrent ratio for the industrial borrowers. This would avoid unfortunate stringencies onaccount of lack of working capital as those faced by the industrial units. There can be notwo opinions that the industrial units must maintain a sound current ratio–somethingwhich can be achieved only if a good part of working capital is financed through long-term funds.
5. Style of credit: The group also recommends a change in ‘style of credit’ i.e., the manner inwhich bank finance is extended to the borrower. Further, the total credit limit of borrowershould be bifurcated into two components; the minimum level of borrowing which theborrower expects to use throughout the year (loan) and a demand cash credit, whichwould take care of his fluctuating requirements. Both these limits should be reviewedannually. It is recommended that the demand for cash credit should be charged a slightlyhigher interest rate than the loan component, so that the borrower is motivated to takehigher level of fixed component and a smaller limit of cash credit. This would enable thebankers to forecast the demand for credit more accurately.
6. Information system for banks: The following points may be noted in this regard:
(a) To ensure that the customers do not use the new credit facility in an unplannedmanner, the financing should be placed on a quarterly budgeting reporting systemfor operational purposes in the prescribed forms.
(b) Actual drawings within the sanctioned limit will be determined by the customer’sinflow and outflow of funds as reflected in the quarterly funds flow statements andthe permissible level of drawings will be the level as at the end of the previousquarter plus or minus the deficit or surplus shown in the funds flow statements.
(c) Variances are bound to arise in any budget or plan. The variances to the extent of say10% should be permissible and beyond this, the banker and the customer shoulddiscuss the reason.
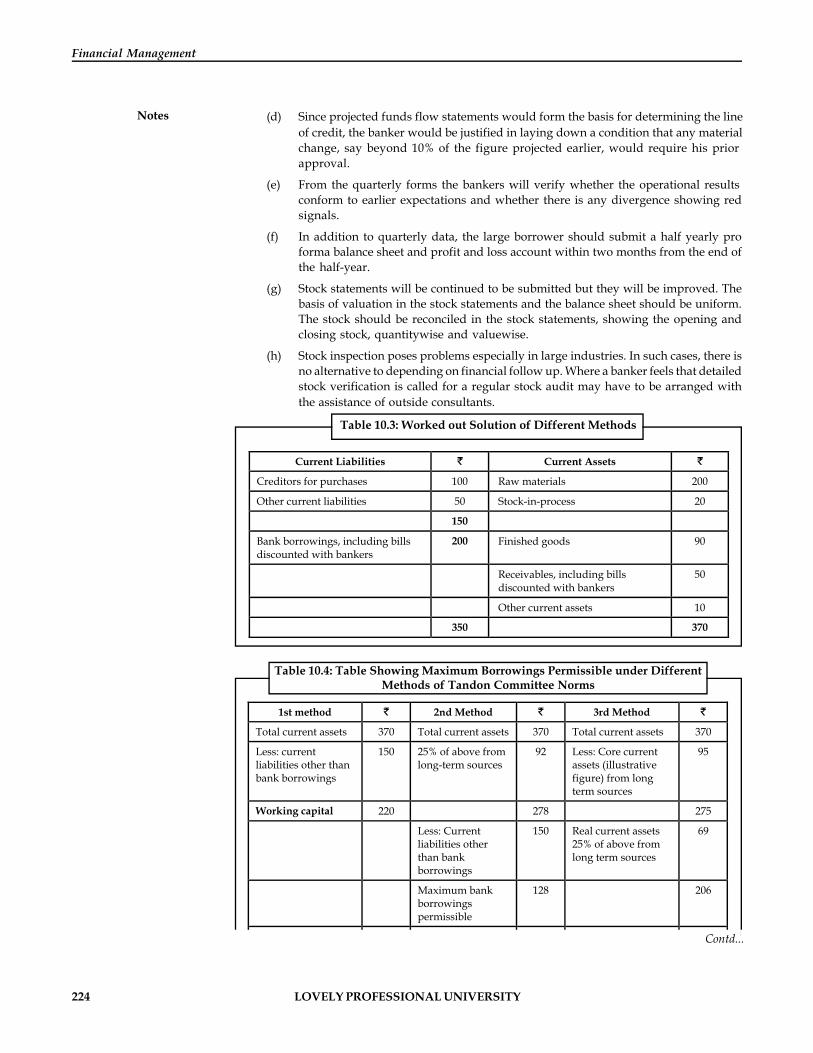
224 LOVELY PROFESSIONAL UNIVERSITY
Financial Management
Notes (d) Since projected funds flow statements would form the basis for determining the lineof credit, the banker would be justified in laying down a condition that any materialchange, say beyond 10% of the figure projected earlier, would require his priorapproval.
(e) From the quarterly forms the bankers will verify whether the operational resultsconform to earlier expectations and whether there is any divergence showing redsignals.
(f) In addition to quarterly data, the large borrower should submit a half yearly proforma balance sheet and profit and loss account within two months from the end ofthe half-year.
(g) Stock statements will be continued to be submitted but they will be improved. Thebasis of valuation in the stock statements and the balance sheet should be uniform.The stock should be reconciled in the stock statements, showing the opening andclosing stock, quantitywise and valuewise.
(h) Stock inspection poses problems especially in large industries. In such cases, there isno alternative to depending on financial follow up. Where a banker feels that detailedstock verification is called for a regular stock audit may have to be arranged withthe assistance of outside consultants.
Table 10.3: Worked out Solution of Different Methods
Current Liabilities Current Assets
Creditors for purchases 100 Raw materials 200
Other current liabilities 50 Stock-in-process 20
150
Bank borrowings, including bills discounted with bankers
200 Finished goods 90
Receivables, including bills discounted with bankers
50
Other current assets 10
350 370
Table 10.4: Table Showing Maximum Borrowings Permissible under DifferentMethods of Tandon Committee Norms
1st method 2nd Method 3rd Method
Total current assets 370 Total current assets 370 Total current assets 370
Less: current liabilities other than bank borrowings
150 25% of above from long-term sources
92 Less: Core current assets (illustrative figure) from long term sources
95
Working capital 220 278 275
Less: Current liabilities other than bank borrowings
150 Real current assets 25% of above from long term sources
69
Maximum bank borrowings permissible
128 206
25% of above from long term sources
55 Less: Current liabilities other than bank borrowings
150
Maximum bank borrowings permissible
165 Maximum bank borrowings permissible
56
Excess borrowings (200 – 165)
35 Excess borrowings (200 – 128)
72 Excess borrowings (200 – 56)
144
Current ratio _370_ 315
1.17:1 Current ratio _370_ 278
1.33:1 Current ratio _370_ 206
1.79:1
Contd...
LOVELY PROFESSIONAL UNIVERSITY 225
Unit 10: Working Capital Management
Notes
1st method Rs. 2nd Method Rs. 3rd Method Rs.
Total current assets 370 Total current assets 370 Total current assets 370
Less: current liabilities other than bank borrowings
150 25% of above from long-term sources
92 Less: Core current assets (illustrative figure) from long term sources
95
Working capital 220 278 275
Less: Current liabilities other than bank borrowings
150 Real current assets 25% of above from long term sources
69
Maximum bank borrowings permissible
128 206
25% of above from long term sources
55 Less: Current liabilities other than bank borrowings
150
Maximum bank borrowings permissible
165 Maximum bank borrowings permissible
56
Excess borrowings (200 – 165)
35 Excess borrowings (200 – 128)
72 Excess borrowings (200 – 56)
144
Current ratio _370_ 315
1.17:1 Current ratio _370_ 278
1.33:1 Current ratio _370_ 206
1.79:1
The amount of maximum permissible bank finance as per the recommendations of TandonCommittee, based on three methods is calculated as follows with the help of another example.
Example: Following is the balance sheet of XYZ Ltd. Calculate the amount of maximumpermissible bank finance by all the three methods for working capital as per Tandon Committeenorms. You are required to assume the level of core current assets to be 30 lakhs.
You are also required to calculate the current ratios under each method and compare the samewith the current ratios as recommended by the Committee, assuming that the bank has grantedMPBF.
Balance Sheet of XYZ Ltd.
As on 31st March 2000
( In lakhs)Liabilities Assets
Equity shares Rs. 10 each 200 Fixed assets 500
Retained earnings 200 Current assets
11% debentures 300 Inventory:
Public deposits 100 Raw materials 100
Trade creditors 80 W.I.P. 150
Bills payable 100 Finished goods 75 225
Debtors 100
Cash / Bank 55 480
980 980
Solution:
1. The amount of maximum permissible bank finance (MPBF) by the different methods ofTandon Committee norms can be calculated as follows:
1st Method = 75% (current assets – current liabilities)
= 75% ( 480 – 180) lakhs
= 75% ( 300) lakhs
= 225 lakhs
2nd Method = 75% of current assets – current liabilities
226 LOVELY PROFESSIONAL UNIVERSITY
Financial Management
Notes = 75% of 480 – 180 lakhs
= 360 lakhs – 180 lakhs
= 180 lakhs
3rd Method = 75% (current assets – core current assets) – currentliabilities
= 75% ( 480 lakhs – 30 lakhs) – 180 lakhs
= 75% ( 450 lakhs) – 180 lakhs
= 337.5 lakhs – 180 lakhs
= 157.5 lakhs
2. Calculation of current Ratios after MPBF limits from the bank under the different methods:
1st Method =Current Assets
Current Liabilities including cash credit limits
= 705 ( 480 + 225) lakhs
405 ( 180 + 225)
= 1.74: 1
2nd Method = 660 ( 480 + 180) lakhs
360 ( 180 + 180)
= 1.83: 1
3rd Method = 637.5 ( 480 + 157.5) lakhs
337.5 ( 180 + 157.5)
= 1.89: 1
Comment: In all the three instances, the position of current ratio is, therefore, satisfactory andmore than the minimum limits as prescribed by the Committee.
10.7.3 Recent Changes in Maximum Permissible Bank Finance (MPBF)
Banks have always been important providers of funds in Indian scenario. Two important changesin credit policy have been effected in beginning of 1997.
First, the RBI scrapped the concept of MPBF and the Indian Banks’ Association (IBA) groupproposed a new system. The MPBF was scrapped in order to facilitate need-based workingcapital without sticking to age-old policies, which might have outlived their utility. The salientfeatures of new system are:
For borrowers with requirements of up to 25 lakhs, credit limits will be computed afterdetailed discussions with borrower, without going into detailed evaluation.
For borrowers with requirements above 25 lakhs, but up to 5 crores, credit limit can beoffered up to 20% of the projected gross sales of the borrower.
For large borrowers not selling in the above categories, the cash budget system may beused to identify the working capital needs.

LOVELY PROFESSIONAL UNIVERSITY 227
Unit 10: Working Capital Management
NotesHowever, RBI permits banks to follow Tandon/Chore Committee guidelines and retain MPBFconcept with necessary modifications.
The cash budget approach has been widely criticized for its shortcoming like:
It does not disclose the extent of changes in various current assets or current liabilities of profit.It does not keep track the movement of assets and liabilities. Secondly, earlier the RBI hasprescribed overturn arrangements for financing working capital beyond 50 crores. Now it isnot essential to have consortium arrangements. However, banks may lend from consortium soas to spread the risks.
Task Why does an increase in the ratio of current to total assets decrease both profits andrisk as measured by net working capital?
Self Assessment
Fill in the blanks:
13. The Dehejia Committee suggested that the banks should make an appraisal of creditapplications with reference to the …………...financial situations of the client.
14. The ………………….had appointed various committees to ensure equitable distributionof bank resources to various sectors of economy.
15. The …………..was scrapped in order to facilitate need-based working capital withoutsticking to age-old policies
Case Study Case: Management
Mr. Bhatt is a young man of bright ideas. Although he is employed as an engineerin one of the large engineering concerns in Lahore (Pakistan), he spends all hisspare time developing new products in his private laboratory at home.
Currently, he has commercially provided a domestic appliance called Lavex, which wouldbe a great convenience kitchen to help housewives. He is not interest in manufacturingand selling his new products; his only interest in developing new products is to makemoney by way of selling patent rights to some established concerns. However, he releasesthat till he succeeds in selling the patent rights at the price he expects, he has to manufactureand sell the new products on ad hoc basis so as to demonstrate the commercial superiorityof his products and thereby, to induce the parties to buy the patents from him. With thisobjective, he is currently thinking of manufacturing and selling ‘Lavex’. He will not giveup his full-time job; he will supervise and guide ‘Lavex’ production and sales during hisspare time.
Bhatt has already spent 30,000 in developing the product. He proposes to buy thecomponent from other parties and keep the production activity to a minimum. Theminimum equipment required would cost 11,000. He would need to rent a small placefor 1,200 per month for production. He proposes to use his residence as office for salesactivity.
Contd...
228 LOVELY PROFESSIONAL UNIVERSITY
Financial Management
Notes Bhatt proposes to introduce the product in Chennai city only. His sales projections are asfollows:
January 60
February 40
March 110
April 140
May 220
June 180
He is not interested in pushing sales beyond 220 units per month as he cannot cope withthe production. He has budgeted 20,000 for sales promotion, which will be spent mostlyfor demonstration in leading department stores in the city. The promotion budget isscheduled as follows :
January 7,000
February 7,000
March 3,000
April 3,000
This selling price per units will be 280 and the dealers will be given 15 percent tradediscount. He calculates that about 50 unit will be needed for “demonstration and display”in the leading sores at his cost. Although the sales to dealers will be made on one month’scredit, he knows that the actual collections will be realized in about 4 weeks time. He rulesout cash sales.
Assembling is one of the activity in the production process. Components and materials,which will be purchased from outside parties strictly on 30 days credit will cost 160 perunit. Wages per month will be 6000. The production capacity per month will be 220 units.Wages will be paid weekly. Overhead expenses are estimated at 2800 per month. Materialsand components need to be ordered at least one month in advance. There will be inventoryof finished goods or goods in process as the production will be strictly against firm orders.Bhatt proposes to employ a full-time production, sales supervisor for 880 per month.
Mr. Bhatt wants to know how much finance will be needed for his first six months ofoperation and when, so that he may plan accordingly.
Questions
1. Discuss the nature of the financial problem involved.
2. Prepare the monthly cash budget for the first six months period of the proposedventure.
3. How can the above-mentioned problem be sorted out?
10.8 Summary
Working capital refers to the funds invested in current assets i.e., investment in sundrydebtors, cash and other current assets.
The total of investments in all current assets is known as gross working capital.
LOVELY PROFESSIONAL UNIVERSITY 229
Unit 10: Working Capital Management
Notes Net working capital refers to the excess of total current assets over total current liabilities.
The important factors Affecting Working Capital are General Nature of Business, ProductionPolicy, Credit Policy, Inventory Policy, Abnormal Factors and Market Conditions.
An optimum working capital ratio is dependent upon the business situation as such andthe nature and composition of various current assets.
The methods used for in Forecasting Working Capital Needs are: Current assets holdingperiod, Ratio of sales and Ratio of fixed investment
Two important issues in formulating the working capital policy are: What should be theratio of current assets to sales and what should be the ratio of short term financing to long-term financing?
The different short-term sources available for working capital are Bank credit, Transactioncredit, etc.
long-term sources of working capital finance are Retained earnings, debentures/bonds ofdifferent types, loans from financial institutions, venture capital financing etc.
Banks have always been important providers of funds in Indian scenario.
10.9 Keywords
Gross Working Capital: The total current assets are termed as the gross working capital.
Net Working Capital: The excess of current assets over current liabilities represents net workingcapital.
Permanent Working Capital: It is the minimum investment kept in the form of inventory of rawmaterials, work in progress, finished goods, stores and spares, and book debts to facilitateuninterrupted operation in a firm.
Temporary Working Capital: Any additional working capital apart from permanent workingcapital required to support the changing production and sales activities is referred to as temporaryworking capital.
Working Capital: It refers to short-term funds to meet operating expenses.
10.10 Review Questions
1. Why do we distinguish between permanent and variable working capital?
2. Why is the volume of sales the most important factor affecting working capital? Besidessales, what other factors affect working capital? Why?
3. What two processes are accomplished in the management of working capital?
4. Why should the manager know the percentage of funds in current accounts?
5. What are the two kinds of fluctuations in working capital levels? How should they beviewed?
6. What technique is used for identifying relationship between working capital levels andother variables such as sales level? What does this technique do?
7. At least three sets of guidelines for the sources of working capital are available. How arethe three similar? How are they different?

230 LOVELY PROFESSIONAL UNIVERSITY
Financial Management
Notes 8. Explain the rationale of the Tandon Committees’ recommendations. Describe the importantfeatures of the Tandon Committee recommendation.
9. “Expenses reduce working capital, whereas charging of depreciation does not”. Do youagree?
10. Can a company show a net loss in its profit and loss account and an increase in the workingcapital?
Answers: Self Assessment
1. gross 2. indirect. 3. under-capitalized
4. Over-capitalization 5. liquidity 6. less
7. operating cycle 8. Shorter 9. conservative
10. safety 11. Trade credit 12. Cash credit
13. total 14. Reserve Bank of India 15. MPBF
10.11 Further Readings
Books Dr Pradeep Kumar Sinha, Financial Management, New Delhi, Excel Books, 2009.
Van Horne, J.C. and Wachowicz, Jr, J.M., Fundamentals of Financial Management,New Delhi, Prentice Hall of India Pvt. Ltd., 1996, p. 2.
Chandra, P., Financial Management—Theory and Practice, New Delhi, Tata McGrawHill Publishing Company Ltd., 2002, p. 3.
LOVELY PROFESSIONAL UNIVERSITY 231
Unit 11: Inventory Management
NotesUnit 11: Inventory Management
CONTENTS
Objectives
Introduction
11.1 The Role of Inventory in Working Capital
11.1.1 The Purpose of Inventories
11.1.2 Types of Inventory
11.1.3 Inventory under Uncertainty and Safety Stock
11.2 Inventory Management
11.3 Various Techniques of Inventory Management
11.3.1 Setting of Various Stock Levels
11.3.2 ABC Analysis (called Always Better Control)
11.4 Establishment of System of Budget
11.4.1 Use of Perpetual Inventory Records and Continuous Stock Verification
11.4.2 Determining Economic Order Quantity
11.4.3 Review of Stores and Non-moving Items
11.4.4 Use of Control Ratios
11.4.5 Just-in-Time (JIT) System
11.4.6 Material Requirement Planning (MRP) system
11.5 Valuation of Material Issues and Inventory
11.5.1 Management Issues
11.5.2 Valuation of Periodic Inventories
11.5.3 Valuation of Perpetual Inventories
11.6 Comparison of Inventory Valuation Methods
11.6.1 Specific Identification
11.7 Summary
11.8 Keywords
11.9 Review Questions
11.10 Further Readings
Objectives
After studying this unit, you will be able to:
Recognize the meaning of inventory
Describe the role of inventory in working capital

232 LOVELY PROFESSIONAL UNIVERSITY
Financial Management
Notes Explain the various techniques of inventory management
Discuss the valuation of materials and inventories
Introduction
The term ‘inventory’ refers to the stockpile of the product a firm is offering for sale and thecomponents that make up the product. In other words, inventory is composed of assets that willbe sold in the future in the normal course of business operations. The assets which firms store asinventory in anticipation of needs are: (1) raw materials (2) work in process (semi-finishedgoods) and (3) finished goods. The raw material inventories certain items that are purchased bythe firm from others and are converted into finished product through manufacturing (production)process. They are an important impact of the final product. The work in progress is normally,partially or semi-finished goods, at the various stages of production in a multi-stage productionprocess. Finished goods represent final or completed products, which are available for sale. Theinventory of such goods consists of items that have been produced but are yet to be sold.
Inventory, as a current asset, differs from other current assets because it is not finance managerswho alone are involved here. Rather, all the functional areas in finance, marketing, productionand purchasing are involved.
11.1 The Role of Inventory in Working Capital
Inventories are components of the firm’s working capital and as such represent current asset.Some characteristics that are important in the broad context of working capital managementinclude:
1. Current asset: It is assumed that inventories will be converted into cash in the currentaccounting cycle, which is usually one year. There are exceptions to this, e.g., wine may bekept in casks or bottles for many years for the proper formation of the product. Amanufacturer of fine pianos may have a production process that exceeds one year.
2. Level of liquidity: Inventories are considered as a source of near cash for more of theproducts. Some firms at some time may hold some slow moving items that may not besold for a long time. With chronic slowdown or changes in the markets for goods theprospects for sale of entire product lines may be diminished. In these cases, the liquidityaspects of the inventories become important to the manager of working capital. Firmsmust keep a reasonable margin for uncertain operating environments, the analysis mustdiscount the liquidity value of the inventories significantly.
3. Liquidity lag: Inventories are tied to the firm’s pool of working capital through threespecific lags, namely:
(a) Creation lag: In majority of cases, inventories are purchased on credit, creating anaccount payable, when the raw materials are processed in the factory, cash is paidfor production expenses for the requirement during the period, labour is paid onpay day, utility bill for electricity is paid after the bill is submitted, Or
for goods purchased for resale, the firm may have 30 or more days to hold the goodsbefore payment is due.
(b) Storage lag: Once goods are available for sale, they will not be immediately convertedinto cash by sealing even when sales are moving fast, the firm will hold inventoryas a back up. Thus the firm will usually pay suppliers, workers, utility and otheroverhead expenses before the goods are actually sold. This lag represents a cost tothe firm.
LOVELY PROFESSIONAL UNIVERSITY 233
Unit 11: Inventory Management
Notes(c) Sale lag: Once goods have been sold, they normally do not create cash immediately.Most sales occur in credit and accounts receivable is created. The firm has to wait tocollect receivables. This lag also represents a cost to the firm.
4. Circulating activity: Inventories get rotated with other current assets. They get convertedinto cash and then invested again in inventory to continue the operating cycle.
11.1.1 The Purpose of Inventories
The specific benefit that accrue from holding inventories can be identified as follows:
1. Avoiding lost sales: In most cases, a firm must be prepared to deliver goods on demandwithout goods on hand which are ready to be sold, most firms would lose business. Shelfstock refers to items that are stored by the firm and sold with little or no modifications tocustome An automobile is an item of shelf stock even though customers may specifyminor variations, the basic item leaves a factory and is sold as a standard item. The samesituation exists for many items of heavy machinery, consumer products and high industrialgoods.
2. Getting quantity discounts: Due to bulk purchases many suppliers will reduce the price ofsuppliers and component parts or may offer discounts.
3. Reducing orders costs: By reducing the number of orders, the administration costs forraising purchase orders, acceptance and inspection note gets reduced.
4. Achieving efficient production runs: Frequent setups produce high start up costs, longerruns involve lower costs.
Inventories provide a ‘buffer’ between purchasing, producing and marketing goods. Rawmaterials and other inventory items can be purchased at appropriate times and in properamounts to take advantage of economic conditions and price incentives. The manufacturingprocess can occur in sufficiently long production runs and with pre-planned schedules toachieve efficiency and economies.
5. Reducing risk of production shortages: Manufacturing from produced goods with hundredor even thousands of components. One of them, however, small it may be, is to be in stockif the production is to be continued for a longer spell.
6. In-process inventory provides flexibility in production scheduling so that an efficientschedule and high utilization of capacity may be attained within in process inventory; abottleneck at any stage in the production process renders idle the machines and facilitiesat subsequent stages.
7. Finished goods inventory enables a firm to double its production programme andmarketing activities so that desirable results can be achieved on both the fronts. If finishedgoods inventory is available, the marketing department can meet the needs of customerpromptly, irrespective of the quantity and composition of goods flowing out of theproduction time currently.
11.1.2 Types of Inventory
Four types of inventories may be identified:
1. Raw material inventory: This consists of basic materials that have not been committed toproduction in a manufacturing firm. Raw materials that are purchased from time-to-time
234 LOVELY PROFESSIONAL UNIVERSITY
Financial Management
Notes to be used in the firm’s production operation range from iron ore awaiting processinginto steel to electronic components to be incorporated into stereo amplifiers. The purposeof maintaining raw material inventory is that material is taken up for productionimmediately so as to avoid delays in shipment of raw materials and thereby avoidproduction delays.
2. Stores and spares: These are materials/accessories which are incidental to theconsumption of Indian products and can be purchased at bulk quantity.
Example: bolts, nuts, clamps, screws, etc.,
These spare parts are usually bought from outside or sometimes they are manufacturedwithin the company too. This category also includes those products, which are producedin addition of the main products for the purpose of sale.
3. Work-in-process inventory: This category includes these materials that have beencommitted to the production process but have not been completed. The more complex andlengthy the production process, the larger will be the investment in work-in-processinventory.
4. Finished goods inventory: These are completed products awaiting sale. The purpose of afinished goods inventory is to couple the products and sales functions so that it no longeris necessary to produce the goods before a sale can occur.
The Nature of Inventory Planning and Control
Inventory must be sold in order to generate revenue. In a manufacturing firm, raw materialsmust first be converted into finished goods before products can be sold. Money invested ininventory cannot be invested in other earning as sets such as production or sales facilities.Therefore, it is necessary to ensure that excessive amounts of resources are not invested ininventories.
The purpose of inventory management is to minimize the cost of inventory without impairingthe efficient flow of production and sales activities. Inventory decisions are affected by the costof ordering inventory and the cost of carrying inventory as well as by the costs of not havingenough inventories in hand. Below are common types of inventory costs that are not incurred inrelation to the actual cost of the inventory itself:
Inventory ordering costs: Inventory ordering costs include:
Cost of acquiring recent price quotations
Costs of preparing and approving a purchase order
Cost of receiving shipments and checking against purchase orders
Cost of recording to purchase and moving the new inventory into storage.
Inventory carrying costs: Included under this category are:
Cost of money invested in inventory
Heat, length, power and depreciation costs for inventory storage facilities.
Inventory handling costs
Inventory insurance costs
Cost of taxes in inventory
Costs of spoilage, obsolescence and deterioration.
LOVELY PROFESSIONAL UNIVERSITY 235
Unit 11: Inventory Management
NotesInventory storage costs: The following are included in these costs:
Cost of lost sales
Cost of inefficient production runs
Cost of substituting more expensive raw materials
Penalty costs for late completion of contracts.
Inventory ordering costs and inventory carrying costs are used to compute the optimum sizeinventory. Inventory shortage costs are included in determining the optimum re-order pointfor inventory items.
Re-order point: The economic order quantity provides a manager with information about theoptimum order size for a particular item of inventory but it does not provide information aboutwhen the order should be placed. The re-order point is the inventory level of which the order isplaced. If a firm has the ability to buy and receive inventory items instantly, a new order isplaced when there are no more units on hand.
Unfortunately, few firms are able to get instant deliveries. Sometime is required between placingan order and receipt of the goods. This time period is called lead-time. If the lead-time is knownand daily demand is known, the reorder point is easy to find.
Example: SWT Company has a lead-time of 8 days for tyre orders. The daily demand is50 tyres. The lead-time demand or demand during lead-time is 8 × 50 = 400 tyres. If the companyplans to receive a new tyre shipment just as the inventory reaches zero, it should place an orderwhen the inventory level reaches 400 tyres. A new order is placed at an inventory level of400 tyres, 8 days before inventory reaches zero.
11.1.3 Inventory under Uncertainty and Safety Stock
The use of lead-time and lead-time demand in the analysis of reorder point assumes a knownconstant demand and lead-time often one or both of these fluctuate and are not known. Demandin particular is difficult to predict, because it can change from day-to-day. Delivery of inventoryis affected by the suppliers inventory levels and operating efficiency, as well as, by variations indelivery schedules of common carriers.
When lead-time or demand is uncertain, the analysis of the inventory reorder point is complicated.There may be a situation of possibility of remaining out of inventory, which is known asstockout. Running out of stock involves cost by way of lost profit in potential sales, customersill will, or the loss of the customer altogether. Raw materials inventory stockouts may causeexpensive start up costs, production inefficiencies, a switch to more expensive raw materials orpenalty costs for late delivery of contracted goods. Often, it is difficult to estimate stockout costs.
In order to avoid stockout costs, firms sometimes carry a safety stock, which is additionalinventory above what is needed. Safe stock is a cushion that the management uses to avoid oninterruption of normal activities due to stockouts.
The optimum inventory strategy is to increase safety stock as long as cost of carrying theadditional inventory is less than the expected cost of stockouts. The expected stockout cost is thecost of the stock out multiplied by its probability of occurring.
Example: gross margin is 35 per unit. Expected demand of 50 units per day means thata 1-day stock-out results in a stock out cost of 35 × 50 or 1,750. Management estimates thatwith the safety stock, there is a 30 per cent chance of stock out. The expected cost of a stockout is:
Expected stockout = stock out cost × probability of stockout
= 1750 × 0.30 = 525
236 LOVELY PROFESSIONAL UNIVERSITY
Financial Management
Notes The optimum strategy is to carry enough safety stocks that the cost of carrying the safety stockequals the expected cost of a stock out with a carrying cost of 12 per unit; the optimum safetystock is (525/12) i.e., 44 tyres. With a 30 per cent chance of a stockout, the arbitrary 100-unit safetystock is excessively sophisticated-Statistical models may be developed to address the issue ofoptimum safety stocks and reorder points.
Self Assessment
Fill in the blanks:
1. Inventory ordering costs and inventory carrying costs are used to compute the ………………inventory.
2. Inventories are tied to the firm’s pool of working capital through three specific lags,namely Creation lag Storage lag and …………..
3. In order to avoid stockout costs, firms sometimes carry a……………., which is additionalinventory above what is needed.
11.2 Inventory Management
The main objective of inventory management is to achieve maximum efficiency in productionand sales with the minimum investment in inventory.
Inventory consists of stock of materials, components, work-in-progress, finished products andstores and spares. The techniques commonly used for inventory management are as follows:
1. Setting of various stock levels
2. ABC analysis
3. Establishment of system of budgets
4. Use of perpetual inventory records and continuous stock verification
5. Determination of economic order quantity
6. Review of slow and non-moving items
7. Use of control ratios
8. Just-in-time (JIT) System
9. Material Requirement Planning (MRP) system
Self Assessment
Fill in the blanks:
4. Inventory consists of stock of materials, components, work-in-progress, finished productsand…………………...
5. The objective of inventory management is to achieve maximum efficiency in productionand sales with the ……………investment in inventory
11.3 Various Techniques of Inventory Management
11.3.1 Setting of Various Stock Levels
Minimum Level
It indicates the lowest figure of inventory balance which must be maintained in hand at alltimes, so that there is no stoppage of production due to non-availability of inventory.
LOVELY PROFESSIONAL UNIVERSITY 237
Unit 11: Inventory Management
NotesMain consideration for fixation of minimum level of inventory:
1. Information about maximum consumption and maximum delivery period in respect ofeach item to determine its reorder level.
2. Average rate of consumption for each inventory item.
3. Average delivery period for each item. Average delivery period = ½ (maximum period +minimum period)
Formula:
Minimum level of inventory = Re-order level – (Average rate of consumption ×Average time of inventory delivery)
Maximum level = It indicates figure of inventory quantity held in stock atany time.
The following are the considerations that govern the fixation of maximum level for variousinventory items:
1. It’s reorder level. The reorder itself depends on the maximum rate of consumption andmaximum delivery period.
2. The knowledge about minimum consumption and minimum delivery period for eachinventory item.
3. The figure of economic order quantity.
4. The availability of funds, storage space, nature of item and their price per unit are alsoimportant.
5. For imported material since of their irregular supply, the maximum level should be high.
Formula used for calculation of maximum level of inventory
= Reorder level × Reorder quantity – (Minimum Consumption × Minimum reorder period)
Reorder level
This level is between minimum and maximum levels, such that before the material ordered isreceived into stores, there is sufficient quantity on hand to cover with normal and abnormalconsumption situations. It is the level at what order for replenishment of stock should be placed.
The formula used for its calculation is as follows:
Reorder level = Maximum reorder period × Maximum Usage (or)
= Minimum level + (Avg. rate of consumption × Avg.time to obtain fresh supplies)
Now, Avg. inventory level = Maximum level + ½ Reorder quantity
OR = Maximum level + Minimum level
2
Did u know? What is Danger Level?
It is the level at which normal issues of raw material inventory are stopped and emergencyissues are only made.

238 LOVELY PROFESSIONAL UNIVERSITY
Financial Management
Notes Danger Level = Avg. Consumption × Lead time for emergencyPurchases
Example: Two components, A and B, are used as follows:
Normal usage 100 units/week
Maximum usage 150 units/week
Minimum usage 50 units/week
Reorder quantity A 600, B 1000
Reorder period A 4 to 6 weeks
B 2 to 4 weeks
Calculate for cash component:
1. Reorder level
2. Minimum level
3. Maximum level
4. Average Stock level
Solution:
1. Reorder level = Maximum usage/week × Maximum delivery period
Reorder level for A = 150 units × 6 = 900 units
Reorder level for B = 150 units × 4 = 600 units
2. Minimum level = Reorder level – (Normal usage × Avg. period)
Minimum level for A = 900 units – 50 units × (4 6)
2+
= 900 units – 250 units = 650 units
Minimum level for B = 600 units – 50 units × (2 4)
2+
= 450 units
3. Maximum level
= Reorder level + Reorder Qty – (Min. consumption ×Min. reorder period)
Maximum level for A = (900+600) – (50 units × 4 weeks)
= 1500 – 200 = 1300 units
Maximum level for B = (600+1000) – (50units × 2) = 1500 units
4. Average stock level = ½ (minimum + maximum stock level) Average stockfor component A = ½ (650 + 1300) = 975
Average stock for component
B = ½ (450 + 1500) = 975
11.3.2 ABC Analysis (called Always Better Control)
It is a system of inventory control where discriminating control is exercised over different itemsof stores classified on the basis of investment involved. Usually, the items are divided into three
LOVELY PROFESSIONAL UNIVERSITY 239
Unit 11: Inventory Management
Notescategories according to their importance, namely their value and frequency of replenishmentduring a period.
1. ‘A’ category of items consists of only a small percentage i.e., about 10% of the total itemshandled by the stores but require heavy investment (in rupee value) about 70% of the totalinventory value.
2. ‘B’ category of items (relatively less important) constitutes 20% of the total items handledby stores, having an investment (in rupee value) of about 20% of the total inventory value.
3. ‘C’ category consists of large number of items handled by stores say 70%, having relativelysmall investment say 10% of the total inventory value.
‘A’ category of items is controlled effectively by using a regular system, which ensures neitherover-stocking nor shortage of materials for production. The stocks of materials are controlledby fixing certain levels like maximum level, minimum level and reorder level. Reduction ininventory management costs is achieved by determining economic order quantity. To avoidshortage and to minimize heavy investment in inventories, the techniques of value analyses,variety reduction, standardization etc., are used.
In case of ‘B’ category of items, less degree of control as applicable to ‘A’ category items arewarranted. The orders for the items, belonging to this category, may be placed after reviewingthe situation periodically.
For ‘C’ category of items, there is no need of exercising constant control. Orders for these itemsare placed either at 6 months interval or yearly interval, depending on the consumption pattern.In this case, the objective is to economize an ordering and handling costs.
Example:
Category Cost Range
( )
Total No. of Items Total Cost
( )
C 1-500 12,000 10,00,000
B 501-2000 2,000 15,00,000
A 2001 – 100,000 1,000 100,00,000
15,000 125,00,000
Percentage of total items and costs
Category % of total Items
Cumulative % of Total Items
Percentage of Total Cost
Cumulative % of the Total Cost
A 7 7 80 80
B 13 20 12 92
C 80 100 8 100
11.4 Establishment of System of Budget
To control investment in inventories, it is necessary to know in advance about the inventoriesrequirements during a specific period, usually a year. The exact quantity of various types ofinventories and the time when they would be required can be known by studying carefullyproduction plans and production schedules. Based on this, inventories requirement budget canbe prepared. Such a budget will discourage the unnecessary investment in inventories.

240 LOVELY PROFESSIONAL UNIVERSITY
Financial Management
Notes 11.4.1 Use of Perpetual Inventory Records and Continuous StockVerification
Perpetual inventory represents a system of records maintained by the stores department. Itcomprises Bin Cards and Stores Ledger.
Bin cards maintain quantitative records of receipts, issues and closing balances of each item ofstores. Separate bin cards are maintained for each item. Each card is filled up with the physicalmovement of goods i.e., on its receipt and issue.
Like bin cards, the stores ledger is maintained to record all receipts and issue transaction inrespect of materials. It is filled up with the help of goods received note and material issuerequisitions.
A perpetual inventory is usually checked by a programme of continuous stock taking. Continuousstocktaking means the physical checking of these records (which are maintained under perpetualinventory) with actual stock. Perpetual inventory is essential for material control. It helpscontinuous stocktaking.
Stock verification may be periodical or continuous. Annual stock taking has certain inherentshortcomings e.g., all the items have to be covered in a given number of days, either theproduction dept. has to be shut down during these days to enable thorough checking of stock, orelse the verification has to be of limited character. On the other hand, the system of continuousstocktaking consists of counting and verifying the number of items daily throughout the year,so that during the year all the items of stores are covered three or four time. The stock verifiersare independent of stores and stores staff has no knowledge as to the particular items that arebeing checked on a particular date.
11.4.2 Determining Economic Order Quantity
Economic Order Quantity (EOQ) is the order size for some particular inventory item that resultsin lowest total inventory cost for the period. Total inventory cost consists of inventory orderingcost and investment carrying cost. An EOQ may be computed for each inventory item.
EOQ assumes that the relevant costs of inventory can be divided into order costs and carryingcosts (the model excludes the actual cost of the inventory). Each of them has certain keycomponents and characteristics. Order costs include the fixed costs of placing and receivingorders, the cost of writing, a purchase order, of processing the resulting paper work, and ofreceiving an order and checking it against the invoice. Order costs are stated in rupees per order.Carrying costs are the variable costs per unit of holding an item of inventory for a specificperiod of time. Carrying costs including storage costs, insurance costs, the cost of deteriorationand obsolescence, and the opportunity or financial costs of having funds invested in inventorythese costs are stated in Rupees per unit per period.
Order costs decrease as the size of the order increases. Carrying costs, however, increase withincreases in order size. The EOQ model analyzes the trade-off between order costs and carryingcosts to determine the order quantity that minimizes the total inventory cost.
Several methods for finding EOQ are available. One is trial and error, which requires computingthe total inventory cost at various order sizes. Eventually, the EOQ can be found or closelyapproximated by repeating the computation enough time. Another approach is to graph thecost. Although both methods can be used, the first is time-consuming and the second lacksprecision.

LOVELY PROFESSIONAL UNIVERSITY 241
Unit 11: Inventory Management
NotesA third approach is to calculate the optimum order size mathematically using a method calledthe Economic Order Quantity (EOQ) model, which yields the optimum order quantity with asingle set of calculations. The model is:
EOQ =2
Where, A = Annual usage units
S = Ordering cost per order
C = Inventory carrying cost per unit per annum
Notes The EOQ model rests on the several important assumptions:
1. There is a known constant demand.
2. Ordering costs are known and remain constant.
3. Carrying costs are known and remain constant.
4. Production and inventory capacity is unlimited.
Example: SWT Company, which is open Monday through Friday except for a 2-weekvacation period and 10 holidays. The firm operates a total of 240 business days a year. Below isgiven the demand and cost data for its most expensive steel belted radial tyre.
Avg. daily demand 50; Selling price 95/tyre
Cost 60/tyre; Ordering cost 500/order
Carrying cost 20 per cent of unit cost
A = 50 tyres a day × 240 business days = 12000
S = Cost of ordering is 500 per order,
C = 20% × 60 i.e., 12 per unit
Hence EOQ =2 1200 500
60 × 0.2
1000,000 = 1000 tyres
Hence, Economic Ordering Size is 1000 tyres
Number of order A
EOQ =12000 units 12 orders
1000 units/order
Ordering Cost = 12000 × 500 per oderA S = 6000
EOQ 1000 units per order
Carrying cost is function of average amount of inventory on hand multiplied by the carryingcost rate. The average inventory on hand is the order size divided by 2.
Average inventory =EOQ 1000 units = 500 units
2 2
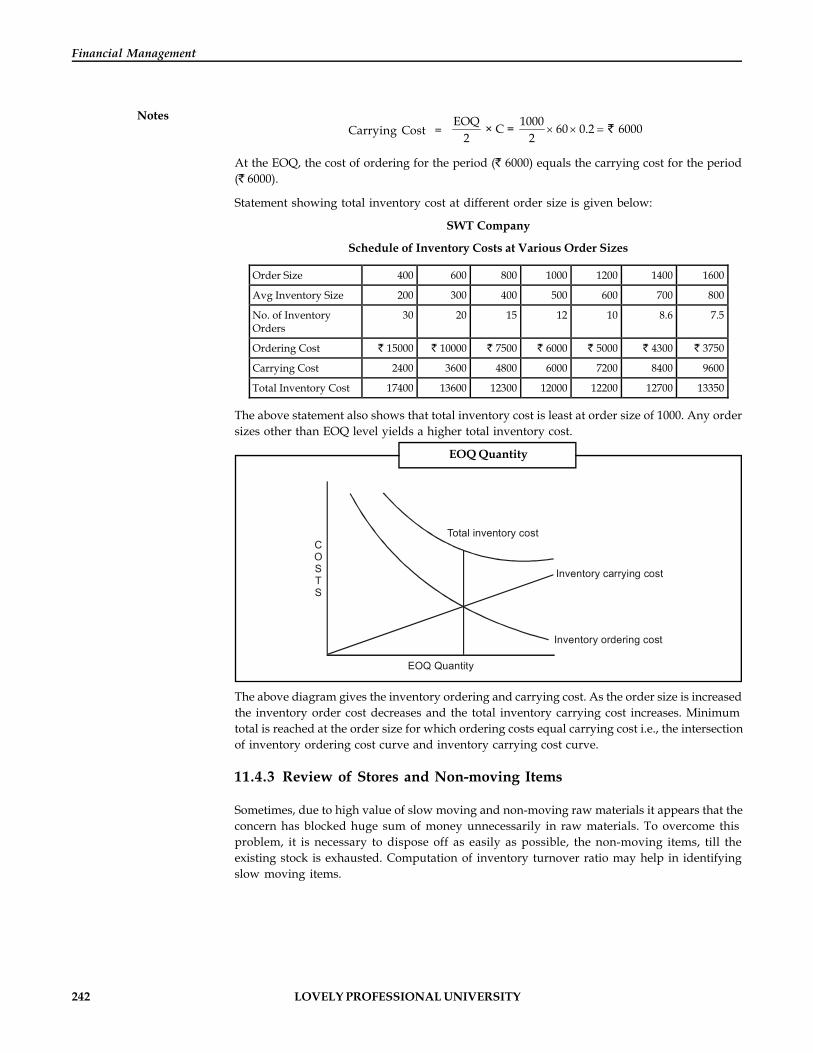
242 LOVELY PROFESSIONAL UNIVERSITY
Financial Management
NotesCarrying Cost =
EOQ 1000 × C = 60 0.2 60002 2
At the EOQ, the cost of ordering for the period ( 6000) equals the carrying cost for the period( 6000).
Statement showing total inventory cost at different order size is given below:
SWT Company
Schedule of Inventory Costs at Various Order Sizes
Order Size 400 600 800 1000 1200 1400 1600
Avg Inventory Size 200 300 400 500 600 700 800
No. of Inventory Orders
30 20 15 12 10 8.6 7.5
Ordering Cost 15000 10000 7500 6000 5000 4300 3750
Carrying Cost 2400 3600 4800 6000 7200 8400 9600
Total Inventory Cost 17400 13600 12300 12000 12200 12700 13350
The above statement also shows that total inventory cost is least at order size of 1000. Any ordersizes other than EOQ level yields a higher total inventory cost.
EOQ Quantity
COSTS
Total inventory cost
Inventory carrying cost
Inventory ordering cost
EOQ Quantity
The above diagram gives the inventory ordering and carrying cost. As the order size is increasedthe inventory order cost decreases and the total inventory carrying cost increases. Minimumtotal is reached at the order size for which ordering costs equal carrying cost i.e., the intersectionof inventory ordering cost curve and inventory carrying cost curve.
11.4.3 Review of Stores and Non-moving Items
Sometimes, due to high value of slow moving and non-moving raw materials it appears that theconcern has blocked huge sum of money unnecessarily in raw materials. To overcome thisproblem, it is necessary to dispose off as easily as possible, the non-moving items, till theexisting stock is exhausted. Computation of inventory turnover ratio may help in identifyingslow moving items.
LOVELY PROFESSIONAL UNIVERSITY 243
Unit 11: Inventory Management
Notes11.4.4 Use of Control Ratios
1. Input-output ratio: Inventory control can also be exercised by the use of input-outputratio. Input Output ratio is the ratio of the quantity of input of material to production andthe standard material content of the actual output. This ratio enables comparison of actualconsumption and standard consumption, thus indicating the usage of material is favourableor adverse.
2. Inventory Turnover ratio: It is computed as follows:
Inventory turnover ratio =Cost of materials consumed during the periodCost of average stock held during the period
Average Stock = ½ (Opening Stock + Closing Stock)
Computation of turnover ratios for different items of materials and comparison of the turnoverratio provides a useful guidance for measuring inventory performance. Therefore, it is possibleto know which is fast moving and which is slow moving. On this basis, attempt should be madeto reduce the amount of capital locked up and prevent over-stocking of the slow moving items.
11.4.5 Just-in-Time (JIT) System
The Just-in-Time (JIT) system is used to minimize inventory investment. The philosophy is thatmaterials should arrive exactly the time they are needed for production. Ideally the firm shouldhave work-in-process inventory. Because its objective is to minimize inventory investment, a JITsystem uses no (or little) safety stock. Close coordination among the firm’s employees, its suppliersand transporters must exist to ensure that material inputs arrive on time. Failure of the materialsto arrive on time results in a shutdown of the production line until the material arrives. Further,JIT system should ensure quality parts from the suppliers to ensure uninterrupted production.
11.4.6 Material Requirement Planning (MRP) system
Many companies used a Material Requirement Planning (MRP) system to determine what materialsto order and when to order. MRP applies EOQ concepts to determine how much to order. Bymeans of a computer, it stimulates each products bill of materials, inventory status andmanufacturing process. The bill of materials is simply a list of all the parts and materials that gointo making the finished product. For a given production plan, the computer stimulates materialsrequirements by comparing production needs to available inventory balances. On the basis ofthe time it takes for a product that is in process to move through the various production stagesand the lead time required to get materials, the MRP system determines when orders should beplaced for the various item on the bill of materials.
The advantage of an MRP system is that it forces the firm to consider its inventory needs morecarefully. The objective is to lower the firm’s inventory investment without impairing production.
Self Assessment
Fill in the blanks:
6. ………………..indicates the lowest figure of inventory balance which must be maintainedin hand at all times.
7. ………………is the ratio of the quantity of input of material to production and the standardmaterial content of the actual output.
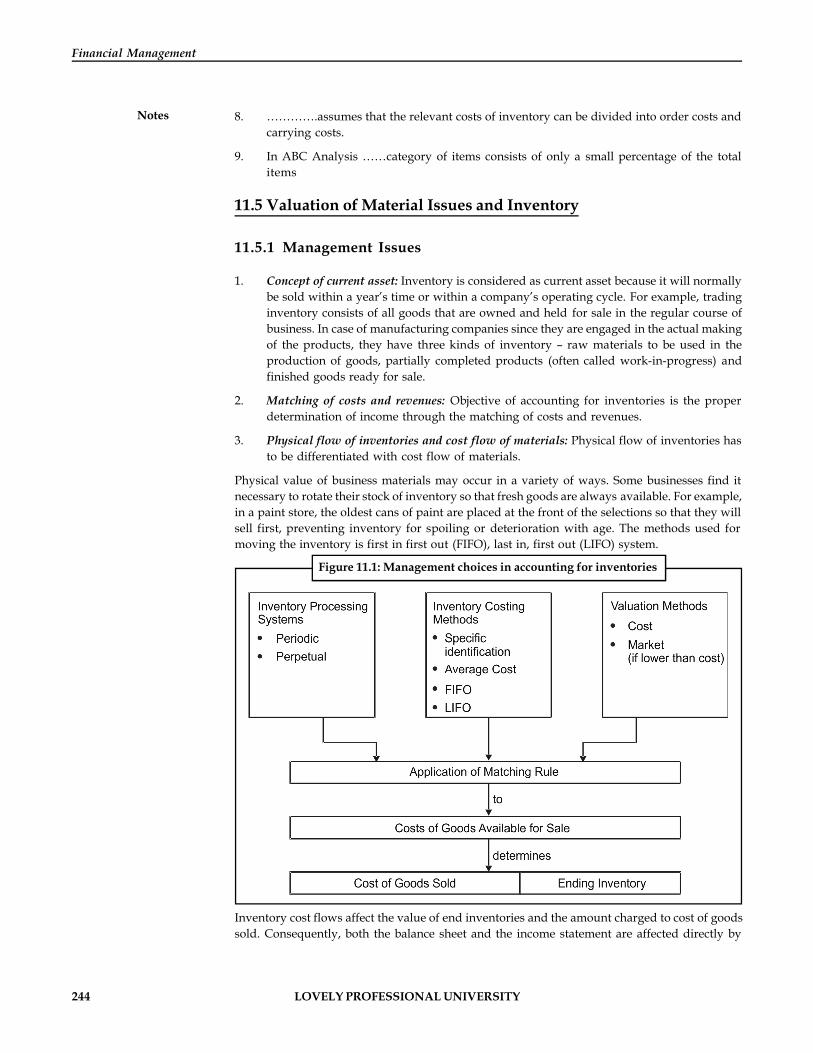
244 LOVELY PROFESSIONAL UNIVERSITY
Financial Management
Notes 8. ………….assumes that the relevant costs of inventory can be divided into order costs andcarrying costs.
9. In ABC Analysis ……category of items consists of only a small percentage of the totalitems
11.5 Valuation of Material Issues and Inventory
11.5.1 Management Issues
1. Concept of current asset: Inventory is considered as current asset because it will normallybe sold within a year’s time or within a company’s operating cycle. For example, tradinginventory consists of all goods that are owned and held for sale in the regular course ofbusiness. In case of manufacturing companies since they are engaged in the actual makingof the products, they have three kinds of inventory – raw materials to be used in theproduction of goods, partially completed products (often called work-in-progress) andfinished goods ready for sale.
2. Matching of costs and revenues: Objective of accounting for inventories is the properdetermination of income through the matching of costs and revenues.
3. Physical flow of inventories and cost flow of materials: Physical flow of inventories hasto be differentiated with cost flow of materials.
Physical value of business materials may occur in a variety of ways. Some businesses find itnecessary to rotate their stock of inventory so that fresh goods are always available. For example,in a paint store, the oldest cans of paint are placed at the front of the selections so that they willsell first, preventing inventory for spoiling or deterioration with age. The methods used formoving the inventory is first in first out (FIFO), last in, first out (LIFO) system.
Figure 11.1: Management choices in accounting for inventories
Inventory cost flows affect the value of end inventories and the amount charged to cost of goodssold. Consequently, both the balance sheet and the income statement are affected directly by

LOVELY PROFESSIONAL UNIVERSITY 245
Unit 11: Inventory Management
Notesinventory cost flows. The valuation inventory cost flows is more relevant, rather than physicalflow of inventory. A number of costing alternatives are used. First In, First Out (FIFO) assignsthe most recent cost to inventory and the oldest costs to cost of goods sold. Last In First Out(LIFO) assigns the most recent costs to cost of goods sold and oldest costs to inventory. A thirdalternative is to assign an average cost to inventory and cost of goods sold. The inventory costflow does not have to follow the physical movement of inventory. Inventory valuation usingFIFO, LIFO or average cost should satisfy the matching concept. The management choices inAccounting for Inventories are given in Figure
11.5.2 Valuation of Periodic Inventories
In periodic inventory systems, used primarily by trading organizations, purchases of inventoryare recorded in a purchases account rather than directly in the inventory account. When merchandiseis sold, the sales revenue is recorded but entry is made in cost of goods sold. Cost of goods sold iscomputed at the end of the accounting period, when financial statements are prepared.
In a trading organization, the beginning inventory balance and the purchases account balancesrepresent the cost of goods available for sale. In order to calculate the cost of goods sold, aphysical count is made of the merchandise remaining on hand. The next step is to value theinventory in hand by assigning to each unit a cost based on some cost flow assumption such asFIFO, LIFO or weighted average. The value of ending inventory is deducted from the cost ofgoods available for sale to compute cost of goods sold.
Example: In case of B Ltd., the opening balance as on 1st July consist of 18 units costing 10 each. During July, the company purchased 32 additional units as follows:
July 1 Beginning balance 18 units @ 10 180
July 11 Purchases 10 units @ 10.50 105
July 25 Purchases 12 units @ 11 132
July 30 Purchases 10 units @ 12 120
Total 50 units 537
During July, the company sold 30 of the 50 units available for sale leaving an end inventory of20 units. Sales were as follows:
July 3 Sale 8 units
July 17 Sale 5 units
July 28 Sale 17 units
Total 30 units
In order to prepare financial statements, B Co. Ltd. must assign value to the 20 units, end of theperiod inventory and 30 units, which were sold. The value depends on the inventory methodused by the company and on the cost flow assumption adopted. First, let us consider periodicinventories followed by perpetual inventory systems.
FIFO (First In First Out)
As the name suggest, the materials are issued in the order in which they are received in stores.Thus, each issue of material recovers the purchase price, which does not reflect the currentmarket price (if the prices do not remain same). This method is considered suitable in time offalling prices because the material cost charged to production will be high while the replacement
246 LOVELY PROFESSIONAL UNIVERSITY
Financial Management
Notes cost of materials will be low. But in the case of rising prices, if this method is adopted, the chargeto production will be low as compared to the replacement cost of materials. Consequently, itwould be difficult to purchase the same quantity of materials (as in the current period) in futurewithout having additional capital resources.
In the above illustration, with a beginning inventory of 180 and total purchases of 357 duringJuly, total cost of goods available for sale is 537. The physical inventory shows 20 unitsremaining on hand. With FIFO valuation we consider 20 units consist of the latest units acquired.
The ending inventory will be as follows:
10 units from July 30 purchases (last purchases) @ 12 120
10 units from July 25 purchases (2nd last purchases) @ 11 110
230
Cost of goods sold of 307 will be computed as follows:
Goods available for sale 537
Less end inventory 230
Cost of goods sold 307
LIFO (Last In, First Out)
Under this method (as the name suggests), the assumption is that the items of the last batch (lot)purchased are the first to be issued. Therefore, under this method, the price of the last batch (lot)is used for pricing the issues, until it is exhausted and so on. If, however, the quantity of the issueis more than the quantity of the latest lot than earlier (lot) and its price will be taken intoconsideration. For valuation of month end inventory, 20 units are assumed to be the earliestunits acquired. It will consist of the balance at the beginning and the part of the 1st unitspurchased during the month as below:
18 units from the beginning balance @ 10 units 180
2 units from July 11 purchases @ 10.50 21
201
Cost of goods sold is 336 in this case
Goods available for sale 537
Less end inventory 201
Cost of goods sold 336
Weighted Average
The weighted average cost of the inventory available in July is obtained by dividing the totalcost of inventory, including the beginning balance and July purchase, by the total units availablefor sale.
Cost of goods available for saleNo. of units available for sale = 10.74
Cost of ending inventory is 214.80 calculated as:
20 units × 10.74 = 214.80

LOVELY PROFESSIONAL UNIVERSITY 247
Unit 11: Inventory Management
NotesCost of goods sold is 322.20 calculated as:
30 units × 10.74 = 322.20
11.5.3 Valuation of Perpetual Inventories
In a perpetual inventory system, the inventory account contains a current record of all inventorytransactions. Such a system is particularly useful in a manufacturing firm, where a currentpurchase cost data are vital. A perpetual inventory system allows the firm to charge inventorycosts to production as soon as inventory is used. Each receipt of raw materials and issue toproduction (work in-progress) is recorded in the inventory account as the transactions occur.The Inventory account is current, hence the name ‘perpetual’.
As in periodic system, purchases in a perpetual system are recorded at their cost. When rawmaterials inventory is issued to production, its cost is transferred from the raw materialsinventory account to work-in-progress account. If the cost of raw materials change over time,some cost flow assumption must be made. Perpetual system may be maintained using specificidentification FIFO, LIFO or moving average. The illustration given below, deals withmerchandise inventory, but the same principle can be followed for transfer of raw material toWIP, transfer of WIP to finished goods and sale of finished goods.
Notes Specific Identification
Special identification requires an ability to follow the physical flow of each inventoryitem and its cost from acquisition through use or sale. The method is appropriate wheneach item of inventory can be separately identified and therefore has a cost that appliesonly to that item. Specific identification is used with unique and costly items such asjewelry, automobiles or custom made products (i.e., products as per customers’specifications).
First In First Out (FIFO)
Inventory cost flow with perpetual FIFO is illustrated as below. The units remaining in inventoryare always assumed to be those purchased most recently. After the July 17 sale of five units, the15 units remaining on hand consist of the most recent 10 units acquired on July 11 and five unitsfrom the beginning balance. Similarly, the sale of 17 units on July 28 first exhausts five unitsfrom the beginning balance, then 10 units acquired next on July 11, and finally two units purchasedmost recently on July 25.
If one compares the perpetual FIFO ending inventory balance with the periodic FIFO endinginventory balance, one can observe that two are identical. With FIFO valuation, periodic andperpetual system both produces the same ending inventory cost.
FIFO Perpetual Inventory Record of B Comapny Ltd.
Date Explanation Purchases Sales Balance
Units Units Cost Total Cost Units
Units Cost
Total Cost Units
Total Cost
July Rs Rs Rs Rs Rs
1 Balance 18 10.00 180 18 180
3 Sold 8 units - - - 8 10.00 80 10 100
11 Bought 10 units 10 10.50 105 - - - 20 205
17 Sold 5 units - - 5 10.00 50 15 155
25 Bought 12 units 12 11.00 132 - - - 27 287
28 Sold 17 units - - - 5 10.00 50 - -
0 10 10.50 105 - -
0 2 11.00 22 10 110
30 Bought 10 units 10 12.00 120 - - - 20 230
Contd...
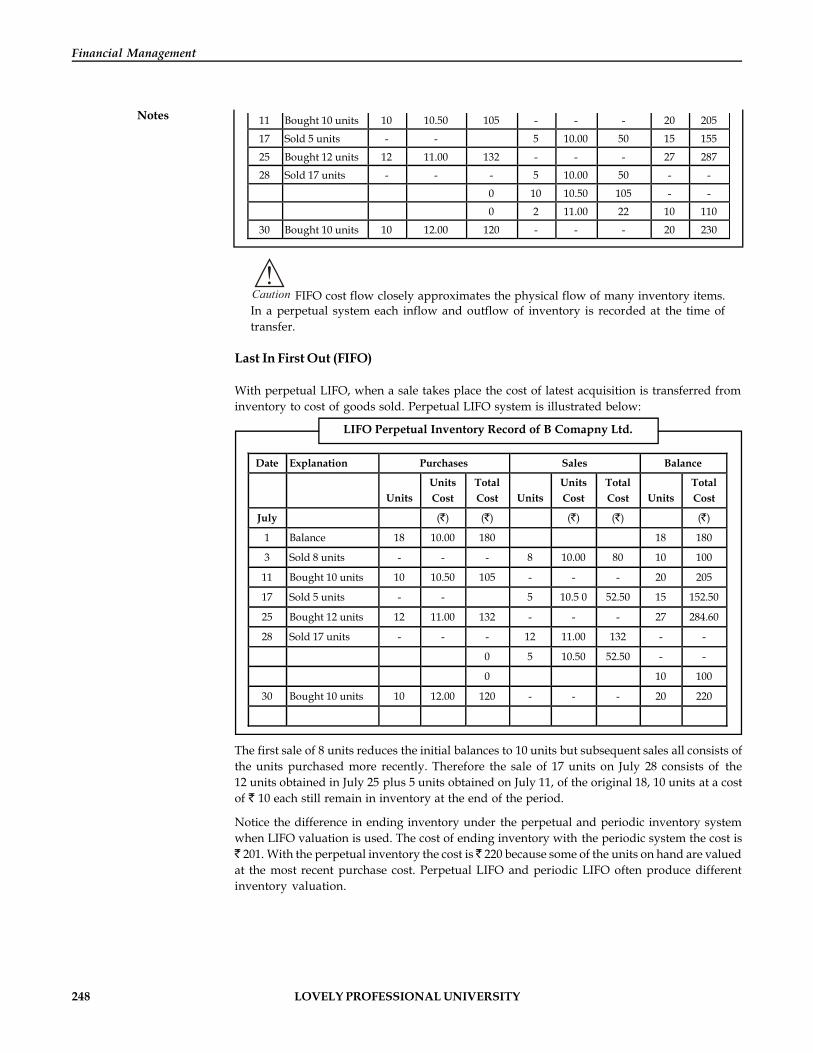
248 LOVELY PROFESSIONAL UNIVERSITY
Financial Management
Notes
Date Explanation Purchases Sales Balance
Units Units Cost Total Cost Units
Units Cost
Total Cost Units
Total Cost
July Rs Rs Rs Rs Rs
1 Balance 18 10.00 180 18 180
3 Sold 8 units - - - 8 10.00 80 10 100
11 Bought 10 units 10 10.50 105 - - - 20 205
17 Sold 5 units - - 5 10.00 50 15 155
25 Bought 12 units 12 11.00 132 - - - 27 287
28 Sold 17 units - - - 5 10.00 50 - -
0 10 10.50 105 - -
0 2 11.00 22 10 110
30 Bought 10 units 10 12.00 120 - - - 20 230
!Caution FIFO cost flow closely approximates the physical flow of many inventory items.In a perpetual system each inflow and outflow of inventory is recorded at the time oftransfer.
Last In First Out (FIFO)
With perpetual LIFO, when a sale takes place the cost of latest acquisition is transferred frominventory to cost of goods sold. Perpetual LIFO system is illustrated below:
LIFO Perpetual Inventory Record of B Comapny Ltd.
Date Explanation Purchases Sales Balance
Units Units Cost
Total Cost Units
Units Cost
Total Cost Units
Total Cost
July ( ) ( ) ( ) ( ) ( )
1 Balance 18 10.00 180 18 180
3 Sold 8 units - - - 8 10.00 80 10 100
11 Bought 10 units 10 10.50 105 - - - 20 205
17 Sold 5 units - - 5 10.5 0 52.50 15 152.50
25 Bought 12 units 12 11.00 132 - - - 27 284.60
28 Sold 17 units - - - 12 11.00 132 - -
0 5 10.50 52.50 - -
0 10 100
30 Bought 10 units 10 12.00 120 - - - 20 220
The first sale of 8 units reduces the initial balances to 10 units but subsequent sales all consists ofthe units purchased more recently. Therefore the sale of 17 units on July 28 consists of the12 units obtained in July 25 plus 5 units obtained on July 11, of the original 18, 10 units at a costof 10 each still remain in inventory at the end of the period.
Notice the difference in ending inventory under the perpetual and periodic inventory systemwhen LIFO valuation is used. The cost of ending inventory with the periodic system the cost is
201. With the perpetual inventory the cost is 220 because some of the units on hand are valuedat the most recent purchase cost. Perpetual LIFO and periodic LIFO often produce differentinventory valuation.
LOVELY PROFESSIONAL UNIVERSITY 249
Unit 11: Inventory Management
Notes
Did u know? The primary advantage of LIFO is that current costs are matched with currentrevenues. Consequently LIFO has definite tax advantage during periods of rising prices.
Average Cost/Moving Average
An average cost perpetual inventory system requires computing a new average cost each timeadditional inventory is purchased. This moving average is a weighted average of the units inhand after each acquisition. This is illustrated below. For example, the average cost of the unitsin hand after the July 11 purchase included 10 units at 10 each and 10 units at 10.50 each. Theaverage cost is 10.25, calculated by dividing the total cost of 205 by 20 units.
The units removed from inventory are valued at the average cost at the time of sale or use. Withcosts increasing over time the moving average cost also increases, but it always lags somewhatbehind the current cost of inventory. As usual, the average cost valuation falls somewherebetween FIFO and LIFO valuation.
Moving Average Perpetual Inventory Record of B Comapny Ltd.
Date Particulars Purchases Sales Balance
Units Unit Cost
Total Cost Units
Unit Cost
Total Cost Units
Unit Cost
Total Cost
July
1 Balance 18 10.00 180 18 10 180.00
3 Sold 8 units - - - 8 10.00 80.00 10 10 100.00
11 Bought 10 units 10 10.50 105 - - - 20 10.25 205.00
17 Sold 5 units - - 5 10.25 51.25 15 10.25 153.75
25 Bought 12 units 12 11.00 132 - - - 27 10.5833 285.75
28 Sold 17 units - - - 17 10.5833 179.92 10 10.5833 105.83
30 Bought 10 units 10 12.00 120 - - - 20 11.2915 225.83
!Caution The moving average inventory costs are between FIFO and LIFO cost. In a perpetualinventory system, a new average cost is computed every time, units are added to theinventory, units transferred out of inventory are costed at the recent computed averagecost.
Self Assessment
Fill in the blanks:
10. …………..assigns the most recent cost to inventory and the oldest costs to cost of goodssold.
11. ……………………assigns the most recent costs to cost of goods sold and oldest costs toinventory.
12. ……………………..inventory system requires computing a new average cost each timeadditional inventory is purchased.
250 LOVELY PROFESSIONAL UNIVERSITY
Financial Management
Notes 11.6 Comparison of Inventory Valuation Methods
The six inventory values obtained in the illustration are shown below. Assuming total sales of 500, gross margin varies from 164 to 193 depending on the inventory system and cost flow
assumptions applied in valuing the ending inventory.
Perpetual Inventory System of B Comapny Ltd.
FIFO Moving /Weighted Average LIFO ( ) ( ) ( )
Sales 500.00 500.00 500.00
Beginning inventory 180.00 180.00 180.00
Purchases 357.00 357.00 357.00
Goods available for sales 537.00 537.00 537.00
Less: ending inventory 230.00 225.83 220.00
Cost of goods sold 307.00 311.17 317.00
Gross margin 193.00 188.83 183.00
Perpetual Inventory System
FIFO Moving Average LIFO ( ) ( ) ( )
Sales 500.00 500.00 500.00
Beginning inventory 180.00 180.00 180.00
Purchases 357.00 357.00 357.00
Goods available for sales 537.00 537.00 537.00
Less: ending inventory 230.00 214.80 201.00
Cost of goods sold 307.00 322.20 336.00
Gross margin 193.00 177.80 164.00
Clearly the selection of an inventory valuation method has significant effect on inventoryvalues, product costs and determination of net income. If managers could select an inventoryvaluation method at will and change methods whenever they wished, they could easilymanipulate reported income, but the consistency principle, which requires the consistentapplication of accounting principles and methods over time, prevents such manipulation. Butone should be aware of the strengths and weaknesses of each of the inventory valuation methods.
11.6.1 Specific IdentificationThe advantage of specific identification is that it provides good matching of products costs andrevenues. Managers, in some situations, can adjust gross profit by selecting which units of aninventory are delivered to customer. Anyway, the method cannot be used where there are manytypes of inventory and inventory is received at frequent intervals.
First In First Out
Advantages1. It is simple to understand and easy to operate.2. It tends to conform to the physical movement of inventory and results in reporting
inventories on the balance sheet at a cost that is close to the current purchase price.3. In case of falling prices, the use of this method gives better results.

LOVELY PROFESSIONAL UNIVERSITY 251
Unit 11: Inventory Management
NotesDisadvantages
1. When prices are rising, the higher net income results in a higher income tax expense.
2. In case of rising prices, the real inputs of the concern being low, they may be inadequateto meet the concern’s demand to purchase raw materials at the ruling price.
Last In First Out
Advantages
1. Lower tax expense during period of rising prices, since net income tends to be stated morenearly in current terms, because revenues are matched with current rather than old productcosts. The lower tax expense results in improved cash flows.
Disadvantages
1. If used for a number of years, balance sheet inventory values tend to become grosslyunderstated, because inventories are reported at costs that existed several years ago.
2. If the company has to reduce its inventory below the amount normally at hand, productcosts calculated with old values appear abnormally low.
3. This method of valuation is not acceptable to income tax authorities.
Average Cost Methods
Inventory valuations at average cost are among the least popular methods. They seem to haveall the disadvantages of LIFO and FIFO and few advantages. Neither net income nor endinginventories are shown at current values.
Notes Selection of Pricing Method
No hard and fast rules of procedure have been laid down to select a method of pricingissues of materials. However, the ultimate choice of a method may be based on thefollowing considerations:
1. The method of costing used and the policy of management.
2. The frequency of purchases and issues.
3. The extent of price fluctuations.
4. The extent of work involved in recording, issuing and pricing materials.
5. Whether cost of materials used should reflect current or historical conditions.
Self Assessment
Fill in the blanks:
13. The selection of an inventory valuation method has significant effect on inventory values,…………… costs and determination of net income.
14. The advantage of …………………..is that it provides good matching of products costs andrevenues.
15. ……………..method of valuation is not acceptable to income tax authorities.
252 LOVELY PROFESSIONAL UNIVERSITY
Financial Management
Notes
Case Study Case: Inventory Levels
The Storage Corporation currently carries 25 million of inventory. The financemanager is considering whether to recommend a reduction in inventory costs atthe following information about inventory costs at various levels. The company’s
after-tax discount rate that is used to evaluate current asset policies is 6%. The companyearns a contribution margin of 20% on sales.
Rs 25 million Rs 23 million Rs 21 million
Storage costs 7,50,000 7,25,000 7,10,000
Spoilage costs 4,00,000 3,75,000 3,67,000
Daily sales 1,20,000 1,19,000 1,14,500
1 Would it be profitable for the company to reduce its inventory from 25 million to 23 million? (Calculate the change in after-tax income).
2 Would it be profitable for the company to reduce its inventory to 21 million?(Calculate the change in after-tax income.)
1 Reducing inventory from 25 to 23 million causes net income to:
DStorage cost = ( 7,50,000 – 7,25,000)(0.60) = 15,000
DSpoilage cost = ( 4,00,000 – 3,75,000)(0.60) = 15,000
DFinancing cost = ( 20,00,000)(0.06) = 1,20,000
DProfit on sales = ( 1,20,000 – 1,19,000)(365)(0.20)(0.60) = (43,800)
DNet Profit = 1,06,200
2 To determine if it is profitable to reduce inventory to 21 million, determine thechange in profits associated with reducing from 23 million. That is, you know that
23 million is better than 25 million and the decision is now whether to reduce itfurther to 21 million. Remember that decisions depend on incremental costs andbenefits.
Reducing inventory from 23 to 21 million causes net income to:
DStorage cost = ( 7,25,000 – 7,10,000)(0.60) = 9,000
DSpoilage cost = ( 3,75,000 – 3,67,000)(0.60) = 4,800
DFinancing cost = ( 20,00,000)(0.06) = 1,20,000
DProfit on sales = ( 1,19,000 – 1,14,500)(365)(0.20)(0.60) = (1,97,100)
DNet Profit = ( 63,300)
Given the choices, 23 million is the most profitable level of inventory.
Question
Fabrication Company requires steel for its fabrication work. The probability distributionsof the daily usage rate and the lead time for procurement are given below:
These distributions are independent
Contd...
LOVELY PROFESSIONAL UNIVERSITY 253
Unit 11: Inventory Management
NotesDaily usage rate in tonnes Probability Lead time in days Probability
4 0.3 5 .6
6 0.5 10 .2
8 0.2 15 .2
The stockout cost is estimated to be 4,000 per tonne. The carrying cost is 1,000 per tonneper year.
Required
1. What is the optimal level of safety stock?
2. What is the probability of stockout?
Source: Nitin Balwani, Accounting and Finance for Managers, Excel Books, New Delhi.
11.7 Summary
Inventory is composed of assets that will be sold in the future in the normal course ofbusiness operations.
Inventories provide a ‘buffer’ between purchasing, producing and marketing goods
Four types of inventories may be identified which are Raw material inventory, Stores andspares, Work-in-process inventory and Finished goods inventory.
The main objective of inventory management is to achieve maximum efficiency inproduction and sales with the minimum investment in inventory.
Minimum level indicates the lowest figure of inventory balance which must be maintainedin hand at all times, so that there is no stoppage of production
In ABC Analysis (called Always Better Control)ABC Analysis (called Always Better Control)the items are divided into three categories according to their importance, value andfrequency of replenishment during a period.
Economic Order Quantity (EOQ) is the order size for some particular inventory item thatresults in lowest total inventory cost for the period.
The Just-in-Time (JIT) system philosophy is that materials should arrive exactly the timethey are needed for production.
Many companies used a Material Requirement Planning (MRP) system to determine whatmaterials to order and when to order.
The methods used for moving the inventory is first in first out (FIFO), last in, first out(LIFO) system.
11.8 Keywords
Economic Order Quantity (EOQ): It refers to that level of inventory at which the total cost ofinventory is minimum
Inventory: The stockpile of the products a firm is offering for sales and the components thatmake up the product.
Optimum Level of Inventory: It is the level where the total costs of inventory is less.
254 LOVELY PROFESSIONAL UNIVERSITY
Financial Management
Notes Raw materials: It is the input that is converted into finished goods through a manufacturing orconversion process.
Work-in-progress: It is the stage of stocks between raw materials & finished goods.
11.9 Review Questions
1. Why is inventory management important?
2. Describe briefly three types of inventory costs associated with economic order quantityand reorder point compensation.
3. What is meant by a reorder point? What factors affect the inventory reorder point?
4. How does uncertainty affect inventory management?
5. Describe perpetual inventory and periodic inventory system.
6. Do FIFO perpetual and FIFO periodic always yield the same inventory valuation? DoLIFO perpetual and LIFO periodic always yield the same inventory valuation?
7. Compare the effect of LIFO and FIFO inventory valuation on the income statement andbalance sheet in periods of rising and falling prices.
8. What is meant by the ABC Inventory Control System? On what key promise is this systembased? What are its limitations?
9. What are likely to be the new points of each of the following managers about the levels ofthe various types of inventories: field, marketing, manufacturing, purchasing? What isinventory investment?
10. What factors make managing inventory more vital for companies regarding the issue ofeffective working capital management?
Answers: Self Assessment
1. optimum size 2. Sale lag. 3. safety stock
4. stores and spares 5. minimum 6. Minimum level
7. Input Output ratio 8. EOQ 9. A
10. FIFO 11. Last In First Out (LIFO) 12. Average cost perpetual
13. product 14. specific identification 15. LIFO
11.10 Further Readings
Books Dr Pradeep Kumar Sinha, Financial Management, New Delhi, Excel Books, 2009.
Van Horne, J.C. and Wachowicz, Jr, J.M., Fundamentals of Financial Management,New Delhi, Prentice Hall of India Pvt. Ltd., 1996, p. 2.
Chandra, P., Financial Management—Theory and Practice, New Delhi, Tata McGrawHill Publishing Company Ltd., 2002, p. 3.
LOVELY PROFESSIONAL UNIVERSITY 255
Unit 12: Receivables Management
NotesUnit 12: Receivables Management
CONTENTS
Objectives
Introduction
12.1 Costs and Benefits of Receivables
12.1.1 Costs
12.1.2 Benefits
12.1.3 Cost/Benefit Analysis
12.2 Three Crucial Decision Areas in Receivables Management
12.2.1 Credit Policies
12.2.2 Credit Terms
12.2.3 Collection Policies
12.3 Factoring and Credit Control
12.4 Managing International Credit
12.5 Summary
12.6 Keywords
12.7 Review Questions
12.8 Further Readings
Objectives
After studying this unit, you will be able to:
Identify the cost benefit analysis of receivables.
Describe the crucial decision areas in receivable management
Explain the Factoring and credit control
Discuss the management of international credit
Introduction
The term ‘receivable’ is defined as “debt owed to the firm by customers arising sale of goods orservices in the ordinary course of business”. When a firm makes an ordinary sale of goods orrenders services and does not receive payment it means that the firm has granted trade creditand the amount appears as receivables in the books of the seller, which will be collected infuture. Thus, accounts receivable represent an extension of credit to customers, allowing them areasonable period of time to pay for the goods or services which they have received.
256 LOVELY PROFESSIONAL UNIVERSITY
Financial Management
Notes 12.1 Costs and Benefits of Receivables
In modern competitive economic systems, sale of goods in credit is an essential part. In fact,credit sales and the receivables are treated as marketing tools to aid the sale of goods.
12.1.1 Costs
Costs associated are collection cost, capital cost, delinquency cost, and default cost. Costsassociated with extension of credit and accounts receivable
1. Collection cost: These are administrative costs incurred in collecting the receivables fromthe customers to whom credit sales are made. Included in the costs are (a) additionalexpenses in the creation and maintenance of credit department with staff, accountingrecords, stationery, postage and other related items, (b) expenses in acquiring creditinformation either through outside specialist agencies or by the staff of the firm itself.These expenses are incurred only if the firm does sell on credit. These costs are likely to besemi-variable since up to a certain point, the existing staff will be able to carry on theincreased workload, but beyond that, additional staff will be required. Some costs arevariable, e.g., getting credit information from outside agencies in respect of new customersadded.
2. Capital cost: Accounts receivable is an investment in assets, and hence have to be financedthereby involving a cost. The cost on the use of additional capital to support credit sales,which alternatively could be profitably employed elsewhere is therefore a part of the costof extending credit or otherwise.
3. Delinquency cost: This arises when the customers fail to meet their obligations on due dateafter the expiry of the credit period. Such costs are called delinquency costs. The importantcomponents of this cost are: (a) blocking of funds for an extended period, (b) cost associatedwith the steps to be initiated to the over dues, such as reminders and the collection efforts,legal charges, where necessary, etc.
4. Default cost: If the firm is not able to recover the over dues because of the inability of thecustomers, such debts are treated as bad debts and have to be written off. Such costs areknown as default costs associated with credit sales and accounts receivable.
Did u know? With relaxation of credit standards, default expenses (i.e., bad debt expenses)go up. If credit standards are made more restrictive, bad debt expenses go down.
12.1.2 Benefits
Benefits from credit sales and receivables management are increased sales and increased profits.The impact of a liberal policy of trade credit is likely to have two forms. First, it is oriented tosales expansion i.e., to increase sales to existing customers or attract new customers. Secondly,the firm may extend credit to protect its current sales against emerging competition. Here themotive is sales retention. As a result of increased sales, profitability also increases since thefirm’s fixed costs get distributed on a larger volume i.e., fixed cost per unit to be absorbed getsreduced, increasing the profits of the firm.
12.1.3 Cost/Benefit Analysis
From the above discussion, it is clear that investments in receivables involve both benefits andcosts. The extension of trade credit has a major impact on sales, costs and profitability other

LOVELY PROFESSIONAL UNIVERSITY 257
Unit 12: Receivables Management
Notesthings being equal, a relatively liberal policy and therefore higher investments in receivable,will produce larger sales. However, costs will be higher with liberal policies than with stringentmeasures. Therefore, accounts receivable management should aim at trade off between profit(benefit) and risk (cost). That is to say, decision to loosen funds to receivables (or the decision togrant credit) will be based on a comparison of the benefits and costs involved. While determiningthe optimum level of receivables, the costs and benefits to be compared are marginal costs andbenefits i.e., the firm should only consider the incremental benefits and costs that result from achange in the receivables or trade policy. Obviously, it can go on extending credit facility till theincremental benefits are more than the incremental costs.
Notes Credit sales are generally made on open account that means, there is no formalacknowledgement of debt obligation through any financial instrument. However,extension of credit involves risk and cost. The benefits as well as cost to determine the goalof receivable management.
Self Assessment
Fill in the blanks:
1. …………….cost arises when the customers fail to meet their obligations on due date afterthe expiry of the credit period.
2. ……………….are administrative costs incurred in collecting the receivables from thecustomers to whom credit sales are made.
3. Costs will be higher with liberal policies than with …………….measures.
4. While determining the optimum level of receivables, the costs and benefits to be comparedare ……………..costs and benefits
12.2 Three Crucial Decision Areas in Receivables Management
The three crucial decision areas in receivable management are (a) credit policies (b) credit termsand (c) collection policies.
12.2.1 Credit Policies
It involves a trade-off between profits on additional sales that arise due to credit being extendedon the one hand and cost of carrying the receivables and bad debt losses on the other. The creditpolicy of a firm provides the framework to determine (1) whether or not to extend credit to acustomer and (2) how much credit to extend. The credit policy decision has two dimensions(1) credit standards and (2) credit analysis.
Credit Standards
The term ‘credit standards’ represents the basic criteria for the extension of credit to customers. Thequantitative bases of establishing credit standards are factors such as credit ratings, credit references,average payment period, and certain financial ratio. We are interested in illustrating the trade-offbetween benefit and cost to the firm as a whole and therefore not considering the individualcomponents of credit standards. The trade-off with reference to credit standards covers the collectioncost, the average collection period, level of bad debt losses, and level of sales. These factors shouldbe considered while considering whether to relax credit standards or not.
258 LOVELY PROFESSIONAL UNIVERSITY
Financial Management
Notes The implication of relaxed credit standards is more credit, a larger credit department to serviceaccounts and related matters and increase in collection costs.
A relaxation in credit standard implies an increase in sales, which in turn, leads to higheraverage accounts receivables. Further, relaxed standards would enable credit to get extended toeven less creditworthy customers, resulting in longer period to pay over dues. The reverse willhappen if credit standards are tightened.
Further, changing credit standards can also be expected to change the volume of sales. Asstandards are relaxed, sales are expected to increase; conversely a tightening is expected to causea decline in sales.
!Caution It must be kept in mind that with relaxation in credit standards, bad expenses willgo up.
The effect of alternative credit standards is illustrated in the following example:
Example: A firm is currently selling a product at 10 per unit. The most recent sales (allcredit) were 60,000 units. The variable cost per unit is 6 and the average cost per unit given asales volume of 60,000 units is 8. The firm’s total fixed cost is 120,000. The average collectionperiod may be assumed to be 30 days.
The firm is contemplating a relaxation of credit standards that is expected to result in a 15 percent increase in rupee sales. The average collection would increase to 45 days with no change inbad debt expenses. The increase in collection expenses may be assessed to be negligible. Thefirms required return on investment is 15 per cent.
Should the firm relax the credit standard?
Solution:
Current Plan:
Sales Revenue 60,000 × 10/- 600,000
Less Cost:
Variable 60,000 × 6 360,000
Fixed 120,000 480,000
Profit on Sales 120,000
Less: Interest @ 15% on average receivables
1 month credit period hence avg. receivables
Cost of sales ´ + ´æ ö
ç ÷è ø
8 60,000 6 9000360 = 40,000 × 0.15 6,000
Net Profit 114,000
Proposed Plan
Sales Revenue 60000 × 1.15 × 10 690,000
Less cost:

LOVELY PROFESSIONAL UNIVERSITY 259
Unit 12: Receivables Management
NotesVariable 60,000 × 6 × 1.15 414,000
Fixed 120,000 534,000
Profit on sales 156,000
Less Interest @ 15% on average receivables 10,013
i.e., ´´
534000 1.515%12
Net Profit 145,987
Hence, increase in profits of the firm and the firm should relax the credit standard 31,987
Credit Analysis
Besides establishing credit standards, a firm should develop procedures for evaluating creditapplicants. Two basic steps are involved in the credit investigation process – obtaining creditinformation and analysis of credit information.
Did u know? On the basis of credit analysis the decision to grant credit to a customer aswell as the quantum of credit is taken.
Sources of credit information are internal and external. Internal means various forms filled inby the customers giving details of financial operation, trade references of firms with whom thecustomer has business, behaviour of the customer in terms of historical payment pattern inrespect of existing credit customer. External sources include copy of the published financialstatements, trade references and bank references. Finally, specialist credit bureau reports fromorganizations specializing in supplying credit information can also be utilized.
Once the credit information has been collected from different sources, the next step is to determinecredit worthiness of the applicant. There are no established procedures to analyze the information.The analysis should cover two aspects – quantitative and qualitative.
The assessment of the quantitative aspect is based on factual information available from thefinancial statements, the past records of the firm and so on. Another step may be through a ratioanalysis of the liquidity, profitability and financial capacity of the applicant and comparisonwith the industry average. Again trend analysis over a period of time will reveal the financialstrength of the customer. Another approach may be to prepare an ageing schedule of the accountspayable of the applicant. This will give an insight into the past payment pattern of the customer.
The quantitative assessment should be supplemented by qualitative interpretation of theapplicants credit worthiness. For example, quality of management, references from othersuppliers, bank references and specialist bureau reports.
12.2.2 Credit Terms
Credit terms have three components:
1. Credit period in terms of time for which credit is extended, during this period the overdueamount must be paid by the customer;
2. Cash discount, if any, which the customer can take advantage of i.e., overdue amount willbe reduced by this amount; and
3. Cash discount period, which refers to the duration during which the discount can beavailed of.
260 LOVELY PROFESSIONAL UNIVERSITY
Financial Management
Notes These terms are usually written as 2/10 net 30. The abbreviation 2/10 net 30 means that thecustomer is entitled to 2% cash discount if he pays within 10 days (discount period) after thebeginning of the credit period of 30 days). If, however, he does not want to take advantage of thediscount he may pay within 30 days. If not made within a maximum period of 30 days, thecustomer would be deemed to have defaulted.
The credit terms such as the credit standards, affect the profitability as well as the cost of thisfirm. The three components of credit terms, namely, the rate of discount, period of discount andthe credit period affect the trade-off. Here the analysis is restricted from the point of suppliers oftrade credit.
The cash discount has implications for the sales volume, average collection period, bad debtexpenses and profit per unit. The sales volume will increase. The grant of discount impliesreduced prices. If the demand for the products is elastic, reduction in prices will result in highersales volume.
!Caution A firm should determine the credit terms on the basis of cost benefit trade-off.
Since the customers would like to take advantage of the discount and pay within the discountperiod, the average collection period would be reduced. The reduction in the collection periodwould lead to a reduction in the investment in receivables and also the cost. The decrease in theaverage collection period would also cause a fall in bad debt expenses. As a result, profits willincrease. The discount would have a negative effect in the profits. This is because the decrease inprices would affect the profit margin per unit of sale. Increase in credit period will increase thesales volume, average collection period and bad debt expenses. A reduction in credit period islikely to have an opposite effect.
Example: In our example, assume that the firm is contemplating to allow 2% discountfor payment prior to the 10th day after a credit sale. It would be recalled that the current averagecollection period is 30 days, credit sales are 60,000 units. The variable cost per unit is 6 as theaverage cost per unit is 8.
It is expected that if discounts are offered, sales will increase by 15% i.e., to 69000 units and theaverage collection period will drop to 15 days. Assume, bad debt expenses will not be affected,return on investment expected by the firm is 15%, 60% of the total sales will be on discount.Should the firm implement the proposal?
Solution:
Benefit:
Profit on sales = Additional units × (sales price – variable cost)
= 9000 × (10 – 6) 36,000
Saving on avg. collection period
Present: Average investment in receivable at cost
60,000 × 812 40,000
Proposed: Average investment in receivables
(60,000 × 8) + (9000 × 6)24 22,250
LOVELY PROFESSIONAL UNIVERSITY 261
Unit 12: Receivables Management
NotesReduction 17,750
Int. @ 15% on saving 17750 × 0.15 2,663
38,663
Cost, 2% on 60% of 69000 × 10 8,280
Net benefit 30,383
Example: Suppose the firm is contemplating an increase in the credit period from 30 – 60days. The average collection period, which is at 45 days, is expected to increase to 75 days. It isalso likely that the bad debt or expenses will increase from the current level of 1% to 3% of sales.Total credit sales are expected to increase from the current levels of 60,000 units to 69,000 units.The present average cost per unit is 8; the variable cost sales per unit are 6 and 10 per unitrespectively. Assume the firm expects a return of 15%. Should the firm extend the credit period?
Solution: The decision should be taken on the basis of comparison of benefits and costs associatedwith the decision. The benefits arising from additional profits from additional sales, while thecosts include the cost of additional investments in receivables and additional bad debt expenses:
1. Profit on additional sales 4 × 9000 36,000
2. Cost of additional investment in receivables
Proposed investment =´ + ´æ ö
ç ÷è ø
8 60,000 6 9000360 × 75 = 111,250
Present investment =Accounts Receivable at time chosen
Average daily sales × 45
60,000
Additional investment proposed 51,250
Cost of additional investment at 15% 7,688
3. Additional bad debt expense
Bad debt with proposed credit period 3% on 690,000 20,700
Bad debts with present plan 1% × 600,000 6000
Hence additional bad debt expenses 14,700
Thus, the total cost associated with the extension of credit period is 7688 + 14700 i.e., 22,388.As against this, the benefit comes to 36,000. There is therefore a net gain of 13,612. The firmmust be advised to extend the credit period from 30 to 60 days.
Example: XYZ Corporation is considering relaxing its present credit policy and is in theprocess of evaluating two proposed policies. Currently the firm has annual credit sales of 50lakhs and accounts receivable turnover ratio of 4 times a year. The current level of loss due tobad debts is 1,50,000.The firm is required to give a return of 25% on the investment in newaccounts receivable. The company’s variable costs are 70% of the selling price. Given the followingfurther information, which is a better option?

262 LOVELY PROFESSIONAL UNIVERSITY
Financial Management
Notes Present Policy Policy Option I Policy Option II
Annual credit sales 50,00,000 60,00,000 67,50,000
Accounts receivable turnover ratio 4 times 3 times 2.4 times
Bad debt losses 1,50,000 300,000 4,50,000
Solution: XYZ Corporation
Decision-making (liberalization of credit terms)
Present Policy ( )
Policy Option 1 ( )
Policy Option II ( )
Sales revenue Less variable cost contribution
50,00,000
35,00,00015,00,000
60,00,000 42,00,000–18,00,000
67,50,000 47,25,000–20,25,000
Less other relevant costs Bad debt losses Investment cost (Notes)
1,50,000 218,750
300,000
3,50,000
4,50,000
4,92,187.50
Contribution margin-final 11,31,250 11,50,000 10,82,812.50.
Policy option I is the better option.
Notes: Present policy: 35,00,000/4times = 875,000. Its cost @ 25% = 218,750
Option 1 : 42,00,000/3times = 14,00,000. Its cost @ 25% = 3,50,000
Option 2 : 47,25, 000/2.4times = 19,68,750.Its cost @ 25% = 4,92,187.50
12.2.3 Collection Policies
Efficient and timely collection of debtors ensure that bad debt losses are reduced to the minimumand the average collection period is shorter. If the firm spends more resources, on utilization ofdebts, it is likely to have smaller bad debts. Thus, a firm must work out the optimum amountthat it should spend on collection of debtors. This involves a trade-off between the levels ofexpenditure on the one hand and decreases in bad debt losses and appropriate investment indebtors on the other.
The collection cost of the firm has to work in a manner that it does not create too much resentmentamongst the customers. On the other hand, it has to keep the amount of outstanding paymentsin check. Hence, it has to work in a very smooth manner and diplomatically too.
It is important that clear-cut procedures regarding credit collection are set up. Such proceduresmust answer questions like the following:
1. How long a is debtor balance allowed to exist before collection process is started?
2. What should be the procedure of follow up with defaulting customer? How are remindersare to be sent and how should each successive reminder be drafted?
3. Should there be collection machinery whereby personal calls by company’s representativesare made?
4. What should be the procedure for dealing with doubtful accounts? Is legal action to beinitiated? How should account be handled?
LOVELY PROFESSIONAL UNIVERSITY 263
Unit 12: Receivables Management
NotesMonitoring of Receivables
1. Computation of average age of receivables: It involves computation of average collection
period as follows: Accounts Receivable at time chosen
Average daily sales
2. Ageing schedule: An important insight into the collection pattern of the preparation oftheir ageing schedule. In this, receivables are classified according to their age, say1-30 days, 31-60 days, 61-90 days, 91-120 days and 121 days and above. This classificationhelps the firm in its collection efforts and enables the management to have a closer controlover the quality of individual accounts. The agency schedule provides an effective methodof comparing the liquidity of receivables with the liquidity of receivables in the past aswell as that of another firm in the same industry. This comparison can be made periodically.The ageing schedule provides a useful supplement to average collection period receivables/sales analysis.
3. Collection programme:
(a) Monitoring the state of receivables
(b) Intimating to customers when due date approaches
(c) Telegraphic and telephone advice to customers on the due dates
(d) Threat of legal action on overdue accounts
(e) Legal action on overdue accounts.
4. Collection matrix: In order to correctly study the changes in the payment behaviour ofcustomer, it is helpful to look at the pattern of collections associated with credit sales. Thefollowing table shows an illustrative collection matrix.
Example: The credit sales during the month of January are collected as follows:
10% in January (the month of sales), 42% in February (the first following month), 36% in March(the second following month) and 12% in April (the third following month).
From the collection pattern, one can judge whether the collection is improving, stable ordeteriorating. A secondary benefit of such an analysis is that it provides a historical record ofcollection percentage. That could be useful in projecting monthly receipts for each budgetingperiod.
Collection Matrix
Percentage of receivables colleted during the
Jan Sales
Feb Sales
March Sales
April Sales
May Sales
Month of sales 10 14 13 15 9
First following month 42 35 38 40 35
Second following month 36 40 26 21 26
Third following month 12 11 23 19 25
Fourth following month 5 5

264 LOVELY PROFESSIONAL UNIVERSITY
Financial Management
Notes
Task ABC Company’s existing sales are 180 lakhs. It is currently extending a creditperiod of ‘net 30 days’ to its customers. The company’s contribution to sales ratio is 20 percent and the cost of funds is 15 per cent. The company is contemplating to increase its salesby 16 lakhs to be achieved by means of lengthening the existing period to ‘net 45 days’.The bad debt losses on additional sales is expected to be 5 per cent. Should the company goin for a policy change or not.
Self Assessment
Fill in the blanks:
5. The …………………represents the basic criteria for the extension of credit to customers.
6. Efficient and timely collection of debtors ensures that ……………losses are reduced to theminimum and the average collection period is shorter.
7. Credit terms have three components which are………………; Cash discount and Cashdiscount period.
8. If the demand for the products is elastic, reduction in prices will result in ……….....salesvolume.
12.3 Factoring and Credit Control
A large firm has some advantages, in managing its accounts receivable. First, it may be possiblefor divisions to pool information on the creditworthiness of its customers. Second, there arepotential companies of scale in record keeping, billing, etc., especially if the process can becomputerized. Third, debt collection is a specialized business that calls for experience andjudgement. The small firm may not be able to hire or train a specialized credit manager. However,it may be able to obtain some of the economies by parking part of the job out to a factor and thearrangement is known as factoring.
Factoring is a collection and finance service designed to improve the cash flow position of thesellers by converting sales invoices into ready cash. It is a continuing arrangement between thefactor and the seller client, the factor purchases the client’s debtors and in relation theretocontrols the credit extended to the customers and administer the sales ledger.
1. Under an agreement between the seller and selling firm, the latter makes an appraisal ofthe creditworthiness of the potential customers and may also set the credit limit and termsof credit for different customers.
2. The sales documents will contain the instructions to make the payment directly to thefactory that is responsible for the collection.
3. When the payment is received by the factor on the date, the factor shall deduct its fees,charges, etc., (as agreed) and credit the balance to the firm’s accounts.
4. In some cases, if agreed, the factor firm may also provide advance finance to the sellingfirm for which it may charge from the selling firm. In a way, this tantamount to billdiscounting by the factor firm. However, factoring is something more than mere billdiscounting, as the former includes analysis of the credit worthiness of the customer too.The factor may pay whole or a substantial portion of the sales value to the selling firmimmediately on sales being affected. The balance, if any, may be paid on the normal duedate. The mechanism of factoring has been presented in following figure:
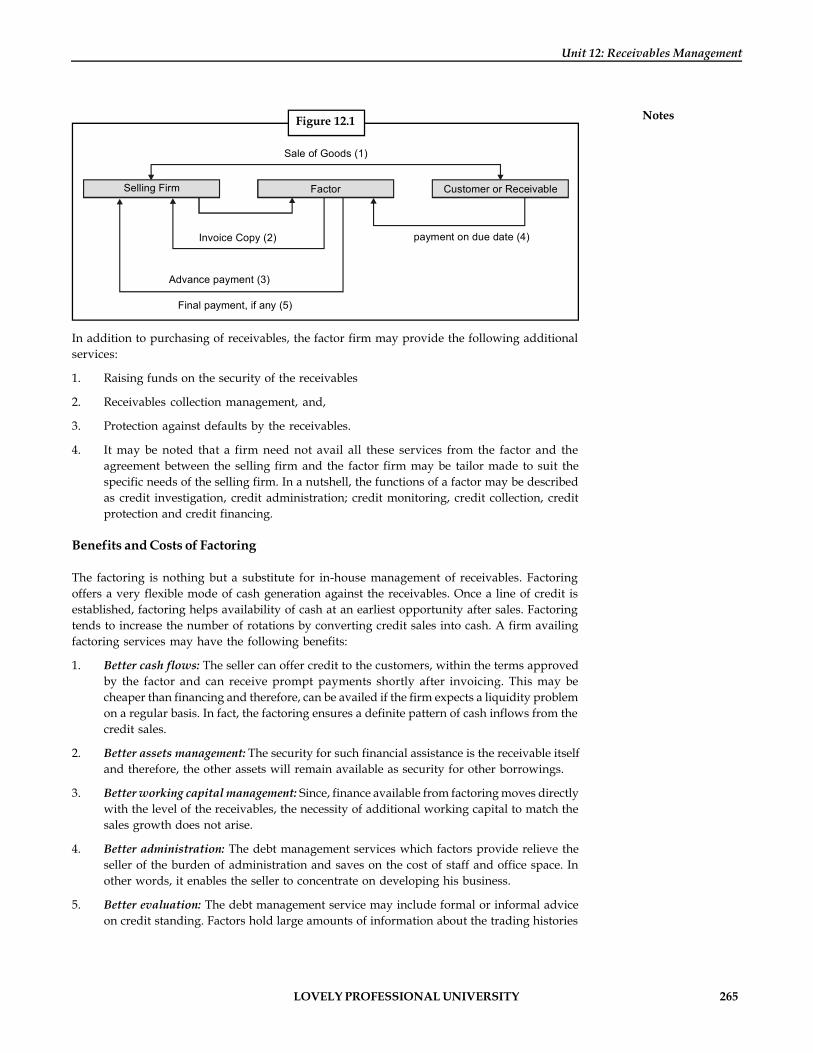
LOVELY PROFESSIONAL UNIVERSITY 265
Unit 12: Receivables Management
NotesFigure 12.1
Sale of Goods (1)
FactorSelling Firm Customer or Receivable
Invoice Copy (2)
Advance payment (3)
Final payment, if any (5)
payment on due date (4)
In addition to purchasing of receivables, the factor firm may provide the following additionalservices:
1. Raising funds on the security of the receivables
2. Receivables collection management, and,
3. Protection against defaults by the receivables.
4. It may be noted that a firm need not avail all these services from the factor and theagreement between the selling firm and the factor firm may be tailor made to suit thespecific needs of the selling firm. In a nutshell, the functions of a factor may be describedas credit investigation, credit administration; credit monitoring, credit collection, creditprotection and credit financing.
Benefits and Costs of Factoring
The factoring is nothing but a substitute for in-house management of receivables. Factoringoffers a very flexible mode of cash generation against the receivables. Once a line of credit isestablished, factoring helps availability of cash at an earliest opportunity after sales. Factoringtends to increase the number of rotations by converting credit sales into cash. A firm availingfactoring services may have the following benefits:
1. Better cash flows: The seller can offer credit to the customers, within the terms approvedby the factor and can receive prompt payments shortly after invoicing. This may becheaper than financing and therefore, can be availed if the firm expects a liquidity problemon a regular basis. In fact, the factoring ensures a definite pattern of cash inflows from thecredit sales.
2. Better assets management: The security for such financial assistance is the receivable itselfand therefore, the other assets will remain available as security for other borrowings.
3. Better working capital management: Since, finance available from factoring moves directlywith the level of the receivables, the necessity of additional working capital to match thesales growth does not arise.
4. Better administration: The debt management services which factors provide relieve theseller of the burden of administration and saves on the cost of staff and office space. Inother words, it enables the seller to concentrate on developing his business.
5. Better evaluation: The debt management service may include formal or informal adviceon credit standing. Factors hold large amounts of information about the trading histories
266 LOVELY PROFESSIONAL UNIVERSITY
Financial Management
Notes of firms. This can be valuable to those who are using factoring services and can therebyavoid doing business with customers having poor track record.
6. Better risk management: In case of non-recourse factoring, the seller will have the advantageof repositioning the risk of customers not paying their due bills. This will cost more thanrecourse factoring and thereby allows the seller to escape the consequences of customer’sdefault.
However, the factoring involves some monetary and non-monetary costs as follows:
1. Monetary costs:
(a) The factor firm usually charges substantial fees and commission for the collection ofreceivables.
(b) The advance finance provided by the factor firm would be available at a higherinterest costs than the usual rate of interest.
2. Non-monetary costs:
(a) The factor firm doing the evaluation of the creditworthiness of the customer will beprimarily concerned with the minimization of risk of delays and defaults. In theprocess, it may tend to ignore possible sale prospect.
(b) A factor is a third party to the customer and the latter not feel comfortable whiledealing with it.
(c) The factoring of receivables may be considered as a symptom of financial weakness.Thus, while evaluation the use of factoring services, the firm must analyze the costsand benefits associated with the factoring. It may be noted that though factoring isa costly service, yet some firms may find it to be more economical than to establishtheir own collection department.
Self Assessment
Fill in the blanks:
9. Factoring is a collection and finance service designed to improve the cash flow position ofthe sellers by converting ………………..into ready cash.
10. The ………………is a substitute for in-house management of receivables.
11. The advance finance provided by the factor firm would be available at a ………........interestcosts than the usual rate of interest
12. The factoring of receivables may be considered as a symptom of financial ………………
12.4 Managing International Credit
Credit management is difficult task for managers of purely domestic companies, and thesetasks, become much more complex for companies that operate internationally. This is partlybecause international operations typically expose a firm to exchange rate risk. It is also due tothe perils involved in shipping goods to long distance and to cross at least two internationalboundaries.
Exports of finished goods are usually priced in the currency of the importers’ local market.Therefore, a US company that sells a product in Japan, would have to price that product inJapanese yen and extend credit to Japanese wholesale in local currency (yen). If yen depreciatesagainst the dollar before the US exporter collects its account receivable, the US company experience
LOVELY PROFESSIONAL UNIVERSITY 267
Unit 12: Receivables Management
Notesan exchange rate loss, the yen collected are worth fewer dollars than expected at the time whenthe sale was made. The exchange rate variation can happen the other way yielding an exchangerate gain to the US exporter.
For a major currency such as the Japanese Yen, the exporter can bridge against this risk by usingcurrency, forward or option markets, but it is costly to do, particularly for relatively smallamounts.
This risk may be further magnified because credit standards may be different and acceptablecollection techniques much different.
Notes The exporter cannot take the “not to bother” approach and concede foreign marketsto international rivals. Those export sales, if carefully monitored and (where possible)effectively hedged against exchange rate risk, often prove to be very profitable.
Self Assessment
Fill in the blanks:
13. International operations typically expose a firm to …………………risk.
14. For a major currency, the exporter can bridge against the risk by using currency, forwardor …………….markets.
15. This risk in international credit may be further magnified because credit standards may bedifferent and …………………techniques much different.
Case Study Case: Agarwal Cast Company Inc.
On August 30, 2006, Agarwal Cast Company Inc., applied for a $200,000 loan from themain office of the National bank of New York. The application was forwarded to thebank’s commercial loan department.
Gupta, the President and Principal Stockholder of Agarwal cast, applied for the loan inperson. He told the loan officer that he had been in business since February 1976, but thathe had considerable prior experience in flooring and carpets since he had worked as anindividual contractor for the past 20 year. Most of this time, he had worked in Frankfertand Michigan. He finally decided to “work for himself” and he formed the company withBerry Hook, a former co-worker. This information seemed to be consistent with the Dunand Bradstreet report obtained by the bank.
According to Gupta, the purpose of the loan was to assist him in carrying his receivablesuntil they could be collected. He explained that the flooring business required him tospend considerable cash to purchase materials but his customers would not pay until thejob was done. Since he was relatively new in the business, he did not feel that he couldcompete if he had to require a sizeable deposit or payment in advance. Instead, he couldquote for higher profits, if he was willing to wait until completion of the job for payment.To show that his operation was sound, he included a list of customers and projects with hisloan application. He also included a list of current receivables.
Contd...

268 LOVELY PROFESSIONAL UNIVERSITY
Financial Management
Notes Gupta told the loan officer that he had monitored his firm’s financial status closely andthat he had financial reports prepared every six months. He said that the would send acopy to the bank. In addition, he was willing to file a personal financial statement with thebank.
Question
Prepare your recommendation on Agarwal Cast Company.
12.5 Summary
Receivable is defined as debt owed to the firm by customers arising sale of goods orservices in the ordinary course of business.
The three crucial decision areas in receivable management are (a) credit policies (b) creditterms and (c) collection policies.Credit Policies involves a trade-off between profits onadditional sales that arise due to credit being extended on the one hand and cost of carryingthe receivables and bad debt losses on the other.
Credit terms have three components which are Credit period, Cash discount and Cashdiscount period.
The collection cost of the firm has to work in a manner that it does not create too muchresentment amongst the customer
Factoring is a collection and finance service designed to improve the cash flow position ofthe sellers by converting sales invoices into ready cash.
Factoring offers a very flexible mode of cash generation against the receivables.
Credit management is difficult task for managers that operate internationally becauseinternational operations typically expose a firm to exchange rate risk.
12.6 Keywords
Collection Policy: It is the procedures passed to collect amount receivables, when they becomedue.
Credit Standards: It refers to the minimum criteria for the extension of credit to a customer.
Credit Terms: It means the stipulations under which goods or services are sold on credit.
Receivables: It is defined as debt owed to the firm by customers arising from sale of goods orservices in the ordinary course of business.
Receivables Management: It involves decision areas: credit standards, credit period, cash discountsand collection procedures.
12.7 Review Questions
1. Explain the objectives of credit polity of/or firm. What are the elements of a credit policy?
2. What are the techniques of control of receivables? Explain the “Ageing Schedule”.
3. Who do you mean by factoring? Explain the benefits of factoring.
4. Why are a firm’s regular credit terms typically conform to those of its industry?
5. What are the basic trade-offs in a tightening of credit standards?
LOVELY PROFESSIONAL UNIVERSITY 269
Unit 12: Receivables Management
Notes6. Why are the risks involved in international credit management more complex than thoseassociated are true or false with purely domestic credit sales?
7. Analyse the benefit of the receivables management to the corporates.
8. Elucidate the consequences of liberal versus stiff credit standards.
9. Examine the different sources of credit information to the corporates & to the agencies.
10. Examine the factors that influence the size of investment in receivables.
Answers: Self Assessment
1. Delinquency 2. Collection cost 3. stringent
4. marginal 5. credit standards 6. bad debt
7. Credit period 8. higher 9. sales invoices
10. factoring 11. higher 12. weakness.
13. exchange rate 14. option 15. acceptable collection
12.8 Further Readings
Books Dr Pradeep Kumar Sinha, Financial Management, New Delhi, Excel Books, 2009.
Van Horne, J.C. and Wachowicz, Jr, J.M., Fundamentals of Financial Management,New Delhi, Prentice Hall of India Pvt. Ltd., 1996, p. 2.
Chandra, P., Financial Management - Theory and Practice, New Delhi, Tata McGrawHill Publishing Company Ltd., 2002, p. 3.
270 LOVELY PROFESSIONAL UNIVERSITY
Financial Management
Notes Unit 13: Management of Cash
CONTENTS
Objectives
Introduction
13.1 Cash Management
13.1.1 Cash Management Planning Aspects
13.1.2 Cash Management Control Aspects
13.2 Cash Collection and Disbursement Systems
13.2.1 Concept of Float
13.2.2 Managing Float
13.3 Cash Management Models
13.3.1 William J Baumol’s Economic Order Quantity Model
13.3.2 Miller – Orr Cash Management Model
13.4 Treasury Management
13.5 The Cash Conversion Cycle
13.6 Management of Marketable Securities
13.7 Summary
13.8 Keywords
13.9 Review Questions
13.10 Further Readings
Objectives
After studying this unit, you will be able to:
Describe the management of cash
Discuss cash management planning and control aspects
Explain the different cash management models
Recognize the cash conversion cycle
Introduction
Management of cash is an important function of the finance manager. The modern day businesscomprises of numerous units spread over vast geographical areas. It is the duty of the financemanager to provide adequate cash to each of the units. For the survival of the business, it isabsolutely essential that there should be adequate cash. It is the duty of finance manager tomaintain liquidity at all parts of the organization while managing cash. On the other hand, hehas also to ensure that there are no funds blocked in idle cash. Idle cash resources entail a greatdeal of cost in terms of interest charges and in terms of opportunities costs. Hence, the questionof costs of idle cash must also be kept in mind by the finance manager. A cash managementscheme, therefore, is a delicate balance between the twin objectives of liquidity and costs.

LOVELY PROFESSIONAL UNIVERSITY 271
Unit 13: Management of Cash
Notes13.1 Cash Management
Need for Cash
The following are four motives for holding cash:
1. Transaction need: Cash facilitates the meeting of the day-to-day expenses and otherpayments on the debts. Normally, inflows of cash from operations should be sufficient forthis purpose. But sometimes this inflow may be temporarily blocked. In such cases, it isonly the reserve cash balance that can enable the firm to make its payments in time.
2. Speculative needs: Cash may be held in order to take advantage of profitable opportunitiesthat may present themselves and which may be lost for want of ready cash/settlement.
3. Precautionary needs: Cash may be held to act as for providing safety against unexpectedevents. Safety as is typified by the saying that a man has only three friends – an old wife,an old dog and money at bank.
4. Compensation motive: Another motive to hold cash balances is to compensate banks forproviding certain services and loans.
Nature of Cash Management
The exact nature of a cash management system would depend upon the organizational structureof an enterprise. In a highly centralized organization, the system would be such that the centralor head office controls the inflows and outflows of cash on a routine and daily basis. In adecentralized form of organization, where the divisions have complete responsibility ofconducting their affairs, it may not be possible and advisable for the central office to exercise adetailed control over cash inflows and outflows.
Self Assessment
Fill in the blanks:
1. Cash held in order to take advantage of profitable opportunities comes under the motiveof ………………needs.
2. The exact nature of a cash management system would depend upon the ……………………..of an enterprise.
13.1.1 Cash Management—Planning Aspects
The first step in cash management is to estimate the requirements of cash. For this purpose, cashflow statements and cash budgets are required to be prepared.
Did u know? What is Cash budget?
Cash budget is the plan of receipts and payments of cash during the budget period.
272 LOVELY PROFESSIONAL UNIVERSITY
Financial Management
Notes Cash budget represents cash requirements of business during the budget period. Cash budgetcan be prepared for either short or for long periods.
1. Cash budgets for short period: Preparation of cash budget month by month would involvemaking the following estimates:
(a) As regards receipts:
(i) Receipts from debtors;
(ii) Cash sales; and
(iii) Any other sources of receipt of cash (say, dividend from a subsidiary company).
(b) As regards payments:
(i) Payments to be made for purchases;
(ii) Payments to be made for expenses;
(iii) Payments that are made periodically but not every month;
Debenture interest; Income tax paid in advance Sales tax etc.
(iv) Special payments to be made in a particular months, for example dividends toshareholders, redemption of debentures, repayments of loan, payment forassets acquired, etc.,
2. Cash budget for long period: Long-range cash forecast often resembles the projected sourceand application of funds statement. The following procedures may be adopted to preparelong-range cash forecasts:
(a) Take the cash at bank and in the beginning of the year;
(b) Add:
(i) Trading profit (before tax) expected to be earned;
(ii) Depreciation and other development expenses incurred to be written off;
(iii) Sale proceeds of assets;
(iv) Proceeds of fresh issue of shares or debentures; and
(v) Reduction in working capital that is current assets (except cash) less currentliabilities.
3. Deduct:
(i) Dividends to be paid
(ii) Cost of assets to be purchased
(iii) Taxes to be paid
(iv) Debentures or shares to be redeemed
(v) Increase in working capital.
Self Assessment
Fill in the blanks:
3. ………………...is the plan of receipts and payments of cash during the budget period.
4. To estimate the requirements of cash, ……………… statements and cash budgets are requiredto be prepared.
LOVELY PROFESSIONAL UNIVERSITY 273
Unit 13: Management of Cash
Notes13.1.2 Cash Management—Control Aspects
We have already seen that the finance manager must control the levels of cash balance at variouspoints in the organization. This task assumes special importance on account of the fact that thereis generally a tendency amongst divisional managers to keep cash balance in excess of theirneeds.
Notes The financial managers must devise a system whereby each division of anorganization retains enough cash to meet its day-to-day requirements without havingsurplus balances on hand. For this, methods have to be employed to:
1. Speed up the mailing time of payments from customers,
2. Reduce the time of payments received by the firm remain uncollected and speed upthe movement funds to be disbursement banks.
Two very important methods to speed up collection process are:
1. Concentrating banking and
2. Lock-box system
1. Concentration banking: In concentration banking, the company establishes a number ofstrategic collection centers in different regions instead of a single collection center at thehead office. This system reduces the period between the time a customer mails in hisremittances and the time when they become spend able funds with the company. Paymentsreceived by the different collection centers are deposited with their respective local bankswhich in turn, transfer all surplus funds to the concentration bank of the head office. Theconcentration bank with which the company has its major bank account is generallylocated at the headquarters. Concentration banking is one important and popular way ofreducing the size of the float.
2. Lock-box system: Another means to accelerate the flow of funds is a lock box system. Withconcentration banking, remittances are received by a collection centre and deposited inthe bank after processing. The purpose of lock box system is to eliminate the time betweenthe receipt of remittances by the company and the deposit in the bank. A lock boxarrangement usually is on regional basis, which a company chooses according to itsbilling patterns. Before determining the regions to be used, a feasibility study is made ofthe possibility of cheques that would be deposited under alternative plans. In this regard,operations research techniques have proved useful in the location of lock box sites. Forexample, if a company divides the country into five zones on the basis of feasibilitystudies, it might pick up New Delhi for the North, Bombay for the West, Calcutta for theEast, Madras for the South and Nagpur for the centre.
Under this arrangement, the company rents the local post-office box and authorize itsbank at each of the locations to pick up remittances in the boxes. Customers are billed withinstructions to mail their remittances to the lock boxes. The bank picks up the mail severaltimes a day and deposits the cheques in the company’s account. The cheques may bemicrofilmed for record purposes and cleared for collection. The company receives a depositslip and lists all payments together with any other material in the envelope. This procedurefrees the company from handling and depositing the cheques. Thus, the lag between thetime cheques are received by the company and the time they are actually deposited in thebank is eliminated. The main drawback of lock box system is the cost of its operation. Thebank provides a number of services in addition to usual clearing the cheques and requirescompensation for them. Since the cost is directly proportional if average remitted is small.
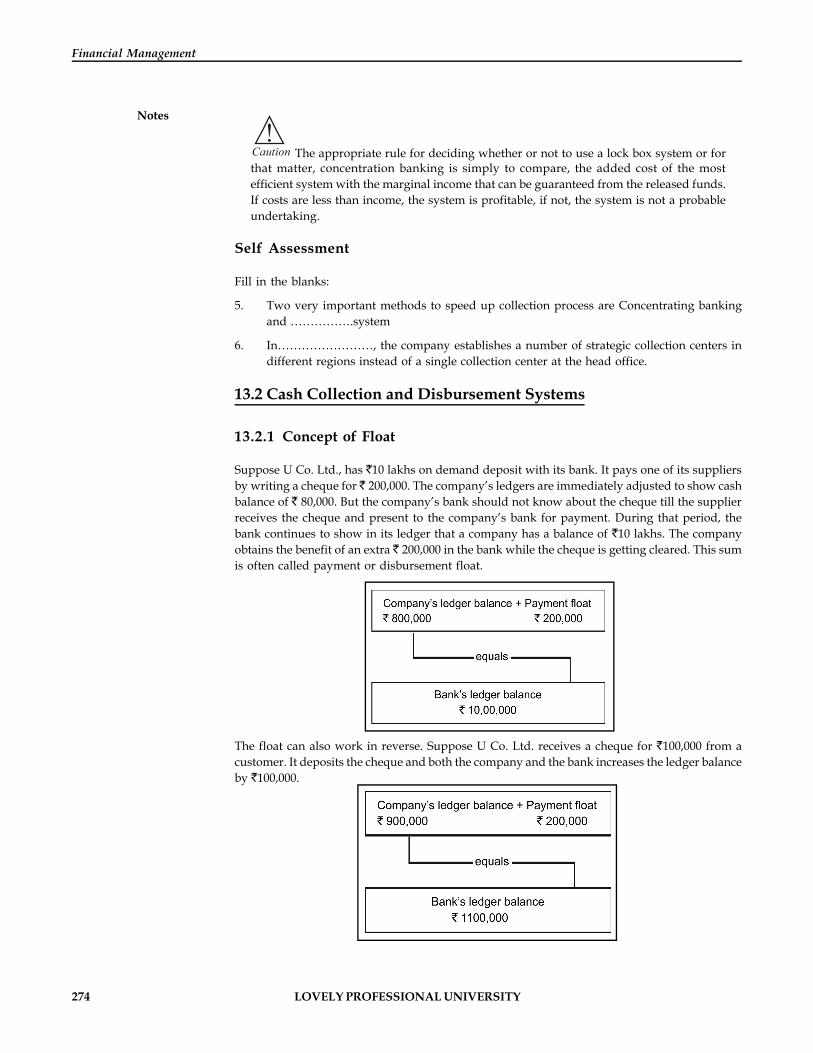
274 LOVELY PROFESSIONAL UNIVERSITY
Financial Management
Notes
!Caution The appropriate rule for deciding whether or not to use a lock box system or forthat matter, concentration banking is simply to compare, the added cost of the mostefficient system with the marginal income that can be guaranteed from the released funds.If costs are less than income, the system is profitable, if not, the system is not a probableundertaking.
Self Assessment
Fill in the blanks:
5. Two very important methods to speed up collection process are Concentrating bankingand …………….system
6. In……………………, the company establishes a number of strategic collection centers indifferent regions instead of a single collection center at the head office.
13.2 Cash Collection and Disbursement Systems
13.2.1 Concept of Float
Suppose U Co. Ltd., has 10 lakhs on demand deposit with its bank. It pays one of its suppliersby writing a cheque for 200,000. The company’s ledgers are immediately adjusted to show cashbalance of 80,000. But the company’s bank should not know about the cheque till the supplierreceives the cheque and present to the company’s bank for payment. During that period, thebank continues to show in its ledger that a company has a balance of 10 lakhs. The companyobtains the benefit of an extra 200,000 in the bank while the cheque is getting cleared. This sumis often called payment or disbursement float.
The float can also work in reverse. Suppose U Co. Ltd. receives a cheque for 100,000 from acustomer. It deposits the cheque and both the company and the bank increases the ledger balanceby 100,000.
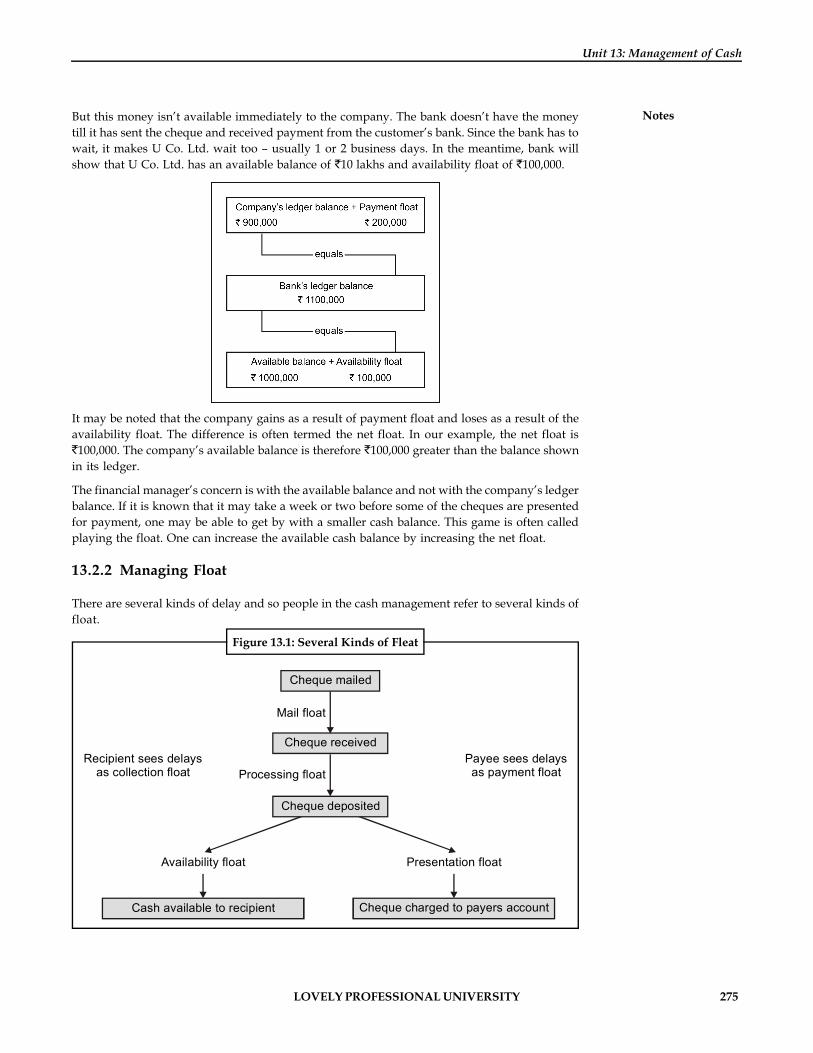
LOVELY PROFESSIONAL UNIVERSITY 275
Unit 13: Management of Cash
NotesBut this money isn’t available immediately to the company. The bank doesn’t have the moneytill it has sent the cheque and received payment from the customer’s bank. Since the bank has towait, it makes U Co. Ltd. wait too – usually 1 or 2 business days. In the meantime, bank willshow that U Co. Ltd. has an available balance of 10 lakhs and availability float of 100,000.
It may be noted that the company gains as a result of payment float and loses as a result of theavailability float. The difference is often termed the net float. In our example, the net float is
100,000. The company’s available balance is therefore 100,000 greater than the balance shownin its ledger.
The financial manager’s concern is with the available balance and not with the company’s ledgerbalance. If it is known that it may take a week or two before some of the cheques are presentedfor payment, one may be able to get by with a smaller cash balance. This game is often calledplaying the float. One can increase the available cash balance by increasing the net float.
13.2.2 Managing Float
There are several kinds of delay and so people in the cash management refer to several kinds offloat.
Figure 13.1: Several Kinds of Fleat
Cheque mailed
Mail float
Cheque received
Processing float
Cheque deposited
Availability float Presentation float
Cheque charged to payers accountCash available to recipient
Recipient sees delays as collection float
Payee sees delays as payment float
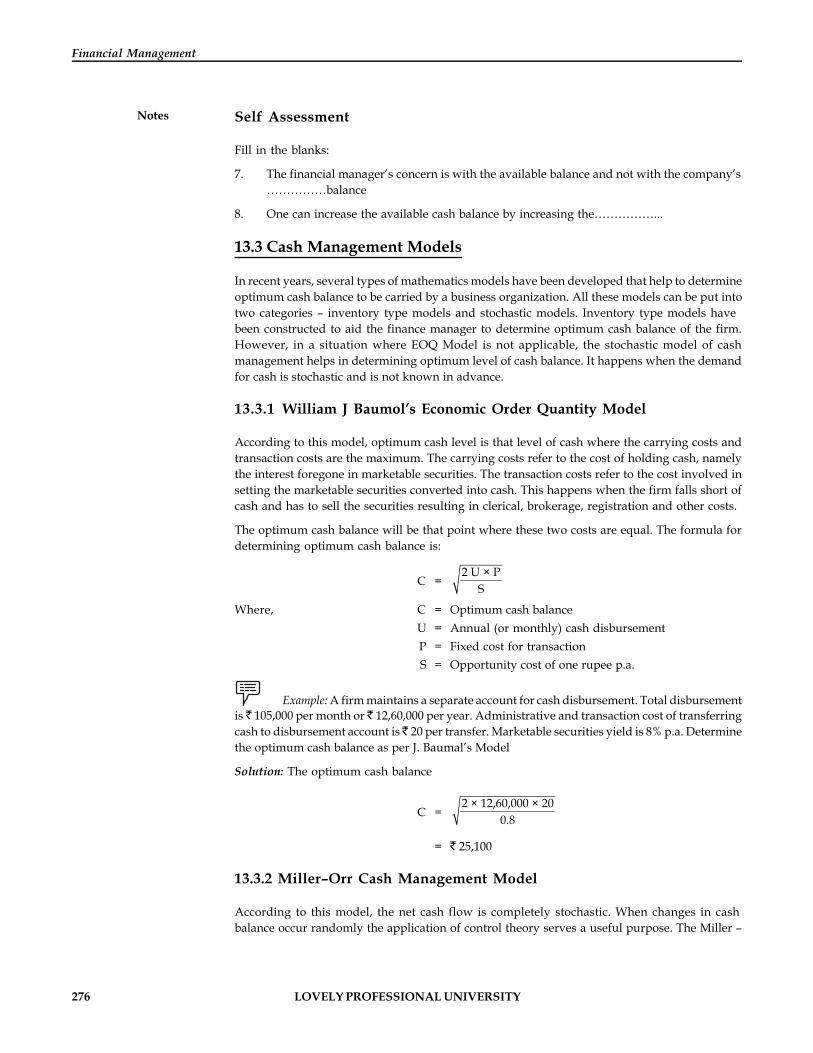
276 LOVELY PROFESSIONAL UNIVERSITY
Financial Management
Notes Self Assessment
Fill in the blanks:
7. The financial manager’s concern is with the available balance and not with the company’s……………balance
8. One can increase the available cash balance by increasing the……………...
13.3 Cash Management Models
In recent years, several types of mathematics models have been developed that help to determineoptimum cash balance to be carried by a business organization. All these models can be put intotwo categories – inventory type models and stochastic models. Inventory type models havebeen constructed to aid the finance manager to determine optimum cash balance of the firm.However, in a situation where EOQ Model is not applicable, the stochastic model of cashmanagement helps in determining optimum level of cash balance. It happens when the demandfor cash is stochastic and is not known in advance.
13.3.1 William J Baumol’s Economic Order Quantity Model
According to this model, optimum cash level is that level of cash where the carrying costs andtransaction costs are the maximum. The carrying costs refer to the cost of holding cash, namelythe interest foregone in marketable securities. The transaction costs refer to the cost involved insetting the marketable securities converted into cash. This happens when the firm falls short ofcash and has to sell the securities resulting in clerical, brokerage, registration and other costs.
The optimum cash balance will be that point where these two costs are equal. The formula fordetermining optimum cash balance is:
C =2 U × P
S
Where, C = Optimum cash balanceU = Annual (or monthly) cash disbursementP = Fixed cost for transactionS = Opportunity cost of one rupee p.a.
Example: A firm maintains a separate account for cash disbursement. Total disbursementis 105,000 per month or 12,60,000 per year. Administrative and transaction cost of transferringcash to disbursement account is 20 per transfer. Marketable securities yield is 8% p.a. Determinethe optimum cash balance as per J. Baumal’s Model
Solution: The optimum cash balance
C =2 × 12,60,000 × 20
0.8
= 25,100
13.3.2 Miller–Orr Cash Management Model
According to this model, the net cash flow is completely stochastic. When changes in cashbalance occur randomly the application of control theory serves a useful purpose. The Miller –

LOVELY PROFESSIONAL UNIVERSITY 277
Unit 13: Management of Cash
NotesOrr model is one of such control limit models. This model is designed to determine the time andsize of transfers between an investment account and cash account. In this model, limits are set forcash balances. These limits may consist of h as upper limit, z as the return point and zero as thelower limit. When the cash balance reaches the upper limit, the transfer of cash equal to h isinvested in marketable securities account. When it touches the lower limit, a transfer frommarketable securities account to cash account is made. During the period when cash balancestays between (h,z) and (z,o) i.e., high and low limits of cash balance are set up on the basis offixed cost associated with the securities transactions, the opportunity cost of holding cash andthe degree of likely fluctuations in cash balances. These limits satisfy the demands for cash at thelowest possible total costs. The following diagram illustrates the Miller – Orr Model.
Figure 13.2: Miller-orr Cash Management Model
HUpper Control Limit
ZReturn Point
O Time Lower Control Limit
Self Assessment
Fill in the blanks:
9. The ……………..costs refer to the cost of holding cash.
10. The ……………..costs refer to the cost involved in setting the marketable securitiesconverted into cash.
13.4 Treasury Management
Treasury management once viewed as a peripheral activity conducted by back-office, todayplays a very vital role in corporate management. Treasury management can be defined in manyways. The Association of Corporate Treasure defines “Treasury management as the efficientmanagement of liquidity and financial risk in business.” All firms, to some degree, are involvedin treasury management, although in smaller companies, it may not be a separately defined job.
Notes Treasury management is responsible for:
1. Management of cash while obtaining the optimum return from any surplus funds.
2. Management of exchange rate risks in accordance with group policy.
3. Providing both long-term and short-term funds for the business at minimum cost.
4. Maintaining good relationships with banks and other providers of finance includingshareholders.
5. Advising on aspects of corporate finance including capital structure, mergers andacquisitions.
278 LOVELY PROFESSIONAL UNIVERSITY
Financial Management
Notes Functions of Treasury Department
1. Cash management: The efficient collection and payment of cash both inside the group andto third parties is the function of the treasury department. The involvement of thedepartment with the details of receivables and payables will be a matter of policy. Theremay be complete centralization within a group treasury or the treasury may simplyadvise subsidiaries and divisions on policy (collection/payment periods, discounts, etc.,).Any position between these two extremes would be possible. Treasury will normallymanage surplus funds in an investment portfolio. Investment policy will consider futureheads for liquid funds and acceptable levels of risk as determined by company policy.
2. Currency management: The treasury department manages the foreign currency riskexposure of the company. In a large multinational company (MNC), the first step willusually be set off intragroup indebtedness. The use of matching receipts and payments inthe same currency will save transaction costs. Treasury might advise on the currency to beused when invoicing overseas sales. The treasury will manage any net exchange exposuresin accordance with company policy. If risks are to be minimized, then forward contractscan be used either to buy or sell currency forward.
3. Funding management: The treasury department is responsible for planning and sourcingthe company’s short, medium and long-term cash needs. The treasury department willalso participate in the decision on capital structure and forecast future interest and foreigncurrency rates.
4. Banking: It is important that a company maintains a good relationship with its bankers.Treasury department carries out negotiations with bankers and acts as the initial point ofcontact with them. Short-term finance can come in the form of bank loans or through thesale of commercial paper in the money market.
5. Corporate finance: The treasury department is involved in both acquisition and divestmentactivities within the group. In addition, it will often have responsibility for investorrelations. The latter activity has assumed increased importance in markets where shareprice performance is regarded as crucial and may affect the company’s ability to undertakeacquisition activity or, if the price falls drastically, the lender it vulnerable to a hostile bid.
Self Assessment
Fill in the blanks:
11. Treasury will normally manage ……………funds in an investment portfolio.
12. Treasury advise on the ………………to be used when invoicing overseas sales.
13.5 The Cash Conversion Cycle
Central to short-term financial management is an understanding of the term ‘Cash ConversionCycle’.
We have discussed in the earlier unit that operating cycle encompasses two major short-termasset categories: inventory and accounts receivable. It is measured by summing the average ageof inventories and average collection period.
However, the process of producing and selling a product also includes purchase of productioninputs (raw materials) an account, which results in accounts payables. Accounts payable reducethe number of days a firm’s resources are tied up in operating cycle. The time it takes to pay theaccounts payable, measured in days is the average payment period.

LOVELY PROFESSIONAL UNIVERSITY 279
Unit 13: Management of Cash
Notes
Did u know? What is cash conversion cycle?
The operating cycle less the average payment period is referred as the Cash ConversionCycle. It represents the amount of time the firms’ resources are tied up.
Example: MAX Company, a producer of paper has annual sale of 10 lakhs, a cost ofgoods sold of 75% of sales, and purchases are 65% of cost of goods sold. MAX has an average ageof inventory of 60 days, an average collection period of 40 days and an average payment periodof 35 days. Thus, the cash conversion cycle for MAX is 65 days (60 + 40 – 35).
Funding Requirements of the Cash Conversion Cycle
Permanent versus seasonal funding needs: If the firm’s sales are constant, then its investment inoperating assets should also be constant, and the firm will have only a permanent fundingrequirement. If the firms’ sales are cyclic, then its investment in operating assets will vary overtime with its sales cycles and the firm will have seasonal funding requirements in addition tothe permanent funding required for its minimum investment in operating assets.
Aggressive versus Conservative Seasonal Funding Strategies
Short-term funds are typically less expensive than long-term funds. Long-term fundsallow the firm to lock in the funds over a period of time and thus avoid the risk ofincreases in short-term interest.
Long-term funding ensures that the required funds are available to the firm when needed.
!Caution Short-term funding exposes the firm to the risk that it may not be able to obtainthe funds need to cover its seasonal peaks.
Under the aggressive funding strategy, the firm funds its seasonal requirements with short-term debt and its permanent requirements with the long-term debt. Under a conservativefunding strategy, the firm funds both its seasonal and its permanent requirement with long-term debt.
Clearly, the aggressive strategy’s heavy reliance on the short-term financing makes it riskierthan the conservative strategy because of interest rate swings and possible difficulties in obtainingneeded short-term financing quickly when seasonal peaks occur. The conservative strategyavoids these risks through the locked-in interest rate and long-term financing, but it is morecostly because of the negative spread between the earnings rate on surplus fund, and the cost ofthe long-term funds that create the surplus. Where the firm operates between the extremes of theaggressive and conservative seasonal funding strategies depends on management’s responsetowards risk and the strength of its banking relationships.
Task In respect of a firm, on an average, accounts receivable are collected after 80 days,inventories have an average of 100 days and accounts payable are paid approximately60 days after they arise. Calculate the firm’s cash cycle and cash turnover assuming a 360-day year.

280 LOVELY PROFESSIONAL UNIVERSITY
Financial Management
Notes Strategies for managing the cash conversion cycle:
1. Turnover inventory as quickly as possible without stockouts that will result in lost sales.
2. Collect accounts receivable as quickly as possible without losing sales from high-pressurecollection techniques.
3. Manage mail, processing and clearing time to reduce them when collecting from customersand to increase them when paying suppliers.
4. Pay accounts payable as slowly as possible without damaging the firm’s credit rating.
Self Assessment
Fill in the blanks:
13. Accounts payable reduce the number of days a firm’s resources are tied up in ……………cycle.
14. Under a ……………..funding strategy, the firm funds both its seasonal and its permanentrequirement with long-term debt.
13.6 Management of Marketable Securities
Management of marketable securities is an integral part of investment in cash as this may serveboth the purposes of liquidity and cash provided choice of investment is made correctly. As theworking capital needs are fluctuating, it is possible to park excess funds in same short-termsecurities, which can be liquidated when need for cash is felt. The selection of securities shouldbe guided by three principles:
Safety: Returns and risks go hand in hand. As the objective of this investment is ensuringliquidity, minimum risk is the criterion for selection.
Maturity: Matching of maturing and forecasted cash needs is essential. Prices of long-term securities fluctuate more with changes in interest rates and are therefore, more risky.
Marketability: It refers to the convenience, speed and cost at which a security can beconverted into cash. If the security can be sold quickly without loss of time and price, it ishighly liquid or marketable.
The choice of marketable securities is mainly limited to government treasury bills, depositswith banks and inter-corporate deposits, units of Unit Trust of India and Commercial paper ofcorporates are other attractive means of parking surplus funds for companies along with depositswith sister concerns or associate companies.
Example: (On cash budget)
1. The following results are expected by XYZ Ltd. By quarter next year in thousands ofrupees:
Quarter 1 2 3 4 Sales 7,500 10,500 18,000 10,500 Cash Payments Production Costs 7,000 10,000 8,000 8,500 Selling, administration and other costs 1,000 2,000 2,900 1,600 Purchase of plant and other fixed assets 100 1100 2100 2100

LOVELY PROFESSIONAL UNIVERSITY 281
Unit 13: Management of Cash
NotesDebtors at the end of the quarter are one-third of sales of the quarter. The opening balanceof debtors is 30,00,000. Cash on hand at the beginning of the year is 650,000 and thedesired maximum balance is 500,000. Borrowings are made at the beginning of thequarters in which the need will occur in multiples of 10,000 and are repaid at the end ofquarters. Interest charges may be ignored. You are required to prepare:
(a) A cash budget by quarters – for the year and
(b) State the amount of loan outstanding at the end of the year
Solution: Cash budget next year (quarter wise) (000)
Quarter
1 2 3 4 Total
(A) Cash inflows
Collection from debtors
1. From prior quarter (1/3 of sales)
3000 2500 3500 6000 15000
2. From current quarter (2/3 of sales)
5000 7000 12000 7000 31000
8000 9500 15500 13000 46000
(B) Cash outflows
1. Production costs 7000 10000 8000 8500 33500
2. Selling, admn. and other costs
1000 2000 2900 1600 7500
3. Plant and other fixed assets purchased
100 1100 2100 2100 5400
Total cash payments 8100 13100 13000 12200 46400
(C) Surplus/(deficiency) (100) (3600) 2500 800 (400)
1. Beginning balance 650 550 500 500 650
2. Ending balance (indicated)
550 (3050) 3000 1300 250
Borrowing required (deficiency + min. cash reqd.)
3550 3550
Quarter
1 2 3 4 Total
Repayment mode (balance – min. cash reqd.)
(2500) (800) (3300)
Ending balance 550 500 500 500 500
Loan outstanding is 35,50,000 – 33,00,000 = 250,000
Example: A firm uses a continuous billing system that results in an average daily receiptof 40,00,000. It is contemplating the institution of concentration banking, instead of the currentsystem of centralized billing and collection. It is estimated that such a system would reduce thecollection period of accounts receivable by 2 days.
Concentration banking would cost 75,000 annually and 8% can be earned by the firm or itsinvestments. It is also found that a lock-box system can reduce its overall collection time by fourdays and could cost annually 120,000.
282 LOVELY PROFESSIONAL UNIVERSITY
Financial Management
Notes 1. How much cash would be released with the concentration banking system?
2. How much money can be saved due to reduction in the collection period by 2 days?Should the firm institute the concentration banking system?
3. How much cash would be freed by lock-box system?
4. Between concentration banking and lock-box system, which is better?
Solution:
1. Cash released by the concentration banking system = 40,00,000 × 2 days = 80,00,000
2. Savings = 8% × 80,00,000 = 640,000. The firm should institute the concentration bankingsystem. It costs only 75,000 while the savings expected are 640,000.
3. Cash released by the lock-box system = 40,00,000 × 4 days = 160,00,000
4. Savings in lock box system 8% × 160,00,000 = 12,80,000
5. Lock-box system is better. Its net savings 11,60,000
( 1280,000 – 120,000) are higher than that of concentration banking.
Example: Assume, a firm which purchases raw materials on credit is required by thecredit terms to make payments within 60 days. The firm’s experience has been that it takes on anaverage, 35 days to pay its accounts payable and 70 days to collect its accounts receivable.Moreover, 85 days elapse between the purchase of raw materials and the sale of finished goods,that is to say, the average age of a firm’s inventory is 85 days. What is the firm’s cash cycle? Alsoestimate the cash turnover.
Solution: The cash cycle of the firm can be calculated by finding the average number of days thatelapses between the cash outflows associated with paying accounts payable and the cash inflowsassociated with collecting accounts receivable, i.e.,
1. Cash cycle =85 days +70 days – 35 days =120 days
2. Cash Turnover = the assumed number of days in a year divided by the cash cycle=365/120=3.04
Example: The under mentioned facts are available:
1. Cash turnover rate 4.5
2. Annual cash outflow 175,000
3. Accounts payable can be stretched by 20 days
What would be the effect of stretching accounts payable on the minimum operating cashrequirement?
Assuming the firm can earn 8% on its investments, what would be the saving on cost?
Solution: Cash turnover 4.5 i.e., 360/4.5 i.e., 80 days and annual cash outflow 175,000 hence cashrequirement= 175000/4.5 = 38,889.
With accounts payable stretching by 20 days, cash cycle will be 80+20 days i.e., 100 days, cashturnover 360/60 =6 times, hence cash requirement will change to 175,000/6 = 29,167.
Cash requirement will reduce by 38,889 – 29,167 =9,722 and savings in cost will be 8% on9722 = 778.
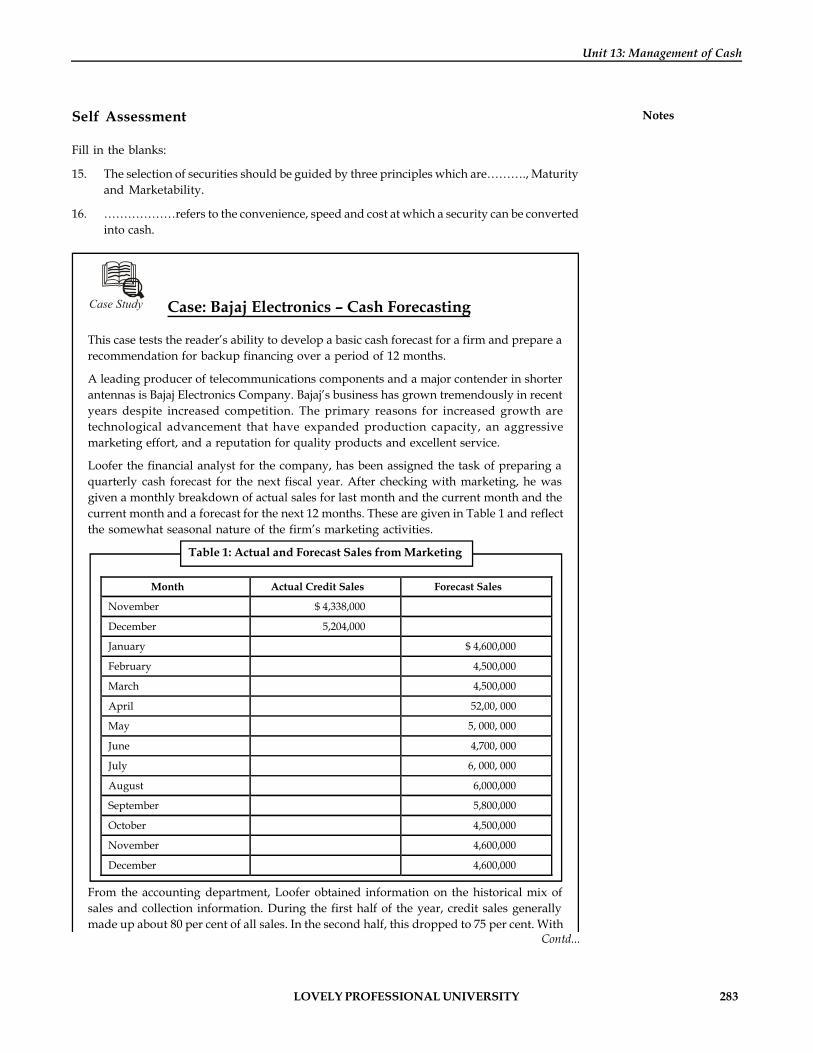
LOVELY PROFESSIONAL UNIVERSITY 283
Unit 13: Management of Cash
NotesSelf Assessment
Fill in the blanks:
15. The selection of securities should be guided by three principles which are………., Maturityand Marketability.
16. ………………refers to the convenience, speed and cost at which a security can be convertedinto cash.
Case Study Case: Bajaj Electronics – Cash Forecasting
This case tests the reader’s ability to develop a basic cash forecast for a firm and prepare arecommendation for backup financing over a period of 12 months.
A leading producer of telecommunications components and a major contender in shorterantennas is Bajaj Electronics Company. Bajaj’s business has grown tremendously in recentyears despite increased competition. The primary reasons for increased growth aretechnological advancement that have expanded production capacity, an aggressivemarketing effort, and a reputation for quality products and excellent service.
Loofer the financial analyst for the company, has been assigned the task of preparing aquarterly cash forecast for the next fiscal year. After checking with marketing, he wasgiven a monthly breakdown of actual sales for last month and the current month and thecurrent month and a forecast for the next 12 months. These are given in Table 1 and reflectthe somewhat seasonal nature of the firm’s marketing activities.
Table 1: Actual and Forecast Sales from Marketing
Month Actual Credit Sales Forecast Sales
November $ 4,338,000
December 5,204,000
January $ 4,600,000
February 4,500,000
March 4,500,000
April 52,00, 000
May 5, 000, 000
June 4,700, 000
July 6, 000, 000
August 6,000,000
September 5,800,000
October 4,500,000
November 4,600,000
December 4,600,000
From the accounting department, Loofer obtained information on the historical mix ofsales and collection information. During the first half of the year, credit sales generallymade up about 80 per cent of all sales. In the second half, this dropped to 75 per cent. With
Contd...
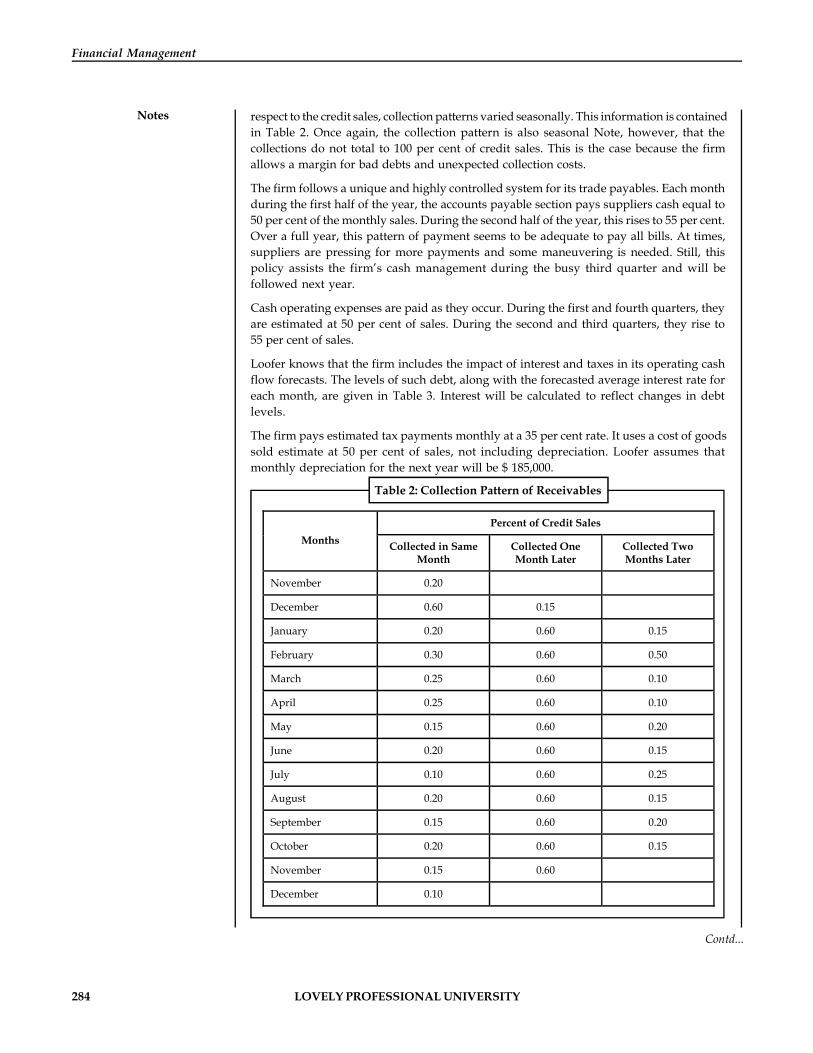
284 LOVELY PROFESSIONAL UNIVERSITY
Financial Management
Notes respect to the credit sales, collection patterns varied seasonally. This information is containedin Table 2. Once again, the collection pattern is also seasonal Note, however, that thecollections do not total to 100 per cent of credit sales. This is the case because the firmallows a margin for bad debts and unexpected collection costs.
The firm follows a unique and highly controlled system for its trade payables. Each monthduring the first half of the year, the accounts payable section pays suppliers cash equal to50 per cent of the monthly sales. During the second half of the year, this rises to 55 per cent.Over a full year, this pattern of payment seems to be adequate to pay all bills. At times,suppliers are pressing for more payments and some maneuvering is needed. Still, thispolicy assists the firm’s cash management during the busy third quarter and will befollowed next year.
Cash operating expenses are paid as they occur. During the first and fourth quarters, theyare estimated at 50 per cent of sales. During the second and third quarters, they rise to55 per cent of sales.
Loofer knows that the firm includes the impact of interest and taxes in its operating cashflow forecasts. The levels of such debt, along with the forecasted average interest rate foreach month, are given in Table 3. Interest will be calculated to reflect changes in debtlevels.
The firm pays estimated tax payments monthly at a 35 per cent rate. It uses a cost of goodssold estimate at 50 per cent of sales, not including depreciation. Loofer assumes thatmonthly depreciation for the next year will be $ 185,000.
Table 2: Collection Pattern of Receivables
Percent of Credit Sales Months Collected in Same
Month Collected One Month Later
Collected Two Months Later
November 0.20
December 0.60 0.15
January 0.20 0.60 0.15
February 0.30 0.60 0.50
March 0.25 0.60 0.10
April 0.25 0.60 0.10
May 0.15 0.60 0.20
June 0.20 0.60 0.15
July 0.10 0.60 0.25
August 0.20 0.60 0.15
September 0.15 0.60 0.20
October 0.20 0.60 0.15
November 0.15 0.60
December 0.10
Contd...
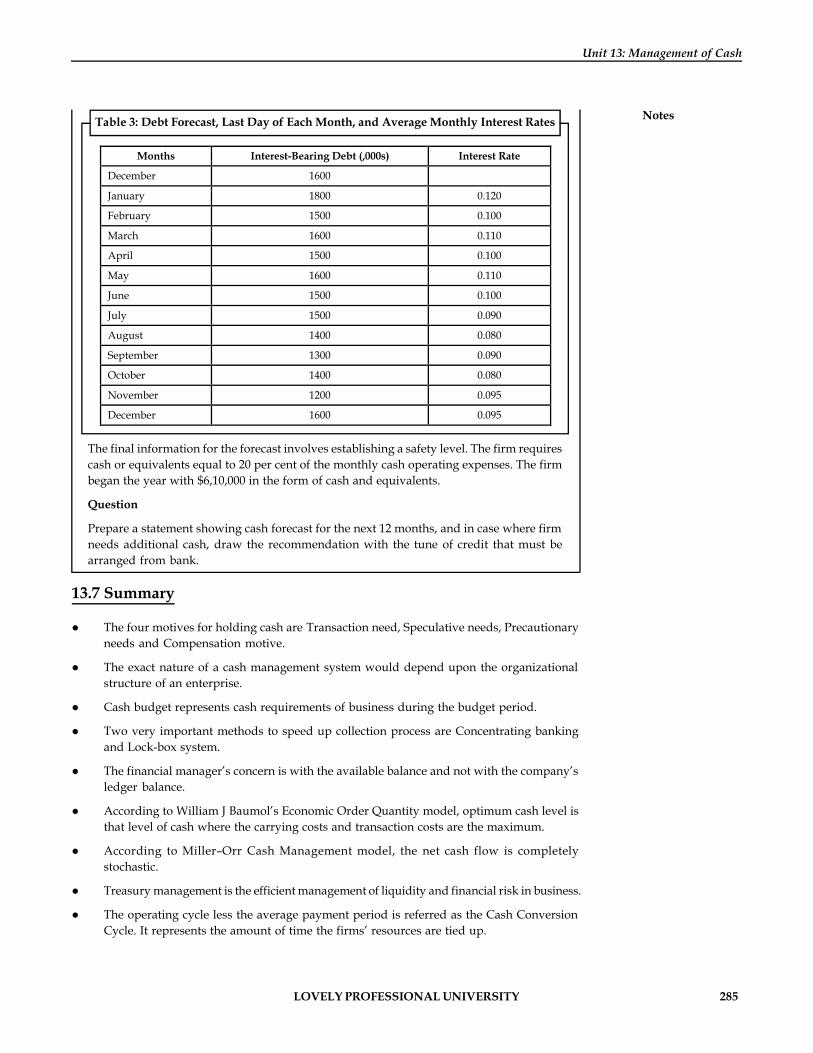
LOVELY PROFESSIONAL UNIVERSITY 285
Unit 13: Management of Cash
NotesTable 3: Debt Forecast, Last Day of Each Month, and Average Monthly Interest Rates
Months Interest-Bearing Debt (,000s) Interest Rate
December 1600
January 1800 0.120
February 1500 0.100
March 1600 0.110
April 1500 0.100
May 1600 0.110
June 1500 0.100
July 1500 0.090
August 1400 0.080
September 1300 0.090
October 1400 0.080
November 1200 0.095
December 1600 0.095
The final information for the forecast involves establishing a safety level. The firm requirescash or equivalents equal to 20 per cent of the monthly cash operating expenses. The firmbegan the year with $6,10,000 in the form of cash and equivalents.
Question
Prepare a statement showing cash forecast for the next 12 months, and in case where firmneeds additional cash, draw the recommendation with the tune of credit that must bearranged from bank.
13.7 Summary
The four motives for holding cash are Transaction need, Speculative needs, Precautionaryneeds and Compensation motive.
The exact nature of a cash management system would depend upon the organizationalstructure of an enterprise.
Cash budget represents cash requirements of business during the budget period.
Two very important methods to speed up collection process are Concentrating bankingand Lock-box system.
The financial manager’s concern is with the available balance and not with the company’sledger balance.
According to William J Baumol’s Economic Order Quantity model, optimum cash level isthat level of cash where the carrying costs and transaction costs are the maximum.
According to Miller–Orr Cash Management model, the net cash flow is completelystochastic.
Treasury management is the efficient management of liquidity and financial risk in business.
The operating cycle less the average payment period is referred as the Cash ConversionCycle. It represents the amount of time the firms’ resources are tied up.
286 LOVELY PROFESSIONAL UNIVERSITY
Financial Management
Notes Management of marketable securities is an integral part of investment in cash. The selectionof securities should be guided by three principles which are Safety, Maturity andMarketability.
13.8 Keywords
Cash: It is one of the components of current assets and a medium of exchange for the purpose oftransactions.
Cash Budget: It is a statement showing the estimated cash inflows and cash outflows over aplanning period.
Conversion Costs: It is the costs that are associated with the sales of marketable security.
Float: It is the amount of the money tied up in cheques that have been written but not yetcollected.
Optimal Cash Balance: It is that cash balance where the firm’s opportunity cost equalstransactions cost and the total cost is minimum.
13.9 Review Questions
1. Explain the Baumol’s Model of Cash Management.
2. Write short notes on Lock box system and Concentration banking.
3. What is the difference between the firm’s operating cycle and its cash conversion cycle?
4. Why it is helpful to divide the funding needs of a seasonal business into its permanent andseasonal funding requirements when developing a funding strategy?
5. What are the benefits, costs and risks of an aggressive funding strategy and of a conservativefunding strategy? Under which strategy is the borrowing often in excess of the actualneed?
6. “Cash budgeting or short-term cash forecasting (budgeting) is the principal tool of cashmanagement.” Discuss.
7. “Efficient cash management will aim at maximizing the cash inflows and slowing cashoutflows”. Discuss.
8. Briefly discuss the various avenues or opportunities available to the companies to parktheir surplus funds for a short-term.
9. Analyse the importance of the preparation of the cash budget for the corporates.
10. “Management of cash flows plays a very important role in cash management”. Discuss.
Answers: Self Assessment
1. Speculative 2. organizational structure 3. Cash budget
4. cash flow 5. Lock-box 6. concentration banking
7. ledger 8. net float 9. carrying
10. transaction 11. surplus 12. currency
13. operating 14. conservative 15. Safety
16. Marketability
LOVELY PROFESSIONAL UNIVERSITY 287
Unit 13: Management of Cash
Notes13.10 Further Readings
Books Dr Pradeep Kumar Sinha, Financial Management, New Delhi, Excel Books, 2009.
Van Horne, J.C. and Wachowicz, Jr, J.M., Fundamentals of Financial Management,New Delhi, Prentice Hall of India Pvt. Ltd., 1996, p. 2.
Chandra, P., Financial Management—Theory and Practice, New Delhi, Tata McGrawHill Publishing Company Ltd., 2002, p. 3.
288 LOVELY PROFESSIONAL UNIVERSITY
Financial Management
Notes Unit 14: Management of Surplus & Dividend Policy
CONTENTS
Objectives
Introduction
14.1 Management of Profits
14.2 Dividend Policy
14.2.1 Types of Dividend Policies
14.2.2 Factors affecting Dividend Decisions
14.3 Theories of Dividend Decisions
14.3.1 Traditional Approach
14.3.2 Walter’s Model
14.3.3 Gordon’s dividend Capitalization Model
14.3.4 Miller and Modigliani Model
14.3.5 Rational Expectations Model
14.4 Forms of Dividends
14.4.1 Bonus Shares (Stock Dividend)
14.4.2 Stock (Share) Split
14.4.3 Stock Repurchase
14.5 Corporate Dividend Behaviour
14.5.1 Legal and Procedural Aspects in Connection with Payment of Dividend
14.6 Summary
14.7 Keywords
14.8 Review Questions
14.9 Further Readings
Objectives
After studying this unit, you will be able to:
Discuss the connotation of management of profits
Describe the various aspects of dividend policy
Explain the theories of dividend
Recognize the corporate dividend behaviour
Introduction
Finance is the life-blood of business, without which a firm cannot promote, maintain and expandand achieve its predetermined objective. Whether it is big, medium or small it needs finance.

LOVELY PROFESSIONAL UNIVERSITY 289
Unit 14: Management of Surplus & Dividend Policy
NotesProfit is the primary motivating force for any economic activity, a business enterprise essentiallybeing an economic organization, it has to maximise the welfare of its stakeholders. To this end,the business undertaking has to earn profit from its operations. Profit is the excess of revenueover expenses on conducting operations. In fact, profits are useful intermediate beacon towardswhich a firm’s capital should be directed. In this connection McAlpine rightly remarked thatprofit cannot be ignored since it is both, a measure of the success of business and the means of itssurvival and growth. To quote Bradly, “if an enterprise fails to make profit, capital invested iseroded and if this situations, prolongs the enterprise ultimately ceases to exist.” A well organisedprofit planning programme will help towards maintaining a level of profit, which will ensurethe concentration of the business and fulfillment of other responsibilities. Certainly, profitgrowth coupled with high level of profit and the ability to maintain reasonable profit will helptowards:
1. Ensuring that shareholders receive an adequate dividend;
2. Preserving the assets worth of the business;
3. Generating a sufficient cash flow out of profits to provide capital for expansion; and
4. Providing funds for research, and development of new and improved products to replacethe existing products before they decline.
14.1 Management of Profits
From the point of view of dividend decision it is better to call management of profits asmanagement of earnings. Earnings mean net earnings available to equity shareholders fromwhere a firm actually declares dividends or retain profits for financing of investmentopportunities.
Net earnings = Operating Profit – (Interest + Tax + Preference Dividend)
Management of earnings means, how the earnings of a firm are determined and how they areutilised or appropriated or allocated or distributed. In other words, how the business firmapportions their earnings is between dividends and retentions for financing of investmentopportunities. Retention of earning’s also known as plough back of profits. Management ofearnings is an important finance activity of a business undertaking. Since proper managementof earnings helps to maximise shareholder’s wealth. Particularly in Joint Stock companies whereowners are different from the management team, who are selected/appointed by owners. Usuallymanagement team or Board of Directors (BoDs) does not distribute the total net earnings to theshareholders as dividends. They may retain a part of it for financing of investment opportunitiesor expansion programmes by keeping future growth of the firm in mind. Management ofearnings policy must maximise value of the firm, thereby maximise benefits to its owners. Onthe other hand improper retained earnings and absence of financial control measures are theindicators of inefficient management of earnings that may not help to maximise value of thefirm, but they may lead to the liquidation of the company.
When a corporation makes a profit, it can spend that profit in two ways:
1. Return the profits to stockholders by way of dividends, share buy-backs or bonus issues;
2. Use the money to increase the profitability of the company
Example: A company makes a profit of 100. It can pay this entire amount to stockholderswho can then use that money as they think fit—spend on consumer items, make furtherinvestments, whatever. Or the company can use all that profit to invest in the business with aview to increasing profits in future years. Or the company can do a bit of both.
290 LOVELY PROFESSIONAL UNIVERSITY
Financial Management
Notes
Did u know? What is surplus?
Surplus is the amount of profit remaining after tax and distribution to stockholders that isretained in a business and used as a reserve or as a means of financing expansion orinvestment.
When sizing up a company’s fundamentals, investors need to look at how much capital is keptfrom shareholders. Making profits for shareholders ought to be the main objective for a listedcompany and, as such, investors tend to pay most attention to reported profits. Sure, profits areimportant. But what the company does with that money is equally important.
Typically, a portion of the profit is distributed to shareholders in the form of a dividend. Whatgets left over is called retained earnings or retained capital. Savvy investors should look closelyat how a company puts retained capital to use and generates a return on it.
It is sometimes rather loosely stated in management texts and business journals that ‘retainedprofits are reinvested in the assets of the company’ or that ‘profits are ploughed back’, thusgiving management a reasonably cheap and easily accessible source of funds to finance growth.These ‘internally generated funds’ are easily accessible provided a company makes good profits,because directors can, within limits, choose dividend levels. They can choose to retain and use(reinvest) the resulting increase in company assets. The funds are also cheap because there are nocosts involved in issuing more shares and no borrowing costs. What this really means is that themanagers of profitable businesses have more assets to use in productive activities.
Sometimes companies will convert part of retained profits into permanent share capital byissuing bonus shares to existing shareholders, free of any cash contribution (because the increasein assets from profit making has already been received). From a company viewpoint bonusshares have no effect on financing or investing activities
The ability to use retained earnings wisely is a sign of good company management. If thecompany management cannot do any better with earnings than he can, then he is better off if thecompany pays him the full amount in dividends.
In broad terms, capital retained is used to maintain existing operations or to increase sales andprofits by growing the business.
Some companies need large amounts of new capital just to keep running. Others, however, canuse the capital to grow. When you invest in a company, you should make it your priority toknow how much capital the company appears to need and whether management has a trackrecord of providing shareholders with a good return on that capital.
Fortunately, for companies with at least several years of historical performance, there is a fairlysimple way to gauge how well management employs retained capital. Simply compare the totalamount of profit per share retained by a company over a given period of time against the changein profit per share over that same period of time.
!Caution When evaluating the return on retained earnings, you need to determine whetherit’s worth it for a company to keep its profits. If a company reinvests retained capital anddoesn’t enjoy significant growth, investors would probably be better served if the boardof directors declared a dividend.
Another way to evaluate the effectiveness of management in its use of retained capital is tomeasure how much market value has been added by the company’s retention of capital. Supposeshares of Company A were trading at 10 in 1993, and in 2003 they traded at 20. Thus,

LOVELY PROFESSIONAL UNIVERSITY 291
Unit 14: Management of Surplus & Dividend Policy
Notes5.50 per share of retained capital produced 10 per share of increased market value. In otherwords, for every 1 retained by management, 1.82 ( 10 divided by 5.50) of market value wascreated. Impressive market value gains mean that investors can trust management to extractvalue from capital retained by the business.
Managing and improving your cash flow should result in a cash surplus for your business. Acash surplus is the cash that exceeds the cash required for day-to-day operations. How youhandle your cash surplus is just as important as the management of money into and out of yourcash flow cycle.
Notes Two of the most common uses of extra cash are:
1. Paying down your debt
2. Investing the cash surplus
Like so many other things you do for your business, deciding where to use your cash surplusrequires some planning and your better judgment.
1. Paying Down Debt: Paying down any debt you may have is generally the first optionconsidered when deciding what to do with a cash surplus. Rightfully so because a short-term investment of your cash surplus is not likely to yield a return equal to or greater thanthe rate of interest on any of your debt. It doesn’t make any sense to invest a cash surplusat 5 percent when you can pay down a bank loan that is charging interest at 12 percent.However, the decision to automatically pay down debt may not be correct in all cases.
One of the key advantages of managing your cash flow is the ability to predict the futurecash requirements for your business. That is, it should help you determine when yourbusiness may need to rely on external financing as a source of cash. The need for externalfinancing may be the result of expanding your business, purchasing new property orequipment, or just getting you through a normal seasonal down period.
Whatever the reason, preparing a cash flow budget is the best way of predicting thesefuture needs for cash. With at least some indication of your future cash needs, you can thenmake some decisions regarding the best way to finance those needs.
Example: You may feel that interest rates are relatively low at this time and that youlook for them to rise in the near future. Therefore, instead of using your cash surplusto pay off a two-year loan at 10.5 percent, it may be beneficial to invest the surplustemporarily, and avoid a much higher interest rate on a bank loan one year from now.
2. Investing the Cash Surplus: When investing a cash surplus, it’s only natural to seek thehighest rate of return for your investment. Four factors must be considered when makingyour investment decisions:
(a) Risk
(b) Liquidity
(c) Maturity
(d) Yield
Each factor plays an important role in determining the rate of return you receive on yourinvested cash surplus. These factors can also help you determine how much to invest andwhen to invest your surplus.
292 LOVELY PROFESSIONAL UNIVERSITY
Financial Management
Notes There are many investment opportunities available for your cash surplus. You mustconsider the advantages and disadvantages as well as the levels of risk, maturity, liquidity,and the yields of each of your investment opportunities. The following are just a few of theinvestment opportunities you may have:
(a) Checking accounts with interest
(b) Sweep accounts
(c) Treasury bills and notes
(d) Certificates of deposit (CDs) and money market funds
Risk in Investing Surplus
The investment of your cash surplus should never be speculative - that is, high risk. As in mostbusinesses, your cash surplus may only be a temporary surplus of cash inflows over your cashoutflows. Any permanent losses resulting from a high risk investment could be devastating,even to the point of making you unable to continue your business.
The level of risk you are willing to accept ultimately determines the yield of your investment.A higher level of risk will generally provide you with a higher yield. On the other hand, a lowlevel of risk will result in a lower yield on your investment. In some cases, you choose to investin an investment with a higher level of risk to gain a higher yield. But as a rule, a conservativeapproach to the level of risk is recommended when investing your cash surplus.
Self Assessment
Fill in the blanks:
1. …………...is the amount of profit remaining after tax and distribution to stockholders thatis retained in a business.
2. The ability to use retained earnings wisely is a sign of ………….company management.
3. ……………mean net earnings available to equity shareholders from where a firm actuallydeclares dividends.
14.2 Dividend Policy
Since, management of earnings means allocation of earnings among dividends and plough ofprofits. The term ‘dividend’ refers to that portion of company’s net earnings that is paid out tothe equity shareholders (not for preference shareholders, since they are entitled to have a fixedrate of dividend). Dividend policy of a firm decides the portion of earnings is to be paid asdividends to ordinary shareholders and the portion that is ploughed back in the firm forinvestment purpose. The total net earnings of equity may be paid as dividends (100% dividendpayout ratio), which may consequently result in slower growth and lower market price or a partof net earnings may be paid as dividends, higher capital gains and higher market price. When acompany uses a part of its net earnings for dividend payments then, the remaining earnings areretained. Thus, there is an inverse relationship between retained earnings and payment of cashdividend-the larger the cash dividends and lesser the retention, smaller the cash dividends andlarger retentions. Hence, the alternative use of net earnings or net profit dividends and retainedearnings are competitive and conflicting.
Dividend decision affects the value of the firm. The cash available for the payment of dividendsis affected by the firm’s investment decision, and financing decision. A decision, which is related
LOVELY PROFESSIONAL UNIVERSITY 293
Unit 14: Management of Surplus & Dividend Policy
Notesto investment leads to less cash available for payment of dividends. Thus, there is a relationbetween investment decision and financing decision. Distribution of net earnings betweendividends and retention would obviously affect owners’ wealth. Now the company is in dilemmawhich alternative is consistent to maximise shareholders wealth. The firm has to pay dividendsto shareholders if dividends lead to the maximisation of wealth for them, otherwise the companyshould retain them for financing profitable investment opportunities.
14.2.1 Types of Dividend Policies
The firm’s dividend policy is formulated with two basic objectives in mind – providing forsufficient financing and maximizing the wealth of the firm’s shareholders. Three of the morecommonly used dividend policies are:
1. Constant Payout Ratio Dividend Policy
2. Regular Dividend Policy
3. Low Regular and Extra-dividend Policy
Constant Payout Ratio Dividend Policy
With constant target payout ratio, a firm pays a constant percentage of net earnings as dividendto the shareholders. In other words, a stable dividend payout ratio implies that the percentageof earnings paid out each year is fixed. Accordingly, dividends would fluctuate proportionatelywith earnings and are likely to be highly volatile in the wake of wide fluctuations in theearnings of the company. As a result, when earnings of the firm decline substantially, or thereare a loss in a given period, the dividends according to the target payout ratio, would be low ornil.
Example: If a firm has a policy of 50% target payout, its dividends will range between 5 and zero per share, if the earnings per share are 10 per share and zero (or less) per share
respectively.
Did u know? What is payout?
The term payout refers to the ratio of dividend to earnings or the percentage of share ofearnings used to pay dividend.
Regular Dividend Policy
The regular dividend policy is based on the concept of a fixed rupee dividend in each period.This policy provides the owners with positive information thereby minimizing the uncertainty.Another variant of this policy is to increase the regular dividend once a proven increase inearnings has occurred.
Often, a regular dividend policy is built around a target dividend payout ratio but withoutletting the dividends fluctuate, it pays a stated rupee dividend and adjusts that dividend towardsthe target payout as proven earnings happen.
Low Regular and Extra Dividend Policy
Some firms have the policy of low regular and extra dividend, meaning the firms keep theregular earnings as low as possible which is supplemented by additional dividend when earnings
294 LOVELY PROFESSIONAL UNIVERSITY
Financial Management
Notes are higher than normal in a given period. By terming the additional dividend as extra dividend,the firms avoid giving shareholders false hopes. This policy is especially common amongcompanies that experience cyclical shifts in earnings.
14.2.2 Factors affecting Dividend Decisions
Most investors have two forms of return from the purchase of common shares. These are:
1. Capital gains: The investor expects an increase in the market value of the common sharesover a period of time.
Example: If the stock is purchased at 40 and sold for 60, the investor will realize acapital gain of 20. Capital gain may be defined as the profit resulting from the saleof capital investments, in this case common shares.
2. Dividends: The investor expects at some point, a distribution of the firm’s earnings. Frommature and stable organizations, most investors expect regular dividends to be declaredand paid on the common shares. This expectation takes priority over the desire to retainearnings to finance expansion and growth.
The three major factors explain the investor’s priority of dividends over capital gains:
1. Reduction of uncertainty: The promise of future capital gains or a future distribution ofearnings, involves more uncertainty than a distribution of current earnings.
2. Indication of strength: The declaration and payment of cash dividend carries some sort ofconfidence that the firm is reasonably strong and healthy.
3. Need for current income: Many shareholders require a regular flow of income throughtheir investments, for their day-to-day expenses.
Constraints on paying dividends from the firm’s point of view: Though most firms recognizethe investors demand for dividends, several factors may restrict the firm’s ability to declare andpay dividends. These are:
1. Insufficient cash: Although a firm may have earned enough income to declare dividendsbut may not have sufficient cash to pay the dividends. The firm’s liquid funds may havebeen tied up in receivables or inventory or may be short on liquid funds because ofcommitment to fixed assets.
2. Contractual restriction: Like a bond indenture that restricts the dividend pay out to 20%of earnings during the tenure of the bond or the firm, agreeing as a part of a contract witha creditor to restrict dividend payments.
3. Legal restrictions: Occasionally, a firm will be legally restricted from declaring and payingdividends unless a certain portion of current profits is ploughed back into business by way ofretained earnings. Companies (Declaration of Dividend out of Reserves) Rules 1975 providesfor such restrictions. Further dividends can be paid only out of the profits earned during thefinancial year after providing for depreciation (Sec. 205 of the Companies Act, 1956).
Importance of Stability of Dividends
A number of arguments can be given to underline the importance of steady dividend paymentsincluding:
1. Perception of stability: When a firm pays regular dividend it is considered as a sign ofcontinued normal operations. On the other hand, a reduction in dividend payment will be

LOVELY PROFESSIONAL UNIVERSITY 295
Unit 14: Management of Surplus & Dividend Policy
Notestreated as a sign of impending trouble for the company. Many investors will sell theirshares, without checking further and this set up pressure will result in the loss of sentimentin the market and decline in the market price.
2. Preference of investors: The common shareholders of mature firms generally prefer toreceive steady dividends.
3. Dividend decisions as a routine: By establishing a stable dividend policy, the board ofdirectors avoids a lengthy discussion on dividend levels.
4. Flexibility of the extra dividend: With a steady dividend policy, the firm can flexiblyhandle period temporarily high earnings, by giving a slightly large distribution of earningswithout raising the expectation of investors.
5. Desire for current income by the shareholders: Desire for current income by some investors,such as, retired persons and widows. Obviously, such group of investors may be willingto pay a higher share price to avoid the inconvenience of erratic dividend payment, whichdisrupts their budgeting. They would place positive utility on stable dividends.
Self Assessment
Fill in the blanks:
4. The regular dividend policy is based on the concept of a ……………..dividend in eachperiod.
5. A ………………………ratio implies that the percentage of earnings paid out each year isfixed.
6. When a firm pays regular dividend it is considered as a sign of continued ………….operations.
14.3 Theories of Dividend Decisions
A few models, which studied the relationship between the dividend policy and the equityreturns, are given below:
14.3.1 Traditional Approach
The traditional approach to the dividend policy was given by Mr. B Graham and D.L. Dodd andit lays clear relationship between dividends and the stock market prices. According to thisapproach, the stock value responds positively to higher dividends and negatively with lowdividends.
The following expression expresses the relationship by using a multiplier:
P = m (D + E/3)
Where, P = Market Price M = Multiplier
D = Dividend per share E = Earnings per share
The traditional approach, further states that the P/E ratio (Price/Earnings Ratio) are directlyrelated to the dividend payout ratio i.e., a high dividend payout ratio will increase the P/E ratioand vice versa.
296 LOVELY PROFESSIONAL UNIVERSITY
Financial Management
Notes Limitations
A firm’s share price may rise even in case of low pay out ratio if its earnings are increasing. Herethe capital gains for the investor will be higher than the cash dividends. Similarly, for a firmhaving a high dividend payout ratio with a slow growth rate, there will be a negative impact onthe market price (because of lower earnings). In addition, some investors may prefer cashdividends to the uncertain capital gains that may arise in future.
14.3.2 Walter’s Model
Walter’s Model supports the doctrine that dividends are relevant. The investment policy of afirm cannot be separated from its dividend policy and both are, according to Walter, interlinked.The choice of an appropriate dividend policy affects the value of an enterprise.
The relationship between dividend and share price on the basis of Walter’s formula is shownbelow:
Vc =a c
c
D+R /R (E D)R
Where,
Vc = Market value of the ordinary shares of the company
Ra = Actual capitalization rate
Rc = Normal capitalization rate expected by the investors
E = Earnings per share
D = Dividend per share
Analyzing the Walter Formula:
We know that the value of share =
EPS(Earning pershare)Capitalization rate =
a
Divident Retained EarningsR
The Walter formula gives an added weight to the retained earning portion of the earnings
formula. The factor a
c
RR is placed in front of retained earnings to change its weighted value
under three different situations as follows:
1. If Ra/Rc is greater than I i.e., the firms earnings are more than the norm. In this situationwe want the firm to retain its earnings since other alternative investment offer a lowerreturn than the firm is about to secure.
Example: A firm has EPS 5 and pay dividend of 2. Its actual capitalization rate is15% and normal capitalization rate is 10%. What is the value of the firm usingcapitalization earnings and Walter formula?
Capitalization earnings = Value = 5/10 % = 50
Walter formula value = 2 + 15 6.52 (5 2) 6510 10%

LOVELY PROFESSIONAL UNIVERSITY 297
Unit 14: Management of Surplus & Dividend Policy
Notes2. Ra/Rc is equal to I, when the actual and normal capitalization rates are identical. In thiscase, the retained earnings have the same weighted value as dividends and the WalterFormula gives the same value as the Capitalization Earnings formula.
3. Ra/Rc is less than I i.e., retained earnings have a lower weight than dividends. Thus less thefirm retain, the higher its value. In the above example, if the capitalization (actual) is 5%.
Value of the firm Capitalization of earnings 5/10% = 50
Value of the Firm Walter formula =
(5 2) 3.52 5/10 3510% 10%
Assumption of the Walter Model
1. Retained earnings are the only source of finance available to the firm, with no outsidedebt or additional equity used.
2. Ra and Rc are assumed to be constant and thus additional investments made by the firmwill not change its risk and return.
Profiles
1. Firm has an indefinite life.
2. For a given value of the firm, the dividend per share and the earnings per share remainconstant.
Limitations of the Walter Model
1. Exclusive financing by retained earnings make the model suitable only for all equityfirms.
2. The assumption that the return on investment remains constant will not be true for firmsmaking high investments.
3. It ignores the business risk of the firm, which has a direct impact on the value of the firm.
Example: To illustrate approaches to dividend decisions using Walter Model
Let us consider a firm with 4 earnings per share and 3 current dividend. The firm is currentlyselling for 22 per share and thus has an actual capitalization rate of 4/22 or 18%. The normalcapitalization rate for the industry is 12 per cent. The firm has a need for cash and is consideringlowering the dividend to 2 per share. What effect would this have on the value of commonshare by using Walter Model?
3 dividend 3 18/12 1
.12 = 4.5 37.5.12
2 dividend 2 18/12 2
.12 = 5 41.67
.12
14.3.3 Gordon’s Dividend Capitalization Model
Another model that has given importance to dividend policy of the firm is the Gordon Model.Gordon Model assumes that future dividends are the sole determinant of the intrinsic value ofthe common shares.
298 LOVELY PROFESSIONAL UNIVERSITY
Financial Management
Notes The model may be written:
Value of the share = norm act
Div. Curr.CR (CR )(%RE)
Where Div. Curr = Current Dividend in rupees (annual basis)
CRnorm = Capitalization rate demanded by the market for the stock of the type.
CRact = Actual capitalization rate based on the firms current earnings(provided they are relatively normal) and current market price.
%RE = Percentage of Future earnings, the firm is likely to retain.
The dividend growth model shows the value of a share as the shares current dividend dividedby the amount that the demanded profit exceeded the rate of growth in the dividend, statedgraphically. The model shows value as:
Value of the share =
Current dividendDemanded after tax profit dividend growth
Example: If a firm has a 10% actual capitalization rate, a dividend payout of 40% anddeclares a 1 dividend in 2005. What is the growth rate? What is the likely stream of dividendsthrough 2009? If the firm is in industry with a 12% normal capitalization rate, what is theintrinsic value using the dividend growth model?
Solution: Multiplying the actual capitalization rate by the percentage of retained earnings givesthe growth rate in dividend per share, assuming no change in dividend payout.
The firm retains a 60% share of the 10% post-tax profits for a 6% growth rate. The stream ofdividend payments at a 6% growth rate is as follows:
Year 2005 2006 2007 2008 2009
Dividend factor 1.06 (1.06)2 (1.06)3 (1.06)4
Dividend 1 1.06 1.12 1.19 1.26
Value of the share =
1 1 16.6712% (10%)(60%) 0.06
Factors Incorporated in the Dividend Growth Model
1. Restriction of the shareholders’ return to a single variable: In this model the income factoris limited to the current dividend earnings retained in the firm are part of the growthfactor that will operate to increase the current dividend, but only the dividend and itsexpected increases are considered as a return.
2. Inclusion of two capitalization rates:
(a) Normal Capitalization Rate (CRnorm) i.e., reciprocal of PE ratio: If the firm is not able toachieve such a return at the existing market price, shareholders will sell their shares,thus depressing the market price and raising the rate of return.
(b) Actual Capitalization Rate: The firm’s actual capitalization rate is the relationship of itsactual EPS to the market price of its stock. This is an important factor influencinggrowth. A firm with higher profits will have more funds to retain and hence moremoney to finance growth, as compared with firms with lower profits.
LOVELY PROFESSIONAL UNIVERSITY 299
Unit 14: Management of Surplus & Dividend Policy
Notes3. Inclusion of a growth factor: In common shares valuation, we are primarilyconcerned with firm’s growth financed from retained earnings. We eliminate thesources of funds for growth:
(a) Use of debt or other fixed return securities.
(b) Issuing additional common shares.
Analyzing the Dividend Growth Model
There are three possible situations. To do this, let us consider a company with EPS of 2 andactual capitalization of 10%.
1. Normal capitalization rate less than actual capitalization rate: The shareholder in thiscase will gain more by investing in the company. For example, he may be expecting an 8%rate and the firm is actually achieving 10%. The shareholders want the firm to retain theearnings and achieve 10% return on them from similar investments. Thus, he wouldexpect that raising the growth rate of a highly profitable firm. The intrinsic value atdifferent payout ratios are worked out as below:
30% Div. Payout =
.6 .6 608% (10% 70%) 1%
50% Div. Payout =
1 1 33.338% (10% 50%) 3%
70% Div. Payout =
1.4 1.4 288% (10% 30%) 5%
100% Div. Payout =
2 2 258% (10% 0%) 8%
The intrinsic value drops from 60 at a 30% dividend payout to 25 at 100% payout.
2. Normal capitalization rate equal to capitalisation rate: In this case, the firm is doingabout as well as expected and the shareholder probably does not care about the level ofdividends. Intrinsic value will be 20 at all payout levels.
3. Normal capitalisation rate more than actual capitalization rate: In this situation, the firm isnot doing as well as expected. It is expected that the intrinsic value to rise if the firm increasedits dividend payout. Since the shareholders would like to have cash to invest at higher returnelsewhere. The intrinsic value at different payout ratios are worked out as below:
30% Div. Payout =
.6 .6 1212% (10% 70%) 5%
50% Div. Payout =
1 1 14.312% (10% 50%) 7%
70% Div. Payout =
1.4 1.4 15.5512% (10% 30%) 9%
100% Div. Payout =
2 2 16.6712% (10% 0%) 12%

300 LOVELY PROFESSIONAL UNIVERSITY
Financial Management
Notes The intrinsic value increases from 12 to 16.67 when the payout ratio is raised from 30% to100%.
14.3.4 Miller and Modigliani Model
The irrelevance of dividends is provided by the MM Hypothesis. MM maintains that dividendpolicy has no effect on the share prices of the firm. What matters, according to them, is theinvestment policy through which the firm can increase its earnings and thereby the value of thefirm given the investment decision of the firm, the dividend decision – splitting the earningsinto packages of retentions and dividends – is a matter of detail and does not matter.
Under conditions of perfect capital markets, rational investors, absence of tax discriminationbetween dividend income and capital appreciation, given the firm’s investment policy, itsdividend policy may have no influence on the market price of shares.
Assumptions
MM Hypothesis is based on the following critical assumptions:
1. Perfect capital markets, in which all investors are rational. Information is available to allfree of cost, there are no transaction costs, securities are infinitely divisible; no investor islarge enough to influence the market price of securities, there are no floatation costs.
2. There are no taxes. Alternatively, there are no differences in tax rate applicable to capitalgains and dividends.
3. A firm has a given investment policy which does not change. The operational implicationof this assumption is that financing of new investment out of retained earnings will notchange the business risk complexion of the firm and therefore, no change in the requiredrate of return.
4. There is a perfect certainty by every investor as to future investments and profits of thefirm. In other words, investors are able to forecast future prices and dividends with certainty.This assumption is dropped by MM later.
MM Hypothesis: The Crux of the Argument
The crux of the MM position on the irrelevance of dividend is the arbitrage argument. Arbitragerefers to entering simultaneously into two transactions, which balance each other. The twotransactions involve the payment of dividend on one side and raising external funds eitherthrough the sale of new shares or to raise loans – to finance investment programmers. Supposea firm has some investment opportunity, it has two alternatives (1) it can retain its earnings tofinance the investment or (2) distribute the dividend to the shareholders and raise an equalamount externally through sale of new shares. In case, the firm selects the second alternative,arbitrage process is involved in that the payment of dividends is associated with raising of fundsthrough other means of financing. The effect of dividend payment on the shareholders wealthwill be exactly offset by the effect of raising additional shares.
When dividends are paid, the market price of the shares will increase. But the issue of additionalshares will cause a decline in the terminal value of the shares. What is gained by investorsthrough increase dividends will be offset by the reduction in terminal value of the shares. Themarket price before and after payment of dividend would be same. The investors according toMM, is indifferent between dividend and retention of earnings. Since the shareholders areindifferent, the wealth would not be affected by current and future dividend decisions of thefirm. It would depend entirely upon the expected future earnings of the firm.

LOVELY PROFESSIONAL UNIVERSITY 301
Unit 14: Management of Surplus & Dividend Policy
Notes
Notes There would be no difference as per MM, if external funds are raised in the form ofdebt instead of equity. This is because of their indifference between debt and equity withrespect of leverage. The cost of capital is independent of leverage and the real cost of debtis the same as the real cost of equity.
The arbitrage process also implies that the total market value plus current dividends of twofirms, which are alike in all respects except Dividend Payout Ratio, will be identical. Theindividual shareholder can retain and invest his own earnings and do this, as well as the firm.
With dividends being irrelevant, a firm’s cost of capital would be independent of its DividendPayout Ratio.
Finally, the arbitrage process will ensure that under conditions of uncertainty also the dividendpolicy is irrelevant.
When two firms are similar in respect of business risk, the prospective future earnings andinvestment policies, the market price of their shares must be the same. This MM considers, dueto the rational behaviour of the investors who prefer more wealth to less wealth. Differences incurrent and future dividend policies cannot affect the market value of the two firms, as thepresent value of prospective dividends plus terminal value are the same.
MM Hypothesis Proof
MM provides the proof in support of their argument in the following way:
In the first step, the market value of a share in the beginning of the period is equal to the presentvalue of dividend paid at the end of the period plus the market price of the share at the end of theperiod. Symbolically:
P0 = ++
1 1e
1 (D P )(1 K ) ……(1)
where,
P0 = The prevailing market price of a share
Ke = The cost of equity capital
D1 = the dividend to be paid at the end of the period one
P1 = The market price of a share at the end of period one with no external financingthe total value of the firm will be as follows:
nP0 = ++
1 1e
1 (nD nP )(1 K ) ...(2)
where, n = No. of shares outstanding
Now, if the firm finances its investment decisions by raising additional capital issuing n1 newshares at the end of the period (t = 1), then the capitalized value of the firm will be the sum of thedividends received at the end of the period and the value of the total outstanding shares at theend of the period less the value of the new shares. Since this adjustment is actually adding andreducing the value of the new shares. Thus we have:
nP0 = + + -+
1 1 1 1 1e
1 [nD (n n )P n P ](1 K ) …. (3)
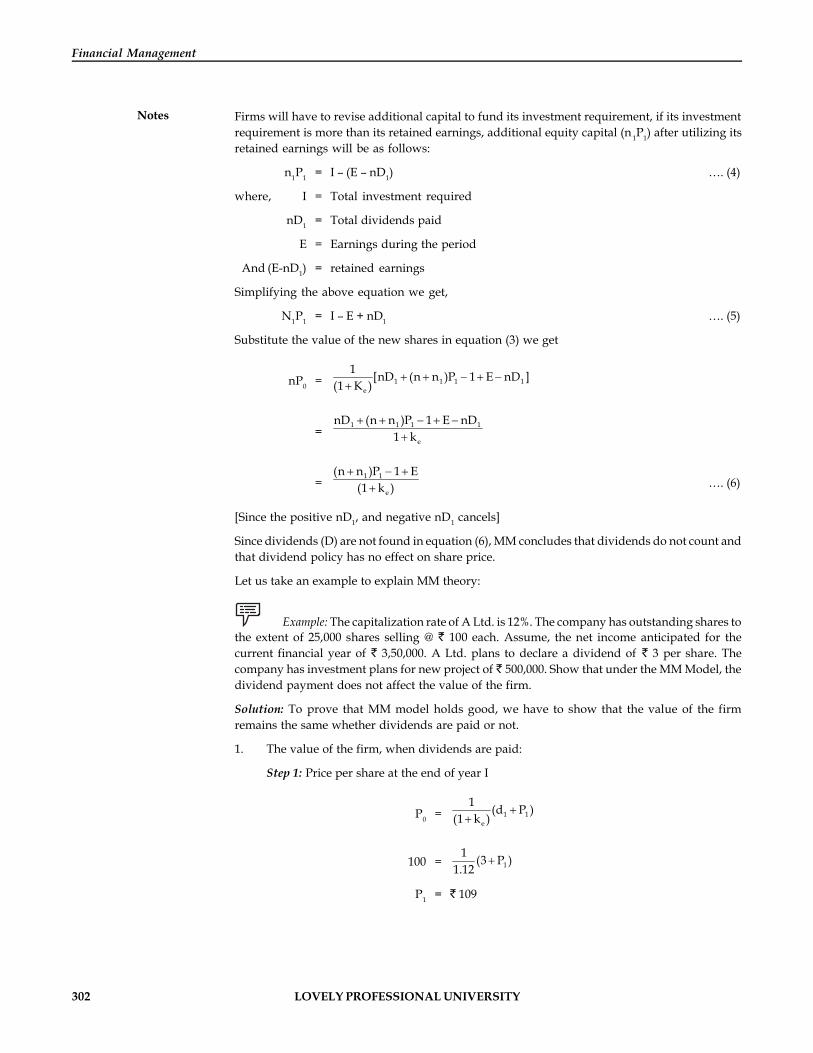
302 LOVELY PROFESSIONAL UNIVERSITY
Financial Management
Notes Firms will have to revise additional capital to fund its investment requirement, if its investmentrequirement is more than its retained earnings, additional equity capital (n 1P1) after utilizing itsretained earnings will be as follows:
n1P1 = I – (E – nD1) …. (4)
where, I = Total investment required
nD1 = Total dividends paid
E = Earnings during the period
And (E-nD1) = retained earnings
Simplifying the above equation we get,
N1P1 = I – E + nD1 …. (5)
Substitute the value of the new shares in equation (3) we get
nP0 = + + - + -+
1 1 1 1e
1 [nD (n n )P 1 E nD ](1 K )
=+ + - + -
+
1 1 1 1
e
nD (n n )P 1 E nD1 k
=+ - +
+
1 1
e
(n n )P 1 E(1 k ) …. (6)
[Since the positive nD1, and negative nD1 cancels]
Since dividends (D) are not found in equation (6), MM concludes that dividends do not count andthat dividend policy has no effect on share price.
Let us take an example to explain MM theory:
Example: The capitalization rate of A Ltd. is 12%. The company has outstanding shares tothe extent of 25,000 shares selling @ 100 each. Assume, the net income anticipated for thecurrent financial year of 3,50,000. A Ltd. plans to declare a dividend of 3 per share. Thecompany has investment plans for new project of 500,000. Show that under the MM Model, thedividend payment does not affect the value of the firm.
Solution: To prove that MM model holds good, we have to show that the value of the firmremains the same whether dividends are paid or not.
1. The value of the firm, when dividends are paid:
Step 1: Price per share at the end of year I
P0 = ++
1 1e
1 (d P )(1 k )
100 = + 11 (3 P )
1.12
P1 = 109
LOVELY PROFESSIONAL UNIVERSITY 303
Unit 14: Management of Surplus & Dividend Policy
NotesStep 2: Amounts to be raised by the issue of new shares to finance investment requirement:
N1P1 = I – (E – nD1)
= 500,000 – (350,000 – 25000 × 3)
= 225,000
Step 3: No. of shares to be raised
n1 =225000
109 Nos.
Step 4: Value of the firm
nP0 =
1 1
e
(n n )P I E(1 k )
= (25,000 225,000/109) 109 (500,000) 350,000)
1.12
Value of the firm nPo = 25,00,000
2. Value of the firm when dividends are not paid:
Step 1: Price per share at the end of year I
P0 =
1 1e
1 (D P )(1 k )
100 = 1P Or1.12
P1 = 112
Step 2: Amount to be raised from the issue of shares
500,000 – 350,000 = 150,000
Step 3: No. of shares to be raised = 150,000/1.12
Step 4: Value of the firm
nP0 =
1 1
e
(n n )P I E(1 k )
= (25,000 150,000/1.12) 1.12 (500,000) 350,000
1.12
Value of the firm nPo = 25,00,000
Thus the value of the firm in both the cases remains the same.
Critical Analysis of the Assumptions
1. Tax effect: The assumption cannot be true since the tax rate for the dividend and capitalgains are different.
2. Floatation costs: The proceeds that the firm gets from the issue of securities are net off. theissue expenses – the total issue expenses include underwriting expenses, brokerage andother marketing costs, of the tune of 10 – 15% of the total issues in India. These high costscannot be ignored.
304 LOVELY PROFESSIONAL UNIVERSITY
Financial Management
Notes 3. Transaction costs: It is an unrealistic assumption that investors do not have to incurtransaction costs like brokerage when disposing off the shares. Further, the inconvenienceand the uncertainty involved in the share price movements make the investors prefercurrent income by way of dividend to plough back of profits by the company.
4. Market conditions: Sometimes, market conditions do effect the investment decisions ofthe firm. For instance, though a firm has profitable investment opportunities, the badmarket condition may not allow it to mobilize the funds. In such cases, firm will have todepend on the retained earnings and will have a low dividend payout ratio.
14.3.5 Rational Expectations Model
According to rational expectation model, there would be no impact of the dividend declarationon the market price of the share so long as it is at the expected rate. If the dividend declared ishigher or lower than the expected level it may show some adjustments. For example, in case thefirm declares dividend higher than what was expected, it would result in an upward movementof the share price, as there would be expectations of higher earnings in future. Similarly, lowdividends would be taken as a fall in future earnings and hence market price will fall.
Example: The Agro Chemicals Company belongs to a risk class for which the appropriatecapitalization rate is 10%. It currently has 100,000 shares selling at 100 each. The firm hasproposed to declare 5 as dividend at the end of the current financial year, which has just begun.What will be the price of the share at the end of the year, if a dividend is not declared? What willbe the price if one is? Answer on the basis of Modigliani and Miller model and assume no taxes.
Solution:
1. According to Walter’s formula, the optimum dividend payout ratio would be 0%as Ra > Rc
V =a c
c
D R /R (E D)R
=
0 12 /10 5
6010%
2. (a) Price of the shares, when dividends are declared (MM)
P =
1 1e
1 (D P )(1 k )
100 = 11 ( 5 P )
1.10 ,
Hence P1 = 105
(b) Price of the shares when dividends are not declared
100 =1
1.10 P1,
Hence P1 = 110

LOVELY PROFESSIONAL UNIVERSITY 305
Unit 14: Management of Surplus & Dividend Policy
NotesSelf Assessment
Fill in the blanks:
7. Walter’s Model supports the doctrine that dividends are ……………..
8. Gordon Model assumes that future dividends are the sole determinant of the …………..valueof the common shares.
9. According to ………………….model, there would be no impact of the dividend declarationon the market price of the share so long as it is at the expected rate.
14.4 Forms of Dividends
In addition to cash dividends, the firm has other options for distributing profits to shareholders.These options are:
1. Bonus shares (stock dividend)
2. Stock (share) split
3. Stock repurchase
14.4.1 Bonus Shares (Stock Dividend)
Bonus shares occur when new shares are issued on a pro rata basis to the current shareholderswhile the firm’s assets, its earnings, the risk being assured and the investor’s percentageownership in the company remain uncharged.
Example: If a shareholder owns 100 shares of common stock at a time when the firmdistributes bonus shares in the ratio of 1:20 (1 share for every 20 shares held), the shareholderwill receive 5 additional shares.
There are several favourable aspects of a bonus issue:
1. Conserves cash: The stock dividend (bonus shares) allows the firms to declare a dividendwithout using up cash that may be needed for operations or expansion.
2. Indicates higher future profits: Normally a bonus share is an indication of higher futureprofits.
3. Raises future dividends for investors: If the regular cash dividend is continued after thebonus issue, the individual shareholder will receive higher total dividends.
4. Has high psychological value: Because of the positive aspects of bonus shares, issue ofbonus shares receives positive response by the market.
5. Retains proportional ownership for shareholders: It helps the majority shareholders inretaining the proportional ownership as compared to rights issue of shares where theshareholders are expected to pay for the shares including the premium as per issue criteria.
14.4.2 Stock (Share) Split
A stock split is a change in the number of outstanding shares through a proportional reductionor increase in the par value of the shares. Only the face value (par value) and number ofoutstanding shares are affected. The market price of the stock will adjust immediately to reflectthe stock split. Example: a firm may have 20,00,000 outstanding shares selling for 20 per share.

306 LOVELY PROFESSIONAL UNIVERSITY
Financial Management
Notes The firm declares a 2–for–1 stock split. After the split, the outstanding share will go up to40,00,000 and will sell for approximately 10 per share. A shareholder with 100 shares worth 2000 before the split will hold 200 shares worth 2000.
Notes Why firms go for stock splits?
1. Reduction of market price of stock: The major objective behind most stock split is toreduce the per share price of a firm’s common shares. A lower price per share makesthe stock more affordable in marketable lots (usually 100 shares) to more investors.
2. Indication of future growth: The announcement of the stock split is perceived as afavourable news by the investors in that with growing earnings, the company hasbright prospects and the investors can reasonably look for increase in futuredividends.
3. Reverse split: An indication of trouble. In case of reverse split, the firm reduces thenumber of outstanding shares. The declaration of reverse split is an indication thatthe firm does not have good prospects.
14.4.3 Stock Repurchase
This occurs when a firm brings back outstanding shares of its own common shares. Firmsrepurchase stock for three major reasons:
1. For stock option: A stock option is the right to purchase a specified number of shares ofcommon shares during a stated time period and a stipulated price. Stock options arefrequently given to senior officers of a company as an incentive to work to raise the valueof the firm. As for example, a firm’s stock is currently selling for 20 per share when thepresident is given the option to buy 1000 shares for 22 at anytime in the next three years.If the stock value rises to 40 the president can exercise the option, purchase the stock for
22,000 (1000 shares @ 22) and sell it for 40,000 immediately. The capital gain arising onthe sale will be a profit for the president as a direct result of the success of the firm.
2. To have shares for acquisition: When a firm is seeking control of another firm, it may bewilling to offer its own common shares for the shares of the other firm. In this exchange ofshares, the firm can repurchase stock to make the acquisition. This allows take over withoutincreasing the number of outstanding shares and avoids a dilution of earnings.
3. To retire the stock, thus increasing earnings per share: When a firm retires a portion of itsshares or buys back its own shares (as per procedure laid down by statute), the repurchaseincreases the firm’s earnings per share.
Stock Repurchase Viewed as Cash Dividend
When common shares are repurchased for cancellation, the motive is to distribute excess cash tothe owners. Generally, as long as earnings remain constant, the repurchase reduces the numberof outstanding shares raising the earnings per share and therefore the market price per share.Besides, the advantage of an increase in per share earnings, certain tax benefits to owner alsoresult. In case of cash dividend, the owner is required to pay income taxes on it, whereas, theincrease in market value of the shares, that resulted from repurchase would not be taxed till theowner sells the shares. Of course, when the stock is sold, the capital gain is taxed at a favourablerate than one applied to ordinary income.
LOVELY PROFESSIONAL UNIVERSITY 307
Unit 14: Management of Surplus & Dividend Policy
NotesSelf Assessment
Fill in the blanks:
10. A stock split is a change in the number of ……………shares through a proportional reduction
11. The ………..shares allows the firms to declare a dividend without using up cash that maybe needed for operations or expansion.
12. A ………………is the right to purchase a specified number of shares of common sharesduring a stated time period and a stipulated price.
14.5 Corporate Dividend Behaviour
A firm’s dividend policies consider division of the firms after tax income into two categories:
1. Funds to finance long-term growth: These are represented in the Balance Sheet as RetainedEarnings, also known as ploughing back of profits in the firm.
2. Funds to be distributed to shareholders: These are cash dividends declared by the Board ofDirectors and paid to common shareholders.
Two possible approaches to dividend decisions
1. As a long-term financing decision: In this approach, all the firms after tax profits can beconsidered as source of long-term financing. Thus, the payment of cash dividends reducesthe funds available to finance growth and either restricts growth or forces the firm to findout other financing sources. Thus, the firm might accept a guideline to retain earnings aslong as either of the conditions exists.
(a) Sufficient profitable projects are available: Acceptances of highly profitable projectsrepresents a growth goal for most of the firms. As long as such projects are available,the firm can retain earnings to finance them.
(b) Capital structure needs equity funds: Among a variety of sources of long-term fundsand to avoid, the high risk associated with excessive debt, the firm must have abalance of debt and equity financing. Because of the costs of floating common shares,retained earnings are profitable as equity financing.
With either of the guidelines, cash dividends are viewed as a remainder.
2. As maximization of wealth: With this approach, the firm recognizes that the payment ofdividends has a strong influence on the market price of the common shares.
14.5.1 Legal and Procedural Aspects in Connection with Payment ofDividend
Legal Aspects
The amount of dividend that can be legally distributed is governed by the company law, judicialpronouncements in leading cases and contractual restrictions. The important provisions ofcompany law pertaining to dividends are given below:
1. Company can pay only cash dividends (with the exception of bonus shares)
2. Dividends can be paid only out of the profits earned during the financial year after providingfor depreciation and after transferring to reserves, such percentage of profits as prescribedby law.
308 LOVELY PROFESSIONAL UNIVERSITY
Financial Management
Notes
!Caution The Companies (transfer to Reserves) Rules, 1975 provide that before dividenddeclaration a certain percentage of profits as specified below should be transferred to thereserves of the company:
(i) Where the divident exceeds 10% but not 12.5% of the paid up capital - Not less than2.5% of the current profits
(ii) Where dividend exceeds 12.5% but not 15% - Not less than 5% of the current profits
(iii) Where dividend exceeds 15% but not 20% - Not less than 7.5% of the current profits
(iv) Where dividend exceeds 20% - Not less than 10% of the current profits
3. Due to inadequacy or absence of profits in any year, dividend may be paid out of theaccumulated profits of previous year provided conditions as stipulated by the Companies(Declaration of Dividend out of Reserves) Rules, 1975 are satisfied:
(a) The rate of dividend should not exceed the average of the rates at which the dividendwas declared by it in 5 years immediately preceding that year or 10% of its paid upcapital whichever is less.
(b) The total amount to be drawn from the accumulated profits carried in previousyears and transferred to reserves shall not exceed an amount equal to 1/10th of thesum of its paid up capital and free reserves and the amount so drawn shall first beutilized to set off the losses incurred in the financial year before any dividend inrespect of preference or equity shares is declared and
(c) The balance of reserves after such drawl shall not fall below 15% of its paid upcapital.
(d) Dividend cannot be declared for past years for which accounts have been closed.
Procedural Aspects
The important events and dates are given below:
1. Board resolution: Dividend is the prerogative of the Board of Directors. Hence the Boardof Directors should in a formal meeting resolve to pay the dividend.
2. Shareholder’s approval: The resolution of the Board of Directors to pay the dividend hasto be approved by the shareholders in the Annual General Meeting.
3. Record date: The dividend is payable to members whose names appear in the Register ofMembers as on the record date.
4. Dividend Payment: Dividend warrants must be posted within 30 days of the declarationdate.
Task Do you think payment of dividends is an obligation for the corporate. Justify.
LOVELY PROFESSIONAL UNIVERSITY 309
Unit 14: Management of Surplus & Dividend Policy
NotesSelf Assessment
Fill in the blanks:
13. The amount of dividend that can be legally distributed is governed by the …………….law.
14. With ……………………approach, the firm recognizes that the payment of dividends has astrong influence on the market price of the common shares.
15. Dividend warrants must be posted within …… days of the declaration date.
Case Study Case: Ramesh Products
This case allows the reader to apply the concept of future EPS in evaluating a course ofaction in terms of its effect on the market value of the firm’s common stock.
Ramesh Products (RKP) is a medium-sized producer of chemicals and vinyl coating usedin a variety of industrial processes. The company’s main facilities are located in an industrialpark in East Baltimost, a central site by a rail line that is linking the firm with its majorcustomers on the east coast.
Last year the firm recorded over $200 million in sales, showed a net income of $53 millionand concluded a very successful year. For the coming year, the firm expects a 15 per centimprovement in sales and operating income figures.
The firm’s management committee, consisting of the president and the vice-presidents ofproduction, marketing, and finance, will be meeting with in a week to discuss a major newactivity for the next year. Products has been invited to bid on a long-term contract toproduce a line of plastics for a large chemical company in Wilmington, Delaware. Itappears that the firm can easily get the $50 million contract which should yield an additional$14 million in operating income. These figures are for next year only, and the firm estimateseven higher sales and profits in the future.
Chowdhary vice-president of finance, has been studying the financial data related to thenew line of plastics. The production manager knows of a small plastic company locatedabout three miles from RKP’s facilities. The plastics company has all the equipment neededto produce the new line of plastics; the company is for sale for $104 million. This pricerepresents largely the value of the assets, since the company has lost its only large contracts.Chowdhary Prasad has discussed the purchase of this plastics company with a local realestate agent and has confirmed that it is available for $100 million.
Chowdhary Prasad figures that RKP has sufficient working capital to add the new plasticsline but does not have the cash to buy the 100 million of machinery and equipment neededto begin the production. Discussion with a representative of a large Baltimore bank revealsthat RKP can borrow $39 million through a 12 per cent mortgage on its main facilities. Amortgage company has indicated that it would help finance the plastic machinery with a$51 million, 13.6 per cent mortgage. Chowdhary Prasad is considering these choices butknows that RKP has traditionally kept its debt-asset ratio below 41 per cent. He does notwant to borrow if the additional debt causes the ratio to exceed 41 per cent.
Chowdhary Prasad discussed equity financing with RKP’s investment banker on a recenttrip to New Jersy City.He learned that the firm could probably issue upto $150 million in15 per cent preferred stock or class A common stock. If the common stock were offered, it
Contd...
310 LOVELY PROFESSIONAL UNIVERSITY
Financial Management
Notes could net $20 per share to RKP. Chowdhary Prasad called new Jersy and confirmed thatthese options were still open to the firm.
In making decision on new investments, Chowdhary Prasad believes in the validity of thefuture-earnings per share technique. He knows that RKP has traditionally traded at a 6/1price-earning multiple and he expects that this will hold. Thus, if a new project increasesfuture earnings per share, it will increase the value of the firm for its shareholders.
Question
According to the future earning share approach and after detailed analysis what do youfeel about the plastic project. Is it worth while to accept.
14.6 Summary
Management of earnings means, how the earnings of a firm are determined and how theyare utilised or appropriated or allocated or distributed.
The firm’s dividend policy is formulated with two basic objectives in mind – providingfor sufficient financing and maximizing the wealth of the firm’s shareholders.
Three of the more commonly used dividend policies are Constant Payout Ratio DividendPolicy, Regular Dividend Policy and; Low Regular and Extra-dividend Policy
According to traditional approach of dividend policy the stock value responds positivelyto higher dividends and negatively with low dividends.
According to Walter model, the investment policy of a firm cannot be separated from itsdividend policy and both are interlinked.
Gordon Model assumes that future dividends are the sole determinant of the intrinsicvalue of the common shares.
The irrelevance of dividends is provided by the Miller and Modigliani Hypothesis
According to rational expectation model, there would be no impact of the dividenddeclaration on the market price of the share so long as it is at the expected rate.
In addition to cash dividends, the firm has other options for distributing profits toshareholders. These options are Bonus shares (stock dividend), Stock (share) split andStock repurchase
The amount of dividend that can be legally distributed is governed by the company law,judicial pronouncements in leading cases and contractual restrictions.
14.7 Keywords
Dividends: It refers to that portion of company’s net earnings that is paid out to the equityshareholders.
Dividend Policy: It decides the portion of earnings to be paid as dividends to ordinaryshareholders and what portion is ploughed back in the firm for investment purpose.
Payout Ratio: The ratio of dividend to earnings is known as payout ratio.
Profit: It is the excess of the revenue over the expenses on conducting the operations.
Stability: it refers to the consistency or lack of variability in the stream of dividend payments.
LOVELY PROFESSIONAL UNIVERSITY 311
Unit 14: Management of Surplus & Dividend Policy
Notes14.8 Review Questions
1. What do you think are the determinants of the dividend policy of corporate enterprise?
2. Explain the terms bonus shares and share splits. What is their rationale?
3. What factors determine the dividend policy of a company? Do you believe it will bejustifiable for a company to obtain a short-term loan from a bank to allow payment of adividend?
4. To what extent are firms able to establish definite long run dividend policies? Whatfactors would affect these policies? To what extent might these policies affect market valueof firms’ securities? Explain.
5. What is stable dividend policy? Why should a firm follow such a policy?
6. In a world of no taxes and no transaction costs, a firm cannot be made more valuable bymanipulating the dividend payout ratio. Explain the validity of the statement.
7. What assumptions and arguments are used by Modigliani and Miller in support of theirrelevance of dividends? Are dividends really irrelevant? If not, what are the argumentsfor relevance of dividend policy?
8. (a) Explain the following formula given by Walter for determining dividend policy:
V =a c
c
D R /R (E D)R
where, V = value of ordinary shares
Ra = Internal productivity of retained earnings
Rc = Market capitalization rate
E = Earnings per shares
D = Dividends per share
(b) What are the merits and limitations of the formula in designing the dividend policyfor a company?
9. How far do you agree with the proposition that dividends are irrelevant?
10. ‘Payment of dividend involves legal considerations’. Discuss.
Answers: Self Assessment
1. Surplus 2. good 3. Earnings4. fixed rupee 5. stable dividend payout 6. normal7. relevant. 8. intrinsic 9. rational expectation10. outstanding 11. bonus 12. stock option13. company 14. maximization of wealth 15. 30
14.9 Further Readings
Books Dr Pradeep Kumar Sinha, Financial Management, New Delhi, Excel Books, 2009.
Van Horne, J.C. and Wachowicz, Jr, J.M., Fundamentals of Financial Management,New Delhi, Prentice Hall of India Pvt. Ltd., 1996, p. 2.
Chandra, P., Financial Management—Theory and Practice, New Delhi, Tata McGrawHill Publishing Company Ltd., 2002, p. 3.

Jalandhar-Delhi G.T. Road (NH-1)Phagwara, Punjab (India)-144411For Enquiry: +91-1824-300360Fax.: +91-1824-506111Email: [email protected]
LOVELY PROFESSIONAL UNIVERSITY