research overview and cognitive...
TRANSCRIPT
1/29/2013
1
Research overview and cognitive approaches
Partha P. Sarkar, Ph.D.Professor
WESEP 594
January 24, 2013
1
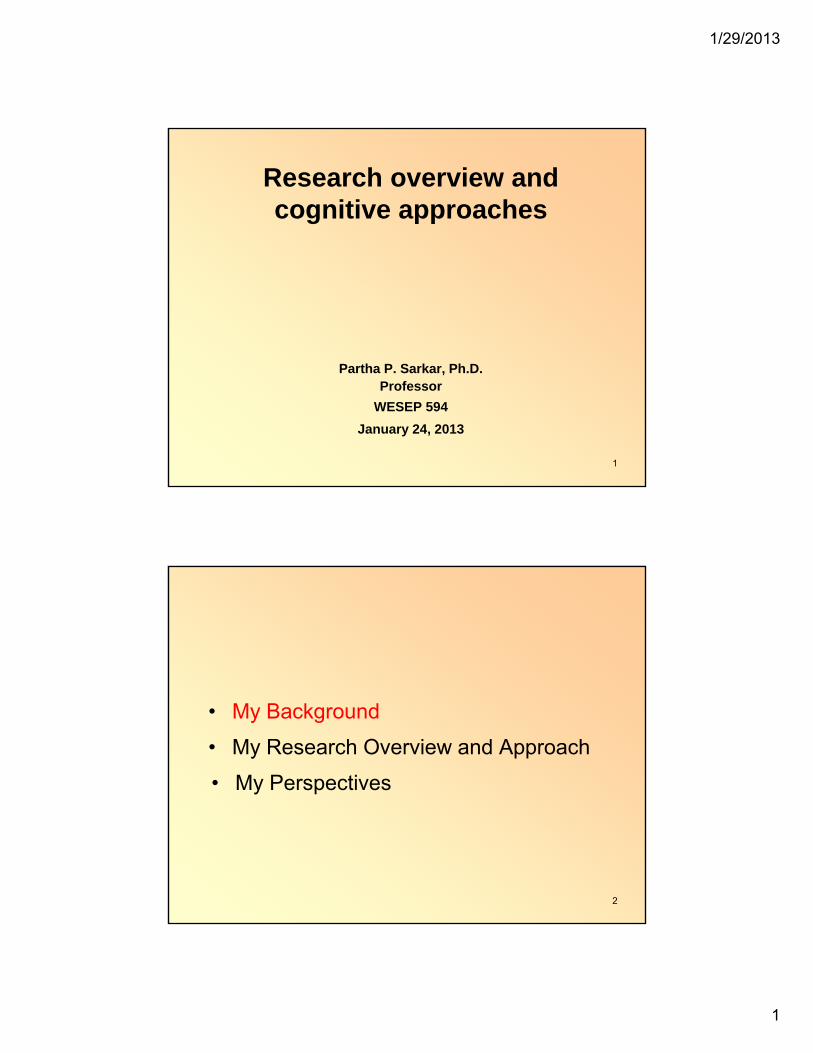
• My Background
• My Research Overview and Approach
• My Perspectives
2

1/29/2013
2
My Background
Education:• Ph.D., Johns Hopkins University, 1989-1992
• M.S., Washington State University, 1985-1986
• B.Tech, Indian Institute of Technology (Kanpur), 1980-1985
Academic Experience (20 yrs+):• Texas Tech University, 1992-2000
• Iowa State University, 2000-present
Industrial Experience (2 yrs):• Structural Engineering Research Center (SERC), Chennai, India, 1988-89
• DCPL (Kuljian Corporation, USA), Mumbai, India, 1987-88
3
Professional Highlights• TA Wilson Endowed Chair in Engineering, 2000-2008
• Guest Professor, 2008-2012, Global Center of Excellence on Wind Engineering, Tokyo Polytechnic University, Atsugi, Japan
• Invited talk to US Congressional Staff, 2005
• President, American Assoc. for Wind Engineering (2011-12)
• Member, Ed. Board, J. of Wind Engr. and Ind. Aero. & 2 Other Journals
• Appearance on several National/Intl.TV Channels, Museum, Public Radio
Research Interests
Wind Engineering/Wind Energy • Wind-tunnel and full-scale testing of CE structures
• Aerodynamics of flexible structures
• Wind loads on low-rise buildings/structures
• Design of next generation wind tunnels
• Study of tornado-, microburst-, gust front-induced wind loads 4

1/29/2013
3
Research Highlights
Sponsors: Federal - NSF, NOAA, NAVY, DOE, State - TxDOT, IAWIND, Industry
Projects: 40+ projects with a total budget of +16.5M
Students: Advised 4 postdocs, 11 PhD (8 graduated), 13 MS, 50+ undergrads
Publications: +125 articles (~50 Journal Papers), 3 Proceedings (Ed), 1 CD-
ROM, 4 Patents
5
Faculty CollaboratorsDr. Vinay Dayal, Associate Professor of Aerospace Engineering
Dr. William A. Gallus, Jr., Professor of Geological and Atmo. Sciences
Dr. Matt Frank, Associate Professor of Industrial Engineering
Dr. Hui Hu, Associate Professor of Aerospace Engineering
Dr. Atul Kelkar, Professor of Mechanical Engineering
Dr. Mike Olsen, Professor of Mechanical Engineering
Dr. Brent Phares, Assoc. Director, Bridge Engineering Center
Dr. Sri Sritharan, Professor of Civil Engineering
Dr. Gene Takle, Professor of Agronomy
Dr. Terry Wipf, Professor/Chair of Civil Engineering (Director, Bridge Engineering
Center)
Dr. Fred L. Haan, Associate Professor of Mech. Engineering, Rose-Hulman Institute
Tim Samaras, Denver, Colorado
Dr. Joshua Wurman, Principal, CSWR, Colorado
and others …6

1/29/2013
4
It is a team effort
7
ASEE: Prism Nov. 2006
WESEPResearch Interests
• Studying wind flow characteristics and interference loading effects in wind farms
• Prediction of aerodynamic/aeroelastic loads and response of wind turbine components
• SHM and fatigue life prediction
• Developing of wind energy capturing systems
Curriculum Development
WESEP 511 Wind Energy System Design Advanced design and control of horizontal-axis wind turbines which include design loads, component design and prediction of its residual life, design of wind farms, electro-mechanical energy conversion systems, and control system and its implementation.
8

1/29/2013
5
Current/Pending Wind Energy Projects
• IGERT-WESEP with Jim McCalley (PI), NSF
• Characterization of Surface Wind Energy Resources and Wake Interferences among Wind Turbines over Complex Terrains for Optimal Site Design and Turbine Durability –with Dr. Hui Hu (PI), 01/01/2012 to12/31/2014, NSF
• Innovative Offshore Vertical-Axis Wind Turbine Rotors –with Dr. Matt Frank (PI), 01/01/2012 to 12/31/2016, DOE
• Smart Sensory Membrane for Wind Turbine Blades –with Dr. Simon Laflamme (PI), pending, Iowa Energy Center
9
Damage to Infrastructure
Every year on an average in the US: $6.3 billion worth of wind damage including
$1 billion worth of damage from tornadoes $1.4 billion worth of damage from microburst
36% of property losses from major natural disasters is from wind
Every once in a while in the US: Hurricane damage exceeds $50 billion annually Metropolitan cities take a hit from tornadoes
e.g. Fort Worth, Texas – March 28, 2000
Wind Simulation and Testing Laboratory
US Losses (Rand Report)
Wild Fire12%
Others8% Flood
18%
Wind36%
Earthquake26%
2004, Hurricane Damage, Tampa
1992, Hurricane Damage, Miami
2000, Tornado Damage, Ft. Worth
1997, Rain-Wind Induced Fatigue Damage, Houston
10

1/29/2013
6
ISU Wind Engineering and Experimental Aerodynamics (WEEA) Program
Wind engineering efforts seek to understandand mitigate the damaging effects of wind on:
•Built structures•Environment•People
Experimental aerodynamics efforts investigatebasic aerodynamic problems in:
•Aerospace•Agriculture•Environment•Transportation•Sports•Wind Energy
Meteorology
Statistics/Probability
Aerodynamics/Aeroelasticity
Structures
Materials
Vibrations
Wind Simulation and Testing Laboratory
11
Extreme wind events involve a wide range of complex flow patterns • Gust Front: violent gusting, direction change• Tornado: rotating flow, downdraft and updraft• Microburst: downdraft and outflow
Extreme Events are Transient in Nature
Wind Simulation and Testing Laboratory
12

1/29/2013
7
• My Background
• My Research Overview and Approach
• My Perspectives
13
Develop Facilities and Tools
14

1/29/2013
8
AABL Wind and Gust Tunnel• Two test sections
•Aero: 8 ft x 6 ft, 110 mph (<0.2% turbulence) and •ABL: 8 ft x 7.5 ft, 90 mph (various terrains)
• Gust generation: up to 25% change in wind speed in 4sec.
Aero: 8 ft x 6 ft, 110 mph
Gust Generator
Wind Simulation and Testing (WiST) Lab FacilitiesAtmospheric Boundary Layer (ABL) Simulation
8 ft x 7.25 ft, 110 mph15
Bypass Duct for Gust Generation
0.80
0.90
1.00
1.10
1.20
1.30
1.40
-4 -2 0 2 4 6 8 10 12
Time (sec)
Vel
ocit
y (V
/Vin
itia
l)
16

1/29/2013
9
• This facility was designed specifically to study tornado- and microburst-
induced forces on buildings and structures.
• Maximum diameter of tornado: 3.5 ft
• Maximum tangential velocity at 2/3rd fan Power: 14.5 m/s (32.4 mph)
• Maximum diameter of microburst: 6.0 ft
• Maximum downdraft or microburst velocity: 50 ft/sec (34 mph)
• Maximum translating wind speed: 0.61 ft/sec
Wind Simulation and Testing (WiST) Lab FacilitiesTornado or Microburst Wind Simulation
17
Tornado/Microburst Simulator
18

1/29/2013
10
4 to 8 ft
Fan Motor
5.5 m (18 ft)
1.83 m (6 ft)
0.3 m (1 ft)
1.52 m (5 ft)
H = 1 to 5 ft
Rotating downdraftAdjustable ground plane
Turning Vane Open
Honeycomb/Screen
Tornado Mode
19
Wind Simulation and Testing (WiST) Lab FacilitiesWind-Induced Vibration
Suspension system for studying aeroelastic (e.g. flutter, vortex shedding, buffeting) problems 3 degrees of freedom
Free vibration or forced vibration
Bridge decks
Airfoils
Stay cables
Towers and poles
Vibration of structural systems
Aerospace Engineering
Contact: Prof. Partha Sarkar, AerE
1/29/2013
11
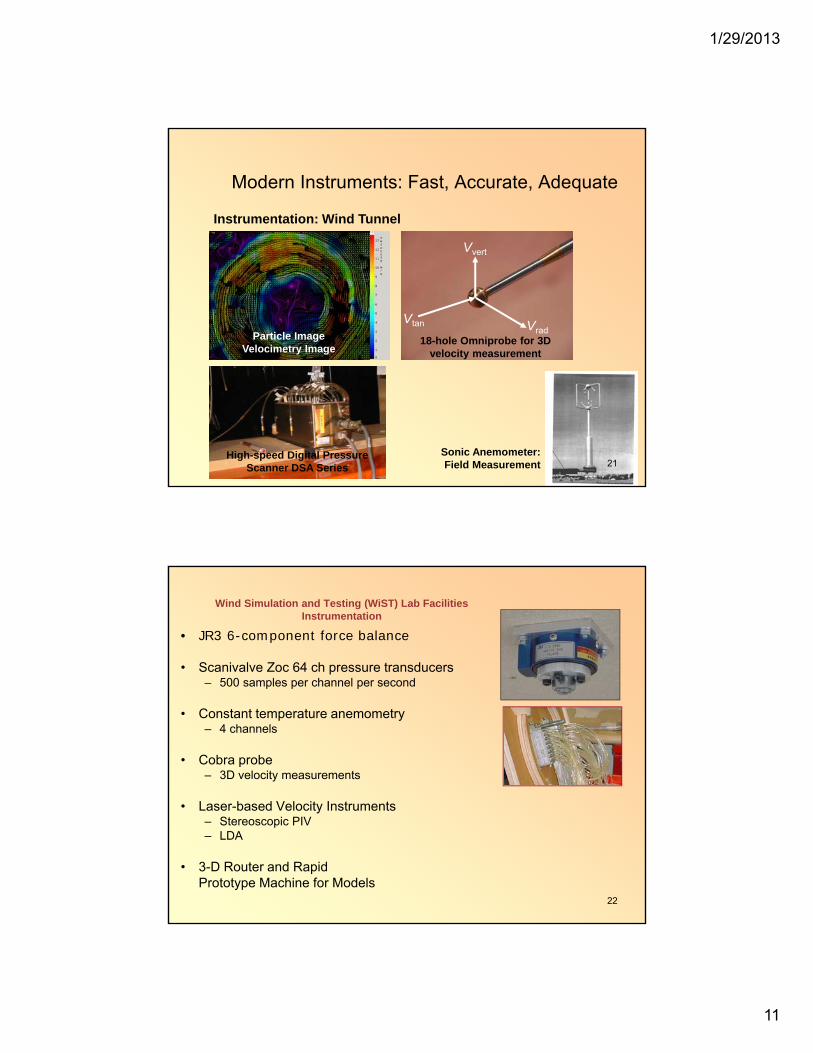
Modern Instruments: Fast, Accurate, Adequate
Instrumentation: Wind Tunnel
Vvert
VradVtan
18-hole Omniprobe for 3D velocity measurement
High-speed Digital Pressure Scanner DSA Series
Sonic Anemometer: Field Measurement
Particle Image Velocimetry Image
21
• JR3 6-component force balance
• Scanivalve Zoc 64 ch pressure transducers– 500 samples per channel per second
• Constant temperature anemometry– 4 channels
• Cobra probe– 3D velocity measurements
• Laser-based Velocity Instruments– Stereoscopic PIV– LDA
• 3-D Router and Rapid Prototype Machine for Models
Wind Simulation and Testing (WiST) Lab FacilitiesInstrumentation
22

1/29/2013
12
ABL Simulation of Straight-Line Winds
23
Fig.1 Miami-Ft Lauderdale
Fig. 2 Dallas
24

1/29/2013
13
25
Studying Effects of Tornadoes and Microburst
• Laboratory Simulations
• Field Measurements
• Numerical Simulations
26

1/29/2013
14
Types of tornados (National Geographic)
inflow
2max
inflow2)( Ratio Swirl
Q
rV
Q
rrS c
27
Tangential Velocity Validation
Tangential velocity profiles for tornado simulator and field radar data for Spencer, South Dakota tornado of 1998 and Mulhall, Oklahoma tornado of 1999.
Doppler on WheelsJ. Wurman (2004,2005)
r/rc
v /v
ma
x
0 1 2 3 4
0
0.5
1Vane 5 (z=0.10rc)
Vane 5(z=0.24rc)
Vane 5 (z=0.38rc)
Vane 5 (z=0.52rc)
Mulhall radar (z=0.52rc)
Spencer radar (z=0.52rc)
28

1/29/2013
15
ISU Collaborative EffortTimothy M. Samaras
ISU Collaborative Effort
0 25 50 75 100 125 150 175 200 225 250840
855
870
885
900
915
930
945
960

1/29/2013
16
Instantaneous vortex structure at θv=15º, Low Swirl Ratio
Single-celled vortex
Zhang and Sarkar, 2011
31
Instantaneous vortex structure at θv=45º, High Swirl Ratio
(a) Smooth ground (b) Rough ground IISub-vortices
32

1/29/2013
17
Hu, Yang, Sarkar, Haan (2011)
33
-6 -4 -2 0 2 4 6-0.5
0
0.5
1
1.5
2
X/D
CF
z
R1:LS:0o
R1:HS:0o
R1:QS:0o
XY
Z
Wind Engineering ResearchTornado-Induced Wind Loads on Structures
by Haan, Sarkar, Gallus, Balaramudu (NSF Sponsored)
r/rc
v /v
ma
x
0 1 2 3 4
0
0.5
1Vane 5 (z=0.10rc)
Vane 5(z=0.24rc)
Vane 5 (z=0.38rc)
Vane 5 (z=0.52rc)
Mulhall radar (z=0.52rc)
Spencer radar (z=0.52rc)
Comparison of ISU Laboratory Simulated and Field Tornado Wind Speed Distributions
Transient Roof Uplift Load Coefficient for a Gable-Roofed Building in a Translating Tornado, LS-Low Speed, HS- High-Speed
34

1/29/2013
18
Results: Static Jet Microburst Simulation
(1) .... 2
11
b
z Cerf
n
b
zC
mU
U
C 1 =1.52, C2 =0.68, n=1/6.5
Cp
x/H
-1 -0.5 0 0.5 1
2
2.5
3
BA
CK
Cp
x/H
00.511.520
0.5
1
FR
ON
T
x/H
Cp
1.5-1.5
-1
-0.5
0
0.5k-esst k-wreazrngrsmlesExp
ROOF
U/Um
z/b
0 0.25 0.5 0.75 1 1.250
0.5
1
1.5
rakepivWoodRajarathnamEqn. (1)NIMROD Doppler Radar
Pressure Coefficients for Building at 1D from Center of the Jet
Comparison of Different Turbulence models with Experimental Data
Normalized Radial Velocity Profiles
35
Results: Moving Jet Microburst Simulation
Jet Translation Speed1 = 0.225 m/sNozzle Jet Exit Velocity = 10 m/sNozzle Diameter = 203.2 mm (8 in.)
X/D
Cd
-3 -2 -1 0 1 2 3-2
-1.5
-1
-0.5
0
0.5
1
1.5
2S1 (CFD)S1 (Exp)
X /D
Cl
-3 -2 -1 0 1 2 3-1.5
-1
-0.5
0
0.5
1
1.5 S1 (CFD )S1 (Exp)
Drag coefficient for 25.4 mm cube Lift coefficient for 25.4 mm cube
36

1/29/2013
19
Model in ANSI/ANS4
0
2
1
14
57
N Jo
hn
son
St.
Flo
ren
ce S
t.
Lin
coln
St.
4th Ave.
3rd Ave.
4th
St.
3rd
St.
2n
d S
t.
1st S
t.
3rd Ave.
Conn St.
Sunset Dr.
Do
roth
y Ave
.
Ple
asa
nt D
r.
Ne
we
ll Ave
.
5th
St.
Circle Dr.
Hillto
p D
r.
N
42
2
2
2
4
2 22
32
4
224216
212436
1114
7
335376
2227
4 7
31
4
7
6
6
4
7
4
7
3 4 2 7
7
6
7
7
7
78
77
6888
6
667766
4
67
4 88 5
7
7
7 7 6 4 7
766
74 6 7 6
4
4
2
4
6
7
2
8 7
87878
7
4
6
42
2
1
2
86 7
7
1021
0
2
21
0
011
7 8 7
1
2
2
7
8
3
0 0 0
0
6 7
8
88
8
88
8
7
7
8
8
7
78
8
7
78
8
6
6
4
4
2
4
1 4
2
2
2
6
4
42
2
0
1
8
4
4 6
7
66
7
6
2
1
2
7
6 6
76
66
66
8
6
7
77
1 0
6
2
1
6433
6
No Damage(0)
DOD= 1,2
DOD= 3,4
DOD= 5,6
DOD= 7,8
DOD= 9,10
DOD= 9,10(Residence where there were the dead)
ElementarySchoolChur
ch Church
Bank A
High School
Warehouse
1
S Jo
hn
son
St.
57 14
57
14
IndustrialBuilding
6
6
Bank B
Fire EngineGarage
0 0
01
0
200m
Butler County
Des Moines
Iowa State
Parkersburg
0 100
An_l
An_r
As2_r
As2_l
As1_r
As1_l
Vt6
6
Tran
slation
Directio
n
Rm
0
Enhanced Fujita Scale
Field Investigation of EF5 Tornado Disaster in Parkersburg, IA, May 25, 2008, Kikitsu and Sarkar (2010)
37
Field Investigation of EF5 Tornado Disaster in Parkersburg, IA, May 25, 2008 (Kikitsu and Sarkar, 2010)
High school Bank office
ResidenceTanks
38

1/29/2013
20
Thampi, Dayal and Sarkar, 2011
39
Case 1 Vs Case 2
Deflection in global Z Deflection in global X Von Mises stress
• Case 1: X = -1.65rc (125 mph), Case 2: X = 0.25rc (180 mph) 40

1/29/2013
21
Final damage state of sealed building with roof uplift connectors designed for 40 m/s
(3-sec gust), with failed roof elements removed
Partially damaged example building at Parkersburg
Thampi, Dayal, Sarkar, 2011
41
Time-domain modeling of loads
42

1/29/2013
22
A Time-Domain Model for Predicting Aerodynamic Loads on a Slender Support Structure for Fatigue Design
Chang, Phares and Sarkar, 2008
43
Pole 1
Pull & release
0 2 4 6 8 100
100
200
300
400
500
6.40
3.33
1.300.31
Frequency (Hz)
Am
plit
ud
e
-200-100
0100200
0 2 4 6 8 10Frequency (Hz)
An
gle
(de
g)
Mode FEA FFT Difference Damping ratio
1 0.338 0.305 10.82% 0.25%
2 1.337 1.294 3.32% 0.17%
3 3.407 3.333 2.22% 0.29%
4 6.702 6.396 4.78% 0.27%
Long-Term Monitoring
Pluck test - Pole 1
44

1/29/2013
23
U(z)
X
Y
Z
)sin()(
)()1)((
2
1
cos)(sin)(
sin)(cos)(
22
2
12
tKCD
yKY
U
y
D
yKY
AUF
FFF
FFF
FFFFkyycym
FFFkxxcxm
L
yvs
LDy
b
LDx
b
yse
yvs
yb
y
xse
xb
x
Buffeting
Vortex shedding
Mathematical modelingEquation of motion
45
dU
vtC
U
utCAU
U
vn
U
vC
U
uCAU
d
dCC
d
dCCAuU
FFF
vLuD
t
LD
LL
DD
LDx
b
])(
)(')(
)('2[2
1
),()2
(2
1
])()[()(2
1
sin)(cos)(
0
2
2
2
dU
vtCC
U
utCAU
nU
vCC
U
uCAU
d
dCC
d
dCCAuU
FFF
vLDuL
t
LDL
LL
DD
LDy
b
])(
)(')()(
)('2[2
1
U
v ,)(])(
2[
2
1
)]()[()(2
1
cos)(sin)(
'
0
2
'2
2
0 t coefficienlift RMS :C
negligible ~ stiffness cAeroelasti:Y
tests tunnel windfrom - damping caeroelastiNonlinear :ε
tests tunnel windfrom - damping caeroelastiLinear :Y
)sin()(
)()1)((
2
1
L
2
1
22
2
12
tKC
D
yKY
U
y
D
yKY
AUF
L
yvs
Mathematical modelingBuffeting functions
Vortex shedding forcing function
46

1/29/2013
24
12-sided cylinder model
12 in. × 12 in. end plate with rounded corners
22-lb capacityForce transducer
Chain
0.75 in. Aluminum hollow rod
Coil Springs
Leaf spring
• Length: 20 in.
• Diameter: 4 in. (Corner to Corner)
Wind Tunnel TestingDynamic
• Mass: 0.19 slugs
• Frequency: 7.15 Hz
• Range of Re: 3.5×10³ ~ 5.5×10⁴ 47
0 1 2 3 4 5-0.5
-0.4
-0.3
-0.2
-0.1
0.0
0.1
0.2
0.3
0.4
0.5
Am
plit
ud
e,
y 0 (in
)
Time (sec)
0 1 2 3 4 5-0.5
-0.4
-0.3
-0.2
-0.1
0.0
0.1
0.2
0.3
0.4
0.5
Am
plitu
de, y
0 (in
)
Time (sec)
0 1 2 3 4 5-0.5
-0.4
-0.3
-0.2
-0.1
0.0
0.1
0.2
0.3
0.4
0.5
Am
plitu
de,
y0 (
in)
Time (sec)
Before “Lock-in”
After “Lock-in”
“Lock-in”
0.0
0.5
1.0
1.5
2.0
0 1 2 3 4 5 6 7 8 9 10
Reduced velocity, U/nD
f s/f
n
“Lock-in”St =0.2
Wind Tunnel TestingDynamic: Strouhal number
48

1/29/2013
25
0.00
0.05
0.10
0.15
0.20
0.5 1.0 1.5 2.0 2.5 3.0 3.5 4.0 4.5 5.0
Scruton number, Sc
Red
uced
am
plitu
de, y 0
/D
Experiment for a 12-sided cylinder
Fitted equation for a 12-sided cylinder
Griffin et al. for a circular cylinder
2.45c
2t
20
]SSπ(80.72[1
1.91
D
y
3.35c
2t
2
0
)]SSπ(80.43[1
1.29
D
y
Wind Tunnel TestingDynamic: Sc vs. Amplitude
49
Aerodynamic Force ModelingComparison
S12
S10
U
0.0
2.5
5.0
7.5
10.0
0 5 10 15 20 25 30 35 40 45 501 min. mean wind speed (mph)
Stre
ss-R
ange
(ks
i) 1
S10
S12
0
2
4
6
8
0 5 10 15 20 25 30 35 40
1 min. mean wind speed (mph)
Stre
ss-r
ange
(ks
i) 1
±3·σ
X-Numerical Simuation
0
2
4
6
8
0 5 10 15 20 25 30 35 40
1 min. mean wind speed (mph)
Stre
ss-r
ange
(ks
i) 1
±3·σ
Y-Numerical Simuation
Peak
50

1/29/2013
26
Time-Domain Aeroelastic Loads and Response of Flexible Bridges in Gusty Wind: Prediction and Experimental Validation
Cao and Sarkar, 2012
Akashi Kaikyo Bridge
6532 ft. 51
Experimental Setup
View From Downstream View From Side
52

1/29/2013
27
Results and DiscussionStationary Wind Case
0
1
2
3
4
5
6
7
0 5 10 15 20
Vel
ocit
y, U
(m
/s)
Time (s)
53
Results and DiscussionStationary Wind Case
-0.2
-0.15
-0.1
-0.05
0
0.05
0.1
0.15
0.2
0 5 10 15 20
Lif
t co
effi
cien
t, C
l
Time (s)
Numerical
Experimental
-0.06
-0.04
-0.02
0
0.02
0.04
0.06
0 5 10 15 20
Mom
ent
coef
fici
ent,
Cm
Time (s)
Numerical
Experimental
54
-0.04
-0.03
-0.02
-0.01
0
0.01
0.02
0.03
0.04
0 5 10 15 20
Ver
tica
l dis
pla
cem
ent,
h
(m)
Time (s)
-5
-4
-3
-2
-1
0
1
2
3
4
0 5 10 15 20
Tor
sion
al d
isp
lace
men
t, α
(deg
)
Time (s)

1/29/2013
28
Mitigation of Wind Loads
55
Understanding Wind Loads
EffectCause
Delta Wing Vortices on Roof
56

1/29/2013
29
Mitigation
Conical VortexDisrupter
Meteorological wind tunnel at CSU
-4
-2
0
2
0 100 200 300 400 500 600 700 800 900
Time t (sec)
Cp
-12
-10
-8
-6
-4
-2
0
2
Cp
Texas Tech WERFL
Mitigation
Before
After
Source: Sarkar, Wu, Banks and Meroney
Conical Vortex Disrupter Separated shear layer
Vortex
Wall
Building roof
Airflow inducedinto bubble
57
Aerodynamic Solutions to Cable Vibrations Sarkar, Mehta, Zhao, Gardner, Phelan
•
WIND
Upper Water Rivulet
58

1/29/2013
30
Full-scale tests for validation
Veteran’s Memorial Bridge, Port Arthur, TX
59
Full-scale tests for validation
60

1/29/2013
31
Full-scale tests for validationVeterans’ Memorial 5g cable-stay Vibration Event
61
Rain/wind-induced stay cable vibration
WIND
Upper Water Rivulet
Circular Ring
0
0.5
1
1.5
2
2.5
0 100 200 300 400
Reduced Velocity (=U/nD)
RM
S o
f D
ispl
. (in
.)
With UpperRivulet Only
With Rivulet andRings @ 2D
With Rivulet andRings @ 4D
Aerospace Engineering
62

1/29/2013
32
• My Background
• My Research Overview and Approach
• My Perspectives
63
Concept Phase
Select a few problem areas/topics first
Do a quick literature review on those topics
Lay out all the potential topics on the table
Discuss with your advisor(s) and Others
Keep your ability, interest, facilities and available time in mind
Don’t be hasty, explore in details and iterate if necessary
Do a detailed literature review on a couple of potential problem
topics that you select
Chart a scope of work – identify basic ingredients
Build slowly up and add spice to your work to increase its value
64

1/29/2013
33
Execute PhaseYou should• Think BIG / Out of the Box
• Sleep/shower/eat with the problem
• Explore all views of the problem
• Be well organized
• Prepare to delve into the abyss of the problem
• Document and surely backup data/results
You shouldn’t• Jump into quick conclusions
• Trust your own results until convinced by testing an
alternate method
• Discuss concepts with others whom you cannot trust
• Be afraid of hitting a brickwall because you may65
Conclusion Phase
• Write – Weekly reports documenting your work
– Conference/poster paper as soon as one part of work is partly done
– Journal paper as soon as one part of work is complete
– Dissertation chapter(s) as you make progress
66

1/29/2013
34
Attributes of a good researcher– Creative/Imaginative– Motivated– Inquisitive mind and Knowledgeable– Self-confident/Not Over-confident– Bold – Reasonable– Persuasive– Hardworking– Detailed– Patient– Organized– Maybe eccentric 67
THANKS
68