research project on investing in consumer brands and companies
TRANSCRIPT

Challenging conventional wisdom about
consumer product investing

Summary
2
• Venture capitalists traditionally cite a handful of reasons they prefer to
invest in technology over consumer companies; however, many of these
reasons are not fully supported by the facts
• Consumer companies making branded products or services have
fundamentally more attractive business models than companies that focus
on retail aggregation alone
• Apparel and accessories is an attractive vertical for early-stage investment
because of high and growing brand values and compelling financial profiles
• Consumer electronics is a challenging vertical for early-stage investing
because of low barriers to competition and difficulty of reaching end-users
DRAFT

Contents
• Introduction
• Retail aggregators vs. product makers
• Apparel and accessories
• Consumer electronics
3
DRAFT

US venture investment is heavily skewed towards technology with
consumer accounting for 5-10% of dollars invested…
SOURCE: PWC, NVCA MoneyTree Report 2014, CapIQ as of 4/8/15 based on Russell 3000 Index
15%
31%26%
55%
44%
19%
6%
14%
6%9%
17%
6%
16%
6%
25%
19%
17%
14%
11%
4%16%
6%
18%
20%
10%
8% 8%
16%
4%
13%6%
4% 4% 8%
19%
5%4%
18%
7%3% 6%
4%
4%
1%
3%4%
0%
10%
20%
30%
40%
50%
60%
70%
80%
90%
100%
Perc
ent
of U
S V
en
ture
In
ve
stm
en
t
28.5
2000
1%
1995
4.0
3%
US Stock Market
2%
2%
7.4
2014
7.7
2013
2%2%
1%
3%
2%
2007
5.0
2%
3%
1%
Financials Services
Other
Software, ITSemiconductors, Electronics,Instrumentation, Networking
Computers, PeripheralsTelecomIndustrial/Energy
Media
Consumer
Healthcare
Venture Capital Dollars InvestedUS Stock Market
Value
4
DRAFT

Many of the largest companies in the world are non-tech
SOURCE: Capital IQ 4/8/15 5
Rank Company Name Primary Sector Primary Industry Market Cap
1 Apple Inc. (NasdaqGS:AAPL) Information Technology Technology Hardw are, Storage and Peripherals 731,588
2 Google Inc. (NasdaqGS:GOOGL) Information Technology Internet Softw are and Services 371,090
3 Berkshire Hathaw ay Inc. (NYSE:BRK.A) Financials Multi-Sector Holdings 353,030
4 Exxon Mobil Corporation (NYSE:XOM) Energy Integrated Oil and Gas 352,606
5 Microsoft Corporation (NasdaqGS:MSFT) Information Technology Systems Softw are 339,801
6 Johnson & Johnson (NYSE:JNJ) Healthcare Pharmaceuticals 278,501
7 Wells Fargo & Company (NYSE:WFC) Financials Diversif ied Banks 277,862
8 Wal-Mart Stores Inc. (NYSE:WMT) Consumer Staples Hypermarkets and Super Centers 261,408
9 General Electric Company (NYSE:GE) Industrials Industrial Conglomerates 251,788
10 Facebook, Inc. (NasdaqGS:FB) Information Technology Internet Softw are and Services 230,289
11 JPMorgan Chase & Co. (NYSE:JPM) Financials Diversif ied Banks 226,759
12 The Procter & Gamble Company (NYSE:PG) Consumer Staples Household Products 223,521
13 Pfizer Inc. (NYSE:PFE) Healthcare Pharmaceuticals 212,701
14 Verizon Communications Inc. (NYSE:VZ) Telecommunication Services Integrated Telecommunication Services 204,155
15 Chevron Corporation (NYSE:CVX) Energy Integrated Oil and Gas 200,540
16 Oracle Corporation (NYSE:ORCL) Information Technology Systems Softw are 188,264
17 The Walt Disney Company (NYSE:DIS) Consumer Discretionary Movies and Entertainment 180,766
18 The Coca-Cola Company (NYSE:KO) Consumer Staples Soft Drinks 178,628
19 Amazon.com Inc. (NasdaqGS:AMZN) Consumer Discretionary Internet Retail 177,023
20 AT&T, Inc. (NYSE:T) Telecommunication Services Integrated Telecommunication Services 169,459
21 Bank of America Corporation (NYSE:BAC) Financials Diversif ied Banks 164,223
22 Visa Inc. (NYSE:V) Information Technology Data Processing and Outsourced Services 163,296
23 Merck & Co. Inc. (NYSE:MRK) Healthcare Pharmaceuticals 162,203
24 International Business Machines Corporation (NYSE:IBM)Information Technology IT Consulting and Other Services 159,976
25 Citigroup Inc. (NYSE:C) Financials Diversif ied Banks 159,110
DRAFT
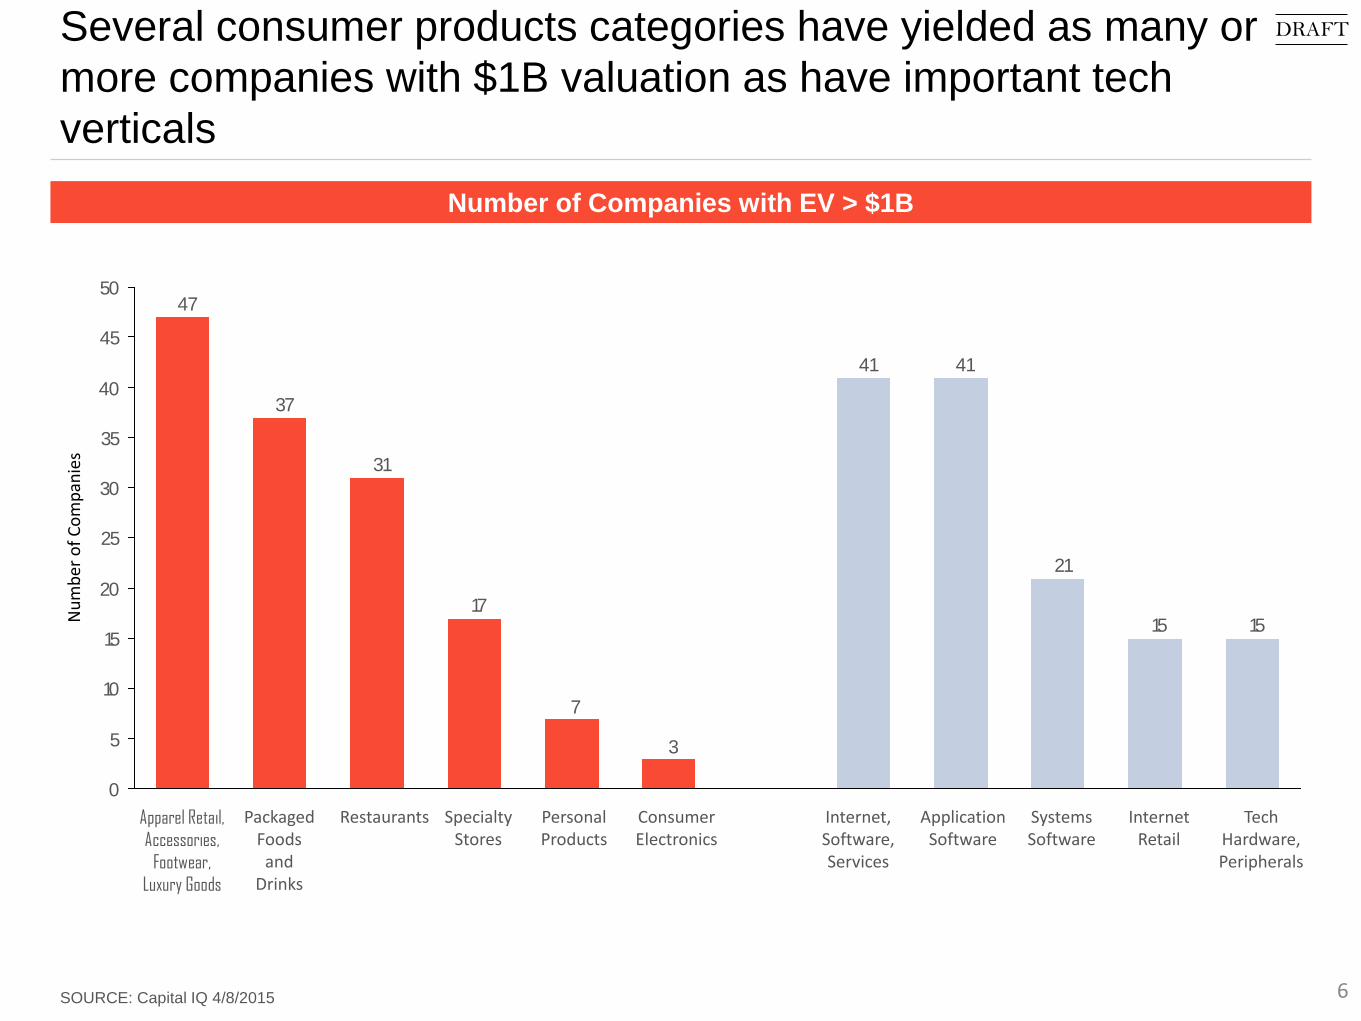
Several consumer products categories have yielded as many or
more companies with $1B valuation as have important tech
verticals
SOURCE: Capital IQ 4/8/2015
1515
21
4141
3
7
17
31
37
47
0
5
10
15
20
25
30
35
40
45
50
Internet, Software, Services
Nu
mb
er o
f C
om
pan
ies
Apparel Retail,
Accessories,
Footwear,
Luxury Goods
Packaged Foods and
Drinks
Tech Hardware, Peripherals
Systems Software
Application Software
Internet Retail
Specialty Stores
Restaurants Consumer Electronics
Personal Products
Number of Companies with EV > $1B
6
DRAFT

While some consumer companies trade at high multiples,
technology companies trade even higher
SOURCE: Capital IQ 4/8/15
7.4x8.1x8.4x
9.0x
27.2x
13.0x
15.3x16.1x
17.6x
22.0x
0
2
4
6
8
10
12
14
16
18
20
22
24
26
28
EV/L
TM R
even
ue
High Multiple Consumer Products
Companies
High Multiple Consumer Technology
Companies
7
DRAFT

Several consumer companies have scaled to $1 billion in
sales as quickly as technology’s greatest success stories
SOURCE: Forbes, CapitalIQ, FastCompany, Stanford GSB, Company Websites
10
10
10
10
9
9
8
8
8
7
6
6
5
5
5
5
4
3
2
Years to reach $1B in sales
Consumer
IT, Software, Internet
8
DRAFT

While leading tech darlings do generate high gross margins,
consumer brands hold their own and often have higher total
margin
SOURCE: Capital IQ 4/8/15
51%
55%
57%
59%
60%
61%
61%
65%
73%
79%
21%
21%
33%
28%
21%
24%
30%
19%
31%
43%
27%
29%
45%
62%
66%
68%
70%
72%
83%
87%
9%
20%
-3%
26%
18%
20%
37%
5%
40%
2%
Gross Margin EBIT Margin
9
DRAFT

Today’s consumer product IPO class has built larger businesses
per $ of VC investment than their technology counterparts …
SOURCE: Capital IQ, Pitchbook
2.2x2.3x
3.2x3.4x
4.3x
0.3x
0.7x
1.0x
1.5x1.5x
2.0x
2.8x
0.0
0.5
1.0
1.5
2.0
2.5
3.0
3.5
4.0
4.5
LTM
R
evenue/C
apit
al
10
Annual LTM Revenue at time of IPO / Pre-IPO Capital Raised
DRAFT

0
10
20
30
40
50
60
70
80
90
100
110
120
130
0 20 40 60 80 100 120 140 160 180 200 220 240 260 280 300 320
Eventbrite
Annu
al R
even
ue (
$ m
illio
ns)
Total Capital Raised
($ millions)
… and private ventures support a similar story to today’s IPO
class …
SOURCE: CB Insights, PrivCo April 8th, 2015, Fast Company, Inc.com
Consumer, Retail IT, Internet
Less capital, more
revenue
More capital, less
revenue
11
DRAFT

… but due to high public valuations, technology IPO class has
created more value per $ of VC investment
SOURCE: Capital IQ 5/15/15, Pitchbook
2.9x
6.5x
12.9x13.4x
20.5x
4.6x
10.9x11.3x
25.9x
28.9x30.0x
0
5
10
15
20
25
30
EV/C
apit
al
Growth
Rate
(%)
31 58 20 11 20 52 67 59 73 72 74
12
IPO Enterprise Value / Pre-IPO Capital Raised
DRAFT

Global market size of consumer categories is often multiples
larger than popular technology verticals
SOURCE: Businessoffashion.com, Statista, Forbes, Markets and Markets, Tech Crunch
208796121131
280317
1,2001,240
2,1002,140
0
200
400
600
800
1,000
1,200
1,400
1,600
1,800
2,000
2,200
Dolla
rs (B
)
Enterprise
Software
Apparel SaaSCyber
Security
Marketing
Software
Internet
Advertising
Cloud
Services
Consumer
Electronics
BeverageRestaurantsPackaged
Food
13
DRAFT

Consumer product companies can reach very high market
shares, comparable to those of leading IT firms
SOURCE: Forbes, Statista
30%
48%
68%
33%
42%45%
60%
67%
0%
10%
20%
30%
40%
50%
60%
70%
Mar
ketS
hare
US Athletic
Footwear
Global Toothpaste US Soft drinks US Out-of-
home Coffee
Global Search US Smartphones Global Cloud
Computing
US Fitness
Trackers
14
DRAFT

Contents
• Introduction
• Retail aggregators vs. product makers
• Apparel and accessories
• Consumer electronics
15
DRAFT
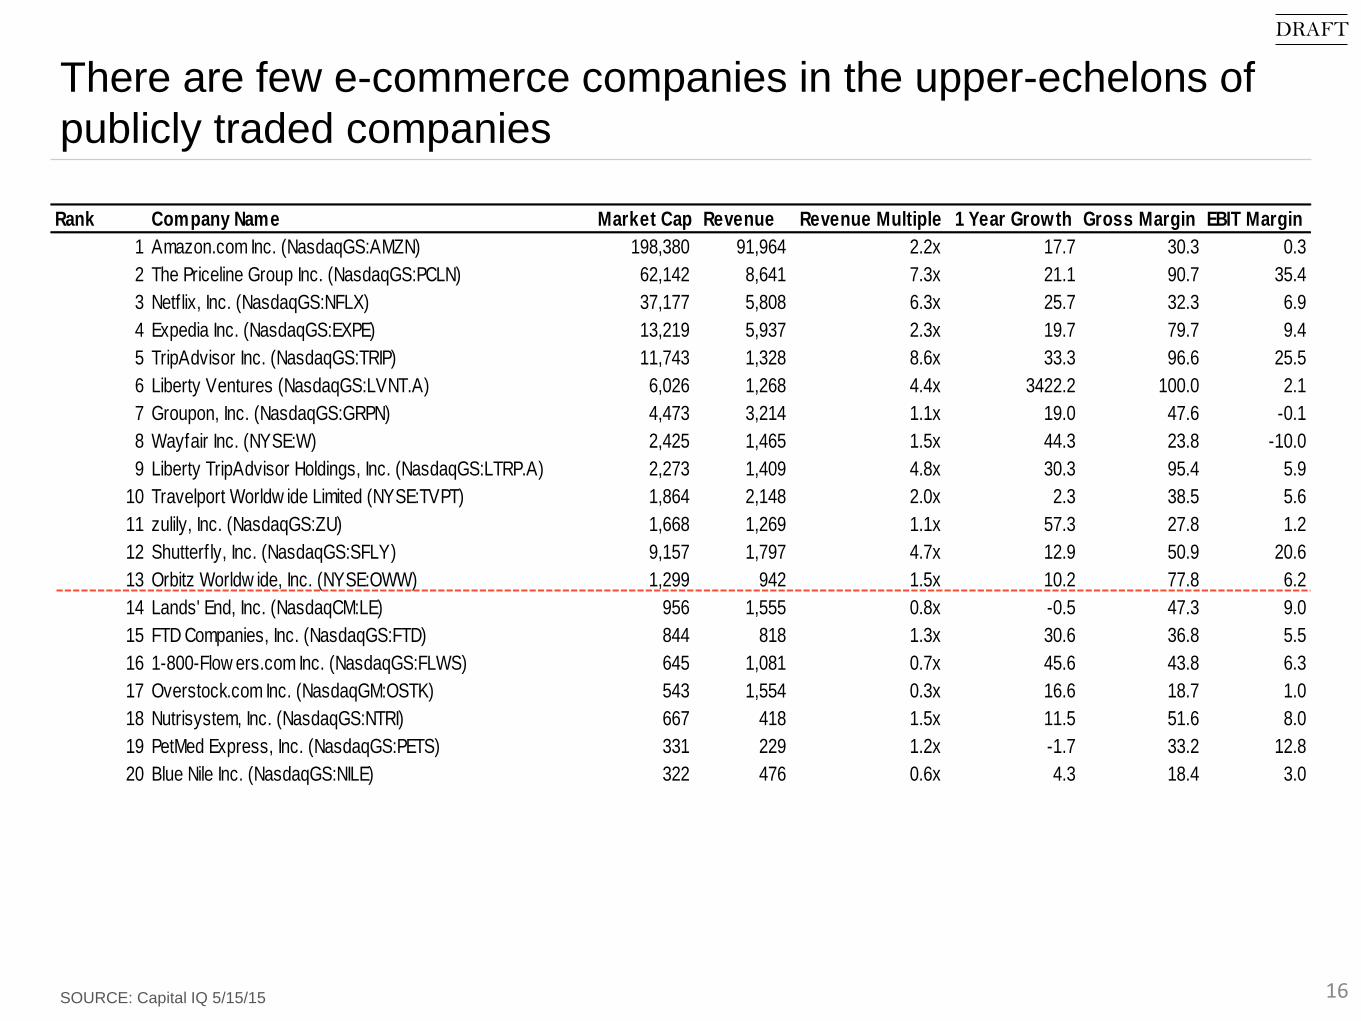
There are few e-commerce companies in the upper-echelons of
publicly traded companies
SOURCE: Capital IQ 5/15/15 16
Rank Company Name Market Cap Revenue Revenue Multiple 1 Year Growth Gross Margin EBIT Margin
1 Amazon.com Inc. (NasdaqGS:AMZN) 198,380 91,964 2.2x 17.7 30.3 0.3
2 The Priceline Group Inc. (NasdaqGS:PCLN) 62,142 8,641 7.3x 21.1 90.7 35.4
3 Netflix, Inc. (NasdaqGS:NFLX) 37,177 5,808 6.3x 25.7 32.3 6.9
4 Expedia Inc. (NasdaqGS:EXPE) 13,219 5,937 2.3x 19.7 79.7 9.4
5 TripAdvisor Inc. (NasdaqGS:TRIP) 11,743 1,328 8.6x 33.3 96.6 25.5
6 Liberty Ventures (NasdaqGS:LVNT.A) 6,026 1,268 4.4x 3422.2 100.0 2.1
7 Groupon, Inc. (NasdaqGS:GRPN) 4,473 3,214 1.1x 19.0 47.6 -0.1
8 Wayfair Inc. (NYSE:W) 2,425 1,465 1.5x 44.3 23.8 -10.0
9 Liberty TripAdvisor Holdings, Inc. (NasdaqGS:LTRP.A) 2,273 1,409 4.8x 30.3 95.4 5.9
10 Travelport Worldw ide Limited (NYSE:TVPT) 1,864 2,148 2.0x 2.3 38.5 5.6
11 zulily, Inc. (NasdaqGS:ZU) 1,668 1,269 1.1x 57.3 27.8 1.2
12 Shutterf ly, Inc. (NasdaqGS:SFLY) 9,157 1,797 4.7x 12.9 50.9 20.6
13 Orbitz Worldw ide, Inc. (NYSE:OWW) 1,299 942 1.5x 10.2 77.8 6.2
14 Lands' End, Inc. (NasdaqCM:LE) 956 1,555 0.8x -0.5 47.3 9.0
15 FTD Companies, Inc. (NasdaqGS:FTD) 844 818 1.3x 30.6 36.8 5.5
16 1-800-Flow ers.com Inc. (NasdaqGS:FLWS) 645 1,081 0.7x 45.6 43.8 6.3
17 Overstock.com Inc. (NasdaqGM:OSTK) 543 1,554 0.3x 16.6 18.7 1.0
18 Nutrisystem, Inc. (NasdaqGS:NTRI) 667 418 1.5x 11.5 51.6 8.0
19 PetMed Express, Inc. (NasdaqGS:PETS) 331 229 1.2x -1.7 33.2 12.8
20 Blue Nile Inc. (NasdaqGS:NILE) 322 476 0.6x 4.3 18.4 3.0
DRAFT

Only a handful of publicly traded e-commerce companies have
returned >5x over the last 10 years (or since IPO)
SOURCE: Capital IQ 5/15/15 17
0x
5x
10x
15x
20x
25x
30x
35x
40x
45x
50x
55x
60x
Tota
l Ret
urn
to S
hare
hold
ers
EXPE
AMZN
Year 0 Year 10
LTRP.A
W
GRPN
SFLYLVNT.A
TRIP OWWZU EBAY
NTRI
OSTK
FLWS
PETSFTD
LE NILETVPT
DRAFT
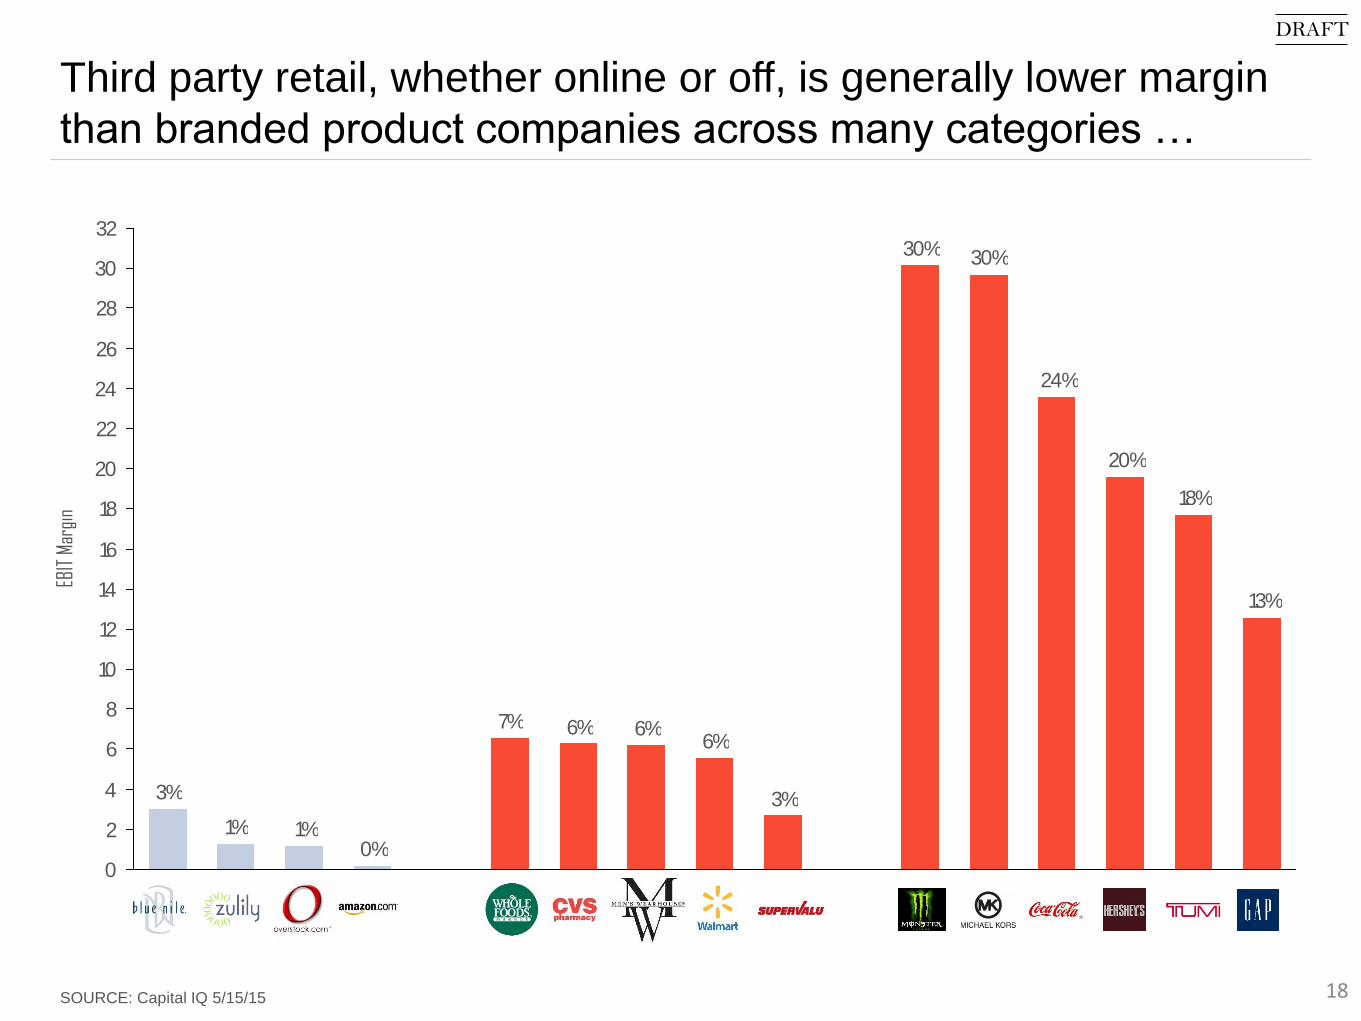
Third party retail, whether online or off, is generally lower margin
than branded product companies across many categories …
SOURCE: Capital IQ 5/15/15 18
13%
18%
20%
24%
30%30%
3%
6%6%6%7%
0%1%1%
3%
0
2
4
6
8
10
12
14
16
18
20
22
24
26
28
30
32
EBIT
Mar
gin
DRAFT
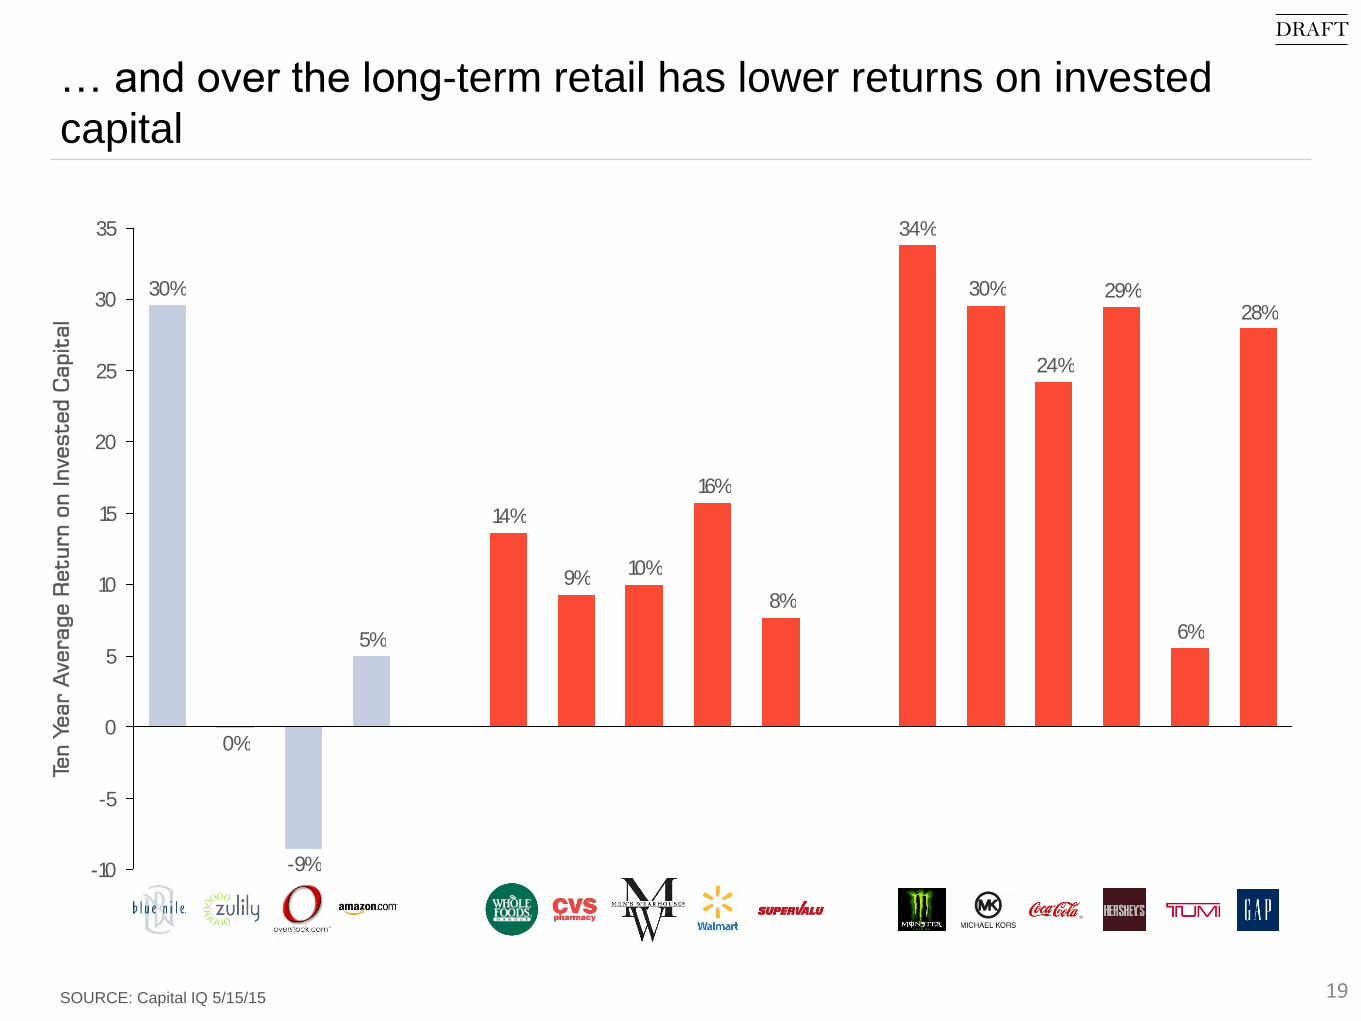
… and over the long-term retail has lower returns on invested
capital
SOURCE: Capital IQ 5/15/15 19
28%
6%
29%
24%
30%
34%
8%
16%
10%9%
14%
5%
-9%
0%
30%
-10
-5
0
5
10
15
20
25
30
35
Ten Year A
verage R
eturn on Invested C
apit
al
DRAFT

Due to lower margins, retail generally trades at lower revenue
multiples than branded products
SOURCE: Capital IQ 5/15/15 20
1.0x
2.4x
3.1x
4.4x
2.7x
0.9x
0.3x
0.6x
1.4x
0.9x 1.0x
2.2x
0.3x
1.1x
0.6x
0.0
0.5
1.0
1.5
2.0
2.5
3.0
3.5
4.0
4.5
Enterpris
e Valu
e/LTM
R
evenue
DRAFT

Two strategies for success in competitive retail spaces
SOURCE: Forbes 21
Aggregate Fragmented Supplier Base in Niche
MarketScale
• When supplier base is highly fragmented
retailer creates value by consolidating buying
process
• Fragmented supplier base means that retailer
brand value can exceed that of suppliers,
enabling greater value capture
• Scale allows retailers to compete on price and
convenience
• Price: Retailers with large buying volumes
and more brand recognition than suppliers
can negotiate best prices
• Convenience: Larger scale enables more
efficient and timely distribution
• Amazon market share in e-commerce is as
large as the next 12 players combined
DRAFT
Contents
• Introduction
• Retail aggregators vs. product makers
• Apparel and accessories
• Consumer electronics
22
DRAFT

Apparel and accessories industry has both positives and
negatives
SOURCE: Consumer investor interviews 23
What to Like What Not to Like
• Attractive gross margins and operating
profitability
• Relatively capital-light business models
• Ability to attract debt financing can raise
returns to equity investors
• Share of branded product is on a upward
trend with growing “value” of apparel and
luxury brands
• Clear model for growth through expanding
distribution outlets
• Retailer power and “broken wholesale
channel” limits brand margin
• “Faddy” trends makes product success
hard to predict and shortens product
lifecycle
• Finite exit environment (i.e., limited
strategic interest in acquisitions)
• Fashion is usually not a “winner take all”
market
• Low frequency of purchase for most
categories means revenue is not highly
recurring
DRAFT

Apparel and accessories then and now
SOURCE: Consumer investor interviews 24
Examples
Direct-to-consumer selling leads to greater value capture by brands
E-commerce drives increased reach with less time and money
Digital marketing builds stronger customer relationships, yields
better customer insight in design, and enables customization with
price premium
Barriers to entry arguably falling due to e-commerce and more
fragmented retail channel
Outsourcing costs have increased with rising wages in China and
other manufacturing hubs
DRAFT

There are 40 publicly traded apparel and accessories companies
with >$1B in market cap (1/2)
SOURCE: Capital IQ 5/15/15 25
Rank Company Name Market Cap Revenue Revenue Multiple 1 Year Growth Gross Margin EBIT Margin
1 Nike, Inc. (NYSE:NKE) 90,256 30,247 2.8x 11.7 45.8 13.6
2 V.F. Corporation (NYSE:VFC) 30,284 12,339 2.6x 6.5 48.7 14.8
3 L Brands, Inc. (NYSE:LB) 25,801 11,454 2.5x 6.3 47.0 17.1
4 Under Armour, Inc. (NYSE:UA) 16,773 3,248 5.3x 29.8 48.9 11.1
5 The Gap, Inc. (NYSE:GPS) 16,323 16,435 1.0x 1.8 38.3 12.6
6 Hanesbrands Inc. (NYSE:HBI) 12,576 5,474 2.7x 15.4 37.5 14.2
7 Michael Kors Holdings Limited (NYSE:KORS) 12,250 4,208 2.7x 40.7 61.0 29.7
8 Ralph Lauren Corporation (NYSE:RL) 11,622 7,620 1.4x 2.3 57.5 13.8
9 Tiffany & Co. (NYSE:TIF) 11,185 4,250 2.7x 5.4 59.7 21.0
10 Signet Jew elers Limited (NYSE:SIG) 10,694 5,954 2.0x 35.5 38.5 10.7
11 Coach, Inc. (NYSE:COH) 10,350 4,324 2.1x -11.6 69.7 18.9
12 Lululemon Athletica Inc. (NasdaqGS:LULU) 9,157 1,797 4.7x 12.9 50.9 20.6
13 PVH Corp. (NYSE:PVH) 8,672 8,241 1.4x 0.7 52.5 8.6
14 Skechers USA Inc. (NYSE:SKX) 5,271 2,607 1.9x 33.7 45.0 9.6
15 Urban Outfitters Inc. (NasdaqGS:URBN) 5,215 3,323 1.5x 7.7 42.5 11.0
16 Carter's, Inc. (NYSE:CRI) 5,210 2,927 1.9x 8.4 41.2 12.4
17 Columbia Sportsw ear Company (NasdaqGS:COLM) 4,048 2,155 1.7x 22.4 45.8 9.8
18 Fossil Group, Inc. (NasdaqGS:FOSL) 3,780 3,458 1.2x 3.1 56.6 15.7
19 Kate Spade & Company (NYSE:KATE) 3,509 1,170 3.2x 34.4 60.3 4.9
20 American Eagle Outfitters, Inc. (NYSE:AEO) 3,123 3,283 0.8x -0.7 43.9 6.5
DRAFT

There are 40 publicly traded apparel and accessories companies
with >$1B in market cap (2/2)
SOURCE: Capital IQ 5/15/15 26
Rank Company Name Market Cap Revenue Revenue Multiple 1 Year Growth Gross Margin EBIT Margin
21 DSW Inc. (NYSE:DSW) 3,117 2,496 1.2x 5.4 38.0 9.9
22 Wolverine World Wide Inc. (NYSE:WWW) 3,110 2,765 1.4x 3.4 39.5 9.7
23 G-III Apparel Group, Ltd. (NasdaqGS:GIII) 2,563 2,117 1.2x 23.2 35.8 7.8
24 Deckers Outdoor Corp. (NYSE:DECK) 2,498 1,588 1.4x 10.9 47.7 13.0
25 Steven Madden, Ltd. (NasdaqGS:SHOO) 2,478 1,354 1.8x 1.1 34.9 12.1
26 Chico's FAS Inc. (NYSE:CHS) 2,437 2,675 0.8x 3.4 53.3 6.1
27 The Buckle, Inc. (NYSE:BKE) 2,155 1,153 1.7x 2.2 50.1 22.3
28 Five Below , Inc. (NasdaqGS:FIVE) 1,866 680 2.7x 27.0 35.0 11.3
29 Genesco Inc. (NYSE:GCO) 1,643 2,860 0.5x 8.9 49.0 5.9
30 Guess? Inc. (NYSE:GES) 1,536 2,418 0.4x -5.9 35.9 6.2
31 Abercrombie & Fitch Co. (NYSE:ANF) 1,490 3,744 0.4x -9.1 61.8 4.9
32 Express Inc. (NYSE:EXPR) 1,447 2,165 0.6x -2.4 41.2 6.8
33 The Children's Place, Inc. (NasdaqGS:PLCE) 1,399 1,756 0.7x 0.2 35.7 5.4
34 Brow n Shoe Co. Inc. (NYSE:BWS) 1,349 2,572 0.6x 2.3 40.4 5.1
35 Tumi Holdings, Inc. (NYSE:TUMI) 1,302 529 2.4x 11.8 58.2 16.9
36 Iconix Brand Group, Inc. (NasdaqGS:ICON) 1,285 390 7.3x -3.7 100.0 48.6
37 Oxford Industries Inc. (NYSE:OXM) 1,258 998 1.4x 8.8 55.1 8.4
38 Crocs, Inc. (NasdaqGS:CROX) 1,216 1,148 1.1x -3.8 49.3 1.8
39 The Cato Corporation (NYSE:CATO) 1,079 987 0.8x 7.3 39.1 9.2
DRAFT

The shift from unbranded to branded means a continued
opportunity for new brands to gain share
SOURCE: Euromonitor 27
… yet many categories are still largely
unbranded
DRAFT
Percent of S
ale
s B
randed
Branded M
arket S
hare
The share of brands is rising …

Apparel and luxury has the fastest growing brand “value”
NOTE: Size of bubble represents $ value of brand growth
SOURCE: Millward Brown BrandZ Top 100 Most Valuable Global Brands 2014 28
Apparel brand values are increasing
at a rapid clip, due to branded
products gaining share
Apple and Google are by far the
world’s most valuable brands
DRAFT

Value capture opportunity from brands going direct-to-consumer
is significant
SOURCE: Goldman Sachs 29
Notional P&L of a retail, wholesale and e-commerce sale
Wholesale sale
Retail sale
Brand.come-commerce sale
Value to brand
Value to brand
Value to brand
Cost of goods sold
Cost of goods sold
Cost of goods sold
Operating costs of brand
Operating costs of brand
Operating costs of brand
Retail mark up
Store costs
DRAFT

Movement to e-commerce and downstream integration both lead
to more value capture by brand…
SOURCE: Goldman Sachs, L2 30
P&L is more attractive with e-commerce distribution and especially with brand-
owned digital channel……more room to move to
brand-owned channel
39
61 70
0
50
10
60
80
20
30
100
90
40
Aggregator.com
Perc
ent o
f e-c
omm
erce
sal
es
Brand.com
DRAFT

…yet in many categories, majority of sales are still through
wholesale…
SOURCE: Euromonitor 31
32
61
75
4549
95
60
6
4
5
3
62
37
24
5146
37
4
0
10
20
30
40
50
60
70
80
90
100
Perc
ent
of
Sale
s
Eyewear Sporting GoodsFootwear
1
Bags & LuggageWatches
1
2
JewelleryClothing
Brand.com WholesaleOwned Retail
DRAFT

… and the rise of e-commerce is mostly eating into wholesale
distribution
SOURCE: Euromonitor 32
Retail E-commerce Wholesale
E-commerce is growing
at the expense of
wholesale, while owned
retail continues to
grow
Perc
ent o
f Sal
esDRAFT

E-commerce also lowers working capital (i.e., inventory)
requirements, leading to greater capital efficiency
SOURCE: Goldman Sachs, Company Data (Samsonite, Nike, Kors, Prada, Tiffany, Coach, ASOS, YOOX) 33
Net Working Capital Days
DRAFT

… while transaction-less stores allow the benefits of owned-retail
with e-commerce inventory characteristics
SOURCE: Pando Daily, Inc.com 34
• Consumers often want to physically touch
and try on apparel items before purchase,
necessitating brands to go beyond e-
commerce
• Use of retail location as “show-room” with
transaction still via brand.com enables:
• Minimal square footage
• E-commerce inventory profile
• Closer interaction with customer
Bonobos sales per square
foot is “the highest we know
about in men’s clothing…it’s
in the four figures” – Andy
Dunn
Warby Parker Showroom in
NYC grossed $2.5 million with
600 square feet $4,200 sales
per sq. foot, on par with Tiffany
Bonobos Guide Shop
Warby Parker Showroom
DRAFT
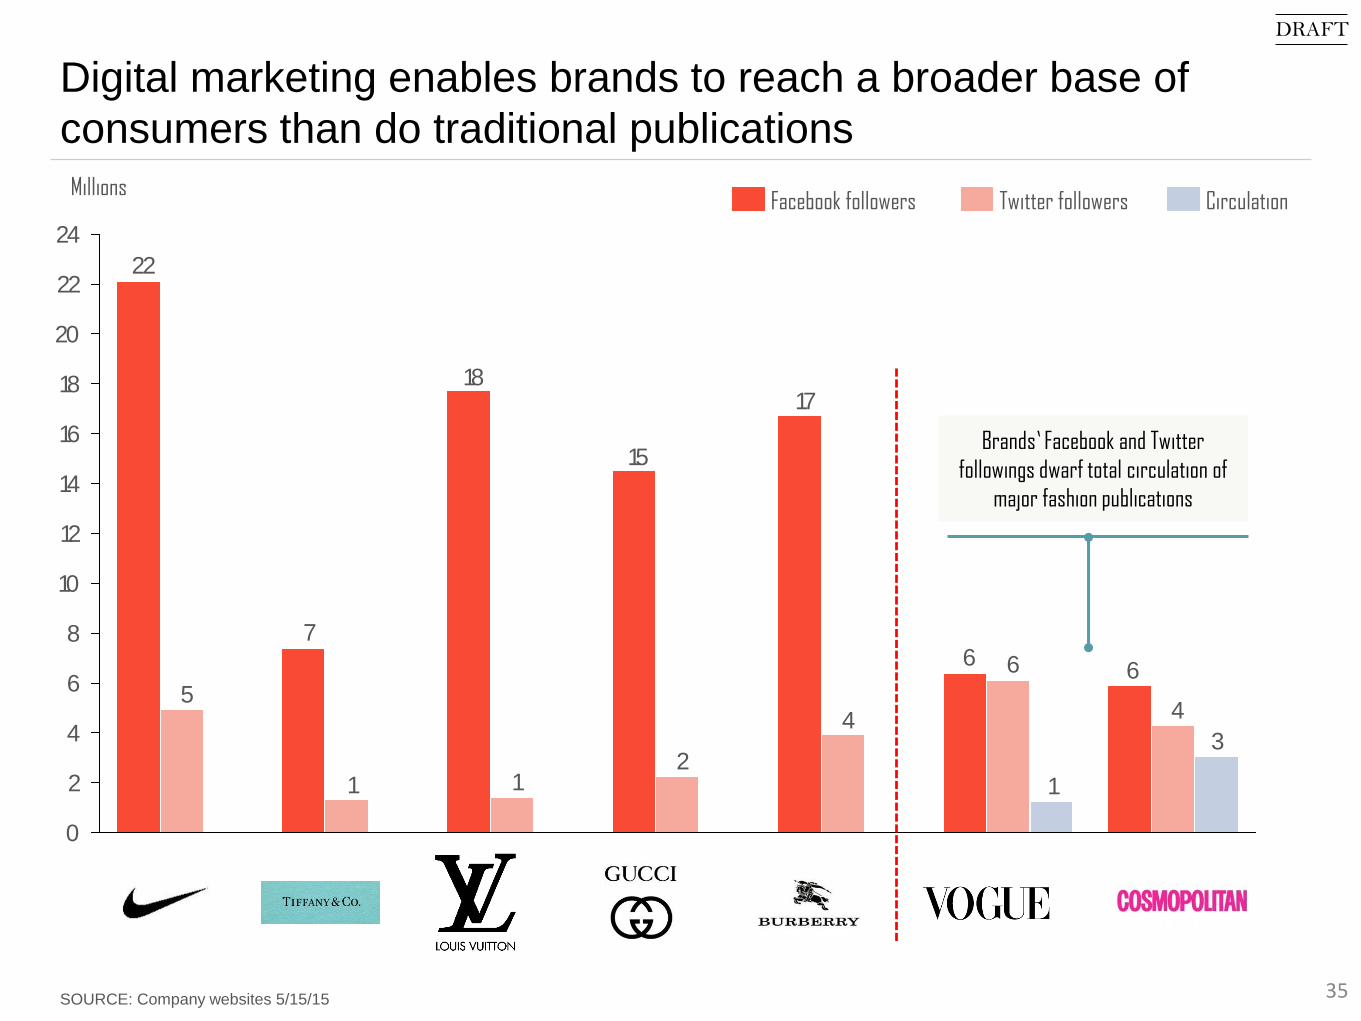
Digital marketing enables brands to reach a broader base of
consumers than do traditional publications
SOURCE: Company websites 5/15/15 35
66
17
15
18
7
22
4
6
4
211
5
3
1
0
2
4
6
8
10
12
14
16
18
20
22
24
MillionsFacebook followers Twitter followers Circulation
Brands’ Facebook and Twitter
followings dwarf total circulation of
major fashion publications
DRAFT

Rising manufacturing wages is increasing the cost of outsourced
garment production
SOURCE: American Progress, WTO 36
55
80
100
90
70
60
50
0
10
20
40
30
Shar
e of
Glo
bal C
loth
ing
Expo
rts
(201
2)
38
4
48
Bangladesh
Germany
All others
China
Italy
DRAFT

Apparel investors identify several criteria of successful early-
stage companies
SOURCE: Consumer investor interviews 37
Independent
Distribution
• Distribution not solely dependent on wholesale model and especially not on department store
• Owned retail is better than wholesale, but has significant upfront costs
Earned Media• Ability to get free PR is essential to growing brand awareness at reasonable cost
Demographic• Product should speak to a clear target demographic
• Demographic should be attractive in terms of underlying size, growth, and purchasing power
Brand• Company should have clear brand image associated with certain values
Merchandising• Trend/fads change quickly in fashion. A success 1 season does not translate into a viable
brand
• Mgmt. team should have demonstrated ability to “merchandise,” an ability to anticipate fashion trends
DRAFT

Case study: Crocs demonstrates “fad” based nature of
apparel and impact of higher margins from owned retail
SOURCE: Google Finance May 2015 38
Tops sales estimates and
operating margin hits 30%
“investors have wondered whether
Crocs can maintain its momentum, or
if the brand is a fad ready to fizzle” -
Forbes
“Strong expectations for sales during the
holiday season (mirrored by other shoe
brands including Nike)” - Reuters
Earnings miss on lower sales growth and
lower margin (caused by mixed shift
away from owned retail to third party)
DRAFT

Case study: Lululemon’s rise and fall demonstrates vulnerability to
competition and maintaining image, even with strong brand loyalty
SOURCE: Google Finance May 2015 39
Lululemon expects profit
and sales in the current
quarter to top earlier
forecasts after holiday
shoppers flocked to its
shops
Company recalls 17% of
Yoga pants due to see-
through issue
“Lululemon Stock Squeezed
15% On CEO's Decision To
Step Down” - Forbes
Same store sales decline
for first time since 2009,
driven by new yoga
segment competition and
quality image issues
“Stock rises on Strong
Guidance: Turnaround
Gaining Momentum” –
Fool.com
DRAFT

Contents
• Introduction
• Retail aggregators vs. product makers
• Apparel and accessories
• Consumer electronics
40
DRAFT

Consumer electronics industry has both positives and negatives
SOURCE: Consumer investor interviews 41
What to Like What Not to Like
• Potential to exhibit exponential growth
• High switching costs
• Retailer power and “broken wholesale channel” limits producer
margin
• Low frequency of purchase for most categories means revenue is
not highly recurring
• Low barriers leads to competition that drives down
prices/margins quickly and/or requires large investment in
innovation
• Longer time and more money required (vs. software) to get
product to market, due to both product development and
distribution challenges
DRAFT
Consumer electronics then and now
SOURCE: Consumer investor interviews 42
Examples
Faster consumer adoption of technology supports extremely rapid
sales growth
E-commerce drives increased reach with less time and money
Digital marketing builds stronger customer relationships, yields
better customer insight in design, and enables customization with
price premium
Lower cost of prototyping is increasing startup capital efficiency
Kickstarter represents financing competition, but also helps
startups get early market feedback
Proliferation of smartphones has decreased the importance of
additional hardware vs. software applications
DRAFT
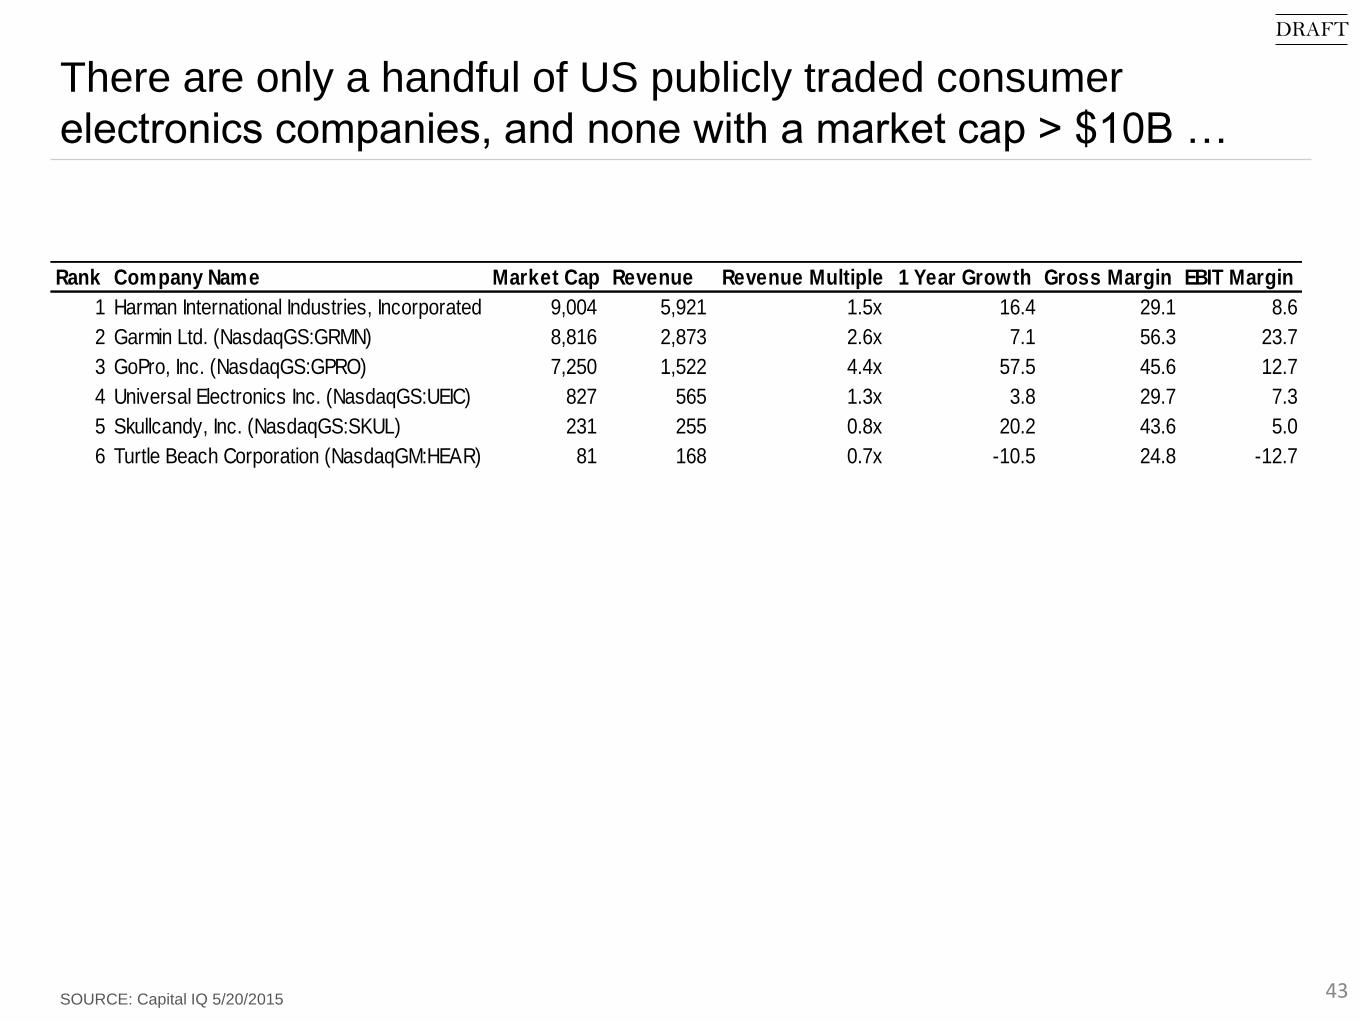
There are only a handful of US publicly traded consumer
electronics companies, and none with a market cap > $10B …
SOURCE: Capital IQ 5/20/2015 43
Rank Company Name Market Cap Revenue Revenue Multiple 1 Year Growth Gross Margin EBIT Margin
1 Harman International Industries, Incorporated (NYSE:HAR)9,004 5,921 1.5x 16.4 29.1 8.6
2 Garmin Ltd. (NasdaqGS:GRMN) 8,816 2,873 2.6x 7.1 56.3 23.7
3 GoPro, Inc. (NasdaqGS:GPRO) 7,250 1,522 4.4x 57.5 45.6 12.7
4 Universal Electronics Inc. (NasdaqGS:UEIC) 827 565 1.3x 3.8 29.7 7.3
5 Skullcandy, Inc. (NasdaqGS:SKUL) 231 255 0.8x 20.2 43.6 5.0
6 Turtle Beach Corporation (NasdaqGM:HEAR) 81 168 0.7x -10.5 24.8 -12.7
DRAFT

Yet, venture investment in consumer electronics and hardware
has been increasing …
SOURCE: VentureWire 44
DRAFT

Speed of consumer adoption of hardware products has increased
tremendously
SOURCE: The Atlantic 45
DRAFT

3D printing is one of the innovations lowering the cost of
prototypes
SOURCE: Gartner 46
0
50,000
1,00,000
1,50,000
2014A2012A 2013A 2015P
Un
its
So
ld
Number of 3D Printers Sold for <$100K
DRAFT

The falling prices of television sets demonstrates the
competitiveness of consumer electronics industries
SOURCE: BusinessInsider 47
DRAFT

Many hardware categories have been disrupted by software
applications utilizing the smartphone as a hardware platform
48
Smartphones empowered with mapping applications (i.e., Google Maps) eliminated the need for separate navigation consoles like Garmin
The proliferation of high-power cameras installed in iPhones and other smartphones resulted in the death of Flip Video
While Kindle continues to be a successful publishing and software business, the original e-reader business has lost traction due to smartphones and tablets
Calculators pre-installed in all smartphones has reduced the purchases of mid-range calculators
DRAFT

Garmin rise and fall demonstrates disruption by software
applications utilizing the smartphone as a hardware platform (1/2)
SOURCE: Google Finance May 2015 49
June 29, 2007:
Introduction of
iPhone
DRAFT

Garmin rise and fall demonstrates disruption by software
applications utilizing the smartphone as a hardware platform (2/2)
SOURCE: CapitalIQ 5/15/201550
2,871
2,6322,7162,759
2,690
2,946
3,494
3,180
1,774
1,028
763
573465
369346233
24%
22%22%
27%29%
31%33%
40%38%
36%37%
36%
0
500
1,000
1,500
2,000
2,500
3,000
3,500
0%
5%
10%
15%
20%
25%
30%
35%
40%
EBIT M
arginA
nn
ual
Sal
es
($ M
)
2012 2013 20142010
24%
2011
20%
25%
20092007 20082002 2005 20062004
36%
200320011999 2000
Sales
EBIT Margin
June 29, 2007: Introduction of
iPhone
DRAFT
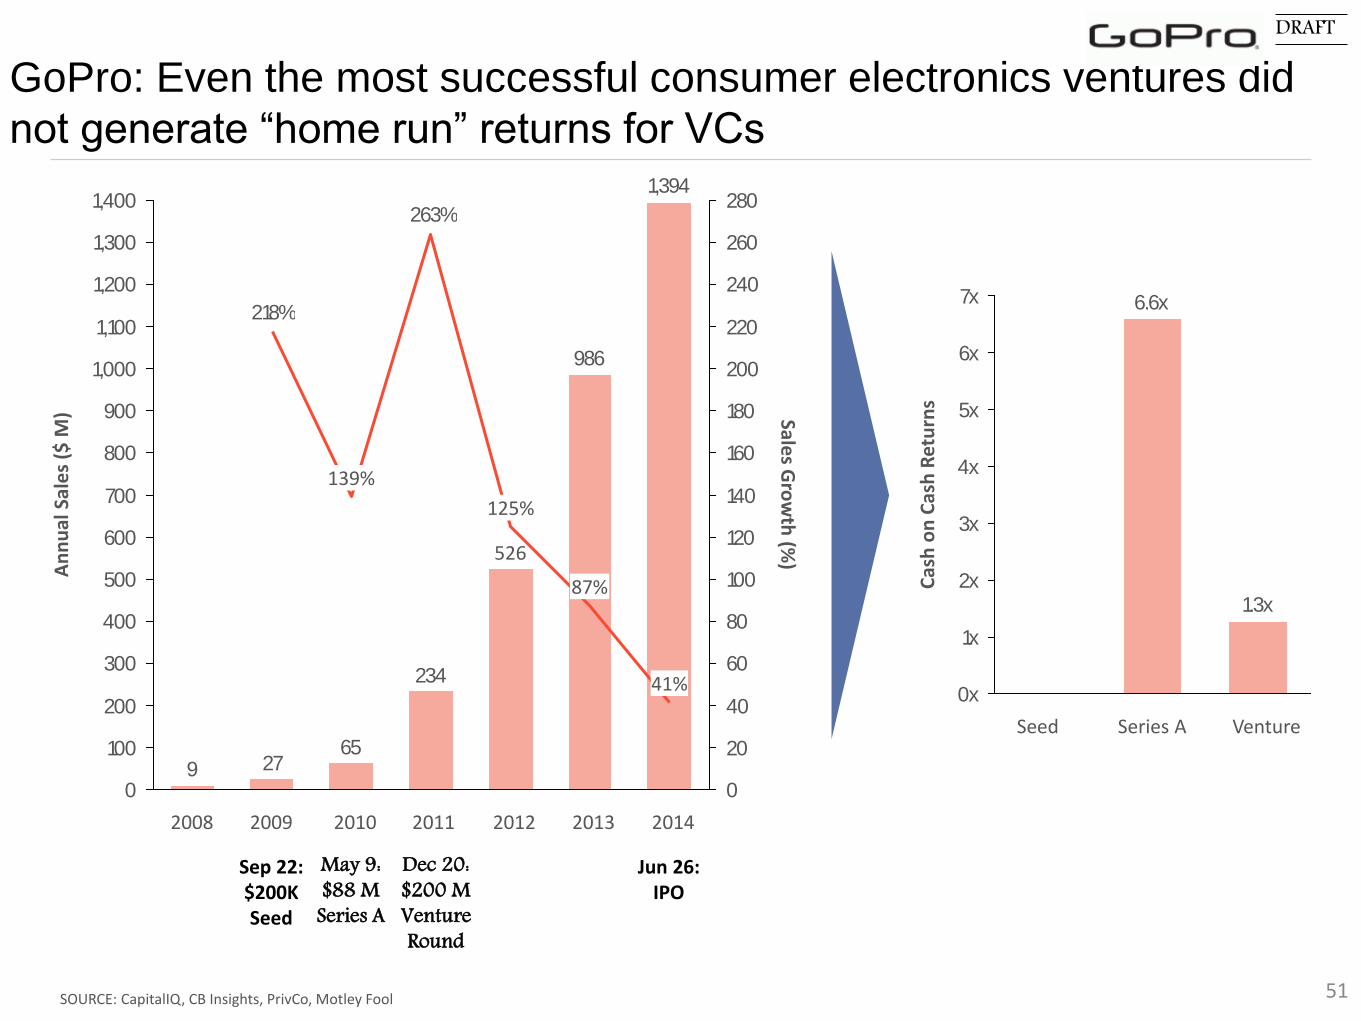
GoPro: Even the most successful consumer electronics ventures did
not generate “home run” returns for VCs
SOURCE: CapitalIQ, CB Insights, PrivCo, Motley Fool 51
1,394
986
234
65279
263%
218%
0
100
200
300
400
500
600
700
800
900
1,000
1,100
1,200
1,300
1,400
0
20
40
60
80
100
120
140
160
180
200
220
240
260
280
Sales G
row
th (%
)
An
nu
al S
ale
s ($
M)
20092008
41%
125%
201320112010 2014
87%
2012
526
139%
1.3x
6.6x
0x
1x
2x
3x
4x
5x
6x
7x
VentureSeries ASeed
Cas
h o
n C
ash
Ret
urn
s
May 9: $88 M
Series A
Sep 22: $200K Seed
Dec 20:$200 M Venture Round
DRAFT
Jun 26: IPO

Fitbit success demonstrates that consumer electronics
can exhibit exponential growth trajectories
SOURCE: Forbes 52
DRAFT
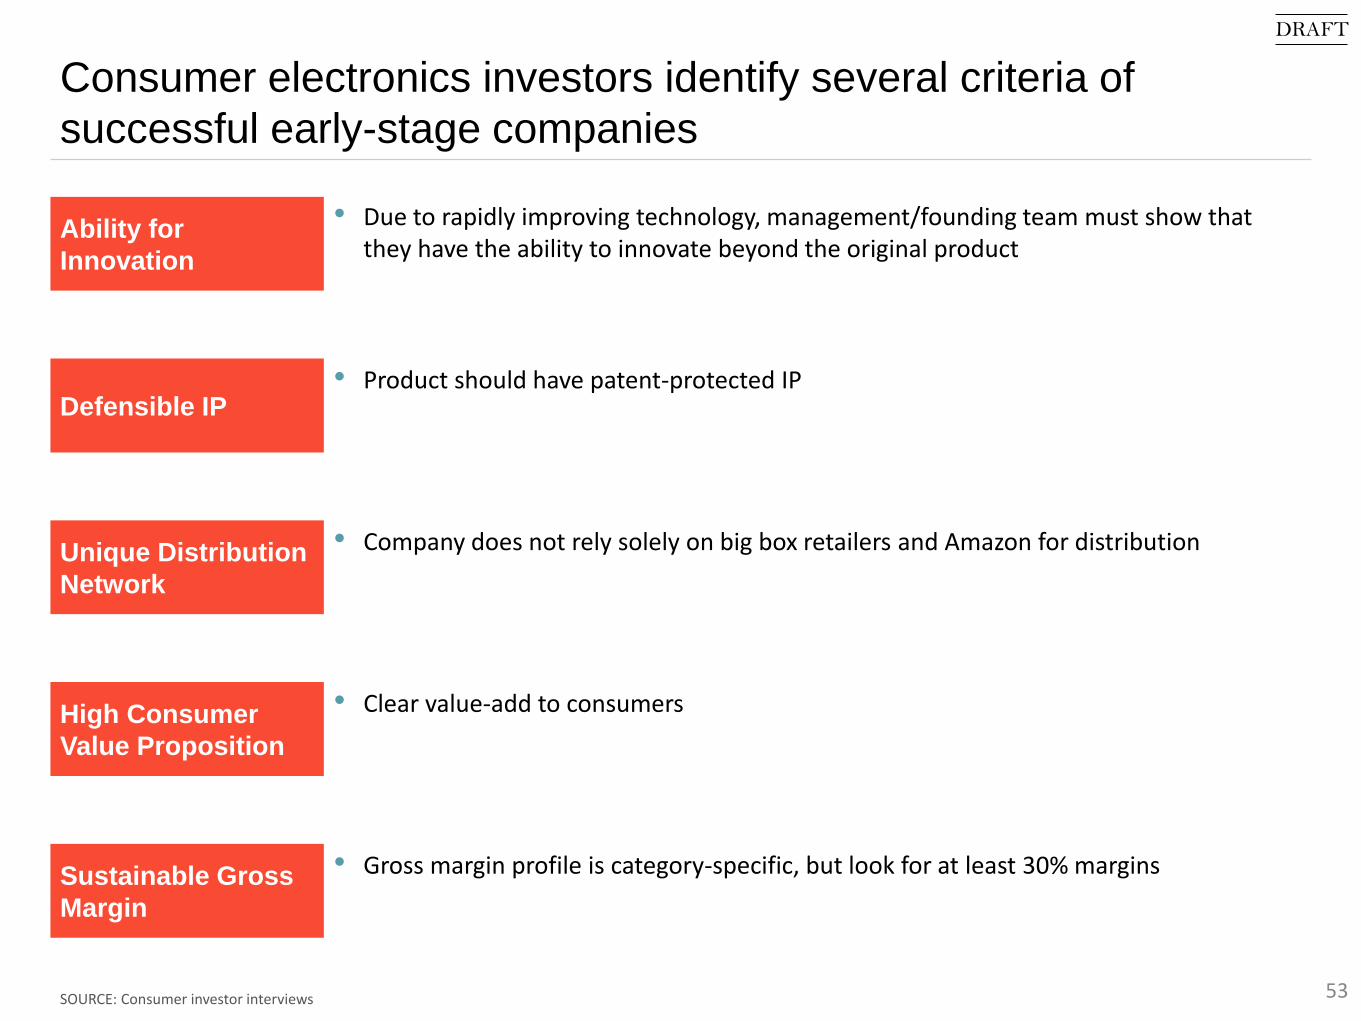
Consumer electronics investors identify several criteria of
successful early-stage companies
SOURCE: Consumer investor interviews 53
Ability for
Innovation
• Due to rapidly improving technology, management/founding team must show that they have the ability to innovate beyond the original product
Defensible IP• Product should have patent-protected IP
Unique Distribution
Network
• Company does not rely solely on big box retailers and Amazon for distribution
High Consumer
Value Proposition
• Clear value-add to consumers
Sustainable Gross
Margin
• Gross margin profile is category-specific, but look for at least 30% margins
DRAFT
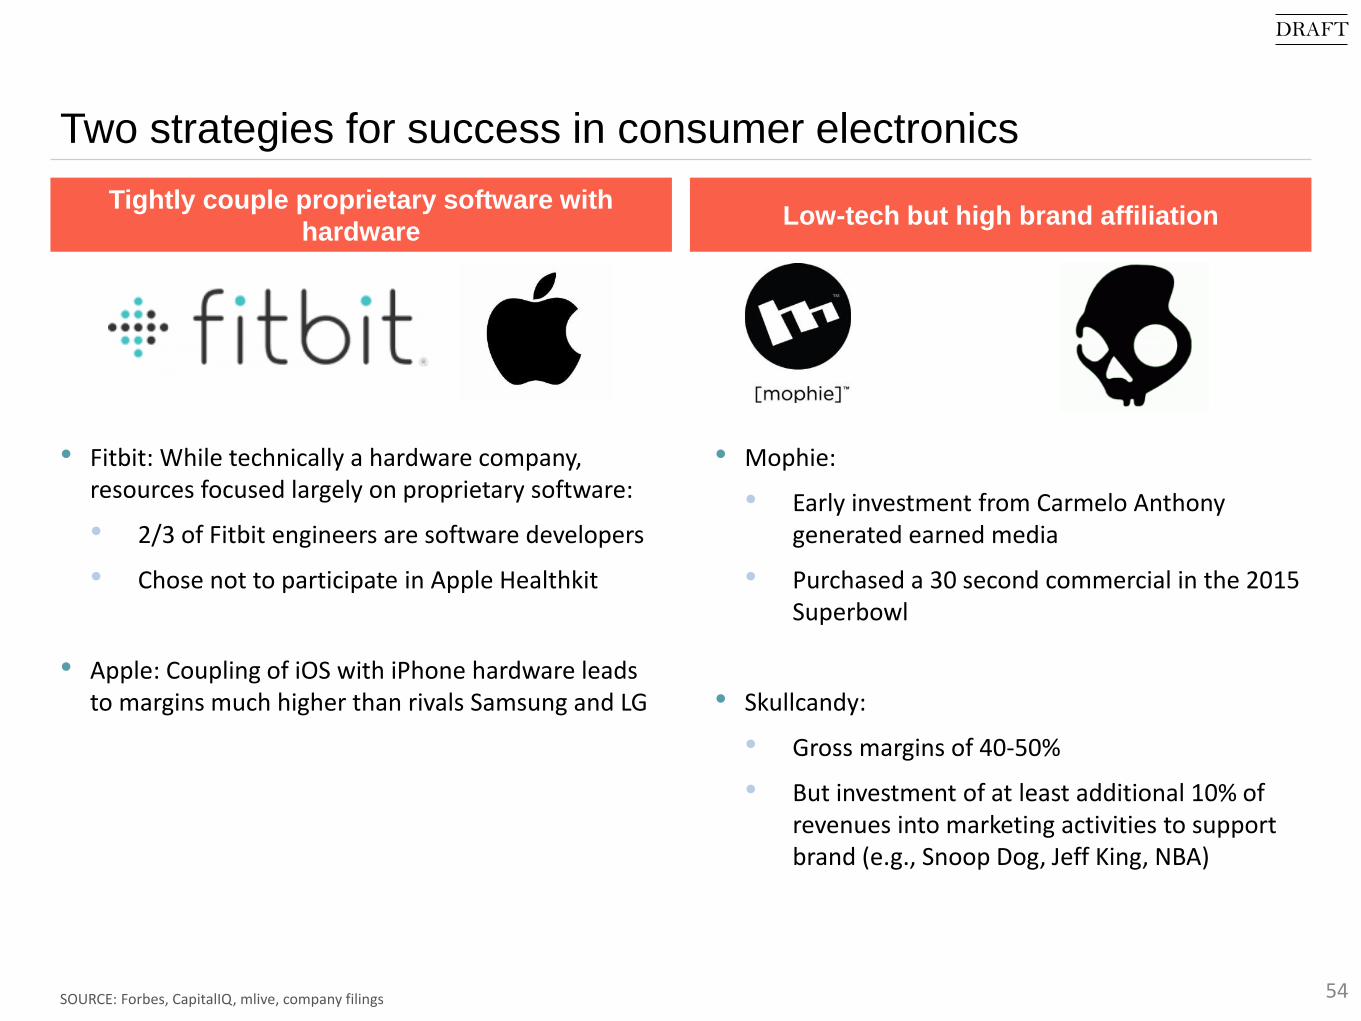
Two strategies for success in consumer electronics
SOURCE: Forbes, CapitalIQ, mlive, company filings 54
Tightly couple proprietary software with
hardwareLow-tech but high brand affiliation
• Fitbit: While technically a hardware company, resources focused largely on proprietary software:
• 2/3 of Fitbit engineers are software developers
• Chose not to participate in Apple Healthkit
• Apple: Coupling of iOS with iPhone hardware leads to margins much higher than rivals Samsung and LG
• Mophie:
• Early investment from Carmelo Anthony generated earned media
• Purchased a 30 second commercial in the 2015 Superbowl
• Skullcandy:
• Gross margins of 40-50%
• But investment of at least additional 10% of revenues into marketing activities to support brand (e.g., Snoop Dog, Jeff King, NBA)
DRAFT