research report number 202-3f. no restrictions. this document ... the effectiveness of vehicle...
TRANSCRIPT

Technical Reports ~nter TFlxas Tra!1s~nrtat!o'11nstltut.e
1. Repott Na, 2. Govetnment Accessio~ No.
TTI-2-18-75-202-JF 4. Title and Subtitle
William R. McCasland 9. P erfotming Organization Nome and Addre u
Texas Transportation Institute Texas A&M University College Station, Texas 77843
TECHNICAL. REPORT STANDARD TITLE PACf
3. Recipient'& Catalog No.
10. Work Unit No.
II. Contract ot Gtont No.
Study No. 2-18-75-202 13. Type of Report and Period Covered
~~--------------------------------------------~ 12. Spon&oring Agency Name and Address
Texas State Department of Highways and Public Transportation; Transportation Planning Division
P. 0. Box 5051 Austin ·Texas -7P.Tt:?r-.---:-·1:1. Suppl~entary l'(ates
Research done in cooperation with DOT, FHWA.
Final - September, 1974 Mav. 1976
14. Spon&oring Agency Code
Research Study Title: "Design and Evaluation of Freeway Surveillance and Traffic 16. Abstract
rnntrol Systems"
Studies of urban .traffic operations were conducted on the freeways of Texas to determine the design and effectiveness of traffic control and surveillance systems; to relieve peak period congestion; to lessen the impact of disabled vehicles on the operation and safety of the freeways; and reduce the incidents of overhead structure damage by overheight vehicles. The research study uses demonstration installations to test the implementatton requirements as well as to evaluate the operational theory.
17. Key Wards 18. Distribution Statement
l
I I I
On-freeway control, lane use control, surveillance and control, overheight detection, cost-benefit analysis, incident detection.
No Restrictions. This document is avail- i able to the public through the National I Technical Information Service, Springfield, Virginia 22161.
21· No. of Pages 22. Price 19. Security Clauil. (of this report) 20. Security Classif. (of this page) i
L_ ____ u_n_c_la_s_s_i_f_ie __ d ________ ~~--u __ n_c_l_a_ss_i_f_i_ed __________ ~ ___ 7_o ____ ~ ________ __j Form DOT F 1700.7 18·691
FINAL REPORT
DESIGN AND EVALUATION OF FREEWAY
SURVEILLANCE AND TRAFFIC CONTROL SYSTEMS
by
William R. McCasland Research Engineer
Research Report Number 202-3F
Design and Evaluation of Freeway Surveillance and Traffic Control Systems
Research Study Number 2-18-75-202
Sponsored by The State Department of Highways and Public Transportation
In Cooperation with the U. S. Department of Transportation
Federal Highway Administration
TEXAS TRANSPORTATION INSTITUTE Texas A&M University
College Station, Texas
May, 1976
ABSTRACT
Studies of urban traffic operations were conducted on the freeways
of Texas to determine the design and effectiveness of traffic control
and surveillance systems; to relieve peak period congestion; to lessen
the impact of disabled vehicles on the operation and safety of the free
ways; and reduce the incidents of overhead structure damage by over
height vehicles. The research study uses demonstration installations
to test the imple~entation requirements as well as to evaluate the
operational theory.:~~"~-
DISCLAIMER
The contents of this report reflect the views of the author who is
responsible for the facts and the accuracy of the data presented herein.
The contents do not necessarily reflect the official views or policies
of the Federal Highway Administration. This report does not consitute
a standard, specification, or regulation.
Key Words: On-freeway control, lane use control, surveillance and
control, overheight detection, cost-benefit analysis, incident detection.
ii
SUMMARY
This study is the continuation of research in the development and
evaluation of traffic surveillance and control on urban freeways. Two
designs of on-freeway control were considered: lane use control in an
interchange and total freeway control approaching a congested section of
freeway.
The total freeway control study.has progressed through the preliminary
designs and has been approved for demonstration and evaluation when funds
are avail a b 1 e .
The lane us~~~gntrol study has been concluded and the results indicate
that the control was effective in closing a lane approaching a merge area,
that the control was cost effective in the reduction of total delay in
the intersection and that extensive traffic enforcement is essential for
this type of control. The study was conducted on I.H. 10 (Katy Freeway)
at I.H. 610 in Houston.
Three projects involving the design and evaluation of traffic surveil
lance systems were included in this study: detect~on of overheight vehicles,
design of CCTV systems for incident identification and incident management,
and evaluation of detectors for applications in traffic surveillance and
control.
The study of the detection and warning of overheight trucks was conducted
on an experimental installation on I.H. 45 (North Freeway) in Houston. The
results indicated that the photoelectric detection system was effective in
detecting loads that could damage a low clearance structure. There was incon
clusive proof that the activations of the warning caused trucks of legal or
illegal heights to divert from the freeway, but studies did indicate that
iii

the warning system did not have a detrimental effect on the safety or
operation of the total traffic flow.
The study of the design and application of closed circuit television
systems in urban traffic management continues. Camera locations were
examined with respect to area coverage and resolution problems. Low
light level cameras were demonstrated for applications in 24-hour surveil
lance and produced excellent quality pictures for traffic surveillance
under average nighttime conditions. Research efforts will be continued to
test the equipment under extreme light and environmental conditions.
The effectiveness of vehicle detectors for an automatic incident
detection system i~being evaluated on the old Gulf Freeway surveillance
system and on a new installation on I.H. 610 North Loop in Houston.
Redundant equipment designs and computer software logic will be used to
compensate for the errors in detection due to equipment malfunctions,
vehicle placement, and vehicle detection characteristics. This effort
will be continued in fiscal year 1976.
The basic evaluation of the effectiveness of transportation facilities
is the benefit-cost ratio analysis. A review of literature indicated that
only a limited amount of data was available that considered current con
ditions. This study developed costs to update that basic data and the
benefit-cost analysis procedures. An analysis was made of the effects
of energy shortages and temporary mandatory controls that affect the supply,
demand, and price resources. Data on air and noise pollution and other
highway impact data were assembled and an analytical procedure was recom
mended for use in determining the economic feasibility of a project and in
determining which project best accomplishes a particular goal or set of
goals.
iv

Technical assistance to the State was provided throu.gh the study for
those activities that closely related to the implementation of results of
the research~ Two such activities were concluded in this study: the
surveillance design for the elevated section of I.H. 35 in Austin and the
operational analysis of a high accident location on U.S. 59 in Houston.
It is the interchange of knowledge and experience between the operations
and the research programs of the State Department of Highways and Public
Transportatiqn that determines the s~ccess of both.
_IIJlpl ementation_
All of the systems described in this study are operating now or
planned to be~o~perational in the near future. There is no indication as a
result of this research that any of these systems should be discontinued.
Implementation of similar systems will require detailed justification
studies as did each of these demonstrations.
Recommendations for Further Research
1. Those systems not completed in this study should be continued.
These include on-freeway control - total freeway control, low
volume incident detection, low light level CCTV demonstration
studies.
2. Every effort should be made to investigate the applications of
these systems to priority treatment operations for transit and
high occupancy vehicles.
v
TABLE OF CONTENTS
INTRODUCTION . . . .
Background
Statement of the Problem
Goals and Objectives of the Study .
RESULTS OF THE STUDY .....
Status of Objectives
Discussion of Accomplishments .
On-Freeway Control - Total Roadway •
On~Freeway Control - One Lane
High Load Detection System ..
Design of Urban Wide CCTV System for Traffic
Survei 11 ance . . .
Effectiveness of Detectors for Application in
Traffic Surveillance, Driver Communications,
and Control Systems
Updating Cost-Benefit Analysis Procedures
Surveillance Design for Elevated Freeway in
Austin . .
Operational Analysis of High Accident Location
on U.S. 59 in Houston
DOCUMENTATION OF RESULTS
CLOSURE .
REFERENCES
vi
Page
1
2
3
4
4
6
-6
13
33
40
52
53
56
57
60
61
62

LIST OF ILLUSTRATIONS
Page
Figure No.
l. On-Freeway Traffic Control Signals ....... . 11
2. Advanced Warning Signs and Flashers for pn-Freeway Traffic Control Signals . . . . . . . . . . . . . . . 12
3.
4.
5.
Study Site for Lane Control on I.H. 10 Westbound at I.H. 610 North Loop ............ .
Overhead Lane Use Signals.- Lane Closure Warning with Yellow •x• .•...............
Overhead Lane Use Signals - Lane Closure Control with Yellow and Red •x•s ............ .
6; Volume·-comparison - Outside lane Uith and Without Lane--Us'iTControl ..•.•••.•..
7. Average Daily Signal Compliance Rates
8. Range of Signal Compliance Rates •...
9. Five-Minute Flow Rates at I.H. 10 Westbound at ~lirt Road .................. .
10. Five-Minute Average Speeds at I.H. 10 Westbound
. . . . . .
15
16
17
19
22
23
27
at Wirt Road . . • . . . . . . . . • . . . . . . 28
11. Typi ca 1 Capacity-Demand Curves for I. H. 10 \IJestbound with a Moderate Restrictive Lane Use Control Strategy 29
12. Typical Capacity-Demand Curves for I.H. 10 Westbound with a Very Restrictive Lane Use Control Strategy 30
13. Capacity, Demand, Delay Relationships in the I.H. 10-I.H. 610 Interchange . . . . . . . . . . • . . . . 32
14. Light Source for Photo Electric Detection for High load Detection . . . . • . • . . . 37
15. Advance Warning Signs and Flashers •.•
16. Signs and Signals at the Low Clearance Structure .
17. Low light Level CCTV Camera, Pan and Tilt, and Control Unit .•.•..•...••..•...
vii
. . . . . .
38
39
45

LIST OF TABLES
Page
Table No.
1. ACCIDENT DATA COMPARISON FROM WASHINGTON TO CAMPBELL INTERCHANGES ON I.H. 10 FREEWAY ........... 25
2. BENEFIT-COST ANALYSIS FOR THE ON-FREEWAY LANE USE CONTROL SYSTEM ON I.H. 10 ....
3. LIST OF SUPPLIERS OF LOW LIGHT LEVEL (LLL) CCTV EQUIPMENT . . . . . . . . . . . . . .
viii
. . . . . . . . . • 34
. . . . . . . • 44

INTRODUCTION ·.
Background
The Texas State Department of Highways and Public Transportation
(SDHPT) has supported research on traffic operations on urban freeways
since 1955. The continuity of the research program has enabled the
SDHPT to apply the results of the past to the development and conduct
of the new studies. It has also enabled the researchers to extend and
continue studies beyond work plan schedules when delays in the pro
curement and the installation of equipment were encountered. Such is
the case with the major efforts__~~~~-~_!:_Q"~-?,--=research study: the study of on
freeway control systems was begun in 1973 and will be completed in 1976
while the study of low volume incident detection which includes the ob
jectives on closed circuit television systems and detector accuracy,
was proposed in 1972 and will be completed in 1976.
These statements on delays to the research program emphasize the
problems and realities of conducting research under field conditions and
the need for the patient support which has been provided by the SDHPT
during these two decades.
The justification for this support of research in surveillance and
control is becoming more evident as the SDHPT directs its attention to
energy and resource conservation, to public transportation development,
and to optimization of existing transportation facilities. The basic
goal in the development of surveillance and control systems has been the
effective management of traffic, which must also be the prerequisite for
many 6f the transit and car pooling incentive programs now being proposed.
1
Statement of the Problem
Urban freeways carry almost 40 percent of the vehicle miles of travel
in the urban areas. The freeway network is only two percent of the total
street network. Twenty to twenty-five percent of freeway travel occurs
during the two peak periods, which constitute 10 to 15 percent of the
total 24 hours. These statistics :may vary from day-to-day, city-to-city,
state-to-state, but the importance of the freeway system to urban trans
portation is constantly increasing. The current trends in the development
and installation of bus priority systems on urban freeways to increase the
people-carrying capacity of these roadways emphasizes the necessity for
maintaining_drLacceptable level of service.
The d~finition of an acceptable level of service has not been
established, because it must reflect local conditions and local trans
portation goals and objectives. However, traffic congestion and_ stop-and
go operations that prevail on most freeways during peak periods, maintenance
operations, or incident occurrences are not acceptable to any motorist or
transportation agency.
Many freeways are instrumented with ramp metering systems that have
improved traffic operations, but many ramp systems cannot exert sufficient
control to eliminate congestion brought on by increasing traffic demands.
On-freeway control systems are proposed in this study to supplement ramp
metering and to provide a sufficient amount of control of traffic demand.
Disabled vehicles and accidents cause more disruptions to traffic
operations than any other factor. Many freeways have some form of surveil
lance system to locate and identify disabled vehicles. Visual surveillance
with closed circuit television and electronic detection with detector-
computer monitoring systems are being investigated in this study for
2
application to this serious problem.
Transportation agencies must consider any system, procedure, or
operation that improves the efficiency of the existing streets and
freeways, and must weigh the costs and benefits of the various alter
natives. Inflation, energy shortages, and governmental controls have
·affected transportation supply and demand relationships. The cost
analysis evaluation procedures for transportation alternatives have
been reviewed and revised in this study.
Goals and Objectives of the Study
The goals of the research program are to develop, test, and evaluate
traffic surveillance, control, and communications systems that reduce the
frequency and severity of recurrent and non-recurrent congestion on urban
freeways.
The specific objectives of this research study are:
1. To evaluate an on-freeway control system that meters traffic
flow on the main lanes of the freeway when traffic densities
downstream exceed critical levels.
2. To evaluate an on-freeway control system that restricts the
use of one freeway lane upstream of the merge area of another
freeway lane.
3. To evaluate a detection and warning system to divert trucks
with overheight loads from freeways with height restrictions.
4. To develop a design for an urban-wide closed circuit television
system with a cost effectiveness evaluation for use in incident
identification and incident management.
5. To evaluate the effectiveness of detectors for applications in.
traffic surveillance, driver communications, and control systems.
3

6. To determine a cost-benefit analysis that reassesses the prior
ities of time, vehicle operating costs, and air pollution
values to compensate for energy shortages, the Environmental
Protection Agency's transportation regulations and other
nondescript economic factors.
7. To provide technical assistance to the SDHPT for development
of goals and objectives for implementation of research results.
RESULTS OF THE STUDY
Status of the Objectives
A review of the status of the seven objectives is presented below.
The results of the study related to each of the objectives are discussed
in the following sections of the report.
Objective Z - On-freeway control to meter freeway traffic flow.
This objective has been partially satisfied. The design, ope
rational procedures, and measures of effectiveness have been
developed and identified. The installation and evaluation of a
test facility have been delayed until approval from the Federal
Highway Administration for an experimental project is secured.
Objective 2 - On-freeway control of one Zane upstream of a
merge area. The signal system to control one of the three westbound
lanes of I.H. 10 Freeway at the interchange of I.H. 610 Freeway in
Houston became operational on November 20, 1974. Preliminary results
of the control study are discussed in this report. A final research
report on the study will be written after data from one year of
operation have been collected and evaluated.
4

Objective 3 - High load detection system. The study of the high
load detection and warning system of I.H. 45 North Freeway at the
interchange of I.H. 10 Freeway in Houston has been completed and
documented in Research Report 202-1.
Objective 4 - Design of urban-wide CCTV system for traffic
surveillance. This study has concentrated on the evaluation of
low light level television cameras for night-time surveillance.
Demonstrations of television cameras from several companies were
conducted and technical requirements for night-time surveillance
were identified. A one-camera system has been leased and a six
month studi'~~~f~ii:e_ld~in.stallation requirements will be conducted in -------~
1976. A reseaf,~~f;:report wi 11 be written on the results of these
studies.
Objective 5 - Effectiveness of detectors for application in
traffic surveiZZCcrzce, driver corrununications, and control systems.
This objectiy~, _ _h~ts been partially satisfied by the study of the
existing detection system on the Gulf Freeway (I.H. 45 in Houston).
The study will be~~ompleted with the evaluation of a low volume
incident detecti6n system to be installed on I.H. 610 North Loop
Freeway in Houston in 1976. The installation will have three-loop
detector speed traps to determine if the speed and volume measure-
ments can be made more accurately with redundant detection systems.
A research report will be prepared in 1976 documenting the results
of the studies for this objective.
Objective 6 - Benefit-·cost analysis with consideration for
current conditions. This objective has been satisfied by the review
of current literature and economic conditions and the revision of

the benefit-cost analysis for transportation facility.evaluations.
Results of the study were documented in Research Study 202-2.
Objective 7 - Technical assistance to the Texas State Depart-
ment of Highways and Public Transportation. This objective has
been sat)3fi~d by the conduct of two studies: the evaluation of a
high accident location on U.S. 59 Southwest Freeway in Houston and
the design of the surveillance and communications system for the
evaluated section of I.H. 35 Freeway in Austin. Results of these
two studies are discussed in the following sections of this report.
Discussion of-Accomplishments
A review of the status of the objectives of the research indicates
that some of~he activities scheduled for completion during this study
have been delaye·a~because of the length of time required to receive - _ ____,:.._,__;;:__ .
approval and topp~plete the installation of test facilities. Some,"-~-~
objections w~re raised to the proposals to control the main lanes of free
ways to improve urban transportation because the acceptability of the
control systemsby the public and the safety of operation were unknown.
Yet, these are the same questions that the research program proposes to answer
through demonstration under real world conditions. Even though it takes
time to contact all offices responsible for the review and approval of
demonstration and experimental projects and to answer their questions on
the merits of the study, considerable progress has been made on the
objectives in this study that fall in this category. Progress reports
on the development and evaluation of these demonstration projects are
included in the following sections.
On-Freeway Control - Total Roadway_- 11 As I look at the solutions
that people offer for various problems facing us, I notice that
6
they all have a feature in common. Whenever one can identify
some aspect of the problem that is holding back progress (that is,
whenever one can isolate a bottleneck), the universal conclusion
seems to be that the bottleneck should be eliminated, and then all
wi 11 be· right.
Unfortunately, whether one is talking about traffic or whatever,
it does not work that way.
When _o_ri_e.l)ott 1 eneck is e 1 imina ted, severa 1 others sudden 1 y spring
into existence. I would like to argue that the automatic assumption
that bottlenecks are bad is a false and most dangerous premise.
Indee-cf;'-1-~wish to make the heretical assertion that a much more --·· ---~-----
-----~·
effective_wily~Jpr solving many of our problems might be to insert a -·-.-"--'·-'-'---
few well-chos~I!le~ttl enecks into the system. 11 *
Ramp metering is an accepted operational system of applying bottle··
necks for controll ing _ _traffi c demands entering on ur~an freeways, but -
control strategies _ljsually depend on certain traffic demand patterns for
exiting traffic. When these exiting demands do not reach expected levels,
the ramp metering controls will be less effective in eliminating and
reducing freeway congestion. Similar situations exist when lane blockages
and other capacity-reducing events occur.
Research in traffic control of freeways in the operations of special
controlled access facilities indicates that more restrictive control of
demand is required if peak operational efficiency is to be achieved and
if the level of service of the freeway is to be controlled. The control
---------------------*Dr. William H. Huggins, John Hopkins University, quoted from the
11 Wa11 Street Journa1, 11 March 14, 1974. Dr. Huggins is a professor in Electrical Engineering, specializing in circuit and system theory.
7

Ul C1 llt:t:WC1J UJ l.llt: lt:::Vt!l Ul ~t:::I"VICt::: !::iCrdl.t!!:JJ Ut!COfllt!!::i mun~ lllt:::drllri!:JIUI
as the development of public transportation priority systems for urban
freeways becomes a necessity. The research on more restrictive control of
freeway demand is being conducted at two locations with the control of
one lane and with the control of a total roadway to provide the answers
to the design and operational requirements.
Theory of Control -The concept of controlling traffic on the main
lanes of a freeway is based on the same theory used on entrance ramps,
that is, to control traffic demand at less than roadway capacity to
improve operating conditions at downstream bottleneck sections. Most
of the ramp control systems use a strategy of maximizing the through-put
of a bottl~ng~~j n terms of vehicles per hour. The ramp control systems
often fail to achieve total success because of several factors. First, . - ------~-
- ----:;-=-o·;;:"~- .io--
there is a shor?~~~lay in sensing variations in traffic flow. When--~
operating at or near capacity, this delay is very critical and can result
in the development of congestion due to normal variations in traffic flow.
Second, even if the change in traffic flow characteristics is sensed
imnediately, the amount of control that can be applied to entrance ramp
demand may be insufficient to eliminate the development of congestion.
Third, once congestion has developed, most ramp control systems do not
exert enough control on demand to return the traffic flow on the freeway
to optimum conditions. This can only be done by a reduction in freeway
demand.
Therefore, if ramp control systems cannot achieve total success
when the objective is to maximize flow rates, there is less chance of
success when the objective is to maintain a high level of service.
There are several alternatives for improving the effectiveness of freeway
8

control regardless of the objective.
First, the ramp control system can be expanded and level of control
can be more restrictive. This alternative has several disadvantages that
make it unacceptable. The expansion of ramp metering will extend into
sections of freeways that have no operational problems. Experience has
shown this control to be unacceptable to the public and thus ineffective
because of high violation rates of the metering signals. The costs for
providing this control are greater than other alternatives. The increase
in level of control is economical, since the system is already installed,
but the very restrictive control rates are unacceptable to the public and
may cause pro~_l~ll1s5n·:·adjacent streets that para 11 el and cross the freeway. ---------------------- -
Even though field~xperiments have proven ramp closures to be very effective,
only a few 1 ocatio·fi~]~ave been equipped with ramp closure gates. Compl e~~~ly -- --_---=- __ ......_....::.:;--=:=::-;:-_~ - - -
denying access to freeways by local traffic is difficult to achieve, even
for the short time periods during peak flows.
A second alternative is to divert traffic from the freeway to other
routes or other modes of transportation. Systems for promoting voluntary
diversions from the freeway have not been successful. Only when conditions
on the freeway are known to be much worse than alternate routes can
significant voluntary diversion be expected. Systems promoting diversion
to other modes of travel have had limited success, and should be encouraged.
The development of park and ride facilities, car pool, and van pool pro
grams and other transit incentives ·are to be supported, but their impact
on total traffic demand will be small for many years.
The third alternative is to control traffic demand on the main lanes
of a freeway. This approach is direct and effective in controlling the
level of service downstream of the control point. It is this approach
9

that is the subject of this research study.
Method of Control - The control system must be capable of reducing
the capacity of the roadway. Theoretically, this can be done by con
trolling the speed of vehicles, but that method is impractical on an
urban freeway. Freeway motorists drive at a speed they consider practical
and safe, which is .usually at or near the speed limit. The freeway
roadway width C?n be restricted by narrowing the lanes or reducing the
number of lanes. Narrowing the lanes is unacceptable at high speeds and
provides less control of the demand rates passing the control station.
Reducing the n!Jc'!li:>-er_:cofJanes is a practical solution which has been
applied on-urbim __ fre-eways;--though usually for the objective of improving
a downstreamme_r·_g4[l9 area. The assignment of one lane to priority
vehicles could-ars~o=--have the-effect of reducing traffic flow. Another~
approach, which.is to be investigated in this study is the control by
traffic signals or all freeway lanes at the control site. The instal
lation would resemble in theory a mid-block traffic signal on an arterial
street (Figure 1). The signals would rest in green until control of
demand was required. The signals would be activated, changing the ,si-gnals
to yellow, followed by a red indication. Depending on the condition of
traffic downstream, the signal cycle would be split to reduce the freeway
flow by 25, 50, or 75 percent. The green phase will be short (15-20
seconds) so that speeds at the signal will be low.
The major concern, expressed by those who proposed as well as those
who reviewed the study, is for the safety of motorists approaching the
signal. Every effort will be made in the design and operation of the
signal to minimize the probability of_ accidents. Advanced warning signs
and flashers will be prominently displayed (Figure 2). Fail-safe circuits
10

... ..... <r::~JF=-~====0:~ , ......... ~
-·--~ ----
1' ---- ---
.- . / ~ ---------- .
~-.··
.. -- ... --· ..
. .
11
~-------------..... -
Vl ,.._ ttl s:: 0)
•r-V)
,.._ 0 s...
4-) s:: 0 u u
-- - •r-4-4-ttl s... I-
>. ttl 3: ClJ ClJ s...
LL... I
s:: 0
. ,.._
ClJ s... :::::l 0)
•r-LL...

... - ·- ---I
~---w--------------h-- - - -
.•
,J
i
II
I
I ,I r .I I
·~ I i I I
1+--__...__ _____ --r--L- --- --• -,------
i
Figure 2. Advanced Warning Signs and Flashers for On-Freeway Traffic Control Signals
12

will be provided to minimize the effect of equipment malfunctions, and
the operation of the signals will be closely monitored.
Benefits of Control - The primary benefit of an on-freeway control
system will be the achievement of the level of operation required for
the selected control strategy of the freeway. The on-freeway control
will enable the operators of the freeway to more equitably distribute
the effects of controi between local and suburban users of the freeway.
The control system can be used to promote usage of high occupancy vehicles
by providing priority entry of one freeway lane and/or providing a higher
level of service downstream of the control site.
There a-re--::oifl~~potential benefits that depend on the exi~~ing traffic
demands, envir~~~~~f~fconditions and alternate facilities. For example, the ·. -~ -~----=·~_::: .... ::: .. .-:::..::_·- :_
reduction in freeway~ueYnand will tend to increase the traffic flows on d6wn-stream entrance ramps and interchanges. It is possible that total traffic
----~
delay along the freeway corridor will be reduced if queues at the entrance
ramps have blocked the movement of crossing traffic. Secondly, the
relocation of standing queues from the ramps and freeway lanes inside the
control site to the _main lanes upstream of the control site may result i11'"-
improved air quality by distributing exhaust emissions over a larger and
less populated area. Finally, the establishment of controls at the
outer limits of an urban area may encourage the following: the use of
other roadways that are not fully utilized; the change in trip starting
times to avoid the control; and the change to other forms of transportation
that receive priority operations at and beyond the control site. All of
these potential results are improvements in maximizing the use of existing
facilities.
On-Freeway Control - One Lane - Most freeway to freeway interchanges
13
are of a balanced design with the same number of freeway lanes entering
and exiting the interchange area. Within the interchange, the connecting
roadways diverge from the major roadways, add one or more lanes, then merge
one with another and finally merge with the major roadway. It is possible,
for example,c~to~~-have sh lanes of demand within the interchange destined
for the exiting roadway that has a four lane capacity. When traffic demand
peaks on all six lanes at the same time, queueing within and without the
interchange !akes place and other traffic movements are adversely ~ffected.
This study examines one solution to this problem that adds capacity to the
traffic that forms the long queues that affect other traffic movements.
Installation -The study site is at the merge of I.H. 10 Westbound - ---~-·· ---
-- ---~----~~-----·- .
at I.H_.~6l_O=North Loop Freeways in Houston. In Figure 3, the connecting
roadways (lf~and (2) from I.H. 610 that merge with roadway (5) of I.H. 10 • --'-~:....=-
have long queUes~ that block one of the through lanes of roadways' (3) and
(4) on I.H. 610. Capacity is added to the connecting roadways by closing
the outside lane of I.H. 10 {5). This is accomplished by overhead
lane use signals shown in Figures 4 and 5. The first two signals use a
green arrow and a yellow •x• and the last two signals use a green arrow,
yellow 'X' ancrred 'X' to affect the lane closure. The lane closure
signals rest in green and the advanced flashers at the warning signs
rest in dark when control is not in operation. When traffic conditions
warrant the application of control, an operator presses a switch which
starts the advance flashers and changes the green arrow signals over the
right lane to a yellow •x•. After 30 seconds, the operator presses the
switch a second time, changing the lane closure signals on the last two
mast arms from a yellow to a red •x•. When the operator determines
that control has been as effective as possible, within the limits of
14

Figure 3. Study Site for Lane Control On I.H. 10 Westbound at I.H. 610 North Loop
( 4)
-:.. ,.
- Advance Warning Sign & Flashers - First Advance Warning Lane
Signal C - Second Advance Warning Lane
Signal D - First Lane Closure Signal E - Second Lane Closure Signal F - Merge Area
NOT TO SCALE ------*=*=F=P · Distance from 8 to E = 2450 Feet (747 Meters)
iDistance from E to F = 200 Feet (61 Meters)
I'·' .'1

---~--:::~--:- .. :---
-===~~=~-~~ . - _______ ._...._,_,~ .. -~---;.~~-- .; .. ,*'/
Figure 4. Overhead Lane Use Signals - Lane Closure Warning with Yellow •x•
16

.. ··_...
---~-~:~.--~-
="""~ ~""-----""-~""----:;-~· ---'--==--
Figure 5. Overhead Lane Use Signals - Lane Closure Control with Yellow and Red 'X's
17
the control strategy, he presses the switch once more, which returns
the lane signals to the green arrow and the advance flashers to a dark
state.
Results of Control - There are several ways to measure the effec
tiveness of the lane control system: first, does it accomplish the
objective of shifting capacity from one roadway to another; second, do
the motorists~understand and comply with the control signals; third,
is it a safe operation; fourth, what effect does the control have on the
total operations in the area; and fifth, is the ~ystem cost effective.
Data are to be collected during one year of operation and a final ~-~------
report wil-1--doGument-:-:~~~-~esults. The following sections of this
report willj)~t~h~Jilterim findings of operation.
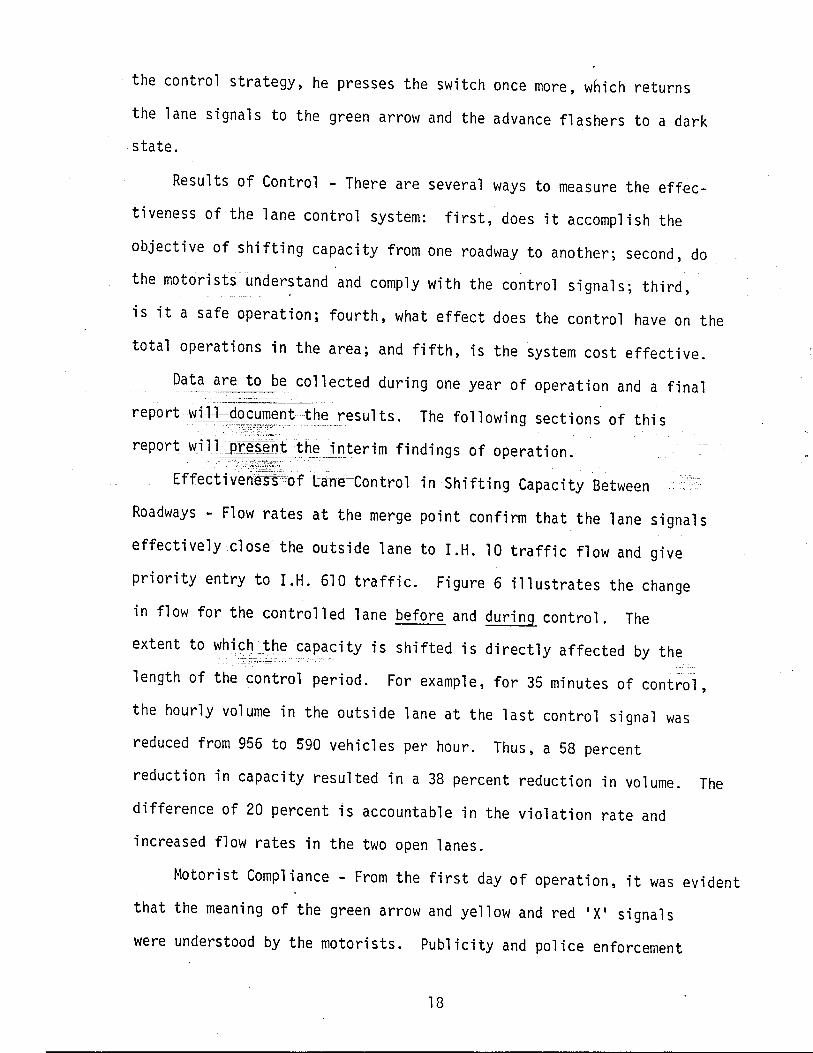
Effectivenrn"cof Lane-control in Shifting Capacity Between
Roadways - Flow rates at the merge point confirm that the lane signals
effectively close the outside lane to I.H. 10 traffic flow and give
priority entry to I.H. 610 traffic. Figure 6 illustrates the change
in flow for the controlled lane before and during control. The
extent to whicho~he capacity is shifted is directly affected by the
length of the control period. For example, for 35 minutes of control,
the hourly volume in the outside lane at the last control signal was
reduced from 956 to 590 vehicles per hour. Thus, a 58 percent
reduction in capacity resulted in a 38 percent reduction in volume. The
difference of 20 percent 1s accountable in the violation rate and
increased flow rates in the two open lanes.
Motorist Compliance- From the first day of operation, it was evident
that the meaning of the green arrow and yellow and red 'X' signals
were understood by the motorists. Publicity and police enforcement
18

.,
....... lO c -s ro 0'1
:::0:< -'·0 M- __, :::r c
3 s:uro ::I 0.. ("")
0 :::0:3 -'•"'0 rt-QI :::r -s 0 ....... C VI rt-0
::I rSlll ::I roo
c c::: MVIVI ro .......
0.. nro 0 ::II M-Sll -s::::s oro __,
Control Periods
V> w I=> z ....... :E:
lO
0::: w a..
V> w -l u ....... :c w > LL. 0
0::: w OJ :E: ::::> z
120
110
100
90 I I
I I
80 I
70
60
50
40
30
20
10
I-I \
I
·~
•
.·.·. /;! 't> u -4 I ~I , ..5 I
I ! I
I : I I
I\ ! I I \ t,
I\ 1 ; \ ,, I ~j I I I I
I '
[' ...... ~.. I
' I' ,,
" ' I ,. 1 I \ i , i, I I I ; I
/:~. ~ ' n I .. I I
I \ /
! \ I
I ' I . t I I \ I
I ' ' I
I ~ / • \ I
\ I \ I \ I \ I
"'0 Q) VI 0 1
4:45-5:45 Volume
With Contra 1 590 · : Without Cant ro 1 · 956
!.( .
I I I I
r-u Q) c 10 -l
I I
I I I I
, I t'' \ I
\I ; \ I
I'\ / ; \ I I \ I
i ' : I ' I
I '"
Without Contr~
,'.J 0 L------+~~--r-----~--~--~~~-r~----+------+--~--+-------4:30PM 40 50 5:00 1,,::10 20 30 40 50 6:00PM
TI~1E

assisted in getting the meaning of the signals across to those who might
not have understood, but the major factor contributing to the understanding
of the signals by the motorists was the compliance by the majority of the
drivers. The actions taken by most drivers to immediately clear the control
lane was in sharp contrast to those who ignored the signals indicating that
violations of the signals for the most part are intentional.
To measure the voluntary compliance of the signals, lane closure
compliance rates are computed for each period of ·control. A com
pliance rate is the percent of motorists who comply with the red •x•
phase of the lane closure light. The data are collected by the operator
after the outside lane of traffic has had sufficient time to merge into --. ~---~-----
the m-iddle lane=~~--The operator counts traffic in the outside (closed)
lane for thre:e:::minutes. The count is made at the last closure signal
just upstreamcfLJhe merge point. When this control period ends,-- ,
the operator makes another count for the same amount of time when
the lane is open. The two counts are compared to determine the
percentage of motorists who violated the red •x• signal during the
control period. These compliance rates, which estimate the motorists•
acceptance of the lane closure system, have averaged approximately 85 -.-. .. -.---.
percent under--normal traffic conditions. There are four factors that
influence the level of compliance:
Severity of Congestion significantly reduces motorist com
pliance to the lane closure system. When a motorist has been
delayed in a queue for a period longer than he feels is normal,
he is more likely to violate the lane closure signal in an effort
to decrease his delay. Violations usually occur in groups; i.e.
one or two consecutive violators will attract other violators.
20
Weather, because of its relationship to congestion, ·also affects
compliance rates. Rain, wet pavement, hazy overcast conditions
adversely affecting visibility, cause an increase in congestion and
a decrease in compliance rates.
Motorist familiarity with the system may have an effect on
compliance rates. The greater percent of traffic during the control
periods is repeat drivers who, after several runs through the system,
may begin to violate the closure.
Enforcement by the police results in an increase in compliance.
Police usually patrol the area one or two days a week. Motorcycle
policemen_are~stationed at the first advance warning light and the -
second lane _cjp_~_LI_re light. Their presence raises the compliance
rates to almo-st'JOO percent. Occasionally they issue tickets to
violators or verbally warn them of the necessity for their compliance
with the closure light.
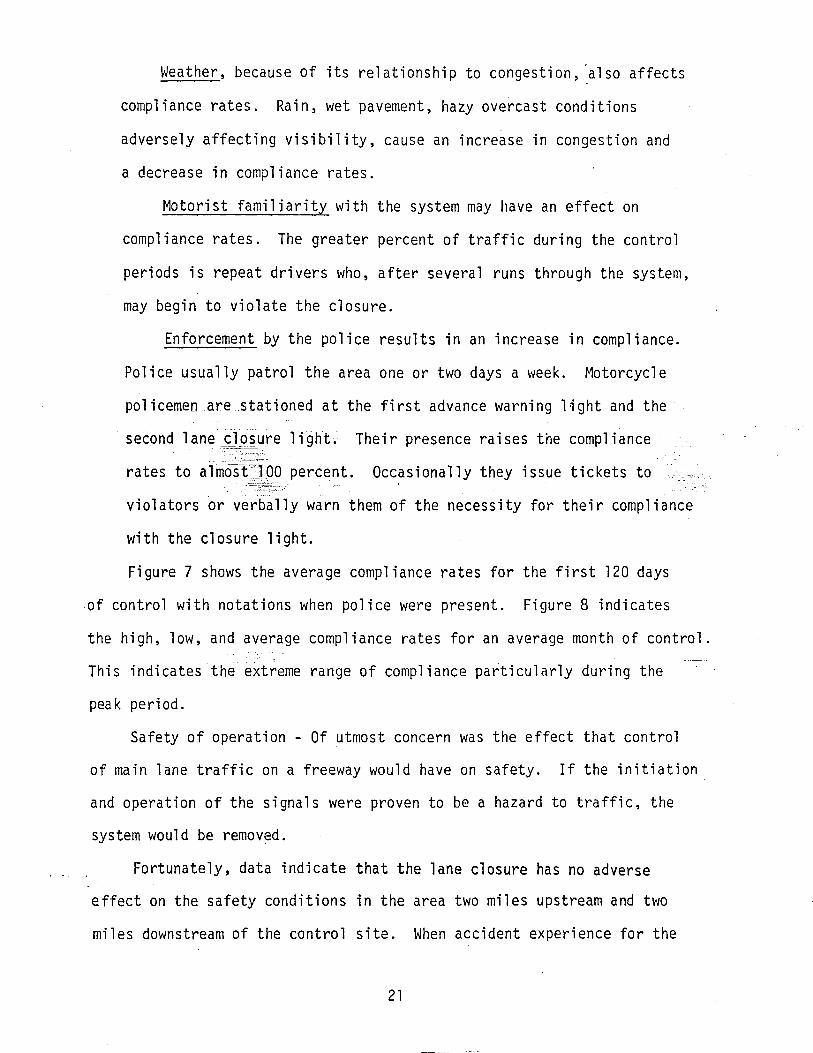
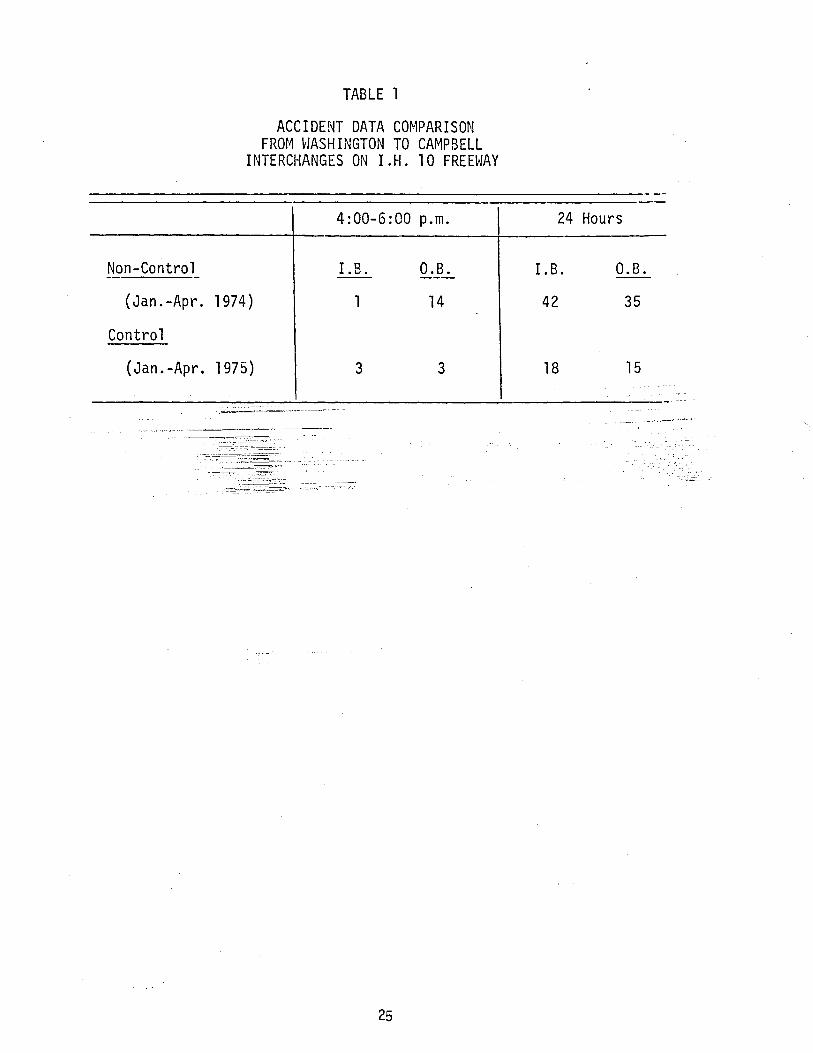
Figure 7 shows the average compliance rates for the first 120 days
of control with notations when police were present. Figure 8 indicates
the high, low, and average compliance rates for an average month of control.
This indicates the extreme range of compliance particularly during the
peak period.
Safety of operation - Of utmost concern was the effect that control
of main lane traffic on a freeway would have on safety. If the initiation
and operation of the signals were proven to be a hazard to traffic, the
system would be removed.
Fortunately, data indicate that the lane closure has no adverse
effect on the safety conditions in the area two miles upstream and two
miles downstream of the control site. When accident experience for the
21

100. p p p p
p
~ p
90 I I \
p
>- I i _I 0.. I 1/l:::E
0:::0 wu ;:: t-80 O:::c:::C D:C
1-LL. ow
z: 1- c:::C z: _I
tj _~70 0:::0 wo::: 0.. 1-
N z: N 0
u z: '""'60
P - POLICE PRESENCE
50~----~------~,------~------~----~------~--~--~----~------~------~----~~--~~ 20 10 30 40 50 60 70 80 90 100 110 120
CONTROL DAY
Figure 7. Average Daily Signal Compliance ·Rates
I I ';:
,,
>-_J 0.. :E 0 u
I-c::x: :r: I-
LJ.J z c::x: _J
_J
0 N a::: w I-
:z: 0 u :z: ....... (/) a::: LJ.J > ....... a::: Cl
u.. 0
I-:z: LJ.J u a::: LJ.J 0..
100
90
80
70
60
50
4:30 PM 40 50 5:00 10 20
TIME OF DAY March= 1975
Figure 8. Range of Signal (
30 40 50
ates
Average ,____,. Daily Rate
6:00 PM

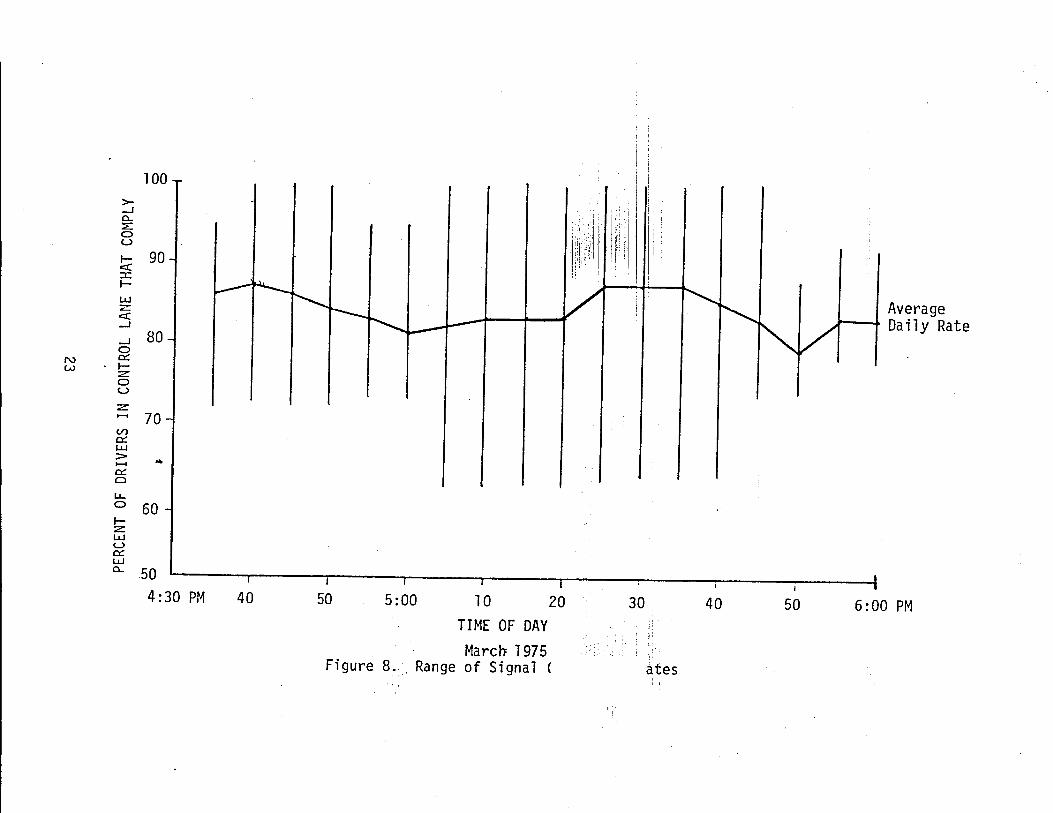
first four months of 1975 is compared with that of the same period during
the previous year (non-control), records show a 57 percent decrease in
the combined outbound ahd inbound incidents (Table 1). When considering only
the section of-outbound freeway that is directly affected by control
operations, the reduction of accidents is 80 percent. Table 1 was com-
piled from the computerized records of the SDHPT.
These results can not be directly attributed to the operation of the
signals, since the time of comparisons is so short •. Still they do
present a strong argument that the signals are not a traffic hazard. Data
for the full year of operation will be collected and further analyses will ·---------~-
Effecj:=~lila~e Control on Traffic Operations - There are thre,e~_
sections of roaij~ay that"-:can be affected by the lane closure controf system:
I.H. 10 Westbound, downstream of the control site; I.H. 10 Westbound, up-
stream of the control site; and I.H. 610 connecting roadways and approaches
from the South and East. Each of these roadways has been monitored and
measurements of traffic characteristics on each indicate the following:
Traffic Flow Downstream of Control - The control system does not
change the capacity of the merge area, but simply shifts the priority
flow from one approach to another. If there is adequate demand on both
approaches, the total output of the merge area remains the same. This
is the case with the I.H. 10-I.H. 610 merge area. The total flow on
I.H. 10 Westbound from the interchange has not been significantly changed.
Even if the lane control could exert some influence on the flow at
this point, the two bottleneck sections downstream (the weaving section .
at Silber and the lane drop at Wirt) would still control the throughput
of the freeway.
24
Non-Control - -
TABLE 1
ACCIDENT DATA COMPARISON FROM WASHINGTON TO CAMPBELL
INTERCHANGES ON I.H. 10 FREEWAY
4:00-6:00 p.m.
I. B.
(Jan.-Apr. 1974) 1
0.8.
14
Control
(Jan.-Apr. 1975) 3 3
------=---=-=--=--:------------~--- ----
---------~-==--=:::=-===--~--...o:.:..::-~ - - _:: ,_, __ -._
25
24 Hours
I. B.
42
18
0.8.
35
15
----~_..::.z:..= -
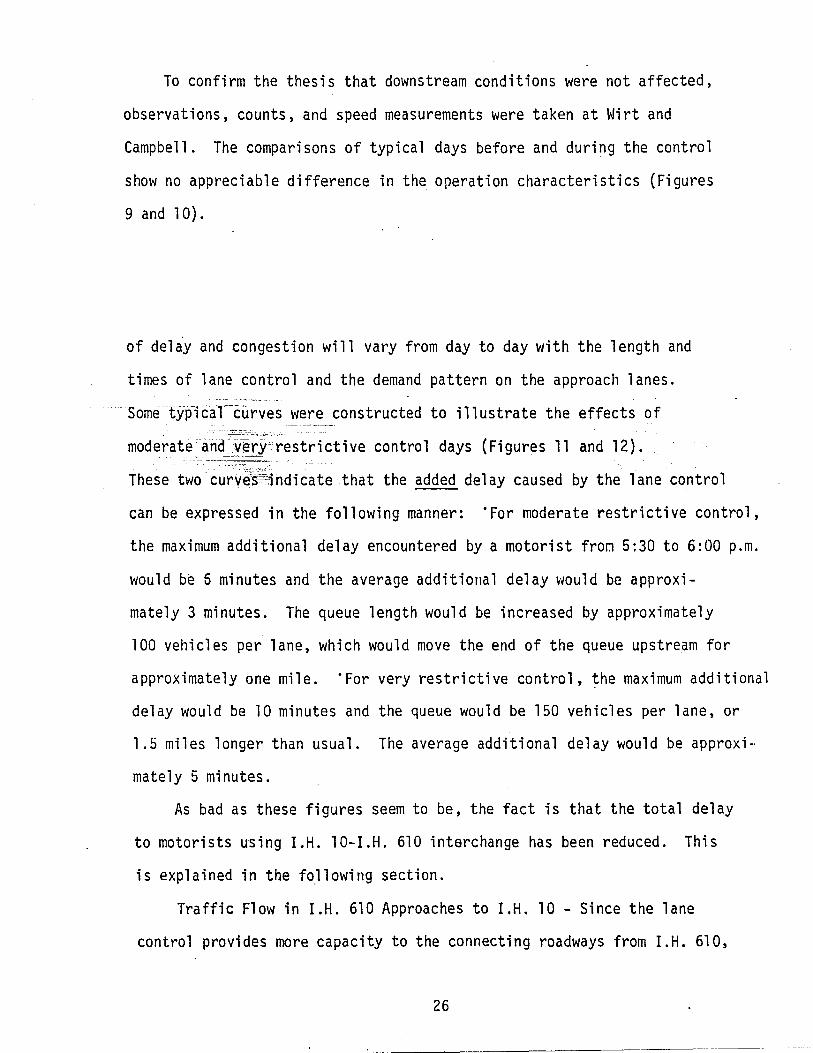
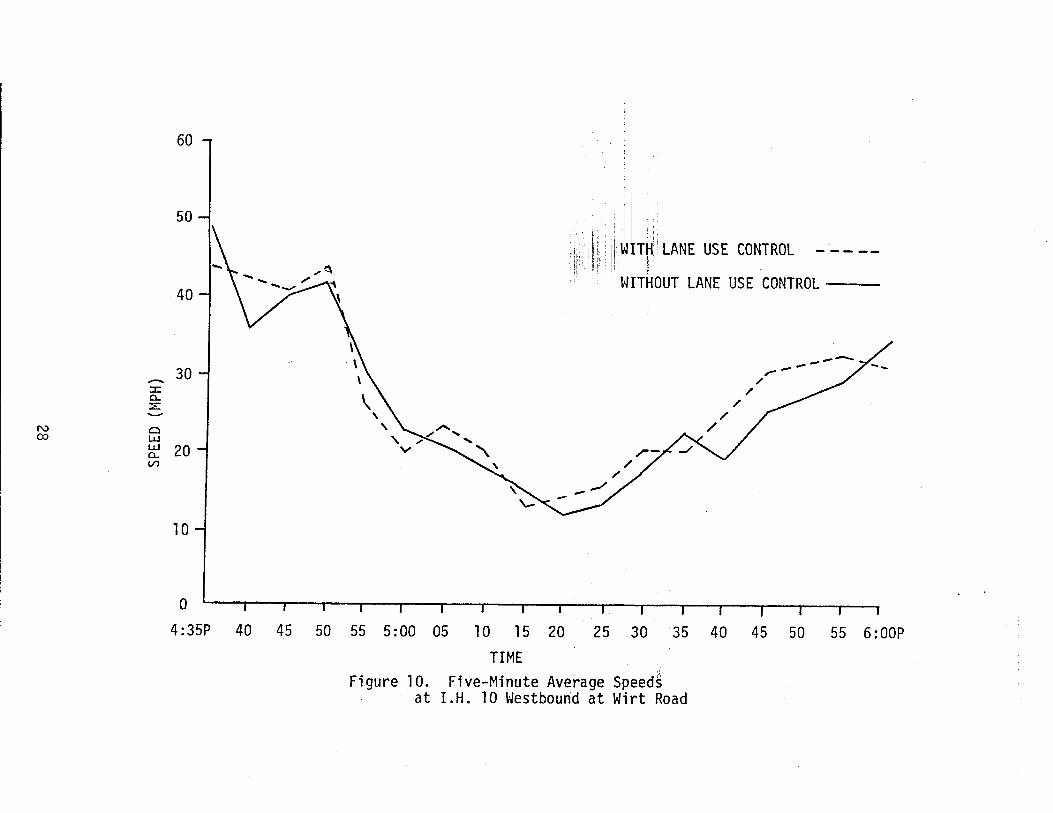
To confirm the thesis that downstream conditions were not affected,
observations, counts, and speed measurements were taken at Wirt and
Campbell. The comparisons of typical days before and during the control
show no appreciable difference in the operation characteristics (Figures
9 and 1 0).
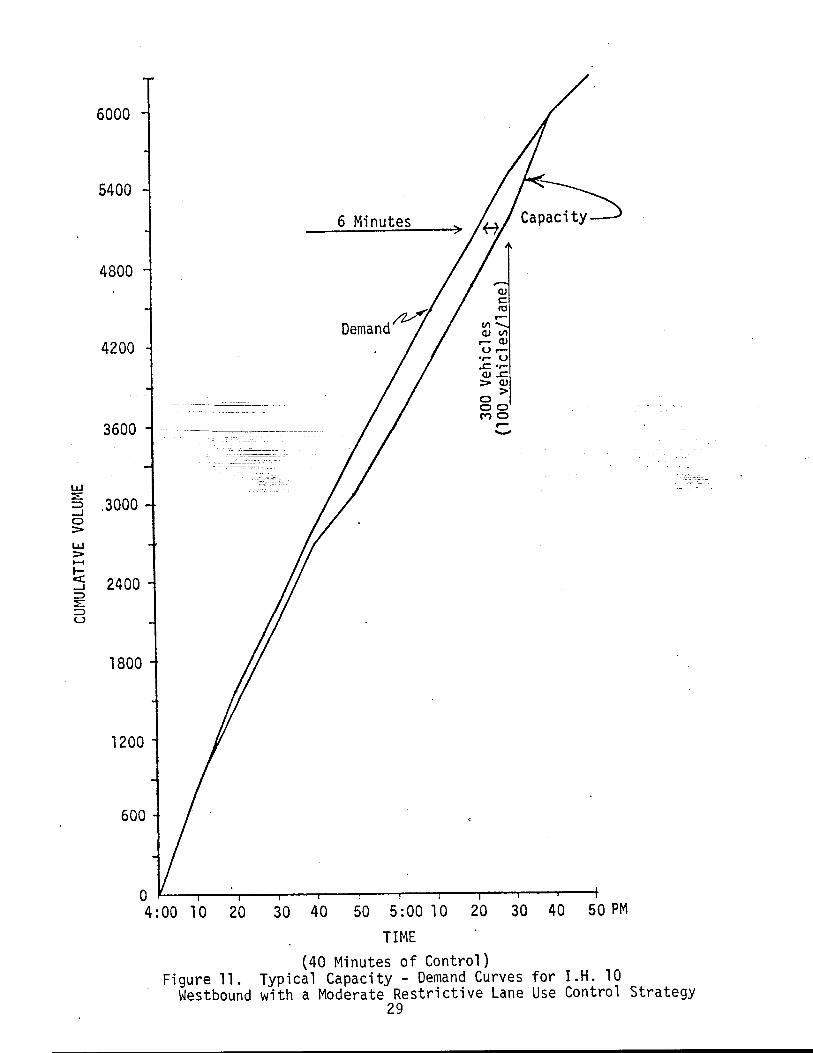
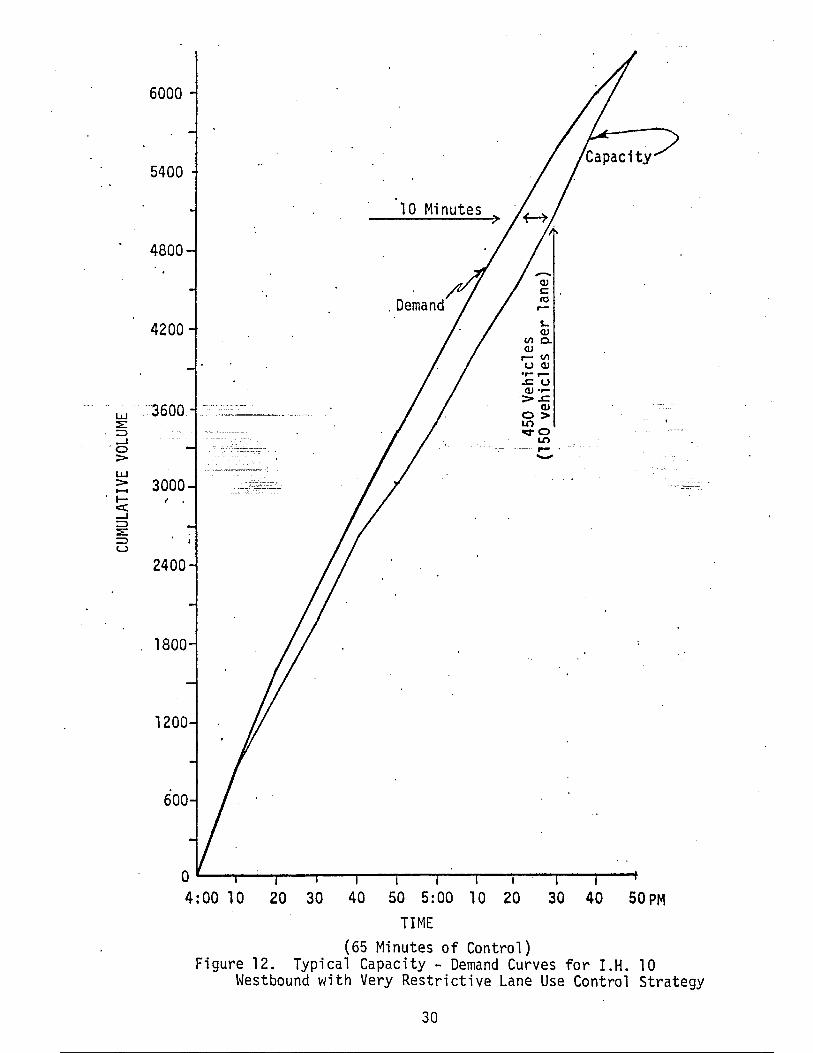
of delay and congestion wi11 vary from day to day with the length and
times of lane control and the demand pattern on the approach lanes.
· Some ·typi car·~curves were constructed to i 11 ustrate the effects of ·--------~~~,....,.,_. --
moderate·ari_d.ver,trestrictive control days (Figures 11 and 12).
These two curv~'s~:indicate that the added delay caused by the larie control
can be expressed in the following manner: 'For moderate restrictive control,
the maximum additional delay encountered by a motorist fro~ 5:30 to 6:00 p.m.
would be 5 minutes and the average additional delay ~~auld be approxi-
mately 3 minutes. The queue length would be increased by approximately
100 vehicles per lane, which would move the end of the queue upstream for
approximately one mile. 'For very restrictive control, the maximum additional
delay would be 10 minutes and the queue would be 150 vehicles per lane, or
1.5 miles longer than usual. The average additional delay would be approxi
mately 5 minutes.
As bad as these figures seem to be, the fact is that the total delay
to motorists using I.H. 10-I.H. 610 interchange has been reduced. This
is explained in the following section.
Traffic Flow in I.H. 610 Approaches to I.H. 10- Since the lane
control provides more capacity to the connecting roadways from I.H. 610,
26

w ::E => __. 0 > w 1-=> z ....... ::E
I LO
600
500
I
400
300
200
100
,_ __ I '
I ' I
I I
~ITH LANE USE CONTROL
WITHOUT LANE USE CONTROL ---
TOTAL VOLUME WITH CONTROL 11,340
TOTAL VOLUME WITHOUT CONTROL 11,010
0 ~----~--~--~--~~--~--~--r-~---r--~--~--r-~---r--~--~~--~---r--~--~~ 4:00P 05 10 15 20 25 30 35 40 45 50 55 5:00 OS 10 15 20 25 30 35 40 45 50 55 6:00P
TIME PERIOD Figure 9. Five-Minute Flow Rates
at I.H. 10 Westbound at Wirt Road
-::X: 0.. ::::
N 0 ex:> w
w 0.. (/")
60
50
40
30
20
10
0
:I i i:
i" ! t
:,· i i; 1:
···I: !il;wh~',; LANE USE CONTROL - ----:: .
WITHOUT LANE USE CONTROL--
4: 35P 40 45 50 55 5:00 05 10 15 20 25 . 30 35 40 45 50 55 6: OOP
TIME
Figure 10. Five-Minute Average Speed~ at I.H. 10 Westbound at Wirt Road
6000
5400
4800
4200
3600
w
3 .3000 0 > w > ......
~ 2400 ::::> :=.::: ::::> u
1800
1200
600
0
6 Minutes
..-
Ca~
4:00 1 0 20 30 40 50 5:00 1 0 20 30 40 50 PM
TIME (40 Minutes of Control)
Figure 11. Typical Capacity- Demand Curves for I.H. 10 Westbound with a Moderate Restrictive Lane Use Control Strategy
29
w :E: ::::> -I ·a > w
6000
5400
4800
4200
3600
;:: 3000 ' I- I ' ~ -I ::::> :E: ::::> u
2400
10 Minutes
s... Q)
VlO.. Q)
,..... Ill UQJ .,... ,..... ..cu Q)•,... >..C
Q)
O> LO oo:t'O
LO ---- ,..... . -
20 30 40 50 5: 00 1 0 20 30 40 50 PM
TIME (65 Minutes of Control)
Figure 12. Typical Capacity - Demand Curves for I.H. 10 Westbound with Very Restrictive Lane Use Control Strategy
30

the flow rates are higher and the queues are shorter on these ramps.
The objective of the control at this particular interchange was to keep the
queue lengths on the ramps from extending back to the main lanes on I.H. 610.
In most instances, the control was successful. Please refer to Figure 13
for the following discussion of delay in the I.H. 10-I.H. 610 interchange.
The reduction in delay on the two connecting ramps from I.H. 610 was
equal to the increase in delay to the I.H. 10 approach. This is proven by
the fact that the downstream capacity of I.H. 10 has not been changed and
that total upstream demands have not been affected by control. (See Locations
(1) and (2) in Figure 13.) Therefore the total delay to traffic destined for
I. H. 10 Westbound _has no_t__changed.
The reduction ol-:=qu_eue lengths of the I.H. 610 ramps (Location 3) has .im-
proved the throughput of -the I .H. 61 0 roadway from the West Loop to the North
Loop (Location 4). Delay studies on the 3-lane section of freeway crossing
over I.H. 10 indicated a savings of approximately 13-vehicle hours of travel
time on one typical day of control or 2,416-vehicle hours per year (Location 5).
This savings would increase with an increase in traffic demand on I.H. 610.
Benefit-Cost Analysis - The operation of lane control has several obvious
benefits: the reduction of conflicts in the merging area; the reduction in
total travel time through the interchange; and possibly, the reduction of
accidents in the area. There are also operations that may be considered as
disadvantages: the increase in delay to I.H. 10 traffic, even though it is
offset by improvements to I.H. 610 traffic delay; the increased difficulty for
I.H. 10 traffic to weave to the right to exit at the first ramp (Silber) down
stream of the control section, and the frustrations of facing additional
controls on the urban roadway-system.
The only factor that can objectively be evaluated at this time is
I •
31

(2) I.H. 610 and I.H. 10 Demand .for I. H. 10 Westbound Unchanged. ·.
610 .
.s~ 290 .
---t' t--- OLD_ KATY HWY.
<1> · I. H. 1 o westliourici .. Bott1 eneck ·• · ,-=~~._ Capacity Unchanged POST OAK
(4)
(5)
WOODWAY
Reduction in Queue Length·
WASHINGTON
NOT TO SCALE
•I.H. 610 Figure 13. Capacity, Demand, Delay Relationships
In the I.H. 10-I.H. 610 Interchange 32

the reduction in delay compared to the cost of installation, operation,
and maintenance of the signal system.
From available accident records for the first four months of 1974
and 1975, from Washington to Wirt Road interchanges, a projected accident
reduction of 16 vehicles per year was obtained by comparing accident
frequencies of 1974 and 1975 in this area. An average two-vehicle rear
end involvement with no human injury is estimated at $418. This results
in a yearly savings of $6,688 in motorists• personal property damage.
Elimination of these 16 accidents also results in an additional
savings to the motorists for delay. Studies have shown that the average
accident dJr~~~ly~f~fe~_~s traffic flow for approximately 41 minutes, -- ------~---··-·
resulting in a sr'f:rer~_Emt decrease in flow for three lanes. For a four ...
lane section of freewaY, the reduction of flow would be in the 25-40
percent range.
But because of the difficulty in relating the change in accident
experience to the lane control, these benefits are not included in the
analysis.
Therefore, total annual cost for this system is computed to be
$8,600 and the total annual benefit is $17,500, yielding a benefit
cost ratio of approximately 2.0 (Table 2).
High Load Detection System - An Overheight Load Detection and
Warning System was implemented by District 12 of the State Department
of Highways and Public Transportation on I.H. 45 near the I.H. 10 exit
just north of the Houston Central Business District. The system was
to function by detecting objects passing through a continuous light beam
14 feet above the Northbound I.H. 45 roadway and operating a series of
yellow flashing lamps on static message signs in advance of the Hogan
33

Part I
TABLE 2
BENEFIT-COST ANALYSIS FOR THE ON-FREEWAY LANE USE CONTROL SYSTEM
ON I.H o 10
Costs (Manual 0 eration)
Cost of System
1 0 years @ 1 0%
N R(l+R) x p = y (l+R)N-1
------1(1.-1-)l_L __ -$2 60 7677 47768 0 ·x 9 o- 0
-
(1.1 )1~-J~~~=: ' . - 1.59374246 -
R = Interes-t· Rate N = Number of Years P = Principal Y = Yearly Capital Recovery Cost
Annual Operating Costs (Signal Operator Expenses)
Maximum 240 days/year Control time 4:00-6:30 for 240 days = 600 hours 600 hours @ $3/hour = $1 ,800 6,240 miles @ 16¢/mile = $998 travel expenses
Total
Annual Maintenance Costs
Total Annual Cost
Part II
Costs (Automatic Operation)
Cost of System
Cost of Automation
Total Installation Cost
34
Annual
$4,800
2,800
~-QOO
$8,600
Annual
Initial cost
$29,600
Imt1a1 Cost
$29,600
~150
$37,750

10 years @ 10%
N R(l+R) X p = y (l+R)N-1
TABLE 2 (Continued)
10 _:.] (1.1 ~-X $37 750 = 9791 ~37778 = (,:~)To_, , T:""593/4Nb
Annual Maintenance Costs
Total Annual Cost
Part II I
Benefits
$6,145
1,500
$7,545
I
Vehicle -hours--sav-ings per typi ca 1 day 13 Number of days-operation per typical year 240
Total Ye~rJY savings in vehicle hours 3,120
Average cost per vehicle hour computed for an occupancy of 1.3 persons per vehicle
Total annual savings
Benefit Cost Ratio
Manual Operation 2:1
Automatic Operation 2.3:1
35
5.56
$17,500

Street Overpass. The static messages alerted the drivers of a possible
overheight vehicle and indicated the diversion route to the Westbound
I.H. 10 roadway (Figures 14, 15, and 16). Preliminary tests were conducted
at the study site by recording traffic operations on 8-mm film each time
the system was activated. This study approach was unacceptable because
of numerous false actuations of the detection system and the expense of
photographic equipment and supplies. An alternate approach of controlled
studies was used at the study site to collect the traffic data on volumes,
speeds, and brake light applications at five time periods over three days.
Each of 11 studies for each time period was composed of nine ~inutes ~f
data; 1) 3 minutes immediately before_ the warning system vms manually-
activated, 2}:~3-fllinutes while the warning system was operating, and·
3) 3 minutes immediately after the warning system had ceased operations.
Analysis of the volume and speed data indicated that the operations of the
warning system did not significantly affect the normal traffic operations
in the study section. The brake light data analysis did show that the
system was significantly noticeable by the driver in three of the five
time periods over the three-day period. Only one overheight load was
observed during the studies and was diverted to I.H. 10 Westbound exit
by the sign-signal system.
Extensive tests conducted on the photoelectric detection system
indicated that an object one inch in diameter was the minimum detectable
size, if the object is less than 20 feet from the detector. Tables were
developed for various 1 amp source--to-detector distances and detectab 1 e
object sizes. Test results indicated light diffraction around objects
close to the light source inhibited detection. Also, no detection was
noted when the speed of the object•s shadow between the photoelectric
36

Figure 14. Light Source for Photo Electric Detector for
High Load Detection
37

.... ~.!:·::--,. .. "~J<-~·-~···:---v-· ... ~ ... -~: ,. .. ··:~~:~ ~;~~~~:~·f~:~~?.~~,.~-~"""'-~::f:··~ .. ~~ .,~~t~~,,~,~~~'. ~ • .f • ••
Figure 15. Advance Warning Signs and Flashers
38

Figure 16. Signs and Signals at the Low Clearance Structure
. 39

cells was greater than 450 MPH or was slower than 2 MPH.
These studies prove that the system does not detect all overheight
loads. In fact, skid plates welded by District 12 State Forces under
the Hogan Street Overpass have paint scratches that prove that not every
high load diverts to I.H. 10. Further study did not reveal whether the
detection and warning system functioned properly when contact with the
skid plates was made by the overheight loads. However, the detection
system was proven in the laboratory to be effective in detecting large
objects and the fact that no significant damage to the bridge has been
reported since the installation of the warning system is supportive
of the conclusion that the warning system is effective.
The results-of=the study are discussed in more detail in the Research
Report 202-1 'entitled~'Evaluation of the High Load Detection and Warning-
System on I. H. ·45 in Houston."
Design of Urban Wide CCTV System for Traffic Survei1lance
There is continued interest in the design and application of closed
circuit television for traffic surveillance, even though there have been
studies of television systems since the first installation in the early
1960's. The reasons for this are: the need for visual surveillance
has increased; the development of automatic electronic surveillance
systems has been slow; the television industry continues to provide better
quality cameras with greater capability for 24-hour surveillance.
Need for Visual Surveillance - Urban highway transportation systems
are required to provide the desired mobility but with constraints that
limit the expansion of the transportation network. To accomplish the goals
of mobility under these conditions, transportation agencies are investi
gating all alternatives for making the best use of the existing facilities,
40
for encouraging the development and use of public transportation systems,
and for increasing the efficiency of private transportation. These
alternatives can be stated another way: better management of traffic ope
rations, priority operation of high occupancy vehicles, incentive programs
for use of public transportation, and car pools. Most of the techniques,
procedures, and systems that are being proposed involve traffic surveil
lance, motorist communications, and traffic control systems. In some
instances, intensive enforcement of traffic controls is required. Current
information on the status of traffic conditions, roadway conditions, capacity
reducing events, traffic control devices is essential to all of these alter-
natives.
Visual surveillance is one of the best methods for obtaining information,
and television surveillance is one of the best means of providing visual
coverage of miles of freeway. Freeway patrolling is another form of visual
surveillance that is very effective, except for the time required to cover
many miles of freeway, particularly during periods of heavy traffic con
gestion. If used together, patrols and CCTV can provide an excellent visual
surveillance system, with that most important extra benefit of improved
response time to incidents.
On most freeway and major arterials of the urban areas of the United
States, visual surveillance from passing motorists, arterial traffic
watchers, official patrol units, or other on-site persons are the only
systems now in use. If the need for surveillance is increasing, then
the need for better systems of surveillance is increasing.
Development of Automatic Electronic Surveillance- Electronic surveil
lance systems use vehicle detectors that provide basic traffic data to a
traffic analyzer that computes traffic parameters which are applied to
41

control strategies or to other decision making processes. ·Since the first
vehicle detector was placed at an intersection to make the signal control
responsive to traffic, engineers have continued to develop new and better
ways to apply the real time traffic data to control and communications
systems. And with the application ~of digital computers to traffic control,
the number of traffic algorithms has increased dramatically.
However, progress in the development of an automatic electronic surveil
lance system has been sloH because the hardware systems for detection and
transmission of data cannot perform at accuracies that are expected and
required. Attempts to obtain the required accuracy and reliability often
resulted in de~igns that were considered to be economically infeasible,
but the equipment manufacturers continue to try to develop the perfect
detector and thefraffic control managers continue to try to develop com
puter programs that compensate for the inaccuracies, variations, and
reliability of operation of current hardware.
Development of CCTV Equipment - Experience in the development of
equipment for industry, military, and the space agencies has enabled the
CCTV industry to greatly improve the quality and costs of the equipment.
Improvements in camera tubes have lowered the light requirements such that
nighttime visibility is adequate for traffic surveillance. Developments
in the quality of electronic circuits and environmental housings have
improved the reliability of equipment housed in the field.
Research Accomplishments -The research was conducted on two subjects:
the state-·of-the-development of the television cameras with low light level
capability and the state-of-.the··devel opment for towers capable of pro vi ding
a mounting platform for the video equipment in the field.
Suppliers of CCTV equipment were invited to demonstrate their lines
42
of low light level cameras for the research staff and representatives
of the State Department of Highways and Public Transportation. Six
companies responded and five demonstrated their equipment (Table 3).
Two cameras provided excellent pictures of traffic and roadway geometries
at night: COHU Model 2855 - Silicon Intensified Target Camera; and the
General Electric Camera. COHU Model 2856 - Intensified Silicon Intensified
Target Camera- demonstrated greater sensitivity to light than·Model 2855
in a closed light box, but was not used in field trials. Diamond Electric
successfully demonstrated its low light level camera to SDHPT, but the
research staff was unable to attend.
Based on the results of these limited demonstrations, it was
determined that th~ camera should be able to produce a usable picture .:3~ -
with less than 10 foot candles (FT-c) illumination on the face plate
of the camera. Those cameras that, according to their specifications,
can satisfy the requirements are noted in Table 3.
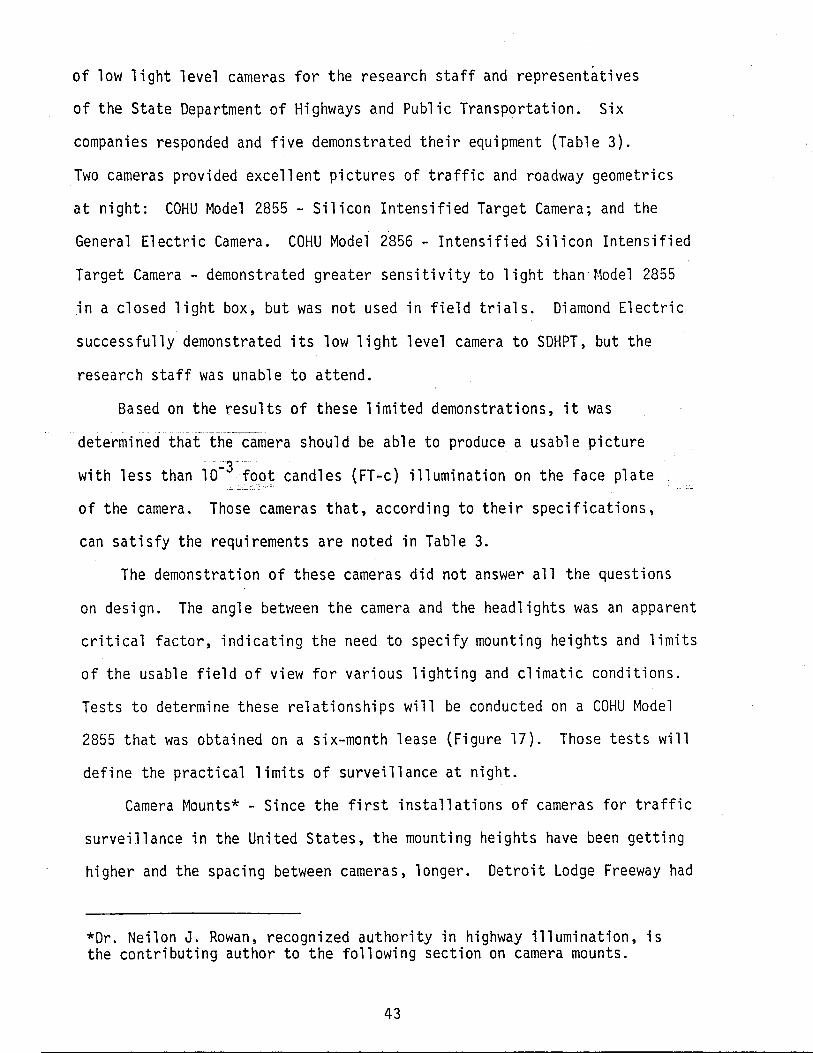
The demonstration of these cameras did not answer all the questions
on design. The angle between the camera and the headlights was an apparent
critical factor, indicating the need to specify mounting heights and limits
of the usable field of view for various lighting and climatic conditions.
Tests to determine these relationships will be conducted on a COHU Model
2855 that was obtained on a six-month lease (Figure 17). Those tests will
define the practical limits of surveillance at night.
Camera Mounts* - Since the first installations of cameras for traffic
surveillance in the United States, the mounting heights have been getting
higher and the spacing between cameras, longer. Detroit Lodge Freeway had
*Dr. Neilan J. Rowan, recognized authority in highway illumination, is the contributing author to the following section on camera mounts.
43

Company
COHU, Inc.
COHU, Inc.
Diamond Electric
General Electric
Panasonic
Venus Scientific,
Venus Scientific,
TABLE 3
LIST OF SUPPLIERS OF · LOW LIGHT LEVEL (LLL) CCTV
EQUIPMENT*
Model
2855
2856
LLl LL2 LL55
4TE 36A
WV-260T
Inc. NVl
Inc. NV2
Remarks
Silicon Intensified· Target Vidicon
Intensified Silicon Intensified Target Vidicon
Nite Guard Electron-In-Epicon
Silicon Target Vidicon
LLL CCTV
Intensified LLL CCTV
*Exclusion of any camera or manufacturer in this study does not consitute an opinion on the unacceptability of the equipment or supplier.
44

Figure 17. Low Light Level CCTV Camera, Pan and Tilt, and Control Unit
45

14 cameras in a 3.2-mile section with mounting heights of 30 feet. Houston Gulf
Freeway had 14 cameras in a 6.5-mile section with some mounting heights of 60
feet. Dallas has 8 cameras in a 10.0-mile section with mounting heights from
50 feet to 120 feet. The Port Authority of New York has a camera on the 35th
floor of a building. The San Francisco Oakland Bridge has cameras mounted on
the bridge towers 125 feet above the roadway. Finally, the ultimate in camera
installations is the airborne camera used by California in the Los Angeles area.
So the search continues for an effective camera platform that is high
enough to permit longer spacing between cameras; sturdy enough to prevent
excessive sway and vibration; designed to facilitate the maintenance of
the camera and associated electronic components; not too high so that
climatic conditions reduce the usable range of the camera; designed to be
aesthetically acceptable; and economically feasible. Several alternatives
have been investigated:
Standard Highway Luminaire Poles - Current designs use 50-foot poles for
continuous highway lighting. Experience of several operating systems is that
this mounting height is very good for daylight viewing for distances of 2,000
to 3,000 feet. Good resolution is possible for viewing distance up to 5,000
feet in clear weather.
Sign Bridge Towers - Poles attached to the top of sign bridges have been
tested and proven to be acceptable platforms for towers with mounting heights
comparable to the luminaire pole.
High Mast Lighting - Several factors have prompted the consideration of
CCTV systems with existing and planned high mast lighting systems. These include:
1. It is desirable to mount TV cameras at substantial heights to
gain a better perspective view of transportation facilities
and to increase the area of coverage.
2. The clear line of sight required for microwave transmission
46

necessitates the installation of antennas to substantial
heights to avoid the interference of urban development
and terrain.
3. It is desirable to make maximum use of all elements of the
highway system to improve safety and economics.
For these reasons, a preliminary analysis was made of the feasibility.
of installing CCTV systems on existing high mast lighting systems. This
analysis was based on previous experience with high mast lighting
systems, a review of current standard plans for high mast lighting
hardware, and discussions with designers of high mast lighting systems.
High mast lighting systems generally conform to one of the
general operational categories, as follows:
1. The luminaires are fixed at the top of the mast, and
access for service and maintenance is accomplished by
service personnel climbing the towers.
2. The luminaires are fixed at the top of the mast and access
for service and maintenance is achieved by a personnel
carrier that travels along the mast.
3. The luminaires are mounted on a ring assembly that can be
lowered to near ground level for service and maintenance.
Except for the very early installations, Texas has utilized the third
alternative, that is, providing for the lighting assembly to be lowered
for servtce and maintenance. Thus, a typical high mast assembly consists
of a mast from 150 feet to 175 feet in height, a ring assembly with 6 to
15 luminaires mounted on it, and the necessary winch and electrical gear
for operation of the system.
To facilitate lowering of the lighting assembly, the luminaires are
47

.. :· ·. ·.:··= !. :··
'·.
.. ....... ... .. · ;
• :.' k - e.• .
~ ·. '
... - . .....
. ·: .. ·:: -~:
-...
··-· .. . .·· -· ..... , :.. .
. . ~ .
. ,;. -~:
· ....
:. .-., -~ . . ·. ~
... ·· ..
... :.
·.:·:··.:.' ... '·/··.: .. · ... · .. _ .· .
. ... ~ . : -
.. _J
·_. ·-·:~ .. ·.··:.· ..
~··
' ·'
i·
·}
'
.·· '
mounted on a ring
is suspended on tl
system of PUlleys
Which is attached
the winch, the 1igJ
The mast is ge
at the joints. The
base to approximate7
the electrical conduc
Because the ring
on the mast due to Wi1
transmission equipment
alternative is to moun
lighting assembly or 01
number of factors that
1. The camera cou·
below the light
luminaires wou7c
A 7 though it has
Pated that the s
low 1ight level c
Another majo
attracted to the ;
numbers, and they
accumulation on thE
CCTV lens .
2. The use of microwav1

assembly would be questionable. Even though the light ring
can be made to fit the mast with low tolerance, the mast is
not designed to satisfy the allowable deflection requirements
of microwave transmission. Typically, lighting masts deflect
several feet under normal wind loads.
3. Because of the extensive deflections observed, the
acceptability of CCTV camera mounting on a lighting mast is
questionable. It is possible that the deflections would
result in seasickness effects and problems in maintaining
the viewing target under long distance viewing conditions.
4. Using a coaxial cable for signal transmission from a
lighting mast would require modification of the mounting
assembly. It would be necessary to route the coaxial cable
through the top of the mast and over a pulley in the same
manner as the electrical conductor is installed. This
could be accomplished quite easily on new installations,
but would be quite costly on existing installations.
In view of the fact that most factors relating to the installation
of CCTV equipment on high mast lighting supports are negative, it was
concluded that this alternative was not feasible. Therefore, effort
to identify suitable support equipment was directed in two areas: a
review of the CCTV microwave system used on the:Houston Ship Channel
and a review of commercially available support systems.
Towers - Early in 1975, the U.S. Coast Guard began operation of the
Houston-Galveston Vessel Traffic System. This system is a combination of
the previously established voice radio network on which vessels report
their intentions and movements to the Vessel Traffic Center, and a CCTV
49

system on which Coast Guard personnel in the center can visually observe
traffic at critical bends along the channel. This CCTV system consists
of several towers which support cameras at 30- and 75-foot heights and
microwave reflector boards at 150-foot heights.
The towers used in the Coast Guard system are typical three-legged,
self-supporting communication towers, commercially available as catalog
items. From inspection, it appears that the Coast Guard towers may have
been purchased from the Rohn Tower Company of Peoria, Illinois.
The Rohn Tower Company was contacted for information relating to the
availability and general design details of communication towers applicable
to CCTV microwave transmission. A general catalog was provided, giving
tower descriptions for various applications. The heavy .. duty self-supporting
tower series offered by Rohn is available in 20-foot sections up to a mounting
height of 320 feet. If shorter mounting heights are required, then only
the sections required to satisfy the deflection requirements are specified.
For example, it appears that the Coast Guard towers on the Houston Ship
Channel were made up of the eight (8) bottom sections of the heavy-duty
series, giving a total tower height of 160 feet and reflector board
mounting height of 150 feet. As an indication of the size of structure,
it is estimated that the base dimension of the tower is approximately 25
feet and the top dimension is about 8~ feet along the side of the triangular
section. It should be noted that these towers are designed on the basis
of limiting deflections for microwave transmission. The Rohn catalog
makes reference to Electronics Industries Association (EIA) specification
RS 222-A for the twist and deflections.
Also available for microwave transmission are several series of
guyed towers. The limitations on the use of such towers would be the
50
area in which they are to be installed. If the towers are to be ' installed w'ithin close proximity to the roadway, they would be of the
self-supporting type with protective devices to prevent vehicle impacts
with the tower. It is important to note, however, that the guyed towers
are considerably cheaper than self-supporting towers because the rigidity
for microwave transmission is provided by the guy wire system. Pre-
liminary recommendations on camera platforms are as follows:
1. CCTV systems should be mounted on towers installed for that
specific purpose. The towers should be of a frame-work type
to achieve maximum rigidity for the least cost.
2. Towers should be self-supporting except in special cases where
the guy wire system can be installed without danger of being
damaged by traffic or maintenance operations.
3. The tower design should be developed on the basis of signal
transmission methods. Allowable deflections are far more
liberal for camera mounting than for the mounting of
reflectors or antennas for a microwave system.
4. Microwave transmission systems should take advantage of
buildings and other rigid structures where practical.
5. Towers designed for microwave transmission should be designed
in accordance with Electronic Industries Association speci-
fication RS 222. This specification may be obtained from
the following source:
Electronics Industries Association Engineering Department 2001 I Street, NW Washington, D.C. 20006
51

Driver Communications, and Control Systems -The development of automatic
traffic surveillance, driv~r communications, and control systems depends
directly on the accuracy and reliability of vehicle detectors. Research
studies during the last few years have measured wide variations in the
operation of detectors used on the Gulf Freeway Surveillance Project.
Because the computer system and computer programmers were available to the
research staff, the variations in detector operation could be lessened by
software programs to improve the accuracy of the data. However; a better
understanding of the detection problem is necessary so that implementation
projects, that do not have the staff or computer capabilities of a research
project, will not be disabled by high incidence of hardware malfunctions.
Preliminary studies were conducted on the Gulf Freeway with the existing
system. A procedure for recording malfunctions of detectors and the
detection system was established. Two detection stations 850 feet apart,
with two loop detectors per lane were studied with the following results:
1. Each loop yields different occupancy (vehicle time-over-the-loop)
times for the same vehicle type at the same speed and lane position.
2. The range of occupancy readings for each detector for the same
vehicle type, excluding tractor-trailer combinations, is
predictable.
3. The accuracy of vehicle counts for all types, excluding tractor
trailer combinations, was acceptable.
4. The mean occupancy value for a loop detector is directly related
to the loop amplifier used.
5. The mean trap time (time between the lead and lag detector
actuations) for the same vehicle type is related to both
52

the loop detectors characteristics and loop amplifier
type.
6. Temperature change caused a change in both loop detector
and amplifier characteristics resulting in change in mean
occupancy and speed trap volumes. Twelve loop amplifier
models from six different manufacturers were used in the
detector study.
Computer programming was used to compensate for the above occupancy
and speed varianGes. The installation of three-loop speed traps on Loop
I.H. 610 at U.S. 59 will be investigated next year to determine if the
speed trap accuracies can be increased by using redundant systems. The
effects of telephone line data communications facilities on detector
measurements will be analyzed as opposed to the present direct wire com
munications.
Updating Benefit-Cost Analysis Procedu~~- A review of literature on
transportation costs related to highways, traffic characteristics, and
exhaust and noise pollution indicated that only a limited amount of data
was available that considered current conditions. This study developed
costs to update the basic data and the benefit-·cost analysis procedures.
An analysis was made of the effects of energy shortages and temporary man
datory controls that affect the supply, demand, and prices of resources.
The full presentation of the user costs and analysis procedure is contained
in Research Report 202-2, entitled 11 Benefit-Cost Analysis: Updated Unit
Costs and Procedures. 11
Current Highway User Costs - The updated highway user costs are
presented with the value of time costs, vehicle running costs, and highway
accident costs that reflect those costs existing in Texas during early 1975.
53
' .•.• :: ·.j _,.,.- -, .... ·, .. ·, •• ··:· .: ••.• ~: .::; ........ ••· ....... • •. .;.~.• ....... ,"( :..:· : :- -·~ ... .;.-. : .. :'·. .• ·,.; ··~ <F;, ... '·- .- ' - ••• -
The vehicle running costs are given by vehicle type and average
running speed for six levels of service that might exist on Texas freeways.
Also, vehicle running costs are given by vehicle type, uniform speed, and
speed cycle change on city streets.
The values of time are given by vehicle type and average running
speed for vehicles with driver only and for vehicles with passengers.
Highway accident costs are given that reflect the average direct
costs for vehicles involved in an accident by vehicle type and type of
accident in urban areas. Separate costs are given for vehicles with fatal
injuries, nonfatal injuries, and property damage only. Also, costs due to
loss of future earnings for persons killed in accidents are presented separately
according to sex.
Impact of Energy Shortage - An analysis was made of the impact of the
energy shortage on the relative·costs that are used in conventional benefit
cost or cost-effectiveness analyses of highway projects.
This analysis indicates that there has been a change in the relation
ship between real income (value of time) and real vehicle running costs,
caused primarily by the fuel shortage. A literature search reveals no
procedure for discounting time cost savings in relation to other user
cost savings that could be incorporated in benefit-cost analyses.
Recommended Analytical Procedure - An analytical procedure that uses
the benefit-cost or cost-effectiveness approach and considers user and non
user benefits and costs of a highway project and the data requirements of
the procedure were developed in this study. In addition to the updated
values of time, vehicle running costs, and accident costs, other data are
presented which will assist in the measurement of the effects of air and
noise pollution generated by highway users and the effects of traffic
54
eCOl
eco
gi'
at
be
ei
i:
s

.. · .... ·.::.:.-.·· .. .. .
generation characteristics on land use activities directly affecting land
values.
By comparing annualized dollar benefits and costs, discounted to
present value, for a year prior to implementation and one or more years
after implementation, a benefit-cost ratio can be generated and the
economic feasibility of a project can be partially determined. The full
economic feasibility of a project can be determined if due weight is
given to all measurable benefits and costs (in dollars and other units)
attributable to it. Various weighting schemes can be employed with the
benefit-cost ratio to arrive at an implementation decision. If the cost
effectiveness approach is used, the benefits and costs can be considered
in other measurable quantities in addition to dollars, but no weighting
scheme is employed to arrive at a decision.
The procedure is useful in selecting the most economically feasible
or cost-effective project from among several alternative projects which
could accomplish one or more goals. This is accomplished through the
use of a value matrix technique composed of weights assigned to each
goal and to each project. The technique is fairly flexible, and the most
difficult task is assigning weights to the goals. But, this technique
is necessary to arrive at a decision between alternative projects and
goals.
Summary and Recommendations - The following results have been obtained
from the study:
1. Highway user costs have been updated to 1975 conditions in the
urban areas of Texas.
2. Data on air and noise pollution and other highway impact data
have been assembled in a usable manner.
55
l l .1
l 'l l
._ -· ... >·:·\.' ·_,,.;.
3. An analysis has been made of the impact of the energy shortage
on the relative costs that are used in the conventional benefit-
cost or cost-effectiveness analysis.
4. An analytical procedure has been recommended for use in deter
mining the economic feasibility of a project and in determining
which project best accomplishes a particular goal or set of goals.
It is recommended that the analytical procedure be tested on pilot
freeway projects to further define data requirements and limitations so
that alterations and refinements can be made.
Surveillance Design for Elevated Freeway in A~stin - System design
considerations for a closed circuit television system for the new elevated .
freeway section of I.H. 35 in Austin were developed by the research study
and presented to the Austin District Office. The results of the low . light level camera demonstrations reported in Objective 4 were applied at
this location because of the requirement for 24-hour surveillance of the
roadway.
A final design of the camera locations and mounting heights will be
developed following tests with the camera system leased by HPR Study 173
and further demonstrations of the camera system at the site.
A system design of the driver information system to be used to warn
approaching traffic of congestion or accidents on the elevated freeway was
proposed to the Austin District. Matrix signs using one or more candidate
messages were proposed for the freeway approaches. The ramp approaches
were considered less critical because of lower volumes and slower speeds.
Fixed message signs with flashers and fold-out message signs were suggested
for these locations.
56

. .. ..· -'-"·'···. ····c· , .... ,-; ·:·~·. . :: . •. ... . ·· ... ~- .. ~ -.
. ~-.. . . .,··· :·, -- -···· .. · . -•:
Operational Analysis of High Accident Locations on U.S. 59 in
Houston - Film studies were made of the erratic maneuvers approaching a
major diverging area of U.S. 59 in Houston. The accident experience
at this location was high despite the good geometric design and adequate
roadway capacity.
The film studies revealed the extent of the problem. Of the 70,000
vehicles that used this section of the freeway, 2 percent (1 ,400) of the
vehicles weaved from one diverging roadway to the other within a few
hundred feet of the Vehicle Impact Attenuator (VIA) installation. At the
speeds of operation and the flow rates, these maneuvers were considered
hazardous, and the site was unsafe as evidenced by the high accident
experience since the opening of the diverge area in October 1974.
The site and the approach to the diverge of the roadway were studied
by several engineers. The results of the subjective evaluations were:
1. The approach signing should be improved to align the motorists
in the correct lanes.
2. The Vehicle Impact Attenuation installation needed to be more
visible to the motorists, especially at night.
3. The approach striping should be enhanced to improve the align
ment of the approaching traffic.
Several changes were suggested by the research study and the par
ticipating engineers from the Houston District Urban Office and Austin
Office of the State Department of Highways and Public Transportation.
The recommendations for changes and the actions taken· by the Department
were as follows~
1. Improve the advance signing to clearly identify through routes
and the left-hand exit to the downtown distribution system.
57
Response - The Department has drafted plans for advance signing
changes which will be made in the near future.
2. Improve the visibility of the gore area by increasing the back
drop signing.
Response - A standard EXIT sign with upward sloping arrow was
placed above the Cross Hatched Backboard to denote the left .. hand
roadway was the exit to the street system.
3. Improve the visibility of the gore area by adding spot lighting.
Response - Lighting will be installed at the same time as the
new advanced signing mentioned in Item No. 1.
4. Improve the visibility of the gore area by painting the crash
barrels.
Response - The barrels were painted Highway Yellow.
5. Improve the visibility by adding yellow flashers and delineators
to the gore area.
~esponse - Delineators have been added to the gore area to increase
the effective distance from the VIA to the decision point. Plans
have been developed for installing the yellow flashers in the
gore area in 1976.
6. Improve the alignment of the approaching traffic by adding
accentuated lane lines to discourage lane changing across the
center lane.
Response - 1,300 feet of 12-inch white Thermoplastic Pavement
Markings were added to the lane lines delineating the middle
lane passed the gore area.
7. Improve the approaching traffic by minor changes to existing
advanced signing.
58
1 \ i

.. ··.\."'-': ·····:· >:·.~.· . . ~ ~ ~-_.-···; :. ':··
. ..... . . .... ··· ~~ .·.·
Response - Several modifications were made to signs just in
advance of the gore area.
After several of the modifications were made to the gore area, addi
tional film studies were made. The results of the weaving studies indi
cated no significant change in the number of weavers5
but a perceptive
reduction in severe (i.e .• close to the gore area) maneuvers.
The accident experience to date is very limited, but encouraging.
In the 8 months from October 1974 to June 1975, there were 14 impacts of
the Vehicle Impact Attenuator. After the modifications to the signs and
striping, there was only one impact in the next 5 months.
Further analysis of this area will be made as the other modifications
are put in effect.
59

I j
!
. :.· ~: ~- .. ~
DOCUMENTATION OF RESULTS
Three research reports were written for the one-year period entitled
"Design and Evaluation of Freeway Surveillance and Traffic Control Systems: 11
Research Report Number 202-l, "The Evaluation of the High Load
Detection and Warning System on I.H. 45 in Houston," by Gene P.
Ritch.
Research Report Number 202-2, "Benefit-Cost Analysis: Updated
Unit Costs and Procedures," by Jesse L. Buffington and William F.
McFarland.
Research Report Number 202-3F, "Final Report of Design and
Evaluation of Freeway Surveillance and Traffic Control Systems,"
by William R. McCasland.
Several studies initiated under this project will be completed and
documented in rese.arch reports for Study Number 2-18-76-173, entitled
"Development and Evaluation of On-Freeway Traffic Control Systems and
Surveillance Techniques." These include: On-Freeway Control -Total
Roadway; On-Freeway Control -One Lane; and Low Light Level CCTV Demon
stration Testing.
60

i .
I ~---- --
··, ,. >> ..
. ·- ... --. . . ·.
CLOSURE
This study has continued the State's research program in the develop
ment and implementation of traffic control and surveillance systems for
the improvement in the efficiency and safety of existing urban freeway
networks. Progress in the application of new technology and innovative
transportation strategies cannot be measured by the results of one year.
That on-freeway control for one lane is operational and on-freeway
control for the total roadway has been approved for installation and evalu
ation is the culmination of over three years of work in the research pro-
gram.
The CCTV surveillance system for I.H. 35 in Austin will be the second
to be installed as an operational system in Texas, since the Baytown Tunnel
System in 1963. Research systems were installed on the Gulf Freeway in
1965 and the North Central Expressway in Dallas in 1969. Development of
the low light level cameras now permits designs for 24~hour surveillance.
The application of vehicle detection hardware to more complex and
demanding tasks, such as incident detection and high load detection, will
result in better equipment and improved computer logic. The process has
not run its course, but the detection deficiencies are becoming better
known and the requirements for detection better defined.
The most significant progress that this study can report for this year
of research is the continued relationship between the research program and the
State's operational programs. The objective of providing technical assistance
to the State is a means used to assist in implementation of research results
when appropriate. That the Austin District, Houston District, and Houston
Urban Office did request and receive this assistance is the best indication
of progress in the research program.
61 -------------------------

:! ~ :
i J l j
l 4 'j J
t j
1 l 1
1 •
.. :·
.:. - ~ ·. ·: ..
REFERENCES
1. Smith, S. A. and Carter, E. C., "Pretimed Signal - Control System
for an Underwater Vehicular Tunnel," University of Maryland
Research Report, Transportation Research Record 533, 1975.
2. Lautzenheiser, R. C., "Evaluation of On-Freeway Traffic Control at an
Interchange," Texas Transportation Institute Research Report 139-10.
3. Foote, R. S. and Crowley, K. W., "Developing Density Controls for
Improved Traffic Operations," Highway Research Record No. 154, 1967.
62