research uk hotel - content.knightfrank.com · 2 introduction the intensity of new hotel supply...
TRANSCRIPT
HIGHLIGHTS
RESEARCH
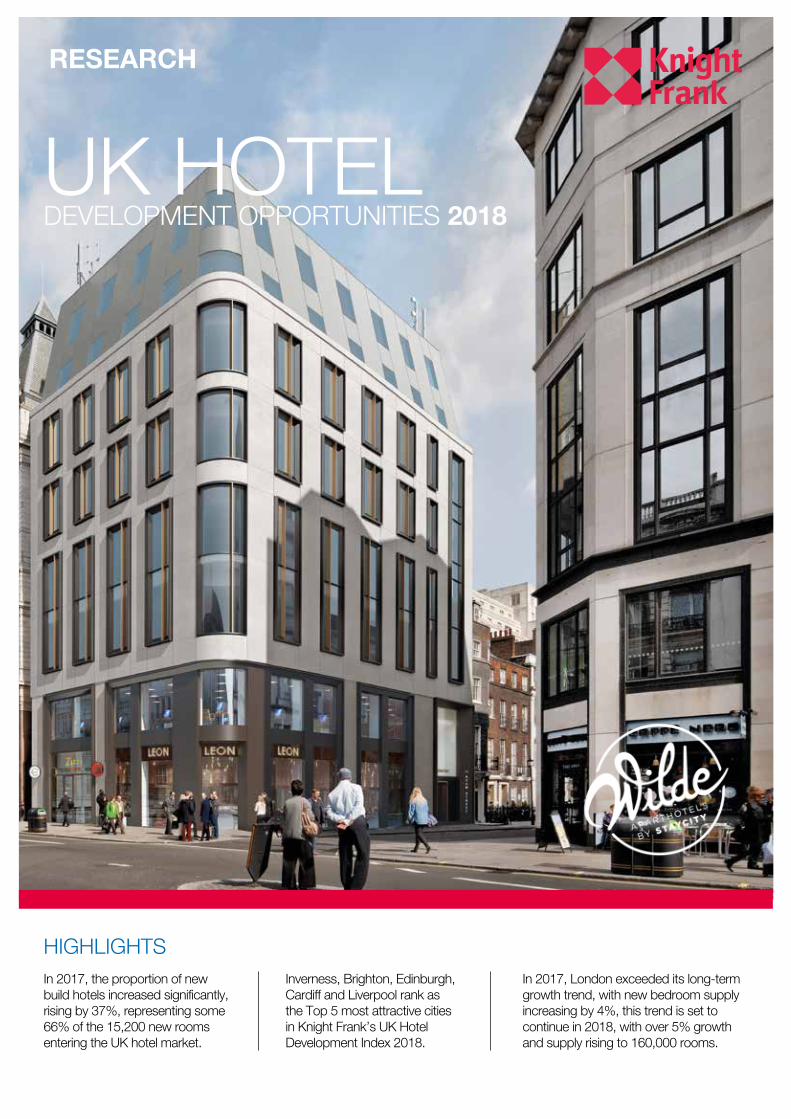
In 2017, the proportion of new build hotels increased significantly, rising by 37%, representing some 66% of the 15,200 new rooms entering the UK hotel market.
Inverness, Brighton, Edinburgh, Cardiff and Liverpool rank as the Top 5 most attractive cities in Knight Frank’s UK Hotel Development Index 2018.
In 2017, London exceeded its long-term growth trend, with new bedroom supply increasing by 4%, this trend is set to continue in 2018, with over 5% growth and supply rising to 160,000 rooms.
UK HOTEL DEVELOPMENT OPPORTUNITIES 2018
2
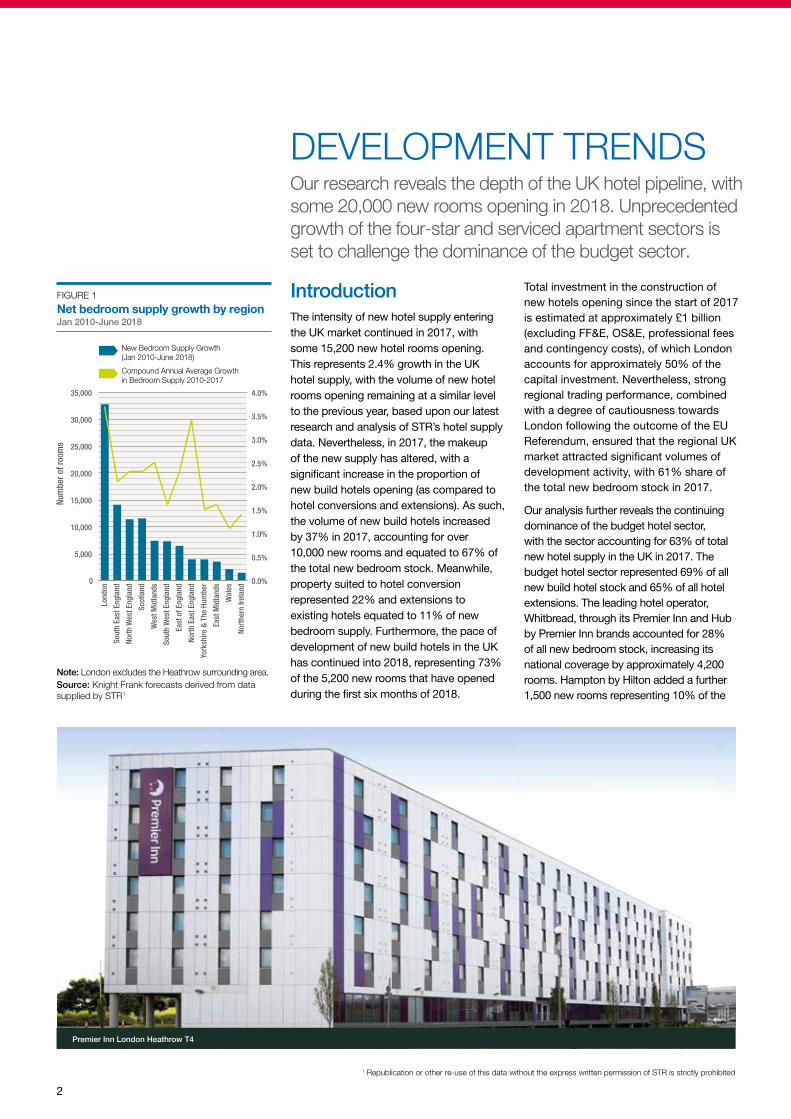
IntroductionThe intensity of new hotel supply entering the UK market continued in 2017, with some 15,200 new hotel rooms opening. This represents 2.4% growth in the UK hotel supply, with the volume of new hotel rooms opening remaining at a similar level to the previous year, based upon our latest research and analysis of STR’s hotel supply data. Nevertheless, in 2017, the makeup of the new supply has altered, with a significant increase in the proportion of new build hotels opening (as compared to hotel conversions and extensions). As such, the volume of new build hotels increased by 37% in 2017, accounting for over 10,000 new rooms and equated to 67% of the total new bedroom stock. Meanwhile, property suited to hotel conversion represented 22% and extensions to existing hotels equated to 11% of new bedroom supply. Furthermore, the pace of development of new build hotels in the UK has continued into 2018, representing 73% of the 5,200 new rooms that have opened during the first six months of 2018.
Total investment in the construction of new hotels opening since the start of 2017 is estimated at approximately £1 billion (excluding FF&E, OS&E, professional fees and contingency costs), of which London accounts for approximately 50% of the capital investment. Nevertheless, strong regional trading performance, combined with a degree of cautiousness towards London following the outcome of the EU Referendum, ensured that the regional UK market attracted significant volumes of development activity, with 61% share of the total new bedroom stock in 2017.
Our analysis further reveals the continuing dominance of the budget hotel sector, with the sector accounting for 63% of total new hotel supply in the UK in 2017. The budget hotel sector represented 69% of all new build hotel stock and 65% of all hotel extensions. The leading hotel operator, Whitbread, through its Premier Inn and Hub by Premier Inn brands accounted for 28% of all new bedroom stock, increasing its national coverage by approximately 4,200 rooms. Hampton by Hilton added a further 1,500 new rooms representing 10% of the
0
5,000
10,000
15,000
20,000
25,000
30,000
35,000
0.0%
0.5%
1.0%
1.5%
2.0%
2.5%
3.0%
3.5%
4.0%
Lond
on
Sout
h Ea
st E
ngla
nd
Nort
h W
est E
ngla
nd
Scot
land
Wes
t Mid
land
s
Sout
h W
est E
ngla
nd
East
of E
ngla
nd
Nort
h Ea
st E
ngla
nd
York
shire
& T
he H
umbe
r
East
Mid
land
s
Wal
es
Nort
hern
Irel
and
Num
ber o
f roo
ms
New Bedroom Supply Growth(Jan 2010-June 2018)
Compound Annual Average Growthin Bedroom Supply 2010-2017
Source: Knight Frank forecasts derived from data supplied by STR1
FIGURE 1
Net bedroom supply growth by region Jan 2010-June 2018
Premier Inn London Heathrow T4
1 Republication or other re-use of this data without the express written permission of STR is strictly prohibited
DEVELOPMENT TRENDS Our research reveals the depth of the UK hotel pipeline, with some 20,000 new rooms opening in 2018. Unprecedented growth of the four-star and serviced apartment sectors is set to challenge the dominance of the budget sector.
Note: London excludes the Heathrow surrounding area.
33
UK HOTEL DEVELOPMENT OPPORTUNITIES 2018 RESEARCH
market share and with respectable growth from Travelodge (1,150 rooms), Holiday Inn Express (590 rooms) and the budget design brand Moxy (460 rooms), the top five operators in terms of new bedroom stock accounted for some 8,000 new rooms, representing 52% of the total new hotel supply.
The growth of new budget hotels entering the market is evidence of an underlying shift towards greater branding, albeit greater diversification of brands and the market becoming less fragmented. This important structural change is resulting in market-wide improvements in terms of product offering and standards, thereby contributing in part to the overall increase in UK RevPAR performance, once the new supply is embedded in the market.
Growth Trends – Current UK Hotel Supply The UK hotel bedroom supply has grown at a compound annual average rate of 2.2% per annum since the beginning of 2011. During this period and taking into consideration the new supply opened during the first six months of 2018, London (including the Heathrow surrounding area) has witnessed an increase of over 36,000 new rooms, with a compound annual average growth rate of 3.5% per annum. Regional UK, meanwhile, has recorded an average compound annual growth of 1.8% per annum, with the addition of approximately 69,000 new rooms.
The full price of London’s existing hotel assets, combined with continued yield compression, brought about by a plethora of domestic and overseas investors, have helped fuel development activity both in London and the provincial UK market, as an alternative route to investment.
In 2017, London exceeded its long-term growth trend, with new bedroom supply increasing by 4%, and total supply in London rising to approximately 152,000 rooms. This strong flow of construction in the capital has resulted in London’s share of the UK hotel market rising from 21% in 2010 to 23% in 2017.
Nevertheless, the strong and robust regional UK trading performance over the past few years, brought about by a diverse mix of both business and leisure demand and unprecedented growth in visitor numbers to certain UK cities, has resulted in a growing number of regional UK cities becoming a
destination of choice for developers and investors alike.
After London, the South East of England has witnessed the greatest growth in the volume of new supply since 2010, with some 14,000 new rooms opening. This growth can be largely attributed to the expansion of the hotel markets at Heathrow and Gatwick airports, which combined have contributed to some 34% of the new supply in the region, with Heathrow alone expanding by some 1,700 new rooms over the past three years. With soaring passenger traffic at the UK’s busiest airports recording annual growth of 3% in 2017 at Heathrow and 5.2% at Gatwick, boosted by larger and fuller aircraft, growth in emerging markets and long haul flights, UK airports are therefore a major demand generator and contributor to new hotel supply. The hotel markets of both Luton and Stansted airports have further consolidated this trend, representing 21% of the new hotel supply that has opened in the East of England over the past three years.
Meanwhile, the North West of England and Scotland are two further regions which have witnessed healthy growth in supply since 2010, each with an annual average growth rate of 2.3%, representing 22% of the UK’s total new room stock, equivalent to some 22,000 rooms. With the successful regeneration, transformation and reshaping of a number of UK cities, largely through joint public/private initiatives and institutional investment, targeted hotel development in key UK cities, has been the driving force behind such growth, with new supply in Manchester accounting for 50% of the supply growth in the North West region.
Meanwhile, in Scotland, for the past three years, Edinburgh has accounted for 36% of the new bedroom stock, followed by Aberdeen (22%) and Glasgow (16%). Elsewhere, since the start of 2015, Birmingham has added almost 1,300 rooms, contributing over 53% of the West Midlands new supply, whilst Newcastle-Upon-Tyne has increased by almost 1,000 rooms and represented 46% of new supply in the North East of England.
Other regional UK cities which have recorded significant growth in new hotel supply during 2017, well above the national average, include Hull (13%), Bath (11%), Manchester (7%), Aberdeen (7%), Belfast (6%), Bristol (6%), Cambridge (6%) and Edinburgh (5%).
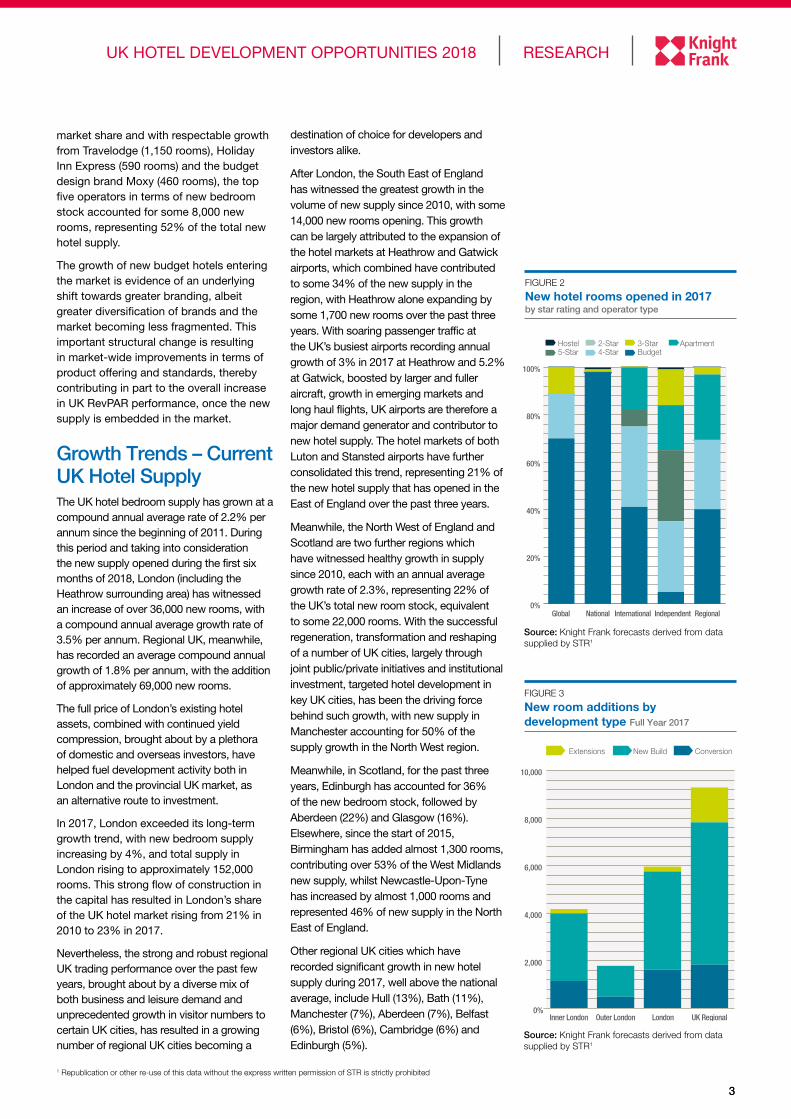
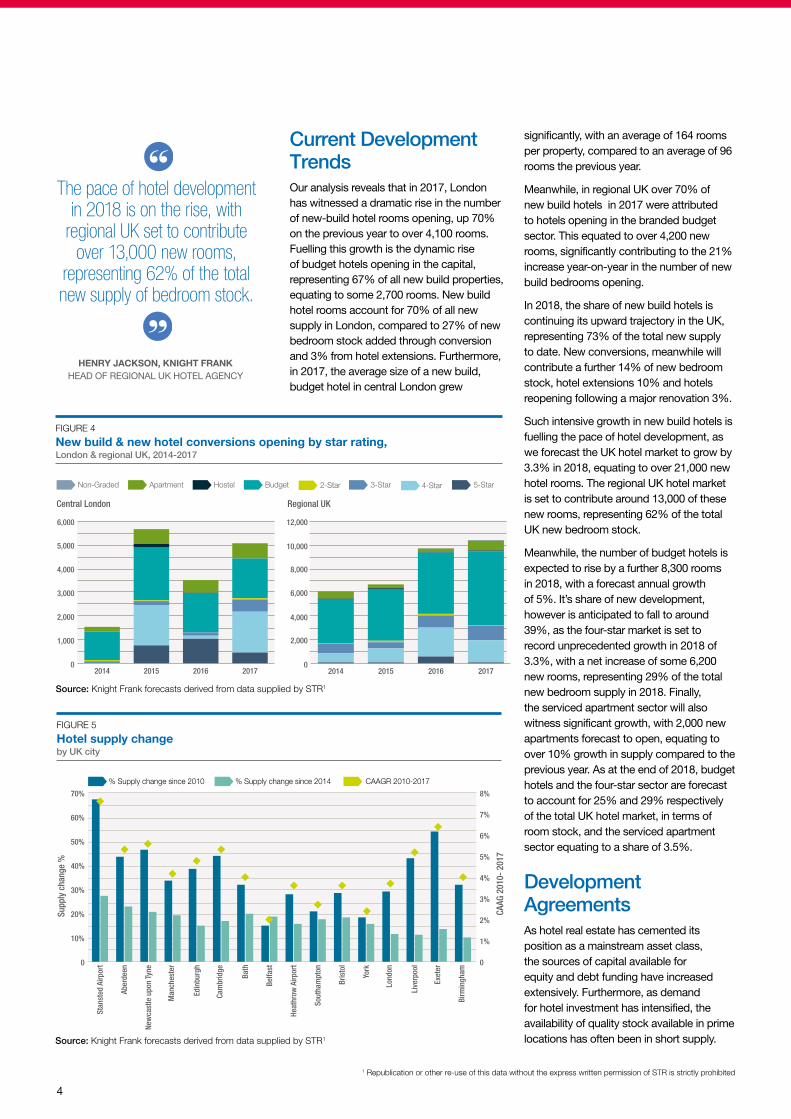
Source: Knight Frank forecasts derived from data supplied by STR1
FIGURE 2
New hotel rooms opened in 2017 by star rating and operator type
0
10
20
30
40
50
60
70
80
90
100
Budget
0%
20%
40%
60%
80%
100%
RegionalIndependentInternationalNationalGlobal
Hostel 2-Star5-Star 4-Star
3-StarBudget
Apartment
Source: Knight Frank forecasts derived from data supplied by STR1
FIGURE 3
New room additions by development type Full Year 2017
0%
2,000
4,000
6,000
8,000
10,000
London UK RegionalOuter LondonInner London
New Build ConversionExtensions
1 Republication or other re-use of this data without the express written permission of STR is strictly prohibited
4
Current Development Trends Our analysis reveals that in 2017, London has witnessed a dramatic rise in the number of new-build hotel rooms opening, up 70% on the previous year to over 4,100 rooms. Fuelling this growth is the dynamic rise of budget hotels opening in the capital, representing 67% of all new build properties, equating to some 2,700 rooms. New build hotel rooms account for 70% of all new supply in London, compared to 27% of new bedroom stock added through conversion and 3% from hotel extensions. Furthermore, in 2017, the average size of a new build, budget hotel in central London grew
significantly, with an average of 164 rooms per property, compared to an average of 96 rooms the previous year.
Meanwhile, in regional UK over 70% of new build hotels in 2017 were attributed to hotels opening in the branded budget sector. This equated to over 4,200 new rooms, significantly contributing to the 21% increase year-on-year in the number of new build bedrooms opening.
In 2018, the share of new build hotels is continuing its upward trajectory in the UK, representing 73% of the total new supply to date. New conversions, meanwhile will contribute a further 14% of new bedroom stock, hotel extensions 10% and hotels reopening following a major renovation 3%.
Such intensive growth in new build hotels is fuelling the pace of hotel development, as we forecast the UK hotel market to grow by 3.3% in 2018, equating to over 21,000 new hotel rooms. The regional UK hotel market is set to contribute around 13,000 of these new rooms, representing 62% of the total UK new bedroom stock.
Meanwhile, the number of budget hotels is expected to rise by a further 8,300 rooms in 2018, with a forecast annual growth of 5%. It’s share of new development, however is anticipated to fall to around 39%, as the four-star market is set to record unprecedented growth in 2018 of 3.3%, with a net increase of some 6,200 new rooms, representing 29% of the total new bedroom supply in 2018. Finally, the serviced apartment sector will also witness significant growth, with 2,000 new apartments forecast to open, equating to over 10% growth in supply compared to the previous year. As at the end of 2018, budget hotels and the four-star sector are forecast to account for 25% and 29% respectively of the total UK hotel market, in terms of room stock, and the serviced apartment sector equating to a share of 3.5%.
Development AgreementsAs hotel real estate has cemented its position as a mainstream asset class, the sources of capital available for equity and debt funding have increased extensively. Furthermore, as demand for hotel investment has intensified, the availability of quality stock available in prime locations has often been in short supply.
FIGURE 5
Hotel supply change by UK city
0
10%
20%
30%
40%
50%
60%
70%
% Supply change since 2014% Supply change since 2010 CAAGR 2010-2017
Supp
ly c
hang
e %
CAAG
201
0- 2
017
0
1%
2%
3%
4%
5%
6%
7%
8%
Birm
ingh
am
Exet
er
Live
rpoo
l
Lond
on
York
Bris
tol
Sout
ham
pton
Heat
hrow
Airp
ort
Belfa
st
Bath
Cam
brid
ge
Edin
burg
h
Man
ches
ter
New
cast
le u
pon
Tyne
Aber
deen
Stan
sted
Airp
ort
Source: Knight Frank forecasts derived from data supplied by STR1
Source: Knight Frank forecasts derived from data supplied by STR1
Regional UKCentral London
4-Star 5-Star3-StarBudgetHostelApartment 2-StarNon-Graded
0
1,000
2,000
3,000
4,000
5,000
6,000
20172016201520140
2,000
4,000
6,000
8,000
10,000
12,000
2017201620152014
FIGURE 4
New build & new hotel conversions opening by star rating, London & regional UK, 2014-2017
1 Republication or other re-use of this data without the express written permission of STR is strictly prohibited
The pace of hotel development in 2018 is on the rise, with
regional UK set to contribute over 13,000 new rooms,
representing 62% of the total new supply of bedroom stock.
HENRY JACKSON, KNIGHT FRANK HEAD OF REGIONAL UK HOTEL AGENCY

UK HOTEL DEVELOPMENT OPPORTUNITIES 2018 RESEARCH
5
Combined with the insatiable demand by global branded operators to build scale, the pool of investors and lenders seizing the opportunity to fund hotel development schemes has widened significantly.
Whilst there are numerous ways to finance a real estate development, we take a look specifically at the alternative funding routes available for development which are becoming more prevalent in the sector.
Forward Purchase AgreementAs highlighted in Figure 6, a development funded via a forward purchase agreement is such that a developer secures an agreement with an investor, during the project’s planning and conception stage, to purchase the property upon completion
Developer agrees to sell the completed development to a purchaser. The agreement is secured at an early stage, most likely pre or during planning.
Purchase price agreed is either a fixed amount or on the value of the development, based on the capitalisation of the rent payable by the tenant.
Pre-let Agreement grantedto tenant by either developer or purchaser.
DeveloperInvestor / Purchaser (Institutional investor)
Agree plans & specifications, provisions to ensure the quality & standard of the development. Timetable for the development, to include a long-stop date for purchaser / tenant to terminate the agreement if development is in breach / becomes insolvent.
Transfer of title to purchaser upon project completion.
Stamp Duty Land Tax payable on the price of the developed land.
Pre Construction Construction
EquityThird party lender funding construction will hold a charge on the property until sales proceeds are available to redeem the loan.
Funds Construction Development Finance
(Repaid from Sales Proceeds)
Practical Completion
TenantHOTEL
£
HOTEL
FIGURE 6
FORWARD PURCHASE AGREEMENT
of construction at either a fixed price or at a price based upon the value of the development. The most likely buyer is that of an institutional investor, with either the developer or the investor securing a pre-let agreement with a tenant.
A forward purchase agreement is attractive to an investor who benefits from taking no risk during the construction, as such only limited construction due diligence is required. A developer will most likely secure development financing from a third party lender who will hold a charge on the property until such a time that the loan is repaid out of the sales proceeds at the time of practical completion. At this stage, the transfer of the title to the purchaser also takes place.
Whilst a forward purchase agreement is likely to offer the largest investor pool and is expected to achieve the highest
Travelodge Portsmouth – under construction, due Spring 2019
6
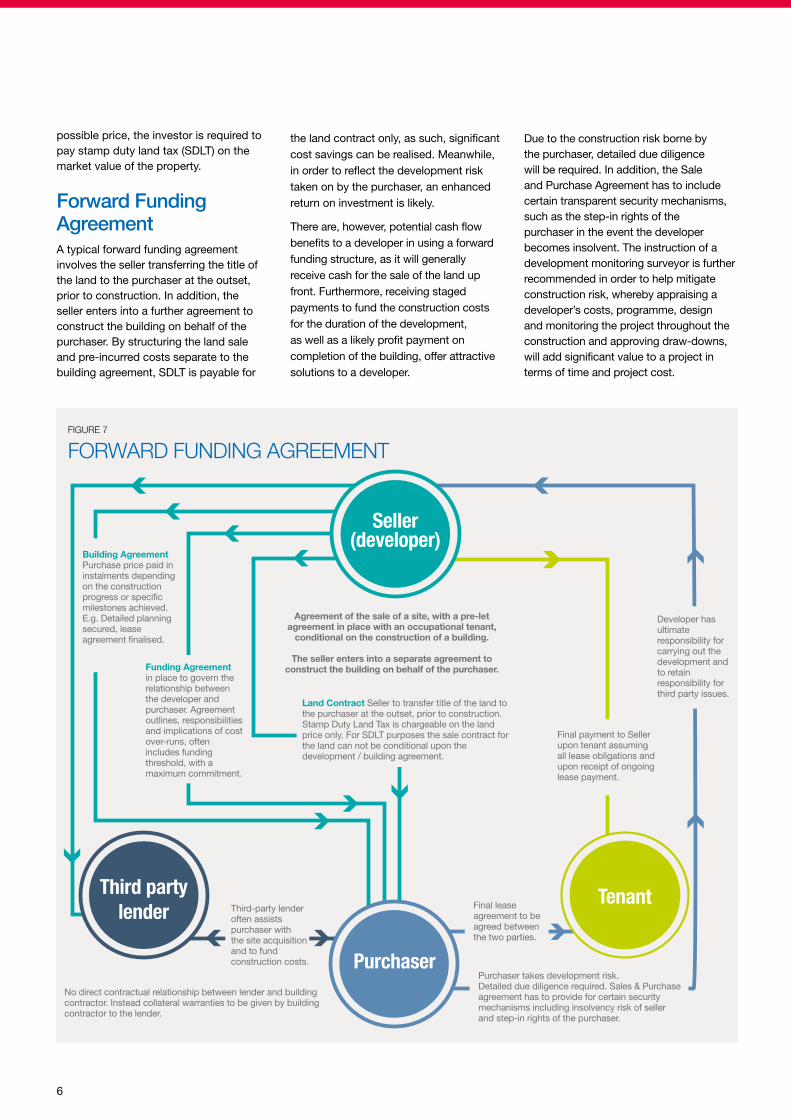
possible price, the investor is required to pay stamp duty land tax (SDLT) on the market value of the property.
Forward Funding AgreementA typical forward funding agreement involves the seller transferring the title of the land to the purchaser at the outset, prior to construction. In addition, the seller enters into a further agreement to construct the building on behalf of the purchaser. By structuring the land sale and pre-incurred costs separate to the building agreement, SDLT is payable for
the land contract only, as such, significant cost savings can be realised. Meanwhile, in order to reflect the development risk taken on by the purchaser, an enhanced return on investment is likely.
There are, however, potential cash flow benefits to a developer in using a forward funding structure, as it will generally receive cash for the sale of the land up front. Furthermore, receiving staged payments to fund the construction costs for the duration of the development, as well as a likely profit payment on completion of the building, offer attractive solutions to a developer.
Due to the construction risk borne by the purchaser, detailed due diligence will be required. In addition, the Sale and Purchase Agreement has to include certain transparent security mechanisms, such as the step-in rights of the purchaser in the event the developer becomes insolvent. The instruction of a development monitoring surveyor is further recommended in order to help mitigate construction risk, whereby appraising a developer’s costs, programme, design and monitoring the project throughout the construction and approving draw-downs, will add significant value to a project in terms of time and project cost.
Third-party lender often assists purchaser with the site acquisition and to fund construction costs.
No direct contractual relationship between lender and building contractor. Instead collateral warranties to be given by building contractor to the lender.
Building Agreement Purchase price paid in instalments depending on the construction progress or specific milestones achieved. E.g. Detailed planning secured, lease agreement finalised.
Funding Agreement in place to govern the relationship between the developer and purchaser. Agreement outlines, responsibilities and implications of cost over-runs, often includes funding threshold, with a maximum commitment.
Land Contract Seller to transfer title of the land to the purchaser at the outset, prior to construction. Stamp Duty Land Tax is chargeable on the land price only. For SDLT purposes the sale contract for the land can not be conditional upon the development / building agreement.
Third partylender Final lease
agreement to be agreed between the two parties.
Developer has ultimate responsibility for carrying out the development and to retain responsibility for third party issues.
Tenant
Purchaser takes development risk. Detailed due diligence required. Sales & Purchase agreement has to provide for certain security mechanisms including insolvency risk of seller and step-in rights of the purchaser.
Purchaser
Seller(developer)
Agreement of the sale of a site, with a pre-let agreement in place with an occupational tenant,
conditional on the construction of a building.
The seller enters into a separate agreement to construct the building on behalf of the purchaser.
Final payment to Seller upon tenant assuming all lease obligations and upon receipt of ongoing lease payment.
FIGURE 7
FORWARD FUNDING AGREEMENT

7
TABLE 1 A sample of hotel development transactions Jan 2017 - May 2018
Development funding Region Number of transactions
Average sales price (£)
Average No. of Rooms
Average price per room (£)
Average initial rent per room (£) Yield
Forward Funding Agreement Regional UK 15 15,000,000 126 118,600 5,800 4.9%
Forward Purchase Agreement Regional UK 3 6,800,000 77 87,900 4,600 5.3%
Two-Cheque deal London 3 74,400,000 251 296,400 12,300 4.1%
Source: Knight Frank Research
A traditional forward funding agreement would typically result in a smaller pool of investors and a softer price than compared to a forward purchase agreement. Nevertheless, forward funding agreements remain a popular route for funding hotel developments, particularly where the seller and tenant are the same corporate entity, thereby providing the opportunity to recycle capital by unlocking value from its freehold sites and deploying investment where it can maximise returns.
Two-Cheque DealA variant and simplified version of the forward funding agreement, whereby one payment is made by the investor to include the land price and pre-incurred costs to date and a second cheque for the balance of the agreed price is payable upon project completion and agreement of the occupational lease. This model further benefits the buyer with the mitigation of SDLT attributable to the land element of the deal only.
Development TransactionsKnight Frank research reveals that in 2017, a total of 18 hotel development transactions took place in the UK, equating to approximately £400 million of investment. The majority of these transactions (98%) involved an agreement with a fixed-lease in place, with deals secured via one of the three alternative funding mechanisms. Of the five fixed-lease deals that took place in London, some £300 million, all involved freehold sites owned by Whitbread. These deals were structured as a means of unlocking value and using Whitbread’s proven strong covenant to structure a fixed-lease investment upon the development’s practical completion.
In 2018, there remains strong demand for hotel developments to be funded through a forward funding or forward commitment agreement. Our analysis reveals some 21 projects either under offer or available,
UK HOTEL DEVELOPMENT OPPORTUNITIES 2018 RESEARCH
hub by Premier Inn London’s Kings Cross (opened June 2017)
Regional UKLondon
3-Star
5-Star4-Star4-Star
2-StarBudgetApartment Unknown
IN 2017, KNIGHT FRANK RESEARCH REVEALS APPROX.
£400 MILLIONOF INVESTMENT TOOK PLACEIN THE UK INVOLVING A HOTEL DEVELOPMENT OPPORTUNITY.
comprising over 2,600 rooms, with a combined project value of over £410 million. Operators entering into lease agreements and fostering partnerships with developers has extended beyond Travelodge and Premier Inn, to include Dalata, Malmaison Hotel du Vin Group, Melia Hotels and Leonardo Hotels.
Based upon the development transactions which completed between January 2017 and May-YTD 2018, Table 1 highlights the average pricing for each type of funding.
8
(
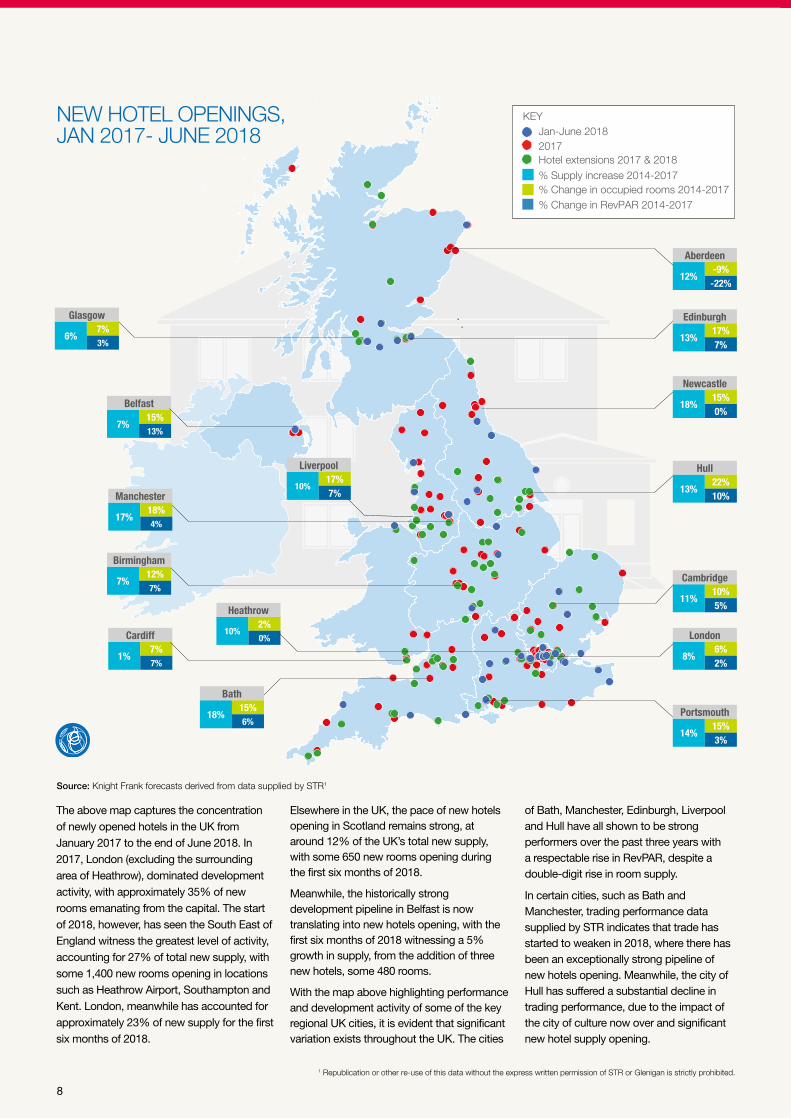
The above map captures the concentration of newly opened hotels in the UK from January 2017 to the end of June 2018. In 2017, London (excluding the surrounding area of Heathrow), dominated development activity, with approximately 35% of new rooms emanating from the capital. The start of 2018, however, has seen the South East of England witness the greatest level of activity, accounting for 27% of total new supply, with some 1,400 new rooms opening in locations such as Heathrow Airport, Southampton and Kent. London, meanwhile has accounted for approximately 23% of new supply for the first six months of 2018.
Elsewhere in the UK, the pace of new hotels opening in Scotland remains strong, at around 12% of the UK’s total new supply, with some 650 new rooms opening during the first six months of 2018.
Meanwhile, the historically strong development pipeline in Belfast is now translating into new hotels opening, with the first six months of 2018 witnessing a 5% growth in supply, from the addition of three new hotels, some 480 rooms.
With the map above highlighting performance and development activity of some of the key regional UK cities, it is evident that significant variation exists throughout the UK. The cities
of Bath, Manchester, Edinburgh, Liverpool and Hull have all shown to be strong performers over the past three years with a respectable rise in RevPAR, despite a double-digit rise in room supply.
In certain cities, such as Bath and Manchester, trading performance data supplied by STR indicates that trade has started to weaken in 2018, where there has been an exceptionally strong pipeline of new hotels opening. Meanwhile, the city of Hull has suffered a substantial decline in trading performance, due to the impact of the city of culture now over and significant new hotel supply opening.
NEW HOTEL OPENINGS, JAN 2017- JUNE 2018
12%-9%-22%
Aberdeen
13%22%10%
Hull
11%10%5%
Cambridge
8%6%2%
London
Jan-June 2018KEY
2017Hotel extensions 2017 & 2018% Supply increase 2014-2017
% Change in RevPAR 2014-2017% Change in occupied rooms 2014-2017
13%17%7%
Edinburgh
6%7%3%
Glasgow
18%15%0%
Newcastle
10%17%7%
Liverpool
7%12%7%
Birmingham
18%15%6%
Bath
17%18%4%
Manchester
14%15%3%
Portsmouth
7%15%13%
Belfast
1%7%7%
Cardiff 10%2%0%
Heathrow
Source: Knight Frank forecasts derived from data supplied by STR1
1 Republication or other re-use of this data without the express written permission of STR or Glenigan is strictly prohibited.
9
UK HOTEL DEVELOPMENT OPPORTUNITIES 2018 RESEARCH
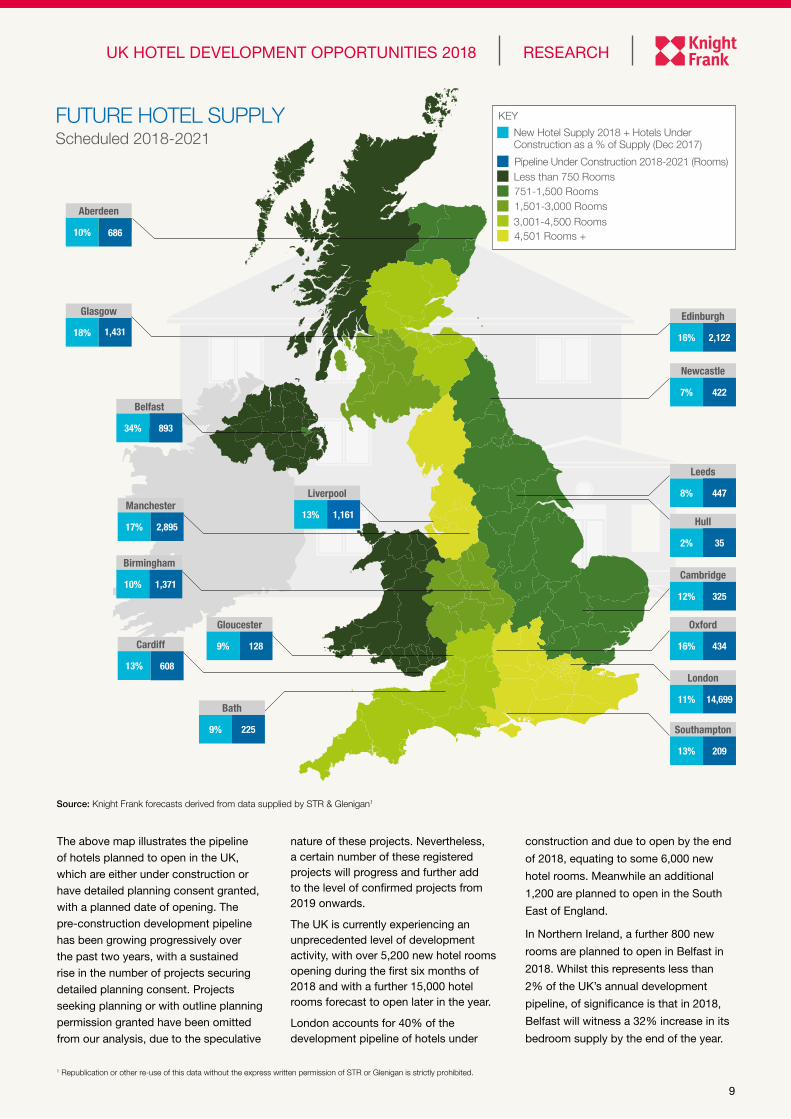
The above map illustrates the pipeline of hotels planned to open in the UK, which are either under construction or have detailed planning consent granted, with a planned date of opening. The pre-construction development pipeline has been growing progressively over the past two years, with a sustained rise in the number of projects securing detailed planning consent. Projects seeking planning or with outline planning permission granted have been omitted from our analysis, due to the speculative
nature of these projects. Nevertheless, a certain number of these registered projects will progress and further add to the level of confirmed projects from 2019 onwards.
The UK is currently experiencing an unprecedented level of development activity, with over 5,200 new hotel rooms opening during the first six months of 2018 and with a further 15,000 hotel rooms forecast to open later in the year.
London accounts for 40% of the development pipeline of hotels under
construction and due to open by the end
of 2018, equating to some 6,000 new
hotel rooms. Meanwhile an additional
1,200 are planned to open in the South
East of England.
In Northern Ireland, a further 800 new
rooms are planned to open in Belfast in
2018. Whilst this represents less than
2% of the UK’s annual development
pipeline, of significance is that in 2018,
Belfast will witness a 32% increase in its
bedroom supply by the end of the year.
FUTURE HOTEL SUPPLY Scheduled 2018-2021
(
KEY
New Hotel Supply 2018 + Hotels Under Construction as a % of Supply (Dec 2017)
Less than 750 Rooms
3,001-4,500 Rooms
751-1,500 Rooms 1,501-3,000 Rooms
Pipeline Under Construction 2018-2021 (Rooms)
4,501 Rooms +10% 686
Aberdeen
2%10%
Hull
35
8%10%
Leeds
447
12% 325
Cambridge
11% 14,699
London
16% 2,122
Edinburgh
7% 422
Newcastle
13% 1,161
Liverpool
17% 2,895
Manchester
13% 209
Southampton
34%3%
Belfast
893
13% 608
Cardiff 16% 434
Oxford
9% 128
Gloucester
Source: Knight Frank forecasts derived from data supplied by STR & Glenigan1
18% 1,431
Glasgow
1 Republication or other re-use of this data without the express written permission of STR or Glenigan is strictly prohibited.
9% 225
Bath
10% 1,371
Birmingham
10
Source: Knight Frank Research & Projections
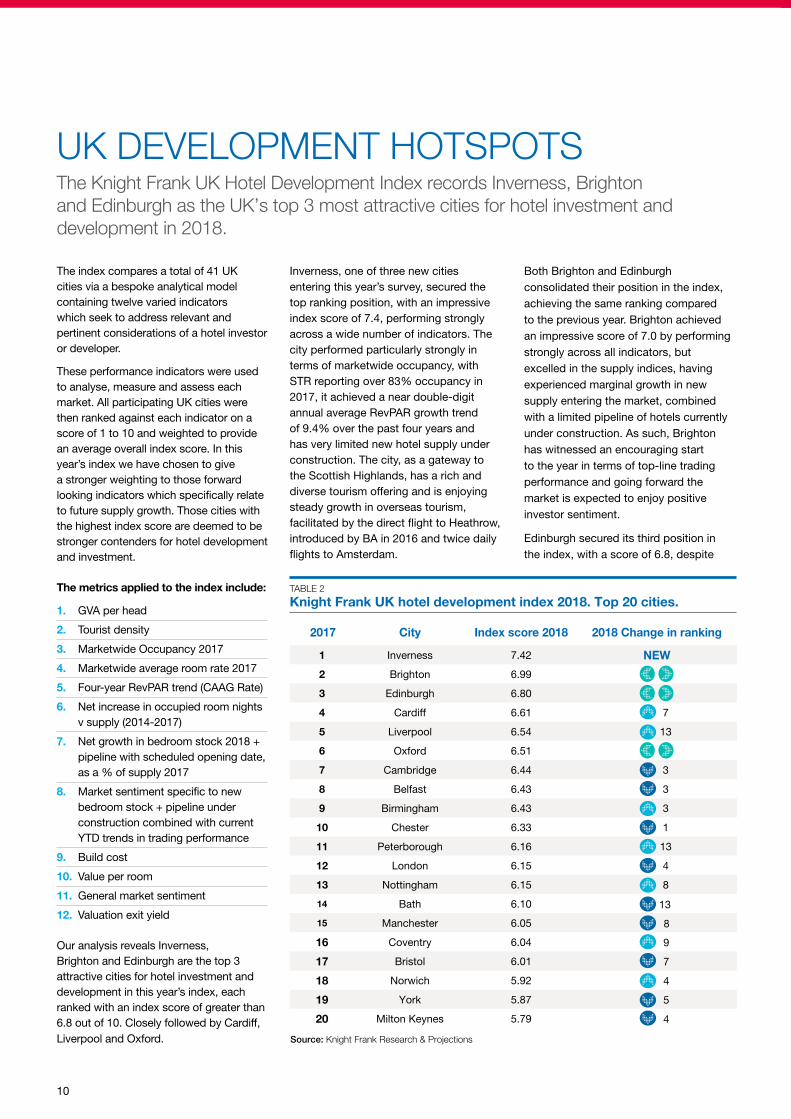
The index compares a total of 41 UK cities via a bespoke analytical model containing twelve varied indicators which seek to address relevant and pertinent considerations of a hotel investor or developer.
These performance indicators were used to analyse, measure and assess each market. All participating UK cities were then ranked against each indicator on a score of 1 to 10 and weighted to provide an average overall index score. In this year’s index we have chosen to give a stronger weighting to those forward looking indicators which specifically relate to future supply growth. Those cities with the highest index score are deemed to be stronger contenders for hotel development and investment.
The metrics applied to the index include:
1. GVA per head
2. Tourist density
3. Marketwide Occupancy 2017
4. Marketwide average room rate 2017
5. Four-year RevPAR trend (CAAG Rate)
6. Net increase in occupied room nights v supply (2014-2017)
7. Net growth in bedroom stock 2018 + pipeline with scheduled opening date, as a % of supply 2017
8. Market sentiment specific to new bedroom stock + pipeline under construction combined with current YTD trends in trading performance
9. Build cost
10. Value per room
11. General market sentiment
12. Valuation exit yield
Our analysis reveals Inverness, Brighton and Edinburgh are the top 3 attractive cities for hotel investment and development in this year’s index, each ranked with an index score of greater than 6.8 out of 10. Closely followed by Cardiff, Liverpool and Oxford.
UK DEVELOPMENT HOTSPOTSThe Knight Frank UK Hotel Development Index records Inverness, Brighton and Edinburgh as the UK’s top 3 most attractive cities for hotel investment and development in 2018.
Inverness, one of three new cities entering this year’s survey, secured the top ranking position, with an impressive index score of 7.4, performing strongly across a wide number of indicators. The city performed particularly strongly in terms of marketwide occupancy, with STR reporting over 83% occupancy in 2017, it achieved a near double-digit annual average RevPAR growth trend of 9.4% over the past four years and has very limited new hotel supply under construction. The city, as a gateway to the Scottish Highlands, has a rich and diverse tourism offering and is enjoying steady growth in overseas tourism, facilitated by the direct flight to Heathrow, introduced by BA in 2016 and twice daily flights to Amsterdam.
TABLE 2 Knight Frank UK hotel development index 2018. Top 20 cities.
2017 City Index score 2018 2018 Change in ranking
1 Inverness 7.42 NEW
2 Brighton 6.99
3 Edinburgh 6.80
4 Cardiff 6.61 7
5 Liverpool 6.54 13
6 Oxford 6.51
7 Cambridge 6.44 3
8 Belfast 6.43 3
9 Birmingham 6.43 3
10 Chester 6.33 1
11 Peterborough 6.16 13
12 London 6.15 4
13 Nottingham 6.15 8
14 Bath 6.10 13
15 Manchester 6.05 8
16 Coventry 6.04 9
17 Bristol 6.01 7
18 Norwich 5.92 4
19 York 5.87 5
20 Milton Keynes 5.79 4
Both Brighton and Edinburgh consolidated their position in the index, achieving the same ranking compared to the previous year. Brighton achieved an impressive score of 7.0 by performing strongly across all indicators, but excelled in the supply indices, having experienced marginal growth in new supply entering the market, combined with a limited pipeline of hotels currently under construction. As such, Brighton has witnessed an encouraging start to the year in terms of top-line trading performance and going forward the market is expected to enjoy positive investor sentiment.
Edinburgh secured its third position in the index, with a score of 6.8, despite
11
UK HOTEL DEVELOPMENT OPPORTUNITIES 2018 RESEARCH
0
2,000
4,000
6,000
8,000
10,000
12,000
14,000
16,000
18,000
0.0%
2.0%
4.0%
6.0%
8.0%
10.0%
12.0%
14.0%
16.0%
Lond
on
Scot
land
Nort
h W
est
Engl
and
Sout
h Ea
st E
ngla
nd
Sout
h W
est
Eng
land
Wes
t Mid
land
s
York
shire
&
The
Hum
ber
Wal
es
East
Mid
land
s
East
of E
ngla
nd
Nort
h Ea
st E
ngla
nd
Nort
hern
Irel
and
Pipe
line
% o
f exi
stin
g su
pply
Pipe
line
by n
umbe
r of r
oom
s
Total pipeline with planned opening date Pipeline % of existing supply
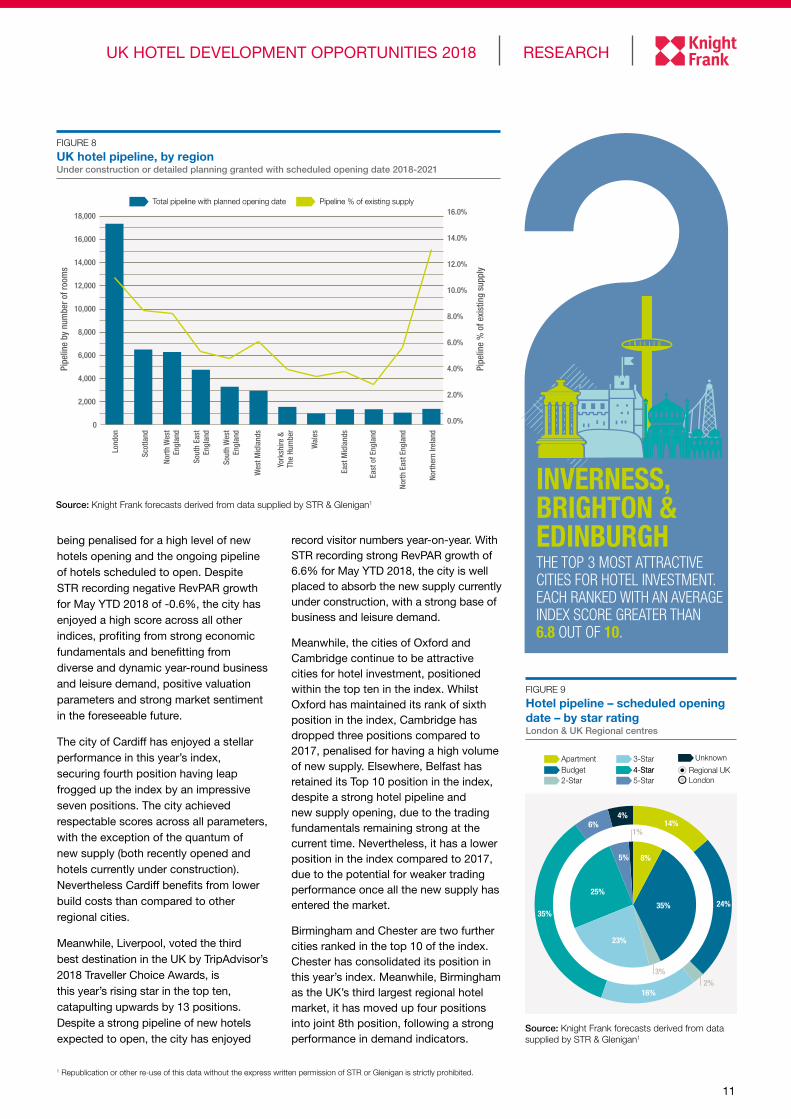
FIGURE 8
UK hotel pipeline, by region Under construction or detailed planning granted with scheduled opening date 2018-2021
Source: Knight Frank forecasts derived from data supplied by STR & Glenigan1
Regional UKLondon
3-Star
5-Star4-Star4-Star
2-StarBudgetApartment Unknown
24%
16%
35%
6% 14%
35%
25%
8%
23%
5%
3%
1%
2%
4%
FIGURE 9
Hotel pipeline – scheduled opening date – by star rating London & UK Regional centres
being penalised for a high level of new hotels opening and the ongoing pipeline of hotels scheduled to open. Despite STR recording negative RevPAR growth for May YTD 2018 of -0.6%, the city has enjoyed a high score across all other indices, profiting from strong economic fundamentals and benefitting from diverse and dynamic year-round business and leisure demand, positive valuation parameters and strong market sentiment in the foreseeable future.
The city of Cardiff has enjoyed a stellar performance in this year’s index, securing fourth position having leap frogged up the index by an impressive seven positions. The city achieved respectable scores across all parameters, with the exception of the quantum of new supply (both recently opened and hotels currently under construction). Nevertheless Cardiff benefits from lower build costs than compared to other regional cities.
Meanwhile, Liverpool, voted the third best destination in the UK by TripAdvisor’s 2018 Traveller Choice Awards, is this year’s rising star in the top ten, catapulting upwards by 13 positions. Despite a strong pipeline of new hotels expected to open, the city has enjoyed
record visitor numbers year-on-year. With STR recording strong RevPAR growth of 6.6% for May YTD 2018, the city is well placed to absorb the new supply currently under construction, with a strong base of business and leisure demand.
Meanwhile, the cities of Oxford and Cambridge continue to be attractive cities for hotel investment, positioned within the top ten in the index. Whilst Oxford has maintained its rank of sixth position in the index, Cambridge has dropped three positions compared to 2017, penalised for having a high volume of new supply. Elsewhere, Belfast has retained its Top 10 position in the index, despite a strong hotel pipeline and new supply opening, due to the trading fundamentals remaining strong at the current time. Nevertheless, it has a lower position in the index compared to 2017, due to the potential for weaker trading performance once all the new supply has entered the market.
Birmingham and Chester are two further cities ranked in the top 10 of the index. Chester has consolidated its position in this year’s index. Meanwhile, Birmingham as the UK’s third largest regional hotel market, it has moved up four positions into joint 8th position, following a strong performance in demand indicators.
Source: Knight Frank forecasts derived from data supplied by STR & Glenigan1
INVERNESS,BRIGHTON & EDINBURGHTHE TOP 3 MOST ATTRACTIVE CITIES FOR HOTEL INVESTMENT. EACH RANKED WITH AN AVERAGE INDEX SCORE GREATER THAN 6.8 OUT OF 10.
EDINBURGH, INVERNESS, BELFAST, BATH & LONDON THE TOP 5 MOST ATTRACTIVE CITIES FOR HOTEL INVESTMENT. ALL RANKED WITH AN AVERAGE INDEX SCORE GREATER THAN SEVEN OUT OF TEN .
Regional UKLondon
3-Star
5-Star4-Star4-Star
2-StarBudgetApartment Unknown
3 attractive cities for hotel investment and development in this year’s index, each ranked with an average index score of greater than 6.8 out of 10.
1 Republication or other re-use of this data without the express written permission of STR or Glenigan is strictly prohibited.
12
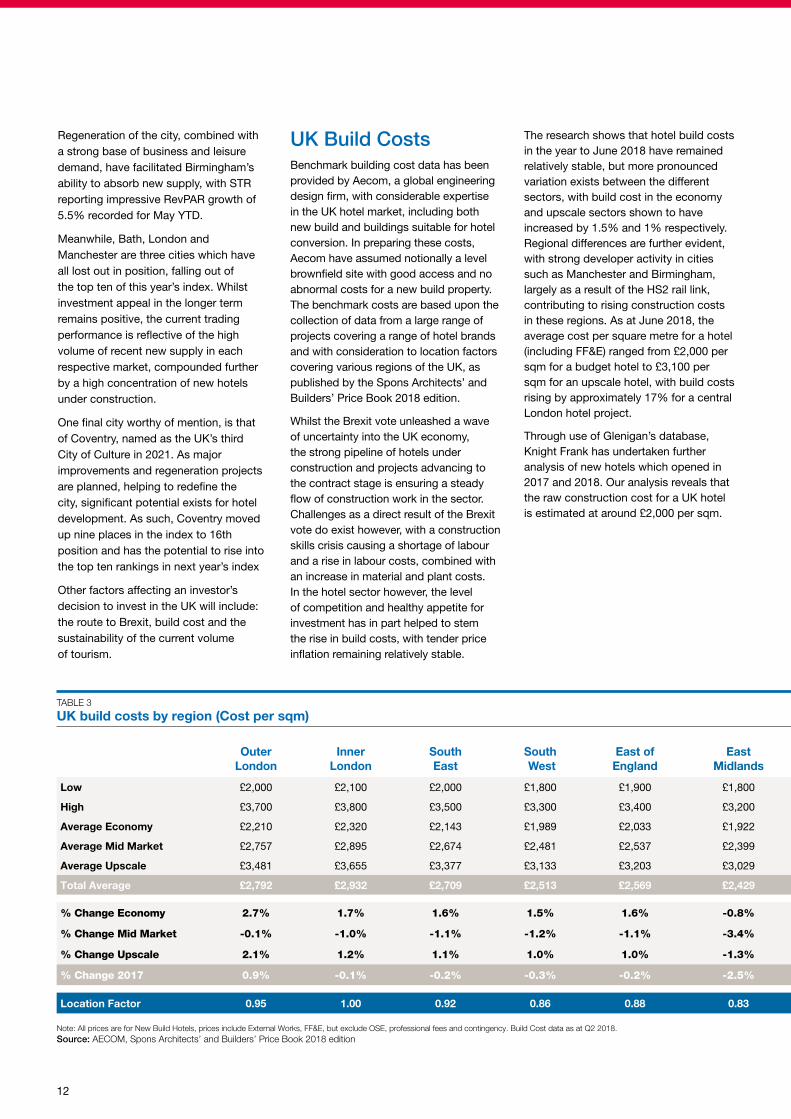
TABLE 3 UK build costs by region (Cost per sqm)
Outer London
Inner London
South East
South West
East of England
East Midlands
West Midlands
North West
Yorkshire & Humberside
North East
Scotland WalesNorthern Ireland
UK
Low £2,000 £2,100 £2,000 £1,800 £1,900 £1,800 £1,800 £1,800 £1,800 £1,700 £1,800 £1,800 £1,600 £1,600
High £3,700 £3,800 £3,500 £3,300 £3,400 £3,200 £3,300 £3,300 £3,200 £3,100 £3,200 £3,100 £2,800 £3,800
Average Economy £2,210 £2,320 £2,143 £1,989 £2,033 £1,922 £1,967 £1,967 £1,922 £1,856 £1,945 £1,900 £1,679 £1,989
Average Mid Market £2,757 £2,895 £2,674 £2,481 £2,537 £2,399 £2,454 £2,454 £2,399 £2,316 £2,426 £2,371 £2,095 £2,481
Average Upscale £3,481 £3,655 £3,377 £3,133 £3,203 £3,029 £3,098 £3,098 £3,029 £2,924 £3,063 £2,994 £2,646 £3,133
Total Average £2,792 £2,932 £2,709 £2,513 £2,569 £2,429 £2,485 £2,485 £2,429 £2,346 £2,457 £2,402 £2,122 £2,513
% Change Economy 2.7% 1.7% 1.6% 1.5% 1.6% -0.8% 3.8% 2.7% 1.5% 0.3% 0.4% 0.3% 2.7% 1.5%
% Change Mid Market -0.1% -1.0% -1.1% -1.2% -1.1% -3.4% 1.1% -0.1% -1.2% -2.4% -2.3% -2.3% -0.1% -1.2%
% Change Upscale 2.1% 1.2% 1.1% 1.0% 1.0% -1.3% 3.3% 2.1% 1.0% -0.2% -0.1% -0.2% 2.1% 1.0%
% Change 2017 0.9% -0.1% -0.2% -0.3% -0.2% -2.5% 2.0% 0.9% -0.3% -1.5% -1.4% -1.4% 0.9% -0.3%
Location Factor 0.95 1.00 0.92 0.86 0.88 0.83 0.85 0.85 0.83 0.80 0.84 0.82 0.72
Note: All prices are for New Build Hotels, prices include External Works, FF&E, but exclude OSE, professional fees and contingency. Build Cost data as at Q2 2018. Source: AECOM, Spons Architects’ and Builders’ Price Book 2018 edition
Regeneration of the city, combined with a strong base of business and leisure demand, have facilitated Birmingham’s ability to absorb new supply, with STR reporting impressive RevPAR growth of 5.5% recorded for May YTD.
Meanwhile, Bath, London and Manchester are three cities which have all lost out in position, falling out of the top ten of this year’s index. Whilst investment appeal in the longer term remains positive, the current trading performance is reflective of the high volume of recent new supply in each respective market, compounded further by a high concentration of new hotels under construction.
One final city worthy of mention, is that of Coventry, named as the UK’s third City of Culture in 2021. As major improvements and regeneration projects are planned, helping to redefine the city, significant potential exists for hotel development. As such, Coventry moved up nine places in the index to 16th position and has the potential to rise into the top ten rankings in next year’s index
Other factors affecting an investor’s decision to invest in the UK will include: the route to Brexit, build cost and the sustainability of the current volume of tourism.
The research shows that hotel build costs in the year to June 2018 have remained relatively stable, but more pronounced variation exists between the different sectors, with build cost in the economy and upscale sectors shown to have increased by 1.5% and 1% respectively. Regional differences are further evident, with strong developer activity in cities such as Manchester and Birmingham, largely as a result of the HS2 rail link, contributing to rising construction costs in these regions. As at June 2018, the average cost per square metre for a hotel (including FF&E) ranged from £2,000 per sqm for a budget hotel to £3,100 per sqm for an upscale hotel, with build costs rising by approximately 17% for a central London hotel project.
Through use of Glenigan’s database, Knight Frank has undertaken further analysis of new hotels which opened in 2017 and 2018. Our analysis reveals that the raw construction cost for a UK hotel is estimated at around £2,000 per sqm.
UK Build CostsBenchmark building cost data has been provided by Aecom, a global engineering design firm, with considerable expertise in the UK hotel market, including both new build and buildings suitable for hotel conversion. In preparing these costs, Aecom have assumed notionally a level brownfield site with good access and no abnormal costs for a new build property. The benchmark costs are based upon the collection of data from a large range of projects covering a range of hotel brands and with consideration to location factors covering various regions of the UK, as published by the Spons Architects’ and Builders’ Price Book 2018 edition.
Whilst the Brexit vote unleashed a wave of uncertainty into the UK economy, the strong pipeline of hotels under construction and projects advancing to the contract stage is ensuring a steady flow of construction work in the sector. Challenges as a direct result of the Brexit vote do exist however, with a construction skills crisis causing a shortage of labour and a rise in labour costs, combined with an increase in material and plant costs. In the hotel sector however, the level of competition and healthy appetite for investment has in part helped to stem the rise in build costs, with tender price inflation remaining relatively stable.
13
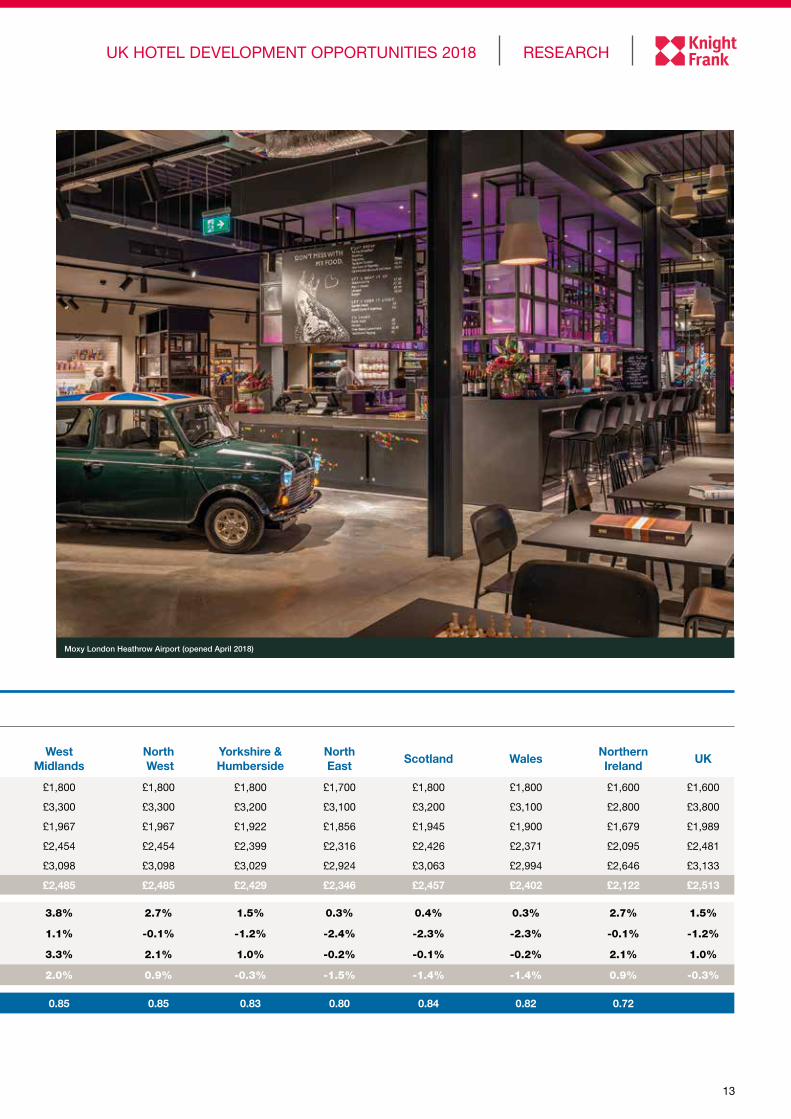
TABLE 3 UK build costs by region (Cost per sqm)
Outer London
Inner London
South East
South West
East of England
East Midlands
West Midlands
North West
Yorkshire & Humberside
North East
Scotland WalesNorthern Ireland
UK
Low £2,000 £2,100 £2,000 £1,800 £1,900 £1,800 £1,800 £1,800 £1,800 £1,700 £1,800 £1,800 £1,600 £1,600
High £3,700 £3,800 £3,500 £3,300 £3,400 £3,200 £3,300 £3,300 £3,200 £3,100 £3,200 £3,100 £2,800 £3,800
Average Economy £2,210 £2,320 £2,143 £1,989 £2,033 £1,922 £1,967 £1,967 £1,922 £1,856 £1,945 £1,900 £1,679 £1,989
Average Mid Market £2,757 £2,895 £2,674 £2,481 £2,537 £2,399 £2,454 £2,454 £2,399 £2,316 £2,426 £2,371 £2,095 £2,481
Average Upscale £3,481 £3,655 £3,377 £3,133 £3,203 £3,029 £3,098 £3,098 £3,029 £2,924 £3,063 £2,994 £2,646 £3,133
Total Average £2,792 £2,932 £2,709 £2,513 £2,569 £2,429 £2,485 £2,485 £2,429 £2,346 £2,457 £2,402 £2,122 £2,513
% Change Economy 2.7% 1.7% 1.6% 1.5% 1.6% -0.8% 3.8% 2.7% 1.5% 0.3% 0.4% 0.3% 2.7% 1.5%
% Change Mid Market -0.1% -1.0% -1.1% -1.2% -1.1% -3.4% 1.1% -0.1% -1.2% -2.4% -2.3% -2.3% -0.1% -1.2%
% Change Upscale 2.1% 1.2% 1.1% 1.0% 1.0% -1.3% 3.3% 2.1% 1.0% -0.2% -0.1% -0.2% 2.1% 1.0%
% Change 2017 0.9% -0.1% -0.2% -0.3% -0.2% -2.5% 2.0% 0.9% -0.3% -1.5% -1.4% -1.4% 0.9% -0.3%
Location Factor 0.95 1.00 0.92 0.86 0.88 0.83 0.85 0.85 0.83 0.80 0.84 0.82 0.72
UK HOTEL DEVELOPMENT OPPORTUNITIES 2018 RESEARCH
Moxy London Heathrow Airport (opened April 2018)
14
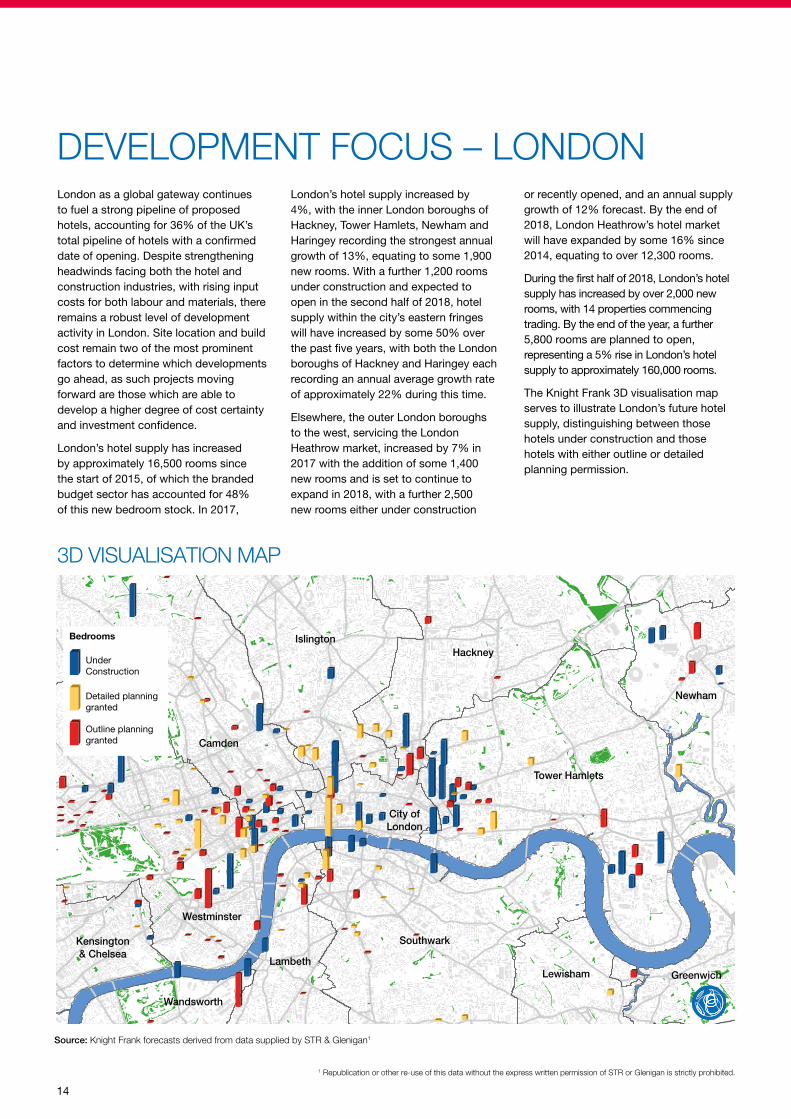
London as a global gateway continues to fuel a strong pipeline of proposed hotels, accounting for 36% of the UK’s total pipeline of hotels with a confirmed date of opening. Despite strengthening headwinds facing both the hotel and construction industries, with rising input costs for both labour and materials, there remains a robust level of development activity in London. Site location and build cost remain two of the most prominent factors to determine which developments go ahead, as such projects moving forward are those which are able to develop a higher degree of cost certainty and investment confidence.
London’s hotel supply has increased by approximately 16,500 rooms since the start of 2015, of which the branded budget sector has accounted for 48% of this new bedroom stock. In 2017,
DEVELOPMENT FOCUS – LONDONLondon’s hotel supply increased by 4%, with the inner London boroughs of Hackney, Tower Hamlets, Newham and Haringey recording the strongest annual growth of 13%, equating to some 1,900 new rooms. With a further 1,200 rooms under construction and expected to open in the second half of 2018, hotel supply within the city’s eastern fringes will have increased by some 50% over the past five years, with both the London boroughs of Hackney and Haringey each recording an annual average growth rate of approximately 22% during this time.
Elsewhere, the outer London boroughs to the west, servicing the London Heathrow market, increased by 7% in 2017 with the addition of some 1,400 new rooms and is set to continue to expand in 2018, with a further 2,500 new rooms either under construction
or recently opened, and an annual supply growth of 12% forecast. By the end of 2018, London Heathrow’s hotel market will have expanded by some 16% since 2014, equating to over 12,300 rooms.
During the first half of 2018, London’s hotel supply has increased by over 2,000 new rooms, with 14 properties commencing trading. By the end of the year, a further 5,800 rooms are planned to open, representing a 5% rise in London’s hotel supply to approximately 160,000 rooms.
The Knight Frank 3D visualisation map serves to illustrate London’s future hotel supply, distinguishing between those hotels under construction and those hotels with either outline or detailed planning permission.
Camden
IslingtonHackney
Tower Hamlets
GreenwichLewisham
Southwark
Lambeth
Wandsworth
Westminster
Kensington& Chelsea
City ofLondon
Newham
3D VISUALISATION MAP
Source: Knight Frank forecasts derived from data supplied by STR & Glenigan1
Under Construction
Detailed planninggranted
Outline planninggranted
Bedrooms
1 Republication or other re-use of this data without the express written permission of STR or Glenigan is strictly prohibited.

15
Whilst Brexit uncertainty may dampen confidence and growth, and currency-induced inflation may impact upon consumer spending, from the perspective of a private, international real estate investor, with a long-term view to investment, this environment can lead to new, exciting opportunities. Despite rising costs and signs of an increasingly challenging operating market, the pace of hotel development continues to be strong and investor appetite remains positive.
Having access to accurate data and current, relevant sector insight is one tool to help navigate the challenges of today’s business environment. Furthermore, processing this intelligence will help provide the vision and awareness that in turn will facilitate the process in making a smart investment decision, thereby providing a greater degree of cost certainty and investment confidence. Competition for development sites remains fierce, but rightly so as choosing the right location for a hotel is critical to delivering a profit and the return on
KNIGHT FRANK VIEWcapital. Other critical factors however, which further lend themselves to making a smart investment decision and deliver compelling and superior returns to an investor include: the construction cost and the importance placed upon value engineering and innovation, the product, the brand, management, operational structure, quality of service and the return on capital employed.
Many institutional investors who opted to diversify their portfolios by investing in hotels at a time when the sector was not yet considered mainstream, now find themselves holding well performing assets, which have benefitted from yield compression. As institutional investors typically hold their investment interest for the mid-to long term, the volume of new build hotels post completion coming to market is relatively limited. With demand for fixed lease hotel interests backed by strong covenants, continuing to grow, institutional investors are increasingly willing to invest at the embryonic stage, choosing the route of new-build, hotel development. As such, the branded
budget hotel sector is able to deliver a strong pipeline of hotels, with the sector regarded an attractive investment, offering a well-defined, robust, good quality, low cost product.
Furthermore, operators and developers are increasingly seeking out cities benefiting from significant regeneration and with the UK staycation market continuing to strengthen, the potential for alternative funded hotel development sites can only be in one direction, upwards.
A solid base of low-risk, long-term investment will continue to remain a key investment criteria in a diversified portfolio. However, with strong returns and increased confidence and understanding of the sector, institutional investors are more likely to fund developments with greater operational risk. The route of franchised and/or managed hotels post practical completion of select-service and full service properties is likely to be a growing trend to watch out for.
TABLE 4 Hotel supply analysis by London borough – existing supply & pipeline
London Borough% Supply Change
Dec 2015 v June 2018
Q2 2018 London Market Share
(by number of rooms)
Hotel Pipeline with Scheduled Date of Opening as a % of Existing Supply (by Rooms)
Number of rooms in pipeline
2018-2021
CAAG % 2013- Forecast FY 2018
Westminster/City of london 5.2% 31.4% 9.3% 4,440 2.3%
Kensington & Chelsea/Hammersmith & Fulham 1.3% 12.0% 1.9% 336 1.1%
Camden/Islington 7.3% 13.8% 4.2% 880 3.1%
Lambeth/Southwark/Wandsworth/Lewisham 10.3% 8.9% 9.6% 1,285 5.9%
Hackney/Tower Hamlets/Newham/Haringey 24.9% 10.5% 25.6% 4,071 8.1%
Outer London West 15.5% 14.1% 18.5% 3,942 6.0%
Outer London North 18.5% 1.1% 0.0% 0 4.9%
Outer London East 10.4% 3.2% 11.6% 558 7.6%
Outer London South 12.0% 5.1% 7.7% 599 4.9%
Total 7.8% 100.0% 10.6% 16,111 3.9%
Inner London 7.8% 76.5% 9.5% 11,012 3.3%
Outer London 14.2% 23.5% 14.3% 5,099 5.9%
Source: Knight Frank forecasts derived from data supplied by STR & Glenigan1
UK HOTEL DEVELOPMENT OPPORTUNITIES 2018 RESEARCH
1 Republication or other re-use of this data without the express written permission of STR or Glenigan is strictly prohibited.

Important Notice
© Knight Frank LLP 2018 – This report is published for general information only and not to be relied upon in any way. Knight Frank LLP (and its Affiliates, Members and Employees) will have no responsibility or liability whatsoever for any loss or damage resultant from any use of, reliance on or reference to the contents of this document. The information contained herein, does not purport to be comprehensive and is strictly for information purposes only. Any expression of opinions contained within the report are subject to change without notice. No party should treat any of the contents herein as advice. Reproduction of this report in whole or in part is not allowed without prior written approval of Knight Frank LLP to the form and content within which it appears. Knight Frank LLP is a limited liability partnership registered in England with registered number OC305934. Our registered office is 55 Baker Street, London W1U 8AN, where you may look at a list of members’ name.
HOTEL RESEARCH
Philippa Goldstein Hotel Analyst, +44 (0) 203 826 0600 [email protected]
HOTELS
Julian Evans FRICS Head of Healthcare, Hotels & Leisure +44 (0) 20 7861 1147 [email protected]
Henry Jackson MRICS Partner - UK Regional Hotel Agency +44 (0) 20 7861 1085 [email protected]
Karen Callahan MRICS Partner - Hotel Valuation & Advisory +44 (0) 20 7861 1086 [email protected]
Charles Fletcher MRICS Partner – Specialist Property Investment +44 (0) 20 7861 1450 [email protected]
Charles Ingram Evans MRICS Partner – Department Head, Project and Building Consultancy +44 (0) 20 3826 0688 [email protected]
Knight Frank Research Reports are available at KnightFrank.com/Research
UK Hotel Trading Performance Review 2017
RECENT MARKET-LEADING RESEARCH PUBLICATIONS
UK Hotel Capital Markets Investment Review - 2018
UK HOTEL CAPITAL MARKETS INVESTMENT REVIEW 2018
HIGHLIGHTS
RESEARCH
UK Hotel investment totalled £5.5 billion in 2017, with Regional UK representing 56% of total investment
Private equity investors ranked as the top investor type with investment totalling approximately £1.5 billion
Overseas investors accounted for over £2.3 billion of investment, with a growing acceptance to deploy funds into prime regional UK cities
HIGHLIGHTS (12-MONTH PERIOD SEPTEMBER-AUGUST 2016/17)
London’s GOPPAR up 5.8%, driven by strong growth in the Average Room Rate.
Regional UK Hotels average a Gross Operating Profit of 32% compared to 45.5% in London.
Payroll costs continue to rise and equate to 24% of Total Revenue in London and 31% in Regional UK.
RESEARCH
2017
UK HOTEL TRADING PERFORMANCE REVIEW
SPECIALIST PROPERTYTHE HUMAN FACTOR
2018
RESEARCH
OVERVIEW OPPORTUNITIES OUTLOOK
Specialist Property Report 2018
Knight Frank Research provides strategic advice, consultancy services and forecasting to a wide range of clients worldwide including developers, investors, funding organisations, corporate institutions and the public sector. All our clients recognise the need for expert independent advice customised to their specific needs.
We would like to thank the teams at STR, AECOM and Glenigan who have helped us research this publication, without access to the data the detail provided in this publication would not have been possible.
Republication or other re-use of data provided by STR, without their express written permission is strictly prohibited. For further information please refer to www.ampmhotels.com
Republication or other re-use of data acquired from the Glenigan database, without their written consent is strictly prohibited. For further information please refer to www.glenigan.com
Front Cover Picture: Wilde Aparthotels by Staycity – The Strand, London, opened March 2018.
UK Hotel & Leisure Property 2018, Spring Market Overview
A
UK HOTEL & LEISURE PROPERTY 2018
SPRING MARKET OVERVIEW