residency and movement patterns of cuvier’s beaked whales
TRANSCRIPT

MARINE ECOLOGY PROGRESS SERIESMar Ecol Prog Ser
Vol. 660: 203–216, 2021https://doi.org/10.3354/meps13593
Published February 18
1. INTRODUCTION
Cuvier’s beaked whales Ziphius cavirostris are cos-mopolitan members of the family of beaked whales,Ziphiidae, which frequent shelf edge and continentalslope waters (Waring et al. 2001, Tyack et al. 2006).The species is the deepest-diving air-breathing ver-tebrate, with dives to 3567 m that can last over 2 h
(Schorr et al. 2014, Shearer et al. 2019). Cuvier’sbeaked whales forage during dives to depths greaterthan 800 m, each followed by a series of shorter sub-mergences to depths less than 400 m (Baird et al.2006, Tyack et al. 2006, Shearer et al. 2019). Theseanimals feed on meso- and bentho-pelagic cephalo -pods, fish, and crustaceans (Waring et al. 2001, Westet al. 2017), and when foraging in slope areas, it is
© The authors 2021. Open Access under Creative Commons byAttribution Licence. Use, distribution and reproduction are un -restricted. Authors and original publication must be credited.
Publisher: Inter-Research · www.int-res.com
*Corresponding author: [email protected]
Residency and movement patterns of Cuvier’s beaked whales Ziphius cavirostris off
Cape Hatteras, North Carolina, USA
Heather J. Foley1,2,*, Krishna Pacifici2, Robin W. Baird3, Daniel L. Webster3, Zachary T. Swaim1, Andrew J. Read1
1Duke University Marine Laboratory, Duke University, 135 Duke Marine Lab Road, Beaufort, NC 28516, USA2Department of Forestry and Environmental Resources, Program in Fisheries, Wildlife and Conservation Biology,
North Carolina State University, Raleigh, NC 27695, USA3Cascadia Research Collective, 218 1/2 West 4th Avenue, Olympia, WA 98501, USA
ABSTRACT: Cuvier’s beaked whales Ziphius cavirostris are wide-ranging, deep-diving cetaceansthat are particularly sensitive to anthropogenic noise. Current stock assessments assume a singlepopulation in the western North Atlantic Ocean, but knowledge of the residency patterns and dis-tribution of the species is currently lacking in the region. Here we describe the spatial ecology of20 Cuvier’s beaked whales equipped with satellite-linked tags off Cape Hatteras, North Carolina,USA, between 2014 and 2017. We applied a hierarchical switching state-space model to filterlocation estimates and define behavioral states of area-restricted search (ARS) and transit. Weused kernel density estimation to identify high use areas, and net squared displacement analysesto assess residency. The vast majority (96%) of locations were classified as ARS behavior, suggest-ing that tagged whales allocated much of their time to foraging. Maximum net displacement hada sample median of 50 km, and 81% of individual whales were classified as demonstrating a res-ident, or ‘home range,’ movement pattern. Overall, our research indicates a localized populationof Cuvier’s beaked whales occupying the area off Cape Hatteras. The tagged animals demon-strated a small, defined core use area and exhibited little displacement from the region. Thesepatterns of movement and spatial use can inform future conservation and management of thisspecies, which is vulnerable to anthropogenic disturbances caused by several sources, includingmid-frequency active sonar and seismic exploration.
KEY WORDS: Cuvier’s beaked whale · Ziphius cavirostris · Satellite telemetry · Residency · Sitefidelity · Spatial ecology · Biologging · State-space modeling · Net squared displacement
OPENPEN ACCESSCCESS

Mar Ecol Prog Ser 660: 203–216, 2021204
believed that fixed bathymetric features includingcanyons, shelf edges, and seamounts serve to con-centrate and/or aggregate their prey (Moulins et al.2007, Moors-Murphy 2014). In the western North At-lantic, the species is also found in association withwarm-core rings and other ephemeral oceanographicfeatures affiliated with the Gulf Stream, leading tohigh densities in these areas (Waring et al. 2016).
Due to their response to naval mid-frequencyactive sonar (MFAS), which has been known tocause mass and single strandings, Cuvier’s beakedwhales are of particular conservation concern (Coxet al. 2006, D’Amico et al. 2009, Tyack et al. 2011,DeRuiter et al. 2013, Simonis et al. 2020). Behavioralresponse studies, conducted using controlled expo-sure experiments (CEEs) in the Bahamas, Norway,and southern California, have demonstrated thatthe species is particularly sensitive to acoustic dis-turbance (Southall et al. 2016). During these experi-ments, focal individuals reacted strongly to simu-lated sonar signals by interrupting foraging divesand moving away from the sound source, often overtens of kilometers and for several days (Tyack et al.2011). These substantive behavioral modificationscould result in significant fitness costs (Tyack et al.2011, DeRuiter et al. 2013). Therefore, a better un -derstanding of baseline patterns of movement andforaging ecology of Cuvier’s beaked whales couldhelp place these behavioral responses to MFASwithin an ecological context, and better define miti-gation strategies for acoustic disturbances to thespecies throughout its range.
Previous studies in the Ligurian Sea, Canary Is -lands, Hawai‘i, and southern California have de -monstrated that Cuvier’s beaked whale populationsexhibit high degrees of site fidelity (McSweeney etal. 2007, Schorr et al. 2014, Falcone et al. 2017, Reyes2017, Baird 2019). In the western North Atlantic, asingle stock is currently recognized for the species(Waring et al. 2016). However, the continental slopewaters off Cape Hatteras, North Carolina, USA,appear to be particularly important habitat, withoccupancy and site fidelity demonstrated betweenseasons and years (Forney et al. 2017, Waples & Read2020). The species is present in high densities year-round in this area, with substantially fewer visualand acoustic detections in Norfolk Canyon to thenorth and Onslow Bay to the south (Stanistreet et al.2017, McLellan et al. 2018).
The western North Atlantic is an increasingly noisyenvironment (Weilgart 2007, Hildebrand 2009,Stanistreet et al. 2017). Cetaceans in this region mustcope with the sounds of shipping traffic, naval exer-
cises using MFAS, and potential offshore energy ex -ploration (Schick et al. 2011). Given the particularsensitivity of Cuvier’s beaked whales to anthro-pogenic noise, we wanted to gain a better under-standing of the home ranges and spatial use patternsof the species in this region, which is in close proxim-ity to the largest naval base in the world (Norfolk,Virginia), as well as an area where future seismicexploration is likely (Weilgart 2007, Schick et al.2011, Forney et al. 2017).
Analysis of residency in cetaceans often employscapture−recapture methods based on photo-identifi-cation. However, due to the infrequency of sightingsof this species, obtaining sufficient photos to examinelong-term site fidelity can take many years (e.g.Baird 2019). The use of satellite-linked tags permitstracking of animals over weeks and months, allowingboth movement and residency patterns to be ana-lyzed at fine scales (Hussey et al. 2015, Hays et al.2016). No dedicated studies of the home ranges ormovement patterns of Cuvier’s beaked whales havebeen conducted to date in the western NorthAtlantic.
Here we sought to establish a baseline of the spa-tial ecology of Cuvier’s beaked whales off Cape Hat-teras, using data from 20 individuals satellite-taggedbetween 2014 and 2017. Our primary objective wasto establish the geographic range and residency ofthe population. Based on work conducted in otherareas (McSweeney et al. 2007, DeRuiter et al. 2013,Falcone et al. 2017, Baird 2019), we hypothesizedthat Cuvier’s beaked whales would demonstratehigh site fidelity to the area and relatively smallhome range sizes.
2. MATERIALS AND METHODS
2.1. Study area
The study area includes the outer continentalshelf and slope waters off Cape Hatteras, NorthCarolina, USA (Fig. 1). The continental shelf is rela-tively narrow at Cape Hatteras, and the slope isquite steep, with depth increasing from 200 to>1500 m in less than 10 km (Mullin & Fulling 2003).The Gulf Stream is the dominant oceanographicfeature in the area, forming the largest frontal sys-tem in the North Atlantic (Chambault et al. 2017).The primary study region was ‘The Point,’ wherethe Gulf Stream flow peels off the continental shelf,heading northeast into pelagic waters (Forney et al.2017).
Foley et al.: Cuvier’s beaked whale residency and movement 205
2.2. Spatial use
2.2.1. Telemetry
We deployed satellite-linked tags in the Low Im -pact Minimally Percutaneous External-electronicsTransmitter (LIMPET) configuration (Andrews et al.2008, Baird et al. 2010, 2011a) using a pneumatic riflefrom a 9.1 m aluminum-hulled vessel. The tags weredeployed into or just below the dorsal fin of 20Cuvier’s beaked whales between 2014 and 2017. Asdescribed by Thorne et al. (2017), the tags wereattached using 2 titanium darts (6.7 cm) with back-ward facing petals. We attempted to photograph allanimals we encountered prior to, during, and posttag deployment for individual identification, as wellas sex and age class designation using photo-identi-
fication methods detailed by Shearer et al. (2019).We compared photographs across all survey effortin order to catalog each individual and validateall tagged individuals as unique. Most tags (n = 16)were Wildlife Computers SPLASH10A satellite-linkeddepth- recording tags from which both position andcompressed dive records are transmitted. Four otheranimals were equipped with Smart Position andTemperature (SPOT5 & 6) tags, which provide onlythe surface location of the animals. Location esti-mates were derived using a least squares methodfrom Service Argos receivers on polar-orbiting satel-lites. Transmission schedules varied by deploymentyear. Tags deployed in 2014−2016 were programmedto initially transmit 18−20 h d−1, based on tag type.SPOT5 tags deployed in 2014−2015 transmitted dailyfor 80 d, followed by every second day for 10 d,
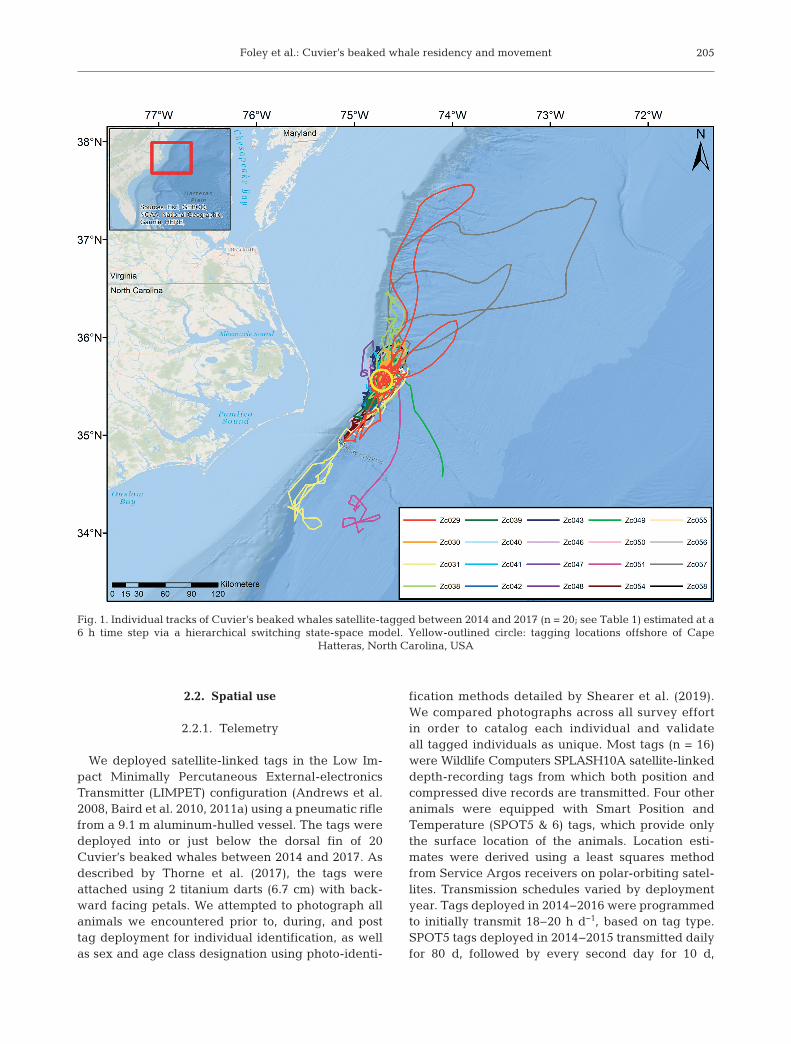
Fig. 1. Individual tracks of Cuvier’s beaked whales satellite-tagged between 2014 and 2017 (n = 20; see Table 1) estimated at a6 h time step via a hierarchical switching state-space model. Yellow-outlined circle: tagging locations offshore of Cape
Hatteras, North Carolina, USA

Mar Ecol Prog Ser 660: 203–216, 2021206
and every fifth day until transmissions ceased. TheSPOT6 tag deployed in 2016 transmitted daily, withthe number of transmitting hours per day beingreduced to 8 at 80 d. In 2014, SPLASH10A tags trans-mitted daily for 28 d, and every second day after-wards, and SPLASH10A tags deployed in 2015 and2016 transmitted every day for 25 d, then every sec-ond day for 8 d, followed by every third day. All tagsdeployed in 2017 transmitted for 21 h every day.
All positions were assigned an estimated accuracylocation class (LC) based on the timing and numberof transmissions received during a satellite pass. LCs0 to 3 have designated error radii of >1500,500−1500, 250−500, and <250 m, respectively, andLCs A and B do not have an estimated level of error(Argos 2007−2016). Location class Z positions areconsidered invalid by Argos and were not includedin analyses.
2.2.2. Location filtering and behavioral stateestimation
We fit a hierarchical Bayesian switching state-space model (hSSSM) (Jonsen et al. 2003, 2005, 2007)using the ‘bsam’ package v 1.1.2 (Jonsen 2016) at 6 htime intervals across all individuals in R version 3.6.0(R Development Core Team 2018) to estimate thelocations of each animal and distinguish between 2behavioral states: area-restricted search (ARS) andtransit. Two separate first-difference correlated ran-dom walks were used in the process model (transi-tion equation), which allowed parameters to varybetween 2 distinct behavioral states, while also esti-mating the location of the animal. The 2 states aredefined by mean turning angle and movement persistence of the animal. Hierarchical models canvastly improve behavioral state estimation andincrease accuracy of movement parameters by bor-rowing strength across all tracks (Jonsen 2016), andis particularly suited to data with large location errorrelative to the scale of movement.
Within the hSSSM, the behavioral state at time t(bt) is estimated using the mean value from Markovchain Monte Carlo (MCMC) samples, which providea continuous value from 1 (transit) to 2 (ARS) (Jonsen2016). After removing any points with duplicatetimestamps, we ran the hSSSM with a burn-in of30 000 samples, generating 10 000 MCMC samplesin each of 2 chains. We retained every 10th sample toreduce within-chain sample autocorrelation (Jonsen2016), for 2000 final posterior samples which we usedto calculate model parameters and estimated loca-
tions. Based on the results of previous studies, weconsidered behavioral state values of <1.25 as transitbehavior, those >1.75 as ARS, and intermediate val-ues between 1.25 and 1.75 as uncertain (Jonsen et al.2007, Bailey et al. 2009, Kennedy et al. 2014, Acuña-Marrero et al. 2017, Fortune et al. 2020).
ARS is associated with frequent course reversalsand relatively slow swim speed, whereas transitbehavior has higher rates of movement withincreased persistence between locations (Jonsen2016). Across studies of many different animal taxa,foraging has been inferred from ARS behavior, inwhich animals slow their horizontal movementspeeds and increase turning rates in highly produc-tive areas (Fortune et al. 2020). Animals are believedto spend more time in a particular area if they are for-aging successfully (Fortune et al. 2020). It is possiblethat ARS could include behaviors such as breeding orresting (Bailey et al. 2009). However, the beakedwhales tagged in this study consistently dove todepths at which they are known to forage, spendingvery little time at the surface of the water (Shearer etal. 2019). Previous studies have determined that non-foraging time in Cuvier’s beaked whales is spent in:(1) short surfacing bouts of ~2 min, (2) relatively shal-low ‘bounce dives,’ or (3) transit to and from foragingdepths (Barlow et al. 2013, 2020). Thus, taken to -gether, we inferred that ARS of Cuvier’s beakedwhales demonstrated foraging behavior.
Environmental metrics were calculated at eachposition of the hSSSM output, including bathymetricdepth, slope, distance to shelf break, and sea sur-face temperature. We used the National Oceanicand At mospheric Administration National Centersfor Environmental Information (NCEI) 3 arc-secondSoutheast Atlantic US Coastal Relief Model (CRM)to generate depth values whenever possible. Inareas not included in the NCEI CRM (<6% of loca-tions in this study), we employed 30 arc-second datafrom the General Bathymetric Chart of the Oceans(GEBCO) 2014 global bathymetry grid (www. gebco.net). We also used the GEBCO bathymetric grid togenerate slope values and the 200 m isobath con-tour, which served as a proxy for the continentalshelf break (Thorne et al. 2017). We obtained Groupfor High Resolution Sea Surface Temperature (www.ghrsst. org) grids with a 1 km resolution using theNOAA Coastwatch tool Xtractomatic (http:// coastwatch. pfeg. noaa. gov/ xtracto/) in R (R DevelopmentCore Team 2018). In addition, total travel distances,cal culated as great circle distances between thehSSSM-estimated locations, and thus representingthe absolute minimum horizontal distance tra -

Foley et al.: Cuvier’s beaked whale residency and movement 207
versed between locations, were calculated for eachindividual.
2.2.3. Home range estimation
To describe spatial use by Cuvier’s beaked whales,we evaluated home range and core use areas bothfor each individual tagged whale and for the sampleof all tagged animals using utilization distributions(UDs) generated through kernel density estimation(KDE) from the hSSSM output. We used core useareas to represent particularly high use areas foreach individual (Johnston et al. 2005, Hauser et al.2014). Home range estimation can be sensitive toauto-correlated data, but serial independence ofobservations is not required (De Solla et al. 1999).Instead, maximizing the number of observationswhile using regularly spaced time intervals, suchas those generated from the hSSSM, leads to moreprecise and accurate results (De Solla et al. 1999,Fieberg 2007). After the hSSSM-estimated locationswere projected to the Albers Equal Area projection,we generated core use (50% probability contour)and home range (95% probability contour) areas andassociated isopleths in the R package ‘ks’ using thebivariate plug-in bandwidth matrix as the smoothingparameter (Duong & Hazelton 2003, 2005, Duong2007). The plug-in bandwidth is a ‘second-genera-tion’ kernel density estimator allowing for separatebandwidths in the x- and y-directions that performswell at identifying high use areas, even with auto-correlated telemetry data (Hall et al. 1995, Jones etal. 1996, Walter et al. 2015). We used linear regres-sion to evaluate the relationship between individualtrack duration and the areal size of both home rangeand core use areas.
2.2.4. Movement patterns
We calculated net squared displacement (NSD) toevaluate movement patterns of Cuvier’s beakedwhales offshore of Cape Hatteras. We ran a candi-date set of movement pattern models for all tagswith >100 hSSSM-estimated locations, or approxi-mately 25 d of tag duration, adapting code from Pap-worth et al. (2012). NSD, i.e. the Euclidean distancebetween the initial and subsequent locations of ananimal over time, has been used both in marine andterrestrial systems to evaluate movement patterns ofindividuals (Bunnefeld et al. 2011, Harrison 2012,Papworth et al. 2012). Animal movements lie on a
continuum between nomadism, in which an animalnever remains in the same place for long periods, andsedentarism, where an animal is spatially con-strained within a home range (Börger & Fryxell2012). The other two over-arching movement tacticsare dispersal and migration. Specific movement pat-terns are classified to individuals by fitting the NSDcurve of an animal to a series of potential non-linearmixed movement models unique to each tactic, link-ing theoretical expectations in variation to observedNSD (Singh et al. 2012, Couriot et al. 2018). Homerange, or resident animals, have either a constantNSD or one whose NSD curve asymptotes followinga linear increase. Nomadism is denoted by a continu-ous, linear increase in NSD over time, while migra-tion models show seasonal departures and return toan initial location, following a plateau. Dispersinganimals demonstrate departure from an animal’s ini-tial location followed by a plateau, but fail to return(Börger & Fryxell 2012). The best fitting model andits associated movement pattern category for eachindividual was assigned using concordance criterionvalues, with the largest value corresponding to themost appropriate tactic. Random effects wereincluded in models to account for individual variabil-ity, in addition to sparse or unbalanced data, but seeBörger & Fryxell (2012) for additional detail on modelstructure and selection.
We plotted NSD over time for each individual,along with the sample population mean. We calcu-lated maximum net displacement for each individualfrom their initial location as the maximum value ofthe square root of each NSD at every subsequentlocation. To evaluate any linear association betweenmaximum net displacement and individual trackduration, we used linear regression.
3. RESULTS
3.1. Spatial use
We tagged 20 Cuvier’s beaked whales between May2014 and May 2017, with transmissions ranging in du-ration from 2 to 93 d, with a mean length of 42 ± 21 d(SD) (Table 1). Twelve of the animals tagged wereadult males, 3 were adult females, 3 were adults of un-known sex, and 2 were animals of unknown sex or ageclass. No individuals were tagged on more than oneoccasion. Animals remained in close association withthe continental shelf and slope waters, ranging fromOnslow Bay in the south to the Virginia/Maryland bor-der to the north (Fig. 1). Fifteen individuals remained

Mar Ecol Prog Ser 660: 203–216, 2021208
within 100 km of their tagging locations offCape Hatteras, and no animal ventured far-ther than 272 km from its initial location dur-ing its tracking period (Table 1, Fig. 1). Totaltravel distances ranged from 29 to 4802 kmacross individuals. The median water depthat estimated surface locations was 1590 m(mean ± SD = 1524 ± 641 m, range =47−3662 m). The median distance to thecontinental shelf break (200 m isobath) was10 km (mean ± SD = 13.6 ± 16.4 km), with amaximum distance from the shelf break of165 km. Slope at estimated locations had amedian value of 4.9°, a mean of 5.7°, and amaximum of 18.6°. Daily sea surface tem-perature values at estimated locationsranged from 16.1 to 30.4°C, with a mean of26.2°C (median = 26.3°C).
3.2. Location filtering and behavioralstate estimation
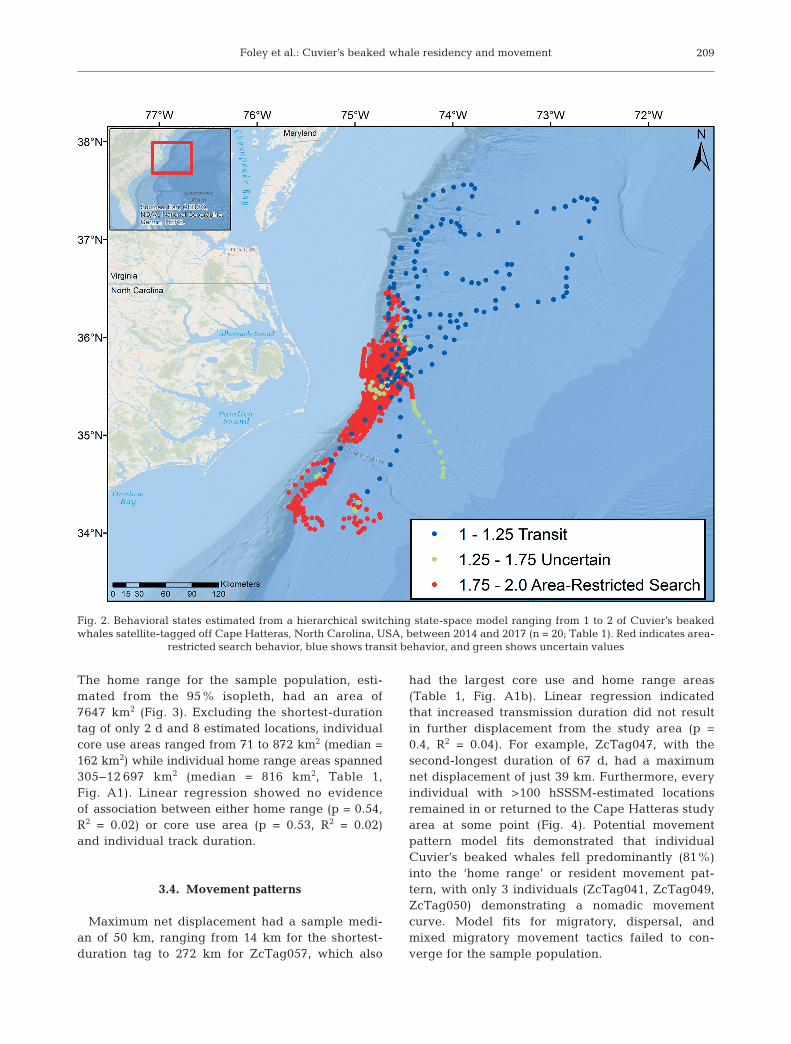
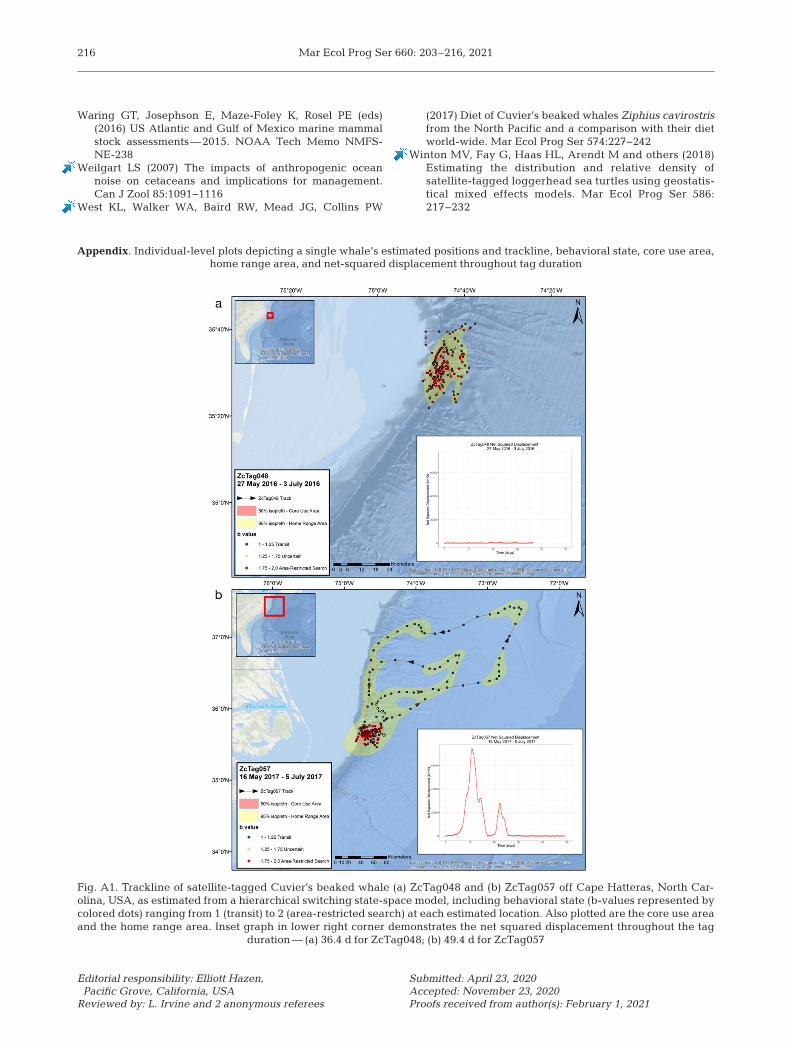
The hSSSM generated 3354 estimatedlocations for the 20 individuals and clearlydistinguished between transit (4.8% oflocations) and ARS (93.5%) behaviors,with only 1.7% of the points classified asuncertain (Fig. 2). ARS behavior was thedominant mode for most individuals, withmost animals (75%) remaining in thatbehavioral mode for the entirety of theirtag transmission time (Table 1, Fig. A1a inthe Appendix). ARS behavior was moreprevalent in locations close to the study siteand continental shelf break (mean distanceto 200 m isobath = 11.3 km) (Fig. 2), andtransit behavior generally occurred whenanimals departed from the study site, northand east of the shelf break (mean distanceto 200 m isobath = 50.5 km) (Fig. A1b).
3.3. Home range estimation
The home range area for the samplepopulation ranged from the Virginia/North Carolina border southward toOnslow Bay, straddling the continentalshelf break (Fig. 3). The core use areafor the tagged whales comprised a singlearea of 583 km2 just east of the continen-tal shelf break off Cape Hatteras (Fig. 3).T
ag I
DT
ag t
ype
Dep
loym
ent
Du
rati
onR
aw A
rgos
Pos
t h
SS
SM
AR
SM
inim
um
Cor
e u
seH
ome
ran
ge
Max
imu
m n
etD
epth
at
dat
e(d
)lo
cati
ons
loca
tion
s (n
)P
rop
.to
tal d
ista
nce
(50
% is
ople
th)
(95
% is
ople
th)
dis
pla
cem
ent
dep
loym
ent
(n)
trav
eled
(k
m)
area
(k
m2 )
area
(k
m2 )
(km
)(m
)
ZcT
ag02
9M
k10
-A5/
13/2
014
59.9
333
241
0.68
2480
823.
874
74.1
243.
994
4Z
cTag
030
Mk
10-A
9/16
/201
440
.426
115
61.
065
610
9.8
624.
646
.55
1485
ZcT
ag03
1S
PO
T5
9/16
/201
435
.611
913
00.
8881
780
0.6
3977
.418
3.77
1591
ZcT
ag03
8M
k10
-A6/
14/2
015
56.4
299
223
1.0
1273
635.
725
11.4
98.5
312
81Z
cTag
039
SP
OT
56/
14/2
015
39.4
187
157
1.0
611
140.
059
1.3
39.2
416
10Z
cTag
040
Mk
10-A
6/14
/201
52.
022
81.
029
21.6
71.6
13.7
118
01Z
cTag
041
Mk
10-A
10/1
5/20
1534
.320
113
81.
068
618
1.0
812.
042
.46
779
ZcT
ag04
2M
k10
-A10
/21/
2015
59.2
262
238
1.0
990
162.
168
9.7
33.3
211
92Z
cTag
043
SP
OT
510
/21/
2015
56.8
367
228
1.0
679
139.
671
7.7
41.7
013
03Z
cTag
046
Mk
10-A
5/25
/201
616
.159
611.
022
387
.830
4.9
24.0
212
82Z
cTag
047
Mk
10-A
5/25
/201
666
.926
226
81.
089
112
3.6
548.
639
.08
1236
ZcT
ag04
8M
k10
-A5/
27/2
016
36.4
197
146
1.0
478
71.0
347.
925
.14
1393
ZcT
ag04
9S
PO
T6
5/27
/201
692
.821
036
80.
9617
2516
2.1
952.
113
4.25
1228
ZcT
ag05
0M
k10
-A8/
20/2
016
30.4
5512
21.
058
414
7.7
1060
.657
.56
1215
ZcT
ag05
1M
k10
-A8/
21/2
016
11.4
6346
0.72
426
557.
833
81.4
186.
5617
61Z
cTag
054
Mk
10-A
5/10
/201
718
.112
872
1.0
345
218.
377
0.9
72.7
914
93Z
cTag
055
Mk
10-A
5/10
/201
752
.912
620
71.
012
3635
4.0
1389
.658
.83
1548
ZcT
ag05
6M
k10
-A5/
10/2
017
47.9
327
191
1.0
1040
505.
917
37.7
54.3
017
10Z
cTag
057
Mk
10-A
5/16
/201
749
.447
519
70.
5048
0287
2.2
1269
6.6
271.
9317
50Z
cTag
058
Mk
10-A
5/16
/201
739
.130
815
71.
076
414
2.2
816.
045
.18
1515
Tab
le 1
. Su
mm
ary
of C
uvi
er’s
bea
ked
wh
ale
sate
llite
tag
dep
loym
ents
. Dat
es a
re s
how
n a
s m
o/d
/yr.
hS
SS
M: h
iera
rch
ical
Bay
esia
n s
wit
chin
g s
tate
-sp
ace
mod
el; A
RS
: ar
ea-r
estr
icte
d s
earc
h
Foley et al.: Cuvier’s beaked whale residency and movement 209
The home range for the sample population, esti-mated from the 95% isopleth, had an area of7647 km2 (Fig. 3). Excluding the shortest-durationtag of only 2 d and 8 estimated locations, individualcore use areas ranged from 71 to 872 km2 (median =162 km2) while individual home range areas spanned305−12 697 km2 (median = 816 km2, Table 1,Fig. A1). Linear regression showed no evidenceof association between either home range (p = 0.54,R2 = 0.02) or core use area (p = 0.53, R2 = 0.02)and individual track duration.
3.4. Movement patterns
Maximum net displacement had a sample medi -an of 50 km, ranging from 14 km for the shortest-duration tag to 272 km for ZcTag057, which also
had the largest core use and home range areas(Table 1, Fig. A1b). Linear regression indicatedthat increased transmission duration did not resultin further displacement from the study area (p =0.4, R2 = 0.04). For example, ZcTag047, with thesecond-longest duration of 67 d, had a maximumnet displacement of just 39 km. Furthermore, everyindividual with >100 hSSSM-estimated locationsremained in or returned to the Cape Hatteras studyarea at some point (Fig. 4). Potential movementpattern model fits demonstrated that individualCuvier’s beaked whales fell predominantly (81%)into the ‘home range’ or resident movement pat-tern, with only 3 individuals (ZcTag041, ZcTag049,ZcTag050) demonstrating a nomadic movementcurve. Model fits for migratory, dispersal, andmixed migratory movement tactics failed to con-verge for the sample population.
Fig. 2. Behavioral states estimated from a hierarchical switching state-space model ranging from 1 to 2 of Cuvier’s beakedwhales satellite-tagged off Cape Hatteras, North Carolina, USA, between 2014 and 2017 (n = 20; Table 1). Red indicates area-
restricted search behavior, blue shows transit behavior, and green shows uncertain values

Mar Ecol Prog Ser 660: 203–216, 2021210
4. DISCUSSION
Our analysis demonstrates that Cuvier’s beakedwhales are resident to the slope waters off Cape Hat-teras, North Carolina, USA, over periods of at leastweeks to months. Tagged animals exhibited small,overlapping core use areas and little displacementfrom the region, tending to prefer relatively deepwaters with high relief and warm sea surface temper-atures close to the shelf break. ARS was the domi-nant behavior (96% of locations) for all whales, andtransit behavior did not occur at any point in thetransmission duration for 15 of the 20 tagged individ-uals (Table 1).
We believe that the dominance of ARS displayedby our sample of tagged whales represents a residentpopulation that is strongly linked to the bathymetricand oceanographic features of our study site. In addi-
tion, the unusual diving patterns exhibited by thisspecies, in which deep foraging dives are inter-spersed with shallower, non-foraging dives, mayhelp to explain the preponderance of this behavioralmode. The function of these shallower ‘bounce dives’is not fully understood, but it has been hypothesizedthat they may serve a variety of functions, includingphysiological recovery, rest, or providing an opportu-nity for social interactions (Tyack et al. 2006, Cioffi2020). Unlike most other cetaceans, Cuvier’s beakedwhales spend very little time at the surface, so thesefunctions must occur at depth and interspersedbetween foraging dives. We believe that this unusualbehavioral pattern, together with a strong affinity toplace, explains why most whales spent almost theentirety of their transmission periods in apparentARS behavior. These results should not be inter-preted as indicating that our tagged whales spent
Fig. 3. Home range area (yellow) and core use area (red) for Cuvier’s beaked whales satellite-tagged off Cape Hatteras, North Carolina, USA, between 2014 and 2017 (n = 20; Table 1) generated from kernel density estimation

Foley et al.: Cuvier’s beaked whale residency and movement 211
96% of their time foraging, however, as other essen-tial behaviors, including resting and socializing, mustbe interspersed with foraging during these periods.We interpret our findings as indicating that ourtagged whales engaged in a variety of behavioralmodes within a fairly restricted area, at least duringthe summer months.
We identified a localized core use area for thetagged animals, as well as overlapping high useareas for individual whales. However, as the rangefor Cuvier’s beaked whales is known to be expansivethroughout deep slope waters of the western NorthAtlantic (Waring et al. 2001, 2016), it is still unclearwhat specific habitat characteristics of the area offCape Hatteras attracts these animals in such highdensities (Stanistreet et al. 2017, McLellan et al.2018, Cioffi 2020, Waples & Read 2020). Similar areasof relief and bathymetry are available both north and
south of the core use area, but these outlying regionsare not utilized as strongly. The confluence of theGulf Stream and the Labrador Current often occursnear the core use area, producing productive frontsand eddies with which the species is believed toassociate. These mesoscale features may create ag -gregations of prey, which ultimately determines thedistribution of foraging whales (Laidre et al. 2004,Waring et al. 2016). Many animals use smaller homeranges than expected from observed mobility levelsin environments with high prey availability (Börgeret al. 2008, Acuña-Marrero et al. 2017, Couriot et al.2018). Due to their ephemeral and patchy nature,however, prey-aggregating oceanographic featuresand processes are difficult to quantify over relevantspatiotemporal scales, even with the ad vancementof front-detecting algorithms applied to remotelysensed data (Etnoyer et al. 2006). Furthermore, we
Fig. 4. Net squared displacement (km2) over tag duration for Cuvier’s beaked whales satellite-tagged off Cape Hatteras, NorthCarolina, USA, between 2014 and 2017 (n = 20; Table 1). Sample population mean represented by solid black line. Highestpeak represents the maximum displacement, where values close to 0 represent the return of an individual to its initial location

Mar Ecol Prog Ser 660: 203–216, 2021212
do not know whether these surface manifestations ofmeso-scale oceanographic conditions directly resultin the aggregation of the meso- and bathypelagicprey on which the species relies (Moulins et al. 2007,West et al. 2017), but the effects of these processeswarrant further study. Interestingly, we did not findany of the tagged animals that ventured into pelagicwaters to directly associate with such aforemen-tioned ephemeral fronts or eddies. Alternatively,fixed bathymetric features may be driving the consis-tent occurrence of Cuvier’s beaked whales in thearea, further supporting the residency of the samplepopulation in the waters off Cape Hatteras.
Prey abundance, although difficult to measure instudies of deep-diving cetaceans, could help placethe movements described here into an ecologicalcontext. However, very little is known about theabundance of meso- and bentho-pelagic squid andfish in the western North Atlantic, or how these preyspecies aggregate in relation to oceanographic vari-ables. As such, static parameters such as depth andslope are often used as proxies for prey distribution(Palacios et al. 2013). However, static variablesmay not be the best substitutes for cetacean habitatat fine scales (Johnston et al. 2005). Instead, tempo-rally dynamic covariates including mesoscale activity(upwelling, fronts, eddies, or currents) and their in -teractions with the physical features that can aggre-gate resources, particularly those below the surface,may be more directly applicable for identifying fine-scale deep-diving cetacean habitat (Abecassis et al.2015, Briscoe et al. 2018). Incorporating telemetereddive data, while continuing to refine the definition offoraging vs. non-foraging dives in this species, couldimprove our ability to model the movements and spa-tial ecology of these whales, which spend very littletime at the surface.
Individual beaked whale species may also occupydistinct ecological niches, and exhibit fine-scalehabitat partitioning with other beaked whales anddeep-diving odontocetes that occupy similar habi-tats, such as Gervais’ beaked whales Mesoplodoneuropaeus, Blainville’s beaked whales M. densiros -tris, short-finned pilot whales Globicephala macro -rhynchus, and sperm whales Physeter macro-cephalus (Schick et al. 2011, Stanistreet et al. 2017,Baird 2019). Indi vidual Cuvier’s beaked whalesmay have developed specialized foraging strategieswithin this small core use area off Cape Hatterasthat are particularly efficient (Barlow et al. 2020),although their diet and foraging behavior is stillpoorly understood (MacLeod et al. 2003, West et al.2017).
Most tagged individuals (81%) fell under the ‘resi-dent’, or home range, movement pattern, but 3 indi-viduals demonstrated a more nomadic movementpattern. However, transmissions from these 3 whales(ZcTag041, ZcTag049, ZcTag050) ceased when theywere at their maximum NSD (Fig. 4). NSD should in-crease linearly with time for nomadic movement(Harrison 2012), so such individuals were likely mis-classified. For example, ZcTag049 had the longest-duration tag (Table 1), and remained resident in thestudy area for nearly 3 mo before departing just be-fore tag failure. The model fit for ZcTag049 wastherefore more suited to a nomad than a resident.Every animal with more than 100 hSSSM-estimatedrelocations returned to its initial location at somepoint. Interestingly, 2 of the tagged animals never re-turned to their initial locations during tag trans -mission (ZcTag046 and ZcTag051). Despite constitut-ing 2 of the shortest tag durations in the sample (16and 11 d, respectively, Table 1), it is conceivable thatthese individuals were not members of a populationinhabiting the waters off Cape Hatteras, but ratherpart of a separate oceanic population that, on occa-sion, spatially overlaps with that of the animalstagged off Cape Hatteras, as has been observed inbeaked whale populations in Hawai‘i (Baird et al.2011b, Baird 2019). However, we believe this to beunlikely, at least in the case of ZcTag046. Social network analyses link 12 of the 20 tagged whales(60%) by association within a single cluster of ani -mals (Cioffi 2020), including ZcTag046, which wasseen together in the same group with ZcTag047, bothat tagging as well as more than a year later (Waples& Read 2020). Therefore, if ZcTag046 were to be amember of an oceanic population occasionally pres-ent in the region, the resident and oceanic popula-tions must interact socially, evidence of which has notbeen observed in other regions (Baird et al. 2011b,Baird 2019). Similar reasoning applies to ZcTag051,which has never been re-sighted in the region norlinked by association to the main social network clus-ter. However, another individual sighted in the samegroup with ZcTag051 at tagging has twice been re-sighted in the area over 2 yr later, demonstrating sitefidelity to the region (Waples & Read 2020).
We were unable to assess the effects of seasonalityin our study. Currently, our tagging efforts occur onlybetween May and October, when favorable weatherconditions allow field work. That limitation, alongwith typical duration of the tag transmissions, pre-vented us from collecting telemetry data for Cuvier’sbeaked whales between January and April. How-ever, Stanistreet et al. (2017) found no evidence for

Foley et al.: Cuvier’s beaked whale residency and movement 213
seasonality in beaked whale acoustic detectionsalong the western North Atlantic continental shelfbreak. Additionally, recent visual studies in theregion have detected Cuvier’s beaked whales at sim-ilar levels year-round, with little to no seasonal varia-tion (McLellan et al. 2018).
Cuvier’s beaked whales are a wide-ranging andcosmopolitan species, but high levels of site fidelityhave been observed around the world (McSweeneyet al. 2007, Moulins et al. 2007, Falcone et al. 2017,Reyes 2017, Baird 2019). The site fidelity and inter-annual residence of the animals in the Cape Hatterasregion is further bolstered by recent literature de -monstrating a year-round presence of Cuvier’sbeaked whales in the study area (Stanistreet et al.2017, McLellan et al. 2018, Shearer et al. 2019).Ongoing photo-identification analyses from theregion indicates a re-sighting rate of 0.30 for the spe-cies (Waples & Read 2020). We have re-sighted overhalf of the satellite-tagged whales in this study inthe Cape Hatteras area, and many other animalsuniquely identified from photographs have been re-sighted across seasons and years (Waples & Read2020). Furthermore, most individual Cuvier’s beakedwhales sighted on more than 1 day (83%) are linkedby association in a single social network analysiscluster (Cioffi 2020). Taken together, this body ofwork demonstrates site fidelity to, and residency ofCuvier’s beaked whales in, the continental slopewaters off Cape Hatteras over several temporalscales, supporting our hypothesis.
The periodicity at which animals depart from andreturn to the Cape Hatteras study area varied be -tween and within individuals and was difficult toquantify. Some animals demonstrated only a few for-ays away from the region, while other individuals departed and returned to the area several timesthroughout their tag transmission period. Such move-ments can also occur in response to disturbance. Forexample, Tyack et al. (2011) found that a satellite-tagged Cuvier’s beaked whale in the Bahamas moved‘several tens of km’ away from an area of a CEE, andtook approximately 3 d to return, movements thatwere interpreted as a ‘clear reaction to sonar.’ Calcu-lating such metrics for whales off Cape Hatteras, andworking to distinguish between baseline and responsebehaviors, could help define and mitigate responsesto CEEs with MFAS. However, further work is neces-sary to elucidate population-level patterns of depar-ture from and return to the area.
Effective conservation relies on an accurate under-standing of the space use and distribution of a spe-cies (Palacios et al. 2013, Winton et al. 2018). Here
we have demonstrated that the continental slopewaters off Cape Hatteras are a localized area ofimportant habitat for Cuvier’s beaked whales inwhich they dedicate significant time to ARS, suggest-ing foraging. The sample population of taggedwhales remains in or close to the area over medium-term time scales (weeks to months), and long-termsite fidelity has been demonstrated through analysisof photographic records (Waples & Read 2020).
Cuvier’s beaked whales are particularly sensitiveto anthropogenic disturbances, including MFAS,which has been proven to reduce fitness, negativelyimpact reproduction and survival, and cause injuryand death in the species (Cox et al. 2006, DeRuiter etal. 2013, Baird 2019, Simonis et al. 2020). Two poten-tial reactions to such acoustic disturbances observedin individual Cuvier’s beaked whales are cessation offoraging and horizontal avoidance (DeRuiter et al.2013). Repeated exposure to anthropogenic distur-bances can negatively impact communication, ener-getics, and stress levels of an individual (Forney et al.2017). The whales in our study demonstrated smallcore use areas and very little propensity for eitherdispersal or migration behavior, but continuedacoustic disturbance may cause individuals to beforced out of their home ranges, thereby modifyingtheir distributions over both space and time (Gomezet al. 2016). The Cuvier’s beaked whale populationoff Cape Hatteras may not be able to successfullyrelocate or shift its limited distribution without con-siderable fitness costs. Our work represents one ofthe largest samples of telemetry data from anyCuvier’s beaked whale population in the world, andthe spatial ecology presented here is an importantfirst step to better allow us to assess any futurebehavioral changes of this population in response toanthropogenic disturbance.
Acknowledgements. We are indebted to Will Cioffi, NicolaQuick, and Danielle Waples for their contributions to thiswork both in the field and the lab. The Naval Facilities Engi-neering Command Atlantic funded the field work andanalyses. Satellite tagging was conducted under NationalMarine Fisheries Service Scientific Research Permit Nos.17086, 20605, and 15330 issued to R.W.B. The InstitutionalAnimal Care and Use Committee (IACUC) approved allresearch protocols.
LITERATURE CITED
Abecassis M, Polovina J, Baird RW, Copeland A and others(2015) Characterizing a foraging hotspot for short-finnedpilot whales and Blainville’s beaked whales located offthe west side of Hawai’i Island by using tagging andoceanographic data. PLOS ONE 10: e0142628

Mar Ecol Prog Ser 660: 203–216, 2021214
Acuña-Marrero D, Smith ANH, Hammerschlag N, Hearn Aand others (2017) Residency and movement patterns ofan apex predatory shark (Galeocerdo cuvier) at theGalapagos Marine Reserve. PLOS ONE 12: e0183669
Andrews RD, Pitman RL, Ballance LT (2008) Satellite track-ing reveals distinct movement patterns for Type B andType C killer whales in the southern Ross Sea, Antarc-tica. Polar Biol 31: 1461−1468
Argos (2007−2016) User’s manual. Collecte localisationsatellites. https: //www.argos-system.org/manual/
Bailey H, Mate BR, Palacios DM, Irvine L, Bograd SJ, CostaDP (2009) Behavioural estimation of blue whale move-ments in the Northeast Pacific from state-space modelanalysis of satellite tracks. Endang Species Res 10: 93−106
Baird RW (2019) Behavior and ecology of not-so-socialodontocetes: Cuvier’s and Blainville’s beaked whales. In: Würsig B (ed) Ethology and behavioral ecology oftoothed whales and dolphins, the odontocetes. Springer,Cham, p 305–329
Baird RW, Webster DL, McSweeney DJ, Ligon AD, SchorrGS, Barlow J (2006) Diving behaviour of Cuvier’s (Ziphiuscavirostris) and Blainville’s (Mesoplodon densirostris)beaked whales in Hawai’i. Can J Zool 84: 1120−1128
Baird RW, Schorr GS, Webster DL, McSweeney DJ, HansonMB, Andrews RD (2010) Movements and habitat use ofsatellite-tagged false killer whales around the mainHawaiian Islands. Endang Species Res 10: 107−121
Baird RW, Schorr GS, Webster DL, McSweeney DJ, HansonMB, Andrews RD (2011a) Movements of two satellite-tagged pygmy killer whales (Feresa attenuata) off theisland of Hawai’i. Mar Mamm Sci 27: E332−E337
Baird RW, Schorr GS, Webster DL, Mahaffy SD, McSweeneyDJ, Hanson MB, Andrews RD (2011b) Open-ocean move -ments of a satellite-tagged Blainville’s beaked whale(Mesoplodon densirostris): evidence for an offshore pop-ulation in Hawai’i? Aquat Mamm 37: 506−511
Barlow J, Tyack PL, Johnson MP, Baird RW, Schorr GS,Andrews RD, Aguilar de Soto N (2013) Trackline andpoint detection probabilities for acoustic surveys ofCuvier’s and Blainville’s beaked whales. J Acoust SocAm 134: 2486−2496
Barlow J, Schorr GS, Falcone EA, Moretti D (2020) Variationin dive behavior of Cuvier’s beaked whale with seafloordepth, time-of-day, and lunar illumination. Mar EcolProg Ser 644: 199−214
Börger L, Fryxell JM (2012) Quantifying individual differ-ences in dispersal using net squared displacement. In: Clobert J, Baguette M, Benton T, Bullock J (eds) Disper-sal and spatial evolutionary ecology, Oxford UniversityPress, Oxford, p 222–230
Börger L, Dalziel BD, Fryxell JM (2008) Are there generalmechanisms of animal home range behaviour? A reviewand prospects for future research. Ecol Lett 11: 637−650
Briscoe DK, Fossette S, Scales KL, Hazen EL and others(2018) Characterizing habitat suitability for a central-place forager in a dynamic marine environment. EcolEvol 8: 2788−2801
Bunnefeld N, Börger L, van Moorter B, Rolandsen CM, Det-tki H, Solberg EJ, Ericsson G (2011) A model-drivenapproach to quantify migration patterns: individual,regional and yearly differences. J Anim Ecol 80: 466−476
Chambault P, Roquet F, Benhamou S, Baudena A and others(2017) The Gulf Stream frontal system: a key oceano-graphic feature in the habitat selection of the leather-back turtle? Deep Sea Res I 123: 35−47
Cioffi WR (2020) Social behavior of the Cuvier’s beakedwhale (Ziphius cavirostris) investigated by telemetry andphoto-identification. PhD dissertation, Duke University,Durham, NC
Couriot O, Hewison AJM, Saïd S, Cagnacci F and others(2018) Truly sedentary? The multi-range tactic as a re -sponse to resource heterogeneity and unpredictability ina large herbivore. Oecologia 187: 47−60
Cox TM, Ragen TJ, Read AJ, Vos E and others (2006) Under-standing the impacts of anthropogenic sound on beakedwhales. J Cetacean Res Manag 7: 177−187
D’Amico A, Gisiner RC, Ketten DR, Hammock J, Johnson C,Tyack PL, Mead J (2009) Beaked whale strandings andnaval exercises. Aquat Mamm 35: 452−472
De Solla SR, Bonduriansky R, Brooks RJ (1999) Eliminatingautocorrelation reduces biological relevance of homerange estimates. J Anim Ecol 68: 221−234
DeRuiter SL, Southall BL, Calambokidis J, Zimmer WMXand others (2013) First direct measurements of behav-ioural responses by Cuvier’s beaked whales to mid-fre-quency active sonar. Biol Lett 9: 20130223
Duong T (2007) ks: Kernel density estimation and kerneldiscriminant analysis for multivariate data in R. J StatSoftw 21: 1−16
Duong T, Hazelton ML (2003) Plug-in bandwidth matricesfor bivariate kernel density estimation. J NonparametrStat 15: 17−30
Duong T, Hazelton ML (2005) Cross-validation bandwidthmatrices for multivariate kernel density estimation.Scand J Stat 32: 485−506
Etnoyer P, Canny D, Mate BR, Morgan LE, Ortega-Ortiz JG,Nichols WJ (2006) Sea-surface temperature gradientsacross blue whale and sea turtle foraging trajectories offthe Baja California Peninsula, Mexico. Deep Sea Res II53: 340−358
Falcone EA, Schorr GS, Watwood SL, DeRuiter SL (2017)Diving behaviour of Cuvier’s beaked whales exposed totwo types of military sonar. R Soc Open Sci 4: 170629
Fieberg J (2007) Kernel density estimators of home range: smoothing and the autocorrelation red herring. Ecology88: 1059−1066
Forney KA, Southall BL, Slooten E, Dawson S, Read AJ,Baird RW, Brownell RL Jr (2017) Nowhere to go: noiseimpact assessments for marine mammal populations withhigh site fidelity. Endang Species Res 32: 391−413
Fortune SME, Ferguson SH, Trites AW, LeBlanc B, LeMayV, Hudson JM, Baumgartner MF (2020) Seasonal di vingand foraging behaviour of Eastern Canada−West Green-land bowhead whales. Mar Ecol Prog Ser 643: 197−217
Gomez C, Lawson JW, Wright AJ, Buren AD, Tollit D,Lesage V (2016) A systematic review on the behaviouralresponses of wild marine mammals to noise: the disparitybetween science and policy. Can J Zool 94: 801−819
Hall P, Lahiri SN, Truong YK (1995) On bandwidth choicefor density estimation with dependent data. Ann Stat 23: 2241−2263
Harrison AL (2012) A synthesis of marine predator mi -grations, distributions, species overlap, and use of PacificOcean Exclusive Economic Zones. PhD dissertation, Uni-versity of California, Santa Cruz, CA
Hauser DDW, Laidre KL, Suydam RS, Richard PR (2014)Population-specific home ranges and migration timing ofPacific Arctic beluga whales (Delphinapterus leucas).Polar Biol 37: 1171−1183
Hays GC, Ferreira LC, Sequeira AMM, Meekan MG and
Foley et al.: Cuvier’s beaked whale residency and movement 215
others (2016) Key questions in marine megafauna move-ment ecology. Trends Ecol Evol 31: 463−475
Hildebrand JA (2009) Anthropogenic and natural sources ofambient noise in the ocean. Mar Ecol Prog Ser 395: 5−20
Hussey NE, Kessel ST, Aarestrup K, Cooke SJ and others(2015) Aquatic animal telemetry: a panoramic windowinto the underwater world. Science 348: 1255642
Johnston DW, Westgate AJ, Read AJ (2005) Effects of fine-scale oceanographic features on the distribution and move -ments of harbour porpoises Phocoena phocoena in theBay of Fundy. Mar Ecol Prog Ser 295: 279−293
Jones MC, Marron JS, Sheather SJ (1996) A brief survey ofbandwidth selection for density estimation. J Am StatAssoc 91: 401−407
Jonsen I (2016) Joint estimation over multiple individualsimproves behavioural state inference from animal move-ment data. Sci Rep 6: 20625
Jonsen ID, Myers RA, Flemming JM (2003) Meta-analysis ofanimal movement using state-space models. Ecology 84: 3055−3063
Jonsen ID, Flemming JM, Myers RA (2005) Robust state-space modeling of animal movement data. Ecology 86: 2874−2880
Jonsen ID, Myers RA, James MC (2007) Identifying leather-back turtle foraging behaviour from satellite telemetryusing a switching state-space model. Mar Ecol Prog Ser337: 255−264
Kennedy AS, Zerbini AN, Rone BK, Clapham PJ (2014) Indi-vidual variation in movements of satellite-tracked hump-back whales Megaptera novaeangliae in the easternAleutian Islands and Bering Sea. Endang Species Res 23: 187−195
Laidre KL, Heide-Jørgensen MP, Logdson ML, Hobbs RCand others (2004) Seasonal narwhal habitat associationsin the high Arctic. Mar Biol 145: 821−831
MacLeod CD, Santos MB, Pierce GJ (2003) Review of dataon diets of beaked whales: evidence of niche separationand geographic segregation. J Mar Biol Assoc UK 83: 651−665
McLellan WA, McAlarney RJ, Cummings EW, Read AJ, Pax-ton CGM, Bell JT, Pabst DA (2018) Distribution and abun-dance of beaked whales (Family Ziphiidae) off Cape Hat-teras, North Carolina, USA. Mar Mamm Sci 34: 997−1017
McSweeney DJ, Baird RW, Mahaffy SD (2007) Site fidelity,associations, and movements of Cuvier’s (Ziphius cavi-rostris) and Blainville’s (Mesoplodon densirostris) beakedwhales off the island of Hawai’i. Mar Mamm Sci 23: 666−687
Moors-Murphy HB (2014) Submarine canyons as importanthabitat for cetaceans, with special reference to the Gully: a review. Deep Sea Res II 104: 6−19
Moulins A, Rosso M, Nani B, Würtz M (2007) Aspects of thedistribution of Cuvier’s beaked whale (Ziphius cavi-rostris) in relation to topographic features in the PelagosSanctuary (north-western Mediterranean Sea). J MarBiol Assoc UK 87: 177−186
Mullin KD, Fulling GL (2003) Abundance of cetaceans in thesouthern US North Atlantic Ocean during summer 1998.Fish Bull 101: 603−613
Palacios DM, Baumgartner MF, Laidre KL, Gregr EJ (2013)Beyond correlation: integrating environmentally andbehaviourally mediated processes in models of marinemammal distributions. Endang Species Res 22: 191−203
Papworth SK, Bunnefeld N, Slocombe K, Milner-Gulland EJ(2012) Movement ecology of human resource users:
using net squared displacement, biased random bridgesand resource utilization functions to quantify hunter andgatherer behaviour. Methods Ecol Evol 3: 584−594
R Development Core Team (2018) R: a language and envi-ronment for statistical computing. R Foundation for Sta-tistical Computing, Vienna
Reyes C (2017) Abundance estimate, survival and sitefidelity patterns of Blainville’s (Mesoplodon densirostris)and Cuvier’s (Ziphius cavirostris) beaked whales off ElHierro (Canary Islands). MSc thesis, University of St An -drews
Schick RS, Halpin PN, Read AJ, Urban DL and others (2011)Community structure in pelagic marine mammals atlarge spatial scales. Mar Ecol Prog Ser 434: 165−181
Schorr GS, Falcone EA, Moretti DJ, Andrews RD (2014) Firstlong-term behavioral records from Cuvier’s beakedwhales (Ziphius cavirostris) reveal record-breakingdives. PLOS ONE 9: e92633
Shearer JM, Quick NJ, Cioffi WR, Baird RW and others(2019) Diving behaviour of Cuvier’s beaked whales(Ziphius cavirostris) off Cape Hatteras, North Carolina. RSoc Open Sci 6: 181728
Simonis AE, Brownell RL Jr, Thayre BJ, Trickey JS, OlesonEM, Huntington R, Baumann-Pickering S (2020) Co-occurrence of beaked whale strandings and naval sonarin the Mariana Islands, Western Pacific. Proc R Soc B287: 20200070
Singh NJ, Börger L, Dettki H, Bunnefeld N, Ericsson G(2012) From migration to nomadism: movement variabil-ity in a northern ungulate across its latitudinal range.Ecol Appl 22: 2007−2020
Southall BL, Nowacek DP, Miller PJO, Tyack PL (2016)Experimental field studies to measure behavioral re -sponses of cetaceans to sonar. Endang Species Res 31: 293−315
Stanistreet JE, Nowacek DP, Baumann-Pickering S, Bell JTand others (2017) Using passive acoustic monitoring todocument the distribution of beaked whale species in thewestern North Atlantic Ocean. Can J Fish Aquat Sci 74: 2098−2109
Thorne LH, Foley HJ, Baird RW, Webster DL, Swaim ZT,Read AJ (2017) Movement and foraging behavior ofshort-finned pilot whales in the Mid-Atlantic Bight: importance of bathymetric features and implications formanagement. Mar Ecol Prog Ser 584: 245−257
Tyack PL, Johnson M, Soto NA, Sturlese A, Madsen PT(2006) Extreme diving of beaked whales. J Exp Biol 209: 4238−4253
Tyack PL, Zimmer WMX, Moretti D, Southall BL and others(2011) Beaked whales respond to simulated and actualnavy sonar. PLOS ONE 6: e17009
Walter WD, Onorato DP, Fischer JW (2015) Is there a singlebest estimator? Selection of home range estimators usingarea-under-the-curve. Mov Ecol 3: 10
Waples DM, Read AJ (2020) Photo-identification analyses inthe Cape Hatteras study area: 2019 annual progress re -port. Prepared for US Fleet Forces Command. Submittedto Naval Facilities Engineering Command Atlantic, Nor-folk, Virginia, under Contract No N62470-15-D-8006, TaskOrder 19F4026 issued to HDR, Inc., Virginia Beach, VA
Waring GT, Hamazaki T, Sheehan D, Wood G, Baker S(2001) Characterization of beaked whale (Ziphiidae) andsperm whale (Physeter macrocephalus) summer habitatin shelf-edge and deeper waters off the northeast US.Mar Mamm Sci 17: 703−717
Mar Ecol Prog Ser 660: 203–216, 2021216
Waring GT, Josephson E, Maze-Foley K, Rosel PE (eds)(2016) US Atlantic and Gulf of Mexico marine mammalstock assessments—2015. NOAA Tech Memo NMFS-NE-238
Weilgart LS (2007) The impacts of anthropogenic oceannoise on cetaceans and implications for management.Can J Zool 85: 1091−1116
West KL, Walker WA, Baird RW, Mead JG, Collins PW
(2017) Diet of Cuvier’s beaked whales Ziphius cavirostrisfrom the North Pacific and a comparison with their dietworld-wide. Mar Ecol Prog Ser 574: 227−242
Winton MV, Fay G, Haas HL, Arendt M and others (2018)Estimating the distribution and relative density ofsatellite-tagged loggerhead sea turtles using geostatis-tical mixed effects models. Mar Ecol Prog Ser 586: 217−232
Editorial responsibility: Elliott Hazen,Pacific Grove, California, USA
Reviewed by: L. Irvine and 2 anonymous referees
Submitted: April 23, 2020Accepted: November 23, 2020Proofs received from author(s): February 1, 2021
Fig. A1. Trackline of satellite-tagged Cuvier’s beaked whale (a) ZcTag048 and (b) ZcTag057 off Cape Hatteras, North Car-olina, USA, as estimated from a hierarchical switching state-space model, including behavioral state (b-values represented bycolored dots) ranging from 1 (transit) to 2 (area-restricted search) at each estimated location. Also plotted are the core use areaand the home range area. Inset graph in lower right corner demonstrates the net squared displacement throughout the tag
duration — (a) 36.4 d for ZcTag048; (b) 49.4 d for ZcTag057
Appendix. Individual-level plots depicting a single whale's estimated positions and trackline, behavioral state, core use area, home range area, and net-squared displacement throughout tag duration