residual risk evaluation public review draft mound plant · public review draft mound plant...
TRANSCRIPT

•
•
RESIDUAL RISK EVALUATION OU-4 MIAMI-ERIE CANAL AREA
PUBLIC REVIEW DRAFT
Mound Plant Miamisburg, Ohio
Prepared for: U.S. Department of Energy
Prepared by: Science Applications International Corporation
Dublin, Ohio
Managed by: BWXTofOhio
April 14, 2000

•
•
•
1.0
2.0
3.0
3.4 3.5
TABLE OF CONTENTS
INTRODUCTION . . . . . . . . . . . . . . . . . . . . . . . . . . . . . . . . . . . . . . . . . . . . . . . . . . . . . . . . . 1 1.1 Purpose Of Residual Risk Evaluation . . . . . . . . . . . . . . . . . . . . . . . . . . . . . . . . . . . 1 1.2 Scope of the Miami-Erie Canal RRE ................................... 4 1.3 Organization of Report ............................................... 4
DATA COMPILATION AND EVALUATION . . . . . . . . . . . . . . . . . . . . . . . . . . . . . . . . . . 5 2.1 Data Quality Assessment ..................................... : . . . . . . . 6 2.2 Environmental Media Considered and Data Availability ..................... 6 2.3 Data Analysis ...................................................... 7 2.4 Data Screening Process . . . . . . . . . . . . . . . . . . . . . . . . . . . . . . . . . . . . . . . . . . . . . . . 8
2. 4.1 Screening Constituents Based on Background . . . . . . . . . . . . . . . . . . . . 18 2.4.2 Screening Constituents Based on Guideline Val~es ................. 18 2.4.3 Screening Constituents Based on Frequency of Detection ............ 19 2.4.4 Screening Constituents Based on Essential Human Nutrients ......... 19 2.4.5 Additional Screening Procedures ............................... 20
EXPOSURE ASSESSMENT . . . . . . . . . . . . . . . . . . . . . . . . . . . . . . . . . . . . . . . . . . . . . . . 20 3.1 Characterization of Exposure Setting . . . . . . . . . . . . . . . . . . . . . . . . . . . . . . . . . . . 20 3.2 Identifying Exposure Pathways .. : .......... : . ........................ 21 3.3 Identifying Exposure Scenarios ....................................... 22
3.3.1 Recreational Adult and Child Scenarios .......................... 22 3.3.2 Residential Adult and Child Scenarios ................................... 26 3.3.3 Off Site Construction Worker Scenario ................................. 27 Exposure Point Concentrations .............................................. 27 Human Intake Equations And Assumptions . . . . . . . . . . . . . . . . . . . . . . . . . . . . . . . . . . . . 28
4.0 TOXICITY ASSESSMENT ....................................................... 33 4.1 Toxicity Values for Evaluating the Dermal Pathway .............................. 34 4.2 Toxicity Assessment for Lead ............................................... 34 .
5.0 RISK CHARACTERIZATION ..................................................... 36 5.1 Risk Characterization Methods . . . . . . . . . . . . . . . . . . . . . . . . . . . . . . . . . . . . . . . . . . . . . . 3 6
5 .1.1 Quantification of Carcinogenic Risk . . . . . . . . . . . . . . . . . . . . . . . . . . . . . . . . . . . 36 5.1.2 Quantification ofNon-carcinogenic Risk ................................ 37
5.2 Risk Characterization Results ............................................... 38
6.0 UNCERTAINTYINTHERISKASSESSMENT ...................................... 63 6.1 Uncertainty in Analytical Data . . . . . . . . . . . . . . . . . . . . . . . . . . . . . . . . . . . . . . . . . . . . . . . 63 6.2 Uncertainty in Exposure Assessment . . . . . . . . . . . . . . . . . . . . . . . . . . . . . . . . . . . . . . . . . . 63 6.3 Uncertainties Related to Toxicity Information ................................... 64 6.4 Uncertainties In Risk Characterization ........................................ 66
7.0 . REFERENCES ................................................................. 67

•
•
•
Table 2.1
Tabl~2.2
Table 2.3
Table 3.1
Table 4.1
Table 5.1 Table 5.2 Table 5.3 Table 5.4 Table 5.5 Table 5.6 Table 5.7 Table 5.8 Table 5.9 Table 5.10 Table 5.11 Table 5.12 Table 5.13 Table 5.14 Table 5.15
Table 5.16 Table 5.17 Table 5.18
Figure 1.1 Figure 1.2 Figure 3.1
Appendix A
LIST OFT ABLES
Identification of Constituents of Potential Concern for the Recreational RRE of the MiamiErie Canal Area Identification of Constituents of Potential Concern for the Residential RRE of the MiamiErie Canal Area Identification of Constituents of Potential Concern for the Off-Site Construction Worker RRE of the Miami-Erie Canal Area Exposure Assumptions for Recreation, Residential and Off-Site Construction Worker Scenarios in the Miami-Erie Canal Area Toxicity Values and Chemical-Specific Parameters for Constituents of Potential Concern in the Miami-Erie Canal Area Total Residual Risk for a Recreational Adult at the Miami-Erie Canal Area Background Risk for a Recreational Adult at the Miami-Erie Canal Area Incremental Residual Risk for a Recreational Adult at the Miami-Erie Canal Area Total Residual Risk for a Recreational Child at the Miami-Erie Canal Area Background Risk for a Recreational Child at the Miami-Erie Canal Area Incremental Residual Risk for a Recreational Child at the Miami-Erie Canal Area Total Residual Risk for a Residential Adult at the Miami-Erie Canal Area Background Risk for a Residential Adult at the Miami-Erie Canal Area Incremental Residual Risk for a Residential Adult at the Miami-Erie Canal Area Total Residual Risk for a Residential Child at the Miami-Erie Canal Area Background Risk for a Residential Child at the Miami-Erie Canal Area Incremental Residual Risk for a Residential Child at the Miami-Erie Canal Area Total Residual Risk for an Off-Site Construction Worker at the Miami-Erie Canal Area Background Risk for an Off-Site Construction Worker at the Miami-Erie Canal Area Incremental Residual Risk for an Off-Site Construction Worker at the Miami-Erie Canal Area Total Miami-Erie Canal Residual Risk Evaluation Summary Table Background Miami-Erie Canal Risk Evaluation Summary Table Incremental Miami-Erie Canal Residual Risk Evaluation Summary Table
LIST OF FIGURES
Mound Plant Vicinity Map Miami-Erie Canal Area Map Conceptual Site Model for the Miami-Erie Canal RRE
LIST OF APPENDICES
Miami Erie Canal Database (Provided on 3.5 inch disk provided with this report)

•• ATSDR ARAR BVA CDC CERCLA COPCs CSF DOE EPA EPC FFA GV HEAST HI HQ IEUBK IRIS LOAEL NCEA
• NCP ND NOAEL Ohio EPA osc ou PAH PCB ppm PRS QAPjP RAGS RID RfC RME RRE RREM SVOCs TPH TIC UCL VOCs
•
ACRONYMS AND ABBREVIATIONS
Agency for Toxic Substances Disease Registry Applicable or Relevant and Appropriate Great Miami Buried Valley Aquifer Centers of Disease Control and Prevention Comprehensive Environmental Response, Compensation, and Liability Act constituents of potential concern cancer slope factor Department of Energy U.S. Environmental Protection Agency exposure point concentration Federal Facilities Agreement Guideline Values Health Effects and Assessment Summary Tables hazard index hazard quotient Integrated Exposure Uptake Biokinetic Model for Lead in Children Integrated Risk Information System lowest observed adverse effects level National Center for Environmental Assessment National Oil and Hazardous Substances Pollution Contingency Plan Not detected no observed adverse effect level Ohio Environmental Protection Agency On-Scene Coordinator Operable Unit polycyclic aromatic hydrocarbon polychlorinated biphenyls parts per million Potential Release Site quality assurance project plan Risk Assessment Guidance for Superfund reference dose factor reference concentration factor reasonable maximum exposure residual risk evaluation residual risk evaluation methodology semi-volatile organic compounds total petroleum hydrocarbon tentatively identified compound upper confidence limit volatile organic compounds

•
•
Miami-Erie Canal Human Health Residual Risk Evaluation
Executive Summary
This report was prepared using the Mmmd 2000 Residual Risk Evaluation Methodology (DOE
1997a)(RREM) to quantify the potential for cancer and other non-cancer health effects from long-term, low-level
exposures to site-related contaminants in the Miami-Erie Canal area. A Residual Risk Evaluation (RRE)
evaluates human health risks associated with residual levels of contamination remaining within an area to ensure
that future users of the land will not be exposed to unacceptable contaminant levels. Residual risks were
calculated for total risk, background risk and incremental risk for the most likely and most conservative scenarios
for the canal property. These scenarios included current and future recreational user (adult and child), a
hypothetical future resident (adult and child) and a hypothetical adult off site construction worker. These
scenarios included potential exposure to surface and subsurface soil via incidental ingestion, dermal contact,
inhalation of dust and volatile organic compounds and external radiation exposure .
Total, background and incremental non-cancer risks for all receptors in all scenarios were below the
target hazard level. This suggests that non-carcinogenic risks are within acceptable levels. Total, background
and incremental carcinogenic risks for the recreational scenario (adult and child), the residential child and the
adult off site construction worker fell within the acceptable risk range of 104 to 10-6 for both current and future
scenarios. Background carcinogenic risks for the hypothetical adult residential scenario were within the
acceptable carcinogenic risk range. Total and incremental carcinogenic risk for the hypothetical adult resident
slightly exceeded the acceptable risk range of 104 to IQ-6.
Total cancer risk for the residential adult was 3 .1 x 1 04. Of this risk, 1. 2x 1 04 or 3 9% was due to dermal
exposure to benzo(a)pyrene. An additionall.5x104 or 48% of this risk is due to external exposure to radium-
226. Incremental cancer risk was 2.1x10⁴. Of this risk, 1.2x10 4 or 60% was due to dermal exposure to
benzo(a)pyrene. An additional5.0x1o-s or 24% of this risk is due to external exposure to radium-226.
P AHs are ubiquitous in many environments, particularly along railroad right-of-ways, such as the one
running through the canal area. Radium-226 is a naturally occurring radioisotope that is present in background
soils .

• 1.0 INTRODUCTION
•
•
The U.S. Department of Energy's (DOE) Mmmd Plant is located on a 306-acre parcel ofland within the
City of Miamisburg, Ohio, about 10 miles southwest of Dayton, Ohio. Figure 1.1 shows the vicinity of the
Mound Plant The plant is located approximately 2,000 feet east of the Great Miami River and partially overlies
the Great Miami Buried Valley Aquifer (BV A). Since 1948, Mound has operated as a research, development
and production facility in support of DOE's weapons and energy programs. Mound's past weapons program
mission included process development, production engineering, manufacturing, and surveillance of detonators,
explosives, and nuclear components. Mound's current mission is to support DOE's efforts in environmental
management and to transition the site, in cooperation with the City of Miamisburg, from a cold-war production
facility to commercial or industrial use. The Miami-Erie Canal area, the subject of this report, will be returned
to recreational use as a city park. A map of the Miami-Erie Canal area is included as Figure 1.2.
This report was developed using the Mound 2000 Residual Risk Evaluation Methodology (RREM)
(DOE 1997a) to quantify the potential for ~ancer and other non-cancer health effects from long-term, low-level
exposures to site-related contaminants in the canal area also known as Operable Unit 4 (OU-4). A Residual Risk
Evaluation (RRE) evaluates human health risks associated with residual levels of contamination remaining within
an area to ensure that future users of the land will not be exposed to contaminant levels that would pose
unacceptable risks. The RRE results will be used, together with Applicable or Relevant and Appropriate
Requirements (ARARs), to determine the need for additional site remediation or to demonstrate that land is ready
for public use. ·
1.1 Purpose Of Residual Risk Evaluation ·
The objective of the Miami-Erie Canal area RRE is to assess risks associated with residual levels of
contamination that exist after completion of the removal action. Although the RRE method was developed
specifically for use at Mound, the method is consistent with the CERCLA baseline risk assessment method to
ensure that future users of the land will not be exposed to contaminant levels that would pose unacceptable risks .
Residual Risk Evaluation OU-4 Miami-Erie Canal Area Public Review Draft Report
Page 1 of 68

•
• ~E
s
Residual Risk Evaluation OU-4 Miami-Erie Canal Area Public Review Draft Report
Page 2 of68

•
•
~.: ..
\..----~ ·~
'N
~E s
Residual Risk Evaluation OU-4 Miami-Erie Canal Area Public Review Draft Report
Page 3 of68
-~-----·-::·
.:!
.....

• 1.2 Scope oftbe Miami-Erie Canal RRE
The RRE for the Miami-Erie Canal area includes an evaluation ofhwnan health risk for potential residual
contamination in the area following the completion of the removal action documented in the On-Scene
Coordinator (OSC) Report (DOE 1999). The canal area RRE was completed using the Mound 2000 RREM
(DOE 1997a). Since the canal area is currently used for recreation purposes, residual risks were evaluated for
the recreational scenario. Although residential use of the canal area is unlikely, given existing physical
constraints, a residential risk calculation was performed to evaluate the need for additional restrictions. Since
the RREM does not provide exposure assumptions or intake equations for the residential or recreational use
scenarios the needed values were drawn from the "Risk Based Guideline Value.s, Mound Plant, Miamisburg,
Ohio, March, 1997, Final Rev 4" (DOE 1997b).
Residual risks were calculated for total risk, background risk and incremental risk. Total risk was
calculated using the total concentration of the constituents of potential conCern (COPCs) detected in the canal
area. Background risk was calculated based on background levels of the COPCs and incremental risk was
calculated using the difference between total and background levels. Incremental risk can be used to assess the
• increase in risk above background levels due to Mound Plant operations.
1.3 Organization of Report
The RREM provides a framework for eva~uating potential human health risks associated with residual
levels of contamination. Although the RREM is similar to a traditional CERCLA baseline risk assessment, it
serves a different purpose and, therefore, is not identical. The RREM consists of five elements, including:
l. identification of the contaminants to be evaluated,
2. exposure assessment,
3. toxicity assessment,
4. risk characterization,
5. and evaluation of potential cumulative risks.
The following sections describe each of these elements in more detail starting with Section 2.0, Data
Compilation and Evaluation, which describes the methods used to compile Miami-Erie Canal area data and
identify contaminants to be evaluated in the RRE. Section 3.0, Exposure Assessment, summarizes the pathways
• through which hazardous substances may reach potential receptors and intake assumptions used to quantify
Residual Risk Evaluation OU-4 Miami-Erie Canal Area Public Review Draft Report
Page4 of 68

exposure. In Section 4.0, Toxicity Assessment, exposure point concentrations, intake equations and toxicological
• reference values are presented. Information from the exposure assessment is combined with information from
the toxicity assessment to characterize human health risks in Section 5.0, Risk Characterization. Section 6.0,
Uncertainties, presents some of the sources of uncertainty inherent in risk assessments and in the RRE. Section
7.0, References, contains a list of all documents cited in this report.
2.0 DATA COMPILATION AND EVALUATION
Identification of contaminants to be carried through the RRE calculations is a multi-step process
beginning with the identification ~fall contaminants detected in the area and then eliminating contaminants based
upon a set of established screening criteria described in the RREM.
All available sampling data were compiled for use in the Miami-Erie Canal RRE. Newer data was used
to supplement, rather than supersede older data except when older data described materials that had subsequently
been removed from the area. In this case, the older data no longer represent site conditions and were, therefore,
not used in the RRE. Sampling data obtained from the Mound Soil Screening Facility was used except in the case
where a sample was split and analyzed by both the Mound Soil Screening Facility and a commercial analytical
• laboratory. In such cases, the value from the commercial analytical laboratory was used to take advantage of the
greater precision available from the commercial analytical laboratory. Data used to characterize the Miami-Erie
Canal area were drawn from the following data sets:
•
DATA SET DESCRIPTION Canal Removal Action Verification Data Includes samples from South Pond, Runoff Hollow, Overflow Creek, and portions of the Plant Drainage Ditch between the plant boundary and the canal
Water Park/Tennis Court Sampling Results Samples obtained in park area as part of previous investigations
Twin 60s Sediment Sampling
REFERENCE On-Scene Coordinator Report, OU-4 MiamiErie Canal Removal Action, Final, June, 1999
OU-9 Regional Soils Investigation Report, August 1995, Final, Revision 2
Mound Laboratory Environmental Plutonium Study 1974 (MLM-02249), September 1975
PRS 416 Data Package, Unpublished
The following data sets were excluded because they represent areas remediated by removal actions .
Residual Risk Evaluation OU-4 Miami-Erie Canal Area Public Review Draft Report
Page 5 of68

• DATA SET DESCRIPTION Original Rogers Study
Special Canal Sampling, SAIC 1992 Agency for Toxic Substances Disease Registry (ATSDR)
REFERENCE "Mound Laboratory Environmental Plutonium Study (1974). Samples from the park vicinity were included in the RRE.
"Health Consultation, DOE Mound Plant" (1994)
The A TSDR report included samples obtained from the park area, however, insufficient information
about the analytical techniques (e.g. minimum detectable activities, sample quantitation limits) was provided
to allow for data verification, so the data were not included in the RRE.
2.1 Data Quality Assessment
Samples were collected and analyzed according to the methods outlined in the OU9 Quality Assurance
Project Plan (QAPjP) (DOE 1993a) and the OU5 QAPjP (DOE 1993b). All data used in the risk assessment
have undergone Quality Assurance/Quality Control (QNQC) evaluation and data validation in accordance with
the requirements described in the OU9 QAPjP (DOE 1993a) and the OU5 QAPjP (DOE 1993b).
• 2.2 Environmental Media Considered and Data Availability
•
Field investigations conducted for the canal area are listed above. Samples were analyzed for volatile
organic compounds (VOCs), semi-volatile organic compounds (SVOCs), pesticides and polychlorinated
biphenyls (PCBs), dioxins/dibenzofurans, metals, common anions, total petroleum hydrocarbons (TPH), and
radionuclides. Environmental media that were evaluated include surface soil (0-2 feet below land surface),
subsurface soil (>2 feet below land surface), and sediment. During the canal area removal action, approximately
38,000 yds3 of soil were removed. Only 16 out 15,214 analyses were run on soil collected more than two feet
below land surface. Following soil removal, clean soil was brought in to backfill excavated areas so samples
collected at 0-2 feet below land surface may now have an additional 1-2 feet of clean fill over them.
Although it is possible that contamination in the canal area may leach through soil to reach the BV A,
for the canal area RRE it was assumed that residential, recreational and off site construction worker receptors
would drink municipally supplied water, not water obtained from the BV A. Potential risks due to exposure to
BVA groundwater will be assessed prior to completion of the fmal Mound Record of Decision .
Residual Risk Evaluation OU-4 Miami-Erie Canal Area Public Review Draft Report
Page 6 of 68

Canal area drainage ways contain water only during heavy rain events and therefore, are dry most of the
• time. Due to intermittent flow in the canal area ditches, receptors in the canal area were asswned to come into
contact with sediments with the same frequency, as they would surface soils. Therefore, the exposure
asswnptions for soils and sediments are the same and these media have been merged into one data set for the
RRE. Merging the soil and sediment data sets increased the statistical power of the data set by increasing the
number of observations. Since the same exposure asswnptions were used to estimate exposures to sediment and
soil, combining the data sets does not reduce the overall estimate of risk but does simplify the presentation of
RRE results.
•
•
2.3 Data Analysis
For each constituent detected in Miami-Erie Canal area soils, the 95% upper confidence limit of the mean
(UCL) was calculated to estimate the concentration that receptors in the area may be exposed to. This is known
as the Exposure Point Concentration or EPC. The 95% UCL was calculated in accordance with Mound 2000,
Gilbert's Statistical Methods for Environmental Pollution Monitoring (Gilbert 1987), and the Supplemental
Guidance to RAGS: Calculating the Concentration Term (EPA, 1992a). Before calculating the 95% UCL, the
distribution of the data set was determined. If the data were found to be normally distributed, the EPC was
calculated as the 95% UCL of the arithmetic mean of the data, using the Student's t-statistic (EPA 1992a). If the
data were found to be log normally distributed, the EPC was calculated as the 95% UCL using the H-statistic
(EPA 1992a).
The 95% UCL on the arithmetic mean for normal data sets was calculated as follows:
95% UCL= Mean+ t(s/n ';,)
Where:
UCL= upper confidence limit, t = t statistic (Table A2, Gilbert,. 1987), s = standard deviation, and n = number of observation in the data set ·
Residual Risk Evaluation OU-4 Miami-Erie Canal Area Public Review Draft Report
Page 7 of 68

•
•
•
The 95% UCL equation of the arithmetic mean for log-normal data sets was calculated as follows:
95% UCL = e Mean+H(sl(n-1) 'h)
Where:
UCL = upper confidence limit, H = H statistic (Table A12, Gilbert, 1987), s = standard deviation, and n = number of observations in the data set e =constant
If the 95% UCL exceeded the maximum value observed in the sampling results , the maximum value was
used as the EPC for that constituent (whether the data were normally or log nolmally distributed). For both
chemical and radiological constituents "not detected" (ND) results were treated as one-half the limit of detection
and included in the calculations of the mean and UCL values. Blind field duplicates were collected to assess
variability in the sampling process. Duplicate samples were used in the data quality assessment but were not
included in the calculation of the exposure point concentrations. If a data set had less than twenty observations
(n<20) the maximum detected concentration was used as the EPC. For radionuclides, zero or negative results
with no detection limits were excluded from the data set. Data qualified as "J", or estimated values at
concentrations less than the detection limit, were evaluated as half the detection limit. For "J" data, which was
greater than the detection limit or reported without the sample detection limit, the value was used as reported.
Samples reported as ND or zero with no detection limit were not utilized in calculating a 95% UCL. Data flagged
with an "R", meaning rejected, were also not used in calculating the EPC.
2.4 Data Screening Process
All constituents that were detected one or more times were listed in constituent summary tables and
sorted by media and depth where they were detected. The constituent screening methods described below were
then used to generate a final list of constituents of potential concern (COPCs ). The constituent summary tables
also provide maximum detected concentrations, the range of contaminant detection limits, the frequency of .
detection and the decision and rationale to include or exclude a constituent from further consideration in the RRE.
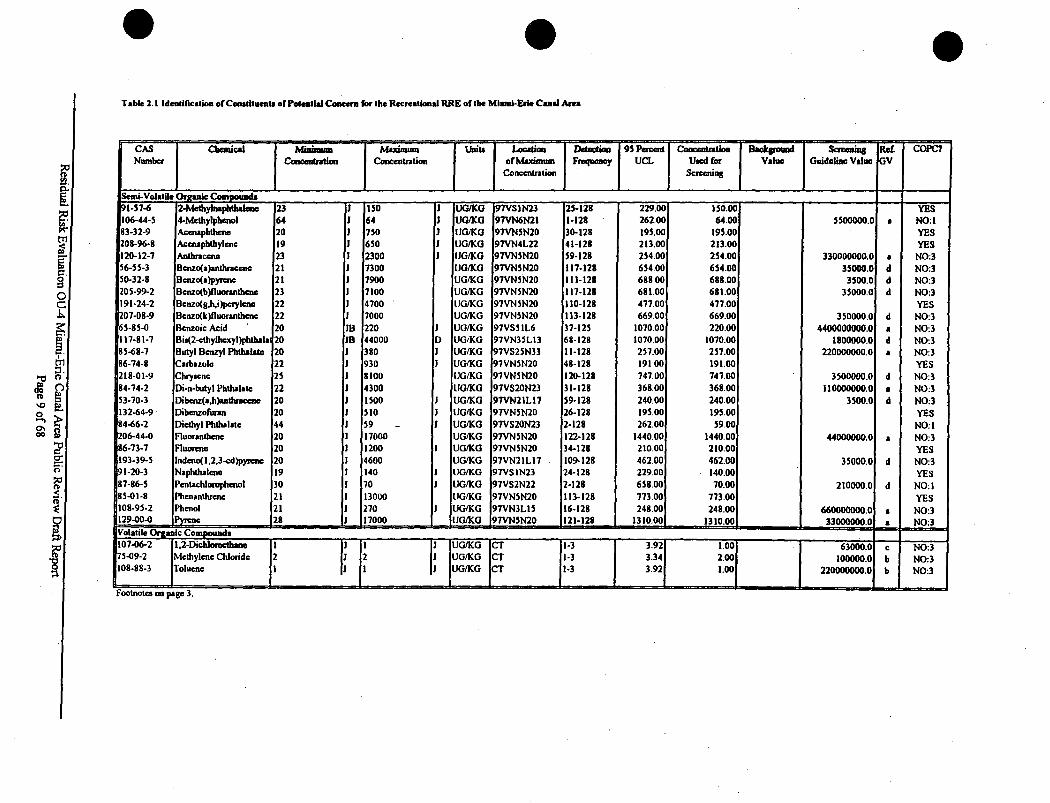
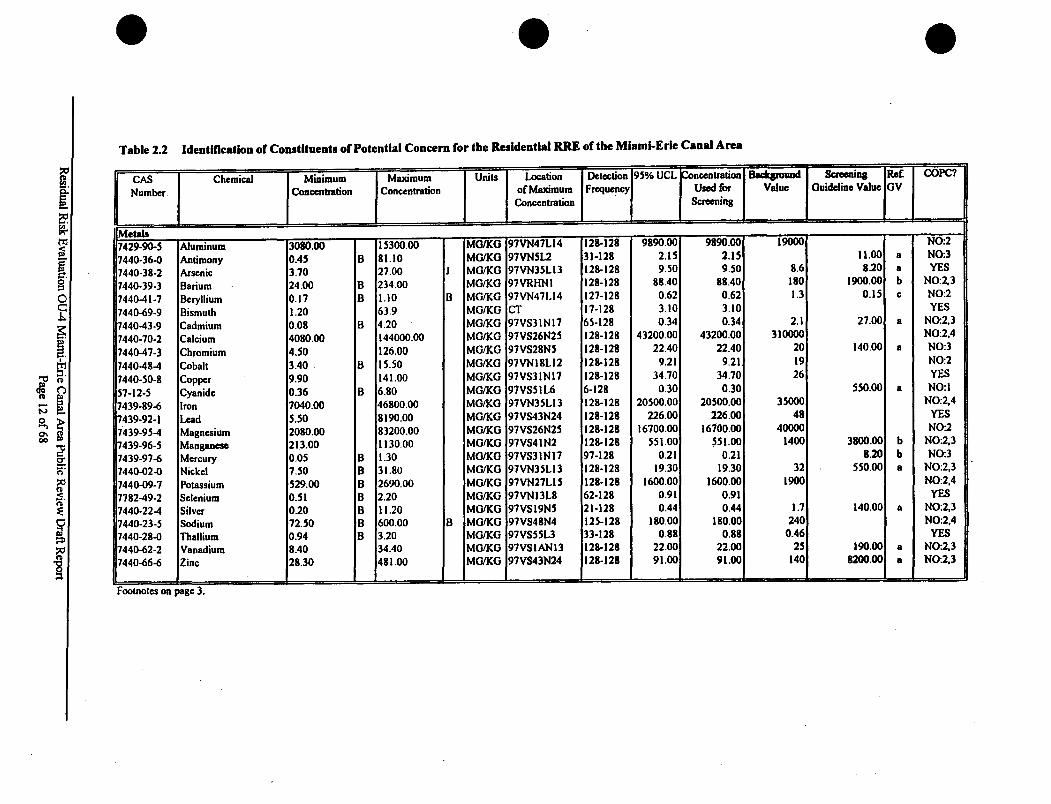
The following section describes how COPCs were selected. Tables 2.1, 2.2 and 2.~ identify the COPCs for the
recreational, residential, and off site construction worker scenarios, respectively .
Residual Risk Evaluation OU-4 Miami-Erie Canal Area Public Review Draft Report
Page 8 of 68
i. [ ~ ~ tTl e. ~ ~-g
~ ~
! ::::1.
'"tl n
!i ia
~ c;·
~ ~-
~ f ::1
• • Table l.l ldeatiRcation or Coa.tituetlb or Poteatlal Coac:em tor the Recreational RRE or the MIUDI-Erie Canal Area
CAS a.cmical Miaiaua M.lximum Uaill Loc:.dioa Dctoc:liaa Number Coaccutration Concaltration of Maximum Fn:queucy
Concentration
Semi-VolatUe Orl!llllic: ComiiOUDda ~1-57-6 2-Mcthylllapldlla'- 23 J ISO J UGIKG 97VS1N23 25-128 106-44·5 4-Melhylphcnol 64 J 64 J UGJKG 97VN6N21 1-128 83-32-9 Accnaphlhcnc 20 J 750 J UGIKG 97VN5N20 30.128 208-96·8 Accoaphlhylene 19 J 650 J UGIKG 97VN4L22 41-121 120·12-7 Anthracene 23 J 2300 J UGIKG 97VN5N20 59·121 56-55-3 Bcnzo(a)anlhraccno 21 J 7300 UGIKG 97VN5N20 117-121 50-32-1 Bcnzo(a)pyrc:nc 21 I 7900 UGIKG 97VN5N20 111-121 205-99-2 Bcnzo(b )fluonnlhcnc 23 J 7100 UGIKG 97VNSN20 117-128 191-24-2 Benzo(g,h,i)pcrylc:no 22 I 4700 lJGIKG 97VN5N20 110-121 207-08-9 Benzo(k)fluoranlhcnc 22 I 7000 UGIKG 97VNSN20 113-121 65-85~ Benzoic Acid 20 m 220 I UGIKG 97VS51L6 37·125 117-81-7 Bio(2-cthylhcxyl)phthala 20 m 44000 D UG1KG 97VN3SLI3 68-128 85-68-7 Butyl Benzyl Phthalate 20 J 380 J UGIKG 97VS2SN33 11-121 86-74-8 Carbazole 22 I 930 I UGIKG 97VN5N20 48-128 218-01-9 Chryacnc 25 J 8100 lJGIKG 97VNSN20 120-128 84-74-2 Di-n-butyl Pbthalato 22 J 4300 LIGIKG 97VS20N23 31-128 53-70-3 Dibcnz(a,h)antbrac:cnc 20 J 1500 J UGIKG 97VN21LI7 59-128 132-64-9 Dibcnzofinn 20 J SIO J UGIKG 97VNSN20 26-128 84-66·2 Dicthyl Phthalate 44 J 59 - J UGIKG 97VS20N23 2-121 206-44~ Fluoranthcnc 20 J 17000 UGIKG 97VN5N20 122·128 86·73-7 Fluon:ne 20 J 1200 I UGIKG 97VNSN20 34·128 193-39-S lndeno(1,2,3-cd)pyra~e 20 J 4600 UGIKG 97VN21Ll7 109-128 91·20·3 Naphthalene 19 J 140 I UGIKG 97VSIN23 24-128 87-86-S Pentachlorophenol 30 J 70 J UGIKG 97VS2N22 2·128 85~1-8 Phenanthrene 21 I 13000 lJGIKG 97VN5N20 113·128 108-95-2 Phenol 21 J 270 I UGIKG 97VN3LI5 16-128 129~0~ !Pyrone 21 J 17000 UGIKG 97VN5N20 121·128 Volatile Orgulc CompoUDcls 107~6-2 1,2-DichJorvctbanc I
I! I
I! UGIKG CT 1·3
75~9-2 Methylene Chloride 2 2 UGIKG CT 1-3 108-88-3 Toluene I I UGIKG CT 1-3
Footnotes on page 3.
• 95 Pcn:cnt Coac:cutratioa Backpauad Sc:n:cains Rc£ COPe?
UCL UICdror Value Guideline V aluc GV Screening
229.00 .,0.00 YES 262.00 64.00 5500000.0 • NO: I 195.00 195.00 YES 213.00 213.00 YES 254.00 254.00 330000000.0 • N0:3 654.00 654.00 35000.0 d N0:3 618.00 688.00 3500.0 d N0:3 681.00 681.00 35000.0 d N0:3 471.00 477.00 YES 669.00 669.00 350000.0 d N0:3
1070.00 220.00 4400000000.0 • N0:3 1070.00 1070.00 1800000.0 d N0:3 257.00 257.00 220000000.0 • N0:3 191.00 191.00 YES 747.00 747.00 3500000.0 d N0:3 368.00 368.00 110000000.0 • N0:3 240.00 240.00 3500.0 d N0:3 195.00 195.00 YES 262.00 59.00 NO: I
1440.00 1440.00 44000000.0 a N0:3 210.00 210.00 YES 462.00 462.00 35000.0 d N0:3 229.00 140.00 YES 658.00 70.00 210000.0 d N0:1 773.00 773.00 YES
I
248.00 248.00 660000000.0 • N0:3 1310.00 1310.00 33000000.0 N0:3
I a
3.92 1.00 63000.0 c N0:3 3.34 2.00 100000.0 b N0:3 3.92 1.00 220000000.0 b N0:3
-

~ t ~ ~ tT1
~ g· ~ ~ ~-m ., ~
em n ~ i e.i;'" g; f;&
~ c:;·
~ ::i. ~
~ ~ 1
• • Table 1.1 ldentilic:alion or CODJtituenta or Potential Conc:cm ror the Recreational RRE or the Miami-Erie Cual ARa
CAS Chanica! MiDimum Maximum Unita Lacaliaa Dalcctiao
Number Conc:cnlration Concentration ofMaximmn Frequency Concentration
Metala 7429-90-5 Aluminmn 3080.00 15300.00 MGIKG 97VN47L14 128-128
7440-36-0 Antimony 0.45 B 81~10 MGIKG 97VN5L2 31-128
7440-38-2 Ancnic 3.70 27.00 J MGIKG 97VN35LJ3 128-128
7440-39-3 Barium 24.00 B 234.00 MGIKG 97VRHN1 128-128
7440-41-7 Bcryllium 0.17 B 1.10 B MGIKG 97VN47L14 127-128
7440-69-9 Biamulh 1.20 63.9 MGIKG CT 17-128
7440-43-9 Cadmium 0.08 n 4.20 MGIKG 97VS31N17 65-128
7440-70-2 Calcium 4080.00 144000.00 MGIKG 97VS26N25 128-128
7440-47-3 Chromium 4.50 126.00 MGIKG 97VS28N5 128-128
7440-48-4 Co ball 3.40 II IS. SO MGIKG 97VNJ8L12 128-128
7440-50-8 Copper 9.90 141.00 MGIKG 97VS3JNJ7 128-128
57-12-5 Cyanide 0.36 B 6.80 MGIKG 97VS511.6 6-128
7.439-89-6 Iron 7040.00 46800.00 MGIKG 97VN35L13 128-128
7439-92-1 Lead 5.50 8190.00 MGIKG 97VS43N24 128-128
7439-95-4 Magncaimn 2080.00 83200.00 MGIKG 97VS26N25 128-128
7439-96-5 Mans•- 213.00 1130.00 MGIKG 97VS4JN2 128-128
7439-97-6 Mercury 0.05 B 1.30 MGIKG 97VS3JN17 97-128
7440-02-0 Nickel 7.50 B 31.80 MGIKG 97VN35LI3 128-128
7440-09-7 Potassium 529.00 B 2690.00 MGIKG 97VN27LJS 128-128
1782-49-2 Selenium 0.51 B 2.20 MGIKG 97VNI3LB 62-128
7440-22-4 Silver 0.20 B 11.20 MGIKG 97VS19N5 21-128
7440-23-5 Sodium 72.50 B 600.00 0 MGIKG 97VS48N4 125-128
7440-28-0 Thallium 0.94 B 3.20 MGIKG 97VS55L3 33-128
7440-62-2 Vanadium 8.40 34.40 MGIKG 97VSJAN13 128-128
7440-66-6 Zinc 28.30 481.00 MGIKG 97VS43N24 128-128
Footnote• on pa8c 3.
• ~%UCL Caal:calratiaa Backpmd Sc:rar:aiDa Ref. COPC7
Uacd for Valuo Guideline Value GV
Screening
9890.00 9890.00 19000 N0:2
2.15 2.15 44.0 I N0:3
9.50 9.50 8.6 33.0 • N0:3
88.40 88.40 180 77000.0 b N0:2,3
0.62 0.62 1.3 "6.0 c N0:2,3
3.10 3.10 YES
0.34 0.34 2.1 1100.0 a N0:2,3
43200.00 43200.00 310000 N0:2,4
22.40 22.40 20 5500.0 a N0:3
9.21 9.21 19 N0:2
34.70 34.70 26 YES
0.30 0.30 22000.0 • NO: I
20500.00 20500.00 35000 N0:2.,4
226.00 226.00 48 YES
16700.00 16700.00 40000 N0:2,4
551.00 551.00 1400 130000.0 b N0:2,3
0.21 0.21 330.0 b NO:J
19.30 19.30 32 22000.0 I N0:2,3
1600.00 1600.00 1900 N0:2,4
0.91 0.91 YES
0.44 0.44 1.7 5500.0 a N0:2,3
180.00 180.00 240 N0:2
0.88 0.88 0.46 YES I
22.00 22.00 2S 7100.0 • N0:2,3
91.00 91.00 140 330000.0 • N0:2,3 I

I ~ ~
~ ~-g 0
I: ~ ~-. I.Tl
""' R· rl (') ~[ s, ~ &l tl
~ 5-S' :S. (II
~
i :;o
1
• • Table 2.1 ldftlilkalloa of Condltuenls otPateatlal Coacera for lhe Recreacianal RRE or die Miami-Erie Canal Area
CAS Chcrtlic.tl MiaiJaum Number c~
Pesticides/PCBS 160-S7·l Dieldrin 1.100 ,494'70-5 EadrinKetonc 0.430 5103-74·2 G1mma Cblonl•oc 0.300
Rldiomldida 1004S-97·3 Cesium-137 0.19 13981·16·3 Plutonium-238 0.01 PU-2391240 PlutMium-2391240 0.00 13966..00-2 Pow.ium-40 11.10 13982-63-3 R.adium-226 1.84 10098-97·2 Sbontiwn-90 0.61 14274-82-9 Thoriwn-228 0.87 14269-63-7 Thorium-230 0.87 74~0-29-1 Thorium-232 0.!11 10028-11-8 Tritium 0.0!1 13966-29·!1 Uraniwri-234 0.62 1!1117·96-1 Uranium-23S 0.01 7440-61-1 Uraoium-238 0.64 a= J/10111 Hlfor iqataoa b= 1110111 HI ror ingestion+ inhalation
c= ao·• cancer ritk for ingestion+ ini'Lilalion
d~ J0'6 cancer riJk for ingcsliOD
e= 10"6 cancer ritk for inption + inhalation + a:tcru.l •J• = cstimlled quanlitiy "B"'" analytc detceted in .usociatcd blank
Maxinwm Conc:cntlation
1.100 J 2.000 J 0.300 J
0.19 J . 7U
4.17 14.90 3.04 7.20 7.67 1.99 2.17 79.60 1.28 0.10 1.62
Units Loc.diao otMill:imam Conccnlntion
UGIKG CT UGIKG CT UGtKG CT
PCIIG CT PCIIG 97VS34N9 PCliG 97VSONI6 I'CIIG CT PCI!G CT PCIIG CT PCIIG 97VSl9NS PCI!G 97VS8N21 PCIIG 97VS47N29 PCIIG 97VS19NS PCI/0 97VSI7N6 PCIIG 97VN31N17 PCI/0 97VN35Ll3
Dc:tcc:liOD "Pacczll Frequcacy UCL
1·3 1.33 3·3 2.47 1-3 . 0.34
1·3 0.25 683·702 23.00 412-680 0.10 3-3 16.00 2-3 4.09 3-3 9.22 126-126 1.27 126-126 1.57 126·126 1.00 106-124 5.96 126-126 0.9!1 97-126 0.05 126-126 1.00
NO: I • <5% Dc:lecll N0:2 • <Badcsround
COIICCIIII'IIion U....tfor
Sccccning
1.10 2.00 0.30
0.19 23.00 0.10
14.90 3.04 7.20 1.27 l.S1 1.00 !1.96 0.95 0.!10 1.00
N0:3 ·<Screening To..Ucity VaiiiC
N0:4 • EISCtllill Human Nutricat I.OOE-06 it equivalent II> 1.00 x 10"'
• ~ Scrccoiaa Ref. COPC?
V•lue Guideline Value GV
1600.0 c N0:3 YES YES
0.42 0.8 0 N0:2,3 o.u 110.0 ~ N0:3 0.18 100.0 c N0:2,3
n NO:l 2 0.3 c YES
0.72 570.0 0 N0:3 1.5 1.7 c N0:2.3 1.9 820.0 e N0:2,3 1.4 950.0 c N0:2,3 1.6 45000.0 c NO:J 1.1 710.0 c N0:2,3 '
0.11 6.6 • NO:l 1.2 31.0 c N0:2,J __
:;:g
I ~ ~ tr1
~ C'. g
~ ~ §.
"lj~ ~ (')
~ [ s,~ ~ ~
~ :::::-: 0
~ :s. ~
~ i
• • Table 2.2 Identification of Constituents of Potential Concern for the Residential RRE of the Miami-Erie Canal Area
CAS Chemical Minimum Maximum Units Location Dctc:c;tion 95%UCL jeonc;cntration
Number Concentration Concentration of Maximum frequency Used for Conc;cntration Screening
Metals 7429-90-5 Aluminum 3080.00 15300.00 MOIKO 97VN47L14 128-128 9890.00 9890.00
7440-36-0 Antimony 0.45 B 81.10 MOIKO 97VN512 31-128 2.15 2.15
7440-38-2 Arsenic: 3.70 27.00 J MG/KG 97VN35Ll3 128-128 9.50 9.50
7440-39-3 Barium 24.00 B 234.00 MO!KG 97VRHN1 128-128 88.40 88.40
7440-41-7 Beryllium 0.17 B 1.10 B MG!KO 97VN471.14 127-128 0.62 0.62
7440-69-9 Bismuth 1.20 63.9 MG!KO CT 17-128 3.10 3.10
7440-43-9 Cadmium 0.08 B 4.20 MG/KG 97VS31Nl7 65-128 034 0.34
7440~70-2 Calcium 4080.00 144000.00 MG!KG 97VS26N2S 128-128 43200.00 43200.00
7440-47-3 Chromium 4.50 126.00 MG/KG 97VS28N5 128-128 22.40 22.40
7440-48-4 Cobalt 3.40 B 15.50 MG!KG 97VN18Ll2 128-128 9.21 9.21
7440-50-8 Copper 9.90 141.00 MG!KO 97VS31Nl7 128-128 34.70 34.70
57-12-5 Cyanide 0.36 B 6.80 MOIKG 97VS51L6 6-128 0.30 0.30
7439-89-6 Iron 7040.00 46800.00 MG!KG 97VN35Ll3 128-128 20500.00 20500.00
7439-92-1 Lead 5.50 8190.00 MG/KG 97VS43N24 128-128 226.00 226.00
i439-95-4 Magnesium 2080.00 83200.00 MG!KG 97VS26N25 128-128 16700.00 16700.00
7439-96-5 Manganese 21.3.00 1130.00 MG!KG 97VS41N2 128-128 551.00 ~51.00
7439-97-6 Mercury 0.05 B 1.30 MG/KG 97VS31NI7 97-128 0.21 0.21
7440-02-0 Nickel 7.50 B 31.80 MG/KO 97VN35Ll3 128-128 19.30 19.30
7440-09-7 Potassium 529.00 B 2690.00 MOIKG 97VN27Ll5 128-128 1600.00 1600.00
7782-49-2 Selenium 0.51 B 2.20 MG/KG 97VN13L8 62-128 0.91 0.91
7440-22-4 Silver 0.20 B 11.20 MGIKG 97VS19N5 21-128 0.44 0.44 7440-23-5 Sodium 72.50 B 600.00 B MG/KG 97VS48N4 125-128 180.00 180.00 7440-28-0 Thallium 0.94 B 3.20 MOIKO 97VS55L3 33-128 0.88 0.88 7440-62-2 Vanadium 8.40 34.40 MOIKG 97VS1AN13 128-128 22.00 22.00
7440-66-6 Zinc 28.30 481.00 MOIKG 97VS43N24 128-128 91.00 91.00
Footnotes on page 3.
• Bacqrouud Sc:recning Rc£ COPC?
Value Guideline Value ov
19000 N0:2 11.00 a N0:3
8.6 8.20 • YES 180 1900.00 b N0:2,3 1.3 0.15 c; N0:2
YES 2.1 27.00 a N0:2,3
310000 N0:2,4 20 140.00 a N0:3 19 N0:2 26 YES
550.00 a NO: I 35000 N0:2,4
48 YES 40000 N0:2
1400 3800.00 b N0:2,3 1.20 b N0:3
32 550.00 a N0:2,3 1900 N0:2,4
YES 1.7 140.00 a N0:2,3
240 N0:2,4 0.46 YES
25 190.00 a N0:2,3 140 8200.00 • N0:2,3

• • • Table 2.2 Identification of Constituents of Potential Concern for the Re1ldentlal RRE of the Miami-Erie Canal Area
~ [
CAS Chemic:al Minimum Maximum Units Location Dctcc;tion 9S%UCL jeon<:entration BlctpouDd ScRcoina Rot CO PC?
Number Concentration Concentration of Maximum Frequency Used Cor Value Guideline Value GV
Concentration Sc:rccning
~ ~ tr:l < e. ~ C".
8 0 c:: 1. ~ ~. I
tr:l
"' ~· &l (')
~ i e.~ ~ ~
d' g c;· ::0 n ~.
~
~ ::0
1
Said-Volatile Ori!Uiic ComDOIIIIIb ~1-57-6 2-Mcthylnaphthalene 23 J ISO J UGIKG 97VSIN23 25-128 229.00 150.00 YES
106-44-S 4-Methylphenol 64 J 64 J UGIKG 97VN6N21 1-128 262.00 64.00 140.00 a N0:1
83-32-9 Accnaphthene 20 J 750 J UGIKG 97VNSN20 30-128 195.00 195.00 YES
208-96-8 Acenaphthylene 19 J 650 J UGIKG 97VN4L22 41-128 213.00 213.00 YES
120-12-7 Anthracene 23 J 2300 J UGIKG 97VN5N20 59-128 254.00 254.00 1200000.00 a N0:3
56-55-3 Benzo( a )anthracene 21 J 7300 UGIKG 97VN5N20 117-128 654.00 654.00 880.00 d N0:3
50-32-8 Benzo(a)pyrcno 21 J 7900 UGIKG 97VN5N20 111-121 688.00 688.00 88.00 d YES
205-99-2 Benzo(b )Ouoranthene 23 J 7100 UGIKG 97VNSN20 117-128 681.00 681.00 880.00 d N0:3
191-24-2 Benzo(g,h,i)perylcne 22 J 4700 UGIKG 97VN5N20 110-128 477.00 477.00 YES
207-08-9 Benzo(lt)Ouoranthene 22 J 7000 UGIKG 97VN5N20 113-128 669.00 669.00 8800.00 d N0:3
65-85-0 Benzoic Acid 20 JB 220 J UGIKG 97VS51L6 37-125 1070.00 220.00 110000000.00 a NO:J
117-81-7 Bis(2-cthylhexyl)phthal1 20 JB 44000 D UGIKG 97VN3SLI3 68-128 1070.00 1070.00 46000.00 d N0:3
85-68-7 Butyl Benzyl Phthalate 20 J 380 J UGIKG 97VS2SN33 11-128 257.00 257.00 5500000.00 a N0:3
86-74-8 Carbazole 22 J 930 J UGIKG 97VN5N20 48-128 191.00 191.00 YES
218-01-9 Chryscne 25 J 8100 UGIKG 97VN5N20 120-128 747.00 747.00 88000.00 d N0:3
84-74-2 Di-n-butyl Phthalate 22 J 4300 UGIKG 97VS20N23 31-128 368.00 368.00 2700000.00 • N0:3
53-70-3 Dibcnz( a,h)anthracene 20 J 1500 J UGIKG 97VN21Ll7 59-128 240.00 240.00 88.00 d YES
132-64-9 Dibcnzofuran 20 J 510 J UGIKG 97VNSN20 26-128 195.00 195.00 YES
84-66-2 Diethyl Phthalate 44 J 59 J UGIKG 97VS20N23 2-128 262.00 59.00 N0:1
206-44-0 Fluoranthene 20 J 17000 UGIKG 97VNSN20 122-128 1440.00 1440.00 1100000.00 a N0:3
86-73-7 Fluorene 20 J 1200 J UGIKG 97VN5N20 34-128 210.00 210.00 YES
193-39-5 lndeno( 1,2,3-cd)pyrcne 20 J 4600 UGIKG 97VN21Ll7 109-128 462.00 462.00 880.00 d N0:3
91-20-3 Naphthalene 19 J 140 J UGIKG 97VSIN23 24-128 229.00 140.00 YES
87-86-S Pentachlorophenol 30 J 70 J UGIKG 97VS2N22 2-128 658.00 70.00 5300.00 d NO: I
85-01-8 Phenanthrene 21 J 13000 UGIKG 97VN5N20 113-128 773.00 773.00 YES
108-95-2 Phenol 21 J 270 J UGIKG 97VN3Ll5 16-128 248.00 248.00 16000000.00 a N0:3
129-00-0 Pyrcne 28 J 17000 UGIKG 97VN5N20 121-128 1310.00 1310.00 820000.00 • N0:3
Volatile OrRanic: ComiiOIIDIIs 107-06-2 1.2-Dichlorocthane I J I J UGIKG CT 1-3 3.92 1.00 1600.00 c N0:3
75-09-2 Methylene Chloride 2 J 2 J UGIKG CT 1-3 3.34 2.00 100000.00 b N0:3
108-88-3 Toluene I J I J UGIKG CT 1-3 3.92 1.00 25000.00 b N0:3
Footnotes on page 3.

:::c
I C! "' PI'" ttl e. iii r::. 0 ::s 0
~ ~ §. I
ttl ., ~-~ ("}
~ [ S.i;> ~ ~
~ g r;· :::c 0 :s. 0 ~
~ :::c
1
• • Table 2.2 Identification of Constituents of Potential Concern for the Residential RRE of the Miami-Erie Canal Area
- -----
CAS Chemic:al ·Minimum Number· Conc:entration
PadddcsiPCDS 60-57-1 Dieldrin 1.100 53494-70-5 Endrin Ketone 0.430 5103-74-2 Gamma Chlordane 0.300
Radionuclldes 10045-97-3 Cesium-137 0.19 13981-16-3 Plutonium-238 0.01 PU-239/240 Plutonium-239/240 0.00 13966..(){)-2 Potassium-40 11.10 13982-63-3 Radium-226 1.84 10098-97-2 Strontium-90 0.52 14274-82-9 Thorium-228 0.61 14269-63-7 Thorium-230 0.87 7440-29-1 Thorium-232 0.51 10028-17-8 Tritium 0.05 13966-29-5 Uranium-234 0.62 15117-96-l Uranium-235 0.01
• 7440-61-1 Uranium-238 0.64 a= Ill Oth HI for ingestion b= 1/1 Oth HICor ingestion + inhalation c= I o·' cancer risk for ingestion + inhalation
d= 10" cancer risk for ingestion
e= I 04 cancer risk for ingestion + inhalation + c:xlcmal •r ~estimated quantitiy "8" = analytc detected in associated blank
- -·----Maximum
Concentration
1.100 J 2.000 J 0.300 J
0.19 J 715.00
4.17 1490 3.04 7.20 7.67 7.99 2.17 79.60 1.28 0.10 1.62
-· ------------------- ----------- -------·
Units Loc:ation of Maximum Concentration
UGIKG CT UOIKO CT UGIKG CT
PCIIG CT PCIJG 97VS34N9 PCI/G 97VS43N16 PCI/G CT PCIJG CT PCIJG CT PCI/G 97VSI9N5 PCIJO 97VS8N21 PCIJG 97VS47N29 PCIJG 97VS19N5 PCI/G 97VSI7N6 PCI/G 97VN31NI7 PCI/G. 97VN35L13
Detection 95%UCL Frequency
1·3 1.33 3-3 2.47 1-3 0.34
1-3 0.25 689-718 22.50 412-680 0.10 3-3 16.00 2-3 4.09 3-3 9.22 126-126 1.27 126-126 1.57 126-126 1.12 106-124 5.96 126-126 0.95 97-126 0.05 126-126 1.03 NO: I • <5% Detects N0:2 • <Background
jCom:entration Used for
Screening
1.10 2.00 0.30
0.19 22.50 0.10
14.90 3.04 7.20 1.27 1.57 1.00 5.96 0.95 0.05 1.03
N0:3 - < Screening Toxicity Value
N0:4 • Essential Human Nutrient
I.OOE~ is equivalent to 1.00 x 10⁴
• Backgrouud Sc:Renina Ref. COPC?
Value Guideline Value GV
40.00 c N0:3 YES YES
0.42 0.05 e N0:2 0.13 2.70 c YES 0.18 2.50 e N0:2,3
37 N0:2 2 0.02 e YES
0.72 14.00 e N0:3 I.S 0.11 e N0:2 1.9 21.00 e N0:2,3
I 24.00 e N0:3 1.6 11000.00 e N0:3 1.1 18.00 e N0:2,3
0.11 0.41 e N0:2,3 1.2 1.80 e N0:2,3
·-

• • • Table 2.3 Identlflc:atlon of Constituent• of Potential Concern for tbe Oft' Site Construction Worker RRE of the Miami-Erie Canal Area
c ~
CAS . Chemic:al Minimum Maximum Units Location DciOc:tion 95%UCL jeoncentration Bacqround Scrocains Ret COPC?
Number. Concentration Concentration of Maximum Frequency Usodfor Valuo Guideline Value ov Concentration Screening
~ ~ ttl
~ r:;t. 0 ::s 0
t ~ m. trJ
"d ~-.g (')
~ i g,~ ~ Q
~ :=: n ~ I'll ;S. I'll ~
~ !
Metals 7429-90-5 Aluminum 3080.00 15300.00 MOIKO 97VN47L14 128-128 9890.00 9890.00 19000 N0:2
7440-36-0 Antimony 0.45 B 81.10 MOIKO 97VN5L2 31·128 2.15 2.15 8.50 a N0:3
7440-38-2 Arsenic: 3.70 27.00 J MOIKO 97VN35L13 128-128 9.50 9.50 8.6 6.40 a YES
7440-39-3 Barium 24.00 B 234.00 MOIKO 97VRHNI 128-128 88.40 88.40 180 1500.00 b N0:2,3
744041-7 Beryllium 0.17 B 1.10 B MO!KO 97VN47L14 127-128 0.62 0.62 1.3 3.50 c: N0:2,3
7440-69-9 Bismuth 1.20 63.9 MO!KO CT 17-128 3.10 3.10 YES
744043-9 Cadmium 0.08 B 4.20 MOIKO 97VS31N17 65-128 0.34 0.34 2.1 21.00 a N0:2,3
7440-70-2 Calcium 4080.00 144000.00 MG!KG 97VS26N25 128-128 43200.00 43200.00 310000 N0:2,4
744047-3 Chromium 4.50 126.00 MO!KG 97VS28N5 128-128 22.40 22.40 20 110.00 a N0:3
7440484 Cobalt 3.40 B 15.50 MG!KG 97VNI8Ll2 128-128 9.21 9.21 19 N0:2
7440-50-8 Copper 9.90 141.00 MG!KO 97VS31NI7 128-128 34.70 34.70 26 YES
57-12-5 Cyanide 0.36 B 6.80 MOIKG 97VS51L6 6-128 0.30 0.30 430.00 a NO: I
7439-89-6 Iron 7040.00 46800.00 MGIKG 97VN35Ll3 128-128 20500.00 20500.00 35000 N0:2,4
7439-92-1 Lead 5.50 8190.00 MGIKO 97VS43N24 128-128 226.00 226.00 48 YES
7439-954 Magnesium 2080.00 83200.00 MOIKO 97VS26N25 128-128 16700.00 16700.00 40000 N0:2
7439-96-5 Manganese 213.00 1130.00 MO!KG 97VS41N2 128-128 551.00 551.00 1400 2700.00 b N0:2,3
7439-97-6 Mercury 0.05 B 1.30 MOIKG 97VS31N17 97-128 0.21 0.21 6.40 b N0:3
7440-02-0 Nickel 1.50 8 31.80 MGIKO 97VN35Ll3 128-128 19.30 19.30 32 430.00 a N0:2,3
7440-09-7 Potassium 529.00 8 2690.00 MOIKO 97VN27Ll5 128-128 1600.00 1600.00 1900 N0:2,4
718249-2 Selenium 0.51 B 2.20 MGIKO 97VN13L8 62-128 0.91 0.91 YES
7440-224 Silver 0.20 B 11.20 MOIKO 97VS19N5 21-128 0.44 0.44 1.7 110.00 a N0:2,3
7440-23-5 Sodium 72.50 8 600.00 8 MO!KO 97VS48N4 125-128 180.00 180.00 240 N0:2,4
7440-28-0 Thallium 0.94 8 3.20 MOIKO 97VSS5L3 . 33-128 0.88 0.88 0.46 YES I
7440-62-2 Vanadium 8.40 34.40 MG!KO 97VSIANI3 128-128 22.00 22.00 25 150.00 a N0:2,3 I 7440-66-6 Zinc: 28.30 481.00 MO!KO 97VS43N24 128-128 91.00 91.00 140 6400.00 a N0:2,3
Footnotes on page 3.

• • • Table 2.3 ldentlftc:atlon of Constituents of Potential Conc:em for the Oft' Site Construction Worker RRE of the Miami-Erie Canal Area
Q. Q.
[ CAS Chemic:al Minimum Maximum Units Location Detection 9S%UCL Conuotration Bac:qround Screening Ref. COPC?
Number Concentration Conc:cntration of Maximum Frequency Used Cor Value Guideline Value GV
Concentration Screening
~ "' ""' t"r1
! ~ J;t. 0 ::s 0 c:: j,.
~ ~. tn
'"tl :J. ~ :; ~ [ g, ~ ~ g
~ if ~ ~.
~
~ ~
1
Sem.I-Voladlc oiDnic ComiiCIIIIIIb 91-57~ 2-Mcthylnapbthalene 23 J ISO J UGIKO 97VS1N23 25-128 229.00 150.00 YES
106-44-5 4-Methylphenol 64 J 64 J UGIK.G 97VN6N21 1-128 262.00 64.00 110000.00 a NO: I
83-32-9 Acenaphthene 20 J 750 J UG!KG 97VN5N20 30-128 195.00 195.00 YES
208-96-8 Acenaphthylene 19 J 650 J UG!KG 97VN4L22 41-128 213.00 213.00 YES
120-12-7 Anthracene 23 J 2300 J UG!KG 97VNSN20 59-128 254.00 254.00 6400000.00 a N0:3
56-55-3 Benzo(a)anthraccne 21 J 7300 UGIKG 97VN5N20 117-128 654.00 654.00 20000.00 d N0:3
50-32-8 Benzo(a)pyrenc 21 J 7900 UG!KG 97VN5N20 111-128 688.00 688.00 2000.00 d N0:3
205-99-2 Benzo(b )Ouoranthene 23 J 7100 UG!KG 97VN5N20 117-128 681.00 681.00 2oooo:oo d N0:3
191-24-2 Benzo(g,h,i)pcrylenc 22 J 4700 UG!KG 97VNSN20 110-128 477.00 477.00 YES
207-08-9 Benzo(k.)Ouoranthene 22 J 7000 UG!KG 97VN5N20 113-128 669.00 669.00 200000.00 d N0:3
65-85-0 Benzoic Acid 20 JB 220 J UG!KG 97VSSIL6 37-125 1070.00 220.00 85000000.00 a N0:3
117-81-7 Bis(2-ethylhexyl)phthall 20 m 44000 D UG!KG 97VN35LI3 68-128 1070.00 1070.00 430000.00 a N0:3
85~8-7 Butyl Benzyl Phthalate 20 J 380 J UG!KG 97VS2SN33 11-128 257.00 257.00 4300000.00 a N0:3
86-74-8 Carbazole 22 J 930 J UGIKG 97VNSN20 48-128 191.00 191.00 YES
218-01-9 Chryscne 25 J 8100 UG!KG 97VN5N20 120-128 747.00 747.00 2000000.00 d N0:3
84-74-2 Di-n-butyl Phthalate 22 J 4300 UG!KG 97VS20N23 31-128 368.00 368.00 2100000.00 a N0:3
53-70-3 Dibcnz(a,h)anthraccne 20 J 1500 J UG!KG 97VN21LI7 59-128 240.00 240.00 2000000.00 d N0:3
132~-9 Dibcnzofuran 20 J 510 J UG!KG 97VNSN20 26-128 195.00 195.00 YES
84~-2 Diethyl Phthalate 44 J 59 J UG!KG 97VS20N23 2-128 262.00 59.00 NO: I
206-44-0 Auoranthene 20 J 17000 UG!KG 97VNSN20 122-128 1440.00 1440.00 850000.00 a N0:3
86-73-7 Auorene 20 J 1200 J UG!KG 97VNSN20 34-128 210.00 210.00 YES
193-39-5 lndeno( 1,2,3-cd)pyrcne 20 J 4600 UG!KG 97VN21LI7 109-128 462.00 462.00 20000.00 d N0:3
91-20-3 Naphthalene 19 J 140 J UG!KG 97VSIN23 24-128 229.00 140.00 YES
87-86-S Pentachlorophenol 30 J 70 J UGIKG 97VS2N22 2-128 658.00 70.00 120000.00 d NO: I
85-01-8 Phenanthrene 21 J 13000 UG!KG 97VN5N20 113-128 713.00 773.00 YES
108-95-2 Phenol 21 J 270 J UG!KG 97VN3LIS 16-128 248.00 248.00 13000000.00 a N0:3
129-00-0 Pyrene 28 J 17000 UG!KG 97VNSN20 121-128 1310.00 1310.00 640000.00 a N0:3
Volatile OrRanic ComiiCIIIIIIb 107-06-2 I ,2-Dichlorocthane I J I J UGIKG CT 1-3 3.92 1.00 ssooo.oo c N0:3
75-09-2 Methylene Chloride 2 J 2 J UG!KG CT 1-3 3.34 2.00 100000.00 b N0:3
108-88-3 Toluene I J I J UG!KG CT 1-3 3.92 1.00 25000.00 b N0:3
Footnotes on pase 3.

I ~ ~ tTl e. ~. g
~ ~ ~. m
~ ;. ~ ('") ; [ g,~ ~ ~
i. ('l
~ :$. ~
a {
• • Table 2.3 ldentmcatlon of Constituents of Potential Concem for tbe Off Site Conatrudion Worker RRE oftbe Mlam&-Erle Canal Area ·
CAS Chemical Minimum Number Concentration
Pe5ddda/PCBS 60-57-1 Dieldrin 1.100 53494-70-5 Endrin Ketone 0.430 5103-74-2 Gamma Chlordane 0.300
RadlonucUdcs 10045-97-3 Ccsium-137 0.19 13981-16-3 Plutonium-238 0.01 PU-239/240 Plutonium-239/240 0.00 13966-00-2 Potsssium-40 11.10 13982-63-3 Radium-226 1.84 10098-97-2 Strontium-90 0.52 14274-82-9 Thorium-228 0.61 14269-63-7 Thorium-230 0.87 7440-29-1 Thorium-232 0.51 10028-17-8 Tritium 0.05 13966-29-S Uranium-234 0.62 15117-96-1 Uranium-23S 0.01 7440-61-1 Uranium-238 0.64 a~ 1/IOth HI for ingestion b= 1/IOth HI for ingestion+ inhalation
c= I o" cancer risk for ingestion + inhalation d= 10 .. cancer risk for ingestion
e= I O-' cancer risk for ingestion + inhalation + external "r ~ estimated quantitiy "B" = analytc detected in associated blank
Maximum Units Conc:cntration
1.100 UGIKG J 2.000 UGIKO J 0.300 J UO/KG
0.19 PCI/G J 115.00 PCI/G
4.17 PC I/O 14.90 PCIIG 3.04 PCI/G 7.20 PC I/O 7.67 PC I/O 7.99 PCI/G 2.17 PCIIG 79.60 PCIIG 1.28 PCI/G 0.10 PCI/G 1.62 PCIIG
Location of Maximum Conc:cntration
CT CT CT
CT 97VS34N9 97VS43Nl6 CT CT CT 97VSI9N5 97VS8N21 97VS47N29 97VS19N5 97VS17N6 97VN31Nl7 97VN35Ll3
Detection 95%UCL Frequency
1-3 1.33 3-3 2.47 1-3 0.34
1-3 0.25 689-718 22.SO 412-680 0.10 3-3 16.00 2-3 4.09 3-3 9.22 126-126 1.27 126-126 1.57 126-126 1.12 106-124 5.96 126-126 0.95 97-126 0.05 126-126 1.03 NO: I - <5% Detects N0:2 - <Background
ICODc:cntration Uscdfbr Screening
1.10 2.00 0.30
0.19 22.SO 0.10
14.90 3.04 7.20 1.27 1.57 1.00 5.96 0.95 0.05 1.03
N0:3 ·<Screening Toxicity Value
N0:4 - Essential Human Nutrient ·
l.OOE-06 Is equivalent to 1.00 x 10⁴
BKqround Sc:rccnina Value Guideline Value
930.00
0.42 2.30 0.13 28.00 0.18 26.00
37 2 0.70
0.72 .
ISO.OO I.S 4.30 1.9 220.00
I 250.00 1.6 120000.00 1.1 190.00
0.11 17.00 1.2 SS.OO
• Ref. COPC? GV
'
c N0:3 YES YES
e N0:2,3 e N0:3 e N0:2,3
N0:2 e YES e N0:3 e N0:2,3 e N0:2,3 e N0:3 e N0:3 e N0:2,3 e N0:2,3 e N0:2,3

•
•
•
2.4.1 Screening Constituents Based on Background
Site-specific backgrmmd concentrations described as the Upper 95% Tolerance Limit of the background
sample results for each constituent have been developed for Mound Plant soils (DOE 1997a) and are presented
in the RREM. Constituents with a maximum concentration detected exceeding their level in background were
identified as COPCs and carried to the next step of the RRE. Constituents with maximum concentrations less
than their background concentration were not carried though the RRE. If no background value was available for
a particular constituent (e.g., many organic compounds), the constituent was carried through to the next step of
theRRE.
In cases where the 95% UCL of the arithmetic mean fell below the maximum detected value, the 95%
UCL was compared to background to determine whether the 95% UCL was below background. If the 95% UCL
was below the background value for the constituent, the constituent was not identified as a COPC in the RRE.
Including constituents whose 95% UCL is less than background would cause the incremental risk to be a
"negative" risk. Eliminating these constituents focuses the RRE on constituents detected above background.
2.4.2 Screening Constituents Based on Guideline Values
Soil constituents present at concentrations that exceed background concentration were compared to Risk
Based Guideline Values (GVs) for the Mound Facility (DOE 1997b). GVs are media-specific concentrations
of constituents that correspond to specific human health risk levels for specified exposure scenarios. GV s were
developed for recreational, residential and off site construction worker scenarios (see DOE 1997b for the detailed
derivation of Guideline Values). Recreational, residential and off site construction worker GV s, were used to
screen COPCs for retention in the quantitative risk assessment.
The GVs used to screen COPCs were developed specifically for Mound, and were approved by the DOE,
the U.S. EPA, and Ohio EPA. The GV s correspond to the 10-6 risk level for carcinogenic constituents and
radionuclides, and to a Hazard Quotient of one for each non-carcinogen constituent. A 1 x 1 o-6 risk level
represents an incremental increase of one chance in one million of developing cancer as a result of exposure to
the GV concentration. Since the target risk level for carcinogenic constituents is a range of 10-4 to 10-6 , as
specified in the NCP, screening COPCs against the GV is protective. For non-carcinogenic constituents, the
Hazard Quotient (HQ), or the ratio of the intake of a single constituent to its reference dose, is used to defme
acceptable risk. When multiple COPCs occur in the same area, the HQs are summed to derive a Hazard Index
Residual Risk Evaluation OU-4 Miami-Erie Canal Area Public Review Draft Report
Page 18 of68

(HI). The target threshold for non-carcinogenic constituents is a HI of less than or equal to one. The GV s for
• non-carcinogenic constituents were calculated for a HI of one. To account for the possibility of more than one
non-carcinogenic constituent, COPC's were screened using 1/10 the GV for non-carcinogenic constituents.
Carcinogenic or radioactive constituents that exceed their GV s and non-carcinogenic constituents that exceed one
tenth of their GV were carried to the next step of the RRE.
2.4.3 Screening Constituents Based on Frequency of Detection
Constituents detected at concentrations above Mound background levels and above applicable GV s were
next evaluated for their frequency of detection. The Risk Assessment Guidance for Superfund (RAGS) Part A
(EPA, 1989) states that infrequently detected compounds may be artifacts in the data due to sampling, analytical,
or other problems, and therefore may not be site-related. Compounds that were detected infrequently in all media,
and not detected at high concentrations in any medium were eliminated from further consideration by the RRE.
No compounds were eliminated on the basis that they were unrelated to historical operations conducted within
the canal area.
Infrequent detection was defmed as five percent or less. This is equivalent to one detect in 20 samples.
• If there were an insufficient number of samples (e.g. less than 20) to determine whether the frequency of detection
is five percent or less, the contaminant was not eliminated on the basis of frequency of detection. Other relevant
•
· factors such as whether the constituent is expected to be present based on historical data or degradation products
of known contaminants also were considered in the decision to include or exclude infrequently detected
constituents.
2.4.4 Screening Constituents Based on Essential Human Nutrients
According to RAGS Part A (EPA 1989): "Chemicals that are (1) essential human nutrients, (2) present
at low concentrations (i.e., only slightly elevated above naturally occurring levels), and (3) toxic only at very high
doses (i.e., much higher than those that could be associated with contact at the site) need not be considered further
in the quantitative risk assessment." Inorganic analytes meeting this description were not carried through the
RRE. Calcium, chloride, iron, magnesium, potassium, and sodium are considered essential nutrients to humans.
These compounds were detected in the canal area at levels below or slightly elevated above background and are
toxic only at very high doses. Concentrations of these compounds in on-site media would not be expected to
Residual Risk Evaluation OU-4 Miami-Erie Canal Area Public Review Draft Report
Page 19 of68

result in intakes associated with a toxic response. Therefore, these compounds were eliminated as COPCs for
• the canal area.
2.4.5 Additional Screening Procedures
In accordance with the RREM, additional screening procedures also were used to evaluate Miami-Erie
Canal area constituents. For example, in accordance with EPA's Functional Guideline for Organics (EPA 1988)
if a blank contains measurable levels of a common laboratory contaminant, then the associated sample results
were considered as positive results only if the concentration in the samples exceeded ten times the concentration
in the blank. If the concentration of a common laboratory contaminant was less than ten times the blank
concentration, the constituent was considered to be an artifact of laboratory handling and was not included in the
RRE. Common laboratory contaminants include acetone, 2-butanone, methylene chloride, toluene and phthalate
esters.
Given the high degree of uncertainty in both the identity and reported concentrations of tentatively
identified compounds {TICs), these constituents were not carried through the RRE. Relatively few TICs were
reported in the Miami-Erie Canal database and historical information does not suggest that a particular TIC
• should be present.
•
3.0 EXPOSURE ASSESSMENT
The goal of the RRE exposure assessment is to estimate the type and magnitude of contaminant
exposures that may occur under current conditions with the area being used for recreational purposes and in the
future assuming that the area is developed for residential use. The information gathered in the exposure
assessment is integrated with toxicity information to characterize potential risks associated with exposure to
residual contamination in the canal area.
3.1 Characterization of Exposure Setting
The Mianii-Erie Canal area is located west of the Mound Plant between the Conrail Railroad right-of-way
to the east and Dayton-Cincinnati Road to the west. The area includes: ( 1) the abandoned Miami-Erie Canal; (2)
Overflow Creek which connects the canal to the Great Miami River; (3) a drainage ditch from the site boundary
to the canal; (4) Runoff Hollow between the Conrail tracks and the Mound Plant; and (5) South Pond in the
Residual Risk Evaluation OU-4 Miami-Erie Canal Area Public Review Draft Report
Page 20 of68

Miamisburg City Park. Currently, land use in the canal area is a combination of city park, Conservancy District,
• and railroad right-of-way.
•
•
Historic operations and accidental releases from the Mound Plant have resulted in the discharge of
contamination into the Miami-Erie Canal area. This contamination consisted primarily of plutonium and tritium
(DOE 1999). An underground pipeline rupture at the Mound Plant in 1969 resulted in the release of plutonium-
238 in a nitric acid solution. During pipeline remediation, a rainstorm washed contaminated soil to the canal and,
to a lesser extent, to Overflow Creek and the Great Miami River. Plutonium-contaminated soils were deposited
as sediments in the canal. Tritium contamination of canal area soils is largely due to the pre-1970 disposal of
tritiated process liquids. Some of the tritiated water released to the canal area may have infiltrated and migrated
to the regional aquifer known as the Buried Valley Aquifer (BVA), however, groundwater in the canal area is
currently not used.
Several investigations and one removal action have been performed in the Miami-Erie Canal area since
the pipeline break in 1969. For a complete chronology of Miami-Erie Canal activities, see the OSC Report (DOE
1999). Restoration activities in the Miami-Erie Canal area have included the excavation and removal of
approximately 38,000 cubic yards of soil. The removal action clean-up goal was to remove plutonium-238, with
a resulting 95% UCL of the mean concentrations less than 75 pCi/g, and to remove all known spots of
contamination greater than 150 pCi/g (DOE 1999). These goals were established by a focus group of
stakeholders to be consistent with risk-based GV s for the recreation use scenario. The OSC report (DOE 1999)
demonstrated that the verification sampling results confirm that these goals were achieved. Following
completion of the Miami-Erie Canal restoration project, 1-2 feet of clean soil was brought in to replace soil that
had been removed. The clean soil was graded, grass was seeded, trees were planted, and a bike path was
constructed. The canal property will once again be used as a City of Miamisburg park after a DOE easement
is canceled.
3.2 Identifying Exposure Pathways
Although many exposure pathways are possible, this RRE focuses only on the likely pathways within
expected recreational land use. Pathways for residential and off site construction worker use were added to
evaluate the need for land use restrictions. When identifying exposure pathways it is important to keep in mind
the four elements of an exposure pathway. An exposure pathway consists of: ( 1) a source of chemical release,
(2) a transport media, (3) a point of potential human contact with the contaminated media, and (4) an exposure
Residual Risk Evaluation OU-4 Miami-Erie Canal Area Public Review Draft Report
Page 21 of 68

route (e.g. ingestion). If any of these elements is missing or eliminated, the pathway will be incomplete and
• exposure will not occur.
A graphical representation of the exposure pathways identified for potential receptors is included in the
conceptual site model for the Miami-Erie Canal (Figure 3.1). The conceptual site model summarizes the
pathways that hazardous substances may take to reach potential receptors. Exposure assumptions used to
evaluate potential exposure pathways were drawn from the Mound Plant Risk-Based Guideline Values (DOE
1997b) and are based on the reasonable maximum exposure (RME) scenario recommended by Risk Assessment
Guidance for Superfund (RAGS), Part A (EPA 1989). The RME scenario is a conservative depiction of
potential exposure conditions intended to represent the maximum exposure conditions that one might reasonably
expect to occur at the site. RME assumptions were used to characterize risk for all potential canal area receptors.
Exposure assumptions used to quantify contaminant exposures are summarized in Table 3.1.
3.3 Identifying Exposure Scenarios
Residual contamination in the Miami-Erie Canal area was evaluated for three potential use scenarios.
Residual contamination in the canal area was evaluated for recreational adults and children, for residential adults
• and children and for an adult off site construction worker. Recreational use is the intended use. Residential use
of the canal area is unlikely, however it was included to determine whether land use restrictions were needed. The
construction worker was also included to determine whether land use restrictions were needed. All three scenarios
assume exposure to soil and sediment.
•
3.3.1 Recreational Adult and Child Scenarios
Since recreational activities are planned within the canal area, recreational adults and children were
identified as potential receptors. During recreational activities th~se receptors could be exposed to residual
contamination present in soil 0-2 feet below land surface including sediment. It was assumed that recreational
users would use municipally supplied water. The recreational users were assumed to be on the property four
hours per day, 52 days per year over a six year period for children and over a 24 year period for adults. Adults
were assumed to weigh 70-kilograrns while children were assumed to weigh 15 kilograms .
Residual Risk Evaluation OU-4 Miami-Erie Canal Area Public Review Draft Report
Page 22 of68

• ~
G. ~ ~ ~ trl
SOURCE MEDIA
RELEASE MECHANISM
• EXPOSURE
MEDIA EXPOSURE
ROUTES
INHALATION (VAPORS)
CURRENT/ FUTURE RECREATIONAL USER
ADULT CHILD
•• HUMAN
RECEPTORS
······~
FUTURE RESIDENT
ADULT CHILD
OFF-SITE CONSTRUCTION
WORKER
e. ~-
VOLATILIZATION* AIR L-........:INHA:.::.:..:::LA:..:.TI:..:.O=.:N..:..(!::..RADON):..::::..::.:...:.:--L...---.1..-----1..----'----'----'
g
~ ~ ~-~
"0 :;:2.
&l ~ ~[ g,~ ~ g
~ ;::;·
~ ~-
~ I
SOIL/ SEDIMENT --.. SURFACE SOIU
SEDIMENT I-.-.
INGESTION • • DERMAL CONTACT • • INHALATION (FUGITIVE DUsn • • EXTERNAL RADIATION • • INGESTION - -
' llol SUBSURFACESOIL DERMALCONTACT - -INHALATION (FUGITIVE DUSn - -
, EXTERNAL RADIATION - -
INGESTION
GROUNDWATER DERMAL CONTACT
• COMPLETE PATHWAY EVALUATED QUANTITATIVELY
0 COMPLETE PATHWAY EVALUATED QUALITATIVELY
INCOMPLETE PATHWAY, NOT EVALUATED * NO VOLA TILE COPCs IN AREA
INHALATION (VAPORS)
Figure 3.1 Coneeptual Site Model for the Miami-Erie Canal RRE
)V-~·-····
• • -. • • • • • .-• • -.

g, [ ~ ~
i r:. g
~ ~ §. tTl
~ ~· Jg (j
~ [ a.~ ~ g
~ c;·
~ ~·
~ {
• • • Table 3.1 E:~posure Assumptions for Recreadooal aod Residential Use or the Miami-Erie Caoal Area
Off Site Recreational Recreational Resideot Resident Construction Reference
Parameter Units Adult Cblld Adult Child Worker
Medium/pathway Surface soli CO - 2 ft.) & Sedlmeot lncldentallngesdoo
Soil ingcstioo rate mglday 100 . 200 NA NA NA a
Exposure frequeocy days/year 52 52 NA NA NA b
Exposure duratioo years 24 6 NA NA NA c:
Body weig)!t kg 70 IS NA NA NA d
Carcinogen averaging time days 25550 2SSSO NA NA NA c
Nonc:arc:inogen IMI'Iging time days 8760 2190 NA NA NA e
Conversion Factor kglmg l.OOE-06 I.OOE-06 NA NA NA
Dermal coo tact
Skin surface area available for contact cm2 5463 2115 NA NA NA f
Adherence factor mglc:ml I I NA NA NA g
Exposure frequency events/year 52 52 NA NA NA b
Exposure duration years 24 6 NA NA NA c
Body weig)!t kg 70 IS NA NA NA d
Carcinogen averaging time days 25550 2SSSO NA NA NA e
Noncarcinogco IMI'Iging time days 8760 2190 NA NA NA e
Conversion Factor kglmg l.OOE.06 1.00£.()6 NA NA NA
Inhalation ofVOCs and dust
Inhalation rate m3/day 20 8.7 NA NA NA h
Exposure time hours/day 4 4 NA NA NA i
Exposure frequency days/year 52 52 NA NA NA b
Exposure duratioo years 24 6 NA NA NA c:
Body weig)!t kg 70 IS NA NA NA d
Carcinogen averaging time days 25550 25550 NA NA NA e
Nonc:arc:inogco IMI'Iging time days 8760 2190 NA NA NA e
Conversion Factor days/hour 0.042 0.042 NA NA NA

• i [ ~ ~ trl e. ~. 8
~ ~
! "' ;:I. &l ;;
~i g,~ ~ Q
~ c;·
~ ;S.
~
~ 1
• • Table 3.1 EJ:posure Assumptions for Recreatloaalaad Raideatial Use of the Miami-Erie Canal Am
Off Site Recreational Recreational Resident Resident Coastrac:tlon Refereac:e
Parameter Units Ada It Child Adult Child Worker
~arfaceiSubsurfaee soU (0 ft ·total depth) and Sediment ' lncldentallogadon
Soil ingestion rate mglday NA NA 100 200 480 a
Exposure frequency days/year NA NA 350 350 250 b
Exposun: duration years NA NA 24 6 I c: Body weight kg NA NA 70 IS 70 d !
Carcinogen averaging time days NA NA 25550 25550 25550 e Noncarcinogcn a'Ya118ins time days NA NA 8760 2190 36S e
Conversion Factor kglmg NA NA l.OOE-06 l.OOE-06 I.OOE-06
Dermal contad
Skin surface an:a available for contact em~ NA NA 5463 2115 5000 r Adherence fac:tor mglan1 NA NA I I 0.2 g
Exposure frequency events/year NA NA 350 350 250 b
Exposure duration years NA NA 24 6 I c: Body weight kg NA NA 70 IS 70 d
Carc:inogcn averaging time days NA NA 25550 25550 25550 e
Noncarcinogm averaging time days NA NA 8760 2190 365 e
Conversion Factor kglmg NA NA l.OOE-06 l.OOE-06 J.OOE-06
Inhalation ofVOCs and dust
Inhalation rate m3/day NA NA 20 8.7 20 h
Exposun: frequency days/year NA NA 350 350 250 b
Exposure time hours/day I I 16 16 8 i
Exposure duration years NA NA 24 6 I c
Body weight kg NA NA 70 IS 70 d
Carc:inogm averaging time days NA NA 25550 2SSSO 25550 e Nonc:arc:inogc:u averaging time days NA NA 8760 2190 365 c Conversion Factor davs/hour NA NA 0.042 0.042 0.042

Current and future exposure scenarios for the recreational scenario are identical. Exposure pathways
• evaluated for the recreational user for both currentandfuture scenarios, include:
• · incidental ingestion of sediment or soil 0-2 feet below land surface;
• external exposure to ionizing radiation from radionuclides in sediment or soil 0-2 feet below land
surface;
• dermal contact with contaminants in sediment or soil 0-2 feet below land surface;
• inhalation of airborne contaminated soil particulates; and
• inhalation of volatile emissions from soil.
The parameters used to evaluate these pathways and their references are provided in Table 3.1.
3.3.2 Residential Adult and Child Scenarios
In order to calculate risk under a residential use scenario, hypothetical residents were assumed to live at
the site for 24 years and hypothetical resident children were assumed to live at the site for 6 years. Allowing for
a two-week vacation, site residents have an exposure frequency of 350 days/year. During home construction,
• excavation for basement construction could bring subsurface soil to the land surface. Therefore, potential direct
soil exposure pathways were evaluated assuming that site residents could be exposed to residual contamination
present in sediment or soil at any depth. It was assumed that canal area residents would use municipally supplied
water forpotable supply.
•
There are currently no site residents, so the site resident scenario was conducted for a hypothetical future
use. The expostire pathways evaluated for the future site resident include:
• incidental ingestion of sediment or soil at or below land surface;
• external exposure to ionizing radiation from radionuclides in sediment or soil at or below land surface;
• dermal contact with contaminants in sediment or soil at or below land surface;
• inhalation of airborne contaminated soil particulates; and
• inhalation of volatile emissions from soil.
The parameters used to evaluate these pathways and their references are provided in Table 3 .1 .
Residual Risk Evaluation OU-4 Miami-Erie Canal Area Public Review Draft Report
Page26 of 68

•
•
3.3.3 Off Site Construction Worker Scenario
Since it is reasonable to assume that construction activities could occur within the canal area, adult
construction workers were identified as potential receptors. During construction activities these receptors could
be exposed to residual contamination present in soil at or below land surface .. Potential exposure pathways
include incidental soil ingestion, external radiation exposure, and inhalation of airborne dust and vapors. Off Site
Construction workers were assumed to be on the property 8 hours per day, 250 days per year over a 1-year period.
Since construction workers are assumed to be adults, a body weight of 70-kilogram was used to assess exposure
to chemical contaminants. It was assumed that canal area construction workers would use municipally supplied
water for potable supply.
Current and future exposure scenarios for the construction worker scenario are identical. Exposure
pathways evaluated for the construction worker for both current and future scenarios, include:
incidental ingestion of soil at or below land surface; external exposure to ionizing radiation from radionuclides in soil at or below land surface; inhalation of airborne contaminated dust; inhalation of volatile emissions from soil;
The parameters used to evaluate these pathways and their references are provided in Table 3 .1.
3.4 Exposure Point Concentrations
Exposure point concentrations (EPC) are the concentrations of contaminants available to human
receptors at the point of contact. If the data were found to be normally distributed, the EPC for the RRE was
calculated as the 95% UCL of the arithmetic mean of the data, using the student's t-statistic. If the data were
found to be log normally distributed, the RME estimate was calculated as the 95% UCL using the H-statistic
(EPA 1992a). A detailed description of these calculations can be found in Section 2.3.
Only surface soil data (0-2 feet below land surface) were used to calculate the exposure point . concentration for ~e recreational user. Recreational users are assumed to have only limited contact with surface
soil or sediment. During home construction subsurface soils could be brought to land surface. Therefore the
exposure point concentration for the hypothetical off site construction worker and future site resident scenario
• was calculated using _sediment and soil samples collected at any depth. Given the low number of subsurface
Residual Risk Evaluation OU-4 Miami-Erie Canal Area Public Review Draft Report
Page 27- of 68

• samples collected, the inclusion of subsurface soil had little to no effect on EPC for the residential scenario.
•
•
3.5 Human Intake Equations And Assumptions
This section presents the exposure equations and assumptions used to derive contaminant-specific intake
estimates for the populations and exposure pathways evaluated in the risk assessment. The use of the intake
equations presented in this section is in accordance with methods presented by EPA in RAGS Part A (EPA 1989)
and the RREM presented in Mound 2000 (DOE 1997a). Exposure assumptions have been developed to represent
high-end RME conditions.· Exposure assumptions for each of the potential receptors, and corresponding guidance
or rationale used in this assessment are presented in Table 3.1.
There is a fundamental difference in the measurement of exposures from chemical contaminants as
compared to radionuclide contaminants. For chemicals, exposure generally refers to the intake (e.g.,
inhalation, ingestion, dermal exposure) of the chemical, expressed in units ofmglkg-day. Toxicity values for
chemicals are generally expressed in these terms; therefore, the product of the intake estimate with the
toxicity value yields a risk value. Radionuclide intake is typically expressed in units of activity (i.e., bequerel
[Bq] or curie [Ci]) rather than mass .. In addition, dose has a different meaning for radionuclides than for
chemicals since adverse effects are related to decay rate rather than amount or mass. For radionuclides, dose
is equal to the energy imparted to a unit mass of human tissue. Despite these differences the risk due to
chemical and radiological contaminants have been summed in the RRE summary tables (Table 5.16-5.18)
The approach used to estimate intake for chemical contaminants largely applies to radionuclides.
However, there are a few key differences in the methods. For example, in addition to the ingestion, inhalation
and direct contact pathways considered for chemical contaminants: external exposure to penetrating radiation was
also evaluated for radionuclides. Equations for estimating the intake of radionuclides have been modified by
omitting the body weight and averaging time from the denominator. This is done because radiation exposure
assessments do not end with the calculation of intake, but use dose conversion factors to estimate dose
equivalents to specified organs.
Oral and inhalation intakes are expressed as the amount of chemical at the exchange boundary (e.g., skin,
lungs, intestine) that is available for absorption. These intakes are not equivalent to the absorbed dose (the
amount of chemical actually absorbed into the blood stream). Dermal doses are expressed as estimates of
Residual Risk Evaluation OU-4 Miami-Erie Canal Area Public Review Draft Report
Page 28 of68

•
•
•
absorbed dose. The toxicological reference values used to calculate risk have been adjusted to account for this
difference; however, this discrepancy is a source of uncertainty when comparing or combining dermal doses with
intakes from other exposure. routes.
Exposure to soil and sediment through incidental ingestion was evaluated for recreational users under
current and future land use scenarios and for future off site construction workers and residents. Intakes for
the chemical contaminants in soil/sediment ingestion pathway were estimated by using the following
equation:
Where: Cso
IR
FI
EF
ED
CF
BW
AT
Csox !Rx F1 x EFx EDx CF Intake (mg!Jcg- ~) = --=------
. BWxAT
Contaminant concentration in soil/sediment (mg/kg)
Ingestion rate (mg/day)
Fraction ingested from contaminated source (1.0) (unitless)
Exposure frequency (days/year)
Exposure duration (years)
Conversion factor (1 0-6 kg/mg)
Body weight (kg)
Averaging time for cancer and non-cancer effects (days)
Radionuclide intakes for the soil/sediment via incidental ingestion was estimated by using the following .
equation:
Where:
IR
FI
bttk (Jfl) =Csox!RxFI xFFxFDxCF
Radiological activity in soil/sediment (pCi/g)
Ingestion rate (mg/day)
Fraction ingested from contaminated source (1.0) (unitless)
Residual Risk Evaluation OU-4 Miami-Erie Canal Area Public Review Draft Report
Page29 of 68

•
•
•
EF
ED
CF
Exposure frequency (days/year)
Exposure duration (years)
Conversion factor ( 10-6 kg/mg)
Dermal exposure to soil and sediment was assumed to occur simultaneously with incidental ingestion
exposure. Exposure to soil and sediment through dermal contact was evaluated.for recreational users under
current and future land use scenarios, and for future off site construction workers and residents.
Soil/sediment dermal exposures were evaluated for recreational users under current and future land use
scenanos. Chemical intakes for the soil/sediment via dermal exposure were estimated using the following
equation:
Where:
Cso
SA
AF.
ABS
EF
ED
CF
BW
AT
Csox S4xAFxAmxEFxEDx CF AhsorlJedfue (mglkg- chy) = --------
BWxAT
Chemical concentration in soil/sediment (mglkg)
Skin surface area available for contact (cm2/day)
Soil to skin adherence factor (1) (mg/cm2)
Dermal absorption factor (unitless)
Exposure frequency (days/year)
Exposure duration (years)
Conversion factor ( 10-6 kg/mg)
Body weight (kg)
Averaging time for cancer and non-cancer effects (days)
Exposure to external radiation from radionuclides in soils/sediments was estimated by using the
following equation:
AbsorbedDose (pCilg) = Cso xED x Te x (1-Se)
Residual Risk Evaluation OU-4 Miami-Erie Canal Area Public Review Draft Report
Page 30 of 68

• Where:
Cso
ED
Te
Se
Radionuclide activity in soil/sediment (pCi/g)
Exposure duration (years)
Gamma exposure time factor {hrs/hrs)
Shielding factor ( unitless)
Unlike i'nhalation, ingestion, and dermal exposure, the external radiation exposure term is defmed as
an equivalent radionuclide concentration in soil/sediment that an onsite receptor would be exposed to for a
particular exposure duration. This exposure term is adjusted for exposure time and shielding. For the canal
area RRE a default shielding factor of 20% was assumed. These assumptions provide for a conservative
estimate of external radiation exposure.
Intake of soil/sediment (fugitive dust) via inhalation was evaluated for recreational users under
current and future land use scenarios, and for future off site construction workers and residents. The intake
equation for chemical contaminants for this pathway is provided
• below:
Where:
Cso
IR
ET
EF
ED
PEF
BW
AT
•
Csox!RxErxEFxED Intake(mglkg-day) = PEFxBWxAT
Contaminant concentration in soil/sediment (mg/kg)
Inhalation rate (m3/hr)
Exposure time {hrs/day)
Exposure frequency (days/year)
Exposure duration (years)
Particulate emission factor (4.63 x 10⁹ m3/kg, EPA default value)
Body weight (kg)
Averaging time for cancer and non-cancer effects (days)
Residual Risk Evaluation OU-4 Miami-Erie Canal Area Public Review Draft Report
Page 31 of 68

• The intake equation for radionuclide contaminants via inhalation of fugitive dust was estimated using the
following equation:
Where:
IR
ET
EF
ED
PEF
~ox!RxEI'xFFxFJJ Intake (/Ci} = PFF
Radiological activity in soil/sediment (pCi/g)
Inhalation rate (m3/hr)
Exposure time (hrs/day)
Exposure frequency (days/year)
Exposure duration (years)
Particulate emission factor (4.63 x 10⁹ m3/g, EPA default value)
The PEF relates the concentration of the contaminant in soil/sediment to the concentration of
• respirable particles in the air from fugitive dust emissions. These emissions result from wind erosion. The
default value of 4.63 x 10⁹ m3/kg was taken from RAGS, Volwne I, Part B (EPA 199lb) and represents a
surface with unlimited erosion potential.
•
Volatilization of chemical contaminants from soils/sediments may result in exposures via inhalation
for recreational users; however, no volatile COPCs were identified in the canal area. Therefore, this pathway
was not evaluated for chemical constituents.
4.0 TOXICITY ASSESSMENT
The objectives of the toxicity assessment are to identify and select toxicological values for use in
estimating the significance of the exposure and to evaluate potential adverse effects associated with exposure to
compounds detected in the Miami-Erie Canal area. The RRE for the canal area evaluated chronic exposures. The
RRE utilized methods recommended by EPA for evaluating hwnan cancer and non-cancer health effects resulting
from exposure to the COPCs. The toxicity criteria used in the RRE were obtained from the most current update
Residual Risk Evaluation OU-4 Miami-Erie Canal Area Public Review Draft Report
Page 32 of 68

•
•
•
of the EPA Integrated Risk Information System (IRIS) or, if the information was not available in IRIS, the EPA
Health Effects Assessment Swnmary Tables (HEAST). IRIS is an electronic database containing the most
current descriptive and quantitative EPA regulatory information on chemical and radiological constituents.
Constituent files maintained in IRIS contain information related to non-carcinogenic and carcinogenic health
effects of constituents. HEAST is a published reference, updated periodically by EPA It contains toxicity
information and values for constituents from health effects documents and profiles. Other sources for toxicity
information include the National Center for Environmental Assessment (NCEA) Provisional Values, A TSDR
Toxicology Profiles or EPA Criteria Documents. Table 4.1 presents a swnmary of toxicological criteria used
along with the chemical-specific characteristics used to estimate dermal absorbed dose and the concentrations
present in vapors or dust.
In assessing the potential for non-cancer health effects, EPA assumes that there is a threshold below
·which no adverse toxic effects are expected. For example, a toxic threshold would exist if a substance had no
to,ac effect at a certain level of exposure, but did have a toxic effect at a higher level. EPA derives and publishes
reference doses (RIDs) and reference concentrations (RfCs) for use in evaluating adverse non-carcinogenic
effects. These are estimates (with uncertainty spanning an order of magnitude or greater) of daily human
exposures, including sensitive sub-populations, that may go without appreciable harmless effects during a lifetime
(EPA 1989). EPA derives RIDs and RfCs for humans based on estimates of the no-observable-adverse-effect
level (NOAEL) or lowest-observable-adverse-effect-level (LOAEL) observed in test organisms.
Carcinogenesis, however, is generally thought to be a phenomenon without a threshold for effect (EPA
1989). The basis for this presumption is that an extremely low level of exposure to some carcinogens may result
in chromosomal or enzyme changes leading to uncontrolled cellular proliferation or cancer. EPA does not
therefore estimate an effect threshold for carcinogenic chemicals. EPA uses a two-part evaluation for
carcinogens. First the constituent is assigned a weight-of-evidence classification based on both epidemiological
evidence of carcinogenic effects and laboratory tests conducted with animals. Then a cancer potency factor, or
slope factor (CSF), is calculated. The slope factor is a plausible upper-bound estimate of the slope of the dose
response curve in the low dose range. In risk assessment, the cancer slope factor is used to estimate. the excess
lifetime probability of a carcinogenic effect occurring in exposed receptors.
4.1 Toxicity Values for Evaluating the Dermal Pathway
Residual Risk Evaluation OU-4 Miami-Erie Canal Area Public Review I?raft Report
Page 33 of 68

•
•
•
Toxicological reference values are available only for the oral and inhalation pathways and the majority
of these values are based on intake (i.e., administered dose) rather than an absorbed dose. Because the intake
equation for the dermal contact pathway calculates absorbed dose (by incorporating a dermal absorption factor
or a permeability coefficient), it is necessary to convert the administered dose toxicity value to an absorbed dose
toxicity value in order to calculate risk. For the Miami-Erie Canal RRE oral administered-dose toxicity values
were adjusted using compound specific gastrointestinal absorption factors. For non-carcinogens, the admini~tered
dose toxicity value (i.e., the RID) was multiplied by the gastrointestinal absorption factor. For carcinogens, the
slope factor was divided by the gastrointestinal absorption factor.
4.2 Toxicity Assessment for Lead
Lead was identified as a COPC in the canal area, however, lead does not have toxicological reference
values. A risk-based remediation goal for lead 400 parts per million (ppm) in soil was established by EPA based
on the "Interim Guidance on Establishing Soil Lead Cleanup Levels at RCRA Facilities" (EPA, 1994a). The
allowable concentration of 400 ppm lead in soil is supported by USEPA's Integrated Exposure Uptake Biokinetic
Model for Lead in Children (IEUBK) (USEP A, 1994b ). The IEUBK predicts that 400 ppm lead in soil could
cause a 6 year old resident child (averaged across the preceding 84 months) to have a probability of no greater
than 5% of a blood lead level of 10 micrograms/deciliter (.ug/dL) assuming exposure to surface soil and
subsurface soil brought to the land surface. In children, a blood lead level of between 10 and 15 micrograms per
deciliter (.ug/dL) has been associated with a level at which no adverse effects would be expected (Centers for
Disease Control and Prevention [CDC], 1985). Since the residential exposure scenario is more conservative than
the recreational scenario, the acceptable level of 400 ppm lead is expected to be protective under both the
recreational and residential scenarios .
Residual Risk Evaluation OU-4 Miami-Erie Canal Area Public Review Draft Report
Page 34 of68

i. ~ ~ ~ trl
f g· ~ ~ §. &1
'"0 ~~ (')
:!. ~ VI -s.t: &l ~
~ cr ~ :s. ~
~ :;tl
!
• • rrable ._I TolldtJ VU. and Cbemkai-Speclllc Puuneten far C...._.. ofl'ae8ldW c-. Ia tile MluDI-Erte Calllll Ana
N-c- c- ~IE__..P-.
Donul .,.._ c-.1 Onl A ~Quilled ·-- Onl .... .,_ hlonlal ............. Cl liFO. RFDo RFDI csr. CSFa --- csn ,_ ,_.,.
Claoaokal lalil<&'dnl {mf/1<1/tbzl. lmlil<&'dnl (...,.......,). (mclkl/olo7)"
1 ( ..... doJf' (aalll<c/doJ)' (Uallllu) (U ..... )
INORGANJCS Anenic 3.001!-04 1.231!-().4 S.OOE-04 I.SOE+OO NA NA I.SOE+OI Bimndh NA NA NA NA NA NA NA
;!i 3.701!-m 1.111!-02 NA NA NA NA NA NA NA NA NA NA NA NA
Selenium S.OOB-03 2.201!-03 NA NA NA NA NA 'nwlium 8.001!-0S 1.201!-05 NA NA NA NA NA SVOCa NA 2-Melhylnophthal- NA NA NA NA NA NA NA A......,.,.._ 6.008-02 1.861!-02 NA NA NA NA NA A~lcno NA NA NA NA NA NA NA Bemlo(a)pynno NA NA NA 7.301!+00 2.521!+00 NA 3.101!+00 Bonzu(ghi)pcrylr:no NA NA NA NA NA NA NA c.t>amlo NA NA NA 2.001!-m NA NA NA Dibem(a,h~ NA NA NA 7.308+00 1.668+00 NA 3.101!+00 Dibcnml\nn NA NA NA NA NA NA NA
Fl- 4.001!-m 2.001!-m NA NA NA NA
~aphlhaleno 2.001!-m I.OOE.m 8.601!-04 NA NA NA NA Phalanthn:no NA NA NA NC NC NA NC Patld<loa/PCBa Edrin Ketone NA NA NA NA NA NA NA o.mma a.Jordono S.OOI!-04 2.SOE-04 2.001!-04 3.SOE-OI 1.25E.m NA 3.SOI!-OI RaolloaiiCUda Plut<mium-238 NA NA NA 2.9SI!-10 NA 2.951!-10 2.741!-08 R.dium-226 NA NA NA 3.001!-10 NA 3.008-10 2.801!-09
a. These 8~ abocrpticn facton ha .. been compiled by lbe Biomedical and Environmcnllllntc.malion Analysis Section (BEIAS) oflbe Heollb and Safdy ~b llMaianofOU Jtidac Nllional Labonlmy(ORNL) li>r uso o1 aU DOE-ORJERDaila; lbeOI aboocplion liolar lilr PCBa- uacd lilrcadt.Anx:lar~.
0.41 NA 0.3
O.IS 0.44 0.15
0.8 0.31 0.31 0.31 0.31 0.7 0.1
0.31 0.5 o.s 0.65
o.s 0.5
NA NA
b. DeWIII ps1ICinlalinal ~ liolara (0.8lilr voea, o.s lilr svoea. 0.2lilr inarpaica) wae .........S if no other information -.1d bo loc:ar.d (EPA Jle&ioniV pidanoc). c. 1bcsc pbainteatii.J aboocplion Codon arolakcn Item lbe Apncy li>r Toxic Substonccl and Oil-. Rqislly (ATSDR) taxicdosica1 prolilcs;
ORNL haaalso listed 7%u01abs. Flldot fotinorpnic IIIII of mercury. NA • Not AYiilable RID • Refen:nco Dose CSF • c.- Slope Flldot 01• Ciulrainlalinol ASS • Damal Absorption Factor
SVOCa • Semi-volatile Orpnic Compounds PCBa • Palycblooinalcd biphcnyb VOC. • V'*lilo OrpnicCompounds
I.OOE.QS b equinlcnlla 1.00 x 10 ..
• • • • c
•
• • • • • .. b b
• • • •
-Donal All3
jtJ-1}
0.01 0.01 0.01 0.01 0.01 0.01
0.3 0.3 0.3 0.3 0.3 0.3 0.3 0.3 0.3 0.3 0.3
0.3 0.3
NA N~_
•

•
•
•
5.0 RISK CHARACTERIZATION
This section presents the risk characterization for the Miami-Erie Canal area. Information from the
exposure assessment (Section 3) is combined with information from a toxicity assessment (Section 4) to
characterize human health risks.
5.1 Risk Characterization Methods
Risk characterization integrates the exposure and toxicity assessments by comparing estimates of intake
or dose with appropriate toxicity values. This in turn provides an indication of the potential for adverse effects
to exposed receptors. The objective of the risk characterization is to determine if exposure to contaminants
associated with the site poses risks that exceed EPA target levels for human health effects. The results of the risk
assessment may thus support the determination of site release or the need for site remediation.
The RRE reports the incremental risk, total risk, and risk from background for each contaminant
evaluated in the Miami-Erie Canal Area. The incremental risk is the risk posed by site-related contamination
above the risk posed by background environmental levels. Background risk is the risk resulting from sources
other than the Mound-related residual contamination. Site-specific background values are provided in the Mound
2000 RREM (DOE 1997a). The Mound 2000 background values that correspond to the canal COPCs were used
as the EPCs to determine background risk. Total risk is the sum of the background and incremental risk. This
risk characterization presents a separate evaluation of non-carcinogenic and carcinogenic effects. The assessment
distinguishes cancer from non-cancer effects because organisms typically respond differently following exposure .
to carcinogenic or non-carcinogenic agents. Quantification methods for cancer and non-cancer effects are
discussed separately in the following sections.
5.1.1 Quantification of Carcinogenic Risk
Cancer risks are probabilistic estimates of the excess (incremental) lifetime cancer risk for an individual
specifically attributable to long term exposure to site-related chemicals. The procedure for calculating risk
associated with exposure to carcinogenic compounds has been established by EPA (EPA 1989). A non-threshold,
dose-response model was used to calculate a cancer slope (potency) factor for each CO PC. To derive an estimate
of risk, the cancer slope factor was multiplied by the estimated chronic daily intake experienced by the exposed
individual:
Residual Risk Evaluation OU-4 Miami-Erie Canal Area Public Review Draft Report
Page 36 of 68

• Where:
Risk =
CDI
CSF
Risk= CDI x CSF
High end estimate of the excess lifetime cancer risk to an individual (unitless
probability)
Chronic daily intake averaged over an established period (mglkg body weight/day)
Cancer slope factor (95% upper-bound estimate of the slope of the dose-response
curve) expressed as (mglkg body weight/day)·'.
To evaluate the risk of exposure to more than one carcinogenic COPC, the risk estimates for each
COPC were summed to provide an overall estimate of total carcinogenic risk (EPA 1989).
n
Risk T = I Risk i =I
• Where:
•
RiskT The combined excess lifetime cancer risk across chemical carcinogens
Risk; The risk estimate for the ith chemical of n chemicals under evaluation.
5.1.2 Quantification of Non-carcinogenic Risk
The traditionally accepted practice of evaluating exposure to non-carcinogenic compounds has been to
experimentally determine a NOAEL and to divide this by a safety factor to establish an acceptable human dose,
for example, acceptable daily intake or RID. The RID is then compared to the average daily intake experienced
by the exposed population to obtain a measure of concern for adverse non-carcinogenic effects:
Where:
HQ
Intake
HQ Intake
R fD
Hazard Quotient: potential for adverse non-carcinogenic effects
Average daily intake for subchronic or chronic exposure (mglkg body weight/day)
Residual Risk Evaluation OU-4 Miami-Erie Canal Area Public Review Draft Report
Page 37 of68

• RID Acceptable intake for subchronic or chronic exposure (mglkg body weight/day) .
To evaluate exposure to multiple non-carcinogenic COPCs the HQs for all COPCs were summed to
obtain the Hazard Index (HI).
Where:
Hazard Index
Hazard Quotient for the ith chemical of n chemicals under evaluation.
EPA has established target risk levels for use in determining the need for site remediation. For non
carcinogenic effects, EPA has set the target HQ at one. If the HQ is > 1, there is the potential for adverse health
effects at the given exposure/dose level, but the HQ value is not an indication of the severity of the effects. For
multiple non-carcinogens, the HQs for all of the chemicals under evaluation are summed resulting in the HI. If
• the HI is> 1, the potential also exists for adverse health effects resulting from exposure to mixtures of chemicals.
•
In cases where the HQ for individual substances is below 1 yet several HQs sum to greater than 1, EPA
recommends segregating the compounds into groups with like or common toxicological effects and re-evaluating
the potential for the various adverse health effects. In cases where HQs for individual substances are greater than
1, this step is not necessary or useful.
5.2 Risk Characterization Results
The following sections present the risk characterization results for the Miami-Erie Canal area by potential
receptor. All of the tables for Section 5 (Tables 5.1 through 5.18) are presented at the end of the Section. Risk
estimates for individual COPCs for all scenarios and pathways are presented in Tables 5.1 through 5.15. Tables
5.1 through 5. 6 present risk estimates based on recreational exposure parameters, T abies 5. 7 through 5 .12 present
risk estimates based on residential exposure parameters and Tables 5.13 through 5.15 present risk estimates
based on off site construction worker exposure parameters. Residual risks were calculated based on total risk,
background risk and incremental risk. Total risk was calculated using total concentration of the COPCs detected
. in the area. Background risk was based on background levels of the COPCs, and incremental risk was calculated
Residual Risk Evaluation OU-4 Miami· Erie Canal Area Public Review Draft Report
Page 38 of68

••
•
•
using the difference between total and background levels. Incremental risk can be used to assess the increase in
risk above background levels due to Mound Plantoperations. Tables 5.16 through 5.18 present summaries of
the results for all scenarios and pathways assessed in the RRE. In the summary tables, risk estimates that are at
or above the non-cancer HI of 1 and the cancer target risk range of 10-6 are bolded. Risk estimates of zero
indicate that toxicity criteria were not available for the COPC bein~ evaluated.
Recreational Adult
Tables 5.1 through 5.3 present total, background and incremental risk for a recreational adult in the
Miami~Erie Canal area. The total, background and incremental non-cancer risk is less than 1 indicating that non
cancer risk is at an acceptable level. Total cancer risk for a recreational adult is 9.4 x 10⁻⁶, which falls within the
target risk range of 104 to 10-6. The only constituent to exceed 1x 10⁻⁶ was radium-226. Residual risk due to
radium-226 was driven by external exposure to radium-226 in soil. The majority (66%) of this risk is due to
background levels (6.2 x 10⁻⁶). The incremental risk due to radium-226 in the canal area to a recreational adult
is 3.2 x 10⁻⁶, which again falls within the target risk range.
Recreational Child
Tables 5.4 through 5.6 present total, background and incremental risk for a recreational child in the
Miami-Erie Canal area. The total, background and incremental non-cancer risk is less than 1 indicating that non
cancer risk is at an acceptable level. Total cancer risk for arecreational child is 2.4 x 10⁻⁶, which falls within the
target risk range of 10·4 to 10-6. The only constituent to exceed 10 -6was radium-226. Residual risk due to
radium-226 was driven by external exposure to radium-226 in soil. The majority of this risk (67%) is due to
background levels (1.6 x 10"6). The incremental risk due to radium-226 in the canal area to a recreational child
is 2.1 X 10·7, which falls below the target risk range .
Residual Risk Evaluation OU-4 Miami-Erie Canal Area Public Review Draft Report
Page 39 of68

•
•
•
Residential Adult
Tables 5. 7 through 5.9 present total, background and incremental risk for a residential adult in the
Miami-Erie Canal area. The total, background, and incremental non-cancer risk, or HI, is less than 1 indicating
that non-cancer risk is at an acceptable level. Total chemical and radiological cancer risk of 3.lx104 for the
residential adult exceeds the target cancer risk range of 1 04 to 1 o.o. Risk from exposure to radionuclides for a
residential adult is 1.5 x 10⁴. Constituents that exceed l x 10.o include benzo(a)pyrene, dibenz{a,h)anthracene,
arsenic, plutonium-238 and radium-226. Background cancer risk to a residential adult is 1.1 x 10⁴, which
accounts for 34% of the total residual risk. Incremental residual cancer risk for a residential adult in the canal
area is 2.1 x 10-\ which exceeds the target risk range. 62% of the incremental risk is due to benzo(a)pyrene
which is ubiquitous the environment, particularly near rail roads and roadways.
Residential Child
Tables 5.10 through 5.12 present total, background and incremental risk for a residential child in the
Miami-Erie Canal area. The total, background and incremental non-cancer risk is less than 1 indicating that non
cancer risk is at an acceptable level. Total chemical and radiological cancer risk for a residential child is 1.3 x
IQ-4, which slightly exceeds the target risk range of 104 to 10.o. Constituents that exceed 1 x 10.o include
benzo(a)pyrene, dibenz{a,h)anthracene, arsenic, plutonium-238 and radium-226. Background cancer risk to a
residential child is 4.2 x I0-5, which accounts for 32% of the total residual risk. Incremental residual cancer risk
for a residential child in the canal area is 9.0 x 10·5, which falls within the target risk range. 69% of the
incremental risk is due to benzo(a)pyrene which is ubiquitous in the environment, particularly near rail roads and
roadways.
Off Site Construction Worker
. Tables 5.12 through 5.15 present total, background and incremental risk for an off site construction
worker in the Miami-Erie Canal area. The total, background and incremental non-cancer risk is less than 1
indicating that non-cancer risk is at an acceptable level. Total chemical and radiological cancer risk for an off
site construction worker is 7.2 x 10.o, which is within the acceptable risk range of 10 io 10 _.o The only
constituent that exceeds 1 x 1 o.o is radium-226 via external exposure. Background and incremental, chemical
Residual Risk Evaluation OU-4 Miami-Erie Canal Area Public Review Draft Report
Page40 of68

•
•
•
and radiological cancer risk to an off site construction worker is 5.1 x 10.o and 2.2x10.o respectively. Both these
values fall within the target risk range of 10-4 to 10.o .
Residual Risk Evaluation OU-4 Miami-Erie Canal Area Public Review Draft Report
Page 41 of 68

i ~ ~ tt:l ~ ~ r::. g
~ ~ §. I
tt:l '"tl ~-1» (j
~[ e.;;~ ~
~ c:;· ·::0
n ;S.
~
~ i
• • TableS..l Total Ratdaal Risk ror a RecreaUoaal Adult at the MJaml-Erte Cmal Area
I CANCER EFFECTS J c NON-CANCEREn'ECTS -n- J Roule-Spccilic Risk
Constituent Oral Dermal lnhalllion Jnhalllion Dust VOC5
EPC _,., Pnllddn/PCBS Endrin Kclono 0.002 NA NA NA NAP Gamma Chlordane 00003 7.36-12 2.46-10 S.1E-17 NAP
Metals Bismuth 3.10 NA NA NA NAP Copper 34.70 NA NA NA NAP
. Lead 226.00 NA NA NA NAP Selenium 0.91 NA NA NA NAP Thallium 0.88 NA NA NA NAP
S.ml-Volatile OrJank Compouado 2-Mcthylnaphthalcne O.lS NA NA NA NAP Accnaphthenc: 0.19S NA NA NA NAP Accnaphthylene 0.211 NA NA NA NAP Benzc(g,h.i)perylene 0.417 NA NA NA NAP Carbazole 0.191 2.76-10 1.46.08 NA NAP Oibenmfurnn 0.19S NA NA NA NAP Fluorene 0.21 NA NA NA NAP Naphthalene 0.14 NA NA NA NAP Phenanthrene 0.173 NC NC NC NAP
(Total Chemdal I I 2.1E-IO 1.46-08 S.1E-17 0.06+00 EPC
Rodlonudldrt gg[a Radium-226 3.04 1.1 E-07 NAP 8.36-12 NAP
l!otal Rodlonudldn I I 1.1£.07 NAP 8.3£-11 0.0£+00
Exlemal
NAP NAP
NAP NAP NAP NAP NAP
NAP NAP NAP NAP NAP NAP NAP NAP NAP
0.06+00
9.JE-06
Cancer Risk Total
0.06+00 2.56-10
0.06+00 0.0£+00 0.0£+00 0.0£+00 0.06+00
006+00 0.06+00 0.0£+00 0.06+00 1.4£.08 006+00 0.06+00 0.06+00 0.06+00 I.S6.08
9.46-06
I
_ UE-06 __ 9.4t=ili]
Oral
NA I 2E.07
NA I 9£-04
NA 3.1E.OS 2.26.03
NA 6.66.07
NA NA NA NA
1.16-06 1.46-06
NA I 2.56.03
NAP
I NAP
Roule-Spccific HQ Dermal Inhalation Inhalation Exlemal
Dust VOCa
NA NA NAP NAP 4.06-06 2.4£-12 NAP NAP
NA NA NAP NAP 3.SE-04 NA NAP NAP
NA NA NAP NAP 4.6£-0S NA NAP NAP 8.2£.03 NA NAP NAP
NA NA NAP NAP l.SE.OS NA NAP NAP
NA NA NAP NAP NA NA NAP NAP NA NA NAP NAP NA NA NAP NAP
3.S6.0S 0.06+00 NAP NAP 4.1E.OS 2.6£-10 NAP NAP
NA NA NAP NAP 8.1E.03 2.6£..10 0.06+00 0.06+00
NAP NAP NAP NAP
NAP NAP NAP NAP
NOI>-Canccr HI
Total
0.06+00 41£.()6
O.OEtOO 5.4£.()4 0.06+00 8.3£-0S 1.0£.()2
0.0£+00 3.6£-0S 0.0£+00 0.0£+00 0.0£+00 0.0£+00 3.6£-0S 4.86-0S 0.06+00 1.16-02
NAP
NAP
I
I (Total Overoll Rlslr. I I 1.1£.()7 1.4£.08 8.3£-12 0.0£+00 9.3£-06 UE-06 ] 0~SE~3 ------vE-03- 2.66-10 0.06+00 0.06+00 1.16-02 I 6PC Exposure point eoncentration mglkg Millipm per kilognun NA Not IIYIIilablc; insufficient toxicity data NAP Not applic:oble path-y. nato VOC NC Not o suspcct<d carcinogen pCilg Picoc:uriea per JIIBIII VOC5 Volllilc crpnic compounds
1.00£.()6 ls c:quivalent to 1.00 X 10 ..
•

f. i ~ ~
[ iii r::::. g
~ f: m
"tl iS·
~[ sa, ~ &.; ~
~ ~ ~ :$.
~
~ i
• Talale 5..2
Conatiwent
r .. licldooi1'CBS Enclrin~ Oamma atlordano
Melala Bismulh Copper lad Scll'lllium Thallium
Semi· Volallla Orpal< Cooa ........... 2-Methylnlplltllalmo Acenaphtbene A.......,mhyl...., ~iJpeoyleno Cubezole DibenzD!ilnm Fluorene Naphthalene
l'h<nanlhrmc [Total Cbemieal I R•dloau<lldn Raclium-226
(Total Radionuelidoo J
• Blldlpvand Rnldul Rbk for a lhc:reattond Al:lult at the Miami-Erie Omal Area
EPC .....
26 48
0.46
EPC IQla
2
I CANCER EfFECTS :J I NON.cA.I'ICER En'ECTS I Route·Spcoilic Risk c-. Roulo-Speei6c HQ Non-Cwcr
Onl Dermal Inhalation Inhalation Emmol Rlak Onl Dermal JnhalJIIicm Inhalation Bxtemll tn Dust VOCo Tol.ll Dull VOC. Tol.ll
NA NA NA NAP NAP 0,08+00 NA NA NA NAP NAP O.OB+OO O.OB+OO O.OE+OO O.OE+OO NAP NAP O.OB+OO O.OE+OO O.OE+OO 0.08+00 NAP NAP O.OB+OO
NA NA NA NAP NAP O.OE+OO NA NA NA NAP NAP O.OE+OO NA NA NA NAP NAP O.OB+OO 1.41!-04 2.6B-O<I NA NAP NAP 4.08.()4 NA NA NA NAP NAP O.OB+OO NA NA NA NAP NAP 0.08+00 NA NA NA NAP NAP O.OB+OO O.OE+OO O.OE+OO NA NAP NAP O.OB+OO NA NA NA NAP NAP 0.08+00 L2E-03 4.3E-03 NA NAP NAP SAE-03
NA NA NA NAP NAP 008+00 NA NA NA NAP NAP 0.08+00 NA NA NA NAP NAP O.OB+OO O.OB+OO O.OE+OO NA NAP NAP O.OB+OO NA NA NA NAP NAP O.OB+OO NA NA NA NAP NAP O.OB+OO NA NA NA NAP NAP O.OEtOO NA NA NA NAP NAP 0.01!+00
O.OE+OO OOB+OO NA NAP NAP 001!+00 NA NA NA NAP NAP 0.01!+00 NA NA NA NAP NAP O.OE+OO NA NA NA NAP NAP 0.08+00 NA NA NA NAP NAP 0.08+00 O.OB+OO O.OE+OO O.OE+OO NAP NAP O.OBtOO NA NA NA NAP NAP O.OB+OO O.OE+OO 0.01!+00 0.08+00 NAP NAP 0.08+00 NC NC NC NAP NAP O.OB+OO NA NA NA NAP NAP O.OE+OO
( O.OE+OO O.OE+OO OOE+OO O.OE+OO 0.01!+00 O.OE+OO II 1.31!.03 451!.03 0.08+()() 0.01!+()() 0.01!+00 S.SB-03 I
7.SE.OS NAP S.SE-12 NAP 6.tE-06 6.1E-06 NAP NAP NAP NAP NAP NAP
I HE-08 NAP ISE-:ff~-N.Al'~ ~--· 6:%£.116=][-NAP~- NAP NAP NAP NAP NAP I lfOiAfD;.HiiUJil!il] 1 7.5E.OS o.oi!+OO s.~o.oE+OO '-1£.116 o.OB+OO o.OB+OO o.OB+OO s.BB-03 I lli'C
m&'k8 NA NAP NC pCila VOC.
1.001!-06
~point --.tration Millp per blof.ram NoiiMiilal>lo; ii:Dullicricnt IDJ<icily data Not applioabl6 polhway Not aiUipOCIAOd C~Rinogen l'i<:ocurioa per fl'1llll Volatilo"'Jllllllic~
I .. qumlent to 1.00 x w"
•

! [ ~ ~ l"I1
~ r::. g
~ ~ §. m
'"tl ~&: (") i i g,_~
~ ~
~ c;· -~
R :s. ~
~ {
• • •• Table 5.3 lncranental Residual Risk for a Rec:reatlcmal Adult at tbe MJami-Erte Caul Area
I CANCEREFFECTS -1 I NON:CANCEREFFECTS--· I Route-Specific Rislc
Constituent Onl Dermal Inhalation Inhalation ExlemaJ Dust voc.
EPC
.. m PosllddaiPCBS Endrin Kdone 0.002 NA NA NA NAP NAP Oomma Chlordane 0.0003 7.3E-12 24E-IO 5.7E-17 NAP NAP
Mtlala Bismuth 3.10 NA NA NA NAP NAP Copper 8.70 NA NA NA NAP NAP Lead 178.00 NA NA NA NAP NAP Selenium 0.91 NA NA NA NAP NAP Thallium 0.42 NA NA NA NAP NAP
Semi-VolaUie Oraanlc Compounda 2-Methylnaphthalene O.IS NA NA NA NAP NAP Acenaphthcnc 0.195 NA NA NA NAP NAP Acenaphlhylene 0.213 NA NA NA NAP NAP BelllXl(g.h,i)paylene 0.477 NA NA NA NAP NAP Cubamle 0.191 2.7E-10 1.4E-08 NA NAP NAP Dibenzo(Wlln 0.195 NA NA NA NAP NAP Fluorene 0.21 NA NA NA NAP NAP Naphthalene 014 NA NA NA NAP NAP Phenanthrene 0.773 NC NC NC NAP NAP
!Total Chemical I I 2.7E-to 1.4E-08 S.Th-17 O.OE+OO O.OEi-00 EPC
Radionuclides ~ Radium-226 1.04 39E-08 NAP 28E-12 NAP UE-06
[!Cital Radion1Jdlde I I 3.98.os NAP 2.8E-12 O.OE+OO l.lE-06
Canca RjsJc
Tobl
O.OIHOO 2.SE-IO
O.OE+OO O.OE+OO O.OE+OO 0.08+00 OOE+OO
O.OE+OO O.OE+OO O.OE+OO O.OE+OO 1.4E-08
O.OE+OO O.OE+OO 0.08+00 O.OE+OO UE-08
l.lE-06
UE-06
I I
I I
Route-Specific HQ Non-Cancer Onl Dcnnal Inhalation Inhalation ExlemaJ I:D
Dust VOC. T alai
NA NA NA NAP NAP O.OEi-00 1.2E~7 4.0E-'l6 2.4E-12 NAP NAP 4.1E-'l6
NA NA NA NAP NAP O.OE+OO 4.8E~5 8.~5 NA NAP NAP 1.3E~
NA NA NA NAP NAP 0.08i-OO l7E~5 4.6E~S NA NAP NAP 8.3E~S
UE-03 3.9E-03 NA NAP NAP S.OE-03
NA NA NA NAP NAP O.OE+OO 6.6E-07 l.SE-05 NA NAP NAP 3.6E-OS
NA NA NA NAP NAP 0.08i-OO NA NA NA NAP NAP O.OE+OO NA NA NA NAP NAP O.OE+OO NA NA NA NAP NAP O.OE+OO
I.IE-'l6 l.SE-05 O.OE+OO NAP NAP 36E-OS 1.4E-'l6 4.7E-OS 2.6E-10 NAP NAP 4.8E-05
NA NA NA NAP NAP 0.08i-OO 1.2E-03 4.18-03 2.6E-10 0.08i-OO 0.08i-OO 5.3E~3 I
NAP NAP NAP NAP NAP NAP
NA NA NA NAP ~AP NAP I ITotaiOYorall RiSk-] I 3.9E-08 1.4E-08 2.8E-12 O.OE+OO UE-06 l.ZE-06 I O.OBi-00 o.OBi-00 S.lE-03 I EPC Exposure paint c:oncenlnlion for incremenlal risk is total minus bsclcwound mglkg Milligram per til....,. NA Not omilablo; insufficient toxicity dala NAP Not applicable pllhway NC Not a suspoclcd cccinogen pCilg Pioocuries per gram VOC. Volatile orpnic compounds
I.OOB-'l6 b equivalent to 1.00 x 10•

i ~ ~ ~
[ fll r::. g
~ f: tTl
"'d ::l.
&l ~ ~ [ g,~ ~ g
~ r;· ·::o n
~-
i ~ 1
• • Table5.4 Tollll Ralllaal Rblr. for • Recrudonal CbiW at the Miami-Erie Caal Area
I CANCER EFFECTS I c NON.:cANCER EFFECTS I
Constituent
Patidda/PCBS lindrin Kelane Gamma Chlonlllne
Molall Bisntlll.b Coppa' .
l..cad Selenium Thallium
S.mi-Volatllc Orcaalc CompoiUIIh
EI'C JltliJb
0.002 0.0003
).10 34.70
226.00 0.91 0.88
2-M~ O.IS A«napptlhenc 0.19S Aunaphthylene 0.113 Benm(&h,i)pcrylene 0. 417 Calba.zDie 0.191 DibenzoCuran 0.195 Fluorene 0.21 Naphthalene 0.14 l'llenanllnnc o. m I Total Cllti!adab I RodlonlldidH Rad.ium-226
('tob.iaiiiiiODUdii!!t::J
EI'C ~ 3.04
Oral
NA 17Ji..ll
NA NA NA NA NA
NA NA NA NA
6.2H-IO NA NA NA NC
I ~4E-J.o
57£.08
Route-Spceilic Ride IJcmull lnhalaiion Inhalation External
Dust. VOCs
NA NA NAP NAP UE-10 2.9li-11 NAP NAP
NA NA NAP NAP NA NA NAP NAP NA NA NAP NAP NA NA NAP NAP NA NA NAP NAP
NA NA NAP. NAP. NA NA NAP NAP NA NA NAP NAP NA NA NAP NAP
6.4E-09 NA NAP NAP NA NA NAP NAP NA· NA NAP NAP NA NA NAP NAP NC NC NAP. NAP
6SB-99 l.9E-17 O.OH+OO O.Oii+OO
NAP 9.0£-13 NAP UE-06
Ctnccr Ride Total
O.OH+OO l.lli-10
O.OE+OO O.OH+OO OOB+OO OOH+OO O.OE•OO
0.06+00 O.OH+OO O.OE+OO 0.06+00 7.0£-09 0.0£+00 0.0£+00 O.OE+OO 0.06+00
Oral
NA Uli-06
NA I.Bii-03
NA l.SE-04 liE-02
NA 62li-OIS
NA NA NA NA
I.OE.OS l.lii-OS
NA
Route-SpecifiC IIQ Dctmal lnhallllion
Dust
NA NA 7.2E-06 Uli-12
NA NA 6.3E-04 NA
NA NA 1.3E.OS NA UE-02 NA
NA NA 6.3li-OS NA
NA NA NA NA NA NA NA NA
6.3li-OS O.OE+OO l.4li-OS UE-10
NA NA
lnhallllion External VOCa
NAP NAP NAP NAP
NAP NAP NAP NAP NAP NAP NAP NAP NAP NAP
NAP NAP NAP NAP NAP NAP NAP NAP NAP NAP NAP NAP NAP NAP NAP NAP NAP NAP
7.JE-09 I [})e-02 _.!·~- u!!--•ll _ _!!,_Oii+QI!_o.Ofi+OO
UE-06 NAP NAP NAP NAP NAP
Non.c.nHl
Total
o.OH+OO 8.4E~
O.OE+OO 2.4E-03 O.OH+OO 4.3&-04 l6E.02
O.OE+OO 6.9H.OS O.Oii+OO O.OE+OO 0.0£+00 O.OE+OO 7.3£-0S 9.8E.OS O.OB+OO l.Slli-02 . I
NAP
I NAP- '''N:AP--!W'-- --,:w>.. NAP NAP I
ffotaiOnraiJRbk I I S.8E.08 6.5E-09 9.0E-13 O.OH+OO UE-06 1.4E-06:J I 23E-02 1.6E-02 BB-10 O.Oli+OO O.OE+OO 3.91i-02 I EPC . l!.ll:pasunl point CCIIICa\ll1llio mglkg Millipm pa' kilogram. NA Not .nibble; inA.IIlic:icnt toxicity data. NAP Nllli!'Piicablc ~way. not a VOC. NC NlllallllpCCted carcinogen. pCi/g Picocuria pa' pm VOC. Vol.tile arpnic compounds.
1.001i-06 Is equinle:nltD 1.00 x 10⁴
.~

~ [ ~ ~ -~
~ r::-. g
~ ~ §. m
"'tl ~~ (")
~ ~ 0\ -
e.~ ~ ~
~ r;·
~ :s. ~
~ f
• TabJe5.5
Constituent
Pnlidcln/PCBS l!ndrin~ Oamma Chiem-
Mttalt Bilmuth Copper Lead Selenium Thallium
Semi-Volatile Orpalc Compoacla 2-Mcthylnaphthalene Acenaphtheno Acenaphthylane Bcnzo(s.h.i)pctylcno Carbazole Dibcnzofunn Fluorene Naphthalene PhenanthRno
(TO..I Cbomkal J
Radloau<lldOI Radium-226
• Bac:kpaaDd Residual Risk for a Recreational Odld at the Miami-Erie OuW Area
EPC ...,.,.
26 48
0.46
EPC
~ 2
I
On!
NA O.OE+OO
NA NA NA NA NA
NA NA NA NA
0.01!+00 NA NA NA NC
I o.oi!+OO
3.71!~
CANCER En'ECTS -
Route-Si!!!:ilic Risk Dermal Inhalation lnhaJalion Bxtemal
Dust VOCa
NA NA NAP NAP O.OE+OO O.OE+OO NAP NAP
NA NA NAP NAP NA NA NAP NAP NA NA NAP NAP NA NA NAP NAP NA NA NAP NAP
NA NA NAP NAP NA NA NAP NAP NA NA NAP NAP NA NA NAP NAP
0.01!+00 NA NAP NAP NA NA NAP NAP NA NA NAP NAP NA NA NAP NAP NC NC. NAP NAP
0.01!+00 0.01!+00 0.01!+()() 0.01!+()()
NAP 5.91!-16 NAP I.SE-06
J[--Concer Risk Oral Total
0.01!+()() NA O.OE+OO 0.01!+()()
0.01!+()() NA 0.01!+()() l.lB~l
O.OB+OO NA 0.01!+()() 0.01!+()() O.OB+OO I.IB~2
0.01!+00 NA O.OE+OO 0.01!+00 0.01!+00 NA O.OB+OO NA 0.01!+00 NA 0.01!+00 NA 0.01!-100 0.01!+00 O.OEtOO 0.01!+00 0.01!+00 NA O.OE+()() II 1.21!~2
1.6E-06 NAP·
NON-CANCER En'ECTS
Row-Specilic ~ N.....c.n-Dermal lnhaJalion lnhaJalion BxtemaJ HI
Dual VOCa Total
NA NA NAP NAP O.OB+OO 0.01!+()() O.OB+OO NAP NAP O.OB+OO
NA NA NAP NAP 0.01!+00 4.78-44 NA NAP NAP 1.81!-03
NA NA NAP NAP 0.01!+()() 0.01!+()() NA NAP NAP 0.01!+00 7.71!~3 NA NAP NAP 1.91!~2
NA NA NAP NAP O.OB+OO 001!+()() NA NAP NAP 0.01!+00
NA NA NAP NAP OOI!HlO NA NA NAP NAP O.OB+OO NA NA NAP NAP 0.01!+00 NA NA NAP NAP 0.01!+()()
O.OB+OO O.OB+OO NAP NAP 001!+00 O.OB+OO 0.01!+00 NAP NAP 0.01!+00
NA NA NAP NAP 0.01!+00 8.~3 O.OB+OO O.OB+OO 0.01!+()() _JOI!-02 I
NAP NAP. NAP NAP NAP
!Total Radioaacllclea I [TIE~ NAP- HE-16 NAP t.st:o6- ---.:6~ 1 r- NAP- --N~ NAP NAP NAP NAP 1
[Total Onnll Rbk J I 3.7B~ O.OE+OO S.91!-16 IIVALUBI l.SE-06 UE-06 II 1.21!-'12 8.~3 O.OB+OO 0.01!+()() O.OB+OO 2.01!-02 J
EPC l!xpaoure point concentntion mglkg Millipm per lcilosnm-NA Not nailablo; inwlliciont toxi<:ity dota NAP Not opplicablo pathway; not 1 VOC. NC Not aiUipOCted carcinogen. pCi/g Picocurioo per pm VOC. Voluilo oopnic compounda.
I.OOB~ b equinloat to 1.00 X I 04
.~
I

~
ii' i ~ [ g_ g
~ f: m
"tl :J. ~ ;; ;[ ~i
~·· c:r ~ -~
"' ~-
~ 1
• • • Table 5.6 lncrerna~tal Residual Risk for a Reaadonal Ol1ld at the Mluni-Erte Canal Area
I CANCERBFFECTS ---.-=:1 C: --- ~-- - ·- NON.cANCER~-----· :J
Rowi.Speci[IC Risk Cancer Roulc-s,ocilie HQ Non-Oinccr Constilw:nt Oral lltnMI lnhalllion lnhalalion Exl.ema1 · Risk Oral lltnMI lnhalalian lnhalalion Exl.ema1 HI
Du:ll. VOC. Toll! Du:ll. VOCa T olal EPC
..nur
Pesllclda/PCBS llndrin Ket.ono 0.002 NA NA NA NAP NAP O.OE+OO NA NA NA NAP NAP O.OB+OO Ocmna Chlordane 0.0003 l.lE·II 8.1E·ll 2.2B-17 NAP NAP 9.4E·Il 8.SE-07 5.46-06 3.6E-12 NAP NAP 6.3E.o6
Mdab Bianuth 3.10 NA NA NA NAP NAP 0.06+00 NA NA NA NAP NAP O.OE+OO Copp« 8.70 NA NA NA NAP NAP O.OE+OO HE~ l.lli-04 NA NAP NAP 4.S~
lad 178.00 NA NA NA NAP NAP O.OE+OO NA NA NA NAP NAP O.OB+OO Selenium o.91 NA NA NA NAP NAP O.OE+OO 2.6E~ 6.26-0S NA NAP NAP 3.2E~
Thallium 0.42 NA NA NA NAP NAP O.OE+OO 7.SE.Ol '-lE-03 NA NAP NAP 1.36.02
S.uai-Volatlle Orpnk c-paundl 2-Mdhylnap/ldlalene O.IS NA NA NA NAP NAP 0.01!+00 NA NA NA NAP NAP O.OE+OO ~ 0.19S NA NA NA NAP NAP 0.08+00 4.6E.o6 4.1B..OS NA NAP NAP s.m..os Aunaphlbylene 0.213 NA NA NA NAP NAP O.OE+OO NA NA NA NAP NAP 0.08+00 Bau:o(g.h,i)pclylcne 04n NA NA NA NAP NAP 0.01!+00 NA NA NA NAP NAP 0.08+00 Carbemlc 0.191 4.71!·10 UE-09 NA NAP NAP S2E-09 NA NA NA NAP NAP O.OE+OO Diben.zofunn 0.19S NA NA NA NAP NAP O.OE+OO NA NA NA NAP NAP 0.0!!+00 Fluorene 0.21 NA NA NA NAP NAP 0.01!+00 7.58-06 4.1B.QS O.OB+OO NAP NAP S.SE-03 Nltphthalcne 0.14 NA NA NA NAP NAP O.OE+OO l.OE.OS 6.3E.OS ).96-10 NAP NAP 7.3E-OS ~ o.nl
!Total Chtllllcal I NC NC NC NAP NAP O.OE+OO NA NA NA NAP NAP O.OB+OO
I 4.8E·IO 4.96..()9 l.~·J'l ~O.OJi:+<JQ_~JB!.~ __ s,'@iL) I IIE..Ol S.6E-03 4.06-10 O.OB+OO O.OE+OO t.4E-02 I EPC
lbdionudldrl I.Qf& Radium-226 1.04 1.9E-08 NAP 31E-l3 NAP 7.96.07 8.1E-07 NAP NAP NAP NAP NAP NAP
(To~llbdloa_tKIId~ I 1 1.9E..08 NAP l.IE-13 o.oi+OO 7.96-07 -i.TE-07] I-NA- NA NA NAP NA NAP I
ITotaiO..trdRllk I I 20!!..()8 4.91!..()9 l.IE-13 O.OE+OO 7.96-07 8.26-07 I I 8.16-03 S.6E..()] 406-lO O.OB+OO O.OE+OO l.4E-02 I EPC Elqloooun> point c:cnernlrlllicn f.,.. inctcmental risk is total minus ~ mg/ks Millipllpa:tilcgt:vn NA Not mlillb~Q; insuffiCient toxicity dala NAP Not opplicablc pathway NC Not a suspec:kid crreinogcn
pCils Pieoeurica pa: 8J1IIII VOCa Volalilc <qlllic ~
I.OOE-06 b equiwlall to 1.00 x 10⁴

? "" 00 0 ..... 0\ 00
• ~
l ~ ~ tr:l e. !· ~ ~
! ::1. I'll (')
[ ~ ~ c;·
~ ~-
~ I
Table 5.1
Canstilucnl
-.v.a~~Orpatc
c...-. 2-Melbylntplllbalme Aconophlhcne Acenlpldbylono llcnza(a)pylme llenm(&b.i)paykno Catbazole Dihenz(a,h)lnw-Dibenzofunn FluoRr1e Naphthalene Pherwllhrme
Patlddn Endrin Ketone Gamma Ollanlane
Motab Anenic llismulh Coppa Lad Sdollium Thallium
IT .... ClooiDical I RIIIIJao1lclldn PluiDnium-2)8 Radilllll-226
(Totdlbdloaudldt I
• Total Relldual Rbk ror a Residential Aduh at the MJami..Erte C8llal Area
1 CANCER uncrs =-::J c- NCJN.CANcu uncrs 1 Route-Specillc Risk
Onl Damal Inhalation Inhalation Exlemal Dust voc.
II'C -o.u NA NA NA NAP NAP 0.19S NA NA NA NAP NAP 0.21) NA NA NA NAP NAP 0.688 UE-06 UE-04 4.7E-11 NAP NAP o.4n NA NA NA NAP NAP 0.191 I.BE-09 4.2E-411 NA NAP NAP 0.24 8.2E.07 U&-05 1.6E-II NAP NAP 0.19S NA NA NA NAP NAP 0.21 NA NA NA NAP NAP 0.14 NA NA NA NAP NAP o.m NC NC NC NAP NAP
0.002 NA NA NA NAP NAP 0.000) 4.9E-11 1.6E-09 l.lE-IS NAP NAP
9.S 6.7[.06 1.9&-06 liE-09 NAP NAP u NA NA NA NAP NAP 34.7 NA NA NA NAP NAP 226 NA NA NA NAP NAP 0.91 NA NA NA NAP NAP 0.88 NA NA NA NAP NAP
I UE-06 1.5&-M l.2E-09 NAP NAP EPC Qa u.s 5.6£.06 NA 2.4E-08 NAP l.IE-09 ).04 7.7E.07 O.OE.OO l.lE-10 NAP UE-06
I U£.06 OOE~ 2.SE-08 N__M 1.5&-04__
Canoer Risk
Tolll
O.OE.OO O.OE.OO 0.0£.00 l.l&-M O.OE.OO 4.4E-411 J.OUS O.OE.OO O.OE+OO O.OE+OO O.OE+OO
OOE+OO I 7E-09
U&-05 O.OE+OO OOE.OO O.OE+OO O.OE+OO O.OE.OO
U&-Of I
5.6£.06 1.5&-M
1.5&-04 I
Onl
NA 4.SE-G6
NA NA NA NA NA NA
7.2E-G6 9.6E-G6
NA
NA 8.2E.07
4.)£.02 NA
l.lE.Ol NA
lSE-04 I.SE-02
I 60E-02
NA NA
I O.OE+OO
RaW-Specillc HQ Damal lniWolion Inhalation Exlanal
Non-earHI
Tollll Dust VOCa
NA NA NAP NAP O.OE.OO 2.4£-04 NA NAP NAP . UE-04
NA NA NAP NAP 0.0£.00 NA NA NAP NAP 0.0£.00 NA NA NAP NAP O.OE+OO NA NA NAP NAP O.OE.OO NA NA NAP NAP O.OE.OO NA NA NAP NAP O.OE.OO
2.4E-04 OOE.OO NAP NAP 2.4£-04 UE-04 I.OE-08 NAP NAP l.2E-04
NA NA NAP NAP O.OE+OO
NA NA NAP NAP O.OE.OO 2.7E.OS 9.6E·II NAP NAP 2.8E-OS
S.SE-02 1.2E-G6 NAP NAP I.OE-01 NA NA NAP NAP 0.0£+00
l.lE.Ol NA NAP NAP UE-03 NA NA NAP NAP O.OE.OO
l.IE-04 NA NAP NAP HE-04 S.SE-02 NA NAP NAP 7.0[-02
1.2E.OI 1.2E-G6 O.OE.OO O.OE.OO I.BE-01 I
NA NA NAP NA O.OE+OO NA NA NAP NA O.OE.OO
O.OE.OO O.OE.OO O.OE.OO O.OE.OO __ _ji.QE+OC)_)
lonnur-- 1 1 u&-os 1.5&-04 2.8E-411 NAP u&-04 12&-04 1 1 6.0E-02 1.2E.o• 1.2E-G6 NAP o.oE.oo I.BE-01 1 EPC m!Vkl NA NAP NC pCils voc. I.OOE-G6
[_.....point coru=llllion Milliplm pa bloplm Nol anilable; insulliamttoxicity data Nol applic:oble palhway NotaiUipCded -.:inoscn Picocurieo pa ...... Volalilo arpnio compounds
Ia equinlad to 1.00 X 10"'
•

i .,. \0
g, 0'1 00
~
l -~ tr1
~ ~-g
~ ~ ~-m ;. (")
i i ~ (";"
~ ;S.
~
~ 1
• • Table5.1 BadlpouDd Ralci.W Risk for a Resldeatlal Adult at die Miami-Erie Caul Area
I CANCER ll"rECTS I I ----- --NON.CANcatlrncrs ----~
Roufo-SpeQ&c Risk Cancer Roufo-Spodllc !!g N....c-Conslitucnl Ohl Dennol lnbalalion JniWation Exlanll Risk Ohl Damol lnhalolion lnbalalion Exlanll IU
Dust VOCa Tolll Dust VOCa Tolll IPC -S...V-Orpdc c-.-.
2-~ NA NA NA NAP NAP O.OE+OO NA NA NA NAP NAP O.OE+OO A""""''hd- NA NA NA NAP NAP O.OE+OO O.OE+OO O.OE+OO NA NAP NAP O.OE+OO A~ NA NA NA NAP NAP O.OE+OO NA NA NA NAP NAP O.OE+OO Benzo(o)pyn:no O.OE+OO O.OE+OO O.OE+OO NAP NAP O.OE+OO NA NA NA NAP NAP O.OE+OO llcnm(a,b,i)paylr:no NA NA NA NAP NAP O.OE+OO NA NA NA NAP NAP O.OE+OO Clltluolo O.OE+OO O.OE+OO NA NAP NAP OOE+OO NA NA NA NAP NAP O.OE+OO Dihau(l,)l)lnllnocno O.OE+OO OOE+OO O.OE+OO NAP NAP OOE+OO NA NA NA NAP NAP O.OE+OO DihcnzDfllnn NA NA NA NAP NAP O.OE+OO NA NA NA NAP NAP O.OE+OO F1uarene NA NA NA NAP NAP O.OE+OO O.OE+OO O.OE+OO O.OE+OO NAP NAP O.OE+OO Nophlllllcnc NA NA NA NAP NAP O.OE+OO O.OE+OO O.OE+OO O.OE+OO NAP NAP O.OE+OO Pbcnonlbrcnc NC NC NC NAP NAP O.OE+OO NA NA NA NAP NAP O.OE+OO -Endrin Kclonc NA NA NA NAP NAP O.OE+OO NA NA NA NAP NAP O.OE+OO ~Cblonllno O.OE+OO O.OE+OO O.OE+OO NAP NAP OOE+OO O.OE+OO O.OE+OO O.OE+OO NAP NAP O.OE+OO
Mctlb Ancnio 1.6 UE-K _I. I E-N UE-® NAP NAP UE-05 l9E-Ol S.lE-02 I.IE-06 NAP NAP 9.lE-02 llismlllh NA NA NA NAP NAP O.OE+OO NA NA NA NAP NAP O.OE+OO Coppa 26 NA NA NA NAP NAP O.OE+OO 9.6E-04 I.IE-03 NA NAP NAP 2.7£-03 LCid ... NA NA NA NAP NAP O.OE+OO NA NA NA NAP NAP O.OE+OO Scleniwn NA NA NA _NAP NAP O.OE+OO O.OE+OO O.OE+OO NA NAP NAP O.OE+OO Thollium 0.46 NA NA NA NAP NAP O.OE+OO 7.9E-03 UE-02 NA NAP NAP l7E-02
lra~a~~ I I UE-K I.IE-K · 2.8E-® O.OE+OO O.OE+OO UE-05 I I UE-02 _UI!-92 __ _l.!E-06 O.OE+OO O.OE+OO 1.3E-OI I EPC Qa
Plutoniwn-238 0.13 3.2E-08 NA 1.4E·IO NAP UE-11 3.2E-08 NA NA NA NAP NA O.OE+OO R.odium-126 2 S.OE-07 O.OE+OO UE-10 NAP Ul.-15 t.7E-15 NA NA NA NAP NA O.OE+OO
lra~a~R..U adldl I I HE-07 O.OE+OO l.6E-IO NAP UE-05 t.7E-05_I I O.OE+OO O.OE+OO _ O.OE+QO ___ O.~E+OO O.OE+OO O.OE+OO I ro•a..ifra~a~Ridl 1 1 UE-116 uE-M 3.2£-09 NAP uus u&ef 1 o.oE+OO o.OE+OO 1.3E-OI 1 EPC mA NA NAP NC pCils VOCa
I.OOE-06
Ellpalare painl OCIIICISIIhlion WillipD per blopm Nat IMiillblr, in111111cicn1tmcicily dato Nat ipFiicoble polhwoy Nat I ouopeo:lod c:uQnoscn
Pioocuria per ...... Vallliloaqonio....,.,.,......
.. cquiwlonl Ia 1.00" 10 ..
•

• • • TallleU 1--.a RaWual Risk rar a Rnldmtlal Adult d die MJuat.Erh Cual Ana
I CANCER IITECTI I I l'iOI'I-CAI'ICD IJ'RCI'I I l!.oule-SDocilio Riot c..- ~1m N....c-
~ Onl Damol lnholalian lnbalation EOCianll Riot Onl Oeatlol lnWalim lnbalatioG Exta!lll m Dusl VOCa TOUI Dull VOCa TOUI
G. ! ~ ~
iOC -SID-V ..... Olpllc ~ 2·M~ O.IS NA NA NA NAP NAP O.O£+GO NA NA NA NAP NAP O.OI!+GO ~ 0.1" NA NA NA NAP NAP 0.0£+00 4.5£.06 2.4£-44 NA NAP NAP 2-..o4 ~ 0,21) NA NA NA NAP NAP OOE+GO NA NA NA NAP NAP 0.01!-tGO
tTl llcnzo(a~ 0681 u~ UE-114 HE· II NAP NAP UE-N • NA NA NA NAP NAP OOE+i!O
! g, 8 0 c J,.
~ U77 NA NA NA NAP NAP O.OE+OO NA NA NA NAP NAP 0.0£+00 Carbuole 1.191 UE-09 4.2£~ N'A NAP NAP H£·01 NA NA NA NAP NAP 0.0£+00 Dibcm(a,J(lono..- 0.24 UE-07 UE-05 UE·II NAP NAP 2.0E-t5 NA NA NA NAP NAP O.OE+i!O OO>enztlftnn 0.19$ NA NA NA NAP NAP 0.0£+00 NA NA NA NAP NAP O.OE+GO Fluara!o 0.21 NA NA NA NAP NAP O.OE+OO 12£-06 2.4£-04 O.O£+i!O NAP NAP 2.4£-44 Naphlllalme 0.14 NA NA NA NAP NAP 00£+00 9.6£-06 UE-04 U£41 NAP NAP J.1E-04 PbenanlhP:nc o.m NC NC NC NAP NAP 00£<00 .NA NA NA NAP NAP o.OE+oO
~ m.
l'ltlllclda Erulrin KA:Ione 0.001 NA NA NA · NAP NAP 0.0£+00 NA NA NA NAP NAP O.OE+OO Cllmma Clloodano 0.0003 49E·II UE-09 UE·U NAP NAP 1.7E-09 82£-07 2.7£-0~ 9.6£·11 NAP NAP UE.OS
I
tTl Mdllo
~ ~·
~i S.2;" ~ &
~ ~
Ar...U. 09 6.3£.07 8.4£.07 3.0£-10 NAP NAP UE-H 4.1£-0) HE-03 1.2£-07 NAP NAP 9.6£.03 Bismulb ).I NA NA NA NAP NAP 0.0£+00 NA NA NA NAP NAP 0.0£-tGO Copsla 1.7 NA NA NA NAP NAP 0.0£+00 12£-44 UE-04 NA NAP NAP 11.1£-44 Lad 118 NA NA NA NAP NAP OOE+OO' NA NA NA NAP NAP O.OE-tGO Sd<nium 091 NA NA NA NAP NAP O.OE+OO 2.$£-04 3.1£-04 NA NAP NAP S.6E-04 ThalliwD 0811 NA NA NA NAP NAP 0.0£+00 1.5£.02 S.SE.Q2 NA NAP NAP 7.0£-02
lr-C!Madal I l.uE-06 1.4&-04 UE-10 0.0£+00 0.0£+00 UE-04 I I 2.0£.01 61£-02 1.3£-07 0.0£+00 0.0£+GO 8.1£-02 I EPC
.... adl .. Qa n
~ flulonium.238 12.37 S.SE-06 NA 2 4£.08 NAP 31£·09 UE-8' NA NA NA NAP NAP OOE<OO lladium-116 1.04 UE-07 0.0£+00 IIE·IO NAP 5.11:-05 UE-tS NA NA NA NAP NAP 0.0£-tGO
;S.
~ Lro~a~~...u. I ls.aE-06 O.OE+GO 24£.08 NAP -- -~~~~- $.61:-05] I O.OE+GO O.OE+OO 0.01!-tGO 0.0£+li!I __ O.OE-tGO 0.0£+GO I
i jOnnDTalllllblt I I '-'E-M UE-04 1.$£~ NAP S.OE-05 Z.OE-114 I O.OE-02 UE-02 1.3£-07 NAP NAP 1.1£.02 I £PC ~ poinl........,lnlion, inc:rommtllvdue ia lolal !llimll boc:kpound
f m&'la t.lilliiPm .... tilosnm NA Nolmilable; insulllcient toxicity dati NAP N<lllpplicable pllllway NC Nata~ CIIICinopn
pCils J'iQoc:uria """.,.... VOCs Vala!ilo 111p1ioc ~
I.OOE-06 luquivalcal to 1.00" 10_.

• :::0 g_ [ ~ ~ tt:l e. g_ 0 = ~ ~ ~-m
"' ~-d1l (')
~ i g,~ &; ~
~ ::::: 0
:::0 n :;. ~
~ :::0
1
• Table 5.10 Taal Relldual Rhk for a Rnldeatlal Cblld at tbe Milml-1111 Cull Ana
I CANCER IFnelS I I JIION.CANCU D7ICll I lloula-SDccillc Risk c..... ~SDOCilo !!!2 N~
Ccnatilucnl Onl Dermal lnbolalion lnbllalion ExB!ol Riot Onl Dermal lnhalllian lnbllalion Eafanll m Dull VOCa Totof Dull VOCa. Tolll -s-1-Volollloo.p.k
~ 1-~ o.u NA NA NA NAP NAP O.OE+OO NA NA NA NAP NAP 0.0£+00
~ 0.1" NA NA NA NAP NAP O.OE+OO 4.1£.05 U£.04 NA NAP NAP 4.1E-04 ACCNpbtbylono 0.113 NA NA NA NAP NAP O.OE+OO NA NA NA NAP NAP 0.0£+00 Benzo(o)pyn:na 0.6811 5.5&-06 5.6E-85 1.4E-ll NAP NAP 6.2£.15 NA NA NA NAP NAP O.OE+OO JlenZXI(J,h,i)paylcne un NA' NA NA NAP NAP O.OEtOO NA NA NA NAP NAP O.OE+OO CubozDie 0.191 4.1E~ 1.9E-48 NA NAP NAP 1.3E-41 NA NA NA NAP NAP O.OE+OO llil>enz(l,h~ 0.24 U£.06 I.'JE.f6 l.lE-11 NAP NAP 1.1[..15 NA NA NA NAP NAP O.OE+OO Dibenmfillln 0.1, NA NA NA NAP NAP O.OE+OO NA NA NA NAP NAP O.OE+OO Fluorene 0.11 NA NA NA NAP NAP OOE+OO 6.7E-G5 UE-G4 O.OE+OO NAP NAP 4.9£.04 Naphlholenc 0.14 NA NA NA NAP NAP O.OE+OO 1.9E-G5 '7E-G4 1.1E4 NAP NAP 66E-G4 Phenonllll1:ne o.m NC NC NC NAP NAP O.OE•OO NA NA NA NAP NAP O.OE+OO
Ptlllddn Endrin Ketone 0.001 NA NA NA NAP NAP O.OE+OO NA NA NA NAP NAP O.OE+OO Clommo Chlordono 0.0003 1.1E-IO 7.3E·IO l.lE·U NAP NAP 8.5E-IO 7.7E-G6 UE-G5 UE-10 NAP NAP 5.6E-G5
Motlb Anenie 9.5 UE-85 4-0E-06 1.6E~ NAP NAP J-0[..05 4.0E-GI I OE-Gl 1.5E-G6 NAP NAP 5.1E-Gl Bismuth 3.1 NA NA NA NAP NAP O.OEtOO NA NA NA NAP NAP O.OE+OO Copper 34.7 NA NA NA NAP NAP O.OEtOO 1.1E-G1 4.1E-G3 NA NAP NAP 1.6E.Q2 Lad 116 NA NA NA NAP NAP O.OEtOO NA NA NA NAP NAP O.OE+OO Seleniwn 0.91 NA NA NA NAP NAP O.OE+OO 2.3E-Gl ,.6E-G4 NA NAP NAP UE-Gl TIWiium 0.88 NA NA NA NAP NAP O.OE+OO 1.4E-GI UE-Gl NA NAP NAP 1.4£.01
(Tai:IIC:..... I I ur.." 6.9[.." 1.6E~ NAP NAP ur.." I I 5.6E-GI 1.1E-Gl 1.5E-G6 NAP NAP 7.7E-GI I IPC
Rodionucljc!q Qa Plulonium-238 11-' UE-06 NA 1.6E~ NAP 7.9E-IO 1.1[..116 NA NA NA NA NA O.OE+OO Rodium-116 3.04 3.1E-G7 OOE+OO 36E·ll NAP 17£.15 J.7[..15 NA NA NA NA NA 0.0£+00
(T al:ll Radloloud .. _ _I (uE-06 O.OE~ _t7E~ ____)IAP __ ~7Uj____liE-Qi] I O.OE+OO O.OE+OO O.OE+OO NAP _NAP O.OE+OO I lanniitaiiiRid< I I 2.~ UE-85--.i.:iE-09- NAP--i'7US-Ij&if I [ 5.6E-GJ 1.1E-GJ UE-G6 NAP NAP 7.78-GJ I EPC mslkll NA NAP NC pCila VOC.
1.00[..06
~painl~ ......._per tilotlnm Nol...a.hlr, insulllcienlloxic:ity data Nol.,piooolio pallnrly Nola~......a-Pioocollia per ...... Volatile Olpllio CXIIIIpOUIIda
.. equMJad to 1.00" 10 ..
•

• • • TableS.JI ............ Clllld at tile Mlaml-Erte Caul Ana
I CANCEIIIFRCII I I NClfi..CAMCIERIFRCII I Route Sperjfk. RDit eo.- RDuto-SDecilo !:!2 NanOncer
Conllilucnl Onl Damll lnbolalion lnbolalian EXImlll RDit Onl Damll lnbolalian lnbolalian EXImlll HI Dust voc. TOCII Dust voc. TOCII
~
9. II:I'C .....
[ ~ ~
,.,._V ..... Orpollc
~ Z·~ NA NA NA NAP NAP O.OE+OO NA NA NA NAP NAP O.OE+GO Acallpblbona NA NA NA NAP NAP O.OE+GO O.OE+OO O.OE+GO NA NAP NAP 0.01!+00 A~ NA NA NA NAP NAP O.OE+GO NA NA NA NAP NAP O.OE+GO
tTl e. Iii r::.
Benm(o)pylme O.OE+GO OOE+GO 0.0£+00 NAP NAP O.OE+OO NA NA NA NAP NAP O.OE+GO Benzo(a.b.i)paylono NA NA NA NAP NAP OOE+GO NA NA NA NAP NAP O.OE+OO Coltlozalo O.OE+GO 0.0£+00 NA NAP NAP 0.0£+00 NA NA NA NAP NAP O.OE+GO Dibenz(o,h~ 00£+00 0.0£+00 O.OE+OO NAP NAP 0.0£+00 NA NA NA NAP NAP 0.01!+00
g 0
l:
Dibenzolinn NA NA NA NAP NAP 0.0£+00 NA NA NA NAP NAP O.OE+GO FluDraoe NA NA NA NAP NAP OOE+GO O.OE+GO O.OE+GO O.OE+GO NAP NAP O.OE+GO Nophlbllenc NA NA NA NAP NAP 00£+00 0.0£+00 0.0£+00 0.0£+00 NAP NAP 0.01!+00 Phcnlnlbzaoe NC NC NC NAP NAP 0.0£+00 NA NA NA NAP NAP 0.0£+00
~ m.
Pntld ... Endrin ICdono NA NA NA NAP NAP O.OE+OO NA NA NA NAP NAP 0.0£+00 Clomma CliiDidano 0.0£+00 0.0£+00 O.OE+OO NAP NAP 0.0£+00 O.OE+OO O.OE+GO O.OE+GO NAP NAP 0.0£+00
I
tTl Mllab
0,:, ~-~ ()
~[ e.~ ~ ~
~
Analic 8.6 UE-05 UE-06 1.4£-09 NAP NAP J.IE-05 3.7£·01 9.SE.OZ Z.ZE-06 NAP NAP 4.6£.01 llimoulh NA NA NA NAP NAP O.OE+OO NA NA NA NAP NAP O.OE+GO Copper :16 NA NA NA NAP NAP O.OE+OO 9.0£.0] lZE-03 NA NAP NAP lll!-02 Lad 411 NA NA NA NAP NAP 0.0£+00 NA NA NA NAP NAP O.OE+GO Sdenium NA NA NA NAP NAP O.OE+OO O.OE+GO O.OE+GO NA NAP NAP 0.0£+00 1bollillm 0.46 NA NA NA NAP NAP 0.0£+00 7.4£-02 S.ZE-02 NA NAP NAP l.lE-01
ITollll~ --I I UE-05 UE-06 1.4£-09 0.0£+00 O.OE+GO u&-o5 1 I 4.5£.01 I.SE-01 Z.ZE-06 0.0£+00 0.0£+00 6.0£.01 I II:PC
:::: n
-~
QJ l'lulanium-:Ill 0.13 UE-08 NA I.SE·II NAP 4 SE·IZ 16£-08 NA NA NA NAP NAP O.OEtOO Rodium-Z:I6 z Z.SE-07 0.0£+00 HE· II NAP u~ ~-·~ NA NA NA NAP NAP O.OE+GO
:.:i. ~ frobiJWI lit . I I_ Z.7E.07 _0~0£+00 __ ).9£._11 ___ !'IM...___~~E-05 ~-~ I o.oE+ao O.OE+GO 0.0£+00 O.OE+GO _O.OE+GO 0.0£+00 I
i ~
i
IOnnDT-Rbk I I UE-05 l.~~---w.p-- ---uE:i5----.:Jt..is I C4.SE.OI I.SE-01 Z.ZE-06 NAP NAP 6.0E.OI I EPC EllpDIIn paini ... ICalllodiou lf08IkB - MiJipD per kiloplm NA NciiYliJIIIIo; inlullldenl toxiQty dati NAP Nat lplllil:able podnroy NC Natuuopecl<d..........., pCila PioDcuria per aram V0C. Valoblo Cllpnic compounds
I.OOE-06 laoquinlcatto I.OOa 104
'~ .:
~j ~.~ ... ~t:i~: :-:"

• • • Table5.1Z 1-tal Rnldual Risk for • Raldeallal Cblld at tba Mllmi-Erte Caul Ami 1-a.J
I CANCER EFfECTS I I NON-CANCER EFFECTS I Jloui<.Spccillc Risk Cancer lloule-Soociftc !!Q Non-e..-
Constituent Onl Dermll lnholation Inhalation Extanll Risk Onl Dennol lnhololion lnholation Extanll HI Dust VOCI Total Dull VOCI Tolll
I ~
~ -Se5V-o.p.k c..,.... 2·Mctbylnopbthllene o.u NA NA NA NAP NAP O.OE+OO NA NA NA NAP NAP O.OE+GO Acenophthcno 0.195 NA NA NA NAP NAP 0.0£+00 4.2£.0' UE-04 NA NAP NAP 4.1£.44
~ A<cnlphthykllo 0.21] NA NA NA NAP NAP 0.0£+00 NA NA NA NAP NAP O.OE+GO
tt1 Qi
~ r::. g
llcnzo(a)pylale 0681 5.5[.06 5.6£.05 2.4£·11 NAP NAP UE-05 NA NA NA NAP NAP O.OE+OO llcn2.o(a,h,i)payk:no 0.471 NA NA NA NAP NAP 0.0£+00 NA· NA NA NAP NAP O.OE+GO Colbazolo U91 4.2£-09 1.9£-08 NA NAP NAP 23£·08 NA NA NA NAP NAP O.OE+GO Dibcnz(a,ll)an~ 0.24 Ut:-06 1.7E-06 8.3£-12 NAP NAP l.IE-05 NA NA NA NAP NAP O.OE+GO Dibenzofunn 0.1, NA NA NA NAP NAP OOE+OO NA NA NA NAP NAP O.OE+GO FJucmae 0.21 NA NA NA NAP NAP O.OE+OO 6 7E.O' UE-04 O.OE+GO NAP NAP 49£-04
0
~ Naphtbllene 0.14 NA NA NA NAP NAP O.OE+OO 8.9£.0' HE-04 2.1£-08 NAP NAP 6.6£-04 Phenantluene o.m NC NC NC NAP NAP O.OE+OO NA NA NA NAP NAP O.OE+GO
~ Pntlr:ldn Endrin Ketone 0.002 NA NA NA NAP NAP O.OE+OO NA NA NA NAP NAP OOE+OO
§. Oamma Ollordane 0.0003 1.2£-10 7.3£-10 UE-U NAP NAP 8 5E-10 7.7E-06 4.9£.0' 1.9£-10 NAP NAP UE.O'
I
tt1 '"tl ::1.
d8 ~ ~ [
Motalo AIJcnic 0.9 1.5E-06 l8E.07 UE-10 NAP NAP UE-06 lBE-02 9.9£.03 2.3£.07 NAP NAP 4.8£.02 Bismulh ).J NA NA NA NAP NAP 0.0£+00 NA NA NA NAP NAP O.OE+GO Copper 1.7 NA NA NA NAP NAP O.OE+GO l.OE-03 1.1£.03 NA NAP NAP 4.1£.0] Lad 171 NA NA NA NAP NAP 0.0£+00 NA NA NA NAP NAP O.OE+GO Selenium 091 NA NA NA NAP NAP 0.0£•00 2.3£.03 HE-04 NA NAP NAP 2.9£.03
g,~ &l ~
~ c;·
1hallium 0.81 NA NA NA NAP NAP O.OE+OO 1.4£.01 9.9£-02 NA NAP NAP 2.4£.01
lro~a~c-...a I lut:-06 UE-05 1.8£-10 0.0£+00 0.0£+00 7.4£.05 1 I 1.8£.01 1.1£.01 2.6£-07 O.OE+GO O.OE+GO l0£.01 I EPC
Rllobamxlldn Ql Plulollium-238 22.37 UE-06 NA 2.6£·09 NAP 7.8£·10 UE-06 NA NA NA NAP NA 0.0£+00
~ Radium-226 1.04 1.3£.07 0 OE+OO 12£-11 NAP UE-15 UE-15 NA NA NA NAP NA O.OE+GO
;S.
~ ITolaiRadlaa ..... I I UE-06 0.0£+00 2.6£-09 NAP UE-05 UE-05 I I O.OE+GO O.OE+GO O.OE+GO O.OE+GO __ O.OE+GO O.OE+GO I
~ IOnraDTolaiRkk I I U£.05 6.5£.05 2.8£-09 NAP UE-15 f.0£.05 I I 1.8£.01 I.IE.OI 2.6£-07 NAP NAP ].OE.OI I EPC Expaoun paint~ inaanenlal nJue is Ioiii minul bacqround
~ mglka MiiiPm .... tiJosnm
1 NA No1 nailable; insuflicient lollicily data NAP Not app1icab1o polhwoy NC Notuu•pectodcarcinopn pCi/a l'iooculielperiJIUD VOCI Valalilo _.;. compounds
1.00£-06 laequinleniiD I.OOx 10"1

• • • Table 5.13 ToUI Raldual Risk ror an OIJ Site Constructloo Worker at Cbe Mlaml-Erte Caoal Area
I CANCER Ell'ECrS I I NON-CANCER En'I:CT3 I Route-S~ Risk Can<cr Roulo-SDea6r !!S! Nan-ea.-
Conslilucnl Onl Dc:rmol lnholalion lnbalation ExtCI1III Risk Onl Dc:rmol lnhllolion lnbalation Exlanol HI Dull voc. Tacal Dull VOC. Tacal
~ II'C -~ -VolallloOrplllc c..,_..
~ 2·MctltylnlpbtiWcn O.IS NA NA NA NAP NAP O.OE+OO NA NA NA NAP NAP O.OE+OO Acenopldllcno 0.19S NA NA NA NAP NAP O.OE+OO I.~E-4~ HE-4~ NA NAP NAP 4.&-0'
~ Atenoplllbylone 0.21) NA NA NA NAP NAP O.OE+OO NA NA NA NAP NAP O.OE+OO
tTl lknzo(s.1l.i)pa un NA NA NA NAP NAP O.OE+OO NA NA NA NAP NAP O.OE+OO < CoJbozole 0.191 UE·IO 2)£-10 NA NAP NAP 49£-10 NA NA NA NAP NAP 0.0£+00 e. Dibenmlluan O.IU NA NA NA NAP NAP O.OE+OO NA NA NA NAP NAP 0.0£+00 Iii Fluorene 0.21 NA NA NA NAP NAP O.OE+OO UE-4~ l.IE-4~ O.OE+OO NAP NAP S.SE-4~ r::. Naphthalene 0.14 NA NA NA NAP ·NAP O.OE+OO UE-4~ UE-4' 7.4£-49 NAP NAP 7.4£-4, g
Pherwtthmle o.m NC NC NC NAP NAP O.OE+OO NA NA NA NAP NAP 0.0£+00
~ Pedlcldn Endrin Ketone 0.002 NA NA NA NAP NAP OOE<OO NA NA NA NAP NAP O.OE+OO
~ Gamma Chlordane 0.0003 7.0£·12 8 BE-12 6.9£-17 NAP NAP 1.6£-11 2 BE-46 3.~£-46 6.9£-11 NAP NAP 6.3£-46
~. Motab Arsenic 9.~ 9.6£-07 HE-08 9.3£-11 NAP NAP t.0£.06 UE-01 7.6£-0l 8 7E-47 NAP NAP UE-41
I Bismulh 3.1 NA NA NA NAP NAP O.OE<OO NA NA NA NAP NAP O.OE+OO tTl
"" ::l. Copper 34.7 NA NA NA NAP NAP 0.0£+00 4.4£-43 l.IE-44 NA NAP NAP 4.7£-43
~ n Leod 226 NA NA NA NAP NAP OOE+OO NA NA NA NAP NAP O.OE+OO (')
Sdenium 0.91 NA NA NA NAP NAP O.OE+OO 8~E-44 4.0£-4~ NA NAP NAP 9.0£-44 Vl [ Thallimn 0.88 NA NA NA NAP NAP O.OE+OO SZE-42 7.2£-43 NA NAP NAP UE-42
""' 0
~ IT ohl Cbomlaol I I 9.6£-47 4.9£-08 9.3£·11 O.OE+OO O.OE+OO t.o£.06 I I 2.1£-41 I.~E-02 8.8£-47 O.OE+OO __ O.OE+OO_ 2.2£-41 I -. 0\ EPC 00
lb-adldet
~ Qa
Rodium·U6 ].04 I.IE-07 O.OE+OO 9.9£·12 NAP 6.1£.06 U£.06 NA NA NA NAP NA O.OE+OO
c;· IT o4al Radloaadldo I I 1.1£-47 0.0£+00 9.9£-12 NAP UE-M '-21:-M I I O.OE+OO 0.0£+00 0.0£+00 0.0£+00 O.OE+OO 0.0£+00 I w ~- IOnnD T o4al Rldt I I 1.11:-M 4.9£-48 I.OE·IO 0.0£+00 6.1&G6 7.2&G6 I I 2.1£-41 UE-42 8.8£-47 0.0£+00 O.OE+OO 2.2£-40
~ EPC Expooan point -tion
~ mgltg Millipm pa l:ilaBnm NA Not IMitable; ins111&oicnt toxicity dala NAP Notopplicablc palhway
I NC Nato mspeded corcinos<n pCi/8 Piooculia per ....... voc. Vololile C11J111ic compounds I.OOE~ b equinlo:nt to 1.00" 10 ..

• • • Table5.14 Baclqp'OaDd R~ual Risk rot' an 0m1te constnact1oa Wortrer at tile Mluai-Erte CaaaJ Ana
I CANCER EFFECTS I I NCJN.CANCD UfEC1I I Jtoule.S~ Rillt Cancer Jtoule.S~ Hg N....c-
Constituent . Onl Damll lnholllion Jnllllalion Exlanol Rillt Onl Dc:lmol . Jnhllolion lnholalion Exlanol HI Dust VOCI Toll! Dust VOCa Toll!
::0 tl't g. ..... [ s-1-V-Orp.k
c ....... 2·M~ NA NA NA NAP NAP O.OE+OO NA NA NA NAP NAP O.OE+OO
~ Accnopldblno NA NA NA NAP NAP O.OE+OO O.OE+OO O.OE+OO NA NAP NAP O.OE+OO ~ Acenopldbytalo NA NA NA NAP NAP O.OE+OO NA NA NA NAP NAP O.OE+OO tTl 8enzoC&b,i)pcry NA NA NA NAP NAP O.OE+OO NA NA NA NAP NAP O.OE+OO < Cllbuolo O.OE+OO 0.0£+00 NA NAP NAP 0.0£+00 NA NA NA NAP NAP O.OE+OO e. Dibonzolhnn NA NA NA NAP NAP 0.0£+00 NA NA NA NAP NAP O.OE+OO lil Fluora1c NA NA NA NAP NAP O.OE+OO O.OE+OO 0.0£+00 0.0£+00 NAP NAP O.OE+OO c-. NaplufWene NA NA NA NAP NAP OOE+OO 0.0£+00 O.OE+OO O.OE+OO NAP NAP O.OE+OO g
Pbcnuttlucne NC NC NC NAP NAP O.OE•OO NA NA NA NAP NAP O.OE+OO 0
1: PHIIddu EnclrinKdone NA NA NA NAP NAP O.OEtOO NA NA NA NAP NAP O.OE+OO
~ Clamml Ollardlno 0.0£+00 0.0£+00 O.OE+OO NAP NAP OOE+OO O.OE+OO O.OE+OO O.OE+OO NAP NAP O.OE+OO
~. Mlbb Anenic: u 8.7£.07 HE .OS 8.4£·11 NAP NAP 9.1£.07 IJE·OI 6.8E.Ol 7.9£.07 NAP NAP 1.4£.01 . Jlismulh NA NA NA NAP NAP O.OE+OO NA NA NA NAP NAP O.OE+OO tTl
"tt :::1. Copper 26 NA NA NA NAP NAP O.OEtGQ l.lE.Ol 2.)£-04 NA NAP NAP 3.~ &: n Lad 48 NA NA NA NAP NAP OOEtOO NA NA NA NAP NAP O.OE+OO n ("') Scll:nium NA. NA NA NAP NAP O.OE+OO O.OE+OO O.OE+OO NA NAP NAP 0.0£+00
~ [ 11llllium 0.46 NA NA NA NAP NAP O.OE+OO l.7E.Ol l.BE.Ol NA NAP NAP l.IE-02
g,~ It alai Cbooalml I I '8.7£-07 4.4£-08 1.4£·11 O.OE+OO 0.0£+00 9.1£.07 1 I 1.6£.01 J.JE-02 7.9£-07 O.OE+OO 0.0£+00 I.BE.OI I ~ ~ IPC
~ Radlaaadldn Qa llldium·ll6 2 7.2£-08 O.OEtOO 6.5E·Il NAP 4.0£..06 UE-06 NA NA NA NAP NA O.OE+OO
r;· It alai Radloa ..... I I 7.2£-08 O.OE+OO 6.5£·12 NAP UF,M UF,M I 1 o.oE+OO O.OE+OO O.OE+OO O.OE+OO O.OE+OO O.OE+OO I ~ ~- lo-.JJ Tolal Rllk I 1 · 9.4£.07 UE-08 9.1£·11 0.0£+00 4.0Jr,06 s.orM I I 1.6£.01 J.JE-02 7.9£-07 O.OE+OO 0.0£+00 1.8£.01 I ~ EPC Exposure point cmcentnlion
~ mglks Milliplm per tiJosnlu NA Not IYiiloble; insullkitnt toxicity data NAP Notlplllicoblcpllh~
f NC Not I -pa:ll:d cm:iJiasen pCi1a Pi<oc:urico I pcrpm ' VOCa Valllile arpnio compounds I.OOE-06 .. equinlaJI to 1.00 ~ 10 ..
i I

•
~01 "OOI OIJ1l01110!11boll !1011001 ~"!JJIlbb"'!!IIDA t::lOA
llldl.l:ldf111!111000!d 11!:)11 -.,....~liON ::>H
.(oaqrod "JJPP!!IIdd ION c!VH IIII'~IU'I!"!!Jtt""'~IOH VH
lllllll<lm.l:ld ~ ¥u punoJilptqfiiU!WJ"IOII!""l"'~~IJI!Od~ ::>d'!l
r-zif:D'f~ 110+30"0 110+30"0 80-30'6 £0-!118 to-an I I w:u'l w.rn 110+30'0 ll•ilt"J 60'il8't LO"llt"l I I lPIIIPID.lJIII.IUO)
[Oo+i!OO 110+!10'0 IIO+iiO'O 110+300 110+30'0 GO+ao·o 1 110+30'0 VN dVN VN VN VN
I t0"39'L 110+30'0 00+30'0 10"30'11 £0"lllll w-a89 1 to-36'S dVN dVN VN (O"llt'L t0"3U I'O"l!0'6 dVN dVN VN SO" !lot to-an 110+30'0 dVN dVN VN YN VN OH!tl dVN dVN VN so-an (0"31'1 00+3011 dVN dVN VN 'VN VN w-an dVN dVN so-an to-3tL to-a~·•
ll0"3£9 dVN dVN 11·36'9 9Q:liH 90"38[ 110+30'0 dVN c!VN VN VN VN
00+30'0 dVN dVN VN VN YN SO"!IH dVN ciVIl lilt3H S0"31t so-an SO"i!H dVN dVN 110+30'0 SO"lll'£ so-an OO+iiO'O dVN dVN VN VN VN IIO+iiOO dVN dVN VN VN VN 00+300 dVN dVN VN VN VN 00+30'0 dVN dVN VN YN VN SO"D't dVN dVM vN So-ill'£ so-an 110+30'0 c!VN dVN VN VN VN
1"101 t::lOA """ IH ~""!l!lllllll UIJ!I'IIIIIII l'fiii'I<I 1"'0 ~ bli liiJ#iiiS:;JiiO
I --I.L:ti..U3~N ···-]
I w.r'" to-:tn
1 ao-a96
OO+iiOO OO+iiOO 00+30'0 OO+iiOO 00+300 80"3'6
11·39'1 00+30'0
OO+i!O'O 00+30'0 00+300 00+300 01•30 OO+aoo OO+aO'O 00+30'0 OO+ao·o
1"101 ~
-'"::>
w.rn c!VN tl·an 110+!10'0
to-:tn c!VN tl·liH .00+30'0
00+30'0 00+30'0 [1•3811 60"i!U
dVN c!VN VN VN dVN dVN VN VN c!VN dVN VN VN dVN dVN YN VN dVN dVN VN VN dVN dVN tl·388 60"39't
c!VN dVN Ll·36'9 [1•38'8 dVN dVN VN VN
c!VN dVN ::>H ::>N ~ dVN c!VN VN VN
dVN dVN VN YN dVN dVN VN VN dVN dVN VH o1·an dVN dVN YN VN dVN dVN VN YN dVN dVN VM VN c!VN dVN VN VN
r.:loA --11110
(IUIOlll3 IIO!III'1M IIO!III'1M l'fiii:I(I
..-.O!J!oOCIS41ft011
110-!IH I ao·an
IIO"l!U I -VN VN VN VN VN
110-31'6
tt·l!O'L VN
:lN YN VN. VN
OI•D't VN VN VN VN
1"'0
I ID3.1A3 U:JIIIY.J . . --,
tO'I Q5l
:WJ
88'0 111'0 ILl L1l n 60
l=· ............ ll.iiiiiiiJ 9tt·llln!P'll
............a
,---ji:jjliiii,jjijO.i]
11111!111'11 ""'!'!"PS
per}
"""""::> 'lll'WI!8 IJ!IDUV
-~~~ £000'0 """P"'P'D IIIIIWI!)
tOO'O """PJ' \l!lPUl ..,_ ..
£LL'O ~
ti'O ~N lt'O ""'"""'l:'
SIII'O """lJ'ZJDZI! 161'0 '"'"''"'''r.)
Ut'O ~ tlt'O ~~ SIII'O ~V "'0 ~-[
li!IIM' .:lo£11
~ IIIJIIII'OIIIIPA .....
IIIOfti!1JIIOO
liN\>' paw;) -v.l"f11111KIIP PI ...... .\\ IIOIPft.lliUO:> lrllt!IJO 1111 ~ li'QI pnPfUl:l..,_l sa·sepp.L
•
j. ~ ~ li!: 11.1 ·s: ~ .;!
~ :i ~ <<a 1~ ~l ·t: w . 'fi ~ .., :::> 0 a ·.= !J i w ~ iii!
l ·u ~
•

•
•
•
Table 5.16 Total Residual Risk for the Miami-Erie Canal Area Summary Table
Scenario and Total Total Receptor Noru:areinogen Carcinogenic
Resident Child Soil (all sample Scenario depths)
Recreational Adult Soil (0-2 ft bls) Scenario
Radionuclides
Chemical Ingestion Dermal Inhalation of Dust Inhalation of VOCs
TOTAL
Radionuclides Inp;estion Inhalation of Dust External
TOTAL Chemical & Radionuclide Total
Chemical 1lnll;estion Dermal Inhalation of Dust Inhalation of VOCs
TOTAL
5.6E-Ol l.JE-05 2.1E-Ol 6.9E..OS 2.5E-06 l.6E-09 O.OE-+00 O.OE+OO 7.7E-Ol 9.:ZE-05
NAP J.:ZE-06 NAP 2.7E-09 NAP 3.7E-05 NAP 4.0E-05
7.7E-Ol l.JE-04
2.5E-03 2.7E-10 8.6E-03 l.4E-08 l.OE-09 2.2E-l6
O.OE-+00 O.OE+OO l.IE-02 l.SE-08
NAP l.lE-07 NAP 3.2E-ll
Radionuclides Ingestion ~~~~~--------~----~~--------+-~~~~ Inhalation of Dust External NAP
TOTAL NAP Chemical & Radionuclide Total l.lE-02
Recreational Child . Soil (0-2 ft bls) Chemical 'lngestion 2.3E-02 Scenario Dermal l.6E-02
Inhalation of Dust 3.2E-09 Inhalation of VOCs O.OE-+00
TOTAL 3.9E-02
Radionuclides I Ingestion NAP Inhalation of Dust NAP External NAP
TOTAL NAP Chemical & Radionuclide Total 3.9E-02
Residual Risk Evaluation OU-4 Miami-Erie Canal Area Public Review Draft Report
Page 57 of68
9.3E-06 9.4E-06 9.4E-06
6.4E-10 6.5E-09 1.7E-16
O.OE+OO 7.1E-09
5.7E-08 5.4E-l2 :Z.JE-06 2.4E-06 :Z.4E-06

•
•
•
Table 5.16 Total Residual Risk for the Miami-Erie Canal Area Summary Table
Scenario and Total Total Reeeptor Noncan:inogen Carcinogenic
Radionuclides
1-U values which exceed the target risk level of one and ELCR values which exceed 10-6 presented in bold text.
IE-01 is equivalent to 1.00 xl0"1
Residual Risk Evaluation OU-4 Miami-Erie Canal Area Public Review Draft Report
Page 58 of68

•
•
•
Table 5.17 Background Residual Risk for tbe Miami-Erie Canal Area Sununary Table
Scenario and Receptor
Radionuclidcs
~}.~ ~~~!!.,:"''kimc&.;;j~~ ~~~~,~~~'' Recreational Child Soil (0-2 ft bls) Chemical Ingestion 13E-03 Scenario Dcnnal 4.SE-03
Inhalation of Dust O.OE+OO Inhalation of VOCs O.OE+OO
TOTAL S.BE-03
Radionuclidcs Inacstion NAP Inhalation of Dust NAP External NAP
TOTAL NAP Chemical & Radionuclide Total S.SE-03
Residual Risk Evaluation OU-4 Miami-Erie Canal Area Public Review Draft Report
Page 59 of68
O.OE-+00 O.OE-+00 O.OE+OO O.OE-+00 O.OE+OO
7.SE-08 2.1E-ll 1.51-06 1.61-06 1.61-06

•
•
•
Table 5.17 Background Residual Risk for the Miami-Erie Canal Area Summary Table
Scenario and Receptor
Radioiluclides
HI values which exceed the target risk level of one and ELCR values which exceed 10-6 presented in bold text.
1E-01 is equivalent to 1.00 x10"1
Residual Risk Evaluation OU-4 Miami-Erie Canal Area Public Review Draft Report
Page60 of68

•
•
•
Table 5.18 Incremental Residual Risk for the Miami-Erie Canal Area Summary Table
Scenario and Receptor
Child Soil (all sample depths)
Chemical
Radionuclides
Radionuclides
Incremental Noncarcinogen Risk
Incremental Carcinogenic
,-. -:·i:'ti{ $~~" .v.f~ dt}~~~tlfikli~is~!d£l~rr;=--~~~~ vw; ~ ~~ ~ A Ax1Zi6;r~xwJ';~~M ~::,'
Recreational Child Soil (0-2 ft bls) Chemical Inaestion 8.1E-03 Scenario Dermal 5.6E-03
IDhal.ation of Dust 2.4E-09 Inhalation of VOC1 O.OE+OO
TOTAL l.4E-02
Radionuclides IInaestion NAP IDhal.ation of Dust NAP External NAP
TOTAL NAP Chemical & Radionuclide Total l.4E-02
Residual Risk Evaluation OU-4 Miami-Erie Canal Area Public Review Draft Report
Page 61 of 68
4.8E-10 4.9E-09 1.3E-16 O.OE+OO 5.3E-09
1.9E-08 1.8E-12 7.9E-07 8.1E-07 8.1.&-07

•
•
•
Table 5.18 Incremental Residual Risk for the Miami-Erie Canal Area Summary Table
Scenario and ~eceptor
Incremental Noncarcinogen Risk
In values which exceed the target risk level of one and ELCR values which exceed 10-6 presented in bold text.
lE-01 is equivalent to 1.00 xl0"1
Residual Risk Evaluation OU-4 Miami-Erie Canal Area Public Review Draft Report
Page 62 of68
Incremental Carcinogenic

•
•
•
6.0 UNCERTAINTY IN THE RISK ASSESSMENT
In the following section, an evaluation is presented of the sources of uncertainty in the Miami-Erie Canal
area RRE and the relative influence of these sources on the results of the evaluation. Uncertainty is inherent in
the selection of input parameters and in every step of the risk assessment process. Risk assessment of
contaminated sites must not be viewed as yielding single value, invariant results. Rather, the results of risk
assessment are estimates that span a range of possible values, and which must be understood only in light of the
assumptions and methods used in the evaluation.
The results of the RRE are presented in terms of the potential for adverse effects based upon a number
of conservative assumptions. The tendency to be conservative is an effort to err toward protecting health.
Uncertainty can be found at all phases in the risk assessment: in the analytical data, the exposure assessment, the
toxicity assessment, and the risk characterization. Where uncertainty does exist, the RRE uses conservative
assumptions to ensure that the outcome will be protective.
6.1 Uncertainty in Analytical Data
Uncertainty is introduced to the RRE when sample locations are selected and when samples are collected
and analyzed. In the RRE, the long-term exposure concentrations were upper estimates of site concentrations
(e.g., maximum detect or 95% UCL); therefore, a conservative bias to overestimate potential exposure has been
incorporated into the risk estimates. The uncertainty associated with the statistical analysis of environmental data
is low, with little introduction of bias. However, it is possible that contaminated areas of the canal were not
sampled. This is unlikely given the extent of sampling conducted.
6.2 Uncertainty in Exposure Assessment
Exposure assessment may introduce considerable uncertainty in the risk assessment process. The RREM
presents exposure and intake calculations based on EPA procedures that were used in the Miami-Erie Canal RRE.
Exposure assumption values were also used to develop site-specific risk-based guideline values for the Mound
Plant which were approved by Ohio EPA and EPA. Exposure assumptions are based on speculation regarding
Residual Risk Evaluation OU-4 Miami-Erie Canal Area Public Review Draft Report
Page 63 of 68

,(f potential land use, assumptions concerning contaminant fate and transport, and receptor behavior. The
. uncertainty associated with the exposure assumptions used in the risk assessment is low to moderate, and most .
likely overestimates the actual risks.
6.3 Uncertainties Related to Toxicity Information
Although EPA approved toxicity values were used for the RRE a significant amount of uncertainty may
surround these values. Identification of the sotirces of this uncertainty enables the risk assessor to establish the
degree of confidence associated with the toxicity measures.
Uncertainty is inherent within the toxicity assessment and is primarily due to differences in study design,
species, sex, routes of exposure, or dose-response relationships. A major source of uncertainty involves using
toxicity values based on experimental studies that substantially differ from typical human exposure scenarios.
The derivation of the toxicity values must take into account such differences as 1) using dose-response
information from animal studies to predict effects in humans, 2) extrapolating.dose-response information from
high-dose studies to predict adverse health effects from low doses, 3) using data from short-term studies to ce predict chronic effects, and 4) extrapolating from uniform animal populations to variable human populations.
Ct
The cancer slope factors in particular are based on studies that may differ greatly from realistic situations.
Experimental cancer bioassays typically expose animals to very high levels of chemicals (i.e., the maximum
tolerated dose) for their entire lifetime. After appropriate studies have been identified, the slope factor is
calculated as the upper 95th percent confidence limit of the slope of the dose-response curve. This introduces
conservatism into the risk assessment. In addition, carcinogens are assumed to be human carcinogens regardless
ofEPA's weight-of-evidence c1assification.
The derivation of reference doses involves the use of animal studies. Uncertainty factors ranging from
1 to 1,000 are incorporated into the reference dose to provide an extra level of health protection. The factors used
depend on the type of study from which the value has been derived (e.g., animal or human, chronic or acute, study
Residual Risk Evaluation OU-4 Miami-Erie Canal Area Public Review Draft Report
Page 64 of68

•
•
•
6.4 Uncertainties In Risk Characterization
Uncertainties in any phase of the risk analysis are reflected in the risk estimates. Some uncertainty is
associated with the summation of risks and HQ~ for multiple chemical contaminants. As stated in RAGS (EPA
1989), "The assumption of dose additivity ignores possible synergisms or antagonisms among chemicals, and
assumes similarity in mechanisms of action and metabolism." However, summing risks and HQs for multiple
substances in this risk assessment provides a conservative estimate .
Residual Risk Evaluation OU-4 Miami-Erie Canal Area Public Review Draft Report
Page 66 of68
• 7.0 REFERENCES
•
•
Centers of Disease Control and Prevention (CDC), 1985. Preventing Lead Poisoning in Children, U.S. Department of Health and Human Services, Atlanta Georgia.
DOE (United States Department of Energy) 1975. Mound Laboratory Environmental Plutonium Study 1974 (MLM-02249), September 1975
DOE 1974. Mound Laboratory Environmental Plutonium Study. Samples from the park vicinity included in theRRE
DOE 1992. Special Canal Sampling, SAIC 1992
DOE 1993a. OU9 Quality Assurance Project Plan
DOE 1993b. OU5 Quality Assurance Project Plan
DOE 1994. "Health Consultation, DOE Mound Plant" (1994)
DOE 1995. OU-9 Regional Soils Investigation Report, August 1995, Final, Revision 2
DOE 1997a. Mound 2000 Residual Risk Evaluation Methodology, Mound Plant, Miamisburg, Ohio. Final, Revision 0. January 1997
DOE 1997b. Risk-Based Guideline Values, Mound Plant, Miamisburg, Ohio. Prepared by Hazardous Waste Remedial Actions Program managed by Lockheed Martin Energy Systems, Inc. March 1997.
DOE 1999. On-Scene Coordinators Report, OU-4 Miami-Erie Canal Removal Action, Mound Plant Miamisburg, Ohio. Final (Revision 0) June 1999.
EPA. 1998d. RCRA QAPP Instructions, USEPA Region 5, Chicago, IL, April1998 revision. http://www.epa.gov/reg5rcralwptdiv/cars/cars.htm
EPA 1990. "National Oil and Hazardous Substances Pollution Contingency Plan," Final Rule, FR Vol. 55, No. 46, March 8, 1990, available from U.S. Government Printing Office, Was~gton, D.C.
EPA 1989. "Risk Assessment Guidance for Superfund, Volume 1: Human Health Evaluation Manual, Part A, Interim Final," EPA, Office ofEmergency and Remedial Response, Washington, DC.
EPA 1991a. "Risk Assessment Guidance for Superfund, Volume 1: Human Health Evaluation Manual, Supplemental Guidance, Standard Default Exposure Factors, Interim Final," OSWER Directive 9285.6-03, EPA, Office of Emergency and Remedial Response, Washington, DC.
EPA 1991 b. "Risk Assessment Guidance for Superfund, Vol. 1: Human Health Evaluation Manual (Part B, Development of Risk-based Preliminary Remediation Goals," OSWER Directive 9285.7-01B, Office of Emergency and Remedial Response, Washington, D.C .
Residual Risk Evaluation OU-4 Miami-Erie Canal Area Public Review Draft Report
Page 67 of68

•
•
•
EPA 1992a. "Supplemental Guidance to RAGS: Calculating the Concentration Term," PB92-963373, May 1992. EPA, Office of Emergency and Remedial Response Toxics Integration Branch, Washington, DC.
EPA 1992b. "Dermal Exposure Assessment: Principles and Applications," EP A/600/8-91/0 11 b, Office of Health and Environmental Assessment, Washington, DC.
EPA 1992c. "Risk Assessment Guidance for Superfund Volume 1: Human Health Evaluation Manual Supplemental Guidance Dermal Risk Assessment Interim Guidance," EPA, Office of Emergency and Remedial Response Toxics Integration Branch, Washington, DC.
EPA 1994a. Interim Guidance on Establishing Soil Lead Cleanup Levels at RCRA Facilities. Office of Solid Waste and Emergency Response. OSWER Directive #93SS.4-12. Washington D.C.
EPA 1994b. Guidance Manual for the Integrated Exposure Uptake Biokinetic Model for Lead in Children. Office ofEmergency and Remedial Response. Washington, D.C. EPA/S40/R-93/081, PB93963610
EPA 1995. "Health Effects Assessment Summary Tables," OHEA ECAO-CIN-909, Office of Research and Development and Office of Emergency and Remedial Response, Washington, D.C.
EPA 1996a. Radiation Exposure and Risks Assessment Manual (RERAM), Risk Assessment Using Radionuclide Slope Factors, EPA 402-R-96-016, Air and Radiation, June.
EPA 1996f. Recommendations of the Technical Review Workgroup for Lead for an Interim Approach to Assessing Risks Associated with Adult Exposure to Lead in Soil. December .
EPA 1997. "Exposure Factors Handbook," Volumes I, II, and III, EPA/600/P-95/002Fa-c, EPA, Office of Research and Development, Washington, DC.
EPA 2000. Integrated Risk Information System (IRIS), National Center for Environmental Assessment, U.S. Environmental Protection Agency, 26 West Martin Luther King Drive, MS-190, Cincinnati, Ohio 45268. (513) 569-7254 ..
Gilbert, R.O. 1987. Statistical Methods for Environmental Pollution Monitoring. Van Nostrand Reinhold, New York.
PRS 416 Data Package, Unpublished
SAIC 1997. Memo to George Stephens from Genia McDuffee. July 10, 1997on the subject of Shielding of External Gamma Dose from a Soil Cover .
Residual Risk Evaluation OU-4 Miami-Erie Canal Area Public Review Draft Report
Page 68 of68

•
Appendix A
•
•