resource blessing, revenue curse? domestic … resource blessing, revenue curse? domestic revenue...
TRANSCRIPT

WP/14/5
Resource Blessing, Revenue Curse? Domestic Revenue Effort in Resource-Rich Countries
Ernesto Crivelli and Sanjeev Gupta
© 2014 International Monetary Fund WP/14/5
IMF Working Paper
Fiscal Affairs Department
Resource Blessing, Revenue Curse? Domestic Revenue Effort in Resource-Rich Countries
Prepared by Ernesto Crivelli and Sanjeev Gupta1
January 2014
Abstract
This paper uses a newly constructed revenue dataset of 35 resource-rich countries for the period 1992-2009 to analyze the impact of expanding resource revenues on different types of domestic (non resource) tax revenues. Overall, we find a statistically significant negative relationship between resource revenues and total domestic (non resource) revenues, including for the major tax components. For each additional percentage point of GDP in resource revenues, there is a reduction in domestic (non resource) revenues of about 0.3 percentage points of GDP. We find this primarily occurs through reduced effort on taxes on goods and services—in particular, the VAT— followed by a smaller negative impact on corporate income and trade taxes.
JEL Classification Numbers: H2, Q33, Q38
Keywords: Natural resources, resource revenue, tax revenue
Author’s E-Mail Address: [email protected]; [email protected]
1 We are grateful for comments received from Olivier Basdevant, Martin Cerisola, Benedict Clements, Svetlana Cerovic, Ruud De Mooij, Allan Dizioli, Julio Escolano, Alejandro Guerson, Amgad Hegazy, Eva Jenkner, Michael Keen, Oana Luca, Mario Mansour, Diego Mesa-Puyo, Gohar Minasyan, Luc Moers, Marco Pani, Patrick Petit, Edgardo Ruggiero, Yahia Said, Sergio Sola, Juan Toro, Susan Yang, SeokHyun Yoon, and participants at the FAD seminar. The usual caveats apply.
This Working Paper should not be reported as representing the views of the IMF. The views expressed in this Working Paper are those of the author(s) and do not necessarily represent those of the IMF or IMF policy. Working Papers describe research in progress by the author(s) and are published to elicit comments and to further debate.
3
Contents Page
Abstract ......................................................................................................................................2
I. Introduction ............................................................................................................................4
II. Methodology and Data ..........................................................................................................8 A. Empirical Specification .............................................................................................8 B. Data ...........................................................................................................................9
III. Main Results ......................................................................................................................12
IV. Further Analysis.................................................................................................................16
V. Concluding Remarks ...........................................................................................................20 Tables 1. Panel OLS Results with Fixed Country and Time Effects, Robust Errors ..........................13 2. System-GMM, Robust Errors ..............................................................................................15 3. Only Hydrocarbon Producers ..............................................................................................16 4. Excluding countries with very high resource revenue dependence .....................................17 5. By level of domestic (non resource) tax revenue effort .......................................................18 6. Revenue normalized with resource- and non resource GDP, respectively ..........................19 Figures 1. World Bank’s Efficiency of Revenue Mobilization Index, 2011 ..........................................5 2. Resource and non Resource Revenue, 1992-2009 .................................................................6 3. Pairwise Correlations between Resource and non Resource Revenue ..................................6 4. Total Revenue and Resource Revenue (in percent of GDP) ................................................10 5. Non Resource Tax Revenues (in percent of GDP) ..............................................................10 6. VAT Design, 2012 ...............................................................................................................11 7. Corporate Income Tax Rates, 2012 .....................................................................................11 Appendix Appendix I. Data ......................................................................................................................22 Appendix Tables A1.1. Descriptive Statistics ......................................................................................................23 A2.1. Including Squared Resource Revenue Variable .............................................................24 A2.2. Alternative Proxy for Resource Revenues .....................................................................25 References ................................................................................................................................26
4
I. INTRODUCTION
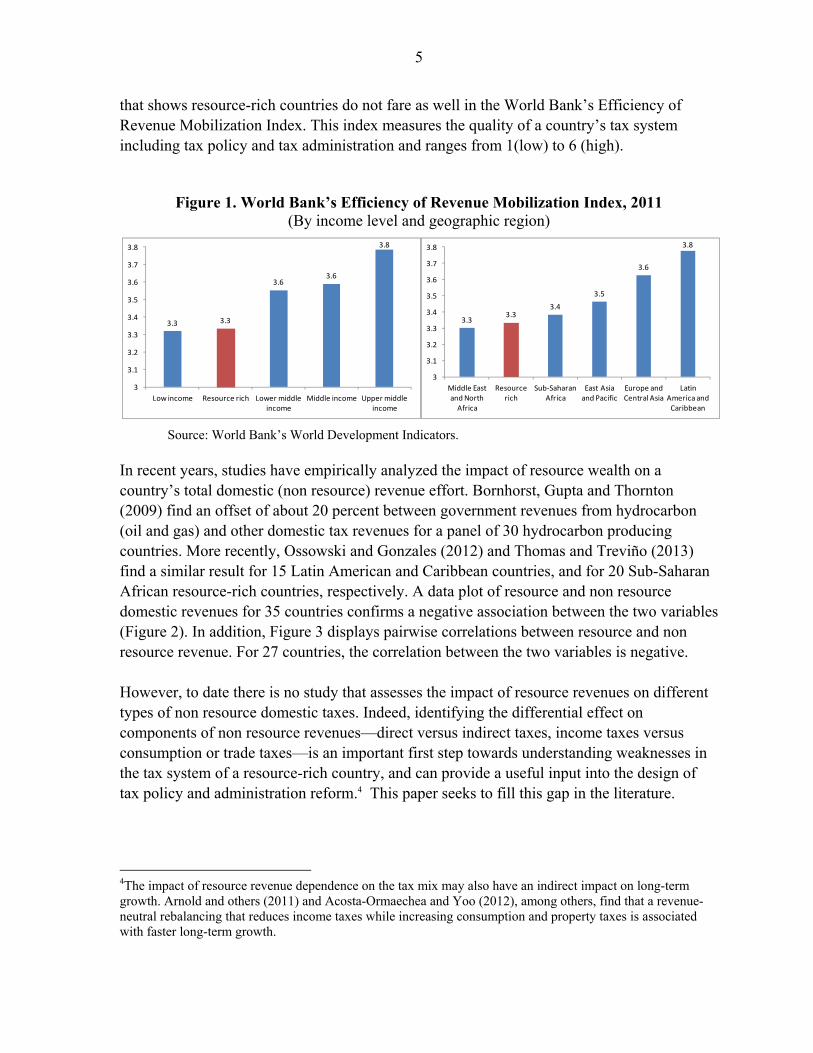
Because of substantial resource revenues, some have argued that resource-rich countries should have a relatively low domestic (non resource) tax burden to help promote private sector activity and thereby, economic growth.2 However, there is a growing literature3 that contends the opposite. It argues that, in a society with a broad-based tax system, paying taxes is part of an implicit contract in which taxpayers gain political representation or other forms of voice over public policies and provision of public services (Levi, 1988; Moore, 1998, 2007). As such, the quality of public services and trust in government tends to improve with rising tax effort (Bergman, 2002; Leite and Weidmann, 1999). With low or no domestic taxation and a heavy dependence on resource taxation, this link is ruptured (Knack, 2009). In addition, in some countries natural resources are expected to be exhausted in the foreseeable future. A well-diversified tax base would provide a revenue stream to support critical public programs when natural resources are depleted. This is particularly relevant for resource-rich countries that are scaling up spending on infrastructure and social sectors to a level that may not be consistent with inter-temporal fiscal sustainability. This can change if the non resource sector generates fiscal dividends in the form of higher taxes, which compensates for income loss arising from consumption of natural resource wealth. Another important consideration is that resource revenues tend to be volatile and in the absence of an appropriate fiscal framework, this volatility is transmitted to the budget (IMF, 2011). Adoption of well-designed revenue stabilizing rules can mitigate volatility, but most resource-rich countries have not succeeded in implementing such rules. Thus, the advantages of having low taxation can be potentially offset in the absence of a sustainable fiscal framework, insufficient diversification of the tax base, fiscal volatility and most importantly, underdeveloped institutions that are associated with limited democratic accountability and widespread rent seeking (Ross, 2001, Treisman, 2007). Further, countries that rely heavily on revenues from natural resources exhibit a sharp deterioration in their tax administration capacity, adopt extensive, ad hoc tax exemptions, and apply their tax laws in a discretionary manner (Knack, 2009). This is illustrated in Figure 1
2 One could argue that policymakers typically have a “target” tax burden for the country. If resource revenues rise, it would be natural to expect a decline in non resource domestic revenues, as the former is often considered a relatively efficient source of revenue (IMF, 2012).
3 Originally conceived in the spirit of the ‘resource curse’ argument, this literature has dealt with other equally important issues, such as the sharp real exchange rate appreciation experienced by natural resources-rich countries, impeding economic diversification (Dutch disease), or the more recent focus on the negative development effects of the rent-seeking behavior associated with the exploitation of natural resource endowments. See, for example, Ross (1999), Davis and Tilton (2005), and Bornhorst, Gupta and Thornton (2009) for a review of the resource curse literature.
5
that shows resource-rich countries do not fare as well in the World Bank’s Efficiency of Revenue Mobilization Index. This index measures the quality of a country’s tax system including tax policy and tax administration and ranges from 1(low) to 6 (high).
Figure 1. World Bank’s Efficiency of Revenue Mobilization Index, 2011 (By income level and geographic region)
Source: World Bank’s World Development Indicators.
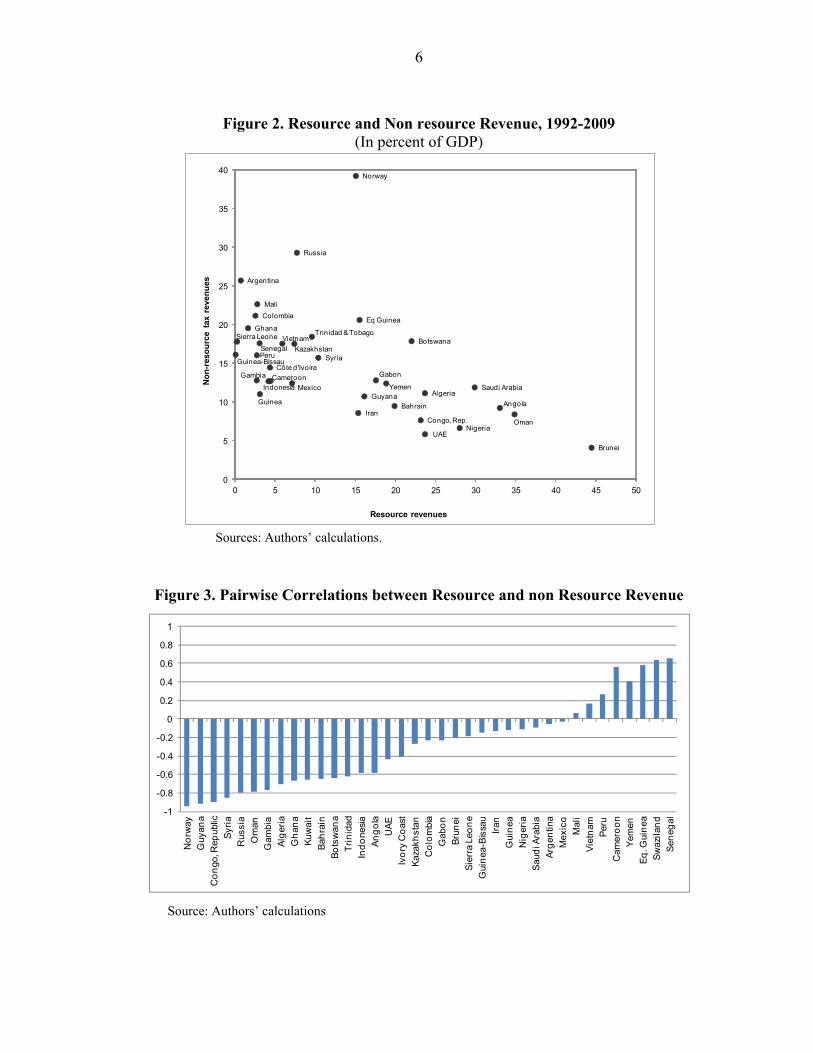
In recent years, studies have empirically analyzed the impact of resource wealth on a country’s total domestic (non resource) revenue effort. Bornhorst, Gupta and Thornton (2009) find an offset of about 20 percent between government revenues from hydrocarbon (oil and gas) and other domestic tax revenues for a panel of 30 hydrocarbon producing countries. More recently, Ossowski and Gonzales (2012) and Thomas and Treviño (2013) find a similar result for 15 Latin American and Caribbean countries, and for 20 Sub-Saharan African resource-rich countries, respectively. A data plot of resource and non resource domestic revenues for 35 countries confirms a negative association between the two variables (Figure 2). In addition, Figure 3 displays pairwise correlations between resource and non resource revenue. For 27 countries, the correlation between the two variables is negative. However, to date there is no study that assesses the impact of resource revenues on different types of non resource domestic taxes. Indeed, identifying the differential effect on components of non resource revenues—direct versus indirect taxes, income taxes versus consumption or trade taxes—is an important first step towards understanding weaknesses in the tax system of a resource-rich country, and can provide a useful input into the design of tax policy and administration reform.4 This paper seeks to fill this gap in the literature.
4The impact of resource revenue dependence on the tax mix may also have an indirect impact on long-term growth. Arnold and others (2011) and Acosta-Ormaechea and Yoo (2012), among others, find that a revenue-neutral rebalancing that reduces income taxes while increasing consumption and property taxes is associated with faster long-term growth.
3.3 3.3
3.63.6
3.8
3
3.1
3.2
3.3
3.4
3.5
3.6
3.7
3.8
Low income Resource rich Lower middle income
Middle income Upper middle income
3.33.3
3.4
3.5
3.6
3.8
3
3.1
3.2
3.3
3.4
3.5
3.6
3.7
3.8
Middle East and North
Africa
Resource rich
Sub-Saharan Africa
East Asia and Pacific
Europe and Central Asia
Latin America and
Caribbean
6
Figure 2. Resource and Non resource Revenue, 1992-2009
(In percent of GDP)
Sources: Authors’ calculations.
Figure 3. Pairwise Correlations between Resource and non Resource Revenue
Source: Authors’ calculations
Algeria
Angola
Argentina
Bahrain
Botswana
Cameroon
Colombia
Congo, Rep.
Côte d'IvoireGabonGambia
Ghana
Guinea
Guinea-Bissau
GuyanaIndonesia
Iran
Kazakhstan
Mali
NigeriaOman
Peru
Russia
Senegal
Sierra Leone Vietnam
YemenMexico
Norway
Brunei
Eq Guinea
Saudi Arabia
Syria
Trinidad & Tobago
UAE
0
5
10
15
20
25
30
35
40
0 5 10 15 20 25 30 35 40 45 50
No
n-r
eso
urc
e ta
xre
ven
ues
Resource revenues
-1
-0.8
-0.6
-0.4
-0.2
0
0.2
0.4
0.6
0.8
1
No
rway
Guy
ana
Co
ngo
, Rep
ublic
Syr
ia
Rus
sia
Om
an
Gam
bia
Alg
eria
Gh
ana
Kuw
ait
Bah
rain
Bo
tsw
ana
Tri
nid
ad
Ind
one
sia
An
go
la
UA
E
Ivo
ry C
oas
t
Kaz
akh
stan
Co
lom
bia
Gab
on
Bru
nei
Sie
rra
Leo
ne
Gui
nea
-Bis
sau
Iran
Gui
nea
Nig
eria
Sau
di A
rabi
a
Arg
entin
a
Mex
ico
Mal
i
Vie
tnam
Per
u
Cam
ero
on
Yem
en
Eq
. Gui
nea
Sw
azila
nd
Sen
egal
7
One reason why empirical work in this area has remained limited is due to the relative scarcity of reliable data on non resource tax revenues and its components. While disaggregating resource revenues from non resource revenue is challenging in itself, the task is even more difficult when non resource taxes have to be disaggregated into different components. The problem arises from the way taxes are compiled and reported, making it difficult to extract the share of tax revenue that comes from resource activities. Resource companies are a major contributor to the corporate income tax, but to derive the non resource share of the corporate tax revenue, an adjustment of these revenues is required. Similar difficulties arise when trade taxes include revenues from commodity exports. In this paper, we construct a database for 35 resource-rich countries during 1992-2009 that not only disaggregates data between resource and non resource revenues but also disaggregates non resource revenues into its different components.
Overall, our results corroborate earlier findings with respect to the impact of natural resource revenues on total domestic (non resource) revenue, with an estimated offset of about 30 percent. Results by type of taxes confirm the differential effect of resource taxation on different components of non resource taxation. We find a large and robust negative impact of natural resource revenues on taxes on goods and services—in particular on the VAT—while a more modest impact, though still negative and significant, is found on corporate income tax and trade taxes. Our results are robust to the inclusion of control variables, the exclusion of outliers, and alternative estimation methodologies, addressing in particular concerns related to the endogeneity of resource revenue in our estimations.
The rest of the paper is organized as follows. Section II sets out the empirical approach, and describes the dataset in more detail. The main empirical results are presented in Section III, with further analysis for the purpose of additional robustness performed in Section IV. Section V summarizes the results and evaluates their policy relevance.
8
II. METHODOLOGY AND DATA
A. Empirical Specification
To empirically test how resource revenues may affect non resource domestic tax revenue (and its main components), we model domestic non resource tax revenues as a function of resource revenues, both in relation to GDP, and a set of control variables in X. This leads to an estimating equation of the following form:
Tit = αi + β1 Rit + β2 Xit + μt + εit (1) where the dependent variable T in Eq.(1) is domestic non resource tax revenues, expressed relative to GDP; and R is government revenues from natural resources, also expressed relative to GDP, while i=1,…,N and t=1,…,L are respectively country- and time-indicators (so that and are country- and time-specific effects). Equation (1) is regressed separately for total tax revenues (TAX) as well as revenues from taxes on goods and services (G&S), the value-added tax (VAT), tax on corporate profits (CIT), the personal income tax (PIT), and tax on international transactions (TRADE). The coefficient β1 indicates the marginal effect of an additional percentage point of government revenues from natural resources on the non resource revenue effort. The control variables are drawn from previous studies that analyzed the determinants of the tax ratio (Ghura, 1998) and tax effort (see, for example, Sen Gupta, 2007; Baunsgaard and Keen, 2010; Pessino and Fenochietto, 2010). In particular, a proxy for the development of the economy, measured as the log of GDP per capita, is expected to be positively associated with non resource tax revenues, in reflection of growing demand for public services with rising income per capita, and because of a higher degree of economic and institutional sophistication. A higher share of agriculture in value-added is expected to be negatively associated with non resource revenues because agriculture is harder to tax. Non resource trade openness, measured as the sum of non resource exports plus imports, expressed relative to GDP, can present either sign. Rodrik (1998) argues that more open countries are vulnerable to risks and, given the need for social insurance, tend to have bigger governments. Moreover, since trade taxes are easier to collect, especially in developing countries, a positive relationship between trade openness and revenues can be expected. However, higher trade openness could be the result of trade liberalization through tariff reductions. This would be consistent with a negative relationship between trade openness and revenue. Other control variables include inflation, which may have revenue effects through both unindexed tax systems and the generation of seigniorage; the level of external indebtedness, which reflects the need to generate revenues to service debt; and the quality of institutions as proxied by the ICRG corruption index, which takes values from 0 (high corruption) to 6 (low corruption). Finally, we include foreign aid (ODA) in relation to GDP, which has been found both positively and negatively associated with revenues (Benedek et al., 2013).

9
B. Data
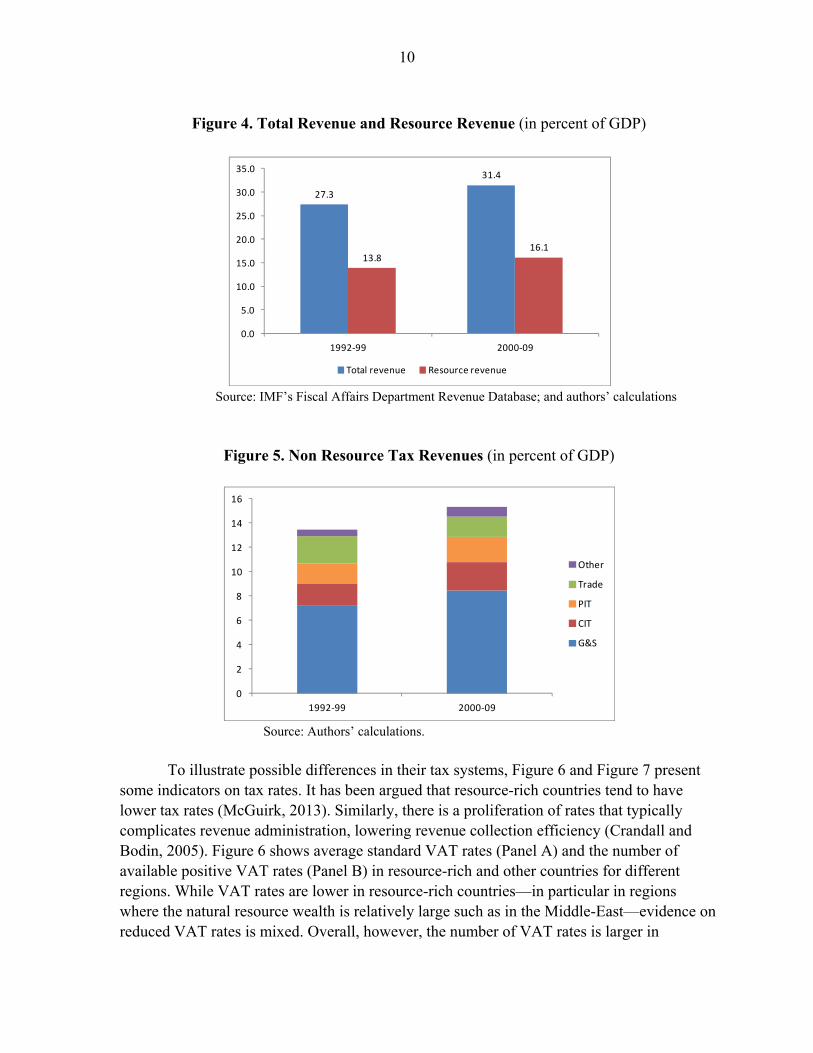
The dataset comprises an unbalanced panel of 35 natural resource rich countries for the period covering 1992–2009. Data on tax revenues are drawn from the Government Financial Statistics (GFS) as well as from the annual consultation reports of the IMF with its member countries .We took the GFS data as the starting point, and supplemented it with detailed revenue information provided by country desk economists at the IMF. This allowed us to identify the share of tax revenues that is related to resource endowments and disaggregate non resource tax revenues. The latter comprises taxes on goods and services, VAT, taxes on profits (CIT), the personal income tax (PIT), and taxes on international transactions (Trade), adjusted to exclude resource revenues. For example, our CIT series does not include the tax on profits paid by resource companies, which is included in resource revenues. Government revenues from natural resources comprise revenues from taxing the extraction companies, from taxing exports of those natural resources, from the royalties these companies pay, and from production sharing agreements. Full details of the dataset and summary statistics are provided in Appendix I. Figure 4 shows averages of total and resource revenues (relative to GDP) in the 1990s and 2000s. Resource revenues have increased from 13.8 percent of GDP, on average, during the 1990s to 16.1 percent of GDP, on average, during the 2000s, reflecting increases in both the production of hydrocarbon and other commodities and world prices, and in the tax and royalty rates applied to resource endowments. Also, the share of resource revenues in total revenues has increased. Figure 5 shows averages of non resource tax revenues (relative to GDP) from the major taxes. All in all, total non resource tax revenues have increased from 13.6 percent of GDP, on average, during the 1990s to 15.3 percent of GDP, on average, during the 2000s. The largest contributors to this increase have been taxes on goods and services and income taxes. As a result of trade liberalization and a reduction in trade tariffs, tax revenue from taxes on international trade declined.
10
Figure 4. Total Revenue and Resource Revenue (in percent of GDP)
Source: IMF’s Fiscal Affairs Department Revenue Database; and authors’ calculations
Figure 5. Non Resource Tax Revenues (in percent of GDP)
Source: Authors’ calculations.
To illustrate possible differences in their tax systems, Figure 6 and Figure 7 present some indicators on tax rates. It has been argued that resource-rich countries tend to have lower tax rates (McGuirk, 2013). Similarly, there is a proliferation of rates that typically complicates revenue administration, lowering revenue collection efficiency (Crandall and Bodin, 2005). Figure 6 shows average standard VAT rates (Panel A) and the number of available positive VAT rates (Panel B) in resource-rich and other countries for different regions. While VAT rates are lower in resource-rich countries—in particular in regions where the natural resource wealth is relatively large such as in the Middle-East—evidence on reduced VAT rates is mixed. Overall, however, the number of VAT rates is larger in
27.3
31.4
13.816.1
0.0
5.0
10.0
15.0
20.0
25.0
30.0
35.0
1992-99 2000-09
Total revenue Resource revenue
0
2
4
6
8
10
12
14
16
1992-99 2000-09
Other
Trade
PIT
CIT
G&S

11
resource-rich countries. Similarly Figure 7 shows that average corporate income tax rates on non resource activities5 tend to be lower in resource-rich countries.
Figure 6. VAT Design, 2012
(By geographic region)
Panel A. Average Standard VAT Rate Panel B. Average Number of Reduced (In percent) VAT Rates
Source: IMF’s Fiscal Affairs Department Revenue Database.
Figure 7. Corporate Income Tax Rates, 2012
(In percent, by geographic region)
Source: IMF’s Fiscal Affairs Department Revenue Database.
5 Many resource-rich countries have adopted a CIT surcharge only on profits from resource activities, in particular hydrocarbons (Keen and Mansour, 2010).
0.0
2.0
4.0
6.0
8.0
10.0
12.0
14.0
16.0
18.0
Middle East and North
Africa
East Asia and Pacific
Europe and Central Asia
Sub-Saharan Africa
Latin America and Caribbean
Non-resource Resource rich
0.0
0.5
1.0
1.5
2.0
2.5
3.0
3.5
4.0
Middle East and North
Africa
East Asia and Pacific
Europe and Central Asia
Sub-Saharan Africa
Latin America and Caribbean
Non-resource Resource rich
0
5
10
15
20
25
30
35
Middle East and North
Africa
East Asia and Pacific
Europe and Central Asia
Sub-Saharan Africa
Latin America and Caribbean
Non-resource Resource rich
12
III. MAIN RESULTS
Eq. (1) is first estimated by ordinary least squares with country6 and time fixed-effects, for total tax revenue (Tax) as well as five of its components: taxes on goods and services (G&S), value-added tax (VAT), tax on corporate profits (CIT), personal income tax (PIT), and tax on international trade (Trade). Table 1 presents the results of our baseline model, including all control variables described in Section II, and a constant. In general, we do find support for the underlying hypothesis of a large offset in domestic tax (non resource) revenues associated with an increased share of resource revenues. The effect of resource revenues on the domestic non resource tax revenue effort is found to be negative and highly significant for the total as well as for different tax sources. For each additional percentage point of revenue from natural resources, there is a decline in total non resource tax revenues by 0.43 percentage points of GDP (Column 1). This is a sizeable impact considering the high volatility of resource revenues. To illustrate this, consider the impact of an increase in resource revenues by one standard deviation. This would imply a non resource revenue loss of 1.6 percentage points of GDP,7 which is substantial given that one standard deviation of resource revenues is about its average change over a two-year period. That is, the average annual fluctuation in resource revenues is associated with an estimated annual fluctuation in non resource revenue of about 0.8 percentage point of GDP. The largest negative impact is found on taxes on goods and services, for which there is an offset of 0.12 percentage points of GDP for each additional percentage point of resource revenues (Column 2), followed by the CIT with an offset of about 0.04 percentage points of GDP (Column 4) and the PIT with an offset of about 0.06 percentage points of GDP (Column 5). The large impact on taxes on goods and services is further confirmed by the offset of 0.11 percentage points of GDP found on the VAT (Column 2), which is a component of this category of taxes. Finally, the lowest negative impact is found on trade taxes (Column 6), with an offset of about 0.03 percentage points of GDP, which may be related to natural resource industries relying heavily on imported machineries and technologies to support production.
6 Hausman tests favor the fixed effects over the random effects estimator, so the latter are not reported. Both Chow (1960), Roy (1957), Zellner (1962), and Baltagi (2008) tests for poolability support the panel specification with homogeneous (not country-specific) slope coefficients, since the joint significance of the interactions between regressors and country dummies is rejected.
7 The average standard deviation is 3.93, where standard deviations are calculated for each country separately.

13
Table 1. Panel OLS Results with Fixed Country and Time Effects, Robust Errors
Dependent variables: Tax G&S VAT CIT PIT Trade
(1) (2) (3) (4) (5) (6)
Resource Revenue -0.4286*** -0.1238*** -0.1154*** -0.0392*** -0.0604*** -0.0284***
(0.0799) (0.0359) (0.0379) (0.0075) (0.0225) (0.0108)
Non-resource Openness -0.0035 0.0022 -0.0020* 0.0028*** 0.0020*** 0.0018
(0.0051) (0.0018) (0.0011) (0.0008) (0.0007) (0.0011)
Foreign Debt to GDP -0.0243 0.0075 0.0116* 0.0055* 0.0042 0.0054**
(0.0172) (0.0066) (0.0064) (0.0028) (0.0038) (0.0025)
Corruption 0.2188 -0.0809 0.0368 0.0880 0.2553** -0.1179
(0.4553) (0.1804) (0.1078) (0.0888) (0.1078) (0.0775)
Agriculture (share of GDP) -0.2240** 0.01089 0.0497 -0.0310* -0.0587* -0.1216***
(0.1131) (0.0505) (0.0430) (0.0181) (0.0409) (0.0409)
Log (GDP per capita) 2.8086 0.1164 2.9318*** 0.5119*** 0.5818 0.1799
(2.4825) (0.9925) (0.9944) (0.1707) (0.9433) (0.5081)
Log(Inflation) 1.8038* -0.3185 2.2824* 1.7699** -0.2805 0.3109
(0.9431) (1.2006) (1.2911) (0.8678) (0.6498) (0.3437)
ODA (share of GDP) -0.2326 0.0232 -0.0255 -0.1192*** -0.0001 0.0067
(0.9431) (0.0289) (0.0264) (0.0326) (0.0163) (0.0173)
Constant 0.3681 4.8479 -20.5064** -0.7674 -7.3513 -1.4035
(22.97) (9.1724) (8.8397) (1.8177) (8.4505) (4.3347)
R2 0.25 0.24 0.29 0.33 0.17 0.42
Observations 429 401 215 241 332 321
No. of countries 35 32 22 24 28 28
Note: Dependent variable is total tax revenue, tax on goods and services, vat, corporate income tax, and trade, excluding resource revenues to GDP, respectively. Full set of year dummies in all regressions. Robust standard errors, in parenthesis; ***(**,*) indicate significance at 1(5, 10) percent.
Turning to the control variables, we confirm that the structure of the economy matters for tax revenues. The share of agriculture in GDP, when significant, is negatively related to tax revenues, whereas the overall level of development, proxied by GDP per capita is positively related. Trade openness presents, as expected, both signs; inflation is positively related, and foreign indebtedness is also, as expected, positively associated with tax to GDP ratios. As in the literature (Gupta et al., 2004; Benedek et al., 2013) we find a negative association between foreign aid (ODA) and tax revenue effort. Finally, we do not find evidence of an association between the level of corruption and tax revenue effort.
14
Some concerns arise with the use of the fixed-effects estimator, in particular the potential endogeneity of natural resource revenues. Larger fiscal deficits in the presence of a negative shock to non resource revenue can increase the reliance on resource revenues, for example, through the imposition of higher corporate tax rates and royalties on extractive industries. Second, the characteristics of the tax revenue data, which show persistence over time, raise the possibility of serial correlation.8 To address these issues, Table 2 reports results of estimating Eq.(1) using the system generalized method of moments (GMM), which in contrast to the fixed-effects estimates in Table 1 should be fully consistent.9 The system-GMM takes Eq.(1) in differences and levels as a system, using lagged changes as instruments in the latter, and lagged levels as instrument for changes in the former. We have also allowed for possible dynamic effects by including a lagged dependent variable (the empirics showing significant serial correlation in its absence). To test the validity of the instruments we present not only the Hansen statistic, but also the Sargan statistic, which is less vulnerable to instrument proliferation (Roodman, 2009).10 The diagnostics are satisfactory, with a tolerable value for the Sargan test, and with the Arellano-Bond (1991) test for first and second order serial correlation (M1 and M2) suggesting that the former is present but the later is not, which is consistent with the underlying assumptions. The results with the GMM estimator are qualitatively identical to those with the fixed-effects estimator, with a significant negative effect of natural resource revenues on total domestic tax revenue effort and on the main tax sources (except for the PIT that is found statistically insignificant). The order of magnitude is also preserved, with the largest offset found on taxes on goods and services, in particular explained by a large negative impact on the VAT, followed by smaller offset effects on the CIT and trade taxes.11 Although the magnitude of
8 This is confirmed by the Wooldrige test for serial correlation.
9 Endogeneity could also be dealt with by using an instrumental variable estimation, but finding suitable instruments for natural resource revenues is difficult. Therefore, using a GMM methodology is a better option, in particular as it becomes clear that the characteristics of our dataset, with small T=17 years and large N=35 countries fits the use of GMM models. We use the Blundell and Bond (1998) system-GMM estimator instead of Arellano and Bond (1991) difference-GMM estimator since the first one has much better finite sample properties in terms of bias and root mean squared error than the later, and results are not qualitatively different.
10 We present both statistics only in cases where there appears to be a potential issue with instrument proliferation. The Hansen statistic’s p-value should be high enough to reject correlation between the instruments and the errors but not too high because it weakens confidence in the test. The Sargan test, in contrast, is less vulnerable to instrument proliferation, but not robust to heteroskedasticity.
11 As in Bornhorst, Gupta and Thornton (2009) we also test for possible endogeneity of corruption by instrumenting this variable. While the results are not qualitatively different from the previous ones on the significant negative effect of resource revenues on domestic tax effort and the different taxes, we do find a negative association between higher perceived corruption and tax revenue effort for the VAT only.

15
the contemporaneous offset appears somehow lower to that obtained with fixed-effects, the inclusion of the lagged domestic non resource revenue variable in the GMM model allows us to compute the ultimate or long-run offset effect. Table 2 reports θ for the ultimate offset effect for each tax.12 Consider again the impact of an increase in resource revenues by one standard deviation. This would imply an ultimate non resource revenue loss of 1.8 percentage points of GDP.
Table 2. System-GMM, Robust Errors Dependent variables: Tax G&S VAT CIT PIT Trade (1) (2) (3) (4) (5) (6) Resource Revenue -0.2917*** -0.0497** -0.0620*** -0.0172* -0.0007 -0.0091* (0.1215) (0.0227) (0.0202) (0.0098) (0.0099) (0.0059) Dependent variable (lagged) 0.2721** 0.8797*** 0.7047*** 0.6869*** 0.9319*** 0.8857*** (0.1227) (0.0407) (0.1033) (0.0723) (0.0385) (0.0702) Non-resource Openness 0.0242 -0.0032 -0.0003 0.0013 0.0006 0.0007 (0.0178) (0.0028) (0.0014) (0.0021) (0.0007) (0.0009) Foreign Debt to GDP 0.0627* 0.0110*** 0.0060 0.0013 -0.0021 0.0012 (0.0389) (0.0043) (0.0041) (0.0039) (0.0028) (0.0014) Corruption 1.4256 -0.0418 0.0335 -0.0920 0.1154 0.0180 (1.3831) (0.1109) (0.1208) (0.1524) (0.0933) (0.0625) Agriculture (share of GDP) 0.0631 -0.0258 0.0241 0.0207 0.0125 -0.0036 (0.1574) (0.0214) (0.0215) (0.0210) (0.0111) (0.0178) Log (GDP per capita) 3.4968 0.2039 0.7068** 0.3228 0.1885 -0.0632 (2.9614) (0.3543) (0.3100) (0.2906) (0.1661) (0.1590) Log(Inflation) 2.5051 0.9980 -4.9447*** 0.3187 0.0134 1.0051 (4.4915) (1.5450) (0.7207) (1.3577) (0.5206) (0.7573) ODA (share of GDP) 0.1429 0.0223 0.0391 0.0003 -0.0249 -0.0284 (0.2222) (0.0698) (0.0629) (0.0415) (0.0257) (0.0381) θ -0.4008*** -0.4131*** -0.2102*** -0.0550* -0.0102 -0.0801
(0.1437) (0.1658) (0.0572) (0.0335) (0.1457) (0.0761) M1 (p value) 0.022 0.001 0.002 0.066 0.091 0.005 M2 (p value) 0.091 0.087 0.668 0.353 0.085 0.383 Over-identification Hansen: Hansen: 1.0 Hansen: Hansen: Hansen: Hansen: 1.0 (p value) 0.886 Sargan: 0.22 0.581 0.860 0.38 Sargan: 0.09 Observations 401 391 200 230 318 315 Instruments 64 64 64 63 64 65 No. of countries 35 32 21 24 28 28 Notes:
a/ Dependent variable is total tax revenue, tax on goods and services, vat, corporate income tax, and trade, excluding resource revenues to GDP, respectively. Full set of year dummies in all regressions. Robust standard errors, in parenthesis; ***(**,*) indicate significance at 1(5, 10) percent.
b/ One step, instruments based on first lag of differences in the dependent variable and resource revenue, and second lags of their levels in the differenced equation.
12 With Eq.(1) including the lagged domestic tax variable, Tit = αi + β0 Tit-1 + β1 Rit + β2 Xit + μt + εit, the
cotemporaneous effect is captured by β1, whereas the ultimate or long-run effect is captured by ≡

16
IV. FURTHER ANALYSIS
A number of robustness checks are presented in this section and some additional checks are presented in Appendix II. For this purpose, only results based on our preferred method, the system-GMM estimator are presented. A first robustness check consists of estimating Eq. (1) for a subset of only hydrocarbon (oil and gas) producer countries.13 14 The results in Table 3 point to qualitatively similar results to those presented in Section III. We find a significant negative effect of resource revenues on total domestic tax revenue effort and on the main tax sources. The main difference is on the magnitude of the offset effect of resource revenues on total non resource revenues that appears to be smaller. However, the offset effect of 0.15 percentage points for each additional percentage point in resource revenues is in line with previous literature that considers only hydrocarbon producer countries (Bornhorst, Gupta and Thornton, 2009). Otherwise the size of the offset and the order of magnitude for the different taxes is similar to that found for the total sample.
Table 3. Only Hydrocarbon Producers
Dependent variables: Tax G&S VAT CIT PIT Trade (1) (2) (3) (4) (5) (6) Resource Revenue -0.1509*** -0.0312* -0.0526*** -0.0209* -0.0009 -0.0091** (0.0582) (0.0182) (0.0186) (0.0112) (0.0076) (0.0045) Dependent variable (lagged) 0.6537*** 0.9206*** 0.7108*** 0.6994*** 0.9543*** 0.8944*** (0.1939) (0.0325) (0.1081) (0.0799) (0.0379) (0.1003) θ -0.4359** -0.3929* -0.1818*** -0.0695** -0.0198 -0.0861
(0.1976) (0.2141) (0.0536) (0.0311) (0.1638) (0.5412) M1 (p value) 0.014 0.003 0.006 0.070 0.094 0.014 M2 (p value) 0.601 0.068 0.554 0.339 0.117 0.611 Over-identification Hansen: Hansen: 1.0 Hansen: Hansen: Hansen: Hansen: (p value) 0.23 Sargan: 0.06 0.35 0.21 0.24 0.27 Observations 320 297 156 185 241 243 Instruments 65 64 64 63 64 65 No. of countries 26 23 16 19 20 21
Notes: a/ Dependent variable is total tax revenue, tax on goods and services, vat, corporate income tax, and trade, excluding resource revenues
to GDP, respectively. Full set of control variables and year dummies in all regressions. Robust standard errors, in parenthesis; ***(**,*) indicate significance at 1(5, 10) percent.
b/ One step, instruments based on first lag of differences in the dependent variable and resource revenue, and second lags of their levels in the differenced equation.
13 Appendix I describes the countries included in the sample.
14 An additional robustness test consisted of excluding outliers. Russia and Norway were identified as outliers using the Hadi (1994) procedure; Sierra Leone and Senegal were also considered outliers, as resources contributed only marginally to GDP during the sample period under consideration, due to civil war and thus lack of investment in the resource sectors. The estimates without outliers are not significantly different from the full sample estimates.

17
In addition, the impact of resource revenues on domestic (non resource) tax revenues is analyzed by taking out of the sample those countries with the highest resource revenue dependence—which effectively are the largest hydrocarbon producers. Table 4 presents the results for countries with a share of resource revenues to GDP below 20 percent. While not significantly different in magnitude than the coefficients obtained for the full sample, the estimated contemporaneous offset for this group of countries is larger than that obtained for hydrocarbon producer countries. Not surprisingly, however, the estimated ultimate (long run) effect is smaller—for total tax and tax on goods and services—suggesting that those countries with a lower dependence on resource revenues would have a greater incentive to preserve their non resource revenue base.
Table 4. Excluding countries with very high resource revenue dependence
Dependent variables: Tax G&S VAT CIT PIT Trade (1) (2) (3) (4) (5) (6) Low Resource Dependence Resource Revenue -0.2690** -0.0535* -0.0731* -0.0360* -0.0297* -0.0259*** (0.1355) (0.0306) (0.0464) (0.0217) (0.0174) (0.0097) Dependent variable (lagged) 0.3082** 0.8477*** 0.8115*** 0.6738*** 0.9159*** 0.9242*** (0.1581) (0.0591) (0.1156) (0.0778) (0.0502) (0.0836) θ -0.3888** -0.3512** -0.3879** -0.1103* -0.3541*** -0.3424**
(0.1574) (0.1820) (0.2056) (0.0785) (0.1109) (0.2213) M1 (p value) 0.012 0.001 0.023 0.102 0.135 0.015 M2 (p value) 0.201 0.081 0.118 0.323 0.095 0.290 Over-identification Hansen: Hansen: Hansen: Hansen: 0.93 Hansen: 1.0 Hansen: 1.0 (p value) 0.56 0.27 0.41 Sargan: 0.08 Sargan: 0.21 Sargan: 0.11 Observations 307 318 75 176 269 251 Instruments 93 64 64 63 64 65 No. of countries 25 25 12 17 23 20
Notes: a/ Dependent variable is total tax revenue, tax on goods and services, vat, corporate income tax, and trade, excluding resource revenues to
non-resource GDP, respectively. Full set of control variables and year dummies in all regressions. Robust standard errors, in parenthesis; ***(**,*) indicate significance at 1(5, 10) percent.
b/ One step, instruments based on first lag of differences in the dependent variable and resource revenue, and second lags of their levels in the differenced equation.
Similarly, Table 5 presents the results of estimating Eq. (1) dividing the sample among those countries with domestic (non resource) tax revenue effort below and above the average—about 15 percent of GDP. The expectation here is that countries with a relatively high non resource domestic tax revenue effort will have a greater incentive to reduce their reliance on them, as their distortion at the margin is higher and thus will present a larger offset for a given increase in resource revenue. This is reflected in the estimated coefficients showing a lower contemporaneous offset for those countries with a relatively low tax revenue effort. Also as expected the computed ultimate effects are lower for this group of countries.

18
Table 5. By level of domestic (non resource) tax revenue effort Dependent variables: Tax G&S VAT CIT PIT Trade (1) (2) (3) (4) (5) (6) Low Tax Effort Resource Revenue -0.1734*** -0.0551*** -0.0267** -0.0093* 0.0176 -0.0081 (0.0654) (0.0211) (0.0119) (0.0056) (0.0172) (0.0066) Dependent variable (lagged) 0.2269*** 0.7391*** 0.6650*** 0.8850*** 0.6603*** 0.9390*** (0.0940) (0.0708) (0.0898) (0.0857) (0.1535) (0.0894) θ -0.2242*** -0.2112*** -0.0797*** -0.0814 0.0518 -0.1330
(0.0675) (0.0662) (0.0285) (0.0704) (0.0447) (0.2326) M1 (p value) 0.129 0.008 0.046 0.009 0.097 0.047 M2 (p value) 0.679 0.426 0.504 0.631 0.570 0.896 Over-identification Hansen: Hansen: Hansen: Hansen: Hansen: Hansen: 1.0 (p value) 0.84 0.12 0.62 0.88 0.74 Sargan: 0.05 Observations 228 211 88 131 149 181 Instruments 65 64 57 61 60 65 No. of countries 20 17 10 14 13 16
High Tax Effort Resource Revenue -0.3581*** -0.0708*** -0.0410*** -0.0314 -0.0177** -0.0068 (0.1373) (0.0239) (0.0134) (0.0213) (0.0088) (0.0189) Dependent variable (lagged) 0.2508* 0.8976*** 0.9047*** 0.7469*** 0.9146*** 0.8385*** (0.1618) (0.0242) (0.0873) (0.0415) (0.0507) (0.0974) θ -0.4781*** -0.6923*** -0.4312** -0.1240 -0.2073** -0.0421
(0.1203) (0.2202) (0.2342) (0.0937) (0.0995) (0.1321) M1 (p value) 0.045 0.018 0.026 0.120 0.082 0.030 M2 (p value) 0.158 0.166 0.237 0.326 0.054 0.131 Over-identification Hansen: Hansen: 1.0 Hansen: 1.0 Hansen: Hansen:1.0 Hansen: 1.0 (p value) 0.39 Sargan: 0.94 Sargan: 0.06 0.45 Sargan:0.84 Sargan: 0.15 Observations 174 180 112 99 169 134 Instruments 65 65 64 63 64 65 No. of countries 15 15 11 10 15 12
Notes: a/ Dependent variable is total tax revenue, tax on goods and services, vat, corporate income tax, and trade, excluding resource revenues
to non-resource GDP, respectively. Full set of control variables and year dummies in all regressions. Robust standard errors, in parenthesis; ***(**,*) indicate significance at 1(5, 10) percent.
b/ One step, instruments based on first lag of differences in the dependent variable and resource revenue, and second lags of their levels in the differenced equation.
Finally, Eq. (1) is estimated using domestic (non resource) tax revenues and resource revenues normalized by non resource GDP and resource GDP, respectively (Ossowski and Gonzales, 2012). 15 Usually the resource sector represents a significant and volatile part of GDP, and thus, normalization of resource and non resource revenues using total GDP could potentially affect the size and significance of the estimated coefficients (β1). Specifically, if
15 Alternatively, resource and non-resource GDP were both taken as a share of non resource GDP but the results are very similar to those presented in Section III.

19
resource revenue-to-GDP increases due to a sharp increase in resource production, non resource revenue may appear depressed relative to GDP simply because of the increased income and the coefficient estimates for β1 may be biased downwards. The results in Table 6 indicate once again qualitatively similar results to those obtained in Section III. As expected, however, the estimated coefficients present smaller absolute values, since the narrower tax bases increase the ratio of resource revenue significantly more than that of non resource revenue. The coefficient on resource revenue suggests that for each additional percentage point of natural resource revenues, there is a decline in total non resource tax revenue by 0.0042 percentage points of non resource GDP. Considering the higher volatility of resource revenue, when measured in percent of resource GDP, the impact on non resource revenue appears still significant. An increase in resource revenues (in percent of resource GDP) by one standard deviation implies a contemporaneous non resource revenue loss of about 1 percentage points of non resource GDP, whereas one standard deviation of resource revenues is now about its average change for a period of 18 months. That is the average annual fluctuation in resource revenues is associated with an estimated annual fluctuation in non resource revenue of about 0.7 percentage points of non resource GDP. In addition, its ultimate offset effect is estimated at about 1.6 percentage points of non resource GDP.
Table 6. Revenue normalized with resource- and non resource GDP, respectively
Dependent variables: Tax G&S VAT CIT PIT Trade (1) (2) (3) (4) (5) (6) Resource Revenue -0.0042* -0.0021* -0.0012*** -0.0014* -0.0002 -0.0142 (0.0016) (0.0006) (0.0004) (0.0006) (0.0003) (0.0121) Dependent variable (lagged) 0.6943*** 0.8521*** 0.6584*** 0.7460*** 0.9617*** 0.7538*** (0.1330) (0.0686) (0.0854) (0.0661) (0.0386) (0.0819) θ -0.0137** -0.0141** -0.0035*** -0.0055* -0.0052 -0.0576
(0.0089) (0.0094) (0.0009) (0.0038) (0.0079) (0.0651) M1 (p value) 0.076 0.003 0.001 0.027 0.043 0.000 M2 (p value) 0.375 0.426 0.780 0.272 0.359 0.241 Over-identification Hansen: Hansen: Hansen: 1.0 Hansen: Hansen: Hansen: (p value) 0.56 0.57 Sargan: 0.14 0.21 0.64 0.51 Observations 402 391 200 230 318 315 Instruments 65 65 65 63 64 65 No. of countries 35 32 21 24 28 28
Notes: a/ Dependent variable is total tax revenue, tax on goods and services, vat, corporate income tax, and trade, excluding resource
revenues to non resource GDP, respectively. Full set of control variables and year dummies in all regressions. Robust standard errors, in parenthesis; ***(**,*) indicate significance at 1(5, 10) percent.
b/ One step, instruments based on first lag of differences in the dependent variable and resource revenue, and second lags of their levels in the differenced equation.
Additional robustness checks are presented in Appendix II, which include an analysis of possible non-linear effects, and an alternative variable for resource revenues. Other checks were performed on the results of Section III. In particular, to control for the impact of the economic cycle on revenue, real GDP growth was included (Crivelli, 2013). Also to control for the size of the formal sector in the economy, money supply M2 to GDP was included

20
(Schneider and Enste, 2000). Finally, a measure of real exchange rate appreciation was included to account for potential “Dutch disease” effects on GDP, and thus on the tax base.16
V. CONCLUDING REMARKS
This paper uses a newly constructed revenue database for 35 resource-rich countries to analyze the impact of expanding resource revenues on domestic (non resource) revenues, including on its different components. The results show that there is a statistically significant negative relationship between resource revenues and domestic (non resource) revenues. For each additional percentage point of GDP in resource revenue, there is a corresponding reduction in domestic (non resource) revenues of about 0.3 percentage points of GDP. Similar results arise when data are disaggregated: the impact is relatively large for taxes on goods and services—in particular for the VAT—while the impact on corporate and trade taxes is smaller. These results are robust to different model specifications, including those that consider potential endogeneity and serial correlation in the data. In addition, our results are reasonably robust to alternative definitions of resource revenues, and for a subsample including only hydrocarbon producing countries. A fall in domestic (non resource) revenues owing to rising resource revenues can be a source of concern. As noted earlier, this will make resource-rich countries more dependent on volatile revenues, increase pro cyclicality in their fiscal policy, and retard their institutional development. In those resource-rich countries that are scaling up public spending to meet infrastructure and social needs, fiscal sustainability could be affected in the absence of a sound fiscal framework. There are a number of policy lessons that can be drawn from this study. First, resource-rich countries should carefully monitor the evolution of non resource revenues; if the offset between resource and non resource revenues is large, they should consider examining the design of their tax policy and strengthening revenue administration. It is possible that exemptions and special tax treatments have grown with rising resource revenues and that revenue administration has weakened. Second, attention should be paid to the design and administration of individual taxes. For the VAT, the data presented in the paper indicate that resource-rich countries tend to have lower rates, higher-than-usual exemptions, and a larger number of rates, all potentially lowering the efficiency of the VAT. Similarly, income taxation should be assessed, particularly if its base narrows with expanding resource revenue dependence.
16 These results, which do not differ qualitatively or quantitatively from those presented in Section III, are not provided to preserve space but are available from the authors upon request.

21
Finally, even though this paper has shown robust empirical evidence of a substantial offset between resource and non resource revenues—with the associated risks of a large dependence on resource revenues—there are, however, many caveats to what the “optimal” offset between resource and non resource revenue should be. The trade-off between different resource and non resource revenues has a bearing on both efficiency and equity of the tax system. This subject is beyond the scope of the paper and needs to be explored in future research.
22
Appendix I. Data
The countries in the sample are the following17: Algeria*, Angola*, Argentina*, Bahrain*, Botswana*, Brunei*, Cameroon*, Colombia*, Congo Republic*, Equatorial Guinea*, Gabon*, Gambia, Ghana, Guinea, Guinea-Bissau, Guyana, Indonesia*, Iran*, Ivory Coast*, Kazakhstan*, Mali, Mexico*, Nigeria*, Norway*, Oman*, Peru, Russia*, Saudi Arabia*, Senegal, Sierra Leone, Syria*, Trinidad and Tobago*, United Arab Emirates*, Vietnam*, and Yemen*.
Data on total tax revenue, VAT, income tax revenue, and trade tax revenue are taken from the IMF’s Government Financial Statistics (GFS) database, and IMF country documents, as discussed in Section II, relative to GDP. Data on natural resource revenues, including disaggregated tax revenue on natural resource endowments are taken from the IMF’s Fiscal Affairs Department Database on Natural Resources Taxation, which is constructed based on GFS, IMF country documents, and from consultations of IMF’s fiscal specialists with country authorities. Total natural resources rents, relative to GDP, is taken from the World Bank’s World Development Indicators (WDI) database, constructed based on sources and methods in World Bank (2011).
Share of agriculture in aggregate value added is taken from the WDI database. Non resource trade Openness is calculated as imports plus exports (excluding exports of natural resources) in percent of GDP, taken from the IMF’s International Financial Statistics (IFS) database. Per capita GDP is calculated in constant (2000) U.S. dollars, taken from the WDI database, expressed in logs. Inflation is the annual change in the CPI, taken from the IFS database. Foreign debt, relative to GDP, taken from the WDI database. The ICRG corruption scores, produced by Political Risk Services Group, are assessments by staff and relate to actual and potential corruption in the following forms: excessive patronage, nepotism, job reservations, ‘favor-for-favors’, secret party funding and suspiciously close ties between politics and business. The scores range from 0 to 6, where 0 indicates the highest potential risk of corruption and 6 indicates the lowest potential risk for any country. Foreign aid is Net total ODA, relative to GDP, from the OCDE (Development Co-operation Directorate) database. Table A1.1 summarizes the data.
17 Hydrocarbon (oil and gas) producing countries are identified with an asterisk.

23
Table A1.1. Descriptive Statistics
Obs. Mean Max. Min. Std.
Dev.
Total Tax Revenue, percent of GDP 527 14.8 54.4 0.4 8.0
Tax Revenue from Goods and Services, percent of GDP 552 5.0 15.8 0.0 3.6
VAT Tax Revenue, percent of GDP 269 4.3 9.9 0.0 2.1
Corporate Income Tax Revenue, percent of GDP 361 1.8 9.2 0.0 1.4
Personal Income Tax Revenue, percent of GDP 440 1.9 11.5 0.0 2.1
Trade Tax Revenue, percent of GDP 467 1.9 7.0 0.1 1.3
Resource Revenue, percent of GDP 551 15.2 68.7 0.0 14.1
Natural Resource Rents, percent of GDP 665 21.6 80.7 0.1 19.3
Agriculture Value-added, percent of GDP 627 15.6 62.4 0.3 14.8
Non-resource Trade Openness, percent of GDP 655 41.9 875.6 0.0 68.2
GDP per capita, 2000 USD 637 11453.7 70928.2 411.0 15398.3
Inflation, in percent 618 0.1 3.9 -0.2 0.3
Foreign Debt, percent of GDP 629 57.8 281.4 0.3 50.4
ICRG Corruption Score 642 2.5 6.0 1.0 0.9
Total ODA, percent of GDP 633 2.7 41.7 0.0 4.5

24
Appendix II. Further Robustness Analysis
First, we test for nonlinear effects by including a squared term of the resource revenue variable, where our expectation is that a larger share of revenues from natural resources will have a larger negative impact on domestic tax revenue effort. The results are presented in Table A2.1. While there is still evidence of an offset between resource and domestic non resource revenue—with resource revenues being significantly negatively associated with domestic non resource revenue in the regressions—we do not find support for the underlying hypothesis of a larger contemporaneous offset in domestic non resource revenues associated with an increased share of resource revenues. The coefficient for the squared resource revenue variable is not statistically significant in the regressions. The estimated ultimate effects, however, are very high, indicating that the offset in the long run is indeed larger for an increased share of resource revenues. This result resembles the findings in Section III for hydrocarbon producer countries.
Table A2.1. Including Squared Resource Revenue Variable
Dependent variables: Tax G&S VAT CIT PIT Trade (1) (2) (3) (4) (5) (6) Resource Revenue -0.2814** -0.1111*** -0.0669*** -0.0382** -0.0331* -0.0256* (0.1133) (0.0392) (0.0213) (0.0200) (0.0198) (0.0149) Resource Revenue (squared) 0.0273 0.0018 0.0009 0.0003 0.0006* 0.0005 (0.3698) (0.011) (0.0016) (0.0003) (0.0004) (0.0004) Dependent variable (lagged) 0.3454** 0.8336*** 0.8080*** 0.7283*** 0.9443*** 0.9513*** (0.1547) (0.0471) (0.0526) (0.0373) (0.0355) (0.0663) θ -0.4299** -0.6567*** -0.3422*** -0.1395** -0.5837* -0.5165
(0.1979) (0.1820) (0.0962) (0.0734) (0.3725) (0.8535) M1 (p value) 0.014 0.001 0.002 0.081 0.101 0.005 M2 (p value) 0.143 0.046 0.669 0.345 0.097 0.343 Over-identification Hansen: Hansen: 1.0 Hansen: Hansen: 1.0 Hansen: 1.0 Hansen: (p value) 0.55 Sargan: 0.06 0.53 Sargan: 0.12 Sargan: 0.34 0.25 Observations 401 391 200 230 318 315 Instruments 96 96 96 92 94 96 No. of countries 35 32 21 24 28 28
Notes: a/ Dependent variable is total tax revenue, tax on goods and services, vat, corporate income tax, and trade, excluding resource revenues
to GDP, respectively. Full set of control variables and year dummies in all regressions. Robust standard errors, in parenthesis; ***(**,*) indicate significance at 1(5, 10) percent.
b/ One step, instruments based on first lag of differences in the dependent variable, resource revenue, and resource revenue(squared), and second lags of their levels in the differenced equation.
A second robustness test consists of estimating Eq.(1) with an alternative proxy for revenue from natural resources. To this end, we have included a variable that captures the sum of natural resource rents from oil, gas, coal (hard and soft), minerals, and forests, expressed in percent of GDP. This variable on total natural resources rents is available for all countries in
25
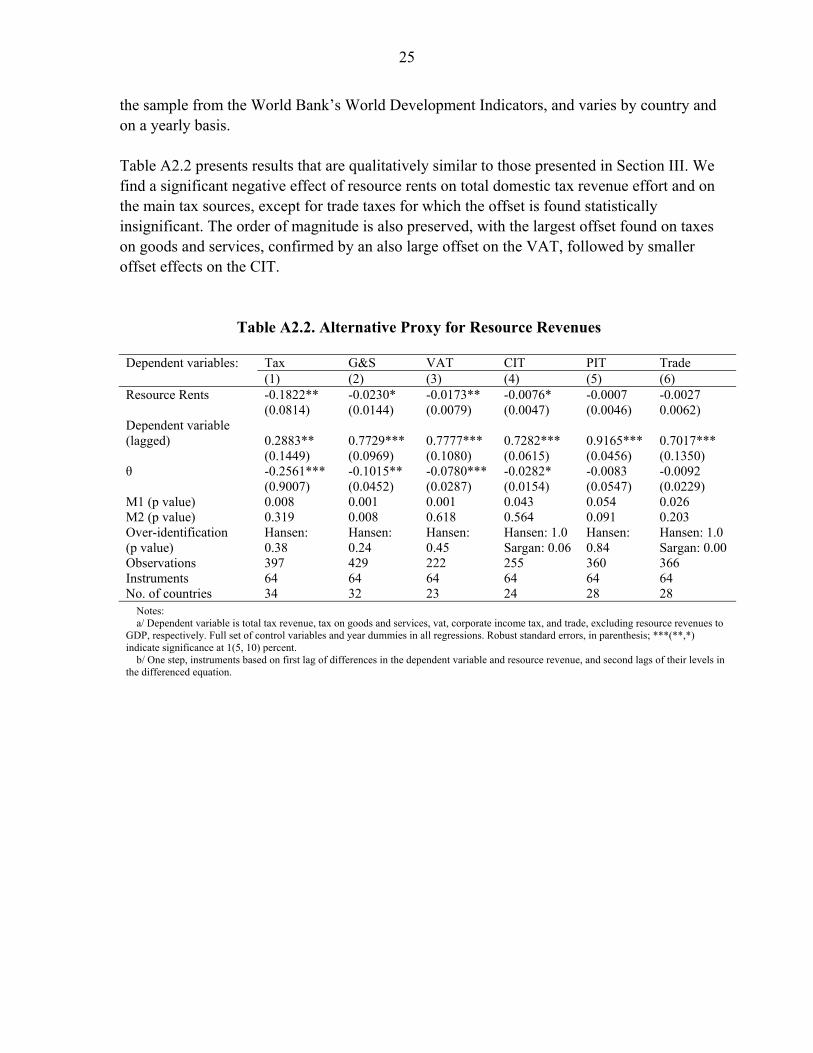
the sample from the World Bank’s World Development Indicators, and varies by country and on a yearly basis. Table A2.2 presents results that are qualitatively similar to those presented in Section III. We find a significant negative effect of resource rents on total domestic tax revenue effort and on the main tax sources, except for trade taxes for which the offset is found statistically insignificant. The order of magnitude is also preserved, with the largest offset found on taxes on goods and services, confirmed by an also large offset on the VAT, followed by smaller offset effects on the CIT.
Table A2.2. Alternative Proxy for Resource Revenues Dependent variables: Tax G&S VAT CIT PIT Trade (1) (2) (3) (4) (5) (6) Resource Rents -0.1822** -0.0230* -0.0173** -0.0076* -0.0007 -0.0027 (0.0814) (0.0144) (0.0079) (0.0047) (0.0046) 0.0062) Dependent variable (lagged) 0.2883** 0.7729*** 0.7777*** 0.7282*** 0.9165*** 0.7017*** (0.1449) (0.0969) (0.1080) (0.0615) (0.0456) (0.1350) θ -0.2561*** -0.1015** -0.0780*** -0.0282* -0.0083 -0.0092
(0.9007) (0.0452) (0.0287) (0.0154) (0.0547) (0.0229) M1 (p value) 0.008 0.001 0.001 0.043 0.054 0.026 M2 (p value) 0.319 0.008 0.618 0.564 0.091 0.203 Over-identification Hansen: Hansen: Hansen: Hansen: 1.0 Hansen: Hansen: 1.0 (p value) 0.38 0.24 0.45 Sargan: 0.06 0.84 Sargan: 0.00 Observations 397 429 222 255 360 366 Instruments 64 64 64 64 64 64 No. of countries 34 32 23 24 28 28
Notes: a/ Dependent variable is total tax revenue, tax on goods and services, vat, corporate income tax, and trade, excluding resource revenues to
GDP, respectively. Full set of control variables and year dummies in all regressions. Robust standard errors, in parenthesis; ***(**,*) indicate significance at 1(5, 10) percent.
b/ One step, instruments based on first lag of differences in the dependent variable and resource revenue, and second lags of their levels in the differenced equation.
26
REFERENCES
Acosta-Ormaechea, S., and J. Yoo, 2012, “Tax Composition and Economic Growth,” IMF
Working Paper 12/257, (Washington: International Monetary Fund). Arellano, M. and S. Bond, 1991, “Some tests of specification for panel data: Monte Carlo
evidence and an application to employment equations,” The Review of Economic Studies, 58, pp. 277-297.
Arnold, J., B. Brys, C. Heady, A. Johansson, C. Schwellnus, and L. Vartia, 2011, “Tax
Policy for Economic Recovery and Growth,” Economic Journal, Vol.111, pp. 59-80. Baltagi, B., 2008, “Econometric Analysis of Panel Data,” Wiley, 4th Edition, 2008. Baunsgaard, T., and M. Keen, 2010, “Tax Revenue and (or?) Trade Liberalization,” Journal
of Public Economics, Elsevier, Vol. 94(9–10), pp. 563–77, October. Benedek, D., E. Crivelli, S. Gupta, and P. Muthoora, 2013, “Foreign aid and revenue: Still a
crowding out effect? FinanzArchiv (forthcoming). Bergman, M., 2002, “Who pays for social policy? A study on taxes and trust,” Journal of
Social Policy 31 (2), pp. 289-305. Blundell, R., and S. Bond, 1998, “Initial Conditions and Moment Restrictions in Dynamic
Panel Data Models,” Journal of Econometrics, 87, pp. 115–43. Bornhost, F., S. Gupta, and J. Thornton, 2009, “Natural Resource Endowments and the
Domestic Revenue Effort,” European Journal of Political Economy, Elsevier, Vol. 25(4), pp. 439–46, December.
Chaudhry, K., 1997, “The Price of Wealth: Economies and Institutions in the Middle East,”
Cornell University Press, Ithaca. Chow, C., 1960, “Tests of Equality Between Sets of Coefficients in Two Linear
Regressions,” Econometrica, 28, pp. 591–605. Collier, P., 2006, Is aid oil? An analysis of whether Africa can absorb more aid,” World
Development 34, pp. 1482-97. Crandall, W., and J. Bodin, 2005, “Revenue Administration Reform in Middle Eastern
Countries, 1994-2004,” IMF Working Paper 05/203 (Washington: International Monetary Fund).

27
Crivelli, E., 2013, “Fiscal impact of privatization revisited: The role of tax revenues in
transition economies,” Economic Systems 37, 217-32. Davis, G., and J. Tilton, 2005, “The resource curse,” Natural Resources Forum 29, pp. 233-
42. Ghura, D., 1998, “Tax Revenue in Sub-Saharan Africa: Effects of Economic Policies and
Corruption,” IMF Working Paper 98/135 (Washington: International Monetary Fund). Gupta, S and S. Tareq, 2008, “Mobilizing Revenue,” Finance and Development, Vol. 45,
Issue 3 (Washington: International Monetary Fund). Hadi, A., 1994, “A modification of a method for the detection of outliers in multivariate
samples,” Journal of the Royal Statistical Society (Series B) 56, 393-96. International Monetary Fund, 2011, “Revenue Mobilization in Developing Countries,” Policy
Paper, Fiscal Affairs Department, March (Washington: International Monetary Fund) International Monetary Fund, 2012, “Fiscal Regimes for Extractive Industries: Design and
Implementation,” Board Paper, August (Washington: International Monetary Fund) Keen, M., and M. Mansour, 2010, “Revenue Mobilisation in Sub-Saharan Africa: Challenges
from Globalisation II - Corporate Taxation,” Development Policy Review, Overseas Development Institute, Vol. 28(5), pp. 573–96, 09.
Knack, S., 2009, “Sovereign rents and quality of tax policy and administration,” Journal of
Comparative Economics 37, pp. 359-71. Leite, C., and J. Weidmann, 1999, “Does mother nature corrupt? Natural resources,
corruption, and economic growth.” In: Abed, G. and S. Gupta (Eds), Governance, Corruption, and Economic Performance, (Washington: International Monetary Fund).
Levi, M., 1988, “Of Rule and Revenue,” University of California Press, Berkeley. McGuirk, E., 2013, “The illusory leader: natural resources, taxation and accountability,”
Public Choice 154, pp. 285-313. Moore, M., 1998, “Death without taxes: democracy, state capacity and aid dependence in the
fourth world.” In: Robinson, M., White, G. (Eds.), The Democratic Development State, Oxford University Press, Oxford.
28
Moore, M., 2007, “How does taxation affect the quality of governance,” IDS Working Paper 280, Brighton, UK.
Nickell, S., 1981, “Bias in Dynamic Models with Fixed Effects,” Econometrica, 49(6),
pp. 1417–26. Ossowski, R., and A. Gonzales, 2012, “Manna from Heaven: The Impact of Nonrenewable
Resource Revenues on Other Revenues of Resource Exporters in Latin America and the Caribbean,” IDB Working Paper 337, (Washington: Inter-American Development Bank).
Pessino, C. and R. Fenochietto, 2010, “Determining Countries’ Tax Effort,” Hacienda
Pública Española/Revista de Economía Pública, Vol. 195, No. 4, pp. 65–87. Rodrik, D., 1998, “Why Do More Open Economies have Bigger Governments? Journal of
Political Economy, Vol. 106, pp. 997–1032. Roodman, D., 2009, “A Note on the Theme of Too Many Instruments,” Oxford Bulletin of
Economics and Statistics 71(1), pp.135–58. Ross, M., 1999, “The political economy of the resource curse,” World Politics 51, pp. 297-
322. Ross, M., 2001, “Does oil hinders democracy?” World Politics 53, pp. 325-61. Roy, S., 1957, “Some Aspects of Multivariate Analysis,” Wiley. Schneider, F., and D. Enste, 2000, “Shadow Economies: Size, Causes and Consequences,”
Journal of Economic Literature 38, pp. 73-110. Sen Gupta, A., 2007, “Determinants of Tax Revenue Efforts in Developing Countries,” IMF
Working Paper 07/184 (Washington: International Monetary Fund). Smith, R., 2001, “Estimation and Inference with Non-stationary Panel Time-series Data,”
Paper prepared for the RC33 Conference, Cologne October 2000, Department of Economics, Birkbeck College, London.
Tanzi, V., and H. Davoodi, 1997, “Corruption, Growth, and Public Finances,” In: Abed, G.
and S. Gupta (Eds), Governance, Corruption, and Economic Performance, (Washington: International Monetary Fund).
Thomas, A., and J. Treviño, 2013, “Resource Dependence and Fiscal Effort in Sub-Saharan
Africa,” IMF Working Paper 13/188 (Washington: International Monetary Fund).
29
Treisman, D., 2007, “What have we learned about the causes of corruption from ten years of
cross-national empirical research?” Annual Review of Political Science 10, pp. 211-44. World Bank, 2011, “The changing wealth of nations: Measuring sustainable development in
the new millennium,” Environment and Development (Washington, D.C: The World Bank).
Zellner, A., “An Efficient Method of Estimating Seemingly Unrelated Regression and Tests
for Aggregation Bias,” Journal of the American Statistical Association, Vol. 57.