resource-led industrial development in the oil & gas ... · prominp - the national oil and...
TRANSCRIPT

Resource-Led Industrial Development in the Oil & Gas Supply Chain: The Case of Brazil Renato Lima de Oliveira, Ph.D candidate MIT Department of Political Science [email protected]
MIT-IPC Working Paper 16-002 June 2016
292 Main Street, E38-506, Cambridge, MA 02139 ipc.mit.edu
ABSTRACT
Developmental economics has traditionally viewed the production of commodities, and O&G in particular, as an activity of limited potential for backward linkages, industrial development and innovation (Hirschman, 1958; Prebisch, 1950). This view stands in stark contrast to the reality of the contemporary O&G industry, which has a complex, global, multi-tiered value chain, and is intensive in R&D and innovation, particularly as oil companies develop more challenging resources such as deep offshore and unconventional reservoirs. Because those resources also require more capital expenditures, the economic impact of the O&G industry in terms of direct investment is becoming more significant. This paper shows that these factors, combined with government control of subsoil resources, has driven a push for active industrial policies in the sector through local content requirements (LCR), which are structured by economic and political incentives. Using evidence from Brazil, a country that has developed vast resources of offshore oil and invested heavily in developing a domestic supply sector, this study highlights the possibilities for resource-led industrial growth as well as its competitive challenges, which include increasing productivity and serving clients outside the protected Brazilian market and limiting rent-seeking.
Acronyms
AHT – Anchor handling tug (supply vessel) API – American Petroleum Institute BOE – Barrel of oil equivalent. CAPEX – Capital expenditure E&P – Exploration and production FPSO – Floating production storage and offloading GVC – Global value chain IOC – International oil company
LCP – Local content policy NOC – National oil company O&G – Oil and gas OEPC – Organization of the Petroleum Exporting Countries OPEX – Operational expenditure PROMINP - The National Oil and Natural Gas Industry Mobilization Program of Brazil
This research was sponsored by SENAI. The IPC is grateful for their support.
Esta pesquisa foi patrocinada pelo SENAI. O IPC agradece pelo seu apoio.

1
Resource-Led Industrial Development in the Oil & Gas Supply Chain: The Case of Brazil 1. General overview of the petroleum industry
The oil and gas (O&G) industry is one of the most important and complex industries in the world (Inkpen and Moffett, 2011). In value, it is responsible for 4.8% of global GDP and 12% of global goods trade (Aguilera and Radetzki, 2015). It generates high demand for equipment for exploration and production (E&P) of hydrocarbons, such as production platforms and drilling rigs. Once refined and separated into different products, O&G products are either used as a source of energy, particularly liquid fuels for transportation and natural gas for heating and generation of electricity, or when used by the petrochemical industry, it is a raw material for a range of products, from textiles to plastic bottles. Furthermore, because of its role in energy security, petroleum also influences geopolitics and international relations.
The O&G industry has a long value chain that can be divided into upstream, midstream, and downstream segments. Upstream refers to the activities related to E&P. Midstream encompasses the distribution and transportation of hydrocarbons, such as pipelines and oil tankers, and downstream refers to the transformation of O&G into other products through refining and as a feedstock into petrochemical plants. It also includes retail operations, such as gas stations.
Despite environmental concerns over climate change, fossil fuels are still the world’s main source of energy, accounting for 86% of demand (BP, 2015). BP also estimates that world energy demand will grow by 37% between 2013 to 2035, with the oil industry growing in absolute terms, with slightly falling share relative to renewables, such as wind and solar. While renewables are growing faster, more hydrocarbons will be produced and consumed in the years to come.
However, as the most accessible and cheapest sources of oil become scarce, the industry is turning to harder to develop resources such as deep offshore and other unconventional sources. Such resources require higher capital and operational expenditures and drive demand for innovative technological solutions, such as subsea robotics for deep offshore and the combination of horizontal drilling and hydraulic fracturing for shale O&G. To meet these challenges, the O&G industry has become more technology intensive over the years (Perrons, 2014; Donnelly, 2014). Taking a historical perspective, this trend represents a partial shift from the high rents accrued to owners of land – such as nation states – to providers of technological solutions.
This paper will make three interrelated claims. First, the contemporary oil industry, particularly in the exploitation of high-cost resources such as deep offshore, is technology intensive and

2
provides vast opportunities for backward linkages and innovation. This reality contrasts to standard developmental accounts that saw limited opportunities for industrial development and productivity gains from natural resources industries (Hirschman, 1958; Prebisch, 1950; Ross, 2012). Second, that countries with natural resources can condition the exploitation of their deposits on the development and use of locally manufactured goods and equipment through local content requirements (LCRs), a practice that has been growing in the oil industry (Tordo et al., 2013). Third, that such LCRs will be shaped both by economic and political forces. On the economic side, demand for capital and operational investments and pre-existing domestic industrial capacity and productivity will determine the level of what is economically efficient to procure domestically. On the political side, distributive pressures can induce the selection of excessively ambitious targets for local content and high protectionism levels for domestic players. This can reduce the competitive forces necessary for the emergence of an internationally competitive domestic supplier sector and put the sustainability of the whole industry at risk, particularly during negative price shocks.
This paper is divided in two parts. The first characterizes the global O&G industry in terms of its global value chain (GVC), main players, and the role played by sovereign states in the sector. Using the analysis and nomenclature from the first section, the second section develops a portrait of Brazil’s O&G industry, its achievements and competitive challenges. Brazil exemplifies both the possibilities for resource-led industrial development as well as the vulnerabilities associated with using aggressive industrial policies in the O&G sector to score political gains.
1.1. Value creation in the O&G industry
The petroleum value chain starts with the identification of resources where O&G are likely to be found – the first step of the E&P stage. Countries typically have ownership of the subsoil rights and the power to determine the conditions under which companies (or a state monopoly) can locate and exploit natural resources. The total share of revenues kept by the state under these production contracts is called the government take, which can go as high as 90% in some countries, particularly those with very low costs of production (GAO, 2007). Even at that taxation level, if there is a large difference between cost of production and the international oil price, companies can make a sizable profit.
After the acquisition of exploratory rights of a specified acreage from the state, an oil company will gradually invest in activities that reduce the uncertainty about whether a commercial discovery can be made. During the exploration phase, seismic surveys and other analyses are conducted. If results are promising, an oil operator will start a drilling campaign that can include several exploration wells. If discoveries are made, new wells are drilled to delineate and characterize the field, which is called the appraisal phase. Finally, after the field is characterized in its extent and production potential, the development phase begins, where long-term production
3
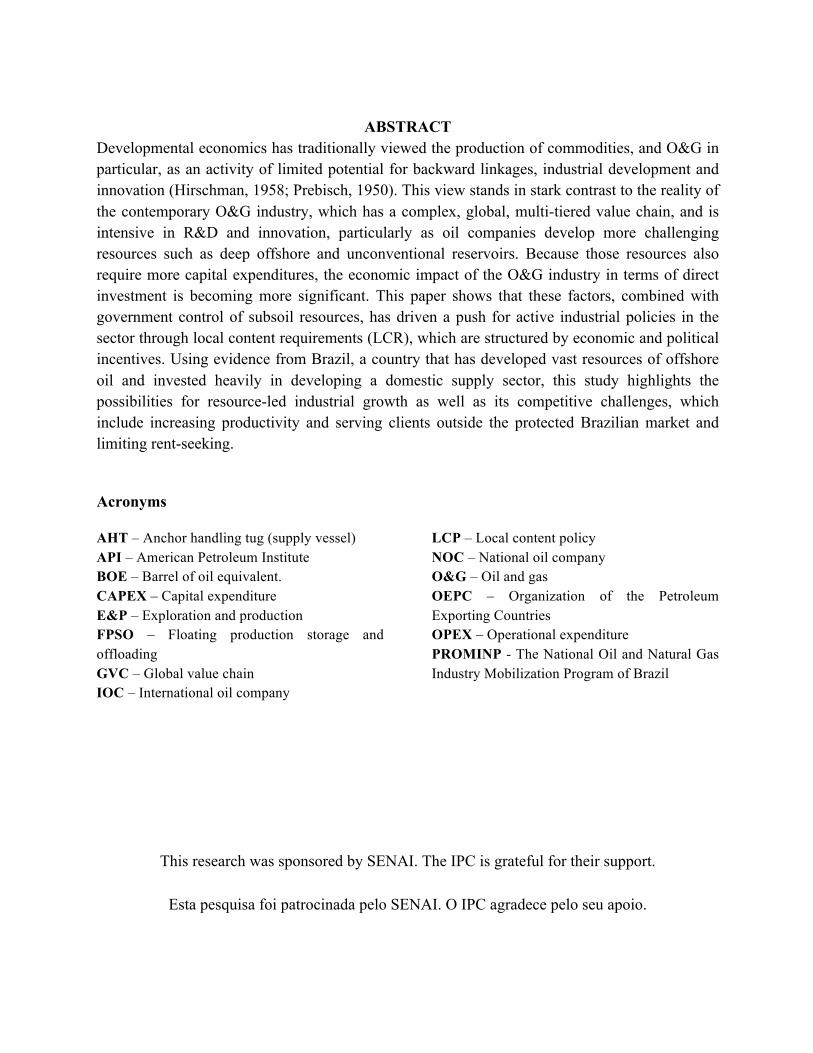
infrastructure is built. Overall, it can take up to a decade to move from land acquisition to production, with investment of hundreds of millions of dollars required before revenues from the oil production can flow (Jahn, Cook, and Graham 2008, Bret-Rouzat and Favennec 2011). Even failed exploratory campaigns – wells that turned out to be dry or with oil that is not commercially viable to produce – will result in a large number of contracts for oil service companies and manufacturers of capital equipment. Figure 1 summarizes the principal stages of the petroleum sector value chain.
Figure 1: The O&G value chain
The number of companies in each step of the production chain varies, as do the associated profit margins. In the upstream, barriers of entry are typically high, and relatively few companies are responsible for the majority of production and services in the world. First, countries usually impose market restrictions, frequently creating monopolies or granting privileged access to state companies, the national oil companies (NOC). They lead the ranks of oil production (see Table 1, where ExxonMobil, BP, Shell, Chevron, and Total are the exceptions). Second, projects in the upstream stage of O&G development can easily cost billions of dollars, particularly when developing deep offshore resources. This means that few companies can afford the high capital requirements and long lead times required before production can begin, and revenues can flow.
These characteristics make the oil industry special in economic terms. Oil companies sometimes can have radically different cost structures, for example 20 times more than a competitor, and still compete in the same market (Pinto Júnior et al., 2007). A NOC such as Saudi Aramco can

4
produce with the lowest costs in the world but still leave space in the market for Petrobras, which extracts from costly deep offshore reserves, or Canadian companies that transform oil sands into crude, such as Suncor.
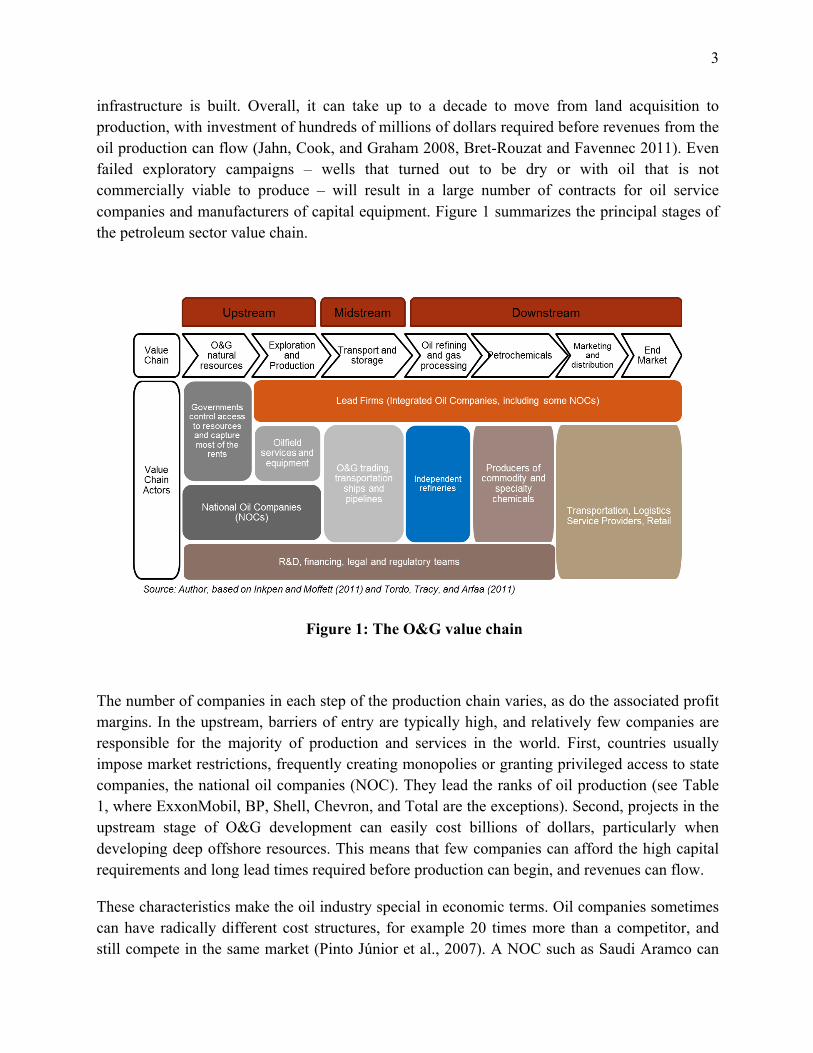
Given that upstream projects are becoming more complex due to geological challenges and also because of regulations, such as environmental standards and local content requirements, capital costs have been on the rise, as shown in Figure 2. Typically, costs of services and equipment in this industry follow closely the price of oil, as higher prices increase the demand for E&P activities in areas that are not commercially viable at low prices.
Table 1: Top 15 O&G companies by production
Name Production (in mbpd)
Country of origin
Saudi Aramco 12 Saudi Arabia Gazprom 8.3 Russia National Iranian Oil Co. 6 Iran ExxonMobil 4.7 USA Rosneft 4.7 Russia PetroChina 4 China BP 3.7 UK Shell 3.7 UK/Netherlands Pemex 3.6 Mexico Kuwait Petroleum Corp. 3.4 Kuwait Chevron 3.3 USA Abu Dhabi National Oil Co.
3.1 United Arab Emirates
Total 2.5 France Petrobras 2.4 Brazil Qatar Petroleum 2.4 Qatar Source: Forbes, 2015
5
Figure 2: Costs of equipment, facilities, materials and personnel in the upstream
1.2. Oilfield Equipment and Service Companies
Although oil companies are the most visible actors in the oil business, and sit on top of the “food chain”, the exploration and production of oil involves a range of equipment and services. For instance, to drill a well, an oil operator will need a drilling rig, drill bits, drilling fluids, pipes, cement, and so on. Operators contract out most of these goods and services to oilfield service companies. This segment grown by filling niches left by oil operators (outsourcing) and by working in partnership with NOCs that had access to resources but lacked expertise in developing them. All oil companies (state or private) work with oilfield service companies. In fact, about 70% to 95% of all expenditures made by oil companies in the upstream segment are outsourced (Bain & Company and Tozzini Freire, 2009; Raymond and Leffler, 2006). Within the broad category of E&P, it is possible to further open the value chain and divide it in subsegments: reservoir information, drilling, well completion, production, maintenance and logistics, and decommission. Each subsegment varies in terms of its market concentration and opportunities for new entrants. Drilling and well completion comprise the lion’s share of value, with about two-thirds of the expenditures (Bain & Company and Tozzini Freire, 2009). Four companies dominate the market of oilfield services by integrating different stages of the production process and offering innovative technological solutions: Schlumberger, Halliburton, Baker Hughes and Weatherford, and they occupy the second tier of the upstream oil industry. A common characteristic of these companies is the large share of revenues dedicated to R&D, which can go above US$1 billion a year (Economist, 2012) and reach high percentages as a share of total revenues. For example, Schlumberger has consistently invested 2.5% or above per year in research and engineering activities (Schlumberger, 2014). The third tier is composed of equipment manufacturers, sometimes by subsidiaries of oilfield integrators.
100
120
140
160
180
200
220
Sources: IHS Cera Capital Cost Analysis Service (2016), BP (2015), Bloomberg (2015)Year
Ups
tream
Cap
ital C
ost I
ndex
(UC
CI)
2000 2001 2002 2003 2004 2005 2006 2007 2008 2009 2010 2011 2012 2013 2014 2015
Year
4060
8010
0
Spo
t cru
de p
rice
Capital and service costs (2000=100)Oil price (spot)
6
While oilfield service companies may also work in drilling operations, sometimes by subsidiaries, the drilling market is more diverse. Focusing on the offshore drilling market, which is more complex and capital-intensive, the main drillers include Transocean, ENSCO, Noble, Hercules, Diamond, and Seadrill. The top ten companies of this segment owned about half of the approximately 900 drillers in the world as of 2010 (Kaiser and Snyder, 2013). More than large sums invested into R&D or proprietary technology, the major barrier of entry in the offshore drilling business is the capital necessary to procure rigs, which can cost as high as $ 1 billion, and the ability to secure contracts with oil companies. Nationally-based companies that are part of well-capitalized business groups have successfully captured part of this market, such as the Brazilian groups Queiroz Galvão, Schain and Odebrecht, or Grupo R, in Mexico. Drillers are responsible for staffing the crew and performing the service, but the equipment itself is built by shipyards. In the case of offshore drilling rigs, the main manufacturers come from South Korea and Singapore and are companies like Samsung Heavy Industries, Daewoo, and Keppel. The construction is intensive in steel, labor, and equipment. The drilling operation requires another range of goods and services, from specialized drill bits to fluids, like drilling mud (Devereux, 2012).
Finally, after wells are producing (assuming they are viable) and the necessary infrastructure is in place, the oil company that leads the project will have made most of the associated capital expenditures (CAPEX), but another set of providers will be involved in the operational expenditures (OPEX) of the field, such as maintenance, logistics, and at the end of the life of the reservoir, decommission.
Oilfield service companies tend to not directly compete with oil operators for their own exploration acreage. Currently, oil operators are broadly responsible for analyzing the prospects of projects (the geological risk), taking on financial risk, and managing a portfolio of assets.
1.3. Midstream and downstream
Significant rents exist in the E&P (Tordo, Tracy and Arfaa, 2011) but as the value chain moves from the discovery and production of oil to transformation (downstream), the market becomes more competitive and the margins tighter.
After a barrel of oil is produced, it is sent to a refinery for transformation and separation into products such as gasoline, diesel, asphalt, and other compounds used in a wide range or products, including plastics, solvents, and fertilizers. Crude oil varies in terms of its quality, particularly in its sulfur content and density (measured in the API gravity scale). The characteristics of the crude determine the yield of different products obtained in the refining process. Sweet (low sulfur) light (>32 API) crude is more valued in the market than sour, heavy crude. Refineries that have passed through technical upgrades are able to process cheaper heavy crude and produce

7
more of the products that have high market value. However, these investments are capital-intensive and not necessarily profitable – it depends on the price spread between heavy and light crude.
Margins in the refinery business are typically thin. A refinery receives a commodity as feedstock (barrels of crude) and produces other commodities, such as gasoline, kerosene, diesel, and lubricants. Proximity to consuming markets is critical. However, because refining requires high capital investment and has only low margins, few companies operate them. Refineries are typically owned by oil companies that have operations in the upstream and distribution (retail). These functions are what is commonly meant when referring to an “integrated” oil company, such as Shell, BP, and Petrobras. At the very end of the chain, when products are sold at the pump in gas stations, margins are razor thin and gas stations usually derive the highest share of their profits from sales in the convenience store and other services such as vehicle repair and inspection.
Another branch of the downstream segment is petrochemical production. From “cuts” of crude oil or natural gas it is possible to further extract base chemicals such as ethylene, propylene, benzene, toluene and xylenes. These intermediate compounds are chemically transformed to serve as raw materials for plastics and resins. The base petrochemicals segment is very concentrated and firms rely heavily on economies of scale. Major players include BASF (Germany), Dow (USA), Shell (UK), Total (France), Saudi Basic Industries Corporation (Saudi Arabia), and Braskem (Brazil). As one moves downstream along the petrochemicals production chain, a greater number of companies are involved in converting chemicals into intermediates and useful goods such as the blade of a wind turbine or a plastic bottle made out of PET (polyethylene terephthalate).
1.4. The global nature of the O&G industry and domestic industrial policies
As a point-source non-renewable resource, O&G production is initially tied to the geography of the resource: it is necessarily produced in the places in the world were hydrocarbons can be commercially extracted. To assert more control over their natural resources, many countries nationalized O&G operations, created NOCs, or imposed strict rules on how international oil companies (IOCs) can operate. Through a combination of collusion within the Organization of the Petroleum Exporting Countries (OPEC) and contract renegotiation by raising taxes, oil-rich countries have successfully captured high rents in upstream production. However, few of those countries have excelled in oilfield services and equipment manufacturing. They have been unable, therefore, to capture rents from the most knowledge-intensive aspects of the industry. As easy sources of oil exhaust, countries that depend uniquely on their favorable geology will face increasing fiscal pressures.

8
The technological and knowledge-intensive parts of the O&G industry are very global. Equipment and high-skilled personnel used for E&P can be imported, crude oil can be transported for refining, and cuts can be further transported for petrochemical production. As with other global value chains of this sort, the potential detachment of the production with the rest of the economy can result in an enclave development, where the oil production creates no linkages to the rest of the economy with the exception of generating rents to governments. A few NOCs, particularly those which had to face challenging conditions to produce oil (e.g., offshore) such as Statoil (Norway), Petrobras, and Petronas (Malaysia), have developed capabilities, and these have allowed them to internationalize.
A recent trend has been to use local content legislation to force oil companies to procure part of their goods and services from suppliers with local manufacturing (Tordo et al., 2013). Through these mechanisms, goods that were traditionally imported have to be manufactured locally, such as parts of floating, production, storage and offloading (FPSO) units.1 The stated goal of a LCR is to capture part of the value added by the O&G industry by “sustainable and efficient provision of internationally competitive local goods and services” (Paul, 2013, p. 181). The intent of these mandates is to build capabilities and capture a higher share of the value added of oil production domestically by creating the demand for industrial equipment and services. While these mandates set minimum requirements to oil operators and impose fines for non-compliance, suppliers with local manufacturing still have to compete with the rest of the world and meet international standards (Lima de Oliveira, 2015). For example, a domestic shipyard may obtain an order because of local content yet receive contractual fines and have part of the order relocated to foreign shipyards if delivery schedules are unmet. This is so because many elements of an oil platform are modular and can be imported from overseas shipyards.
Therefore, the goals of industrial policies in the O&G sector have to take into account the geographically and organizationally fragmented nature of the industry, a problem faced other sectors where GVCs are well developed, such as ICT hardware and motor vehicles (Gereffi and Sturgeon, 2013). Because the state has an upper hand in determining the rules of access for extraction of natural resources, it is comparatively easier to impose industrial policies in exchange of rights of production. However, the challenges for building a successful and sustainable domestic industry are great. Since market conditions and the rate of technological change in the industry are fast (Lloyd’s Register Energy, 2014), playing industrial “catch-up” is not enough: manufacturing for the O&G industry requires a well-conceived innovation strategy in addition to some degree of insulation from distributive pressures of local interest groups, as is required for successful industrial policies in general (Evans, 1995).
1 FPSO ships store and process crude O&G as it is pumped from well, offloading them to tankers, thus eliminating the need for fixed pipelines.
9
PART II: How Brazil fits in the Oil GVC
2. Introduction
Part II of this paper analyzes the development of the oil industry in Brazil, its international integration and its competitive challenges. After a brief historical overview, it turns to current regulations that affect investment decisions in the country, particularly LCR imposed to the upstream segment of the production chain. The growth of the Brazilian shipyard industry is shown as evidence of the high demand for locally produced capital goods for the offshore oil industry and the possibilities for industrial policies based on LC development – points made in the preceding section. However, I show that this industry, born from protection and direct government incentives, has deep competitive challenges arising from low productivity levels.
Using a novel dataset from audit reports from the National Agency of Petroleum (ANP), I show that fines for not complying with local content mandates have been on the rise – both in terms of occurrences as well as in monetary value. This increase is an indication that the domestic industry has not being able to keep up with demand or meet the stricter LC regulations that have been adopted over the years. Trade data and an analysis of over 20 thousand contracts of Petrobras between 2005 and 2015 reveals the segments most demanded by the oil industry and the main suppliers. However, as will be discussed in detail, a specific Brazilian regulation for O&G equipment providers (Repetro) distorts trade data analysis because domestic sales are counted as exports, generating false-positives exporters. Instead, import license requests by firms to ANP is used to identify the items that oil companies claim that the domestic industry is not able to deliver on a reasonable price or time. Finally, data examination is complemented with interviews with industry stakeholders and policymakers
2.1. The gradual growth of the Brazilian oil industry
Unlike neighboring countries such as Venezuela or Bolivia, Brazil was not blessed with an easy geology for hydrocarbon extraction. After an intense political campaign to nationalize the industry and develop the national O&G resources, Petrobras was formed in 1953, as an unusual NOC which had a monopoly of oil fields that where yet to be found.
Oil production in Brazil started in onshore basins in the Northeast of the country but it soon became clear these resources had limited potential. To overcome oil scarcity, Petrobras took the strategic decision to invest in offshore exploration. The first offshore discovery was made in 1968, in Sergipe, but significant resources were not found until 1976, with the discovery of large reservoirs in the Campos basin, off the state of Rio de Janeiro (Dias and Quagliano, 1993).
10
Petrobras progressively went further offshore, registering some of the world records for deep water oil operations (Freire, 2013). Despite these gains, production was still far below the national consumption by the mid-1990s. In 1995, a Constitutional Amendment allowed the federal government to license exploratory areas to private (domestic or foreign) companies and by 1997 a new regulatory framework was in place with the creation of ANP. The agency was put in charge of regulating the sector and conducting regular rounds of bidding for new exploratory blocks.
Nevertheless, Petrobras kept its leading role in the industry, and filled capability gaps by partnering with IOCs to invest in capital-intensive deep water projects. The strategy paid off in 2007 with the discovery of the “pre-salt” reserves in the Campos and Santos basins, with initial estimates as high as 70 billion barrels of oil, more than tripling Brazil’s total oil reserves at the time (for comparison, U.S. oil reserves are about 50 billion barrels of oil). However, developing the pre-salt resources came with high costs and huge technological hurdles, given that operations are 300 km offshore and at water depths of 2,000 meters or more. Today, Petrobras maintains its dominant position in the Brazilian oil market. About 91.3% of the oil produced in the country comes from a facility operated by Petrobras (ANP, 2015).
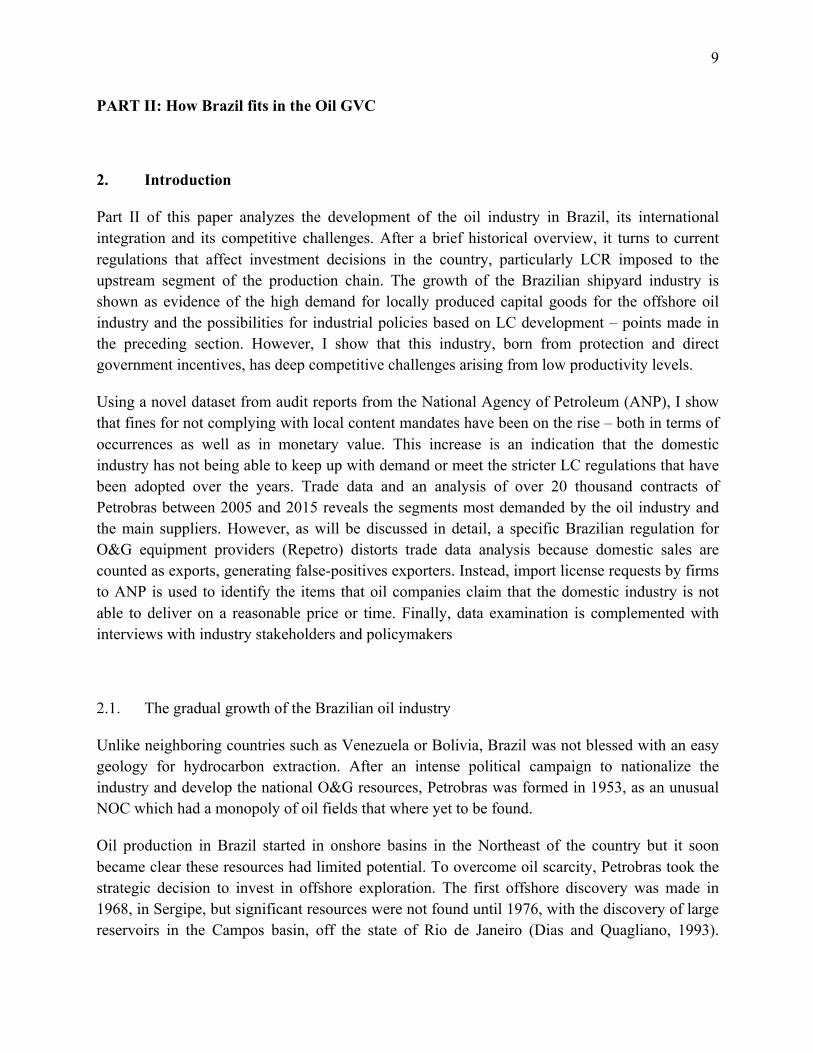
While majors like Shell, Statoil, and Chevron extract O&G in Brazil with their own platforms, their market share is small. Nevertheless, in many fields, including in the pre-salt, Petrobras works in partnership with other companies, which had been critical to raise capital for deep offshore development, helping to consolidate Brazil’s leadership in deep offshore oil. In 2015, 82% of Brazil’s oil production originated from deep (over 500m of water depth) offshore fields, while the average in the world was of 6% in 2011 (IEA 2012). Taking into account the participation of partners in the oil production, the market share of Petrobras slightly decreases to 85%, as shown in Figure 3.
Figure 3: Oil and gas production by concessionary

11
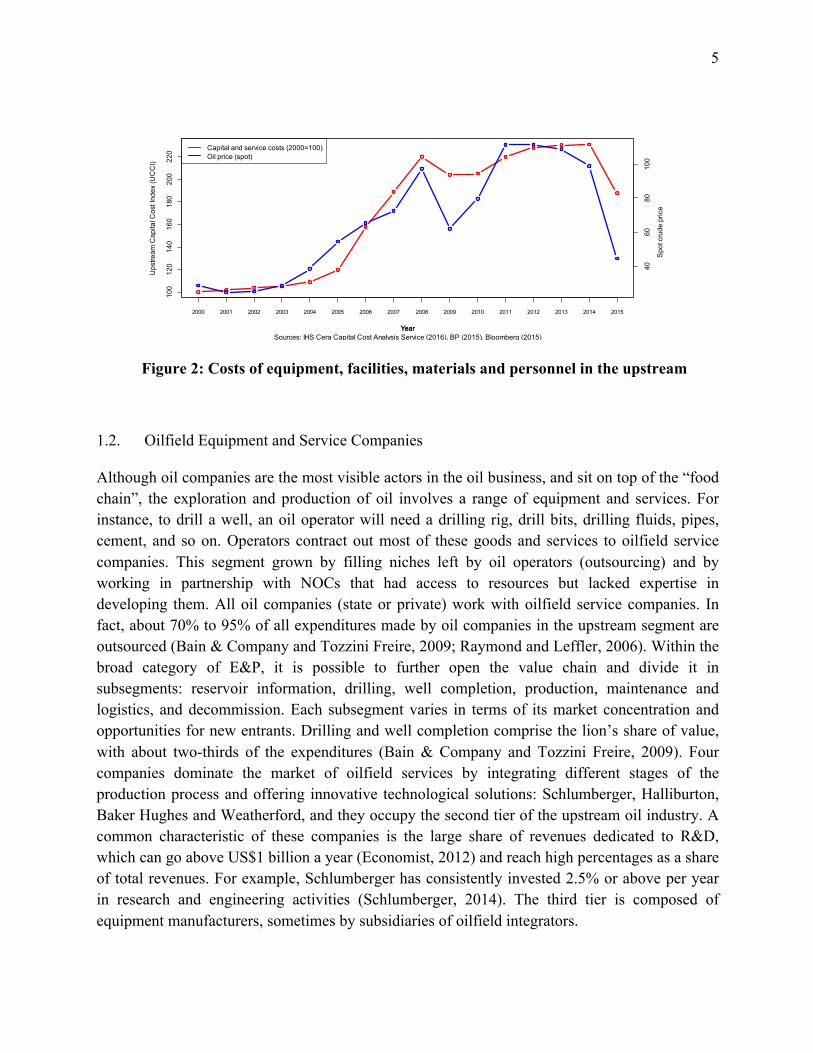
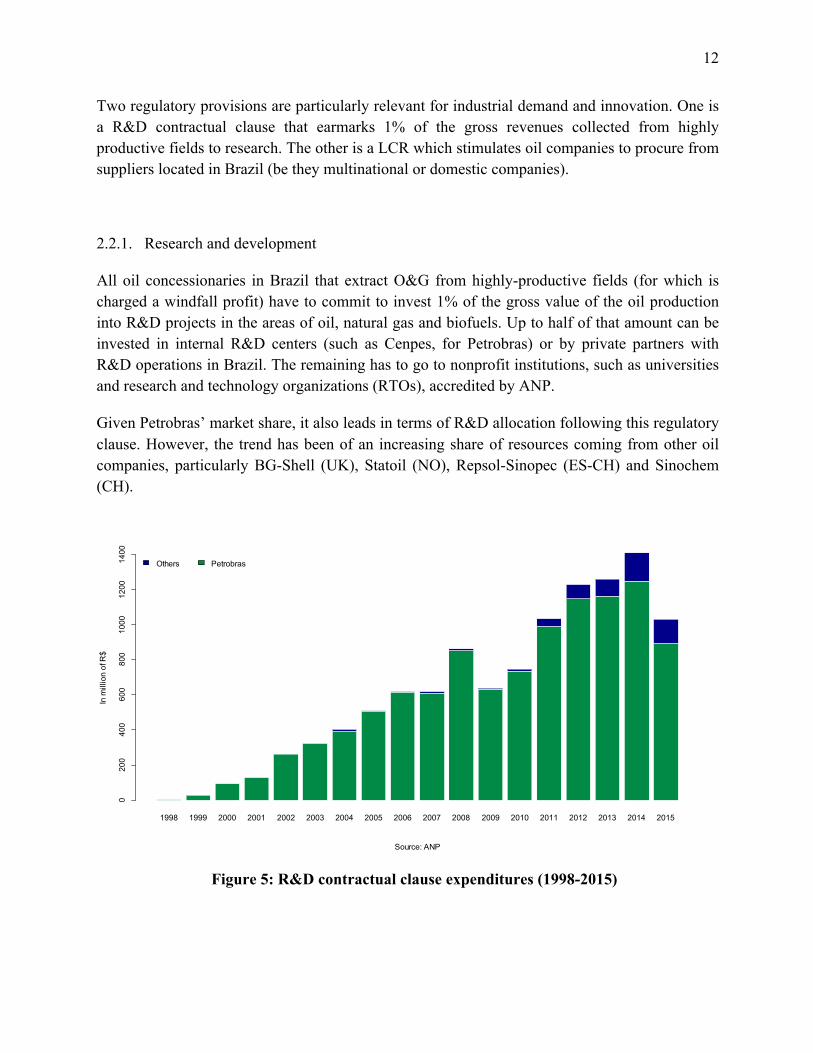
Given the scale of the resource discoveries, Brazil was expected to become an important net oil exporter. In comparison to other major Latin American oil producers, only Brazil has had a consistent rise in production, as depicted in Figure 4, which shows a slow but steady rise in output, based in gradual learning and a relatively stable institutional environment.
Figure 4: Oil production in selected Latin American countries (1965-2014)
2.2. Access to market rules
With the end of the monopoly of Petrobras, the government was free to select other companies to explore and produce oil in the Brazilian territory and since 1999, ANP has been conducting bidding rounds offering areas for exploration. So far, 13 licensing rounds have taken place in addition to a bid for the pre-salt area of Libra, under production-sharing contract.2
2 After the discovery of the pre-salt area in 2007, the government decided to change the E&P and revenue rules for that particular oil play (Laws No. 12351/10, 12276/10, and 12858/13). The most important changes were the introduction of production-sharing contracts, the creation of a new state entity (PPSA) to represent the Union in the contract committees and sell its share of oil, and a guaranteed minimum participation of 30% of Petrobras as operator of all pre-salt fields. The changes only affected the pre-salt areas previously unlicensed, thus respecting all previous contracts. However, the minimum share of Petrobras in all pre-salt contracts is likely to change as congress was moving to pass a bill that would release such restriction.
1970 1980 1990 2000 2010
010
0020
0030
0040
00
Source: BP Statistical Review of World Energy 2015Year
Tho
usan
d ba
rrel
s da
ily
ArgentinaBrazilMexicoVenezuela
12
Two regulatory provisions are particularly relevant for industrial demand and innovation. One is a R&D contractual clause that earmarks 1% of the gross revenues collected from highly productive fields to research. The other is a LCR which stimulates oil companies to procure from suppliers located in Brazil (be they multinational or domestic companies).
2.2.1. Research and development
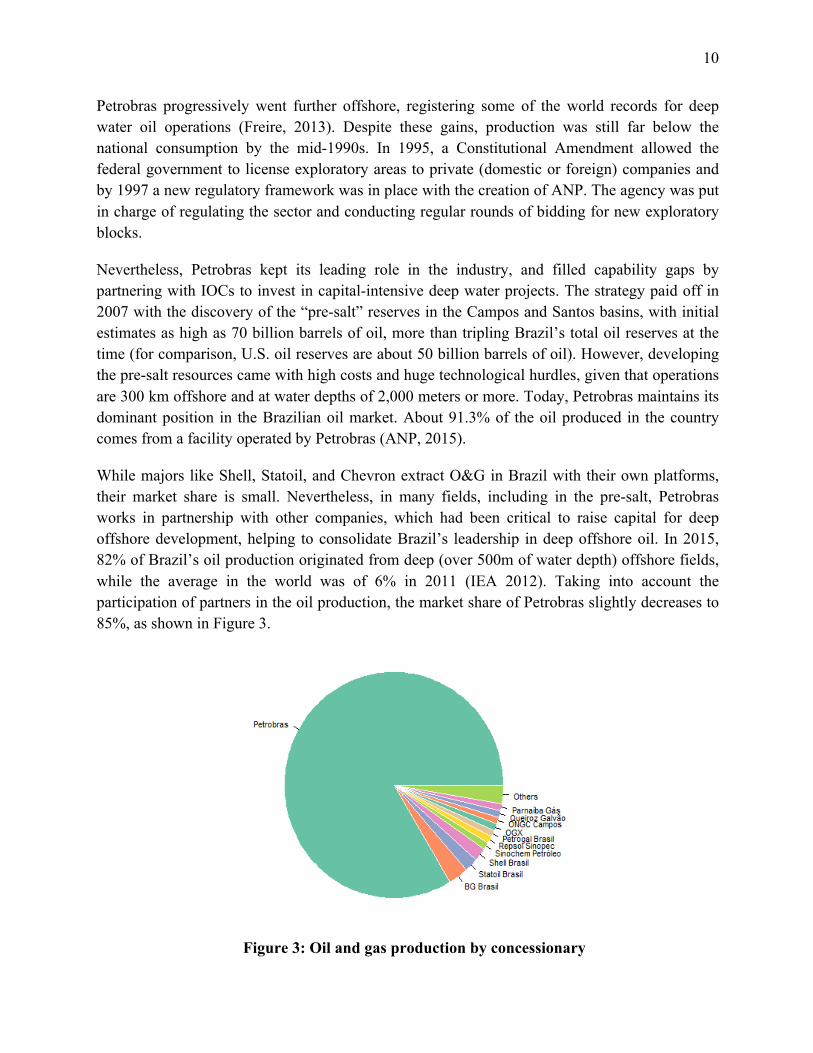
All oil concessionaries in Brazil that extract O&G from highly-productive fields (for which is charged a windfall profit) have to commit to invest 1% of the gross value of the oil production into R&D projects in the areas of oil, natural gas and biofuels. Up to half of that amount can be invested in internal R&D centers (such as Cenpes, for Petrobras) or by private partners with R&D operations in Brazil. The remaining has to go to nonprofit institutions, such as universities and research and technology organizations (RTOs), accredited by ANP.
Given Petrobras’ market share, it also leads in terms of R&D allocation following this regulatory clause. However, the trend has been of an increasing share of resources coming from other oil companies, particularly BG-Shell (UK), Statoil (NO), Repsol-Sinopec (ES-CH) and Sinochem (CH).
Figure 5: R&D contractual clause expenditures (1998-2015)
1998 1999 2000 2001 2002 2003 2004 2005 2006 2007 2008 2009 2010 2011 2012 2013 2014 2015
Others Petrobras
Source: ANP
In m
illio
n of
R$
020
040
060
080
010
0012
0014
00

13
In addition to R&D resources channeled to universities and RTOs, the growth of deep offshore oil production in Brazil and its technological challenges attracted in-house R&D centers of global suppliers, such as Schlumberger, GE O&G and FMC, particularly in the innovation cluster next to the campus of the Federal University of Rio de Janeiro (UFRJ). IEA (2013) calculated Brazil’s world market share of FPSOs as 21% and of subsea trees as of 37% – two critical inputs in the deep offshore segment. These numbers are expected to reach 26% and 44%, respectively, in 2020. Given this scale, proximity to the main client of deep offshore solutions, Petrobras, is a critical asset. R&D facilities located in Brazil have been used to develop global solutions relevant to the rest of the world. For instance, after the discovery of the pre-salt, there was a boom of patent fillings in Brazil by global oilfield service companies (Carvalheiro et al., 2014).
An issue of the R&D policies of the Brazilian O&G sector is that there is scarcely any link between earmarked funds for Brazilian universities and the broader supply chain. These resources have been instrumental for universities and human capital formation, but have so far failed to promote the competitiveness of the supply base. Government organizations such as the Brazilian Federal Innovation Agency (Finep) and the Brazilian National Development Bank (BNDES), through the Inova Petro program, have attempted to promote innovation in the supply chain, but the program so far failed to achieve its objectives. 3
2.2.2. Local content
Since the first round of bidding, ANP considered LC investments as criteria for selecting winners, along with signature bonus (cash payment) and a minimum exploratory program (how much investment the firm commits to do in the exploration phase, such as seismic acquisitions and drilling of wells). The weight of LC and how it is defined, however, changed over time. Starting in rounds 5 and 6 (2003-2004), LC became mandatory and from round 7 onwards a rigorous certification system was put in place, where items and sub-items had to be measured in their specific degree of national value added by third-party auditors accredited by ANP. An official ANP booklet describes the items and sub items and the minimum expected LC value for each. Penalties for not complying were also raised.
These changes were a result of learning by policymakers and pressure from suppliers interested in capturing a higher share of the growing investments of oil companies. On the learning side, for example, a maximum amount of LC was adopted after the government perceived that some companies were offering unrealistic LC estimates, giving them unfair advantage in the bidding
3 Interviews with João De Negri (10-15-2015), former director at FINEP, and André Pomeu and Ricardo Costa, O&G division of BNDES (02-12-2016).
14
round.4 The creation of a booklet and a certification system was also a way to more accurately estimate the real investments in LC. On the pressure side, the minimum share of domestic content in each item and sub item was set after consultation forums held by ANP with information provided by business organizations such as the Brazilian Machinery and Equipment Association (ABIMAQ), which had an interest in seeking higher targets that would benefit its members.5
The growth of oil production in Brazil would already have a natural, market-driven impact in increasing the demand for the domestic supply sector. With strong LC requirements in place, an even higher demand has been created. Oil companies started to face – particularly after Round 7 – significant penalties in case for not complying with the regulations. BNDES estimated that Brazil’s O&G industry’s gross fixed capital formation increased from 3.5% of the GDP in 2000 to 10% in 2013 (BNDES, 2014) and remains the leading sector for new industrial investment even at the current period of low oil prices.6
In order to support the growth of the O&G industry and help to meet the LC targets, the government and Petrobras established the National Oil and Natural Gas Industry Mobilization Program (Prominp) in 2003. Prominp provides a coordinating function by fostering discussions among the main stakeholders of the O&G industry that identify bottlenecks and measures that could enhance the capacity and competitiveness of the industry based in Brazil. Through Prominp and other initiatives, Petrobras went above and beyond the use of LC to meet its regulatory obligation and started to heavily promote the expansion of the domestic supply base, often driven by political pressures, as the company itself has recognized (Petrobras, 2013, p.18). One of the key sectors incentivized by Prominp and other government initiatives was the shipbuilding industry, particularly shipyards with dry docks for the production of tankers and other vessels for use in offshore oil production.
2.3. The shipbuilding industry
This section examines how the high capital investments required to develop an offshore oil industry can be leveraged for active industrial policies, through the example of Brazil’s shipbuilding industry. Government activism was responsible for mobilizing public and private capital for new investments in this sector, but so far, the industry has been unable to become internationally competitive. In fact, low productivity levels coupled with a reduction in domestic demand due to low oil prices may put the future of this industry at risk.
4 Interview with Marco Antônio Almeida, Secretary of Oil, Natural Gas and Renewable Fuels, Ministry of Mines and Energy (MME)(08-07-2014). 5 Interview with Alberto Machado Neto (Abimaq)(01-27-2016). 6 Interviews with André Pompeu and Ricardo Costa, O&G department of BNDES (02-12-2016).

15
About 90% of Brazil’s oil production comes from offshore operations. Offshore drilling rigs to locate reserves, semi-submersible platforms or FPSOs to produce O&G, tankers to transport production, and platform supply vessels (PSVs) to support offshore platforms with equipment and cargo, comprise only a portion of the goods used in these activities. All of them are assembled in shipyards where the main processes are the cutting and welding of steel plates and installation of modules and equipment following carefully specified engineering plans.
The Brazilian government’s ambitious policy to the Brazilian naval industry stemmed from a combination of factors. These included a new political administration led by the Worker’s Party (PT) with strong preference for industrial policies, a rising local demand for ships and platforms due to the growth of the offshore oil industry, and the pre-existing availability of funding and regulatory instruments to support the industry. Furthermore, shipyards are labor-abundant operations, generating thousands of jobs, a politically important factor. Finally, as was later revealed by the Carwash operation of the federal police starting in 2014, suppliers of Petrobras paid bribes to political parties of the then ruling coalition and helped to fund electoral campaigns (Netto 2016).
That combination led policymakers to devise incentives to update existing shipyards and attract big Brazilian business groups (like Queiroz Galvão, Camargo Corrêa, Odebrecht), along with international technology partners (IHI, Daewoo, Kawasaki, etc.), to invest in new facilities. This included subsidized funding from the Marine Merchant Fund and guaranteed orders from Petrobras. In addition, oil concessionaries were subject to fines if they did not use Brazilian shipyards in their projects. Petrobras actively participated in sponsoring new shipyards by devising a specific program to renew its fleet of oil tankers through the Fleet Modernization and Expansion Program (Promef) (Petrobras, 2013). It also supported the creation of Sete Brasil, a company built in 2010 with public and private money with the goal of developing Brazilian suppliers of the very expensive deep offshore drilling rigs.
Promef was designed by Petrobras to replace its old leased fleet of tankers with a new fleet that would be built to current standards (double-hulled) in Brazilian shipyards, with a minimum local content of 65%. The rationale was that procuring a package of 49 new ships would provide enough scale to interest Brazilian firms in investing in the sector. The program recognized that the first ships would have higher than prevailing international prices and longer delivery times, but the assumption was that by the end of the process the local shipyards would have moved along a learning curve that would put them on equal footing with foreign suppliers. Similarly, Sete Brasil planned to build in Brazil a package of 29 drilling rigs. At the time the program was conceived, lease prices for drilling rigs were at record levels, at about US$500,000 per day, and at such high prices new entrants could be attracted to the market. It was estimated that the construction would require investments of US$26 billion, generating up to 120 thousand direct
16
and indirect jobs.7 The perspective of becoming a supplier for Promef and Sete Brasil led to rounds of investments in shipyard capacity.
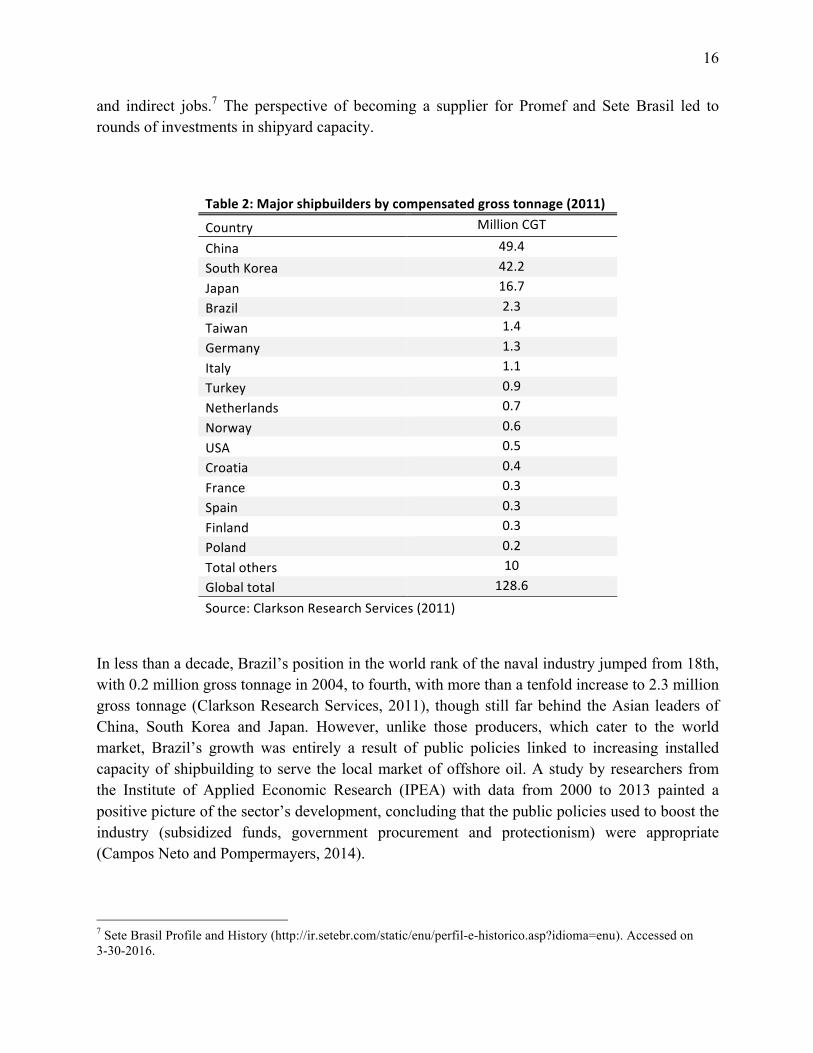
Table2:Majorshipbuildersbycompensatedgrosstonnage(2011)
Country MillionCGT
China 49.4SouthKorea 42.2Japan 16.7Brazil 2.3Taiwan 1.4Germany 1.3Italy 1.1Turkey 0.9Netherlands 0.7Norway 0.6USA 0.5Croatia 0.4France 0.3Spain 0.3Finland 0.3Poland 0.2Totalothers 10Globaltotal 128.6Source:ClarksonResearchServices(2011)
In less than a decade, Brazil’s position in the world rank of the naval industry jumped from 18th, with 0.2 million gross tonnage in 2004, to fourth, with more than a tenfold increase to 2.3 million gross tonnage (Clarkson Research Services, 2011), though still far behind the Asian leaders of China, South Korea and Japan. However, unlike those producers, which cater to the world market, Brazil’s growth was entirely a result of public policies linked to increasing installed capacity of shipbuilding to serve the local market of offshore oil. A study by researchers from the Institute of Applied Economic Research (IPEA) with data from 2000 to 2013 painted a positive picture of the sector’s development, concluding that the public policies used to boost the industry (subsidized funds, government procurement and protectionism) were appropriate (Campos Neto and Pompermayers, 2014).
7 Sete Brasil Profile and History (http://ir.setebr.com/static/enu/perfil-e-historico.asp?idioma=enu). Accessed on 3-30-2016.
17
However, the domestic foundations through which the naval industry were built started to crack by 2014. First, the drastic fall of the oil price in mid-2014 led to a global reduction of investments in the O&G sector. Second, Petrobras was already engulfed with corruption investigations (from the Carwash scandal, see Netto 2016) that would tarnish its reputation and credit rating, increasing its financial pressures. Both an exogenous shock (low oil prices) as well as domestic issues (management problems at Petrobras) affected the efforts to rebuild a domestic shipyard industry.
In point of fact, even before the 2014 crisis it was clear that Brazilian shipyards were underperforming. One indication was that Petrobras faced considerable delays from local shipyards (Campos Neto, 2014), affecting its production curve. To speed up deliveries, Petrobras developed a program to monitor shipyards closely, and encouraged measures to increase productivity and improve engineering and management practices (Pires et al., 2013). When these corrective measures were insufficient, Petrobras cancelled orders from local shipyards and turned instead to Chinese suppliers. Even shipyards that previously paid bribes ended up losing contracts (Lima-de-Oliveira 2015).
More evidence that the domestic naval industry was facing severe productivity challenges can be found in an audit report (TC 025.692/2013-5) produced by the Federal Audit Court (TCU) on Promef. The report revealed productivity levels way below what was assumed in the contracts between Petrobras and shipyards. For instance, the EAS shipyard, the biggest in the country, was built only after winning an order from Promef to deliver ten “Suezmax” ships (the firm later also got other contracts for Petrobras and Sete Brasil). However, the first Suezmax was delayed by 623 days. Because of the sequential nature of construction, the delay in the first ship affected the production of the remaining ones, although not by the same extent. Productivity levels measured as output per labor hour of the first two Suezmax at EAS were a third of what was specified in the contract. More generally, Silva (2014) shows that the worker productivity in Brazilian shipyards are half of China’s and one eighth of Korea’s, and estimates 36% cost disadvantage, on average, of producing oil tankers in Brazil.
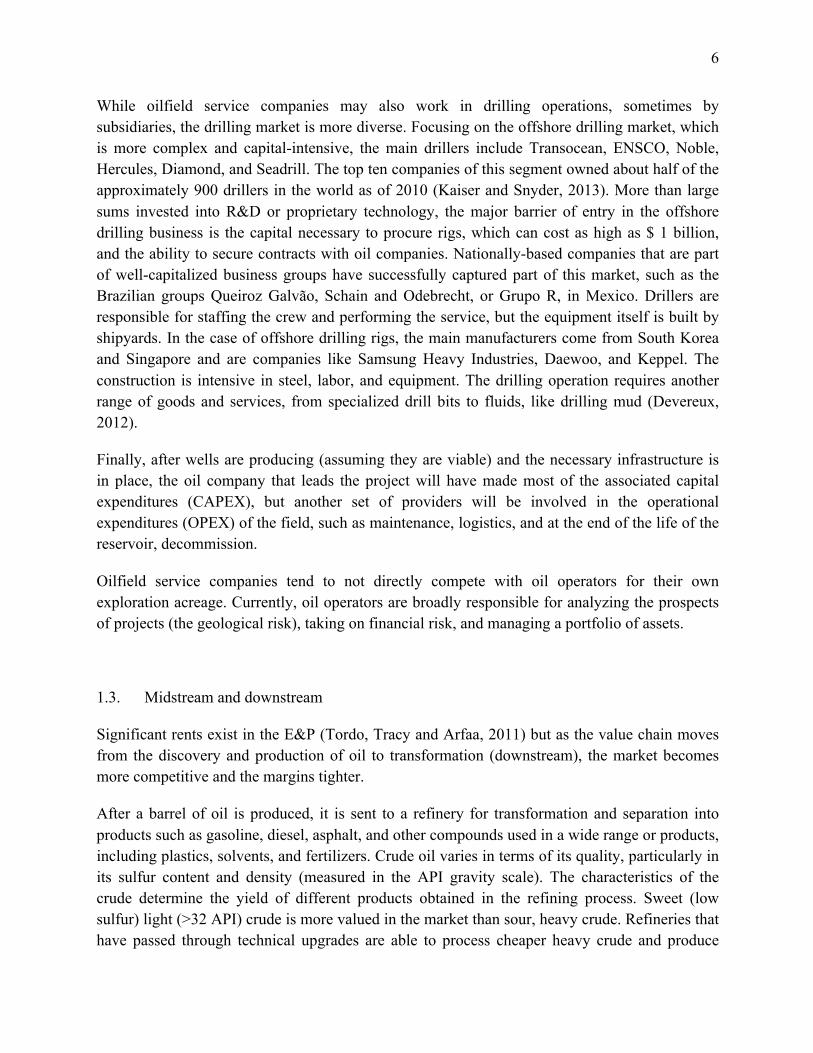
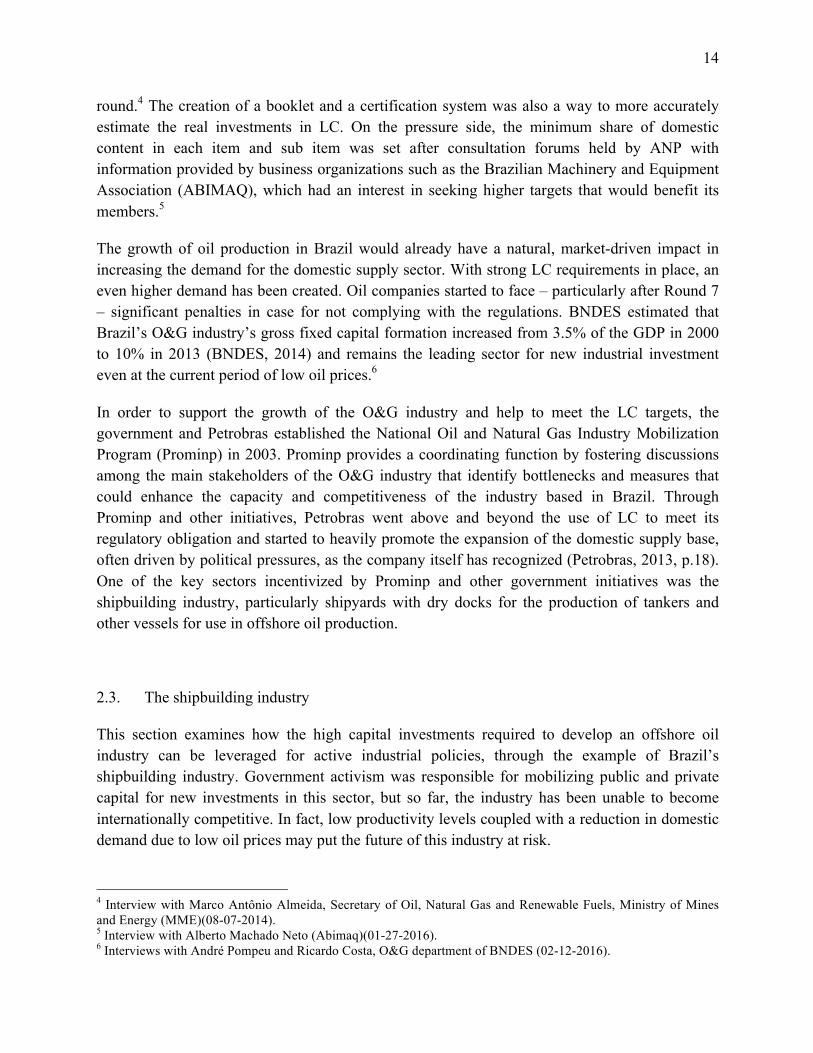
The commodities crisis and cancellations of domestic projects has made this situation worse. Data from the association of the naval industry, Sinaval, shows that employment levels in the sector had boomed from 2004 to 2014, but began falling in 2015. The current perspective is negative as Petrobras delayed or cancelled projects. As the price of capital goods in the O&G industry plummeted after 2014 (as shown in Figure 2) due to reduced international demand leaving many equipment idle, the cost of opportunity for building in Brazil increased. The future of Sete Brasil, for instance, is uncertain and plans for survival, at the very least, call for a much leaner structure. As the time of this writing, the company has defaulted in its payments to lenders and to the shipyards that started the construction of the rigs, leading them to fire employees working on current orders (see Figure 6).

18
Figure 6: Direct employment in shipyards in Brazil (2004-2015)
Interviews with industry experts suggest that the future of the naval manufacturing in Brazil might be a more focused industry. For example, local production and integration of “topsides” – customized modules that go on top of the hull of a platform – for offshore structures is more competitive than the more commoditized hull construction. Adjustment of contractual incentives can also explain variation on performance levels.8
Besides worker productivity levels, another challenge faced by the Brazilian naval industry is overinvestment and the decentralized way that the industrial park was built. There are now large shipyards across the coast of Brazil: from Pernambuco, in the northeast, to Rio Grande do Sul, in the south. Such fragmentation undermines benefit from economies of agglomeration, including cluster effects and spillovers in institutions (e.g. training), labor markets and upstream supply and service industries.9 Fragmentation is mainly a function of the political payoffs to states that attracted these labor-intensive investments – another case where political incentives conflict with economic efficiency.
Despite the strong political drive to develop the naval industry in Brazil, there is no government bailout on the horizon for the current projects as they face huge losses from cancelled contracts and an inability to deliver goods on time. The financial disclosures of the EAS from 2007 to 2015 show that the company has already lost over a USD$1 billion and the controlling
8 For instance, the BRASA shipyard has a good track record of integrating and producing FPSO modules in part because of its close relationship with the Dutch company SBM, which owns 50% of the firm. SBM was hired by Petrobras to operate platforms under the condition of fulfilling a minimum local content. SBM then invested in the Brasa shipyard, transferred technology and made sure the good were delivered on time, so it could start operating the platforms and receive prompt payments from Petrobras. 9 Incentives for cluster formation as a competitive tool is also one of the key suggestions made by IBP (2015).
2004 2005 2006 2007 2008 2009 2010 2011 2012 2013 2014 2015
Source: Sinaval 2016Year
Tota
l dire
ct e
mpl
oym
ent
020
000
4000
060
000
8000
0

19
shareholders (the big Brazilian business groups Queiroz Galvão and Camargo Corrêa) have so far covered the losses with direct injection of new capital.10 The current management team has adopted lean manufacturing principles and is betting on achieving productive gains to reverse the losses.
Because large sums of monetary and human capital have already been mobilized in new operations throughout the country, and with the government legally and financially unable to provide bailouts, the naval industry will need to quickly react to changes and become more internationally competitive to survive a moment of low oil prices and a demand lower than expected for the coming years in Brazil. Dramatic write-offs and consolidation appears inevitable, however.
2.4. How global is the Brazilian O&G sector?
Despite Brazil’s surging production, the country is still not an energy exporter. Trade balance data of 27 different product codes related to crude oil, natural gas, oil products, and base petrochemicals reveals a deficit of over $ 11 billion in 2013 and $ 8 billion in 2014 (see Table 3). On the other hand, numbers from 17 different O&G upstream equipment, such as production platform and drill pipes, reveals a mostly positive trade balance, with a surplus of over $ 7 billion in 2013.
Table 2: Brazil’s trade balance in the O&G industry (in thousand R$)
Sub-sector 2010 2011 2012 2013 2014 O&G upstream equipment
-$119,778 $1,034,182 $682,412 $7,268,156 -$257,988
Crude and products
$1,097,032 $2,011,707 $376,965 -$11,881,699 -$8,111,205
Source: UN Comtrade
The growth of demand, LCRs and active efforts of all government levels to attract foreign suppliers have driven foreign direct investment (FDI) in Brazil’s O&G sector during the last decade. Many “global suppliers” (Sturgeon and Lester, 2004), particularly those with strong presence in the subsea segment such as FMC (USA), Technip (France), Vallourec (France) and 10 The biggest loss was registered in 2011, of USD $787 million, while in 2015 the negative result was of $ 97 million. EAS has faced many issues during its first years of operation including delays on the import of a large crane from China due to a supplier’s fault, low productivity of welders, and change of technological partner from Samsung to IHI.
20
GE O&G (USA), have manufacturing facilities in Brazil. They were attracted to the country by the demand of the local market and policy incentives. However, are they using Brazil as an export platform of O&G equipment?
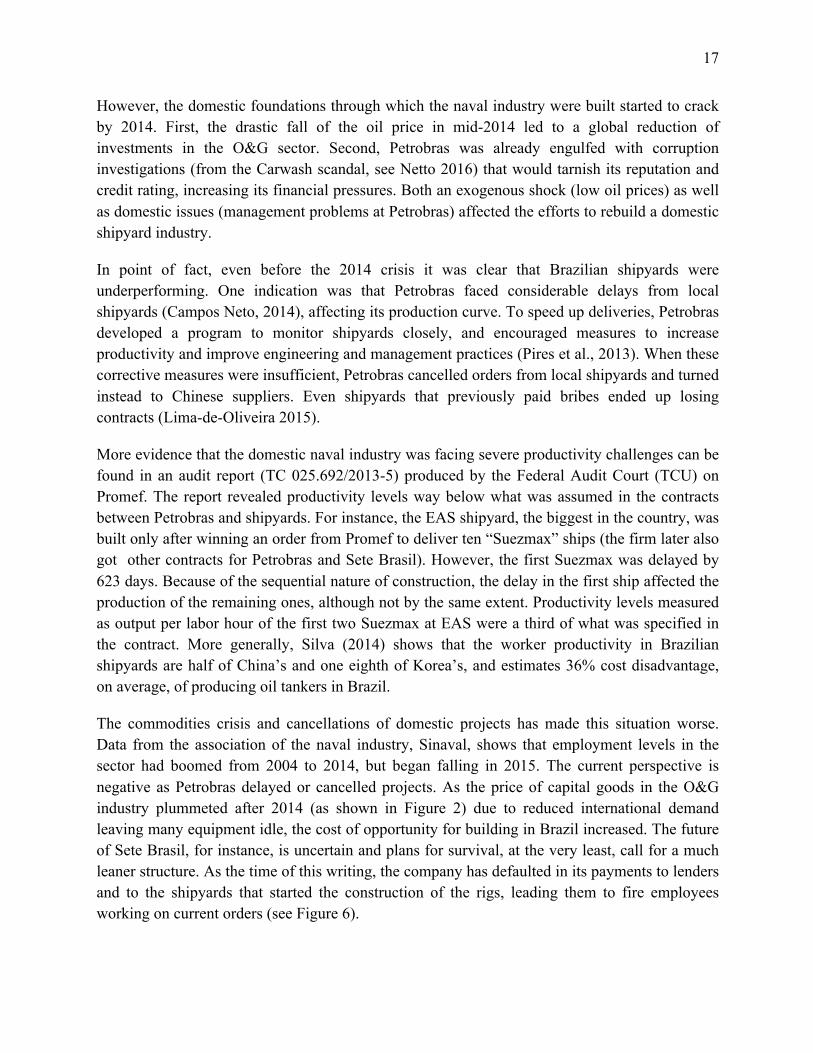
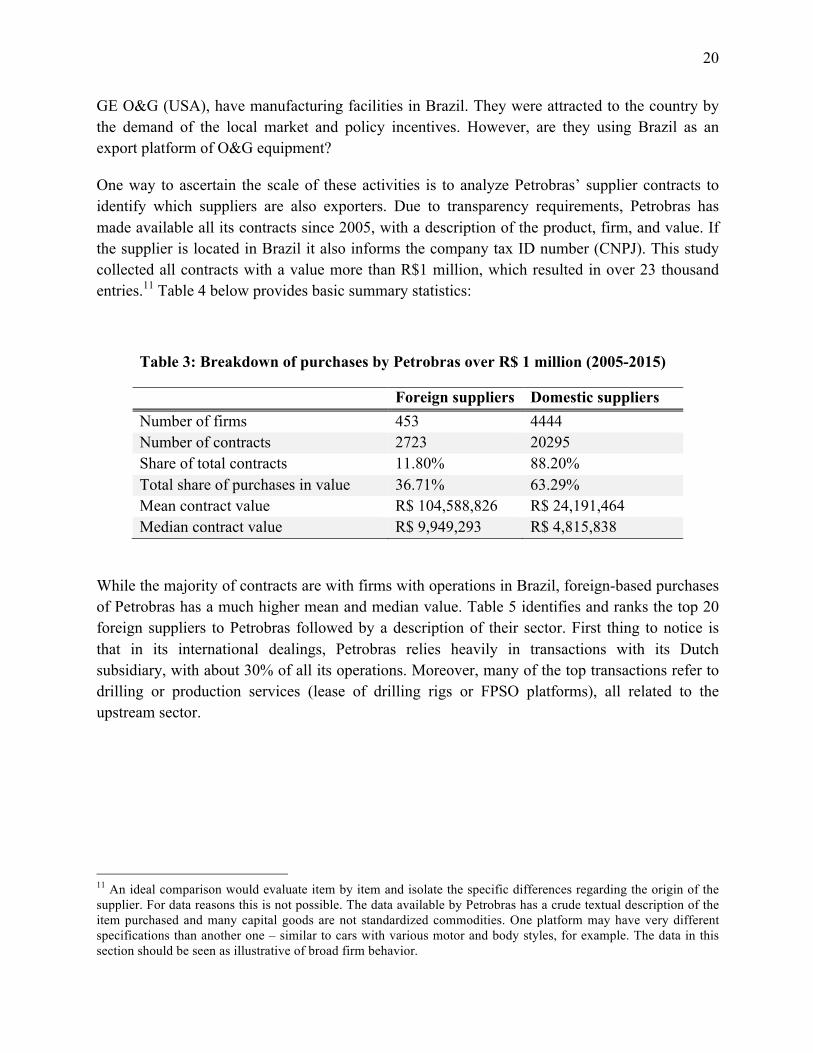
One way to ascertain the scale of these activities is to analyze Petrobras’ supplier contracts to identify which suppliers are also exporters. Due to transparency requirements, Petrobras has made available all its contracts since 2005, with a description of the product, firm, and value. If the supplier is located in Brazil it also informs the company tax ID number (CNPJ). This study collected all contracts with a value more than R$1 million, which resulted in over 23 thousand entries.11 Table 4 below provides basic summary statistics:
Table 3: Breakdown of purchases by Petrobras over R$ 1 million (2005-2015)
Foreign suppliers Domestic suppliers Number of firms 453 4444 Number of contracts 2723 20295 Share of total contracts 11.80% 88.20% Total share of purchases in value 36.71% 63.29% Mean contract value R$ 104,588,826 R$ 24,191,464 Median contract value R$ 9,949,293 R$ 4,815,838
While the majority of contracts are with firms with operations in Brazil, foreign-based purchases of Petrobras has a much higher mean and median value. Table 5 identifies and ranks the top 20 foreign suppliers to Petrobras followed by a description of their sector. First thing to notice is that in its international dealings, Petrobras relies heavily in transactions with its Dutch subsidiary, with about 30% of all its operations. Moreover, many of the top transactions refer to drilling or production services (lease of drilling rigs or FPSO platforms), all related to the upstream sector.
11 An ideal comparison would evaluate item by item and isolate the specific differences regarding the origin of the supplier. For data reasons this is not possible. The data available by Petrobras has a crude textual description of the item purchased and many capital goods are not standardized commodities. One platform may have very different specifications than another one – similar to cars with various motor and body styles, for example. The data in this section should be seen as illustrative of broad firm behavior.

21
Table 4: Top foreign-based suppliers to Petrobras
Rank Company name Activity/Sector Share in value
1 Petrobras Netherlands B.V. Subsidiary 29.788% 2 Tupi B.V. Production platforms 5.994% 3 Arpoador Drilling B.V. Drilling rig/services 2.963% 4 Diamond Offshore Netherlands B.V. Drilling rig/services 2.608%
5 Southern Schlumberger S.A. Oilfield equipment and services 2.506%
6 Transocean UK Limited Drilling rig/services 2.248% 7 Subsea 7 International Offshore support operations 2.054% 8 Pride Foramer S.A.S. Drilling rig/services 1.977% 9 ODN I GMBH Drilling rig/services 1.976% 10 Paragon Offshore (Nederland) B.V Drilling rig/services 1.917%
11 Halliburton Energy Services Inc. Oilfield equipment and services 1.531%
12 Hibernia Marine C.V. Drilling rig/services 1.513% 13 Guara B.V. Production platforms 1.365%
14 Baker Hughes Nederlands B.V. Oilfield equipment and services 1.176%
15 SBM Espírito do Mar B.V Production platforms 1.148% 16 Dleif Drilling L.L.C. Drilling rig/services 1.126% 17 SBM Baleia Azul S.A.R.L. Production platforms 1.120% 18 Etesco Drilling Services, LLC Drilling rig/services 1.093% 19 Commodore Marine LLP Drilling rig/services 1.055% 20 Allseas Marine Contractors S.A. Offshore support operations 1.027%
Transactions in the domestic market are less concentrated and the company that ranks highest captures less than 5% of the total local expenditures. The type of goods and services is also markedly different, with suppliers of equipment (such as Vallourec, Confab, GE Oil & Gas), oilfield services (Schlumberger, Halliburton, Baker, Odebrecht O&G), electrical energy, and logistic support, such as helicopter transportation (Omni, Líder) and supply vessels for offshore platforms (Bram). The vast majority are local subsidiaries of global suppliers.

22
Table 6: Top 20 Brazilian-based suppliers to Petrobras
Rank Company name Activity/Sector Domestic capital
Share in value
1 Vallourec Tubos do Brasil S.A. Special pipes No 4.587% 2 Petrobras Distribuidora S.A. Subsidiary Yes 2.923% 3 Confab Industrial Sociedade Anônima Pipes No 2.766%
4 Schlumberger Serviços de Petróleo Oilfield equipment and services No 2.202%
5 Halliburton Serviços LTDA Oilfield equipment and services No 2.128%
6 Bram Offshore Transportes Marítimos Logistic support No 1.300% 7 Baixada Santista Energia S.A. Electrical energy Yes 1.156% 8 Petrobras Logística de Exploração Subsidiary Yes 1.155%
9 Baker Hughes do Brasil LTDA Oilfield equipment and services No 1.084%
10 Weatherford Indústria e Comércio Oilfield equipment and services No 1.074%
11 UTC Engenharia S/A EPC contractor Yes 0.995%
12 Odebrecht Óleo e Gás S/A Oilfield equipment and services Yes 0.967%
13 BJ Services do Brasil LTDA Oilfield equipment and services No 0.960%
14 Omni Táxi Aéreo S/A Logistic support No 0.885% 15 Fábrica Carioca de Catalisadores Chemical products Yes 0.869% 16 Líder Táxi Aéreo S/A - Air Brasil Logistic support Yes 0.858%
17 Subsea7 do Brasil Servicos LTDA Oilfield equipment and services No 0.846%
18 GE Oil & Gas do Brasil LTDA Oilfield equipment and services No 0.818%
19 Consórcio Tuc Construções Refinery and petrochemical (Comperj) Yes 0.793%
20 Norskan Offshore Limitada Logistic support No 0.716%
Next, I selected firms which operate in Brazil and were suppliers to Petrobras and matched their tax ID with trade data from the Secretariat of Foreign Trade (SECEX), part of the Ministry of Development, Industry and Foreign Trade. The result reveals that exporters won more and larger contracts with Petrobras than non-exporters.

23
Table 5: Contracts of Petrobras with companies located in Brazil
Exporters Non-exporters Number of firms 983 3461 Number of contracts 7173 13122 Share of contracts 42.45% 57.55% Total share of purchases in value 52.00% 48.00% Mean contract R$ 29,653,469 R$ 20,164,392 Median contract R$ 5,138,205 R$ 4,645,261
A caveat is that a tax-benefit program called Repetro can count local sales as exports, thus making export data an unreliable indicator. For instance, through Repetro, when goods are sold to oil companies operating in Brazil, they can be considered exports, although the good does not physically leave the country (it is an export on paper only). In addition, an oil company can use the good in a “temporary admission” status, without paying import duties. For example, a Brazilian shipyard that builds an oil platform will “export” the final product on paper to a foreign entity, such as Petrobras Netherlands. Then, Petrobras Brazil will “import” the platform without paying import taxes in a regime of “temporary admission”, as a lease. It will count in the trade statistics as an export from Brazil – with the full value of the good – and a service import at its use value (i.e., the value of the lease).
By registering the good as an export, Brazilian manufacturers are relieved of paying the taxes that accrue to domestic sales, such as the industrial production tax. Repetro provides a tax benefit for Brazilian-based manufacturers by putting them on more competitive footing with producers abroad, but has the side effect of distorting trade statistics. As a result, trade data is a poor indicator of the performance of Brazilian firms in the O&G supply chain.
To sum up, export data is inflated, and cannot identify which companies are truly selling to customers abroad and which are selling to domestic customers, such as Petrobras that is compelled to buy locally to comply with LCR. Individual interviews with company executives revealed a limited number of true exports from Brazil, such as “wet Christmas trees,” a subsea equipment, produced by, for instance, FMC Technologies in Brazil. In general, industry stakeholders, including executives outside Brazil, agree that the Brazilian O&G supply base has
24
been built to serve the domestic market and currently does not seek markets outside of the country. In other countries, an international orientation has been more present.12
2.5. The impact of LCR
Oil operators can request waivers from ANP to relieve their local content obligation if they provide evidence of excessive prices or delivery times in the local market compared to imports. A waiver can also be granted if the operator wants to adopt a new technological solution to which there is no domestic equivalent.13
Import requests provide a hint on what goods and services oil operators consider more competitive to import than contract in Brazil. As a way to overcome the distortions in the trade microdata, Brazil’s Freedom of Information Law was used to obtain from ANP the number of waivers and the goods requested by oil operators for permission to import without incurring in LC penalties.
According to ANP, operators made 172 requests for waivers, of which 40 were not considered because they were made after the exploration phase was concluded. A total of 132 requests are still pending analysis. The majority (126) of the requests is for blocks undergoing exploration phase and only six in the development stage. The bulk of the requests are for offshore blocks: 105 versus 21 for onshore. Only one request has been authorized by the agency at the time of this writing – a purchase of casing tubes by Statoil where the Norwegian operator proved that the local offer was 43% above the international price.14
12 For example, in 2011 Shell selected Mexico as a site for Strategic Sourcing Development for its global operations. The Mexican procurement office is responsible for identifying, certifying, and supporting companies based in Mexico to become suppliers to Shell’s activities in export markets including Argentina, Colombia, Canada and the USA. Brazil was not chosen because the oil company concluded that the Brazilian O&G industrial park was built to serve Brazil and was not competitive worldwide. 13 However, even when waivers are granted, companies must find substitute local content in order to meet overall (“global”) local content targets. 14 The decision was approved by the board of ANP (Board Resolution nº 1008/2015) on December 9, 2015, and refers to the offshore block C-M-529.
25
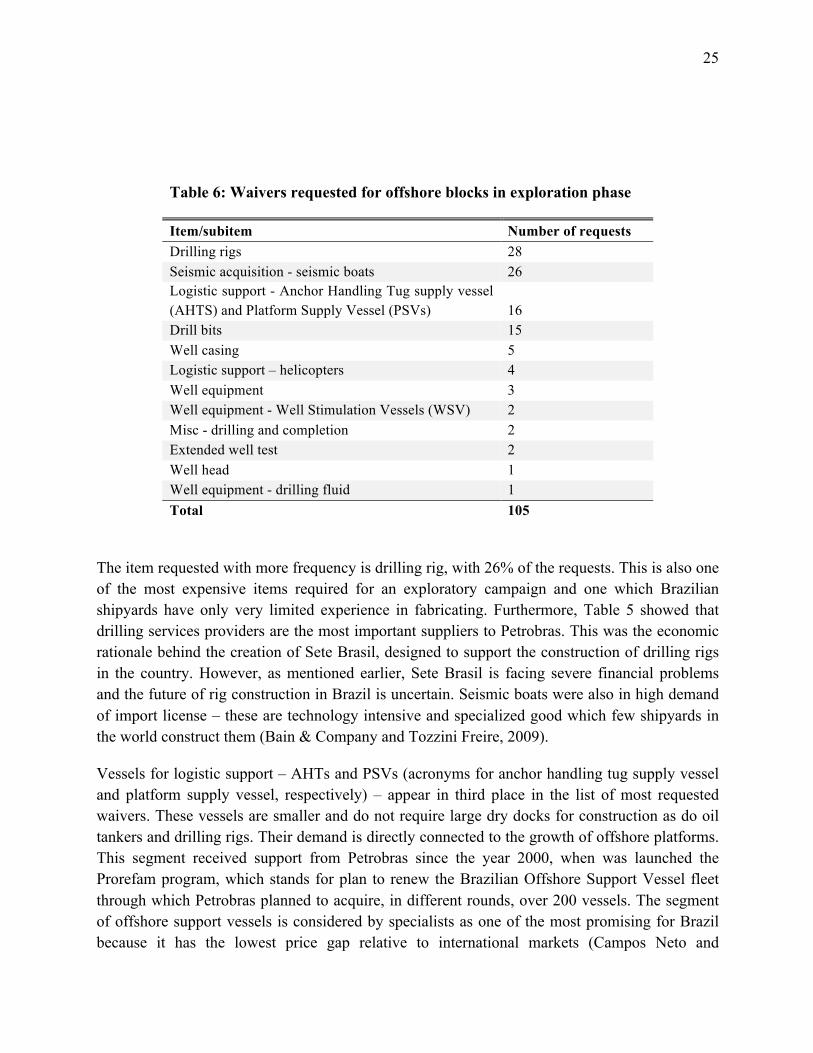
Table 6: Waivers requested for offshore blocks in exploration phase
Item/subitem Number of requests Drilling rigs 28 Seismic acquisition - seismic boats 26 Logistic support - Anchor Handling Tug supply vessel (AHTS) and Platform Supply Vessel (PSVs) 16 Drill bits 15 Well casing 5 Logistic support – helicopters 4 Well equipment 3 Well equipment - Well Stimulation Vessels (WSV) 2 Misc - drilling and completion 2 Extended well test 2 Well head 1 Well equipment - drilling fluid 1 Total 105
The item requested with more frequency is drilling rig, with 26% of the requests. This is also one of the most expensive items required for an exploratory campaign and one which Brazilian shipyards have only very limited experience in fabricating. Furthermore, Table 5 showed that drilling services providers are the most important suppliers to Petrobras. This was the economic rationale behind the creation of Sete Brasil, designed to support the construction of drilling rigs in the country. However, as mentioned earlier, Sete Brasil is facing severe financial problems and the future of rig construction in Brazil is uncertain. Seismic boats were also in high demand of import license – these are technology intensive and specialized good which few shipyards in the world construct them (Bain & Company and Tozzini Freire, 2009).
Vessels for logistic support – AHTs and PSVs (acronyms for anchor handling tug supply vessel and platform supply vessel, respectively) – appear in third place in the list of most requested waivers. These vessels are smaller and do not require large dry docks for construction as do oil tankers and drilling rigs. Their demand is directly connected to the growth of offshore platforms. This segment received support from Petrobras since the year 2000, when was launched the Prorefam program, which stands for plan to renew the Brazilian Offshore Support Vessel fleet through which Petrobras planned to acquire, in different rounds, over 200 vessels. The segment of offshore support vessels is considered by specialists as one of the most promising for Brazil because it has the lowest price gap relative to international markets (Campos Neto and
26
Pompermeyer, 2014). However, at the peak of the demand in Brazil, local shipyards were charging high prices for new orders.
In summary, the list of waivers reveals equipment for which the Brazilian industry has scarcely any capacity to produce, such as drilling rigs, as well to others for which domestic suppliers exist but charge high prices.
2.6. Local content enforcement
This section examines a critical part of the regulatory feature of the Brazilian O&G industry: the enforcement of LC targets through audits made by ANP. LC rules have changed over time, becoming stricter in response to electoral incentives, pressures from business associations (such as Sinaval and Abimaq), and a federal government and its NOC willing to use the growth of the oil sector for industrial policies (Almeida, Lima-de-Oliveira and Schneider, 2014).
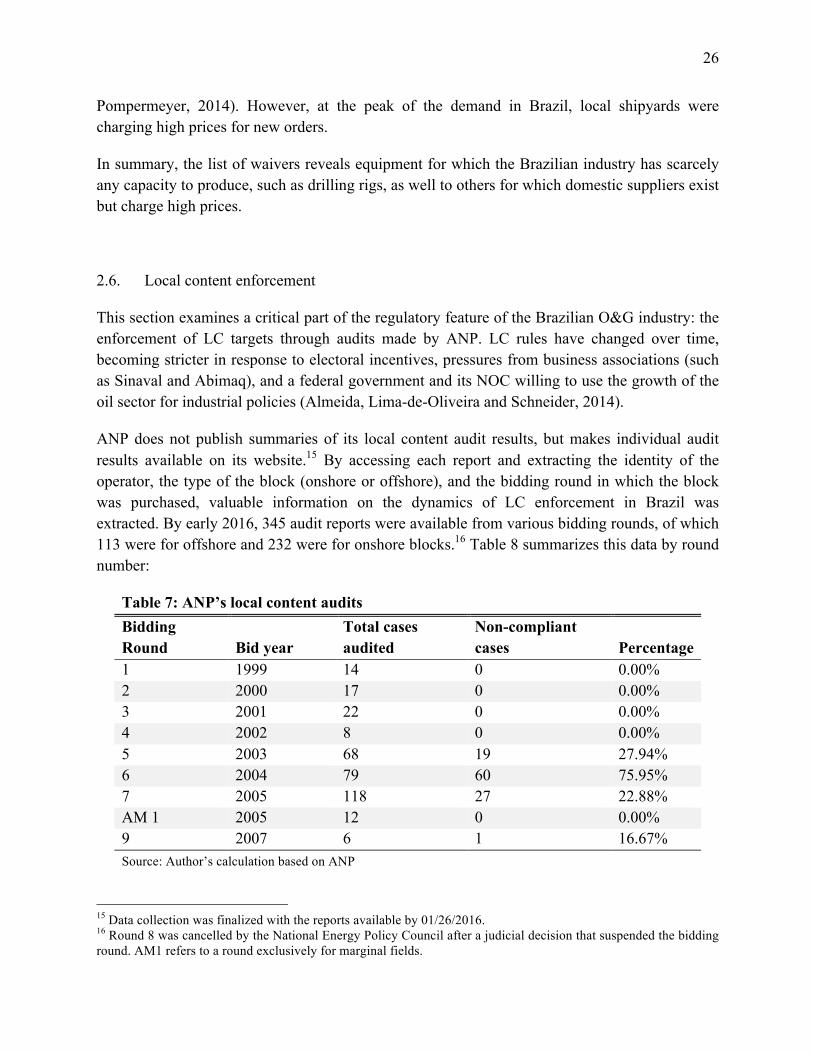
ANP does not publish summaries of its local content audit results, but makes individual audit results available on its website.15 By accessing each report and extracting the identity of the operator, the type of the block (onshore or offshore), and the bidding round in which the block was purchased, valuable information on the dynamics of LC enforcement in Brazil was extracted. By early 2016, 345 audit reports were available from various bidding rounds, of which 113 were for offshore and 232 were for onshore blocks.16 Table 8 summarizes this data by round number:
Table 7: ANP’s local content audits
Bidding Round Bid year
Total cases audited
Non-compliant cases Percentage
1 1999 14 0 0.00% 2 2000 17 0 0.00% 3 2001 22 0 0.00% 4 2002 8 0 0.00% 5 2003 68 19 27.94% 6 2004 79 60 75.95% 7 2005 118 27 22.88% AM 1 2005 12 0 0.00% 9 2007 6 1 16.67% Source: Author’s calculation based on ANP
15 Data collection was finalized with the reports available by 01/26/2016. 16 Round 8 was cancelled by the National Energy Policy Council after a judicial decision that suspended the bidding round. AM1 refers to a round exclusively for marginal fields.
27
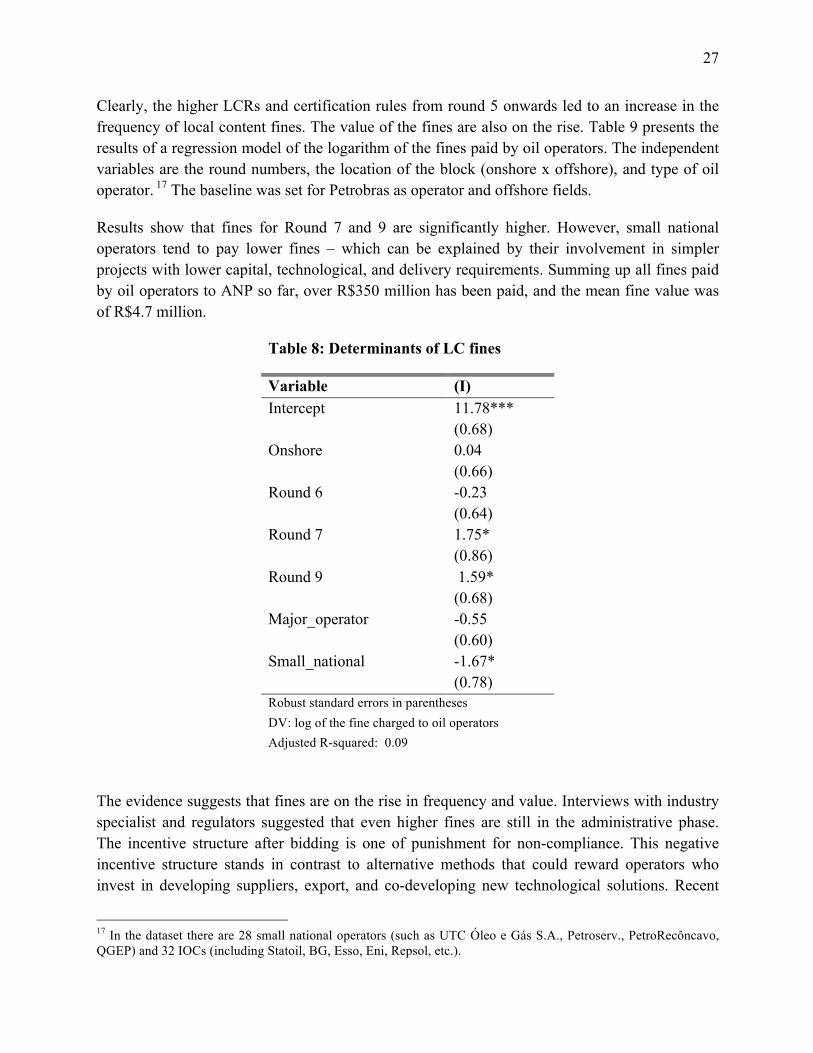
Clearly, the higher LCRs and certification rules from round 5 onwards led to an increase in the frequency of local content fines. The value of the fines are also on the rise. Table 9 presents the results of a regression model of the logarithm of the fines paid by oil operators. The independent variables are the round numbers, the location of the block (onshore x offshore), and type of oil operator. 17 The baseline was set for Petrobras as operator and offshore fields.
Results show that fines for Round 7 and 9 are significantly higher. However, small national operators tend to pay lower fines – which can be explained by their involvement in simpler projects with lower capital, technological, and delivery requirements. Summing up all fines paid by oil operators to ANP so far, over R$350 million has been paid, and the mean fine value was of R$4.7 million.
Table 8: Determinants of LC fines
Variable (I) Intercept 11.78***
(0.68)
Onshore 0.04
(0.66)
Round 6 -0.23
(0.64)
Round 7 1.75*
(0.86)
Round 9 1.59*
(0.68)
Major_operator -0.55
(0.60)
Small_national -1.67* (0.78) Robust standard errors in parentheses DV: log of the fine charged to oil operators Adjusted R-squared: 0.09
The evidence suggests that fines are on the rise in frequency and value. Interviews with industry specialist and regulators suggested that even higher fines are still in the administrative phase. The incentive structure after bidding is one of punishment for non-compliance. This negative incentive structure stands in contrast to alternative methods that could reward operators who invest in developing suppliers, export, and co-developing new technological solutions. Recent
17 In the dataset there are 28 small national operators (such as UTC Óleo e Gás S.A., Petroserv., PetroRecôncavo, QGEP) and 32 IOCs (including Statoil, BG, Esso, Eni, Repsol, etc.).

28
changes (Decree N. 8637/2016), still under implementation, intend to increase the competitiveness of the oil industry by measures that includes a reform of LC regulations. Some of the proposed measures aim to better regulate the instrument of waivers (clearing the backlog of requests to ANP), support the establishment of new suppliers and new productive capacity, and to promote exports through offset of LC requirements when an operator purchases goods for use in their operations outside Brazil.
This part analyzed the growth of the oil industry in Brazil and governmental policies designed to maximize industrial and innovation linkages through mandatory R&D funding and local content obligations. The policies produced a mixed result, particularly for the capital goods sector. While there has been a substantial attraction of foreign suppliers to Brazil and an increased productive capacity, such as was the case in the shipbuilding industry, the industry suffers from an inward-looking bias and lack of international competitiveness. Data from waiver requests and fines paid show that local content requirements were set at levels beyond what the industry has been able to supply in terms of cost and delivery time.
3. Conclusion
This paper characterized the value chain of the contemporary O&G industry in its upstream, midstream and downstream segments, and argued that the most significant rents exist in the upstream. For the production of more challenging resources, such as deep offshore and unconventionals, more capital expenditures are necessary and the overall costs associated with producing O&G rise. This also increases demand for technological solutions that both enable production at the frontier and reduce production costs.
Because governments have ownership of subsoil rights (except in the United States, where property owners do), they determine where and under what conditions companies can develop and exploit natural resources. One of these conditions is to impose minimum LC requirements in projects, both in the investment and operation phases. In the case of Brazil, regulatory provisions also earmarked oil rents to R&D investments. The Brazilian industry has benefited from the growth of production from the capital- and technology-intensive offshore reservoirs and LC regulations have driven substantial foreign investment. As a result, the O&G industry has increased its share in Brazil’s gross fixed capital formation from 3.5% of the GDP in the year 2000 to 10% in 2013 (BNDES, 2014).
Despite these developments, significant competitive challenges remain which need to be tackled to guarantee the sustainability and future growth of this important economic sector in Brazil.
First, the industry has an inward-looking bias. At a moment when growth has slowed due to management problems at Petrobras and low oil prices, this bias makes the local industry

29
extremely vulnerable. In terms of oil production, Petrobras keeps a market-share of 85%, despite inroads made by majors such as BG-Shell and Chevron. Global suppliers who brought their manufacturing to Brazil are mostly serving the domestic market and not using Brazil as an export platform. Brazilian companies, including new shipyards, are also focused on the domestic market and filling the LCR of oil operators. More openness and integration with GVCs will be necessary – a point that can be made to the Brazilian industry in general.
Second, regulations may need to become more flexible to accommodate the realities of low oil prices and, as a result, lower domestic demand. The way LC was adopted in Brazil – pre-specified in the bidding process – introduces considerable uncertainties for oil companies. Particularly in deep offshore projects, lead times are long, taking up to a decade from the bidding to the start of operations. This means that firms have to commit today to purchase a certain share of goods and services in the future, when market conditions may be very different. These uncertainties can raise costs and penalize operators that fail to comply (Almeida and Martinez-Prieto, 2014). As has been shown, fines have increased in frequency and amount, and the fines collected do not return in the form of programs that support the industry’s international competitiveness.
Third, while the availability of funding for R&D is abundant, the O&G innovation policies are detached from a supplier development strategy. The federal government announced recent changes to support exports from Brazilian-based suppliers and product innovation, but these measures have yet to be implemented and, when they are, evaluated.
Fourth, a low-oil price scenario and the fast gains of productivity found in the unconventional production of the U.S. will put a particular pressure in deep offshore oil development (Aguilera and Radetzki 2015). Innovative cost-reduction technologies will be key to sustain the growth of the oil industry in Brazil. In the short- and long-term, the competitiveness agenda of the Brazilian O&G supply sector will benefit from a tighter link between knowledge institutions and the research needs of the private sector for product and process innovation.
Finally, the Brazilian experience in promoting the O&G supply chain highlights how the contemporary oil sector can be a target for industrial policies that break with the enclave development paradigm. This point is very relevant to other countries that are attempting to develop an indigenous O&G supply chain based on local content mandates, such as Nigeria, Angola, and most recently, Mexico (Okonta 2013, Ovadia 2016). Brazil shows that it is indeed possible to promote backward linkages in the oil industry in the form of industrial and scientific demand. However, the sustainability over time – particularly in periods of low oil prices, when rents become scarce – depends on a degree of insulation from political pressures that poses a real challenge. These are pressures to (a) increase requirements due to demands from interest groups; (b) localize investments in regions where it is politically convenient rather than economically adequate; (c) engage in rent-seeking coalitions, such as extracting bribes from suppliers, which

30
will then support the coalition in power. While the O&G can be a positive force for developing an innovative industry, and there is certainly room for industrial policies that coordinate complementary investments and reduce bottlenecks (Rodrik 2008), the potential for rent-seeking is high given the participation of the state as a regulator and as a direct producer. Strong accountability institutions are necessary to curb the emergence of rent-seeking coalitions that is likely to arise from the combination of high rents, government discretion and electoral pressures. In Brazil, the kickback scheme that operated in Petrobras was uncovered by the federal police and public prosecutors acting independently from the government and with the help of plea-bargains, a novel instruments of investigations in Brazil (Netto 2016). Hence, the design and implementation of accountability institutions should also be seen as an area prone for innovation and a key component of a resource-led industrial development strategy. This institutional aspect should be on the agenda of scholars and practitioners and the Brazilian experience with the Carwash scandal can also serve to other countries as they try to emulate a developmental route from natural-resources.
31
References
Agência Nacional de Petróleo (ANP), 2014. Anuário Estatístico Brasileiro do Petróleo, Gás Natural e Biocombustíveis: 2014. Rio de Janeiro: ANP.
Aguilera, Roberto F., and Marian Radetzki. 2015. The Price of Oil. Cambridge: Cambridge University Press.
Almeida, Mansueto, Renato Lima-de-Oliveira, Ben Ross Schneider. 2014. “Política industrial e empresas estatais no Brasil: BNDES e Petrobras.” in Capacidades Estatais e Democracia: Arranjos Institucionais de Políticas Públicas. Ed. Alexandre de Ávila Gomide e Roberto Rocha C. Pires. Brasília: IPEA
Bain & Company and Tozzini Freire, 2009. Relatório III – Desenvolvimento da Cadeia Produtiva de Petróleo e Gás e Investimentos em E&P. São Paulo: BNDES.
BNDES. 2014. Perspectivas do Investimento 2015-2018 e Panoramas Setoriais. Rio de Janeiro: BNDES/APE/DEPEQ.
BP. 2015. Energy Outlook 2035. Available at: http://www.bp.com/content/dam/bp/pdf/energy-economics/energy-outlook-2015/bp-energy-outlook-2035-booklet.pdf
Bret-Rouzaut, Nadine, and Jean-Pierre Favennec. 2011. Oil and Gas Exploration and Production: Reserves, costs, contracts (3rd edition). Paris: Editions Technip.
Cavalheiro, G.M. do C., Joia, L.A., & Gonzalves, A.C., 2014. “Strategic patenting in the upstream oil and gas industry: Assessing the impact of the pre-salt discovery on patent applications in Brazil.” World Patent Information, 39, 58–68. http://doi.org/10.1016/j.wpi.2014.04.003
Campos Neto, Carlos Alvares da Silva e Fabiano Mezadre Pompermeyer (eds), 2014. Ressurgimento da indústria naval no Brasil: 2000-2013. Brasília: IPEA.
Campos Neto, Carlos Alvares da Silva, 2014. “Investimentos na indústria naval brasileira 2000-2013” In Carlos Alvares da Silva Campos Neto and Fabiano Mezadre Pompermayer Eds. Ressurgimento da indústria naval no Brasil: 2000-2013. Brasília: IPEA.
Devereux, Steve, 2012. Drilling Technology (2nd edition). Tulsa (OK): PennWell Corporation. Dias, José Luciano de Mattos, and Maria Ana, Quagliano, 1993. A questão do petróleo no
Brasil: uma história da Petrobrás. Rio de Janeiro: FGV / Petrobras. Donnelly, J., 2014. “Comments: Innovation Follows Price”. Journal of Petroleum Technology,
66(11), 18-18. Economist, 2012. The unsung masters of the oil industry (Jul 21st 2012). Available at
http://www.economist.com/node/21559358 Evans, Peter, 1995. Embedded Autonomy: States and Industrial Transformation. Princeton:
Princeton University Press, 1995.
32
Forbes. 2015. “The World's Biggest Oil And Gas Companies – 2015.” Available at http://www.forbes.com/sites/christopherhelman/2015/03/19/the-worlds-biggest-oil-and-gas-companies/
Freire, Wagner. 2013. “Petrobras: das origens até os anos 1990” in in Fábio Giambiagi and Luiz Paulo Velloso Lucas ed., Petróleo: Reforma e Contrareforma do Setor Petrolífero Brasileiro. Rio de Janeiro: Elsevier.
Government Accountability Office (GAO), 2007. Oil and Gas Royalties: A Comparison of the Share of Revenue Received from Oil and Gas Production by the Federal Government and Other Resource Owners. Available at: http://www.gao.gov/assets/100/94953.pdf
Gereffi, Gary and Timothy Sturgeon, 2013. “Global value chain-oriented industrial policy: the role of emerging economies.” in Global Value Chains in a Changing World, ed. Deborah Elms and Patrick Low. Geneva: WTO Publications.
Hirschman, Albert O., 1958. The Strategy of Economic Development. New Haven, Conn.: Yale University Press.
IBP, 2015. Public Policies Proposal for Socioeconomic Development Through Investments in Exploration and Production Offshore – Final Report 2015. Rio de Janeiro: IBP/Bain & Company.
International Energy Agency (IEA). 2012. Oil: Medium-Term Market Report 2012. Paris (FR): OECD/IEA.
International Energy Agency (IEA). 2013. World Energy Outlook. Paris (FR): OECD/IEA. Inkpen, Andrew and Michael H. Moffett, 2011. The Global Oil & Gas Industry: Management,
Strategy & Finance. Tulsa (OK): PennWell Corporation. Jahn, Frank, Mark Cook and Mark Graham. 2008. Hydrocarbon Exploration and Production (2nd
edition). Amsterdam: Elsevier. Kaiser, Mark J. and Brian F. Snyder. 2013. The Offshore Drilling Industry and Rig Construction
in the Gulf of Mexico. London (UK): Springer. Leffler, William L., Richard Pattarozzi, and Gordon Sterling, 2011. Deepwater Petroleum
Exploration & Production (2nd edition). Tulsa (OK): PennWell Corporation. Lima-de-Oliveira, Renato, 2015. “Local Content Requirements in the Oil and Gas Industry in
Developing Countries: The Return of ISI?” (September 8, 2015). MIT Political Science Department Research Paper No. 2015-20. Available at SSRN: http://ssrn.com/abstract=2657678 or http://dx.doi.org/10.2139/ssrn.2657678
Lloyd’s Register Energy, 2014. Oil and Gas Technology Radar. Available at http://mediaserver.dwpub.com/fjd-profile/39737/Lloyds_Register_Energy_Oil_And_G.pdf
McKinsey & Company, 2015. Perspectives on downstream oil and gas: profitability in a world of over capacity. Available at: http://www.mckinsey.com/~/media/McKinsey/dotcom/client_service/Oil%20and%20gas/PDFs/Profitability_in_a_world_of_over_capacity.ashx

33
Netto, Vladimir. 2016. Lavajato: O juiz Sérgio Moro e os Bastidores da Operação que Abalou o Brasil. Rio de Janeiro: Primeira Pessoa.
Okonta, Ike. 2013. “Nigeria: Policy Incoherence and the Challenge of Energy Security.” In The Handbook of Global Energy Policy, ed. Andreas Goldthau. Malden, MA: Wiley-Blackwell.
Ovadia, J. S. 2016. “Local content policies and petro-development in Sub-Saharan Africa: A comparative analysis.” Resources Policy, 49, 20–30.
Paul, Anthony E., 2013. “Maximizing National Development from the Oil and Gas Sector Through Local Value-Add: Extracting from an Extractive Industry.” in Governance of The Petroleum Sector in an Emerging Developing Economy, ed. Kwaku Appiah-Adu. Surrey (UK): Gower Publishing Limited.
Perrons, R.K., 2014. “How innovation and R&D happen in the upstream oil & gas industry: Insights from a global survey.” Journal of Petroleum Science and Engineering, 124, 301–312.
Petrobras, 2013. Retomada da Indústria Naval e Offshore do Brasil 2003-2013-2020: visão Petrobras. Rio de Janeiro: Petrobras.
Pinto Júnior, Helder Queiroz, Edmar Fagundes de Almeida, José Vitor Bomtempo, Mariana Iootty, Ronaldo Goulart Bicalho. 2007. Economia da Energia: Fundamentos Econômicos, Evolução Histórica e Organização Industrial. Rio de Janeiro: Elsevier Editora.
Pires, Roberto Rocha, Alexandre de Ávila Gomide, and Lucas Alves Amaral, 2013. “A ver navios? A revitalização da indústria naval no Brasil democrático.” Texto para discussão No. 1864. Brasília: IPEA.
Prebisch, Rául, 1950. The Economic Development of Latin America and its Principal Problems. Lake Success (NY): United Nations Department of Social Affairs.
Raymond, Martin S. and William L. Leffler, 2006. Oil and Gas Production. Tulsa (OK): Penwell.
Rodrik, Dani. 2008. Normalizing Industrial Policy, 1–50. Washington, D.C.: The World Bank. Ross, M.L., 2012. The Oil Curse: How petroleum wealth shapes the development of nations.
Princeton, NJ: Princeton University Press. Schlumberger, 2014. Annual Report. Silva, M.M., 2014. “Tributação na indústria da construção naval brasileira: peso dos tributos e
sobre preço de navio-tanque e plataforma offshore.” In Ressurgimento da indústria naval no Brasil (2000-2013), Carlos Alvares da Silva Campos Neto and Fabiano Mezadre Pompermayer. Brasília: 2014.
Sturgeon, T.J. and Lester, R.K., 2004. “The new global supply-base: New challenges for local suppliers in East Asia” in Shahid, Y., Anjum, A.M. and Nabeshima, K. (Eds), Global Production Networking and Technological Change in East Asia. Washington (DC): The World Bank and Oxford University Press.

34
Tordo, S, Brandom S. Tracy and Noora Arfaa. 2011. “National oil companies and value creation.” World Bank Working Paper 218.
Tordo, S., Warner, M., Manzano, O. and Anouti, Y., 2013. Local Content Policies in the Oil and Gas Sector. Washington (DC): World Bank.
Tribunal de Contas da União (TCU), 2015. Acórdão 1884/2015 (TC 025.692/2013-5 (Acompanhamento Execução do PROMEF). Available at http://www.tcu.gov.br/Consultas/Juris/Docs/judoc/Acord/20150730/AC_1884_30_15_P.doc