respiration -...
TRANSCRIPT

MOLECULAR BIOLOGY
Despite the differences in the amino acid sequencebetween animal and human insulin, they all bindto the hurnan insulin receptor and cause loweringof blood glucose concentration. However, somediabetics develop an allergy to animal insulins,so it is preferable to use human insulin. In 1982human insulin became commercially available forthe first time. It was produccd using geneticallymodified E. coli bacteria. Since then methods ofproduction have been developed using yeast cellsand more recently safflower plants.
Each of these species has been geneticallymodified by transferring the gene for makinghuman insulin to it. This is done in such a waythat the gene is transcribed to produce mRNA andthe mRNA is translated to produce harvestablequantities of insulin. The insulin produced hasexactly the same amino acid sequence as if thegene was being transcribed and translated inhuman cells.
This may seernobvious, but itdepends on eacl-rIRNA with aparticular anticodonhaving the sameamino acid attachedto it as in hurtrarrs. Irrother words, E. coli,yeast and safflower(a prokaryote, afungus and a plant)all use the samegenetic code ashumans (an animal).It is fortunate for Figure 12genetic engineersthat all organisms, with very few exceptions, usethe same genetic code as it makes gene transferpossible between widely differing species.
2.8 Cell respirationUnderstanding+ Cell respiration is the controlled release of
energg from organic compounds to produceATP.
à ATP from cell respiration is immediatelgavailable as a source of energg in the cell.
Ð Anaerobic cell respiration gives a small gield ofATP from glucose.
; Aerobic cell respiration requires oxggen andgives a large gield of ATP from glucose,
Use of anaerobic cell respiration in geasts toproduce ethanol and carbon dioxide in baking.Lactate production in humans when anaerobicrespiration is used to maximize the power ofmuscle contractions.
@ nature of sc¡ence) Assessing the ethics of scientif ic research
the use of invertebrates in respirometerexperiments has ethical implications.
@ srilrs+ Analgsis of results from experiments involving
measurement of respiration rates in germinatingseeds or invertebrates using a respirometer.
L22

2.8 CELL RESPIRATION
Release of energg bg cell respirationCell respiration is the controlled release of energg fromorganic compounds to produce ATP.
Cell respiration is one of the functions of life that all living cells perform.Organic compounds are broken down to release energy, which can thenbe used in the cell. For example, energy is released in muscle flbres bybreaking down glucose into carbon dioxide and water. The energy canthen be used for muscle contraction.
In humans the source of the organic compounds broken down in cellrespiration is the food that we eat. Carbohydrates and lipids are oftenused, but amino acids lrom proteins may be used if we eat more proteinthan needed. Plants use carbohydrates or lipids previously made byphotosynthesis.
Cell respiration is carried out using enzymes in a careful and controlledway, so that as much as possible of the energy released is retainedin a usable form. This form is a chemical substance called adenosinetriphosphate, almost always abbreviated to ATP. To make ATP, aphosphate group is linked to adenosine diphosphate, or ADP. Energyis required to carry out this reaction. The energy comes from thebreakdown of organic compounds.
ATP is not transferred from cell to cell and all cells require a continuoussupply. This is the reason for cell respiration being an essential functionof life in all cells.
ATP is a source of energgATP from cell respiration is immediatelg available as asource of energg in the cell.Cells require energy for three main types of activity.
o Synthesizinglarge molecules like DNA, RNA and proteins.
o Pumping molecules or ions across membranes by active transport.
o Moving things around inside the cell, such as chromosomes,vesicles, or in muscle cells the protein fibres that cause musclecontraction.
The energy for all of these processes is supplied by ATP. Theadvantage of ATP as an energy supply is that the energy isimmediately available. It is released simply by splitting ATP into ADPand phosphate. The ADP and phosphate can then be reconverted toATP by cell respiration.
When energy from ATP is used in cells, it is ultimately all convertedto heat, Although heat energy may be useful to keep an organismwarm, it cannot be reused for cell activities and is eventually lost to theenvironment. This is the reason for cells requiring a continual source ofATP for cell activities.
I Figure 1 Breaking down 8 grams of glucosein cell respiration provides enough energu tosprint 100 metres
cell
active cell processes
À Figure 2
À Figure 3 lnfra red photo ofloucanshowing that it is warmer than itssurroundings due to heat generatedbg respiration. Excess heat isdissipated bg sending warm bloodto the beak
æ.0
31.0
29.0
n.06.9AO4.019.0
ATPADP +

MOLECULAR BIOLOGY
Ä Figure 4 The mud in mangrove swamps isdeficient in oxggen. Mangrove trees haveevolved vertical roots called pneumatophoreswhich theg use to obtain oxggen from the air
ActivitgDoes bioethanol solve or make moreProblems?There has been much debate aboutbioethanol production. A renewablefuel that cuts down on carbonemissions is obviouslg desirable.What are the arguments againstbioethanol production?
Anaerobic respirationAnaerobic cell resp¡rat¡on gives a small gield ofATP from glucose.Glucose is broken down in anaerobic cell respiration without using anyoxygen. The yield of ATP is relatively small, but the ATp can be producedquickly. Anaerobic cell respiration is therefore useful in three situations:o when a short but rapid burst of AIP production is needed;o when oxygen supplies run out in respiring cells;
o in environments that are deficient in oxygen, for examplewaterlogged soils,
The products of anaerobic respiration are not the same in all organisms.In humans, glucose is converted to lactic acid, which is usually in adissolved form known as lactate. In yeast and plants glucose is convertedto ethanol and carbon dioxide. Both lactate and ethanol are toxic inexcess, so must be removed from the cells that produce them, or beproduced in strictly limited quantities.Summary equationsglucose ----z^-+ lactateUUADP ATPThis occurs in animals including humans.
glucose -- + ethanol * carbon dioxideUVADP ATPThis occurs in yeasts and plants.
Ë
J*'t
@ ve"st and its usesUse of anaerobic cell respiration in geasts to produceethanol and carbon dioxide in baking.Yeast is a unicellular fungus that occurs naturally in habitats whereglucose or other sugars are available, such as the surface of fruits.It can respire either aerobically or anaerobically. Anaerobic cellrespiration in yeast is the basis for production of foods, drinks andrenewable energy.
Bread is made by adding water to flour, kneading the mixture to makedough and then baking it. Usually an ingredienr is added to the doughto create bubbles of gas, so that the baked bread has a lighter texture.Yeast is often this ingredient. After kneading, the dough is keptwarm to encourage the yeast to respire. Any oxygen in the dough issoon used up so the yeast carries out anaerobic cell respiration. Thecarbon dioxide produced by anaerobic cell respiration cannot escapefrom the dough and forms bubbles. The swelling of the dough due to

2.8 CELL RESPIRATION
Data-based questions: Mon¡tor¡ng anaerobic cell respiration in geastThe apparatus in flgure 7 was used to monitor 2 Explain the loss of mass. t3lmass changes during the brewing of wine' The, 3 Suggest two reasons Tor the increasing rateflask was placed on an electronic balance, whic!_ of íiass loss from the start of the experimentwas connected to a computer for data-logging. The until day 6. l2lresults are shown in figure 8.
l carcurate the rorar loss of mass during the 4 :::.Tt" two reasons for the mass remaining) !¡¡! , constant from day t I onwards. Í21
experiment and the mean daily loss. t3l
the production of bubbles of carbon dioxide is called rising. Ethanolis also produced by anaerobic cell respiration, but it evaporatesduring baking.Bioethanol is ethanol produced by living organisms, for use asa renewable energy source. Although any plant matter can beutilized as a feed stock and various living organisms can be usedto convert the plant matter into ethanol, most bioethanol isproduced from sugar cane and corn (maize), using yeast. Yeastconverts sugars into ethanol in large fermenters by anaerobicrespiration. Only sugars can be converted, so starch and cellulosemust first be broken down into sugars. This is done using enzymesThe ethanol produced by the yeasts is purified by distillationand various methods are then used to remove water from it toimprove its combustion. Most bioethanol is used as a fuel invehicles, sometimes in a pure state and sometimes mixed withgasoline (petrol).
À Figure 6
airlock toprevent
entruof oxggen
560
geast in a
solution ofsugar andnutrients
electronicbalanceconnected1o a data-loggingc0mputer
Íme / dags
À Figure 7 Yeast data-logging apparatus ^t Figure 8 Monitoring anaerobic cell respiration in geast
@ m"erob¡c resp¡ration in humansLactate production in humans when anaerobic resp¡ration is used to maximize thepower of muscle contractions.
555ooØØI 550È
545
45
The lungs and blood system supply oxygen tomost organs of the body rapidly enough foraerobic respiration to be used, but sometimes we
resort to anaerobic cell respiration in muscles. Thereason is that anaerobic respiration can supplyATP very rapidly for a short period of time. It is

MOLECULAR BIOLOGY
therefore used when.we need to maximize thepower of muscle contractions.
In our ancestors maximally powerful musclecontractions will have been needed for survivalby allowing escape from a predator or catching ofprey during times of food shortage. These eventsrarely occur in our lives today. Instead anaerobicrespiration is more likely to be used duringtraining or sport. These are examples:o weight lifters during the lift;o short-distance runners in races up to 400
metres;o long-distance runners, cyclists and rowers
during a sprint finish.Anaerobic cell respiration involves the productionof lactate, so when it is being used to supply ATp,the concentration of lactate in a muscle increases.There is a limit to the concentration that the bodycan tolerate and this limits how much anaerobicrespiration can be done. This is the reason for theshort timescale over which the power of musclecontractions can be maximized. We can only sprintfor a short distance - not more than 400 metres.
After vigorous muscle contractions, the lactatemust be broken down. This involves the use ofoxygen. It can take several minutes for enoughoxygen to be absorbed for all lactate to be brokendown. The demand for oxygen that builds upduring a period of anaerobic respiration is calledthe oxygen debt.
t Figure 9 Short bursts of intense exercise are fuelledbg ATP from anaerobic cell respiration
r, Figure 10 The desert rat never needs to drinkdespite onlg eating drg foods, because aerobiccell respiration supplies its water needs
Aerobic resp¡rat¡onAerobic cell respiration requires oxUgen and gives a largegield of ATP from glucose.If oxygen is available to a cell, glucose can be more fully broken downto release a greater quantity of energy than in anaerobic cell respiration.Whereas the yield of ATP is only two molecules per glucose withanaerobic cell respiration, it is more than thirty per glucose with aerobiccell respiration.Aerobic cell respiration involves a series of chemical reactions. carbondioxide and water are produced. In most organisms carbon dioxide is awaste product that has to be excreted, but the water is often useful. Inhumans about half a litre is produced per day.
glucose * oxygen -75* carbon dioxide * waterADP to ATP
In eukaryotic cells most of the reactions of aerobic cell respiration,including all of the reactions that produce carbon dioxide, happen insidethe mitochondrion.

2.8 CELL RESPIRATION
@ nespirometersAnalgsis of results from experiments involving measurement of respiration rates ingerminating seeds or invertebrates using a respirometer.A respirometer is any device that is used to in volume. If possible the temperature insidemeasure respiration rate. There are many possible the respirometer should be controlled using adesigns. Most involve these parts: thermostatically controlled water bath.
o A sealed glass or plastic container in which the Respirometers can be used to perform variousorganism or tissue is placed. experiments:
o An alkali, such as potassium hydroxide, to o the respiration rate of different organismsabsorb carbon dioxide. could be compared;
o A capillary tube containing fluid, connected to o the effect of temperature on respiration ratethe container. could be investigated;
One possible design of respirometer is shownin figure l l, but it is possible to design simplerversions that require only a syringe with acapillary tube attached to it.If the respirometer is working correctly andthe organisms inside are carrying out aerobiccell respiration, the volume of air inside therespirometer will reduce and the fluid in thecapillary tube will move towards the containerwith the organisms. This is because oxygen is usedup and carbon dioxide produced by aerobic cellrespiration is absorbed by the alkali.
The position of the fluid should be recordedseveral times. If the rate of movement of thefluid is relatively even, the results are reliable.If the temperature inside the respirometerfluctuates, the results will not be reliable becausean increase in air temperature causes an increase
o respiration rates could be compared in activeand inactive organisms.
The table below shows the results of an experimentin which the effect of temperature on respiration ingerminating pea seeds was investigated.
To analyse these results you should first check tosee if the repeats at each temperature are closeenough for you to decide that the results are reliableYou should then calculate mean results for eachtemperature. The next stage is to plot a graph of themean results, with temperature on the horizontalx-axis and the rate of movement of fluid on thevertical y-axis. Range bars can be added to thegraph by plotting the lowest and highest result ateach temperature and joining them with a ruledline. The graph will allow you to conclude what therelationship is between the temperature and therespiration rate of the germinating peas.
capillarg tube
graduated 1 cm3sunnge
wire basket containinganimallissue
filter paper rolledto form a wickpotassium hgdroxidesolution
Temperature('c)
Movement of fluid in respirometer(mm min-lJ
lstreading
2ndreading
3tdreading
5 2.0 1.5 2.0
10 2.5 2.5 3.0
15 3.5 4.0 4.0
20 5.5 5.0 6.0
25 6.5 8.0 7.5
30 11.5 11.0 9.5A Figure 11 Diagram of a respirometer
r27

MOLECULAR BIOLOGY
Data-based quest¡ons: Oxggen consumption in tobacco hornwormsTobacco hornworms are the larvae oT Manduca sexta.Adults of this species are moths. Larvae erìergefrom the eggs laid by the adult female moths. There
b) Suggest reasons for the difference in thetrends between the periods below andabove the critical weight. l2l
The researchers reared some tobacco hornwormsin air with reduced oxygen content. They foundthat the instar larvae moulted at a lower body massthan Ìarvae reared in normal air with 2OTo oxygen.3 Suggest a reason for earlier moulting in larvae :
reared in air with reduced oxygen content. [2] !
before criticalweight after critical weight
! are a series of larval stages called instars. Eachi instar grows and then changes into the next one! by shedding its exoskeleton and developing a new! larger one. The exoskeleton includes the tracheal
tubes that supply oxygen to the tissues.
The graphs below (figure 12) show measurementsmade using a simple respirometer of the respirationrate of )rd,4t]n and 5th instar larvae. Details ofthe methods are given in the paper published bythe biologists who carried out the research. Thereference to the research is Callier V and Nijhout
: H F (201I ) "Control of body size by oxygen supply: reveals size-dependent and size-independenti mechanisms of molting and metamorphosis."i PNAS;108:14664-146ó9. This paper is freely
available on the internet at http://wwwpnas.org/content/ 108 135 I I4664.fi_rll.pdf +html.Each data point on the graphs shows the body massand respiration rate of one larva. For each instar theresults have been divided into younger larvae withlow to intermediate body mass and older larvaewith intermediate to high body mass. The resultsare plotted on separate graphs. The intermediatebody mass is referred to as the critical weight.I a) Predict, using the dara in the graphs, how
the respiration rate of a larva will changeas it grows lrom moulting until it reachesthe critical weight. ttl
b) Explain the change in respiration rate thatyou have described. t2l
2 al Discuss the trends in respiration rate inlarvae above the critical weight. t2l
0.r20.100.080.060.040.02
0.16
0.14
0.r2
0.10
0.08
72 456 7 I 1,0 7r t? 13
0
00
.CE
OÈorcC
.P
o.=oo
02 tr
5
/ôo /O
o-"o
o
o
I.O T,T I,2 T,3 T.4
002
0 01
001
0
05
0.03 20.0300.0280.02 60.0240.0220.0200.018
0
oooo
o Ão t .t
o-oo-66-
69o oo
$9us9bs$s>ss*sS o>"o>*úo¡t}S$weight (g) weight [g)
r Figure 12 Respiration rates of tobacco hornworms IafterCallier and Nijhout, 2011]
0.00 z0.0060.00 50.0040.0030.0020.0010.000
0.0090.0080.0070.00 60.00 50.0040.00 3
@ etf,ics of animal use ¡n resp¡rometersAssessing the ethics of scientif ic research: the use of invertebrates inrespiromete r experi ments has ethical i m pl ications.It is important for all scientists to assess the we consider the consequences such as benefltsethics of their research. There has been intense to students who are learning science? Do wedebate about the ethics of using animals in consider intentions? For example, if the animalsexperiments. When discussing ethical issues, do are harmed unintentionally does that change
5th instar a
a
OOo
-oo8-
o
o
o@--Â-o oo
{oo
oo o- -
4th instar . ,.a
a
3rd instar
a
t28

2.9 PHOTOSYNTHESIS
whether the experiment was ethical or not? Arethere absolute principles of right and wrong: forexample, can we say that animals should neverbe subject to conditions that are outside whatthey would encounter in their natural habitat?
Before carrying out respirometer experimentsinvolving animals these questions shouldbe answered to help to decide whether theexperiments are ethically acceptable:
I Is it acceptable to remove animals from theirnatural habitat for use in an experiment andcan they be safely returned to their habitat?
2 Will the animals suffer pain or any other harmduring the experiment?
f Can the risk of accidents that cause pain orsuffering to the animals be minimized duringthe experiment? In particular, can contactwith the alkali be prevented?
4 Is the use of animals in the experimentessential or is there an alternative method thatavoids using animals?
It is particularly important to consider the ethics ofanimal use in respirometer experiments because theInternational Baccalaureate Organization has issueda directive that laboratory or field experiments andinvestigations need to be undertaken in an ethicalway. An important aspect of this is that experimentsshould not be undertaken in schools that inflictpain or harm on humans or other living animals.
2.9 PhotosUnthes¡s
Understanding) Photosgnthesis is the production of carbon
compounds in cells using light energg.
t Visible light has a range of wavelengths withviolet the shortest wavelength and red thelongest.
> Chlorophgll absorbs red and blue light mosteffectivelg and reflects green light more thanother colours.
à Oxggen is produced in photosgnthesis fromphotolVsis of water.
t Energg is needed to produce carbohgdrates and
other carbon compounds from carbon dioxide.
Ð Temperature, light intensitu and carbon dioxideconcentration are possible limiting factors on
the rate of photosgnthesis.
@ ryplicatiCIm*à Changes to the Earth's atmosphere, oceans and
rock deposition due to photosgnthesis.
@ srittst Design of experiments to ¡nvestigate limiting
factors on photosgnthesis.Ð Separation of photosgnthetic pigments bg
chromatographg.Ð Drawing an absorption sPectrum for chlorophgll
and an action sPectrum for photosgnthesis.
@ l.ture of sc¡enceÐ Experimental design: controlling relevant
variables in photosgnthesis experiments isessent¡al.
t29

MOLECULAR BIOLOGY
What is photosgnthesis?Photosgnthesis is the production of carbon compounds incells using light energg.Living organisms require complex carbon compounds to build thestructure of their cells and to carry out life processes. some organismsare able to make all the carbon compounds that they need using onlylight energy and simple inolganic substances such as carbon dioxide andwater. The process that does this is called photosynthesis.Photosynthesis is an example of energy conversion, as light energyis converted into chemical energy in carbon compounds. The carboncompounds produced include carbohydrates, proteins and lipids.
r Figure 2 The trees in one hectare of redwoodforest in California can have a biomass of morethan 4,000 tonnes, mostlg carbon compoundsproduced bg photosgnthesis
t Figure 1 Leaves absorb carbon dioxide and light and use them in photosgnthesis
@ s.parating photosgnthetic p¡gments bg chromatogrephgSeparation of photosg nthet¡c p¡gments b g ch romatogra ph g.Chloroplasts contain several types of chlorophylland other pigments called accessory pigments.Because these pigments absorb different ranges ofwavelength of light, they look a different colour tous. Pigments can be separated by chromatography.You may be familiar with paper chromatographybut thin layer chromatography gives better results.This is done with a plastic strip that has beencoated with a thin layer of a porous material.A spot containing pigments extracted from leaftissue is placed near one end of the strip. Asolvent is allowed to run up the strip, to separatethe different types of pigment.
I Tear up a leaf into small pieces and put themin a mortar.
2 Add a small amount of sand for grinding.
{
I
Ia
È
d
rf
\
ì
,o
t3
I
ra
Ia.
ó3a
a¡ od
,
TJffiI
.*
A Figure 3 Thin lager chromatographg ITLC)

2.9 PHOTOSYNTHESIS
3 Add a small volume of propanone (acetone).
4 Use the pestle to grind the leaf tissue anddissolve out the pigments.
5 If the propanone all evaporates, add a little more.
6 When the propanone has turned dark green,allow the sand and other solids to settle, thenpour the propanone off into a watch glass.
7 Use a hair drier to evaporate off all thepropanone and water from the cells' cytoplasm.
8 When you have just a smear of dry pigmentsin the watch glass, add 3-4 drops of propanoneand use a paint brush to dissolve the pigments.
9 Use the paint brush to transfer a very smallamount of the pigment solution to theTLC strip. Your aim is to make a very smallspot of pigment in the middle of the strip,10 millimetres from one end. It should be verydark. This is achieved by repeatedly putting asmall drop onto the strip and then allowing itto dry before adding another amount. You canspeed up drying by blowing on the spot or byusing the hair drier.
lO When the spot is dark enough, slide the otherend of the strip into the slot in a cork or bungthat fits into a tube that is wider than the TLCstrip. The slot should hold the strip firmly.
ll Insert the cork and strip into a specimen tube.The TLC strip should extend nearly to thebottom of the tube, but not quite touch.
Spotnumber
Colour DistancemovedImm)
Rf Name ofpigment
t2
3
4
5
6
7
I
Pigment Colour ofpigment
Rf
Carotene orange 0.98
Chlorophgll a blue green 0.59
Chlorophgll b gellow green 0.42
Phaeophgtin olive green 0.81
Xanthophgll 1 gellow 0.28
Xanthophgll 2 gellow 0.15
12 Mark the outside of the tube just below thelevel of the spot on the TLC strip.
13 Take the strip and cork out of thetube.
14 Pour running solvent into the specimen tubeup to the level that you marked.
15 Place the specimen tube on a lab benchwhere it will not be disturbed. Carefullylower the TLC strip and cork into thetube, so that the tube is sealed and theTLC strip is just dipping into the runningsolvent. The solvent must NOT touch thepigment spot.
16 Leave the tube completely alone for aboutfive minutes, to allow the solvent to runup through the TLC strip. You can watchthe pigments separate, but DO NOT TOUCHTHE TUBE.
l7 When the solvent has nearly reached thetop of the strip, remove it from the tube andseparate it from the cork.
18 Rule two pencil lines across the strip, one atthe level reached by the solvent and one at thelevel of the initial pigment spot.
19 Draw a circle around each of the separatedpigment spots and a cross in the centre ofthe circle.
Table of standard R, valuesI Figure 4 Chromatogram of leaf pigments
131

MOLECULAR BIOLOGY
20 Using a ruler with millimetre markings,measure the distance moved by the runningsolvent (the distance between the two lines)and the distance moved by each pigment (thedistance between the lower line and the crossin the centre of the circle).
2l Calculate the R, for each pigment, where R, isthe distance run by the pigment divided by thedistance run by the solvent.
22 Show all your results in the table above, startingwith the pigment that had moved least far.
r Figure 5 ln a rainbow the wavelengths ofvisible light are separated
Wavelengths of lightVisible light has a range of wavelengths with violet theshortest wavelength and red the longest.Sunlight or simply light is made up of all the wavelengrhs of electromagneticradiation that our eyes can detect. It is therefore visible to us and otherwavelengths are invisible. There is a spectrum of electromagnetic radiationfrom very short to very long wavelengths. Shorter wavelengths such asX-rays and ultraviolet radiation have high energy; longer wavelengths suchas infrared radiation and radio waves have lower energy. Visible light haswavelengths longer than ultraviolet and shorter than infrared. The range ofwavelengths of visible light is 400 to 700 nanometres.
When droplets of water in the sky split sunlight up and a rainbow isformed, different colours of light are visible. This is because sunlight isa mixture of different wavelengths, which we see as different coÌours,including violet, blue, green and red. Violet and blue are the shorterwavelengths and red is the longest wavelength.The wavelengths of Ìight that are detected by the eye are also those usedby plants in photosynthesis. A reason for this is that they are emitted bythe sun and penetrate the Earth's atmosphere in larger quantities thanother wavelengths, so are particularìy abundant.
1.5 blue :450-500 nm
green:525-575 nm
red : 650-700 nm
1.0
500 1000 1500 2000 2500 3000
wavelength/nmA Figure 6 The spectrum of electromagnetic radiation reaching the Earth's surface
Light absorption bg chlorophgllChlorophgll absorbs red and blue light most effectivelgand reflects green light more than other colours.The flrst stage in photosynthesis is the absorption of sunlight. Thisinvolves chemical substances called pigments. A white or transparentsubstance does not absorb visible light. Pigments are substances that do
05
NI
E
=ooo=-o
oU
oso0
.CEooCo.o!oG
a
0
t32
2.9 PHOTOSYNTHESIS
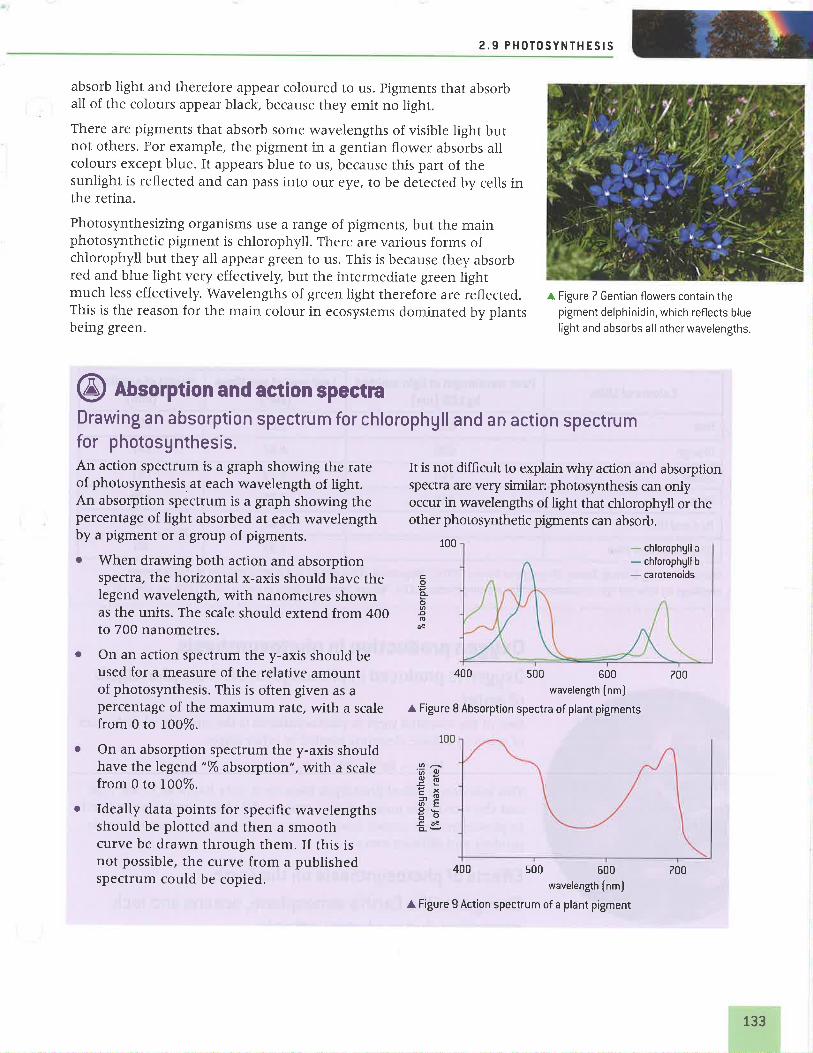
absorb light and therefore appear coloured to us. pigments that absorball of the colours appear black, because they emit no light.There are pigments that absorb some wavelengths of visible tight butnot others. For example, the pigment in a gentian flower absorbs allcolours except blue. It appears blue to us, because this part of thesunlight is reflected and can pass into our eye, to be detected by cells inthe retina.Photosynthesizing organisms use a range of pigments, but the mainphotosynthetic pigment is chlorophyll. There are various forms ofchlorophyll but they all appear green to us. This is because they absorbred and blue light very effectively, but the intermediate green lightmuch less effectively. wavelengths of green light therefore are reflected.This is the reason for the main colour in ecosystems dominated by plantsbeing green.
A Figure Z Gentian flowers contain thepigment delphinidin, which reflects bluelight and absorbs all other wavelengths.
@ nlsorpt¡on end act¡on spectraDrawing an ebsorption spectrum for chlorophgll and an act¡on spectrumfor photosgnthesis.An action spectrum is a graph showing the rate It is not difficult to explain why action and absorptionof photosynthesis at each wavelength of light. spectra are very similar: photosynthesis can onlyAn absorption spectrum is a graph showing the occur in wavelengths of light that chlorophyll or thepercentage of light absorbed at each wavelength other photoslmthetic pigments can absorb.by a pigment or a group of pigments.o When drawing both action and absorption
spectra, the horizontal x-axis should have thelegend wavelength, with nanometres shownas the units. The scale should extend from 400to 700 nanometres.
o On an action spectrum the y-axis should beused for a measure of the relative amountof photosynthesis. This is often given as apercentage of the maximum rate, with a scalefrom 0 to t00%.
o On an absorption spectrum the y-axis shouldhave the legend "% absorption", with a scalefrom 0 to 100%.
o Ideally data points for specific wavelengthsshould be plotted and then a smoothcurve be drawn through them. If this isnot possible, the curve from a publishedspectrum could be copied.
400 s00 500wavelength Inm]
A Figure 9 Action spectrum of a plant pigment
c.9èoØoo
100
400 500 500wavelength Inm]
A Figure 8 Absorption spectra of plant pigments
100
- chlorophgll a
- chlorophgll b
- carotenoids
700
Ø-ëË7x;q@ÞOsãocèec-
700
133
MOLECULAR BIOLOGY
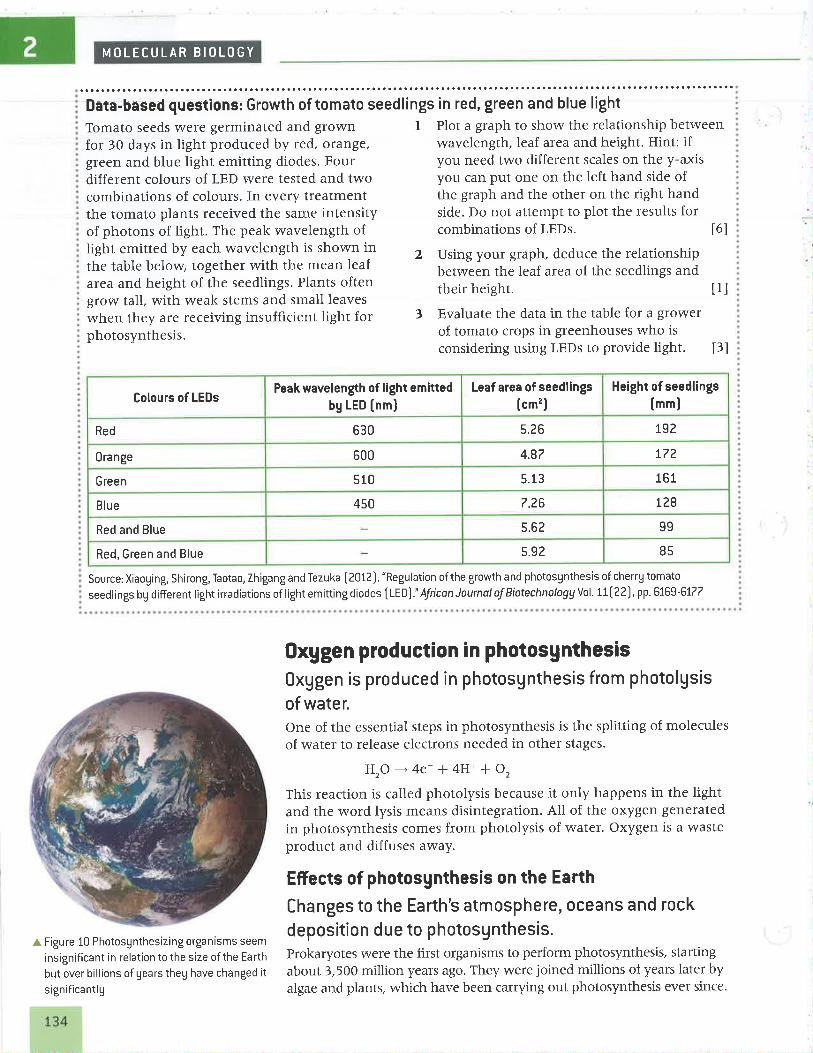
ö;ï;;;;;;;;;;,i;;;' c;;;il;,;;ä;;;;rì;s;ì;';;;;;ä;;; ;i;i¡s;i''''Tomato seeds were germinated and grown I Plot a graph to show the relationship betweenfor 30 days in light produced by red, orange, wavelength, leaf area and height. Hint: ifgreen and blue light emitting diodes. Four you need two different scales on the y-axisdifferent colours of LED were tested and two you can put one on the left hand side ofcombinations of colours. In every treatment the graph and the other on the right handthe tomato plants received the same intensity side. Do not attempt to plot the results forof photons of light. The peak wavelength of combinations of LEDs. t6llight emitted by each wavelength is shown in 2 Using your graph, deduce the relationshipthe table below, together with the mean leaf between the leaf area of the seedlings andarea and height of the seedlings. Plants often +L^i-grow tall, with weak srems and small l.;;.;^ their height' tllwhen they are receiving insufficient light for 3 Evaluate the data in the table for a growerphotosynthesis. of tomato crops in greenhouses who is
considering using LEDs to provide light. t3l
Colours of LEDsPeak wavelength of light em¡tted
bg LED [nm)Leaf area of seedlings
f cm')Height of seedlings
f rm)Red 630 5.26 1,92
0range 600 4.8? t72
Green 510 5.13 161
Blue 450 7.26 t28
Red and Blue s.62 99
Red, Green and Blue s.92 8s
Source: Xiaoging, Shirong, Taotao, Zhigang and Tezuka l20t?). "Regulation of the growth and photosgnthes¡s of cherru tomato
seedlings bg different light irradiations of light emitting diodes ILED)!' Africon Journol of BiotechnologgYol.l'Il??), pp. 6169-6177
À Figure 10 Photosgnthesizing organisms seeminsignificant in relation to the size of the Earthbut over billions of gears theg have changed itsignif icantlg
Oxggen production in photosgnthesis0xggen is produced in photosgnthesis from photolgsisof water.One of the essential steps in photosynthesis is the splitting of moleculesof water to release electrons needed in other stages.
HrO ---+ 4e- l4H+ + 02
This reaction is called photolysis because it only happens in the lightand the word lysis means disintegration. All of the oxygen generatedin photosynthesis comes from photolysis of water. Oxygen is a wasteproduct and diffuses away.
Effects of photosgnthes¡s on the EarthChanges to the Earth's atmosphere, oceans and rockdeposition due to photosgnthesis.Prokaryotes were the first organisms to perform photosynthesis, startingabout 3,500 million years ago. They were joined millions of years later byalgae and plants, which have been carrying out photosynthesis ever since.

2.9 PHOTOSYNTHESIS
one consequence of photosynthesis is the rise in the oxygen concentrationof the atmosphere. This began abottf 2,400 million years ago (mya), rising to2%by volume by 2,200 mya. This is known as the Great Oxidation Event.At the same time the Earth experienced its flrst glaciation, presumablydue to a reduction in the greenhouse effect. This could have been dueto the rise in oxygenation causing a decrease in the concentration oîmethane in the atmosphere and photosynthesis causing a decrease incarbon dioxide concentration. Both methane and carbon dioxide arepotent greenhouse gases.
The increase in oxygen concentrations in the oceans between 2,400 and2,200 mya caused the oxidation of dissolved iron in the water, cansingit to precipitate onto the sea bed. A distinctive rock formation wasproduced called the banded iron formation, with layers of iron oxidealternating with other minerals. The reasons for the banding are not yetlully understood. The banded iron formations are the most importantiron ores, so it is thanks to photosynthesis in bacteria billions of yearsago that we have abundant supplies of steel today.The oxygen concentration of the atmosphere remained at about 2To hom2,200 mya until about 750-635 mya. There was then a significant rise to2O7o or more. This corresponds with the period when many groups ofmulticellular organisms were evolving.
Different atmospheres
Planet Composition ofatmosphere (%J
C0, Nz Ar 0? H,0
Venus987t00Earth 0.04 78 1. 2t 0.1
Mars 96 2.5 1.5 2.5 0.1
What are the main differencesbetween the composition of theEarth's atmospheres and theatmosphere of the other planets.What is the cause of thesedifferences?
light intensitg
75 150 2?5 300light intensitg/J dm 2s 1
Figure 12 The graph shows the resultsof an experiment in which the rateof photosgnthesis was found bgmeasuringthe uptake of carbon dioxide
I What is the reason for a C0,uptake rate of -200 indarkness?
2 What can gou predict about cellrespiration and photosgnthesisat the point where the net rate ofC0, uptake is zero?
50
oõ40=ooF30oo{zoCoo¡)ð10
0
1500
= looooE
-9 soooè=utiU
200
4.0 3.0 2.O 1.0
Millions of gears ago Ix 1,000]r Figure 11
Prod uction of carboh gdratesEnergg is needed to produce carbohgdrates and othercarbon compounds from carbon dioxide.Plants convert carbon dioxide and water into carbohydrates byphotosynthesis. The simple equation below summarizes the process:
carbon dioxide * water -- carbohydrate * oxygenTo carly out this process, energy is required. A chemical reaction thatinvolves putting in energy is described as endothermic. Reactionsinvolving the production of oxygen are usually endothermic in livingsystems. Reactions involving combining smaller molecules to makelarger ones are also often endothermic and moÌecules of carbohydratesuch as glucose are mnch Ìarger than carbon dioxide or water.
0
135

MOLECULAR BIOLOGY
2r0100 200 300 400
C02lcm3m 3 air
', Figure 13 ln this graph the rate ofphotosVnthesis was measuredindirectlg bg measuring the change inplant biomass.
1 The maximum cerbondioxide concentration of theatmosphere is 380 cm3 m-3air.Whg is the concentration oftenlower near leaves?
2 ln what weather conditions iscerbon dioxide concentrationlikelg to be the limiting factorfor photosgnthesis?
40
30
c2OoåroI
0
Øoo¡
ØoEo5.çooo.c
The energy lor the conversion of carbon dioxide into carbohydrate isobtained by absorbing light. This is the reason for photosynthesis onlyoccurring in the light. The energy absorbed from light does notdisappear - it is converted to chemical energy in the carbohydrates.
Limiting factorsTemperature, light intensitg and carbon dioxideconcentration are poss¡ble limiting factors on therate of photosgnthesis.The rate of photosynthesis in a plant can be affected by threeexternal factors:
. temperature;o light intensity;o carbon dioxide concentration
Each of these factors can limit the rate if they are below the optimallevel. These three factors are therefore called limiting factors.According to the concept of limiting lactors, under any combinationof light intensity, temperature and carbon dioxide concentration, onlyone of the factors is actually limiting the rate of photosynthesis. Thisis the factor that is lurthest from its optimum. If the factor is changedto make it closer to the optimum, the rate of photosynthesis increases,but changing the other factors will have no effect, as they are not theIimiting factor.
Ol course, as the limiting factor is moved closer to its optimum, whilekeeping the other factors constant, a point will be reached wherethis factor is no longer the one that is furthest from its optimum andanother factor becomes the limiting factor. For example, at night, lightintensity is presumably the limiting factor for photosynthesis. Whenthe sun rises and light intensity increases, temperature will usuallytake over as the limiting factor. As the temperatllre increases duringthe morning, carbon dioxide concentration might well become thelimiting factor.
@ Controlled variables in limiting factorexPeriments
Experimental design: controlling relevant variables inphotosUnthesis experiments is essential.In any experiment, it is important to control all variables other thanthe independent and dependent variable that you are investigating'The independent variable is the one that you deliberately vary in theexperiment with a range of levels that you choose. The dependentvariable is what you measure during the experiment, to see if it isaffected by the independent variable.
136

2.9 PHOTOSYNTHESIS
It is essential during this type of experiment to be sure that theindependent variable is the only factor that could be affectingthe dependent variable. All other variables that might affecr theindependent variable must therefore be controlled.These are questions that you need to answer when you are designingan experiment to investigate a limiting factor on photosynthesis:o Which limiting factor will you investigate? This will be your
independent variable.¡ How will you measure the rate of photosynthesis? This will be
your dependent variable.. How will you keep the other limiting factors at a constant and
optimal level? These will be your controlled variables.
@ lnrrestigating limiting fectorsDesign of experiments to investigate limiting factorson photosgnthes¡s.There are many possible experimental designs. A method that can beused to investigate the effect of carbon dioxide concentration is givenbelow. You could either modify this to investigate a different limitingfactor or you could develop an entirely different design.
Investigating the effect of carbon dioxide on photosgnthes¡sIf a stem of pondweed such as Elodea, Cabomba or Myriophyllum isplaced upside-down in water and the end of the stem is cut, bubblesof gas may be seen to escape. If these are collected and tested, theyare found to be mostly oxygen, produced by photosynthesis. Therate of oxygen production can be measured by counting the bubbles.Factors that might affect the rate of photosynthesis can be varied tofind out what effect this has. In the method below carbon dioxideconcentration is varied.
I Enough water to fill a large beaker is boiled and allowed to cool.This removes carbon dioxide and other dissolved gases.
2 The water is poured repeatedly from one beaker to another, tooxygenate the water. Very little carbon dioxide will dissolve.
3 A stem of pondweed is placed upside-down in the water and theend of its stem is cut. No bubbles are expected to emerge, as thewater contains almost no carbon dioxide. The temperature of thewater should be about 25 'C and the water should be very brightlyilluminated. Suitable apparatus is shor¡m in figure 15.
4 Enough sodium hydrogen carbonate is added to the beaker to raisethe carbon dioxide concentration by 0.01 mol dm r. If bubblesemerge, they are counted for 30 seconds, repeating the countsuntil two or three consistent results are obtainecl.
50
0
ooEfE'*GE
òs
Temperature100
t
0 1020304050temperature/"C
Figure 14 ln this graph therate of photosgnthesis wasmeasured indirectlg bgmeasuring the change inplant biomass
What was the optimumtemperature forphotosgnthesis in thisplant?
What was the maximumtemperature forphotosgnthesis?
2
L37

MOLECULAR BIOLOGY
hgdrogencarbonate
pondweed
water at 25oC
light source
Ä Figure 15 Apparatus for measuringphotosgnthesis rates in differentconcentrations of carbon dioxide
5 Enough sodium hydrogen carbonate is added to raise theconcentration by another 0.01 mol dmr. Bubble counts are donein the same way.
6 The procedure above is repeated again and again until furtherincreases in carbon dioxide do not affect the rate of bubbleproduction.
0uestionsI Why are the following procedures necessary?
a) Boiling and then cooling the water before the experiment.
b) Keeping the water at 25 "C and brightly illuminating it.c) Repeating bubble counts until several consistent counts have
been obtained.
2 What other factor could be investigated using bubble counts withpondweed and how would you design the experiment?
3 How could you make the measurement of the rate of oxygenproduction more accurate?
I

0uEsTl0!ls
0uestionsI Lipase is a digestive enzyme that accelerates
the breakdown of triglycerides in the smallintestine. In the laboratory, the rate of activityof lipase can be detected by a decline in pH.Explain what causes the pH to decline. Í41
2 Papain is a protease that can be extracted frompineapple fruits. Figure I6 shows the effectof temperature on the activity of papain. Theexperiment was performed using papain dissolvedin water and then repeated with the samequantity of papain that had been immobilized byattaching it to a soÌid surface. The results showthe percentage of the protein in the reactionmixture that was digested in a fixed time.
100 immobilized
PaParn
dissolvedpaparn
20 30 40 50 60 70 80temperature/"C
A Figure 16
a) (i) Outline the effects of temperature onthe activity of dissolved papain. Í21Explain the effects of temperature onthe activity of dissolved papain. t2lCompare the effect of temperature onthe activity of immobilized papain withthe effect on dissolved papain. î21Suggest a reason for the difference thatyou have described. [2]In some parts of the human body,enzymes are immobilized in membranes.Suggest one enzyme and a part of thebody where it would be useful for it tobe immobilized in a membrane. Í21
(ii)
b) (i)
( ii)
(iii)
3 The equation below summarizes the results ofmetabolic pathways used to produce ATP, usingenergy from the oxidation of glucose.
glucose f oxygen + (ADP * Pi) ---+
l80g l34.4drn1 l8.25kgcarbon dioxide * water + ATP
l34.4drn' l08g l8.25kg
a) (i) State the volume units that are shownin the equation. tll
(ii) State the mass units that are shown inthe equation. Í21
b) (i) Calculate the mass of ATP produced perdmr of oxygen. l2l
(ii) Calculate the mass of ATP produced perrace in table l. Í41
c) Explain how it is possible to synthesize suchlarge masses of ATP during races. I3l
d) During a l00m race, 80g of ATP is neededbut only 0.5 dmr of oxygen is consumed.Deduce how ATP is being produced. t3l
Length ofrace/m
Volume of oxggen consumed in cellrespiration during the race/dm3
1 500 36
10,000 150
4?,300 700
r Table 1
4 Figure 17 shows the effects of varying lightintensity on the carbon dioxide absorptionby leaves, at different, flxed carbon dioxideconcentrations and temperatures.
a) Deduce the limiting factor forphotosynthesis at:(i) w (ii) x (iii) Y (iv) z. t4)
b) Explain why curves I and II are the samebetween I and 7 units of light intensity. t3l
c) Explain the negative values for carbondioxide absorption when the leaves were inlow light intensities. tll
lV 0.4%c0, ar 30'c
lll 0.4%C0, ar 20'C
ll 0.13%C0, ar 30'CI 0.13%C0, ar 20"C
W
r234567light intensitg/arbilrarg units
EBOØoS5oC-oË4uä-ts20
6\0
913'= 12;flEro
!Ë8c(o^' bÀã5Ø^¡r-3o)U81.906t
À Figure 17

MOLECULAR BIOLOGY
5 Figure l8 shows the results of an experimentin which Chlorella cells were given light ofwavelengths from óó0 nm (red) up to 700 nm(far red). The rate of oxygen production byphotosynthesis was measured and the yieldof oxygen per photon of light was calculated.This gives a measure of the efficiencyof photosynthesis at each wavelength.The experiment was then repeated withsupplementary light with a wavelength of650 nm at the same time as each of thewavelengths from 660 to 700 nm, but with thesame overall intensity of light as in the firstexperiment.
o----o with supplementarg light
tr------Ð wilhout supplementarg light
650 680 700wavelength (nm)
r Figure 18 Photon gield of photosgnthesis in different lightintensities
a) Describe the relationship betweenwavelength of light and oxygen yield,when there was no supplementary light. [2]
b) Describe the effect of the supplementarylight. Í21
c) Explain how the error bars help in drawingconclusions from this experiment. Í21
d) The probable maximum yield of oxygenwas 0.125 molecules per photon of light.Calculate how many photons are neededto produce one oxygen molecule inphotosynthesis. I2l
e) Oxygen production by photolysis involvesthis reaction:
4HrO --+ 02+ 2H2O + 4H+ * 4e-Each photon of light is used to excite anelectron (raise it to a higher energy level).Calculate how many times each electronproduced by photolysis must be excitedduring the reactions of photosynthesis. t2l
0.15
0.10
0.05
EgocoocoCøo=oooEcoo¡xoo!oÐ