respiratory and metabolic functions of carbonic anhydrase...
TRANSCRIPT

275:1766-1779, 1998. Am J Physiol Regul Integr Comp Physioland Chris M. Wood Yuxiang Wang, Raymond P. Henry, Pamela M. Wright, George J. F. Heigenhauseranhydrase in exercised white muscle of trout Respiratory and metabolic functions of carbonic
You might find this additional information useful...
41 articles, 23 of which you can access free at: This article cites http://ajpregu.physiology.org/cgi/content/full/275/6/R1766#BIBL
1 other HighWire hosted article: This article has been cited by
[PDF] [Full Text] [Abstract]
, December 1, 2004; 287 (6): R1344-R1353. Am J Physiol Regulatory Integrative Comp PhysiolJ. Frolow and C. L. Milligan
(Oncorhynchus mykiss Walbaum)Hormonal regulation of glycogen metabolism in white muscle slices from rainbow trout
on the following topics: http://highwire.stanford.edu/lists/artbytopic.dtlcan be found at Medline items on this article's topics
Medicine .. Exercise Physiology .. Exertion Physiology .. Salmoniformes Biochemistry .. Glycogen Biochemistry .. ATP
including high-resolution figures, can be found at: Updated information and services http://ajpregu.physiology.org/cgi/content/full/275/6/R1766
can be found at: Comparative PhysiologyAmerican Journal of Physiology - Regulatory, Integrative andabout Additional material and information
http://www.the-aps.org/publications/ajpregu
This information is current as of April 27, 2006 .
http://www.the-aps.org/.ESSN: 1522-1490. Visit our website at 0363-6119,Society, 9650 Rockville Pike, Bethesda MD 20814-3991. Copyright © 2005 by the American Physiological Society. ISSN:
from molecules to humans, including clinical investigations. It is published 12 times a year (monthly) by the American Physiologicalilluminate normal or abnormal regulation and integration of physiological mechanisms at all levels of biological organization, ranging
publishes original investigations thatThe American Journal of Physiology - Regulatory, Integrative and Comparative Physiology
on April 27, 2006
ajpregu.physiology.orgD
ownloaded from
Respiratory and metabolic functions of carbonicanhydrase in exercised white muscle of trout
YUXIANG WANG,1,2 RAYMOND P. HENRY,3 PAMELA M. WRIGHT,2GEORGE J. F. HEIGENHAUSER,2 AND CHRIS M. WOOD2
2Department of Biology and Department of Medicine, McMaster University,Hamilton, Ontario, Canada L8S 4K1; 3Department of Zoology, Auburn University,Auburn, Alabama 36849–5414; and 1Division of Marine Biology and Fisheries, RosenstielSchool of Marine and Atmospheric Science, University of Miami, Miami, Florida 33149
Wang, Yuxiang, Raymond P. Henry, Pamela M. Wright,George J. F. Heigenhauser, and Chris M. Wood. Respira-tory and metabolic functions of carbonic anhydrase in exer-cised white muscle of trout. Am. J. Physiol. 275 (RegulatoryIntegrative Comp. Physiol. 44): R1766–R1779, 1998.—Electrical stimulation of a trout saline-perfused trunk prepa-ration resulted in metabolic and respiratory responses compa-rable to those occurring after exhaustive exercise in vivo.Recovery of intracellular acid-base status and glycogen resyn-thesis were faster than in vivo. Intracellular carbonic anhy-drase (ICF CA) blockade elevated intracellular PCO2 relativeto untreated postexercise controls, whereas extracellular CA(ECF CA) blockade did not, in contrast to previous work withmuscle at rest. ECF CA blockade had only a transient effecton postexercise CO2 and ammonia efflux. The relatively smallpool of membrane-associated CA appears to be overwhelmedby exercise-induced CO2 production in muscle. Transmem-brane ammonia efflux appears to shift from diffusion primar-ily as NH3 at rest, which is facilitated by ECF CA, tomovement predominantly as NH4
1 after exercise, which isindependent of CA. The postponed recovery of intracellularpH caused by either or both ECF and ICF CA inhibition wasconsistent with reduced metabolic acid and lactate excretionfrom muscle. Creatine phosphate resynthesis was delayed byCA inhibition, whereas ATP replenishment was not affected.Delayed glycogen recovery indicates that HCO3
2-dependentpathway(s) may be involved in glyconeogenesis.
acid-base regulation; carbonic anhydrase inhibition; ammo-nia; energy-rich phosphates; glycolytic metabolism; benzol-amide; acetazolamide
CARBONIC ANHYDRASE (CA) catalyzes the reversible hy-dration/dehydration of CO2 as shown by
CO2 1 H2OCA
;≤≤≤= H1 1 HCO32
The chemical species in the catalyzed reaction involveboth a respiratory end product (CO2) and a potentialmetabolic precursor (HCO3
2). Because of this, CA hasbeen studied as an enzyme of respiratory CO2 transportand excretion and as a metabolic enzyme that channelsHCO3
2 into various synthetic pathways (for reviews, seeRefs. 16, 18, 41).
Nowhere is this multifunctional aspect of CA moreapparent than in skeletal muscle, where CA is compart-mentalized to the cytoplasm, the sarcolemma, thesarcoplasmic reticulum, and the mitochondria (re-viewed in Refs. 16, 18). In mammals, CA has beenshown to facilitate the excretion of CO2 across thesarcolemma in both type I (red, slow twitch, oxidative)and type II (white, fast twitch, glycolytic) fibers (11, 12).This prevents the buildup of CO2 in the intracellularfluid and the occurrence of an intracellular respiratoryacidosis that would disrupt normal physiological andmetabolic functions. This pattern appears to hold forlower vertebrates as well. Sarcolemmal CA appears tofacilitate the movement of CO2 out of resting troutwhite muscle, and both sarcolemma and cytoplasmicCA appear to be involved in the efflux of NH3 (20).
This is interesting from an evolutionary point of viewbecause the prevailing paradigm has always been thatthe aquatic medium, due to its high capacitance forCO2, did not exert any selective pressure on the develop-ment of physiological mechanisms for CO2 transportand excretion. The fact that a relatively large fluidcompartment such as blood or water could act as avirtually unlimited sink for CO2 was considered themost important factor in shaping the mechanisms ofCO2 excretion in aquatic vertebrates (41). Similararguments have been made for NH3 excretion. (e.g.,Ref. 3). However, membrane-associated CA orientedtoward the extracellular fluid has now been shown to beimportant in facilitating both CO2 and NH3 fluxesacross the sarcolemma, even in the presence of rela-tively small PCO2 and NH3 pressure (PNH3
) gradients, inthe latter case by providing H1 ions for diffusiontrapping of NH3 as NH4
1 (19). Those findings are ingeneral agreement with the prevailing idea in mamma-lian physiology that the relatively small amount ofmembrane-associated CAfunctions in directional trans-port and the much larger pool of cytoplasmic CAfunctions primarily in maintaining instantaneous equi-librium among the chemical species of CO2 in theintracellular fluid (ICF; Ref. 24). Our earlier study (20)of the transport function of CA in a lower vertebratewas performed on a resting perfused trout musclepreparation with a low metabolic rate. Sarcolemma-associated CA makes up only ,5% of the total muscleCA activity in this preparation, with the cytoplasmicpool comprising almost all of the remaining balance.Therefore, it would be interesting to know if thatparticular subcellular fraction of CA remains the func-
The costs of publication of this article were defrayed in part by thepayment of page charges. The article must therefore be herebymarked ‘‘advertisement’’ in accordance with 18 U.S.C. Section 1734solely to indicate this fact.
0363-6119/98 $5.00 Copyright r 1998 the American Physiological SocietyR1766
on April 27, 2006
ajpregu.physiology.orgD
ownloaded from

tionally important component in CO2 excretion underconditions of maximal CO2 production (i.e., exercise) orwhether the larger pool of cytoplasmic CA becomesmore significant.
It would also be interesting to know whether the roleof either or both fractions of muscle CA becomes moreimportant after strenuous exercise, when NH3 produc-tion in muscle becomes greatly elevated because ofadenylate deamination (28, 40). Our recent work sug-gests that muscle cell membrane permeability to ammo-nia alters markedly after strenuous exercise, such thatits NH4
1 permeability increases relative to its NH3permeability at this time (43, 45). As a result, ammoniadistribution becomes more dependent on the mem-brane potential (which sets the electrochemical gradi-ent governing NH4
1 movements) and less dependent onthe pH gradient (which sets the PNH3
gradient govern-ing NH3 movements). This appears to help retainammonia in muscle for adenylate resynthesis (see Refs.49, 50). If this is the case, then the importance of CA inpromoting ammonia efflux by NH3 diffusion trappingmight become less important after exercise.
With respect to the role of CA in metabolism, the liverhas been the major organ of focus in mammals becauseit is the primary site of ureagenesis and gluconeogen-esis (along with the kidney); skeletal muscle has beenless thoroughly studied. However, in mammals it isknown that CAinhibition alters skeletal muscle contrac-tile properties, utilization of metabolic substrates, andaccumulation of metabolic intermediates and end prod-ucts, especially during exercise (9, 11, 19). However,detailed studies on the exact role(s) of CA in theseprocesses are lacking. In the relatively few lowervertebrates that have been investigated, the hepaticCori cycle appears to be much less important than inmammals, and significant gluconeogenesis occurs inseveral other tissues, including skeletal muscle (4, 8,14, 15). In teleost fish (in contrast to most highervertebrates), there is now strong but circumstantialevidence that glyconeogenesis occurs in white muscle,but the exact metabolic pathway involved has neverbeen elucidated (26, 29, 37, 48). Three potential routesfor lactate (Lac) reprocessing in fish have been pro-posed, two of which involve a carboxylation step thatwould suggest the involvement of CA (i.e., carboxyl-ation of pyruvate either via pyruvate carboxylase or viathe reversal of malic enzyme; Refs. 14, 26, 30). Thethird involves the conversion of pyruvate to phospho-enolpyruvate via the reversal of pyruvate kinase (37)and therefore would be independent of HCO3
2 andpresumably independent of CA activity as well. Evi-dence as to the involvement or noninvolvement of CA inthe process of glyconeogenesis from Lac would certainlyhelp clarify the pathway(s) involved.
Another potential involvement of CA is in phospha-gen metabolism. In mammals, CA inhibition has beenreported to cause the breakdown of creatine phosphate(PCr) and an increase in ADP and inorganic phosphate(9, 11). Whether the breakdown of energy-rich phos-phates is the result of respiratory acidosis remainsunclear. In strenuously exercised trout white muscle,
PCr is severely depleted, whereas ATP is less affected,but the former recovers much more quickly in parallelto the clearance of postexercise respiratory acidosis(43). Possibly, elevated PCO2 acts as an end productinhibitor of pyruvate decarboxylation, thereby settingan upper limit to the rate of the tricarboxylic acid cycleand PCr resynthesis.
In this study, we have modified our isolated-perfusedtrout tail trunk preparation (19, 45) so that it can beexercised in situ. The preparation has been used tostudy the transport and metabolic roles of CA in whitemuscle under conditions of both exercise and postexer-cise recovery. Specifically, with respect to transport, thequestion of what roles sarcolemma and/or cytoplasmicCA play in facilitating the transport of CO2 and NH3across the trout muscle cell membrane has been ad-dressed under conditions of greatly increased CO2 andNH3 production. With respect to metabolism, the poten-tial roles of the two muscle CA pools in Lac clearance,glycogen (Gly) resynthesis, and phosphagen dynamicsafter exercise have all been investigated. The resultsdemonstrate the importance of multiple functions ofboth muscle CA pools in the exercise and postexercisephysiology of the rainbow trout.
MATERIALS AND METHODS
Rainbow trout (Oncorhynchus mykiss Walbaum) were pur-chased from Spring Valley Trout Farm, Petersburg, ON,Canada. The fish (initially 400–600 g) were held in two800-liter fiberglass aquariums for 4–6 mo to grow to thedesired size (700–1,000 g) before the experiment. Dechlori-nated Hamilton tap water (meq/l; 0.6 Na1, 0.8 Cl2, 1.8 Ca21,0.5 Mg21, 0.04 K1; pH 8.0, temperature 5–14°C) was suppliedto the fish holding tanks. The trout were fed with high-proteinfloating pellets (Aquaculture Zeigler Brothers) three times aweek. However they were not fed for 5 days before anexperiment, during which time they were kept at 15 6 1°C.Metabolic rate and ammonia production in fish are extremelysensitive to feeding status; we have found that 5 days ofstarvation is sufficient to achieve stable O2 consumption andammonia production rates in trout of this size, withoutsignificant depletion of muscle Gly reserve (C. M. Wood,unpublished data). Before perfusion, the experimental fishwere anesthetized with a high concentration of MS-222 (0.5g/l neutralized with NaOH); fish usually lost equilibrium andceased ventilation within 1 min without struggling. The tailportion was then severed by section at a point immediatelyposterior to the anus and weighed. In addition, in the controlseries (see below), an initial muscle sample was excised froma point immediately anterior to the point of section (seebelow). The fish was then killed by a blow on the head.
Experimental design and protocols. An isolated tail trunkperfusion preparation developed earlier by our laboratorywas employed in this study (refer to Ref. 45 for a detaileddescription). In brief, Cortland salmonid saline with 3%(wt/vol) BSA (fraction V, Sigma) was used as the basicperfusate. The perfusate was saturated with oxygen, whereasPCO2 was kept constant at ,2 Torr (i.e., ,0.25% CO2, balanceO2). Perfusate pH was adjusted to the desired level by varyingNaHCO3 concentration. Immediately after the tail trunk wascut off, catheters (Clay-Adams PE-90) were implanted intothe caudal artery and vein and a ligature around the vertebralcolumn was applied to secure them in place. The perfused tailtrunk was placed in a thermocontrolled (15 6 1°C) saline
R1767CARBONIC ANHYDRASE IN TROUT WHITE MUSCLE
on April 27, 2006
ajpregu.physiology.orgD
ownloaded from
bath, and the perfusate was also equilibrated to the sametemperature before entering the trunk. The standard perfu-sion rate was 2 ml·min21 ·100 g21 tail weight. For the first 30min, a heparinized perfusate (50 IU/ml at pH 7.9; to simulateresting arterial pH values) was employed to purge red bloodcells and to stabilize the preparation. After the initial 30 min,heparin-free perfusate was used. Venous (outflow) followed byarterial (inflow) perfusate samples [2 ml, representing time 0(T0)] were then collected through sampling ports with the useof gas-tight Hamilton syringes.
Immediately after the initial 30-min perfusion and perfus-ate sampling, exhaustive exercise was induced by the directelectrical stimulation of trunk muscle while perfusion at pH7.9 continued. Shielded bipolar platinum electrode pads wereplaced on both sides of the tail trunk and held in place by agauze bandage. Muscle was stimulated for 4 min at 100 V,20-ms pulse duration, and 10 pulses/s frequency, with thepolarity being altered at 15-s intervals to exercise the musclein an undulatory manner similar to that of natural swim-ming. Muscle fatigue and exhaustion were noted as a lack ofresponse to the stimulation toward the end of the 4-minexercise period.
After stimulation, the tail trunk was perfused with salineadjusted to a pH of 7.4 to simulate in vivo postexercisearterial acid-base conditions (43). Venous and arterial perfus-ate samples were then taken at 5 (T5), 15 (T15), and 30 (T30)min postexercise as described above. Part of the arterial andvenous perfusate samples was used to measure pH, total CO2(TCO2), PO2, protein, and water content immediately onsampling. Aliquots (300 µl) of each were deproteinized in 600µl of 6% perchloric acid (PCA) and stored at 270°C for lateranalysis of ammonia (Amm) and Lac concentrations, whilethe remainder of the sample was used to measure Na1, K1,and Cl2 concentration.
Four experimental series were performed: a control andthree experimental treatments (Table 1). In all series, a finalmuscle sample (3–5 g; in the dorsal area above the lateralline) was excised from the perfused tail trunk at the end ofeach 60-min experiment, representing T30 in the protocol.The tissue samples were freeze-clamped quickly with alumi-num tongs prechilled in liquid N2 and then stored in liquid N2for later analysis of pHi, muscle tissue water content, andTCO2, Lac, Amm, Gly, ATP, PCr, Na1, K1, and Cl2 concentra-tions.
The control series employed a drug-free perfusate (pH 7.9before and during exercise, pH 7.4 thereafter) throughout theexperiment. In the control series only, at the start of eachexperiment, immediately after the tail was cut off, a muscletissue sample (3–5 g, same location) was taken from a pointjust anterior to the section to serve as a reference for restingin vivo levels of tissue metabolites and electrolytes. Also, inthe control series only, two extra sets of preparations wererun (i.e., additional to the preparations that ended at T30).These were terminated at 5 (T5) and 15 (T15) min afterexercise, so that muscle samples could be taken at these timesto establish a more detailed profile of the postexercise changesin muscle pHi and metabolic status.
In the first experimental treatment, a CA inhibitor of lowmembrane permeability, benzolamide (BZ), was used to selec-tively block CA activity in the extracellular fluid (ECF)(BZECF). Immediately after the initial 30-min perfusion towash out red blood cells and the 4 min of exercise, thedrug-free perfusate (pH 7.9) was changed to one containing10 µM BZ (pH 7.4) for another 30 min. A perfusate BZconcentration of 10 µM (,1,000 3 the inhibition constant)was applied to achieve ECF CA inhibition while avoiding ICFCA inhibition (13). Arterial and venous perfusate samples(T5, T15, T30) and muscle samples (T30) were collected asdescribed above. Unlike our study on resting fish wherequaternary ammonium sulfanilamide (QAS) was used toinhibit the ECF-oriented CA (20), BZ was chosen in thepresent study because, in our preliminary tests, QAS wasfound to retard the response of the tail trunk to the electricalstimulation. Furthermore, because CA inhibition in skeletalmuscle is known to inhibit various mechanical and metabolicaspects of contraction (see introduction), BZ was not intro-duced to the tail trunk until the exercise routine was com-pleted.
The second experimental treatment used the common,more membrane-permeable CA inhibitor acetazolamide (AZ)to inhibit ICF (cytoplasmic) CA only (AZICF) by a previouslyestablished protocol (20). At 12–16 h before the experiment,fish were anesthetized, weighed, and injected via caudalpuncture with sufficient stock solution of 100 mM AZ toproduce an initial extracellular concentration of 100 µM,assuming an ECF volume (ECFV) of 25% of the fish’s weight.The fish were left for 12–16 h in individual, darkened acrylicboxes served with aerated flowing water, thereby allowing theAZ sufficient time to equilibrate between the ECF and themuscle ICF. For the first 30 min of control perfusion, theperfusate contained 100 µM AZ (pH 7.9) to maintain full ICFinhibition. However, AZ was not used in the 30-min postexer-cise perfusate (pH 7.4) so as to wash the AZ out of theextracellular space. In this case, ECF CA activity would berestored, whereas the inhibition to ICF CA would remain dueto the slow membrane permeability of AZ (20). Perfusatesamples were taken at T5, T15, and T30, and muscle sampleswere taken at T30.
The third experimental treatment evaluated the effect oftotal CA inhibition (ICF and ECF CA blockade, AZtot). Again,the fish were first preinjected with AZ as described above. Incontrast, the tail trunks were perfused with 100 µM AZ forthe entire 60 min of perfusion (i.e., for 30 min preexercise atpH 7.9 and for 30 min postexercise at pH 7.4). Our previousstudy demonstrated that this protocol produced the highestlevel of CA inhibition (84.8%) of all three treatments (20).Perfusate samples were taken at T5, T15, and T30, andmuscle samples were taken at T30.
Finally, all data for resting conditions, i.e., perfusate andmuscle acid-base status, muscle metabolites, and metabolitefluxes, were obtained from muscle and perfusate samples
Table 1. Experimental design for restingand exercised fish
ControlTotal CA
BlockICF CABlock
ECF CABlock
Resting No inhibitor AZtot(100 µM)
AZICF(100 µM)
QASECF(5 mM)
Preinjection Preinjection No preinjec-tion
WithoutECF
With ECFWashout
WashoutPostexercise No inhibitor AZtot
(100 µM)AZICF
(100 µM)BZECF
(10 µM)Preinjection Preinjection No preinjec-
tionWithout
ECFWith ECFWashout
Washout
Resting series were performed in our earlier study (22, 25, 36). AZ,acetazolamide, QAS, quarternary ammonium sulfanilamide; BZ,benzolamide; ICF, intracellular fluid; ECF, extracellular fluid; tot,total; CA, carbonic anhydrase.
R1768 CARBONIC ANHYDRASE IN TROUT WHITE MUSCLE
on April 27, 2006
ajpregu.physiology.orgD
ownloaded from
taken during our earlier study on resting tail trunks (20).These preparations were perfused for the same period of time(but at pH 7.9 throughout), subjected to either a controlperfusion (no drugs) or a similar treatments with CA inhibi-tors, and sampled at T30 (but without exercise). ExtracellularCA inhibition was achieved using QAS. However, ion fluxrates were not measured in our previous study on restingpreparations. Therefore T0 values collected before the exer-cise regimen were used as the reference points for thepostexercise ion flux data. Note that because ECF CA block-ade was applied only after exercise, the reference point is notparallel for this treatment only.
Analytic protocols. Perfusate pH was measured with aRadiometer glass capillary electrode (G297-G2 and K497calomel reference electrode) thermostatted to 15 6 1°C andregistered on a Radiometer PHM84 pH meter. PO2 wasdetermined using a thermostatted Radiometer PO2 electrode(E5046) connected to PHM72 meter. Total O2 content wascalculated based on the measured PO2 (Torr) and the solubil-ity coefficient aO2 (1.77 µmol · l21 ·Torr21) at 15°C (2). TCO2
wasmeasured on 100 µl perfusate sample using a total CO2analyzer (Corning 965). PCO2 and the concentration of HCO3
2
([HCO32]) were calculated by rearrangement of the Hender-
son-Hasselbalch equation with appropriate constants (aCO2and pK8) for trout plasma at 15°C (2). Perfusate ion concentra-tions ([Na1], [K1], and [Cl2]) measurements were conductedon a specific electrode (AVL 983-S Electrolyte Analyzer). Theperfusate Lac and total Amm (TAmm) concentrations weredetermined by the Sigma L-lactate dehydrogenase and gluta-mate dehydrogenase assays (both NAD/NADH coupled), re-spectively. The perfusate total protein and water contentwere determined with a refractometer (American Optical).The nonbicarbonate buffer capacity (b 5 25.54 6 0.15 mM[HCO3
2] pH unit) of the perfusate was determined in aprevious study (45).
One portion of each freeze-clamped muscle sample wasstored in liquid N2 and later pulverized in liquid N2 with aninsulated mortar and pestle. An aliquot (,200 mg) of thismuscle tissue powder was used to measure intracellular pH(pHi) and TCO2 (TiCO2
) with the homogenization technique(33). Intracellular PCO2 and [HCO3
2] were calculated using theHenderson-Hasselbalch equation as outlined above, afterappropriate correction of TiCO2
values for trapped ECF TCO2(see below). A second aliquot (,100 mg) of tissue powder wasdeproteinized in 1 ml 8% PCA and stored in liquid N2 fortissue ammonia analysis by a modified glutamate dehydroge-nase method (23). A third, much larger aliquot was lyophi-lized for 64 h and used for tissue PCr, ATP, Gly, Lac, and ionanalysis. Muscle PCr, ATP, and Gly concentrations wereanalyzed by standard enzymatic techniques (1). Tissue Lacwas determined by the same enzymatic assay describedabove. For tissue Na1, K1, and Cl2 measurements, thefreeze-dried tissue powder (,20 mg) was extracted in 1NHNO3 (1 ml) at 50°C for 48 h. The supernatant was used for[Na1] and [K1] analysis by flame atomic absorption spectrom-etry (Varian AA-1275). Tissue [Cl2] was measured by coulo-metric titration (Radiometer CMT10). A common standardwas used to calibrate all the ion measurements in bothperfusate and muscle tissue.
A second portion of muscle tissue (nonpulverized; 200–300mg) was used to determine the muscle tissue water content bydrying at 70°C in an oven for over 48 h to constant weight.
In addition, in the BZ series, another portion of nonpulver-ized muscle tissue was shipped to Auburn University on dryice and used for muscle CA activity measurement. For theother groups, muscle CA activities were taken from measure-ments on identical protocols in our previous study (20). For
this assay, frozen tissue (,250 mg) was homogenized for 30 sin 2 ml buffer (in mM: 75 mannitol, 225 sucrose, 10 Tris-PO4,pH 7.4) with the use of an Omni 1000 motor-driven homog-enizer and then sonicated (35 W, 15 s, Heat Systems Micro-son) and centrifuged at 10,000 g for 20 min at 4°C (SorvallRC5-B). The supernatant was analyzed for CA activity at 4°Cby the electrometric pH method (17).
Calculations. Metabolic acid (DHm1) added to the perfusate
from the perfused muscle trunk was calculated according toMilligan and Wood (27)
DHm1 5 [HCO3
2]a 2 [HCO32]v 2 b 3 (pHa 2 pHv)
where the subscripts a and v denote measured values inarterial and venous perfusate.
Flux rates of Lac, TAmm, DHm1, total CO2, O2, and ions (Na1,
K1, and Cl2) were calculated according to the Fick principleusing the perfusion rate (1.2 l ·kg21 ·h21 ) and the differencesin concentration between arterial inflow and venous outflow.
Intracellular fluid volume (ICFV) and ECFV were calcu-lated based on water content, [K1], and [Cl2] in whole muscletissue and venous perfusate using the ‘‘Cl2 2 K1 space’’concept of Conway (5) described earlier (45). All intracellularmetabolite and electrolyte concentrations were corrected fortrapped ECF content in whole muscle tissue and expressedper unit ICF water, whereas the concentrations in the perfus-ate were expressed per unit ECF water.
Statistical analyses. Data are presented as means 6 SE(n), where n represents the number of preparations in eachtreatment group. The F test was performed to identify anysignificant differences in variance between the treatment andcontrol groups or between the resting and postexercise groupsin each treatment, then appropriate t-tests were performed toassess whether differences existed between the tested groups(P # 0.05). One-way ANOVA and Duncan’s multiple-rangeand critical range test were performed for multiple compari-sons with reference to the control (P # 0.05).
RESULTS
The exercise protocol introduced by electrical stimu-lation resulted in vigorous muscle contraction in thecontrol group and in all experimental groups, with themuscle exhausting gradually toward the end of the4-min exercise regimen. The BZ treatment was notapplied until immediately after the end of exercise. Thetwo AZ treatment groups did not show any signs ofearlier exhaustion or less muscle contraction as sug-gested in studies on higher vertebrates (10, 11). Theperfusion pressure increased by ,5 cmH2O immedi-ately after exercise, but returned to the original level(,10 cmH2O) within 10 min.
AZICF and AZtot treatments, applied exactly as in thepresent study, resulted in 77.8 and 84.8% inhibition,respectively, of CA activity in the perfused tail trunkmuscle (20); for methodological reasons, these arebelieved to be conservative estimates. In contrast, BZtreatment resulted in only a 38.0% inhibition of CAactivity, which is almost identical to the 40.4% inhibi-tion rate reported earlier for the other ECF CA inhibi-tor QAS (20).
Acid-base status and gas exchange. At rest, the pHi ofperfused white muscle was ,7.28, comparable to the invivo value of 7.25 6 0.02 (n 5 8) measured at the time ofdeath, and after exercise decreased by ,0.6 units to
R1769CARBONIC ANHYDRASE IN TROUT WHITE MUSCLE
on April 27, 2006
ajpregu.physiology.orgD
ownloaded from
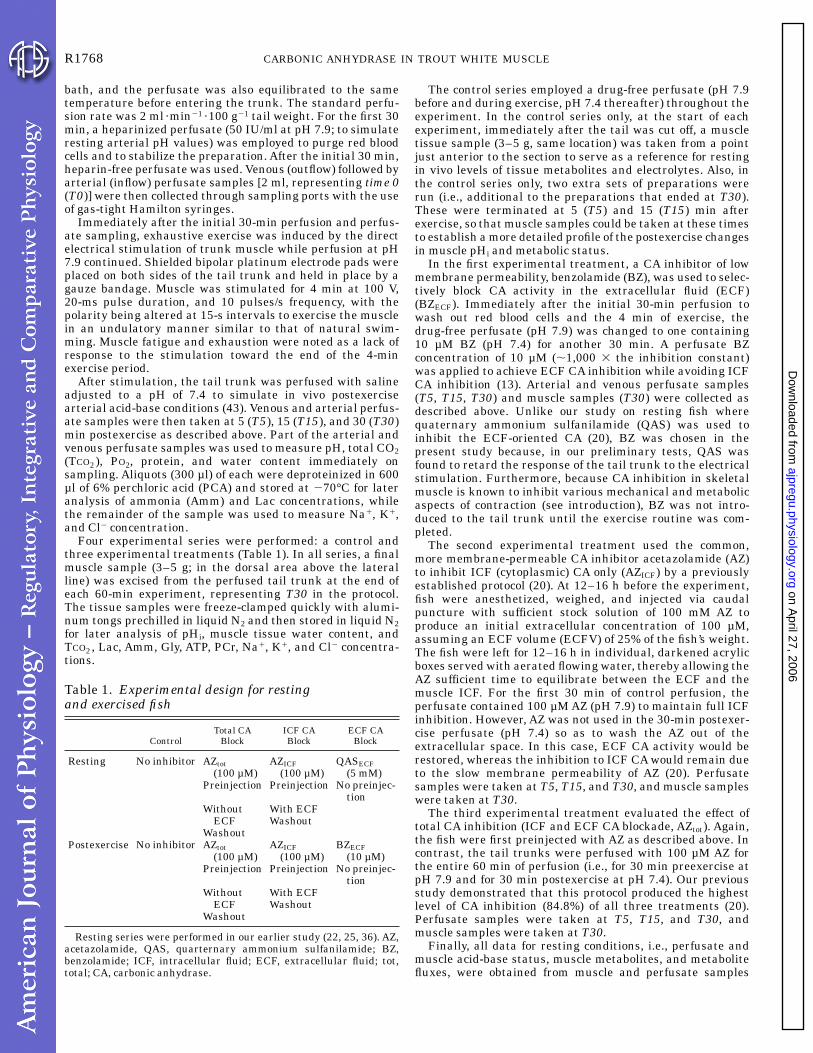
6.73 at T5 in the control series (Fig. 1). This change,occurring after 4 min of in situ electrical stimulation ofthe perfused tail trunk, was comparable to reportedvalues in the white muscle of intact trout under com-monly used in vivo exercise protocols, such as 6 min ofhand chasing (27, 37, 39, 43). However, in contrast tothe in vivo situation where either a further decrease orno change in pHi occurs by 30 min, pHi recoveredrelatively quickly to 6.82 at T15 and 7.07 at T30 in thecontrol group. This value was still significantly lowerthan the initial in vivo resting pHi and the restingvalues in perfused preparations.
In the three experimental groups treated with CAinhibitors, muscle pHi at rest (data reported in 20)remained at the control resting levels. Postexercise pHimeasurements were taken only at T30; in comparisonwith corresponding resting values, pHi remained muchmore depressed at this time in all three treatments(Fig. 1). AZICF produced the greatest depression ofpostexercise pHi (6.89), whereas BZECF produced theleast depression (6.99). In all three cases, these differ-ences were significant relative to the control pHi at T30.
Before exercise (T0), outflowing perfusate pH (pHv)was ,0.1 unit below the inflowing pHa of ,7.90 in bothcontrol and experimental series. The resting arterial-venous (a-v) difference in pH (T30) showed the samepattern (Fig. 1). In the control series, this differenceincreased after exercise to ,0.3 units below the newinflowing pHa of 7.40. These values remained stable atT5, T15, and T30. In all three CA inhibition treatments,the outflowing perfusate pHv values were significantlyhigher compared with the corresponding control valuesat T15 and T30, and also at T5 in the BZECF treatment
only. Thus the pHa 2 pHv difference decreased signifi-cantly at these times relative to the control series,especially in BZECF series. These higher pH values inthe outflowing perfusate reflected the slower correctionof intracellular acidosis in the three treatment groups(Fig. 1).
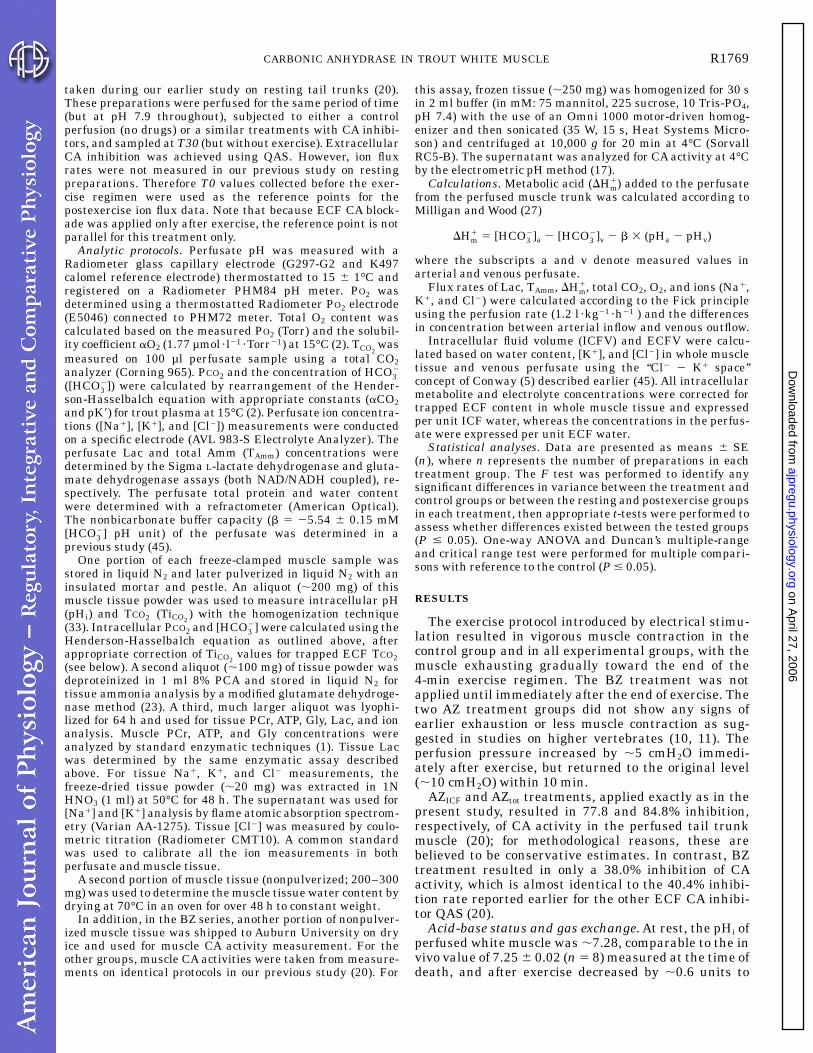
Before exercise (T0), the outflowing perfusate PCO2(PvCO2
) was ,3.5 Torr relative to an inflowing PCO2(PaCO2
) of ,2 Torr (Fig. 2A). After exercise, PvCO2increased ,2.5-fold at T5, declining only slightly byT30 in the control group (Fig. 2A). CA blockade did notaffect PvCO2
at rest, and the same general postexercisepattern was seen in all three treatment groups. How-ever, the postexercise PvCO2
elevation was significantlyattenuated throughout the recovery period by the BZECFtreatment and at T30 by the AZICF treatment (Fig. 2A),in general agreement with the pHv data (Fig. 1).
In this perfused trunk preparation, resting musclehad an intracellular PCO2 of 7.31 6 0.63 Torr (n 5 8) andan intracellular TCO2 of 6.21 6 0.61 mM (n 5 8), bothmarginally higher (0.10 # P # 0.05) than the in vivovalues measured at the time of death (PCO2 5 5.54 60.76 Torr, n 5 8; TCO2 5 4.69 6 0.61 mM, n 5 8). Theseresting values in the perfused muscle were unaffectedby AZICF or AZtot treatment, but extracellular inhibitionsignificantly elevated intracellular PCO2 without a sig-nificant change in TCO2 (Fig. 2, A and B; data reportedin Ref. 20).
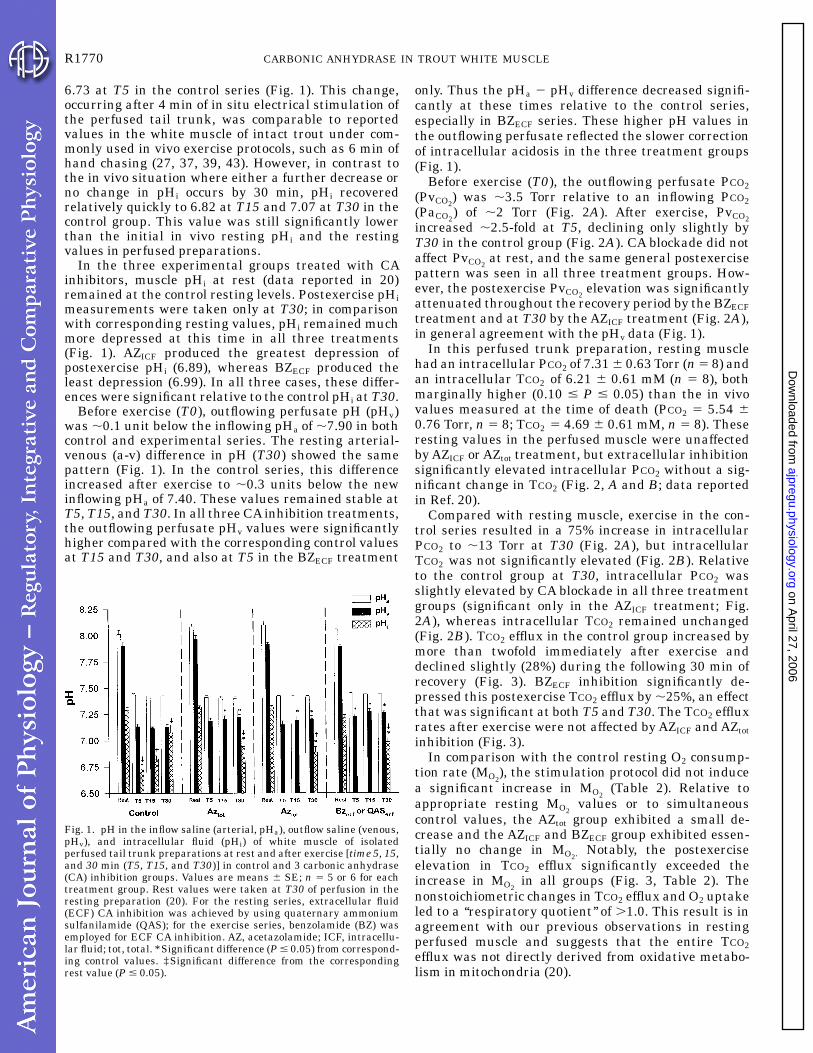
Compared with resting muscle, exercise in the con-trol series resulted in a 75% increase in intracellularPCO2 to ,13 Torr at T30 (Fig. 2A), but intracellularTCO2 was not significantly elevated (Fig. 2B). Relativeto the control group at T30, intracellular PCO2 wasslightly elevated by CA blockade in all three treatmentgroups (significant only in the AZICF treatment; Fig.2A), whereas intracellular TCO2 remained unchanged(Fig. 2B). TCO2 efflux in the control group increased bymore than twofold immediately after exercise anddeclined slightly (28%) during the following 30 min ofrecovery (Fig. 3). BZECF inhibition significantly de-pressed this postexercise TCO2 efflux by ,25%, an effectthat was significant at both T5 and T30. The TCO2 effluxrates after exercise were not affected by AZICF and AZtotinhibition (Fig. 3).
In comparison with the control resting O2 consump-tion rate (MO2
), the stimulation protocol did not inducea significant increase in MO2
(Table 2). Relative toappropriate resting MO2
values or to simultaneouscontrol values, the AZtot group exhibited a small de-crease and the AZICF and BZECF group exhibited essen-tially no change in MO2. Notably, the postexerciseelevation in TCO2 efflux significantly exceeded theincrease in MO2
in all groups (Fig. 3, Table 2). Thenonstoichiometric changes in TCO2 efflux and O2 uptakeled to a ‘‘respiratory quotient’’ of .1.0. This result is inagreement with our previous observations in restingperfused muscle and suggests that the entire TCO2efflux was not directly derived from oxidative metabo-lism in mitochondria (20).
Fig. 1. pH in the inflow saline (arterial, pHa), outflow saline (venous,pHv), and intracellular fluid (pHi) of white muscle of isolatedperfused tail trunk preparations at rest and after exercise [time 5, 15,and 30 min (T5, T15, and T30)] in control and 3 carbonic anhydrase(CA) inhibition groups. Values are means 6 SE; n 5 5 or 6 for eachtreatment group. Rest values were taken at T30 of perfusion in theresting preparation (20). For the resting series, extracellular fluid(ECF) CA inhibition was achieved by using quaternary ammoniumsulfanilamide (QAS); for the exercise series, benzolamide (BZ) wasemployed for ECF CA inhibition. AZ, acetazolamide; ICF, intracellu-lar fluid; tot, total. *Significant difference (P # 0.05) from correspond-ing control values. ‡Significant difference from the correspondingrest value (P # 0.05).
R1770 CARBONIC ANHYDRASE IN TROUT WHITE MUSCLE
on April 27, 2006
ajpregu.physiology.orgD
ownloaded from

At rest, DHm1 flux in the control group was slightly
negative, indicating metabolic acid uptake by the muscle(Fig. 4). With exercise, DHm
1 flux shifted to positivevalues at T15 and T30, indicating an unloading ofmetabolic protons from the muscle. At rest, AZtot and
AZICF CA inhibition had no effect on the direction ofDHm
1, but extracellular CA inhibition resulted in DHm1
efflux. In contrast, CA blockade, in all treatments,significantly altered this pattern of postexercise DHm
1
flux, which remained negative (i.e., inwardly directed)throughout the 30-min recovery period (Fig. 4). Thisinhibition of metabolic proton efflux was greatest in theAZtot treatment and least in the BZECF, a difference that
Fig. 2. A: calculated CO2 partial pressure (PCO2)in inflow saline (PaCO2
), outflow saline (PvCO2),
and white muscle intracellular (PiCO2) at rest and
after exercise (T5, T15, and T30) in the controland 3 CA inhibition groups. Values are expressedas Torr (7.5 Torr 5 1 kPa). B: measured intracellu-lar total CO2 (TiCO2
) in trout white muscle at restand T30 postexercise. Rest values were taken atT30 of perfusion in the resting preparation (20).For the resting series, ECF CA inhibition wasachieved by using QAS; for the exercise series, BZwas employed for ECF CA inhibition. *Signifi-cant difference (P # 0.05) from the correspondingcontrol values. ‡Significant difference from thecorresponding rest values (P # 0.05). Other de-tails as in legend of Fig. 1.
Fig. 3. Total CO2 efflux rate (TCO2; mmol·kg21 ·h21) from the perfused
tail trunk muscle in the control and 3 CA inhibition groups at rest andafter (T5, T15, and T30) exercise. Rest values were taken at T30 ofperfusion in the resting preparation (20). For the resting series, ECFCA inhibition was achieved by using QAS; for the exercise series, BZwas employed for ECF CA inhibition. *Significant difference (P #0.05) from corresponding control values. ‡Significant difference fromcorresponding rest values (P # 0.05). Other details as in legend ofFig. 1.
Table 2. MO2 and RQ of the perfused tail trunkat rest and after exercise
Control AZtot AZICF
BZECF orQASECF
MO2Rest 0.8060.04 0.8960.07 0.9360.04 0.8560.13T5 0.8560.06 0.7260.02*† 0.8460.04 0.8260.04T15 0.8160.06 0.7460.02*† 0.8760.05 0.7760.06T30 0.8060.04 0.7060.00*† 0.9060.03* 0.7860.06
RQRest 1.7460.31 1.1960.02 1.8660.36 1.2860.14T5 3.1760.22† 3.7060.34† 3.0560.43† 2.5460.12†T15 2.4760.18† 3.0160.49 2.3160.38† 2.2660.13†T30 2.5860.27† 2.8160.11 2.0660.32 1.7960.10*
Values are means 6 SE. Oxygen consumption rate (MO2) values are
in mmol·kg21 ·h21. Rest values were taken at time 30 min (T30) ofperfusion in the resting preparation (20). RQ, respiratory quotient;T5, T15, time 5 and 15 min, respectively. *Significantly different(P#0.05) from corresponding control values; †significantly different(P#0.05) from corresponding rest values.
R1771CARBONIC ANHYDRASE IN TROUT WHITE MUSCLE
on April 27, 2006
ajpregu.physiology.orgD
ownloaded from

was significant only at T30. The depressed DHm1 influx
in the BZECF group after exercise (e.g., T30) wasconsistent with the elevated DHm
1 efflux caused by extra-cellular CA inhibition at rest. In general these effectsagreed well with the lower values of pHi and higher val-ues of pHv accompanying CA inhibition seen in Fig. 1.
Effects on ammonia metabolism. Ammonia effluxrates (Fig. 5) were variable within each treatment
group but were generally lower than DHm1 flux rates
(Fig. 4), or approximately 10% of TCO2 efflux rates(Fig. 3). Ammonia efflux was unaffected by CA in-hibition at rest, and the efflux rates increased by morethan fivefold after exercise in the control series (Fig. 5).ECF CA blockade with BZECF reduced this postexerciseincrease by ,50% at 15 min; however, the attenuationwas only transient. AZtot and AZICF also led to minor,nonsignificant reductions (Fig. 5). It was our intentionto measure transmembrane ammonia gradients, aswas done in the previous study at rest (20), butunfortunately, most of the muscle samples were lost inthe failure of the ultra-cold freezer in which they werestored. As a result, intracellular ammonia was onlymeasured in vivo at the time of death (323 6 37 µM, n 58) and at rest (T30 of perfusion: 259 6 57 µM, n 5 8)and in the control group at T15 (4,199.97 6 632.91 µM,n 5 5) and T30 postexercise (2,031.82 6 586.35 µM,n 5 5).
Effects on energy-rich phosphates metabolism. Rest-ing muscle PCr and ATP concentrations in the perfusedtail trunk measured at T30 of perfusion were compa-rable to those measured in vivo at the time of death(Table 3). In parallel with experiments performed onintact fish in vivo (37, 43), muscle PCr in the perfusedtail trunk was almost depleted by exhaustive exercise
Fig. 4. Metabolic proton flux rate in the perfused tail trunk of thecontrol and 3 CA inhibition groups at rest and after (T5, T15, andT30) exercise. Positive and negative flux rate values indicate effluxand influx, respectively. Rest values were taken at T30 of perfusion inthe resting preparation (20). For the resting series, ECF CA inhibi-tion was achieved by using QAS; for the exercise series, BZ wasemployed for ECF CA inhibition *Significant difference (P # 0.05)from the corresponding control values. ‡Significant difference fromthe corresponding rest values (P # 0.05). Other details as in legend ofFig. 1.
Fig. 5. Total ammonia efflux from the perfused tail trunk muscle inthe control and 3 CA inhibition groups at rest and after (T5, T15, T30)exercise. Rest values were taken at T30 of perfusion in the restingpreparation (20). For the resting series, ECF CA inhibition wasachieved by using QAS; for the exercise series, BZ was employed forECF CA inhibition *Significant difference (P # 0.05) from correspond-ing control values. ‡Significant difference from corresponding restvalues (P # 0.05). Other details as in legend of Fig. 1.
Table 3. Intracellular PCr, ATP, Gly, and Lacconcentrations in resting and postexercise perfusedtrunk preparation subjected to different treatments
Control AZtot AZICF QAS or BZECF
PCrIn vivo 38.5763.44Rest 39.2661.78 16.8860.95* 36.6961.69 26.1962.50*T5 6.9263.14‡ NA NA NAT15 12.2160.56‡ NA NA NAT30 29.5263.32‡ 17.7661.63* 11.9363.06*† 22.8161.71*
ATPIn vivo 7.5160.56Rest 10.7560.13‡ 9.9460.55 11.0460.32 10.4560.47T5 8.9360.87 NA NA NAT15 7.3360.30 NA NA NAT30 8.2960.81† 8.8360.44 7.4260.45† 8.7960.23†
GlyIn vivo NARest 39.1762.6 30.5562.33* 30.5262.38* 40.0862.99T5 10.2162.26† NA NA NAT15 7.5362.39† NA NA NAT30 40.6666.56 25.9862.86* 24.4564.39* 27.8262.22*†
LacIn vivo 3.9760.86Rest 3.0460.59 4.5460.65 3.8261.61 4.4261.52T5 33.9468.82† NA NA NAT15 39.0966.01† NA NA NAT30 21.1864.03† 20.7765.61† 27.1267.81† 21.3263.82†
Values are means 6 SE in mmol/l ICF. In vivo values were obtainedfrom muscle in the control series at the time of death. Rest valueswere taken at T30 of perfusion in the resting preparation (20). In vivoconcentrations measured in the control fish before perfusion (i.e., attime of death) are included in comparison. *Significant differencebetween control and corresponding treatment values; †significantdifference of postexercise values relative to resting value within eachtreatment group (P#0.05), ‡significant difference between rest(perfused) and in vivo values in control series. NA, not available; PCr,creatine phosphate; Gly, glycogen; Lac, lactate.
R1772 CARBONIC ANHYDRASE IN TROUT WHITE MUSCLE
on April 27, 2006
ajpregu.physiology.orgD
ownloaded from

and was largely but not completely recovered after 30min (Table 3). In contrast, ATP levels were only moder-ately reduced after exercise, an effect that persisted atT15 and T30.
CA inhibition had no effect on muscle ATP levels atrest or on the ,20% depression seen at T30 (Table 3).However, the effects of CA inhibition on PCr metabo-lism were pronounced. Under resting conditions, totaland ECF CA inhibition reduced PCr reserves to 43 and67% of control resting levels, respectively. However,under ICF CA blockade, PCr concentrations remainedat control resting levels (Table 3). In the postexercisestate, the effects of CA inhibition were rather different.Muscle PCr concentrations at 30 min postexercise inthe AZtot and BZECF treatment groups remained signifi-cantly below the corresponding control levels (T30),and they did not differ from their initial resting values(Table 3). However, the AZICF treatment, which had notaffected PCr levels at rest, resulted in the largestdepression at T30 postexercise (Table 3). These resultssuggest that ECF CA activity may play a role inmaintaining the resting muscle PCr levels, whereasICF CA activity may be important for PCr recovery.
Effects on glycolytic metabolism and Lac efflux. Rest-ing muscle Gly concentrations (,40 mM) measured atT30 in the perfused tail trunk were high relative tomost in vivo studies (reviewed in Ref. 3) but wereinternally consistent; unfortunately in vivo samplestaken at the time of death in the present study forcomparison were lost. Lac values in the perfused prepa-ration at rest (3–4 mM) were comparable to in vivomeasurements (Table 3). In the control series, theintensive exercise protocol triggered a massive Glybreakdown similar to that seen in many in vivo studies(27, 37, 43). Surprisingly, under these in vitro condi-tions, Gly recovered much faster than in the in vivostudies (Table 3). It took a mere 30 min for muscle Glyto be completely restored to resting levels in theperfused tail trunk, a process that usually takes manyhours to complete in vivo. In concert with this change inmuscle Gly, there was a .10-fold elevation in muscleLac accumulation immediately after exercise in thecontrol series (Table 3). However, based on the stoichi-ometry of 1 Gly 5 2 Lac, the buildup of Lac accountedfor only about one-half of the Gly depletion at T5.Muscle Lac burden was reduced by 50% during the30-min recovery period; however, in contrast to Gly, itdid not return to the resting level. By T30, Lac clear-ance accounted for only ,40% of Gly resynthesis. Thislack of stoichiometric agreement between Gly and Lacdynamics indicates that part of glyconeogenesis mayhave originated from sources other than Lac (Table 3).
Under resting conditions, AZICF and AZtot treatmentsresulted in a significant decrease in muscle Gly storage,whereas extracellular blockade had no effect (Table 3).In parallel to the resting data, Gly in AZtot and AZICFalso remained significantly lower than the controlvalue after 30 min of recovery from exhaustive exercise.However, these concentrations did not differ signifi-cantly from the respective resting values in each treat-ment group. In contrast, extracellular CA blockade
(BZECF), which was without effect at rest, resulted in asubstantially lower muscle Gly concentration at T30postexercise in comparison to either the control seriesat this time or the corresponding rest value (Table 3).
Resting muscle Lac concentrations were not signifi-cantly affected by CA blockade. Similarly, there were nosignificant differences in muscle Lac among all fourtreatment groups 30 min after exercise (Table 3).
At rest, Lac flux rates (Fig. 6) from perfused muscle(net efflux) were comparable in magnitude but oppositein sign (net uptake) to those of metabolic protons (DHm
1;Fig. 4) and were unaffected by CA blockade. Afterexercise, Lac efflux rates increased approximately five-fold to a stable value throughout the 30-min postexer-cise period in the control series (Fig. 6). All threeCA-inhibition treatments significantly reduced thispostexercise elevation by 20–50%. This attenuationwas evident immediately after exercise and throughoutrecovery in AZtot and BZECF groups but only at T30 inthe AZICF group. Overall, extracellular CA inhibitionwith BZECF was most effective in reducing postexerciseLac efflux (by ,50%). Although these changes in Lacefflux associated with exercise and CA inhibition aresubstantial on a relative basis, it should be appreciatedthat on an absolute basis they are small relative to thepostexercise Lac burden in the muscle (Table 3). Atmost, measured Lac efflux could account for ,15% ofLac clearance from muscle over the 30-min recoveryperiod (Table 3), so it is not surprising that the effects ofCA inhibition on efflux rate (Fig. 6) were not reflected inmuscle Lac concentrations.
Effects of CA inhibition on muscle ionic balance. Ionand fluid levels in perfused trout muscle at rest (T30)were slightly altered relative to in vivo valuesmeasured at the time of death, with significant eleva-tions in intracellular Na1 and K1 as well as in ECFVand a reduction in intracellular Cl2 concentration(Table 4). In the postexercise control series at T30,intracellular Na1 and K1 concentrations as well as
Fig. 6. Net lactate efflux from the perfused tail trunk muscle incontrol and 3 CA inhibition treatment groups at rest and after (T5,T15, T30) exercise. Rest values were taken at T30 of perfusion in theresting preparation (20). For the resting series, ECF CA inhibitionwas achieved by using QAS; for the exercise series, BZ was employedfor ECF CA inhibition. *Significant difference (P # 0.05) fromcorresponding control values. ‡Significant difference from correspond-ing rest values (P # 0.05). Other details as in legend of Fig. 1.
R1773CARBONIC ANHYDRASE IN TROUT WHITE MUSCLE
on April 27, 2006
ajpregu.physiology.orgD
ownloaded from

ICFV were significantly elevated relative to the corre-sponding values at rest. CAblockade resulted in changesin intracellular Na1 concentration in comparison withvalues in exercise control, whereas K1 and Cl2 concen-trations remained unchanged. Among the changescaused by CA inhibition, AZtot and BZECF led to signifi-cant depressions in Na1 concentration. In contrast,AZICF caused Na1 concentration to increase. Intra- andextracellular fluid volumes were not significantly differ-ent among control and CA inhibition groups, indicatingthat fluid shifts do not occur with CA inhibition.
Muscle ionic concentrations may not be a particu-larly sensitive measure of changes in the actual fluxrates of ions. Ionic flux measurements themselves werequite variable (Fig. 7), reflecting the difficulty of measur-ing small changes in perfusate ion concentrationsagainst high background concentrations. Nevertheless,clear trends were seen. At rest, ionic flux rates betweenthe perfusate and the muscle were not significantlydifferent from zero (Na1, Cl2) or slightly negative(a small net K1 uptake; Fig. 7). After exercise, net Na1,Cl2, and K1 fluxes all increased (i.e., net losses), withthe increase in Cl2 flux appearing greatest at T5 andthe increases in Na1 and K1 appearing fairly consistentthroughout the recovery period. The changes for bothNa1 and Cl2 were significant throughout recovery,whereas those for K1 were significant only at T5(Fig. 7). CA inhibition had little effect on ionic flux ratesat rest or on the basic pattern of changes after exercise,in agreement with the muscle concentration data (Ta-ble 4). However at T30, Na1 losses were significantlyreduced by ,40%, whereas Cl2 and K1 losses wereslightly elevated relative to the control series by allthree blocking treatments. AZICF also elevated Cl2 lossat rest.
DISCUSSION
Preparation. In previous studies on the effects ofexercise on trout white muscle (44, 45), we first exer-cised the live fish by chasing them to exhaustion andthen quickly killed the animal to make the perfused tailtrunk preparation. A major improvement in the presentstudy was the development of a method to exercise theresting perfused tail trunk in situ, thereby allowing
Table 4. Intracellular Na1, K1, and Cl2 concentrations and ECFV and ICFV in restingand postexercise trout white muscle
Na1 K1 Cl2 ECFV ICFV
mmol/l ICF ml/g wet wt
In vivo 5.9560.46 148.0363.67 7.0960.63 0.07460.004 0.66260.006Rest 8.4060.52* 163.8764.45* 4.7560.43* 0.10260.005* 0.65660.008Postexercise (T30)
Control 13.8261.62† 174.6667.86† 4.0760.19 0.08960.006 0.68260.004†AZtot 7.6364.44* 188.89612.03† 3.9760.32† 0.09160.016 0.67060.021AZICF 20.7861.92*† 198.05612.80† 3.9160.30† 0.08560.008† 0.66960.016BZECF 9.5360.92* 189.7766.79† 3.8460.15† 0.08060.006† 0.69260.010†
Values are means 6 SE. In vivo values were obtained from muscle in the control series before the perfusion. Rest values were taken at T30 ofperfusion in the resting preparation (20). In postexercise groups, values were obtained from the control and 3 CA inhibition treatment groupsat T30. ECFV and ICFV, ECF and ICF volume, respectively. *Significant difference between corresponding control and treatment values inpostexercised fish or between rest (perfused) and in vivo values in resting fish (n58, P#0.05); †significant difference from corresponding restvalues (20).
Fig. 7. Net Na1, Cl2, and K1 flux rates in the perfused tail-trunkmuscle in control and 3 CA inhibition treatment groups before andafter (T5, T15, T30) exercise. Positive and negative flux rates indicateefflux and influx, respectively. In contrast to Figs. 1–6, rest valueswere taken from the same preparations as the postexercise values,before the initiation of exercise. AZ was present during the restmeasurements in the AZtot and AZICF series, but in the BZECF series,BZ was added only immediately after the end of exercise. *Significantdifference (P # 0.05) from corresponding control values. ‡Significantdifference from the corresponding rest values (P # 0.05). Otherdetails as in legend of Fig. 1.
R1774 CARBONIC ANHYDRASE IN TROUT WHITE MUSCLE
on April 27, 2006
ajpregu.physiology.orgD
ownloaded from

comparison of measurements before and after exercise.The direct stimulation protocol that we employed repro-duced typical postexercise metabolic, respiratory, andacid-base responses shown in many in vivo studies (39,43, 48). Clearly, the perfused tail trunk does not reflectthe exact physiological condition in postexercise musclein vivo, because it lacks red blood cells and hormones. Iteliminates extraneous effects from the presence of CAin other organs and tissues such as the red blood cells,gills and liver, thereby facilitating specific studies onmuscle. In particular, the preparation was designed todissect out the role(s) of CA in the intracellular andextracellular space of fish white muscle with respect togas exchange, acid-base regulation, and metabolism.An unavoidable consequence of the lack of red blood cellCA in particular is the fact that intracellular PCO2 inthe muscle is slightly elevated (e.g., 7.3 vs. 5.5 Torr atrest, probably more after exercise), because PCO2 at thedownstream end of the diffusion gradient from myocyteto capillary blood (or perfusate) must be higher in theabsence of blood-based catalysis.
The available CA inhibition data indicate that the CAinhibitors were distributed in the fluid compartmentsfor which the experimental protocol was intended (20).The lowest degree of muscle CA inhibition, 38%, wasseen for the BZECF treatment (comparable to 40%inhibition by QAS in resting muscle), whereas the AZICFand AZtot treatments produced 78 and 85% inhibition,respectively, as in resting muscle. Because of the methodby which the muscle tissue is processed for measure-ment of CA activity, these inhibition values are conser-vative estimates of total inhibition (20). CA inhibitionin mammalian fibers has been reported to affect vari-ous aspects of muscle contraction (27, 39, 43, 44). Themechanical properties of trout muscle could not bemeasured directly in the perfused tail trunk, but noobvious differences in muscle contraction were ob-served between the control and CA inhibition treat-ments with AZ. Note in particular that QAS was usedonly at rest, and BZECF treatment was started after theend of exercise so as to avoid any such complicatingeffects.
Another noteworthy aspect of the preparation was itsability to maintain high values of intracellular PCr andATP and low values of Lac (Table 3) throughout perfu-sion at rest. These values were close to those measuredin vivo at the time of death (Table 3; see Ref. 46 for acomparison of additional resting values for rainbowtrout in the literature). Furthermore, after exercise insitu, perfused trunks in the control series rapidlycorrected these values (also Gly) back toward restinglevels. These observations suggest that the metabolicmachinery is intact and that O2 or nutrient supply isnot a limiting factor.
As a guide to further discussion, Table 5 summarizesthe major effects observed in exercised trout muscleresulting from separate inhibition of extra- and intracel-lular CA.
Effects on gas, acid-base, and Lac exchanges. In thecase of a metabolically active tissue such as muscle, CAcan be important in both gas transport and intracellu-
lar acid-base balance. At rest in trout muscle as well asmammalian muscle, cytoplasmic CA is believed tofunction primarily in maintaining an instantaneousequilibrium between CO2 and HCO3
2: as CO2 diffusesacross the sarcolemma out of the cell, it is immediatelyreplaced from the much larger but less permeableintracellular HCO3
2 pool (18, 19). Membrane-associatedCA on the extracellular surface of the sarcolemma isbelieved to function in the catalyzed hydration ofexcreted CO2 to HCO3
2 in the extracellular boundarylayer, maintaining the transmembrane PCO2 gradientby preventing the buildup of molecular CO2. CA inhibi-tion in resting muscle results in lowered CO2 efflux(20).
In exercised trout muscle, CO2 and H1 productionrates are both much higher than at rest, with H1
production driving HCO32 dehydration. CA facilitates
rapid establishment of a new equilibrium, and elevatedCO2 excretion is achieved with very little elevation overresting intramuscular TCO2 concentrations (Fig. 2B). Infact, after a 1-h recovery period, fish white muscle oftenexhibits a depression in intracellular HCO3
2 and TCO2,because the CA-catalyzed reactions are driven in thedirection of dehydration as a result of the elevatedlevels of metabolic protons combined with the rapidremoval of molecular CO2 (27, 39, 43, 44).
One of the most apparent differences in the role oftrout muscle CA at rest vs. postexercise appears to bean increase in the importance of the cytoplasmic CApool in CO2 efflux. When cytoplasmic CA was inhibited(AZICF), there was a significant decrease in pHi and asignificant increase in the intracellular PCO2 at 30 minpostexercise (Figs. 1 and 2A). At the same time, TCO2
Table 5. Summary of the major effects of CA inhibitionon exercised trout white muscle in comparison withtrout in the control postexercise preparation
ECF CAInhibition
ICF CAInhibition
Total CAInhibition
pHi 2 2 2PiCO2
NC 1 NCTCO2 efflux 2 NC NCTiCO2
NC NC NCMO2 NC 1 2DHm
1 efflux reversed reversed reversedAmm efflux 2 (transient) NC NCLac efflux 2 2 2Muscle Lac NC NC NCMuscle PCr 2 2 2Muscle ATP NC NC NCMuscle Gly 2 2 2Muscle Na1 2 1 2Muscle K1 NC NC NCMuscle Cl2 NC NC NCECFV NC NC NCICFV NC NC NCNa1 efflux NC 2 2K1 efflux 1 1 1Cl2 efflux 1 1 1
All values are compared with the corresponding control. 2, signifi-cant decrease; 1, significant increase; NC, no change; reversed, achange of direction in the flux (i.e., from efflux to influx). PiCO2
,intracellular PO2
; TiCO2, total intracellular CO2; DHm
1 , metabolicproton flux rate.
R1775CARBONIC ANHYDRASE IN TROUT WHITE MUSCLE
on April 27, 2006
ajpregu.physiology.orgD
ownloaded from
efflux and intracellular TCO2 concentrations were notdifferent from those in the control group (Figs. 2Band 3). These results indicate that with the cytoplasmicpool of CA inhibited, exercised muscle produces CO2faster than it can be excreted; CO2 builds up in theintracellular space until a new steady state is estab-lished in which a higher intracellular PCO2 is respon-sible for maintaining normal CO2 excretion rates. Thedecreased pHi, which is a result of both the respiratoryacidosis and the accumulation of metabolic protons,pushes the equilibrium of the CO2-HCO3
2-H1 systemtoward increased PCO2. This factor appears to be impor-tant, because there was a pronounced ICF acidosisdespite the very high intracellular buffer capacity oftrout white muscle (27).
In contrast, CA inhibition did not cause an intracellu-lar acidosis in trout white muscle at rest (20). Rather,CO2 efflux was reduced, at least by extracellular CAinhibition, intracellular PCO2 increased, and the lowrate of production and accumulation of CO2 in 30 minwas insufficient to produce a new steady state. Thelarge intracellular CA pool, which may be present inexcess for CO2 excretion at rest, becomes more impor-tant under conditions of peak CO2 load. For respiratorygas exchange at the systemic level in mammals andlower vertebrates (e.g., within the red blood cell), it isgenerally accepted that CA is present in tremendousexcess of requirements for resting CO2 excretion. How-ever, under periods of exercise, and therefore maximalCO2 production, the high levels of CA activity becomenecessary (e.g., Ref. 38). An analogous situation mayexist for individual tissues and cells as well: underconditions of high CO2 production, the large CA pool inthe cytoplasm becomes necessary to maintain outwardCO2 transport.
In support of this idea, ECF CA inhibition alone(BZECF) did not result in a significant increase inintracellular PCO2 at 30 min postexercise (Fig. 2A),although it did slightly depress the elevated total CO2efflux (Fig. 3). Conversely, selective inhibition of CA inthe ECF in white muscle at rest by QAS did cause anincrease in intracellular PCO2 as well as a more markeddepression of resting total CO2 efflux (20). So withregard to CO2 efflux, it appears that the relatively smallpool of membrane-associated CA on the extracellularsurface of the sarcolemma may be swamped by the highlevels of CO2 produced during exhaustive exercise andthat the intracellular enzyme plays the dominant roleat this time.
The additional intracellular acidoses in all of the CAinhibition treatments (Fig. 1) may have been primarilyof metabolic origin, because in all of them there oc-curred a sustained influx of Hm
1 after exercise, incontrast to the net efflux seen in the control series atthis time (Fig. 4). In the absence of CA catalysis, theefflux of metabolic protons (from Lac production or ATPbreakdown) from the muscle cells through the intersti-tial fluid into the perfusate cannot be ‘‘neutralized’’ byHCO3
2 in the transit time available. As a result, pH inthe poorly buffered interstitial fluid is lower. Metabolicproton efflux would be reduced because the efflux must
fight a larger net electrochemical gradient, one whichstrongly favors influx. Thus net metabolic proton up-take occurs. Earlier we concluded that Lac efflux frompostexercise trout muscle involves a Lac2-H1 symportand the free diffusion of H-Lac (44, 47), so the reductionin net Lac efflux caused by all three CA inhibitiontreatments (Fig. 6) fits well with the reversal of DHm
1
fluxes.However, it is important to understand that the DHm
1
influx shown in all the CA inhibition treatments (Fig. 4)is equivalent to (and cannot be differentiated from)HCO3
2 efflux. The conventional wisdom is that cellmembranes in both fish and mammals are not perme-able to bicarbonate ions (40, 41), although HCO3
2
movement can still be carried out through carrier-mediated transport, i.e., via the Cl2/HCO3
2 or Lac2/HCO3
2 antiport. Earlier we concluded that the Lac2/HCO3
2 antiport was not involved in Lac efflux afterexercise in trout white muscle (44, 47), and the presentCl2 flux measurements reveal no differential effects ofCA inhibition on net Cl2 exchange (Fig. 7). It appearsmore likely that the observed effects really do representthe movements of metabolic protons. An additionalfactor in some of the treatments was a retardation ofglycogen resynthesis (Table 3), which would delay thebiochemical removal of metabolic protons.
Regardless, the results clearly demonstrated thatmuscle CA not only plays an important role in facilitat-ing CO2 release from skeletal muscle, but also influ-ences the metabolic acid movement across muscle cellmembranes after exercise. This may be particularlytrue in the poorly vascularized fish white muscle,where interstitial fluid has relatively low nonbicarbon-ate buffer capacity and absolute CA activity is also low.Hence, limitations on the rate at which CO2, H1, andHCO3
2 come to equilibrium may very well affect theirtransport from muscle to extracellular space.
These results strongly suggest that CA is involved inboth respiratory and metabolic acid-base regulation introut white muscle. Unlike the present study, AZinfusion in vivo caused an increase in intracellular PCO2in white muscle of postexercise trout, whereas pHiremained unchanged (7). A direct comparison betweenthe intact fish and the isolated perfused tail trunk maynot be very realistic. The perfused tail trunk is a highlysimplified system in which white muscle is the soletarget of CA inhibition; the intact fish in vivo is amulticompartment system in which CA inhibition canoccur simultaneously at multiple sites. Indeed, theblocking protocol used by Currie et al. (7) favoredinhibition of erythrocytic CA, causing an increase inPCO2 throughout all compartments of the animal. It isunlikely that the 5- to 30-min period of AZ administra-tion (7) would have been adequate to fully block CA inthe muscle.
In control perfused trunk preparations, intracellularacidosis was corrected rapidly after exercise (Fig. 1)relative to in vivo studies (27, 37, 39, 43). This phenom-enon is likely associated with a similarly fast glycogenrepletion rate (Table 3; see below), which biochemicallyconsumes metabolic acid. The rapid rate in the per-
R1776 CARBONIC ANHYDRASE IN TROUT WHITE MUSCLE
on April 27, 2006
ajpregu.physiology.orgD
ownloaded from
fused tail trunk may reflect the absence of ‘‘stress’’hormones. In trout in vivo, Pagnotta et al. (32) demon-strated that exercise-induced cortisol mobilization hin-ders both glycogen resynthesis from Lac and postexer-cise acid clearance. The adaptive significance is unclear.However cortisol ‘‘removal’’ by pharmacological inter-vention greatly accelerates the in vivo correction rate toa level comparable to that seen in vitro. It would beinformative to confirm this conclusion by the additionof cortisol to the perfusate in the tail trunk preparation.
Effects on glycogen, energy-rich phosphate, and ammo-nia metabolism. Today, it is generally accepted that Lacrelease from muscle and transport to the liver forhepatic-based gluconeogenesis (the Cori cycle) are lessimportant in fish than in mammals. Instead, most fishretain a large portion of the Lac synthesized duringexhaustive exercise within white muscle, where it islater used as a carbon source for in situ glycogenresynthesis (14, 26, 48). The rapid restoration of Glyand partial clearance of Lac by the perfused trunkmuscle in the present study (Table 3) further supportsthis view, However, it must be pointed out that theglucose in the perfusate (as in vivo) could have poten-tially provided the substrate for this glycogen replenish-ment, although there are multiple lines of evidencethat oppose this interpretation (26, 48). What remainsparticularly unclear at present is the biochemical path-way by which Lac is converted back to glycogen in fishmuscle; an involvement of CA for HCO3
2 supply mightbe expected in several of the proposed routes (seeintroduction). Regardless, we would not necessarilyexpect CA inhibition to have the same effects on Lactransport and metabolism in fish as in mammals. Geerset al. (9) reported that in mammalian muscle, CAinhibition with chlorazolamide led to marked increasesin both muscle Lac concentration and efflux rate intoblood, effects which were not seen in the perfused trouttrunk (Table 3, Fig. 6) or in vivo (7). Indeed CAinhibition reduced Lac release from the perfused prepa-ration, perhaps through the effect on proton gradientdiscussed earlier.
The depressed resting levels of Gly in the fish thathad been pretreated with AZ (AZtot and AZICF groups),but not in QAS-treated fish (Table 3), show that intracel-lular CA activity is essential to maintenance of normalglycogen stores and are consistent with findings inmammalian muscle (6, 34). More importantly, all threeCA inhibition treatments slowed the rate of Gly resyn-thesis after exercise (Table 3). Interpretation is com-plex, however, because Lac clearance was not affected,and furthermore Gly resynthesis substantially ex-ceeded Lac removal (Table 3), suggesting that otherfuels were used. At any one time, the Gly store is afunction of synthesis and degradation rates (i.e., glycoly-sis), so potential effects on the latter must also beconsidered. One possible interpretation is that thepathway of Gly resynthesis involves carboxylation ofpyruvate via pyruvate carboxylase or via the reversal ofmalic enzyme rather than reversal of pyruvate kinase(see introduction). However, the lower pHi accompany-ing CA inhibition (Fig. 1) may also be an important
factor; Walsh and Milligan (42) summarized circumstan-tial evidence indicating that acidosis itself inhibits bothglycogenesis and gluconeogenesis from Lac in trouttissues. Clearly, there is a need for more detailedanalyses in a simpler system (i.e., in the test tube); theimportant lesson from the present study is that muscleCA plays a critically direct or indirect role and shouldbe considered in such systems.
ATP concentrations in white muscle were not affectedby CA inhibition either at rest or after exercise (Ta-ble 3). Curiously though, extracellular CA inhibitiongreatly lowered intracellular PCr at rest, whereasintracellular CA inhibition had no effect. This may beassociated with the observation that at rest intracellu-lar PCO2 was elevated only by extracellular CA inhibi-tion and not by intracellular blockade (20). However,intracellular CA inhibition, which did elevate intracel-lular PCO2 after exercise, appeared to become extremelypotent in delaying or preventing PCr recovery afterexercise. This depletion or slower resynthesis of PCrmay be due to end product inhibition on pyruvatedehydrogenase caused by PCO2 buildup. In rat muscle,similar effects of CA inhibition (9, 11) and respiratoryacidosis (35) in causing PCr depletion have been re-ported. Although AZ has previously been shown toresult in substantial limitation of the carboxylationreaction in mammalian preparation (16), a similareffect of intracellular CA inhibition may also result inend product inhibition of decarboxylation reactionssuch as that catalyzed by pyruvate dehydrogenase. Atleast in mammals, the resynthesis of PCr has beenshown to be dependent on the rate of ATP turnoversupplied by the maximal activity of the TCA cycle (31).Therefore in end product inhibition of pyruvate dehydro-genase the rate-limiting step would be expected toreduce the rate of ATP synthesis and, hence, PCrregeneration. Additionally or alternately, the well-known effect of creatine kinase activation by low pHiand ADP (21) may have been involved. Thus theintracellular acidosis resulting from CA inhibition mayhave increased creatine kinase activity. The increasedavailability of protons would shift the equilibrium ofthe PCr 1 H1 1 ADP 5 Cr 1 ATP reaction to the right,thereby tending to deplete PCr reserves, as seen inmammalian muscle (9).
After exhaustive exercise, ammonia efflux from theperfused muscle was increased approximately fivefold,but no significant changes in this pattern were ob-served in the total and intracellular CA inhibitiongroups and the decrease of ammonia efflux in theextracellular CA inhibition group was only transient(Fig. 5). In the absence of intracellular ammonia mea-surements that would have allowed estimation of therelevant PNH3 and NH4
1 electrochemical gradients, in-terpretation is greatly limited. Nevertheless, the rela-tive lack of effect of CA inhibition supports our generalhypothesis that diffusion trapping of NH3 becomes lessimportant at this time because the muscle cell mem-branes become more permeable to NH4
1 during postex-ercise recovery (see introduction). In other words, NH4
1
permeability increases relative to NH3 permeability
R1777CARBONIC ANHYDRASE IN TROUT WHITE MUSCLE
on April 27, 2006
ajpregu.physiology.orgD
ownloaded from

after exercise, perhaps in response to acidosis, therebyensuring that the strong electrochemical gradient di-rected in the uptake direction will help retain ammoniain the cells for adenylate resynthesis (43, 45).
Perspectives
Extracellular and intracellular CA localized, respec-tively, to the sarcolemma and the cytoplasm in troutwhite skeletal muscle, are engaged directly or indi-rectly in many physiological processes, including acid-base balance, respiration, metabolism of phosphagens,glycolysis/glyconeogenesis, transmembrane relocationof ammonia and Lac, and perhaps ion regulation.Sarcolemma-associated CA plays a critical role in coor-dinating and promoting the transmembrane move-ments of ammonia and CO2 at rest via the shuttling ofH1 ions between these two chemical pools in theinterstitial fluid boundary layer. However, during post-exercise recovery, when CO2 and ammonia productionrates greatly increase, its role in CO2 export may besuperceded by the increased importance of the muchlarger intracellular CA pool in this regard. In addition,the overall role of both CA pools in ammonia excretionappears to be diminished because of the increasedimportance of NH4
1 permeability relative to NH3 per-meability at this time. However both pools contributeto establishing the acid-base conditions that favor amodest efflux of metabolic acid and Lac from the muscleto the extracellular fluid. The reduced restoration ofglycogen in muscle caused by CA inhibition suggeststhat postexercise gluconeogenesis may occur via anHCO3
2-dependent pathway, although other interpreta-tions are possible. Finally, the rapid postexercise recov-ery of metabolites and acid-base status in the perfusedtail trunk, which at present is a hormone-free prepara-tion, supports the idea that stress hormones such ascortisol exert negative effect on glycogen replenishmentand Lac and metabolic acid clearance in postexercisetrout white muscle in vivo. In future, the ability tomanipulate and strictly control hormone levels andmetabolic fuels in the perfusate of the tail trunk mayprovide a valuable approach for understanding theintegration of these processes.
The authors thank Tina Lukezic for the important technicalassistance in this project.
The investigation was supported by a National Sciences andEngineering Research Council Canada research grant to C. M. Wood,grants from Medical Research Council Canada and Ontario Heartand Stroke Foundation to G. J. F. Heigenhauser, and by NationalScience Foundation Grants IBN-93–04844 and 97–27835 to R. P.Henry. G. J. F. Heigenhauser is a career investigator of Ontario Heartand Stroke Foundation.
Address for reprint requests: Y. Wang, Division of Marine Biologyand Fisheries, Rosenstiel School of Marine and Atmospheric Science,Univ. of Miami, 4600 Rickenbacker Causeway, Miami, FL 33149.
Received 21 May 1998; accepted in final form 17 August 1998.
REFERENCES
1. Bergmeyer, H. U. Methods of Enzymatic Analysis. New York:Academic, 1983.
2. Boutilier, R. G., T. A. Heming, and G. K. Iwama. Appendix:physicochemical parameters for use in fish respiratory physiol-
ogy. In: Fish Physiology, edited by W. S. Hoar and D. J. Randall.New York: Academic, 1984, p. 403–430.
3. Cameron, J. N., and N. Heisler. Studies of ammonia in therainbow trout: physico-chemical parameters, acid-base behav-iour and respiratory clearance. J. Exp. Biol. 105: 107–125, 1983.
4. Connett, R. J. Glyconeogenesis from lactate in frog muscle.Am. J. Physiol. 237 (Cell Physiol. 6): C231–C236, 1979.
5. Conway, E. J. Nature and significance of concentration rela-tions of potassium and sodium ions in skeletal muscle. Physiol.Rev. 37: 84–132, 1957.
6. Cote, C., H. Riverin, M.-J. Barras, R. R. Tremblay, P.Fremont, and J. Frenette. Effect of carbonic anhydrase IIIinhibition on substrate utilization and fatigue in rat soleus.Can. J. Physiol. Pharmacol. 71: 277–283, 1993.
7. Currie, S., J. D. Kieffer, and B. L. Tufts. The effects of bloodCO2 reaction rate on CO2 removal from muscle in exercised trout.Respir. Physiol. 100: 261–269, 1995.
8. Fournier, P., and H. Guderley. Metabolic fate of lactatefollowing vigorous activity in the frog, Rana pipiens. Am. J.Physiol. 262 (Regulatory Integrative Comp. Physiol. 31): R245–R254, 1992.
9. Geers, C., K. Benz, and G. Gros. Effects of carbonic anhydraseinhibitors on oxygen consumption and lactate accumulation inskeletal muscle. Comp. Biochem. Physiol. A Physiol. 112A:111–117, 1995.
10. Geers, C., and G. Gros. Carbonic anhydrase inhibition affectscontraction of directly stimulated rat soleus. Life Sci. 42: 37–47,1988.
11. Geers, C., and G. Gros. Effects of carbonic anhydrase inhibitorson contraction, intracellular pH and energy-rich phosphates ofrat skeletal muscle. J. Physiol. (Lond.) 423: 279–297, 1990.
12. Geers, C., and G. Gros. Muscle carbonic anhydrase: function inmuscle contraction and in the hemeostasis. In: The CarbonicAnhydrases. Cellular Physiology and Molecular Genetics, editedby S. J. Dodgson, R. E. Tashian, G. Gros, and N. D. Carter. NewYork: Plenum, 1991, p. 227–239.
13. Gilmour, K. M., R. P. Henry, C. M. Wood, and S. F. Perry.Extracellular carbonic anhydrase and an acid-base disequilib-rium in the blood of the dogfish Squalus acanthias. J. Exp. Biol.200: 173–183, 1997.
14. Gleeson, T. T. Post-exercise lactate metabolism: a comparativereview of sites, pathways, and regulation. Annu. Rev. Physiol. 58:565–581, 1996.
15. Gleeson, T. T., and P. M. Dalessio. Lactate: a substrate forreptilian muscle gluconeogenesis following exhaustive exercise.J. Comp. Physiol. [B] 160: 331–338, 1990.
16. Gros, G., and S. J. Dodgson. Velocity of CO2 exchange inmuscle and liver. Annu. Rev. Physiol. 50: 669–694, 1988.
17. Henry, R. P. Technique for measuring carbonic anhydraseactivity in vitro. The electrometric delta pH and pH stat meth-ods. In: Carbonic Anhydrases: Cellular Physiology and MolecularGenetics, edited by S. J. Dodgson, R. E. Tashian, G. Gros, andN. D. Carter. New York: Plenum, 1991, p. 119–125.
18. Henry, R. P. Multiple roles of carbonic anhydrase in cellulartransport and metabolism. Annu. Rev. Physiol. 58: 523–538,1996.
19. Henry, R. P., and T. A. Heming. Carbonic anhydrase andrespiratory gas exchange. In: Fish Physiology, edited by W. S.Hoar and D. J. Randall. New York: Academic, 1998.
20. Henry, R. P., Y. Wang, and C. M. Wood. Carbonic anhydrasefacilitates CO2 and NH3 transport across the sarcolemma of troutwhite muscle. Am. J. Physiol. 272 (Regulatory Integrative Comp.Physiol. 41): R1754–R1761, 1997.
21. Hochachka, P. W., and T. P. Mommsen. Protons and anaerobio-sis. Science 219: 1391–1397, 1983.
22. Kowalchuk, J. M., G. J. F. Heigenhauser, M. I. Lindinger,J. R. Sutton, and N. L. Jones. Factors influencing hydrogen ionconcentration in muscle after intense exercise. J. Appl. Physiol.65: 2080–2089, 1988.
23. Kun, E., and E. B. Kearney. Ammonia. In: Methods of Enzy-matic Analysis, edited by U. Bergmeyer. New York: Academic,1971, p. 1802–1806.
24. Maren, T. H., B. R. Friedland, and R. S. Rittmaster. Kineticproperties of primitive vertebrate carbonic anhydrases. Comp.Biochem. Physiol. B Biochem. Mol. Biol. 67B: 69–74, 1980.
R1778 CARBONIC ANHYDRASE IN TROUT WHITE MUSCLE
on April 27, 2006
ajpregu.physiology.orgD
ownloaded from

25. Meyer, R. A., G. A. Dudley, and R. L. Terjung. Ammonia andIMP in different skeletal muscle fibers after exercise in rats. J.Appl. Physiol. 49: 1037–1041, 1980.
26. Milligan, C. L. Metabolic recovery from exhaustive exercise inrainbow trout. Comp. Biochem. Physiol. A Physiol. 113A: 51–60,1996.
27. Milligan, C. L., and C. M. Wood. Tissue intracellular acid-basestatus and the fate of lactate after exhaustive exercise in therainbow trout. J. Exp. Biol. 123: 123–144, 1986.
28. Mommsen, T. P., and P. W. Hochachka. The purine nucleotidecycle as two temporally separated metabolic units: a study ontrout muscle. Metabolism 6: 552–556, 1988.
29. Moyes, C. D., P. M. Schulte, and P. W. Hochachka. Recoverymetabolism of trout white muscle: role of mitochondria. Am. J.Physiol. 262 (Regulatory Integrative Comp. Physiol. 31): R295–R304, 1992.
30. Moyes, C. D., and T. G. West. Exercise metabolism of fish. In:Biochemistry and Molecular Biology of Fishes, edited by P. W.Hochachka and T. P. Mommsen. New York: Elsevier, 1995, p.367–391.
31. Paganini, A. T., J. M. Foley, and R. A. Meyer. Lineardependence of muscle phosphocreatine kinase on oxidative capac-ity. Am. J. Physiol. 272 (Cell Physiol. 41): C501–C510, 1997.
32. Pagnotta, A., L. Brooks, and C. L. Milligan. The potentialregulatory role of cortisol in the recovery from exhaustiveexercise in rainbow trout. Can. J. Zool. 72: 2136–2146, 1994.
33. Portner, H. O., R. G. Boutilier, Y. Tang, and D. P. Toews.Determination of intracellular pH and PCO2 after metabolicinhibition by fluoride and nitrilotriacetic acid. Respir. Physiol. 81:255–274, 1990.
34. Rose, R. J., D. R. Hodgson, T. B. Kelso, L. J. McCutcheon,W. M. Bayly, and P. D. Gollnick. Effects of actazolamide onmetabolic and respiratory responses to exercise at maxima O2uptake. J. Appl. Physiol. 68: 617–626, 1990.
35. Sahlin, K., L. Edstrom, and H. Sjoholm. Fatigue and phospho-creatine depletion during carbon dioxide-induced acidosis in ratmuscle. Am. J. Physiol. 245 (Cell Physiol. 14): C15–C20, 1983.
36. Scarabello, M., C. M. Wood, and G. J. F. Heigenhauser.Glycogen depletion as an experimental test of the oxygen debthypothesis in juvenile rainbow trout. Can. J. Zool. 69: 2562–2568, 1991.
37. Schulte, P. M., C. D. Moyes, and P. W. Hochachka. Integrat-ing metabolic pathways in post-exercise recovery of white muscle.J. Exp. Biol. 166: 181–195, 1992.
38. Swenson, E. R., and T. H. Maren. Roles of gill and red bloodcell carbonic anhydrase in elasmobranch PCO2 and CO2 excretion.Am. J. Physiol. 253 (Regulatory Integrative Comp. Physiol. 22):R450–R458, 1987.
39. Tang, Y., and R. G. Boutilier. White muscle intracellularacid-base and lactate status following exhaustive exercise: acomparison between freshwater and seawater adapted rainbowtrout. J. Exp. Biol. 156: 153–171, 1991.
40. Tang, Y., H. Lin, and D. J. Randall. Compartmental distribu-tions of carbon dioxide and ammonia in rainbow trout at rest andfollowing exercise, and the effect of bicarbonate infusion. J. Exp.Biol. 169: 235–249, 1992.
41. Walsh, P. J., and R. P. Henry. Carbon dioxide and ammoniametabolism and exchange. In: Biochemistry and Molecular Biol-ogy of Fishes, edited by P. W. Hochachka and T. P. Mommsen.New York: Elsevier, 1991, p. 181–207.
42. Walsh, P. J., and C. L. Milligan. Coordination of metabolismand intracellular acid-base status: ionic regulation and metabolicconsequences. Can. J. Zool. 67: 2994–3004, 1989.
43. Wang, Y., G. J. F. Heigenhauser, and C. M. Wood. Integratedresponses to exhaustive exercise and recovery in rainbow troutwhite muscle: acid-base, phosphogen, carbohydrate, lipid, ammo-nia, fluid volume and electrolyte metabolism. J. Exp. Biol. 195:237–258, 1994.
44. Wang, Y., G. J. F. Heigenhauser, and C. M. Wood. Lactate andmetabolic H1 transport and distribution after exercise in rain-bow trout white muscle. Am. J. Physiol. 271 (Regulatory Integra-tive Comp. Physiol. 40): R1239–R1250, 1996.
45. Wang, Y., G. J. F. Heigenhauser, and C. M. Wood. Ammoniamovement and distribution after exercise across white musclecell membranes in rainbow trout. Am. J. Physiol. 271 (RegulatoryIntegrative Comp. Physiol. 40): R738–R750, 1996.
46. Wang, Y., M. P. Wilkie, G. J. F. Heigenhauser, and C. M.Wood. The analysis of metabolites in rainbow trout whitemuscle: a comparison of different sampling and processingmethods. J. Fish Biol. 45: 855–873, 1994.
47. Wang, Y., P. M. Wright, G. J. F. Heigenhauser, and C. M.Wood. Lactate transport by perfused rainbow trout white muscle:kinetic characteristics and sensitivity to inhibitors. Am. J.Physiol. 272 (Regulatory Integrative Comp. Physiol. 41): R1577–R1587, 1997.
48. Wood, C. M. Acid-base and ion balance, metabolism, and theirinteractions, after exhaustive exercise in fish. J. Exp. Biol. 160:285–308, 1991.
49. Wright, P. A., D. J. Randall, and C. M. Wood. The distributionof ammonia and H2 between tissue compartments in lemon sole(Parophrys vetulus) at rest, during hypercapnia and followingexercise. J. Exp. Biol. 136: 149–175, 1988.
50. Wright, P. A., and C. M. Wood. Muscle ammonia stores are notdetermined by pH gradients. Fish Physiol. Biochem. 5: 159–162,1988.
R1779CARBONIC ANHYDRASE IN TROUT WHITE MUSCLE
on April 27, 2006
ajpregu.physiology.orgD
ownloaded from