restaurant mroi
TRANSCRIPT

Optimizing Marketing and
Media Strategy for Retail Food ServiceThrough Effective
Marketing Measurement and
Accountability
1

Today’s Agenda
• Bottom-Line Analytics
• The Marketing Measurement Challenge
• The Vision
• QSR Case Study
• The Plan
2Copyright Bottom Line Analytics, LLC - All Rights Reserved, 2013

About Us
Bottom-Line Analytics LLC is a consulting group that focuses on Marketing and Social Media analytics
Our modeling experts have a total of over 100 years of direct experience with marketing optimization modeling. This includes direct experience in over 35 countries and dozens of product categories
We are dedicated to the principles of innovation, excellence and uncompromising customer service
Most important, however, we are dedicated to getting tangible and positive business results for our clients
3Copyright Bottom Line Analytics, LLC - All Rights Reserved, 2013

Our Team’s Experience
4Copyright Bottom Line Analytics, LLC - All Rights Reserved, 2013

Today’s Agenda
• Bottom-Line Analytics
• The Marketing Measurement Challenge
• The Vision
• QSR Case Study
• The Plan
5Copyright Bottom Line Analytics, LLC - All Rights Reserved, 2013

• In the early 1900’s John Wanamaker turned a phrase marketers still reference today:
“Half the money I spend on advertising is wasted, I just don’tknow which half”
• In the 1930’s, Albert Einstein said
“Insanity is doing the same thing over and over again and expecting different results”
• In the 1990’s a new era of marketing accountability was born, with an appropriate quote, by F. John Reh
“You can not manage what you don't measure”
The Marketing Measurement Challenge
6Copyright Bottom Line Analytics, LLC - All Rights Reserved, 2013

BLA Focuses on Measuring & Optimizing The Where And The What
Revenues
Offline Media, Direct, Creative
& Message
Online Media, Direct & Message
Pricing, Capacity &Customer
Transactions
Macro Variables and
Market Factors
Competition
Influential Factors – Independent Variables
Social Media
7Copyright Bottom Line Analytics, LLC - All Rights Reserved, 2013

Today’s Agenda
• Bottom-Line Analytics
• The Marketing Measurement Challenge
• The Vision
• QSR Case Study
• The Plan
8Copyright Bottom Line Analytics, LLC - All Rights Reserved, 2013

9
• Visualize-
– A tool which will enable you to accurately ascribe ROI to each of your various marketing initiatives
– The ability to simulate and forecast any of a number of future Business Plans and/or Business Scenarios
– An ability to know what marketing programs are working and not working – The ability to accurately quantify volume gains from specific competitors, due
to cannibalization or that which is purely incremental
• Realize– How to drive 3-10% more revenue with current or existing marketing budgets
through model-based marketing spending optimization– A business and marketing plan that can be factually defended and linked
directly to profitable revenue and growth– A business plan where you are confident that your marketing dollars are
working at maximum efficiency– A system whereby wasted and unproductive marketing initiatives can be
eliminated
The Vision
Copyright Bottom Line Analytics, LLC - All Rights Reserved, 2013

Today’s Agenda
• Bottom-Line Analytics
• The Marketing Measurement Challenge
• The Vision
• QSR Case Study
• The Plan
10Copyright Bottom Line Analytics, LLC - All Rights Reserved, 2013
11
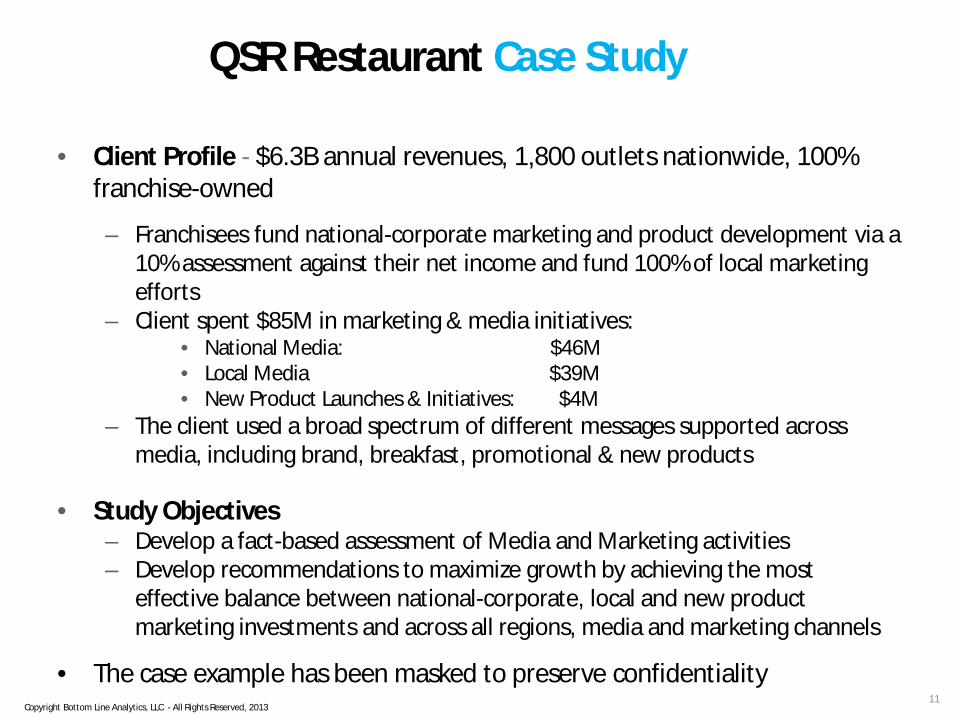
• Client Profile - $6.3B annual revenues, 1,800 outlets nationwide, 100% franchise-owned
– Franchisees fund national-corporate marketing and product development via a 10% assessment against their net income and fund 100% of local marketing efforts
– Client spent $85M in marketing & media initiatives:• National Media: $46M• Local Media $39M• New Product Launches & Initiatives: $4M
– The client used a broad spectrum of different messages supported across media, including brand, breakfast, promotional & new products
• Study Objectives– Develop a fact-based assessment of Media and Marketing activities– Develop recommendations to maximize growth by achieving the most
effective balance between national-corporate, local and new product marketing investments and across all regions, media and marketing channels
• The case example has been masked to preserve confidentiality
QSR Restaurant Case Study
Copyright Bottom Line Analytics, LLC - All Rights Reserved, 2013

12
How Effective Are Our Media and Marketing Activities?1. What proportion of marketing program/channels contributed to total
revenue sales?2. Which regions were most impacted by marketing and which marketing
programs worked best in each region?3. What were the key drivers of growth and what role did new-products play
in driving that growth?4. What messages drove a greater response - brand, new product, breakfast
or promotional?5. What is the ROI of individual marketing programs/channels?
Client Questions
What Can We Do To Improve In The Future?6. Which marketing activities represent the best opportunities for
increased funding and which should we cut back?7. What is the optimal total spend and how should that be allocated across
markets and programs/channels?8. What Is the optimal marketing spend across individual markets?
Copyright Bottom Line Analytics, LLC - All Rights Reserved, 2013
13
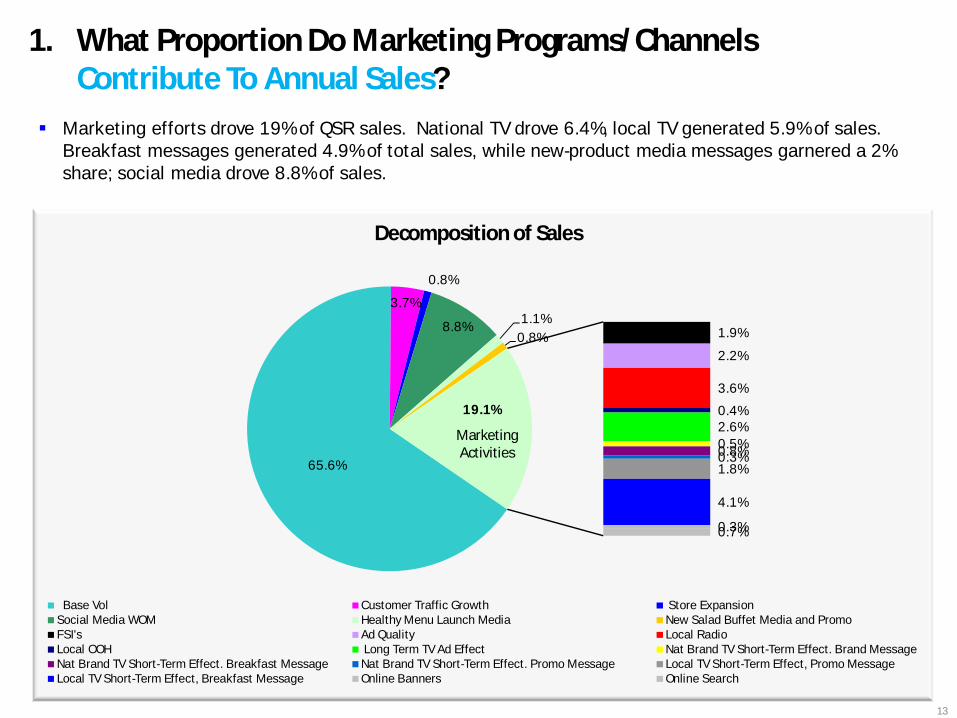
65.6%
3.7%
0.8%
8.8% 1.1%0.8% 1.9%
2.2%
3.6%
0.4%2.6%0.5%0.8%0.3%1.8%
4.1%
0.3%0.7%
19.1%
Base Vol Customer Traffic Growth Store ExpansionSocial Media WOM Healthy Menu Launch Media New Salad Buffet Media and PromoFSI's Ad Quality Local RadioLocal OOH Long Term TV Ad Effect Nat Brand TV Short-Term Effect. Brand MessageNat Brand TV Short-Term Effect. Breakfast Message Nat Brand TV Short-Term Effect. Promo Message Local TV Short-Term Effect, Promo MessageLocal TV Short-Term Effect, Breakfast Message Online Banners Online Search
Marketing efforts drove 19% of QSR sales. National TV drove 6.4%, local TV generated 5.9% of sales. Breakfast messages generated 4.9% of total sales, while new-product media messages garnered a 2% share; social media drove 8.8% of sales.
Decomposition of Sales
1. What Proportion Do Marketing Programs/Channels Contribute To Annual Sales?
MarketingActivities

14
Consolidated Sales Decomposition by Region
0%
10%
20%
30%
40%
50%
60%
70%
80%
90%
100%
Northeast Central Southeast SouthWest West
Online Search Online Banners Local TV Short-Term Effect Nat Brand TV Short-Term Effect Long Term TV Ad Effect Local OOH Local Radio Ad Quality FSI's New Salad Buffet Media and Proomo Healthy Menu Launch Store Expansion Customer Traffic Growth Base Vol
The West Region is the most marketing driven of all of the regions. This is due to the higher success of new product launches . The SE region is most affected by local TV advertising, whereas FSI’s have a relatively greater impact in the NE region.
Decomposition of Sales by Region
2. Which Regions Were Most Impacted By Marketing AndWhich Marketing Programs Worked Best In Each Region?
Copyright Bottom Line Analytics, LLC - All Rights Reserved, 2013

15
-3% -2% -1% 0% 1% 2% 3% 4%
Healthy Menu Launch Base Vol Ad Quality Local Radio Store Expansion FSI's Customer Traffic Long Term TV Ad EffectNew Salad Buffet Media and Promo Online Adv National TV Short-Term Effect Local TV Short-Term EffectLocal OOH Price
Contributions to Annual Sales Variance
The QSR sales increased 6.7% YOY. The two new item launches together accounted for 3.2 points of that growth, or nearly half. Improved national TV ad quality was a notable positive driver
Negative effects were due to a +3% price increase and reductions in outdoor and local TV ad spending
3. What Are The Key Drivers Of Growth? What Role Did New-Products Play In Driving That Growth?
3.2
-3.2
Copyright Bottom Line Analytics, LLC - All Rights Reserved, 2013

$-
$0.50
$1.00
$1.50
$2.00
$2.50
$3.00
Brand Messages Breakfast Messages New ProductMessages
PromotionalMessages
$1.11
$1.49
$2.68
$1.26
ROI of Marketing Campaigns & Messages(Profit Per Expenditure $)
4. What Messages Drove A Greater Response, Brand, NewProduct, Breakfast Or Promotional?
New product and breakfast messages stand out as delivering the highest ROI per dollar of investment.
16Copyright Bottom Line Analytics, LLC - All Rights Reserved, 2013

17
The QSR generates a 29% ROI on $85.1MM of Marketing spend
Across the mix, all activities generate positive returns except outdoor advertising and FSI’s. The launch of the healthy menu line was most profitable, with above average ROI for Salad Buffet marketing, national TV, local radio and online advertising.
Marketing ROI
Gross Profit
Spend (Cost)
Net Returns % ROI
New Salad Buffet Media and Promotion $ 6.6 $ 3.6 $ 2.9 45%FSI's $ 14.3 $ 16.4 $ (2.1) -15%Healthy Menu Launch $ 4.8 $ 0.4 $ 4.4 92%Local TV $ 15.9 $ 12.1 $ 3.7 24%National TV $ 57.2 $ 39.2 $ 18.0 31%Local Radio $ 15.5 $ 8.7 $ 6.7 44%Local Outdoor $ 1.7 $ 2.0 $ (0.3) -17%Online Advertising $ 4.4 $ 2.3 $ 2.0 46%Total Local Spending $ 47.5 $ 39.4 $ 8.1 17%Total National Spending $ 73.1 $ 45.6 $ 27.4 38%Total Spend $ 120.6 $ 85.0 $ 35.5 29%
5. What Is The ROI Of Individual Marketing Programs/Channels?
Copyright Bottom Line Analytics, LLC - All Rights Reserved, 2013

18
Below shows the relative attractiveness of the QSR’s marketing investments and campaigns. Online media represents the best upside opportunity, while FSIs and Local OOH should be reduced
Diminishing Returns-Reduce
Increase/Maintain SpendingIncrease
Significantly
Significantly Decrease
Marketing Investment ROI Matrix
6. Which Marketing Activities Represent The Best OpportunitiesFor Increased Funding? Which Should Be Cut Back?
Copyright Bottom Line Analytics, LLC - All Rights Reserved, 2013

19
0%
20%
40%
60%
80%
100%
Current Mktg Contrbution Current Spend Optimal Spend
Online Search Online BannersLocal TV Short-Term Effect, Breakfast Message Local TV Short-Term Effect, Promo MessageLocal TV Breakfast Message Local TV Promo MessageNational TV Promo Message National TV Branded MessageNational TV Breakfast Message Local OOH Local Radio FSI's New Salad Buffet Media and Proomo Healthy Menu Launch
The QSR can optimize sales by decreasing FSI’s, National & Local Promotional TV and Online Banners, while keeping total spending constant
Increase spending on the Healthy Menu initiative, Local & National Breakfast TV, Radio and Online Search. This solution is expected to generate an 8% increase in overall sales
Marketing Spending Optimization by Channel
7. What Is The Optimal Total Spend And How Should That BeAllocated Across Programs/Channels?
Copyright Bottom Line Analytics, LLC - All Rights Reserved, 2013

Marketing Spending Optimization by Region
0%
10%
20%
30%
40%
50%
60%
70%
80%
90%
100%
Current Mktg Contribution Current Spend Optimal Spend
West SouthWest Southeast Central Northeast
8. What Is The Optimal Total Spend And How Should That Be Allocated Across Markets?
The greatest upside opportunity is to increase relative marketing investments in the Southeast and West Regions
20Copyright Bottom Line Analytics, LLC - All Rights Reserved, 2013

21
0
5,000
10,000
15,000
20,000
25,000
30,0001/
6/20
003/
6/20
005/
6/20
007/
6/20
009/
6/20
0011
/6/2
000
1/6/
2001
3/6/
2001
5/6/
2001
7/6/
2001
9/6/
2001
11/6
/200
11/
6/20
023/
6/20
025/
6/20
027/
6/20
029/
6/20
0211
/6/2
002
1/6/
2003
3/6/
2003
5/6/
2003
7/6/
2003
9/6/
2003
11/6
/200
31/
6/20
043/
6/20
04
Model Actual
Overall R^2 = 96.7%, Holdout R^2 = 94.0% ,MPE=+/- 2.4%
Model Validation
Sales $Mil
One year after this project, due to significant increases in breakfast media and new-product investments, this QSR increased same-store sales 11% and net income 17%
Our models do a good job of predicting sales
Copyright Bottom Line Analytics, LLC - All Rights Reserved, 2013

Today’s Agenda
• Bottom-Line Analytics
• The Marketing Measurement Challenge
• The Vision
• QSR Case Study
• The Plan
22Copyright Bottom Line Analytics, LLC - All Rights Reserved, 2013

23
• Developing the analytics and measurement tools• Building measurement and accountability into
business plans• Measuring and monetizing the customer experience
with social media measurement• Developing a measurement and accountability
culture• Entering and realizing the path to superior profits
and growth
The Plan
Copyright Bottom Line Analytics, LLC - All Rights Reserved, 2013

Contact
• Michael Wolfe– Principal - Bottom-Line Analytics LLC – [email protected]– (o) 770.485.0270 – (C) 678.314.8446
• David Weinberger– Chief Marketing Officer - Bottom-Line Analytics LLC– [email protected]– (O) 770.649.0472
24